Table of Contents
UNITED STATES
SECURITIES AND EXCHANGE COMMISSION
Washington, D.C. 20549
FORM N-CSR
CERTIFIED SHAREHOLDER REPORT OF REGISTERED
MANAGEMENT INVESTMENT COMPANIES
Investment Company Act file number 811-07238
SUNAMERICA SERIES TRUST
(Exact name of registrant as specified in charter)
21650 Oxnard Street, Woodlands Hills, CA 91367
(Address of principal executive offices) (Zip code)
John T. Genoy
President
SunAmerica Asset Management, LLC
Harborside 5, 185 Hudson Street, Suite 3300
Jersey City, NJ 07311
(Name and address of agent for service)
Registrant’s telephone number, including area code: (201) 324-6414
Date of fiscal year end: December 31
Date of reporting period: December 31, 2022
Table of Contents
Item 1. Reports to Stockholders
This filing is on behalf of five of the sixty-one Investment Company Series of SunAmerica Series Trust. Also, attached to this filing are the financial statements with regard to the five Master Funds of the American Funds Insurance Series®.
Table of Contents
SUNAMERICA SERIES TRUST
ANNUAL REPORT
DECEMBER 31, 2022
Table of Contents
| 1 | ||||
| 2 | ||||
SunAmerica Series Trust SA American Funds Asset Allocation Portfolio | 4 | |||
SunAmerica Series Trust SA American Funds Global Growth Portfolio | 6 | |||
| 8 | ||||
SunAmerica Series Trust SA American Funds Growth-Income Portfolio | 10 | |||
SunAmerica Series Trust SA American Funds VCP Managed Allocation Portfolio | 12 | |||
| 14 | ||||
| 15 | ||||
| 16 | ||||
| 18 | ||||
| 26 | ||||
| 29 | ||||
| 30 | ||||
| 38 | ||||
| 40 | ||||
| 41 | ||||
Summary Prospectus Supplement | 47 | |||
| 48 |
Table of Contents
Dear SunAmerica Series Trust Investor,
We are pleased to present the SunAmerica Series Trust annual report, which contains the investment portfolio information and the financial statements of the Trust portfolios that invest exclusively in shares of corresponding funds (“Master Funds”) of the American Funds Insurance Series (“AFIS”) for the reporting period ended December 31, 2022.
If you have any questions, please contact your investment representative, or you may contact us directly at 1-800-445-7862.
Thank you for the confidence you place in us with your financial future, and we look forward to reporting to you once again in six months.
Sincerely,

John T. Genoy
President
SunAmerica Series Trust
Note: All performance figures quoted are for the SunAmerica Series Trust. They do not reflect fees and charges associated with the variable annuity. Past performance is no guarantee of future results. Annuities are long-term investment vehicles designed for retirement purposes. Early withdrawal may be subject to withdrawal charges and if taken prior to age 59 1/2, a 10% federal tax penalty may apply. An investment in a variable annuity involves investment risk, including possible loss of principal. The contract, when redeemed, may be worth more or less than the total amount invested.
Investments in stocks and bonds are subject to risks. The Portfolios are indirectly exposed to these risks through their investments in the master funds. Investments in growth stocks may be subject to volatile price swings and therefore present a greater potential for loss than other investments. Income seeking investment strategies may not be realized due to changes in dividend policies or the availability of capital resources. Investments in non-U.S. stocks and bonds may be subject to additional risks such as fluctuations in foreign currencies, political and economic instability, differences in securities regulation and accounting standards, foreign tax laws, and limited availability of public information. Investments in lower rated bonds and “junk bonds” are considered speculative due to the heightened risk of default and are subject to unpredictable losses as a result of changes in the issuer’s creditworthiness.
There can be no assurance that the Portfolios will meet their investment objectives. The master funds’ asset allocation may result in underperformance relative to benchmarks and other funds with similar objectives.
A full description of the investment goals, principal strategies, and risks for each Portfolio are provided in the prospectus.
For a full description of the master funds, please consult the prospectus for the relevant underlying master fund.
Investments are not guaranteed or endorsed by any bank, are not a deposit or obligation of any bank, and are not federally insured by Federal Deposit Corporation (FDIC), the Federal Reserve Board or any other federal government agency.
• Not FDIC or NCUA/NCUSIF Insured
• May Lose Value • No Bank or Credit Union Guarantee
• Not a Deposit • Not insured by any Federal Government Agency
| ||
| 1 |
Table of Contents
SUNAMERICA SERIES TRUST
EXPENSE EXAMPLE December 31, 2022 |
(unaudited)
Disclosure of Portfolio Expenses in Shareholder Reports
As a shareholder of a separate series (a “Portfolio”) in the SunAmerica Series Trust (the “Trust”), you incur ongoing costs, including management fees; service (12b-1) fees; and other Portfolio expenses. The Example is intended to help you understand your ongoing costs (in dollars) of investing in the Portfolios and to compare these costs with the ongoing costs of investing in other mutual funds. The example is based on an investment of $1,000 invested at July 1, 2022 and held until December 31, 2022. Shares of the Trust are not offered directly to the public. Instead, shares are currently issued and redeemed only in connection with investments in and payments under variable annuity contracts and variable life insurance policies (“Variable Contracts”) offered by life insurance companies affiliated with SunAmerica Asset Management, LLC, the Trust‘s investment adviser and manager. The fees and expenses associated with the Variable Contracts are not included in these Examples, and had such fees and expenses been included your costs would have been higher. Please see your variable contract prospectus for more details on the fees associated with the variable contract.
Actual Expenses
The “Actual” section of the table provides information about your actual account values and actual expenses. You may use the information in these columns, together with the amount you invested, to estimate the expenses that you paid over the period. Simply divide your account value by $1,000 (for example, an $8,600 account value divided by $1,000 = 8.6), then multiply the result by the number in the column under the heading entitled “Expenses Paid During the Six Months Ended December 31, 2022”, to estimate the expenses you paid on your account during this period. The “Expenses Paid During the Six Months Ended December 31, 2022” column and the “Annualized Expense Ratio” column do not include fees and expenses that may be charged by the Variable Contracts, in which the Portfolios are offered. Had these fees and expenses been included, the “Expenses Paid During the Six Months Ended December 31, 2022” column would have been higher and the “Ending Account Value” column would have been lower.
Hypothetical Example for Comparison Purposes
The “Hypothetical” section of the table provides information about hypothetical account values and hypothetical expenses based on the Portfolio‘s actual expense ratio and an annual rate of return of 5% before expenses, which is not the Portfolio‘s actual return. The hypothetical account values and expenses may not be used to estimate the actual ending account balance or expenses you paid for the period. You may use this information to compare the ongoing costs of investing in the Portfolios and other funds. To do so, compare this 5% hypothetical example with the 5% hypothetical examples that appear in the shareholder reports of other funds. The “Expenses Paid During the Six Months Ended December 31, 2022” column and the “Annualized Expense Ratio” column do not include fees and expenses that may be charged by the Variable Contracts, in which the Portfolios are offered. Had these fees and expenses been included, the “Expenses Paid During the Six Months Ended December 31, 2022” would have been higher and the “Ending Account Value” would have been lower.
Please note that the expenses shown in the table are meant to highlight your ongoing costs only and do not reflect any fees and expenses that may be charged by the Variable Contracts. Please refer to your variable contract prospectus for more information. Therefore the “Hypothetical” example is useful in comparing ongoing costs and will not help you determine the relative total costs of owning different funds. In addition, if these fees and expenses were included, your costs would have been higher.
| ||
| 2 |
Table of Contents
SUNAMERICA SERIES TRUST
EXPENSE EXAMPLE (continued) December 31, 2022 |
(unaudited)
| Actual | Hypothetical | |||||||||||||||||||||||||||
| Portfolio | Beginning Account Value at July 1, 2022 | Ending Account Value Using Actual Return at December 31, 2022 | Expenses Paid During the Six Months Ended December 31, 2022* | Beginning Account Value at July 1, 2022 | Ending Account Value Using a Hypothetical 5% Assumed Return at December 31, 2022 | Expenses Paid During the Six Months Ended December 31, 2022 | Annualized Expense Ratio* | |||||||||||||||||||||
SA American Funds Asset Allocation | ||||||||||||||||||||||||||||
Class 1 #@ | $ | 1,000.00 | $ | 1,029.15 | $ | 1.33 | $ | 1,000.00 | $ | 1,023.89 | $ | 1.33 | 0.26 | % | ||||||||||||||
Class 3 #@ | $ | 1,000.00 | $ | 1,028.35 | $ | 2.61 | $ | 1,000.00 | $ | 1,022.63 | $ | 2.60 | 0.51 | % | ||||||||||||||
SA American Funds Global Growth | ||||||||||||||||||||||||||||
Class 1 #@ | $ | 1,000.00 | $ | 1,044.60 | $ | 1.44 | $ | 1,000.00 | $ | 1,023.79 | $ | 1.43 | 0.28 | % | ||||||||||||||
Class 3 #@ | $ | 1,000.00 | $ | 1,042.67 | $ | 2.73 | $ | 1,000.00 | $ | 1,022.53 | $ | 2.70 | 0.53 | % | ||||||||||||||
SA American Funds Growth | ||||||||||||||||||||||||||||
Class 1 #@ | $ | 1,000.00 | $ | 1,000.00 | $ | 1.36 | $ | 1,000.00 | $ | 1,023.84 | $ | 1.38 | 0.27 | % | ||||||||||||||
Class 3 #@ | $ | 1,000.00 | $ | 998.62 | $ | 2.62 | $ | 1,000.00 | $ | 1,022.58 | $ | 2.65 | 0.52 | % | ||||||||||||||
SA American Funds Growth-Income | ||||||||||||||||||||||||||||
Class 1 #@ | $ | 1,000.00 | $ | 1,041.28 | $ | 1.49 | $ | 1,000.00 | $ | 1,023.74 | $ | 1.48 | 0.29 | % | ||||||||||||||
Class 3 #@ | $ | 1,000.00 | $ | 1,039.41 | $ | 2.78 | $ | 1,000.00 | $ | 1,022.48 | $ | 2.75 | 0.54 | % | ||||||||||||||
SA American Funds VCP Managed Allocation | ||||||||||||||||||||||||||||
Class 1 #@ | $ | 1,000.00 | $ | 988.33 | $ | 1.35 | $ | 1,000.00 | $ | 1,023.84 | $ | 1.38 | 0.27 | % | ||||||||||||||
Class 3 #@ | $ | 1,000.00 | $ | 987.19 | $ | 2.60 | $ | 1,000.00 | $ | 1,022.58 | $ | 2.65 | 0.52 | % | ||||||||||||||
| * | Expenses are equal to the Portfolio’s annualized expense ratio multiplied by the average account value over the period, multiplied by 184 days divided by 365 (to reflect the one-half year period). These ratios do not reflect expenses associated with the Variable Contracts. If such fees and expenses had been included, the expenses would have been higher. Please refer to your Variable Contract prospectus for details on the expenses that apply to the Variable Contracts of the insurance companies. |
| # | During the stated period, the investment adviser either waived fees and assumed expenses for the Portfolios. As a result, if these fees and expenses had not been waived, the “Actual/Hypothetical Ending Account Value” would have been lower and the “Actual/Hypothetical Expenses Paid During the Six Months Ended December 31, 2022” and “Annualized Expense Ratios” would have been higher. |
| @ | Does not include the expenses of the underlying Funds of the American Funds Insurance Series (“Master Funds”) that the Portfolios bear indirectly. If these indirect expenses had been included, the “Actual/Hypothetical Expenses Paid During the Six Months Ended December 31, 2022 and the “Annualized Expense Ratios” would have been higher and the “Actual/Hypothetical Ending Account Value” would have been lower. |
| ||
| 3 |
Table of Contents
| Industry Allocation* | |
| Asset Allocation Investment Companies | 100.1% |
| * | Calculated as a percentage of net assets |
Table of Contents
| Security Description | Shares or Principal Amount | Value | ||
| INVESTMENT COMPANIES — 100.1% | ||||
| Asset Allocation Investment Companies — 100.1% | ||||
| American Funds Insurance Series® — Asset Allocation Fund, Class 1 | 74,912,448 | $1,663,056,352 | ||
| TOTAL INVESTMENTS (cost $1,798,132,513)(1) | 100.1% | 1,663,056,352 | ||
| Other assets less liabilities | (0.1) | (844,094) | ||
| NET ASSETS | 100.0% | $1,662,212,258 | ||
| (1) | See Note 3 for cost of investments on a tax basis. |
| Level 1 - Unadjusted Quoted Prices | Level 2 - Other Observable Inputs | Level 3 - Significant Unobservable Inputs | Total | ||||
| ASSETS: | |||||||
| Investments at Value:* | |||||||
| Investment Companies | $1,663,056,352 | $— | $— | $1,663,056,352 |
| * | For a detailed presentation of investments, please refer to the Portfolio of Investments. |
Table of Contents
| Industry Allocation* | |
| International Equity Investment Companies | 100.1% |
| * | Calculated as a percentage of net assets |
Table of Contents
| Security Description | Shares or Principal Amount | Value | ||
| INVESTMENT COMPANIES — 100.1% | ||||
| International Equity Investment Companies — 100.1% | ||||
| American Funds Insurance Series® — Global Growth Fund, Class 1 | 11,671,442 | $352,244,133 | ||
| TOTAL INVESTMENTS (cost $345,267,545)(1) | 100.1% | 352,244,133 | ||
| Other assets less liabilities | (0.1) | (219,938) | ||
| NET ASSETS | 100.0% | $352,024,195 | ||
| (1) | See Note 3 for cost of investments on a tax basis. |
| Level 1 - Unadjusted Quoted Prices | Level 2 - Other Observable Inputs | Level 3 - Significant Unobservable Inputs | Total | ||||
| ASSETS: | |||||||
| Investments at Value:* | |||||||
| Investment Companies | $352,244,133 | $— | $— | $352,244,133 |
| * | For a detailed presentation of investments, please refer to the Portfolio of Investments. |
Table of Contents
| Industry Allocation* | |
| Domestic Equity Investment Companies | 100.1% |
| * | Calculated as a percentage of net assets |
Table of Contents
| Security Description | Shares or Principal Amount | Value | ||
| INVESTMENT COMPANIES — 100.1% | ||||
| Domestic Equity Investment Companies — 100.1% | ||||
| American Funds Insurance Series® — Growth Fund, Class 1 | 9,040,123 | $689,670,983 | ||
| TOTAL INVESTMENTS (cost $815,141,311)(1) | 100.1% | 689,670,983 | ||
| Other assets less liabilities | (0.1) | (361,895) | ||
| NET ASSETS | 100.0% | $689,309,088 | ||
| (1) | See Note 3 for cost of investments on a tax basis. |
| Level 1 - Unadjusted Quoted Prices | Level 2 - Other Observable Inputs | Level 3 - Significant Unobservable Inputs | Total | ||||
| ASSETS: | |||||||
| Investments at Value:* | |||||||
| Investment Companies | $689,670,983 | $— | $— | $689,670,983 |
| * | For a detailed presentation of investments, please refer to the Portfolio of Investments. |
Table of Contents
| Industry Allocation* | |
| Domestic Equity Investment Companies | 100.1% |
| * | Calculated as a percentage of net assets |
Table of Contents
| Security Description | Shares or Principal Amount | Value | ||
| INVESTMENT COMPANIES — 100.1% | ||||
| Domestic Equity Investment Companies — 100.1% | ||||
| American Funds Insurance Series® — Growth-Income Fund, Class 1 | 7,230,623 | $363,049,602 | ||
| TOTAL INVESTMENTS (cost $361,512,699)(1) | 100.1% | 363,049,602 | ||
| Other assets less liabilities | (0.1) | (212,555) | ||
| NET ASSETS | 100.0% | $362,837,047 | ||
| (1) | See Note 3 for cost of investments on a tax basis. |
| Level 1 - Unadjusted Quoted Prices | Level 2 - Other Observable Inputs | Level 3 - Significant Unobservable Inputs | Total | ||||
| ASSETS: | |||||||
| Investments at Value:* | |||||||
| Investment Companies | $363,049,602 | $— | $— | $363,049,602 |
| * | For a detailed presentation of investments, please refer to the Portfolio of Investments. |
Table of Contents
| Industry Allocation* | |
| Asset Allocation Investment Companies | 100.1% |
| * | Calculated as a percentage of net assets |
Table of Contents
| Security Description | Shares or Principal Amount | Value | ||
| INVESTMENT COMPANIES — 100.1% | ||||
| Asset Allocation Investment Companies — 100.1% | ||||
| American Funds Insurance Series® — Managed Risk Growth-Income Fund, Class P1 | 146,054,579 | $1,827,142,788 | ||
| TOTAL INVESTMENTS (cost $1,791,192,880)(1) | 100.1% | 1,827,142,788 | ||
| Other assets less liabilities | (0.1) | (915,781) | ||
| NET ASSETS | 100.0% | $1,826,227,007 | ||
| (1) | See Note 3 for cost of investments on a tax basis. |
| Level 1 - Unadjusted Quoted Prices | Level 2 - Other Observable Inputs | Level 3 - Significant Unobservable Inputs | Total | ||||
| ASSETS: | |||||||
| Investments at Value:* | |||||||
| Investment Companies | $1,827,142,788 | $— | $— | $1,827,142,788 |
| * | For a detailed presentation of investments, please refer to the Portfolio of Investments. |
Table of Contents
SUNAMERICA SERIES TRUST
STATEMENT OF ASSETS AND LIABILITIES
December 31, 2022
| SA American Funds Asset Allocation Portfolio | SA American Funds Global Growth Portfolio | SA American Funds Growth Portfolio | SA American Funds Growth- Income Portfolio | SA American Funds VCP Managed Allocation Portfolio | ||||||||||||||||
ASSETS: | ||||||||||||||||||||
Investment at value (unaffiliated)* | $ | 1,663,056,352 | $ | 352,244,133 | $ | 689,670,983 | $ | 363,049,602 | $ | 1,827,142,788 | ||||||||||
Receivable for: | ||||||||||||||||||||
Fund shares sold | — | — | 17,283,443 | — | 11,603,822 | |||||||||||||||
Investments sold | 8,661,360 | 10,503,242 | — | 7,524,950 | — | |||||||||||||||
Prepaid expenses and other assets | 6,009 | 5,760 | 5,802 | 5,741 | 5,917 | |||||||||||||||
Due from investment adviser for expense reimbursements/fee waivers | 862,556 | 220,456 | 351,146 | 191,118 | 1,088,296 | |||||||||||||||
|
|
|
|
|
|
|
|
|
| |||||||||||
Total assets | 1,672,586,277 | 362,973,591 | 707,311,374 | 370,771,411 | 1,839,840,823 | |||||||||||||||
|
|
|
|
|
|
|
|
|
| |||||||||||
LIABILITIES: | ||||||||||||||||||||
Payable for: | ||||||||||||||||||||
Fund shares redeemed | 8,660,920 | 10,503,084 | — | 7,524,793 | 2 | |||||||||||||||
Investments purchased | — | — | 17,283,215 | — | 11,603,326 | |||||||||||||||
Investment advisory and management fees | 1,221,956 | 299,190 | 497,456 | 270,750 | 1,476,973 | |||||||||||||||
Service fees | 357,790 | 78,501 | 145,961 | 79,281 | 388,472 | |||||||||||||||
Transfer agent fees | 63 | 84 | 94 | 94 | 77 | |||||||||||||||
Trustees’ fees and expenses | 9,059 | 1,886 | 2,973 | 1,887 | 10,731 | |||||||||||||||
Other accrued expenses | 124,231 | 66,651 | 72,587 | 57,559 | 134,235 | |||||||||||||||
|
|
|
|
|
|
|
|
|
| |||||||||||
Total liabilities | 10,374,019 | 10,949,396 | 18,002,286 | 7,934,364 | 13,613,816 | |||||||||||||||
|
|
|
|
|
|
|
|
|
| |||||||||||
NET ASSETS | $ | 1,662,212,258 | $ | 352,024,195 | $ | 689,309,088 | $ | 362,837,047 | $ | 1,826,227,007 | ||||||||||
|
|
|
|
|
|
|
|
|
| |||||||||||
NET ASSETS REPRESENTED BY: | ||||||||||||||||||||
Paid-in capital | 1,581,918,268 | 294,221,005 | 711,364,523 | 320,019,566 | 1,695,013,033 | |||||||||||||||
Total accumulated earnings (loss) | 80,293,990 | 57,803,190 | (22,055,435 | ) | 42,817,481 | 131,213,974 | ||||||||||||||
|
|
|
|
|
|
|
|
|
| |||||||||||
NET ASSETS | $ | 1,662,212,258 | $ | 352,024,195 | $ | 689,309,088 | $ | 362,837,047 | $ | 1,826,227,007 | ||||||||||
|
|
|
|
|
|
|
|
|
| |||||||||||
Class 1 (unlimited shares authorized): | ||||||||||||||||||||
Net assets | $ | 7,470,402 | $ | 1,022,160 | $ | 1,667,535 | $ | 1,539,816 | $ | 961,633 | ||||||||||
Shares of beneficial interest issued and outstanding | 492,957 | 96,601 | 148,931 | 138,268 | 70,186 | |||||||||||||||
Net asset value, offering and redemption price per share | $ | 15.15 | $ | 10.58 | $ | 11.20 | $ | 11.14 | $ | 13.70 | ||||||||||
|
|
|
|
|
|
|
|
|
| |||||||||||
Class 3 (unlimited shares authorized): | ||||||||||||||||||||
Net assets | $ | 1,654,741,856 | $ | 351,002,035 | $ | 687,641,553 | $ | 361,297,231 | $ | 1,825,265,374 | ||||||||||
Shares of beneficial interest issued and outstanding | 109,688,714 | 33,254,866 | 61,638,804 | 32,595,669 | 133,718,470 | |||||||||||||||
Net asset value, offering and redemption price per share | $ | 15.09 | $ | 10.55 | $ | 11.16 | $ | 11.08 | $ | 13.65 | ||||||||||
|
|
|
|
|
|
|
|
|
| |||||||||||
| ||||||||||||||||||||
*Cost | ||||||||||||||||||||
Investment securities (unaffiliated) | $ | 1,798,132,513 | $ | 345,267,545 | $ | 815,141,311 | $ | 361,512,699 | $ | 1,791,192,880 | ||||||||||
|
|
|
|
|
|
|
|
|
| |||||||||||
See Notes To Financial Statements
| ||
| 14 |
Table of Contents
SUNAMERICA SERIES TRUST
For the Year Ended December 31, 2022
| SA American Funds Asset Allocation Portfolio | SA American Funds Global Growth Portfolio | SA American Funds Growth Portfolio | SA American Funds Growth- Income Portfolio | SA American Funds VCP Managed Allocation Portfolio | ||||||||||||||||
INVESTMENT INCOME: | ||||||||||||||||||||
Dividends (unaffiliated) | $ | 37,167,313 | $ | 3,561,533 | $ | 4,363,908 | $ | 5,917,255 | $ | 43,090,993 | ||||||||||
|
|
|
|
|
|
|
|
|
| |||||||||||
Total investment income | 37,167,313 | 3,561,533 | 4,363,908 | 5,917,255 | 43,090,993 | |||||||||||||||
|
|
|
|
|
|
|
|
|
| |||||||||||
EXPENSES: | ||||||||||||||||||||
Investment advisory and management fees | 14,654,363 | 3,610,572 | 6,027,966 | 3,210,920 | 18,738,527 | |||||||||||||||
Service fees | 4,291,238 | 946,978 | 1,768,244 | 939,971 | 4,928,806 | |||||||||||||||
Transfer agent fees | 629 | 934 | 944 | 944 | 786 | |||||||||||||||
Custodian and accounting fees | 9,758 | 9,716 | 9,725 | 9,711 | 9,781 | |||||||||||||||
Reports to shareholders | 21,506 | 15,674 | 16,279 | 25,935 | 42,851 | |||||||||||||||
Audit and tax fees | 28,973 | 30,092 | 28,536 | 28,536 | 28,965 | |||||||||||||||
Legal fees | 19,617 | 8,298 | 11,272 | 8,347 | 21,319 | |||||||||||||||
Trustees’ fees and expenses | 47,886 | 10,604 | 19,269 | 10,476 | 56,781 | |||||||||||||||
Other expenses | 65,333 | 35,774 | 39,432 | 31,558 | 94,049 | |||||||||||||||
|
|
|
|
|
|
|
|
|
| |||||||||||
Total expenses before fee waivers and expense reimbursements | 19,139,303 | 4,668,642 | 7,921,667 | 4,266,398 | 23,921,865 | |||||||||||||||
|
|
|
|
|
|
|
|
|
| |||||||||||
Net (fees waived and expenses reimbursed)/recouped by investment adviser (Note 4) | (10,344,256 | ) | (2,660,422 | ) | (4,255,035 | ) | (2,266,532 | ) | (13,807,336 | ) | ||||||||||
|
|
|
|
|
|
|
|
|
| |||||||||||
Net expenses | 8,795,047 | 2,008,220 | 3,666,632 | 1,999,866 | 10,114,529 | |||||||||||||||
|
|
|
|
|
|
|
|
|
| |||||||||||
Net investment income (loss) | 28,372,266 | 1,553,313 | 697,276 | 3,917,389 | 32,976,464 | |||||||||||||||
|
|
|
|
|
|
|
|
|
| |||||||||||
REALIZED AND UNREALIZED GAIN (LOSS) ON INVESTMENTS: | ||||||||||||||||||||
Net realized gain (loss) on investments (unaffiliated) | 9,886,522 | 7,255,041 | 4,856,904 | 1,108,132 | 18,010,796 | |||||||||||||||
Net realized gain from capital gain distributions received from underlying funds (unaffliated) | 177,193,803 | 42,290,829 | 98,397,789 | 36,518,352 | 44,340,787 | |||||||||||||||
|
|
|
|
|
|
|
|
|
| |||||||||||
Net realized gain (loss) on investments | 187,080,325 | 49,545,870 | 103,254,693 | 37,626,484 | 62,351,583 | |||||||||||||||
|
|
|
|
|
|
|
|
|
| |||||||||||
Net change in unrealized appreciation (depreciation) on investments (unaffiliated) | (480,433,080 | ) | (170,212,629 | ) | (364,360,619 | ) | (113,257,348 | ) | (490,854,145 | ) | ||||||||||
|
|
|
|
|
|
|
|
|
| |||||||||||
Net realized and unrealized gain (loss) on investments | (293,352,755 | ) | (120,666,759 | ) | (261,105,926 | ) | (75,630,864 | ) | (428,502,562 | ) | ||||||||||
|
|
|
|
|
|
|
|
|
| |||||||||||
NET INCREASE (DECREASE) IN NET ASSETS RESULTING FROM OPERATIONS | $(264,980,489 | ) | $(119,113,446 | ) | $(260,408,650 | ) | $(71,713,475 | ) | $(395,526,098 | ) | ||||||||||
|
|
|
|
|
|
|
|
|
| |||||||||||
See Notes To Financial Statements
| ||
| 15 |
Table of Contents
SUNAMERICA SERIES TRUST
STATEMENT OF CHANGES IN NET ASSETS
| SA American Funds Asset Allocation Portfolio | SA American Funds Global Growth Portfolio | SA American Funds Growth Portfolio | ||||||||||||||||||||||
| For the year ended December 31, 2022 | For the year ended December 31, 2021 | For the year ended December 31, 2022 | For the year ended December 31, 2021 | For the year ended December 31, 2022 | For the year ended December 31, 2021 | |||||||||||||||||||
INCREASE (DECREASE) IN NET ASSETS | ||||||||||||||||||||||||
OPERATIONS: | ||||||||||||||||||||||||
Net investment income (loss) | $ | 28,372,266 | $ | 23,408,377 | $ | 1,553,313 | $ | 268,848 | $ | 697,276 | $ | (120,683 | ) | |||||||||||
Net realized gain (loss) on investments | 187,080,325 | 67,450,460 | 49,545,870 | 36,274,245 | 103,254,693 | 103,043,305 | ||||||||||||||||||
Net unrealized gain (loss) on investments | (480,433,080 | ) | 142,027,418 | (170,212,629 | ) | 31,248,652 | (364,360,619 | ) | 31,333,048 | |||||||||||||||
|
|
|
|
|
|
|
|
|
|
|
| |||||||||||||
Net increase (decrease) in net assets resulting from operations | (264,980,489 | ) | 232,886,255 | (119,113,446 | ) | 67,791,745 | (260,408,650 | ) | 134,255,670 | |||||||||||||||
|
|
|
|
|
|
|
|
|
|
|
| |||||||||||||
DISTRIBUTIONS TO SHAREHOLDERS FROM: | ||||||||||||||||||||||||
Distributable earnings — Class 1 | (416,599 | ) | (141,237 | ) | (7,838 | ) | (199,491 | ) | (268,888 | ) | (83,121 | ) | ||||||||||||
Distributable earnings — Class 3 | (89,851,051 | ) | (34,086,030 | ) | (2,320,402 | ) | (37,244,762 | ) | (102,651,696 | ) | (29,364,523 | ) | ||||||||||||
|
|
|
|
|
|
|
|
|
|
|
| |||||||||||||
Total distributions to shareholders | (90,267,650 | ) | (34,227,267 | ) | (2,328,240 | ) | (37,444,253 | ) | (102,920,584 | ) | (29,447,644 | ) | ||||||||||||
|
|
|
|
|
|
|
|
|
|
|
| |||||||||||||
Net increase (decrease) in net assets resulting from capital share transactions (Note 6) | 89,193,134 | 249,223,548 | (257,651 | ) | 21,283,169 | 222,054,344 | 180,165,289 | |||||||||||||||||
|
|
|
|
|
|
|
|
|
|
|
| |||||||||||||
TOTAL INCREASE (DECREASE) IN NET ASSETS | (266,055,005 | ) | 447,882,536 | (121,699,337 | ) | 51,630,661 | (141,274,890 | ) | 284,973,315 | |||||||||||||||
NET ASSETS: | ||||||||||||||||||||||||
Beginning of period | 1,928,267,263 | 1,480,384,727 | 473,723,532 | 422,092,871 | 830,583,978 | 545,610,663 | ||||||||||||||||||
|
|
|
|
|
|
|
|
|
|
|
| |||||||||||||
End of period | $ | 1,662,212,258 | $ | 1,928,267,263 | $ | 352,024,195 | $ | 473,723,532 | $ | 689,309,088 | $ | 830,583,978 | ||||||||||||
|
|
|
|
|
|
|
|
|
|
|
| |||||||||||||
See Notes to Financial Statements
| ||
| 16 |
Table of Contents
SUNAMERICA SERIES TRUST
STATEMENT OF CHANGES IN NET ASSETS
| SA American Funds Growth-Income Portfolio | SA American Funds VCP Managed Allocation Portfolio | |||||||||||||||
| For the year ended December 31, 2022 | For the year ended December 31, 2021 | For the year ended December 31, 2022 | For the year ended December 31, 2021 | |||||||||||||
INCREASE (DECREASE) IN NET ASSETS | ||||||||||||||||
OPERATIONS: | ||||||||||||||||
Net investment income (loss) | $ | 3,917,389 | $ | 3,366,473 | $ | 32,976,464 | $ | 19,119,684 | ||||||||
Net realized gain (loss) on investments | 37,626,484 | 12,872,269 | 62,351,583 | 67,377,314 | ||||||||||||
Net unrealized gain (loss) on investments | (113,257,348 | ) | 64,003,183 | (490,854,145 | ) | 220,281,054 | ||||||||||
|
|
|
|
|
|
|
| |||||||||
Net increase (decrease) in net assets resulting from operations | (71,713,475 | ) | 80,241,925 | (395,526,098 | ) | 306,778,052 | ||||||||||
|
|
|
|
|
|
|
| |||||||||
DISTRIBUTIONS TO SHAREHOLDERS FROM: | ||||||||||||||||
Distributable earnings — Class 1 | (73,286 | ) | (81,163 | ) | (48,018 | ) | (60,478 | ) | ||||||||
Distributable earnings — Class 3 | (14,810,470 | ) | (16,958,634 | ) | (86,448,980 | ) | (145,042,998 | ) | ||||||||
|
|
|
|
|
|
|
| |||||||||
Total distributions to shareholders | (14,883,756 | ) | (17,039,797 | ) | (86,496,998 | ) | (145,103,476 | ) | ||||||||
|
|
|
|
|
|
|
| |||||||||
Net increase (decrease) in net assets resulting from capital share transactions (Note 6) | 21,676,038 | 38,585,400 | (11,787,507 | ) | 44,129,343 | |||||||||||
|
|
|
|
|
|
|
| |||||||||
TOTAL INCREASE (DECREASE) IN NET ASSETS | (64,921,193 | ) | 101,787,528 | (493,810,603 | ) | 205,803,919 | ||||||||||
NET ASSETS: | ||||||||||||||||
Beginning of period | 427,758,240 | 325,970,712 | 2,320,037,610 | 2,114,233,691 | ||||||||||||
|
|
|
|
|
|
|
| |||||||||
End of period | $ | 362,837,047 | $ | 427,758,240 | $ | 1,826,227,007 | $ | 2,320,037,610 | ||||||||
|
|
|
|
|
|
|
| |||||||||
See Notes to Financial Statements
| ||
| 17 |
Table of Contents
SUNAMERICA SERIES TRUST
December 31, 2022
Note 1. Description of Business and Basis of Presentation
SunAmerica Series Trust (the “Trust”), organized as a Massachusetts business trust on September 11, 1992, is an open-end management investment company. The Trust is comprised of sixty-one separate investment series, five of which are included in this report: SA American Funds Asset Allocation Portfolio, SA American Funds Global Growth Portfolio, SA American Funds Growth Portfolio, SA American Funds Growth-Income Portfolio and SA American Funds VCP Managed Allocation Portfolio, (collectively, the “Portfolios”). SunAmerica Asset Management, LLC (“SAAMCO” or the “Adviser”), an indirect, wholly owned subsidiaries of Corebridge Financial, Inc. (“Corebridge”), which is an indirect, majority-owned subsidiary of American International Group, Inc., a Delaware corporation (“AIG”). SAAMCo serves as investment adviser for all Portfolios of the Trust.
Shares of the Trust are issued and redeemed only in connection with investments in and payments under variable annuity contracts and variable life policies. Shares of the Portfolios are held by separate accounts of American General Life Insurance Company, a Texas life insurer (“AGL”), The United States Life Insurance Company in The City of New York, a New York life insurer (“USL”) and The Variable Annuity Life Insurance Company, a Texas life insurer (“VALIC”) and variable annuity contracts issued by Nassau Life Insurance Company (“Nassau”). AGL, USL and VALIC are indirect, majority owned subsidiaries of AIG. Each of the life companies are collectively referred to as the “Life Companies.”
SA American Funds Asset Allocation Portfolio, SA American Funds Global Growth Portfolio, SA American Funds Growth Portfolio, SA American Funds Growth-Income Portfolio and SA American Funds VCP Managed Allocation Portfolio operate as “Feeder Funds,” and invest all or substantially all of their assets in shares of an underlying mutual fund (“underlying fund” and/or “Master Fund”).
Class 1 shares and Class 3 shares of each Portfolio may be offered only in connection with certain variable contracts. Class 3 shares of a given Portfolio are identical in all respects to Class 1 shares of the same Portfolio, except that (i) each class may bear differing amounts of certain class-specific expenses; (ii) Class 3 shares are subject to service fees while Class 1 shares are not; and (iii) Class 3 shares have voting rights on matters that pertain to the Rule 12b-1 plan adopted with respect to Class 3 shares. Class 3 shares of each Portfolio pay service fees at an annual rate of 0.25% of each class’s average daily net assets. The Board of Trustees may establish additional portfolios or classes in the future.
Each Master Fund is a portfolio offered by American Funds Insurance Series® (“AFIS” or “American Funds”), a registered open-end management investment company. Each Portfolio’s corresponding Master Fund is listed below:
Trust Feeder Funds | American Funds Master Funds | |
SA American Funds Asset Allocation Portfolio | American Funds® Asset Allocation Fund | |
SA American Funds Global Growth Portfolio | American Funds® Global Growth Fund | |
SA American Funds Growth Portfolio | American Funds® Growth Fund | |
SA American Funds Growth-Income Portfolio | American Funds® Growth-Income Fund | |
SA American Funds VCP Managed Allocation Portfolio | American Funds® Managed Risk Growth-Income Fund |
The underlying fund’s accounting policies are outlined in the underlying funds’ financial statements, available at U.S. Securities and Exchange Commission (“SEC”) Internet website at www.sec.gov, and should be read in conjunction with these financial statements.
The investment goals for the Portfolios included in this report are as follows:
The SA American Funds Asset Allocation Portfolio seeks high total return (including income and capital gains) consistent with the preservation of capital over the long term. Its strategy is to invest all or substantially all of its assets in Class 1 shares of the Master Fund, the American Funds Insurance Series® Asset Allocation Fund (“the Master Asset Allocation Fund”), a portfolio offered by AFIS, a registered open-end investment company. In turn, the Master Asset Allocation Fund invests in a diversified portfolio of common stocks and other equity securities, bonds and other intermediate and long-term debt securities and money market instruments.
The SA American Funds Global Growth Portfolio seeks growth. Its strategy is to invest all or substantially all of its assets in Class 1 shares of the Master Fund, the American Funds Insurance Series® Global Growth Fund (“the Master Global Growth Fund”), a portfolio offered by AFIS, a registered open-end investment company. In turn, the Master Global Growth Fund invests primarily in common stocks and other securities of companies around the world that have the potential for growth.
The SA American Funds Growth Portfolio seeks growth. Its strategy is to invest all or substantially all of its assets in Class 1 shares of the Master Fund, the American Funds Insurance Series® Growth Fund (“the Master Growth Fund”), a portfolio offered by AFIS, a registered open-end investment company. In turn, the Master Growth Fund invests primarily in common stocks of companies that appear to offer superior opportunities for growth of capital.
| ||
| 18 |
Table of Contents
The SA American Funds Growth-Income Portfolio seeks growth and income. Its strategy is to invest all or substantially all of its assets in Class 1 shares of the Master Fund, the American Funds Insurance Series® Growth-Income Fund (“the Master Growth-Income Fund”), a portfolio offered by AFIS, a registered open-end investment company. In turn, the Master Growth-Income Fund invests primarily in common stocks or other securities that demonstrate the potential for appreciation and/or dividends.
The SA American Funds VCP Managed Allocation Portfolio seeks long-term capital growth and income while seeking to manage volatility and provide downside protection. It invests all or substantially all of its assets in Class P1 shares of the Master Fund, the American Funds Insurance Series® Managed Risk Growth-Income Fund (“the Master Managed Risk Fund”), a portfolio offered by AFIS, a registered open-end investment company. In turn, the Master Managed Risk Fund invests in the shares of an underlying fund, the American Funds Growth-Income Fund and American Funds Bond Fund (the “Underlying Funds”). The Underlying Funds invest in a diversified portfolio of common stocks and other equity securities, bonds and other debt securities and money market instruments.
Indemnifications: The Trust’s organizational documents provide current and former officers and trustees with a limited indemnification against liabilities arising out of the performance of their duties to the Trust. In addition, pursuant to Indemnification Agreements between the Trust and each of the current (and certain former) trustees who is not an “interested person,” as defined in Section 2(a)(19) of the Investment Company Act of 1940, as amended (the “1940 Act”), of the Trust (collectively, the “Disinterested Trustees”), the Trust provides the Disinterested Trustees with a limited indemnification against liabilities arising out of the performance of their duties to the Trust, whether such liabilities are asserted during or after their service as trustees. In addition, in the normal course of business the Trust enters into contracts that contain the obligation to indemnify others. The Trust’s maximum exposure under these arrangements is unknown. Currently, however, the Trust expects the risk of loss to be remote.
Note 2. Significant Accounting Policies
The preparation of financial statements in accordance with U.S. generally accepted accounting principles (“GAAP”) requires management to make estimates and assumptions that affect the reported amounts and disclosures in the financial statements. Actual results could differ from those estimates and those differences could be significant. The Portfolios are considered investment companies under GAAP and follow the accounting and reporting guidance applicable to investment companies. The following is a summary of significant accounting policies consistently followed by the Trust and the Master Funds, in the preparation of their respective financial statements:
Security Valuation
In accordance with the authoritative guidance on fair value measurements and disclosures under GAAP, the Portfolios disclose the fair value of their investments in a hierarchy that prioritizes the inputs to valuation techniques used to measure the fair value. In accordance with GAAP, fair value is defined as the price that the Portfolios would receive upon selling an asset or transferring a liability in a timely transaction to an independent third party in the principal or most advantageous market. GAAP establishes a three-tier hierarchy to provide more transparency around the inputs used to measure fair value and to establish classification of fair value measurements for disclosure purposes. Inputs refer broadly to the assumptions that market participants would use in pricing the asset or liability, including assumptions about risk. Inputs may be observable or unobservable. Observable inputs are inputs that reflect the assumptions market participants would use in pricing the asset or liability developed based on market data obtained from sources independent of the reporting entity. Unobservable inputs are inputs that reflect the reporting entity’s own assumptions about the assumptions market participants would use in pricing the asset or liability developed based on the best information available in the circumstances. The three-tiers are as follows:
Level 1 — Unadjusted quoted prices in active markets for identical securities
Level 2 — Other significant observable inputs (including quoted prices for similar securities, interest rates, prepayment speeds, credit risk, referenced indices, quoted prices in inactive markets, adjusted quoted prices in active markets, adjusted quoted prices on foreign equity securities that were adjusted in accordance with pricing procedures adopted by the Board of Trustees (the “Board”), etc.)
Level 3 — Significant unobservable inputs (includes inputs that reflect the Portfolios’ own assumptions about the assumptions market participants would use in pricing the security, developed based on the best information available under the circumstances)
Changes in valuation techniques may result in transfers in or out of an investment’s assigned Level within the hierarchy. The methodology used for valuing investments is not necessarily an indication of the risk associated with investing in those investments and the determination of the significance of a particular input to the fair value measurement in its entirety requires judgment and consideration of factors specific to each security.
The availability of observable inputs can vary from security to security and is affected by a wide variety of factors, including, for example, the type of security, whether the security is recently issued and not yet established in the marketplace, the liquidity of markets, and other characteristics particular to the security. To the extent that valuation is based on models or inputs that are less observable or unobservable in the market, the determination of fair value requires more judgment. Accordingly, the degree of judgment exercised in determining fair value is greatest for instruments categorized in Level 3.
The summary of the Portfolios’ assets and liabilities classified in the fair value hierarchy as of December 31, 2022, is reported on a schedule at the end of each Portfolio’s Portfolio of Investments.
| ||
| 19 |
Table of Contents
The net asset value (“NAV”) of each Portfolio is determined based upon the NAV of its corresponding Master Fund.
Master Funds
Each Master Fund is a series of AFIS. All portfolio securities of funds managed by Capital Research and Management Company (“Capital Research”) are valued, and the NAV per share for each share class are determined, as follows:
Each Master Fund is a series of AFIS. All portfolio securities of funds managed by Capital Research and Management Company (“Capital Research”) are valued, and the NAV per share for each share class are determined, as follows: The AFIS investment adviser values the AFIS investments at fair value as defined by U.S. GAAP. The net asset value of per share is calculated once daily as of the close of regular trading on the New York Stock Exchange, normally 4 p.m. New York time, each day the New York Stock Exchange is open.
Methods and inputs — The AFIS investment adviser uses the following methods and inputs to establish the fair value of each fund’s assets and liabilities. Use of particular methods and inputs may vary over time based on availability and relevance as market and economic conditions evolve.
Equity securities, including depositary receipts, are generally valued at the official closing price of, or the last reported sale price on, the exchange or market on which such securities are traded, as of the close of business on the day the securities are being valued or, lacking any sales, at the last available bid price. Prices for each security are taken from the principal exchange or market on which the security trades. The value of an underlying fund is based on its reported net asset value.
Fixed-income securities, including short-term securities, are generally valued at evaluated prices obtained from third-party pricing vendors. Vendors value such securities based on one or more of the inputs described in the following table. The table provides examples of inputs that are commonly relevant for valuing particular classes of fixed-income securities in which the funds are authorized to invest. However, these classifications are not exclusive and any of the inputs may be used to value any other class of fixed-income security.
| Fixed-income class | Examples of standard inputs | |
| All | Benchmark yields, transactions, bids, offers, quotations from dealers and trading systems, new issues, spreads and other relationships observed in the markets among comparable securities; and proprietary pricing models such as yield measures calculated using factors such as cash flows, financial or collateral performance and other reference data (collectively referred to as “standard inputs”) | |
| Corporate bonds & notes; convertible securities | Standard inputs and underlying equity of the issuer | |
| Bonds & notes of governments & government agencies | Standard inputs and interest rate volatilities | |
| Mortgage-backed; asset-backed obligations | Standard inputs and cash flows, prepayment information, default rates, delinquency and loss assumptions, collateral characteristics, credit enhancements and specific deal information | |
| Municipal securities | Standard inputs and, for certain distressed securities, cash flows or liquidation values using a net present value calculation based on inputs that include, but are not limited to, financial statements and debt contracts | |
Securities with both fixed-income and equity characteristics, or equity securities traded principally among fixed-income dealers, are generally valued in the manner described for either equity or fixed-income securities, depending on which method is deemed most appropriate by the AFIS investment adviser. The Capital Group Central Corporate Bond Fund (“CCBF”), a fund within the Capital Group Central Fund Series II, and Capital Group Central Cash Fund (“CCF”), a fund within the Capital Group Central Fund Series (collectively the “Central Funds”), are each valued based upon a floating net asset value, which fluctuates with changes in the value of each fund’s portfolio securities. The underlying securities are valued based on the policies and procedures in the Central Funds’ statements of additional information. The State Street Institutional U.S. Government Money Market Fund held by the managed risk funds is managed to maintain a $1.00 net asset value per share. The net asset value of each share class of each managed risk fund is calculated based on the reported net asset values of the underlying funds in which each fund invests.
Exchange-traded options and futures are generally valued at the official closing price for options and official settlement price for futures of the exchange or market on which such instruments are traded, as of the close of business on the day such instruments are being valued. Forward currency contracts are valued based on the spot and forward exchange rates obtained from third-party pricing vendors. Swaps are generally valued using evaluated prices obtained by third-party pricing vendors who calculate these values based on market inputs that may include the yields of the indices referenced in the instrument and the relevant curve, dealer quotes, default probabilities and recovery rates, other reference data, and terms of the contract.
Securities and other assets for which representative market quotations are not readily available or are considered unreliable by the AFIS investment adviser are fair valued as determined in good faith under fair value guidelines adopted by AFIS investment advisor and approved by the AFIS board of trustees as further described. The AFIS investment adviser follows fair valuation guidelines, consistent with U.S. Securities and Exchange Commission rules and guidance, to consider relevant principles and factors when making
| ||
| 20 |
Table of Contents
fair value determinations. The AFIS investment adviser considers relevant indications of value that are reasonably and timely available to it in determining the fair value to be assigned to a particular security, such as the type and cost of the security; contractual or legal restrictions on resale of the security; relevant financial or business developments of the issuer; actively traded similar or related securities; dealer or broker quotes; conversion or exchange rights on the security; related corporate actions; significant events occurring after the close of trading in the security, and changes in overall market conditions. In addition, the closing prices of equity securities and futures that trade in markets outside U.S. time zones may be adjusted to reflect significant events that occur after the close of local trading but before the net asset value of each share class of each fund is determined. Fair valuations of investments that are not actively trading involve judgment and may differ materially from valuations that would have been used had greater market activity occurred.
Processes and structure — The AFIS board of trustees has designated the AFIS investment adviser to make fair value determinations, subject to board oversight. The AFIS investment adviser has established a Joint Fair Valuation Committee (the “Fair Valuation Committee”) to administer, implement and oversee the fair valuation process, and to make fair value decisions. The Fair Valuation Committee regularly reviews its own fair value decisions, as well as decisions made under its standing instructions to the AFIS investment adviser’s valuation team. The Fair Valuation Committee reviews changes in fair value measurements from period to period and may, as deemed appropriate, update the fair valuation guidelines to better reflect the results of back testing and address new or evolving issues. The Fair Valuation Committee reports any changes to the fair valuation guidelines to the AFIS board of trustees. The AFIS board and audit committee also regularly review reports that describe fair value determinations and methods.
The AFIS investment adviser has also established a Fixed-Income Pricing Review Group to administer and oversee the fixed-income valuation process, including the use of fixed-income pricing vendors. This group regularly reviews pricing vendor information and market data. Pricing decisions, processes and controls over security valuation are also subject to additional internal reviews facilitated by the AFIS investment adviser’s global risk management group.
Securities Transactions, Investment Income, Expenses, Dividends and Distributions to Shareholders: Security transactions are recorded on a trade date basis. Interest income is accrued daily from settlement date except when collection is not expected. Realized gains and losses on the sale of investments are calculated on the identified cost basis. Dividend income is recorded on the ex-dividend date.
The Portfolios invest in Master Fund portfolios offered by American Funds including funds investing in fixed income securities. Distributions from income from the Master Funds, if any, are recorded to income on ex-dividend date. Distributions from net realized capital gains from the Master Funds, if any, are recorded to realized gains on ex-dividend date.
Expenses common to all Portfolios, not directly related to individual Portfolios are allocated among the Portfolios based upon relative net assets or other appropriate allocation methods. In all other respects, expenses are charged to each Portfolio as incurred on a specific identification basis.
The expenses included in the accompanying financial statements reflect the expenses of the Portfolios and do not include indirect expenses borne by each underlying Portfolio in connection with its investment in the underlying Portfolio.
Dividends from net investment income and capital gain distributions, if any, are paid annually. The Portfolios record dividends and distributions to their shareholders on the ex-dividend date.
The amount of dividends and distributions from net investment income and net realized capital gains are determined in accordance with federal income tax regulations, which may differ from GAAP. These “book/tax” differences are either considered temporary or permanent in nature. To the extent these differences are permanent in nature, such amounts are reclassified within the capital accounts at fiscal year end based on their federal tax-basis treatment; temporary differences do not require reclassification. Net assets are not affected by these reclassifications.
Each Portfolio is considered a separate entity for tax purposes and intends to comply with the requirements of the Internal Revenue Code, as amended, applicable to regulated investment companies and distribute all of its taxable income, including any net capital gains on investments, to its shareholders. Each Portfolio also intends to distribute sufficient net investment income and net capital gains, if any, so that it will not be subject to excise tax on undistributed income and gains. Therefore, no federal income tax or excise tax provision is required.
Each Portfolio recognizes the tax benefits of uncertain tax positions only when the position is more likely than not to be sustained, assuming examination by tax authorities. Management has analyzed each Portfolio’s tax positions and concluded that no liability for unrecognized tax benefits should be recorded related to uncertain tax positions. The Portfolios are not aware of any tax provisions for which it is reasonably possible that the total amounts of unrecognized tax benefits will change materially in the next twelve months. The Portfolios file U.S. federal and certain state income tax returns. The Portfolios federal tax returns for the prior three fiscal years remain subject to examinations by the Internal Revenue Service.
LIBOR Risk: A Portfolio’s investments, payment obligations and financing terms may be based on floating rates, such as LIBOR, Euro Interbank Offered Rate, SOFR and other similar types of reference rates (each, a “Reference Rate”). On July 27, 2017, the Chief Executive of the UK Financial Conduct Authority (“FCA”), which regulates LIBOR, announced that the FCA will no longer persuade nor require banks to submit rates for the calculation of LIBOR and certain other Reference Rates after 2021. On March 5, 2021, the FCA and LIBOR’s administrator announced that most LIBOR settings will no longer be published after June 30, 2023. Such announcements indicate that the continuation of LIBOR and other Reference Rates on the current basis cannot and will not be guaranteed. These announcements and any additional regulatory or market changes may have an adverse impact on a Portfolio or its investments.
| ||
| 21 |
Table of Contents
Regulators and market participants are working together to identify or develop successor Reference Rates (e.g. SOFR, which is intended to replace the U.S. dollar LIBOR). It is expected that market participants will focus on the transition mechanisms by which the Reference Rates in existing contracts or instruments may be amended, whether through market wide protocols, fallback contractual provisions, bespoke negotiations or amendments or otherwise. Nonetheless, the termination of certain Reference Rates presents risks to a Portfolio. At this time, it is not possible to completely identify or predict the effect of any such changes, any establishment of alternative Reference Rates or any other reforms to Reference Rates that may be enacted in the UK or elsewhere. The elimination of a Reference Rate or any other changes or reforms to the determination or supervision of Reference Rates, and these changes could have an adverse impact on the market for or value of any securities or payments linked to those Reference Rates and other financial obligations held by a Portfolio or on its overall financial condition or results of operations. In addition, any substitute Reference Rate and any pricing adjustments imposed by a regulator or by counterparties or otherwise may adversely affect a Portfolio’s performance and/or net asset value.
Recent Accounting and Regulatory Developments: In March 2020, FASB issued ASU No. 2020-04, Reference Rate Reform (Topic 848); Facilitation of the Effects of Reference Rate Reform on Financial Reporting, which provides, optional, temporary relief with respect to the financial reporting of contracts subject to certain types of modifications due to the planned discontinuation of the LIBOR and LIBOR based reference rates as of the end of 2021. The temporary relief provided by ASU 2020-04 is effective for certain reference rate related contract modifications that occur during the period March 12, 2020 through December 31, 2022. As a result of an extension in the planned discontinuation date of USD LIBOR, the FASB issued ASU No. 2022-06, “Reference Rate Reform” in December 2022, which extends the temporary relief provided by ASU 2020-04 to December 31, 2024. Management is evaluating the potential impact of ASU 2020-04 to the financial statements.
On December 3, 2020, the SEC announced that it voted to adopt a new rule that establishes an updated regulatory framework for fund valuation practices (the “Rule”). The Rule, in part, provides (i) a framework for determining fair value in good faith and (ii) provides for a fund Board’s assignment of its responsibility for the execution of valuation-related activities to a fund’s investment adviser. Further, the SEC is rescinding previously issued guidance on related issues. The Rule became effective on March 8, 2021 and has a compliance date of September 8, 2022. Adoption of the Rule had no material impact on the Portfolios.
Note 3. Federal Income Taxes
The following details the tax basis of distributions as well as the components of distributable earnings. The tax basis components of distributable earnings differ from the amounts reflected in the Statement of Assets and Liabilities by temporary book/tax differences primarily arising from wash sales.
| For the year ended December 31, 2022 | ||||||||||||||||||||
| Distributable Earnings | Tax Distributions | |||||||||||||||||||
Portfolio | Ordinary Income | Long-term Gains/ Capital and Other Losses | Unrealized Appreciation (Depreciation) | Ordinary Income | Long-Term Capital Gains | |||||||||||||||
SA American Funds Asset Allocation | $ | 42,884,404 | $ | 173,155,158 | $ | (135,745,572 | ) | $ | 31,381,661 | $ | 58,885,989 | |||||||||
SA American Funds Global Growth | 2,554,828 | 48,546,576 | 6,701,788 | — | 2,328,240 | |||||||||||||||
SA American Funds Growth | 11,256,991 | 92,694,977 | (126,007,404 | ) | 3,759,345 | 99,161,239 | ||||||||||||||
SA American Funds Growth-Income | 8,935,518 | 33,149,852 | 732,112 | 3,366,472 | 11,517,284 | |||||||||||||||
SA American Funds VCP Managed Asset Allocation | 32,976,464 | 62,351,583 | 35,885,927 | 19,119,684 | 67,377,314 | |||||||||||||||
| For the year ended December 31, 2021 | ||||||||||||||||||||
| Tax Distributions | ||||||||||||||||||||
Portfolio | Ordinary Income | Long-Term Capital Gains | ||||||||||||||||||
SA American Funds Asset Allocation |
| $ | 18,636,107 | $ | 15,591,160 | |||||||||||||||
SA American Funds Global Growth |
| 268,848 | 37,175,405 | |||||||||||||||||
SA American Funds Growth |
| 176,769 | 29,270,875 | |||||||||||||||||
SA American Funds Growth-Income |
| 3,822,092 | 13,217,705 | |||||||||||||||||
SA American Funds VCP Managed Asset Allocation |
| 27,294,057 | 117,809,419 | |||||||||||||||||
For the year ended December 31, 2022, there were no reclassifications between total accumulated earnings(loss) and paid-in capital resulting from book/tax differences.
The amounts of aggregate unrealized gain (loss) and the cost of investment securities for Federal tax purposes, including short-term securities and repurchase agreements, were as follows:
Portfolio | Aggregate Unrealized Gain | Aggregate Unrealized Loss | Net Unrealized Gain / (Loss) | Cost of Investments | ||||||||||||
SA American Funds Asset Allocation | $ | — | $ | (135,745,572 | ) | $ | (135,745,572 | ) | $ | 1,798,801,924 | ||||||
SA American Funds Global Growth | 6,701,788 | — | 6,701,788 | 345,542,345 | ||||||||||||
SA American Funds Growth | — | (126,007,404 | ) | (126,007,404 | ) | 815,678,387 | ||||||||||
SA American Funds Growth-Income | 732,112 | — | 732,112 | 362,317,490 | ||||||||||||
SA American Funds VCP Managed Asset Allocation | 35,885,927 | — | 35,885,927 | 1,791,256,861 | ||||||||||||
| ||
| 22 |
Table of Contents
Note 4. Investment Advisory and Management Agreement, and Service Plan (12b-1 Plan)
Capital Research serves as investment adviser to the Master Funds. Capital Research, a wholly owned subsidiary of The Capital Group Companies, Inc., manages the investment fund and business affairs of the Master Funds. The Trust, on behalf of each Portfolio, entered into an Investment Advisory and Management Agreement (the “Agreement”) with SAAMCo to handle the Trust’s day-to-day affairs. The Agreement provides that SAAMCo shall manage the Trust’s investments and administer its business affairs; furnish offices, necessary facilities and equipment; provide clerical, bookkeeping and administrative services; and permit any of its officers or employees to serve, without compensation, as trustees or officers of the Trust, if duly elected to such positions. SAAMCo performs all investment advisory services for these Portfolios with the exception of portfolio management. The term “Assets,” as used in the following table, means the average daily net assets of the Portfolios.
The Trust pays SAAMCo a monthly fee calculated daily at the following annual percentages of each Portfolio’s Assets:
Portfolio | Management Fees | |||
SA American Funds Asset Allocation | 0.85 | % | ||
SA American Funds Global Growth | 0.95 | % | ||
SA American Funds Growth | 0.85 | % | ||
SA American Funds Growth-Income | 0.85 | % | ||
SA American Funds VCP Managed Allocation | 0.95 | % | ||
The Trust has entered into a contractual agreement with SAAMCo under which SAAMCo will waive 0.60%, 0.70%, 0.60%, 0.60%, and 0.70% for SA American Funds Asset Allocation Portfolio, SA American Funds Global Growth Portfolio, SA American Funds Growth Portfolio, SA American Funds Growth-Income Portfolio and SA American Funds VCP Managed Allocation Portfolio, respectively, of its advisory fee for such time as the Portfolios are operated as feeder funds, because during that time it will not be providing the portfolio management portion of the advisory and management services to be provided under its investment advisory and management agreement with the Trust. This fee waiver will continue as long as the Portfolios are part of a master-feeder fund structure unless the Board approves a change in or elimination of the waiver.
For the year ended December 31, 2022, SAAMCo has agreed to waive advisory fees as follows:
Portfolio | Amount | |||
SA American Funds Asset Allocation | $ | 10,344,256 | ||
SA American Funds Global Growth | 2,660,422 | |||
SA American Funds Growth | 4,255,035 | |||
SA American Funds Growth-Income | 2,266,532 | |||
SA American Funds VCP Managed Allocation | 13,807,336 | |||
SAAMCo has contractually agreed to waive fees and/or reimburse expenses of the following Portfolio until April 30, 2024; so that the annual operating expenses do not exceed the following percentage of the Portfolio’s average net assets. For purposes of the waived fees and/or reimbursed expense calculations, annual operating expenses shall not include extraordinary expenses (i.e. expenses that are unusual in nature and infrequent in occurrence such as litigation), or acquired fund fees and expenses, brokerage commissions and other transactional expenses relating to the purchase and sale of portfolio securities, interest, taxes and governmental fees, and other expenses not incurred in the ordinary course of the Portfolio’s business. This agreement may be modified or discontinued prior to April 30, 2024 only with the approval of the Board of Trustees of the Portfolio, including a majority of the Independent Trustees. This agreement will be renewed in terms of one year only if the Adviser agrees to extend the expense limitation.
Portfolio | Class 1 | Class 3 | ||||||
SA American Funds VCP Managed Allocation | 0.28 | % | 0.53 | % | ||||
With the exception of advisory fee waivers, for the year ended December 31, 2022, pursuant to the contractual waivers/reimbursement expense referred to above, SAAMCo did not waive or reimburse any expenses.
With the exception of advisory fee waivers, any contractual waivers or reimbursements made by the Adviser are subject to recoupment from that Portfolio within the following two years after the occurrence of the waivers and/or reimbursements provided that the Portfolio is able to effect such payment to the Adviser and remain in compliance with the expense limitations in effect at the time the waivers and/or reimbursements were made. For the year ended December 31, 2022, no amounts were repaid to the Adviser, and there are no remaining balances subject to recoupment.
The Trust has entered into a master Transfer Agency and Service Agreement with VALIC Retirement Services Company (VRSCO), a majority-owned subsidiary of VALIC, which is an affiliate of the Adviser. Under the agreement, VRSCO provides services, which include the issuance and redemption of shares, payment of dividends between the Trust and their “institutional” shareholders and certain shareholder reporting services including confirmation of transactions, statements of account and tax reporting. The Trust, and certain other mutual funds advised by SAAMCo pay VRSCO on an annual basis, a fee in the aggregate amount of $150,000 for transfer agency services provided, pursuant to the agreement. Accordingly, for the year ended December 31, 2022, transfer agent fees were paid (see Statement of Operations) based on the aforementioned agreement.
Class 3 shares of each Portfolio are subject to Rule 12b-1 plans that provide for service fees payable at the annual rate 0.25% of the average daily net assets of Class 3 shares. The service fees are used to compensate the Life Companies for costs associated with the
| ||
| 23 |
Table of Contents
servicing of Class 3 shares, including the cost of reimbursing the Life Companies for expenditures made to financial intermediaries for providing services to contract holders who are the indirect beneficial owners of the Portfolios’ Class 3 shares. Accordingly, for the year ended December 31, 2022, service fees were paid (see Statement of Operations) based on the aforementioned rate.
Note 5. Purchases and Sales of Investment Securities
The cost of purchases and proceeds from sales and maturities of long-term investments during the year ended December 31, 2022 were as follows:
Portfolio | Purchases of portfolio securities (excluding U.S. government securities) | Sales of portfolio securities (excluding U.S. government securities) | Purchases of U.S. government securities | Sales of U.S. government securities | ||||||||||||
SA American Funds Asset Allocation | $ | 74,121,446 | $ | 84,084,868 | $ | — | $ | — | ||||||||
SA American Funds Global Growth | 40,950,519 | 45,605,062 | — | — | ||||||||||||
SA American Funds Growth | 139,134,143 | 23,750,716 | — | — | ||||||||||||
SA American Funds Growth-Income | 31,110,068 | 26,359,734 | — | — | ||||||||||||
SA American Funds VCP Managed Asset Allocation | 48,231,951 | 156,854,296 | — | — | ||||||||||||
Note 6. Capital Share Transactions
Transactions in capital shares of each class of each Portfolio were as follows:
| SA American Funds Asset Allocation Portfolio | ||||||||||||||||||||||||||||||||
| Class 1 | Class 3 | |||||||||||||||||||||||||||||||
| For the year ended December 31, 2022 | For the year ended December 31, 2021 | For the year ended December 31, 2022 | For the year ended December 31, 2021 | |||||||||||||||||||||||||||||
| Shares | Amount | Shares | Amount | Shares | Amount | Shares | Amount | |||||||||||||||||||||||||
Shares sold | 45,224 | $ | 729,835 | 153,726 | $ | 2,784,515 | 4,538,587 | $ | 75,440,624 | 13,472,268 | $ | 238,595,403 | ||||||||||||||||||||
Reinvested dividends | 29,694 | 416,599 | 7,903 | 141,237 | 6,427,114 | 89,851,051 | 1,914,945 | 34,086,030 | ||||||||||||||||||||||||
Shares redeemed | (32,465 | ) | (527,165 | ) | (147,296 | ) | (2,483,423 | ) | (4,804,423 | ) | (76,717,810 | ) | (1,342,407 | ) | (23,900,214 | ) | ||||||||||||||||
|
|
|
|
|
|
|
|
|
|
|
|
|
|
|
| |||||||||||||||||
Net increase (decrease) | 42,453 | $ | 619,269 | 14,333 | $ | 442,329 | 6,161,278 | $ | 88,573,865 | 14,044,806 | $ | 248,781,219 | ||||||||||||||||||||
|
|
|
|
|
|
|
|
|
|
|
|
|
|
|
| |||||||||||||||||
| SA American Funds Global Growth Portfolio | ||||||||||||||||||||||||||||||||
| Class 1 | Class 3 | |||||||||||||||||||||||||||||||
| For the year ended December 31, 2022 | For the year ended December 31, 2021 | For the year ended December 31, 2022 | For the year ended December 31, 2021 | |||||||||||||||||||||||||||||
| Shares | Amount | Shares | Amount | Shares | Amount | Shares | Amount | |||||||||||||||||||||||||
Shares sold | 21,300 | $ | 229,743 | 134,726 | $ | 1,906,276 | 3,659,831 | $ | 41,126,925 | 1,300,232 | $ | 18,504,210 | ||||||||||||||||||||
Reinvested dividends | 831 | 7,838 | 14,244 | 199,491 | 246,589 | 2,320,402 | 2,660,406 | 37,244,762 | ||||||||||||||||||||||||
Shares redeemed | (99,594 | ) | (1,272,835 | ) | (16,991 | ) | (250,341 | ) | (3,932,165 | ) | (42,669,724 | ) | (2,491,159 | ) | (36,321,229 | ) | ||||||||||||||||
|
|
|
|
|
|
|
|
|
|
|
|
|
|
|
| |||||||||||||||||
Net increase (decrease) | (77,463 | ) | $ | (1,035,254 | ) | 131,979 | $ | 1,855,426 | (25,745 | ) | $ | 777,603 | 1,469,479 | $ | 19,427,743 | |||||||||||||||||
|
|
|
|
|
|
|
|
|
|
|
|
|
|
|
| |||||||||||||||||
| SA American Funds Growth Portfolio | ||||||||||||||||||||||||||||||||
| Class 1 | Class 3 | |||||||||||||||||||||||||||||||
| For the year ended December 31, 2022 | For the year ended December 31, 2021 | For the year ended December 31, 2022 | For the year ended December 31, 2021 | |||||||||||||||||||||||||||||
| Shares | Amount | Shares | Amount | Shares | Amount | Shares | Amount | |||||||||||||||||||||||||
Shares sold | 34,805 | $ | 465,022 | 78,701 | $ | 1,364,912 | 10,071,544 | $ | 140,051,304 | 10,459,734 | $ | 188,111,818 | ||||||||||||||||||||
Reinvested dividends | 25,013 | 268,888 | 4,617 | 83,121 | 9,575,718 | 102,651,696 | 1,636,818 | 29,364,523 | ||||||||||||||||||||||||
Shares redeemed | (31,527 | ) | (400,134 | ) | (5,820 | ) | (109,337 | ) | (1,511,185 | ) | (20,982,432 | ) | (2,076,893 | ) | (38,649,748 | ) | ||||||||||||||||
|
|
|
|
|
|
|
|
|
|
|
|
|
|
|
| |||||||||||||||||
Net increase (decrease) | 28,291 | $ | 333,776 | 77,498 | $ | 1,338,696 | 18,136,077 | $ | 221,720,568 | 10,019,659 | $ | 178,826,593 | ||||||||||||||||||||
|
|
|
|
|
|
|
|
|
|
|
|
|
|
|
| |||||||||||||||||
| SA American Funds Growth-Income Portfolio | ||||||||||||||||||||||||||||||||
| Class 1 | Class 3 | |||||||||||||||||||||||||||||||
| For the year ended December 31, 2022 | For the year ended December 31, 2021 | For the year ended December 31, 2022 | For the year ended December 31, 2021 | |||||||||||||||||||||||||||||
| Shares | Amount | Shares | Amount | Shares | Amount | Shares | Amount | |||||||||||||||||||||||||
Shares sold | 23,293 | $ | 271,118 | 96,142 | $ | 1,194,282 | 2,669,532 | $ | 31,652,144 | 3,787,092 | $ | 49,760,493 | ||||||||||||||||||||
Reinvested dividends | 7,213 | 73,286 | 6,186 | 81,163 | 1,463,485 | 14,810,470 | 1,297,524 | 16,958,634 | ||||||||||||||||||||||||
Shares redeemed | (33,883 | ) | (386,870 | ) | (8,770 | ) | (119,893 | ) | (2,120,039 | ) | (24,744,110 | ) | (2,206,662 | ) | (29,289,279 | ) | ||||||||||||||||
|
|
|
|
|
|
|
|
|
|
|
|
|
|
|
| |||||||||||||||||
Net increase (decrease) | (3,377 | ) | $ | (42,466 | ) | 93,558 | $ | 1,155,552 | 2,012,978 | $ | 21,718,504 | 2,877,954 | $ | 37,429,848 | ||||||||||||||||||
|
|
|
|
|
|
|
|
|
|
|
|
|
|
|
| |||||||||||||||||
| ||
| 24 |
Table of Contents
| SA American Funds VCP Managed Allocation Portfolio | ||||||||||||||||||||||||||||||||
| Class 1 | Class 3 | |||||||||||||||||||||||||||||||
| For the year ended December 31, 2022 | For the year ended December 31, 2021 | For the year ended December 31, 2022 | For the year ended December 31, 2021 | |||||||||||||||||||||||||||||
| Shares | Amount | Shares | Amount | Shares | Amount | Shares | Amount | |||||||||||||||||||||||||
Shares sold | 14,298 | $ | 219,254 | 36,922 | $ | 624,236 | 3,238,375 | $ | 48,219,638 | 3,920,151 | $ | 67,327,180 | ||||||||||||||||||||
Reinvested dividends | 3,608 | 48,018 | 3,641 | 60,478 | 6,514,618 | 86,448,980 | 8,763,927 | 145,042,998 | ||||||||||||||||||||||||
Shares redeemed | (2,179 | ) | (31,899 | ) | (1,869 | ) | (32,548 | ) | (9,963,061 | ) | (146,691,498 | ) | (9,833,573 | ) | (168,893,001 | ) | ||||||||||||||||
|
|
|
|
|
|
|
|
|
|
|
|
|
|
|
| |||||||||||||||||
Net increase (decrease) | 15,727 | $ | 235,373 | 38,694 | $ | 652,166 | (210,068 | ) | $ | (12,022,880 | ) | 2,850,505 | $ | 43,477,177 | ||||||||||||||||||
|
|
|
|
|
|
|
|
|
|
|
|
|
|
|
| |||||||||||||||||
Note 7. Line of Credit
The Trust, along with certain other funds managed by the Adviser, has access to a $75 million committed unsecured line of credit and a $50 million uncommitted unsecured line of credit. The committed and uncommitted lines of credit are renewable on an annual basis with State Street Bank and Trust Company (“State Street”), the Trust’s custodian. Interest on each of the committed and uncommitted lines of credit is payable at a variable rate per annum equal to the Applicable Rate plus one and one quarter of one percent (1.25%). The Applicable Rate per annum shall be equal to the higher of (a) the federal funds effective rate on such date and (b) the overnight bank funding rate on such date, plus, in each case, 10 basis points. Notwithstanding anything to the contrary, if the federal funds effective ate or the overnight bank funding rate shall be less than zero, then the federal funds effective rate or the overnight bank funding rate, shall be deemed to be zero for the purposes of determining the rate. The Trust, on behalf of each of the Portfolios, has paid State Street, such Portfolio’s ratable portion of an upfront fee in an amount equal to $40,000 in the aggregate for the uncommitted line of credit made available by State Street to certain other funds managed by the Adviser, which are also party to the uncommitted line of credit. There is also a commitment fee of 30 basis points per annum on the daily unused portion of the committed line of credit. Borrowings under the line of credit will commence when the respective Portfolio’s cash shortfall exceeds $100,000.
For the year ended December 31, 2022, the Portfolios did not utilize the line of credit.
Note 8. Transactions with Affiliates
At December 31, 2022, the following affiliates owned outstanding shares of the following Portfolios:
| Holder | ||||||||||||
Portfolio | USL | AGL | VALIC | |||||||||
SA American Funds Asset Allocation | 7.20 | % | 88.85 | % | 3.95 | % | ||||||
SA American Funds Global Growth | 5.20 | % | 93.93 | % | 0.87 | % | ||||||
SA American Funds Growth | 5.66 | % | 92.75 | % | 1.59 | % | ||||||
SA American Funds Global-Income | 6.03 | % | 92.29 | % | 1.68 | % | ||||||
SA American Funds VCP Managed Allocation | 9.92 | % | 85.96 | % | 4.12 | % | ||||||
Note 9. Other Matters
The coronavirus pandemic and the related governmental and public responses have had and may continue to have an impact on the Portfolio’s investments and net asset value and have led and may continue to lead to increased market volatility and the potential for illiquidity in certain classes of securities and sectors of the market. Preventative or protective actions that governments may take in respect of pandemic or epidemic diseases may result in periods of business disruption, business closures, inability to obtain raw materials, supplies and component parts, and reduced or disrupted operations for the issuers in which the Portfolio invests. Government intervention in markets may impact interest rates, market volatility and security pricing. The occurrence, reoccurrence and pendency of such diseases could adversely affect the economies (including through changes in business activity and increased unemployment) and financial markets either in specific countries or worldwide.
In late February 2022, Russia launched a large-scale invasion of Ukraine (the “Invasion”). The extent and duration of Russia’s military actions and the consequences of such actions are impossible to predict, but has resulted in, and may continue to result in, significant market disruptions, including in the commodities markets, and has negatively affected, and may continue to negatively affect global supply chains, global growth and inflation. In response to Russia’s recent military invasion of Ukraine, the United States, the European Union and other countries have imposed broad-ranging economic sanctions on certain Russian individuals and Russian entities. To the extent covered by the sanctions, the Portfolios are currently restricted from trading in Russian securities. It is unknown when, or if, sanctions may be lifted or a Portfolio’s ability to trade in Russian securities will resume. Even if a Portfolio does not have direct exposure to securities of Russian issuers, the potential for wider conflict in the region or globally may increase volatility and uncertainty in the financial markets. These and any related events could adversely affect a Portfolio’s performance and the value and liquidity of an investment in the Portfolio.
| ||
| 25 |
Table of Contents
SUNAMERICA SERIES TRUST
Selected data for a share of beneficial interest outstanding throughout each period
| Period ended | Net Asset Value, beginning of period | Net investment income (loss)* | Net gain (loss) on investments (both realized and unrealized) | Total from investment operations | Dividends from net investment income | Dividend from net realized gain on investments | Total Distributions | Net Asset Value, end of period | Total Return** | Net Assets, end of period (000’s) | Ratio of expenses to average net assets(1)(2) | Ratio of net investment income (loss) to average net assets(1)(2)(3) | Portfolio turnover | |||||||||||||||||||||||||||||||||||||||
| SA American Funds Asset Allocation Portfolio Class 1 |
| |||||||||||||||||||||||||||||||||||||||||||||||||||
| 12/31/18 | $ | 14.85 | $ | 0.32 | $ | (0.99 | ) | $ | (0.67 | ) | $ | (0.44 | ) | $ | (0.80 | ) | $ | (1.24 | ) | $ | 12.94 | (4.58 | )% | $ | 824 | 0.27 | % | 2.30 | % | 1 | % | |||||||||||||||||||||
| 12/31/19 | 12.94 | 0.43 | 2.31 | 2.74 | (0.27 | ) | (0.70 | ) | (0.97 | ) | 14.71 | 21.22 | 4,320 | 0.27 | 3.05 | 2 | ||||||||||||||||||||||||||||||||||||
| 12/31/20 | 14.71 | 0.28 | 1.54 | 1.82 | — | (0.01 | ) | (0.01 | ) | 16.52 | 12.40 | 7,207 | 0.27 | 1.92 | 3 | |||||||||||||||||||||||||||||||||||||
| 12/31/21 | 16.52 | 0.33 | 2.16 | 2.49 | (0.22 | ) | (0.16 | ) | (0.38 | ) | 18.63 | 15.12 | 8,393 | 0.26 | 1.83 | 2 | ||||||||||||||||||||||||||||||||||||
12/31/22 | 18.63 | 0.32 | (2.90 | ) | (2.58 | ) | (0.34 | ) | (0.56 | ) | (0.90 | ) | 15.15 | (13.44 | ) | 7,470 | 0.26 | 1.94 | 4 | |||||||||||||||||||||||||||||||||
| SA American Funds Asset Allocation Portfolio Class 3 |
| |||||||||||||||||||||||||||||||||||||||||||||||||||
| 12/31/18 | 14.81 | 0.24 | (0.95 | ) | (0.71 | ) | (0.37 | ) | (0.80 | ) | (1.17 | ) | 12.93 | (4.86 | ) | 789,902 | 0.52 | 1.68 | 1 | |||||||||||||||||||||||||||||||||
| 12/31/19 | 12.93 | 0.26 | 2.44 | 2.70 | (0.24 | ) | (0.70 | ) | (0.94 | ) | 14.69 | 20.91 | 1,171,382 | 0.52 | 1.82 | 2 | ||||||||||||||||||||||||||||||||||||
| 12/31/20 | 14.69 | 0.22 | 1.56 | 1.78 | — | (0.01 | ) | (0.01 | ) | 16.46 | 12.14 | 1,473,177 | 0.52 | 1.49 | 3 | |||||||||||||||||||||||||||||||||||||
| 12/31/21 | 16.46 | 0.24 | 2.19 | 2.43 | (0.19 | ) | (0.16 | ) | (0.35 | ) | 18.54 | 14.80 | 1,919,874 | 0.51 | 1.35 | 2 | ||||||||||||||||||||||||||||||||||||
12/31/22 | 18.54 | 0.27 | (2.86 | ) | (2.59 | ) | (0.30 | ) | (0.56 | ) | (0.86 | ) | 15.09 | (13.58 | ) | 1,654,742 | 0.51 | 1.64 | 4 | |||||||||||||||||||||||||||||||||
| SA American Funds Global Growth Portfolio Class 1 |
| |||||||||||||||||||||||||||||||||||||||||||||||||||
| 12/31/18 | 13.13 | 0.09 | (1.23 | ) | (1.14 | ) | (0.22 | ) | (2.62 | ) | (2.84 | ) | 9.15 | (9.12 | ) | 115 | 0.27 | 0.68 | 5 | |||||||||||||||||||||||||||||||||
| 12/31/19 | 9.15 | 0.14 | 3.07 | 3.21 | (0.12 | ) | (1.30 | ) | (1.42 | ) | 10.94 | 35.27 | 246 | 0.29 | 1.34 | 1 | ||||||||||||||||||||||||||||||||||||
| 12/31/20 | 10.94 | 0.05 | 3.25 | 3.30 | (0.04 | ) | (0.95 | ) | (0.99 | ) | 13.25 | 30.48 | 558 | 0.29 | 0.41 | 1 | ||||||||||||||||||||||||||||||||||||
| 12/31/21 | 13.25 | 0.06 | 2.08 | 2.14 | (0.04 | ) | (1.19 | ) | (1.23 | ) | 14.16 | 16.38 | 2,464 | 0.28 | 0.43 | 4 | ||||||||||||||||||||||||||||||||||||
12/31/22 | 14.16 | 0.06 | (3.57 | ) | (3.51 | ) | — | (0.07 | ) | (0.07 | ) | 10.58 | (24.75 | ) | 1,022 | 0.28 | 0.55 | 11 | ||||||||||||||||||||||||||||||||||
| SA American Funds Global Growth Portfolio Class 3 |
| |||||||||||||||||||||||||||||||||||||||||||||||||||
| 12/31/18 | 13.09 | 0.05 | (1.21 | ) | (1.16 | ) | (0.15 | ) | (2.62 | ) | (2.77 | ) | 9.16 | (9.28 | ) | 353,422 | 0.53 | 0.35 | 5 | |||||||||||||||||||||||||||||||||
| 12/31/19 | 9.16 | 0.09 | 3.09 | 3.18 | (0.09 | ) | (1.30 | ) | (1.39 | ) | 10.95 | 34.93 | 390,653 | 0.54 | 0.79 | 1 | ||||||||||||||||||||||||||||||||||||
| 12/31/20 | 10.95 | 0.01 | 3.25 | 3.26 | (0.01 | ) | (0.95 | ) | (0.96 | ) | 13.25 | 30.09 | 421,535 | 0.54 | 0.05 | 1 | ||||||||||||||||||||||||||||||||||||
| 12/31/21 | 13.25 | 0.01 | 2.10 | 2.11 | (0.01 | ) | (1.19 | ) | (1.20 | ) | 14.16 | 16.11 | 471,259 | 0.53 | 0.06 | 4 | ||||||||||||||||||||||||||||||||||||
12/31/22 | 14.16 | 0.05 | (3.59 | ) | (3.54 | ) | — | (0.07 | ) | (0.07 | ) | 10.55 | (24.97 | ) | 351,002 | 0.53 | 0.41 | 11 | ||||||||||||||||||||||||||||||||||
| * | Calculated based on average shares outstanding. |
| ** | Total return does not reflect expenses that apply to the separate accounts of the Life Companies. If such expenses had been included, the total return would have been lower for each period presented. Total return does include expense reimbursements (recoupment). |
| (1) | Net of the following expense reimbursements, waivers and (recoupments) (based on average assets): |
Portfolio | 12/18 | 12/19 | 12/20 | 12/21 | 12/22 | |||||||||||||||
SA American Funds Asset Allocation Class 1 | 0.60 | % | 0.60 | % | 0.60 | % | 0.60 | % | 0.60 | % | ||||||||||
SA American Funds Asset Allocation Class 3 | 0.60 | 0.60 | 0.60 | 0.60 | 0.60 | |||||||||||||||
SA American Funds Global Growth Class 1 | 0.70 | 0.70 | 0.70 | 0.70 | 0.70 | |||||||||||||||
SA American Funds Global Growth Class 3 | 0.70 | 0.70 | 0.70 | 0.70 | 0.70 | |||||||||||||||
| (2) | Does not include underlying fund expenses that the Portfolios bear indirectly. |
| (3) | Recognition of net investment income by the Portfolios is affected by the timing of the declaration of dividends by the underlying investment companies in which the Portfolios invest. |
See Notes to Financial Statements
| ||
| 26 |
Table of Contents
SUNAMERICA SERIES TRUST
FINANCIAL HIGHLIGHTS
Selected data for a share of beneficial interest outstanding throughout each period
| Period ended | Net Asset Value, beginning of period | Net investment income (loss)* | Net gain (loss) on investments (both realized and unrealized) | Total from investment operations | Dividends from net investment income | Dividend from net realized gain on investments | Total Distributions | Net Asset Value, end of period | Total Return** | Net Assets, end of period (000’s) | Ratio of expenses to average net assets(1)(2) | Ratio of net investment income (loss) to average net assets(1)(2)(3) | Portfolio turnover | |||||||||||||||||||||||||||||||||||||||
| SA American Funds Growth Portfolio Class 1 |
| |||||||||||||||||||||||||||||||||||||||||||||||||||
| 12/31/18 | $ | 13.15 | $ | (0.32 | ) | $ | 0.41 | $ | 0.09 | $ | (0.19 | ) | $ | (3.82 | ) | $ | (4.01 | ) | $ | 9.23 | (0.40 | )% | $ | 57 | 0.27 | % | (2.25 | )% | 4 | % | ||||||||||||||||||||||
| 12/31/19 | 9.23 | 0.13 | 2.70 | 2.83 | — | (0.05 | ) | (0.05 | ) | 12.01 | 30.75 | 160 | 0.29 | 1.22 | 7 | |||||||||||||||||||||||||||||||||||||
| 12/31/20 | 12.01 | 0.05 | 5.92 | 5.97 | (0.14 | ) | (1.53 | ) | (1.67 | ) | 16.31 | 52.09 | 704 | 0.28 | 0.34 | 13 | ||||||||||||||||||||||||||||||||||||
| 12/31/21 | 16.31 | 0.05 | 3.48 | 3.53 | (0.03 | ) | (0.71 | ) | (0.74 | ) | 19.10 | 21.93 | 2,305 | 0.27 | 0.28 | 5 | ||||||||||||||||||||||||||||||||||||
12/31/22 | 19.10 | 0.04 | (5.84 | ) | (5.80 | ) | (0.11 | ) | (1.99 | ) | (2.10 | ) | 11.20 | (29.90 | ) | 1,668 | 0.27 | 0.30 | 3 | |||||||||||||||||||||||||||||||||
| SA American Funds Growth Portfolio Class 3 |
| |||||||||||||||||||||||||||||||||||||||||||||||||||
| 12/31/18 | 13.12 | 0.02 | 0.04 | 0.06 | (0.12 | ) | (3.82 | ) | (3.94 | ) | 9.24 | (0.55 | ) | 305,503 | 0.53 | 0.13 | 4 | |||||||||||||||||||||||||||||||||||
| 12/31/19 | 9.24 | 0.05 | 2.75 | 2.80 | — | (0.05 | ) | (0.05 | ) | 11.99 | 30.39 | 377,823 | 0.54 | 0.47 | 7 | |||||||||||||||||||||||||||||||||||||
| 12/31/20 | 11.99 | 0.01 | 5.91 | 5.92 | (0.11 | ) | (1.53 | ) | (1.64 | ) | 16.27 | 51.72 | 544,907 | 0.53 | 0.04 | 13 | ||||||||||||||||||||||||||||||||||||
| 12/31/21 | 16.27 | (0.00 | ) | 3.48 | 3.48 | (0.00 | ) | (0.71 | ) | (0.71 | ) | 19.04 | 21.69 | 828,279 | 0.52 | (0.02 | ) | 5 | ||||||||||||||||||||||||||||||||||
12/31/22 | 19.04 | 0.01 | (5.82 | ) | (5.81 | ) | (0.08 | ) | (1.99 | ) | (2.07 | ) | 11.16 | (30.09 | ) | 687,642 | 0.52 | 0.10 | 3 | |||||||||||||||||||||||||||||||||
| SA American Funds Growth-Income Portfolio Class 1 |
| |||||||||||||||||||||||||||||||||||||||||||||||||||
| 12/31/18 | 12.99 | 0.06 | (0.17 | ) | (0.11 | ) | (0.41 | ) | (2.93 | ) | (3.34 | ) | 9.54 | (1.86 | ) | 47 | 0.28 | 0.45 | 4 | |||||||||||||||||||||||||||||||||
| 12/31/19 | 9.54 | 0.21 | 2.28 | 2.49 | — | (0.05 | ) | (0.05 | ) | 11.98 | 26.17 | 159 | 0.31 | 2.06 | 4 | |||||||||||||||||||||||||||||||||||||
| 12/31/20 | 11.98 | 0.18 | 1.27 | 1.45 | (0.23 | ) | (1.41 | ) | (1.64 | ) | 11.79 | 13.47 | 567 | 0.29 | 1.60 | 9 | ||||||||||||||||||||||||||||||||||||
| 12/31/21 | 11.79 | 0.17 | 2.63 | 2.80 | (0.15 | ) | (0.45 | ) | (0.60 | ) | 13.99 | 24.08 | 1,982 | 0.29 | 1.30 | 7 | ||||||||||||||||||||||||||||||||||||
12/31/22 | 13.99 | 0.14 | (2.49 | ) | (2.35 | ) | (0.14 | ) | (0.36 | ) | (0.50 | ) | 11.14 | (16.49 | ) | 1,540 | 0.28 | 1.21 | 7 | |||||||||||||||||||||||||||||||||
| SA American Funds Growth-Income Portfolio Class 3 |
| |||||||||||||||||||||||||||||||||||||||||||||||||||
| 12/31/18 | 12.95 | 0.14 | (0.28 | ) | (0.14 | ) | (0.34 | ) | (2.93 | ) | (3.27 | ) | 9.54 | (2.05 | ) | 245,183 | 0.53 | 1.07 | 4 | |||||||||||||||||||||||||||||||||
| 12/31/19 | 9.54 | 0.15 | 2.30 | 2.45 | — | (0.05 | ) | (0.05 | ) | 11.94 | 25.75 | 285,659 | 0.55 | 1.37 | 4 | |||||||||||||||||||||||||||||||||||||
| 12/31/20 | 11.94 | 0.12 | 1.30 | 1.42 | (0.20 | ) | (1.41 | ) | (1.61 | ) | 11.75 | 13.25 | 325,404 | 0.54 | 1.09 | 9 | ||||||||||||||||||||||||||||||||||||
| 12/31/21 | 11.75 | 0.11 | 2.64 | 2.75 | (0.13 | ) | (0.45 | ) | (0.58 | ) | 13.92 | 23.68 | 425,777 | 0.53 | 0.88 | 7 | ||||||||||||||||||||||||||||||||||||
12/31/22 | 13.92 | 0.12 | (2.49 | ) | (2.37 | ) | (0.11 | ) | (0.36 | ) | (0.47 | ) | 11.08 | (16.74 | ) | 361,297 | 0.53 | 1.04 | 7 | |||||||||||||||||||||||||||||||||
| * | Calculated based on average shares outstanding. |
| ** | Total return does not reflect expenses that apply to the separate accounts of the Life Companies. If such expenses had been included, the total return would have been lower for each period presented. Total return does include expense reimbursements (recoupment). |
| (1) | Net of the following expense reimbursements, waivers and (recoupments) (based on average assets): |
Portfolio | 12/18 | 12/19 | 12/20 | 12/21 | 12/22 | |||||||||||||||
SA American Funds Growth Class 1 | 0.60 | % | 0.60 | % | 0.60 | % | 0.60 | % | 0.60 | % | ||||||||||
SA American Funds Growth Class 3 | 0.60 | 0.60 | 0.60 | 0.60 | 0.60 | |||||||||||||||
SA American Funds Growth-Income Class 1 | 0.60 | 0.60 | 0.60 | 0.60 | 0.60 | |||||||||||||||
SA American Funds Growth-Income Class 3 | 0.60 | 0.60 | 0.60 | 0.60 | 0.60 | |||||||||||||||
| (2) | Does not include underlying fund expenses that the Portfolios bear indirectly. |
| (3) | Recognition of net investment income by the Portfolios is affected by the timing of the declaration of dividends by the underlying investment companies in which the Portfolios invest. |
See Notes to Financial Statements
| ||
| 27 |
Table of Contents
SUNAMERICA SERIES TRUST
FINANCIAL HIGHLIGHTS
Selected data for a share of beneficial interest outstanding throughout each period
| Period ended | Net Asset Value, beginning of period | Net investment income (loss)* | Net gain (loss) on investments (both realized and unrealized) | Total from investment operations | Dividends from net investment income | Dividend from net realized gain on investments | Total Distributions | Net Asset Value, end of period | Total Return** | Net Assets, end of period (000’s) | Ratio of expenses to average net assets(1)(2) | Ratio of net investment income (loss) to average net assets(1)(2)(3) | Portfolio turnover | |||||||||||||||||||||||||||||||||||||||
| SA American Funds VCP Managed Allocation Portfolio Class 1 |
| |||||||||||||||||||||||||||||||||||||||||||||||||||
| 12/31/18 | $ | 14.37 | $ | 0.22 | $ | (0.92 | ) | $ | (0.70 | ) | $ | (0.28 | ) | $ | (0.71 | ) | $ | (0.99 | ) | $ | 12.68 | (4.89 | )% | $ | 145 | 0.27 | % | 1.56 | % | 103 | % | |||||||||||||||||||||
| 12/31/19 | 12.68 | 0.06 | 2.32 | 2.38 | (0.07 | ) | (0.18 | ) | (0.25 | ) | 14.81 | 18.81 | 130 | 0.28 | 0.42 | 4 | ||||||||||||||||||||||||||||||||||||
| 12/31/20 | 14.81 | 0.21 | 1.21 | 1.42 | — | (0.04 | ) | (0.04 | ) | 16.19 | 9.57 | 255 | 0.27 | 1.38 | 5 | |||||||||||||||||||||||||||||||||||||
| 12/31/21 | 16.19 | 0.23 | 2.14 | 2.37 | (0.25 | ) | (0.92 | ) | (1.17 | ) | 17.39 | 14.99 | 947 | 0.26 | 1.37 | 3 | ||||||||||||||||||||||||||||||||||||
12/31/22 | 17.39 | 0.31 | (3.28 | ) | (2.97 | ) | (0.19 | ) | (0.53 | ) | (0.72 | ) | 13.70 | (16.97 | ) | 962 | 0.26 | 2.10 | 2 | |||||||||||||||||||||||||||||||||
| SA American Funds VCP Managed Allocation Portfolio Class 3 |
| |||||||||||||||||||||||||||||||||||||||||||||||||||
| 12/31/18 | 14.33 | 0.19 | (0.93 | ) | (0.74 | ) | (0.21 | ) | (0.71 | ) | (0.92 | ) | 12.67 | (5.12 | ) | 1,659,358 | 0.52 | 1.32 | 103 | |||||||||||||||||||||||||||||||||
| 12/31/19 | 12.67 | 0.01 | 2.33 | 2.34 | (0.04 | ) | (0.18 | ) | (0.22 | ) | 14.79 | 18.48 | 1,982,324 | 0.53 | 0.11 | 4 | ||||||||||||||||||||||||||||||||||||
| 12/31/20 | 14.79 | 0.21 | 1.17 | 1.38 | — | (0.04 | ) | (0.04 | ) | 16.13 | 9.32 | 2,113,978 | 0.52 | 1.39 | 5 | |||||||||||||||||||||||||||||||||||||
| 12/31/21 | 16.13 | 0.15 | 2.17 | 2.32 | (0.21 | ) | (0.92 | ) | (1.13 | ) | 17.32 | 14.73 | 2,319,091 | 0.51 | 0.85 | 3 | ||||||||||||||||||||||||||||||||||||
12/31/22 | 17.32 | 0.25 | (3.24 | ) | (2.99 | ) | (0.15 | ) | (0.53 | ) | (0.68 | ) | 13.65 | (17.18 | ) | 1,825,265 | 0.51 | 1.67 | 2 | |||||||||||||||||||||||||||||||||
| * | Calculated based on average shares outstanding. |
| ** | Total return does not reflect expenses that apply to the separate accounts of the Life Companies. If such expenses had been included, the total return would have been lower for each period presented. Total return does include expense reimbursements (recoupment). |
| (1) | Net of the following expense reimbursements, waivers and (recoupments) (based on average net assets): |
Portfolio | 12/18 | 12/19 | 12/20 | 12/21 | 12/22 | |||||||||||||||
SA American Funds VCP Managed Allocation Class 1 | 0.70 | % | 0.70 | % | 0.70 | % | 0.70 | % | 0.70 | % | ||||||||||
SA American Funds VCP Managed Allocation Class 3 | 0.70 | 0.70 | 0.70 | 0.70 | 0.70 | |||||||||||||||
| (2) | Does not include underlying fund expenses that the Portfolios bear indirectly. |
| (3) | Recognition of net investment income by the Portfolios is affected by the timing of the declaration of dividends by the underlying investment companies in which the Portfolios invest. |
See Notes to Financial Statements
| ||
| 28 |
Table of Contents
SUNAMERICA SERIES TRUST
REPORT OF INDEPENDENT REGISTERED PUBLIC ACCOUNTING FIRM
To the Board of Trustees of SunAmerica Series Trust and Shareholders of SA American Funds Asset Allocation Portfolio, SA American Funds Global Growth Portfolio, SA American Funds Growth Portfolio, SA American Funds Growth-Income Portfolio and SA American Funds VCP Managed Allocation Portfolio.
Opinions on the Financial Statements
We have audited the accompanying statements of assets and liabilities, including the portfolios of investments, of SA American Funds Asset Allocation Portfolio, SA American Funds Global Growth Portfolio, SA American Funds Growth Portfolio, SA American Funds Growth-Income Portfolio and SA American Funds VCP Managed Allocation Portfolio (five of the portfolios constituting SunAmerica Series Trust, hereafter collectively referred to as the “Portfolios”) as of December 31, 2022, the related statements of operations for the year ended December 31, 2022 and the statements of changes in net assets for each of the two years in the period ended December 31, 2022, including the related notes, and the financial highlights for each of the five years in the period ended December 31, 2022 (collectively referred to as the “financial statements”). In our opinion, the financial statements present fairly, in all material respects, the financial position of each of the Portfolios as of December 31, 2022, the results of each of their operations for the year then ended, the changes in each of their net assets for each of the two years in the period ended December 31, 2022 and each of the financial highlights for each of the five years in the period ended December 31, 2022 in conformity with accounting principles generally accepted in the United States of America.
Basis for Opinions
These financial statements are the responsibility of the Portfolios’ management. Our responsibility is to express an opinion on the Portfolios’ financial statements based on our audits. We are a public accounting firm registered with the Public Company Accounting Oversight Board (United States) (“PCAOB”) and are required to be independent with respect to the Portfolios in accordance with the U.S. federal securities laws and the applicable rules and regulations of the Securities and Exchange Commission and the PCAOB.
We conducted our audits of these financial statements in accordance with the standards of the PCAOB. Those standards require that we plan and perform the audit to obtain reasonable assurance about whether the financial statements are free of material misstatement, whether due to error or fraud.
Our audits included performing procedures to assess the risks of material misstatement of the financial statements, whether due to error or fraud, and performing procedures that respond to those risks. Such procedures included examining, on a test basis, evidence regarding the amounts and disclosures in the financial statements. Our audits also included evaluating the accounting principles used and significant estimates made by management, as well as evaluating the overall presentation of the financial statements. Our procedures included confirmation of securities owned as of December 31, 2022 by correspondence with the transfer agent. We believe that our audits provide a reasonable basis for our opinions.
/s/ PricewaterhouseCoopers LLP
Houston, Texas
February 27, 2023
We have served as the auditor of one or more investment companies in the SunAmerica annuity family of funds (consisting of SunAmerica Series Trust and Seasons Series Trust) since at least 1986. We have not been able to determine the specific year we began serving as auditor.
| ||
| 29 |
Table of Contents
SUNAMERICA SERIES TRUST
APPROVAL OF ADVISORY AGREEMENT
December 31, 2022 (unaudited)
REVIEW AND APPROVAL OF CONTINUATION OF INVESTMENT ADVISORY AGREEMENT
At a meeting held on October 13, 2022, the Board of Trustees (the “Board”) of SunAmerica Series Trust (the “Trust”), including the Trustees who are not interested persons of the Trust, as defined in the Investment Company Act of 1940, as amended (the “Independent Trustees”), approved with respect to the American Funds Asset Allocation SAST Portfolio, American Funds Growth SAST Portfolio, American Funds Global Growth SAST Portfolio, American Funds Growth-Income SAST Portfolio and VCP Managed Asset Allocation Portfolio (collectively, the “Portfolios”) the continuation of the Investment Management and Advisory Agreement between SunAmerica Asset Management, LLC (“SunAmerica” or the “Adviser”) and the Trust (the “Advisory Agreement”).
In connection with the approval of the Advisory Agreement, the Board received materials related to certain factors used in its consideration whether to renew or approve the Advisory Agreement. Those factors included:
| (1) | the requirements of the Trust in the areas of investment supervisory and administrative services; |
| (2) | the nature, extent and quality of the investment advisory, administrative, operational and compliance services provided by SunAmerica, including a review of the investment performance of the Portfolios; |
| (3) | the size and structure of the investment advisory fee and any other material payments to the Adviser and, in connection therewith, a review of the costs of services provided and the profits of SunAmerica Series Trust (the “Trust”) realized by the Adviser and its affiliates from the relationship with the Trust; |
| (4) | the expenses paid by each of the Portfolios, including their total operating expenses and any applicable expense limitation; |
| (5) | the extent to which the Adviser realizes economies of scale and shares them with the Trust; and |
| (6) | the organizational capability, resources, personnel and financial condition of the Adviser and its affiliates. |
In addition, the Board considered (a) the historical relationship between the Trust and SunAmerica; (b) the possibility that services of the type required by the Trust might be better obtained from other organizations; and (c) the conditions and trends prevailing in the economy, the securities markets and the investment company industry.
The Independent Trustees were separately represented by counsel that is independent of SunAmerica in connection with their consideration of approval of the Advisory Agreement. The matters discussed below were also considered separately by the Independent Trustees in executive sessions during which their independent counsel provided guidance to the Independent Trustees.
The Board received information regarding the Trust’s advisory fees compared to advisory fee rates of a group of funds with similar investment strategies and/or objectives, as applicable, (the “Expense Group/Universe”), as selected and prepared by an independent third-party provider of investment company data. The Board also received performance data and expense information prepared by management.
Nature, Extent and Quality of Services.
The Board, including the Independent Trustees, considered the nature, quality and extent of services provided by SunAmerica. In making its evaluation, the Board considered that SunAmerica acts as adviser for each Portfolio and manages the daily business affairs of the Trust, subject to the Trustees’ oversight and control. It was also noted that SunAmerica’s advisory fees compensate SunAmerica for services such as monitoring Portfolio performance and other administrative, compliance and legal services.
The Board noted that SunAmerica is responsible for overseeing the performance of services by the Trust’s custodian, transfer agent and dividend disbursing agent. The Board also noted that SunAmerica is responsible for the financial, legal and accounting records required to be maintained by each Portfolio and for the administration of the Trust’s business affairs, including providing such office space, bookkeeping, accounting, clerical, secretarial and administrative services (exclusive of, and in addition to, any such service provided by any others retained by the Trust or any Portfolio) and such executive and other personnel as may be necessary for the operations of each Portfolio. The Board considered that SunAmerica monitors and reviews the activities of third-party service providers that may provide additional administrative services.
In addition, the Board considered the key personnel of SunAmerica who are involved in the investment management, administration, compliance and risk management activities with respect to the Portfolios. The Board also considered the compensation program for SunAmerica’s investment professionals.
The Board reviewed the qualifications, background and responsibilities of SunAmerica’s staff who is responsible for providing investment management services to the Portfolios and other key personnel of SunAmerica in addition to current and projected staffing levels and compensation practices.
| ||
| 30 |
Table of Contents
SUNAMERICA SERIES TRUST
APPROVAL OF ADVISORY AGREEMENT
December 31, 2022 (unaudited) (continued)
The Board considered SunAmerica’s reputation and long-standing relationship with the Portfolios and considered the benefit to shareholders of investing in funds that are part of a family of funds offering a variety of types of mutual funds and shareholder services. The Board also considered the Trust’s relationship with affiliated life insurance companies that offer the Portfolios through variable annuity and variable life insurance products. The Board considered SunAmerica’s experience in providing management and investment advisory and administrative services to advisory clients. The Board also considered SunAmerica’s code of ethics and its risk management process, and that SunAmerica has developed internal procedures, adopted by the Board, for monitoring compliance with the investment objectives, policies and restrictions of the Portfolios as set forth in the Portfolios’ registration statement.
The Board also reviewed and considered SunAmerica’s compliance and regulatory history, including information about any litigation, regulatory actions or investigations that could impair its ability to serve as an adviser to the Portfolios. The Board considered SunAmerica’s risk assessment and risk management processes. The Board concluded that there was no information provided that would have a material adverse effect on SunAmerica’s ability to provide services to the Trust.
The Board concluded that it was satisfied with the nature, quality and extent of the services provided by or to be provided by SunAmerica and that there was a reasonable basis on which to conclude that they would provide high quality services to the Trust.
Portfolio Fees and Expenses; Investment Performance.
The Board, including the Independent Trustees, received and reviewed information regarding the Portfolios’ fees (actual or contractual management fees, non-management fees, and 12b-1 fees, if applicable), and expense ratios compared against such fees and expense ratios of the Expense Group/Universe for each Portfolio. Such fees and expense ratios were compared both before and after expense waivers, caps and reimbursements, if any.
To assist in analyzing the reasonableness of the advisory fee, the Board received a report prepared independently by Broadridge Financial Solutions, Inc. (“Broadridge”) as well as information provided by management. The Board also considered advisory fees received by the Adviser with respect to other mutual funds and accounts with similar investment strategies to the Portfolios. Based on the information from Broadridge, the Board reviewed detailed information about peer groups of comparable mutual funds based on various factors such as the type of fund (those underlying variable insurance products), comparable investment objectives and strategies, among other factors. Referred to herein are “Expense Groups” and “Performance Groups” that represent those peer groups of funds used to compare expenses and performance, respectively.
The performance information included annualized returns for the period since inception and the one-, three-, five-and ten-year periods, as applicable, ended May 31, 2022 from Broadridge and performance information as of May 31, 2022 from management. On a quarterly basis, the Board monitors and reviews various materials presented and prepared by management, including but not limited to each Portfolio’s overall performance, performance relative to each Portfolio’s relevant benchmark and Morningstar and/or Broadridge peer groups, as applicable. The Board considered that management makes particular note of Portfolios that may require closer monitoring or potential corrective action by the Board.
As part of its review of the Portfolios’ fees and expenses and performance, the Board considered information, including but not limited to the following expense and performance information, provided by Broadridge and management in making its determinations. It was noted that actual advisory fees and total expenses were calculated as of each Portfolio’s most recent fiscal year end, which may vary among the Portfolio’s Expense Group/Universe.
The Boards considered that certain Portfolios pay advisory fees indirectly to Capital Research & Management Company (“Capital Research”) through their investment in the master funds. The Boards further considered the amount of such fees and the amount of the management fees paid to SunAmerica and determined that the amounts paid to SunAmerica by such Portfolios were reasonable in light of the services performed by SunAmerica.
| • | SA American Funds® Asset Allocation Portfolio (master-feeder fund advised by Capital Research/SunAmerica). The Board noted that both actual management fees and total expenses were below the medians of its Expense Group. The Board considered that SunAmerica has contractually agreed to waive 0.60% of its investment advisory fee. |
The Board considered that the Portfolio performed below its benchmark index for the one-, three-, five and ten-year periods. The Board further considered that the Portfolio performed below the medians of its Performance Group for the one-, three- and five-year periods and above the median for the ten-year period. The Board took into account management’s discussion of the Master Fund’s performance and noted the narrower range of underperformance respective to the medians.
| • | SA American Funds® Global Growth Portfolio (master-feeder fund advised by Capital Research/SunAmerica). The Board considered that both actual management fees and total expenses were below the medians of its Expense Group. The Board considered that SunAmerica has contractually agreed to waive 0.70% of its investment advisory fee. |
| ||
| 31 |
Table of Contents
SUNAMERICA SERIES TRUST
APPROVAL OF ADVISORY AGREEMENT
December 31, 2022 (unaudited) (continued)
The Board considered that the Portfolio performed below its benchmark index for the one-year period but above that index for the three-, five- and ten-year periods. The Board also noted that the Portfolio performed above the medians of its Performance Group for the one-, three-, five- and ten-year periods. The Board took into account management’s discussion of the Master Fund’s performance.
| • | SA American Funds® Growth-Income Portfolio (master-feeder fund advised by Capital Research/SunAmerica). The Board noted that both actual management fees and actual total expenses were below the medians of its Expense Group. The Board considered that SunAmerica has contractually agreed to waive 0.60% of its investment advisory fee. |
The Board considered that the Portfolio performed below its benchmark index for the one-, three-, five- and ten-year periods. The Board also noted that the Portfolio performed below the medians of its Performance Group for the same periods. The Board took into account management’s discussion of the Master Fund’s performance.
| • | SA American Funds® Growth Portfolio (master-feeder fund advised by Capital Research/SunAmerica). The Board noted that both actual management fees and total expenses were below the medians of its Expense Group. The Board considered that SunAmerica has contractually agreed to waive 0.60% of its investment advisory fee. |
The Board considered that the Portfolio performed below its benchmark index for the one-year period but above that index for the three-, five- and ten-year periods. The Board further considered that the Portfolio performed above the medians of its Performance Group for the one-, three-, five- and ten-year periods. The Board took into account management’s discussion of the Master Fund’s performance.
| • | SA American Funds® VCP Managed Asset Allocation Portfolio (master-feeder fund advised by Capital Research/SunAmerica). The Board noted that actual management fees were below and total expenses were above the medians of its Expense Group. The Board further noted that SunAmerica has contractually agreed to waive 0.70% of its advisory fee and that there is an expense limitation of 0.28% and 0.53% on Class 1 and Class 3 shares, respectively. The Board took account of management’s discussion of the Portfolio’s expenses. |
The Board considered that the Portfolio performed above its benchmark index for the one- and three-year periods and the period since inception and slightly below that index for the five-year period. The Board also considered that the Portfolio performed at or above the medians of its Performance Group for the one-, three- and five-year periods and the period since inception. The Board took into account management’s discussion of the Master Fund’s performance.
Cost of Services & Benefits Derived.
With respect to indirect costs and benefits, the Board was informed, based on management’s judgment, that any indirect costs incurred by SunAmerica in connection with rendering investment advisory services to the Trust were inconsequential to the analysis of the adequacy of the advisory fees, and that any collateral benefits derived as a result of providing advisory services to the Trust did not impact the reasonableness of the advisory fee. The Board considered that SunAmerica is paid an administrative services fee of up to 0.04% of the average daily net asset value of the Trust’s Portfolios pursuant to an arrangement between SunAmerica and certain affiliated life insurance companies (the “Life Companies”). The Board considered that the Trust also pays VALIC Retirement Services Company, an affiliate of SunAmerica, a fee for the provision of recordkeeping and shareholder services to contract owners and participants.
In connection with benefits derived from the Trust, the Board considered that the Life Companies may benefit as a result of their direct ownership of the Portfolios’ shares, which amounts may be significant. It was noted that in calculating their corporate income tax liability as insurance companies, the Life Companies, as corporate mutual fund shareholders, may exclude a portion of the ordinary dividends paid by underlying U.S. equities in the Portfolios to the same extent the Portfolios receive certain dividends with respect to shares of stock issued by domestic corporations, subject to applicable tax laws and regulations. In addition, the Life Companies may also rely on foreign tax credits with respect to certain foreign securities held by applicable Portfolios. The Board considered that the Life Companies receive financial support from SunAmerica for distribution-related activities, including administrative, marketing and other servicing activities, including payments to help offset costs for marketing activities and training (including training of registered representatives of AIG Capital Services, Inc., an affiliate of SunAmerica) to support sales of the Portfolios, as well as occasional gifts, entertainment or other compensation as incentives. It was noted that such payments may be derived from 12b-1 (service) fees that are deducted directly from the assets of the Portfolios or from investment management fees received by SunAmerica. In addition, the Board considered that, because shares of the Portfolios are offered as investment options through variable annuity or life contracts issued by the Life Companies (the “Variable Contracts”), the investment objectives, strategies and performance of the Portfolios may positively or negatively impact a Life Company’s ability to hedge and the related hedging costs associated with guarantees that the Life Company may provide as the issuer of the Variable Contracts.
| ||
| 32 |
Table of Contents
SUNAMERICA SERIES TRUST
APPROVAL OF ADVISORY AGREEMENT
December 31, 2022 (unaudited) (continued)
The Board concluded that any benefits that SunAmerica and its affiliates could be expected to receive with regard to providing investment advisory and other services to the Portfolios were reasonable.
Profitability and Economies of Scale.
The Board received information related to SunAmerica’s profitability as well as the profitability of certain affiliates with respect to the services they provide to the Trust’s Portfolios. The profitability analysis reflected the relationship between SunAmerica and the affiliated Life Companies. The Board considered that, pursuant to administrative services agreements between SunAmerica and each of the Life Companies, SunAmerica pays a fee to each Life Company at an annual rate of 25 basis points of the average daily net assets of the Portfolios that are held by the corresponding separate accounts of each Life Company, in exchange for certain administrative services provided to the Portfolios. The Board determined that the profitability to SunAmerica in connection with its relationship to the Trust was reasonable. In addition, the Board considered the Investment Management Profitability Analysis prepared by an independent information service, Broadridge, and noted that SunAmerica’s profitability was generally in the range of the profitability of companies contained in the report.
The Board also received and considered information regarding the ability of the Portfolios to achieve economies of scale. It was noted that the advisory fees of nearly all Portfolios contain breakpoints that will reduce the fees paid by a Portfolio as its assets increase. The Board also considered that SunAmerica has voluntarily agreed to waive fees in certain instances, which was noted earlier in the discussion of fees. It was noted that as a result of being part of a complex of mutual funds advised or administered by SunAmerica, the Trust is able to share common resources and may share certain expenses, which could result in a Portfolio experiencing lower expenses than it otherwise would achieve if the Trust were a stand-alone entity. The Board considered that management believed that the Portfolios’ existing fee schedules and the fee schedules for those Portfolios for which management proposed reductions or waivers reflect the economies of scale inherent in providing investment advice to a Portfolio in its particular asset category and asset size. The Board concluded that any potential economies of scale are currently being shared between the Trust and SunAmerica in an appropriate manner.
Terms of Advisory Agreement.
The Board, including the Independent Trustees, reviewed the terms of the Advisory Agreement including the duties and responsibilities undertaken by SunAmerica as discussed above. The Board considered that SunAmerica pays all of its own expenses in connection with the performance of its duties, as well as the salaries, fees and expenses of the officers of the Trust who are employees of SunAmerica.
Conclusions.
In reaching its decision to recommend the renewal of the Advisory Agreement, the Board did not identify any single factor as being controlling, but based its recommendation on each of the factors it considered and each Trustee attributes different weight to the various factors. Based upon the materials it reviewed, the representations made to it and the considerations described above, and as part of their deliberations, the Board, including the Independent Trustees, concluded that SunAmerica possesses the capability and resources to perform the duties required of it under the Advisory Agreement.
Further, based upon its review of the Advisory Agreement, the materials provided, and the considerations described above, the Board, including the Independent Trustees, concluded that: (1) the terms of the Advisory Agreement are reasonable, fair and in the best interest of the Portfolios and their shareholders, and (2) the advisory fee rates are fair and reasonable in light of the usual and customary charges made for services of the same nature and quality and the other factors considered.
REVIEW AND APPROVAL OF NEW INVESTMENT ADVISORY AGREEMENTS FOR THE TRUST IN CONNECTION WITH THE SEPARATION PLAN
The Board, including the Independent Trustees, met on September 22, 2022 and October 13, 2022 (together, the “Board Meeting”) to evaluate, among other matters, AIG’s intention to sell its entire interest in Corebridge over time following an initial public offering of Corebridge’s common stock (the “Separation Plan”), and to determine whether to approve new Investment Advisory and Management Agreements (the “New Agreements”) for the Trust, on behalf of the respective Portfolios, and to recommend approval of the New Agreements to the shareholders of the Portfolios. At the Board Meeting and throughout the process of considering the Separation Plan, the Independent Trustees were assisted in their review, and were advised, by independent legal counsel and met with counsel in executive sessions separate from representatives of SunAmerica.
The Board was aware that the implementation of the Separation Plan may not result immediately in a change of control of SunAmerica (a “Change of Control Event”) but also recognized that the Separation Plan contemplates a series of transactions that may be deemed to constitute one or more Change of Control Events in the future. The Board concluded that approval by shareholders at this time of the
| ||
| 33 |
Table of Contents
SUNAMERICA SERIES TRUST
APPROVAL OF ADVISORY AGREEMENT
December 31, 2022 (unaudited) (continued)
New Agreements and any new advisory agreements that may become effective upon certain Change of Control Events in the future (the “Future Agreements”) will allow the Portfolios to benefit from the continuation of services by SunAmerica and its affiliates throughout the implementation of the Separation Plan without the need for multiple shareholder meetings. The Board further considered that the expenses associated with obtaining shareholder approval of the New Agreements would be split equally between SunAmerica and the Trust, in consideration of the fact that the proxy solicitation process will include multiple proposals, including proposals unrelated to the Separation Plan.
A substantial portion of the Board’s review was conducted in connection with its annual consideration of the renewal (the “Annual Renewals”) of the current Investment Advisory and Management Agreements (the “Current Agreements”) of the Trust, which also occurred during the Board Meeting. During the review process that led to its renewal of the Current Agreements, the Board considered that it was also being asked to consider approval of the New Agreements in connection with the Separation Plan.
Prior to the Board Meeting, the Independent Trustees requested certain detailed information from SunAmerica regarding the Separation Plan, the Trust and the New Agreements, as well as the Annual Renewals, and reviewed the responses thereto. The Board communicated with senior representatives of SunAmerica regarding their personnel, operations and financial condition. The Board also reviewed the terms of the Separation Plan and considered its possible effects on the Portfolios and their shareholders. In this regard, the Trustees spoke with representatives of SunAmerica during the Board Meeting and, with respect to the Independent Trustees, in private sessions with their independent counsel to discuss the anticipated effects of the Separation Plan.
In connection with the Annual Renewals, the Board received materials related to certain factors used in its consideration whether to renew the Current Agreements. The Board also relied on this information in relation to its consideration whether to approve the New Agreements. Those factors included:
| (1) | the requirements of the Trust in the areas of investment supervisory and administrative services; |
| (2) | the nature, extent and quality of the investment advisory, administrative, operational and compliance services provided by SunAmerica, including a review of the investment performance of the Portfolios; |
| (3) | the size and structure of the investment advisory fee and any other material payments to SunAmerica and, in connection therewith, a review of the costs of services provided and the profits realized by SunAmerica and its affiliates from the relationship with the Trust; |
| (4) | the expenses paid by each of the Portfolios, including their total operating expenses and any applicable expense limitation; |
| (5) | the extent to which SunAmerica realizes economies of scale and shares them with the Trust; and |
| (6) | the organizational capability, resources, personnel and financial condition of SunAmerica and its affiliates. |
In addition, the Board considered (a) the historical relationship between the Trust and SunAmerica; (b) the possibility that services of the type required by the Trust might be better obtained from other organizations; and (c) the conditions and trends prevailing in the economy, the securities markets and the investment company industry.
In addition to the information the Board received and considered in approving the Current Agreements, SunAmerica also provided information relating to the New Agreements, including, but not limited to, the Separation Plan, the expected benefits and costs to shareholders of the Trust, and the expected management and operation of SunAmerica after a Change of Control Event. The Board focused its review on, and requested and evaluated other information relating to, the potential impact of implementing the Separation Plan on the operations, personnel, organizational structure, capitalization, and financial and other resources of SunAmerica and its affiliates that render administrative, distribution, compliance, and other services to the Trust. The Independent Trustees were also provided with legal memoranda discussing their fiduciary duties related to the approval of the Current Agreements, the New Agreements as well as considerations relevant to the Separation Plan.
The Independent Trustees were separately represented by counsel that is independent of SunAmerica in connection with their consideration of approval of the New Agreements. The matters discussed below were also considered separately by the Independent Trustees in executive sessions during which their independent counsel provided guidance to the Independent Trustees. The Board and the Independent Trustees did not identify any single matter or particular data point that, in isolation, would be controlling in their decision to approve the New Agreements. Rather, the Board and the Independent Trustees considered the total mix of information provided. The following summary describes the key factors considered by the Board and the Independent Trustees and the conclusions that formed the basis for approving the New Agreements, in light of the legal advice furnished to them by independent legal counsel and their own business judgment. The following list of factors is not inclusive of all factors that were considered.
| ||
| 34 |
Table of Contents
SUNAMERICA SERIES TRUST
APPROVAL OF ADVISORY AGREEMENT
December 31, 2022 (unaudited) (continued)
Nature, Quality and Extent of Services.
The Board, including the Independent Trustees, considered the nature, quality and extent of services provided by SunAmerica. In making its evaluation, the Board considered that SunAmerica acts as adviser for each Portfolio, manages the investment of portions of certain Portfolios’ assets, manages the daily business affairs of the Trust and obtains and evaluates economic, statistical and financial information to formulate and implement investment policies. It was also noted that SunAmerica’s advisory fees compensate SunAmerica for services such as monitoring Portfolio performance, as well as other administrative, compliance and legal services.
The Board noted that SunAmerica is responsible for overseeing the performance of services by the Trust’s custodian, transfer agent and dividend disbursing agent. The Board also noted that SunAmerica is responsible for the financial, legal and accounting records required to be maintained by each Portfolio and for the administration of the Trust’s business affairs, including providing such office space, bookkeeping, accounting, clerical, secretarial and administrative services (exclusive of, and in addition to, any such service provided by any others retained by the Trust or any Portfolio) and such executive and other personnel as may be necessary for the operations of each Portfolio. The Board considered that SunAmerica monitors and reviews the activities of third-party service providers that may provide additional administrative services. The Board also considered that no material changes in SunAmerica’s management or operations are expected as a result of the Separation Plan and that the Separation Plan is not expected to have an effect on SunAmerica’s performance or delivery of services under the New Agreements relative to SunAmerica’s performance or delivery of services under the Current Agreements.
In addition, the Board considered the key personnel of SunAmerica who are involved in the investment management, administration, compliance and risk management activities with respect to the Portfolios in addition to current and projected staffing levels and compensation practices. The Board also considered the compensation program for SunAmerica’s investment professionals. The Board considered that no material changes to any Portfolio’s investment management team or SunAmerica’s compensation practices are expected to occur as a result of the Separation Plan.
The Board considered SunAmerica’s reputation and long-standing relationship with the Portfolios and considered the benefit to shareholders of investing in funds that are part of a family of funds offering a variety of types of mutual funds and shareholder services. The Board also considered the Trust’s relationship with affiliated life insurance companies that offer the Portfolios through variable annuity and variable life insurance products. The Board considered SunAmerica’s experience in providing management and investment advisory and administrative services to advisory clients. The Board also considered SunAmerica’s code of ethics and its risk management process, and that SunAmerica has developed internal procedures, adopted by the Board, for monitoring compliance with the investment objectives, policies and restrictions of the Portfolios as set forth in the Portfolios’ registration statement. The Board further considered that no material changes to SunAmerica’s risk management processes and compliance policies and procedures were expected to result from the anticipated change of control of SunAmerica.
In connection with the Annual Renewals, the Board also reviewed and considered the Adviser’s compliance and regulatory history, including information about whether any were involved in any litigation, regulatory actions or investigations that could impair their ability to serve as an adviser or subadviser to the Portfolios. The Board considered SunAmerica’s risk assessment and risk management processes. The Board concluded that there was no information provided that would have a material adverse effect on SunAmerica’s ability to provide services to the Trust.
The Board considered that the nature, extent and quality of the services provided to the Portfolios by the Adviser were expected to remain unchanged after the change of control of the Adviser that would result from the implementation of the Separation Plan.
Portfolio Fees and Expenses; Investment Performance.
The Board, including the Independent Trustees, received and reviewed information regarding the Portfolios’ fees (actual or contractual management fees, subadvisory fees, non-management fees, and 12b-1 fees, if applicable), and expense ratios compared against such fees and expense ratios of the Expense Group/Universe for each Portfolio. Such fees and expense ratios were compared both before and after expense waivers, caps and reimbursements, if any. It was noted that with respect to subadvisory fees, SunAmerica negotiates such fees at arm’s length. The Board also considered that the subadvisory fees are paid by SunAmerica out of its advisory fee and not by the Portfolios. The Board further considered the amount of subadvisory fees paid by SunAmerica and the amount of the management fees that it retained and determined that these amounts were reasonable in light of the services performed by SunAmerica.
To assist in analyzing the reasonableness of the advisory fees, the Board received a report prepared independently by Broadridge Financial Solutions, Inc. (“Broadridge”) as well as information provided by management. The Board also considered advisory fees received by SunAmerica with respect to other mutual funds and accounts with similar investment strategies to the Portfolios each advises. Based on the information from Broadridge, the Board reviewed detailed information about peer groups of comparable
| ||
| 35 |
Table of Contents
SUNAMERICA SERIES TRUST
APPROVAL OF ADVISORY AGREEMENT
December 31, 2022 (unaudited) (continued)
mutual funds based on various factors such as the type of fund (those underlying variable insurance products), comparable investment objectives and strategies, among other factors. Referred to herein are Expense Groups and Performance Groups/Universes that represent those peer groups of funds used to compare expenses and performance, respectively. The Board also received performance data and expense information prepared by management.
The Trustees noted that the expense information as a whole was useful in assessing whether SunAmerica was providing services at a cost that was competitive with other similar funds. The performance information included annualized returns for the period since inception and the one-, three-, five- and ten-year periods, as applicable, ended May 31, 2022 from Broadridge and performance information as of May 31, 2022 from management. On a quarterly basis, the Board monitors and reviews various materials presented and prepared by management, including but not limited to each Portfolio’s overall performance, performance relative to each Portfolio’s relevant benchmark and Morningstar and/or Broadridge peer groups, as applicable. The Board considered that management makes particular note of Portfolios that may require closer monitoring or potential corrective action by the Board.
As part of its review of the Portfolios’ fees and expenses and performance in connection with the Annual Renewals, the Board noted that it considered expense and performance information for each Portfolio provided by Broadridge and management in making its determination to renew the Current Agreements. For Portfolios with periods of relative underperformance, the Board considered management’s explanations of and plans to address that underperformance. The Board also reviewed Portfolios with higher expenses relative to their respective Expense Groups/Universes and considered management’s discussions in that regard. The Board also considered that the Separation Plan is not expected to result in any changes to the contractual investment advisory fees charged to the Portfolios, nor a reduction in any fee waiver or expense limitation agreed to by SunAmerica with respect to the Portfolios.
Ultimately, the Board and the Independent Trustees concluded that SunAmerica has a strong long-term record of effectively managing each of the Portfolios. The Board and the Independent Trustees further concluded that SunAmerica was applying appropriate discipline and oversight to ensure that each Portfolio adhered to its stated investment objective and strategies and that SunAmerica’s record in managing each Portfolio supported the conclusion that its continued management should benefit each Portfolio and its shareholders.
Cost of Services & Benefits Derived.
With respect to indirect costs and benefits, the Board was informed, based on management’s judgment, that any indirect costs incurred by SunAmerica in connection with rendering investment advisory services to the Trust were inconsequential to the analysis of the adequacy of the advisory fees, and that any collateral benefits derived as a result of providing advisory services to the Trust did not impact the reasonableness of the advisory fee. In its considerations with respect to the Annual Renewals, the Board considered that SunAmerica is paid an administrative services fee of up to 0.04% of the average daily net asset value of the Trust’s Portfolios pursuant to an arrangement between SunAmerica and certain affiliated life insurance companies (the “Life Companies”). The Board considered that the Trust also pays VALIC Retirement Services Company, an affiliate of SunAmerica, a fee for the provision of recordkeeping and shareholder services to contract owners and participants.
Also in connection with the Annual Renewals, the Board considered that the Life Companies may benefit as a result of their direct ownership of the Portfolios’ shares, which amounts may be significant. It was noted that in calculating their corporate income tax liability as insurance companies, the Life Companies, as corporate mutual fund shareholders, may exclude a portion of the ordinary dividends paid by underlying U.S. equities in the Portfolios to the same extent the Portfolios receive certain dividends with respect to shares of stock issued by domestic corporations, subject to applicable tax laws and regulations. In addition, the Life Companies may rely on foreign tax credits with respect to certain foreign securities held by applicable Portfolios. The Board considered that the Life Companies receive financial support from SunAmerica for distribution-related activities, including administrative, marketing and other servicing activities, including payments to help offset costs for marketing activities and training to support sales of the Portfolios, as well as occasional gifts, entertainment or other compensation as incentives. It was noted that such payments may be derived from 12b-1 (service) fees that are deducted directly from the assets of the Portfolios or from investment management fees received by SunAmerica. In addition, the Board considered that, because shares of the Portfolios are offered as investment options through variable annuity or life contracts issued by the Life Companies (the “Variable Contracts”), the investment objectives, strategies and performance of the Portfolios may positively or negatively impact a Life Company’s ability to hedge and the related hedging costs associated with guarantees that the Life Company may provide as the issuer of the Variable Contracts.
The Board considered that the benefits derived by SunAmerica and its affiliates were not expected to change materially as a result of the anticipated change of control of SunAmerica. The Board concluded that any benefits that SunAmerica and its affiliates could be expected to receive with regard to providing investment advisory and other services to the Portfolios would continue to be reasonable.
| ||
| 36 |
Table of Contents
SUNAMERICA SERIES TRUST
APPROVAL OF ADVISORY AGREEMENT
December 31, 2022 (unaudited) (continued)
Profitability and Economies of Scale.
The Board considered that SunAmerica is unable to estimate the profitability of the New Agreements to itself or its affiliates, because the Separation Plan has not yet commenced and the New Agreements are not yet in effect. The Board noted, however, that in connection with the Annual Renewals, it received information related to SunAmerica’s profitability as well as the profitability of certain affiliates with respect to the services they provide to the Trust’s Portfolios in connection with the Current Agreements. The profitability analysis reflected the relationship between SunAmerica and the affiliated Life Companies. The Board considered that, pursuant to administrative services agreements between SunAmerica and each of the Life Companies, SunAmerica pays a fee to each Life Company at an annual rate of 25 basis points of the average daily net assets of the Portfolios that are held by the corresponding separate accounts of each Life Company, in exchange for certain administrative services provided to the Portfolios. The Board determined that the profitability to SunAmerica in connection with its relationship to the Trust under the Current Agreements was reasonable. In addition, the Board considered the Investment Management Profitability Analysis prepared by an independent information service, Broadridge, and noted that SunAmerica’s profitability under the Current Agreements was generally in the range of the profitability of companies contained in the report.
The Board also received and considered information regarding the ability of the Portfolios to achieve economies of scale. It was noted that the advisory fees of nearly all Portfolios contain breakpoints that will reduce the fees paid by a Portfolio as its assets increase. The Board also considered that SunAmerica has voluntarily agreed to waive fees in certain instances, which was noted earlier in the discussion of fees. The Board considered that the multiple fee waivers and expense limitations agreed to by SunAmerica were expected to continue unchanged after the change of control of SunAmerica that would result from the Separation Plan.
It was noted that as a result of being part of a complex of mutual funds advised or administered by SunAmerica, the Trust is able to share common resources and may share certain expenses, which could result in a Portfolio experiencing lower expenses than it otherwise would achieve if the Trust were a stand-alone entity. The Board considered that management believed that the Portfolios’ existing fee schedules reflect the economies of scale inherent in providing investment advice to a Portfolio in its particular asset category and asset size. The Board concluded that any potential economies of scale are currently being shared between the Trust and SunAmerica in an appropriate manner and would continue to be shared after implementation of the Separation Plan.
Considerations Specific to the Separation Plan.
The Board considered the expected impact of the Separation Plan on SunAmerica and its ability to serve the Portfolios. The Board also considered the expected advantages and disadvantages to shareholders as a result of the Separation Plan. The Board and the Independent Trustees noted in particular that the terms of the New Agreements are substantially identical to those of the Current Agreements; that the advisory and subadvisory fee rates under the New Agreements are identical to those under the Current Agreements; that the fee waivers and expense limitations agreed to by SunAmerica with respect to any Portfolio will not change; that the nature, extent and quality of the services to be provided by SunAmerica pursuant to the New Agreements are expected to be provided with the same level of commitment; that the continued retention of SunAmerica would minimize the disruption of the Portfolios’ operations and would not cause the Trust to incur additional costs and expenses that would be necessary if a new investment adviser were to be hired; and that the key personnel serving the Trust are expected to continue to be retained after the change of control of SunAmerica. The Board and the Independent Trustees also considered potential disadvantages of the Separation Plan to Portfolio shareholders, such as the potential eventual loss of affiliation with the AIG name brand. Based on the information provided by SunAmerica, the Board and the Independent Trustees concluded that the Separation Plan is not likely to result in any diminution of SunAmerica’s financial resources or its ability to continue to serve the Trust, or to otherwise destabilize SunAmerica or its management or personnel.
On the basis of these and other factors, the Board, and the Independent Trustees separately, concluded that the continued engagement of SunAmerica to provide investment advisory and management services to the Trust would be in the best interests of the Trust and its Portfolios. The Board, and the Independent Trustees separately, then voted unanimously (i) to approve the New Agreements, including the advisory and subadvisory fee rates proposed in the New Agreements, in respect of each Portfolio for a period not to exceed two years commencing immediately following shareholder approval of the New Agreements, and (ii) to recommend to shareholders of each Portfolio that they approve the New Agreements.
| ||
| 37 |
Table of Contents
SUNAMERICA SERIES TRUST
TRUSTEES AND OFFICERS INFORMATION (unaudited)
The following table contains information regarding the Trustees and Officers that oversee operations of the Portfolios and other investment companies within the Fund complex.
Name and Age† | Position Held | Term of | Principal Occupation(s) | Number of Portfolios in Fund Complex Overseen by Trustee(2) | Other Directorships | |||||||
Disinterested Trustees | ||||||||||||
| Garrett F. Bouton Age: 78 | Trustee | 2007 – Present | Retired (2003-Present); Managing Director and CEO, Barclays Global Investors (1996-2003). | 80 | Chairman/Director, The LECG Group (consulting services) (2006-2010). | |||||||
| Tracey C. Doi Age: 61 | Trustee | 2021 – Present | Chief Financial Officer, Group Vice President of Toyota Motor North America (2000-2022); Board Member, City National Bank (2016-2022). | 80 | Director of Quest Diagnostics (2021-Present) | |||||||
| Jane Jelenko Age: 74 | Trustee | 2006 – Present | Retired Partner KPMG, LLP and Managing Director, Bearingpoint, Inc. (formerly KPMG Consulting). (2003-Present). | 80 | Director, Countrywide Bank (banking) (2003-2008) and Director, Cathay General Bancorp and Cathay Bank (banking) (2012-Present). | |||||||
| Gilbert T. Ray Age: 78 | Trustee | 2001 – Present | Retired Partner, O’Melveny & Myers LLP (law firm) (2000-Present). | 80 | Director, Advanced Auto Parts, Inc. (retail - auto and home supply stores) (2002-2018); Director, Watson, Wyatt Worldwide (services — management consulting services) (2000-2018); Director Dine Equity (services — restaurant) 2004-Present); Director, Diamond Rock Hospitality (financial — real estate) (2005-Present); Director, Towers Watson & Co. (services — management consulting services) 2010-2018). | |||||||
| Charles H. Self III Age: 65 | Trustee | 2021 - Present | Chief Operating Officer, Chief Compliance Officer and Chief Investment Officer of iSectors (2014-2021); Chief Investment Officer of Sumnicht & Associates (2014-2021). | 80 | Director of Governmental Insurance Management (1989-Present); Director of Ohio Muual Insurance Company (2022-Present) | |||||||
| Bruce G. Willison Age: 74 | Trustee and Chairman | 2001 – Present | Professor of Management, Anderson School at UCLA (1999- 2011); Dean, Anderson School at UCLA (1999-2005); co-founder, Grandpoint Capital, Inc. (2009-2010); Chairman of Tyfone, Inc. — Portland, OR (2018-Present); Chairman of Catholic Schools Collaborative (2011- Present). | 80 | Director of NiQ — Portland, OR (2016-2020); Director of Specialty Family Foundation (2013-Present); Director, GrandPoint Bank banking), (2011-Present); Director, Indy Mac Bancorp (banking) 2003-2008); Director, Move, Inc. internet real estate site) (2003-Present); Director, Health Net, Inc. (health insurance plan) (2000-2016). | |||||||
Interested Trustee | ||||||||||||
| John T. Genoy (4) Age: 54 | President and Trustee | 2021 – Present | President of VALIC Company I, Seasons Series Trust, and SAAMCo (2021-Present); Director of SAAMCo (2014-Present: Chief Operating Officer, SAAMCo (2006-Present); Chief Financial Officer, SAAMCo (2002-2021); Senior Vice President, SAAMCo (2021). | 80 | None. | |||||||
| ||
| 38 |
Table of Contents
SUNAMERICA SERIES TRUST
TRUSTEES AND OFFICERS INFORMATION (unaudited) — (continued)
Name and Age† | Position Held | Term of Office and Time Served(1) | Principal Occupation(s) During Past 5 Years | Number of Portfolios in Fund Complex Overseen by Trustee(2) | Other Directorships Held by Trustee(3) | |||||
Officers | ||||||||||
| Kathleen D. Fuentes Age: 53 | Chief Legal Officer, Vice President, and Secretary | 2015 – Present | Vice President and Deputy General Counsel, SAAMCo (2006-Present). | N/A | N/A | |||||
| Christopher C. Joe Age: 53 | Chief Compliance Officer and Vice President | 2017-Present | Chief Compliance Officer, Seasons Series Trust, SunAmerica Series Trust and VALIC Company I (2017-Present); Chief Compliance Officer, VALIC Retirement Services Company (2017-2019); Chief Compliance Officer, Invesco PowerShares (2011-2017); Chief Compliance Officer, Invesco Investment Advisers, LLC (2010- 2013); U.S. Compliance Director, Invesco, Ltd (2006-2014); Deputy Chief Compliance Officer, Invesco Advisers, Inc. (2014-2015). | N/A | N/A | |||||
Gregory N. Bressler Age: 56 | Vice President and Assistant Secretary | 2005 – Present | Senior Vice President and General Counsel, SAAMCo (2005-Present). | N/A | N/A | |||||
Gregory R. Kingston Age: 56 | Treasurer and Principal Financial Officer/Principal Accounting Officer | 2014 – Present | Vice President, SAAMCo (1999-Present); Head of Mutual Fund Administration, SAAMCo (2014-Present). | N/A | N/A | |||||
Shawn Parry Age: 50 | Vice President and Assistant Treasurer | 2014 – Present | Vice President, SAAMCo (2014-Present); Assistant Vice President, SAAMCo (2010-2014) | N/A | N/A | |||||
Donna McManus Age: 61 | Vice President and Assistant Treasurer | 2014 – Present | Vice President, SAAMCo (2014-Present); Managing Director, BNY Mellon (2000-2014). | N/A | N/A | |||||
Matthew J. Hackethal Age: 51 | Anti-Money Laundering Compliance Officer | 2006 – Present | Vice President, SAAMCo (2011-Present); Acting Chief Compliance Officer, SAAMCo (2016-2017); Chief Compliance Officer, SAAMCo (2006-Present). | N/A | N/A | |||||
| Salimah Shamji Age: 51 | Vice President | 2020 – Present | Vice President, SAAMCo (2008-Present). | N/A | N/A | |||||
| Christopher J. Tafone Age: 47 | Vice President and Assistant Secretary | 2021 – Present (Vice President; (2016 – Present) (Assistant Secretary) | Vice President, SAAMCo (2016-Present); Associate General Counsel, AIG Life & Retirement (2016-Present). | N/A | N/A | |||||
| † | The business address for each Trustee and Officer is 21650 Oxnard Street, 10th Floor, Woodland Hills, CA 91367. |
| (1) | Trustees serve until their successors are duly elected and qualified. Each officer will hold office for an indefinite term until the date he or she resigns or retires or until his/her successor is duly elected and qualifies. |
| (2) | The “Fund Complex” consists of all registered investment company portfolios for which SAAMCo serves as investment adviser or administrator. The “Fund Complex” includes the Trust (61 portfolios), Seasons Series Trust (19 portfolios) and VALIC Company I (36 portfolios). |
| (3) | Directorships of companies required to report to the Securities and Exchange Commission under the Securities Exchange Act of 1934 (i.e. “Public Company”) registered under the 1940 Act. |
| (4) | Interested Trustee, as defined within the Investment Company Act of 1940, because he serves as President and COO of SunAmerica. |
Additional information concerning the Trustees and Officers is contained in the Statement of Additional Information and is available without charge by calling (800) 445-7862.
| ||
| 39 |
Table of Contents
SUNAMERICA SERIES TRUST
SHAREHOLDERS TAX INFORMATION (unaudited)
Certain tax information regarding the SunAmerica Series Trust is required to be provided to the shareholders based upon each Portfolio’s income and capital gain distributions for the taxable year ended December 31, 2022.
During the year ended December 31, 2022 the Portfolios paid the following dividends per share along with the percentage of ordinary income dividends that qualified for the dividends received deductions for corporations.
| Total Dividends | Net Investment Income | Net Short-Term Capital Gains* | Net Long-Term Capital Gains | Qualifying% for the Dividends Received Deduction | ||||||||||||||||
SA American Funds Asset Allocation Portfolio Class 1 | $ | 0.90 | $ | 0.34 | $ | — | $ | 0.56 | 71.43 | % | ||||||||||
SA American Funds Asset Allocation Portfolio Class 3 | 0.86 | 0.30 | — | 0.56 | 71.43 | |||||||||||||||
SA American Funds Global Growth Portfolio Class 1 | 0.07 | — | — | 0.07 | — | |||||||||||||||
SA American Funds Global Growth Portfolio Class 3 | 0.07 | — | — | 0.07 | — | |||||||||||||||
SA American Funds Growth Portfolio Class 1 | 2.10 | 0.11 | — | 1.99 | 100.00 | |||||||||||||||
SA American Funds Growth Portfolio Class 3 | 2.07 | 0.08 | — | 1.99 | 100.00 | |||||||||||||||
SA American Funds Growth-Income Portfolio Class 1 | 0.50 | 0.14 | — | 0.36 | 100.00 | |||||||||||||||
SA American Funds Growth-Income Portfolio Class 3 | 0.47 | 0.11 | — | 0.36 | 100.00 | |||||||||||||||
SA American Funds VCP Managed Allocation Portfolio Class 1 | 0.72 | 0.19 | — | 0.53 | 100.00 | |||||||||||||||
SA American Funds VCP Managed Allocation Portfolio Class 3 | 0.68 | 0.15 | — | 0.53 | 100.00 | |||||||||||||||
| * | Short-term capital gains are treated as ordinary income for tax purposes |
| ||
| 40 |
Table of Contents
COMPARISONS: PORTFOLIOS VS. INDEXES (unaudited)
As required by the Securities and Exchange Commission, the following graphs compare the performance of a $10,000 investment in the presented Feeder Portfolios of SunAmerica Series Trust (the “Trust”) to a $10,000 investment in a comparable securities index benchmark since the portfolio’s inception. Importantly, such indices represent “paper” portfolios and do not reflect the costs and expenses of actual investing. Following each graph is a discussion of portfolio performance and factors affecting performance over the year ended December 31, 2022.
The following graphs and tables show the performance of the Portfolios at the SunAmerica Series Trust Feeder Funds level and include all trust expenses but no insurance company expenses associated with the variable annuity or variable life policy and no insurance company contingent deferred sales charge. All dividends are assumed to be reinvested. No expenses are deducted from the performance of the indexes.
The SA American Funds portfolios (“Feeder Funds”) are a part of the Trust and currently do not buy individual securities directly, but instead invest all of their assets in the underlying funds (“Master Funds”) of the American Funds Insurance Series. Each Feeder Fund has the same investment goal and limitations as the underlying Master Fund. Investing in a Feeder Fund may result in higher fees and expenses than investing directly in a Master Fund as the Feeder Funds will bear their own portfolio expenses as well as their pro rata share of each Feeder Fund’s underlying Master Fund fees and expenses. Please see the product prospectus for more information regarding the master-feeder fund structure.
Market indices referenced are unmanaged. You cannot invest directly in an index.
Note: The performance data quoted represents past performance; past performance does not guarantee future results; the investment return and principal value of an investment will fluctuate so that an investor’s shares, when redeemed, may be worth more or less than their original cost; current performance may be lower or higher than the performance data quoted. Please visit www.corebridgefinancial.com/annuities for performance data current to the most recent month-end.
| ||
| 41 |
Table of Contents
American Funds
SA American Funds Asset Allocation Portfolio — Class 3
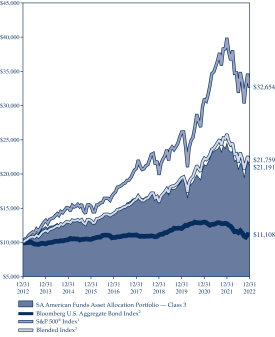
| SA American Funds Asset Allocation Portfolio |
| |||||||
| Average Annual Total Returns as of 12/31/22 |
| |||||||
| Class 1* | Class 3* | |||||||
1-year | -13.44% | -13.58% | ||||||
5-year | 5.31% | 5.06% | ||||||
10-year | N/A | 7.80% | ||||||
Since Inception | 7.06% | 6.26% | ||||||
| * | Inception date for Class 1: 09/26/16; Class 3: 09/01/06. |
| 1 | The S&P 500® Index tracks the performance of 500 stocks representing a sampling of the largest domestic stocks traded publicly in the United States. Because it is market-weighted, the index will reflect the changes in larger companies more heavily than those in smaller companies. |
| 2 | The Bloomberg U.S. Aggregate Bond Index is a broad, unmanaged index generally representative of intermediate-term government bonds, investment grade corporate debt securities and mortgage-backed securities. |
| 3 | The Blended Index is comprised of 60% S&P 500® Index and 40% Bloomberg U.S. Aggregate Bond Index. |
Note: The performance data quoted represents past performance; past performance does not guarantee future results; the investment return and principal value of an investment will fluctuate so that an investor’s shares, when redeemed, may be worth more or less than their original cost; current performance may be lower or higher than the performance data quoted. Please visit corebridgefinancial.com/annuities for performance data current to the most recent month-end.
The SA American Funds Asset Allocation Portfolio — Class 3 (Feeder Fund), which is a mix of stocks and bonds, returned -13.58% for the twelve months ended December 31, 2022. The S&P 500® Index returned -18.11% over the same period, while the Bloomberg U.S. Aggregate Bond Index returned -13.01%. The Blended Index (60% S&P 500® Index and 40% Bloomberg U.S. Aggregate Bond Index) returned -15.79%. The American Funds Insurance Series® Asset Allocation Fund — Class 1 (Master Fund), which is a mix of stocks and bonds, returned -13.19% for the annual period.
U.S. equities had their worst year since 2008, as persistently high inflation and aggressive rate hikes stoked recession fears. The S&P 500® Index entered its first bear market since 2020. Energy was the top S&P 500® Index sector for the second straight year, climbing 66%. Crude oil prices spiked in March after Russia’s invasion of Ukraine upended global oil flows. Growth stocks had the sharpest declines, including several tech giants that had been market leaders over the last decade. Despite consecutive quarters of negative gross domestic product growth in the first half, a strong labor market helped inflation to persist. U.S. fixed income markets fell across the board. The Federal Reserve raised the federal funds rate by 425 basis points from near zero to counter the highest inflation since the 1980s. U.S. Treasury yields rose across the curve, and ended the year inverted as shorter dated bonds sold off sharply.
In the equity portion, investment selection within the consumer discretionary sector was the top contributor to relative returns on a sector basis. Results were buoyed by an off-benchmark holding in food services company Aramark and a higher-than-index position in Philip Morris, which saw returns that significantly outpaced the S&P 500® Index. On the downside, stock selections within the energy and financials sectors weighed on relative returns. Within energy, Exxon Mobil — which the fund did not hold — weighed on relative results as its stock outpaced the S&P 500® Index. A higher-than-benchmark holding in Charter Communications was among the top individual detractors, as returns lagged the S&P 500® Index. The fixed income investments were additive to relative returns overall. Duration positioning within Treasuries and mortgage-backed securities (MBS) contributed positively to results. Sector and security selections detracted. An out-of-benchmark position within U.S. Treasury Inflation-Protected Securities (TIPS) also weighed on returns.
Past performance is no guarantee of future results.
Securities listed may or may not be a part of current Portfolio construction.
| ||
| 42 |
Table of Contents
American Funds
SA American Funds Global Growth Portfolio — Class 3
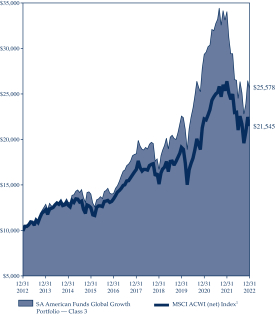
| SA American Funds Global Growth Portfolio |
| |||||||
| Average Annual Total Returns as of 12/31/22 |
| |||||||
| Class 1* | Class 3* | |||||||
1-year | -24.75% | -24.97% | ||||||
5-year | 7.03% | 6.77% | ||||||
10-year | N/A | 9.85% | ||||||
Since Inception | 9.54% | 7.85% | ||||||
| * | Inception date for Class 1: 09/26/16; Class 3: 09/01/06. |
| 1 | The MSCI ACWI (net) Index captures large and mid cap representation across 23 developed and 24 emerging markets countries. The index covers approximately 85% of the global investable equity opportunity set. The net index approximates the minimum possible dividend reinvestment and assumes that the dividend is reinvested after the deduction of withholding tax, applying the rate to nonresident individuals who do not benefit from double taxation treaties. |
Note: The performance data quoted represents past performance; past performance does not guarantee future results; the investment return and principal value of an investment will fluctuate so that an investor’s shares, when redeemed, may be worth more or less than their original cost; current performance may be lower or higher than the performance data quoted. Please visit corebridgefinancial.com/annuities for performance data current to the most recent month-end.
The SA American Funds Global Growth Portfolio — Class 3 (Feeder Fund) returned -24.97% for the twelve months ended December 31, 2022, compared with a -18.36% return for the MSCI ACWI (net) Index. The American Funds Insurance Series® Global Growth Fund — Class 1 (Master Fund) returned -24.54% for the annual period.
Global stocks fell sharply, pressured by rising interest rates, slowing economic growth and inflationary pressures not seen since the 1980s. The war in Ukraine also weighed on investors throughout the year. Several key benchmark indexes fell into bear market territory at times and all but one sector declined in the MSCI ACWI (net) Index. Within the MSCI ACWI (net) Index, communication services, consumer discretionary and information technology stocks suffered the biggest losses. Meanwhile, energy stocks surged amid higher oil and gas prices. Late in the year, signs that inflation may have peaked in the U.S., Europe and elsewhere sparked a rally that erased some of the losses.
Stock selection in the consumer discretionary sector was the top contributor to relative returns. A larger-than-index position in health care firm Cigna was among the top individual contributors to the Master Fund, with returns that outpaced the MSCI ACWI (net) Index. On the downside, stock selections within the information technology sector weighed on results. Netherlands-based payments firm Adyen was among the top individual detractors, with returns that lagged the MSCI ACWI (net) Index in a weak sector overall. On a geographic basis, stocks of companies domiciled in Hong Kong and France were among the top contributors to results, while stocks of companies based in the United States and the Netherlands were among the top detractors.
Past performance is no guarantee of future results.
Securities listed may or may not be a part of current Portfolio construction.
| ||
| 43 |
Table of Contents
American Funds
SA American Funds Growth Portfolio — Class 3
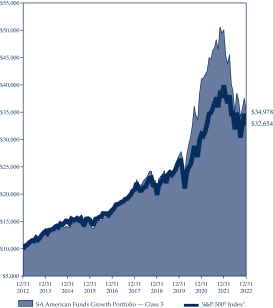
| SA American Funds Growth Portfolio |
| |||||||
| Average Annual Total Returns as of 12/31/22 |
| |||||||
| Class 1* | Class 3* | |||||||
1-year | -29.90% | -30.09% | ||||||
5-year | 11.10% | 10.85% | ||||||
10-year | N/A | 13.34% | ||||||
Since Inception | 13.66% | 9.33% | ||||||
| * | Inception date for Class 1: 09/26/16; Class 3: 09/01/06. |
| 1 | The S&P 500® Index tracks the performance of 500 stocks representing a sampling of the largest domestic stocks traded publicly in the United States. Because it is market-weighted, the index will reflect the changes in larger companies more heavily than those in smaller companies. |
Note: The performance data quoted represents past performance; past performance does not guarantee future results; the investment return and principal value of an investment will fluctuate so that an investor’s shares, when redeemed, may be worth more or less than their original cost; current performance may be lower or higher than the performance data quoted. Please visit corebridgefinancial.com/annuities for performance data current to the most recent month-end.
The SA American Funds Growth Portfolio — Class 3 (Feeder Fund) returned -30.09% for the twelve months ended December 31, 2022, compared with a -18.11% return for the S&P 500® Index. The American Funds Insurance Series® Growth Fund — Class 1 (Master Fund) returned -29.75% for the annual period.
U.S. equities had their worst year since 2008, as persistently high inflation and aggressive rate hikes stoked recession fears. S&P 500® Index entered its first bear market since 2020. Energy was the top S&P 500® Index sector for the second straight year, climbing 66%. Crude oil prices spiked in March after Russia’s invasion of Ukraine upended global oil flows. Growth stocks had the sharpest declines, including several tech giants that had been market leaders over the last decade. Despite consecutive quarters of negative gross domestic product growth in the first half, a strong labor market helped inflation to persist.
Stock selection within the materials sector was the top contributor to relative returns. A position in energy industry firm Halliburton buoyed results as its stock outpaced the broader industry. On the downside, investments within the communication services sector weighed on results. A position in Tesla was the top individual detractor to returns.
Past performance is no guarantee of future results.
Securities listed may or may not be a part of current Portfolio construction.
| ||
| 44 |
Table of Contents
American Funds
SA American Funds Growth-Income Portfolio — Class 3
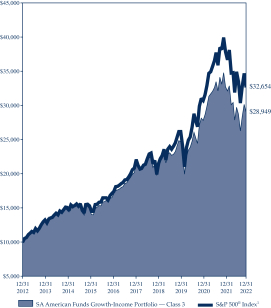
| SA American Funds Growth-Income Portfolio |
| |||||||
| Average Annual Total Returns as of 12/31/22 |
| |||||||
| Class 1* | Class 3* | |||||||
1-year | -16.49% | -16.74% | ||||||
5-year | 7.80% | 7.51% | ||||||
10-year | N/A | 11.22% | ||||||
Since Inception | 10.27% | 7.72% | ||||||
| * | Inception date for Class 1: 09/26/16; Class 3: 09/01/06. |
| 1 | The S&P 500® Index tracks the performance of 500 stocks representing a sampling of the largest domestic stocks traded publicly in the United States. Because it is market-weighted, the index will reflect the changes in larger companies more heavily than those in smaller companies. |
Note: The performance data quoted represents past performance; past performance does not guarantee future results; the investment return and principal value of an investment will fluctuate so that an investor’s shares, when redeemed, may be worth more or less than their original cost; current performance may be lower or higher than the performance data quoted. Please visit corebridgefinancial.com/annuities for performance data current to the most recent month-end.
The SA American Funds Growth-Income Portfolio — Class 3 (Feeder Fund) returned -16.74% for the 12 months ended December 31, 2022, while the S&P 500® Index returned -18.11% over the same period. The American Funds Insurance Series® Growth-Income Fund — Class 1 (Master Fund) returned -16.28% for the annual period.
U.S. equities had their worst year since 2008, as persistently high inflation and aggressive rate hikes stoked recession fears. The S&P 500® Index entered its first bear market since 2020. Energy was the top S&P 500® Index sector for the second straight year, climbing 66%. Crude oil prices spiked in March after Russia’s invasion of Ukraine upended global oil flows. Growth stocks had the sharpest declines, including several tech giants that had been market leaders over the last decade. Despite consecutive quarters of negative gross domestic product growth in the first half, a strong labor market helped inflation to persist.
The Master Fund’s investments within the information technology and industrials sectors were top contributors to relative returns. An out-of-benchmark position in energy company Canadian Natural Resources was a top individual contributor, as the stock outpaced the S&P 500® Index. On the downside, security selections within the communications and financials sectors dragged on Portfolio returns. Netflix was the fund’s top individual detractor owing to a larger-than-benchmark position and returns that lagged the S&P 500® Index.
Past performance is no guarantee of future results.
Securities listed may or may not be a part of current Portfolio construction.
| ||
| 45 |
Table of Contents
American Funds
SA American Funds VCP Managed Allocation Portfolio — Class 3
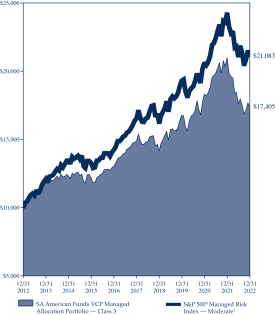
| SA American Funds VCP Managed Allocation Portfolio |
| |||||||
| Average Annual Total Returns as of 12/31/22 |
| |||||||
| Class 1* | Class 3* | |||||||
1-year | -16.97% | -17.18% | ||||||
5-year | 3.41% | 3.15% | ||||||
10-year | N/A | 5.70% | ||||||
Since Inception | 5.27% | 5.67% | ||||||
| * | Inception date for Class 1: 09/26/16; Class 3: 10/15/12. |
| 1 | The S&P 500® Managed Risk Index — Moderate is designed to simulate a dynamic protective portfolio that allocates between the underlying equity index and cash, based on realized volatilities of the underlying equity and bond indices, while maintaining a fixed allocation to the underlying bond index. |
Note: The performance data quoted represents past performance; past performance does not guarantee future results; the investment return and principal value of an investment will fluctuate so that an investor’s shares, when redeemed, may be worth more or less than their original cost; current performance may be lower or higher than the performance data quoted. Please visit corebridgefinancial.com/annuities for performance data current to the most recent month-end.
The SA American Funds VCP Managed Allocation Portfolio — Class 3 (Feeder Fund) returned -17.18% for the twelve months ended December 31, 2022. The S&P 500® Managed Risk Index — Moderate Index returned -13.13% over the same period. The American Funds Insurance Series® Managed Risk Growth-Income Fund — Class P1 (Master Fund) returned -16.74% for the period.
The SA American Funds VCP Managed Allocation Portfolio is a Feeder Fund investing in shares of American Funds Insurance Series® Managed Risk Growth-Income Fund (Master Fund). The Master Fund pursues its objective by investing in shares of American Funds Insurance Series® Growth-Income Fund and American Funds Insurance Series® The Bond Fund of America while seeking to manage Portfolio volatility and provide downside protection, primarily through the use of exchange-traded options and futures contracts. The benefit of the Master Fund’s managed risk strategy should be most apparent during periods of high volatility and in down markets. In steady or rising markets, the Master Fund’s results can be expected to lag those of the Master Fund’s underlying fund.
The underlying American Funds Insurance Series® Growth-Income Fund’s investment within the information technology sector was the top contributor to relative returns. A higher-than-benchmark investment within the industrials sector was also additive to results. On the downside, security selections within the financials and communication services sectors weighed on relative results. The managed risk strategy detracted overall. Within the strategy, the equity future overlay was positive while the Treasury future and option overlays detracted.
| ||
| 46 |
Table of Contents
SUNAMERICA SERIES TRUST
December 31, 2022 (unaudited)
Filed under Rules 497(e) and 497(k)
Registration Nos. 333-08653
033-52742
Seasons Series Trust
SunAmerica Series Trust
(each, a “Trust,” and each series thereof, a “Portfolio”)
Supplement dated October 17, 2022, to each Portfolio’s current Summary Prospectus,
Prospectus and Statement of Additional Information, as amended or supplemented to date
SunAmerica Asset Management, LLC (“SunAmerica”), the Portfolios’ investment adviser, is indirectly, wholly owned by Corebridge Financial, Inc. (“Corebridge”). American International Group, Inc. (“AIG”), the parent of Corebridge, has announced its intention to sell all of its interest in Corebridge over time (such divestment, the “Separation Plan”). On September 19, 2022, AIG sold a portion of its interest in Corebridge in an initial public offering (“IPO”) of Corebridge common stock, following which AIG’s interest in Corebridge is approximately 78%. While the IPO did not result in an “assignment” (as defined in the Investment Company Act of 1940) of the current investment advisory and management agreement between SunAmerica and each Trust with respect to the Portfolios, it is anticipated that one or more of the transactions contemplated by the Separation Plan will ultimately be deemed to result as such. Each agreement provides that it will automatically terminate in the event of its “assignment.”
Accordingly, at a meeting held on October 13, 2022 (the “Board Meeting”), the Board of Trustees (the “Board,” whose members are referred to as the “Trustees”) of each Trust considered and approved proposals to approve a new investment advisory and management agreement between SunAmerica and its respective Trust with respect to the Portfolios to take effect upon the automatic termination of an existing agreement in the event of an assignment resulting from a transaction contemplated by the Separation Plan, thus allowing SunAmerica to continue to provide advisory services to the Portfolios without interruption. At the Board Meeting, each Board also approved several other proposals, as described below, and also approved submitting such proposals to shareholders of each Portfolio at a joint special meeting (the “Special Meeting”) to be held on or about January 19, 2023. Specifically, at the Special Meeting, shareholders will be asked:
| 1. | To elect Trustees to the Board of each Trust; |
| 2. | To approve a new investment advisory and management agreement between SunAmerica and each Trust, on behalf of each of its respective Portfolios, and to approve any future investment advisory and management agreements between SunAmerica and each Trust, each to take effect upon a transaction contemplated by the Separation Plan that results in an assignment of the then-existing investment advisory and management agreement; |
| 3. | To approve a modified “manager-of-managers” structure; and |
| 4. | To approve an amendment to the fundamental investment restriction regarding concentration for each of the SA Franklin Systematic U.S. Large Cap Value Portfolio, the SA Fidelity Institutional AM® Real Estate Portfolio, the SA Large Cap Index Portfolio and the SA DFA Ultra Short Bond Portfolio. |
More detailed information about each proposal to be voted on at the Special Meeting will be provided in a forthcoming proxy statement. When you receive the proxy statement, please review it carefully and cast your vote or provide voting instructions to avoid the additional expense to the Portfolios of any future solicitation. This Supplement is not a proxy and is not soliciting any proxy, which can only be done by means of a proxy statement. The Special Meeting is limited to shareholders of each Portfolio. Shareholders of a Portfolio as of October 26, 2022, are entitled to vote at the Special Meeting.
PLEASE RETAIN THIS SUPPLEMENT FOR FUTURE REFERENCE.
| ||
| 47 |
Table of Contents
SUNAMERICA SERIES TRUST
RESULTS OF SHAREHOLDERS MEETING
December 31, 2022 (unaudited)
On January 19, 2023, a joint special meeting of shareholders (the “Special Meeting”) of each of the portfolios of the Trust to consider certain proposals, including the proposals listed below. Each of the applicable proposals were approved and the results of the Special Meeting with respect to the proposals applicable to the Portfolios were as follows:
| 1. | To elect six Trustees to the Board of Trustees of the Trust (the “Board”) (voted on by all shareholders of all of the portfolios of the Trust, voting together). |
NAME OF TRUSTEE | FOR | WITHHOLD | ||||||
(01) Tracey C. Doi | 3,690,515,635.221 | 118,434,656.196 | ||||||
(02) John T. Genoy | 3,688,993,816.513 | 119,956,474.904 | ||||||
(03) Jane Jelenko | 3,681,946,483.602 | 127,003,807.815 | ||||||
(04) Charles H. Self III | 3,683,752,067.920 | 125,198,223.497 | ||||||
(05) Martha B. Willis | 3,688,729,273.033 | 120,221,018.384 | ||||||
(06) Bruce G. Willison | 3,679,287,280.376 | 129,663,011.041 | ||||||
| 2. | To consider and vote upon a proposal to approve a new investment advisory and management agreement between SunAmerica and the Trust, on behalf of each of the respective Portfolios, and to approve any future investment advisory and management agreements between SunAmerica and the Trust, each to take effect upon a Change of Control Event resulting from the Separation Plan. The material terms of the proposed investment advisory and management agreements are substantially similar to the material terms of the current investment advisory and management agreements (with respect to each Portfolio, voted on by shareholders of the Portfolio, voting separately): |
| FOR | AGAINST | ABSTAIN | ||||||||||
SA American Funds Asset Allocation Portfolio | 103,427,915.180 | 1,848,339.926 | 5,867,801.370 | |||||||||
SA American Funds Global Growth Portfolio | 33,136,786.779 | 629,612.772 | 1,199,241.316 | |||||||||
SA American Funds Growth Portfolio | 56,162,483.015 | 1,004,319.445 | 2,414,761.173 | |||||||||
SA American Funds Growth- Income Portfolio | 31,305,021.406 | 659,977.414 | 1,471,106.670 | |||||||||
SA American Funds VCP Managed Allocation Portfolio | 123,391,375.873 | 3,588,908.247 | 7,391,306.120 | |||||||||
| 3. | To approve a modified “manager-of-managers” structure for each Portfolio (with respect to each Portfolio, voted on by shareholders of the Portfolio, voting separately): |
| FOR | AGAINST | ABSTAIN | ||||||||||
SA American Funds Asset Allocation Portfolio | 100,885,757.960 | 3,510,162.084 | 6,748,136.432 | |||||||||
SA American Funds Global Growth Portfolio | 32,807,579.542 | 828,749.198 | 1,329,312.127 | |||||||||
SA American Funds Growth Portfolio | 55,298,510.034 | 1,371,061.652 | 2,911,991.947 | |||||||||
SA American Funds Growth- Income Portfolio | 30,949,574.924 | 850,584.174 | 1,635,946.392 | |||||||||
SA American Funds VCP Managed Allocation Portfolio | 121,516,819.476 | 5,386,948.958 | 7,467,821.806 | |||||||||
| ||
| 48 |
Table of Contents
Past performance is no guarantee of future results.
Securities listed may or may not be a part of current Portfolio construction.
| ||
| 49 |
Table of Contents
SUNAMERICA SERIES TRUST
VOTING PROXIES ON TRUST PORTFOLIO SECURITIES
A description of the policies and procedures that the Trust uses to determine how to vote proxies related to securities held in the Trust‘s Portfolios which is available in the Trust‘s Statement of Additional Information, may be obtained without charge upon request, by calling (800) 445-SUN2. This information is also available from the EDGAR database on the U.S. Securities and Exchange Commission‘s website at http://www.sec.gov.
PROXY VOTING RECORD ON TRUST PORTFOLIO SECURITIES
Information regarding how the SunAmerica Series Trust Portfolios voted proxies relating to securities held in the Trust‘s Portfolios during the most recent twelve month period ended June 30 is available, once filed with the U.S. Securities and Exchange Commission, without charge, upon request, by calling (800) 445-SUN2 or on the U.S. Securities and Exchange Commission‘s website at http://www.sec.gov.
DISCLOSURE OF QUARTERLY PORTFOLIO HOLDINGS
The Trust is required to file its complete schedule of portfolio holdings with the U.S. Securities and Exchange Commission for the first and third quarters of each fiscal year on Form N-PORT. The Trust’s Forms N-PORT are available on the U.S. Securities and Exchange Commission’s website at http://www.sec.gov.
This report is submitted solely for the general information of shareholders of the Trust. Distribution of this report to persons other than shareholders of the Trust is authorized only in connection with a currently effective prospectus, setting forth details of the Trust, which must precede or accompany this report.
| ||
| 50 |
Table of Contents
Annuity Service Center P.O. Box 15570 Amarillo, TX 79105-5570
CHANGE SERVICE REQUESTED |

THISREPORTISNOTAUTHORIZEDFORDISTRIBUTIONTOPROSPECTIVEPURCHASERSUNLESSACCOMPANIEDORPRECEDEDBYACURRENTPROSPECTUS.
R4397AR.15 (2/22)
Table of Contents
Table of Contents
American Funds Insurance Series, by Capital Group, is the underlying investment vehicle for many variable annuities and insurance products. For over 90 years, Capital Group has invested with a long-term focus based on thorough research and attention to risk.
Investing for short periods makes losses more likely. For current information and month-end results, visit capitalgroup.com/afis. For information about your insurance contract and month-end results, go to the website of the company that issued your contract.
Investing outside the United States involves risks, such as currency fluctuations, periods of illiquidity and price volatility, as more fully described in the prospectus. These risks may be heightened in connection with investments in developing countries. Investing in small-capitalization stocks can involve greater risk than is customarily associated with investing in stocks of larger, more established companies. The return of principal for bond funds and for funds with significant underlying bond holdings is not guaranteed. Fund shares are subject to the same interest rate, inflation and credit risks associated with the underlying bond holdings. High-yield bonds are subject to greater fluctuations in value and risk of loss of income and principal than investment-grade bonds. Bond ratings, which typically range from AAA/Aaa (highest) to D (lowest), are assigned by credit rating agencies such as Standard & Poor’s, Moody’s and/or Fitch as an indication of an issuer’s creditworthiness. The use of derivatives involves a variety of risks, which may be different from, or greater than, the risks associated with investing in traditional cash securities, such as stocks and bonds. Hedge instruments, including exchange-traded futures contracts and exchange-traded put options, may not provide an effective hedge of the underlying securities because changes in the prices of such instruments may not track those of the securities they are intended to hedge. In addition, the managed risk strategy may not effectively protect the funds from market declines and will limit the funds’ participation in market gains. The use of the managed risk strategy could cause the funds’ returns to lag those of the underlying funds in certain market conditions. Refer to the funds’ prospectuses and the Risk Factors section of this report for more information on these and other risks associated with investing in the funds.
Investments are not FDIC-insured, nor are they deposits of or guaranteed by a bank or any other entity, so they may lose value.
Table of Contents
It is our pleasure to present the annual report for American Funds Insurance Series® for the year ended December 31, 2022.
Regarding the investment environment, global stocks fell sharply, pressured by rising interest rates, slowing economic growth and inflationary pressures not seen since the 1980s. Several key benchmark indexes fell into bear market
territory at times and all but one sector declined in the MSCI All Country World Index1. Communication services, consumer discretionary and information technology stocks suffered the biggest losses. Meanwhile, energy stocks surged amid higher oil and gas prices. Late in the year, signs that inflation may have peaked in the U.S., Europe and elsewhere sparked a rally that erased some of the losses.
U.S. equities had their worst year since 2008 as the S&P 500 Index2 fell 18.11%. Growth stocks had the sharpest declines, including several tech giants that had been market leaders over the last decade. On the upside, energy was the top S&P 500 sector for the second straight year, climbing 66%. Crude oil prices spiked in March after Russia’s invasion of Ukraine upended global oil flows. Despite consecutive quarters of negative gross domestic product growth in the first half, a strong labor market helped inflation to persist.
European stocks declined as record-high inflation, rising interest rates and the Ukraine invasion combined to hammer the eurozone economy. Gross domestic product growth in the 19-member eurozone decelerated throughout the year, falling to 0.3% in the third quarter from 0.6% in the first quarter. Political turmoil also weighed on markets amid contentious leadership changes in Italy and the United Kingdom. Despite a strong fourth-quarter rally in European stocks, the MSCI Europe Index3 finished the full year down by 15.06%.
Emerging markets stocks tumbled, undercut by China’s economic slowdown, interest rate hikes and the growing strength of the U.S. dollar. Rising inflation in developing countries that spurred monetary tightening, as well as rolling lockdowns in China to suppress COVID-19, also weighed on equity prices. Overall, the MSCI Emerging Markets Index4 slid 20.09%.
Bonds fell in the face of rising inflation, and the Federal Reserve hiked its policy rate 425 basis points over seven policy meetings in an attempt to tame it. The Bloomberg U.S. Treasury Index5 lost 12.46% in one of the worst bond market
Past results are not predictive of results in future periods.
All market returns referenced in this report are unmanaged and, therefore, have no expenses. Investors cannot invest directly in an index. Country returns are based on MSCI indexes, which reflect reinvestment of distributions and dividends net of withholding taxes. Source: MSCI.
| 1 | Source: MSCI. MSCI ACWI is a free float-adjusted market capitalization-weighted index that is designed to measure equity market results in the global developed and emerging markets, consisting of more than 40 developed and emerging market country indexes. Results reflect dividends net of withholding taxes. |
| 2 | Source: S&P Dow Jones Indices LLC. S&P 500 Index is a market capitalization-weighted index based on the results of approximately 500 widely held common stocks. |
| 3 | Source: MSCI. MSCI Europe Index is a free float-adjusted market capitalization-weighted index that is designed to measure results of more than 10 developed equity markets in Europe. Results reflect dividends net of withholding taxes. |
| 4 | Source: MSCI. MSCI Emerging Markets Index is a free float-adjusted market capitalization weighted index that is designed to measure equity market results in the global emerging markets, consisting of more than 20 emerging market country indexes. Results reflect dividends net of withholding taxes. |
| 5 | Source: Bloomberg Index Services Ltd. Bloomberg U.S. Treasury Index measures the performance of public obligations of the U.S. Treasury. |
American Funds Insurance Series 1
Table of Contents
declines in history. The Federal Reserve and European Central Bank, among others, aggressively raised interest rates in an attempt to bring inflation back to a target of roughly 2%, down from 7% to 10% in many economies. U.S. Treasury yields rose across the curve, which ended the year inverted as shorter dated bonds sold off sharply. The 10-year Treasury yield rose 237 basis points to 3.88%. In this environment, investment-grade (BBB/ Baa and above) corporate bonds saw the worst returns. The Bloomberg U.S. Corporate Investment Grade Index6 was down 15.76%, and spreads widened by 38 basis points. Elsewhere, the Bloomberg U.S. Corporate High Yield 2% Issuer Capped Index7 fell by 11.18%, while the Bloomberg Municipal Bond Index8 declined 8.53%.
In foreign exchange markets a strong U.S. dollar grew stronger for much of the year, particularly as the Fed raised rates at a faster pace than some other central banks, though there was some reversal of its strength in the last two months of the year. The dollar posted gains of 6.6% and
14.6% against the euro and the yen, respectively.
Looking ahead
Big questions remain about how the U.S. economy will do in 2023. It is possible
that the delayed impact of higher rates will keep growth slow, or even cause a mild recession. However, we have confidence in the long-term trajectory of the economy, and the stock market has likely digested much of the potential bad news already, given the decline this year. Investors have reason for hope, as we’ve already taken a measure of pain, in both stocks and bonds. Inflation may persist above the levels we’ve been used to the past decade, but is likely to gently decline over the coming year from the 6.5% mark, published in January 2023. That would be good news on its own, and would also lighten the upward pressure we’ve seen on interest rates this past year. The global negative impact of COVID-19 has already persisted longer than anyone predicted back in early 2020, but should also decline with time, particularly as China has decided to end lockdowns. That will eventually help economic growth.
Thus, as 2023 progresses we may see, out of many fears, a reason for optimism. The ongoing war in Ukraine remains a wild card, and we hope it does not spill over into a larger conflict. That may be the biggest risk to a mildly positive outlook for stocks. There can still be bumps in the road, but with our world-class research, we will continue to focus on finding those companies with the best fundamentals
and the best risk-versus-return tradeoffs. We believe that we will find plenty of attractive securities for the long term in this environment. In the event of periods of volatility, we remain committed to our process, and will look for opportunities at that time as well.
Our time-tested process is based on extensive research, a long-term framework and close attention to valuation, and has resulted in superior outcomes for investors over time. As always, we thank you for your continued support of our efforts and we look forward to reporting to you again in six months.
Sincerely,

Donald D. O’Neal
Co-President

Alan N. Berro
Co-President
February 13, 2023
Past results are not predictive of results in future periods.
| 6 | Source: Bloomberg Index Services Ltd. Bloomberg U.S. Corporate Investment Grade Index represents the universe of investment-grade, publicly issued U.S. corporate and specified foreign debentures and secured notes that meet the specified maturity, liquidity and quality requirements. |
| 7 | Source: Bloomberg Index Services Ltd. Bloomberg U.S. Corporate High Yield 2% Issuer Capped Index covers the universe of fixed-rate, non-investment-grade debt. The index limits the maximum exposure of any one issuer to 2%. |
| 8 | Source: Bloomberg Index Services Ltd. Bloomberg Municipal Bond Index is a market-value-weighted index designed to represent the long-term investment-grade tax-exempt bond market. |
2 American Funds Insurance Series
Table of Contents
About the series
Unless otherwise indicated, American Funds Insurance Series investment results are for Class 1 shares (Class P1 shares for managed risk funds). Class 1A shares began operations on January 6, 2017. Class 2 shares began operations on April 30, 1997. Class 3 shares began operations on January 16, 2004. Class 4 shares began operations on December 14, 2012. Results encompassing periods prior to those dates assume a hypothetical investment in Class 1 shares and include the deduction of additional annual expenses (0.25% for Class 1A shares, 0.25% for Class 2 shares, 0.18% for Class 3 shares and 0.50% for Class 4 shares).
The variable annuities and life insurance contracts that use the series’ funds contain certain fees and expenses not reflected in this report. Investment results assume all distributions are reinvested and reflect applicable fees and expenses. When applicable, results reflect fee waivers and/or expense reimbursements, without which they would have been lower. Visit capitalgroup.com/afis for more information.
The investment adviser is currently waiving a portion of its management fee for Global Growth Fund, Global Small Capitalization Fund, New World Fund, Washington Mutual Investors Fund, Capital World Growth and Income Fund, International Growth and Income Fund, Capital Income Builder, American Funds Global Balanced Fund, The Bond Fund of America, Capital World Bond Fund, American High-Income Trust, American Funds Mortgage Fund and U.S. Government Securities Fund. The waivers will be in effect through at least May 1, 2023. The waivers may only be modified or terminated with the approval of the series’ board. Applicable fund results shown reflect the waivers, without which results would have been lower. Refer to the Financial Highlights tables in this report for details.
For the managed risk funds, the investment adviser is currently waiving a portion of its management fee equal to 0.05% of each fund’s net assets. In addition, the investment adviser is currently reimbursing a portion of other expenses for Managed Risk International Fund. The waivers and reimbursement will be in effect through at least May 1, 2023, unless modified or terminated by the series’ board. After that time, the investment adviser may elect to extend, modify or terminate the reimbursement. The waivers may only be modified or terminated with the approval of the series’ board. Applicable fund results shown reflect the waivers and reimbursement, without which results would have been lower. Refer to the Financial Highlights tables in this report for details.
The Managed Risk Growth Fund pursues its objective by investing in shares of American Funds Insurance Series® – Growth Fund and American Funds Insurance Series® – The Bond Fund of America. The Managed Risk International Fund pursues its objective by investing in shares of American Funds Insurance Series® – International Fund and American Funds Insurance Series® – The Bond Fund of America. The Managed Risk Washington Mutual Investors Fund pursues its objective by investing in shares of American Funds Insurance Series® – Washington Mutual Investors Fund and American Funds Insurance Series® – U.S. Government Securities Fund. The Managed Risk Growth-Income Fund pursues its objective by investing in shares of American Funds Insurance Series® – Growth-Income Fund and American Funds Insurance Series® – The Bond Fund of America. The Managed Risk Asset Allocation Fund pursues its objective by investing in shares of American Funds Insurance Series® – Asset Allocation Fund. The funds seek to manage portfolio volatility and provide downside protection, primarily through the use of exchange-traded futures. The benefit of the funds’ managed risk strategy should be most apparent during periods of high volatility and in down markets. In steady or rising markets, the funds’ results can be expected to lag those of the underlying fund.
Funds are listed in the report as follows: equity, balanced, fixed income and managed risk.
American Funds Insurance Series 3
Table of Contents
Fund results shown are for past periods and are not predictive of results for future periods. Current and future results may be lower or higher than those shown. Prices and returns will vary, so investors may lose money. Investing for short periods makes losses more likely. For current information and month-end results, visit capitalgroup.com/afis. For information about your insurance contract and month-end results, go to the website of the company that issued your contract.
Global Growth Fund declined 24.54% for the 12 months ended December 31, 2022, compared with a decrease of 18.36% in its benchmark index, MSCI ACWI (All Country World Index),¹ a free float-adjusted market capitalization-weighted index that is designed to measure equity market results in the global developed and emerging markets, consisting of more than 40 developed and emerging market country indexes.
Global stocks fell sharply, pressured by rising interest rates, slowing economic growth and inflationary pressures not seen since the 1980s. The war in Ukraine also weighed on investors throughout the year. Several key benchmark indexes fell into bear market territory at times and all but one sector declined in the MSCI ACWI. Within that index, communication services, consumer discretionary and information technology stocks suffered the biggest losses. Meanwhile, energy stocks surged amid higher oil and gas prices. Late in the year, signs that inflation may have peaked in the U.S., Europe and elsewhere sparked a rally that erased some of the losses.
Within the fund, stock selection in the consumer discretionary sector was the top contributor to relative returns. A larger-than-index position in health care firm Cigna was among the top individual contributors to the fund, with returns that outpaced the broader market. On the downside, stock selections within the information technology sector weighed on results. Netherlands-based payments firm Adyen was among the top individual detractors, with returns that lagged the broader market in a weak sector overall.
On a geographic basis, stocks of companies domiciled in Hong Kong and France were among the top contributors to results, while stocks of companies based in the United States and the Netherlands were among the top detractors.
The fund’s portfolio managers are optimistic they will continue to find good companies globally that offer high-quality products and services, and whose values are not yet fully reflected in their share prices.
4 American Funds Insurance Series
Table of Contents
Global Growth Fund (continued)
How a hypothetical $10,000 investment has grown
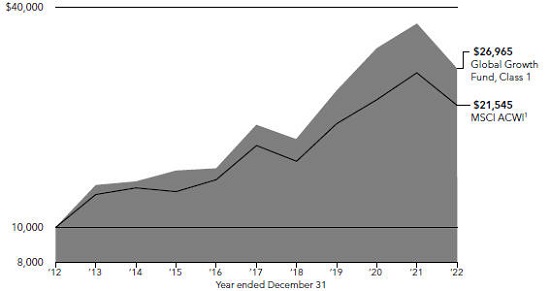
Total returns based on a $1,000 investment For periods ended December 31, 20222
| 1 year | 5 years | 10 years | Lifetime (since April 30, 1997) | Gross expense ratio | Net expense ratio | |||||||||||||||||||
Class 1 | –24.54 | % | 7.33 | % | 10.43 | % | 9.57 | % | 0.52 | % | 0.41 | % | ||||||||||||
Class 1A | –24.73 | 7.07 | 10.16 | 9.30 | 0.77 | 0.66 | ||||||||||||||||||
Class 2 | –24.74 | 7.06 | 10.15 | 9.30 | 0.77 | 0.66 | ||||||||||||||||||
Class 4 | –24.92 | 6.80 | 9.92 | 9.04 | 1.02 | 0.91 | ||||||||||||||||||
Investment results assume all distributions are reinvested and reflect applicable fees and expenses. The investment adviser is currently waiving a portion of its management fee. This waiver will be in effect through at least May 1, 2023. The waiver may only be modified or terminated with the approval of the fund’s board. Net expense ratios reflect the waiver, without which they would have been higher. When applicable, investment results reflect fee waivers and/or expense reimbursements, without which results would have been lower. Visit capitalgroup.com/afis for more information. Expense ratios are as of the fund’s prospectus dated May 1, 2023 (unaudited). Refer to the Financial Highlights table in this report for details.
Past results are not predictive of results in future periods.
Any market index shown is unmanaged and, therefore, has no expenses. Investors cannot invest directly in an index.
| 1 | Source: MSCI. The MSCI index results reflect dividends net of withholding taxes and reinvestment of distributions. |
| 2 | Periods greater than one year are annualized. |
| Where the fund’s assets were invested as of December 31, 2022 | Percent of net assets |
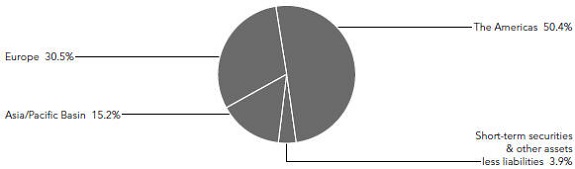
American Funds Insurance Series 5
Table of Contents
Global Small Capitalization Fund
Fund results shown are for past periods and are not predictive of results for future periods. Current and future results may be lower or higher than those shown. Prices and returns will vary, so investors may lose money. Investing for short periods makes losses more likely. For current information and month-end results, visit capitalgroup.com/afis. For information about your insurance contract and month-end results, go to the website of the company that issued your contract.
Global Small Capitalization Fund declined 29.37% for the 12 months ended December 31, 2022. Its benchmark, the MSCI All Country World Small Cap Index,¹ a free float-adjusted market capitalization-weighted index designed to measure equity market results of smaller capitalization companies in both developed and emerging markets, declined 18.67%.
Global stocks fell sharply, pressured by rising interest rates, slowing economic growth and inflationary pressures not seen since the 1980s. The war in Ukraine also weighed on investors throughout the year. Several key benchmark indexes fell into bear market territory at times and all but one sector declined in the MSCI All Country World Index. Within that index, communication services, consumer discretionary and information technology stocks suffered the biggest losses. Meanwhile, energy stocks surged amid higher oil and gas prices. Late in the year, signs that inflation may have peaked in the U.S., Europe and elsewhere sparked a rally that erased some of the losses.
Regarding the fund, stock selection within the health care sector was a positive contributor to relative returns. A larger-than-index investment in medical technology firm Haemonetics was among the fund’s top individual contributors over the period. On the downside, stock selection within the information technology sector weighed on returns. Within individual securities, India-based cloud platform provider Tanla Platforms was a top detractor, as its stock lagged the broader market.
Geographically, investments in companies domiciled in Hong Kong and Korea were overall additive to returns, while investments in those domiciled in China and the United States were detractors, overall.
In a turbulent year for markets across the board, the fund’s results for the past 12 months have been disappointing. However, with analysts’ full-time return to the road after COVID-19-related pauses, fund managers remain confident in the primary research capabilities underpinning investment decisions, and optimistic for the outlook ahead. While cognizant of the possibility of recession in the short term, managers remain committed to investing in companies with long-term potential.
6 American Funds Insurance Series
Table of Contents
Global Small Capitalization Fund (continued)
How a hypothetical $10,000 investment has grown
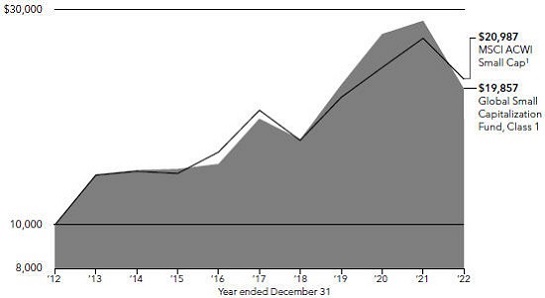
Total returns based on a $1,000 investment For periods ended December 31, 20222
| 1 year | 5 years | 10 years | Lifetime (since April 30, 1998) | Gross expense ratio | Net expense ratio | |||||||||||||||||||
Class 1 | –29.37 | % | 3.05 | % | 7.10 | % | 8.39 | % | 0.70 | % | 0.66 | % | ||||||||||||
Class 1A | –29.54 | 2.80 | 6.84 | 8.13 | 0.95 | 0.91 | ||||||||||||||||||
Class 2 | –29.55 | 2.79 | 6.84 | 8.13 | 0.95 | 0.91 | ||||||||||||||||||
Class 4 | –29.69 | 2.54 | 6.58 | 7.86 | 1.20 | 1.16 | ||||||||||||||||||
Investment results assume all distributions are reinvested and reflect applicable fees and expenses. The investment adviser is currently waiving a portion of its management fee. This waiver will be in effect through at least May 1, 2023. The waiver may only be modified or terminated with the approval of the fund’s board. Net expense ratios reflect the waiver, without which they would have been higher. When applicable, investment results reflect fee waivers and/or expense reimbursements, without which results would have been lower. Visit capitalgroup.com/afis for more information. Expense ratios are restated to reflect current fees and are as of the fund’s prospectus dated May 1, 2023 (unaudited). Refer to the Financial Highlights table in this report for details.
Past results are not predictive of results in future periods.
Any market index shown is unmanaged and, therefore, has no expenses. Investors cannot invest directly in an index.
| 1 | Source: MSCI. The MSCI index results reflect dividends net of withholding taxes and reinvestment of distributions. |
| 2 | Periods greater than one year are annualized. |
| Where the fund’s assets were invested as of December 31, 2022 | Percent of net assets |
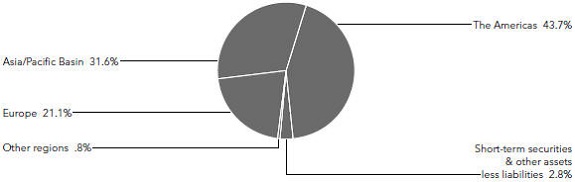
American Funds Insurance Series 7
Table of Contents
Growth Fund
Fund results shown are for past periods and are not predictive of results for future periods. Current and future results may be lower or higher than those shown. Prices and returns will vary, so investors may lose money. Investing for short periods makes losses more likely. For current information and month-end results, visit capitalgroup.com/afis. For information about your insurance contract and month-end results, go to the website of the company that issued your contract.
Growth Fund declined 29.75% for the 12 months ended December 31, 2022, compared with a decrease of 18.11% in its benchmark index, S&P 500 Index,¹ a market capitalization-weighted index based on the results of approximately 500 widely held common stocks.
U.S. equities had their worst year since 2008, as persistently high inflation and aggressive rate hikes stoked recession fears. S&P 500 Index entered its first bear market since 2020. Energy was the top S&P 500 sector for the second straight year, climbing 66%. Crude oil prices spiked in March after Russia’s invasion of Ukraine upended global oil flows. Growth stocks had the sharpest declines, including several tech giants that had been market leaders over the last decade. Despite consecutive quarters of negative gross domestic product growth in the first half, a strong labor market helped inflation to persist.
Regarding the fund, stock selection within the materials sector was the top contributor to relative returns. A position in energy industry firm Halliburton buoyed results as its stock outpaced the broader industry. On the downside, investments within the communication services sector weighed on results. A position in Tesla was the top individual detractor to returns.
The overall uncertain economic environment and challenges of inflation are very real concerns. The fund’s managers believe it is well-positioned for the road ahead and continue to focus on capital appreciation and selecting companies best suited for this challenging economic environment. Portfolio managers remain confident their time-tested investment approach, based on thorough research and robust debate with an eye on valuation, can continue to deliver superior outcomes for investors over the long-term.
8 American Funds Insurance Series
Table of Contents
Growth Fund (continued)
How a hypothetical $10,000 investment has grown
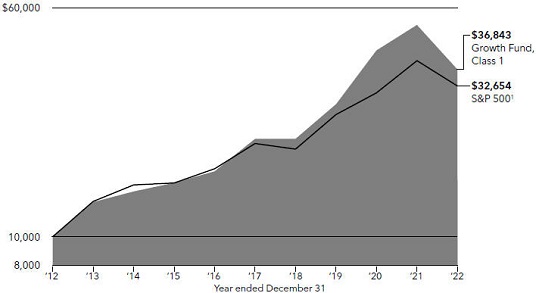
Total returns based on a $1,000 investment For periods ended December 31, 20222
| 1 year | 5 years | 10 years | Lifetime (since February 8, 1984) | Expense ratio | ||||||||||||||||
Class 1 | –29.75 | % | 11.42 | % | 13.93 | % | 12.65 | % | 0.34 | % | ||||||||||
Class 1A | –29.93 | 11.14 | 13.65 | 12.37 | 0.59 | |||||||||||||||
Class 2 | –29.94 | 11.14 | 13.64 | 12.37 | 0.59 | |||||||||||||||
Class 3 | –29.89 | 11.22 | 13.72 | 12.45 | 0.52 | |||||||||||||||
Class 4 | –30.11 | 10.86 | 13.38 | 12.09 | 0.84 | |||||||||||||||
Investment results assume all distributions are reinvested and reflect applicable fees and expenses. When applicable, investment results reflect fee waivers and/or expense reimbursements, without which results would have been lower. Visit capitalgroup.com/afis for more information. Expense ratios are as of the fund’s prospectus dated May 1, 2023 (unaudited). Refer to the Financial Highlights table in this report for details.
Past results are not predictive of results in future periods.
Any market index shown is unmanaged and, therefore, has no expenses. Investors cannot invest directly in an index.
| 1 | Source: S&P Dow Jones Indices LLC. |
| 2 | Periods greater than one year are annualized. |
| Where the fund’s assets were invested as of December 31, 2022 | Percent of net assets |
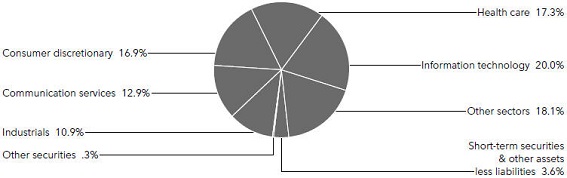
American Funds Insurance Series 9
Table of Contents
International Fund
Fund results shown are for past periods and are not predictive of results for future periods. Current and future results may be lower or higher than those shown. Prices and returns will vary, so investors may lose money. Investing for short periods makes losses more likely. For current information and month-end results, visit capitalgroup.com/afis. For information about your insurance contract and month-end results, go to the website of the company that issued your contract.
International Fund declined 20.57% for the 12 months ended December 31, 2022. Its benchmark index, MSCI ACWI (All Country World Index) ex USA,¹ a free float-adjusted market capitalization-weighted index that is designed to measure equity market results in the global developed and emerging markets (consisting of more than 40 developed and emerging market country indexes, excluding the U.S.), fell 16.00%.
Global stocks fell sharply, pressured by rising interest rates, slowing economic growth and inflationary pressures not seen since the 1980s. The war in Ukraine also weighed on investors throughout the year. Several key benchmark indexes fell into bear market territory at times and all but one sector declined in the MSCI All Country World Index. Within that index, communication services, consumer discretionary and information technology stocks suffered the biggest losses. Meanwhile, energy stocks surged amid higher oil and gas prices. Late in the year, signs that inflation may have peaked in the U.S., Europe and elsewhere sparked a rally that erased some of the losses.
Within the portfolio, stock selection within the energy sector boosted relative returns. Within individual securities, a higher-than-index position in Petroleo Brasileiro was a top contributor as the stock significantly outpaced the market overall. On the downside, stock selection within the information technology sector dragged on returns. A larger-than-index position in South Korean chipmaker SK Hynix was among the top individual detractors.
Looking ahead, the market continues to focus on global inflation levels as a key determinant for interest-rate and asset-price movement. There are signs that the worst of the inflation surge, due in part to rising oil prices and supply-chain issues during the COVID-19 pandemic, seems to be behind us. However, there is still uncertainty about how wage increases – as seen in many developed markets – could impact the continuation of high inflation. As a result of tighter monetary conditions, economies around the world are seeing growth moderate. Meanwhile, contributors to a turbulent macro environment in 2022, such as the war in Ukraine and U.S.-China tensions, have not subsided. In this uncertain environment, the fund’s managers endeavor to maintain a portfolio with a healthy balance of well-managed companies across sectors.
10 American Funds Insurance Series
Table of Contents
International Fund (continued)
How a hypothetical $10,000 investment has grown
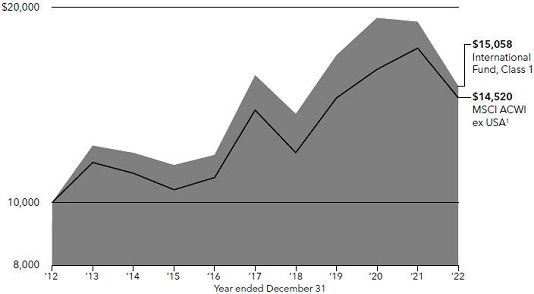
Total returns based on a $1,000 investment For periods ended December 31, 20222
| 1 year | 5 years | 10 years | Lifetime (since May 1, 1990) | Expense ratio | ||||||||||||||||
Class 1 | –20.57 | % | –0.78 | % | 4.18 | % | 7.07 | % | 0.53 | % | ||||||||||
Class 1A | –20.80 | –1.03 | 3.92 | 6.80 | 0.78 | |||||||||||||||
Class 2 | –20.79 | –1.03 | 3.92 | 6.80 | 0.78 | |||||||||||||||
Class 3 | –20.76 | –0.97 | 3.98 | 6.87 | 0.71 | |||||||||||||||
Class 4 | –21.02 | –1.29 | 3.67 | 6.54 | 1.03 | |||||||||||||||
Investment results assume all distributions are reinvested and reflect applicable fees and expenses. When applicable, investment results reflect fee waivers and/or expense reimbursements, without which results would have been lower. Visit capitalgroup.com/afis for more information. Expense ratios are restated to reflect current fees and are as of the fund’s prospectus dated May 1, 2023 (unaudited). Refer to the Financial Highlights table in this report for details.
Past results are not predictive of results in future periods.
Any market index shown is unmanaged and, therefore, has no expenses. Investors cannot invest directly in an index.
| 1 | Source: MSCI. The MSCI index result reflects dividends net of withholding taxes and reinvestment of distributions. |
| 2 | Periods greater than one year are annualized. |
Where the fund’s assets were invested as of December 31, 2022 | Percent of net assets |
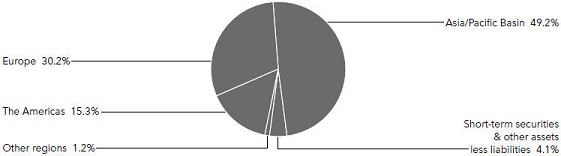
American Funds Insurance Series 11
Table of Contents
New World Fund®
Fund results shown are for past periods and are not predictive of results for future periods. Current and future results may be lower or higher than those shown. Prices and returns will vary, so investors may lose money. Investing for short periods makes losses more likely. For current information and month-end results, visit capitalgroup.com/afis. For information about your insurance contract and month-end results, go to the website of the company that issued your contract.
New World Fund was down 21.86% for the 12 months ended December 31, 2022. Its benchmark index, MSCI ACWI (All Country World Index),¹ a free float-adjusted market capitalization-weighted index that is designed to measure equity market results in the global developed and emerging markets (consisting of more than 40 developed and emerging market country indexes), declined 18.36%. The MSCI Emerging Markets (EM) Index,¹ a free float-adjusted market capitalization-weighted index that is designed to measure equity market results in the global emerging markets (consisting of more than 20 emerging market country indexes), fell by 20.09%.
Global stocks fell sharply, pressured by rising interest rates, slowing economic growth and inflationary pressures not seen since the 1980s. The war in Ukraine also weighed on investors throughout the year. Several key benchmark indexes fell into bear market territory at times and all but one sector declined in the MSCI All Country World Index. Within that index, communication services, consumer discretionary and information technology stocks suffered the biggest losses. Meanwhile, energy stocks surged amid higher oil and gas prices. Late in the year, signs that inflation may have peaked in the U.S., Europe and elsewhere sparked a rally that erased some of the losses.
Emerging markets stocks tumbled, undercut by China’s economic slowdown, the Federal Reserve’s aggressive interest rate hikes and the growing strength of the U.S. dollar. Rising inflation in developing countries that spurred monetary tightening, as well as rolling lockdowns in China to suppress COVID-19, also weighed on equity prices. However, a few countries, including Brazil, were able to separate from the group by benefiting from some stronger fundamentals.
Within the portfolio, a higher-than-benchmark position in the materials sector was beneficial to the fund’s relative returns. Brazilian mining company Vale was a top individual contributor, as its stock saw returns that outpaced the broader market. Indian energy company Reliance Industries was also a relative contributor. On the downside, stock selection within the health care sector dragged on relative returns. Among individual securities, a larger-than-benchmark position in Singapore-based Sea Ltd. was a top detractor to results.
The investment environment has become much more challenging over the last year, with a wide range of uncertainties affecting equity prices – including global shifts in monetary policy, elevated geopolitical tensions and the potential for widespread recession. The portfolio managers believe the fund’s flexibility in seeking investments in both the developed world and emerging markets will provide significant opportunities in these periods of volatility. They remain confident that on-the-ground research, a cornerstone of their investment process, will provide highly differentiated investment insights leading to potentially superior outcomes over the long term.
12 American Funds Insurance Series
Table of Contents
New World Fund® (continued)
How a hypothetical $10,000 investment has grown
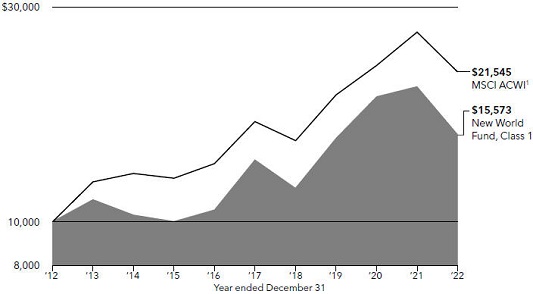
Total returns based on a $1,000 investment For periods ended December 31, 20222
| 1 year | 5 years | 10 years | Lifetime (since June 17, 1999) | Gross expense ratio | Net expense ratio | |||||||||||||||||||
Class 1 | –21.86 | % | 2.58 | % | 4.53 | % | 7.45 | % | 0.64 | % | 0.57 | % | ||||||||||||
Class 1A | –22.09 | 2.32 | 4.27 | 7.18 | 0.89 | 0.82 | ||||||||||||||||||
Class 2 | –22.10 | 2.32 | 4.27 | 7.18 | 0.89 | 0.82 | ||||||||||||||||||
Class 4 | –22.25 | 2.07 | 4.02 | 6.92 | 1.14 | 1.07 | ||||||||||||||||||
Investment results assume all distributions are reinvested and reflect applicable fees and expenses. The investment adviser is currently waiving a portion of its management fee. This waiver will be in effect through at least May 1, 2023. The waiver may only be modified or terminated with the approval of the fund’s board. Net expense ratios reflect the waiver, without which they would have been higher. When applicable, investment results reflect fee waivers and/or expense reimbursements, without which results would have been lower. Visit capitalgroup.com/afis for more information. Expense ratios are restated to reflect current fees and are as of the fund’s prospectus dated May 1, 2023 (unaudited). Refer to the Financial Highlights table in this report for details.
Past results are not predictive of results in future periods.
Any market index shown is unmanaged and, therefore, has no expenses. Investors cannot invest directly in an index.
| 1 | Source: MSCI. The MSCI index result reflects dividends net of withholding taxes and reinvestment of distributions. |
| 2 | Periods greater than one year are annualized. |
Where the fund’s assets were invested as of December 31, 2022 | Percent of net assets |
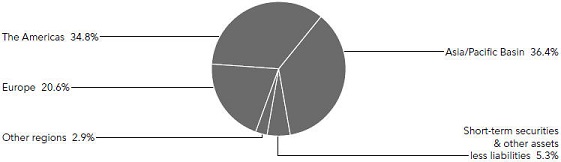
American Funds Insurance Series 13
Table of Contents
Washington Mutual Investors Fund
Fund results shown are for past periods and are not predictive of results for future periods. Current and future results may be lower or higher than those shown. Prices and returns will vary, so investors may lose money. Investing for short periods makes losses more likely. For current information and month-end results, visit capitalgroup.com/afis. For information about your insurance contract and month-end results, go to the website of the company that issued your contract.
Washington Mutual Investors Fund declined 8.28% for the 12 months ended December 31, 2022. Its benchmark index, S&P 500 Index,¹ a market capitalization-weighted index based on the results of approximately 500 widely held common stocks, fell by 18.11%.
U.S. equities had their worst year since 2008, as persistently high inflation and aggressive rate hikes stoked recession fears. S&P 500 Index entered its first bear market since 2020. Energy was the top S&P 500 sector for the second straight year, climbing 66%. Crude oil prices spiked in March after Russia’s invasion of Ukraine upended global oil flows. Growth stocks had the sharpest declines, including several tech giants that had been market leaders over the last decade. Despite consecutive quarters of negative gross domestic product growth in the first half, a strong labor market helped inflation to persist.
Regarding the fund, stock selections in the consumer discretionary and information technology sectors were additive to relative returns. Among individual securities, a higher-than-benchmark position in Unitedhealth Group was a top contributor, as the stock outpaced the broader market. On the downside, security selections within the financials and real estate sectors were top detractors. A lower-than-index position in Exxon Mobil weighed on relative returns as the stock outpaced the market overall.
Looking ahead, the fund’s portfolio managers are keeping a close watch on monetary policy, inflation, and other global issues, along with the resulting implications for the U.S. economy. Portfolio managers continue to favor well-managed, high-quality companies that are capable of paying dividends in myriad economic environments. We remain optimistic that this focus, supported by our global research, will help us to identify attractive long-term investment opportunities.
14 American Funds Insurance Series
Table of Contents
Washington Mutual Investors Fund (continued)
How a hypothetical $10,000 investment has grown
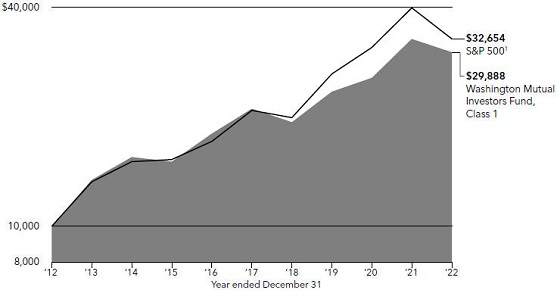
Total returns based on a $1,000 investment For periods ended December 31, 20222
| 1 year | 5 years | 10 years | Lifetime (since July 5,2001) | Gross expense ratio | Net expense ratio | |||||||||||||||||||
Class 1 | –8.28 | % | 7.37 | % | 11.57 | % | 6.97 | % | 0.40 | % | 0.25 | % | ||||||||||||
Class 1A | –8.45 | 7.11 | 11.30 | 6.71 | 0.65 | 0.50 | ||||||||||||||||||
Class 2 | –8.45 | 7.11 | 11.30 | 6.70 | 0.65 | 0.50 | ||||||||||||||||||
Class 4 | –8.69 | 6.84 | 11.08 | 6.47 | 0.90 | 0.75 | ||||||||||||||||||
Investment results assume all distributions are reinvested and reflect applicable fees and expenses. The investment adviser is currently waiving a portion of its management fee. This waiver will be in effect through at least May 1, 2023. The waiver may only be modified or terminated with the approval of the fund’s board. Net expense ratios reflect the waiver, without which they would have been higher. When applicable, investment results reflect fee waivers and/or expense reimbursements, without which results would have been lower. Visit capitalgroup.com/afis for more information. Expense ratios are restated to reflect current fees and are as of the fund’s prospectus dated May 1, 2023 (unaudited). Refer to the Financial Highlights table in this report for details.
Past results are not predictive of results in future periods.
Any market index shown is unmanaged and, therefore, has no expenses. Investors cannot invest directly in an index.
| 1 | Source: S&P Dow Jones Indices LLC. |
| 2 | Periods greater than one year are annualized. |
Where the fund’s assets were invested as of December 31, 2022 | Percent of net assets |
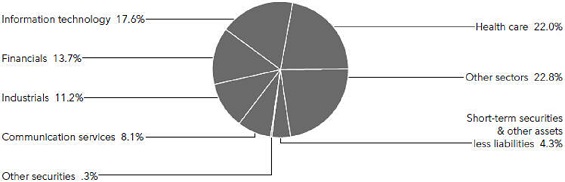
American Funds Insurance Series 15
Table of Contents
Capital World Growth and Income Fund®
Fund results shown are for past periods and are not predictive of results for future periods. Current and future results may be lower or higher than those shown. Prices and returns will vary, so investors may lose money. Investing for short periods makes losses more likely. For current information and month-end results, visit capitalgroup.com/afis. For information about your insurance contract and month-end results, go to the website of the company that issued your contract.
Capital World Growth and Income Fund declined 17.13% for the 12 months ended December 31, 2022, compared with a decline of 18.36% in its benchmark index, MSCI ACWI (All Country World Index),¹ a free float-adjusted market capitalization-weighted index that is designed to measure equity market results in the global developed and emerging markets, consisting of more than 40 developed and emerging market country indexes.
Global stocks fell sharply, pressured by rising interest rates, slowing economic growth and inflationary pressures not seen since the 1980s. The war in Ukraine also weighed on investors throughout the year. Several key benchmark indexes fell into bear market territory at times and all but one sector declined in the MSCI All Country World Index. Within that index, communication services, consumer discretionary and information technology stocks suffered the biggest losses. Meanwhile, energy stocks surged amid higher oil and gas prices. Late in the year, signs that inflation may have peaked in the U.S., Europe and elsewhere sparked a rally that erased some of the losses.
Within the portfolio, a higher-than-index position and stock selection within the materials sector was a top contributor to relative returns. Results were also buoyed by holdings in Vale, a Brazil-based mining company, which saw returns over the period that outpaced the broader market. On the downside, stock selection within the communication services and financials sectors were among the top detractors to returns. A position in Sberbank Russia weighed on returns as the stock saw sharp declines due to Russia’s invasion of Ukraine and related consequences.
On a geographical basis, stocks domiciled in the United States and Brazil contributed the most to relative returns, while holdings in Japan and Russia dragged.
Looking ahead, the market continues to focus on global inflation levels as a key determinant for interest-rate and asset-price movement. There are signs that the worst of the inflation surge, due in part to rising oil prices and supply-chain issues during the COVID-19 pandemic, seems to be behind us. However, there is still uncertainty about how wage increases – as seen in many developed markets – could impact the continuation of high inflation. As a result of tighter monetary conditions, economies around the world are seeing growth moderate. Meanwhile, contributors to a turbulent macro environment in 2022, such as the war in Ukraine and U.S.-China tensions, have not subsided. Against this uncertainty, the fund’s managers remain committed to finding companies that can grow regardless of macro environment and investing in those that have shown a strong tendency to pay a dividend through difficult economic conditions.
16 American Funds Insurance Series
Table of Contents
Capital World Growth and Income Fund® (continued)
How a hypothetical $10,000 investment has grown
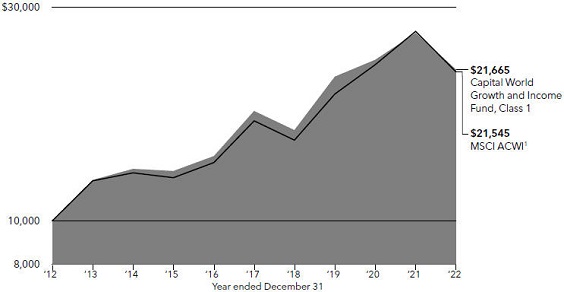
Total returns based on a $1,000 investment For periods ended December 31, 20222
| 1 year | 5 years | 10 years | Lifetime (since May 1, 2006) | Gross expense ratio | Net expense ratio | |||||||||||||||||||
Class 1 | –17.13 | % | 4.36 | % | 8.04 | % | 6.40 | % | 0.53 | % | 0.42 | % | ||||||||||||
Class 1A | –17.29 | 4.10 | 7.79 | 6.15 | 0.78 | 0.67 | ||||||||||||||||||
Class 2 | –17.33 | 4.10 | 7.77 | 6.14 | 0.78 | 0.67 | ||||||||||||||||||
Class 4 | –17.57 | 3.83 | 7.53 | 5.89 | 1.03 | 0.92 | ||||||||||||||||||
Investment results assume all distributions are reinvested and reflect applicable fees and expenses. The investment adviser is currently waiving a portion of its management fee. This waiver will be in effect through at least May 1, 2023. The waiver may only be modified or terminated with the approval of the fund’s board. Net expense ratios reflect the waiver, without which they would have been higher. When applicable, investment results reflect fee waivers and/or expense reimbursements, without which results would have been lower. Visit capitalgroup.com/afis for more information. Expense ratios are restated to reflect current fees and are as of the fund’s prospectus dated May 1, 2023 (unaudited). Refer to the Financial Highlights table in this report for details.
Past results are not predictive of results in future periods.
Any market index shown is unmanaged and, therefore, has no expenses. Investors cannot invest directly in an index.
| 1 | Source: MSCI. The MSCI index results reflect dividends net of withholding taxes and reinvestment of distributions. |
| 2 | Periods greater than one year are annualized. |
Where the fund’s assets were invested as of December 31, 2022 | Percent of net assets |
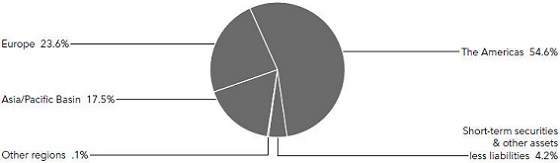
American Funds Insurance Series 17
Table of Contents
Growth-Income Fund
Fund results shown are for past periods and are not predictive of results for future periods. Current and future results may be lower or higher than those shown. Prices and returns will vary, so investors may lose money. Investing for short periods makes losses more likely. For current information and month-end results, visit capitalgroup.com/afis. For information about your insurance contract and month-end results, go to the website of the company that issued your contract.
Growth-Income Fund fell 16.28% for the 12 months ended December 31, 2022, compared with a decline of 18.11% in its benchmark index, S&P 500 Index,¹ a market capitalization-weighted index based on the results of approximately 500 widely held common stocks.
U.S. equities had their worst year since 2008, as persistently high inflation and aggressive rate hikes stoked recession fears. The S&P 500 entered its first bear market since 2020. Energy was the top S&P 500 sector for the second straight year, climbing 66%. Crude oil prices spiked in March after Russia’s invasion of Ukraine upended global oil flows. Growth stocks had the sharpest declines, including several tech giants that had been market leaders over the last decade. Despite consecutive quarters of negative gross domestic product growth in the first half, a strong labor market helped inflation to persist.
Regarding the fund, investments within the information technology and industrials sectors were top contributors to the fund’s relative returns. An out-of-benchmark position in energy company Canadian Natural Resources was a top individual contributor, as the stock outpaced the market overall. On the downside, security selections within the communications and financials sectors dragged on portfolio returns. Netflix was the fund’s top individual detractor owing to a larger-than-benchmark position and returns that lagged the market overall.
Looking ahead, uncertainty in the macroeconomic outlook and in the trajectory of inflation and interest rates will likely continue. Stock valuations have started to come down to reflect investor concerns, although corporate earnings outlooks may not have bottomed. The fund’s portfolio managers will take advantage of volatility to build positions in companies and stocks in which they see long term value. The current environment should provide opportunities for finding investments with attractive risk-adjusted return potential.
18 American Funds Insurance Series
Table of Contents
Growth-Income Fund (continued)
How a hypothetical $ $10,000 investment has grown
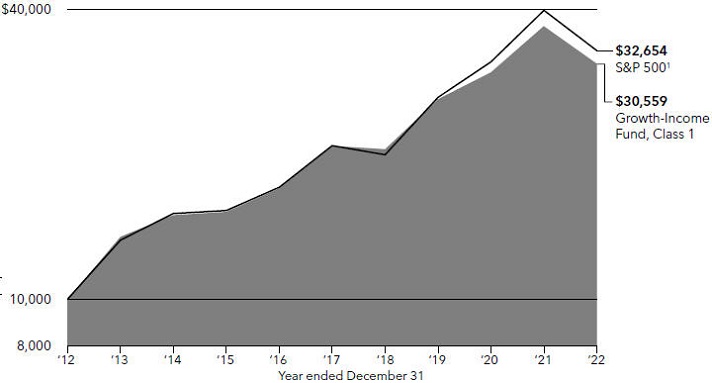
Total returns based on a $1,000 investment For periods ended December 31, 20222
| 1 year | 5 years | 10 years | Lifetime (since February 8, 1984) | Expense ratio | ||||||||||||||||
Class 1 | –16.28 | % | 8.09 | % | 11.82 | % | 11.01 | % | 0.28 | % | ||||||||||
Class 1A | –16.48 | 7.83 | 11.55 | 10.74 | 0.53 | |||||||||||||||
Class 2 | –16.50 | 7.83 | 11.54 | 10.74 | 0.53 | |||||||||||||||
Class 3 | –16.43 | 7.91 | 11.62 | 10.82 | 0.46 | |||||||||||||||
Class 4 | –16.70 | 7.56 | 11.28 | 10.47 | 0.78 | |||||||||||||||
Investment results assume all distributions are reinvested and reflect applicable fees and expenses. When applicable, investment results reflect fee waivers and/or expense reimbursements, without which results would have been lower. Visit capitalgroup.com/afis for more information. Expense ratios are as of the fund’s prospectus dated May 1, 2023 (unaudited). Refer to the Financial Highlights table in this report for details.
Past results are not predictive of results in future periods.
Any market index shown is unmanaged and, therefore, has no expenses. Investors cannot invest directly in an index.
| 1 | Source: S&P Dow Jones Indices LLC. |
| 2 | Periods greater than one year are annualized. |
| Where the fund’s assets were invested as of December 31, 2022 | Percent of net assets |
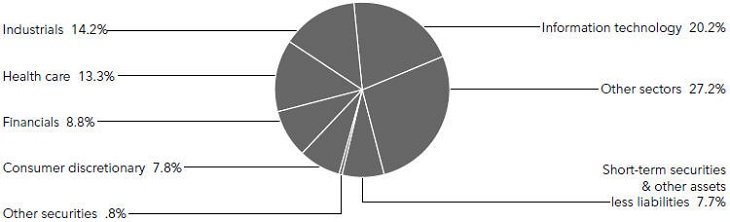
American Funds Insurance Series 19
Table of Contents
International Growth and Income Fund
Fund results shown are for past periods and are not predictive of results for future periods. Current and future results may be lower or higher than those shown. Prices and returns will vary, so investors may lose money. Investing for short periods makes losses more likely. For current information and month-end results, visit capitalgroup.com/afis. For information about your insurance contract and month-end results, go to the website of the company that issued your contract.
International Growth and Income Fund fell 15.00% for the 12 months ended December 31, 2022, compared with a decline of 16.00% in its benchmark index, MSCI ACWI (All Country World Index) ex USA,¹ a free float-adjusted market capitalization-weighted index that is designed to measure equity market results in the global developed and emerging markets (consisting of more than 40 developed and emerging market country indexes excluding the U.S.).
Global stocks fell sharply, pressured by rising interest rates, slowing economic growth and inflationary pressures not seen since the 1980s. The war in Ukraine also weighed on investors throughout the year. Several key benchmark indexes fell into bear market territory at times and all but one sector declined in the MSCI All Country World Index. Within that index, communication services, consumer discretionary and information technology stocks suffered the biggest losses. Meanwhile, energy stocks surged amid higher oil and gas prices. Late in the year, signs that inflation may have peaked in the U.S., Europe and elsewhere sparked a rally that erased some of the losses.
Regarding the fund, stock selections within the consumer discretionary and consumer staples sectors were additive to relative results. Within individual securities, British American Tobacco was a top contributor owing to returns that outpaced the broader market. On the downside, security selections within the financials and energy sectors detracted from returns. Positions in Russian firms Sberbank and Gazprom were among the top individual detractors as their stocks saw declines due to the Russian invasion of Ukraine and related consequences.
The new year looks to continue current macroeconomic uncertainty and trends stemming from shifting monetary policies and geopolitical tensions around the world. In this environment, valuations remain depressed, particularly outside the United States. The fund’s managers continue to focus on businesses they believe will provide good value over the long-term, as guided by the fundamental, global research that underpins investment decisions.
20 American Funds Insurance Series
Table of Contents
International Growth and Income Fund (continued)
How a hypothetical $10,000 investment has grown
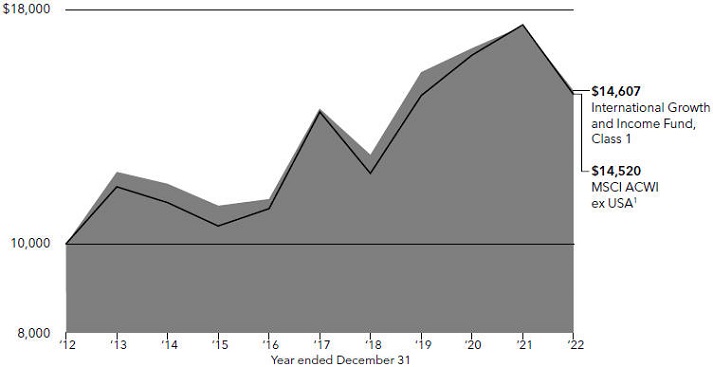
Total returns based on a $1,000 investment For periods ended December 31, 20222
| 1 year | 5 years | 10 years | Lifetime (since November 18, 2008) | Expense ratio | ||||||||||||||||
Class 1 | –15.00 | % | 0.88 | % | 3.86 | % | 6.91 | % | 0.55 | % | ||||||||||
Class 1A | –15.31 | 0.61 | 3.60 | 6.64 | 0.80 | |||||||||||||||
Class 2 | –15.25 | 0.62 | 3.60 | 6.64 | 0.80 | |||||||||||||||
Class 4 | –15.52 | 0.35 | 3.37 | 6.40 | 1.05 | |||||||||||||||
Investment results assume all distributions are reinvested and reflect applicable fees and expenses. The investment adviser is currently waiving a portion of its management fee. This waiver will be in effect through at least May 1, 2023. The waiver may only be modified or terminated with the approval of the fund’s board. When applicable, investment results reflect fee waivers and/or expense reimbursements, without which results would have been lower. Visit capitalgroup.com/afis for more information. Expense ratios are restated to reflect current fees and are as of the fund’s prospectus dated May 1, 2023 (unaudited). Refer to the Financial Highlights table in this report for details.
Past results are not predictive of results in future periods.
Any market index shown is unmanaged and, therefore, has no expenses. Investors cannot invest directly in an index.
| 1 | Source: MSCI. The MSCI index result reflects dividends net of withholding taxes and reinvestment of distributions. |
| 2 | Periods greater than one year are annualized. |
| Where the fund’s assets were invested as of December 31, 2022 | Percent of net assets |
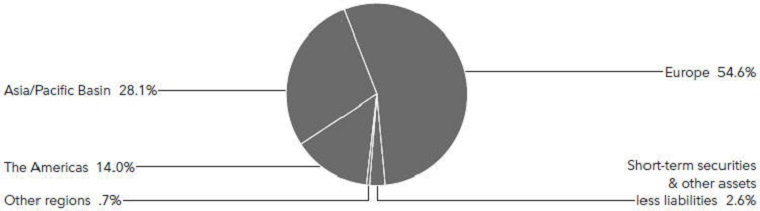
American Funds Insurance Series 21
Table of Contents
Capital Income Builder®
Fund results shown are for past periods and are not predictive of results for future periods. Current and future results may be lower or higher than those shown. Prices and returns will vary, so investors may lose money. Investing for short periods makes losses more likely. For current information and month-end results, visit capitalgroup.com/afis. For information about your insurance contract and month-end results, go to the website of the company that issued your contract.
Capital Income Builder, which invests in a mix of stocks and bonds, declined 6.90% for the 12 months ended December 31, 2022. During the same period, the index blend of 70%/30% MSCI ACWI (All Country World Index)/Bloomberg U.S. Aggregate Index¹ fell 16.59%. MSCI ACWI,² a free float-adjusted market capitalization-weighted index that is designed to measure equity market results in the global developed and emerging markets (consisting of more than 40 developed and emerging market country indexes), fell 18.36%. The Bloomberg U.S. Aggregate Index,³ which represents the U.S. investment-grade (rated BBB/Baa and above) fixed-rate bond market, fell 13.01%.
Global stocks fell sharply, pressured by rising interest rates, slowing economic growth and inflationary pressures not seen since the 1980s. The war in Ukraine also weighed on investors throughout the year. Several key benchmark indexes fell into bear market territory at times and all but one sector declined in the MSCI All Country World Index. Within that index, communication services, consumer discretionary and information technology stocks suffered the biggest losses. Meanwhile, energy stocks surged amid higher oil and gas prices. Late in the year, signs that inflation may have peaked in the U.S., Europe and elsewhere sparked a rally that erased some of the losses.
U.S. fixed income markets fell across the board. The Federal Reserve raised the federal funds rate by 425 basis points from near zero to counter the highest inflation since the 1980s. U.S. Treasury yields rose across the curve, which ended the year inverted as shorter dated bonds sold off sharply.
The overall portfolio has protected the absolute downside for investors. In the equity portfolio, stock selection in consumer staples was a top contributor to relative returns. Investment in aerospace, within the industrials sector, was also additive, as was a position in the energy sector. On the downside, stock selection within financials detracted from returns. Overall, dividend-paying companies have done better than the broader market.
The fund’s fixed income portfolio outpaced its benchmark and was additive to relative returns overall. Duration positioning within the portfolio was a primary driver of returns, while curve positioning and security selection detracted.
The fund’s portfolio managers are cautious given the impact of a potential U.S. recession on earnings and dividends, but also aware that markets tend to bottom three to six months ahead of a recession and are therefore ready to revisit early cyclical investment ideas. With the strength of the U.S. dollar reversing, we believe the fund’s exposure to global markets is well-positioned. The fund also remains well-positioned to use its geographic flexibility to pursue dividend-paying investment opportunities around the world. Fund managers remain loyal to the fund’s objective and optimistic about the companies with growing dividends that were selected for this portfolio through fundamental, bottom-up security selection.
22 American Funds Insurance Series
Table of Contents
Capital Income Builder® (continued)
How a hypothetical $10,000 investment has grown
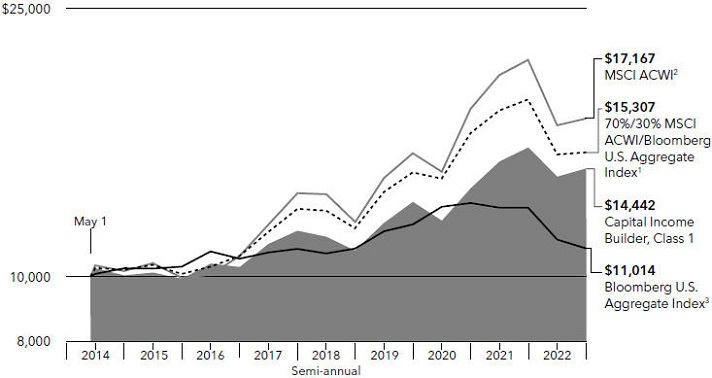
Total returns based on a $1,000 investment For periods ended December 31, 20224
| 1 year | 5 years | Lifetime (since May 1, 2014) | Gross expense ratio | Net expense ratio | ||||||||||||||||
Class 1 | –6.90 | % | 4.35 | % | 4.33 | % | 0.41 | % | 0.27 | % | ||||||||||
Class 1A | –7.06 | 4.10 | 4.08 | 0.66 | 0.52 | |||||||||||||||
Class 2 | –7.13 | 4.09 | 4.14 | 0.66 | 0.52 | |||||||||||||||
Class 4 | –7.37 | 3.83 | 3.81 | 0.91 | 0.77 | |||||||||||||||
Investment results assume all distributions are reinvested and reflect applicable fees and expenses. The investment adviser is currently waiving a portion of its management fee. This waiver will be in effect through at least May 1, 2023. The waiver may only be modified or terminated with the approval of the fund’s board. Net expense ratios reflect the waiver, without which they would have been higher. When applicable, investment results reflect fee waivers and/or expense reimbursements, without which results would have been lower. Visit capitalgroup.com/afis for more information. Expense ratios are restated to reflect current fees and are as of the fund’s prospectus dated May 1, 2023 (unaudited). Refer to the Financial Highlights table in this report for details.
Past results are not predictive of results in future periods.
Any market index shown is unmanaged and, therefore, has no expenses. Investors cannot invest directly in an index.
| 1 | Data sources: MSCI and Bloomberg Index Services Ltd. 70%/30% MSCI ACWI/Bloomberg U.S. Aggregate Index blends the MSCI ACWI (All Country World Index) with the Bloomberg U.S. Aggregate Index by weighting their total returns at 70% and 30%, respectively. Its result assumes the blend is rebalanced monthly. |
| 2 | Source: MSCI. The MSCI index result reflects dividends net of withholding taxes and reinvestment of distributions. |
| 3 | Source: Bloomberg Index Services Ltd. |
| 4 | Periods greater than one year are annualized. |
| Where the fund’s assets were invested as of December 31, 2022 | Percent of net assets |
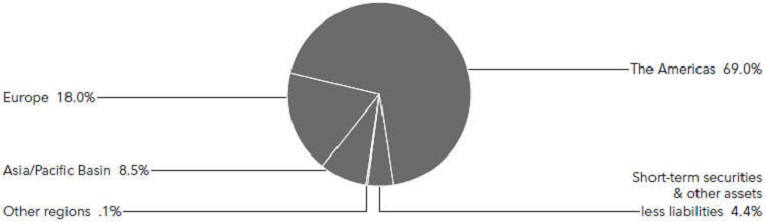
American Funds Insurance Series 23
Table of Contents
Asset Allocation Fund
Fund results shown are for past periods and are not predictive of results for future periods. Current and future results may be lower or higher than those shown. Prices and returns will vary, so investors may lose money. Investing for short periods makes losses more likely. For current information and month-end results, visit capitalgroup.com/afis. For information about your insurance contract and month-end results, go to the website of the company that issued your contract.
Asset Allocation Fund, which is a mix of stocks and bonds, fell 13.19% for the 12 months ended December 31, 2022. During the same period, the index blend of 60%/40% S&P 500 Index/Bloomberg U.S. Aggregate Index¹ declined 15.79%. S&P 500 Index,² a market capitalization-weighted index based on the results of approximately 500 widely held common stocks, was down 18.11%, while the Bloomberg U.S. Aggregate Index,³ which represents the U.S. investment-grade (rated BBB/Baa and above) fixed-rate bond market, fell by 13.01%.
U.S. equities had their worst year since 2008, as persistently high inflation and aggressive rate hikes stoked recession fears. The S&P 500 entered its first bear market since 2020. Energy was the top S&P 500 sector for the second straight year, climbing 66%. Crude oil prices spiked in March after Russia’s invasion of Ukraine upended global oil flows. Growth stocks had the sharpest declines, including several tech giants that had been market leaders over the last decade. Despite consecutive quarters of negative gross domestic product growth in the first half, a strong labor market helped inflation to persist.
U.S. fixed income markets fell across the board. The Federal Reserve raised the federal funds rate by 425 basis points from near zero to counter the highest inflation since the 1980s. U.S. Treasury yields rose across the curve, and ended the year inverted as shorter dated bonds sold off sharply.
In the equity portfolio, investment selection within the consumer discretionary sector was the top contributor to relative returns on a sector basis. Results were buoyed by an off-benchmark holding in food services company Aramark and a higher-than-index position in Philip Morris, which saw returns that significantly outpaced the market overall. On the downside, stock selections within the energy and financials sectors weighed on relative returns. Within energy, Exxon Mobil – which the fund did not hold – weighed on relative results as its stock outpaced the broader market. A higher-than-benchmark holding in Charter Communications was among the top individual detractors, as returns lagged the broader market.
The fund’s fixed income investments were additive to relative returns overall. Duration positioning within Treasuries and mortgage-backed securities (MBS) contributed positively to results. Sector and security selections detracted. An out-of-benchmark position within U.S. Treasury Inflation-Protected Securities (TIPS) also weighed on returns.
In the wake of market selloffs and rotations like the one seen in 2022, opportunities often abound for the long-term investor. Fund managers note that many sound companies with outstanding long-term prospects are trading at attractive valuations because the market is focused on the short term. Managers are focused on differentiating between companies whose fundamental outlook has changed versus those facing more transient issues, and where valuations are attractive. In addition, their portfolios are balanced across a broad array of cyclical and market exposures.
24 American Funds Insurance Series
Table of Contents
Asset Allocation Fund (continued)
How a hypothetical $10,000 investment has grown
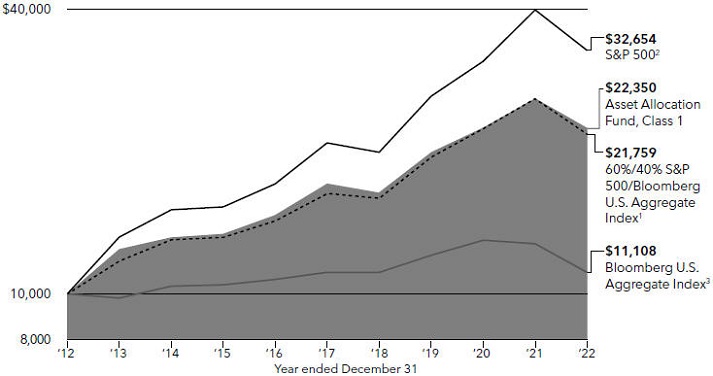
Total returns based on a $1,000 investment For periods ended December 31, 20224
| 1 year | 5 years | 10 years | Lifetime (since August 1,1989) | Expense ratio | ||||||||||||||||
Class 1 | –13.19 | % | 5.59 | % | 8.37 | % | 8.22 | % | 0.30 | % | ||||||||||
Class 1A | –13.43 | 5.32 | 8.11 | 7.95 | 0.55 | |||||||||||||||
Class 2 | –13.41 | 5.33 | 8.10 | 7.95 | 0.55 | |||||||||||||||
Class 3 | –13.37 | 5.40 | 8.18 | 8.03 | 0.48 | |||||||||||||||
Class 4 | –13.66 | 5.06 | 7.87 | 7.69 | 0.80 | |||||||||||||||
Investment results assume all distributions are reinvested and reflect applicable fees and expenses. When applicable, investment results reflect fee waivers and/or expense reimbursements, without which results would have been lower. Visit capitalgroup.com/afis for more information. Expense ratios are as of the fund’s prospectus dated May 1, 2023 (unaudited). Refer to the Financial Highlights table in this report for details.
Past results are not predictive of results in future periods.
Any market index shown is unmanaged and, therefore, has no expenses. Investors cannot invest directly in an index.
| 1 | Data sources: Bloomberg Index Services Ltd. and S&P Dow Jones Indices LLC. 60%/40% S&P 500 Index/Bloomberg U.S. Aggregate Index blends the S&P 500 with the Bloomberg U.S. Aggregate Index by weighting their total returns at 60% and 40%, respectively. Its result assumes the blend is rebalanced monthly. |
| 2 | Source: S&P Dow Jones Indices LLC. |
| 3 | Source: Bloomberg Index Services Ltd. |
| 4 | Periods greater than one year are annualized. |
| Where the fund’s assets were invested as of December 31, 2022 | Percent of net assets |
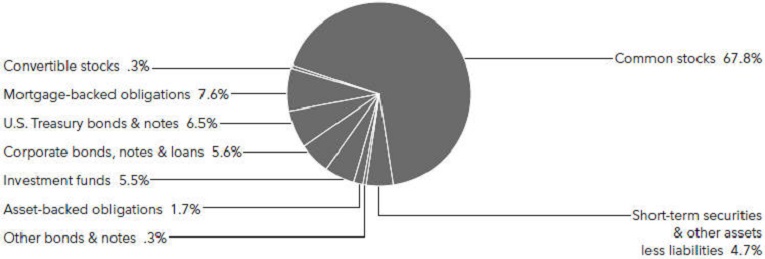
American Funds Insurance Series 25
Table of Contents
American Funds® Global Balanced Fund
Fund results shown are for past periods and are not predictive of results for future periods. Current and future results may be lower or higher than those shown. Prices and returns will vary, so investors may lose money. Investing for short periods makes losses more likely. For current information and month-end results, visit capitalgroup.com/afis. For information about your insurance contract and month-end results, go to the website of the company that issued your contract.
American Funds Global Balanced Fund declined 14.33% for the 12 months ended December 31, 2022. Over the same period, the fund’s index blend of 60%/40% MSCI ACWI (All Country World Index)/Bloomberg Global Aggregate Index¹ fell 17.33%. MSCI ACWI,² a free float-adjusted market capitalization-weighted index that is designed to measure equity market results in the global developed and emerging markets (consisting of more than 40 developed and emerging market country indexes), was down 18.36%, while the Bloomberg Global Aggregate Index,³ a measure of global investment-grade bonds (rated BBB/Baa and above), declined 16.25%.
Global stocks fell sharply, pressured by rising interest rates, slowing economic growth and inflationary pressures not seen since the 1980s. The war in Ukraine also weighed on investors throughout the year. Several key benchmark indexes fell into bear market territory at times and all but one sector declined in the MSCI ACWI. Within that index, communication services, consumer discretionary and information technology stocks suffered the biggest losses. Meanwhile, energy stocks surged amid higher oil and gas prices. Late in the year, signs that inflation may have peaked in the U.S., Europe and elsewhere sparked a rally that erased some of the losses. Bonds fell in the face of rising inflation, and the Federal Reserve hiked its policy rate 425 basis points over seven policy meetings in an attempt to tame it. The Bloomberg U.S. Treasury Index4 lost 12.46% in one of the worst bond market declines in history. The Federal Reserve and European Central Bank, among others, aggressively raised interest rates in an attempt to bring inflation back to a target of roughly 2%, down from 7% to 10% in many economies.
The fund declined overall but outpaced its primary benchmark index. Within the equity portfolio, stock selection in the communication services sector was a top contributor to relative results. A lower-than-benchmark position in Amazon was additive to portfolio relative returns as the stock lagged the market overall. On the downside, stock selection within the materials sector weighed on returns. A higher-than-benchmark holding in Home Depot was a top detractor among individual stocks. The fund’s fixed income investments detracted from relative results. A small exposure to Russian bonds weighed on relative returns, while overall sector selection was positive, owing mostly to holdings in euro-denominated assets.
Investors face an ongoing combination of risks in the year ahead, with likely weak economic growth, high inflation and geopolitical risk continuing. Among stock sectors, fund managers believe sectors such as U.S. utilities and health care may provide attractive investment opportunities as renewable energy incentives and demographic changes are expected to aid growth. They are also closely watching the U.S. dollar, whose strength has weighed on non-U.S. holdings in the portfolio and is expected to remain strong into 2023. The fund’s fixed income portfolio remains cautiously positioned in the current inflationary environment, but managers are confident in the long-term opportunities in bond markets that are now delivering meaningful income for the first time in years. As always, they continue to focus on core principals of global research, individual security selection and bottom-up fundamental analysis to underpin investment decisions.
26 American Funds Insurance Series
Table of Contents
American Funds® Global Balanced Fund (continued)
How a hypothetical $10,000 investment has grown
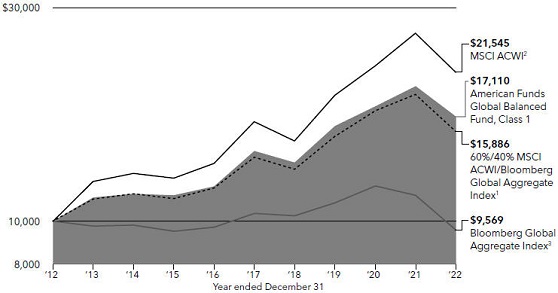
Total returns based on a $1,000 investment For periods ended December 31, 20225
| 1 year | 5 years | 10 years | Lifetime (since May 2, 2011) | Gross expense ratio | Net expense ratio | |||||||||||||||||
Class 1 | –14.33% | 3.65 | % | 5.52 | % | 5.23 | % | 0.51 | % | 0.50 | % | |||||||||||
Class 1A | –14.56 | 3.41 | 5.28 | 4.99 | 0.76 | 0.75 | ||||||||||||||||
Class 2 | –14.56 | 3.40 | 5.25 | 4.97 | 0.76 | 0.75 | ||||||||||||||||
Class 4 | –14.73 | 3.13 | 5.12 | 4.81 | 1.01 | 1.00 | ||||||||||||||||
Investment results assume all distributions are reinvested and reflect applicable fees and expenses. The investment adviser is currently waiving a portion of its management fee. This waiver will be in effect through at least May 1, 2023. The waiver may only be modified or terminated with the approval of the fund’s board. Net expense ratios reflect the waiver, without which they would have been higher. When applicable, investment results reflect fee waivers and/or expense reimbursements, without which results would have been lower. Visit capitalgroup.com/afis for more information. Expense ratios are restated to reflect current fees and are as of the fund’s prospectus dated May 1, 2023 (unaudited). Refer to the Financial Highlights table in this report for details.
Past results are not predictive of results in future periods.
Any market index shown is unmanaged and, therefore, has no expenses. Investors cannot invest directly in an index.
| 1 | Data sources: MSCI and Bloomberg Index Services Ltd. The 60%/40% MSCI ACWI/Bloomberg Global Aggregate Index blends the MSCI ACWI (All Country World Index) with the Bloomberg Global Aggregate Index by weighting their cumulative total returns at 60% and 40%, respectively. Its result assumes the blend is rebalanced monthly. |
| 2 | Source: MSCI. The MSCI index results reflect dividends net of withholding taxes and reinvestment of distributions. |
| 3 | Source: Bloomberg Index Services Ltd. |
| 4 | Source: Bloomberg Index Services Ltd. The Bloomberg U.S. Treasury Index measures the performance of public obligations of the U.S. Treasury. |
| 5 | Periods greater than one year are annualized. |
| Where the fund’s assets were invested as of December 31, 2022 | Percent of net assets |
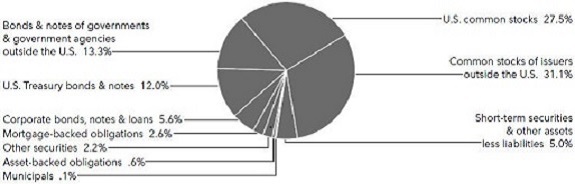
American Funds Insurance Series 27
Table of Contents
The Bond Fund of America®
Fund results shown are for past periods and are not predictive of results for future periods. Current and future results may be lower or higher than those shown. Prices and returns will vary, so investors may lose money. Investing for short periods makes losses more likely. For current information and month-end results, visit capitalgroup.com/afis. For information about your insurance contract and month-end results, go to the website of the company that issued your contract.
The Bond Fund of America declined 12.26% for the 12 months ended December 31, 2022. The fund’s benchmark, Bloomberg U.S. Aggregate Index,¹ which represents the U.S. investment-grade (rated BBB/Baa and above) fixed-rate bond market, was down 13.01%.
U.S. fixed income markets fell across the board. The U.S. Federal Reserve raised the federal funds rate by 425 basis points from near zero to counter the highest inflation since the 1980s. U.S. Treasury yields rose across the curve, which ended the year inverted as shorter dated bonds sold off sharply. The 10-year Treasury yield soared 237 basis points to 3.88%. The Bloomberg U.S. Corporate Investment Grade Index2 returned –15.76%, and spreads widened by 38 basis points. Elsewhere, the Bloomberg U.S. Corporate High Yield 2% Issuer Capped Index3 returned –11.18%, while the Bloomberg Municipal Bond Index4 returned –8.53%.
Over the period, the largest contributions to relative results came from duration positioning and agency mortgage-backed securities (MBS). The fund’s lower-than-benchmark duration helped reduce interest rate sensitivity as rates moved higher and bond prices fell over the period. A lower position in MBS also helped, relative to the benchmark, as spreads widened materially. On the downside, yield curve positioning and a modest position in emerging markets and high-yield bonds detracted from results.
The market and economic environments in 2023 look very different than last year. Inflation appears to have peaked and is on the decline, the Fed has guided to a peak federal funds rate of around 5% to be reached in the first half of 2023, and the market is gearing for an economic slowdown or recession. In response, yields have moved higher and spreads on risky assets have moved wider, making valuations more attractive for fixed income investors.
The fund’s managers have a conservative outlook on the economy and believe that while valuations are more attractive, they do not fully compensate investors for the risk of a deeper economic downturn in the coming year. Managers have added duration, corporate bonds and structured products like agency mortgage-backed securities to effectively eliminate lower-than-benchmark positions but have not moved significantly higher than the benchmark. Interest rate positioning is concentrated in intermediate securities around five-year maturities, which managers believe will benefit the portfolio if inflation and the economy continue to slow and the Fed ends the rate-hike cycle in the first half of 2023.
As the year progresses and managers gain more confidence on either the direction of the economy or valuations, they expect to take more meaningful positions relative to the benchmark. As always, research-driven security selection is expected to be an important driver of future investment results.
28 American Funds Insurance Series
Table of Contents
The Bond Fund of America® (continued)
How a hypothetical $10,000 investment has grown
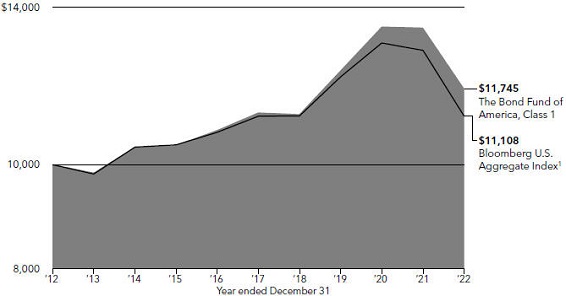
Total returns based on a $1,000 investment For periods ended December 31, 20225
| 1 year | 5 years | 10 years | Lifetime (since January 2, 1996) | Gross expense ratio | Net expense ratio | |||||||||||||||||||
Class 1 | –12.26 | % | 1.02 | % | 1.62 | % | 4.04 | % | 0.38 | % | 0.21 | % | ||||||||||||
Class 1A | –12.49 | 0.78 | 1.37 | 3.79 | 0.63 | 0.46 | ||||||||||||||||||
Class 2 | –12.58 | 0.76 | 1.36 | 3.78 | 0.63 | 0.46 | ||||||||||||||||||
Class 4 | –12.75 | 0.51 | 1.12 | 3.53 | 0.88 | 0.71 | ||||||||||||||||||
Investment results assume all distributions are reinvested and reflect applicable fees and expenses. The investment adviser is currently waiving a portion of its management fee. This waiver will be in effect through at least May 1, 2023. The waiver may only be modified or terminated with the approval of the fund’s board. Net expense ratios reflect the waiver, without which they would have been higher. When applicable, investment results reflect fee waivers and/or expense reimbursements, without which results would have been lower. Visit capitalgroup.com/afis for more information. Expense ratios are as of the fund’s prospectus dated May 1, 2023 (unaudited). Refer to the Financial Highlights table in this report for details.
Past results are not predictive of results in future periods.
Any market index shown is unmanaged and, therefore, has no expenses. Investors cannot invest directly in an index.
| 1 | Source: Bloomberg Index Services Ltd. |
| 2 | Source: Bloomberg Index Services Ltd. Bloomberg U.S. Corporate Investment Grade Index represents the universe of investment-grade, publicly issued U.S. corporate and specified foreign debentures and secured notes that meet the specified maturity, liquidity and quality requirements. |
| 3 | Source: Bloomberg Index Services Ltd. Bloomberg U.S. Corporate High Yield 2% Issuer Capped Index covers the universe of fixed-rate, non-investment-grade debt. The index limits the maximum exposure of any one issuer to 2%. |
| 4 | Source: Bloomberg Index Services Ltd. Bloomberg Municipal Bond Index is a market-value-weighted index designed to represent the long-term investment-grade tax-exempt bond market. |
| 5 | Periods greater than one year are annualized. |
Where the fund’s assets were invested as of December 31, 2022
| Percent of net assets |
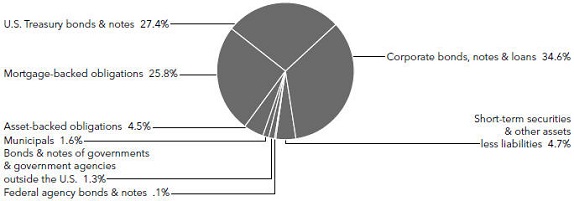
American Funds Insurance Series 29
Table of Contents
Capital World Bond Fund®
Fund results shown are for past periods and are not predictive of results for future periods. Current and future results may be lower or higher than those shown. Prices and returns will vary, so investors may lose money. Investing for short periods makes losses more likely. For current information and month-end results, visit capitalgroup.com/afis. For information about your insurance contract and month-end results, go to the website of the company that issued your contract.
Capital World Bond Fund declined 17.43% for the 12 months ended December 31, 2022. The fund’s benchmark, the Bloomberg Global Aggregate Index,1 which measures global investment-grade bonds (rated BBB/Baa and above), was down 16.25%.
Bonds plummeted in the face of soaring inflation, which rose in part due to energy price shocks resulting from Russia’s invasion of Ukraine. The Bloomberg U.S. Treasury Index² lost 12.46% in one of the worst bond market declines in history. The Federal Reserve and European Central Bank, among others, aggressively raised interest rates in an attempt to bring consumer price increases back to a target of roughly 2%, down from 7% to 10% in many economies.
Over the period, the largest contributions to the fund’s relative results were due to currency and sector selection, with a modest boost from curve positioning. Unhedged holdings in the euro and Japanese yen were additive. On the downside, duration positioning as well as currency hedging in forward contracts detracted. Weak absolute returns in part reflect the strength of the U.S. dollar, spurred by the Fed’s aggressive rate hikes and their effect on global bond markets.
Looking ahead, the fund’s managers believe the Fed’s hiking cycle is close to a peak and see the 50-60 basis points of further hikes priced into forward curves as realistic. The managers’ outlook for bonds is therefore good, with the U.S. dollar likely in a peaking phase as inflation momentum turns around. They expect inflation to fall this year as growth is likely to be relatively sluggish in both the U.S. and Europe.
30 American Funds Insurance Series
Table of Contents
Capital World Bond Fund® (continued)
How a hypothetical $10,000 investment has grown
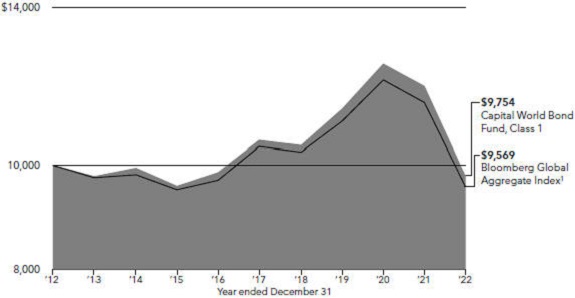
Total returns based on a $1,000 investment For periods ended December 31, 20223
| 1 year | 5 years | 10 years | Lifetime (since October 4, 2006) | Expense ratio | ||||||||||||||||
Class 1 | –17.43 | % | –1.53 | % | –0.25 | % | 2.40 | % | 0.47 | % | ||||||||||
Class 1A | –17.69 | –1.76 | –0.48 | 2.16 | 0.72 | |||||||||||||||
Class 24 | –17.70 | –1.77 | –0.50 | 2.14 | 0.72 | |||||||||||||||
Class 4 | –17.84 | –2.01 | –0.70 | 1.92 | 0.97 | |||||||||||||||
Investment results assume all distributions are reinvested and reflect applicable fees and expenses. The investment adviser is currently waiving a portion of its management fee. This waiver will be in effect through at least May 1, 2023. The waiver may only be modified or terminated with the approval of the fund’s board. When applicable, investment results reflect fee waivers and/or expense reimbursements, without which results would have been lower. Visit capitalgroup.com/afis for more information. Expense ratios are restated to reflect current fees and are as of the fund’s prospectus dated May 1, 2023 (unaudited). Refer to the Financial Highlights table in this report for details.
Past results are not predictive of results in future periods.
Any market index shown is unmanaged and, therefore, has no expenses. Investors cannot invest directly in an index.
| 1 | Source: Bloomberg Index Services Ltd. |
| 2 | Source: Bloomberg Index Services Ltd. Bloomberg U.S. Treasury Index measures the performance of public obligations of the U.S. Treasury. |
| 3 | Periods greater than one year are annualized. |
| 4 | Capital World Bond Fund Class 2 shares were first sold on November 6, 2006. Results prior to that date are hypothetical based on Class 1 share results adjusted for estimated additional annual expenses of 0.25%. |
Where the fund’s assets were invested as of December 31, 2022
| Percent of net assets |
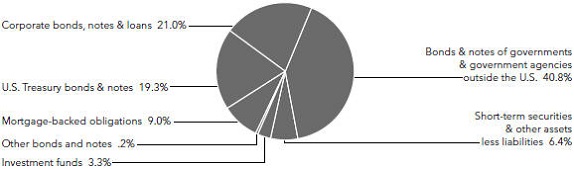
American Funds Insurance Series 31
Table of Contents
American High-Income Trust®
Fund results shown are for past periods and are not predictive of results for future periods. Current and future results may be lower or higher than those shown. Prices and returns will vary, so investors may lose money. Investing for short periods makes losses more likely. For current information and month-end results, visit capitalgroup.com/afis. For information about your insurance contract and month-end results, go to the website of the company that issued your contract.
American High-Income Trust fell 9.01% for the 12 months ended December 31, 2022. In comparison, the fund’s benchmark, the Bloomberg U.S. Corporate High Yield 2% Issuer Capped Index,¹ which measures fixed-rate non-investment-grade bonds (rated BB/Ba and below) and limits the exposure of an issuer to 2%, was down 11.18%.
U.S. fixed income markets fell across the board. The Federal Reserve raised the federal funds rate by 425 basis points from near zero to counter the highest inflation since the 1980s. U.S. Treasury yields rose across the curve, and ended the year inverted as shorter dated bonds sold off sharply. The 10-year Treasury yield soared 237 basis points to 3.88%. Investment-grade (BBB/Baa and above) corporate bonds saw the worst returns. The Bloomberg U.S. Corporate Investment Grade Index2 returned –15.76%, and spreads widened by 38 basis points. Elsewhere, the Bloomberg Municipal Bond Index3 returned –8.53%.
At a high level, security selection was most additive to the fund’s relative returns over the period. In particular, investments within the energy and non-cyclical consumer staples sectors contributed to relative results. On the downside, security selection and a lower-than-benchmark position within the cyclical consumer goods sector detracted from relative results.
With high-yield bond yields close to their long-term average, markets now reflect the higher inflation that emerged over the last year. The adverse consequences of tighter global monetary policy may lead to somewhat higher default rates in the next several years, which could in turn lead to a further rise in yields. The substantial yield increases across fixed income markets provides a more attractive forward return outlook, and although yields may continue to adjust to higher levels, much of the required adjustment may have already occurred. The fund’s managers continue to seek attractive opportunities within the high yield market that appropriately compensate for the underlying investment risks.
32 American Funds Insurance Series
Table of Contents
American High-Income Trust® (continued)
How a hypothetical $10,000 investment has grown
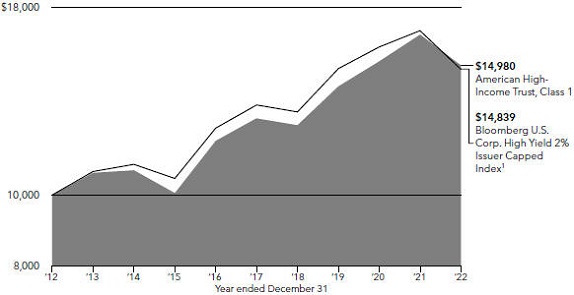
Total returns based on a $1,000 investment For periods ended December 31, 20224
| 1 year | 5 years | 10 years | Lifetime (since February 8,1984) | Gross expense ratio | Net expense ratio | |||||||||||||||||||
Class 1 | –9.01 | % | 3.40 | % | 4.12 | % | 8.16 | % | 0.44 | % | 0.30 | % | ||||||||||||
Class 1A | –9.29 | 3.14 | 3.87 | 7.89 | 0.69 | 0.55 | ||||||||||||||||||
Class 2 | –9.26 | 3.14 | 3.86 | 7.89 | 0.69 | 0.55 | ||||||||||||||||||
Class 3 | –9.25 | 3.21 | 3.93 | 7.97 | 0.62 | 0.48 | ||||||||||||||||||
Class 4 | –9.53 | 2.88 | 3.64 | 7.63 | 0.94 | 0.80 | ||||||||||||||||||
Investment results assume all distributions are reinvested and reflect applicable fees and expenses. The investment adviser is currently waiving a portion of its management fee. This waiver will be in effect through at least May 1, 2023. The waiver may only be modified or terminated with the approval of the fund’s board. Net expense ratios reflect the waiver, without which they would have been higher. When applicable, investment results reflect fee waivers and/or expense reimbursements, without which results would have been lower. Visit capitalgroup.com/afis for more information. Expense ratios are restated to reflect current fees and are as of the fund’s prospectus dated May 1, 2023 (unaudited). Refer to the Financial Highlights table in this report for details.
Past results are not predictive of results in future periods.
Any market index shown is unmanaged and, therefore, has no expenses. Investors cannot invest directly in an index.
| 1 | Source: Bloomberg Index Services Ltd. |
| 2 | Source: Bloomberg Index Services Ltd. Bloomberg U.S. Corporate Investment Grade Index represents the universe of investment-grade, publicly issued U.S. corporate and specified foreign debentures and secured notes that meet the specified maturity, liquidity and quality requirements. |
| 3 | Source: Bloomberg Index Services Ltd. Bloomberg Municipal Bond Index is a market-value-weighted index designed to represent the long-term investment-grade tax-exempt bond market. |
| 4 | Periods greater than one year are annualized. |
| Where the fund’s assets were invested as of December 31, 2022 | Percent of net assets |
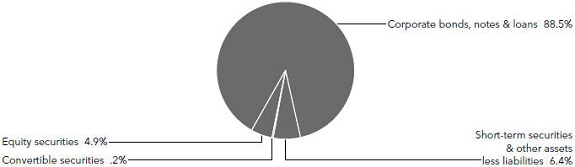
American Funds Insurance Series 33
Table of Contents
American Funds Mortgage Fund®
Fund results shown are for past periods and are not predictive of results for future periods. Current and future results may be lower or higher than those shown. Prices and returns will vary, so investors may lose money. Investing for short periods makes losses more likely. For current information and month-end results, visit capitalgroup.com/afis. For information about your insurance contract and month-end results, go to the website of the company that issued your contract.
American Funds Mortgage Fund fell 9.76% for the 12 months ended December 31, 2022. Its benchmark index, Bloomberg U.S. Mortgage-Backed Securities Index,1 which covers the mortgage-backed pass-through securities of Ginnie Mae, Fannie Mae and Freddie Mac, was down 11.81%.
U.S. fixed income markets fell across the board. The Federal Reserve raised the federal funds rate by 425 basis points from near zero to counter the highest inflation since the 1980s. U.S. Treasury yields rose across the curve, which ended the year inverted as shorter dated bonds sold off sharply. The 10-year Treasury yield soared 237 basis points to 3.88%. Investment-grade (BBB/Baa and above) corporate bonds saw the worst returns. The Bloomberg U.S. Corporate Investment Grade Index2 returned –15.76%, and spreads widened by 38 basis points. Elsewhere, the Bloomberg U.S. Corporate High Yield 2% Issuer Capped Index3 returned –11.18%, while the Bloomberg Municipal Bond Index4 returned –8.53%.
The fund declined but outpaced its benchmark index. At a high level, duration and curve positioning were most additive to relative returns over the period. In particular, the fund benefitted from lower-than-benchmark duration positioning within securitized mortgage-backed security pass-throughs. On the downside, sector selection weighed on results overall, particularly in an out-of-benchmark position within Treasuries.
The fund’s focus remains on meeting its core objectives of providing current income and preserving invested capital. Managers are mindful of the fund’s correlation to equity and its use as a building block in investor portfolios. They are cautious about weakening economic activity as the Fed continues to raise interest rates. The fund is positioned with the view that inflation may remain elevated and that a contraction in growth is likely sometime in the next year.
34 American Funds Insurance Series
Table of Contents
American Funds Mortgage Fund® (continued)
How a hypothetical $10,000 investment has grown
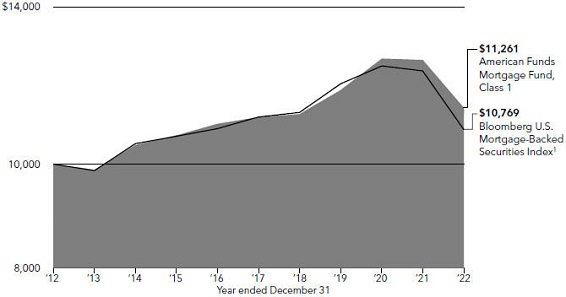
Total returns based on a $1,000 investment For periods ended December 31, 20225
1 year | 5 years | Lifetime 10 years | Gross (since May 2, 2011) | Net expense ratio | expense ratio | |||||||||||||||||||
Class 1 | –9.76 | % | 0.38 | % | 1.19 | % | 1.65 | % | 0.40 | % | 0.30 | % | ||||||||||||
Class 1A | –10.03 | 0.14 | 0.95 | 1.40 | 0.65 | 0.55 | ||||||||||||||||||
Class 2 | –9.94 | 0.14 | 0.94 | 1.40 | 0.65 | 0.55 | ||||||||||||||||||
Class 4 | –10.16 | –0.11 | 0.75 | 1.20 | 0.90 | 0.80 | ||||||||||||||||||
Investment results assume all distributions are reinvested and reflect applicable fees and expenses. The investment adviser is currently waiving a portion of its management fee. This waiver will be in effect through at least May 1, 2023. The waiver may only be modified or terminated with the approval of the fund’s board. Net expense ratios reflect the waiver, without which they would have been higher. When applicable, investment results reflect fee waivers and/or expense reimbursements, without which results would have been lower. Visit capitalgroup.com/afis for more information. Expense ratios are restated to reflect current fees and are as of the fund’s prospectus dated May 1, 2023 (unaudited). Refer to the Financial Highlights table in this report for details.
Past results are not predictive of results in future periods.
Any market index shown is unmanaged and, therefore, has no expenses. Investors cannot invest directly in an index.
| 1 | Source: Bloomberg Index Services Ltd. |
| 2 | Source: Bloomberg Index Services Ltd. Bloomberg U.S. Corporate Investment Grade Index represents the universe of investment-grade, publicly issued U.S. corporate and specified foreign debentures and secured notes that meet the specified maturity, liquidity and quality requirements. |
| 3 | Source: Bloomberg Index Services Ltd. Bloomberg U.S. Corporate High Yield 2% Issuer Capped Index covers the universe of fixed-rate, non-investment-grade debt. The index limits the maximum exposure of any one issuer to 2%. |
| 4 | Source: Bloomberg Index Services Ltd. Bloomberg Municipal Bond Index is a market-value-weighted index designed to represent the long-term investment-grade tax-exempt bond market. |
| 5 | Periods greater than one year are annualized. |
Where the fund’s assets were invested as of December 31, 2022
| Percent of net assets |
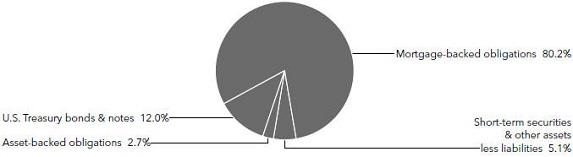
American Funds Insurance Series 35
Table of Contents
Ultra-Short Bond Fund
Fund results shown are for past periods and are not predictive of results for future periods. Current and future results may be lower or higher than those shown. Prices and returns will vary, so investors may lose money. Investing for short periods makes losses more likely. For current information and month-end results, visit capitalgroup.com/afis. For information about your insurance contract and month-end results, go to the website of the company that issued your contract.
Ultra-Short Bond Fund rose 1.42% for the 12 months ended December 31, 2022, compared with a 0.69% rise in the Bloomberg Short-Term Government/Corporate Index,¹ which consists of investment-grade (rated BBB/ Baa and above), fixed-rate, publicly placed, dollar-denominated and non-convertible securities with remaining maturity from one up to (but not including) 12 months within either the government or corporate sector.
With a focus on capital preservation and liquidity, the fund continues to invest in a conservative manner, typically investing in both shorter duration and higher quality securities relative to the index. In the current rising interest rate environment, this approach positioned the fund to capture interest rate hikes relatively quickly. With the U.S. Federal Reserve raising its benchmark rate seven times and by a total of 425 basis points in 2022, the fund’s shorter duration compared with the index resulted in a more positive 12-month return.
Short-term interest rates are currently near a 15-year high and, with the current inflation outlook, the Federal Reserve may choose to increase them again. However, uncertainty on when the Fed may pause hikes or reverse course continues to drive the market.
36 American Funds Insurance Series
Table of Contents
Ultra-Short Bond Fund (continued)
Total returns based on a $1,000 investment For periods ended December 31, 20222
| 1 year | 5 years | 10 years | Lifetime (since February 8, 1984) | Expense ratio | ||||||||||||||||
Class 1 | 1.42 | % | 0.97 | % | 0.49 | % | 3.17 | % | 0.30 | % | ||||||||||
Class 1A | 1.32 | 0.97 | 0.39 | 2.95 | 0.55 | |||||||||||||||
Class 2 | 1.17 | 0.72 | 0.24 | 2.91 | 0.55 | |||||||||||||||
Class 3 | 1.19 | 0.80 | 0.31 | 2.98 | 0.48 | |||||||||||||||
Class 4 | 0.83 | 0.47 | 0.06 | 2.67 | 0.80 | |||||||||||||||
Investment results assume all distributions are reinvested and reflect applicable fees and expenses. When applicable, investment results reflect fee waivers and/or expense reimbursements, without which results would have been lower. Visit capitalgroup.com/afis for more information. Expense ratios are restated to reflect current fees and are as of the fund’s prospectus dated May 1, 2023 (unaudited). Refer to the Financial Highlights table in this report for details.
Past results are not predictive of results in future periods.
Any market index shown is unmanaged and, therefore, has no expenses. Investors cannot invest directly in an index.
| 1 | Source: Bloomberg Index Services Ltd. |
| 2 | Periods greater than one year are annualized. |
| Where the fund’s assets were invested as of December 31, 2022 | Percent of net assets |
Commercial paper | 76.5 | % | ||
Federal agency bills & notes | 21.5 | |||
Other assets less liabilities | 2.0 | |||
|
| |||
| Total | 100.0 | % | ||
|
|
American Funds Insurance Series 37
Table of Contents
U.S. Government Securities Fund®
Fund results shown are for past periods and are not predictive of results for future periods. Current and future results may be lower or higher than those shown. Prices and returns will vary, so investors may lose money. Investing for short periods makes losses more likely. For current information and month-end results, visit capitalgroup.com/afis. For information about your insurance contract and month-end results, go to the website of the company that issued your contract.
U.S. Government Securities Fund declined 10.75% for the 12 months ended December 31, 2022. Its benchmark, the Bloomberg U.S. Government/Mortgage-Backed Securities Index,¹ which covers obligations issued by the U.S. Treasury and U.S. government agencies, was down 12.12%.
U.S. fixed income markets fell across the board. The Federal Reserve raised the federal funds rate by 425 basis points from near zero to counter the highest inflation since the 1980s. U.S. Treasury yields rose across the curve, which ended the year inverted as shorter dated bonds sold off sharply. The 10-year Treasury yield soared 237 basis points to 3.88%.
Over the period, the fund outpaced its benchmark. Top contributors to relative returns were duration and curve positioning. Duration positioning particularly within agency mortgage-backed securities (MBS) was additive. On the downside, sector and security selection weighed modestly on returns relative to the benchmark. The fund utilized interest rate derivatives to more efficiently execute the portfolio’s interest rate positioning based on how managers expected yields to move. These had mixed impacts on results, but ultimately helped to express managers’ convictions more efficiently.
The Fed has provided enormous support to the markets, particularly over the last two years. It is difficult to imagine unwinding that support without disruptions to financial markets and the economy. The fund’s present high weighting to Treasury Inflation-Protected Securities (TIPS) is intended to provide additional return if the market underestimates future inflation. It remains to be seen just how far the Fed will go to tame inflation, but the fund’s managers intend to use all the tools at their disposal to navigate these volatile markets as they seek to protect and grow shareholder assets over time.
38 American Funds Insurance Series
Table of Contents
U.S. Government Securities Fund® (continued)
How a hypothetical $10,000 investment has grown
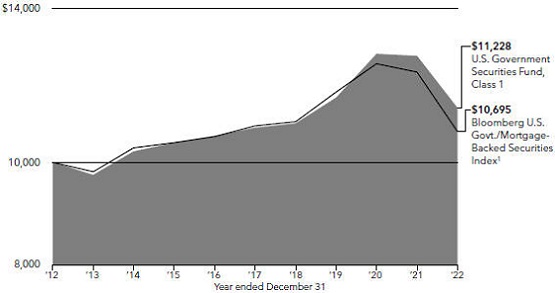
Total returns based on a $1,000 investment For periods ended December 31, 20222
| 1 year | 5 years | 10 years | Lifetime (since December 2, 1985) | Gross expense ratio | Net expense ratio | |||||||||||||||||||
Class 1 | –10.75 | % | 0.85 | % | 1.17 | % | 5.17 | % | 0.34 | % | 0.24 | % | ||||||||||||
Class 1A | –10.93 | 0.61 | 0.93 | 4.92 | 0.59 | 0.49 | ||||||||||||||||||
Class 2 | –10.95 | 0.61 | 0.92 | 4.91 | 0.59 | 0.49 | ||||||||||||||||||
Class 3 | –10.90 | 0.67 | 0.99 | 4.99 | 0.52 | 0.42 | ||||||||||||||||||
Class 4 | –11.19 | 0.37 | 0.70 | 4.66 | 0.84 | 0.74 | ||||||||||||||||||
Investment results assume all distributions are reinvested and reflect applicable fees and expenses. The investment adviser is currently waiving a portion of its management fee. This waiver will be in effect through at least May 1, 2023. The waiver may only be modified or terminated with the approval of the fund’s board. Net expense ratios reflect the waiver, without which they would have been higher. When applicable, investment results reflect fee waivers and/or expense reimbursements, without which results would have been lower. Visit capitalgroup.com/afis for more information. Expense ratios are restated to reflect current fees and are as of the fund’s prospectus dated May 1, 2023 (unaudited). Refer to the Financial Highlights table in this report for details.
Past results are not predictive of results in future periods.
Any market index shown is unmanaged and, therefore, has no expenses. Investors cannot invest directly in an index.
| 1 | Source: Bloomberg Index Services Ltd. |
| 2 | Periods greater than one year are annualized. |
| Where the fund’s assets were invested as of December 31, 2022 | Percent of net assets |
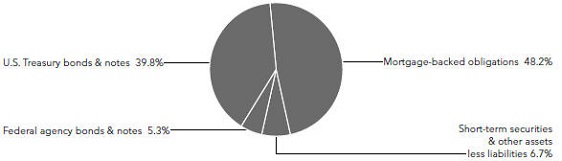
American Funds Insurance Series 39
Table of Contents
Managed Risk Growth Fund
Fund results shown are for past periods and are not predictive of results for future periods. Current and future results may be lower or higher than those shown. Prices and returns will vary, so investors may lose money. Investing for short periods makes losses more likely. For current information and month-end results, visit capitalgroup.com/afis. For information about your insurance contract and month-end results, go to the website of the company that issued your contract.
The fund declined 24.62% for the 12 months ended December 31, 2022. S&P 500 Managed Risk Index – Moderate Aggressive1 was down 13.52%. S&P 500 Index,2 a market capitalization-weighted index based on the results of approximately 500 widely held common stocks, fell 18.11%.
The fund pursues its objective by investing in shares of American Funds Insurance Series® – Growth Fund and American Funds Insurance Series® – The Bond Fund of America while seeking to manage portfolio volatility and provide downside protection, primarily through the use of exchange-traded options and futures contracts. The benefit of the fund’s managed risk strategy should be most apparent during periods of high volatility and in down markets. In steady or rising markets, the fund’s results can be expected to lag those of the underlying fund.
The underlying Growth Fund’s investment within the materials sector was the top contributor to relative returns. Security selections within the consumer discretionary and communication services sectors detracted. The return of the underlying The Bond Fund of America was additive to relative results against its primary benchmark, the Bloomberg U.S. Aggregate Index.3 The managed risk strategy was additive to returns overall. Within the strategy, the equity future overlay was positive while the Treasury future and option overlays detracted.
How a hypothetical $10,000 investment has grown
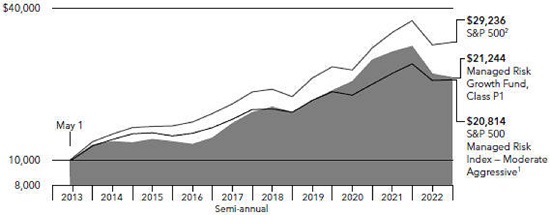
Total returns based on a $1,000 investment For periods ended December 31, 20224
| 1 year | 5 years | Lifetime (since May 1, 2013) | Gross expense ratio | Net expense ratio | ||||||||||||||||
Class P1 | –24.62 | % | 6.61 | % | 8.10 | % | 0.74 | % | 0.69 | % | ||||||||||
Class P2 | –24.88 | 6.31 | 7.80 | 0.99 | 0.94 | |||||||||||||||
The investment adviser is currently waiving a portion of its management fee. This waiver will be in effect through at least May 1, 2023. The waiver may only be modified or terminated with the approval of the fund’s board. Net expense ratios shown reflect the waiver, without which they would have been higher. When applicable, investment results reflect fee waivers and/or expense reimbursements, without which results would have been lower. Visit capitalgroup.com/afis for more information. Expense ratios are as of the fund’s prospectus dated May 1, 2023 (unaudited).
Past results are not predictive of results in future periods.
Any market index shown is unmanaged and, therefore, has no expenses. Investors cannot invest directly in an index.
| 1 | Source: S&P Dow Jones Indices LLC. Standard & Poor’s Managed Risk Index Series is designed to simulate a dynamic protective portfolio that allocates between the underlying equity index and cash, based on realized volatilities of the underlying equity and bond indexes, while maintaining a fixed allocation to the underlying bond index. |
| 2 | Source: S&P Dow Jones Indices LLC. |
| 3 | Source: Bloomberg Index Services Ltd. Bloomberg U.S. Aggregate Index represents the U.S. investment-grade (rated BBB/Baa and above) fixed-rate bond market. |
| 4 | Periods greater than one year are annualized. |
Milliman Financial Risk Management LLC serves as the subadviser with respect to the management of the fund’s managed risk strategy.
40 American Funds Insurance Series
Table of Contents
Managed Risk International Fund
Fund results shown are for past periods and are not predictive of results for future periods. Current and future results may be lower or higher than those shown. Prices and returns will vary, so investors may lose money. Investing for short periods makes losses more likely. For current information and month-end results, visit capitalgroup.com/afis. For information about your insurance contract and month-end results, go to the website of the company that issued your contract.
The fund declined 15.27% for the 12 months ended December 31, 2022, compared to S&P EPAC Ex. Korea LargeMidCap Managed Risk Index – Moderate Aggressive,1 which was down 12.42%. MSCI ACWI (All Country World Index) ex USA,2 a free float-adjusted market capitalization-weighted index that is designed to measure equity market results in the global developed and emerging markets (consisting of more than 40 developed and emerging market country indexes, excluding the U.S.), fell 16.00%.
The fund pursues its objective by investing in shares of American Funds Insurance Series® – International Fund and American Funds Insurance Series® – The Bond Fund of America while seeking to manage portfolio volatility and provide downside protection, primarily through the use of exchange-traded options and futures contracts. The benefit of the fund’s managed risk strategy should be most apparent during periods of high volatility and in down markets. In steady or rising markets, the fund’s results can be expected to lag those of the underlying fund.
The underlying International Fund’s investment within the energy sector was the top contributor to relative returns. On the downside, stock selections within the financials and information technology sectors detracted from relative results. The managed risk strategy was additive to results overall. Within the strategy, the equity future overlay was positive while the Treasury future and option overlays detracted.
How a hypothetical $10,000 investment has grown
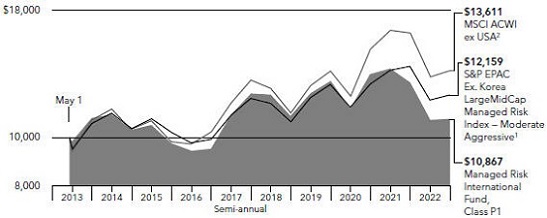
Total returns based on a $1,000 investment For periods ended December 31, 20223
| 1 year | 5 years | Lifetime (since May 1, 2013) | Gross expense ratio | Net expense ratio | ||||||||||||||||
Class P1 | –15.27 | % | –2.31 | % | 0.86 | % | 0.93 | % | 0.86 | % | ||||||||||
Class P2 | –15.54 | –2.60 | 0.51 | 1.18 | 1.11 | |||||||||||||||
The investment adviser is currently waiving a portion of its management fee. In addition, the investment adviser is currently reimbursing a portion of other expenses. This waiver and reimbursement will be in effect through at least May 1, 2023. The adviser may elect at its discretion to extend, modify or terminate the reimbursement at that time. The waiver may only be modified or terminated with the approval of the fund’s board. Net expense ratios shown reflect the waiver and reimbursement, without which they would have been higher. When applicable, investment results reflect fee waivers and/or expense reimbursements, without which results would have been lower. Visit capitalgroup.com/afis for more information. Expense ratios are as of the fund’s prospectus dated May 1, 2023 (unaudited).
Past results are not predictive of results in future periods.
Any market index shown is unmanaged and, therefore, has no expenses. Investors cannot invest directly in an index.
| 1 | Source: S&P Dow Jones Indices LLC. Standard & Poor’s Managed Risk Index Series is designed to simulate a dynamic protective portfolio that allocates between the underlying equity index and cash, based on realized volatilities of the underlying equity and bond indexes, while maintaining a fixed allocation to the underlying bond index. |
| 2 | Source: MSCI. The MSCI index result reflects reinvestment of distributions and dividends net of withholding taxes. |
| 3 | Periods greater than one year are annualized. |
Milliman Financial Risk Management LLC serves as the subadviser with respect to the management of the fund’s managed risk strategy.
American Funds Insurance Series 41
Table of Contents
Managed Risk Washington Mutual Investors Fund
Fund results shown are for past periods and are not predictive of results for future periods. Current and future results may be lower or higher than those shown. Prices and returns will vary, so investors may lose money. Investing for short periods makes losses more likely. For current information and month-end results, visit capitalgroup.com/afis. For information about your insurance contract and month-end results, go to the website of the company that issued your contract.
The fund declined 8.92% for the 12 months ended December 31, 2022. S&P 500 Managed Risk Index – Moderate1 fell 13.13%. S&P 500 Index,2 a market capitalization-weighted index based on the results of approximately 500 widely held common stocks, was down 18.11%.
The fund pursues its objective by investing in shares of American Funds Insurance Series®– Washington Mutual Investors Fund and American Funds Insurance Series®– U.S. Government Securities Fund while seeking to manage portfolio volatility and provide downside protection, primarily through the use of exchange-traded options and futures contracts. The benefit of the fund’s managed risk strategy should be most apparent during periods of high volatility and in down markets. In steady or rising markets, the fund’s results can be expected to lag those of the underlying fund.
The underlying Washington Mutual Investors Fund’s security selection within the consumer discretionary sector was the top contributor to relative returns. Investments in the information technology sector were also additive. The top detractors to relative returns on a sector basis were security selections within financials and real estate. The managed risk strategy detracted overall. Within the strategy, the equity future overlay was additive while the Treasury future and option overlays detracted.
How a hypothetical $10,000 investment has grown
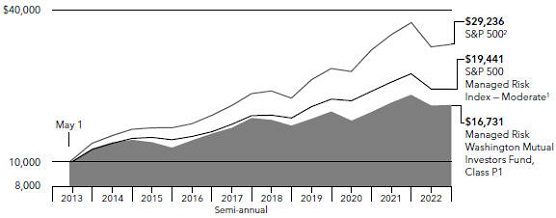
Total returns based on a $1,000 investment For periods ended December 31, 20223
| 1 year | 5 years | Lifetime (since May 1, 2013) | Gross expense ratio | Net expense ratio | ||||||||||||||||
Class P1 | –8.92 | % | 2.39 | % | 5.47 | % | 0.67 | % | 0.62 | % | ||||||||||
Class P2 | –9.16 | 2.08 | 5.12 | 0.93 | 0.88 | |||||||||||||||
The investment adviser is currently waiving a portion of its management fee. This waiver will be in effect through at least May 1, 2023. The waiver may only be modified or terminated with the approval of the fund’s board. Net expense ratios shown reflect the waiver, without which they would have been higher. When applicable, investment results reflect fee waivers and/or expense reimbursements, without which results would have been lower. Visit capitalgroup.com/afis for more information. Expense ratios are as of the fund’s prospectus dated May 1, 2023 (unaudited).
Past results are not predictive of results in future periods.
Any market index shown is unmanaged and, therefore, has no expenses. Investors cannot invest directly in an index.
| 1 | Source: S&P Dow Jones Indices LLC. Standard & Poor’s Managed Risk Index Series is designed to simulate a dynamic protective portfolio that allocates between the underlying equity index and cash, based on realized volatilities of the underlying equity and bond indexes, while maintaining a fixed allocation to the underlying bond index. |
| 2 | Source: S&P Dow Jones Indices LLC. |
| 3 | Periods greater than one year are annualized. |
Milliman Financial Risk Management LLC serves as the subadviser with respect to the management of the fund’s managed risk strategy.
42 American Funds Insurance Series
Table of Contents
Managed Risk Growth-Income Fund
Fund results shown are for past periods and are not predictive of results for future periods. Current and future results may be lower or higher than those shown. Prices and returns will vary, so investors may lose money. Investing for short periods makes losses more likely. For current information and month-end results, visit capitalgroup.com/afis. For information about your insurance contract and month-end results, go to the website of the company that issued your contract.
The fund declined 16.74% for the 12 months ended December 31, 2022, compared to the S&P 500 Managed Risk Index – Moderate,1 which declined 13.13%. S&P 500 Index,2 a market capitalization-weighted index based on the results of approximately 500 widely held common stocks, was down 18.11%.
The fund pursues its objective by investing in shares of American Funds Insurance Series® – Growth-Income Fund and American Funds Insurance Series® – The Bond Fund of America while seeking to manage portfolio volatility and provide downside protection, primarily through the use of exchange-traded options and futures contracts. The benefit of the fund’s managed risk strategy should be most apparent during periods of high volatility and in down markets. In steady or rising markets, the fund’s results can be expected to lag those of the underlying fund.
The underlying Growth-Income Fund’s investment within the information technology sector was the top contributor to relative returns. A higher-than-benchmark investment within the industrials sector was also additive to results. On the downside, security selections within the financials and communication services sectors weighed on relative results. The managed risk strategy detracted overall. Within the strategy, the equity future overlay was positive while the Treasury future and option overlays detracted.
How a hypothetical $10,000 investment has grown
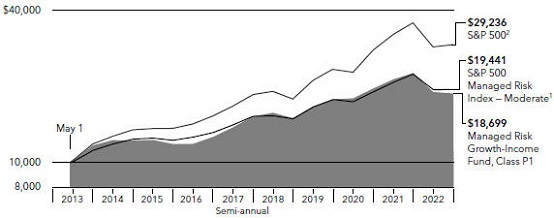
Total returns based on a $1,000 investment For periods ended December 31, 20223
| 1 year | 5 years | Lifetime (since May 1, 2013) | Gross expense ratio | Net expense ratio | ||||||||||||||||
Class P1 | –16.74 | % | 4.32 | % | 6.69 | % | 0.67 | % | 0.62 | % | ||||||||||
Class P2 | –16.93 | 4.06 | 6.39 | 0.92 | 0.87 | |||||||||||||||
The investment adviser is currently waiving a portion of its management fee. This waiver will be in effect through at least May 1, 2023. The waiver may only be modified or terminated with the approval of the fund’s board. Net expense ratios shown reflect the waiver, without which they would have been higher. When applicable, investment results reflect fee waivers and/or expense reimbursements, without which results would have been lower. Visit capitalgroup.com/afis for more information. Expense ratios are as of the fund’s prospectus dated May 1, 2023 (unaudited).
Past results are not predictive of results in future periods.
Any market index shown is unmanaged and, therefore, has no expenses. Investors cannot invest directly in an index.
| 1 | Source: S&P Dow Jones Indices LLC. Standard & Poor’s Managed Risk Index Series is designed to simulate a dynamic protective portfolio that allocates between the underlying equity index and cash, based on realized volatilities of the underlying equity and bond indexes, while maintaining a fixed allocation to the underlying bond index. |
| 2 | Source: S&P Dow Jones Indices LLC. |
| 3 | Periods greater than one year are annualized. |
Milliman Financial Risk Management LLC serves as the subadviser with respect to the management of the fund’s managed risk strategy.
American Funds Insurance Series 43
Table of Contents
Managed Risk Asset Allocation Fund
Fund results shown are for past periods and are not predictive of results for future periods. Current and future results may be lower or higher than those shown. Prices and returns will vary, so investors may lose money. Investing for short periods makes losses more likely. For current information and month-end results, visit capitalgroup.com/afis. For information about your insurance contract and month-end results, go to the website of the company that issued your contract.
The fund was down 13.75% for the 12 months ended December 31, 2022. S&P 500 Managed Risk Index — Moderate Conservative1 fell 12.94%. S&P 500 Index,2 a market capitalization-weighted index based on the results of approximately 500 widely held common stocks, declined 18.11%.
The fund pursues its objective by investing in shares of American Funds Insurance Series®– Asset Allocation Fund while seeking to manage portfolio volatility and provide downside protection, primarily through the use of exchange-traded options and futures contracts. The benefit of the fund’s managed risk strategy should be most apparent during periods of high volatility and in down markets. In steady or rising markets, the fund’s results can be expected to lag those of the underlying fund.
The underlying Asset Allocation Fund’s investment selections within the consumer discretionary and health care sectors were top contributors to relative results on a sector basis. Stock selections within financials and energy detracted from relative returns on a sector basis, although the energy sector was up on an absolute basis. The managed risk strategy detracted from returns overall. Within the strategy, the equity future overlay was positive while the Treasury future and option overlays detracted.
44 American Funds Insurance Series
Table of Contents
Managed Risk Asset Allocation Fund (continued)
How a hypothetical $10,000 investment has grown
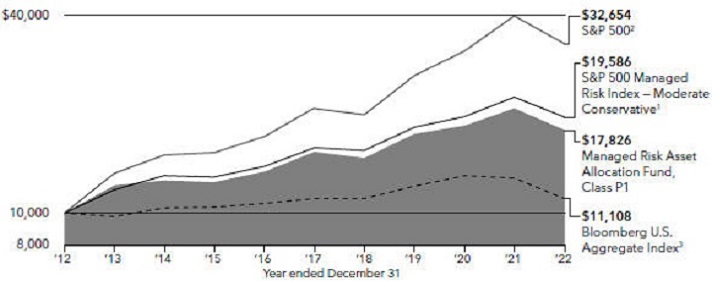
Total returns based on a $1,000 investment For periods ended December 31, 20224
| 1 year | 5 years | 10 years | Lifetime (since September 28, 2012) | Gross expense ratio | Net expense ratio | |||||||||||||||||||
Class P1 | –13.75 | % | 3.09 | % | 5.95 | % | 5.92 | % | 0.70 | % | 0.65 | % | ||||||||||||
Class P2 | –13.97 | 2.83 | 5.69 | 5.66 | 0.95 | 0.90 | ||||||||||||||||||
The investment adviser is currently waiving a portion of its management fee. This waiver will be in effect through at least May 1, 2023. The waiver may only be modified or terminated with the approval of the fund’s board. Net expense ratios shown reflect the waiver, without which they would have been higher. When applicable, investment results reflect fee waivers and/or expense reimbursements, without which results would have been lower. Visit capitalgroup.com/afis for more information. Expense ratios are as of the fund’s prospectus dated May 1, 2023 (unaudited).
Past results are not predictive of results in future periods.
Any market index shown is unmanaged and, therefore, has no expenses. Investors cannot invest directly in an index.
| 1 | Source: S&P Dow Jones Indices LLC. Standard & Poor’s Managed Risk Index Series is designed to simulate a dynamic protective portfolio that allocates between the underlying equity index and cash, based on realized volatilities of the underlying equity and bond indexes, while maintaining a fixed allocation to the underlying bond index. |
| 2 | Source: S&P Dow Jones Indices LLC. |
| 3 | Source: Bloomberg Index Services Ltd. Bloomberg U.S. Aggregate Index represents the U.S. investment-grade (rated BBB/Baa and above) fixed-rate bond market. |
| 4 | Periods greater than one year are annualized. |
Milliman Financial Risk Management LLC serves as the subadviser with respect to the management of the fund’s managed risk strategy.
American Funds Insurance Series 45
Table of Contents
Investment portfolio December 31, 2022
Common stocks 94.49%
| Shares | Value (000) | |||||||
Information technology 22.59% | ||||||||
Microsoft Corp. | 1,807,800 | $ | 433,547 | |||||
ASML Holding NV | 458,318 | 248,089 | ||||||
ASML Holding NV (New York registered) (ADR) | 227,600 | 124,361 | ||||||
Taiwan Semiconductor Manufacturing Company, Ltd. | 15,615,000 | 227,583 | ||||||
Taiwan Semiconductor Manufacturing Company, Ltd. (ADR) | 140,000 | 10,429 | ||||||
Applied Materials, Inc. | 875,000 | 85,208 | ||||||
Broadcom, Inc. | 125,300 | 70,059 | ||||||
Fiserv, Inc.1 | 497,600 | 50,292 | ||||||
Adyen NV1 | 34,330 | 47,506 | ||||||
Samsung Electronics Co., Ltd. | 785,100 | 34,621 | ||||||
Apple, Inc. | 242,400 | 31,495 | ||||||
Hexagon AB, Class B | 2,920,500 | 30,700 | ||||||
MongoDB, Inc., Class A1 | 139,000 | 27,361 | ||||||
Keyence Corp. | 69,400 | 27,170 | ||||||
NVIDIA Corp. | 167,500 | 24,478 | ||||||
Mastercard, Inc., Class A | 53,300 | 18,534 | ||||||
EPAM Systems, Inc.1 | 50,700 | 16,616 | ||||||
Visa, Inc., Class A | 70,197 | 14,584 | ||||||
Capgemini SE | 85,000 | 14,256 | ||||||
Network International Holdings PLC1 | 3,731,800 | 13,366 | ||||||
DocuSign, Inc.1 | 180,000 | 9,976 | ||||||
Shopify, Inc., Class A, subordinate voting shares1 | 195,000 | 6,768 | ||||||
|
| |||||||
| 1,566,999 | ||||||||
|
| |||||||
Health care 21.87% | ||||||||
Novo Nordisk A/S, Class B | 1,706,930 | 231,118 | ||||||
UnitedHealth Group, Inc. | 335,800 | 178,034 | ||||||
DexCom, Inc.1 | 1,012,000 | 114,599 | ||||||
ResMed, Inc. | 509,000 | 105,938 | ||||||
AstraZeneca PLC | 748,300 | 101,556 | ||||||
Pfizer, Inc. | 1,884,219 | 96,547 | ||||||
Cigna Corp. | 259,119 | 85,857 | ||||||
Merck & Co., Inc. | 620,000 | 68,789 | ||||||
Regeneron Pharmaceuticals, Inc.1 | 95,036 | 68,568 | ||||||
Eli Lilly and Company | 158,300 | 57,912 | ||||||
EssilorLuxottica | 266,943 | 48,609 | ||||||
Gilead Sciences, Inc. | 457,317 | 39,261 | ||||||
Mettler-Toledo International, Inc.1 | 25,400 | 36,714 | ||||||
NovoCure, Ltd.1 | 340,000 | 24,939 | ||||||
Alnylam Pharmaceuticals, Inc.1 | 104,200 | 24,763 | ||||||
CVS Health Corp. | 243,600 | 22,701 | ||||||
Danaher Corp. | 82,100 | 21,791 | ||||||
Bayer AG | 363,860 | 18,787 | ||||||
Seagen, Inc.1 | 127,200 | 16,346 | ||||||
Novartis AG | 165,600 | 15,000 | ||||||
Zoetis, Inc., Class A | 98,300 | 14,406 | ||||||
Eurofins Scientific SE, non-registered shares | 182,400 | 13,135 | ||||||
Sanofi | 135,000 | �� | 13,063 | |||||
Vertex Pharmaceuticals, Inc.1 | 43,700 | 12,620 | ||||||
Olympus Corp. | 665,800 | 11,769 | ||||||
Centene Corp.1 | 143,500 | 11,768 | ||||||
Genus PLC | 270,000 | 9,731 | ||||||
Thermo Fisher Scientific, Inc. | 17,472 | 9,622 | ||||||
Siemens Healthineers AG | 178,000 | 8,905 | ||||||
Bachem Holding AG | 101,500 | 8,853 | ||||||
Virbac SA | 36,000 | 8,825 | ||||||
Catalent, Inc.1 | 166,200 | 7,481 | ||||||
Rede D’Or Sao Luiz SA | 1,073,663 | 6,015 | ||||||
46 American Funds Insurance Series
Table of Contents
Global Growth Fund (continued)
Common stocks (continued)
| Shares | Value (000) | |||||||
Health care (continued) | ||||||||
Organon & Co. | 62,000 | $ | 1,732 | |||||
Viatris, Inc. | 110,678 | 1,232 | ||||||
EUROAPI1 | 5,869 | 87 | ||||||
|
| |||||||
| 1,517,073 | ||||||||
|
| |||||||
Consumer discretionary 13.94% | ||||||||
Chipotle Mexican Grill, Inc.1 | 141,600 | 196,468 | ||||||
LVMH Moët Hennessy-Louis Vuitton SE | 236,818 | 172,035 | ||||||
Floor & Decor Holdings, Inc., Class A1 | 914,698 | 63,690 | ||||||
MGM China Holdings, Ltd.1 | 54,589,200 | 60,155 | ||||||
Renault SA1 | 1,688,781 | 56,267 | ||||||
Prosus NV, Class N | 760,993 | 52,246 | ||||||
Amazon.com, Inc.1 | 524,248 | 44,037 | ||||||
NIKE, Inc., Class B | 352,600 | 41,258 | ||||||
Cie. Financière Richemont SA, Class A | 291,500 | 37,722 | ||||||
Wynn Macau, Ltd.1 | 21,430,000 | 23,884 | ||||||
Coupang, Inc., Class A1 | 1,445,604 | 21,265 | ||||||
YUM! Brands, Inc. | 166,000 | 21,261 | ||||||
Booking Holdings, Inc.1 | 9,900 | 19,951 | ||||||
Domino’s Pizza Enterprises, Ltd. | 430,000 | 19,367 | ||||||
MercadoLibre, Inc.1 | 22,250 | 18,829 | ||||||
Home Depot, Inc. | 59,500 | 18,794 | ||||||
Melco Resorts & Entertainment, Ltd. (ADR)1 | 1,559,600 | 17,935 | ||||||
IDP Education, Ltd. | 871,300 | 16,102 | ||||||
Evolution AB | 140,000 | 13,673 | ||||||
Dollar Tree Stores, Inc.1 | 95,000 | 13,437 | ||||||
Moncler SpA | 217,370 | 11,571 | ||||||
Entain PLC | 665,250 | 10,666 | ||||||
Target Corp. | 60,500 | 9,017 | ||||||
Tesla, Inc.1 | 60,000 | 7,391 | ||||||
|
| |||||||
| 967,021 | ||||||||
|
| |||||||
Financials 8.92% | ||||||||
AIA Group, Ltd. | 10,109,600 | 111,378 | ||||||
Tradeweb Markets, Inc., Class A | 1,634,960 | 106,158 | ||||||
AXA SA | 1,692,893 | 47,182 | ||||||
Kotak Mahindra Bank, Ltd. | 1,696,000 | 37,316 | ||||||
Aon PLC, Class A | 101,000 | 30,314 | ||||||
Prudential PLC | 2,203,282 | 29,816 | ||||||
HDFC Bank, Ltd. | 1,464,450 | 28,828 | ||||||
Citigroup, Inc. | 569,715 | 25,768 | ||||||
Ping An Insurance (Group) Company of China, Ltd., Class H | 3,855,500 | 25,447 | ||||||
Société Générale | 1,011,450 | 25,378 | ||||||
Blackstone, Inc., nonvoting shares | 312,000 | 23,147 | ||||||
China Merchants Bank Co., Ltd., Class H | 3,867,000 | 21,436 | ||||||
Zurich Insurance Group AG | 42,200 | 20,166 | ||||||
Banco Santander, SA | 5,334,500 | 15,976 | ||||||
Wells Fargo & Company | 377,200 | 15,575 | ||||||
London Stock Exchange Group PLC | 165,000 | 14,237 | ||||||
AU Small Finance Bank, Ltd. | 1,416,725 | 11,157 | ||||||
Bank of America Corp. | 320,200 | 10,605 | ||||||
HDFC Life Insurance Company, Ltd. | 1,406,500 | 9,600 | ||||||
Tokio Marine Holdings, Inc. | 368,300 | 7,884 | ||||||
Jackson Financial, Inc., Class A | 44,327 | 1,542 | ||||||
Moscow Exchange MICEX-RTS PJSC1,2 | 12,640,000 | — | 3 | |||||
|
| |||||||
| 618,910 | ||||||||
|
| |||||||
Consumer staples 8.57% | ||||||||
British American Tobacco PLC | 3,329,455 | 132,095 | ||||||
Philip Morris International, Inc. | 1,086,204 | 109,935 | ||||||
Altria Group, Inc. | 1,523,500 | 69,639 | ||||||
Kweichow Moutai Co., Ltd., Class A | 278,166 | 68,834 | ||||||
American Funds Insurance Series 47
Table of Contents
Global Growth Fund (continued)
Common stocks (continued)
| Shares | Value (000) | |||||||
Consumer staples (continued) | ||||||||
Keurig Dr Pepper, Inc. | 1,624,000 | $ | 57,912 | |||||
Nestlé SA | 460,353 | 53,164 | ||||||
Monster Beverage Corp.1 | 336,502 | 34,165 | ||||||
Costco Wholesale Corp. | 39,170 | 17,881 | ||||||
Carrefour SA, non-registered shares | 1,055,594 | 17,662 | ||||||
Pernod Ricard SA | 73,000 | 14,349 | ||||||
Simply Good Foods Co.1 | 263,800 | 10,032 | ||||||
Bunge, Ltd. | 85,000 | 8,481 | ||||||
|
| |||||||
| 594,149 | ||||||||
|
| |||||||
Industrials 7.54% | ||||||||
Carrier Global Corp. | 1,366,400 | 56,364 | ||||||
Caterpillar, Inc. | 231,600 | 55,482 | ||||||
Boeing Company1 | 239,000 | 45,527 | ||||||
MTU Aero Engines AG | 167,000 | 36,146 | ||||||
Alliance Global Group, Inc. | 156,400,700 | 33,466 | ||||||
Airbus SE, non-registered shares | 245,400 | 29,179 | ||||||
DSV A/S | 171,230 | 27,158 | ||||||
NIBE Industrier AB, Class B | 2,328,700 | 21,776 | ||||||
Techtronic Industries Co., Ltd. | 1,883,000 | 20,967 | ||||||
CSX Corp. | 635,000 | 19,672 | ||||||
Safran SA | 156,300 | 19,532 | ||||||
GT Capital Holdings, Inc. | 2,454,611 | 19,234 | ||||||
Rentokil Initial PLC | 2,380,000 | 14,628 | ||||||
Kone OYJ, Class B | 273,500 | 14,166 | ||||||
Canadian Pacific Railway, Ltd. (CAD denominated) | 183,000 | 13,644 | ||||||
ASSA ABLOY AB, Class B | 611,000 | 13,146 | ||||||
L3Harris Technologies, Inc. | 62,600 | 13,034 | ||||||
Recruit Holdings Co., Ltd. | 374,200 | 11,901 | ||||||
Daikin Industries, Ltd. | 74,600 | 11,476 | ||||||
Rheinmetall AG | 52,200 | 10,397 | ||||||
BayCurrent Consulting, Inc. | 321,000 | 10,037 | ||||||
SMC Corp. | 22,500 | 9,523 | ||||||
Suzhou Maxwell Technologies Co., Ltd., Class A | 156,970 | 9,302 | ||||||
Nidec Corp. | 143,000 | 7,447 | ||||||
|
| |||||||
| 523,204 | ||||||||
|
| |||||||
Energy 4.84% | ||||||||
TotalEnergies SE | 1,210,900 | 75,578 | ||||||
Canadian Natural Resources, Ltd. (CAD denominated) | 1,281,064 | 71,140 | ||||||
Cenovus Energy, Inc. (CAD denominated) | 3,151,200 | 61,139 | ||||||
Reliance Industries, Ltd. | 1,601,273 | 49,121 | ||||||
Tourmaline Oil Corp. | 430,700 | 21,732 | ||||||
Equinor ASA | 592,000 | 21,234 | ||||||
Aker BP ASA | 599,979 | 18,702 | ||||||
Halliburton Company | 235,128 | 9,252 | ||||||
Gaztransport & Technigaz SA | 75,000 | 8,013 | ||||||
Gazprom PJSC2 | 8,346,000 | — | 3 | |||||
LUKOIL Oil Co. PJSC2 | 246,300 | — | 3 | |||||
|
| |||||||
| 335,911 | ||||||||
|
| |||||||
Materials 3.25% | ||||||||
Sherwin-Williams Company | 385,500 | 91,491 | ||||||
Linde PLC | 169,940 | 55,431 | ||||||
Vale SA, ordinary nominative shares | 1,577,389 | 26,554 | ||||||
First Quantum Minerals, Ltd. | 706,200 | 14,755 | ||||||
Shin-Etsu Chemical Co., Ltd. | 113,500 | 13,828 | ||||||
Corteva, Inc. | 201,300 | 11,832 | ||||||
Koninklijke DSM NV | 93,100 | 11,414 | ||||||
|
| |||||||
| 225,305 | ||||||||
|
| |||||||
48 American Funds Insurance Series
Table of Contents
Global Growth Fund (continued)
Common stocks (continued)
| Shares | Value (000) | |||||||
Communication services 2.68% | ||||||||
Alphabet, Inc., Class A1 | 1,236,600 | $ | 109,105 | |||||
Meta Platforms, Inc., Class A1 | 190,923 | 22,976 | ||||||
Publicis Groupe SA | 273,000 | 17,336 | ||||||
Sea, Ltd., Class A (ADR)1 | 273,336 | 14,222 | ||||||
Tencent Holdings, Ltd. | 297,100 | 12,627 | ||||||
Bharti Airtel, Ltd. | 945,000 | 9,186 | ||||||
|
| |||||||
| 185,452 | ||||||||
|
| |||||||
Real estate 0.18% | ||||||||
Goodman Logistics (HK), Ltd. REIT | 1,027,500 | 12,072 | ||||||
|
| |||||||
Utilities 0.11% | ||||||||
Brookfield Infrastructure Partners, LP | 247,500 | 7,666 | ||||||
|
| |||||||
Total common stocks (cost: $4,798,092,000) | 6,553,762 | |||||||
|
| |||||||
Preferred securities 1.66% | ||||||||
Health care 1.36% | ||||||||
Sartorius AG, nonvoting non-registered preferred shares | 239,000 | 94,514 | ||||||
|
| |||||||
Information technology 0.30% | ||||||||
Samsung Electronics Co., Ltd., nonvoting preferred shares | 512,300 | 20,614 | ||||||
|
| |||||||
Total preferred securities (cost: $27,546,000) | 115,128 | |||||||
|
| |||||||
Short-term securities 4.03% | ||||||||
Money market investments 2.37% | ||||||||
Capital Group Central Cash Fund 4.31%4,5 | 1,645,519 | 164,535 | ||||||
|
| |||||||
Weighted average yield at acquisition | Principal amount (000) | |||||||||||
Commercial paper 1.66% | ||||||||||||
KfW 1/27/20236 | 3.890 | % | USD | 65,000 | 64,782 | |||||||
Toronto-Dominion Bank 1/27/20236 | 4.130 | 50,000 | 49,833 | |||||||||
|
| |||||||||||
| 114,615 | ||||||||||||
|
| |||||||||||
Total short-term securities (cost: $279,166,000) | 279,150 | |||||||||||
|
| |||||||||||
Total investment securities 100.18% (cost: $5,104,804,000) | 6,948,040 | |||||||||||
Other assets less liabilities (0.18)% | (12,386 | ) | ||||||||||
|
| |||||||||||
Net assets 100.00% | $ | 6,935,654 | ||||||||||
|
| |||||||||||
American Funds Insurance Series 49
Table of Contents
Global Growth Fund (continued)
Investments in affiliates5
| Value of affiliates at 1/1/2022 (000) | Additions (000) | Reductions (000) | Net realized loss (000) | Net unrealized depreciation (000) | Value of affiliates at 12/31/2022 (000) | Dividend income (000) | ||||||||||||||||||||||
Short-term securities 2.37% | $ | 376,714 | $ | 1,480,091 | $ | 1,692,180 | $ | (71 | ) | $ | (19 | ) | $ | 164,535 | $ | 9,353 | ||||||||||||
Money market investments purchased with collateral from securities on loan 0.00% | ||||||||||||||||||||||||||||
Capital Group Central Cash Fund 4.31%4 | 1,808 | 1,808 | 7 | — | — | 8 | ||||||||||||||||||||||
|
|
|
|
|
|
|
| |||||||||||||||||||||
Total 2.37% | $ | (71 | ) | $ | (19 | ) | $ | 164,535 | $ | 9,353 | ||||||||||||||||||
|
|
|
|
|
|
|
| |||||||||||||||||||||
| 1 | Security did not produce income during the last 12 months. |
| 2 | Value determined using significant unobservable inputs. |
| 3 | Amount less than one thousand. |
| 4 | Rate represents the seven-day yield at 12/31/2022. |
| 5 | Part of the same “group of investment companies“ as the fund as defined under the Investment Company Act of 1940, as amended. |
| 6 | Acquired in a transaction exempt from registration under Rule 144A or, for commercial paper, Section 4(a)(2) of the Securities Act of 1933. May be resold in the U.S. in transactions exempt from registration, normally to qualified institutional buyers. The total value of all such securities was $114,615,000, which represented 1.65% of the net assets of the fund. |
| 7 | Represents net activity. Refer to Note 5 for more information on securities lending. |
| 8 | Dividend income is included with securities lending income in the fund’s statement of operations and is not shown in this table. |
Key to abbreviations
ADR = American Depositary Receipts
CAD = Canadian dollars
REIT = Real Estate Investment Trust
USD = U.S. dollars
Refer to the notes to financial statements.
50 American Funds Insurance Series
Table of Contents
Global Small Capitalization Fund
Investment portfolio December 31, 2022
Common stocks 96.00%
| Shares | Value (000) | |||||||
Industrials 20.67% | ||||||||
International Container Terminal Services, Inc. | 11,690,490 | $ | 42,075 | |||||
Visional, Inc.1 | 504,850 | 33,522 | ||||||
Stericycle, Inc.1 | 571,050 | 28,490 | ||||||
Japan Airport Terminal Co., Ltd.1 | 559,900 | 27,843 | ||||||
IMCD NV | 177,337 | 25,330 | ||||||
Fasadgruppen Group AB | 2,370,503 | 23,995 | ||||||
Trelleborg AB, Class B | 982,292 | 22,727 | ||||||
Boyd Group Services, Inc. | 146,809 | 22,678 | ||||||
Cleanaway Waste Management, Ltd. | 12,501,414 | 22,274 | ||||||
Interpump Group SpA | 454,700 | 20,598 | ||||||
Saia, Inc.1 | 80,994 | 16,983 | ||||||
CG Power and Industrial Solutions, Ltd.1 | 4,880,108 | 15,908 | ||||||
Instalco AB | 4,098,065 | 15,622 | ||||||
Montrose Environmental Group, Inc.1 | 348,186 | 15,456 | ||||||
Alfen NV1 | 162,431 | 14,668 | ||||||
Dürr AG | 426,625 | 14,396 | ||||||
ALS, Ltd. | 1,639,100 | 13,632 | ||||||
Cargotec OYJ, Class B, non-registered shares | 300,450 | 13,341 | ||||||
Wizz Air Holdings PLC1 | 522,941 | 11,979 | ||||||
Daiseki Co., Ltd. | 313,600 | 10,798 | ||||||
AirTAC International Group | 355,062 | 10,747 | ||||||
Woodward, Inc. | 105,000 | 10,144 | ||||||
Rumo SA | 2,802,100 | 9,877 | ||||||
Japan Elevator Service Holdings Co., Ltd. | 787,656 | 9,866 | ||||||
The AZEK Co., Inc., Class A1 | 482,390 | 9,802 | ||||||
Comfort Systems USA, Inc. | 84,100 | 9,678 | ||||||
Centre Testing International Group Co., Ltd. | 2,684,839 | 8,615 | ||||||
Melrose Industries PLC | 5,266,169 | 8,561 | ||||||
DL E&C Co., Ltd. | 287,442 | 7,732 | ||||||
Guangzhou Baiyun International Airport Co., Ltd., Class A1 | 3,524,879 | 7,613 | ||||||
Engcon AB, Class B1,2 | 1,070,647 | 6,833 | ||||||
Carel Industries SpA | 252,900 | 6,357 | ||||||
Burckhardt Compression Holding AG | 9,963 | 5,929 | ||||||
Kajaria Ceramics, Ltd. | 422,763 | 5,916 | ||||||
Hensoldt AG | 248,197 | 5,873 | ||||||
Diploma PLC | 161,300 | 5,420 | ||||||
SIS, Ltd.1 | 1,128,949 | 5,353 | ||||||
GVS SpA1,2 | 1,192,262 | 5,159 | ||||||
Reliance Worldwide Corp., Ltd. | 2,548,379 | 5,127 | ||||||
Addtech AB, Class B | 353,050 | 5,054 | ||||||
KEI Industries, Ltd. | 267,444 | 4,724 | ||||||
First Advantage Corp.1 | 361,017 | 4,693 | ||||||
Vicor Corp.1 | 85,683 | 4,605 | ||||||
Harsha Engineers International, Ltd.1 | 970,777 | 4,488 | ||||||
ICF International, Inc. | 43,592 | 4,318 | ||||||
Sulzer AG | 54,789 | 4,278 | ||||||
Controladora Vuela Compañía de Aviación, SAB de CV, Class A (ADR),ordinary participation certificates1 | 460,200 | 3,847 | ||||||
LIXIL Corp. | 196,500 | 2,995 | ||||||
Trex Co., Inc.1 | 59,516 | 2,519 | ||||||
Aalberts NV, non-registered shares | 64,502 | 2,508 | ||||||
Dätwyler Holding, Inc., non-registered shares | 12,348 | 2,466 | ||||||
Antares Vision SpA1 | 281,100 | 2,418 | ||||||
Chart Industries, Inc.1 | 16,174 | 1,864 | ||||||
Matson, Inc. | 8,674 | 542 | ||||||
|
| |||||||
| 608,236 | ||||||||
|
| |||||||
Information technology 18.70% | ||||||||
Wolfspeed, Inc.1 | 790,681 | 54,589 | ||||||
eMemory Technology, Inc. | 910,430 | 39,481 | ||||||
Net One Systems Co., Ltd. | 1,201,156 | 31,223 | ||||||
Nordic Semiconductor ASA1 | 1,677,583 | 28,098 | ||||||
American Funds Insurance Series 51
Table of Contents
Global Small Capitalization Fund (continued)
Common stocks (continued)
| Shares | Value (000) | |||||||
Information technology (continued) | ||||||||
Confluent, Inc., Class A1 | 1,096,085 | $ | 24,377 | |||||
PAR Technology Corp.1,2 | 837,615 | 21,837 | ||||||
SUMCO Corp. | 1,466,300 | 19,620 | ||||||
ALTEN SA, non-registered shares | 142,299 | 17,869 | ||||||
Kingdee International Software Group Co., Ltd.1 | 7,337,224 | 15,619 | ||||||
Extreme Networks, Inc.1 | 828,378 | 15,168 | ||||||
BE Semiconductor Industries NV | 235,536 | 14,308 | ||||||
Smartsheet, Inc., Class A1 | 346,627 | 13,643 | ||||||
Euronet Worldwide, Inc.1 | 144,187 | 13,608 | ||||||
Ceridian HCM Holding, Inc.1 | 211,500 | 13,568 | ||||||
Silicon Laboratories, Inc.1 | 95,000 | 12,889 | ||||||
Tanla Platforms, Ltd. | 1,477,291 | 12,708 | ||||||
MACOM Technology Solutions Holdings, Inc.1 | 190,000 | 11,966 | ||||||
Keywords Studios PLC | 344,606 | 11,355 | ||||||
Alphawave IP Group PLC1,2 | 8,897,291 | 10,900 | ||||||
SHIFT, Inc.1 | 59,200 | 10,521 | ||||||
SINBON Electronics Co., Ltd. | 1,142,550 | 10,218 | ||||||
OVH Groupe SAS1,2 | 591,394 | 10,169 | ||||||
Qorvo, Inc.1 | 110,518 | 10,017 | ||||||
Pegasystems, Inc. | 288,141 | 9,866 | ||||||
GitLab, Inc., Class A1,2 | 213,816 | 9,716 | ||||||
SimCorp AS | 139,192 | 9,512 | ||||||
CCC Intelligent Solutions Holdings, Inc.1 | 1,033,074 | 8,988 | ||||||
Aspen Technology, Inc.1 | 36,561 | 7,510 | ||||||
Credo Technology Group Holding, Ltd.1 | 555,400 | 7,392 | ||||||
INFICON Holding AG | 7,397 | 6,462 | ||||||
Cognex Corp. | 116,600 | 5,493 | ||||||
Bentley Systems, Inc., Class B | 142,373 | 5,262 | ||||||
Unity Software, Inc.1,2 | 183,231 | 5,239 | ||||||
Kingboard Laminates Holdings, Ltd. | 4,498,000 | 4,945 | ||||||
AvidXchange Holdings, Inc.1 | 489,768 | 4,868 | ||||||
Topicus.com, Inc., subordinate voting shares1 | 87,540 | 4,596 | ||||||
MongoDB, Inc., Class A1 | 23,300 | 4,586 | ||||||
Truecaller AB, Class B1,2 | 1,289,744 | 4,044 | ||||||
Linklogis, Inc., Class B1,2 | 6,753,115 | 3,482 | ||||||
Softcat PLC | 222,430 | 3,192 | ||||||
Globant SA1 | 17,730 | 2,981 | ||||||
Rapid7, Inc.1 | 71,250 | 2,421 | ||||||
Kingboard Holdings, Ltd. | 710,000 | 2,261 | ||||||
TELUS International (Cda), Inc., subordinate voting shares1,2 | 102,669 | 2,032 | ||||||
GlobalWafers Co., Ltd. | 145,000 | 2,014 | ||||||
LEM Holding SA | 990 | 1,922 | ||||||
Cvent Holding Corp.1 | 344,800 | 1,862 | ||||||
HashiCorp, Inc., Class A1 | 54,600 | 1,493 | ||||||
Bechtle AG, non-registered shares | 40,616 | 1,437 | ||||||
Marqeta, Inc., Class A1 | 212,881 | 1,301 | ||||||
Semtech Corp.1 | 32,200 | 924 | ||||||
Yotpo, Ltd.1,3,4 | 678,736 | 842 | ||||||
|
| |||||||
| 550,394 | ||||||||
|
| |||||||
Consumer discretionary 17.91% | ||||||||
Melco Resorts & Entertainment, Ltd. (ADR)1 | 3,600,384 | 41,404 | ||||||
Skechers USA, Inc., Class A1 | 700,000 | 29,365 | ||||||
Five Below, Inc.1 | 165,181 | 29,216 | ||||||
Thor Industries, Inc. | 370,472 | 27,967 | ||||||
Mattel, Inc.1 | 1,400,000 | 24,976 | ||||||
Wyndham Hotels & Resorts, Inc. | 332,330 | 23,698 | ||||||
Entain PLC | 1,424,930 | 22,847 | ||||||
YETI Holdings, Inc.1 | 547,131 | 22,602 | ||||||
NEXTAGE Co., Ltd. | 1,036,500 | 19,999 | ||||||
Domino’s Pizza Enterprises, Ltd.2 | 443,338 | 19,968 | ||||||
Light & Wonder, Inc.1 | 299,658 | 17,560 | ||||||
52 American Funds Insurance Series
Table of Contents
Global Small Capitalization Fund (continued)
Common stocks (continued)
| Shares | Value (000) | |||||||
Consumer discretionary (continued) | ||||||||
Asbury Automotive Group, Inc.1 | 97,426 | $ | 17,464 | |||||
Inchcape PLC | 1,719,150 | 16,969 | ||||||
Evolution AB | 172,264 | 16,824 | ||||||
DraftKings, Inc., Class A1,2 | 1,400,364 | 15,950 | ||||||
Lands’ End, Inc.1,5 | 2,100,000 | 15,939 | ||||||
Helen of Troy, Ltd.1 | 141,542 | 15,698 | ||||||
TopBuild Corp.1 | 82,261 | 12,873 | ||||||
WH Smith PLC | 701,756 | 12,524 | ||||||
Kindred Group PLC (SDR) | 1,164,011 | 12,150 | ||||||
Shoei Co., Ltd. | 281,700 | 11,006 | ||||||
Tongcheng Travel Holdings, Ltd.1 | 4,538,400 | 10,922 | ||||||
Golden Entertainment, Inc.1 | 256,800 | 9,604 | ||||||
Chervon Holdings, Ltd.2 | 1,635,700 | 9,023 | ||||||
Musti Group OYJ | 495,800 | 8,297 | ||||||
MRF, Ltd. | 7,160 | 7,650 | ||||||
Tube Investments of India, Ltd. | 204,200 | 6,852 | ||||||
Melco International Development, Ltd.1 | 6,130,000 | 6,655 | ||||||
Compagnie Plastic Omnium SA | 337,633 | 4,898 | ||||||
Zhongsheng Group Holdings, Ltd. | 938,500 | 4,784 | ||||||
Everi Holdings, Inc.1 | 330,000 | 4,736 | ||||||
Leslie’s, Inc.1 | 353,358 | 4,315 | ||||||
On Holding AG, Class A1 | 238,410 | 4,091 | ||||||
Elior Group SA1,2 | 1,153,174 | 4,066 | ||||||
Persimmon PLC | 255,136 | 3,766 | ||||||
Haichang Ocean Park Holdings, Ltd.1 | 17,691,000 | 3,617 | ||||||
IDP Education, Ltd. | 150,966 | 2,790 | ||||||
Arco Platform, Ltd., Class A1,2 | 158,600 | 2,141 | ||||||
DESCENTE, Ltd. | 81,425 | 2,003 | ||||||
|
| |||||||
| 527,209 | ||||||||
|
| |||||||
Health care 17.06% | ||||||||
Insulet Corp.1 | 322,368 | 94,901 | ||||||
Haemonetics Corp.1 | 960,147 | 75,516 | ||||||
Globus Medical, Inc., Class A1 | 464,688 | 34,512 | ||||||
Oak Street Health, Inc.1 | 1,542,490 | 33,179 | ||||||
Integra LifeSciences Holdings Corp.1 | 527,958 | 29,603 | ||||||
Max Healthcare Institute, Ltd.1 | 4,669,887 | 24,816 | ||||||
CONMED Corp. | 200,920 | 17,810 | ||||||
CanSino Biologics, Inc., Class H | 1,864,200 | 15,948 | ||||||
Vaxcyte, Inc.1 | 274,959 | 13,184 | ||||||
Ocumension Therapeutics1 | 9,650,966 | 12,105 | ||||||
Hapvida Participações e Investimentos SA1 | 12,352,106 | 11,885 | ||||||
Bachem Holding AG | 135,555 | 11,823 | ||||||
Angelalign Technology, Inc. | 640,800 | 10,100 | ||||||
ICON PLC1 | 46,061 | 8,947 | ||||||
Shandong Pharmaceutical Glass Co., Ltd., Class A | 2,180,508 | 8,890 | ||||||
CompuGroup Medical SE & Co. KGaA | 228,815 | 8,808 | ||||||
Ambu AS, Class B, non-registered shares1 | 683,462 | 8,672 | ||||||
Penumbra, Inc.1 | 36,200 | 8,053 | ||||||
Netcare, Ltd. | 8,818,088 | 7,527 | ||||||
iRhythm Technologies, Inc.1 | 79,700 | 7,466 | ||||||
Denali Therapeutics, Inc.1 | 257,903 | 7,172 | ||||||
Encompass Health Corp. | 117,866 | 7,050 | ||||||
New Horizon Health, Ltd.1 | 3,007,844 | 6,730 | ||||||
Medmix AG | 324,953 | 6,200 | ||||||
Health Catalyst, Inc.1 | 568,785 | 6,046 | ||||||
Hypera SA, ordinary nominative shares | 582,885 | 4,990 | ||||||
Amplifon SpA | 141,536 | 4,228 | ||||||
The Ensign Group, Inc. | 39,450 | 3,732 | ||||||
Masimo Corp.1 | 23,687 | 3,505 | ||||||
Amvis Holdings, Inc. | 122,400 | 3,113 | ||||||
Nordhealth AS, Class A1,2 | 1,279,999 | 2,916 | ||||||
American Funds Insurance Series 53
Table of Contents
Global Small Capitalization Fund (continued)
Common stocks (continued)
| Shares | Value (000) | |||||||
Health care (continued) | ||||||||
Gland Pharma, Ltd.1 | 90,000 | $ | 1,715 | |||||
Beam Therapeutics, Inc.1 | 22,757 | 890 | ||||||
DiaSorin Italia SpA | 292 | 41 | ||||||
|
| |||||||
| 502,073 | ||||||||
|
| |||||||
Financials 8.75% | ||||||||
Star Health & Allied Insurance Co., Ltd.1 | 6,037,336 | 41,333 | ||||||
Cholamandalam Investment and Finance Co., Ltd. | 3,684,053 | 32,078 | ||||||
Eurobank Ergasias Services and Holdings SA1 | 17,966,239 | 20,281 | ||||||
Independent Bank Group, Inc. | 280,449 | 16,849 | ||||||
Stifel Financial Corp. | 271,050 | 15,821 | ||||||
Glacier Bancorp, Inc. | 286,088 | 14,139 | ||||||
Fukuoka Financial Group, Inc. | 572,200 | 13,049 | ||||||
IIFL Finance, Ltd. | 2,116,842 | 12,316 | ||||||
IIFL Wealth Management, Ltd. | 513,500 | 11,028 | ||||||
Janus Henderson Group PLC | 440,000 | 10,349 | ||||||
Bridgepoint Group PLC | 3,459,845 | 8,017 | ||||||
Remgro, Ltd. | 965,035 | 7,551 | ||||||
Five-Star Business Finance, Ltd.1 | 993,023 | 7,268 | ||||||
Patria Investments, Ltd., Class A | 508,200 | 7,079 | ||||||
Aptus Value Housing Finance India, Ltd. | 1,816,424 | 6,657 | ||||||
SiriusPoint, Ltd.1 | 1,100,000 | 6,490 | ||||||
Aavas Financiers, Ltd.1 | 272,734 | 6,072 | ||||||
Eastern Bankshares, Inc. | 278,164 | 4,798 | ||||||
AU Small Finance Bank, Ltd. | 483,716 | 3,809 | ||||||
SouthState Corp. | 46,350 | 3,539 | ||||||
Allfunds Group PLC | 470,000 | 3,284 | ||||||
East West Bancorp, Inc. | 49,700 | 3,275 | ||||||
Capitec Bank Holdings, Ltd. | 15,161 | 1,658 | ||||||
PT Bank Raya Indonesia Tbk1 | 23,860,996 | 619 | ||||||
|
| |||||||
| 257,359 | ||||||||
|
| |||||||
Materials 3.56% | ||||||||
JSR Corp. | 1,140,088 | 22,469 | ||||||
LANXESS AG | 441,240 | 17,807 | ||||||
OZ Minerals, Ltd. | 648,901 | 12,142 | ||||||
Navin Fluorine International, Ltd. | 175,000 | 8,586 | ||||||
PI Industries, Ltd. | 188,382 | 7,772 | ||||||
Zeon Corp. | 768,700 | 7,730 | ||||||
Vidrala, SA, non-registered shares | 64,918 | 5,581 | ||||||
MMG, Ltd.1 | 14,608,000 | 3,728 | ||||||
Materion Corp. | 41,809 | 3,659 | ||||||
Toyo Gosei Co., Ltd.2 | 63,400 | 3,485 | ||||||
Recticel SA/NV | 175,000 | 2,921 | ||||||
Mayr-Melnhof Karton AG, non-registered shares | 17,479 | 2,824 | ||||||
Livent Corp.1 | 130,000 | 2,583 | ||||||
Perimeter Solutions SA1,2 | 221,167 | 2,021 | ||||||
Huhtamäki OYJ | 42,500 | 1,455 | ||||||
Covestro AG, non-registered shares | 2,600 | 102 | ||||||
|
| |||||||
| 104,865 | ||||||||
|
| |||||||
Real estate 2.53% | ||||||||
Altus Group, Ltd. | 551,189 | 21,999 | ||||||
Embassy Office Parks REIT | 4,939,400 | 20,043 | ||||||
Macrotech Developers, Ltd.1 | 582,697 | 7,685 | ||||||
JHSF Participações SA | 5,823,950 | 5,537 | ||||||
Mindspace Business Parks REIT | 1,250,000 | 5,054 | ||||||
ESR-Logos REIT | 15,133,928 | 4,166 | ||||||
54 American Funds Insurance Series
Table of Contents
Global Small Capitalization Fund (continued)
Common stocks (continued)
| Shares | Value (000) | |||||||
Real estate (continued) | ||||||||
Fibra Uno Administración, SA de CV REIT | 3,400,000 | $ | 4,006 | |||||
Corp. Inmobiliaria Vesta, SAB de CV | 1,606,000 | 3,833 | ||||||
Ayala Land, Inc. | 3,718,100 | 2,069 | ||||||
|
| |||||||
| 74,392 | ||||||||
|
| |||||||
Energy 1.89% | ||||||||
Venture Global LNG, Inc., Series C1,3,4 | 2,760 | 25,418 | ||||||
Subsea 7 SA | 1,050,980 | 12,088 | ||||||
DT Midstream, Inc. | 166,383 | 9,194 | ||||||
Weatherford International1 | 82,600 | 4,206 | ||||||
Worley, Ltd. | 350,000 | 3,577 | ||||||
Aegis Logistics, Ltd. | 199,283 | 838 | ||||||
Helmerich & Payne, Inc. | 7,700 | 382 | ||||||
|
| |||||||
| 55,703 | ||||||||
|
| |||||||
Communication services 1.77% | ||||||||
JCDecaux SE1 | 976,059 | 18,563 | ||||||
Lions Gate Entertainment Corp., Class B1 | 3,059,785 | 16,614 | ||||||
Rightmove PLC | 816,439 | 5,055 | ||||||
Bandwidth, Inc., Class A1 | 206,800 | 4,746 | ||||||
VTEX, Class A1 | 993,126 | 3,724 | ||||||
Trustpilot Group PLC1 | 2,966,832 | 3,473 | ||||||
|
| |||||||
| 52,175 | ||||||||
|
| |||||||
Utilities 1.62% | ||||||||
ACEN Corp. | 143,954,250 | 19,747 | ||||||
ENN Energy Holdings, Ltd. | 1,205,597 | 16,819 | ||||||
Brookfield Infrastructure Corp., Class A, subordinate voting shares | 157,667 | 6,133 | ||||||
Neoenergia SA | 1,442,015 | 4,220 | ||||||
SembCorp Industries, Ltd. | 282,600 | 712 | ||||||
|
| |||||||
| 47,631 | ||||||||
|
| |||||||
Consumer staples 1.54% | ||||||||
Grocery Outlet Holding Corp.1 | 621,782 | 18,150 | ||||||
Shop Apotheke Europe NV, non-registered shares1 | 169,500 | 8,003 | ||||||
Monde Nissin Corp. | 39,914,950 | 7,960 | ||||||
Scandinavian Tobacco Group A/S | 305,111 | 5,352 | ||||||
AAK AB | 223,527 | 3,819 | ||||||
Hilton Food Group PLC | 250,077 | 1,688 | ||||||
Zur Rose Group AG1,2 | 9,250 | 257 | ||||||
|
| |||||||
| 45,229 | ||||||||
|
| |||||||
Total common stocks (cost: $2,451,546,000) | 2,825,266 | |||||||
|
| |||||||
Preferred securities 0.87% | ||||||||
Information technology 0.62% | ||||||||
SmartHR, Inc., Series D, preferred shares1,3,4 | 3,006 | 10,752 | ||||||
Yotpo, Ltd., Series F, preferred shares1,3,4 | 2,158,609 | 2,677 | ||||||
Yotpo, Ltd., Series B, preferred shares1,3,4 | 287,894 | 357 | ||||||
Yotpo, Ltd., Series C, preferred shares1,3,4 | 274,070 | 340 | ||||||
Yotpo, Ltd., Series A-1, preferred shares1,3,4 | 183,819 | 228 | ||||||
Yotpo, Ltd., Series A, preferred shares1,3,4 | 89,605 | 111 | ||||||
Yotpo, Ltd., Series C-1, preferred shares1,3,4 | 75,980 | 94 | ||||||
Yotpo, Ltd., Series D, preferred shares1,3,4 | 42,368 | 52 | ||||||
Yotpo, Ltd., Series B-1, preferred shares1,3,4 | 33,838 | 42 | ||||||
Outreach Corp., Series G, preferred shares1,3,4 | 154,354 | 3,603 | ||||||
|
| |||||||
| 18,256 | ||||||||
|
| |||||||
American Funds Insurance Series 55
Table of Contents
Global Small Capitalization Fund (continued)
Preferred securities (continued)
| Shares | Value (000) | |||||||
Industrials 0.24% | ||||||||
Azul SA (ADR), preferred nominative shares1,2 | 1,128,836 | $ | 6,897 | |||||
Azul SA, preferred nominative shares1 | 109,500 | 229 | ||||||
|
| |||||||
| 7,126 | ||||||||
|
| |||||||
Health care 0.01% | ||||||||
PACT Pharma, Inc., Series C, 8.00% noncumulative preferred shares1,3,4 | 2,931,405 | 196 | ||||||
|
| |||||||
Total preferred securities (cost: $45,236,000) | 25,578 | |||||||
|
| |||||||
Rights & warrants 0.34% | ||||||||
Information technology 0.34% | ||||||||
OPT Machine Vision Tech Co., Ltd., Class A, warrants, expire 2/3/20231,6 | 526,700 | 10,007 | ||||||
|
| |||||||
Total rights & warrants (cost: $18,773,000) | 10,007 | |||||||
|
| |||||||
Short-term securities 5.05% | ||||||||
Money market investments 3.25% | ||||||||
Capital Group Central Cash Fund 4.31%5,7 | 958,183 | 95,809 | ||||||
|
| |||||||
Money market investments purchased with collateral from securities on loan 1.80% | ||||||||
Capital Group Central Cash Fund 4.31%5,7,8 | 232,377 | 23,235 | ||||||
Goldman Sachs Financial Square Government Fund, Institutional Shares 4.15%7,8 | 18,552,259 | 18,553 | ||||||
Invesco Short-Term Investments Trust – Government & Agency Portfolio, Institutional Class 4.22%7,8 | 10,793,666 | 10,794 | ||||||
State Street Institutional U.S. Government Money Market Fund, Institutional Class 4.09%7,8 | 271,134 | 271 | ||||||
|
| |||||||
| 52,853 | ||||||||
|
| |||||||
Total short-term securities (cost: $148,644,000) | 148,662 | |||||||
|
| |||||||
Total investment securities 102.26% (cost: $2,664,199,000) | 3,009,513 | |||||||
Other assets less liabilities (2.26)% | (66,610 | ) | ||||||
|
| |||||||
Net assets 100.00% | $ | 2,942,903 | ||||||
|
| |||||||
Investments in affiliates5
| Value of affiliates at 1/1/2022 (000) | Additions (000) | Reductions (000) | Net realized loss (000) | Net unrealized depreciation (000) | Value of affiliates at 12/31/2022 (000) | Dividend income (000) | ||||||||||||||||||||||
Common stocks 0.54% | ||||||||||||||||||||||||||||
Consumer discretionary 0.54% | ||||||||||||||||||||||||||||
Lands’ End, Inc.1 | $ | 41,223 | $ | — | $ | — | $ | — | $ | (25,284 | ) | $ | 15,939 | $ | — | |||||||||||||
Short-term securities 4.04% | ||||||||||||||||||||||||||||
Money market investments 3.25% | ||||||||||||||||||||||||||||
Capital Group Central Cash Fund 4.31%7 | 203,087 | 779,439 | 886,686 | (30 | ) | (1 | ) | 95,809 | 3,871 | |||||||||||||||||||
Money market investments purchased with collateral from securities on loan 0.79% | ||||||||||||||||||||||||||||
Capital Group Central Cash Fund 4.31%7,8 | 32,260 | 9,025 | 9 | 23,235 | — | 10 | ||||||||||||||||||||||
|
| |||||||||||||||||||||||||||
Total short-term securities | 119,044 | |||||||||||||||||||||||||||
|
|
|
|
|
|
|
| |||||||||||||||||||||
Total 4.58% | $ | (30 | ) | $ | (25,285 | ) | $ | 134,983 | $ | 3,871 | ||||||||||||||||||
|
|
|
|
|
|
|
| |||||||||||||||||||||
56 American Funds Insurance Series
Table of Contents
Global Small Capitalization Fund (continued)
Restricted securities4
| Acquisition date | Cost (000) | Value (000) | Percent of net assets | |||||||||||||
Venture Global LNG, Inc., Series C1,3 | 5/1/2015 | $ | 8,280 | $ | 25,418 | .86 | % | |||||||||
SmartHR, Inc., Series D, preferred shares1,3 | 5/28/2021 | 14,344 | 10,752 | .37 | ||||||||||||
Yotpo, Ltd., Series F, preferred shares1,3 | 2/25/2021 | 4,748 | 2,677 | .09 | ||||||||||||
Yotpo, Ltd.1,3 | 3/16/2021 | 1,418 | 842 | .03 | ||||||||||||
Yotpo, Ltd., Series B, preferred shares1,3 | 3/16/2021 | 602 | 357 | .01 | ||||||||||||
Yotpo, Ltd., Series C, preferred shares1,3 | 3/16/2021 | 573 | 340 | .01 | ||||||||||||
Yotpo, Ltd., Series A-1, preferred shares1,3 | 3/16/2021 | 384 | 228 | .01 | ||||||||||||
Yotpo, Ltd., Series A, preferred shares1,3 | 3/16/2021 | 187 | 111 | .01 | ||||||||||||
Yotpo, Ltd., Series C-1, preferred shares1,3 | 3/16/2021 | 159 | 94 | .00 | ||||||||||||
Yotpo, Ltd., Series D, preferred shares1,3 | 3/16/2021 | 89 | 52 | .00 | ||||||||||||
Yotpo, Ltd., Series B-1, preferred shares1,3 | 3/16/2021 | 71 | 42 | .00 | ||||||||||||
Outreach Corp., Series G, preferred shares1,3 | 5/27/2021 | 4,517 | 3,603 | .12 | ||||||||||||
PACT Pharma, Inc., Series C, 8.00% noncumulative preferred shares1,3 | 2/7/2020 | 6,000 | 196 | .01 | ||||||||||||
|
|
|
|
|
| |||||||||||
Total | $ | 41,372 | $ | 44,712 | 1.52 | % | ||||||||||
|
|
|
|
|
| |||||||||||
| 1 | Security did not produce income during the last 12 months. |
| 2 | All or a portion of this security was on loan. The total value of all such securities was $59,781,000, which represented 2.03% of the net assets of the fund. Refer to Note 5 for more information on securities lending. |
| 3 | Value determined using significant unobservable inputs. |
| 4 | Restricted security, other than Rule 144A securities or commercial paper issued pursuant to Section 4(a)(2) of the Securities Act of 1933. The total value of all such restricted securities was $44,712,000, which represented 1.52% of the net assets of the fund. |
| 5 | Affiliate of the fund or part of the same “group of investment companies” as the fund, as defined under the Investment Company Act of 1940, as amended. |
| 6 | Acquired in a transaction exempt from registration under Rule 144A or, for commercial paper, Section 4(a)(2) of the Securities Act of 1933. May be resold in the U.S. in transactions exempt from registration, normally to qualified institutional buyers. The total value of all such securities was $10,007,000, which represented .34% of the net assets of the fund. |
| 7 | Rate represents the seven-day yield at 12/31/2022. |
| 8 | Security purchased with cash collateral from securities on loan. Refer to Note 5 for more information on securities lending. |
| 9 | Represents net activity. Refer to Note 5 for more information on securities lending. |
| 10 | Dividend income is included with securities lending income in the fund’s statement of operations and is not shown in this table. |
Key to abbreviations
ADR = American Depositary Receipts
REIT = Real Estate Investment Trust
SDR = Swedish Depositary Receipts
| Refer | to the notes to financial statements. |
American Funds Insurance Series 57
Table of Contents
Investment portfolio December 31, 2022
Common stocks 96.12%
| Shares | Value (000) | |||||||
Information technology 20.03% | ||||||||
Microsoft Corp. | 6,282,998 | $ | 1,506,789 | |||||
Broadcom, Inc. | 1,265,075 | 707,341 | ||||||
ASML Holding NV | 736,108 | 398,458 | ||||||
ASML Holding NV (New York registered) (ADR) | 189,937 | 103,781 | ||||||
Visa, Inc., Class A | 1,198,388 | 248,977 | ||||||
Apple, Inc. | 1,694,416 | 220,156 | ||||||
Mastercard, Inc., Class A | 566,983 | 197,157 | ||||||
Fiserv, Inc.1 | 1,615,000 | 163,228 | ||||||
Synopsys, Inc.1 | 467,600 | 149,300 | ||||||
Motorola Solutions, Inc. | 510,100 | 131,458 | ||||||
Shopify, Inc., Class A, subordinate voting shares1 | 3,665,992 | 127,247 | ||||||
Applied Materials, Inc. | 1,199,328 | 116,791 | ||||||
Wolfspeed, Inc.1 | 1,655,641 | 114,305 | ||||||
RingCentral, Inc., Class A1 | 3,132,381 | 110,886 | ||||||
ServiceNow, Inc.1 | 269,875 | 104,784 | ||||||
Salesforce, Inc.1 | 787,000 | 104,348 | ||||||
Micron Technology, Inc. | 2,048,078 | 102,363 | ||||||
NVIDIA Corp. | 665,500 | 97,256 | ||||||
Taiwan Semiconductor Manufacturing Company, Ltd. | 5,456,000 | 79,519 | ||||||
Taiwan Semiconductor Manufacturing Company, Ltd. (ADR) | 209,700 | 15,621 | ||||||
Cloudflare, Inc., Class A1 | 1,858,800 | 84,036 | ||||||
Amadeus IT Group SA, Class A, non-registered shares1 | 1,612,361 | 83,150 | ||||||
Genpact, Ltd. | 1,524,231 | 70,602 | ||||||
Keyence Corp. | 165,500 | 64,794 | ||||||
Fidelity National Information Services, Inc. | 884,718 | 60,028 | ||||||
Toast, Inc., Class A1 | 3,143,518 | 56,678 | ||||||
CDW Corp. | 311,859 | 55,692 | ||||||
MongoDB, Inc., Class A1 | 279,700 | 55,056 | ||||||
SAP SE | 477,361 | 49,263 | ||||||
Constellation Software, Inc. | 31,255 | 48,798 | ||||||
GoDaddy, Inc., Class A1 | 645,081 | 48,265 | ||||||
Samsung Electronics Co., Ltd. | 1,085,000 | 47,846 | ||||||
Unity Software, Inc.1,2 | 1,660,000 | 47,459 | ||||||
Ceridian HCM Holding, Inc.1 | 712,011 | 45,676 | ||||||
Trimble, Inc.1 | 840,920 | 42,517 | ||||||
Concentrix Corp. | 305,551 | 40,687 | ||||||
Block, Inc., Class A1 | 635,970 | 39,964 | ||||||
DocuSign, Inc.1 | 718,524 | 39,821 | ||||||
Bill.com Holdings, Inc.1 | 358,729 | 39,087 | ||||||
MicroStrategy, Inc., Class A1 | 236,458 | 33,475 | ||||||
NetApp, Inc. | 527,540 | 31,684 | ||||||
Silicon Laboratories, Inc.1 | 231,815 | 31,450 | ||||||
MKS Instruments, Inc. | 360,705 | 30,563 | ||||||
Intel Corp. | 1,136,000 | 30,025 | ||||||
Smartsheet, Inc., Class A1 | 729,700 | 28,721 | ||||||
Adobe, Inc.1 | 69,034 | 23,232 | ||||||
VeriSign, Inc.1 | 110,053 | 22,609 | ||||||
Ciena Corp.1 | 416,000 | 21,208 | ||||||
Nuvei Corp., subordinate voting shares1 | 806,616 | 20,499 | ||||||
Intuit, Inc. | 52,500 | 20,434 | ||||||
TE Connectivity, Ltd. | 156,600 | 17,978 | ||||||
Alteryx, Inc., Class A1 | 286,092 | 14,496 | ||||||
Enphase Energy, Inc.1 | 45,303 | 12,004 | ||||||
TELUS International (Cda), Inc., subordinate voting shares1 | 533,800 | 10,564 | ||||||
Globant SA1 | 57,138 | 9,608 | ||||||
Kulicke and Soffa Industries, Inc. | 151,860 | 6,721 | ||||||
Stripe, Inc., Class B1,3,4 | 168,598 | 4,704 | ||||||
|
| |||||||
| 6,189,159 | ||||||||
|
| |||||||
58 American Funds Insurance Series
Table of Contents
Growth Fund (continued)
Common stocks (continued)
| Shares | Value (000) | |||||||
Health care 17.31% | ||||||||
Regeneron Pharmaceuticals, Inc.1 | 1,123,014 | $ | 810,243 | |||||
UnitedHealth Group, Inc. | 1,508,620 | 799,840 | ||||||
Intuitive Surgical, Inc.1 | 2,058,000 | 546,090 | ||||||
Alnylam Pharmaceuticals, Inc.1 | 2,075,046 | 493,135 | ||||||
Centene Corp.1 | 3,895,936 | 319,506 | ||||||
Thermo Fisher Scientific, Inc. | 532,200 | 293,077 | ||||||
Vertex Pharmaceuticals, Inc.1 | 879,601 | 254,011 | ||||||
Seagen, Inc.1 | 1,746,784 | 224,479 | ||||||
Moderna, Inc.1 | 1,200,000 | 215,544 | ||||||
NovoCure, Ltd.1 | 2,388,098 | 175,167 | ||||||
Eli Lilly and Company | 463,663 | 169,627 | ||||||
Pfizer, Inc. | 1,675,000 | 85,827 | ||||||
CVS Health Corp. | 909,400 | 84,747 | ||||||
Horizon Therapeutics PLC1 | 689,825 | 78,502 | ||||||
AstraZeneca PLC | 550,784 | 74,750 | ||||||
Edwards Lifesciences Corp.1 | 906,411 | 67,627 | ||||||
Danaher Corp. | 216,235 | 57,393 | ||||||
Molina Healthcare, Inc.1 | 145,723 | 48,121 | ||||||
Abbott Laboratories | 426,712 | 46,849 | ||||||
Verily Life Sciences, LLC1,3,4 | 300,178 | 45,222 | ||||||
Zimmer Biomet Holdings, Inc. | 353,900 | 45,122 | ||||||
Ascendis Pharma A/S (ADR)1 | 364,721 | 44,543 | ||||||
Zoetis, Inc., Class A | 297,320 | 43,572 | ||||||
Mettler-Toledo International, Inc.1 | 26,000 | 37,582 | ||||||
Humana, Inc. | 65,982 | 33,795 | ||||||
Align Technology, Inc.1 | 160,000 | 33,744 | ||||||
Karuna Therapeutics, Inc.1 | 170,239 | 33,452 | ||||||
Guardant Health, Inc.1 | 1,166,810 | 31,737 | ||||||
Novo Nordisk A/S, Class B | 225,077 | 30,475 | ||||||
Catalent, Inc.1 | 409,100 | 18,414 | ||||||
Oak Street Health, Inc.1 | 806,352 | 17,345 | ||||||
Exact Sciences Corp.1 | 341,000 | 16,883 | ||||||
DexCom, Inc.1 | 148,800 | 16,850 | ||||||
Pacific Biosciences of California, Inc.1 | 1,613,190 | 13,196 | ||||||
CRISPR Therapeutics AG1 | 262,678 | 10,678 | ||||||
Galapagos NV1 | 231,294 | 10,259 | ||||||
R1 RCM, Inc.1 | 912,865 | 9,996 | ||||||
Ultragenyx Pharmaceutical, Inc.1 | 161,278 | 7,472 | ||||||
Fate Therapeutics, Inc.1 | 233,700 | 2,358 | ||||||
Biohaven, Ltd.1 | 65,550 | 910 | ||||||
Sana Biotechnology, Inc.1,2 | 179,600 | 710 | ||||||
|
| |||||||
| 5,348,850 | ||||||||
|
| |||||||
Consumer discretionary 16.94% | ||||||||
Tesla, Inc.1 | 10,830,000 | 1,334,039 | ||||||
D.R. Horton, Inc. | 5,494,844 | 489,810 | ||||||
Amazon.com, Inc.1 | 4,125,222 | 346,519 | ||||||
Home Depot, Inc. | 1,031,000 | 325,652 | ||||||
Dollar Tree Stores, Inc.1 | 1,965,915 | 278,059 | ||||||
Las Vegas Sands Corp.1 | 5,500,000 | 264,385 | ||||||
LVMH Moët Hennessy-Louis Vuitton SE | 313,000 | 227,377 | ||||||
Chipotle Mexican Grill, Inc.1 | 120,100 | 166,637 | ||||||
Dollar General Corp. | 657,120 | 161,816 | ||||||
Target Corp. | 1,030,200 | 153,541 | ||||||
Hermès International | 94,901 | 146,446 | ||||||
Burlington Stores, Inc.1 | 664,250 | 134,683 | ||||||
Royal Caribbean Cruises, Ltd.1 | 2,282,305 | 112,814 | ||||||
Aramark | 2,454,864 | 101,484 | ||||||
DoorDash, Inc., Class A1 | 2,000,000 | 97,640 | ||||||
Etsy, Inc.1 | 770,678 | 92,312 | ||||||
Airbnb, Inc., Class A1 | 1,044,500 | 89,305 | ||||||
NVR, Inc.1 | 18,380 | 84,779 | ||||||
American Funds Insurance Series 59
Table of Contents
Growth Fund (continued)
Common stocks (continued)
| Shares | Value (000) | |||||||
Consumer discretionary (continued) | ||||||||
NIKE, Inc., Class B | 543,416 | $ | 63,585 | |||||
Norwegian Cruise Line Holdings, Ltd.1,2 | 5,159,551 | 63,153 | ||||||
Darden Restaurants, Inc. | 387,870 | 53,654 | ||||||
O’Reilly Automotive, Inc.1 | 63,500 | 53,596 | ||||||
Booking Holdings, Inc.1 | 25,450 | 51,289 | ||||||
Salvatore Ferragamo SpA | 2,174,477 | 38,488 | ||||||
Toll Brothers, Inc. | 744,683 | 37,175 | ||||||
YUM! Brands, Inc. | 275,700 | 35,312 | ||||||
Floor & Decor Holdings, Inc., Class A1 | 420,000 | 29,245 | ||||||
Polaris, Inc. | 280,000 | 28,280 | ||||||
adidas AG | 200,959 | 27,433 | ||||||
Caesars Entertainment, Inc.1 | 653,214 | 27,174 | ||||||
Adient PLC1 | 722,000 | 25,046 | ||||||
VF Corp. | 872,859 | 24,100 | ||||||
General Motors Company | 660,000 | 22,202 | ||||||
LGI Homes, Inc.1 | 181,100 | 16,770 | ||||||
YETI Holdings, Inc.1 | 405,000 | 16,730 | ||||||
Hilton Worldwide Holdings, Inc. | 100,828 | 12,741 | ||||||
|
| |||||||
| 5,233,271 | ||||||||
|
| |||||||
Communication services 12.87% | ||||||||
Meta Platforms, Inc., Class A1 | 9,903,206 | 1,191,752 | ||||||
Netflix, Inc.1 | 3,896,520 | 1,149,006 | ||||||
Alphabet, Inc., Class C1 | 5,949,690 | 527,916 | ||||||
Alphabet, Inc., Class A1 | 2,232,320 | 196,958 | ||||||
Charter Communications, Inc., Class A1 | 469,410 | 159,177 | ||||||
Verizon Communications, Inc. | 3,720,000 | 146,568 | ||||||
Take-Two Interactive Software, Inc.1 | 1,177,716 | 122,635 | ||||||
Snap, Inc., Class A, nonvoting shares1 | 11,280,711 | 100,962 | ||||||
Frontier Communications Parent, Inc.1 | 3,168,010 | 80,721 | ||||||
T-Mobile US, Inc.1 | 543,849 | 76,139 | ||||||
Comcast Corp., Class A | 1,822,263 | 63,724 | ||||||
Pinterest, Inc., Class A1 | 1,752,664 | 42,555 | ||||||
Electronic Arts, Inc. | 304,581 | 37,214 | ||||||
Iridium Communications, Inc.1 | 604,439 | 31,068 | ||||||
Tencent Holdings, Ltd. | 605,000 | 25,714 | ||||||
ZoomInfo Technologies, Inc.1 | 785,400 | 23,648 | ||||||
|
| |||||||
| 3,975,757 | ||||||||
|
| |||||||
Industrials 10.90% | ||||||||
Uber Technologies, Inc.1 | 14,666,767 | 362,709 | ||||||
TransDigm Group, Inc. | 562,400 | 354,115 | ||||||
Carrier Global Corp. | 7,599,761 | 313,490 | ||||||
Jacobs Solutions, Inc. | 2,554,200 | 306,683 | ||||||
Delta Air Lines, Inc.1 | 7,215,000 | 237,085 | ||||||
United Rentals, Inc.1 | 462,000 | 164,204 | ||||||
Caterpillar, Inc. | 676,300 | 162,014 | ||||||
Waste Connections, Inc. | 1,101,159 | 145,970 | ||||||
MTU Aero Engines AG | 541,769 | 117,261 | ||||||
General Electric Co. | 1,368,072 | 114,631 | ||||||
Airbus SE, non-registered shares | 955,893 | 113,658 | ||||||
Ryanair Holdings PLC (ADR)1 | 1,500,325 | 112,164 | ||||||
Ryanair Holdings PLC1 | 96,554 | 1,264 | ||||||
Robert Half International, Inc. | 1,323,800 | 97,736 | ||||||
Old Dominion Freight Line, Inc. | 329,800 | 93,591 | ||||||
Boeing Company1 | 395,000 | 75,243 | ||||||
United Airlines Holdings, Inc.1 | 1,695,914 | 63,936 | ||||||
Middleby Corp.1 | 449,500 | 60,188 | ||||||
Axon Enterprise, Inc.1 | 347,957 | 57,736 | ||||||
Equifax, Inc. | 290,691 | 56,499 | ||||||
Northrop Grumman Corp. | 98,700 | 53,852 | ||||||
Dun & Bradstreet Holdings, Inc. | 3,869,573 | 47,441 | ||||||
60 American Funds Insurance Series
Table of Contents
Growth Fund (continued)
Common stocks (continued)
| Shares | Value (000) | |||||||
Industrials (continued) | ||||||||
Canadian Pacific Railway, Ltd. | 496,000 | $ | 36,997 | |||||
AMETEK, Inc. | 253,600 | 35,433 | ||||||
Rockwell Automation | 129,246 | 33,290 | ||||||
HEICO Corp. | 195,000 | 29,960 | ||||||
Advanced Drainage Systems, Inc. | 350,426 | 28,724 | ||||||
ITT, Inc. | 343,000 | 27,817 | ||||||
Armstrong World Industries, Inc. | 374,203 | 25,666 | ||||||
Safran SA | 185,870 | 23,227 | ||||||
Saia, Inc.1 | 75,433 | 15,817 | ||||||
|
| |||||||
| 3,368,401 | ||||||||
|
| |||||||
Energy 5.92% | ||||||||
Halliburton Company | 12,143,661 | 477,853 | ||||||
Canadian Natural Resources, Ltd. (CAD denominated) | 6,655,000 | 369,564 | ||||||
Schlumberger, Ltd. | 2,340,000 | 125,096 | ||||||
Cenovus Energy, Inc. (CAD denominated) | 6,081,800 | 117,998 | ||||||
Permian Resources Corp., Class A | 11,260,000 | 105,844 | ||||||
Tourmaline Oil Corp. | 1,838,700 | 92,777 | ||||||
TotalEnergies SE | 1,469,000 | 91,688 | ||||||
EQT Corp. | 2,268,000 | 76,726 | ||||||
Pioneer Natural Resources Company | 328,000 | 74,912 | ||||||
EOG Resources, Inc. | 466,699 | 60,447 | ||||||
ConocoPhillips | 472,041 | 55,701 | ||||||
MEG Energy Corp.1 | 3,810,000 | 53,042 | ||||||
Hess Corp. | 354,000 | 50,204 | ||||||
Coterra Energy, Inc. | 1,275,197 | 31,332 | ||||||
Range Resources Corp. | 907,000 | 22,693 | ||||||
Suncor Energy, Inc. | 540,794 | 17,154 | ||||||
Equitrans Midstream Corp. | 936,942 | 6,278 | ||||||
|
| |||||||
| 1,829,309 | ||||||||
|
| |||||||
Financials 5.82% | ||||||||
Bank of America Corp. | 14,780,700 | 489,537 | ||||||
Capital One Financial Corp. | 1,399,000 | 130,051 | ||||||
First Republic Bank | 943,211 | 114,968 | ||||||
KKR & Co., Inc. | 2,409,043 | 111,828 | ||||||
Apollo Asset Management, Inc. | 1,557,942 | 99,381 | ||||||
T. Rowe Price Group, Inc. | 642,000 | 70,017 | ||||||
MSCI, Inc. | 146,390 | 68,096 | ||||||
Marsh & McLennan Companies, Inc. | 403,461 | 66,765 | ||||||
Western Alliance Bancorporation | 1,071,775 | 63,835 | ||||||
Wells Fargo & Company | 1,511,200 | 62,397 | ||||||
Blackstone, Inc., nonvoting shares | 738,000 | 54,752 | ||||||
Signature Bank | 446,233 | 51,415 | ||||||
S&P Global, Inc. | 141,000 | 47,227 | ||||||
Aon PLC, Class A | 155,700 | 46,732 | ||||||
JPMorgan Chase & Co. | 313,702 | 42,067 | ||||||
Morgan Stanley | 426,474 | 36,259 | ||||||
Progressive Corp. | 265,951 | 34,496 | ||||||
Blue Owl Capital, Inc., Class A | 2,891,712 | 30,652 | ||||||
Arch Capital Group, Ltd.1 | 458,700 | 28,797 | ||||||
Goldman Sachs Group, Inc. | 74,300 | 25,513 | ||||||
Tradeweb Markets, Inc., Class A | 390,000 | 25,323 | ||||||
Ares Management Corp., Class A | 310,500 | 21,251 | ||||||
SVB Financial Group1 | 87,300 | 20,091 | ||||||
Ryan Specialty Holdings, Inc., Class A1 | 455,200 | 18,895 | ||||||
Brookfield Corp., Class A | 585,103 | 18,407 | ||||||
Trupanion, Inc.1,2 | 287,655 | 13,672 | ||||||
Brookfield Asset Management, Ltd., Class A | 146,275 | 4,194 | ||||||
|
| |||||||
| 1,796,618 | ||||||||
|
| |||||||
American Funds Insurance Series 61
Table of Contents
Growth Fund (continued)
Common stocks (continued)
| Shares | Value (000) | |||||||
Materials 3.15% | ||||||||
Silgan Holdings, Inc. | 2,858,000 | $ | 148,159 | |||||
Wheaton Precious Metals Corp. | 3,674,000 | 143,580 | ||||||
Linde PLC | 373,860 | 121,946 | ||||||
Grupo México, SAB de CV, Series B | 25,356,800 | 89,018 | ||||||
Barrick Gold Corp. | 4,058,000 | 69,716 | ||||||
CF Industries Holdings, Inc. | 743,000 | 63,304 | ||||||
ATI, Inc.1 | 2,070,860 | 61,836 | ||||||
Royal Gold, Inc. | 517,000 | 58,276 | ||||||
Franco-Nevada Corp. | 390,000 | 53,163 | ||||||
Nutrien, Ltd. (CAD denominated) | 665,949 | 48,618 | ||||||
Steel Dynamics, Inc. | 394,900 | 38,582 | ||||||
Albemarle Corp. | 144,809 | 31,403 | ||||||
Mosaic Co. | 678,459 | 29,764 | ||||||
Summit Materials, Inc., Class A | 570,855 | 16,206 | ||||||
|
| |||||||
| 973,571 | ||||||||
|
| |||||||
Consumer staples 2.28% | ||||||||
Costco Wholesale Corp. | 253,000 | 115,494 | ||||||
British American Tobacco PLC | 2,768,763 | 109,850 | ||||||
Performance Food Group Co.1 | 1,743,000 | 101,774 | ||||||
Constellation Brands, Inc., Class A | 334,017 | 77,408 | ||||||
Archer Daniels Midland Company | 784,800 | 72,869 | ||||||
Altria Group, Inc. | 1,440,000 | 65,822 | ||||||
Monster Beverage Corp.1 | 577,600 | 58,644 | ||||||
Estée Lauder Companies, Inc., Class A | 211,111 | 52,379 | ||||||
Molson Coors Beverage Company, Class B, restricted voting shares | 608,423 | 31,346 | ||||||
Philip Morris International, Inc. | 201,113 | 20,355 | ||||||
|
| |||||||
| 705,941 | ||||||||
|
| |||||||
Utilities 0.79% | ||||||||
PG&E Corp.1 | 9,227,065 | 150,032 | ||||||
AES Corp. | 1,085,884 | 31,230 | ||||||
CenterPoint Energy, Inc. | 953,746 | 28,603 | ||||||
Constellation Energy Corp. | 242,227 | 20,882 | ||||||
Edison International | 199,191 | 12,673 | ||||||
|
| |||||||
| 243,420 | ||||||||
|
| |||||||
Real estate 0.11% | ||||||||
Equinix, Inc. REIT | 51,784 | 33,920 | ||||||
|
| |||||||
Total common stocks (cost: $20,777,099,000) | 29,698,217 | |||||||
|
| |||||||
Preferred securities 0.19% | ||||||||
Information technology 0.16% | ||||||||
PsiQuantum Corp., Series D, preferred shares1,3,4 | 906,761 | 24,501 | ||||||
Samsung Electronics Co., Ltd., nonvoting preferred shares | 531,000 | 21,366 | ||||||
Tipalti Solutions, Ltd., Series F, preferred shares1,3,4 | 406,310 | 2,385 | ||||||
Stripe, Inc., Series H, 6.00% noncumulative preferred shares1,3,4 | 52,656 | 1,469 | ||||||
|
| |||||||
| 49,721 | ||||||||
|
| |||||||
Industrials 0.03% | ||||||||
ABL Space Systems Co., Series B2, preferred shares1,3,4 | 153,713 | 5,775 | ||||||
Einride AB, Series C, preferred shares1,3,4 | 77,647 | 2,640 | ||||||
|
| |||||||
| 8,415 | ||||||||
|
| |||||||
Total preferred securities (cost: $68,091,000) | 58,136 | |||||||
|
| |||||||
62 American Funds Insurance Series
Table of Contents
Growth Fund (continued)
Convertible stocks 0.03%
| Shares | Value (000) | |||||||
Financials 0.03% | ||||||||
KKR & Co., Inc., Series C, convertible preferred shares, 6.00% 9/15/2023 | 125,800 | $ | 7,202 | |||||
|
| |||||||
Total convertible stocks (cost: $7,758,000) | 7,202 | |||||||
|
| |||||||
Principal (000) | ||||||||
Convertible bonds & notes 0.02% | ||||||||
Consumer staples 0.01% | ||||||||
JUUL Labs, Inc., convertible notes, 7.00% PIK 2/3/20253,4,5 | USD46,459 | 4,646 | ||||||
|
| |||||||
Industrials 0.01% | ||||||||
Einride AB, convertible notes, 7.00% 2/1/20233,4 | 2,500 | 2,500 | ||||||
|
| |||||||
Total convertible bonds & notes (cost: $46,042,000) | 7,146 | |||||||
|
| |||||||
Bonds, notes & other debt instruments 0.05% | ||||||||
Corporate bonds, notes & loans 0.05% | ||||||||
Consumer discretionary 0.05% | ||||||||
Royal Caribbean Cruises, Ltd. 5.50% 4/1/20286 | 19,060 | 15,245 | ||||||
|
| |||||||
Total bonds, notes & other debt instruments (cost: $14,159,000) | 15,245 | |||||||
|
| |||||||
| Shares | ||||||||
Short-term securities 3.86% | ||||||||
Money market investments 3.70% | ||||||||
Capital Group Central Cash Fund 4.31%7,8 | 11,426,693 | 1,142,555 | ||||||
|
| |||||||
Money market investments purchased with collateral from securities on loan 0.16% | ||||||||
Capital Group Central Cash Fund 4.31%7,8,9 | 244,125 | 24,410 | ||||||
Goldman Sachs Financial Square Government Fund, Institutional Shares 4.15%7,9 | 13,667,057 | 13,667 | ||||||
Invesco Short-Term Investments Trust – Government & Agency Portfolio, Institutional Class 4.22%7,9 | 12,203,079 | 12,203 | ||||||
|
| |||||||
| 50,280 | ||||||||
|
| |||||||
Total short-term securities (cost: $1,192,617,000) | 1,192,835 | |||||||
|
| |||||||
Total investment securities 100.27% (cost: $22,105,766,000) | 30,978,781 | |||||||
Other assets less liabilities (0.27)% | (82,433 | ) | ||||||
|
| |||||||
Net assets 100.00% | $ | 30,896,348 | ||||||
|
| |||||||
Investments in affiliates8
| Value of affiliates at 1/1/2022 (000) | Additions (000) | Reductions (000) | Net realized loss (000) | Net unrealized appreciation (000) | Value of affiliates at 12/31/2022 (000) | Dividend income (000) | ||||||||||||||||||||||
Short-term securities 3.78% | ||||||||||||||||||||||||||||
Money market investments 3.70% | ||||||||||||||||||||||||||||
Capital Group Central Cash Fund 4.31%7 | $ | 1,610,187 | $ | 4,675,615 | $ | 5,142,944 | $ | (325 | ) | $ | 22 | $ | 1,142,555 | $ | 22,361 | |||||||||||||
Money market investments purchased with collateralfrom securities on loan 0.08% | ||||||||||||||||||||||||||||
Capital Group Central Cash Fund 4.31%7,9 | 20,304 | 4,106 | 10 | 24,410 | — | 11 | ||||||||||||||||||||||
|
|
|
|
|
|
|
| |||||||||||||||||||||
Total 3.78% | $ | (325 | ) | $ | 22 | $ | 1,166,965 | $ | 22,361 | |||||||||||||||||||
|
|
|
|
|
|
|
| |||||||||||||||||||||
American Funds Insurance Series 63
Table of Contents
Growth Fund (continued)
Restricted securities4
Acquisition date(s) | Cost (000) | Value (000) | Percent of net assets | |||||||||||
Verily Life Sciences, LLC1,3 | 12/21/2018 | $ | 37,000 | $ | 45,222 | .14 | % | |||||||
PsiQuantum Corp., Series D, preferred shares1,3 | 5/28/2021 | 23,781 | 24,501 | .08 | ||||||||||
Stripe, Inc., Class B1,3 | 5/6/2021 | 6,766 | 4,704 | .02 | ||||||||||
Stripe, Inc., Series H, 6.00% noncumulative preferred shares1,3 | 3/15/2021 | 2,113 | 1,469 | .00 | ||||||||||
ABL Space Systems Co., Series B2, preferred shares1,3 | 10/22/2021 | 10,452 | 5,775 | .02 | ||||||||||
Einride AB, Series C, preferred shares1,3 | 11/23/2022 | 2,640 | 2,640 | .01 | ||||||||||
Einride AB, convertible notes, 7.00% 2/1/20233 | 1/7/2022 | 2,500 | 2,500 | .01 | ||||||||||
JUUL Labs, Inc., convertible notes, 7.00% PIK 2/3/20253,5 | 2/3/2020-11/3/2022 | 43,542 | 4,646 | .01 | ||||||||||
Tipalti Solutions, Ltd., Series F, preferred shares1,3 | 12/1/2021 | 6,956 | 2,385 | .01 | ||||||||||
|
|
|
|
|
| |||||||||
Total | $ | 135,750 | $ | 93,842 | .30 | % | ||||||||
|
|
|
|
|
| |||||||||
| 1 | Security did not produce income during the last 12 months. |
| 2 | All or a portion of this security was on loan. The total value of all such securities was $54,504,000, which represented .18% of the net assets of the fund. Refer to Note 5 for more information on securities lending. |
| 3 | Value determined using significant unobservable inputs. |
| 4 | Restricted security, other than Rule 144A securities or commercial paper issued pursuant to Section 4(a)(2) of the Securities Act of 1933. The total value of all such restricted securities was $93,842,000, which represented .30% of the net assets of the fund. |
| 5 | Payment in kind; the issuer has the option of paying additional securities in lieu of cash. Payment methods and rates are as of the most recent payment when available. |
| 6 | Acquired in a transaction exempt from registration under Rule 144A or, for commercial paper, Section 4(a)(2) of the Securities Act of 1933. May be resold in the U.S. in transactions exempt from registration, normally to qualified institutional buyers. The total value of all such securities was $15,245,000, which represented .05% of the net assets of the fund. |
| 7 | Rate represents the seven-day yield at 12/31/2022. |
| 8 | Part of the same “group of investment companies” as the fund as defined under the Investment Company Act of 1940, as amended. |
| 9 | Security purchased with cash collateral from securities on loan. Refer to Note 5 for more information on securities lending. |
| 10 | Represents net activity. Refer to Note 5 for more information on securities lending. |
| 11 | Dividend income is included with securities lending income in the fund’s statement of operations and is not shown in this table. |
Key to abbreviations
ADR = American Depositary Receipts
CAD = Canadian dollars
PIK = Payment In Kind
REIT = Real Estate Investment Trust
USD = U.S. dollars
Refer to the notes to financial statements.
64 American Funds Insurance Series
Table of Contents
Investment portfolio December 31, 2022
Common stocks 94.99%
| Shares | Value (000) | |||||||
Industrials 16.64% | ||||||||
Recruit Holdings Co., Ltd. | 7,310,189 | $ | 232,492 | |||||
Airbus SE, non-registered shares | 1,657,958 | 197,135 | ||||||
Safran SA | 718,500 | 89,786 | ||||||
Melrose Industries PLC | 36,613,980 | 59,524 | ||||||
Siemens AG | 418,132 | 58,034 | ||||||
MTU Aero Engines AG | 229,720 | 49,721 | ||||||
Ashtead Group PLC | 645,000 | 36,847 | ||||||
DSV A/S | 230,223 | 36,515 | ||||||
NIBE Industrier AB, Class B | 3,878,804 | 36,271 | ||||||
Thales SA | 271,438 | 34,700 | ||||||
Techtronic Industries Co., Ltd. | 2,724,000 | 30,332 | ||||||
Legrand SA | 358,100 | 28,833 | ||||||
International Container Terminal Services, Inc. | 7,953,240 | 28,625 | ||||||
Shenzhen Inovance Technology Co., Ltd., Class A | 2,350,967 | 23,513 | ||||||
ZTO Express (Cayman), Inc., Class A (ADR) | 685,354 | 18,415 | ||||||
Diploma PLC | 540,545 | 18,165 | ||||||
Rumo SA | 5,039,366 | 17,763 | ||||||
Grab Holdings, Ltd., Class A1 | 5,356,295 | 17,247 | ||||||
Brenntag SE | 259,299 | 16,578 | ||||||
CCR SA, ordinary nominative shares | 5,580,000 | 11,435 | ||||||
SMC Corp. | 26,900 | 11,385 | ||||||
Airports of Thailand PCL, foreign registered shares1 | 5,078,900 | 11,000 | ||||||
Kingspan Group PLC | 153,796 | 8,281 | ||||||
Larsen & Toubro, Ltd. | 327,351 | 8,232 | ||||||
Bureau Veritas SA | 292,900 | 7,709 | ||||||
AB Volvo, Class B | 396,824 | 7,185 | ||||||
LIXIL Corp. | 441,700 | 6,731 | ||||||
Fluidra, SA, non-registered shares | 432,985 | 6,715 | ||||||
BAE Systems PLC | 617,024 | 6,377 | ||||||
Zhejiang Sanhua Intelligent Controls Co., Ltd., Class A | 846,334 | 2,578 | ||||||
|
| |||||||
| 1,118,124 | ||||||||
|
| |||||||
Information technology 13.74% | ||||||||
SK hynix, Inc. | 3,255,725 | 195,968 | ||||||
Shopify, Inc., Class A, subordinate voting shares1 | 4,215,370 | 146,315 | ||||||
ASML Holding NV | 210,218 | 113,792 | ||||||
Taiwan Semiconductor Manufacturing Company, Ltd. | 6,501,000 | 94,750 | ||||||
Nice, Ltd. (ADR)1 | 432,150 | 83,102 | ||||||
Fujitsu, Ltd. | 437,900 | 57,990 | ||||||
Lasertec Corp. | 320,511 | 53,238 | ||||||
Samsung Electronics Co., Ltd. | 631,500 | 27,848 | ||||||
NXP Semiconductors NV | 173,200 | 27,371 | ||||||
Disco Corp. | 65,800 | 18,915 | ||||||
Atlassian Corp., Class A1 | 107,001 | 13,769 | ||||||
OBIC Co., Ltd. | 83,700 | 12,374 | ||||||
Constellation Software, Inc. | 7,730 | 12,069 | ||||||
TELUS International (Cda), Inc., subordinate voting shares1 | 526,752 | 10,424 | ||||||
Suse SA1,2 | 576,586 | 10,410 | ||||||
Kingdee International Software Group Co., Ltd.1 | 4,786,000 | 10,188 | ||||||
Dassault Systemes SE | 277,000 | 9,991 | ||||||
ASM International NV | 25,152 | 6,368 | ||||||
Infosys, Ltd. | 329,392 | 5,967 | ||||||
Tata Consultancy Services, Ltd. | 113,863 | 4,483 | ||||||
Canva, Inc.1,3,4 | 4,819 | 4,282 | ||||||
PagSeguro Digital, Ltd., Class A1 | 426,548 | 3,728 | ||||||
|
| |||||||
| 923,342 | ||||||||
|
| |||||||
Health care 12.52% | ||||||||
Daiichi Sankyo Company, Ltd. | 9,749,808 | 312,457 | ||||||
Novo Nordisk A/S, Class B | 1,255,260 | 169,962 | ||||||
Olympus Corp. | 5,808,100 | 102,662 | ||||||
Bayer AG | 841,261 | 43,436 | ||||||
American Funds Insurance Series 65
Table of Contents
International Fund (continued)
Common stocks (continued)
| Shares | Value (000) | |||||||
Health care (continued) | ||||||||
Siemens Healthineers AG | 833,668 | $ | 41,705 | |||||
Grifols, SA, Class A, non-registered shares1 | 2,789,283 | 32,345 | ||||||
Grifols, SA, Class B (ADR)1 | 793,690 | 6,747 | ||||||
WuXi Biologics (Cayman), Inc.1 | 2,504,066 | 19,224 | ||||||
HOYA Corp. | 198,300 | 19,187 | ||||||
M3, Inc. | 644,835 | 17,566 | ||||||
EssilorLuxottica | 80,200 | 14,604 | ||||||
Insulet Corp.1 | 46,653 | 13,734 | ||||||
Takeda Pharmaceutical Company, Ltd. | 361,300 | 11,285 | ||||||
Hapvida Participações e Investimentos SA1 | 8,863,653 | 8,528 | ||||||
Ambu AS, Class B, non-registered shares1 | 662,880 | 8,411 | ||||||
Eurofins Scientific SE, non-registered shares | 98,473 | 7,091 | ||||||
WuXi AppTec Co., Ltd., Class A | 288,960 | 3,345 | ||||||
WuXi AppTec Co., Ltd., Class H | 312,000 | 3,297 | ||||||
bioMérieux SA | 58,300 | 6,131 | ||||||
|
| |||||||
| 841,717 | ||||||||
|
| |||||||
Materials 10.64% | ||||||||
First Quantum Minerals, Ltd. | 10,951,800 | 228,823 | ||||||
Fortescue Metals Group, Ltd. | 12,796,750 | 178,403 | ||||||
Vale SA (ADR), ordinary nominative shares | 6,886,607 | 116,865 | ||||||
Vale SA, ordinary nominative shares | 770,681 | 12,974 | ||||||
Shin-Etsu Chemical Co., Ltd. | 563,500 | 68,654 | ||||||
JSR Corp. | 1,681,700 | 33,144 | ||||||
Ivanhoe Mines, Ltd., Class A1 | 3,403,051 | 26,893 | ||||||
Wacker Chemie AG | 147,773 | 18,887 | ||||||
Linde PLC | 35,287 | 11,510 | ||||||
Koninklijke DSM NV | 93,550 | 11,469 | ||||||
BASF SE | 136,760 | 6,789 | ||||||
Yunnan Energy New Material Co., Ltd., Class A | 19,136 | 362 | ||||||
|
| |||||||
| 714,773 | ||||||||
|
| |||||||
Energy 10.48% | ||||||||
Reliance Industries, Ltd. | 9,393,560 | 288,158 | ||||||
Canadian Natural Resources, Ltd. (CAD denominated) | 1,562,283 | 86,756 | ||||||
Neste OYJ | 1,756,952 | 81,150 | ||||||
Woodside Energy Group, Ltd. | 3,071,566 | 74,317 | ||||||
Petróleo Brasileiro SA (Petrobras) (ADR), ordinary nominative shares | 6,724,576 | 71,617 | ||||||
TotalEnergies SE | 1,147,298 | 71,609 | ||||||
Shell PLC (GBP denominated) | 573,839 | 16,307 | ||||||
Cenovus Energy, Inc. (CAD denominated) | 725,880 | 14,084 | ||||||
|
| |||||||
| 703,998 | ||||||||
|
| |||||||
Consumer discretionary 9.06% | ||||||||
MercadoLibre, Inc.1 | 128,451 | 108,700 | ||||||
Evolution AB | 960,556 | 93,812 | ||||||
Sony Group Corp. | 920,500 | 70,194 | ||||||
Galaxy Entertainment Group, Ltd. | 9,204,000 | 60,944 | ||||||
LVMH Moët Hennessy-Louis Vuitton SE | 72,682 | 52,799 | ||||||
Flutter Entertainment PLC1 | 313,163 | 42,911 | ||||||
Ferrari NV (EUR denominated) | 177,292 | 37,933 | ||||||
Kering SA | 70,951 | 36,312 | ||||||
Maruti Suzuki India, Ltd. | 303,300 | 30,675 | ||||||
Entain PLC | 1,832,094 | 29,375 | ||||||
Coupang, Inc., Class A1 | 1,304,214 | 19,185 | ||||||
Mercedes-Benz Group AG | 136,786 | 8,976 | ||||||
InterContinental Hotels Group PLC | 155,468 | 8,949 | ||||||
Aptiv PLC1 | 84,000 | 7,823 | ||||||
|
| |||||||
| 608,588 | ||||||||
|
| |||||||
66 American Funds Insurance Series
Table of Contents
International Fund (continued)
Common stocks (continued)
| Shares | Value (000) | |||||||
Financials 9.05% | ||||||||
Kotak Mahindra Bank, Ltd. | 7,207,964 | $ | 158,591 | |||||
AIA Group, Ltd. | 12,210,576 | 134,524 | ||||||
Aegon NV | 12,263,736 | 62,212 | ||||||
HDFC Bank, Ltd. | 2,216,455 | 43,632 | ||||||
HDFC Bank, Ltd. (ADR) | 207,750 | 14,212 | ||||||
Nu Holdings, Ltd., Class A1 | 8,115,368 | 33,030 | ||||||
Bajaj Finance, Ltd. | 396,342 | 31,369 | ||||||
ING Groep NV | 2,331,678 | 28,447 | ||||||
Axis Bank, Ltd. | 1,917,190 | 21,549 | ||||||
FinecoBank SpA | 1,211,135 | 20,184 | ||||||
Futu Holdings, Ltd. (ADR)1 | 375,890 | 15,280 | ||||||
China Merchants Bank Co., Ltd., Class A | 2,726,800 | 14,621 | ||||||
B3 SA-Brasil, Bolsa, Balcao | 4,413,000 | 11,041 | ||||||
Allfunds Group PLC | 1,266,915 | 8,853 | ||||||
Bajaj Finserv, Ltd. | 325,950 | 6,074 | ||||||
XP, Inc., Class A1 | 292,000 | 4,479 | ||||||
|
| |||||||
| 608,098 | ||||||||
|
| |||||||
Communication services 6.20% | ||||||||
Sea, Ltd., Class A (ADR)1 | 3,557,478 | 185,096 | ||||||
Bharti Airtel, Ltd. | 12,732,125 | 123,766 | ||||||
Bharti Airtel, Ltd., interim shares | 836,308 | 4,373 | ||||||
Universal Music Group NV | 1,717,633 | 41,462 | ||||||
Informa PLC | 3,630,108 | 27,216 | ||||||
Ubisoft Entertainment SA1 | 518,403 | 14,715 | ||||||
Singapore Telecommunications, Ltd. | 5,800,500 | 11,136 | ||||||
Vivendi SE | 907,392 | 8,683 | ||||||
Yandex NV, Class A1,3 | 313,000 | — | 5 | |||||
|
| |||||||
| 416,447 | ||||||||
|
| |||||||
Consumer staples 4.31% | ||||||||
Kweichow Moutai Co., Ltd., Class A | 224,223 | 55,485 | ||||||
Danone SA | 878,392 | 46,277 | ||||||
Seven & i Holdings Co., Ltd. | 984,200 | 42,102 | ||||||
Treasury Wine Estates, Ltd. | 4,139,490 | 38,250 | ||||||
British American Tobacco PLC | 911,000 | 36,144 | ||||||
Kobe Bussan Co., Ltd. | 754,900 | 21,791 | ||||||
CP ALL PCL, foreign registered shares | 9,053,300 | 17,849 | ||||||
Nestlé SA | 78,463 | 9,061 | ||||||
Dabur India, Ltd. | 933,875 | 6,324 | ||||||
Shiseido Company, Ltd. | 122,000 | 6,012 | ||||||
Essity Aktiebolag, Class B | 211,237 | 5,544 | ||||||
Pernod Ricard SA | 22,974 | 4,516 | ||||||
Diageo PLC | 13,194 | 583 | ||||||
|
| |||||||
| 289,938 | ||||||||
|
| |||||||
Utilities 1.77% | ||||||||
ENN Energy Holdings, Ltd. | 8,532,700 | 119,038 | ||||||
|
| |||||||
Real estate 0.58% | ||||||||
ESR Group, Ltd. | 14,852,600 | 31,175 | ||||||
Ayala Land, Inc. | 14,181,500 | 7,891 | ||||||
|
| |||||||
| 39,066 | ||||||||
|
| |||||||
Total common stocks (cost: $5,702,657,000) | 6,383,129 | |||||||
|
| |||||||
American Funds Insurance Series 67
Table of Contents
International Fund (continued)
Preferred securities 0.79%
| Shares | Value (000) | |||||||
Health care 0.29% | ||||||||
Grifols, SA, Class B, nonvoting non-registered preferred shares1 | 2,274,930 | $ | 19,221 | |||||
|
| |||||||
Energy 0.20% | ||||||||
Petróleo Brasileiro SA (Petrobras), preferred nominative shares | 2,980,131 | 13,829 | ||||||
|
| |||||||
Financials 0.16% | ||||||||
Itaú Unibanco Holding SA, preferred nominative shares | 2,246,000 | 10,635 | ||||||
|
| |||||||
Consumer discretionary 0.13% | ||||||||
Dr. Ing. h.c. F. Porsche AG, nonvoting non-registered preferred shares1 | 88,248 | 8,953 | ||||||
|
| |||||||
Information technology 0.01% | ||||||||
Canva, Inc., Series A, noncumulative preferred shares1,3,4 | 422 | 375 | ||||||
Canva, Inc., Series A-3, noncumulative preferred shares1,3,4 | 18 | 16 | ||||||
Canva, Inc., Series A-4, noncumulative preferred shares1,3,4 | 1 | 1 | ||||||
|
| |||||||
| 392 | ||||||||
|
| |||||||
Total preferred securities (cost: $78,028,000) | 53,030 | |||||||
|
| |||||||
Rights & warrants 0.13% | ||||||||
Health care 0.13% | ||||||||
WuXi AppTec Co., Ltd., Class A, warrants, expire 11/21/20231,6 | 729,706 | 8,446 | ||||||
|
| |||||||
Total rights & warrants (cost: $8,772,000) | 8,446 | |||||||
|
| |||||||
Short-term securities 4.57% | ||||||||
Money market investments 4.55% | ||||||||
Capital Group Central Cash Fund 4.31%7,8 | 3,060,530 | 306,023 | ||||||
|
| |||||||
Money market investments purchased with collateral from securities on loan 0.02% | ||||||||
Goldman Sachs Financial Square Government Fund, Institutional Shares 4.15%7,9 | 603,851 | 604 | ||||||
Capital Group Central Cash Fund 4.31%7,8,9 | 4,223 | 422 | ||||||
Invesco Short-Term Investments Trust – Government & Agency Portfolio, Institutional Class 4.22%7,9 | 420,189 | 420 | ||||||
|
| |||||||
| 1,446 | ||||||||
|
| |||||||
Total short-term securities (cost: $307,420,000) | 307,469 | |||||||
|
| |||||||
Total investment securities 100.48% (cost: $6,096,877,000) | 6,752,074 | |||||||
Other assets less liabilities (0.48)% | (32,493 | ) | ||||||
|
| |||||||
Net assets 100.00% | $ | 6,719,581 | ||||||
|
| |||||||
68 American Funds Insurance Series
Table of Contents
International Fund (continued)
Investments in affiliates8
| Value of affiliates at 1/1/2022 (000) | Additions (000) | Reductions (000) | Net realized loss (000) | Net unrealized depreciation (000) | Value of affiliates at 12/31/2022 (000) | Dividend income (000) | ||||||||||||||||||||||
Short-term securities 4.56% | ||||||||||||||||||||||||||||
Money market investments 4.55% | ||||||||||||||||||||||||||||
Capital Group Central Cash Fund 4.31%7 | $ | 977,398 | $ | 1,494,158 | $ | 2,165,364 | $ | (112 | ) | $ | (57 | ) | $ | 306,023 | $ | 9,392 | ||||||||||||
Money market investments purchased with collateral from securities on loan 0.01% | ||||||||||||||||||||||||||||
Capital Group Central Cash Fund 4.31%7,9 | 34,059 | 33,637 | 10 | 422 | — | 11 | ||||||||||||||||||||||
|
|
|
|
|
|
|
| |||||||||||||||||||||
Total 4.56% | $ | (112 | ) | $ | (57 | ) | $ | 306,445 | $ | 9,392 | ||||||||||||||||||
|
|
|
|
|
|
|
| |||||||||||||||||||||
Restricted securities4
| Acquisition date(s) | Cost (000) | Value (000) | Percent of net assets | |||||||||||||
Canva, Inc.1,3 | 8/26/2021-11/4/2021 | $ | 8,215 | $ | 4,282 | .06 | % | |||||||||
Canva, Inc., Series A, noncumulative preferred shares1,3 | 11/4/2021 | 719 | 375 | .01 | ||||||||||||
Canva, Inc., Series A-3, noncumulative preferred shares1,3 | 11/4/2021 | 31 | 16 | .00 | ||||||||||||
Canva, Inc., Series A-4, noncumulative preferred shares1,3 | 11/4/2021 | 2 | 1 | .00 | ||||||||||||
|
|
|
|
|
| |||||||||||
Total | $ | 8,967 | $ | 4,674 | .07 | % | ||||||||||
|
|
|
|
|
| |||||||||||
| 1 | Security did not produce income during the last 12 months. |
| 2 | All or a portion of this security was on loan. The total value of all such securities was $1,530,000, which represented .02% of the net assets of the fund. Refer to Note 5 for more information on securities lending. |
| 3 | Value determined using significant unobservable inputs. |
| 4 | Restricted security, other than Rule 144A securities or commercial paper issued pursuant to Section 4(a)(2) of the Securities Act of 1933. The total value of all such restricted securities was $4,674,000, which represented .07% of the net assets of the fund. |
| 5 | Amount less than one thousand. |
| 6 | Acquired in a transaction exempt from registration under Rule 144A or, for commercial paper, Section 4(a)(2) of the Securities Act of 1933. May be resold in the U.S. in transactions exempt from registration, normally to qualified institutional buyers. The total value of all such securities was $8,446,000, which represented .13% of the net assets of the fund. |
| 7 | Rate represents the seven-day yield at 12/31/2022. |
| 8 | Part of the same “group of investment companies” as the fund as defined under the Investment Company Act of 1940, as amended. |
| 9 | Security purchased with cash collateral from securities on loan. Refer to Note 5 for more information on securities lending. |
| 10 | Represents net activity. Refer to Note 5 for more information on securities lending. |
| 11 | Dividend income is included with securities lending income in the fund’s statement of operations and is not shown in this table. |
Key to abbreviations
ADR = American Depositary Receipts
CAD = Canadian dollars
EUR = Euros
GBP = British pounds
Refer to the notes to financial statements.
American Funds Insurance Series 69
Table of Contents
Investment portfolio December 31, 2022
Common stocks 90.37%
| Shares | Value (000) | |||||||
Information technology 14.17% | ||||||||
Microsoft Corp. | 343,380 | $ | 82,348 | |||||
Taiwan Semiconductor Manufacturing Company, Ltd. | 3,763,000 | 54,844 | ||||||
Broadcom, Inc. | 50,719 | 28,359 | ||||||
ASML Holding NV | 52,210 | 28,261 | ||||||
Micron Technology, Inc. | 505,143 | 25,247 | ||||||
Wolfspeed, Inc.1 | 312,105 | 21,548 | ||||||
Mastercard, Inc., Class A | 47,073 | 16,369 | ||||||
Apple, Inc. | 114,398 | 14,864 | ||||||
Tata Consultancy Services, Ltd. | 274,095 | 10,793 | ||||||
Visa, Inc., Class A | 50,545 | 10,501 | ||||||
Keyence Corp. | 23,700 | 9,279 | ||||||
Infosys, Ltd. (ADR) | 342,942 | 6,176 | ||||||
Infosys, Ltd. | 131,247 | 2,378 | ||||||
SAP SE | 70,089 | 7,233 | ||||||
Silergy Corp. | 459,376 | 6,514 | ||||||
Synopsys, Inc.1 | 20,004 | 6,387 | ||||||
TELUS International (Cda), Inc., subordinate voting shares1 | 321,870 | 6,370 | ||||||
Samsung Electronics Co., Ltd. | 143,145 | 6,312 | ||||||
NVIDIA Corp. | 42,638 | 6,231 | ||||||
EPAM Systems, Inc.1 | 18,611 | 6,100 | ||||||
PagSeguro Digital, Ltd., Class A1 | 674,012 | 5,891 | ||||||
Edenred SA | 100,382 | 5,462 | ||||||
Accenture PLC, Class A | 20,142 | 5,375 | ||||||
Network International Holdings PLC1 | 1,472,831 | 5,275 | ||||||
Nokia Corp. | 1,113,649 | 5,174 | ||||||
Tokyo Electron, Ltd. | �� | 15,700 | 4,664 | |||||
Nice, Ltd. (ADR)1 | 23,806 | 4,578 | ||||||
Kingdee International Software Group Co., Ltd.1 | 2,128,000 | 4,530 | ||||||
Lasertec Corp. | 27,100 | 4,501 | ||||||
Amadeus IT Group SA, Class A, non-registered shares1 | 70,704 | 3,646 | ||||||
Applied Materials, Inc. | 36,011 | 3,507 | ||||||
MediaTek, Inc. | 142,000 | 2,884 | ||||||
ASM International NV | 10,858 | 2,749 | ||||||
SK hynix, Inc. | 41,006 | 2,468 | ||||||
Trimble, Inc.1 | 41,404 | 2,093 | ||||||
Logitech International SA | 31,053 | 1,927 | ||||||
Euronet Worldwide, Inc.1 | 19,369 | 1,828 | ||||||
KLA Corp. | 4,743 | 1,788 | ||||||
Coforge, Ltd. | 33,028 | 1,544 | ||||||
Cognizant Technology Solutions Corp., Class A | 25,905 | 1,482 | ||||||
Globant SA1 | 8,094 | 1,361 | ||||||
Hamamatsu Photonics KK | 25,400 | 1,222 | ||||||
Hundsun Technologies, Inc., Class A | 198,090 | 1,153 | ||||||
Atlassian Corp., Class A1 | 8,731 | 1,124 | ||||||
VeriSign, Inc.1 | 4,446 | 913 | ||||||
MKS Instruments, Inc. | 8,486 | 719 | ||||||
StoneCo, Ltd., Class A1 | 67,249 | 635 | ||||||
Autodesk, Inc.1 | 3,359 | 628 | ||||||
Disco Corp. | 2,100 | 604 | ||||||
Advanced Micro Devices, Inc.1 | 8,455 | 548 | ||||||
Canva, Inc.1,2,3 | 385 | 342 | ||||||
Intel Corp. | 3,575 | 95 | ||||||
|
| |||||||
| 436,824 | ||||||||
|
| |||||||
Financials 13.94% | ||||||||
Kotak Mahindra Bank, Ltd. | 2,819,943 | 62,045 | ||||||
AIA Group, Ltd. | 4,251,600 | 46,840 | ||||||
Ping An Insurance (Group) Company of China, Ltd., Class H | 4,499,844 | 29,700 | ||||||
HDFC Bank, Ltd. | 1,423,436 | 28,021 | ||||||
B3 SA-Brasil, Bolsa, Balcao | 10,338,358 | 25,867 | ||||||
Capitec Bank Holdings, Ltd. | 206,384 | 22,575 | ||||||
Bajaj Finance, Ltd. | 215,621 | 17,066 | ||||||
70 American Funds Insurance Series
Table of Contents
New World Fund (continued)
Common stocks (continued)
| Shares | Value (000) | |||||||
Financials (continued) | ||||||||
ICICI Bank, Ltd. | 967,310 | $ | 10,368 | |||||
ICICI Bank, Ltd. (ADR) | 290,583 | 6,361 | ||||||
AU Small Finance Bank, Ltd. | 1,923,084 | 15,145 | ||||||
Bank Central Asia Tbk PT | 20,947,600 | 11,484 | ||||||
UniCredit SpA | 750,471 | 10,672 | ||||||
Industrial and Commercial Bank of China, Ltd., Class H | 20,423,000 | 10,519 | ||||||
Nu Holdings, Ltd., Class A1 | 2,383,890 | 9,702 | ||||||
Bank Mandiri (Persero) Tbk PT | 15,218,600 | 9,671 | ||||||
XP, Inc., Class A1 | 602,058 | 9,236 | ||||||
China Merchants Bank Co., Ltd., Class H | 1,461,000 | 8,099 | ||||||
Discovery, Ltd.1 | 1,031,032 | 7,486 | ||||||
Banco Bilbao Vizcaya Argentaria, SA | 1,202,030 | 7,259 | ||||||
Bank Rakyat Indonesia (Persero) Tbk PT | 19,736,600 | 6,257 | ||||||
Eurobank Ergasias Services and Holdings SA1 | 5,321,431 | 6,007 | ||||||
Bank of Baroda | 2,476,327 | 5,528 | ||||||
Moody’s Corp. | 17,666 | 4,922 | ||||||
United Overseas Bank, Ltd. | 191,900 | 4,401 | ||||||
Canara Bank | 1,094,165 | 4,386 | ||||||
Erste Group Bank AG | 135,838 | 4,332 | ||||||
East Money Information Co., Ltd., Class A | 1,416,356 | 3,955 | ||||||
Alpha Services and Holdings SA1 | 3,535,444 | 3,772 | ||||||
Hong Kong Exchanges and Clearing, Ltd. | 76,500 | 3,306 | ||||||
Bajaj Finserv, Ltd. | 176,756 | 3,294 | ||||||
Standard Bank Group, Ltd. | 330,214 | 3,261 | ||||||
Aon PLC, Class A | 10,455 | 3,138 | ||||||
DBS Group Holdings, Ltd. | 122,873 | 3,111 | ||||||
Grupo Financiero Banorte, SAB de CV, Series O | 393,905 | 2,828 | ||||||
China Pacific Insurance (Group) Co., Ltd., Class H | 1,158,294 | 2,558 | ||||||
Postal Savings Bank of China Co., Ltd., Class H | 3,919,000 | 2,421 | ||||||
Bank of Ningbo Co., Ltd., Class A | 498,700 | 2,329 | ||||||
S&P Global, Inc. | 6,883 | 2,305 | ||||||
National Bank of Greece SA1 | 482,747 | 1,931 | ||||||
Piramal Enterprises, Ltd. | 169,260 | 1,690 | ||||||
Banco Santander México, SA, Institución de Banca Múltiple, Grupo Financiero Santander México, Class B | 1,294,654 | 1,515 | ||||||
Lufax Holding, Ltd. (ADR) | 751,404 | 1,458 | ||||||
China Construction Bank Corp., Class H | 2,110,000 | 1,322 | ||||||
TISCO Financial Group PCL, foreign registered shares | 343,800 | 983 | ||||||
Fairfax Financial Holdings, Ltd., subordinate voting shares | 1,008 | 597 | ||||||
HDFC Life Insurance Company, Ltd. | 23,813 | 162 | ||||||
Moscow Exchange MICEX-RTS PJSC1,2 | 438,203 | — | 4 | |||||
Sberbank of Russia PJSC1,2 | 2,662,164 | — | 4 | |||||
|
| |||||||
| 429,885 | ||||||||
|
| |||||||
Health care 13.14% | ||||||||
Novo Nordisk A/S, Class B | 469,272 | 63,539 | ||||||
Thermo Fisher Scientific, Inc. | 72,737 | 40,056 | ||||||
Eli Lilly and Company | 98,730 | 36,119 | ||||||
AstraZeneca PLC | 199,832 | 27,120 | ||||||
Max Healthcare Institute, Ltd.1 | 4,642,420 | 24,670 | ||||||
PerkinElmer, Inc. | 129,804 | 18,201 | ||||||
Abbott Laboratories | 165,381 | 18,157 | ||||||
BeiGene, Ltd. (ADR)1 | 65,681 | 14,446 | ||||||
BeiGene, Ltd.1 | 44,100 | 753 | ||||||
Jiangsu Hengrui Medicine Co., Ltd., Class A | 2,545,088 | 14,110 | ||||||
EssilorLuxottica | 72,078 | 13,125 | ||||||
Danaher Corp. | 48,758 | 12,941 | ||||||
Rede D’Or Sao Luiz SA | 1,633,717 | 9,153 | ||||||
Hypera SA, ordinary nominative shares | 1,024,373 | 8,770 | ||||||
Pfizer, Inc. | 167,880 | 8,602 | ||||||
Laurus Labs, Ltd. | 1,901,101 | 8,597 | ||||||
WuXi Biologics (Cayman), Inc.1 | 1,102,600 | 8,465 | ||||||
American Funds Insurance Series 71
Table of Contents
New World Fund (continued)
Common stocks (continued)
| Shares | Value (000) | |||||||
Health care (continued) | ||||||||
CSL, Ltd. | 41,156 | $ | 8,025 | |||||
Olympus Corp. | 386,100 | 6,825 | ||||||
Carl Zeiss Meditec AG, non-registered shares | 52,892 | 6,676 | ||||||
CanSino Biologics, Inc., Class H | 673,696 | 5,763 | ||||||
WuXi AppTec Co., Ltd., Class H | 268,500 | 2,837 | ||||||
WuXi AppTec Co., Ltd., Class A | 203,359 | 2,354 | ||||||
Siemens Healthineers AG | 100,533 | 5,029 | ||||||
Hapvida Participações e Investimentos SA1 | 4,948,421 | 4,761 | ||||||
Zoetis, Inc., Class A | 31,997 | 4,689 | ||||||
Innovent Biologics, Inc.1 | 1,062,373 | 4,561 | ||||||
Straumann Holding AG | 28,092 | 3,181 | ||||||
Legend Biotech Corp. (ADR)1 | 63,359 | 3,163 | ||||||
Hutchmed China, Ltd.1,5 | 786,002 | 2,418 | ||||||
Shionogi & Co., Ltd. | 46,400 | 2,308 | ||||||
Teva Pharmaceutical Industries, Ltd. (ADR)1 | 238,996 | 2,180 | ||||||
Mettler-Toledo International, Inc.1 | 1,435 | 2,074 | ||||||
OdontoPrev SA, ordinary nominative shares | 1,000,547 | 1,711 | ||||||
Align Technology, Inc.1 | 7,299 | 1,539 | ||||||
Asahi Intecc Co., Ltd. | 91,600 | 1,510 | ||||||
Genus PLC | 40,970 | 1,477 | ||||||
Angelalign Technology, Inc. | 85,000 | 1,340 | ||||||
Medtronic PLC | 16,413 | 1,276 | ||||||
Merck KGaA | 5,502 | 1,066 | ||||||
Bayer AG | 16,010 | 827 | ||||||
Zai Lab, Ltd. (ADR)1 | 16,060 | 493 | ||||||
Shandong Pharmaceutical Glass Co., Ltd., Class A | 66,700 | 272 | ||||||
|
| |||||||
| 405,179 | ||||||||
|
| |||||||
Industrials 10.83% | ||||||||
Airbus SE, non-registered shares | 370,290 | 44,028 | ||||||
General Electric Co. | 229,310 | 19,214 | ||||||
Larsen & Toubro, Ltd. | 722,885 | 18,180 | ||||||
Safran SA | 141,435 | 17,674 | ||||||
IMCD NV | 113,074 | 16,151 | ||||||
DSV A/S | 97,381 | 15,445 | ||||||
Shenzhen Inovance Technology Co., Ltd., Class A | 1,435,674 | 14,359 | ||||||
Copa Holdings, SA, Class A1 | 172,274 | 14,328 | ||||||
Carrier Global Corp. | 342,044 | 14,109 | ||||||
International Container Terminal Services, Inc. | 3,660,200 | 13,173 | ||||||
Grab Holdings, Ltd., Class A1 | 3,941,298 | 12,691 | ||||||
Rumo SA | 3,544,401 | 12,493 | ||||||
Caterpillar, Inc. | 38,431 | 9,207 | ||||||
ZTO Express (Cayman), Inc., Class A (ADR) | 294,858 | 7,923 | ||||||
Daikin Industries, Ltd. | 45,200 | 6,953 | ||||||
Mitsui & Co., Ltd. | 239,100 | 6,952 | ||||||
InPost SA1 | 768,099 | 6,492 | ||||||
TransDigm Group, Inc. | 9,831 | 6,190 | ||||||
Zhejiang Sanhua Intelligent Controls Co., Ltd., Class A | 2,015,524 | 6,140 | ||||||
Suzhou Maxwell Technologies Co., Ltd., Class A | 89,800 | 5,321 | ||||||
Thales SA | 39,462 | 5,045 | ||||||
Interpump Group SpA | 109,354 | 4,954 | ||||||
Boeing Company1 | 25,403 | 4,839 | ||||||
Raytheon Technologies Corp. | 39,064 | 3,942 | ||||||
Contemporary Amperex Technology Co., Ltd., Class A | 67,547 | 3,825 | ||||||
Wizz Air Holdings PLC1 | 153,309 | 3,512 | ||||||
Siemens AG | 24,155 | 3,353 | ||||||
Centre Testing International Group Co., Ltd. | 953,496 | 3,059 | ||||||
SMC Corp. | 7,000 | 2,963 | ||||||
BAE Systems PLC | 273,358 | 2,825 | ||||||
Spirax-Sarco Engineering PLC | 21,156 | 2,718 | ||||||
Epiroc AB, Class B | 153,337 | 2,472 | ||||||
Bharat Electronics, Ltd. | 1,997,357 | 2,412 | ||||||
72 American Funds Insurance Series
Table of Contents
New World Fund (continued)
Common stocks (continued)
| Shares | Value (000) | |||||||
Industrials (continued) | ||||||||
Legrand SA | 28,999 | $ | 2,335 | |||||
Bureau Veritas SA | 85,112 | 2,240 | ||||||
ABB, Ltd. | 71,165 | 2,168 | ||||||
AirTAC International Group | 70,000 | 2,119 | ||||||
Techtronic Industries Co., Ltd. | 180,500 | 2,010 | ||||||
Grupo Aeroportuario del Pacífico, SAB de CV, Class B | 138,094 | 1,978 | ||||||
Hitachi, Ltd. | 32,800 | 1,651 | ||||||
Atlas Copco AB, Class B | 128,644 | 1,374 | ||||||
Nidec Corp. | 25,100 | 1,307 | ||||||
Haitian International Holdings, Ltd. | 485,000 | 1,297 | ||||||
Experian PLC | 27,683 | 942 | ||||||
CCR SA, ordinary nominative shares | 343,384 | 704 | ||||||
Vicor Corp.1 | 8,616 | 463 | ||||||
Hefei Meyer Optoelectronic Technology, Inc., Class A | 126,100 | 434 | ||||||
|
| |||||||
| 333,964 | ||||||||
|
| |||||||
Consumer discretionary 10.70% | ||||||||
LVMH Moët Hennessy-Louis Vuitton SE | 58,437 | 42,451 | ||||||
MercadoLibre, Inc.1 | 33,916 | 28,701 | ||||||
Midea Group Co., Ltd., Class A | 3,015,168 | 22,397 | ||||||
Hermès International | 13,597 | 20,982 | ||||||
Evolution AB | 195,296 | 19,073 | ||||||
Li Ning Co., Ltd. | 2,222,001 | 19,068 | ||||||
Galaxy Entertainment Group, Ltd. | 2,661,000 | 17,620 | ||||||
General Motors Company | 464,326 | 15,620 | ||||||
H World Group, Ltd. (ADR) | 205,118 | 8,701 | ||||||
H World Group, Ltd. | 611,320 | 2,631 | ||||||
YUM! Brands, Inc. | 70,324 | 9,007 | ||||||
Trip.com Group, Ltd. (ADR)1 | 243,784 | 8,386 | ||||||
Zhongsheng Group Holdings, Ltd. | 1,519,000 | 7,743 | ||||||
Kering SA | 13,551 | 6,935 | ||||||
NIKE, Inc., Class B | 56,533 | 6,615 | ||||||
Jumbo SA | 367,791 | 6,278 | ||||||
Astra International Tbk PT | 16,312,800 | 5,943 | ||||||
IDP Education, Ltd. | 294,204 | 5,437 | ||||||
Industria de Diseño Textil, SA | 198,585 | 5,288 | ||||||
Marriott International, Inc., Class A | 35,444 | 5,277 | ||||||
JD.com, Inc., Class A | 181,431 | 5,100 | ||||||
Titan Co., Ltd. | 153,168 | 4,794 | ||||||
Tesla, Inc.1 | 36,323 | 4,474 | ||||||
adidas AG | 32,573 | 4,447 | ||||||
Prosus NV, Class N | 63,003 | 4,325 | ||||||
Alibaba Group Holding, Ltd.1 | 377,472 | 4,168 | ||||||
Americanas SA, ordinary nominative shares | 1,839,202 | 3,362 | ||||||
Lear Corp. | 22,412 | 2,779 | ||||||
Airbnb, Inc., Class A1 | 32,220 | 2,755 | ||||||
Melco Resorts & Entertainment, Ltd. (ADR)1 | 237,753 | 2,734 | ||||||
Maruti Suzuki India, Ltd. | 24,671 | 2,495 | ||||||
Aptiv PLC1 | 23,648 | 2,202 | ||||||
Booking Holdings, Inc.1 | 1,083 | 2,183 | ||||||
InterContinental Hotels Group PLC | 37,749 | 2,173 | ||||||
JD Health International, Inc.1 | 233,200 | 2,133 | ||||||
Naspers, Ltd., Class N | 10,720 | 1,767 | ||||||
Stellantis NV | 121,859 | 1,726 | ||||||
Inchcape PLC | 158,322 | 1,563 | ||||||
Shangri-La Asia, Ltd.1 | 1,882,000 | 1,542 | ||||||
Magazine Luiza SA1 | 2,856,097 | 1,482 | ||||||
Levi Strauss & Co., Class A | 89,390 | 1,387 | ||||||
Sands China, Ltd.1 | 367,200 | 1,216 | ||||||
Renault SA1 | 31,040 | 1,034 | ||||||
FSN E-Commerce Ventures, Ltd. | 499,594 | 932 | ||||||
Flutter Entertainment PLC1 | 6,201 | 850 | ||||||
American Funds Insurance Series 73
Table of Contents
New World Fund (continued)
Common stocks (continued)
| Shares | Value (000) | |||||||
Consumer discretionary (continued) | ||||||||
Cie. Financière Richemont SA, Class A | 6,488 | $ | 840 | |||||
Gree Electric Appliances, Inc. of Zhuhai, Class A | 132,946 | 617 | ||||||
Jiumaojiu International Holdings, Ltd. | 196,000 | 517 | ||||||
Cyrela Brazil Realty SA, ordinary nominative shares | 115,141 | 285 | ||||||
Ozon Holdings PLC (ADR)1,2 | 209,599 | — | 4 | |||||
|
| |||||||
| 330,035 | ||||||||
|
| |||||||
Materials 7.96% | ||||||||
Vale SA (ADR), ordinary nominative shares | 1,657,863 | 28,134 | ||||||
Vale SA, ordinary nominative shares | 1,563,228 | 26,316 | ||||||
First Quantum Minerals, Ltd. | 1,427,502 | 29,826 | ||||||
Freeport-McMoRan, Inc. | 632,561 | 24,037 | ||||||
Asian Paints, Ltd. | 524,675 | 19,588 | ||||||
Albemarle Corp. | 72,979 | 15,826 | ||||||
Linde PLC | 43,780 | 14,280 | ||||||
Sika AG | 54,150 | 13,066 | ||||||
Pidilite Industries, Ltd. | 359,013 | 11,037 | ||||||
Barrick Gold Corp. | 348,685 | 5,990 | ||||||
Shin-Etsu Chemical Co., Ltd. | 46,300 | 5,641 | ||||||
LANXESS AG | 133,996 | 5,408 | ||||||
Sociedad Química y Minera de Chile SA, Class B (ADR) | 59,883 | 4,781 | ||||||
Wacker Chemie AG | 33,237 | 4,248 | ||||||
Gerdau SA (ADR) | 743,704 | 4,120 | ||||||
Givaudan SA | 1,316 | 4,012 | ||||||
Loma Negra Compania Industrial Argentina SA (ADR) | 505,941 | 3,466 | ||||||
Fresnillo PLC | 299,094 | 3,247 | ||||||
Jindal Steel & Power, Ltd. | 427,648 | 2,989 | ||||||
Shandong Sinocera Functional Material Co., Ltd., Class A | 551,700 | 2,189 | ||||||
Wheaton Precious Metals Corp. | 52,459 | 2,050 | ||||||
OCI NV | 50,734 | 1,810 | ||||||
Amcor PLC (CDI) | 142,086 | 1,703 | ||||||
Arkema SA | 18,241 | 1,645 | ||||||
CCL Industries, Inc., Class B, nonvoting shares | 34,789 | 1,486 | ||||||
Umicore SA | 37,150 | 1,371 | ||||||
Koninklijke DSM NV | 11,145 | 1,366 | ||||||
Grupo México, SAB de CV, Series B | 372,626 | 1,308 | ||||||
Corteva, Inc. | 19,893 | 1,169 | ||||||
Glencore PLC | 166,729 | 1,115 | ||||||
Yunnan Energy New Material Co., Ltd., Class A | 53,564 | 1,012 | ||||||
BASF SE | 13,092 | 650 | ||||||
Navin Fluorine International, Ltd. | 7,411 | 364 | ||||||
Polymetal International PLC1 | 76,572 | 228 | ||||||
Alrosa PJSC1,2 | 1,123,215 | — | 4 | |||||
|
| |||||||
| 245,478 | ||||||||
|
| |||||||
Consumer staples 6.23% | ||||||||
Kweichow Moutai Co., Ltd., Class A | 119,607 | 29,597 | ||||||
ITC, Ltd. | 4,065,758 | 16,297 | ||||||
Bunge, Ltd. | 149,915 | 14,957 | ||||||
Anheuser-Busch InBev SA/NV | 179,767 | 10,807 | ||||||
Nestlé SA | 92,198 | 10,648 | ||||||
Constellation Brands, Inc., Class A | 41,910 | 9,713 | ||||||
Philip Morris International, Inc. | 89,011 | 9,009 | ||||||
Varun Beverages, Ltd. | 520,713 | 8,291 | ||||||
Ajinomoto Co., Inc. | 270,999 | 8,263 | ||||||
Monster Beverage Corp.1 | 79,331 | 8,054 | ||||||
Carlsberg A/S, Class B | 47,845 | 6,334 | ||||||
Kimberly-Clark de México, SAB de CV, Class A, ordinary participation certificates | 3,616,697 | 6,138 | ||||||
Pernod Ricard SA | 31,035 | 6,100 | ||||||
Raia Drogasil SA, ordinary nominative shares | 1,191,066 | 5,351 | ||||||
Avenue Supermarts, Ltd.1 | 96,957 | 4,752 | ||||||
Japan Tobacco, Inc. | 232,900 | 4,709 | ||||||
74 American Funds Insurance Series
Table of Contents
New World Fund (continued)
Common stocks (continued)
| Shares | Value (000) | |||||||
Consumer staples (continued) | ||||||||
Arca Continental, SAB de CV | 559,188 | $ | 4,541 | |||||
Dabur India, Ltd. | 536,320 | 3,632 | ||||||
Uni-Charm Corp. | 86,000 | 3,298 | ||||||
Mondelez International, Inc. | 48,376 | 3,224 | ||||||
British American Tobacco PLC | 57,762 | 2,292 | ||||||
L’Oréal SA, non-registered shares | 6,141 | 2,203 | ||||||
Foshan Haitian Flavouring and Food Co., Ltd., Class A | 189,896 | 2,174 | ||||||
Proya Cosmetics Co., Ltd., Class A | 83,620 | 2,015 | ||||||
Danone SA | 34,906 | 1,839 | ||||||
United Spirits, Ltd.1 | 150,135 | 1,593 | ||||||
Essity Aktiebolag, Class B | 59,261 | 1,555 | ||||||
Monde Nissin Corp. | 7,788,000 | 1,553 | ||||||
Wuliangye Yibin Co., Ltd., Class A | 51,771 | 1,340 | ||||||
Reckitt Benckiser Group PLC | 18,928 | 1,317 | ||||||
Diageo PLC | 9,646 | 426 | ||||||
X5 Retail Group NV (GDR)1,2 | 88,147 | — | 4 | |||||
|
| |||||||
| 192,022 | ||||||||
|
| |||||||
Communication services 5.12% | ||||||||
Sea, Ltd., Class A (ADR)1 | 440,837 | 22,937 | ||||||
Alphabet, Inc., Class C1 | 170,931 | 15,167 | ||||||
Alphabet, Inc., Class A1 | 70,628 | 6,231 | ||||||
Bharti Airtel, Ltd. | 1,936,137 | 18,821 | ||||||
Bharti Airtel, Ltd., interim shares | 80,154 | 419 | ||||||
Tencent Holdings, Ltd. | 398,700 | 16,946 | ||||||
MTN Group, Ltd. | 1,937,113 | 14,510 | ||||||
América Móvil, SAB de CV, Series L (ADR) | 579,878 | 10,554 | ||||||
Netflix, Inc.1 | 32,399 | 9,554 | ||||||
Meta Platforms, Inc., Class A1 | 66,844 | 8,044 | ||||||
Telefónica, SA, non-registered shares | 2,013,890 | 7,294 | ||||||
NetEase, Inc. | 215,200 | 3,137 | ||||||
NetEase, Inc. (ADR) | 26,801 | 1,946 | ||||||
Vodafone Group PLC | 4,478,968 | 4,540 | ||||||
Indus Towers, Ltd. | 1,704,995 | 3,916 | ||||||
Activision Blizzard, Inc. | 51,137 | 3,914 | ||||||
Singapore Telecommunications, Ltd. | 1,920,800 | 3,688 | ||||||
JCDecaux SE1 | 88,804 | 1,689 | ||||||
Telefônica Brasil SA, ordinary nominative shares | 222,879 | 1,619 | ||||||
TIM SA | 649,389 | 1,525 | ||||||
Informa PLC | 166,372 | 1,247 | ||||||
Sitios Latinoamerica, SAB de CV, Class B11 | 531,908 | 255 | ||||||
Yandex NV, Class A1,2 | 378,730 | — | 4 | |||||
|
| |||||||
| 157,953 | ||||||||
|
| |||||||
Energy 4.96% | ||||||||
Reliance Industries, Ltd. | 1,922,257 | 58,967 | ||||||
TotalEnergies SE | 429,775 | 26,824 | ||||||
Baker Hughes Co., Class A | 400,704 | 11,833 | ||||||
New Fortress Energy, Inc., Class A | 199,711 | 8,472 | ||||||
BP PLC | 1,438,591 | 8,366 | ||||||
Exxon Mobil Corp. | 66,625 | 7,349 | ||||||
Hess Corp. | 42,526 | 6,031 | ||||||
Cheniere Energy, Inc. | 33,338 | 4,999 | ||||||
Aker BP ASA | 160,241 | 4,995 | ||||||
Chevron Corp. | 24,508 | 4,399 | ||||||
Petróleo Brasileiro SA (Petrobras) (ADR), ordinary nominative shares | 240,586 | 2,562 | ||||||
Shell PLC (GBP denominated) | 88,634 | 2,519 | ||||||
INPEX Corp. | 229,000 | 2,444 | ||||||
TechnipFMC PLC1 | 171,689 | 2,093 | ||||||
American Funds Insurance Series 75
Table of Contents
New World Fund (continued)
Common stocks (continued)
| Shares | Value (000) | |||||||
Energy (continued) | ||||||||
Galp Energia, SGPS, SA, Class B | 76,673 | $ | 1,037 | |||||
Gazprom PJSC2 | 945,858 | — | 4 | |||||
Rosneft Oil Co. PJSC2 | 588,661 | — | 4 | |||||
|
| |||||||
| 152,890 | ||||||||
|
| |||||||
Utilities 1.73% | ||||||||
ENN Energy Holdings, Ltd. | 1,596,100 | 22,267 | ||||||
AES Corp. | 494,900 | 14,233 | ||||||
Engie SA | 433,528 | 6,210 | ||||||
Enel SpA | 717,325 | 3,858 | ||||||
Power Grid Corporation of India, Ltd. | 1,407,075 | 3,622 | ||||||
China Resources Gas Group, Ltd. | 848,600 | 3,161 | ||||||
China Gas Holdings, Ltd. | 67,400 | 97 | ||||||
|
| |||||||
| 53,448 | ||||||||
|
| |||||||
Real estate 1.59% | ||||||||
Macrotech Developers, Ltd.1 | 1,294,321 | 17,070 | ||||||
American Tower Corp. REIT | 36,333 | 7,698 | ||||||
ESR Group, Ltd. | 2,725,200 | 5,720 | ||||||
CK Asset Holdings, Ltd. | 920,500 | 5,667 | ||||||
BR Malls Participações SA, ordinary nominative shares | 3,350,637 | 5,267 | ||||||
China Resources Mixc Lifestyle Services, Ltd. | 550,000 | 2,794 | ||||||
CTP NV | 192,994 | 2,273 | ||||||
Embassy Office Parks REIT | 367,228 | 1,490 | ||||||
China Overseas Land & Investment, Ltd. | 222,115 | 586 | ||||||
Country Garden Services Holdings Co., Ltd. | 180,000 | 446 | ||||||
Ayala Land, Inc. | 198,600 | 110 | ||||||
|
| |||||||
| 49,121 | ||||||||
|
| |||||||
Total common stocks (cost: $2,233,829,000) | 2,786,799 | |||||||
|
| |||||||
Preferred securities 1.05% | ||||||||
Consumer discretionary 0.38% | ||||||||
Dr. Ing. h.c. F. Porsche AG, nonvoting non-registered preferred shares1 | 43,971 | 4,461 | ||||||
Getir BV, Series D, preferred shares1,2,3 | 7,768 | 3,736 | ||||||
Porsche Automobil Holding SE, nonvoting preferred shares | 60,985 | 3,346 | ||||||
|
| |||||||
| 11,543 | ||||||||
|
| |||||||
Materials 0.28% | ||||||||
Gerdau SA, preferred nominative shares | 1,533,179 | 8,529 | ||||||
|
| |||||||
Real estate 0.17% | ||||||||
QuintoAndar, Ltd., Series E, preferred shares1,2,3 | 32,657 | 4,267 | ||||||
QuintoAndar, Ltd., Series E-1, preferred shares1,2,3 | 8,400 | 1,098 | ||||||
|
| |||||||
| 5,365 | ||||||||
|
| |||||||
Financials 0.13% | ||||||||
Itaú Unibanco Holding SA, preferred nominative shares | 339,548 | 1,608 | ||||||
Itaú Unibanco Holding SA (ADR), preferred nominative shares | 151,962 | 716 | ||||||
Banco Bradesco SA, preferred nominative shares | 619,768 | 1,778 | ||||||
|
| |||||||
| 4,102 | ||||||||
|
| |||||||
Energy 0.06% | ||||||||
Petróleo Brasileiro SA (Petrobras) (ADR), preferred nominative shares | 129,613 | 1,204 | ||||||
Petróleo Brasileiro SA (Petrobras), preferred nominative shares | 156,248 | 725 | ||||||
|
| |||||||
| 1,929 | ||||||||
|
| |||||||
Health care 0.02% | ||||||||
Grifols, SA, Class B, nonvoting non-registered preferred shares1 | 71,554 | 605 | ||||||
|
| |||||||
76 American Funds Insurance Series
Table of Contents
New World Fund (continued)
Preferred securities (continued)
| Shares | Value (000) | |||||||
Industrials 0.01% | ||||||||
GOL Linhas Aéreas Inteligentes SA, preferred nominative shares1 | 169,406 | $ | 235 | |||||
|
| |||||||
Information technology 0.00% | ||||||||
Canva, Inc., Series A, noncumulative preferred shares1,2,3 | 34 | 30 | ||||||
Canva, Inc., Series A-3, noncumulative preferred shares1,2,3 | 1 | 1 | ||||||
|
| |||||||
| 31 | ||||||||
|
| |||||||
Total preferred securities (cost: $30,813,000) | 32,339 | |||||||
|
| |||||||
Rights & warrants 0.00% | ||||||||
Materials 0.00% | ||||||||
Shandong Sinocera Functional Material Co., Ltd., Class A, warrants, expire 10/30/20231,6 | 43,474 | 172 | ||||||
|
| |||||||
Consumer discretionary 0.00% | ||||||||
Compagnie Financière Richemont SA, Class A, warrants, expire 11/22/20231 | 37,386 | 31 | ||||||
|
| |||||||
Total rights & warrants (cost: $183,000) | 203 | |||||||
|
| |||||||
Principal amount (000) | ||||||||
Bonds, notes & other debt instruments 3.26% | ||||||||
Bonds & notes of governments & government agencies outside the U.S. 2.66% | ||||||||
Abu Dhabi (Emirate of) 2.50% 9/30/20296 | USD1,000 | 899 | ||||||
Abu Dhabi (Emirate of) 1.70% 3/2/20316 | 885 | 732 | ||||||
Angola (Republic of) 8.25% 5/9/2028 | 500 | 457 | ||||||
Angola (Republic of) 8.00% 11/26/20296 | 1,100 | 968 | ||||||
Angola (Republic of) 8.75% 4/14/20326 | 280 | 243 | ||||||
Argentine Republic 1.00% 7/9/2029 | 32 | 9 | ||||||
Argentine Republic 0.50% 7/9/2030 (0.75% on 7/9/2023)7 | 5,341 | 1,454 | ||||||
Argentine Republic 1.50% 7/9/2035 (3.625% on 7/9/2023)7 | 2,217 | 568 | ||||||
Argentine Republic 3.875% 1/9/2038 (4.25% on 7/9/2023)7 | 1,318 | 420 | ||||||
Argentine Republic 3.50% 7/9/2041 (4.875% on 7/9/2029)7 | 5,279 | 1,502 | ||||||
Armenia (Republic of) 7.15% 3/26/2025 | 290 | 294 | ||||||
Bahrain (Kingdom of) 6.75% 9/20/20296 | 200 | 200 | ||||||
Brazil (Federative Republic of) 10.00% 1/1/2027 | BRL19,869 | 3,461 | ||||||
Brazil (Federative Republic of) 6.00% 5/15/20278 | 16,377 | 3,109 | ||||||
Chile (Republic of) 3.10% 5/7/2041 | USD375 | 271 | ||||||
Chile (Republic of) 4.34% 3/7/2042 | 645 | 547 | ||||||
China (People’s Republic of), Series INBK, 2.89% 11/18/2031 | CNY36,200 | 5,205 | ||||||
China (People’s Republic of), Series INBK, 3.72% 4/12/2051 | 34,650 | 5,410 | ||||||
Colombia (Republic of) 4.50% 1/28/2026 | USD280 | 264 | ||||||
Colombia (Republic of) 3.25% 4/22/2032 | 700 | 511 | ||||||
Colombia (Republic of) 8.00% 4/20/2033 | 200 | 201 | ||||||
Colombia (Republic of) 7.375% 9/18/2037 | 1,090 | 1,025 | ||||||
Colombia (Republic of) 5.625% 2/26/2044 | 520 | 384 | ||||||
Colombia (Republic of) 5.20% 5/15/2049 | 755 | 517 | ||||||
Colombia (Republic of) 4.125% 5/15/2051 | 350 | 211 | ||||||
Cote d’Ivoire (Republic of) 4.875% 1/30/2032 | EUR150 | 127 | ||||||
Dominican Republic 6.875% 1/29/2026 | USD370 | 374 | ||||||
Dominican Republic 8.625% 4/20/20276 | 575 | 600 | ||||||
Dominican Republic 5.50% 2/22/20296 | 275 | 254 | ||||||
Dominican Republic 11.375% 7/6/2029 | DOP12,800 | 221 | ||||||
Dominican Republic 6.00% 2/22/20336 | USD150 | 136 | ||||||
Dominican Republic 7.45% 4/30/20446 | 1,125 | 1,053 | ||||||
Dominican Republic 7.45% 4/30/2044 | 1,000 | 936 | ||||||
Dominican Republic 5.875% 1/30/20606 | 280 | 206 | ||||||
Egypt (Arab Republic of) 5.875% 2/16/20316 | 365 | 255 | ||||||
American Funds Insurance Series 77
Table of Contents
New World Fund (continued)
Bonds, notes & other debt instruments (continued)
Principal (000) | Value (000) | |||||||
Bonds & notes of governments & government agencies outside the U.S. (continued) | ||||||||
Egypt (Arab Republic of) 6.375% 4/11/2031 | EUR550 | $ | 411 | |||||
Egypt (Arab Republic of) 7.625% 5/29/20326 | USD900 | 669 | ||||||
Egypt (Arab Republic of) 7.625% 5/29/2032 | 275 | 204 | ||||||
Egypt (Arab Republic of) 8.50% 1/31/2047 | 800 | 536 | ||||||
Egypt (Arab Republic of) 8.875% 5/29/2050 | 850 | 578 | ||||||
Egypt (Arab Republic of) 8.75% 9/30/2051 | 755 | 510 | ||||||
Egypt (Arab Republic of) 8.15% 11/20/20596 | 500 | 329 | ||||||
Ethiopia (Federal Democratic Republic of) 6.625% 12/11/2024 | 880 | 553 | ||||||
Export-Import Bank of India 3.25% 1/15/2030 | 1,180 | 1,025 | ||||||
Gabonese Republic 6.95% 6/16/2025 | 540 | 513 | ||||||
Gabonese Republic 7.00% 11/24/2031 | 300 | 247 | ||||||
Ghana (Republic of) 6.375% 2/11/2027 | 485 | 188 | ||||||
Ghana (Republic of) 7.875% 3/26/2027 | 200 | 79 | ||||||
Ghana (Republic of) 7.75% 4/7/20296 | 1,125 | 423 | ||||||
Ghana (Republic of) 7.625% 5/16/2029 | 460 | 174 | ||||||
Ghana (Republic of) 8.125% 3/26/2032 | 2,130 | 782 | ||||||
Honduras (Republic of) 6.25% 1/19/2027 | 1,365 | 1,208 | ||||||
Honduras (Republic of) 5.625% 6/24/2030 | 678 | 547 | ||||||
Honduras (Republic of) 5.625% 6/24/20306 | 281 | 227 | ||||||
Indonesia (Republic of) 6.625% 2/17/2037 | 500 | 568 | ||||||
Indonesia (Republic of) 5.25% 1/17/2042 | 840 | 828 | ||||||
Iraq (Republic of) 6.752% 3/9/2023 | 960 | 950 | ||||||
Jordan (Hashemite Kingdom of) 5.75% 1/31/20276 | 800 | 773 | ||||||
Kazakhstan (Republic of) 6.50% 7/21/20456 | 800 | 836 | ||||||
Kenya (Republic of) 6.875% 6/24/2024 | 200 | 185 | ||||||
Kenya (Republic of) 8.25% 2/28/20486 | 1,800 | 1,402 | ||||||
Mongolia (State of) 8.75% 3/9/2024 | 370 | 359 | ||||||
Mongolia (State of) 4.45% 7/7/2031 | 300 | 234 | ||||||
Mozambique (Republic of) 5.00% 9/15/2031 (9.00% on 9/15/2023)7 | 880 | 678 | ||||||
Oman (Sultanate of) 4.875% 2/1/20256 | 565 | 556 | ||||||
Oman (Sultanate of) 5.375% 3/8/2027 | 750 | 736 | ||||||
Oman (Sultanate of) 6.25% 1/25/20316 | 600 | 606 | ||||||
Pakistan (Islamic Republic of) 8.25% 9/30/20256 | 410 | 199 | ||||||
Pakistan (Islamic Republic of) 6.00% 4/8/20266 | 380 | 153 | ||||||
Pakistan (Islamic Republic of) 6.875% 12/5/20276 | 1,050 | 416 | ||||||
Pakistan (Islamic Republic of) 7.875% 3/31/2036 | 200 | 72 | ||||||
Pakistan (Islamic Republic of) 8.875% 4/8/2051 | 850 | 300 | ||||||
Panama (Republic of) 3.75% 4/17/20266 | 678 | 639 | ||||||
Panama (Republic of) 4.50% 5/15/2047 | 1,155 | 892 | ||||||
Panama (Republic of) 4.50% 4/16/2050 | 200 | 152 | ||||||
Panama (Republic of) 4.30% 4/29/2053 | 400 | 290 | ||||||
Panama (Republic of) 4.50% 1/19/2063 | 200 | 142 | ||||||
Paraguay (Republic of) 4.70% 3/27/20276 | 400 | 395 | ||||||
Paraguay (Republic of) 4.95% 4/28/2031 | 320 | 310 | ||||||
Peru (Republic of) 3.00% 1/15/2034 | 425 | 336 | ||||||
Peru (Republic of) 6.55% 3/14/2037 | 1,070 | 1,131 | ||||||
Peru (Republic of) 3.55% 3/10/2051 | 370 | 265 | ||||||
Peru (Republic of) 2.78% 12/1/2060 | 365 | 214 | ||||||
PETRONAS Capital, Ltd. 4.55% 4/21/20506 | 400 | 359 | ||||||
Philippines (Republic of) 1.648% 6/10/2031 | 580 | 465 | ||||||
Philippines (Republic of) 6.375% 10/23/2034 | 820 | 911 | ||||||
Philippines (Republic of) 3.95% 1/20/2040 | 700 | 595 | ||||||
Philippines (Republic of) 3.70% 3/1/2041 | 505 | 414 | ||||||
Philippines (Republic of) 2.95% 5/5/2045 | 790 | 572 | ||||||
PT Indonesia Asahan Aluminium Tbk 6.757% 11/15/2048 | 200 | 188 | ||||||
Qatar (State of) 4.50% 4/23/20286 | 2,000 | 2,016 | ||||||
Qatar (State of) 4.50% 4/23/2028 | 600 | 605 | ||||||
Romania 2.00% 1/28/2032 | EUR1,375 | 987 | ||||||
Romania 2.00% 4/14/2033 | 300 | 207 | ||||||
Romania 5.125% 6/15/20486 | USD500 | 399 | ||||||
Russian Federation 4.25% 6/23/20279 | 1,000 | 430 | ||||||
78 American Funds Insurance Series
Table of Contents
New World Fund (continued)
Bonds, notes & other debt instruments (continued)
Principal amount (000) | Value (000) | |||||||
Bonds & notes of governments & government agencies outside the U.S. (continued) | ||||||||
Russian Federation 4.375% 3/21/20296,9 | USD800 | $ | 328 | |||||
Russian Federation 5.10% 3/28/20359 | 1,600 | 656 | ||||||
Russian Federation 5.25% 6/23/20479 | 1,200 | 492 | ||||||
Senegal (Republic of) 4.75% 3/13/2028 | EUR950 | 880 | ||||||
South Africa (Republic of) 5.875% 6/22/2030 | USD1,200 | 1,120 | ||||||
South Africa (Republic of) 5.875% 4/20/2032 | 400 | 362 | ||||||
Sri Lanka (Democratic Socialist Republic of) 6.125% 6/3/20259 | 450 | 147 | ||||||
Sri Lanka (Democratic Socialist Republic of) 6.85% 11/3/20259 | 1,904 | 614 | ||||||
Sri Lanka (Democratic Socialist Republic of) 6.825% 7/18/20269 | 1,270 | 407 | ||||||
Sri Lanka (Democratic Socialist Republic of) 7.55% 3/28/20309 | 471 | 150 | ||||||
Tunisia (Republic of) 6.75% 10/31/2023 | EUR465 | 420 | ||||||
Tunisia (Republic of) 6.75% 10/31/2023 | 310 | 280 | ||||||
Tunisia (Republic of) 5.625% 2/17/2024 | 500 | 422 | ||||||
Tunisia (Republic of) 5.75% 1/30/2025 | USD625 | 435 | ||||||
Turkey (Republic of) 11.875% 1/15/2030 | 800 | 954 | ||||||
Turkey (Republic of) 5.875% 6/26/2031 | 1,170 | 963 | ||||||
Turkey (Republic of) 4.875% 4/16/2043 | 400 | 261 | ||||||
Turkey (Republic of) 5.75% 5/11/2047 | 2,005 | 1,373 | ||||||
Ukraine 8.994% 2/1/20269 | 600 | 134 | ||||||
Ukraine 7.75% 9/1/20299 | 2,328 | 503 | ||||||
Ukraine 9.75% 11/1/20309 | 900 | 187 | ||||||
Ukraine 7.375% 9/25/20349 | �� | 2,180 | 416 | |||||
United Mexican States 4.50% 4/22/2029 | 300 | 287 | ||||||
United Mexican States 4.75% 4/27/2032 | 870 | 817 | ||||||
United Mexican States 4.75% 3/8/2044 | 1,090 | 884 | ||||||
United Mexican States 3.75% 4/19/2071 | 200 | 125 | ||||||
United Mexican States, Series M, 7.50% 6/3/2027 | MXN20,360 | 986 | ||||||
United Mexican States, Series M, 7.75% 5/29/2031 | 43,000 | 2,044 | ||||||
Venezuela (Bolivarian Republic of) 9.00% 5/7/20239 | USD1,383 | 121 | ||||||
Venezuela (Bolivarian Republic of) 8.25% 10/13/20249 | 299 | 26 | ||||||
Venezuela (Bolivarian Republic of) 7.65% 4/21/20259 | 129 | 11 | ||||||
Venezuela (Bolivarian Republic of) 11.75% 10/21/20269 | 64 | 6 | ||||||
Venezuela (Bolivarian Republic of) 9.25% 9/15/20279 | 170 | 16 | ||||||
Venezuela (Bolivarian Republic of) 9.25% 5/7/20289 | 319 | 29 | ||||||
Venezuela (Bolivarian Republic of) 7.00% 12/1/20189 | 64 | 5 | ||||||
Venezuela (Bolivarian Republic of) 7.75% 10/13/20199 | 1,149 | 92 | ||||||
Venezuela (Bolivarian Republic of) 6.00% 12/9/20209 | 950 | 67 | ||||||
Venezuela (Bolivarian Republic of) 11.95% 8/5/20319 | 106 | 10 | ||||||
Venezuela (Bolivarian Republic of) 12.75% 8/23/20229 | 85 | 7 | ||||||
Venezuela (Bolivarian Republic of) 7.00% 3/31/20389 | 107 | 10 | ||||||
|
| |||||||
| 82,039 | ||||||||
|
| |||||||
Corporate bonds, notes & loans 0.51% | ||||||||
Energy 0.17% | ||||||||
Oleoducto Central SA 4.00% 7/14/20276 | 255 | 225 | ||||||
Oleoducto Central SA 4.00% 7/14/2027 | 200 | 177 | ||||||
Petrobras Global Finance Co. 6.85% 6/5/2115 | 314 | 266 | ||||||
Petróleos Mexicanos 6.875% 8/4/2026 | 800 | 757 | ||||||
Petróleos Mexicanos 6.49% 1/23/2027 | 1,670 | 1,525 | ||||||
Petróleos Mexicanos 8.75% 6/2/2029 | 1,105 | 1,038 | ||||||
Petróleos Mexicanos 6.70% 2/16/2032 | 622 | 490 | ||||||
Petrorio Luxembourg SARL 6.125% 6/9/2026 | 200 | 191 | ||||||
PTT Exploration and Production PCL 2.993% 1/15/2030 | 200 | 174 | ||||||
Sinopec Group Overseas Development (2018), Ltd. 3.10% 1/8/20516 | 630 | 420 | ||||||
|
| |||||||
| 5,263 | ||||||||
|
| |||||||
American Funds Insurance Series 79
Table of Contents
New World Fund (continued)
Bonds, notes & other debt instruments (continued)
| Principal amount (000) | Value (000) | |||||||
Corporate bonds, notes & loans (continued) | ||||||||
Financials 0.09% | ||||||||
Bangkok Bank PCL 3.733% 9/25/2034 (5-year UST Yield Curve Rate T Note Constant Maturity + 1.90% on 9/25/2029)7 | USD800 | $ | 670 | |||||
CMB International Leasing Management, Ltd. 2.75% 8/12/2030 | 895 | 687 | ||||||
HDFC Bank, Ltd. 3.70% junior subordinated perpetual bonds (5-Year UST Yield Curve Rate T Note Constant Maturity + 2.925% on 2/25/2027)6,7 | 600 | 516 | ||||||
Power Financial Corp., Ltd. 6.15% 12/6/2028 | 432 | 439 | ||||||
Power Financial Corp., Ltd. 4.50% 6/18/2029 | 273 | 253 | ||||||
Power Financial Corp., Ltd. 3.35% 5/16/2031 | 310 | 258 | ||||||
|
| |||||||
| 2,823 | ||||||||
|
| |||||||
Consumer discretionary 0.07% | ||||||||
Alibaba Group Holding, Ltd. 4.20% 12/6/2047 | 600 | 461 | ||||||
Alibaba Group Holding, Ltd. 3.15% 2/9/2051 | 410 | 256 | ||||||
Arcos Dorados BV 6.125% 5/27/2029 | 450 | 437 | ||||||
Meituan Dianping 3.05% 10/28/20306 | 800 | 618 | ||||||
MercadoLibre, Inc. 3.125% 1/14/2031 | 400 | 310 | ||||||
Sands China, Ltd. 4.875% 6/18/2030 | 220 | 193 | ||||||
|
| |||||||
| 2,275 | ||||||||
|
| |||||||
Materials 0.05% | ||||||||
Braskem Idesa SAPI 7.45% 11/15/2029 | 775 | 613 | ||||||
Braskem Idesa SAPI 7.45% 11/15/20296 | 300 | 237 | ||||||
GC Treasury Center Co., Ltd. 4.40% 3/30/20326 | 230 | 204 | ||||||
Sasol Financing USA, LLC 5.875% 3/27/2024 | 500 | 491 | ||||||
|
| |||||||
| 1,545 | ||||||||
|
| |||||||
Utilities 0.04% | ||||||||
AES Panama Generation Holdings SRL 4.375% 5/31/20306 | 280 | 244 | ||||||
Empresas Publicas de Medellin ESP 4.25% 7/18/20296 | 412 | 328 | ||||||
Enfragen Energia Sur SA 5.375% 12/30/2030 | 969 | 679 | ||||||
|
| |||||||
| 1,251 | ||||||||
|
| |||||||
Communication services 0.04% | ||||||||
Axiata SPV5 Labuan, Ltd. 3.064% 8/19/2050 | 357 | 238 | ||||||
PLDT, Inc. 2.50% 1/23/2031 | 210 | 165 | ||||||
Tencent Holdings, Ltd. 3.975% 4/11/2029 | 400 | 369 | ||||||
Tencent Holdings, Ltd. 3.24% 6/3/20506 | 580 | 368 | ||||||
|
| |||||||
| 1,140 | ||||||||
|
| |||||||
Consumer staples 0.02% | ||||||||
Marfrig Global Foods SA 3.95% 1/29/2031 | 320 | 246 | ||||||
NBM US Holdings, Inc. 6.625% 8/6/20293 | 420 | 407 | ||||||
|
| |||||||
| 653 | ||||||||
|
| |||||||
Industrials 0.02% | ||||||||
Mexico City Airport Trust 4.25% 10/31/2026 | 475 | 454 | ||||||
|
| |||||||
Health care 0.01% | ||||||||
Rede D’Or Finance SARL 4.50% 1/22/2030 | 480 | 414 | ||||||
|
| |||||||
Total corporate bonds, notes & loans | 15,818 | |||||||
|
| |||||||
U.S. Treasury bonds & notes 0.09% | ||||||||
U.S. Treasury 0.09% | ||||||||
U.S. Treasury (3-month U.S. Treasury Bill Yield - 0.015%) 4.383% 1/31/202410,11 | 2,730 | 2,729 | ||||||
|
| |||||||
Total bonds, notes & other debt instruments (cost: $123,585,000) | 100,586 | |||||||
|
| |||||||
80 American Funds Insurance Series
Table of Contents
New World Fund (continued)
| Shares | Value (000) | |||||||
| Short-term securities 5.44% | ||||||||
Money market investments 5.43% | ||||||||
Capital Group Central Cash Fund 4.31%12,13 | 1,673,444 | $ | 167,328 | |||||
|
| |||||||
Money market investments purchased with collateral from securities on loan 0.01% | ||||||||
Goldman Sachs Financial Square Government Fund, Institutional Shares 4.15%12,14 | 149,334 | 150 | ||||||
Capital Group Central Cash Fund 4.31%12,13,14 | 862 | 86 | ||||||
Invesco Short-Term Investments Trust – Government & Agency Portfolio, Institutional Class 4.22%12,14 | 58,955 | 59 | ||||||
|
| |||||||
| 295 | ||||||||
|
| |||||||
Total short-term securities (cost: $167,602,000) | 167,623 | |||||||
|
| |||||||
Total investment securities 100.12% (cost: $2,556,012,000) | 3,087,550 | |||||||
Other assets less liabilities (0.12)% | (3,766 | ) | ||||||
|
| |||||||
Net assets 100.00% | $ | 3,083,784 | ||||||
|
| |||||||
Futures contracts
Contracts | Type | Number of contracts | Expiration | Notional amount (000) | Value and unrealized (depreciation) appreciation at 12/31/2022 (000) | |||||||||||||||
2 Year Euro-Schatz Futures | Long | 40 | March 2023 | USD4,514 | $ | (18 | ) | |||||||||||||
5 Year U.S. Treasury Note Futures | Short | 14 | March 2023 | (1,511 | ) | 3 | ||||||||||||||
10 Year Euro-Bund Futures | Short | 18 | March 2023 | (2,561 | ) | 126 | ||||||||||||||
10 Year Ultra U.S. Treasury Note Futures | Short | 43 | March 2023 | (5,086 | ) | 30 | ||||||||||||||
30 Year Ultra U.S. Treasury Bond Futures | Long | 53 | March 2023 | 7,118 | (48 | ) | ||||||||||||||
|
| |||||||||||||||||||
| $ | 93 | |||||||||||||||||||
|
| |||||||||||||||||||
Forward currency contracts
Contract amount | Counterparty | Settlement date | Unrealized (depreciation) (depreciation) appreciation at 12/31/2022 (000) | |||||||||
Currency purchased (000) | Currency sold | |||||||||||
USD 77 | EUR 73 | Goldman Sachs | 1/11/2023 | $ | (1 | ) | ||||||
USD 1,484 | EUR 1,409 | Goldman Sachs | 1/12/2023 | (25 | ) | |||||||
EUR 8 | USD 9 | Barclays Bank PLC | 1/13/2023 | — | 4 | |||||||
USD 1,683 | EUR 1,593 | JPMorgan Chase | 1/13/2023 | (24 | ) | |||||||
|
| |||||||||||
| $ | (50 | ) | ||||||||||
|
| |||||||||||
American Funds Insurance Series 81
Table of Contents
New World Fund (continued)
Swap contracts
Credit default swaps
Centrally cleared credit default swaps on credit indices – buy protection
Reference index | Financing rate paid | Payment frequency | Expiration date | Notional amount (000) | Value at 12/31/2022 (000) | Upfront premium paid (000) | Unrealized appreciation at 12/31/2022 (000) | |||||||||||||||||||||
CDX.EM.38 | 1.00 | % | Quarterly | 12/20/2027 | USD2,230 | $ | 131 | $ | 129 | $ | 2 | |||||||||||||||||
Investments in affiliates13
| Value of affiliates at 1/1/2022 (000) | Additions (000) | Reductions (000) | Net realized loss (000) | Net unrealized appreciation (000) | Value of affiliates at 12/31/2022 (000) | Dividend income (000) | ||||||||||||||||||||||
Short-term securities 5.43% | ||||||||||||||||||||||||||||
Money market investments 5.43% | ||||||||||||||||||||||||||||
Capital Group Central Cash Fund 4.31%12 | $ | 216,764 | $ | 756,276 | $ | 805,673 | $ | (44 | ) | $ | 5 | $ | 167,328 | $ | 4,331 | |||||||||||||
Money market investments purchased with collateral from securities on loan 0.00% | ||||||||||||||||||||||||||||
Capital Group Central Cash Fund 4.31%12,14 | 4,255 | 4,169 | 15 | 86 | — | 16 | ||||||||||||||||||||||
|
|
|
|
|
|
|
| |||||||||||||||||||||
Total 5.43% | $ | (44 | ) | $ | 5 | $ | 167,414 | $ | 4,331 | |||||||||||||||||||
|
|
|
|
|
|
|
| |||||||||||||||||||||
Restricted securities3
| Acquisition date(s) | Cost (000) | Value (000) | Percent of net assets | |||||||||||||
QuintoAndar, Ltd., Series E, preferred shares1,2 | 5/26/2021 | $ | 5,258 | $ | 4,267 | .14 | % | |||||||||
QuintoAndar, Ltd., Series E-1, preferred shares1,2 | 12/20/2021 | 1,716 | 1,098 | .04 | ||||||||||||
Getir BV, Series D, preferred shares1,2 | 5/27/2021 | 3,500 | 3,736 | .12 | ||||||||||||
NBM US Holdings, Inc. 6.625% 8/6/2029 | 7/8/2022 | 404 | 407 | .01 | ||||||||||||
Canva, Inc.1,2 | 8/26/2021-11/4/2021 | 656 | 342 | .01 | ||||||||||||
Canva, Inc., Series A, noncumulative preferred shares1,2 | 11/4/2021 | 58 | 30 | .00 | ||||||||||||
Canva, Inc., Series A-3, noncumulative preferred shares1,2 | 11/4/2021 | 2 | 1 | .00 | ||||||||||||
|
|
|
|
|
| |||||||||||
Total | $ | 11,594 | $ | 9,881 | .32 | % | ||||||||||
|
|
|
|
|
| |||||||||||
| 1 | Security did not produce income during the last 12 months. |
82 American Funds Insurance Series
Table of Contents
New World Fund (continued)
| 2 | Value determined using significant unobservable inputs. |
| 3 | Restricted security, other than Rule 144A securities or commercial paper issued pursuant to Section 4(a)(2) of the Securities Act of 1933. The total value of all such restricted securities was $9,881,000, which represented .32% of the net assets of the fund. |
| 4 | Amount less than one thousand. |
| 5 | All or a portion of this security was on loan. The total value of all such securities was $311,000, which represented .01% of the net assets of the fund. Refer to Note 5 for more information on securities lending. |
| 6 | Acquired in a transaction exempt from registration under Rule 144A or, for commercial paper, Section 4(a)(2) of the Securities Act of 1933. May be resold in the U.S. in transactions exempt from registration, normally to qualified institutional buyers. The total value of all such securities was $19,603,000, which represented .64% of the net assets of the fund. |
| 7 | Step bond; coupon rate may change at a later date. |
| 8 | Index-linked bond whose principal amount moves with a government price index. |
| 9 | Scheduled interest and/or principal payment was not received. |
| 10 | All or a portion of this security was pledged as collateral. The total value of pledged collateral was $297,000, which represented .01% of the net assets of the fund. |
| 11 | Coupon rate may change periodically. Reference rate and spread are as of the most recent information available. Some coupon rates are determined by the issuer or agent based on current market conditions; therefore, the reference rate and spread are not available. |
| 12 | Rate represents the seven-day yield at 12/31/2022. |
| 13 | Part of the same “group of investment companies” as the fund as defined under the Investment Company Act of 1940, as amended. |
| 14 | Security purchased with cash collateral from securities on loan. Refer to Note 5 for more information on securities lending. |
| 15 | Represents net activity. Refer to Note 5 for more information on securities lending. |
| 16 | Dividend income is included with securities lending income in the fund’s statement of operations and is not shown in this table. |
Key to abbreviations
ADR = American Depositary Receipts
BRL = Brazilian reais
CDI = CREST Depository Interest
CNY = Chinese yuan
DOP = Dominican pesos
EUR = Euros
GBP = British pounds
GDR = Global Depositary Receipts
MXN = Mexican pesos
REIT = Real Estate Investment Trust
USD = U.S. dollars
Refer to the notes to financial statements.
American Funds Insurance Series 83
Table of Contents
Washington Mutual Investors Fund
Investment portfolio December 31, 2022
Common stocks 95.35%
| Shares | Value (000) | |||||||
Health care 21.99% | ||||||||
UnitedHealth Group, Inc. | 706,573 | $ | 374,611 | |||||
Pfizer, Inc. | 5,089,889 | 260,806 | ||||||
CVS Health Corp. | 2,030,283 | 189,202 | ||||||
Eli Lilly and Company | 436,276 | 159,607 | ||||||
Johnson & Johnson | 897,185 | 158,488 | ||||||
AbbVie, Inc. | 926,694 | 149,763 | ||||||
AstraZeneca PLC (ADR) | 1,747,998 | 118,514 | ||||||
Humana, Inc. | 211,641 | 108,400 | ||||||
Gilead Sciences, Inc. | 1,234,157 | 105,952 | ||||||
Abbott Laboratories | 676,709 | 74,296 | ||||||
Cigna Corp. | 197,196 | 65,339 | ||||||
Elevance Health, Inc. | 118,687 | 60,883 | ||||||
Danaher Corp. | 228,637 | 60,685 | ||||||
Bristol-Myers Squibb Company | 577,839 | 41,576 | ||||||
Novo Nordisk A/S, Class B (ADR) | 214,095 | 28,976 | ||||||
Zimmer Biomet Holdings, Inc. | 179,120 | 22,838 | ||||||
Thermo Fisher Scientific, Inc. | 38,181 | 21,026 | ||||||
Regeneron Pharmaceuticals, Inc.1 | 25,933 | 18,710 | ||||||
Zoetis, Inc., Class A | 100,063 | 14,664 | ||||||
Roche Holding AG (ADR) | 322,207 | 12,614 | ||||||
Molina Healthcare, Inc.1 | 37,656 | 12,435 | ||||||
Edwards Lifesciences Corp.1 | 85,300 | 6,364 | ||||||
Baxter International, Inc. | 114,187 | 5,820 | ||||||
ResMed, Inc. | 24,754 | 5,152 | ||||||
|
| |||||||
| 2,076,721 | ||||||||
|
| |||||||
Information technology 17.56% | ||||||||
Broadcom, Inc. | 919,032 | 513,857 | ||||||
Microsoft Corp. | 1,830,263 | 438,934 | ||||||
Apple, Inc. | 765,754 | 99,494 | ||||||
ASML Holding NV (New York registered) (ADR) | 157,302 | 85,950 | ||||||
Intel Corp. | 2,778,330 | 73,431 | ||||||
Visa, Inc., Class A | 290,482 | 60,351 | ||||||
Fidelity National Information Services, Inc. | 587,989 | 39,895 | ||||||
Motorola Solutions, Inc. | 149,004 | 38,400 | ||||||
Mastercard, Inc., Class A | 110,216 | 38,325 | ||||||
SAP SE (ADR) | 370,066 | 38,187 | ||||||
KLA Corp. | 90,564 | 34,145 | ||||||
Applied Materials, Inc. | 344,981 | 33,594 | ||||||
Paychex, Inc. | 238,707 | 27,585 | ||||||
TE Connectivity, Ltd. | 233,588 | 26,816 | ||||||
Automatic Data Processing, Inc. | 91,188 | 21,781 | ||||||
Texas Instruments, Inc. | 119,302 | 19,711 | ||||||
NetApp, Inc. | 285,109 | 17,124 | ||||||
Synopsys, Inc.1 | 47,178 | 15,064 | ||||||
Oracle Corp. | 116,989 | 9,563 | ||||||
QUALCOMM, Inc. | 85,889 | 9,443 | ||||||
EPAM Systems, Inc.1 | 21,637 | 7,091 | ||||||
Analog Devices, Inc. | 28,186 | 4,623 | ||||||
Micron Technology, Inc. | 74,256 | 3,711 | ||||||
Ciena Corp.1 | 17,550 | 895 | ||||||
|
| |||||||
| 1,657,970 | ||||||||
|
| |||||||
Financials 13.67% | ||||||||
Marsh & McLennan Companies, Inc. | 1,329,999 | 220,088 | ||||||
JPMorgan Chase & Co. | 1,231,233 | 165,108 | ||||||
BlackRock, Inc. | 152,050 | 107,747 | ||||||
Chubb, Ltd. | 450,474 | 99,375 | ||||||
CME Group, Inc., Class A | 530,969 | 89,288 | ||||||
Wells Fargo & Company | 1,821,863 | 75,225 | ||||||
Bank of America Corp. | 1,370,945 | 45,406 | ||||||
Citizens Financial Group, Inc. | 1,109,159 | 43,668 | ||||||
84 American Funds Insurance Series
Table of Contents
Washington Mutual Investors Fund (continued)
Common stocks (continued)
| Shares | Value (000) | |||||||
Financials (continued) | ||||||||
Discover Financial Services | 414,920 | $ | 40,592 | |||||
Intercontinental Exchange, Inc. | 394,483 | 40,470 | ||||||
Morgan Stanley | 458,540 | 38,985 | ||||||
S&P Global, Inc. | 111,373 | 37,303 | ||||||
Capital One Financial Corp. | 348,076 | 32,357 | ||||||
Blackstone, Inc., nonvoting shares | 403,946 | 29,969 | ||||||
Apollo Asset Management, Inc. | 443,289 | 28,277 | ||||||
Nasdaq, Inc. | 458,289 | 28,116 | ||||||
KKR & Co., Inc. | 601,229 | 27,909 | ||||||
Goldman Sachs Group, Inc. | 78,842 | 27,073 | ||||||
Aon PLC, Class A | 75,142 | 22,553 | ||||||
PNC Financial Services Group, Inc. | 130,342 | 20,586 | ||||||
Toronto-Dominion Bank2 | 236,859 | 15,339 | ||||||
KeyCorp | 770,460 | 13,422 | ||||||
Canadian Imperial Bank of Commerce | 314,940 | 12,739 | ||||||
Arthur J. Gallagher & Co. | 56,249 | 10,605 | ||||||
Moody’s Corp. | 26,105 | 7,273 | ||||||
Fifth Third Bancorp | 192,883 | 6,329 | ||||||
Charles Schwab Corp. | 38,738 | 3,225 | ||||||
Progressive Corp. | 14,654 | 1,901 | ||||||
|
| |||||||
| 1,290,928 | ||||||||
|
| |||||||
Industrials 11.24% | ||||||||
Northrop Grumman Corp. | 340,603 | 185,836 | ||||||
Lockheed Martin Corp. | 220,356 | 107,201 | ||||||
Raytheon Technologies Corp. | 991,865 | 100,099 | ||||||
Caterpillar, Inc. | 415,519 | 99,542 | ||||||
Norfolk Southern Corp. | 312,913 | 77,108 | ||||||
CSX Corp. | 2,421,254 | 75,011 | ||||||
L3Harris Technologies, Inc. | 323,116 | 67,276 | ||||||
Honeywell International, Inc. | 292,363 | 62,653 | ||||||
Boeing Company1 | 256,666 | 48,892 | ||||||
Waste Connections, Inc. | 206,205 | 27,335 | ||||||
Equifax, Inc. | 124,702 | 24,237 | ||||||
ABB, Ltd. (ADR) | 753,846 | 22,962 | ||||||
United Parcel Service, Inc., Class B | 123,077 | 21,396 | ||||||
Robert Half International, Inc. | 278,467 | 20,559 | ||||||
Union Pacific Corp. | 99,249 | 20,552 | ||||||
Rockwell Automation | 59,498 | 15,325 | ||||||
Carrier Global Corp. | 317,975 | 13,117 | ||||||
Huntington Ingalls Industries, Inc. | 47,307 | 10,913 | ||||||
PACCAR, Inc. | 108,835 | 10,771 | ||||||
Republic Services, Inc. | 78,273 | 10,096 | ||||||
Johnson Controls International PLC | 152,323 | 9,749 | ||||||
BAE Systems PLC (ADR)2 | 212,361 | 8,950 | ||||||
HEICO Corp. | 56,216 | 8,637 | ||||||
Air Lease Corp., Class A | 157,245 | 6,041 | ||||||
RELX PLC (ADR) | 186,041 | 5,157 | ||||||
Waste Management, Inc. | 11,150 | 1,749 | ||||||
|
| |||||||
| 1,061,164 | ||||||||
|
| |||||||
Consumer discretionary 8.11% | ||||||||
Home Depot, Inc. | 574,803 | 181,557 | ||||||
YUM! Brands, Inc. | 682,736 | 87,445 | ||||||
Target Corp. | 566,187 | 84,385 | ||||||
General Motors Company | 1,894,289 | 63,724 | ||||||
Darden Restaurants, Inc. | 417,284 | 57,723 | ||||||
Lennar Corp., Class A | 515,314 | 46,636 | ||||||
Wynn Resorts, Ltd.1 | 470,851 | 38,831 | ||||||
NIKE, Inc., Class B | 321,417 | 37,609 | ||||||
TJX Companies, Inc. | 469,822 | 37,398 | ||||||
Dollar General Corp. | 115,057 | 28,333 | ||||||
American Funds Insurance Series 85
Table of Contents
Washington Mutual Investors Fund (continued)
Common stocks (continued)
| Shares | Value (000) | |||||||
Consumer discretionary (continued) | ||||||||
D.R. Horton, Inc. | 283,590 | $ | 25,279 | |||||
Starbucks Corp. | 247,055 | 24,508 | ||||||
Chipotle Mexican Grill, Inc.1 | 9,251 | 12,836 | ||||||
VF Corp. | 440,631 | 12,166 | ||||||
Aptiv PLC1 | 104,868 | 9,766 | ||||||
McDonald’s Corp. | 21,948 | 5,784 | ||||||
Royal Caribbean Cruises, Ltd.1 | 110,264 | 5,450 | ||||||
Polaris, Inc. | 52,835 | 5,336 | ||||||
Amazon.com, Inc.1 | 17,265 | 1,450 | ||||||
|
| |||||||
| 766,216 | ||||||||
|
| |||||||
Consumer staples 6.76% | ||||||||
Archer Daniels Midland Company | 1,568,943 | 145,676 | ||||||
Philip Morris International, Inc. | 1,242,650 | 125,769 | ||||||
Keurig Dr Pepper, Inc. | 1,386,913 | 49,457 | ||||||
Kraft Heinz Company | 1,133,294 | 46,136 | ||||||
Procter & Gamble Company | 266,724 | 40,425 | ||||||
Reckitt Benckiser Group PLC (ADR)2 | 2,494,590 | 35,149 | ||||||
Nestlé SA (ADR) | 289,515 | 33,393 | ||||||
General Mills, Inc. | 345,460 | 28,967 | ||||||
Hormel Foods Corp. | 592,388 | 26,983 | ||||||
Mondelez International, Inc. | 372,276 | 24,812 | ||||||
Costco Wholesale Corp. | 50,498 | 23,052 | ||||||
Church & Dwight Co., Inc. | 148,770 | 11,992 | ||||||
Walgreens Boots Alliance, Inc. | 316,943 | 11,841 | ||||||
Unilever PLC (ADR) | 182,723 | 9,200 | ||||||
British American Tobacco PLC (ADR) | 222,076 | 8,879 | ||||||
Kimberly-Clark Corp. | 55,351 | 7,514 | ||||||
Danone (ADR) | 694,054 | 7,298 | ||||||
Conagra Brands, Inc. | 57,435 | 2,223 | ||||||
|
| |||||||
| 638,766 | ||||||||
|
| |||||||
Energy 5.90% | ||||||||
Pioneer Natural Resources Company | 558,497 | 127,555 | ||||||
Chevron Corp. | 509,098 | 91,378 | ||||||
ConocoPhillips | 757,878 | 89,430 | ||||||
Baker Hughes Co., Class A | 2,518,351 | 74,367 | ||||||
Exxon Mobil Corp. | 576,453 | 63,583 | ||||||
EOG Resources, Inc. | 297,609 | 38,546 | ||||||
Canadian Natural Resources, Ltd. | 665,647 | 36,963 | ||||||
TC Energy Corp. | 678,590 | 27,049 | ||||||
Enbridge, Inc. | 208,235 | 8,142 | ||||||
|
| |||||||
| 557,013 | ||||||||
|
| |||||||
Communication services 3.97% | ||||||||
Comcast Corp., Class A | 6,323,705 | 221,140 | ||||||
Alphabet, Inc., Class C1 | 732,176 | 64,966 | ||||||
Alphabet, Inc., Class A1 | 442,820 | 39,070 | ||||||
Meta Platforms, Inc., Class A1 | 262,927 | 31,641 | ||||||
Activision Blizzard, Inc. | 138,758 | 10,622 | ||||||
Electronic Arts, Inc. | 36,898 | 4,508 | ||||||
Deutsche Telekom AG (ADR) | 142,813 | 2,853 | ||||||
|
| |||||||
| 374,800 | ||||||||
|
| |||||||
Utilities 2.63% | ||||||||
Constellation Energy Corp. | 810,638 | 69,885 | ||||||
Sempra Energy | 407,271 | 62,940 | ||||||
Entergy Corp. | 349,992 | 39,374 | ||||||
CMS Energy Corp. | 446,368 | 28,268 | ||||||
Public Service Enterprise Group, Inc. | 235,300 | 14,417 | ||||||
NextEra Energy, Inc. | 142,120 | 11,881 | ||||||
86 American Funds Insurance Series
Table of Contents
Washington Mutual Investors Fund (continued)
Common stocks (continued)
| Shares | Value (000) | |||||||
Utilities (continued) | ||||||||
Xcel Energy, Inc. | 110,238 | $ | 7,729 | |||||
Dominion Energy, Inc. | 123,750 | 7,588 | ||||||
Evergy, Inc. | 95,960 | 6,039 | ||||||
|
| |||||||
| 248,121 | ||||||||
|
| |||||||
Materials 2.24% | ||||||||
Linde PLC | 198,540 | 64,760 | ||||||
Rio Tinto PLC (ADR) | 501,584 | 35,713 | ||||||
Corteva, Inc. | 497,904 | 29,267 | ||||||
Air Products and Chemicals, Inc. | 64,476 | 19,875 | ||||||
LyondellBasell Industries NV | 219,873 | 18,256 | ||||||
Nucor Corp. | 125,314 | 16,518 | ||||||
Huntsman Corp. | 442,172 | 12,151 | ||||||
Albemarle Corp. | 55,023 | 11,932 | ||||||
H.B. Fuller Co. | 49,263 | 3,528 | ||||||
|
| |||||||
| 212,000 | ||||||||
|
| |||||||
Real estate 1.28% | ||||||||
Extra Space Storage, Inc. REIT | 363,771 | 53,540 | ||||||
American Tower Corp. REIT | 109,250 | 23,146 | ||||||
Equinix, Inc. REIT | 27,909 | 18,281 | ||||||
Digital Realty Trust, Inc. REIT | 174,296 | 17,477 | ||||||
Regency Centers Corp. REIT | 115,400 | 7,212 | ||||||
Welltower, Inc. REIT | 15,517 | 1,017 | ||||||
|
| |||||||
| 120,673 | ||||||||
|
| |||||||
Total common stocks (cost: $7,295,957,000) | 9,004,372 | |||||||
|
| |||||||
Convertible stocks 0.35% | ||||||||
Health care 0.20% | ||||||||
Becton, Dickinson and Company, Series B, convertible preferred shares, 6.00% 6/1/2023 | 197,800 | 9,906 | ||||||
Danaher Corp., Series B, cumulative convertible preferred shares, 5.00% 4/15/20232 | 6,821 | 9,253 | ||||||
|
| |||||||
| 19,159 | ||||||||
|
| |||||||
Utilities 0.08% | ||||||||
NextEra Energy, Inc., noncumulative convertible preferred units, 6.926% 9/1/2025 | 90,700 | 4,552 | ||||||
American Electric Power Company, Inc., convertible preferred units, 6.125% 8/15/2023 | 56,400 | 2,909 | ||||||
|
| |||||||
| 7,461 | ||||||||
|
| |||||||
Financials 0.07% | ||||||||
KKR & Co., Inc., Series C, convertible preferred shares, 6.00% 9/15/2023 | 113,300 | 6,487 | ||||||
|
| |||||||
Total convertible stocks (cost: $33,103,000) | 33,107 | |||||||
|
| |||||||
American Funds Insurance Series 87
Table of Contents
Washington Mutual Investors Fund (continued)
Short-term securities 4.19%
| Shares | Value (000) | |||||||
Money market investments 4.07% | ||||||||
Capital Group Central Cash Fund 4.31%3,4 | 3,847,079 | $ | 384,669 | |||||
|
| |||||||
Money market investments purchased with collateral from securities on loan 0.12% | ||||||||
Capital Group Central Cash Fund 4.31%3,4,5 | 63,391 | 6,338 | ||||||
State Street Institutional U.S. Government Money Market Fund, Institutional Class 4.09%3,5 | 2,494,000 | 2,494 | ||||||
Goldman Sachs Financial Square Government Fund, Institutional Shares 4.15%3,5 | 1,460,582 | 1,461 | ||||||
Invesco Short-Term Investments Trust – Government & Agency Portfolio, Institutional Class 4.22%3,5 | 1,324,956 | 1,325 | ||||||
|
| |||||||
| 11,618 | ||||||||
|
| |||||||
Total short-term securities (cost: $396,237,000) | 396,287 | |||||||
|
| |||||||
Total investment securities 99.89% (cost: $7,725,297,000) | 9,433,766 | |||||||
Other assets less liabilities 0.11% | 9,934 | |||||||
|
| |||||||
Net assets 100.00% | $ | 9,443,700 | ||||||
|
| |||||||
Investments in affiliates4
| Value of affiliates at 1/1/2022 (000) | Additions (000) | Reductions (000) | Net realized loss (000) | Net unrealized appreciation (000) | Value of affiliates at 12/31/2022 (000) | Dividend income (000) | ||||||||||||||||||||||
Short-term securities 4.14% | ||||||||||||||||||||||||||||
Money market investments 4.07% | ||||||||||||||||||||||||||||
Capital Group Central Cash Fund 4.31%3 | $ | 321,870 | $ | 1,392,905 | $ | 1,330,045 | $ | (71 | ) | $ | 10 | $ | 384,669 | $ | 6,762 | |||||||||||||
Money market investments purchased with collateral from securities on loan 0.07% | ||||||||||||||||||||||||||||
Capital Group Central Cash Fund 4.31%3,5 | 9,273 | 2,935 | 6 | 6,338 | — | 7 | ||||||||||||||||||||||
|
|
|
|
|
|
|
| |||||||||||||||||||||
Total 4.14% | $ | (71 | ) | $ | 10 | $ | 391,007 | $ | 6,762 | |||||||||||||||||||
|
|
|
|
|
|
|
| |||||||||||||||||||||
| 1 | Security did not produce income during the last 12 months. |
| 2 | All or a portion of this security was on loan. The total value of all such securities was $12,432,000, which represented .13% of the net assets of the fund. Refer to Note 5 for more information on securities lending. |
| 3 | Rate represents the seven-day yield at 12/31/2022. |
| 4 | Part of the same “group of investment companies” as the fund as defined under the Investment Company Act of 1940, as amended. |
| 5 | Security purchased with cash collateral from securities on loan. Refer to Note 5 for more information on securities lending. |
| 6 | Represents net activity. Refer to Note 5 for more information on securities lending. |
| 7 | Dividend income is included with securities lending income in the fund’s statement of operations and is not shown in this table. |
Key to abbreviations
ADR = American Depositary Receipts
REIT = Real Estate Investment Trust
Refer to the notes to financial statements.
88 American Funds Insurance Series
Table of Contents
Capital World Growth and Income Fund
Investment portfolio December 31, 2022
Common stocks 95.23%
| Shares | Value (000) | |||||||
Information technology 15.74% | ||||||||
Broadcom, Inc. | 91,368 | $ | 51,087 | |||||
Microsoft Corp. | 200,685 | 48,128 | ||||||
Taiwan Semiconductor Manufacturing Company, Ltd. | 2,403,800 | 35,035 | ||||||
ASML Holding NV | 48,522 | 26,265 | ||||||
Apple, Inc. | 111,767 | 14,522 | ||||||
EPAM Systems, Inc.1 | 37,912 | 12,425 | ||||||
Tokyo Electron, Ltd. | 35,800 | 10,635 | ||||||
Capgemini SE | 47,477 | 7,963 | ||||||
Micron Technology, Inc. | 141,746 | 7,085 | ||||||
Accenture PLC, Class A | 24,538 | 6,548 | ||||||
Mastercard, Inc., Class A | 15,969 | 5,553 | ||||||
Logitech International SA | 65,146 | 4,043 | ||||||
NVIDIA Corp. | 25,359 | 3,706 | ||||||
Delta Electronics, Inc. | 337,000 | 3,139 | ||||||
Keyence Corp. | 7,600 | 2,975 | ||||||
Hexagon AB, Class B | 260,158 | 2,735 | ||||||
Ceridian HCM Holding, Inc.1 | 38,252 | 2,454 | ||||||
Shopify, Inc., Class A, subordinate voting shares1 | 69,098 | 2,398 | ||||||
OBIC Co., Ltd. | 16,200 | 2,395 | ||||||
Applied Materials, Inc. | 23,343 | 2,273 | ||||||
Synopsys, Inc.1 | 6,800 | 2,171 | ||||||
MediaTek, Inc. | 93,000 | 1,889 | ||||||
Worldline SA, non-registered shares1 | 44,297 | 1,729 | ||||||
TE Connectivity, Ltd. | 13,147 | 1,509 | ||||||
Lasertec Corp. | 8,872 | 1,474 | ||||||
Fujitsu, Ltd. | 11,000 | 1,457 | ||||||
SK hynix, Inc. | 22,772 | 1,371 | ||||||
ServiceNow, Inc.1 | 3,191 | 1,239 | ||||||
Oracle Corp. | 15,041 | 1,229 | ||||||
Disco Corp. | 3,900 | 1,121 | ||||||
GlobalWafers Co., Ltd. | 71,000 | 986 | ||||||
Snowflake, Inc., Class A1 | 5,882 | 844 | ||||||
Zscaler, Inc.1 | 7,066 | 791 | ||||||
Infosys, Ltd. | 41,700 | 755 | ||||||
Nomura Research Institute, Ltd. | 28,600 | 680 | ||||||
SS&C Technologies Holdings, Inc. | 10,174 | 530 | ||||||
PagSeguro Digital, Ltd., Class A1 | 22,705 | 198 | ||||||
Wolfspeed, Inc.1 | 1,813 | 125 | ||||||
Fidelity National Information Services, Inc. | 1,708 | 116 | ||||||
|
| |||||||
| 271,578 | ||||||||
|
| |||||||
Health care 15.17% | ||||||||
UnitedHealth Group, Inc. | 74,724 | 39,617 | ||||||
Abbott Laboratories | 241,728 | 26,539 | ||||||
Eli Lilly and Company | 58,184 | 21,286 | ||||||
Gilead Sciences, Inc. | 178,860 | 15,355 | ||||||
AstraZeneca PLC | 104,122 | 14,131 | ||||||
Pfizer, Inc. | 261,843 | 13,417 | ||||||
Novo Nordisk A/S, Class B | 84,097 | 11,387 | ||||||
Thermo Fisher Scientific, Inc. | 20,658 | 11,376 | ||||||
Daiichi Sankyo Company, Ltd. | 344,500 | 11,040 | ||||||
Centene Corp.1 | 118,976 | 9,757 | ||||||
Novartis AG | 96,113 | 8,706 | ||||||
Siemens Healthineers AG | 144,724 | 7,240 | ||||||
Stryker Corp. | 28,725 | 7,023 | ||||||
AbbVie, Inc. | 34,990 | 5,655 | ||||||
Amgen, Inc. | 18,534 | 4,868 | ||||||
Takeda Pharmaceutical Company, Ltd. | 146,400 | 4,573 | ||||||
CVS Health Corp. | 47,511 | 4,428 | ||||||
Olympus Corp. | 213,300 | 3,770 | ||||||
Medtronic PLC | 42,451 | 3,299 | ||||||
Vertex Pharmaceuticals, Inc.1 | 10,220 | 2,951 | ||||||
American Funds Insurance Series 89
Table of Contents
Capital World Growth and Income Fund (continued)
Common stocks (continued)
| Shares | Value (000) | |||||||
Health care (continued) | ||||||||
ResMed, Inc. | 13,349 | $ | 2,778 | |||||
Shionogi & Co., Ltd. | 52,400 | 2,607 | ||||||
Insulet Corp.1 | 8,552 | 2,518 | ||||||
PerkinElmer, Inc. | 17,633 | 2,472 | ||||||
Carl Zeiss Meditec AG, non-registered shares | 19,475 | 2,458 | ||||||
Bayer AG | 46,783 | 2,416 | ||||||
EssilorLuxottica | 12,616 | 2,297 | ||||||
DexCom, Inc.1 | 19,845 | 2,247 | ||||||
Cigna Corp. | 6,618 | 2,193 | ||||||
Intuitive Surgical, Inc.1 | 7,213 | 1,914 | ||||||
Zoetis, Inc., Class A | 11,180 | 1,638 | ||||||
CSL, Ltd. | 8,133 | 1,586 | ||||||
Alcon, Inc. | 21,412 | 1,471 | ||||||
Rede D’Or Sao Luiz SA | 255,608 | 1,432 | ||||||
BioNTech SE (ADR) | 8,468 | 1,272 | ||||||
Guardant Health, Inc.1 | 32,188 | 876 | ||||||
Eurofins Scientific SE, non-registered shares | 12,151 | 875 | ||||||
Penumbra, Inc.1 | 3,640 | 810 | ||||||
Catalent, Inc.1 | 13,075 | 588 | ||||||
Molina Healthcare, Inc.1 | 1,089 | 360 | ||||||
Agilon Health, Inc.1 | 19,961 | 322 | ||||||
HOYA Corp. | 1,300 | 126 | ||||||
EUROAPI1 | 2,830 | 42 | ||||||
|
| |||||||
| 261,716 | ||||||||
|
| |||||||
Financials 12.95% | ||||||||
Zurich Insurance Group AG | 40,892 | 19,541 | ||||||
AIA Group, Ltd. | 1,331,999 | 14,675 | ||||||
Kotak Mahindra Bank, Ltd. | 641,387 | 14,112 | ||||||
Toronto-Dominion Bank (CAD denominated) | 196,293 | 12,710 | ||||||
JPMorgan Chase & Co. | 73,488 | 9,855 | ||||||
HDFC Bank, Ltd. | 379,442 | 7,470 | ||||||
HDFC Bank, Ltd. (ADR) | 14,868 | 1,017 | ||||||
B3 SA-Brasil, Bolsa, Balcao | 3,320,838 | 8,309 | ||||||
DNB Bank ASA | 401,356 | 7,946 | ||||||
Ping An Insurance (Group) Company of China, Ltd., Class H | 1,071,500 | 7,072 | ||||||
Ping An Insurance (Group) Company of China, Ltd., Class A | 23,000 | 156 | ||||||
Nasdaq, Inc. | 110,650 | 6,788 | ||||||
PNC Financial Services Group, Inc. | 39,710 | 6,272 | ||||||
Wells Fargo & Company | 142,901 | 5,900 | ||||||
Morgan Stanley | 64,543 | 5,487 | ||||||
Chubb, Ltd. | 23,142 | 5,105 | ||||||
ING Groep NV | 395,598 | 4,827 | ||||||
American International Group, Inc. | 75,453 | 4,772 | ||||||
Aon PLC, Class A | 15,659 | 4,700 | ||||||
HDFC Life Insurance Company, Ltd. | 681,398 | 4,651 | ||||||
CME Group, Inc., Class A | 27,577 | 4,637 | ||||||
Discover Financial Services | 44,649 | 4,368 | ||||||
DBS Group Holdings, Ltd. | 167,200 | 4,233 | ||||||
Blackstone, Inc., nonvoting shares | 54,273 | 4,027 | ||||||
Intercontinental Exchange, Inc. | 35,038 | 3,595 | ||||||
KBC Groep NV | 54,921 | 3,526 | ||||||
S&P Global, Inc. | 8,773 | 2,938 | ||||||
Citigroup, Inc. | 60,832 | 2,751 | ||||||
FinecoBank SpA | 153,752 | 2,562 | ||||||
Israel Discount Bank Ltd., Class A | 471,720 | 2,479 | ||||||
Fairfax Financial Holdings, Ltd., subordinate voting shares | 4,135 | 2,449 | ||||||
AXA SA | 80,016 | 2,230 | ||||||
BNP Paribas SA | 35,889 | 2,042 | ||||||
ICICI Bank, Ltd. | 188,346 | 2,019 | ||||||
Apollo Asset Management, Inc. | 31,437 | 2,005 | ||||||
Banco Santander, SA | 631,521 | 1,891 | ||||||
90 American Funds Insurance Series
Table of Contents
Capital World Growth and Income Fund (continued)
Common stocks (continued)
| Shares | Value (000) | |||||||
Financials (continued) | ||||||||
National Bank of Canada | 26,966 | $ | 1,817 | |||||
Arthur J. Gallagher & Co. | 9,509 | 1,793 | ||||||
Fifth Third Bancorp | 48,163 | 1,580 | ||||||
Goldman Sachs Group, Inc. | 4,548 | 1,562 | ||||||
Power Corporation of Canada, subordinate voting shares2 | 63,342 | 1,490 | ||||||
Blue Owl Capital, Inc., Class A | 136,448 | 1,446 | ||||||
Macquarie Group, Ltd. | 12,033 | 1,366 | ||||||
XP, Inc., Class A1 | 86,047 | 1,320 | ||||||
Postal Savings Bank of China Co., Ltd., Class H | 2,121,000 | 1,310 | ||||||
United Overseas Bank, Ltd. | 54,800 | 1,257 | ||||||
Marsh & McLennan Companies, Inc. | 7,341 | 1,215 | ||||||
Bajaj Finance, Ltd. | 15,022 | 1,189 | ||||||
China Merchants Bank Co., Ltd., Class H | 130,403 | 723 | ||||||
China Merchants Bank Co., Ltd., Class A | 86,187 | 462 | ||||||
Axis Bank, Ltd. | 100,962 | 1,135 | ||||||
Hong Kong Exchanges and Clearing, Ltd. | 25,200 | 1,089 | ||||||
Tryg A/S | 45,292 | 1,074 | ||||||
East Money Information Co., Ltd., Class A | 379,800 | 1,061 | ||||||
Aegon NV | 196,376 | 996 | ||||||
Lufax Holding, Ltd. (ADR) | 180,760 | 351 | ||||||
Sberbank of Russia PJSC1,3 | 3,196,952 | — | 4 | |||||
|
| |||||||
| 223,353 | ||||||||
|
| |||||||
Industrials 12.59% | ||||||||
Airbus SE, non-registered shares | 165,602 | 19,690 | ||||||
General Electric Co. | 226,107 | 18,945 | ||||||
BAE Systems PLC | 1,376,080 | 14,222 | ||||||
Raytheon Technologies Corp. | 121,846 | 12,297 | ||||||
Carrier Global Corp. | 262,272 | 10,819 | ||||||
Recruit Holdings Co., Ltd. | 317,150 | 10,087 | ||||||
Safran SA | 80,040 | 10,002 | ||||||
Lockheed Martin Corp. | 20,070 | 9,764 | ||||||
Deere & Company | 21,851 | 9,369 | ||||||
Siemens AG | 59,301 | 8,230 | ||||||
Caterpillar, Inc. | 31,794 | 7,617 | ||||||
Boeing Company1 | 39,550 | 7,534 | ||||||
CSX Corp. | 174,517 | 5,406 | ||||||
L3Harris Technologies, Inc. | 25,925 | 5,398 | ||||||
Mitsui & Co., Ltd. | 152,400 | 4,431 | ||||||
LIXIL Corp. | 288,000 | 4,389 | ||||||
Melrose Industries PLC | 2,436,274 | 3,961 | ||||||
RELX PLC | 119,741 | 3,318 | ||||||
RELX PLC (ADR) | 15,132 | 419 | ||||||
TransDigm Group, Inc. | 5,844 | 3,680 | ||||||
Bureau Veritas SA | 137,541 | 3,620 | ||||||
Johnson Controls International PLC | 55,085 | 3,525 | ||||||
Daikin Industries, Ltd. | 19,600 | 3,015 | ||||||
Brenntag SE | 39,862 | 2,549 | ||||||
Compagnie de Saint-Gobain SA, non-registered shares | 51,704 | 2,538 | ||||||
Canadian Pacific Railway, Ltd. | 31,797 | 2,372 | ||||||
Legrand SA | 28,600 | 2,303 | ||||||
Bunzl PLC | 68,998 | 2,303 | ||||||
ASSA ABLOY AB, Class B | 104,956 | 2,258 | ||||||
Northrop Grumman Corp. | 3,877 | 2,115 | ||||||
Schneider Electric SE | 13,179 | 1,853 | ||||||
Thales SA | 14,244 | 1,821 | ||||||
Waste Connections, Inc. | 13,211 | 1,751 | ||||||
BayCurrent Consulting, Inc. | 54,200 | 1,695 | ||||||
Rockwell Automation | 6,529 | 1,682 | ||||||
VINCI SA | 15,814 | 1,579 | ||||||
Rentokil Initial PLC | 256,104 | 1,574 | ||||||
Nidec Corp. | 22,100 | 1,151 | ||||||
American Funds Insurance Series 91
Table of Contents
Capital World Growth and Income Fund (continued)
Common stocks (continued)
| Shares | Value (000) | |||||||
Industrials (continued) | ||||||||
SMC Corp. | 2,700 | $ | 1,143 | |||||
AB Volvo, Class B | 62,128 | 1,125 | ||||||
MTU Aero Engines AG | 5,108 | 1,106 | ||||||
Atlas Copco AB, Class B | 89,617 | 957 | ||||||
Adecco Group AG | 28,154 | 926 | ||||||
ManpowerGroup, Inc. | 11,115 | 925 | ||||||
Larsen & Toubro, Ltd. | 35,295 | 888 | ||||||
International Consolidated Airlines Group SA (CDI)1,2 | 287,033 | 427 | ||||||
Honeywell International, Inc. | 1,401 | 300 | ||||||
Deutsche Post AG | 3,901 | 147 | ||||||
|
| |||||||
| 217,226 | ||||||||
|
| |||||||
Consumer discretionary 9.00% | ||||||||
LVMH Moët Hennessy-Louis Vuitton SE | 40,590 | 29,488 | ||||||
Home Depot, Inc. | 63,297 | 19,993 | ||||||
General Motors Company | 304,882 | 10,256 | ||||||
Amazon.com, Inc.1 | 98,471 | 8,272 | ||||||
Booking Holdings, Inc.1 | 3,555 | 7,164 | ||||||
Flutter Entertainment PLC1 | 45,621 | 6,251 | ||||||
Restaurant Brands International, Inc. | 44,121 | 2,853 | ||||||
Restaurant Brands International, Inc. (CAD denominated) | 43,454 | 2,811 | ||||||
Cie. Financière Richemont SA, Class A | 40,890 | 5,291 | ||||||
Sony Group Corp. | 66,800 | 5,094 | ||||||
Dollar Tree Stores, Inc.1 | 33,180 | 4,693 | ||||||
Marriott International, Inc., Class A | 29,974 | 4,463 | ||||||
Lennar Corp., Class A | 39,345 | 3,561 | ||||||
Target Corp. | 22,747 | 3,390 | ||||||
Industria de Diseño Textil, SA | 117,969 | 3,141 | ||||||
Sands China, Ltd.1 | 935,200 | 3,098 | ||||||
Shimano, Inc. | 19,200 | 3,059 | ||||||
Chipotle Mexican Grill, Inc.1 | 2,122 | 2,944 | ||||||
Evolution AB | 25,292 | 2,470 | ||||||
Rivian Automotive, Inc., Class A1 | 126,108 | 2,324 | ||||||
NIKE, Inc., Class B | 19,311 | 2,260 | ||||||
Pan Pacific International Holdings Corp. | 119,900 | 2,226 | ||||||
YUM! Brands, Inc. | 16,678 | 2,136 | ||||||
Astra International Tbk PT | 5,716,600 | 2,083 | ||||||
InterContinental Hotels Group PLC | 34,581 | 1,991 | ||||||
Darden Restaurants, Inc. | 14,208 | 1,965 | ||||||
Stellantis NV | 128,257 | 1,818 | ||||||
JD.com, Inc., Class A | 52,947 | 1,488 | ||||||
Tesla, Inc.1 | 12,036 | 1,483 | ||||||
Midea Group Co., Ltd., Class A | 194,700 | 1,446 | ||||||
Li Ning Co., Ltd. | 163,000 | 1,399 | ||||||
Kindred Group PLC (SDR) | 127,475 | 1,331 | ||||||
Wynn Macau, Ltd.1 | 826,400 | 921 | ||||||
Royal Caribbean Cruises, Ltd.1 | 17,446 | 862 | ||||||
Aristocrat Leisure, Ltd. | 39,792 | 822 | ||||||
Entain PLC | 17,337 | 278 | ||||||
Hermès International | 105 | 162 | ||||||
|
| |||||||
| 155,287 | ||||||||
|
| |||||||
Consumer staples 7.57% | ||||||||
Philip Morris International, Inc. | 309,980 | 31,373 | ||||||
Nestlé SA | 110,820 | 12,798 | ||||||
Keurig Dr Pepper, Inc. | 316,125 | 11,273 | ||||||
British American Tobacco PLC | 243,321 | 9,654 | ||||||
Kroger Co. | 171,853 | 7,661 | ||||||
Kweichow Moutai Co., Ltd., Class A | 28,600 | 7,077 | ||||||
Ocado Group PLC1 | 898,794 | 6,764 | ||||||
Imperial Brands PLC | 257,311 | 6,429 | ||||||
Seven & i Holdings Co., Ltd. | 137,500 | 5,882 | ||||||
92 American Funds Insurance Series
Table of Contents
Capital World Growth and Income Fund (continued)
Common stocks (continued)
| Shares | Value (000) | |||||||
Consumer staples (continued) | ||||||||
Bunge, Ltd. | 52,225 | $ | 5,210 | |||||
Ajinomoto Co., Inc. | 131,100 | 3,997 | ||||||
Danone SA | 68,733 | 3,621 | ||||||
Arca Continental, SAB de CV | 432,054 | 3,509 | ||||||
Treasury Wine Estates, Ltd. | 365,056 | 3,373 | ||||||
Varun Beverages, Ltd. | 177,457 | 2,825 | ||||||
Altria Group, Inc. | 56,773 | 2,595 | ||||||
ITC, Ltd. | 565,239 | 2,266 | ||||||
Constellation Brands, Inc., Class A | 9,208 | 2,134 | ||||||
Inner Mongolia Yili Industrial Group Co., Ltd., Class A | 307,600 | 1,368 | ||||||
Essity Aktiebolag, Class B | 31,422 | 825 | ||||||
|
| |||||||
| 130,634 | ||||||||
|
| |||||||
Materials 7.02% | ||||||||
Vale SA, ordinary nominative shares | 1,606,974 | 27,052 | ||||||
Vale SA (ADR), ordinary nominative shares | 880,043 | 14,934 | ||||||
Fortescue Metals Group, Ltd. | 1,251,957 | 17,454 | ||||||
Rio Tinto PLC | 167,527 | 11,755 | ||||||
Freeport-McMoRan, Inc. | 262,321 | 9,968 | ||||||
Linde PLC | 21,113 | 6,887 | ||||||
Shin-Etsu Chemical Co., Ltd. | 39,100 | 4,764 | ||||||
BHP Group, Ltd. (CDI) | 116,082 | 3,579 | ||||||
Air Products and Chemicals, Inc. | 8,996 | 2,773 | ||||||
Albemarle Corp. | 11,198 | 2,428 | ||||||
CRH PLC | 60,032 | 2,377 | ||||||
Air Liquide SA, bonus shares1 | 8,561 | 1,218 | ||||||
Air Liquide SA, non-registered shares | 7,503 | 1,067 | ||||||
Barrick Gold Corp. (CAD denominated) | 121,716 | 2,086 | ||||||
Dow, Inc. | 40,669 | 2,049 | ||||||
Akzo Nobel NV | 29,669 | 1,980 | ||||||
Glencore PLC | 279,444 | 1,869 | ||||||
Amcor PLC (CDI) | 147,168 | 1,764 | ||||||
Evonik Industries AG | 82,596 | 1,586 | ||||||
First Quantum Minerals, Ltd. | 70,833 | 1,480 | ||||||
HeidelbergCement AG | 25,414 | 1,449 | ||||||
Lynas Rare Earths, Ltd.1 | 121,178 | 643 | ||||||
|
| |||||||
| 121,162 | ||||||||
|
| |||||||
Energy 6.30% | ||||||||
Canadian Natural Resources, Ltd. (CAD denominated)2 | 429,516 | 23,852 | ||||||
Baker Hughes Co., Class A | 428,998 | 12,668 | ||||||
TotalEnergies SE | 178,299 | 11,129 | ||||||
EOG Resources, Inc. | 74,135 | 9,602 | ||||||
Tourmaline Oil Corp. | 123,757 | 6,244 | ||||||
BP PLC | 932,803 | 5,424 | ||||||
Reliance Industries, Ltd. | 147,765 | 4,533 | ||||||
Cameco Corp. (CAD denominated) | 147,245 | 3,337 | ||||||
Cameco Corp. | 46,300 | 1,050 | ||||||
Shell PLC (GBP denominated) | 149,201 | 4,240 | ||||||
Cenovus Energy, Inc. (CAD denominated) | 206,756 | 4,011 | ||||||
Woodside Energy Group, Ltd. | 119,566 | 2,893 | ||||||
Woodside Energy Group, Ltd. (CDI) | 37,610 | 908 | ||||||
ConocoPhillips | 29,431 | 3,473 | ||||||
Aker BP ASA | 101,330 | 3,159 | ||||||
TC Energy Corp. (CAD denominated) | 76,353 | 3,044 | ||||||
Suncor Energy, Inc. | 84,173 | 2,670 | ||||||
Var Energi ASA | 735,288 | 2,537 | ||||||
Exxon Mobil Corp. | 18,586 | 2,050 | ||||||
Halliburton Company | 44,744 | 1,761 | ||||||
Gazprom PJSC3 | 2,248,304 | — | 4 | |||||
|
| |||||||
| 108,585 | ||||||||
|
| |||||||
American Funds Insurance Series 93
Table of Contents
Capital World Growth and Income Fund (continued)
Common stocks (continued)
| Shares | Value (000) | |||||||
Communication services 4.97% | ||||||||
Alphabet, Inc., Class C1 | 185,056 | $ | 16,420 | |||||
Alphabet, Inc., Class A1 | 90,146 | 7,954 | ||||||
Netflix, Inc.1 | 30,480 | 8,988 | ||||||
Comcast Corp., Class A | 225,329 | 7,880 | ||||||
SoftBank Corp. | 536,785 | 6,069 | ||||||
NetEase, Inc. | 348,000 | 5,073 | ||||||
Publicis Groupe SA | 78,301 | 4,972 | ||||||
Meta Platforms, Inc., Class A1 | 38,469 | 4,629 | ||||||
Sea, Ltd., Class A (ADR)1 | 85,765 | 4,462 | ||||||
Universal Music Group NV | 148,872 | 3,594 | ||||||
Bharti Airtel, Ltd. | 357,140 | 3,472 | ||||||
Bharti Airtel, Ltd., interim shares | 13,994 | 73 | ||||||
Deutsche Telekom AG1 | 161,959 | 3,230 | ||||||
Singapore Telecommunications, Ltd. | 1,510,800 | 2,901 | ||||||
Omnicom Group, Inc. | 21,678 | 1,768 | ||||||
Nippon Telegraph and Telephone Corp. | 53,400 | 1,524 | ||||||
Tencent Holdings, Ltd. | 34,300 | 1,458 | ||||||
Take-Two Interactive Software, Inc.1 | 12,130 | 1,263 | ||||||
Yandex NV, Class A1,3 | 151,598 | — | 4 | |||||
|
| |||||||
| 85,730 | ||||||||
|
| |||||||
Utilities 2.91% | ||||||||
DTE Energy Company | 51,844 | 6,093 | ||||||
Iberdrola, SA, non-registered shares | 502,226 | 5,875 | ||||||
PG&E Corp.1 | 322,958 | 5,251 | ||||||
NextEra Energy, Inc. | 55,877 | 4,671 | ||||||
E.ON SE | 439,329 | 4,385 | ||||||
China Resources Gas Group, Ltd. | 1,106,532 | 4,121 | ||||||
Engie SA | 236,678 | 3,390 | ||||||
Engie SA, bonus shares | 41,586 | 596 | ||||||
Edison International | 52,162 | 3,318 | ||||||
Enel SpA | 583,497 | 3,138 | ||||||
Exelon Corp. | 59,727 | 2,582 | ||||||
Power Grid Corporation of India, Ltd. | 862,367 | 2,220 | ||||||
AES Corp. | 47,865 | 1,377 | ||||||
Endesa, SA | 67,522 | 1,274 | ||||||
Constellation Energy Corp. | 12,539 | 1,081 | ||||||
Public Service Enterprise Group, Inc. | 14,569 | 893 | ||||||
|
| |||||||
| 50,265 | ||||||||
|
| |||||||
Real estate 1.01% | ||||||||
Crown Castle, Inc. REIT | 39,469 | 5,353 | ||||||
Longfor Group Holdings, Ltd. | 866,238 | 2,655 | ||||||
American Tower Corp. REIT | 12,107 | 2,565 | ||||||
China Resources Mixc Lifestyle Services, Ltd. | 358,800 | 1,823 | ||||||
W. P. Carey, Inc. REIT | 22,705 | 1,774 | ||||||
Americold Realty Trust, Inc. REIT | 62,231 | 1,762 | ||||||
Sun Hung Kai Properties, Ltd. | 70,500 | 965 | ||||||
Iron Mountain, Inc. REIT | 11,618 | 579 | ||||||
|
| |||||||
| 17,476 | ||||||||
|
| |||||||
Total common stocks (cost: $1,368,680,000) | 1,643,012 | |||||||
|
| |||||||
94 American Funds Insurance Series
Table of Contents
Capital World Growth and Income Fund (continued)
Preferred securities 0.16%
| Shares | Value (000) | |||||||||||
Consumer discretionary 0.12% | ||||||||||||
Dr. Ing. h.c. F. Porsche AG, nonvoting non-registered preferred shares1 | 19,788 | $ | 2,007 | |||||||||
|
| |||||||||||
Health care 0.03% | ||||||||||||
Grifols, SA, Class B, nonvoting non-registered preferred shares1 | 59,790 | 505 | ||||||||||
|
| |||||||||||
Financials 0.01% | ||||||||||||
Fannie Mae, Series S, 8.25% noncumulative preferred shares1 | 58,870 | 138 | ||||||||||
Federal Home Loan Mortgage Corp., Series Z, 8.375% noncumulative preferred shares1 | 61,516 | 125 | ||||||||||
|
| |||||||||||
| 263 | ||||||||||||
|
| |||||||||||
Total preferred securities (cost: $3,231,000) | 2,775 | |||||||||||
|
| |||||||||||
Convertible bonds & notes 0.05% | ||||||||||||
Principal amount (000) | ||||||||||||
Communication services 0.05% | ||||||||||||
Sea, Ltd., convertible notes, 2.375% 12/1/2025 | USD952 | 940 | ||||||||||
|
| |||||||||||
Total convertible bonds & notes (cost: $2,437,000) | 940 | |||||||||||
|
| |||||||||||
Bonds, notes & other debt instruments 0.35% | ||||||||||||
Corporate bonds, notes & loans 0.29% | ||||||||||||
Health care 0.15% | ||||||||||||
Teva Pharmaceutical Finance Co. BV 6.00% 4/15/2024 | 1,600 | 1,572 | ||||||||||
Teva Pharmaceutical Finance Co. BV 3.15% 10/1/2026 | 1,100 | 964 | ||||||||||
|
| |||||||||||
| 2,536 | ||||||||||||
|
| |||||||||||
Consumer discretionary 0.07% | ||||||||||||
Royal Caribbean Cruises, Ltd. 11.50% 6/1/20255 | 647 | 695 | ||||||||||
Royal Caribbean Cruises, Ltd. 5.50% 4/1/20285 | 390 | 312 | ||||||||||
Royal Caribbean Cruises, Ltd. 8.25% 1/15/20295 | 151 | 152 | ||||||||||
Royal Caribbean Cruises, Ltd. 9.25% 1/15/20295 | 125 | 129 | ||||||||||
|
| |||||||||||
| 1,288 | ||||||||||||
|
| |||||||||||
Energy 0.04% | ||||||||||||
TransCanada PipeLines, Ltd. 5.10% 3/15/2049 | 800 | 729 | ||||||||||
|
| |||||||||||
Financials 0.03% | ||||||||||||
Lloyds Banking Group PLC 3.369% 12/14/20466 | 709 | 462 | ||||||||||
|
| |||||||||||
Total corporate bonds, notes & loans | 5,015 | |||||||||||
|
| |||||||||||
Bonds & notes of governments & government agencies outside the U.S. 0.06% | ||||||||||||
United Mexican States, Series M, 8.00% 12/7/2023 | MXN20,000 | 1,001 | ||||||||||
|
| |||||||||||
Total bonds, notes & other debt instruments (cost: $6,581,000) | 6,016 | |||||||||||
|
| |||||||||||
Short-term securities 4.42% | ||||||||||||
Weighted average yield at acquisition | ||||||||||||
Commercial paper 4.04% | ||||||||||||
DBS Bank, Ltd. 1/5/20235 | 3.640 | % | USD37,100 | 37,073 | ||||||||
DNB Bank ASA 3/2/20235 | 4.273 | 33,000 | 32,755 | |||||||||
|
| |||||||||||
| 69,828 | ||||||||||||
|
| |||||||||||
American Funds Insurance Series 95
Table of Contents
Capital World Growth and Income Fund (continued)
Short-term securities (continued)
| Shares | Value (000) | |||||||||||
Money market investments purchased with collateral from securities on loan 0.34% | ||||||||||||
Invesco Short-Term Investments Trust – Government & Agency Portfolio, Institutional Class 4.22%7,8 | 2,893,689 | $ | 2,894 | |||||||||
Goldman Sachs Financial Square Government Fund, Institutional Shares 4.15%7,8 | 2,827,563 | 2,827 | ||||||||||
Capital Group Central Cash Fund 4.31%7,8,9 | 1,112 | 111 | ||||||||||
|
| |||||||||||
| 5,832 | ||||||||||||
|
| |||||||||||
Money market investments 0.04% | ||||||||||||
Capital Group Central Cash Fund 4.31%7,9 | 6,929 | 693 | ||||||||||
|
| |||||||||||
Total short-term securities (cost: $76,365,000) | 76,353 | |||||||||||
|
| |||||||||||
Total investment securities 100.21% (cost: $1,457,294,000) | 1,729,096 | |||||||||||
Other assets less liabilities (0.21)% | (3,698 | ) | ||||||||||
|
| |||||||||||
Net assets 100.00% | $ | 1,725,398 | ||||||||||
|
| |||||||||||
Investments in affiliates9
| Value of affiliates at 1/1/2022 (000) | Additions (000) | Reductions (000) | Net realized gain (000) | Net unrealized depreciation (000) | Value of affiliates at 12/31/2022 (000) | Dividend income (000) | ||||||||||||||||||||||
Short-term securities 0.05% | ||||||||||||||||||||||||||||
Money market investments purchased with collateral from securities on loan 0.01% | ||||||||||||||||||||||||||||
Capital Group Central Cash Fund 4.31%7,8 | $ | 293 | $ | $ | 182 | 10 | $ | $ | $ | 111 | $ | — | 11 | |||||||||||||||
Money market investments 0.04% | ||||||||||||||||||||||||||||
Capital Group Central Cash Fund 4.31%7 | 12,989 | 493,820 | 506,123 | 8 | (1 | ) | 693 | 1,469 | ||||||||||||||||||||
|
|
|
|
|
|
|
| |||||||||||||||||||||
Total 0.05% | $ | 8 | $ | (1 | ) | $ | 804 | $ | 1,469 | |||||||||||||||||||
|
|
|
|
|
|
|
| |||||||||||||||||||||
| 1 | Security did not produce income during the last 12 months. |
| 2 | All or a portion of this security was on loan. The total value of all such securities was $6,155,000, which represented .36% of the net assets of the fund. Refer to Note 5 for more information on securities lending. |
| 3 | Value determined using significant unobservable inputs. |
| 4 | Amount less than one thousand. |
| 5 | Acquired in a transaction exempt from registration under Rule 144A or, for commercial paper, Section 4(a)(2) of the Securities Act of 1933. May be resold in the U.S. in transactions exempt from registration, normally to qualified institutional buyers. The total value of all such securities was $71,116,000, which represented 4.12% of the net assets of the fund. |
| 6 | Step bond; coupon rate may change at a later date. |
| 7 | Rate represents the seven-day yield at 12/31/2022. |
| 8 | Security purchased with cash collateral from securities on loan. Refer to Note 5 for more information on securities lending. |
| 9 | Part of the same “group of investment companies” as the fund as defined under the Investment Company Act of 1940, as amended. |
| 10 | Represents net activity. Refer to Note 5 for more information on securities lending. |
| 11 | Dividend income is included with securities lending income in the fund’s statement of operations and is not shown in this table. |
Key to abbreviations
ADR = American Depositary Receipts
CAD = Canadian dollars
CDI = CREST Depository Interest
GBP = British pounds
MXN = Mexican pesos
REIT = Real Estate Investment Trust
SDR = Swedish Depositary Receipts
USD = U.S. dollars
Refer to the notes to financial statements.
96 American Funds Insurance Series
Table of Contents
Investment portfolio December 31, 2022
Common stocks 91.48%
| Shares | Value (000) | |||||||
Information technology 20.19% | ||||||||
Microsoft Corp. | 7,759,381 | $ | 1,860,855 | |||||
Broadcom, Inc. | 2,430,747 | 1,359,104 | ||||||
Mastercard, Inc., Class A | 1,487,948 | 517,404 | ||||||
Apple, Inc. | 2,169,231 | 281,848 | ||||||
Visa, Inc., Class A | 1,346,541 | 279,757 | ||||||
ASML Holding NV | 215,068 | 116,417 | ||||||
ASML Holding NV (New York registered) (ADR) | 137,293 | 75,017 | ||||||
Taiwan Semiconductor Manufacturing Company, Ltd. | 12,123,000 | 176,689 | ||||||
Automatic Data Processing, Inc. | 718,796 | 171,692 | ||||||
Fidelity National Information Services, Inc. | 2,472,310 | 167,746 | ||||||
Accenture PLC, Class A | 625,335 | 166,864 | ||||||
Applied Materials, Inc. | 1,686,100 | 164,192 | ||||||
Concentrix Corp. | 904,367 | 120,426 | ||||||
Micron Technology, Inc. | 2,363,454 | 118,125 | ||||||
ServiceNow, Inc.1 | 294,412 | 114,311 | ||||||
GoDaddy, Inc., Class A1 | 1,402,444 | 104,931 | ||||||
Global Payments, Inc. | 973,628 | 96,701 | ||||||
FleetCor Technologies, Inc.1 | 420,507 | 77,239 | ||||||
Analog Devices, Inc. | 398,402 | 65,350 | ||||||
QUALCOMM, Inc. | 564,911 | 62,106 | ||||||
Fiserv, Inc.1 | 536,700 | 54,244 | ||||||
Texas Instruments, Inc. | 309,811 | 51,187 | ||||||
Adobe, Inc.1 | 143,116 | 48,163 | ||||||
TELUS International (Cda), Inc., subordinate voting shares1 | 2,302,991 | 45,576 | ||||||
KLA Corp. | 116,000 | 43,736 | ||||||
MKS Instruments, Inc. | 481,000 | 40,755 | ||||||
Cognizant Technology Solutions Corp., Class A | 682,850 | 39,052 | ||||||
NVIDIA Corp. | 239,765 | 35,039 | ||||||
Snowflake, Inc., Class A1 | 225,042 | 32,303 | ||||||
Datadog, Inc., Class A1 | 365,800 | 26,886 | ||||||
Intel Corp. | 1,000,000 | 26,430 | ||||||
Ceridian HCM Holding, Inc.1 | 350,352 | 22,475 | ||||||
Trimble, Inc.1 | 443,800 | 22,439 | ||||||
Lam Research Corp. | 50,039 | 21,031 | ||||||
Dye & Durham, Ltd.2 | 1,322,100 | 16,023 | ||||||
Paychex, Inc. | 127,131 | 14,691 | ||||||
VeriSign, Inc.1 | 61,000 | 12,532 | ||||||
Atlassian Corp., Class A1 | 52,744 | 6,787 | ||||||
Euronet Worldwide, Inc.1 | 27,800 | 2,624 | ||||||
|
| |||||||
| 6,658,747 | ||||||||
|
| |||||||
Industrials 14.17% | ||||||||
Raytheon Technologies Corp. | 7,634,279 | 770,451 | ||||||
General Electric Co. | 6,238,229 | 522,701 | ||||||
Northrop Grumman Corp. | 633,267 | 345,517 | ||||||
TFI International, Inc. | 2,669,105 | 267,551 | ||||||
Carrier Global Corp. | 5,549,584 | 228,920 | ||||||
TransDigm Group, Inc. | 340,571 | 214,441 | ||||||
Woodward, Inc. | 2,204,500 | 212,977 | ||||||
General Dynamics Corp. | 848,975 | 210,639 | ||||||
Airbus SE, non-registered shares | 1,617,590 | 192,335 | ||||||
Waste Connections, Inc. | 1,425,463 | 188,959 | ||||||
L3Harris Technologies, Inc. | 840,290 | 174,957 | ||||||
Old Dominion Freight Line, Inc. | 525,000 | 148,985 | ||||||
BWX Technologies, Inc. | 2,159,505 | 125,424 | ||||||
Norfolk Southern Corp. | 482,759 | 118,962 | ||||||
United Rentals, Inc.1 | 296,000 | 105,204 | ||||||
ITT, Inc. | 1,244,379 | 100,919 | ||||||
Waste Management, Inc. | 625,300 | 98,097 | ||||||
Equifax, Inc. | 490,008 | 95,238 | ||||||
Air Lease Corp., Class A | 2,097,300 | 80,578 | ||||||
Honeywell International, Inc. | 364,682 | 78,151 | ||||||
American Funds Insurance Series 97
Table of Contents
Growth-Income Fund (continued)
Common stocks (continued)
| Shares | Value (000) | |||||||
Industrials (continued) | ||||||||
Fortive Corp. | 1,085,000 | $ | 69,711 | |||||
United Airlines Holdings, Inc.1 | 1,810,598 | 68,260 | ||||||
Safran SA | 539,713 | 67,444 | ||||||
Lockheed Martin Corp. | 110,000 | 53,514 | ||||||
GFL Environmental, Inc., subordinate voting shares | 1,600,000 | 46,768 | ||||||
CSX Corp. | 1,171,873 | 36,305 | ||||||
Otis Worldwide Corp. | 268,100 | 20,995 | ||||||
Fastenal Co. | 379,747 | 17,970 | ||||||
Boeing Company1 | 62,500 | 11,906 | ||||||
|
| |||||||
| 4,673,879 | ||||||||
|
| |||||||
Health care 13.30% | ||||||||
UnitedHealth Group, Inc. | 2,035,435 | 1,079,147 | ||||||
Abbott Laboratories | 6,014,324 | 660,313 | ||||||
AbbVie, Inc. | 3,742,689 | 604,856 | ||||||
Novo Nordisk A/S, Class B | 2,431,449 | 329,218 | ||||||
Humana, Inc. | 487,426 | 249,655 | ||||||
AstraZeneca PLC | 1,209,323 | 164,124 | ||||||
AstraZeneca PLC (ADR) | 721,200 | 48,897 | ||||||
Elevance Health, Inc. | 366,614 | 188,062 | ||||||
Thermo Fisher Scientific, Inc. | 265,602 | 146,264 | ||||||
Bristol-Myers Squibb Company | 1,994,278 | 143,488 | ||||||
Eli Lilly and Company | 360,974 | 132,059 | ||||||
Pfizer, Inc. | 2,180,169 | 111,712 | ||||||
PerkinElmer, Inc. | 769,600 | 107,913 | ||||||
Seagen, Inc.1 | 654,515 | 84,112 | ||||||
Horizon Therapeutics PLC1 | 421,815 | 48,002 | ||||||
Zoetis, Inc., Class A | 305,121 | 44,715 | ||||||
Tandem Diabetes Care, Inc.1 | 910,186 | 40,913 | ||||||
Stryker Corp. | 148,897 | 36,404 | ||||||
Medtronic PLC | 413,597 | 32,145 | ||||||
Roche Holding AG, nonvoting non-registered shares | 85,502 | 26,870 | ||||||
Penumbra, Inc.1 | 117,381 | 26,113 | ||||||
Edwards Lifesciences Corp.1 | 317,059 | 23,656 | ||||||
Zimmer Biomet Holdings, Inc. | 171,174 | 21,825 | ||||||
Takeda Pharmaceutical Company, Ltd. | 464,600 | 14,511 | ||||||
NovoCure, Ltd.1 | 193,600 | 14,200 | ||||||
Vir Biotechnology, Inc.1 | 258,400 | 6,540 | ||||||
|
| |||||||
| 4,385,714 | ||||||||
|
| |||||||
Financials 8.78% | ||||||||
JPMorgan Chase & Co. | 3,394,830 | 455,247 | ||||||
Chubb, Ltd. | 1,451,726 | 320,251 | ||||||
Marsh & McLennan Companies, Inc. | 1,709,201 | 282,839 | ||||||
Arthur J. Gallagher & Co. | 1,189,650 | 224,297 | ||||||
Nasdaq, Inc. | 2,761,260 | 169,403 | ||||||
BlackRock, Inc. | 202,957 | 143,821 | ||||||
Morgan Stanley | 1,592,297 | 135,377 | ||||||
Aon PLC, Class A | 442,013 | 132,666 | ||||||
B3 SA-Brasil, Bolsa, Balcao | 39,829,500 | 99,654 | ||||||
Berkshire Hathaway, Inc., Class B1 | 285,000 | 88,037 | ||||||
State Street Corp. | 1,077,260 | 83,563 | ||||||
Webster Financial Corp. | 1,701,139 | 80,532 | ||||||
American International Group, Inc. | 1,272,230 | 80,456 | ||||||
Signature Bank | 669,947 | 77,191 | ||||||
S&P Global, Inc. | 228,138 | 76,413 | ||||||
Moody’s Corp. | 216,306 | 60,267 | ||||||
Power Corporation of Canada, subordinate voting shares2 | 2,293,100 | 53,940 | ||||||
Wells Fargo & Company | 1,298,041 | 53,596 | ||||||
Blue Owl Capital, Inc., Class A | 4,749,165 | 50,341 | ||||||
MSCI, Inc. | 98,300 | 45,726 | ||||||
TPG, Inc., Class A | 1,347,552 | 37,502 | ||||||
98 American Funds Insurance Series
Table of Contents
Growth-Income Fund (continued)
Common stocks (continued)
| Shares | Value (000) | |||||||
Financials (continued) | ||||||||
LPL Financial Holdings, Inc. | 169,900 | $ | 36,727 | |||||
Western Alliance Bancorporation | 486,936 | 29,002 | ||||||
Citizens Financial Group, Inc. | 728,750 | 28,691 | ||||||
Bank of America Corp. | 791,332 | 26,209 | ||||||
PNC Financial Services Group, Inc. | 152,679 | 24,114 | ||||||
CME Group, Inc., Class A | 5,500 | 925 | ||||||
|
| |||||||
| 2,896,787 | ||||||||
|
| |||||||
Consumer discretionary 7.82% | ||||||||
Amazon.com, Inc.1 | 5,804,151 | 487,549 | ||||||
General Motors Company | 8,736,000 | 293,879 | ||||||
Dollar Tree Stores, Inc.1 | 1,279,006 | 180,903 | ||||||
Home Depot, Inc. | 551,165 | 174,091 | ||||||
Hilton Worldwide Holdings, Inc. | 1,177,320 | 148,766 | ||||||
Royal Caribbean Cruises, Ltd.1 | 2,958,586 | 146,243 | ||||||
Wyndham Hotels & Resorts, Inc. | 1,842,940 | 131,420 | ||||||
D.R. Horton, Inc. | 1,325,599 | 118,164 | ||||||
Chipotle Mexican Grill, Inc.1 | 70,670 | 98,054 | ||||||
Burlington Stores, Inc.1 | 399,428 | 80,988 | ||||||
InterContinental Hotels Group PLC | 1,396,700 | 80,392 | ||||||
Starbucks Corp. | 767,500 | 76,136 | ||||||
NIKE, Inc., Class B | 629,740 | 73,686 | ||||||
Dollar General Corp. | 291,102 | 71,684 | ||||||
Lear Corp. | 569,068 | 70,576 | ||||||
Kering SA | 101,695 | 52,046 | ||||||
Aptiv PLC1 | 447,289 | 41,656 | ||||||
Darden Restaurants, Inc. | 296,000 | 40,946 | ||||||
CarMax, Inc.1 | 650,000 | 39,578 | ||||||
Churchill Downs, Inc. | 185,426 | 39,205 | ||||||
Airbnb, Inc., Class A1 | 350,000 | 29,925 | ||||||
Norwegian Cruise Line Holdings, Ltd.1 | 2,177,187 | 26,649 | ||||||
YUM! Brands, Inc. | 196,630 | 25,184 | ||||||
NVR, Inc.1 | 5,298 | 24,437 | ||||||
Rivian Automotive, Inc., Class A1 | 1,071,576 | 19,749 | ||||||
McDonald’s Corp. | 25,000 | 6,588 | ||||||
|
| |||||||
| 2,578,494 | ||||||||
|
| |||||||
Communication services 7.52% | ||||||||
Alphabet, Inc., Class C1 | 5,068,984 | 449,771 | ||||||
Alphabet, Inc., Class A1 | 4,841,135 | 427,133 | ||||||
Netflix, Inc.1 | 1,812,523 | 534,477 | ||||||
Comcast Corp., Class A | 11,970,266 | 418,600 | ||||||
Meta Platforms, Inc., Class A1 | 3,113,843 | 374,720 | ||||||
Charter Communications, Inc., Class A1 | 378,097 | 128,213 | ||||||
Electronic Arts, Inc. | 843,700 | 103,083 | ||||||
T-Mobile US, Inc.1 | 181,772 | 25,448 | ||||||
Take-Two Interactive Software, Inc.1 | 178,984 | 18,638 | ||||||
|
| |||||||
| 2,480,083 | ||||||||
|
| |||||||
Consumer staples 5.80% | ||||||||
Philip Morris International, Inc. | 6,790,089 | 687,225 | ||||||
British American Tobacco PLC | 9,433,859 | 374,286 | ||||||
Keurig Dr Pepper, Inc. | 6,469,367 | 230,698 | ||||||
General Mills, Inc. | 1,378,800 | 115,612 | ||||||
Mondelez International, Inc. | 1,506,161 | 100,386 | ||||||
Molson Coors Beverage Company, Class B, restricted voting shares | 1,620,313 | 83,478 | ||||||
Anheuser-Busch InBev SA/NV | 1,339,531 | 80,530 | ||||||
Archer Daniels Midland Company | 670,100 | 62,219 | ||||||
Constellation Brands, Inc., Class A | 237,807 | 55,112 | ||||||
Bunge, Ltd. | 538,852 | 53,761 | ||||||
American Funds Insurance Series 99
Table of Contents
Growth-Income Fund (continued)
Common stocks (continued)
| Shares | Value (000) | |||||||
Consumer staples (continued) | ||||||||
Procter & Gamble Company | 180,677 | $ | 27,383 | |||||
Kraft Heinz Company | 567,200 | 23,091 | ||||||
Monster Beverage Corp.1 | 178,560 | 18,129 | ||||||
|
| |||||||
| 1,911,910 | ||||||||
|
| |||||||
Energy 4.78% | ||||||||
Chevron Corp. | 2,053,300 | 368,547 | ||||||
ConocoPhillips | 2,749,013 | 324,383 | ||||||
Canadian Natural Resources, Ltd. (CAD denominated) | 4,947,114 | 274,722 | ||||||
Baker Hughes Co., Class A | 7,353,936 | 217,162 | ||||||
EOG Resources, Inc. | 620,310 | 80,343 | ||||||
TC Energy Corp. (CAD denominated)2 | 1,849,358 | 73,728 | ||||||
Exxon Mobil Corp. | 660,220 | 72,822 | ||||||
Equitrans Midstream Corp. | 10,215,807 | 68,446 | ||||||
Suncor Energy, Inc. | 1,451,133 | 46,031 | ||||||
Cheniere Energy, Inc. | 238,735 | 35,801 | ||||||
Diamondback Energy, Inc. | 117,500 | 16,072 | ||||||
|
| |||||||
| 1,578,057 | ||||||||
|
| |||||||
Utilities 4.04% | ||||||||
PG&E Corp.1 | 25,776,996 | 419,134 | ||||||
Edison International | 2,689,330 | 171,095 | ||||||
Entergy Corp. | 1,304,500 | 146,756 | ||||||
Constellation Energy Corp. | 1,414,838 | 121,973 | ||||||
Sempra Energy | 690,000 | 106,633 | ||||||
CenterPoint Energy, Inc. | 2,840,104 | 85,175 | ||||||
AES Corp. | 2,803,707 | 80,635 | ||||||
Enel SpA | 12,931,498 | 69,549 | ||||||
NextEra Energy, Inc. | 585,000 | 48,906 | ||||||
DTE Energy Company | 401,000 | 47,129 | ||||||
CMS Energy Corp. | 551,001 | 34,895 | ||||||
|
| |||||||
| 1,331,880 | ||||||||
|
| |||||||
Materials 3.24% | ||||||||
Linde PLC | 1,122,332 | 366,082 | ||||||
Vale SA (ADR), ordinary nominative shares | 5,459,475 | 92,647 | ||||||
Vale SA, ordinary nominative shares | 3,404,848 | 57,318 | ||||||
LyondellBasell Industries NV | 1,735,980 | 144,138 | ||||||
Albemarle Corp. | 540,457 | 117,204 | ||||||
Freeport-McMoRan, Inc. | 2,382,960 | 90,553 | ||||||
Corteva, Inc. | 1,405,942 | 82,641 | ||||||
ATI, Inc.1 | 1,769,447 | 52,836 | ||||||
Barrick Gold Corp. | 2,373,000 | 40,768 | ||||||
Sherwin-Williams Company | 101,038 | 23,979 | ||||||
|
| |||||||
| 1,068,166 | ||||||||
|
| |||||||
Real estate 1.84% | ||||||||
VICI Properties, Inc. REIT | 9,124,903 | 295,647 | ||||||
Equinix, Inc. REIT | 298,158 | 195,302 | ||||||
Crown Castle, Inc. REIT | 864,782 | 117,299 | ||||||
|
| |||||||
| 608,248 | ||||||||
|
| |||||||
Total common stocks (cost: $19,921,309,000) | 30,171,965 | |||||||
|
| |||||||
100 American Funds Insurance Series
Table of Contents
Growth-Income Fund (continued)
Convertible stocks 0.83%
| Shares | Value (000) | |||||||
Health care 0.51% | ||||||||
Danaher Corp., Series B, cumulative convertible preferred shares, 5.00% 4/15/20232 | 123,957 | $ | 168,154 | |||||
|
| |||||||
Consumer discretionary 0.14% | ||||||||
Aptiv PLC, Series A, convertible preferred shares, 5.50% 6/15/2023 | 420,075 | 45,082 | ||||||
|
| |||||||
Utilities 0.09% | ||||||||
NextEra Energy, Inc., noncumulative convertible preferred units, 6.926% 9/1/2025 | 617,200 | 30,977 | ||||||
|
| |||||||
Financials 0.09% | ||||||||
KKR & Co., Inc., Series C, convertible preferred shares, 6.00% 9/15/2023 | 527,700 | 30,211 | ||||||
|
| |||||||
Total convertible stocks (cost: $288,316,000) | 274,424 | |||||||
|
| |||||||
Bonds, notes & other debt instruments 0.02%
Principal amount (000) | ||||||||
Corporate bonds, notes & loans 0.02% | ||||||||
Industrials 0.02% | ||||||||
Boeing Company 4.875% 5/1/2025 | USD4,706 | 4,674 | ||||||
|
| |||||||
Consumer discretionary 0.00% | ||||||||
General Motors Financial Co. 4.30% 7/13/2025 | 160 | 155 | ||||||
General Motors Financial Co. 5.25% 3/1/2026 | 827 | 815 | ||||||
|
| |||||||
| 970 | ||||||||
|
| |||||||
Energy 0.00% | ||||||||
Weatherford International, Ltd. 11.00% 12/1/20243 | 265 | 272 | ||||||
|
| |||||||
Total corporate bonds, notes & loans | 5,916 | |||||||
|
| |||||||
Total bonds, notes & other debt instruments (cost: $5,868,000) | 5,916 | |||||||
|
| |||||||
Short-term securities 8.45%
| Shares | ||||||||
Money market investments 7.77% | ||||||||
Capital Group Central Cash Fund 4.31%4,5 | 25,654,468 | 2,565,190 | ||||||
|
| |||||||
Money market investments purchased with collateral from securities on loan 0.68% | ||||||||
Invesco Short-Term Investments Trust – Government & Agency Portfolio, Institutional Class 4.22%4,6 | 92,462,113 | 92,462 | ||||||
Goldman Sachs Financial Square Government Fund, Institutional Shares 4.15%4,6 | 91,131,298 | 91,131 | ||||||
Capital Group Central Cash Fund 4.31%4,5,6 | 402,344 | 40,231 | ||||||
|
| |||||||
| 223,824 | ||||||||
|
| |||||||
Total short-term securities (cost: $2,788,688,000) | 2,789,014 | |||||||
|
| |||||||
Total investment securities 100.78% (cost: $23,004,181,000) | 33,241,319 | |||||||
Other assets less liabilities (0.78)% | (258,352 | ) | ||||||
|
| |||||||
Net assets 100.00% | $ | 32,982,967 | ||||||
|
| |||||||
American Funds Insurance Series 101
Table of Contents
Growth-Income Fund (continued)
Investments in affiliates5
| Value of affiliates at 1/1/2022 (000) | Additions (000) | Reductions (000) | Net realized loss (000) | Net unrealized appreciation (000) | Value of affiliates at 12/31/2022 (000) | Dividend income (000) | ||||||||||||||||||||||
Short-term securities 7.89% | ||||||||||||||||||||||||||||
Money market investments 7.77% | ||||||||||||||||||||||||||||
Capital Group Central Cash Fund 4.31%4 | $ | 1,220,761 | $ | 5,840,874 | $ | 4,496,259 | $ | (316 | ) | $ | 130 | $ | 2,565,190 | $ | 40,278 | |||||||||||||
Money market investments purchased with collateral from securities on loan 0.12% | ||||||||||||||||||||||||||||
Capital Group Central Cash Fund 4.31%4,6 | 39,148 | 1,083 | 7 | 40,231 | — | 8 | ||||||||||||||||||||||
|
|
|
|
|
|
|
| |||||||||||||||||||||
Total 7.89% | $ | (316 | ) | $ | 130 | $ | 2,605,421 | $ | 40,278 | |||||||||||||||||||
|
|
|
|
|
|
|
| |||||||||||||||||||||
| 1 | Security did not produce income during the last 12 months. |
| 2 | All or a portion of this security was on loan. The total value of all such securities was $240,456,000, which represented .73% of the net assets of the fund. Refer to Note 5 for more information on securities lending. |
| 3 | Acquired in a transaction exempt from registration under Rule 144A or, for commercial paper, Section 4(a)(2) of the Securities Act of 1933. May be resold in the U.S. in transactions exempt from registration, normally to qualified institutional buyers. The total value of all such securities was $272,000, which represented less than .01% of the net assets of the fund. |
| 4 | Rate represents the seven-day yield at 12/31/2022. |
| 5 | Part of the same “group of investment companies” as the fund as defined under the Investment Company Act of 1940, as amended. |
| 6 | Security purchased with cash collateral from securities on loan. Refer to Note 5 for more information on securities lending. |
| 7 | Represents net activity. Refer to Note 5 for more information on securities lending. |
| 8 | Dividend income is included with securities lending income in the fund’s statement of operations and is not shown in this table. |
Key to abbreviations
ADR = American Depositary Receipts
CAD = Canadian dollars
REIT = Real Estate Investment Trust
USD = U.S. dollars
Refer to the notes to financial statements.
102 American Funds Insurance Series
Table of Contents
International Growth and Income Fund
Investment portfolio December 31, 2022
Common stocks 96.75%
| Shares | Value (000) | |||||||
Financials 16.53% | ||||||||
AIA Group, Ltd. | 408,000 | $ | 4,495 | |||||
Ping An Insurance (Group) Company of China, Ltd., Class H | 643,000 | 4,244 | ||||||
AXA SA | 114,432 | 3,189 | ||||||
Zurich Insurance Group AG | 5,399 | 2,580 | ||||||
HDFC Bank, Ltd. | 118,266 | 2,328 | ||||||
Tokio Marine Holdings, Inc. | 105,200 | 2,252 | ||||||
UniCredit SpA | 132,526 | 1,885 | ||||||
Toronto-Dominion Bank (CAD denominated) | 28,953 | 1,875 | ||||||
Société Générale | 70,627 | 1,772 | ||||||
DNB Bank ASA | 78,454 | 1,553 | ||||||
Euronext NV | 20,312 | 1,506 | ||||||
Banco Bilbao Vizcaya Argentaria, SA | 216,058 | 1,305 | ||||||
Aon PLC, Class A | 4,301 | 1,291 | ||||||
Hana Financial Group, Inc. | 37,354 | 1,250 | ||||||
London Stock Exchange Group PLC | 12,717 | 1,097 | ||||||
Hang Seng Bank, Ltd. | 66,200 | 1,096 | ||||||
B3 SA-Brasil, Bolsa, Balcao | 407,901 | 1,021 | ||||||
UBS Group AG | 54,178 | 1,010 | ||||||
Industrial and Commercial Bank of China, Ltd., Class H | 1,959,040 | 1,009 | ||||||
Banco Santander, SA | 307,795 | 922 | ||||||
Resona Holdings, Inc. | 167,200 | 918 | ||||||
XP, Inc., Class A1 | 53,223 | 816 | ||||||
Prudential PLC | 55,866 | 756 | ||||||
Erste Group Bank AG | 22,556 | 719 | ||||||
DBS Group Holdings, Ltd. | 26,695 | 676 | ||||||
Bank Leumi Le-Israel BM | 77,681 | 648 | ||||||
Discovery, Ltd.1 | 88,847 | 645 | ||||||
Tryg A/S | 25,561 | 606 | ||||||
ABN AMRO Bank NV | 42,512 | 587 | ||||||
HDFC Life Insurance Company, Ltd. | 82,955 | 566 | ||||||
China Merchants Bank Co., Ltd., Class H | 98,500 | 546 | ||||||
Kotak Mahindra Bank, Ltd. | 23,335 | 513 | ||||||
Israel Discount Bank Ltd., Class A | 87,914 | 462 | ||||||
Banca Generali SpA | 13,051 | 449 | ||||||
ICICI Bank, Ltd. (ADR) | 18,198 | 398 | ||||||
Islandsbanki hf. | 466,167 | 394 | ||||||
Skandinaviska Enskilda Banken AB, Class A | 32,490 | 374 | ||||||
Brookfield Corp., Class A (CAD denominated) | 10,905 | 343 | ||||||
Grupo Financiero Banorte, SAB de CV, Series O | 41,185 | 296 | ||||||
ICICI Securities, Ltd. | 45,682 | 275 | ||||||
Postal Savings Bank of China Co., Ltd., Class H | 437,000 | 270 | ||||||
ING Groep NV | 21,878 | 267 | ||||||
EQT AB | 11,659 | 248 | ||||||
United Overseas Bank, Ltd. | 5,400 | 124 | ||||||
AU Small Finance Bank, Ltd. | 12,289 | 97 | ||||||
Brookfield Asset Management, Ltd., Class A (CAD denominated)1 | 2,726 | 78 | ||||||
Moscow Exchange MICEX-RTS PJSC1,2 | 346,177 | — | 3 | |||||
Sberbank of Russia PJSC1,2 | 476,388 | — | 3 | |||||
| �� |
|
| ||||||
| 49,751 | ||||||||
|
| |||||||
Industrials 11.96% | ||||||||
Airbus SE, non-registered shares | 51,245 | 6,093 | ||||||
BAE Systems PLC | 413,069 | 4,269 | ||||||
Alliance Global Group, Inc. | 7,895,900 | 1,689 | ||||||
ABB, Ltd. | 50,534 | 1,539 | ||||||
Rheinmetall AG | 7,314 | 1,457 | ||||||
SMC Corp. | 3,100 | 1,312 | ||||||
Daikin Industries, Ltd. | 8,400 | 1,292 | ||||||
RELX PLC | 46,516 | 1,289 | ||||||
Brenntag SE | 19,924 | 1,274 | ||||||
Bunzl PLC | 34,974 | 1,167 | ||||||
CCR SA, ordinary nominative shares | 565,458 | 1,159 | ||||||
American Funds Insurance Series 103
Table of Contents
International Growth and Income Fund (continued)
Common stocks (continued)
| Shares | Value (000) | |||||||
Industrials (continued) | ||||||||
Ryanair Holdings PLC (ADR)1 | 13,626 | $ | 1,019 | |||||
Safran SA | 7,664 | 958 | ||||||
InPost SA1 | 109,547 | 926 | ||||||
Cathay Pacific Airways, Ltd.1,4 | 787,000 | 856 | ||||||
LIXIL Corp. | 50,900 | 776 | ||||||
Mitsui & Co., Ltd. | 25,200 | 733 | ||||||
Waste Connections, Inc. (CAD denominated) | 5,192 | 688 | ||||||
Experian PLC | 17,789 | 606 | ||||||
TFI International, Inc. (CAD denominated) | 5,936 | 594 | ||||||
Techtronic Industries Co., Ltd. | 50,500 | 562 | ||||||
Caterpillar, Inc. | 2,260 | 541 | ||||||
BELIMO Holding AG | 1,112 | 531 | ||||||
Epiroc AB, Class A | 19,779 | 362 | ||||||
Epiroc AB, Class B | 10,197 | 164 | ||||||
Canadian Pacific Railway, Ltd. (CAD denominated) | 6,837 | 510 | ||||||
Interpump Group SpA | 9,158 | 415 | ||||||
Deutsche Post AG | 9,640 | 363 | ||||||
Siemens AG | 2,589 | 359 | ||||||
Nidec Corp. | 6,900 | 359 | ||||||
DSV A/S | 2,161 | 343 | ||||||
Japan Airlines Co., Ltd.1 | 16,500 | 338 | ||||||
Adecco Group AG | 10,191 | 335 | ||||||
Kone OYJ, Class B | 5,245 | 272 | ||||||
ASSA ABLOY AB, Class B | 11,710 | 252 | ||||||
Wizz Air Holdings PLC1 | 9,714 | 222 | ||||||
SITC International Holdings Co., Ltd. | 79,659 | 176 | ||||||
Hitachi, Ltd. | 2,400 | 121 | ||||||
Polycab India, Ltd. | 2,077 | 64 | ||||||
Husqvarna AB, Class B | 1,503 | 11 | ||||||
|
| |||||||
| 35,996 | ||||||||
|
| |||||||
Consumer discretionary 11.78% | ||||||||
Evolution AB | 44,081 | 4,305 | ||||||
LVMH Moët Hennessy-Louis Vuitton SE | 5,830 | 4,235 | ||||||
MGM China Holdings, Ltd.1 | 2,330,000 | 2,568 | ||||||
Renault SA1 | 75,272 | 2,508 | ||||||
Sands China, Ltd.1 | 568,372 | 1,883 | ||||||
Restaurant Brands International, Inc. (CAD denominated) | 26,120 | 1,689 | ||||||
InterContinental Hotels Group PLC | 25,528 | 1,469 | ||||||
Wynn Macau, Ltd.1 | 1,317,200 | 1,468 | ||||||
Prosus NV, Class N | 19,085 | 1,310 | ||||||
Midea Group Co., Ltd., Class A | 170,800 | 1,269 | ||||||
Galaxy Entertainment Group, Ltd. | 184,000 | 1,218 | ||||||
Sodexo SA | 11,689 | 1,118 | ||||||
adidas AG | 8,004 | 1,093 | ||||||
Li Ning Co., Ltd. | 122,500 | 1,051 | ||||||
B&M European Value Retail SA | 203,086 | 1,012 | ||||||
Nitori Holdings Co., Ltd. | 6,200 | 804 | ||||||
Industria de Diseño Textil, SA | 29,903 | 796 | ||||||
Paltac Corp. | 21,900 | 767 | ||||||
Valeo SA, non-registered shares | 40,170 | 716 | ||||||
Stellantis NV | 43,832 | 621 | ||||||
OPAP SA | 41,296 | 585 | ||||||
Entain PLC | 33,218 | 533 | ||||||
Coupang, Inc., Class A1 | 32,030 | 471 | ||||||
D’Ieteren Group | 2,035 | 392 | ||||||
Americanas SA, ordinary nominative shares | 149,913 | 274 | ||||||
Games Workshop Group PLC | 2,532 | 262 | ||||||
IDP Education, Ltd. | 13,164 | 243 | ||||||
JD.com, Inc., Class A | 7,174 | 202 | ||||||
Pan Pacific International Holdings Corp. | 9,000 | 167 | ||||||
Kering SA | 287 | 147 | ||||||
104 American Funds Insurance Series
Table of Contents
International Growth and Income Fund (continued)
Common stocks (continued)
| Shares | Value (000) | |||||||
Consumer discretionary (continued) | ||||||||
Balkrishna Industries, Ltd. | 4,894 | $ | 126 | |||||
Dixon Technologies (India), Ltd. | 1,902 | 90 | ||||||
MercadoLibre, Inc.1 | 88 | 75 | ||||||
|
| |||||||
| 35,467 | ||||||||
|
| |||||||
Consumer staples 11.46% | ||||||||
British American Tobacco PLC | 196,339 | 7,790 | ||||||
Philip Morris International, Inc. | 65,119 | 6,591 | ||||||
Nestlé SA | 26,069 | 3,011 | ||||||
Anheuser-Busch InBev SA/NV | 40,759 | 2,450 | ||||||
Carlsberg A/S, Class B | 18,056 | 2,390 | ||||||
Kweichow Moutai Co., Ltd., Class A | 9,490 | 2,348 | ||||||
Pernod Ricard SA | 6,241 | 1,227 | ||||||
Japan Tobacco, Inc. | 58,100 | 1,175 | ||||||
Asahi Group Holdings, Ltd. | 33,300 | 1,037 | ||||||
Foshan Haitian Flavouring and Food Co., Ltd., Class A | 77,954 | 892 | ||||||
Arca Continental, SAB de CV | 108,287 | 879 | ||||||
Carrefour SA, non-registered shares | 47,224 | 790 | ||||||
KT&G Corp. | 9,986 | 722 | ||||||
Varun Beverages, Ltd. | 43,375 | 691 | ||||||
Ocado Group PLC1 | 80,608 | 607 | ||||||
Imperial Brands PLC | 20,722 | 518 | ||||||
L’Oréal SA, non-registered shares | 1,190 | 427 | ||||||
Reckitt Benckiser Group PLC | 5,140 | 357 | ||||||
Haleon PLC1 | 60,392 | 241 | ||||||
Danone SA | 4,351 | 229 | ||||||
Avenue Supermarts, Ltd.1 | 2,324 | 114 | ||||||
|
| |||||||
| 34,486 | ||||||||
|
| |||||||
Information technology 10.82% | ||||||||
Taiwan Semiconductor Manufacturing Company, Ltd. | 517,000 | 7,535 | ||||||
ASML Holding NV | 10,887 | 5,893 | ||||||
Edenred SA | 50,178 | 2,730 | ||||||
Tokyo Electron, Ltd. | 8,300 | 2,466 | ||||||
Samsung Electronics Co., Ltd. | 41,896 | 1,848 | ||||||
MediaTek, Inc. | 87,000 | 1,767 | ||||||
Broadcom, Inc. | 2,678 | 1,497 | ||||||
SAP SE | 13,056 | 1,347 | ||||||
Keyence Corp. | 2,700 | 1,057 | ||||||
Kingdee International Software Group Co., Ltd.1 | 444,000 | 945 | ||||||
Logitech International SA | 14,465 | 898 | ||||||
Nokia Corp. | 184,789 | 859 | ||||||
TDK Corp. | 25,500 | 828 | ||||||
Capgemini SE | 4,791 | 804 | ||||||
ASM International NV | 2,074 | 525 | ||||||
Vanguard International Semiconductor Corp. | 186,000 | 468 | ||||||
Halma PLC | 12,131 | 290 | ||||||
Amadeus IT Group SA, Class A, non-registered shares1 | 4,613 | 238 | ||||||
Nice, Ltd. (ADR)1 | 888 | 171 | ||||||
Fujitsu, Ltd. | 1,000 | 132 | ||||||
eMemory Technology, Inc. | 3,000 | 130 | ||||||
Nomura Research Institute, Ltd. | 5,300 | 126 | ||||||
|
| |||||||
| 32,554 | ||||||||
|
| |||||||
Health care 10.34% | ||||||||
AstraZeneca PLC | 77,983 | 10,584 | ||||||
Novo Nordisk A/S, Class B | 49,782 | 6,740 | ||||||
Sanofi | 28,623 | 2,770 | ||||||
EssilorLuxottica | 10,095 | 1,838 | ||||||
Siemens Healthineers AG | 34,852 | 1,744 | ||||||
Bayer AG | 32,378 | 1,672 | ||||||
GSK PLC | 49,438 | 860 | ||||||
American Funds Insurance Series 105
Table of Contents
International Growth and Income Fund (continued)
Common stocks (continued)
| Shares | Value (000) | |||||||
Health care (continued) | ||||||||
Genus PLC | 21,154 | $ | 762 | |||||
Grifols, SA, Class B (ADR)1 | 88,384 | 751 | ||||||
EUROAPI1 | 39,510 | 586 | ||||||
Shionogi & Co., Ltd. | 9,600 | 478 | ||||||
Lonza Group AG | 927 | 456 | ||||||
Roche Holding AG, nonvoting non-registered shares | 1,328 | 417 | ||||||
Novartis AG | 4,476 | 405 | ||||||
BeiGene, Ltd. (ADR)1 | 1,387 | 305 | ||||||
Hypera SA, ordinary nominative shares | 30,419 | 260 | ||||||
Innovent Biologics, Inc.1 | 48,500 | 208 | ||||||
CanSino Biologics, Inc., Class H4 | 22,800 | 195 | ||||||
HOYA Corp. | 1,000 | 97 | ||||||
|
| |||||||
| 31,128 | ||||||||
|
| |||||||
Energy 7.77% | ||||||||
TotalEnergies SE | 89,101 | 5,561 | ||||||
BP PLC | 643,014 | 3,739 | ||||||
TechnipFMC PLC1 | 186,903 | 2,279 | ||||||
Equinor ASA | 57,576 | 2,065 | ||||||
TC Energy Corp. (CAD denominated) | 42,686 | 1,702 | ||||||
Schlumberger, Ltd. | 30,187 | 1,614 | ||||||
Canadian Natural Resources, Ltd. (CAD denominated)4 | 25,703 | 1,427 | ||||||
Aker BP ASA | 43,949 | 1,370 | ||||||
Cameco Corp. (CAD denominated) | 52,625 | 1,193 | ||||||
Reliance Industries, Ltd. | 18,972 | 582 | ||||||
Gaztransport & Technigaz SA | 4,690 | 501 | ||||||
Tourmaline Oil Corp. | 9,772 | 493 | ||||||
Woodside Energy Group, Ltd. | 18,414 | 446 | ||||||
INPEX Corp. | 31,500 | 336 | ||||||
Var Energi ASA | 20,924 | 72 | ||||||
Sovcomflot PAO1,2 | 356,717 | — | 3 | |||||
Gazprom PJSC2 | 671,150 | — | 3 | |||||
LUKOIL Oil Co. PJSC2 | 9,706 | — | 3 | |||||
|
| |||||||
| 23,380 | ||||||||
|
| |||||||
Materials 5.76% | ||||||||
Vale SA, ordinary nominative shares | 198,640 | 3,344 | ||||||
Vale SA (ADR), ordinary nominative shares | 80,910 | 1,373 | ||||||
Linde PLC | 7,570 | 2,469 | ||||||
Glencore PLC | 306,363 | 2,049 | ||||||
Barrick Gold Corp. | 94,562 | 1,625 | ||||||
Barrick Gold Corp. (CAD denominated) | 13,543 | 232 | ||||||
UPM-Kymmene OYJ | 23,659 | 887 | ||||||
Rio Tinto PLC | 10,464 | 734 | ||||||
Asahi Kasei Corp. | 99,900 | 710 | ||||||
Air Liquide SA, non-registered shares | 4,908 | 698 | ||||||
Fresnillo PLC | 58,201 | 632 | ||||||
Koninklijke DSM NV | 5,120 | 628 | ||||||
Sociedad Química y Minera de Chile SA, Class B (ADR) | 7,688 | 614 | ||||||
Fortescue Metals Group, Ltd. | 42,173 | 588 | ||||||
Sika AG | 1,500 | 362 | ||||||
Shin-Etsu Chemical Co., Ltd. | 1,900 | 231 | ||||||
Givaudan SA | 52 | 158 | ||||||
Alrosa PJSC1,2 | 53,607 | — | 3 | |||||
|
| |||||||
| 17,334 | ||||||||
|
| |||||||
Communication services 5.66% | ||||||||
Koninklijke KPN NV | 752,688 | 2,329 | ||||||
Nippon Telegraph and Telephone Corp. | 81,600 | 2,329 | ||||||
Tencent Holdings, Ltd. | 50,600 | 2,151 | ||||||
Telefónica, SA, non-registered shares | 402,982 | 1,459 | ||||||
Publicis Groupe SA | 22,225 | 1,411 | ||||||
106 American Funds Insurance Series
Table of Contents
International Growth and Income Fund (continued)
Common stocks (continued)
| Shares | Value (000) | |||||||
Communication services (continued) | ||||||||
Sea, Ltd., Class A (ADR)1 | 21,542 | $ | 1,121 | |||||
BT Group PLC | 635,302 | 863 | ||||||
SoftBank Corp. | 76,200 | 862 | ||||||
Vodafone Group PLC | 839,939 | 851 | ||||||
América Móvil, SAB de CV, Series L (ADR) | 41,487 | 755 | ||||||
Singapore Telecommunications, Ltd. | 319,600 | 614 | ||||||
Deutsche Telekom AG1 | 29,435 | 587 | ||||||
Indus Towers, Ltd. | 246,737 | 567 | ||||||
Viaplay Group AB, Class B1 | 20,606 | 393 | ||||||
MTN Group, Ltd. | 44,802 | 336 | ||||||
Universal Music Group NV | 9,460 | 228 | ||||||
NetEase, Inc. | 10,800 | 157 | ||||||
Sitios Latinoamerica, SAB de CV, Class B11 | 40,380 | 19 | ||||||
Yandex NV, Class A1,2 | 5,000 | — | 3 | |||||
|
| |||||||
| 17,032 | ||||||||
|
| |||||||
Utilities 3.07% | ||||||||
Engie SA | 190,787 | 2,733 | ||||||
Enel SpA | 397,417 | 2,137 | ||||||
ENN Energy Holdings, Ltd. | 118,100 | 1,648 | ||||||
Brookfield Infrastructure Partners, LP | 36,875 | 1,142 | ||||||
National Grid PLC | 43,151 | 518 | ||||||
Iberdrola, SA, non-registered shares | 37,788 | 442 | ||||||
China Resources Gas Group, Ltd. | 106,200 | 396 | ||||||
Veolia Environnement | 9,023 | 232 | ||||||
|
| |||||||
| 9,248 | ||||||||
|
| |||||||
Real estate 1.60% | ||||||||
CK Asset Holdings, Ltd. | 327,000 | 2,014 | ||||||
Longfor Group Holdings, Ltd. | 351,500 | 1,077 | ||||||
Link REIT | 108,007 | 793 | ||||||
Unibail-Rodamco-Westfield REIT, non-registered shares1 | 10,561 | 551 | ||||||
Embassy Office Parks REIT | 94,895 | 385 | ||||||
|
| |||||||
| 4,820 | ||||||||
|
| |||||||
Total common stocks (cost: $287,727,000) | 291,196 | |||||||
|
| |||||||
Preferred securities 0.63% | ||||||||
Materials 0.40% | ||||||||
Gerdau SA, preferred nominative shares | 216,930 | 1,207 | ||||||
|
| |||||||
Consumer discretionary 0.14% | ||||||||
Volkswagen AG, nonvoting preferred shares | 3,468 | 432 | ||||||
|
| |||||||
Information technology 0.09% | ||||||||
Samsung Electronics Co., Ltd., nonvoting preferred shares | 6,483 | 261 | ||||||
|
| |||||||
Total preferred securities (cost: $2,271,000) | 1,900 | |||||||
|
| |||||||
American Funds Insurance Series 107
Table of Contents
International Growth and Income Fund (continued)
Short-term securities 2.11%
| Shares | Value (000) | |||||||
Money market investments 1.82% | ||||||||
Capital Group Central Cash Fund 4.31%5,6 | 54,926 | $ | 5,492 | |||||
|
| |||||||
Money market investments purchased with collateral from securities on loan 0.29% | ||||||||
Invesco Short-Term Investments Trust – Government & Agency Portfolio, Institutional Class 4.22%5,7 | 851,683 | 852 | ||||||
Goldman Sachs Financial Square Government Fund, Institutional Shares 4.15%5,7 | 14,166 | 14 | ||||||
|
| |||||||
| 866 | ||||||||
|
| |||||||
Total short-term securities (cost: $6,355,000) | 6,358 | |||||||
|
| |||||||
Total investment securities 99.49% (cost: $296,353,000) | 299,454 | |||||||
Other assets less liabilities 0.51% | 1,543 | |||||||
|
| |||||||
Net assets 100.00% | $ | 300,997 | ||||||
|
| |||||||
Forward currency contracts
| Contract amount | Unrealized appreciation at | |||||||||||
| Currency purchased (000) | Currency sold (000) | Counterparty | Settlement date | 12/31/2022 (000) | ||||||||
| USD 612 | GBP 502 | UBS AG | 1/12/2023 | $ | 5 | |||||||
Investments in affiliates6
| Value of affiliate at 1/1/2022 (000) | Additions (000) | Reductions (000) | Net realized loss (000) | Net unrealized depreciation (000) | Value of affiliate at 12/31/2022 (000) | Dividend income (000) | ||||||||||||||||||||||
Short-term securities 1.82% | ||||||||||||||||||||||||||||
Money market investments 1.82% | ||||||||||||||||||||||||||||
Capital Group Central Cash Fund 4.31%5 | $ | 21,699 | $ | 75,477 | $ | 91,678 | $ | (4 | ) | $ | (2 | ) | $ | 5,492 | $ | 302 | ||||||||||||
| 1 | Security did not produce income during the last 12 months. |
| 2 | Value determined using significant unobservable inputs. |
| 3 | Amount less than one thousand. |
| 4 | All or a portion of this security was on loan. The total value of all such securities was $1,435,000, which represented .48% of the net assets of the fund. Refer to Note 5 for more information on securities lending. |
| 5 | Rate represents the seven-day yield at 12/31/2022. |
| 6 | Part of the same “group of investment companies” as the fund as defined under the Investment Company Act of 1940, as amended. |
| 7 | Security purchased with cash collateral from securities on loan. Refer to Note 5 for more information on securities lending. |
Key to abbreviations
ADR = American Depositary Receipts
CAD = Canadian dollars
GBP = British pounds
REIT = Real Estate Investment Trust
USD = U.S. dollars
Refer to the notes to financial statements.
108 American Funds Insurance Series
Table of Contents
Investment portfolio December 31, 2022
Common stocks 74.46%
| Shares | Value (000) | |||||||
Financials 13.77% | ||||||||
Zurich Insurance Group AG | 39,942 | $ | 19,087 | |||||
Toronto-Dominion Bank (CAD denominated) | 162,719 | 10,536 | ||||||
JPMorgan Chase & Co. | 68,717 | 9,215 | ||||||
PNC Financial Services Group, Inc. | 49,137 | 7,761 | ||||||
Münchener Rückversicherungs-Gesellschaft AG | 23,791 | 7,736 | ||||||
CME Group, Inc., Class A | 45,573 | 7,664 | ||||||
DBS Group Holdings, Ltd. | 300,006 | 7,595 | ||||||
Morgan Stanley | 88,772 | 7,547 | ||||||
DNB Bank ASA | 301,733 | 5,974 | ||||||
Power Corporation of Canada, subordinate voting shares | 201,698 | 4,745 | ||||||
BlackRock, Inc. | 6,520 | 4,620 | ||||||
B3 SA-Brasil, Bolsa, Balcao | 1,360,408 | 3,404 | ||||||
Tryg A/S | 138,292 | 3,280 | ||||||
Ping An Insurance (Group) Company of China, Ltd., Class H | 447,500 | 2,954 | ||||||
Ping An Insurance (Group) Company of China, Ltd., Class A | 34,457 | 233 | ||||||
Webster Financial Corp. | 61,978 | 2,934 | ||||||
AIA Group, Ltd. | 253,600 | 2,794 | ||||||
American International Group, Inc. | 43,993 | 2,782 | ||||||
Principal Financial Group, Inc. | 31,762 | 2,665 | ||||||
Blackstone, Inc., nonvoting shares | 33,399 | 2,478 | ||||||
KBC Groep NV | 33,615 | 2,158 | ||||||
United Overseas Bank, Ltd. | 89,200 | 2,046 | ||||||
State Street Corp. | 26,015 | 2,018 | ||||||
Kaspi.kz JSC1 | 21,756 | 1,555 | ||||||
Kaspi.kz JSC (GDR) | 5,969 | 426 | ||||||
East West Bancorp, Inc. | 29,501 | 1,944 | ||||||
ING Groep NV | 157,320 | 1,919 | ||||||
Wells Fargo & Company | 45,898 | 1,895 | ||||||
China Pacific Insurance (Group) Co., Ltd., Class H | 794,150 | 1,754 | ||||||
National Bank of Canada | 24,069 | 1,622 | ||||||
Travelers Companies, Inc. | 8,641 | 1,620 | ||||||
Swedbank AB, Class A | 88,691 | 1,507 | ||||||
Citizens Financial Group, Inc. | 36,461 | 1,436 | ||||||
KeyCorp | 75,308 | 1,312 | ||||||
China Merchants Bank Co., Ltd., Class A | 131,100 | 703 | ||||||
China Merchants Bank Co., Ltd., Class H | 94,500 | 524 | ||||||
IIFL Wealth Management, Ltd. | 55,104 | 1,183 | ||||||
Franklin Resources, Inc. | 42,738 | 1,127 | ||||||
OneMain Holdings, Inc. | 33,517 | 1,116 | ||||||
EFG International AG | 113,913 | 1,086 | ||||||
BNP Paribas SA | 17,927 | 1,020 | ||||||
Great-West Lifeco, Inc. | 43,284 | 1,001 | ||||||
Truist Financial Corp. | 23,131 | 995 | ||||||
Corebridge Financial, Inc. | 44,617 | 895 | ||||||
Hang Seng Bank, Ltd. | 52,200 | 864 | ||||||
Euronext NV | 11,304 | 838 | ||||||
Hong Kong Exchanges and Clearing, Ltd. | 18,300 | 791 | ||||||
Bank Central Asia Tbk PT | 1,423,700 | 781 | ||||||
TPG, Inc., Class A | 26,918 | 749 | ||||||
Citigroup, Inc. | 16,200 | 733 | ||||||
Patria Investments, Ltd., Class A | 47,813 | 666 | ||||||
Banco Santander, SA | 201,758 | 604 | ||||||
Vontobel Holding AG | 7,885 | 524 | ||||||
Macquarie Group, Ltd. | 4,045 | 459 | ||||||
Hana Financial Group, Inc. | 10,680 | 357 | ||||||
Cullen/Frost Bankers, Inc. | 1,968 | 263 | ||||||
UniCredit SpA | 12,643 | 180 | ||||||
SouthState Corp. | 2,204 | 168 | ||||||
Moscow Exchange MICEX-RTS PJSC2,3 | 875,002 | — | 4 | |||||
Sberbank of Russia PJSC2,3 | 204,176 | — | 4 | |||||
|
| |||||||
| 156,843 | ||||||||
|
| |||||||
American Funds Insurance Series 109
Table of Contents
Capital Income Builder (continued)
Common stocks (continued)
| Shares | Value (000) | |||||||
Consumer staples 10.07% | ||||||||
Philip Morris International, Inc. | 259,908 | $ | 26,305 | |||||
British American Tobacco PLC | 471,482 | 18,706 | ||||||
General Mills, Inc. | 102,770 | 8,617 | ||||||
Altria Group, Inc. | 188,250 | 8,605 | ||||||
PepsiCo, Inc. | 47,154 | 8,519 | ||||||
Nestlé SA | 70,531 | 8,145 | ||||||
Kimberly-Clark Corp. | 39,311 | 5,337 | ||||||
Imperial Brands PLC | 207,379 | 5,181 | ||||||
ITC, Ltd. | 1,060,348 | 4,250 | ||||||
Unilever PLC (GBP denominated) | 57,668 | 2,909 | ||||||
Carlsberg A/S, Class B | 19,656 | 2,602 | ||||||
Keurig Dr Pepper, Inc. | 72,760 | 2,595 | ||||||
Danone SA | 48,454 | 2,553 | ||||||
Anheuser-Busch InBev SA/NV | 37,592 | 2,260 | ||||||
Kraft Heinz Company | 32,392 | 1,319 | ||||||
Seven & i Holdings Co., Ltd. | 29,600 | 1,266 | ||||||
Procter & Gamble Company | 7,687 | 1,165 | ||||||
Mondelez International, Inc. | 14,725 | 981 | ||||||
Vector Group, Ltd. | 69,487 | 824 | ||||||
Essity Aktiebolag, Class B | 23,218 | 610 | ||||||
Viscofan, SA, non-registered shares | 9,124 | 589 | ||||||
Reckitt Benckiser Group PLC | 7,982 | 555 | ||||||
Scandinavian Tobacco Group A/S | 21,667 | 380 | ||||||
Kimberly-Clark de México, SAB de CV, Class A, ordinary participation certificates | 136,106 | 231 | ||||||
Coca-Cola HBC AG (CDI) | 7,021 | 168 | ||||||
|
| |||||||
| 114,672 | ||||||||
|
| |||||||
Health care 9.47% | ||||||||
AbbVie, Inc. | 173,251 | 27,999 | ||||||
Amgen, Inc. | 53,879 | 14,151 | ||||||
Gilead Sciences, Inc. | 153,232 | 13,155 | ||||||
AstraZeneca PLC | 60,447 | 8,204 | ||||||
Abbott Laboratories | 66,565 | 7,308 | ||||||
Medtronic PLC | 82,068 | 6,378 | ||||||
Novartis AG | 65,737 | 5,955 | ||||||
Bristol-Myers Squibb Company | 74,164 | 5,336 | ||||||
Pfizer, Inc. | 89,394 | 4,581 | ||||||
UnitedHealth Group, Inc. | 6,954 | 3,687 | ||||||
Roche Holding AG, nonvoting non-registered shares | 10,419 | 3,274 | ||||||
Takeda Pharmaceutical Company, Ltd. | 87,100 | 2,720 | ||||||
Royalty Pharma PLC, Class A | 42,309 | 1,672 | ||||||
Merck & Co., Inc. | 7,825 | 868 | ||||||
EBOS Group, Ltd. | 30,676 | 850 | ||||||
CVS Health Corp. | 7,431 | 692 | ||||||
Bayer AG | 12,641 | 653 | ||||||
GSK PLC | 17,925 | 312 | ||||||
Koninklijke Philips NV (EUR denominated) | 4,898 | 74 | ||||||
Organon & Co. | 662 | 18 | ||||||
|
| |||||||
| 107,887 | ||||||||
|
| |||||||
Industrials 7.34% | ||||||||
Raytheon Technologies Corp. | 239,595 | 24,180 | ||||||
Lockheed Martin Corp. | 11,445 | 5,568 | ||||||
BAE Systems PLC | 526,461 | 5,441 | ||||||
Honeywell International, Inc. | 24,790 | 5,312 | ||||||
Siemens AG | 36,680 | 5,091 | ||||||
RELX PLC | 131,761 | 3,650 | ||||||
RELX PLC (ADR) | 8,177 | 227 | ||||||
Kone OYJ, Class B | 71,780 | 3,718 | ||||||
L3Harris Technologies, Inc. | 16,708 | 3,479 | ||||||
Deutsche Post AG | 64,678 | 2,435 | ||||||
VINCI SA | 24,215 | 2,418 | ||||||
110 American Funds Insurance Series
Table of Contents
Capital Income Builder (continued)
Common stocks (continued)
| Shares | Value (000) | |||||||
Industrials (continued) | ||||||||
Singapore Technologies Engineering, Ltd. | 898,600 | $ | 2,249 | |||||
Trinity Industries, Inc. | 72,684 | 2,149 | ||||||
BOC Aviation, Ltd. | 194,500 | 1,617 | ||||||
Illinois Tool Works, Inc. | 7,243 | 1,596 | ||||||
ITOCHU Corp. | 44,400 | 1,388 | ||||||
SGS SA | 589 | 1,364 | ||||||
Compañia de Distribución Integral Logista Holdings, SA, non-registered shares | 45,292 | 1,144 | ||||||
Trelleborg AB, Class B | 47,577 | 1,101 | ||||||
Grupo Aeroportuario del Pacífico, SAB de CV, Class B | 74,506 | 1,067 | ||||||
AB Volvo, Class B | 58,146 | 1,053 | ||||||
Norfolk Southern Corp. | 3,965 | 977 | ||||||
LIXIL Corp. | 54,600 | 832 | ||||||
Ventia Services Group Pty, Ltd. | 490,862 | 796 | ||||||
United Parcel Service, Inc., Class B | 4,455 | 774 | ||||||
Union Pacific Corp. | 3,606 | 747 | ||||||
Marubeni Corp. | 56,900 | 650 | ||||||
General Dynamics Corp. | 2,526 | 627 | ||||||
Waste Management, Inc. | 3,955 | 620 | ||||||
Carrier Global Corp. | 13,015 | 537 | ||||||
Airbus SE, non-registered shares | 3,671 | 436 | ||||||
Sulzer AG | 4,695 | 367 | ||||||
|
| |||||||
| 83,610 | ||||||||
|
| |||||||
Information technology 6.92% | ||||||||
Broadcom, Inc. | 65,566 | 36,661 | ||||||
Microsoft Corp. | 63,062 | 15,124 | ||||||
Taiwan Semiconductor Manufacturing Company, Ltd. | 583,800 | 8,509 | ||||||
Paychex, Inc. | 17,290 | 1,998 | ||||||
Texas Instruments, Inc. | 11,533 | 1,905 | ||||||
KLA Corp. | 4,878 | 1,839 | ||||||
Vanguard International Semiconductor Corp. | 618,700 | 1,558 | ||||||
Automatic Data Processing, Inc. | 6,477 | 1,547 | ||||||
QUALCOMM, Inc. | 11,372 | 1,250 | ||||||
Western Union Company | 83,565 | 1,151 | ||||||
Tokyo Electron, Ltd. | 3,500 | 1,040 | ||||||
SAP SE | 10,071 | 1,039 | ||||||
Analog Devices, Inc. | 5,930 | 973 | ||||||
NetApp, Inc. | 14,882 | 894 | ||||||
GlobalWafers Co., Ltd. | 46,938 | 652 | ||||||
Fidelity National Information Services, Inc. | 9,497 | 644 | ||||||
Intel Corp. | 18,944 | 501 | ||||||
MediaTek, Inc. | 24,000 | 487 | ||||||
Tripod Technology Corp. | 152,000 | 465 | ||||||
SINBON Electronics Co., Ltd. | 42,446 | 380 | ||||||
BE Semiconductor Industries NV | 3,388 | 206 | ||||||
|
| |||||||
| 78,823 | ||||||||
|
| |||||||
Utilities 6.24% | ||||||||
Dominion Energy, Inc. | 102,936 | 6,312 | ||||||
Iberdrola, SA, non-registered shares | 496,459 | 5,807 | ||||||
DTE Energy Company | 49,064 | 5,766 | ||||||
National Grid PLC | 476,775 | 5,727 | ||||||
Engie SA | 335,814 | 4,810 | ||||||
Engie SA, bonus shares | 36,900 | 529 | ||||||
Power Grid Corporation of India, Ltd. | 2,007,912 | 5,169 | ||||||
E.ON SE | 486,449 | 4,855 | ||||||
The Southern Co. | 62,100 | 4,434 | ||||||
Edison International | 60,608 | 3,856 | ||||||
Duke Energy Corp. | 32,752 | 3,373 | ||||||
AES Corp. | 108,568 | 3,122 | ||||||
Entergy Corp. | 26,522 | 2,984 | ||||||
Exelon Corp. | 49,566 | 2,143 | ||||||
American Funds Insurance Series 111
Table of Contents
Capital Income Builder (continued)
Common stocks (continued)
| Shares | Value (000) | |||||||
Utilities (continued) | ||||||||
Public Service Enterprise Group, Inc. | 28,665 | $ | 1,756 | |||||
SSE PLC | 77,332 | 1,595 | ||||||
CenterPoint Energy, Inc. | 51,179 | 1,535 | ||||||
Sempra Energy | 9,762 | 1,509 | ||||||
ENN Energy Holdings, Ltd. | 93,600 | 1,306 | ||||||
Enel SpA | 240,213 | 1,292 | ||||||
NextEra Energy, Inc. | 13,466 | 1,126 | ||||||
Evergy, Inc. | 15,369 | 967 | ||||||
Power Assets Holdings, Ltd. | 106,500 | 583 | ||||||
CMS Energy Corp. | 3,992 | 253 | ||||||
American Electric Power Company, Inc. | 1,512 | 144 | ||||||
SembCorp Industries, Ltd. | 44,800 | 113 | ||||||
|
| |||||||
| 71,066 | ||||||||
|
| |||||||
Energy 6.00% | ||||||||
Canadian Natural Resources, Ltd. (CAD denominated)5 | 195,057 | 10,832 | ||||||
Chevron Corp. | 47,686 | 8,559 | ||||||
TC Energy Corp. (CAD denominated) | 181,889 | 7,252 | ||||||
TC Energy Corp. | 16,085 | 641 | ||||||
Exxon Mobil Corp. | 69,719 | 7,690 | ||||||
TotalEnergies SE | 90,216 | 5,631 | ||||||
BP PLC | 806,006 | 4,687 | ||||||
EOG Resources, Inc. | 34,736 | 4,499 | ||||||
Shell PLC (GBP denominated) | 115,306 | 3,277 | ||||||
Shell PLC (ADR) | 8,467 | 482 | ||||||
Woodside Energy Group, Ltd. | 86,228 | 2,086 | ||||||
Woodside Energy Group, Ltd. (CDI) | 23,081 | 557 | ||||||
ConocoPhillips | 20,510 | 2,420 | ||||||
Pioneer Natural Resources Company | 10,296 | 2,352 | ||||||
Schlumberger, Ltd. | 36,843 | 1,970 | ||||||
Enbridge, Inc. (CAD denominated) | 40,329 | 1,576 | ||||||
Baker Hughes Co., Class A | 52,596 | 1,553 | ||||||
Equitrans Midstream Corp. | 213,059 | 1,427 | ||||||
DT Midstream, Inc. | 13,716 | 758 | ||||||
Galp Energia, SGPS, SA, Class B | 11,022 | 149 | ||||||
Gazprom PJSC2 | 880,428 | — | 4 | |||||
|
| |||||||
| 68,398 | ||||||||
|
| |||||||
Real estate 5.99% | ||||||||
VICI Properties, Inc. REIT | 586,804 | 19,012 | ||||||
Crown Castle, Inc. REIT | 113,151 | 15,348 | ||||||
Equinix, Inc. REIT | 10,699 | 7,008 | ||||||
Gaming and Leisure Properties, Inc. REIT | 93,929 | 4,893 | ||||||
Federal Realty Investment Trust REIT | 28,164 | 2,846 | ||||||
Link REIT | 372,507 | 2,735 | ||||||
American Tower Corp. REIT | 9,879 | 2,093 | ||||||
CK Asset Holdings, Ltd. | 318,000 | 1,958 | ||||||
Boston Properties, Inc. REIT | 22,486 | 1,520 | ||||||
Charter Hall Group REIT | 146,326 | 1,192 | ||||||
Longfor Group Holdings, Ltd. | 353,000 | 1,082 | ||||||
POWERGRID Infrastructure Investment Trust | 681,036 | 1,047 | ||||||
Embassy Office Parks REIT | 245,585 | 996 | ||||||
Mindspace Business Parks REIT | 214,689 | 868 | ||||||
Extra Space Storage, Inc. REIT | 5,810 | 855 | ||||||
Americold Realty Trust, Inc. REIT | 30,182 | 854 | ||||||
Sun Hung Kai Properties, Ltd. | 61,255 | 838 | ||||||
CTP NV | 68,103 | 802 | ||||||
Digital Realty Trust, Inc. REIT | 6,950 | 697 | ||||||
112 American Funds Insurance Series
Table of Contents
Capital Income Builder (continued)
Common stocks (continued)
| Shares | Value (000) | |||||||
Real estate (continued) | ||||||||
Kimco Realty Corp. REIT | 31,388 | $ | 665 | |||||
Prologis, Inc. REIT | 4,763 | 537 | ||||||
CubeSmart REIT | 8,847 | 356 | ||||||
|
| |||||||
| 68,202 | ||||||||
|
| |||||||
Materials 2.91% | ||||||||
Vale SA (ADR), ordinary nominative shares | 349,433 | 5,930 | ||||||
Vale SA, ordinary nominative shares | 225,247 | 3,792 | ||||||
Rio Tinto PLC | 79,626 | 5,587 | ||||||
Air Products and Chemicals, Inc. | 9,631 | 2,969 | ||||||
Linde PLC | 8,936 | 2,915 | ||||||
BHP Group, Ltd. (CDI) | 82,385 | 2,540 | ||||||
International Flavors & Fragrances, Inc. | 21,588 | 2,263 | ||||||
LyondellBasell Industries NV | 18,557 | 1,541 | ||||||
Evonik Industries AG | 54,480 | 1,046 | ||||||
Sociedad Química y Minera de Chile SA, Class B (ADR) | 12,475 | 996 | ||||||
BASF SE | 16,131 | 801 | ||||||
UPM-Kymmene OYJ | 19,684 | 738 | ||||||
Asahi Kasei Corp. | 96,900 | 688 | ||||||
Fortescue Metals Group, Ltd. | 28,457 | 397 | ||||||
Nexa Resources SA5 | 51,286 | 309 | ||||||
WestRock Co. | 7,448 | 262 | ||||||
Shin-Etsu Chemical Co., Ltd. | 1,900 | 231 | ||||||
Smurfit Kappa Group PLC | 4,754 | 176 | ||||||
|
| |||||||
| 33,181 | ||||||||
|
| |||||||
Consumer discretionary 2.90% | ||||||||
Starbucks Corp. | 41,213 | 4,088 | ||||||
Home Depot, Inc. | 12,852 | 4,059 | ||||||
Industria de Diseño Textil, SA | 149,994 | 3,994 | ||||||
Midea Group Co., Ltd., Class A | 513,775 | 3,816 | ||||||
McDonald’s Corp. | 11,404 | 3,005 | ||||||
Kering SA | 5,640 | 2,887 | ||||||
Restaurant Brands International, Inc. | 38,245 | 2,473 | ||||||
LVMH Moët Hennessy-Louis Vuitton SE | 2,860 | 2,078 | ||||||
YUM! Brands, Inc. | 10,281 | 1,317 | ||||||
Galaxy Entertainment Group, Ltd. | 196,000 | 1,298 | ||||||
Cie. Financière Richemont SA, Class A | 7,967 | 1,031 | ||||||
Darden Restaurants, Inc. | 7,101 | 982 | ||||||
Mercedes-Benz Group AG | 8,466 | 556 | ||||||
OPAP SA | 27,844 | 395 | ||||||
Pearson PLC | 26,653 | 302 | ||||||
Inchcape PLC | 26,460 | 261 | ||||||
Kindred Group PLC (SDR) | 24,452 | 255 | ||||||
VF Corp. | 4,833 | 134 | ||||||
Thule Group AB | 4,224 | 88 | ||||||
|
| |||||||
| 33,019 | ||||||||
|
| |||||||
Communication services 2.85% | ||||||||
Comcast Corp., Class A | 222,680 | 7,787 | ||||||
Verizon Communications, Inc. | 113,150 | 4,458 | ||||||
SoftBank Corp. | 380,300 | 4,300 | ||||||
Singapore Telecommunications, Ltd. | 1,528,600 | 2,935 | ||||||
Koninklijke KPN NV | 918,661 | 2,842 | ||||||
BCE, Inc. | 54,651 | 2,401 | ||||||
Nippon Telegraph and Telephone Corp. | 75,100 | 2,143 | ||||||
HKT Trust and HKT, Ltd., units | 1,127,240 | 1,378 | ||||||
Warner Music Group Corp., Class A | 33,470 | 1,172 | ||||||
Omnicom Group, Inc. | 10,871 | 887 | ||||||
WPP PLC | 81,366 | 808 | ||||||
American Funds Insurance Series 113
Table of Contents
Capital Income Builder (continued)
Common stocks (continued)
| Shares | Value (000) | |||||||
Communication services (continued) | ||||||||
Indus Towers, Ltd. | 211,665 | $ | 486 | |||||
América Móvil, SAB de CV, Series L (ADR) | 24,725 | 450 | ||||||
ProSiebenSat.1 Media SE | 40,927 | 366 | ||||||
|
| |||||||
| 32,413 | ||||||||
|
| |||||||
Total common stocks (cost: $704,847,000) | 848,114 | |||||||
|
| |||||||
Preferred securities 0.05% | ||||||||
Information technology 0.05% | ||||||||
Samsung Electronics Co., Ltd., nonvoting preferred shares | 13,546 | 545 | ||||||
|
| |||||||
| Total preferred securities (cost: $456,000) | 545 | |||||||
|
| |||||||
Rights & warrants 0.00% | ||||||||
Consumer discretionary 0.00% | ||||||||
Compagnie Financière Richemont SA, Class A, warrants, expire 11/22/20233 | 7,130 | 6 | ||||||
|
| |||||||
Total rights & warrants (cost: $0) | 6 | |||||||
|
| |||||||
Convertible stocks 0.44% | ||||||||
Utilities 0.28% | ||||||||
NextEra Energy, Inc., noncumulative convertible preferred units, 6.926% 9/1/2025 | 35,900 | 1,802 | ||||||
AES Corp., convertible preferred units, 6.875% 2/15/2024 | 8,659 | 883 | ||||||
American Electric Power Company, Inc., convertible preferred units, 6.125% 8/15/2023 | 9,704 | 501 | ||||||
|
| |||||||
| 3,186 | ||||||||
|
| |||||||
Health care 0.10% | ||||||||
Danaher Corp., Series B, cumulative convertible preferred shares, 5.00% 4/15/20235 | 841 | 1,141 | ||||||
|
| |||||||
Consumer discretionary 0.06% | ||||||||
Aptiv PLC, Series A, convertible preferred shares, 5.50% 6/15/2023 | 6,448 | 692 | ||||||
|
| |||||||
Total convertible stocks (cost: $4,623,000) | 5,019 | |||||||
|
| |||||||
Investment funds 2.46% | ||||||||
Capital Group Central Corporate Bond Fund6 | 3,442,868 | 28,059 | ||||||
|
| |||||||
| Total investment funds (cost: $33,742,000) | 28,059 | |||||||
|
| |||||||
Bonds, notes & other debt instruments 18.22% | ||||||||
Principal amount | ||||||||
| (000) | ||||||||
U.S. Treasury bonds & notes 9.44% | ||||||||
U.S. Treasury 7.06% | ||||||||
U.S. Treasury 0.125% 1/31/2023 | USD2,200 | 2,193 | ||||||
U.S. Treasury 0.375% 10/31/2023 | 875 | 844 | ||||||
U.S. Treasury 0.125% 12/15/2023 | 8,410 | 8,057 | ||||||
U.S. Treasury 2.50% 4/30/2024 | 2,224 | 2,161 | ||||||
U.S. Treasury 3.25% 8/31/2024 | 554 | 542 | ||||||
U.S. Treasury 0.625% 10/15/2024 | 11,050 | 10,322 | ||||||
U.S. Treasury 0.75% 11/15/2024 | 3,525 | 3,291 | ||||||
U.S. Treasury 4.50% 11/30/2024 | 3,677 | 3,678 | ||||||
U.S. Treasury 4.00% 12/15/2025 | 4,257 | 4,230 | ||||||
U.S. Treasury 0.75% 3/31/2026 | 1 | 1 | ||||||
U.S. Treasury 0.75% 4/30/2026 | 1,093 | 977 | ||||||
U.S. Treasury 0.75% 5/31/2026 | 3,850 | 3,435 | ||||||
114 American Funds Insurance Series
Table of Contents
Capital Income Builder (continued)
Bonds, notes & other debt instruments (continued)
Principal amount | Value (000) | |||||||
U.S. Treasury bonds & notes (continued) | ||||||||
U.S. Treasury (continued) | ||||||||
U.S. Treasury 1.875% 6/30/2026 | USD6,300 | $ | 5,845 | |||||
U.S. Treasury 1.125% 10/31/2026 | 995 | 890 | ||||||
U.S. Treasury 2.00% 11/15/20267 | 2,800 | 2,589 | ||||||
U.S. Treasury 0.50% 4/30/2027 | 2,900 | 2,498 | ||||||
U.S. Treasury 6.125% 11/15/2027 | 950 | 1,037 | ||||||
U.S. Treasury 3.875% 11/30/2027 | 15,438 | 15,354 | ||||||
U.S. Treasury 1.25% 3/31/2028 | 1,350 | 1,174 | ||||||
U.S. Treasury 3.875% 11/30/2029 | 1,360 | 1,351 | ||||||
U.S. Treasury 6.25% 5/15/2030 | 890 | 1,016 | ||||||
U.S. Treasury 4.125% 11/15/2032 | 1,610 | 1,642 | ||||||
U.S. Treasury 1.125% 5/15/20407 | 2,400 | 1,506 | ||||||
U.S. Treasury 2.00% 11/15/2041 | 300 | 215 | ||||||
U.S. Treasury 4.00% 11/15/2042 | 806 | 790 | ||||||
U.S. Treasury 2.375% 5/15/2051 | 197 | 142 | ||||||
U.S. Treasury 3.00% 8/15/20527 | 5,411 | 4,486 | ||||||
U.S. Treasury 4.00% 11/15/2052 | 115 | 116 | ||||||
|
| |||||||
| 80,382 | ||||||||
|
| |||||||
U.S. Treasury inflation-protected securities 2.38% | ||||||||
U.S. Treasury Inflation-Protected Security 0.125% 1/15/20238 | 2,610 | 2,605 | ||||||
U.S. Treasury Inflation-Protected Security 0.625% 4/15/20238 | 3,400 | 3,367 | ||||||
U.S. Treasury Inflation-Protected Security 0.375% 7/15/20238 | 1,818 | 1,797 | ||||||
U.S. Treasury Inflation-Protected Security 0.625% 1/15/20248 | 1,220 | 1,195 | ||||||
U.S. Treasury Inflation-Protected Security 0.50% 4/15/20248 | 1,581 | 1,539 | ||||||
U.S. Treasury Inflation-Protected Security 0.125% 7/15/20248 | 1,887 | 1,828 | ||||||
U.S. Treasury Inflation-Protected Security 0.125% 10/15/20248 | 2,752 | 2,652 | ||||||
U.S. Treasury Inflation-Protected Security 0.25% 1/15/20258 | 539 | 518 | ||||||
U.S. Treasury Inflation-Protected Security 0.125% 4/15/20258 | 1,269 | 1,210 | ||||||
U.S. Treasury Inflation-Protected Security 0.375% 7/15/20258 | 377 | 362 | ||||||
U.S. Treasury Inflation-Protected Security 0.125% 10/15/20258 | 230 | 218 | ||||||
U.S. Treasury Inflation-Protected Security 0.125% 4/15/20268 | 2,388 | 2,245 | ||||||
U.S. Treasury Inflation-Protected Security 1.625% 10/15/20278 | 2,253 | 2,250 | ||||||
U.S. Treasury Inflation-Protected Security 0.50% 1/15/20288 | 242 | 227 | ||||||
U.S. Treasury Inflation-Protected Security 0.125% 1/15/20308 | 2,143 | 1,925 | ||||||
U.S. Treasury Inflation-Protected Security 0.125% 1/15/20318 | 1,831 | 1,625 | ||||||
U.S. Treasury Inflation-Protected Security 0.125% 7/15/20318 | 139 | 123 | ||||||
U.S. Treasury Inflation-Protected Security 1.00% 2/15/20498 | 201 | 169 | ||||||
U.S. Treasury Inflation-Protected Security 0.125% 2/15/20517,8 | 2,031 | 1,311 | ||||||
|
| |||||||
| 27,166 | ||||||||
|
| |||||||
Total U.S. Treasury bonds & notes | 107,548 | |||||||
|
| |||||||
Mortgage-backed obligations 6.13% | ||||||||
Federal agency mortgage-backed obligations 5.40% | ||||||||
Fannie Mae Pool #695412 5.00% 6/1/20339 | — | 4 | — | 4 | ||||
Fannie Mae Pool #AD3566 5.00% 10/1/20359 | 2 | 2 | ||||||
Fannie Mae Pool #931768 5.00% 8/1/20399 | 1 | 1 | ||||||
Fannie Mae Pool #AC0794 5.00% 10/1/20399 | 5 | 5 | ||||||
Fannie Mae Pool #932606 5.00% 2/1/20409 | 2 | 2 | ||||||
Fannie Mae Pool #AE0311 3.50% 8/1/20409 | 9 | 8 | ||||||
Fannie Mae Pool #AE1248 5.00% 6/1/20419 | 8 | 8 | ||||||
Fannie Mae Pool #AJ1873 4.00% 10/1/20419 | 7 | 6 | ||||||
Fannie Mae Pool #AE1274 5.00% 10/1/20419 | 7 | 7 | ||||||
Fannie Mae Pool #AE1277 5.00% 11/1/20419 | 5 | 5 | ||||||
Fannie Mae Pool #AE1283 5.00% 12/1/20419 | 2 | 2 | ||||||
Fannie Mae Pool #AE1290 5.00% 2/1/20429 | 4 | 4 | ||||||
Fannie Mae Pool #AT0300 3.50% 3/1/20439 | 1 | 1 | ||||||
Fannie Mae Pool #AT3954 3.50% 4/1/20439 | 2 | 2 | ||||||
Fannie Mae Pool #AY1829 3.50% 12/1/20449 | 2 | 2 | ||||||
Fannie Mae Pool #FM9416 3.50% 7/1/20459 | 150 | 138 | ||||||
Fannie Mae Pool #BH3122 4.00% 6/1/20479 | 1 | 1 | ||||||
American Funds Insurance Series 115
Table of Contents
Capital Income Builder (continued)
Bonds, notes & other debt instruments (continued)
Principal amount | Value | |||||||
| (000) | (000) | |||||||
Mortgage-backed obligations (continued) | ||||||||
Federal agency mortgage-backed obligations (continued) | ||||||||
Fannie Mae Pool #BJ5015 4.00% 12/1/20479 | USD39 | $ | 37 | |||||
Fannie Mae Pool #BK5232 4.00% 5/1/20489 | 20 | 19 | ||||||
Fannie Mae Pool #BK6840 4.00% 6/1/20489 | 27 | 25 | ||||||
Fannie Mae Pool #BK9743 4.00% 8/1/20489 | 8 | 8 | ||||||
Fannie Mae Pool #BK9761 4.50% 8/1/20489 | 5 | 5 | ||||||
Fannie Mae Pool #FM3280 3.50% 5/1/20499 | 38 | 35 | ||||||
Fannie Mae Pool #CA5540 3.00% 4/1/20509 | 3,219 | 2,861 | ||||||
Fannie Mae Pool #CA6309 3.00% 7/1/20509 | 376 | 337 | ||||||
Fannie Mae Pool #CB2787 3.50% 12/1/20519 | 23 | 21 | ||||||
Fannie Mae Pool #BV0790 3.50% 1/1/20529 | 97 | 88 | ||||||
Fannie Mae Pool #FS0647 3.00% 2/1/20529 | 1,017 | 907 | ||||||
Fannie Mae Pool #CB3236 3.00% 3/1/20529 | 424 | 373 | ||||||
Fannie Mae Pool #FS3275 3.00% 4/1/20529 | 787 | 691 | ||||||
Fannie Mae Pool #MA4600 3.50% 5/1/20529 | 1,452 | 1,321 | ||||||
Fannie Mae Pool #BT8370 3.50% 6/1/20529 | 291 | 265 | ||||||
Fannie Mae Pool #MA4732 4.00% 9/1/20529 | 353 | 332 | ||||||
Fannie Mae Pool #MA4782 3.50% 10/1/20529 | 880 | 800 | ||||||
Fannie Mae Pool #MA4877 6.50% 12/1/20529 | 103 | 106 | ||||||
Fannie Mae Pool #MA4902 3.50% 1/1/20539 | 53 | 48 | ||||||
Fannie Mae Pool #MA4866 4.00% 1/1/20539 | 828 | 777 | ||||||
Fannie Mae Pool #MA4868 5.00% 1/1/20539 | 30 | 30 | ||||||
Fannie Mae Pool #MA4895 6.50% 1/1/20539 | 118 | 121 | ||||||
Fannie Mae Pool #BF0142 5.50% 8/1/20569 | 391 | 404 | ||||||
Fannie Mae Pool #BF0342 5.50% 1/1/20599 | 266 | 272 | ||||||
Fannie Mae Pool #BM6737 4.50% 11/1/20599 | 704 | 691 | ||||||
Fannie Mae Pool #BF0497 3.00% 7/1/20609 | 458 | 401 | ||||||
Freddie Mac Pool #Q15874 4.00% 2/1/20439 | 1 | 1 | ||||||
Freddie Mac Pool #G67711 4.00% 3/1/20489 | 234 | 225 | ||||||
Freddie Mac Pool #Q55971 4.00% 5/1/20489 | 20 | 19 | ||||||
Freddie Mac Pool #Q56175 4.00% 5/1/20489 | 19 | 18 | ||||||
Freddie Mac Pool #Q55970 4.00% 5/1/20489 | 10 | 9 | ||||||
Freddie Mac Pool #Q56599 4.00% 6/1/20489 | 28 | 27 | ||||||
Freddie Mac Pool #Q57242 4.50% 7/1/20489 | 13 | 13 | ||||||
Freddie Mac Pool #Q58411 4.50% 9/1/20489 | 51 | 51 | ||||||
Freddie Mac Pool #Q58436 4.50% 9/1/20489 | 28 | 27 | ||||||
Freddie Mac Pool #Q58378 4.50% 9/1/20489 | 20 | 20 | ||||||
Freddie Mac Pool #ZT1704 4.50% 1/1/20499 | 1,234 | 1,218 | ||||||
Freddie Mac Pool #QD2877 3.00% 12/1/20519 | 130 | 114 | ||||||
Freddie Mac Pool #SD1374 3.00% 3/1/20529 | 430 | 378 | ||||||
Freddie Mac Pool #SD1937 3.00% 3/1/20529 | 243 | 214 | ||||||
Freddie Mac Pool #QE4383 4.00% 6/1/20529 | 340 | 319 | ||||||
Freddie Mac Pool #RA7556 4.50% 6/1/20529 | 936 | 903 | ||||||
Freddie Mac Pool #SD8242 3.00% 9/1/20529 | 605 | 531 | ||||||
Freddie Mac Pool #SD1584 4.50% 9/1/20529 | 206 | 202 | ||||||
Freddie Mac Pool #QF1730 4.00% 10/1/20529 | 838 | 787 | ||||||
Freddie Mac Pool #SD8256 4.00% 10/1/20529 | 100 | 94 | ||||||
Freddie Mac Pool #SD8264 3.50% 11/1/20529 | 200 | 182 | ||||||
Freddie Mac Pool #SD8275 4.50% 12/1/20529 | 1,959 | 1,887 | ||||||
Freddie Mac Pool #SD8281 6.50% 12/1/20529 | 406 | 416 | ||||||
Freddie Mac Pool #SD8285 3.50% 1/1/20539 | 14 | 13 | ||||||
Freddie Mac Pool #SD8286 4.00% 1/1/20539 | 200 | 188 | ||||||
Freddie Mac Pool #SD8288 5.00% 1/1/20539 | 35 | 35 | ||||||
Freddie Mac Pool #SD8282 6.50% 1/1/20539 | 457 | 468 | ||||||
Freddie Mac Seasoned Credit Risk Transfer Trust, Series 2017-1, Class HA, 3.00% 1/25/20569,10 | 115 | 108 | ||||||
Freddie Mac Seasoned Credit Risk Transfer Trust, Series 2017-2, Class MA, 3.00% 8/25/20569 | 235 | 219 | ||||||
Freddie Mac Seasoned Credit Risk Transfer Trust, Series 2017-2, Class HA, 3.00% 8/25/20569,10 | 233 | 218 | ||||||
Freddie Mac Seasoned Credit Risk Transfer Trust, Series 2017-4, Class HT, 3.25% 6/25/20579,10 | 97 | 88 | ||||||
116 American Funds Insurance Series
Table of Contents
Capital Income Builder (continued)
Bonds, notes & other debt instruments (continued)
Principal amount | Value | |||||||
| (000) | (000) | |||||||
Mortgage-backed obligations (continued) | ||||||||
Federal agency mortgage-backed obligations (continued) | ||||||||
Freddie Mac Seasoned Credit Risk Transfer Trust, Series 2017-4, Class MT, 3.50% 6/25/20579 | USD80 | $ | 73 | |||||
Freddie Mac Seasoned Credit Risk Transfer Trust, Series 2018-3, Class MA, 3.50% 8/25/20579 | 20 | 19 | ||||||
Freddie Mac Seasoned Credit Risk Transfer Trust, Series 2019-1, Class MT, 3.50% 7/25/20589 | 1,001 | 905 | ||||||
Freddie Mac Seasoned Credit Risk Transfer Trust, Series 2019-1, Class MA, 3.50% 7/25/20589 | 408 | 386 | ||||||
Freddie Mac Seasoned Credit Risk Transfer Trust, Series 2019-2, Class MA, 3.50% 8/25/20589 | 629 | 594 | ||||||
Freddie Mac Seasoned Credit Risk Transfer Trust, Series 2019-3, Class MA, 3.50% 10/25/20589 | 18 | 17 | ||||||
Freddie Mac Seasoned Credit Risk Transfer Trust, Series 2019-3, Class MT, 3.50% 10/25/20589 | 10 | 9 | ||||||
Freddie Mac Seasoned Loan Structured Transaction Trust, Series 2018-2, Class A1, 3.50% 11/25/20289 | 922 | 881 | ||||||
Freddie Mac Seasoned Loan Structured Transaction Trust, Series 2019-2, Class A1C, 2.75% 9/25/20299 | 1,293 | 1,191 | ||||||
Government National Mortgage Assn. 4.00% 1/1/20539,11 | 3,400 | 3,218 | ||||||
Government National Mortgage Assn. 4.50% 1/1/20539,11 | 60 | 58 | ||||||
Government National Mortgage Assn. 5.00% 2/1/20539,11 | 8,731 | 8,652 | ||||||
Government National Mortgage Assn. 5.50% 2/1/20539,11 | 1,017 | 1,022 | ||||||
Government National Mortgage Assn. Pool #MA5764 4.50% 2/20/20499 | 454 | 441 | ||||||
Government National Mortgage Assn. Pool #MA8426 4.00% 11/20/20529 | 2,927 | 2,773 | ||||||
Government National Mortgage Assn. Pool #MA8427 4.50% 11/20/20529 | 1,054 | 1,024 | ||||||
Government National Mortgage Assn. Pool #MA8488 4.00% 12/20/20529 | 54 | 52 | ||||||
Government National Mortgage Assn. Pool #MA8489 4.50% 12/20/20529 | 300 | 291 | ||||||
Government National Mortgage Assn. Pool #694836 5.682% 9/20/20599 | — | 4 | — | 4 | ||||
Government National Mortgage Assn. Pool #765152 4.14% 7/20/20619 | — | 4 | — | 4 | ||||
Government National Mortgage Assn. Pool #766525 4.70% 11/20/20629 | — | 4 | — | 4 | ||||
Government National Mortgage Assn. Pool #AA7554 6.64% 7/20/20649 | 1 | 1 | ||||||
Government National Mortgage Assn. Pool #725893 5.20% 9/20/20649 | — | 4 | — | 4 | ||||
Uniform Mortgage-Backed Security 2.50% 1/1/20389,11 | 1,708 | 1,563 | ||||||
Uniform Mortgage-Backed Security 2.00% 1/1/20539,11 | 60 | 49 | ||||||
Uniform Mortgage-Backed Security 2.50% 1/1/20539,11 | 140 | 119 | ||||||
Uniform Mortgage-Backed Security 4.00% 1/1/20539,11 | 340 | 319 | ||||||
Uniform Mortgage-Backed Security 4.50% 1/1/20539,11 | 340 | 327 | ||||||
Uniform Mortgage-Backed Security 5.00% 1/1/20539,11 | 1,250 | 1,232 | ||||||
Uniform Mortgage-Backed Security 5.50% 1/1/20539,11 | 13,500 | 13,538 | ||||||
Uniform Mortgage-Backed Security 6.50% 1/1/20539,11 | 1,836 | 1,880 | ||||||
Uniform Mortgage-Backed Security 4.00% 2/1/20539,11 | 172 | 161 | ||||||
Uniform Mortgage-Backed Security 5.50% 2/1/20539,11 | 80 | 80 | ||||||
Uniform Mortgage-Backed Security 6.00% 2/1/20539,11 | 470 | 477 | ||||||
|
| |||||||
| 61,513 | ||||||||
|
| |||||||
Collateralized mortgage-backed obligations (privately originated) 0.42% | ||||||||
Arroyo Mortgage Trust, Series 2021-1R, Class A1, 1.175% 10/25/20481,9,10 | 141 | 112 | ||||||
BINOM Securitization Trust, Series 2022-RPL1, Class A1, 3.00% 2/25/20611,9,10 | 84 | 75 | ||||||
BRAVO Residential Funding Trust, Series 2022-RPL1, Class A1, 2.75% 9/25/20611,9 | 90 | 78 | ||||||
Cascade Funding Mortgage Trust, Series 2020-HB4, Class A, 0.946% 12/26/20301,9,10 | 71 | 69 | ||||||
Cascade Funding Mortgage Trust, Series 2021-HB7, Class A, 1.151% 10/27/20311,9,10 | 136 | 129 | ||||||
Cascade Funding Mortgage Trust, Series 2021-HB6, Class A, 0.898% 6/25/20361,9,10 | 104 | 99 | ||||||
CIM Trust, Series 2022-R2, Class A1, 3.75% 12/25/20611,9,10 | 185 | 175 | ||||||
Citigroup Mortgage Loan Trust, Series 2020-EXP1, Class A1A, 1.804% 5/25/20601,9,10 | 10 | 10 | ||||||
Connecticut Avenue Securities Trust, Series 2021-R01, Class 1M1, (30-day Average USD-SOFR + 0.75%) 4.678% 10/25/20411,9,10 | 4 | 4 | ||||||
Finance of America Structured Securities Trust, Series 2019-JR3, Class A, 2.00% 9/25/20691,9 | 59 | 61 | ||||||
Finance of America Structured Securities Trust, Series 2019-JR4, Class A, 2.00% 11/25/20691,9 | 67 | 66 | ||||||
American Funds Insurance Series 117
Table of Contents
Capital Income Builder (continued)
Bonds, notes & other debt instruments (continued)
Principal amount | Value | |||||||
| (000) | (000) | |||||||
Mortgage-backed obligations (continued) | ||||||||
Collateralized mortgage-backed obligations (privately originated) (continued) | ||||||||
Flagstar Mortgage Trust, Series 2021-10INV, Class A3, 2.50% 10/25/20511,9,10 | USD117 | $ | 95 | |||||
Freddie Mac Structured Agency Credit Risk Debt Notes, Series 2015-DNA3, Class M3, (1-month USD-LIBOR + 4.70%) 9.089% 4/25/20289,10 | 252 | 261 | ||||||
Freddie Mac Structured Agency Credit Risk Debt Notes, Series 2022-DNA3, Class M1A, (30-day Average USD-SOFR + 2.00%) 5.928% 4/25/20421,9,10 | 109 | 109 | ||||||
Freddie Mac Structured Agency Credit Risk Debt Notes, Series 2022-DNA4, Class M1A, (30-day Average USD-SOFR + 2.20%) 6.128% 5/25/20421,9,10 | 19 | 19 | ||||||
Freddie Mac Structured Agency Credit Risk Debt Notes, Series 2022-DNA6, Class M1A, (30-day Average USD-SOFR + 2.15%) 6.078% 9/25/20421,9,10 | 34 | 34 | ||||||
Freddie Mac Structured Agency Credit Risk Debt Notes, Series 2022-DNA6, Class M1B, (30-day Average USD-SOFR + 3.70%) 7.628% 9/25/20421,9,10 | 64 | 65 | ||||||
Freddie Mac Structured Agency Credit Risk Debt Notes, Series 2020-DNA1, Class M2, (1-month USD-LIBOR + 1.70%) 6.089% 1/25/20501,9,10 | 188 | 187 | ||||||
Freddie Mac Structured Agency Credit Risk Debt Notes, Series 2020-DNA2, Class M2, (1-month USD-LIBOR + 1.85%) 6.239% 2/25/20501,9,10 | 408 | 407 | ||||||
Freddie Mac Structured Agency Credit Risk Debt Notes, Series 2020-DNA3, Class B1, (1-month USD-LIBOR + 5.10%) 9.489% 6/27/20501,9,10 | 108 | 112 | ||||||
Freddie Mac Structured Agency Credit Risk Debt Notes, Series 2020-DNA4, Class B1, (1-month USD-LIBOR + 6.00%) 10.389% 8/25/20501,9,10 | 540 | 575 | ||||||
Home Partners of America Trust, Series 2022-1, Class A, 3.93% 4/17/20391,9 | 196 | 184 | ||||||
Legacy Mortgage Asset Trust, Series 2022-GS1, Class A1, 4.00% 2/25/2061 (7.00% on 4/25/2025)1,9,12 | 200 | 185 | ||||||
Legacy Mortgage Asset Trust, Series 2021-GS2, Class A1, 1.75% 4/25/20611,9,10 | 78 | 71 | ||||||
Legacy Mortgage Asset Trust, Series 2021-GS5, Class A1, 2.25% 7/25/2067 (5.25% on 11/25/2024)1,9,12 | 132 | 119 | ||||||
Mello Warehouse Securitization Trust, Series 2021-3, Class A, (1-month USD-LIBOR + 0.85%) 5.239% 11/25/20551,9,10 | 202 | 195 | ||||||
NewRez Warehouse Securitization Trust, Series 2021-1, Class A, (1-month USD-LIBOR + 0.75%) 5.139% 5/25/20551,9,10 | 281 | 277 | ||||||
Progress Residential Trust, Series 2022-SFR3, Class A, 3.20% 4/17/20391,9 | 100 | 91 | ||||||
Reverse Mortgage Investment Trust, Series 2021-HB1, Class A, 1.259% 11/25/20311,9,10 | 66 | 62 | ||||||
Towd Point Mortgage Trust, Series 2016-5, Class A1, 2.50% 10/25/20561,9,10 | 20 | 19 | ||||||
Towd Point Mortgage Trust, Series 2017-3, Class A1, 2.75% 7/25/20571,9,10 | 20 | 19 | ||||||
Towd Point Mortgage Trust, Series 2017-6, Class A1, 2.75% 10/25/20571,9,10 | 40 | 39 | ||||||
Towd Point Mortgage Trust, Series 2018-2, Class A1, 3.25% 3/25/20581,9,10 | 49 | 47 | ||||||
Towd Point Mortgage Trust, Series 2018-5, Class A1A, 3.25% 7/25/20581,9,10 | 24 | 23 | ||||||
Towd Point Mortgage Trust, Series 2020-4, Class A1, 1.75% 10/25/20601,9 | 472 | 420 | ||||||
Treehouse Park Improvement Association No.1 - Anleihen 9.75% 12/1/20331,2 | 100 | 89 | ||||||
Tricon Residential Trust, Series 2021-SFR1, Class A, 1.943% 7/17/20381,9 | 196 | 170 | ||||||
|
| |||||||
| 4,752 | ||||||||
|
| |||||||
Commercial mortgage-backed securities 0.31% | ||||||||
BOCA Commercial Mortgage Trust, Series 2022-BOCA, Class A, (1-month USD CME Term SOFR + 1.77%) 6.105% 5/15/20391,9,10 | 110 | 108 | ||||||
BPR Trust, Series 2022-OANA, Class A, (1-month USD CME Term SOFR + 1.898%) 6.234% 4/15/20371,9,10 | 329 | 322 | ||||||
BX Trust, Series 2022-CSMO, Class A, (1-month USD CME Term SOFR + 2.115%) 6.45% 6/15/20271,9,10 | 332 | 330 | ||||||
BX Trust, Series 2021-VOLT, Class A, (1-month USD-LIBOR + 0.70%) 5.018% 9/15/20361,9,10 | 548 | 529 | ||||||
BX Trust, Series 2021-ARIA, Class A, (1-month USD-LIBOR + 0.899%) 5.217% 10/15/20361,9,10 | 266 | 253 | ||||||
BX Trust, Series 2021-ARIA Class C, (1-month USD-LIBOR + 1.646%) 5.964% 10/15/20361,9,10 | 100 | 93 | ||||||
BX Trust, Series 2022-IND, Class A, (1-month USD CME Term SOFR + 1.491%) 5.827% 4/15/20371,9,10 | 155 | 152 | ||||||
BX Trust, Series 2021-SOAR, Class A, (1-month USD-LIBOR + 0.67%) 4.988% 6/15/20381,9,10 | 173 | 167 | ||||||
118 American Funds Insurance Series
Table of Contents
Capital Income Builder (continued)
Bonds, notes & other debt instruments (continued)
Principal amount (000) | Value (000) | |||||||
Mortgage-backed obligations (continued) | ||||||||
Commercial mortgage-backed securities (continued) | ||||||||
BX Trust, Series 2021-SOAR, Class D, (1-month USD-LIBOR + 1.40%) 5.718% 6/15/20381,9,10 | USD99 | $ | 94 | |||||
BX Trust, Series 2021-ACNT, Class C, (1-month USD-LIBOR + 1.50%) 5.818% 11/15/20381,9,10 | 100 | 95 | ||||||
BX Trust, Series 2022-PSB, Class A, (1-month USD CME Term SOFR + 2.451%) 6.787% 8/15/20391,9,10 | 99 | 99 | ||||||
Extended Stay America Trust, Series 2021-ESH, Class A, (1-month USD-LIBOR + 1.08%) 5.398% 7/15/20381,9,10 | 98 | 95 | ||||||
Great Wolf Trust, Series 2019-WOLF, Class A, (1-month USD-LIBOR + 1.034%) 5.352% 12/15/20361,9,10 | 24 | 23 | ||||||
GS Mortgage Securities Trust, Series 2018-HULA, Class A, 5.238% 7/15/20251,9,10 | 229 | 223 | ||||||
Hawaii Hotel Trust, Series 2019-MAUI, Class A, (1-month USD-LIBOR + 1.15%) 5.468% 5/17/20381,9,10 | 300 | 292 | ||||||
JPMorgan Chase Commercial Mortgage Securities Trust, Series 2022-OPO, Class C, 3.565% 1/5/20391,9,10 | 100 | 78 | ||||||
La Quinta Mortgage Trust, Series 2022-LAQ, Class A, (1-month USD CME Term SOFR + 1.724%) 6.059% 3/15/20391,9,10 | 50 | 49 | ||||||
LUXE Commercial Mortgage Trust, Series 2021-TRIP, Class A, (1-month USD-LIBOR + 1.05%) 5.368% 10/15/20381,9,10 | 62 | 59 | ||||||
Multifamily Connecticut Avenue Securities, Series 2019-1, Class M10, (1-month USD-LIBOR + 3.25%) 7.639% 10/15/20491,9,10 | 141 | 133 | ||||||
SREIT Trust, Series 2021-MFP, Class A, (1-month USD-LIBOR + 0.731%) 5.049% 11/15/20381,9,10 | 361 | 348 | ||||||
|
| |||||||
| 3,542 | ||||||||
|
| |||||||
Total mortgage-backed obligations | 69,807 | |||||||
|
| |||||||
Corporate bonds, notes & loans 1.72% | ||||||||
Health care 0.28% | ||||||||
AbbVie, Inc. 3.20% 11/21/2029 | 25 | 23 | ||||||
AbbVie, Inc. 4.25% 11/21/2049 | 39 | 33 | ||||||
Amgen, Inc. 4.05% 8/18/2029 | 145 | 136 | ||||||
Amgen, Inc. 4.20% 3/1/2033 | 133 | 123 | ||||||
Amgen, Inc. 4.20% 2/22/2052 | 19 | 15 | ||||||
Amgen, Inc. 4.875% 3/1/2053 | 45 | 40 | ||||||
AstraZeneca PLC 3.375% 11/16/2025 | 200 | 193 | ||||||
AstraZeneca PLC 3.00% 5/28/2051 | 11 | 8 | ||||||
Centene Corp. 4.625% 12/15/2029 | 530 | 486 | ||||||
Centene Corp. 3.375% 2/15/2030 | 179 | 152 | ||||||
Centene Corp. 2.625% 8/1/2031 | 40 | 31 | ||||||
Gilead Sciences, Inc. 1.65% 10/1/2030 | 8 | 6 | ||||||
HCA, Inc. 2.375% 7/15/2031 | 18 | 14 | ||||||
Humana, Inc. 3.70% 3/23/2029 | 12 | 11 | ||||||
Merck & Co., Inc. 1.70% 6/10/2027 | 118 | 105 | ||||||
Merck & Co., Inc. 3.40% 3/7/2029 | 110 | 103 | ||||||
Regeneron Pharmaceuticals, Inc. 1.75% 9/15/2030 | 8 | 6 | ||||||
Regeneron Pharmaceuticals, Inc. 2.80% 9/15/2050 | 2 | 1 | ||||||
Shire PLC 3.20% 9/23/2026 | 270 | 254 | ||||||
Teva Pharmaceutical Finance Co. BV 6.00% 4/15/2024 | 700 | 687 | ||||||
Teva Pharmaceutical Finance Co. BV 3.15% 10/1/2026 | 650 | 570 | ||||||
Teva Pharmaceutical Finance Co. BV 4.10% 10/1/2046 | 300 | 184 | ||||||
Zoetis, Inc. 5.60% 11/16/2032 | 25 | 26 | ||||||
|
| |||||||
| 3,207 | ||||||||
|
| |||||||
Energy 0.27% | ||||||||
Apache Corp. 4.25% 1/15/2030 | 385 | 341 | ||||||
Baker Hughes Holdings, LLC 2.061% 12/15/2026 | 8 | 7 | ||||||
BP Capital Markets America, Inc. 3.633% 4/6/2030 | 360 | 331 | ||||||
Cenovus Energy, Inc. 5.40% 6/15/2047 | 73 | 66 | ||||||
EQT Corp. 5.00% 1/15/2029 | 35 | 33 | ||||||
EQT Corp. 3.625% 5/15/20311 | 20 | 17 | ||||||
American Funds Insurance Series 119
Table of Contents
Capital Income Builder (continued)
Bonds, notes & other debt instruments (continued)
Principal amount (000) | Value (000) | |||||||
Corporate bonds, notes & loans (continued) | ||||||||
Energy (continued) | ||||||||
Equinor ASA 2.375% 5/22/2030 | USD365 | $ | 311 | |||||
Exxon Mobil Corp. 2.995% 8/16/2039 | 200 | 154 | ||||||
Exxon Mobil Corp. 3.452% 4/15/2051 | 25 | 19 | ||||||
Kinder Morgan, Inc. 5.45% 8/1/2052 | 11 | 10 | ||||||
MPLX, LP 4.95% 9/1/2032 | 20 | 19 | ||||||
MPLX, LP 4.95% 3/14/2052 | 20 | 16 | ||||||
New Fortress Energy, Inc. 6.50% 9/30/20261 | 80 | 75 | ||||||
NGL Energy Operating, LLC 7.50% 2/1/20261 | 80 | 71 | ||||||
ONEOK, Inc. 3.10% 3/15/2030 | 42 | 35 | ||||||
ONEOK, Inc. 7.15% 1/15/2051 | 97 | 99 | ||||||
Pemex Project Funding Master Trust, Series 13, 6.625% 6/15/2035 | 150 | 109 | ||||||
Petróleos Mexicanos 6.50% 1/23/2029 | 20 | 17 | ||||||
Petróleos Mexicanos 8.75% 6/2/2029 | 177 | 166 | ||||||
Sabine Pass Liquefaction, LLC 4.50% 5/15/2030 | 142 | 132 | ||||||
Shell International Finance BV 2.00% 11/7/2024 | 420 | 400 | ||||||
TransCanada Corp. 5.875% 8/15/2076 (3-month USD-LIBOR + 4.64% on 8/15/2026)12 | 540 | 515 | ||||||
TransCanada PipeLines, Ltd. 5.10% 3/15/2049 | 150 | 137 | ||||||
Williams Companies, Inc. 5.30% 8/15/2052 | 40 | 36 | ||||||
|
| |||||||
| 3,116 | ||||||||
|
| |||||||
Communication services 0.24% | ||||||||
América Móvil, SAB de CV, 8.46% 12/18/2036 | MXN1,300 | 58 | ||||||
AT&T, Inc. 3.50% 6/1/2041 | USD75 | 56 | ||||||
CCO Holdings, LLC 4.25% 2/1/20311 | 360 | 290 | ||||||
CCO Holdings, LLC 4.75% 2/1/20321 | 25 | 20 | ||||||
CCO Holdings, LLC 4.25% 1/15/20341 | 175 | 130 | ||||||
Charter Communications Operating, LLC 3.70% 4/1/2051 | 25 | 15 | ||||||
Meta Platforms, Inc. 3.85% 8/15/2032 | 160 | 141 | ||||||
Meta Platforms, Inc. 4.45% 8/15/2052 | 95 | 76 | ||||||
Netflix, Inc. 4.875% 4/15/2028 | 150 | 145 | ||||||
SBA Tower Trust 1.631% 11/15/20261 | 253 | 215 | ||||||
Sprint Corp. 6.875% 11/15/2028 | 325 | 338 | ||||||
Sprint Corp. 8.75% 3/15/2032 | 90 | 107 | ||||||
T-Mobile US, Inc. 3.875% 4/15/2030 | 625 | 568 | ||||||
T-Mobile US, Inc. 2.55% 2/15/2031 | 253 | 207 | ||||||
Verizon Communications, Inc. 1.75% 1/20/2031 | 142 | 111 | ||||||
Walt Disney Company 4.625% 3/23/2040 | 120 | 113 | ||||||
WarnerMedia Holdings, Inc. 4.279% 3/15/20321 | 56 | 46 | ||||||
WarnerMedia Holdings, Inc. 5.05% 3/15/20421 | 47 | 36 | ||||||
WarnerMedia Holdings, Inc. 5.141% 3/15/20521 | 88 | 64 | ||||||
|
| |||||||
| 2,736 | ||||||||
|
| |||||||
Utilities 0.23% | ||||||||
AEP Transmission Co., LLC 3.80% 6/15/2049 | 45 | 35 | ||||||
Duke Energy Florida, LLC 5.95% 11/15/2052 | 25 | 27 | ||||||
Edison International 4.125% 3/15/2028 | 132 | 123 | ||||||
Edison International 6.95% 11/15/2029 | 25 | 26 | ||||||
FirstEnergy Corp. 2.65% 3/1/2030 | 493 | 403 | ||||||
FirstEnergy Corp. 2.25% 9/1/2030 | 107 | 85 | ||||||
ITC Holdings Corp. 3.35% 11/15/2027 | 25 | 23 | ||||||
Pacific Gas and Electric Co. 3.25% 2/16/2024 | 1,025 | 1,001 | ||||||
Pacific Gas and Electric Co. 2.95% 3/1/2026 | 97 | 89 | ||||||
Pacific Gas and Electric Co. 3.75% 7/1/2028 | 105 | 93 | ||||||
Pacific Gas and Electric Co. 4.65% 8/1/2028 | 284 | 262 | ||||||
Pacific Gas and Electric Co. 2.50% 2/1/2031 | 375 | 292 | ||||||
Southern California Edison Co., Series C, 3.60% 2/1/2045 | 206 | 149 | ||||||
Union Electric Co. 3.90% 4/1/2052 | 25 | 20 | ||||||
WEC Energy Group, Inc. 5.15% 10/1/2027 | 25 | 25 | ||||||
|
| |||||||
| 2,653 | ||||||||
|
| |||||||
120 American Funds Insurance Series
Table of Contents
Capital Income Builder (continued)
Bonds, notes & other debt instruments (continued)
Principal amount (000) | Value (000) | |||||||
Corporate bonds, notes & loans (continued) | ||||||||
Financials 0.20% | ||||||||
AerCap Ireland Capital DAC 3.30% 1/30/2032 | USD150 | $ | 118 | |||||
American Express Co. 4.42% 8/3/2033 (USD-SOFR + 1.76% on 8/3/2032)12 | 82 | 78 | ||||||
Bank of America Corp. 4.948% 7/22/2028 (USD-SOFR + 2.04% on 7/22/2027)12 | 40 | 39 | ||||||
Bank of America Corp. 1.922% 10/24/2031 (USD-SOFR + 1.37% on 10/24/2030)12 | 231 | 177 | ||||||
Bank of America Corp. 5.015% 7/22/2033 (USD-SOFR + 2.16% on 7/22/2032)12 | 84 | 80 | ||||||
Charles Schwab Corp. 2.45% 3/3/2027 | 25 | 23 | ||||||
Citigroup, Inc. 3.057% 1/25/2033 (USD-SOFR + 1.351% on 1/25/2032)12 | 35 | 28 | ||||||
CME Group, Inc. 2.65% 3/15/2032 | 50 | 42 | ||||||
Corebridge Financial, Inc. 3.85% 4/5/20291 | 180 | 164 | ||||||
Corebridge Financial, Inc. 3.90% 4/5/20321 | 32 | 28 | ||||||
Corebridge Financial, Inc. 4.35% 4/5/20421 | 7 | 6 | ||||||
Corebridge Financial, Inc. 4.40% 4/5/20521 | 49 | 39 | ||||||
Credit Suisse Group AG 9.016% 11/15/2033 (USD-SOFR + 5.02% on 11/15/2032)1,12 | 250 | 257 | ||||||
Danske Bank AS 4.298% 4/1/2028 (1-year UST Yield Curve Rate T Note Constant Maturity + 1.75% on 4/1/2027)1,12 | 200 | 184 | ||||||
Discover Financial Services 6.70% 11/29/2032 | 25 | 25 | ||||||
Goldman Sachs Group, Inc. 2.65% 10/21/2032 (USD-SOFR + 1.264% on 10/21/2031)12 | 75 | 59 | ||||||
Goldman Sachs Group, Inc. 3.102% 2/24/2033 (USD-SOFR + 1.41% on 2/24/2032)12 | 40 | 33 | ||||||
Intercontinental Exchange, Inc. 4.60% 3/15/2033 | 18 | 17 | ||||||
Intercontinental Exchange, Inc. 4.95% 6/15/2052 | 16 | 15 | ||||||
JPMorgan Chase & Co. 5.546% 12/15/2025 (USD-SOFR + 1.07% on 12/15/2024)12 | 100 | 100 | ||||||
JPMorgan Chase & Co. 4.851% 7/25/2028 (USD-SOFR + 1.99% on 7/25/2027)12 | 40 | 39 | ||||||
JPMorgan Chase & Co. 1.953% 2/4/2032 (USD-SOFR + 1.065% on 2/4/2031)12 | 227 | 174 | ||||||
JPMorgan Chase & Co. 2.963% 1/25/2033 (USD-SOFR + 1.26% on 1/25/2032)12 | 17 | 14 | ||||||
JPMorgan Chase & Co. 4.912% 7/25/2033 (USD-SOFR + 2.08% on 7/25/2032)12 | 25 | 24 | ||||||
Morgan Stanley 4.889% 7/20/2033 (USD-SOFR + 2.077% on 7/20/2032)12 | 20 | 19 | ||||||
Navient Corp. 5.00% 3/15/2027 | 150 | 132 | ||||||
New York Life Global Funding 3.00% 1/10/20281 | 150 | 138 | ||||||
SVB Financial Group 4.70% junior subordinated perpetual bonds (5-year UST Yield Curve Rate T Note Constant Maturity + 3.064% on 11/15/2031)12 | 38 | 24 | ||||||
Wells Fargo & Company 4.808% 7/25/2028 (USD-SOFR + 1.98% on 7/25/2027)12 | 45 | 44 | ||||||
Wells Fargo & Company 3.35% 3/2/2033 (USD-SOFR + 1.50% on 3/2/2032)12 | 105 | 89 | ||||||
Wells Fargo & Company 4.897% 7/25/2033 (USD-SOFR + 4.897% on 7/25/2032)12 | 35 | 33 | ||||||
|
| |||||||
| 2,242 | ||||||||
|
| |||||||
Consumer discretionary 0.19% | ||||||||
Bayerische Motoren Werke AG 3.45% 4/1/20271 | 25 | 23 | ||||||
Bayerische Motoren Werke AG 4.15% 4/9/20301 | 290 | 276 | ||||||
Bayerische Motoren Werke AG 3.70% 4/1/20321 | 25 | 22 | ||||||
Daimler Trucks Finance North America, LLC 1.125% 12/14/20231 | 495 | 476 | ||||||
Daimler Trucks Finance North America, LLC 1.625% 12/13/20241 | 175 | 162 | ||||||
Daimler Trucks Finance North America, LLC 2.375% 12/14/20281 | 150 | 126 | ||||||
Daimler Trucks Finance North America, LLC 2.50% 12/14/20311 | 150 | 117 | ||||||
Ford Motor Co. 2.30% 2/10/2025 | 200 | 183 | ||||||
Ford Motor Credit Company, LLC 5.125% 6/16/2025 | 200 | 193 | ||||||
Grand Canyon University 4.125% 10/1/2024 | 200 | 188 | ||||||
McDonald’s Corp. 4.60% 9/9/2032 | 15 | 15 | ||||||
McDonald’s Corp. 5.15% 9/9/2052 | 10 | 10 | ||||||
Royal Caribbean Cruises, Ltd. 11.50% 6/1/20251 | 160 | 172 | ||||||
Toyota Motor Credit Corp. 5.40% 11/10/2025 | 228 | 232 | ||||||
|
| |||||||
| 2,195 | ||||||||
|
| |||||||
Industrials 0.10% | ||||||||
Ashtead Capital, Inc. 5.50% 8/11/20321 | 200 | 192 | ||||||
Boeing Company 4.508% 5/1/2023 | 270 | 270 | ||||||
Boeing Company 2.75% 2/1/2026 | 91 | 84 | ||||||
Boeing Company 3.625% 2/1/2031 | 280 | 246 | ||||||
Boeing Company 5.805% 5/1/2050 | 95 | 89 | ||||||
American Funds Insurance Series 121
Table of Contents
Capital Income Builder (continued)
Bonds, notes & other debt instruments (continued)
Principal amount (000) | Value (000) | |||||||
Corporate bonds, notes & loans (continued) | ||||||||
Industrials (continued) | ||||||||
Canadian Pacific Railway, Ltd. 2.45% 12/2/2031 | USD78 | $ | 65 | |||||
Canadian Pacific Railway, Ltd. 3.10% 12/2/2051 | 102 | 69 | ||||||
CSX Corp. 4.75% 11/15/2048 | 50 | 45 | ||||||
CSX Corp. 4.50% 11/15/2052 | 35 | 31 | ||||||
Lockheed Martin Corp. 5.10% 11/15/2027 | 19 | 19 | ||||||
Masco Corp. 3.125% 2/15/2051 | 10 | 6 | ||||||
Union Pacific Corp. 2.80% 2/14/2032 | 17 | 15 | ||||||
Union Pacific Corp. 3.50% 2/14/2053 | 20 | 15 | ||||||
|
| |||||||
| 1,146 | ||||||||
|
| |||||||
Consumer staples 0.09% | ||||||||
7-Eleven, Inc. 0.80% 2/10/20241 | 50 | 48 | ||||||
7-Eleven, Inc. 1.30% 2/10/20281 | 30 | 25 | ||||||
7-Eleven, Inc. 1.80% 2/10/20311 | 207 | 159 | ||||||
Altria Group, Inc. 3.875% 9/16/2046 | 22 | 15 | ||||||
Altria Group, Inc. 3.70% 2/4/2051 | 28 | 18 | ||||||
Anheuser-Busch InBev NV 4.50% 6/1/2050 | 20 | 18 | ||||||
British American Tobacco PLC 4.70% 4/2/2027 | 105 | 101 | ||||||
British American Tobacco PLC 4.448% 3/16/2028 | 150 | 139 | ||||||
British American Tobacco PLC 4.54% 8/15/2047 | 82 | 58 | ||||||
British American Tobacco PLC 4.758% 9/6/2049 | 121 | 88 | ||||||
Kraft Heinz Company 3.00% 6/1/2026 | 93 | 87 | ||||||
Kraft Heinz Company 4.875% 10/1/2049 | 170 | 148 | ||||||
Kraft Heinz Company 5.50% 6/1/2050 | 75 | 72 | ||||||
Philip Morris International, Inc. 5.125% 11/17/2027 | 43 | 43 | ||||||
Philip Morris International, Inc. 5.625% 11/17/2029 | 23 | 23 | ||||||
Philip Morris International, Inc. 5.75% 11/17/2032 | 16 | 16 | ||||||
|
| |||||||
| 1,058 | ||||||||
|
| |||||||
Information technology 0.07% | ||||||||
Apple, Inc. 3.35% 8/8/2032 | 20 | 18 | ||||||
Apple, Inc. 3.95% 8/8/2052 | 20 | 17 | ||||||
Broadcom, Inc. 4.00% 4/15/20291 | 3 | 3 | ||||||
Broadcom, Inc. 4.15% 4/15/20321 | 11 | 10 | ||||||
Broadcom, Inc. 3.137% 11/15/20351 | 2 | 1 | ||||||
Broadcom, Inc. 3.75% 2/15/20511 | 91 | 63 | ||||||
Lenovo Group, Ltd. 5.875% 4/24/2025 | 400 | 390 | ||||||
Oracle Corp. 2.875% 3/25/2031 | 64 | 53 | ||||||
Oracle Corp. 3.60% 4/1/2050 | 150 | 102 | ||||||
ServiceNow, Inc. 1.40% 9/1/2030 | 130 | 100 | ||||||
|
| |||||||
| 757 | ||||||||
|
| |||||||
Materials 0.03% | ||||||||
Celanese US Holdings, LLC 6.379% 7/15/2032 | 10 | 9 | ||||||
Dow Chemical Co. 3.60% 11/15/2050 | 75 | 54 | ||||||
International Flavors & Fragrances, Inc. 1.832% 10/15/20271 | 100 | 84 | ||||||
International Flavors & Fragrances, Inc. 3.468% 12/1/20501 | 10 | 7 | ||||||
LYB International Finance III, LLC 3.625% 4/1/2051 | 102 | 69 | ||||||
Nutrien, Ltd. 5.90% 11/7/2024 | 84 | 85 | ||||||
South32 Treasury, Ltd. 4.35% 4/14/20321 | 10 | 9 | ||||||
|
| |||||||
| 317 | ||||||||
|
| |||||||
Real estate 0.02% | ||||||||
American Tower Corp. 4.05% 3/15/2032 | 11 | 10 | ||||||
Equinix, Inc. 1.55% 3/15/2028 | 25 | 21 | ||||||
Equinix, Inc. 3.20% 11/18/2029 | 144 | 125 | ||||||
Equinix, Inc. 2.50% 5/15/2031 | 47 | 38 | ||||||
| 194 | ||||||||
|
| |||||||
Total corporate bonds, notes & loans | 19,621 | |||||||
|
| |||||||
122 American Funds Insurance Series
Table of Contents
Capital Income Builder (continued)
Bonds, notes & other debt instruments (continued)
Principal amount (000) | Value (000) | |||||||
Asset-backed obligations 0.84% | ||||||||
Affirm Asset Securitization Trust, Series 2022-X1, Class A, 1.75% 2/15/20271,9 | USD96 | $ | 93 | |||||
American Express Credit Account Master Trust, Series 2022-3, Class A, 3.75% 8/16/20279 | 100 | 98 | ||||||
American Homes 4 Rent, Series 2014-SFR2, Class A, 3.786% 10/17/20361,9 | 86 | 83 | ||||||
American Homes 4 Rent, Series 2015-SFR2, Class A, 3.732% 10/17/20521,9 | 87 | 83 | ||||||
American Homes 4 Rent, Series 2015-SFR2, Class B, 4.295% 10/17/20521,9 | 100 | 95 | ||||||
AmeriCredit Automobile Receivables Trust, Series 2022-2, Class A2B, (30-day Average USD-SOFR + 1.15%) 4.958% 12/18/20259,10 | 132 | 132 | ||||||
Avis Budget Rental Car Funding (AESOP), LLC, Series 2020-2, Class A, 2.02% 2/20/20271,9 | 197 | 179 | ||||||
Avis Budget Rental Car Funding (AESOP), LLC, Series 2020-2A, Class B, 2.96% 2/20/20271,9 | 100 | 90 | ||||||
Bankers Healthcare Group Securitization Trust, Series 2022-A, Class A, 1.71% 2/20/20351,9 | 69 | 64 | ||||||
CarMax Auto Owner Trust, Series 2022-3, Class A2B, (30-day Average USD-SOFR + 0.77%) 4.577% 9/15/20259,10 | 103 | 103 | ||||||
CF Hippolyta, LLC, Series 2020-1, Class A1, 1.69% 7/15/20601,9 | 354 | 317 | ||||||
CF Hippolyta, LLC, Series 2020-1, Class A2, 1.99% 7/15/20601,9 | 89 | 73 | ||||||
CF Hippolyta, LLC, Series 2020-1, Class B1, 2.28% 7/15/20601,9 | 91 | 79 | ||||||
CF Hippolyta, LLC, Series 2020-1, Class B2, 2.60% 7/15/20601,9 | 91 | 72 | ||||||
CF Hippolyta, LLC, Series 2021-1, Class A1, 1.53% 3/15/20611,9 | 319 | 276 | ||||||
CF Hippolyta, LLC, Series 2022-1, Class A1, 5.97% 8/15/20621,9 | 493 | 483 | ||||||
Exeter Automobile Receivables Trust, Series 2022-3A, Class A2, 3.45% 8/15/20249 | 36 | 36 | ||||||
Exeter Automobile Receivables Trust, Series 2022-4A, Class A2, 3.99% 8/15/20249 | 44 | 44 | ||||||
FirstKey Homes Trust, Series 2022-SFR2, Class A, 4.145% 5/17/20391,9 | 131 | 123 | ||||||
Ford Credit Auto Owner Trust, Series 2022-B, Class A2B, (30-day Average USD-SOFR + 0.60%) 4.407% 2/15/20259,10 | 70 | 70 | ||||||
Freedom Financial, Series 2022-1FP, Class A, 0.94% 3/19/20291,9 | 7 | 7 | ||||||
GCI Funding I, LLC, Series 2020-1, Class A, 2.82% 10/18/20451,9 | 506 | 447 | ||||||
GCI Funding I, LLC, Series 2021-1, Class A, 2.38% 6/18/20461,9 | 85 | 72 | ||||||
Global SC Finance V SRL, Series 2019-1A, Class B, 4.81% 9/17/20391,9 | 133 | 125 | ||||||
GM Financial Automobile Leasing Trust, Series 2022-3, Class A2B, (30-day Average USD-SOFR + 0.71%) 4.536% 10/21/20249,10 | 76 | 76 | ||||||
GM Financial Consumer Automobile Receivables Trust, Series 2022-3, Class A2B, (30-day Average USD-SOFR + 0.60%) 4.408% 9/16/20259,10 | 78 | 78 | ||||||
GM Financial Revolving Receivables Trust, Series 2022-1, Class A, 5.91% 10/11/20351,9 | 184 | 188 | ||||||
Hertz Vehicle Financing III, LLC, Series 2021-1A, Class A, 1.21% 12/26/20251,9 | 247 | 228 | ||||||
Hertz Vehicle Financing III, LLC, Series 2021-1A, Class B, 1.56% 12/26/20251,9 | 100 | 92 | ||||||
Hertz Vehicle Financing III, LLC, Series 2021-2A, Class A, 1.68% 12/27/20271,9 | 268 | 234 | ||||||
Hertz Vehicle Financing III, LLC, Series 2021-2A, Class B, 2.12% 12/27/20271,9 | 100 | 86 | ||||||
Hertz Vehicle Financing III, LLC, Series 2021-2A, Class C, 2.52% 12/27/20271,9 | 100 | 83 | ||||||
Hyundai Auto Receivables Trust, Series 2022-B, Class A2B, (30-day Average USD-SOFR + 0.58%) 4.387% 5/15/20259,10 | 100 | 100 | ||||||
Navient Student Loan Trust, Series 2021-A, Class A, 0.84% 5/15/20691,9 | 46 | 40 | ||||||
Navient Student Loan Trust, Series 2021-C, Class A, 1.06% 10/15/20691,9 | 143 | 122 | ||||||
Nelnet Student Loan Trust, Series 2021-A, Class APT1, 1.36% 4/20/20621,9 | 211 | 187 | ||||||
Nelnet Student Loan Trust, Series 2021-B, Class AFX, 1.42% 4/20/20621,9 | 423 | 376 | ||||||
Nelnet Student Loan Trust, Series 2021-C, Class AFL, (1-month USD-LIBOR + 0.74%) 5.093% 4/20/20621,9,10 | 218 | 212 | ||||||
New Economy Assets Phase 1 Issuer, LLC, Series 2021-1, Class A1, 1.91% 10/20/20611,9 | 935 | 792 | ||||||
Nissan Auto Lease Trust, Series 2021-A, Class A3, 0.52% 8/15/20249 | 199 | 194 | ||||||
Nissan Auto Lease Trust, Series 2022-A, Class A2B, (30-day Average USD-SOFR + 0.68%) 4.487% 8/15/20249,10 | 236 | 236 | ||||||
OnDeck Asset Securitization Trust, LLC, Series 2021-1A, Class A, 1.59% 5/17/20271,9 | 100 | 92 | ||||||
Oportun Funding, LLC, Series 2021-B, Class A, 1.47% 5/8/20311,9 | 100 | 87 | ||||||
PFS Financing Corp., Series 2022-D, Class A, 4.27% 8/16/20271,9 | 100 | 98 | ||||||
Santander Drive Auto Receivables Trust, Series 2022-4, Class A2, 4.05% 7/15/20259 | 158 | 158 | ||||||
Santander Drive Auto Receivables Trust, Series 2022-7, Class A2, 5.81% 1/15/20269 | 577 | 578 | ||||||
SMB Private Education Loan Trust, Series 2021-A, Class APT2, 1.07% 1/15/20531,9 | 73 | 62 | ||||||
American Funds Insurance Series 123
Table of Contents
Capital Income Builder (continued)
Bonds, notes & other debt instruments (continued)
Principal amount (000) | Value (000) | |||||||
Asset-backed obligations (continued) | ||||||||
Stonepeak Infrastructure Partners, Series 2021-1A, Class AA, 2.301% 2/28/20331,9 | USD211 | $ | 188 | |||||
Toyota Auto Loan Extended Note Trust, Series 2021-1, Class A, 1.07% 2/27/20341,9,10 | 335 | 297 | ||||||
Toyota Auto Receivables Owner Trust, Series 2022-C, Class A2B, (1-month USD-SOFR + 0.57%) 4.377% 8/15/20259,10 | 27 | 27 | ||||||
Verizon Master Trust, Series 2022-3, Class A, 3.01% 5/20/2027 (3.76% on 11/20/2023)9,12 | 160 | 157 | ||||||
Verizon Master Trust, Series 2022-7, Class A1A, 5.23% 11/22/2027 (5.98% on 11/20/2024)9,12 | 451 | 454 | ||||||
Volkswagen Auto Lease Trust, Series 2022-A, Class A2, 3.02% 10/21/20249 | 102 | 100 | ||||||
Westlake Automobile Receivables Trust, Series 2022-2A, Class A2A, 3.36% 8/15/20251,9 | 492 | 487 | ||||||
Westlake Automobile Receivables Trust, Series 2022-3, Class C, 5.49% 7/15/20261,9 | 80 | 79 | ||||||
Westlake Automobile Receivables Trust, Series 2022-3, Class B, 5.99% 12/15/20271,9 | 100 | 100 | ||||||
|
| |||||||
| 9,532 | ||||||||
|
| |||||||
Bonds & notes of governments & government agencies outside the U.S. 0.07% | ||||||||
Peru (Republic of) 2.783% 1/23/2031 | 190 | 158 | ||||||
Portuguese Republic 5.125% 10/15/2024 | 18 | 18 | ||||||
Qatar (State of) 4.50% 4/23/2028 | 200 | 201 | ||||||
Saudi Arabia (Kingdom of) 3.625% 3/4/2028 | 200 | 191 | ||||||
United Mexican States 3.25% 4/16/2030 | 200 | 175 | ||||||
|
| |||||||
| 743 | ||||||||
|
| |||||||
Municipals 0.02% | ||||||||
California 0.00% | ||||||||
Golden State Tobacco Securitization Corp., Enhanced Tobacco Settlement Asset-Backed Bonds, Series 2021-B, 2.746% 6/1/2034 | 15 | 12 | ||||||
|
| |||||||
Illinois 0.02% | ||||||||
G.O. Bonds, Pension Funding, Series 2003, 5.10% 6/1/2033 | 225 | 216 | ||||||
|
| |||||||
Total municipals | 228 | |||||||
|
| |||||||
Total bonds, notes & other debt instruments (cost: $218,921,000) | 207,479 | |||||||
|
| |||||||
Short-term securities 7.36% | ||||||||
| Shares | ||||||||
Money market investments 6.84% | ||||||||
Capital Group Central Cash Fund 4.31%6,13 | 779,601 | 77,952 | ||||||
|
| |||||||
Money market investments purchased with collateral from securities on loan 0.52% | ||||||||
Goldman Sachs Financial Square Government Fund, Institutional Shares 4.15%13,14 | 2,241,328 | 2,241 | ||||||
Invesco Short-Term Investments Trust – Government & Agency Portfolio, Institutional Class 4.22%13,14 | 1,944,356 | 1,945 | ||||||
Capital Group Central Cash Fund 4.31%6,13,14 | 17,119 | 1,712 | ||||||
|
| |||||||
| 5,898 | ||||||||
|
| |||||||
Total short-term securities (cost: $83,839,000) | 83,850 | |||||||
|
| |||||||
Total investment securities 102.99% (cost: $1,046,428,000) | 1,173,072 | |||||||
Other assets less liabilities (2.99)% | (34,006 | ) | ||||||
|
| |||||||
Net assets 100.00% | $ | 1,139,066 | ||||||
|
| |||||||
124 American Funds Insurance Series
Table of Contents
Capital Income Builder (continued)
Futures contracts
Contracts | Type | Number of contracts | Expiration | Notional amount (000) | Value and unrealized appreciation (depreciation) at 12/31/2022 (000) | |||||||||||||||
2 Year U.S. Treasury Note Futures | Long | 203 | March 2023 | USD41,631 | $ | 49 | ||||||||||||||
5 Year U.S. Treasury Note Futures | Long | 357 | March 2023 | 38,531 | (52 | ) | ||||||||||||||
10 Year Ultra U.S. Treasury Note Futures | Long | 7 | March 2023 | 828 | (12 | ) | ||||||||||||||
10 Year U.S. Treasury Note Futures | Short | 14 | March 2023 | (1,572) | 11 | |||||||||||||||
20 Year U.S. Treasury Bond Futures | Long | 9 | March 2023 | 1,128 | (13 | ) | ||||||||||||||
30 Year Ultra U.S. Treasury Bond Futures | Long | 61 | March 2023 | 8,193 | (62 | ) | ||||||||||||||
|
| |||||||||||||||||||
| $ | (79 | ) | ||||||||||||||||||
|
| |||||||||||||||||||
Swap contracts
Interest rate swaps
Centrally cleared interest rate swaps
Receive | Pay | Expiration date | Notional amount (000) | Value at 12/31/2022 (000) | Upfront premium paid (000) | Unrealized (depreciation) appreciation at 12/31/2022 (000) | ||||||||||||||||||||||||||
Rate | Payment frequency | Rate | Payment frequency | |||||||||||||||||||||||||||||
3.52647% | Annual | U.S. EFFR | Annual | 6/16/2024 | USD5,215 | $ | (90 | ) | $ | — | $ | (90 | ) | |||||||||||||||||||
3.5291% | Annual | U.S. EFFR | Annual | 6/16/2024 | 5,635 | (98 | ) | — | (98 | ) | ||||||||||||||||||||||
3.497% | Annual | U.S. EFFR | Annual | 6/16/2024 | 5,600 | (99 | ) | — | (99 | ) | ||||||||||||||||||||||
3.4585% | Annual | U.S. EFFR | Annual | 6/17/2024 | 898 | (17 | ) | — | (17 | ) | ||||||||||||||||||||||
3.4325% | Annual | U.S. EFFR | Annual | 6/17/2024 | 4,100 | (76 | ) | — | (76 | ) | ||||||||||||||||||||||
3-month USD-LIBOR | Quarterly | 0.5935 | % | Semi-annual | 5/18/2030 | 7,200 | 1,512 | — | 1,512 | |||||||||||||||||||||||
3-month USD-LIBOR | Quarterly | 0.807 | % | Semi-annual | 5/18/2050 | 805 | 388 | — | 388 | |||||||||||||||||||||||
|
|
|
|
|
| |||||||||||||||||||||||||||
| $ | 1,520 | $ | — | $ | 1,520 | |||||||||||||||||||||||||||
|
|
|
|
|
| |||||||||||||||||||||||||||
Credit default swaps
Centrally cleared credit default swaps on credit indices – sell protection
Financing rate received | Payment frequency | Reference index | Expiration date | Notional amount15 (000) | Value at 12/31/202216 (000) | Upfront premium paid (000) | Unrealized depreciation at 12/31/2022 (000) | |||||||||||||||||||
5.00% | Quarterly | CDX.NA.HY.38 | 6/20/2027 | USD6,138 | $ | 127 | $ | 174 | $ | (47 | ) | |||||||||||||||
American Funds Insurance Series 125
Table of Contents
Capital Income Builder (continued)
Investments in affiliates6
| Value of affiliates at 1/1/2022 (000) | Additions (000) | Reductions (000) | Net realized loss (000) | Net unrealized (depreciation) appreciation (000) | Value of affiliates at 12/31/2022 (000) | Dividend income (000) | ||||||||||||||||||||||
Investment funds 2.46% | ||||||||||||||||||||||||||||
Capital Group Central Corporate Bond Fund | $ | 30,304 | $ | 6,708 | $ | 3,076 | $ | (677 | ) | $ | (5,200 | ) | $ | 28,059 | $ | 900 | ||||||||||||
Short-term securities 6.99% | ||||||||||||||||||||||||||||
Money market investments 6.84% | ||||||||||||||||||||||||||||
Capital Group Central Cash Fund 4.31%13 | 42,892 | 254,586 | 219,519 | (14 | ) | 7 | 77,952 | 1,714 | ||||||||||||||||||||
Money market investments purchased with collateral from securities on loan 0.15% | ||||||||||||||||||||||||||||
Capital Group Central Cash Fund 4.31%13,14 | 1,954 | 242 | 17 | 1,712 | — | 18 | ||||||||||||||||||||||
|
| |||||||||||||||||||||||||||
Total short-term securities | 79,664 | |||||||||||||||||||||||||||
|
|
|
|
|
|
|
| |||||||||||||||||||||
Total 9.45% | $ | (691 | ) | $ | (5,193 | ) | $ | 107,723 | $ | 2,614 | ||||||||||||||||||
|
|
|
|
|
|
|
| |||||||||||||||||||||
| 1 | Acquired in a transaction exempt from registration under Rule 144A or, for commercial paper, Section 4(a)(2) of the Securities Act of 1933. May be resold in the U.S. in transactions exempt from registration, normally to qualified institutional buyers. The total value of all such securities was $20,234,000, which represented 1.78% of the net assets of the fund. |
| 2 | Value determined using significant unobservable inputs. |
| 3 | Security did not produce income during the last 12 months. |
| 4 | Amount less than one thousand. |
| 5 | All or a portion of this security was on loan. The total value of all such securities was $6,251,000, which represented .55% of the net assets of the fund. Refer to Note 5 for more information on securities lending. |
| 6 | Part of the same “group of investment companies” as the fund as defined under the Investment Company Act of 1940, as amended. |
| 7 | All or a portion of this security was pledged as collateral. The total value of pledged collateral was $1,982,000, which represented .17% of the net assets of the fund. |
| 8 | Index-linked bond whose principal amount moves with a government price index. |
| 9 | Principal payments may be made periodically. Therefore, the effective maturity date may be earlier than the stated maturity date. |
| 10 | Coupon rate may change periodically. Reference rate and spread are as of the most recent information available. Some coupon rates are determined by the issuer or agent based on current market conditions; therefore, the reference rate and spread are not available. |
| 11 | Purchased on a TBA basis. |
| 12 | Step bond; coupon rate may change at a later date. |
| 13 | Rate represents the seven-day yield at 12/31/2022. |
| 14 | Security purchased with cash collateral from securities on loan. Refer to Note 5 for more information on securities lending. |
| 15 | The maximum potential amount the fund may pay as a protection seller should a credit event occur. |
| 16 | The prices and resulting values for credit default swap indices serve as an indicator of the current status of the payment/performance risk. As the value of a sell protection credit default swap increases or decreases, when compared to the notional amount of the swap, the payment/performance risk may decrease or increase, respectively. |
| 17 | Represents net activity. Refer to Note 5 for more information on securities lending. |
| 18 | Dividend income is included with securities lending income in the fund’s statement of operations and is not shown in this table. |
Key to abbreviations
ADR = American Depositary Receipts
Assn. = Association
CAD = Canadian dollars
CDI = CREST Depository Interest
CME = CME Group
DAC = Designated Activity Company
EFFR = Effective Federal Funds Rate
EUR = Euros
G.O. = General Obligation
GBP = British pounds
GDR = Global Depositary Receipts
LIBOR = London Interbank Offered Rate
MXN = Mexican pesos
REIT = Real Estate Investment Trust
SDR = Swedish Depositary Receipts
SOFR = Secured Overnight Financing Rate
TBA = To be announced
USD = U.S. dollars
Refer to the notes to financial statements.
126 American Funds Insurance Series
Table of Contents
Investment portfolio December 31, 2022
Common stocks 67.78%
| Shares | Value (000) | |||||||
Health care 13.40% | ||||||||
UnitedHealth Group, Inc. | 929,300 | $ | 492,696 | |||||
Johnson & Johnson | 2,030,000 | 358,600 | ||||||
Pfizer, Inc. | 5,493,542 | 281,489 | ||||||
Humana, Inc. | 500,000 | 256,095 | ||||||
Gilead Sciences, Inc. | 2,665,000 | 228,790 | ||||||
Cigna Corp. | 650,000 | 215,371 | ||||||
AbbVie, Inc. | 1,221,978 | 197,484 | ||||||
Abbott Laboratories | 1,600,000 | 175,664 | ||||||
Eli Lilly and Company | 400,469 | 146,508 | ||||||
Vertex Pharmaceuticals, Inc.1 | 505,500 | 145,978 | ||||||
CVS Health Corp. | 1,453,100 | 135,414 | ||||||
Regeneron Pharmaceuticals, Inc.1 | 187,220 | 135,077 | ||||||
Centene Corp.1 | 1,235,513 | 101,324 | ||||||
Bristol-Myers Squibb Company | 1,374,818 | 98,918 | ||||||
AstraZeneca PLC | 461,000 | 62,565 | ||||||
AstraZeneca PLC (ADR) | 249,881 | 16,942 | ||||||
Thermo Fisher Scientific, Inc. | 116,000 | 63,880 | ||||||
Alnylam Pharmaceuticals, Inc.1 | 261,834 | 62,225 | ||||||
Novo Nordisk A/S, Class B | 246,400 | 33,363 | ||||||
AbCellera Biologics, Inc.1,2 | 2,871,293 | 29,086 | ||||||
Seagen, Inc.1 | 170,500 | 21,911 | ||||||
Rotech Healthcare, Inc.1,3,4 | 184,138 | 19,703 | ||||||
Elevance Health, Inc. | 37,542 | 19,258 | ||||||
Zoetis, Inc., Class A | 95,618 | 14,013 | ||||||
Karuna Therapeutics, Inc.1 | 57,100 | 11,220 | ||||||
|
| |||||||
| 3,323,574 | ||||||||
|
| |||||||
Consumer discretionary 9.59% | ||||||||
Aramark | 11,375,152 | 470,249 | ||||||
Home Depot, Inc. | 1,206,200 | 380,990 | ||||||
General Motors Company | 6,575,000 | 221,183 | ||||||
Booking Holdings, Inc.1 | 87,604 | 176,546 | ||||||
Lennar Corp., Class A | 1,357,800 | 122,881 | ||||||
Dollar General Corp. | 493,075 | 121,420 | ||||||
LVMH Moët Hennessy-Louis Vuitton SE | 165,700 | 120,372 | ||||||
Amazon.com, Inc.1 | 1,340,400 | 112,594 | ||||||
Target Corp. | 750,000 | 111,780 | ||||||
Etsy, Inc.1 | 840,578 | 100,684 | ||||||
Entain PLC | 6,000,000 | 96,202 | ||||||
Burlington Stores, Inc.1 | 431,484 | 87,488 | ||||||
D.R. Horton, Inc. | 870,000 | 77,552 | ||||||
Royal Caribbean Cruises, Ltd.1 | 1,014,324 | 50,138 | ||||||
YUM! Brands, Inc. | 277,000 | 35,478 | ||||||
Dollar Tree Stores, Inc.1 | 185,000 | 26,166 | ||||||
YETI Holdings, Inc.1 | 495,471 | 20,468 | ||||||
Darden Restaurants, Inc. | 142,000 | 19,643 | ||||||
Chipotle Mexican Grill, Inc.1 | 9,709 | 13,471 | ||||||
Li Auto, Inc., Class A (ADR)1,2 | 350,694 | 7,154 | ||||||
Xpeng, Inc., Class A (ADR)1,2 | 703,800 | 6,996 | ||||||
|
| |||||||
| 2,379,455 | ||||||||
|
| |||||||
Financials 9.21% | ||||||||
Aon PLC, Class A | 807,600 | 242,393 | ||||||
Chubb, Ltd. | 800,000 | 176,480 | ||||||
Apollo Asset Management, Inc. | 2,630,627 | 167,808 | ||||||
Synchrony Financial | 4,100,000 | 134,726 | ||||||
JPMorgan Chase & Co. | 973,100 | 130,493 | ||||||
First Republic Bank | 1,000,000 | 121,890 | ||||||
Bank of America Corp. | 3,000,000 | 99,360 | ||||||
Arthur J. Gallagher & Co. | 476,724 | 89,881 | ||||||
Capital One Financial Corp. | 850,000 | 79,016 | ||||||
Blue Owl Capital, Inc., Class A2 | 7,085,161 | 75,103 | ||||||
American Funds Insurance Series 127
Table of Contents
Asset Allocation Fund (continued)
Common stocks (continued)
| Shares | Value (000) | |||||||
Financials (continued) | ||||||||
Goldman Sachs Group, Inc. | 213,000 | $ | 73,140 | |||||
Ares Management Corp., Class A | 1,015,403 | 69,494 | ||||||
KKR & Co., Inc. | 1,497,000 | 69,491 | ||||||
Nasdaq, Inc. | 1,098,300 | 67,381 | ||||||
Charles Schwab Corp. | 801,126 | 66,702 | ||||||
CME Group, Inc., Class A | 380,200 | 63,934 | ||||||
Discover Financial Services | 600,000 | 58,698 | ||||||
Toronto-Dominion Bank (CAD denominated)2 | 885,700 | 57,348 | ||||||
SLM Corp. | 3,345,000 | 55,527 | ||||||
Intercontinental Exchange, Inc. | 538,487 | 55,243 | ||||||
Blackstone, Inc., nonvoting shares | 737,500 | 54,715 | ||||||
S&P Global, Inc. | 118,700 | 39,757 | ||||||
Brookfield Corp., Class A | 1,260,000 | 39,640 | ||||||
The Bank of N.T. Butterfield & Son, Ltd. | 1,120,585 | 33,405 | ||||||
Morgan Stanley | 339,372 | 28,853 | ||||||
Antin Infrastructure Partners SA | 1,243,300 | 27,033 | ||||||
EQT AB | 1,250,263 | 26,646 | ||||||
Wells Fargo & Company | 570,000 | 23,535 | ||||||
Progressive Corp. | 105,000 | 13,620 | ||||||
Bridgepoint Group PLC | 5,809,554 | 13,461 | ||||||
OneMain Holdings, Inc. | 300,000 | 9,993 | ||||||
Brookfield Asset Management, Ltd., Class A | 315,000 | 9,031 | ||||||
Islandsbanki hf. | 9,555,235 | 8,073 | ||||||
Jonah Energy Parent, LLC3 | 32,117 | 1,899 | ||||||
Sberbank of Russia PJSC1,3 | 8,880,000 | — | 5 | |||||
|
| |||||||
| 2,283,769 | ||||||||
|
| |||||||
Information technology 8.88% | ||||||||
Microsoft Corp. | 3,355,454 | 804,705 | ||||||
Broadcom, Inc. | 1,249,134 | 698,428 | ||||||
ASML Holding NV (New York registered) (ADR) | 316,764 | 173,080 | ||||||
MKS Instruments, Inc. | 1,600,000 | 135,568 | ||||||
Taiwan Semiconductor Manufacturing Company, Ltd. (ADR) | 1,275,000 | 94,975 | ||||||
Mastercard, Inc., Class A | 195,977 | 68,147 | ||||||
NVIDIA Corp. | 332,696 | 48,620 | ||||||
MediaTek, Inc. | 1,463,000 | 29,717 | ||||||
Oracle Corp. | 321,820 | 26,306 | ||||||
Paychex, Inc. | 205,595 | 23,759 | ||||||
GoDaddy, Inc., Class A1 | 281,000 | 21,024 | ||||||
Apple, Inc. | 150,000 | 19,490 | ||||||
KLA Corp. | 49,000 | 18,474 | ||||||
MicroStrategy, Inc., Class A1 | 96,100 | 13,605 | ||||||
Applied Materials, Inc. | 135,000 | 13,146 | ||||||
Snowflake, Inc., Class A1 | 85,810 | 12,317 | ||||||
|
| |||||||
| 2,201,361 | ||||||||
|
| |||||||
Consumer staples 6.59% | ||||||||
Philip Morris International, Inc. | 9,438,592 | 955,280 | ||||||
Nestlé SA | 1,954,200 | 225,682 | ||||||
Archer Daniels Midland Company | 1,880,000 | 174,558 | ||||||
British American Tobacco PLC (ADR) | 2,634,146 | 105,313 | ||||||
British American Tobacco PLC | 1,080,000 | 42,849 | ||||||
Altria Group, Inc. | 1,570,000 | 71,764 | ||||||
Avenue Supermarts, Ltd.1 | 970,539 | 47,566 | ||||||
Costco Wholesale Corp. | 26,000 | 11,869 | ||||||
|
| |||||||
| 1,634,881 | ||||||||
|
| |||||||
Industrials 6.22% | ||||||||
Northrop Grumman Corp. | 933,553 | 509,356 | ||||||
Lockheed Martin Corp. | 474,900 | 231,034 | ||||||
L3Harris Technologies, Inc. | 1,094,000 | 227,782 | ||||||
Boeing Company1 | 1,039,506 | 198,015 | ||||||
128 American Funds Insurance Series
Table of Contents
Asset Allocation Fund (continued)
Common stocks (continued)
| Shares | Value (000) | |||||||
Industrials (continued) | ||||||||
Caterpillar, Inc. | 618,000 | $ | 148,048 | |||||
CSX Corp. | 2,628,369 | 81,427 | ||||||
Raytheon Technologies Corp. | 395,000 | 39,863 | ||||||
General Electric Co. | 288,000 | 24,132 | ||||||
Huntington Ingalls Industries, Inc. | 100,000 | 23,068 | ||||||
AMETEK, Inc. | 140,000 | 19,561 | ||||||
Chart Industries, Inc.1 | 130,200 | 15,003 | ||||||
Copart, Inc.1 | 232,000 | 14,126 | ||||||
Storskogen Group AB, Class B | 16,853,587 | 12,088 | ||||||
|
| |||||||
| 1,543,503 | ||||||||
|
| |||||||
Communication services 4.72% | ||||||||
Alphabet, Inc., Class C1 | 2,992,500 | 265,525 | ||||||
Alphabet, Inc., Class A1 | 1,269,460 | 112,004 | ||||||
Charter Communications, Inc., Class A1 | 821,000 | 278,401 | ||||||
Meta Platforms, Inc., Class A1 | 1,777,348 | 213,886 | ||||||
Netflix, Inc.1 | 384,527 | 113,390 | ||||||
Comcast Corp., Class A | 2,874,400 | 100,518 | ||||||
ZoomInfo Technologies, Inc.1 | 1,747,900 | 52,629 | ||||||
Activision Blizzard, Inc. | 400,000 | 30,620 | ||||||
Electronic Arts, Inc. | 35,000 | 4,276 | ||||||
|
| |||||||
| 1,171,249 | ||||||||
|
| |||||||
Energy 4.12% | ||||||||
Canadian Natural Resources, Ltd. (CAD denominated)2 | 7,515,800 | 417,366 | ||||||
Pioneer Natural Resources Company | 752,000 | 171,749 | ||||||
ConocoPhillips | 1,252,000 | 147,736 | ||||||
Cenovus Energy, Inc. (CAD denominated) | 7,500,000 | 145,513 | ||||||
Hess Corp. | 400,000 | 56,728 | ||||||
Chevron Corp. | 270,000 | 48,462 | ||||||
TC Energy Corp. | 631,700 | 25,180 | ||||||
Equitrans Midstream Corp. | 718,490 | 4,814 | ||||||
Diamond Offshore Drilling, Inc.1 | 266,381 | 2,770 | ||||||
Altera Infrastructure, LP1,3 | 6,273 | 497 | ||||||
Constellation Oil Services Holding SA, Class B-11,3 | 480,336 | 53 | ||||||
McDermott International, Ltd.1 | 30,762 | 10 | ||||||
Bighorn Permian Resources, LLC3 | 4,392 | — | 5 | |||||
|
| |||||||
| 1,020,878 | ||||||||
|
| |||||||
Materials 3.45% | ||||||||
Corteva, Inc. | 4,365,508 | 256,605 | ||||||
Mosaic Co. | 1,940,000 | 85,108 | ||||||
Linde PLC | 256,541 | 83,678 | ||||||
Royal Gold, Inc. | 700,000 | 78,904 | ||||||
Wheaton Precious Metals Corp. | 1,785,000 | 69,758 | ||||||
Nucor Corp. | 500,000 | 65,905 | ||||||
Franco-Nevada Corp. | 347,089 | 47,313 | ||||||
First Quantum Minerals, Ltd. | 2,100,000 | 43,877 | ||||||
ATI, Inc.1 | 1,350,000 | 40,311 | ||||||
Vale SA, ordinary nominative shares | 1,750,000 | 29,460 | ||||||
Nutrien, Ltd. (CAD denominated) | 400,272 | 29,222 | ||||||
Lundin Mining Corp.2 | 4,320,000 | 26,513 | ||||||
|
| |||||||
| 856,654 | ||||||||
|
| |||||||
Real estate 0.96% | ||||||||
VICI Properties, Inc. REIT | 2,769,449 | 89,730 | ||||||
Gaming and Leisure Properties, Inc. REIT | 1,593,566 | 83,009 | ||||||
Equinix, Inc. REIT | 63,445 | 41,559 | ||||||
Crown Castle, Inc. REIT | 166,000 | 22,516 | ||||||
|
| |||||||
| 236,814 | ||||||||
|
| |||||||
American Funds Insurance Series 129
Table of Contents
Asset Allocation Fund (continued)
Common stocks (continued)
| Shares | Value (000) | |||||||
Utilities 0.64% | ||||||||
CenterPoint Energy, Inc. | 1,717,846 | $ | 51,518 | |||||
Exelon Corp. | 779,231 | 33,686 | ||||||
AES Corp. | 983,067 | 28,273 | ||||||
Sempra Energy | 132,039 | 20,405 | ||||||
FirstEnergy Corp. | 307,000 | 12,876 | ||||||
Constellation Energy Corp. | 138,666 | 11,955 | ||||||
|
| |||||||
| 158,713 | ||||||||
|
| |||||||
Total common stocks (cost: $11,870,390,000) | 16,810,851 | |||||||
|
| |||||||
Preferred securities 0.00% | ||||||||
Industrials 0.00% | ||||||||
ACR III LSC Holdings, LLC, Series B, preferred shares1,3,6 | 450 | 189 | ||||||
|
| |||||||
Total preferred securities (cost: $466,000) | 189 | |||||||
|
| |||||||
Rights & warrants 0.00% | ||||||||
Energy 0.00% | ||||||||
Constellation Oil Services Holding SA, Class D, warrants, expire 6/10/20711,3 | 4 | — | 5 | |||||
|
| |||||||
Total rights & warrants (cost: $0) | — | 5 | ||||||
|
| |||||||
Convertible stocks 0.26% | ||||||||
Health care 0.26% | ||||||||
Carbon Health Technologies, Inc., convertible preferred shares, 1.00% 7/9/20243,4 | 50,000 | 63,388 | ||||||
|
| |||||||
Total convertible stocks (cost: $50,000,000) | 63,388 | |||||||
|
| |||||||
Investment funds 5.51% | ||||||||
Capital Group Central Corporate Bond Fund7 | 167,745,028 | 1,367,122 | ||||||
|
| |||||||
Total investment funds (cost: $1,676,023,000) | 1,367,122 | |||||||
|
| |||||||
Principal amount (000) | ||||||||
| Bonds, notes & other debt instruments 21.72% | ||||||||
Mortgage-backed obligations 7.58% | ||||||||
Federal agency mortgage-backed obligations 7.02% | ||||||||
Fannie Mae Pool #AD7072 4.00% 6/1/20258 | USD | 2 | 2 | |||||
Fannie Mae Pool #AE2321 4.00% 8/1/20258 | 1 | 1 | ||||||
Fannie Mae Pool #AE3069 4.00% 9/1/20258 | 1 | 1 | ||||||
Fannie Mae Pool #AH0829 4.00% 1/1/20268 | 1 | 1 | ||||||
Fannie Mae Pool #AH6431 4.00% 2/1/20268 | 168 | 165 | ||||||
Fannie Mae Pool #AH5618 4.00% 2/1/20268 | 2 | 1 | ||||||
Fannie Mae Pool #890329 4.00% 4/1/20268 | 27 | 26 | ||||||
Fannie Mae Pool #MA1109 4.00% 5/1/20278 | 2 | 2 | ||||||
Fannie Mae Pool #MA3653 3.00% 3/1/20298 | 13 | 12 | ||||||
Fannie Mae Pool #AL8347 4.00% 3/1/20298 | 185 | 181 | ||||||
Fannie Mae Pool #254767 5.50% 6/1/20338 | 208 | 214 | ||||||
Fannie Mae Pool #555956 5.50% 12/1/20338 | 131 | 135 | ||||||
Fannie Mae Pool #BN1085 4.00% 1/1/20348 | 411 | 403 | ||||||
Fannie Mae Pool #BN3172 4.00% 1/1/20348 | 162 | 158 | ||||||
Fannie Mae Pool #929185 5.50% 1/1/20368 | 383 | 396 | ||||||
Fannie Mae Pool #893641 6.00% 9/1/20368 | 776 | 811 | ||||||
Fannie Mae Pool #893688 6.00% 10/1/20368 | 164 | 171 | ||||||
Fannie Mae Pool #AS8554 3.00% 12/1/20368 | 5,967 | 5,542 | ||||||
Fannie Mae Pool #907239 6.00% 12/1/20368 | 54 | 56 | ||||||
Fannie Mae Pool #928031 6.00% 1/1/20378 | 63 | 65 | ||||||
Fannie Mae Pool #888292 6.00% 3/1/20378 | 547 | 571 | ||||||
Fannie Mae Pool #AD0249 5.50% 4/1/20378 | 111 | 114 | ||||||
130 American Funds Insurance Series
Table of Contents
Asset Allocation Fund (continued)
Bonds, notes & other debt instruments (continued)
| Principal amount (000) | Value (000) | |||||||
Mortgage-backed obligations (continued) | ||||||||
Federal agency mortgage-backed obligations (continued) | ||||||||
Fannie Mae Pool #190379 5.50% 5/1/20378 | USD55 | $ | 57 | |||||
Fannie Mae Pool #924952 6.00% 8/1/20378 | 865 | 903 | ||||||
Fannie Mae Pool #888637 6.00% 9/1/20378 | 10 | 10 | ||||||
Fannie Mae Pool #995674 6.00% 5/1/20388 | 310 | 324 | ||||||
Fannie Mae Pool #AD0119 6.00% 7/1/20388 | 938 | 984 | ||||||
Fannie Mae Pool #995224 6.00% 9/1/20388 | 8 | 8 | ||||||
Fannie Mae Pool #AE0021 6.00% 10/1/20388 | 286 | 298 | ||||||
Fannie Mae Pool #AL7164 6.00% 10/1/20388 | 196 | 201 | ||||||
Fannie Mae Pool #889983 6.00% 10/1/20388 | 18 | 19 | ||||||
Fannie Mae Pool #AD0095 6.00% 11/1/20388 | 689 | 717 | ||||||
Fannie Mae Pool #AB0538 6.00% 11/1/20388 | 110 | 114 | ||||||
Fannie Mae Pool #995391 6.00% 11/1/20388 | 14 | 15 | ||||||
Fannie Mae Pool #AD0833 6.00% 1/1/20398 | — | 5 | — | 5 | ||||
Fannie Mae Pool #AL0309 6.00% 1/1/20408 | 62 | 65 | ||||||
Fannie Mae Pool #AL0013 6.00% 4/1/20408 | 182 | 190 | ||||||
Fannie Mae Pool #AL7228 6.00% 4/1/20418 | 242 | 248 | ||||||
Fannie Mae Pool #AB4536 6.00% 6/1/20418 | 413 | 428 | ||||||
Fannie Mae Pool #MA4387 2.00% 7/1/20418 | 7,655 | 6,462 | ||||||
Fannie Mae Pool #MA4501 2.00% 12/1/20418 | 8,791 | 7,421 | ||||||
Fannie Mae Pool #FS0305 1.50% 1/1/20428 | 22,809 | 18,688 | ||||||
Fannie Mae Pool #MA4520 2.00% 1/1/20428 | 14,931 | 12,603 | ||||||
Fannie Mae Pool #AP2131 3.50% 8/1/20428 | 3,155 | 2,956 | ||||||
Fannie Mae Pool #AU8813 4.00% 11/1/20438 | 2,218 | 2,169 | ||||||
Fannie Mae Pool #AU9348 4.00% 11/1/20438 | 1,262 | 1,234 | ||||||
Fannie Mae Pool #AU9350 4.00% 11/1/20438 | 1,052 | 1,015 | ||||||
Fannie Mae Pool #AL8773 3.50% 2/1/20458 | 5,278 | 4,945 | ||||||
Fannie Mae Pool #FM9416 3.50% 7/1/20458 | 8,847 | 8,192 | ||||||
Fannie Mae Pool #AL8354 3.50% 10/1/20458 | 1,320 | 1,231 | ||||||
Fannie Mae Pool #AL8522 3.50% 5/1/20468 | 2,806 | 2,610 | ||||||
Fannie Mae Pool #BC7611 4.00% 5/1/20468 | 113 | 109 | ||||||
Fannie Mae Pool #AS8310 3.00% 11/1/20468 | 373 | 335 | ||||||
Fannie Mae Pool #BD9307 4.00% 11/1/20468 | 1,322 | 1,263 | ||||||
Fannie Mae Pool #BD9699 3.50% 12/1/20468 | 1,482 | 1,375 | ||||||
Fannie Mae Pool #BE1290 3.50% 2/1/20478 | 2,160 | 2,005 | ||||||
Fannie Mae Pool #BM1179 3.00% 4/1/20478 | 470 | 421 | ||||||
Fannie Mae Pool #256975 7.00% 10/1/20478 | 2 | 2 | ||||||
Fannie Mae Pool #CA0770 3.50% 11/1/20478 | 1,522 | 1,415 | ||||||
Fannie Mae Pool #257036 7.00% 11/1/20478 | 6 | 7 | ||||||
Fannie Mae Pool #MA3211 4.00% 12/1/20478 | 2,648 | 2,535 | ||||||
Fannie Mae Pool #MA3277 4.00% 2/1/20488 | 11 | 10 | ||||||
Fannie Mae Pool #BK5255 4.00% 5/1/20488 | 11 | 11 | ||||||
Fannie Mae Pool #FM3278 3.50% 11/1/20488 | 16,898 | 15,676 | ||||||
Fannie Mae Pool #FM3280 3.50% 5/1/20498 | 2,314 | 2,144 | ||||||
Fannie Mae Pool #CA4756 3.00% 12/1/20498 | 1,745 | 1,556 | ||||||
Fannie Mae Pool #CA5659 2.50% 5/1/20508 | 2,353 | 1,999 | ||||||
Fannie Mae Pool #CA5968 2.50% 6/1/20508 | 5,666 | 4,869 | ||||||
Fannie Mae Pool #CA6593 2.50% 8/1/20508 | 12,778 | 11,002 | ||||||
Fannie Mae Pool #CA7599 2.50% 11/1/20508 | 1,607 | 1,386 | ||||||
Fannie Mae Pool #FM4897 3.00% 11/1/20508 | 14,598 | 13,142 | ||||||
Fannie Mae Pool #CA8828 2.50% 2/1/20518 | 4,022 | 3,458 | ||||||
Fannie Mae Pool #CA9291 2.50% 2/1/20518 | 52 | 44 | ||||||
Fannie Mae Pool #CA9390 2.50% 3/1/20518 | 666 | 565 | ||||||
Fannie Mae Pool #CB0290 2.00% 4/1/20518 | 4,822 | 3,945 | ||||||
Fannie Mae Pool #FM7741 2.50% 5/1/20518 | 816 | 693 | ||||||
Fannie Mae Pool #FM8453 3.00% 8/1/20518 | 4,876 | 4,347 | ||||||
Fannie Mae Pool #FM8436 2.50% 9/1/20518 | 45 | 39 | ||||||
Fannie Mae Pool #CB1810 3.00% 10/1/20518 | 165 | 145 | ||||||
Fannie Mae Pool #BU0616 2.50% 11/1/20518 | 49 | 42 | ||||||
Fannie Mae Pool #CB2078 3.00% 11/1/20518 | 9,882 | 8,696 | ||||||
Fannie Mae Pool #CB2286 2.50% 12/1/20518 | 17,352 | 14,835 | ||||||
Fannie Mae Pool #CB2402 2.50% 12/1/20518 | 10,959 | 9,290 | ||||||
American Funds Insurance Series 131
Table of Contents
Asset Allocation Fund (continued)
Bonds, notes & other debt instruments (continued)
Principal amount | Value | |||||||
| (000) | (000) | |||||||
Mortgage-backed obligations (continued) | ||||||||
Federal agency mortgage-backed obligations (continued) | ||||||||
Fannie Mae Pool #CB2375 2.50% 12/1/20518 | USD7,995 | $ | 6,825 | |||||
Fannie Mae Pool #BU8372 2.50% 12/1/20518 | 955 | 812 | ||||||
Fannie Mae Pool #CB2323 2.50% 12/1/20518 | 947 | 805 | ||||||
Fannie Mae Pool #CB2312 2.50% 12/1/20518 | 366 | 311 | ||||||
Fannie Mae Pool #CB2319 2.50% 12/1/20518 | 196 | 168 | ||||||
Fannie Mae Pool #BT9510 2.50% 12/1/20518 | 94 | 81 | ||||||
Fannie Mae Pool #BT9483 2.50% 12/1/20518 | 95 | 81 | ||||||
Fannie Mae Pool #CB2372 2.50% 12/1/20518 | 93 | 80 | ||||||
Fannie Mae Pool #FS0235 2.50% 1/1/20528 | 12,638 | 10,713 | ||||||
Fannie Mae Pool #FS0182 3.00% 1/1/20528 | 13,050 | 11,488 | ||||||
Fannie Mae Pool #FS0303 3.00% 1/1/20528 | 978 | 859 | ||||||
Fannie Mae Pool #CB3666 2.50% 2/1/20528 | 24,794 | 21,026 | ||||||
Fannie Mae Pool #FS0546 2.50% 2/1/20528 | 11,820 | 10,020 | ||||||
Fannie Mae Pool #BV4367 2.50% 2/1/20528 | 818 | 695 | ||||||
Fannie Mae Pool #FS0613 2.50% 2/1/20528 | 736 | 625 | ||||||
Fannie Mae Pool #BV9531 2.50% 2/1/20528 | 721 | 612 | ||||||
Fannie Mae Pool #BU8226 2.50% 2/1/20528 | 612 | 520 | ||||||
Fannie Mae Pool #BV4259 2.50% 2/1/20528 | 596 | 507 | ||||||
Fannie Mae Pool #BV3216 2.50% 2/1/20528 | 487 | 413 | ||||||
Fannie Mae Pool #BU7298 2.50% 2/1/20528 | 361 | 306 | ||||||
Fannie Mae Pool #BV0307 2.50% 2/1/20528 | 75 | 63 | ||||||
Fannie Mae Pool #BV3495 2.50% 2/1/20528 | 64 | 55 | ||||||
Fannie Mae Pool #FS0647 3.00% 2/1/20528 | 67,926 | 60,633 | ||||||
Fannie Mae Pool #CB2896 3.00% 2/1/20528 | 7,625 | 6,703 | ||||||
Fannie Mae Pool #CB5013 2.50% 3/1/20528 | 3,992 | 3,392 | ||||||
Fannie Mae Pool #BV6631 2.50% 3/1/20528 | 921 | 782 | ||||||
Fannie Mae Pool #BV8086 2.50% 3/1/20528 | 596 | 508 | ||||||
Fannie Mae Pool #BT8111 2.50% 3/1/20528 | 593 | 503 | ||||||
Fannie Mae Pool #BV4173 2.50% 3/1/20528 | 525 | 446 | ||||||
Fannie Mae Pool #BU8885 2.50% 3/1/20528 | 507 | 431 | ||||||
Fannie Mae Pool #FS0831 3.00% 3/1/20528 | 16,034 | 14,095 | ||||||
Fannie Mae Pool #CB3170 3.00% 3/1/20528 | 7,000 | 6,156 | ||||||
Fannie Mae Pool #CB3410 3.00% 3/1/20528 | 158 | 139 | ||||||
Fannie Mae Pool #MA4578 2.50% 4/1/20528 | 31,872 | 27,036 | ||||||
Fannie Mae Pool #BV5332 2.50% 4/1/20528 | 966 | 820 | ||||||
Fannie Mae Pool #BV4656 2.50% 4/1/20528 | 873 | 741 | ||||||
Fannie Mae Pool #BV2996 2.50% 4/1/20528 | 814 | 691 | ||||||
Fannie Mae Pool #CB3351 2.50% 4/1/20528 | 739 | 628 | ||||||
Fannie Mae Pool #BV4182 2.50% 4/1/20528 | 730 | 620 | ||||||
Fannie Mae Pool #FS1922 2.50% 4/1/20528 | 716 | 608 | ||||||
Fannie Mae Pool #BV8569 2.50% 4/1/20528 | 683 | 580 | ||||||
Fannie Mae Pool #BV7698 2.50% 4/1/20528 | 620 | 526 | ||||||
Fannie Mae Pool #BV7717 2.50% 4/1/20528 | 593 | 504 | ||||||
Fannie Mae Pool #BU8933 3.00% 4/1/20528 | 1,825 | 1,604 | ||||||
Fannie Mae Pool #CB3364 3.00% 4/1/20528 | 457 | 402 | ||||||
Fannie Mae Pool #BU8825 2.50% 5/1/20528 | 1,018 | 864 | ||||||
Fannie Mae Pool #BW2204 2.50% 5/1/20528 | 885 | 752 | ||||||
Fannie Mae Pool #BV9818 2.50% 5/1/20528 | 790 | 672 | ||||||
Fannie Mae Pool #BW0160 2.50% 5/1/20528 | 665 | 565 | ||||||
Fannie Mae Pool #MA4598 2.50% 5/1/20528 | 162 | 137 | ||||||
Fannie Mae Pool #BV9644 2.50% 5/1/20528 | 89 | 76 | ||||||
Fannie Mae Pool #FS1877 3.00% 5/1/20528 | 5,704 | 5,012 | ||||||
Fannie Mae Pool #BV7238 3.00% 5/1/20528 | 1,886 | 1,658 | ||||||
Fannie Mae Pool #CB3495 3.00% 5/1/20528 | 1,867 | 1,640 | ||||||
Fannie Mae Pool #BT7819 3.00% 5/1/20528 | 138 | 121 | ||||||
Fannie Mae Pool #BW1436 4.50% 5/1/20528 | 3,137 | 3,023 | ||||||
Fannie Mae Pool #MA4624 3.00% 6/1/20528 | 1,431 | 1,257 | ||||||
Fannie Mae Pool #BW2935 3.00% 6/1/20528 | 747 | 657 | ||||||
Fannie Mae Pool #BW1449 3.00% 6/1/20528 | 400 | 352 | ||||||
Fannie Mae Pool #BV9701 3.00% 6/1/20528 | 114 | 100 | ||||||
Fannie Mae Pool #BW5663 4.50% 6/1/20528 | 2,906 | 2,800 | ||||||
132 American Funds Insurance Series
Table of Contents
Asset Allocation Fund (continued)
Bonds, notes & other debt instruments (continued)
| Principal amount | Value | |||||||
| (000) | (000) | |||||||
Mortgage-backed obligations (continued) | ||||||||
Federal agency mortgage-backed obligations (continued) | ||||||||
Fannie Mae Pool #CB4534 4.50% 6/1/20528 | USD2,080 | $ | 2,004 | |||||
Fannie Mae Pool #FS2239 2.50% 7/1/20528 | 10,586 | 8,987 | ||||||
Fannie Mae Pool #MA4652 2.50% 7/1/20528 | 7,000 | 5,940 | ||||||
Fannie Mae Pool #BV7868 2.50% 7/1/20528 | 996 | 845 | ||||||
Fannie Mae Pool #BV2584 2.50% 7/1/20528 | 602 | 510 | ||||||
Fannie Mae Pool #BW5528 2.50% 7/1/20528 | 525 | 445 | ||||||
Fannie Mae Pool #BW6043 2.50% 7/1/20528 | 62 | 53 | ||||||
Fannie Mae Pool #BW5579 3.50% 7/1/20528 | 2,000 | 1,819 | ||||||
Fannie Mae Pool #CB4159 4.00% 7/1/20528 | 1,519 | 1,427 | ||||||
Fannie Mae Pool #FS2555 4.50% 7/1/20528 | 125 | 120 | ||||||
Fannie Mae Pool #MA4743 2.50% 8/1/20528 | 6,986 | 5,925 | ||||||
Fannie Mae Pool #BW7293 3.50% 8/1/20528 | 3,000 | 2,729 | ||||||
Fannie Mae Pool #CB4363 3.50% 8/1/20528 | 960 | 874 | ||||||
Fannie Mae Pool #BV7903 3.50% 8/1/20528 | 200 | 182 | ||||||
Fannie Mae Pool #BV8024 4.00% 8/1/20528 | 1,924 | 1,807 | ||||||
Fannie Mae Pool #BW7302 4.00% 8/1/20528 | 289 | 272 | ||||||
Fannie Mae Pool #BW4199 4.50% 8/1/20528 | 2,996 | 2,887 | ||||||
Fannie Mae Pool #BW3035 4.50% 8/1/20528 | 2,532 | 2,440 | ||||||
Fannie Mae Pool #BW5789 4.50% 8/1/20528 | 999 | 963 | ||||||
Fannie Mae Pool #BW6395 4.50% 8/1/20528 | 999 | 962 | ||||||
Fannie Mae Pool #BW7349 3.00% 9/1/20528 | 1,886 | 1,658 | ||||||
Fannie Mae Pool #BW7780 3.00% 9/1/20528 | 219 | 192 | ||||||
Fannie Mae Pool #MA4732 4.00% 9/1/20528 | 56,336 | 52,898 | ||||||
Fannie Mae Pool #BW7326 4.00% 9/1/20528 | 1,648 | 1,547 | ||||||
Fannie Mae Pool #BW9348 4.00% 9/1/20528 | 1,429 | 1,342 | ||||||
Fannie Mae Pool #BW8103 4.00% 9/1/20528 | 1,353 | 1,271 | ||||||
Fannie Mae Pool #MA4733 4.50% 9/1/20528 | 12,197 | 11,752 | ||||||
Fannie Mae Pool #BV0957 4.50% 9/1/20528 | 3,075 | 2,962 | ||||||
Fannie Mae Pool #BW1192 4.50% 9/1/20528 | 2,185 | 2,105 | ||||||
Fannie Mae Pool #BW1201 5.00% 9/1/20528 | 2,361 | 2,331 | ||||||
Fannie Mae Pool #MA4824 2.50% 10/1/20528 | 94 | 80 | ||||||
Fannie Mae Pool #MA4782 3.50% 10/1/20528 | 3,000 | 2,729 | ||||||
Fannie Mae Pool #BW8980 4.00% 10/1/20528 | 5,340 | 5,014 | ||||||
Fannie Mae Pool #BW1210 4.00% 10/1/20528 | 4,034 | 3,788 | ||||||
Fannie Mae Pool #BW7356 4.00% 10/1/20528 | 3,356 | 3,151 | ||||||
Fannie Mae Pool #BX0509 4.00% 10/1/20528 | 1,444 | 1,356 | ||||||
Fannie Mae Pool #MA4784 4.50% 10/1/20528 | 14,120 | 13,605 | ||||||
Fannie Mae Pool #CB4959 4.50% 10/1/20528 | 9,275 | 8,936 | ||||||
Fannie Mae Pool #BV0961 4.50% 10/1/20528 | 3,995 | 3,849 | ||||||
Fannie Mae Pool #BW8981 4.50% 10/1/20528 | 2,309 | 2,224 | ||||||
Fannie Mae Pool #BX0097 4.50% 10/1/20528 | 998 | 962 | ||||||
Fannie Mae Pool #MA4785 5.00% 10/1/20528 | 3,500 | 3,455 | ||||||
Fannie Mae Pool #MA4887 2.50% 11/1/20528 | 1,448 | 1,228 | ||||||
Fannie Mae Pool #MA4854 2.50% 11/1/20528 | 902 | 765 | ||||||
Fannie Mae Pool #BW1309 2.50% 11/1/20528 | 813 | 690 | ||||||
Fannie Mae Pool #MA4885 3.00% 11/1/20528 | 801 | 704 | ||||||
Fannie Mae Pool #FS3279 3.50% 11/1/20528 | 9,999 | 9,099 | ||||||
Fannie Mae Pool #MA4803 3.50% 11/1/20528 | 1,000 | 910 | ||||||
Fannie Mae Pool #MA4804 4.00% 11/1/20528 | 6,621 | 6,217 | ||||||
Fannie Mae Pool #BW1310 4.00% 11/1/20528 | 1,509 | 1,417 | ||||||
Fannie Mae Pool #BX3075 4.50% 11/1/20528 | 2,973 | 2,865 | ||||||
Fannie Mae Pool #MA4911 3.00% 12/1/20528 | 650 | 571 | ||||||
Fannie Mae Pool #MA4838 3.50% 12/1/20528 | 4,500 | 4,093 | ||||||
Fannie Mae Pool #MA4839 4.00% 12/1/20528 | 4,000 | 3,756 | ||||||
Fannie Mae Pool #MA4841 5.00% 12/1/20528 | 6,256 | 6,175 | ||||||
Fannie Mae Pool #MA4877 6.50% 12/1/20528 | 1,000 | 1,026 | ||||||
Fannie Mae Pool #MA4868 5.00% 1/1/20538 | 7,999 | 7,896 | ||||||
Fannie Mae Pool #BX4609 5.00% 1/1/20538 | 1,277 | 1,261 | ||||||
Fannie Mae Pool #MA4869 5.50% 1/1/20538 | 100 | 100 | ||||||
Fannie Mae Pool #MA4895 6.50% 1/1/20538 | 7,427 | 7,618 | ||||||
Fannie Mae Pool #BM6736 4.50% 11/1/20598 | 11,696 | 11,413 | ||||||
American Funds Insurance Series 133
Table of Contents
Asset Allocation Fund (continued)
Bonds, notes & other debt instruments (continued)
| Principal amount | Value | |||||||
| (000) | (000) | |||||||
Mortgage-backed obligations (continued) | ||||||||
Federal agency mortgage-backed obligations (continued) | ||||||||
Fannie Mae Pool #BF0497 3.00% 7/1/20608 | USD4,130 | $ | 3,619 | |||||
Fannie Mae, Series 2002-W3, Class A5, 7.50% 11/25/20418 | 24 | 26 | ||||||
Fannie Mae, Series 2001-T10, Class A1, 7.00% 12/25/20418 | 84 | 86 | ||||||
Fannie Mae, Series 2014-M1, Class A2, Multi Family, 3.298% 7/25/20238,9 | 1,660 | 1,644 | ||||||
Fannie Mae, Series 2014-M2, Class A2, Multi Family, 3.513% 12/25/20238,9 | 1,909 | 1,877 | ||||||
Fannie Mae, Series 2014-M3, Class A2, Multi Family, 3.501% 1/25/20248,9 | 1,338 | 1,314 | ||||||
Fannie Mae, Series 2014-M9, Class A2, Multi Family, 3.103% 7/25/20248,9 | 3,273 | 3,169 | ||||||
Fannie Mae, Series 2017-M3, Class A2, Multi Family, 2.471% 12/25/20268,9 | 7,323 | 6,758 | ||||||
Fannie Mae, Series 2017-M7, Class A2, Multi Family, 2.961% 2/25/20278,9 | 2,602 | 2,446 | ||||||
Fannie Mae, Series 2006-43, Class JO, principal only, 0% 6/25/20368 | 39 | 32 | ||||||
Freddie Mac Pool #C91912 3.00% 2/1/20378 | 11,022 | 10,254 | ||||||
Freddie Mac Pool #G03978 5.00% 3/1/20388 | 420 | 429 | ||||||
Freddie Mac Pool #G04553 6.50% 9/1/20388 | 48 | 51 | ||||||
Freddie Mac Pool #G08347 4.50% 6/1/20398 | 67 | 67 | ||||||
Freddie Mac Pool #C03518 5.00% 9/1/20408 | 572 | 580 | ||||||
Freddie Mac Pool #Q05807 4.00% 1/1/20428 | 1,648 | 1,586 | ||||||
Freddie Mac Pool #Q23185 4.00% 11/1/20438 | 1,303 | 1,275 | ||||||
Freddie Mac Pool #Q23190 4.00% 11/1/20438 | 758 | 732 | ||||||
Freddie Mac Pool #760014 2.74% 8/1/20458,9 | 179 | 173 | ||||||
Freddie Mac Pool #Q37988 4.00% 12/1/20458 | 5,730 | 5,510 | ||||||
Freddie Mac Pool #G60344 4.00% 12/1/20458 | 4,930 | 4,740 | ||||||
Freddie Mac Pool #Z40130 3.00% 1/1/20468 | 4,452 | 4,029 | ||||||
Freddie Mac Pool #Q41090 4.50% 6/1/20468 | 204 | 200 | ||||||
Freddie Mac Pool #Q41909 4.50% 7/1/20468 | 242 | 238 | ||||||
Freddie Mac Pool #760015 2.561% 1/1/20478,9 | 444 | 420 | ||||||
Freddie Mac Pool #Q46021 3.50% 2/1/20478 | 1,150 | 1,068 | ||||||
Freddie Mac Pool #SI2002 4.00% 3/1/20488 | 2,336 | 2,234 | ||||||
Freddie Mac Pool #SD8106 2.00% 11/1/20508 | 33,078 | 27,081 | ||||||
Freddie Mac Pool #SD7528 2.00% 11/1/20508 | 17,984 | 14,872 | ||||||
Freddie Mac Pool #QC2344 2.50% 4/1/20518 | 966 | 821 | ||||||
Freddie Mac Pool #RA5288 2.00% 5/1/20518 | 30,665 | 25,100 | ||||||
Freddie Mac Pool #SD8151 2.50% 6/1/20518 | 330 | 281 | ||||||
Freddie Mac Pool #RA5782 2.50% 9/1/20518 | 10,333 | 8,855 | ||||||
Freddie Mac Pool #SD7545 2.50% 9/1/20518 | 7,074 | 6,091 | ||||||
Freddie Mac Pool #RA5759 2.50% 9/1/20518 | 2,039 | 1,728 | ||||||
Freddie Mac Pool #QC7910 2.50% 9/1/20518 | 931 | 795 | ||||||
Freddie Mac Pool #QC6921 2.50% 9/1/20518 | 911 | 774 | ||||||
Freddie Mac Pool #RA5971 3.00% 9/1/20518 | 6,901 | 6,123 | ||||||
Freddie Mac Pool #QC6456 3.00% 9/1/20518 | 701 | 616 | ||||||
Freddie Mac Pool #RA6107 2.50% 10/1/20518 | 5,385 | 4,568 | ||||||
Freddie Mac Pool #QC8778 2.50% 10/1/20518 | 462 | 392 | ||||||
Freddie Mac Pool #QC9156 2.50% 10/1/20518 | 327 | 278 | ||||||
Freddie Mac Pool #QC7814 2.50% 10/1/20518 | 27 | 23 | ||||||
Freddie Mac Pool #RA6231 2.50% 11/1/20518 | 1,993 | 1,690 | ||||||
Freddie Mac Pool #QC9944 2.50% 11/1/20518 | 1,474 | 1,251 | ||||||
Freddie Mac Pool #QD1746 2.50% 11/1/20518 | 933 | 792 | ||||||
Freddie Mac Pool #QC9788 2.50% 11/1/20518 | 930 | 790 | ||||||
Freddie Mac Pool #QD1523 2.50% 11/1/20518 | 218 | 185 | ||||||
Freddie Mac Pool #RA6483 2.50% 12/1/20518 | 6,952 | 5,934 | ||||||
Freddie Mac Pool #RA7081 2.50% 12/1/20518 | 2,698 | 2,288 | ||||||
Freddie Mac Pool #QD3362 2.50% 12/1/20518 | 854 | 725 | ||||||
Freddie Mac Pool #RA6433 2.50% 12/1/20518 | 43 | 37 | ||||||
Freddie Mac Pool #RA6485 3.00% 12/1/20518 | 1,935 | 1,701 | ||||||
Freddie Mac Pool #RA6428 3.00% 12/1/20518 | 420 | 369 | ||||||
Freddie Mac Pool #SD0853 2.50% 1/1/20528 | 5,650 | 4,790 | ||||||
Freddie Mac Pool #SD7552 2.50% 1/1/20528 | 2,429 | 2,077 | ||||||
Freddie Mac Pool #SD0854 2.50% 1/1/20528 | 1,987 | 1,688 | ||||||
Freddie Mac Pool #RA6615 2.50% 1/1/20528 | 600 | 510 | ||||||
Freddie Mac Pool #QD5254 2.50% 1/1/20528 | 597 | 507 | ||||||
Freddie Mac Pool #SD8194 2.50% 2/1/20528 | 642 | 545 | ||||||
Freddie Mac Pool #QD9066 2.50% 2/1/20528 | 501 | 426 | ||||||
134 American Funds Insurance Series
Table of Contents
Asset Allocation Fund (continued)
Bonds, notes & other debt instruments (continued)
| Principal amount | Value | |||||||
| (000) | (000) | |||||||
Mortgage-backed obligations (continued) | ||||||||
Federal agency mortgage-backed obligations (continued) | ||||||||
Freddie Mac Pool #QD6379 2.50% 2/1/20528 | USD97 | $ | 83 | |||||
Freddie Mac Pool #QD6971 2.50% 2/1/20528 | 63 | 54 | ||||||
Freddie Mac Pool #QD7312 2.50% 2/1/20528 | 32 | 27 | ||||||
Freddie Mac Pool #RA6806 3.00% 2/1/20528 | 2,000 | 1,758 | ||||||
Freddie Mac Pool #QD6948 3.00% 2/1/20528 | 1,906 | 1,676 | ||||||
Freddie Mac Pool #RA6608 3.00% 2/1/20528 | 954 | 838 | ||||||
Freddie Mac Pool #QD7089 3.50% 2/1/20528 | 1,195 | 1,089 | ||||||
Freddie Mac Pool #QD8976 2.50% 3/1/20528 | 952 | 809 | ||||||
Freddie Mac Pool #QE0957 2.50% 3/1/20528 | 875 | 743 | ||||||
Freddie Mac Pool #RA6959 2.50% 3/1/20528 | 766 | 651 | ||||||
Freddie Mac Pool #QE0615 2.50% 3/1/20528 | 606 | 515 | ||||||
Freddie Mac Pool #SD8200 2.50% 3/1/20528 | 437 | 371 | ||||||
Freddie Mac Pool #QD8152 2.50% 3/1/20528 | 367 | 312 | ||||||
Freddie Mac Pool #QD8673 3.00% 3/1/20528 | 1,542 | 1,356 | ||||||
Freddie Mac Pool #RA6992 3.00% 3/1/20528 | 1,097 | 964 | ||||||
Freddie Mac Pool #SD8205 2.50% 4/1/20528 | 6,581 | 5,582 | ||||||
Freddie Mac Pool #QD9911 2.50% 4/1/20528 | 2,676 | 2,269 | ||||||
Freddie Mac Pool #QE0800 2.50% 4/1/20528 | 2,628 | 2,231 | ||||||
Freddie Mac Pool #QE0170 2.50% 4/1/20528 | 1,711 | 1,451 | ||||||
Freddie Mac Pool #QE3079 2.50% 4/1/20528 | 932 | 792 | ||||||
Freddie Mac Pool #QD9907 2.50% 4/1/20528 | 850 | 722 | ||||||
Freddie Mac Pool #QE0407 2.50% 4/1/20528 | 769 | 653 | ||||||
Freddie Mac Pool #QE5290 2.50% 4/1/20528 | 740 | 628 | ||||||
Freddie Mac Pool #QE0025 2.50% 4/1/20528 | 549 | 466 | ||||||
Freddie Mac Pool #QE0799 2.50% 4/1/20528 | 123 | 105 | ||||||
Freddie Mac Pool #SD7554 2.50% 4/1/20528 | 94 | 80 | ||||||
Freddie Mac Pool #QE2101 2.50% 4/1/20528 | 45 | 38 | ||||||
Freddie Mac Pool #SD8206 3.00% 4/1/20528 | 800 | 703 | ||||||
Freddie Mac Pool #RA7063 3.50% 4/1/20528 | 22,000 | 20,028 | ||||||
Freddie Mac Pool #QE2352 2.50% 5/1/20528 | 40 | 34 | ||||||
Freddie Mac Pool #QE1793 3.00% 5/1/20528 | 1,910 | 1,679 | ||||||
Freddie Mac Pool #QE3080 3.00% 5/1/20528 | 400 | 351 | ||||||
Freddie Mac Pool #RA7386 3.50% 5/1/20528 | 7,332 | 6,669 | ||||||
Freddie Mac Pool #SD8220 3.00% 6/1/20528 | 4,451 | 3,913 | ||||||
Freddie Mac Pool #QE4383 4.00% 6/1/20528 | 2,336 | 2,193 | ||||||
Freddie Mac Pool #QE6097 2.50% 7/1/20528 | 83 | 71 | ||||||
Freddie Mac Pool #QE5714 3.50% 7/1/20528 | 4,000 | 3,639 | ||||||
Freddie Mac Pool #QE6274 3.50% 7/1/20528 | 4,000 | 3,638 | ||||||
Freddie Mac Pool #SD8226 3.50% 7/1/20528 | 2,667 | 2,426 | ||||||
Freddie Mac Pool #QE5983 3.50% 7/1/20528 | 2,000 | 1,819 | ||||||
Freddie Mac Pool #QE7680 4.50% 7/1/20528 | 2,533 | 2,441 | ||||||
Freddie Mac Pool #RA7747 2.50% 8/1/20528 | 2,681 | 2,273 | ||||||
Freddie Mac Pool #QE8026 2.50% 8/1/20528 | 1,675 | 1,421 | ||||||
Freddie Mac Pool #SD8234 2.50% 8/1/20528 | 32 | 27 | ||||||
Freddie Mac Pool #RA7749 3.50% 8/1/20528 | 13,390 | 12,181 | ||||||
Freddie Mac Pool #QE9057 4.00% 8/1/20528 | 1,231 | 1,156 | ||||||
Freddie Mac Pool #QE7157 4.00% 8/1/20528 | 224 | 210 | ||||||
Freddie Mac Pool #SD1576 5.00% 8/1/20528 | 3,206 | 3,165 | ||||||
Freddie Mac Pool #SD8262 2.50% 9/1/20528 | 9,650 | 8,185 | ||||||
Freddie Mac Pool #QF0923 2.50% 9/1/20528 | 597 | 506 | ||||||
Freddie Mac Pool #SD8242 3.00% 9/1/20528 | 17,971 | 15,797 | ||||||
Freddie Mac Pool #SD8243 3.50% 9/1/20528 | 4,039 | 3,675 | ||||||
Freddie Mac Pool #SD8244 4.00% 9/1/20528 | 4,000 | 3,756 | ||||||
Freddie Mac Pool #QE9625 4.00% 9/1/20528 | 1,586 | 1,489 | ||||||
Freddie Mac Pool #QF0152 4.50% 9/1/20528 | 1,531 | 1,475 | ||||||
Freddie Mac Pool #SD8246 5.00% 9/1/20528 | 79,771 | 78,743 | ||||||
Freddie Mac Pool #RA7938 5.00% 9/1/20528 | 1,321 | 1,304 | ||||||
Freddie Mac Pool #QF1751 2.50% 10/1/20528 | 946 | 803 | ||||||
Freddie Mac Pool #SD8271 2.50% 10/1/20528 | 579 | 491 | ||||||
Freddie Mac Pool #QF1464 4.00% 10/1/20528 | 1,521 | 1,429 | ||||||
Freddie Mac Pool #QF1489 4.00% 10/1/20528 | 1,281 | 1,203 | ||||||
American Funds Insurance Series 135
Table of Contents
Asset Allocation Fund (continued)
Bonds, notes & other debt instruments (continued)
| Principal amount | Value | |||||||
| (000) | (000) | |||||||
Mortgage-backed obligations (continued) | ||||||||
Federal agency mortgage-backed obligations (continued) | ||||||||
Freddie Mac Pool #SD8256 4.00% 10/1/20528 | USD1,000 | $ | 939 | |||||
Freddie Mac Pool #QF1925 4.00% 10/1/20528 | 1,000 | 939 | ||||||
Freddie Mac Pool #SD8257 4.50% 10/1/20528 | 53,823 | 51,858 | ||||||
Freddie Mac Pool #QF3304 5.00% 10/1/20528 | 3,694 | 3,646 | ||||||
Freddie Mac Pool #SD8291 2.50% 11/1/20528 | 855 | 725 | ||||||
Freddie Mac Pool #SD8283 2.50% 11/1/20528 | 634 | 538 | ||||||
Freddie Mac Pool #SD8273 3.50% 11/1/20528 | 4,000 | 3,639 | ||||||
Freddie Mac Pool #SD8264 3.50% 11/1/20528 | 4,000 | 3,639 | ||||||
Freddie Mac Pool #QF3364 4.00% 11/1/20528 | 2,477 | 2,326 | ||||||
Freddie Mac Pool #SD8265 4.00% 11/1/20528 | 251 | 235 | ||||||
Freddie Mac Pool #SD8266 4.50% 11/1/20528 | 4 | 3 | ||||||
Freddie Mac Pool #SD8275 4.50% 12/1/20528 | 1,295 | 1,248 | ||||||
Freddie Mac Pool #SD8276 5.00% 12/1/20528 | 6,999 | 6,909 | ||||||
Freddie Mac Pool #SD8281 6.50% 12/1/20528 | 14,617 | 14,994 | ||||||
Freddie Mac Pool #SD8284 3.00% 1/1/20538 | 11,360 | 9,985 | ||||||
Freddie Mac Pool #SD8285 3.50% 1/1/20538 | 5,499 | 5,003 | ||||||
Freddie Mac Pool #SD8286 4.00% 1/1/20538 | 336 | 315 | ||||||
Freddie Mac Pool #SD8288 5.00% 1/1/20538 | 3,778 | 3,729 | ||||||
Freddie Mac Pool #SD8282 6.50% 1/1/20538 | 706 | 724 | ||||||
Freddie Mac, Series T041, Class 3A, 4.402% 7/25/20328,9 | 187 | 179 | ||||||
Freddie Mac, Series K733, Class A2, Multi Family, 3.75% 8/25/20258,9 | 9,778 | 9,538 | ||||||
Freddie Mac, Series K734, Class A2, Multi Family, 3.208% 2/25/20268 | 7,370 | 7,077 | ||||||
Freddie Mac, Series K076, Class A2, Multi Family, 3.90% 4/25/20288 | 3,237 | 3,158 | ||||||
Freddie Mac, Series K143, Class A2, Multi Family, 2.35% 6/25/20328 | 19,961 | 16,758 | ||||||
Freddie Mac Seasoned Credit Risk Transfer Trust, Series 2017-1, Class HA, 3.00% 1/25/20568,9 | 2,646 | 2,476 | ||||||
Freddie Mac Seasoned Credit Risk Transfer Trust, Series 2017-3, Class HA, 3.25% 7/25/20568,9 | 1,149 | 1,082 | ||||||
Freddie Mac Seasoned Credit Risk Transfer Trust, Series 2017-2, Class MA, 3.00% 8/25/20568 | 5,121 | 4,758 | ||||||
Freddie Mac Seasoned Credit Risk Transfer Trust, Series 2017-2, Class HA, 3.00% 8/25/20568,9 | 5,074 | 4,744 | ||||||
Freddie Mac Seasoned Credit Risk Transfer Trust, Series 2017-4, Class HT, 3.25% 6/25/20578,9 | 911 | 831 | ||||||
Freddie Mac Seasoned Credit Risk Transfer Trust, Series 2017-4, Class MT, 3.50% 6/25/20578 | 755 | 684 | ||||||
Freddie Mac Seasoned Credit Risk Transfer Trust, Series 2018-3, Class MA, 3.50% 8/25/20578 | 1,823 | 1,730 | ||||||
Freddie Mac Seasoned Credit Risk Transfer Trust, Series 2018-2, Class MT, 3.50% 11/25/20578 | 1,942 | 1,757 | ||||||
Freddie Mac Seasoned Credit Risk Transfer Trust, Series 2019-2, Class MA, 3.50% 8/25/20588 | 9,501 | 8,965 | ||||||
Freddie Mac Seasoned Credit Risk Transfer Trust, Series 2019-4, Class MA, 3.00% 2/25/20598 | 5,448 | 5,052 | ||||||
Freddie Mac Seasoned Loan Structured Transaction Trust, Series 2018-2, Class A1, 3.50% 11/25/20288 | 2,154 | 2,056 | ||||||
Freddie Mac Seasoned Loan Structured Transaction Trust, Series 2019-1, Class A1, 3.50% 5/25/20298 | 4,272 | 4,072 | ||||||
Freddie Mac Seasoned Loan Structured Transaction Trust, Series 2019-1, Class A2, 3.50% 5/25/20298 | 2,455 | 2,255 | ||||||
Freddie Mac Seasoned Loan Structured Transaction Trust, Series 2019-3, Class A1C, 2.75% 11/25/20298 | 2,682 | 2,465 | ||||||
Government National Mortgage Assn. 2.00% 1/1/20538,10 | 68,784 | 57,662 | ||||||
Government National Mortgage Assn. 2.50% 1/1/20538,10 | 5,866 | 5,085 | ||||||
Government National Mortgage Assn. 3.00% 1/1/20538,10 | 83,663 | 74,514 | ||||||
Government National Mortgage Assn. 3.50% 1/1/20538,10 | 16,502 | 15,165 | ||||||
Government National Mortgage Assn. 4.00% 1/1/20538,10 | 3,200 | 3,029 | ||||||
Government National Mortgage Assn. 4.50% 1/1/20538,10 | 33,456 | 32,460 | ||||||
Government National Mortgage Assn. Pool #BD7245 4.00% 1/20/20488 | 437 | 417 | ||||||
Government National Mortgage Assn. Pool #MA5652 4.50% 12/20/20488 | 342 | 332 | ||||||
Government National Mortgage Assn. Pool #MA6602 4.50% 4/20/20508 | 204 | 200 | ||||||
136 American Funds Insurance Series
Table of Contents
Asset Allocation Fund (continued)
Bonds, notes & other debt instruments (continued)
| Principal amount | Value | |||||||
| (000) | (000) | |||||||
Mortgage-backed obligations (continued) | ||||||||
Federal agency mortgage-backed obligations (continued) | ||||||||
Government National Mortgage Assn. Pool #MA7259 4.50% 3/20/20518 | USD1,762 | $ | 1,734 | |||||
Government National Mortgage Assn. Pool #MA7316 4.50% 4/20/20518 | 490 | 482 | ||||||
Government National Mortgage Assn. Pool #MA8346 4.00% 10/20/20528 | 1,260 | 1,193 | ||||||
Government National Mortgage Assn. Pool #MA8426 4.00% 11/20/20528 | 10,566 | 10,009 | ||||||
Government National Mortgage Assn. Pool #MA8488 4.00% 12/20/20528 | 1,000 | 947 | ||||||
Uniform Mortgage-Backed Security 1.50% 1/1/20388,10 | 25,420 | 22,012 | ||||||
Uniform Mortgage-Backed Security 2.50% 1/1/20388,10 | 638 | 584 | ||||||
Uniform Mortgage-Backed Security 2.00% 1/1/20538,10 | 108,193 | 88,062 | ||||||
Uniform Mortgage-Backed Security 4.00% 1/1/20538,10 | 7,100 | 6,660 | ||||||
Uniform Mortgage-Backed Security 4.50% 1/1/20538,10 | 9,560 | 9,203 | ||||||
Uniform Mortgage-Backed Security 5.00% 1/1/20538,10 | 4,884 | 4,813 | ||||||
Uniform Mortgage-Backed Security 5.50% 1/1/20538,10 | 60,890 | 61,059 | ||||||
Uniform Mortgage-Backed Security 6.00% 1/1/20538,10 | 12,770 | 12,962 | ||||||
Uniform Mortgage-Backed Security 4.00% 2/1/20538,10 | 15,948 | 14,963 | ||||||
Uniform Mortgage-Backed Security 5.00% 2/1/20538,10 | 35,408 | 34,891 | ||||||
Uniform Mortgage-Backed Security 5.50% 2/1/20538,10 | 16,800 | 16,838 | ||||||
Uniform Mortgage-Backed Security 6.00% 2/1/20538,10 | 36,230 | 36,745 | ||||||
|
| |||||||
| 1,739,465 | ||||||||
|
| |||||||
Commercial mortgage-backed securities 0.44% | ||||||||
Bank Commercial Mortgage Trust, Series 2020-BN26, Class A4, 2.403% 3/15/20638 | 2,909 | 2,435 | ||||||
Bank Commercial Mortgage Trust, Series 2022-BNK40, Class A4, 3.394% 3/15/20648,9 | 2,550 | 2,246 | ||||||
Barclays Commercial Mortgage Securities, LLC, Series 2017-DELC, Class A, 5.293% 8/15/20366,8,9 | 2,000 | 1,966 | ||||||
Benchmark Mortgage Trust, Series 2018-B2, Class A4, 3.615% 2/15/20518 | 1,000 | 927 | ||||||
Benchmark Mortgage Trust, Series 2020-B17, Class A5, 2.289% 3/15/20538 | 2,960 | 2,466 | ||||||
BX Trust, Series 2021-SDMF, Class A, (1-month USD-LIBOR + 0.589%) 4.907% 9/15/20346,8,9 | 5,954 | 5,711 | ||||||
BX Trust, Series 2021-VOLT, Class A, (1-month USD-LIBOR + 0.70%) 5.018% 9/15/20366,8,9 | 4,505 | 4,346 | ||||||
BX Trust, Series 2021-ARIA, Class A, (1-month USD-LIBOR + 0.899%) 5.217% 10/15/20366,8,9 | 7,968 | 7,593 | ||||||
BX Trust, Series 2021-ARIA, Class B, (1-month USD-LIBOR + 1.297%) 5.615% 10/15/20366,8,9 | 5,968 | 5,613 | ||||||
BX Trust, Series 2021-SOAR, Class A, (1-month USD-LIBOR + 0.67%) 4.988% 6/15/20386,8,9 | 7,481 | 7,216 | ||||||
BX Trust, Series 2021-SOAR, Class B, (1-month USD-LIBOR + 0.87%) 5.188% 6/15/20386,8,9 | 1,351 | 1,290 | ||||||
BX Trust, Series 2021-SOAR, Class C, (1-month USD-LIBOR + 1.10%) 5.418% 6/15/20386,8,9 | 1,220 | 1,156 | ||||||
BX Trust, Series 2021-ACNT, Class A, (1-month USD-LIBOR + 0.85%) 5.168% 11/15/20386,8,9 | 5,254 | 5,063 | ||||||
Citigroup Commercial Mortgage Trust, Series 2015-GC29, Class AAB, 2.984% 4/10/20488 | 470 | 459 | ||||||
Commercial Mortgage Trust, Series 2015-PC1, Class A5, 3.902% 7/10/20508 | 4,735 | 4,540 | ||||||
CSAIL Commercial Mortgage Trust, Series 2015-C4, Class ASB, 3.617% 11/15/20488 | 780 | 758 | ||||||
Extended Stay America Trust, Series 2021-ESH, Class A, (1-month USD-LIBOR + 1.08%) 5.398% 7/15/20386,8,9 | 1,537 | 1,495 | ||||||
Extended Stay America Trust, Series 2021-ESH, Class B, (1-month USD-LIBOR + 1.38%) 5.698% 7/15/20386,8,9 | 1,403 | 1,351 | ||||||
Extended Stay America Trust, Series 2021-ESH, Class C, (1-month USD-LIBOR + 1.70%) 6.018% 7/15/20386,8,9 | 1,465 | 1,410 | ||||||
Grace Mortgage Trust, Series 2020-GRCE, Class A, 2.347% 12/10/20406,8 | 3,795 | 2,918 | ||||||
GS Mortgage Securities Trust, Series 2020-GC47, Class A5, 2.377% 5/12/20538 | 2,489 | 2,059 | ||||||
JPMorgan Chase Commercial Mortgage Securities Trust, Series 2022-OPO, Class A, 3.024% 1/5/20396,8 | 1,964 | 1,682 | ||||||
JPMorgan Chase Commercial Mortgage Securities Trust, Series 2022-OPO, Class C, 3.377% 1/5/20396,8 | 868 | 708 | ||||||
JPMorgan Chase Commercial Mortgage Securities Trust, Series 2022-OPO, Class C, 3.565% 1/5/20396,8,9 | 523 | 407 | ||||||
American Funds Insurance Series 137
Table of Contents
Asset Allocation Fund (continued)
Bonds, notes & other debt instruments (continued)
| Principal amount | Value | |||||||
| (000) | (000) | |||||||
Mortgage-backed obligations (continued) | ||||||||
Commercial mortgage-backed securities (continued) | ||||||||
JPMorgan Chase Commercial Mortgage Securities Trust, Series 2021-410T, Class A, 2.287% 3/5/20426,8 | USD1,431 | $ | 1,171 | |||||
LUXE Commercial Mortgage Trust, Series 2021-TRIP, Class A, (1-month USD-LIBOR + 1.05%) 5.368% 10/15/20386,8,9 | 1,236 | 1,184 | ||||||
LUXE Commercial Mortgage Trust, Series 2021-TRIP, Class B, (1-month USD-LIBOR + 1.40%) 5.718% 10/15/20386,8,9 | 1,904 | 1,803 | ||||||
Manhattan West Mortgage Trust, Series 2020-1MW, Class A, 2.13% 9/10/20396,8 | 13,772 | 11,780 | ||||||
MHC Commercial Mortgage Trust, CMO, Series 2021-MHC, Class A, (1-month USD-LIBOR + 0.801%) 5.119% 4/15/20266,8,9 | 3,950 | 3,837 | ||||||
Morgan Stanley Bank of America Merrill Lynch Trust, Series 2015-C27, Class ASB, 3.557% 12/15/20478 | 556 | 541 | ||||||
Morgan Stanley Bank of America Merrill Lynch Trust, Series 2015-C22, Class ASB, 3.04% 4/15/20488 | 467 | 454 | ||||||
SLG Office Trust, Series 2021-OVA, Class A, 2.585% 7/15/20416,8 | 2,194 | 1,756 | ||||||
SREIT Trust, Series 2021-MFP, Class A, (1-month USD-LIBOR + 0.731%) 5.049% 11/15/20386,8,9 | 4,808 | 4,631 | ||||||
StorageMart Commercial Mortgage Trust, Series 2022-MINI, Class A, (1-month USD CME Term SOFR + 1.00%) 5.336% 1/15/20396,8,9 | 10,709 | 10,352 | ||||||
WMRK Commercial Mortgage Trust, Series 2022-WMRK, Class A, (1-month USD CME Term SOFR + 2.789%) 7.125% 11/15/20276,8,9 | 6,379 | 6,373 | ||||||
|
| |||||||
| 109,697 | ||||||||
|
| |||||||
Collateralized mortgage-backed obligations (privately originated) 0.12% | ||||||||
Arroyo Mortgage Trust, Series 2021-1R, Class A1, 1.175% 10/25/20486,8,9 | 1,101 | 870 | ||||||
Bellemeade Re, Ltd., Series 2019-3A, Class M1B, (1-month USD-LIBOR + 1.60%) 5.989% 7/25/20296,8,9 | 496 | 496 | ||||||
Cascade Funding Mortgage Trust, Series 2018-RM2, Class A, 4.00% 10/25/20686,8,9 | 1,181 | 1,140 | ||||||
Connecticut Avenue Securities Trust, Series 2021-R01, Class 1M1, (30-day Average USD-SOFR + 0.75%) 4.678% 10/25/20416,8,9 | 192 | 190 | ||||||
Credit Suisse Mortgage Trust, Series 2020-NET, Class A, 2.257% 8/15/20376,8 | 4,096 | 3,664 | ||||||
Credit Suisse Mortgage Trust, Series 2017-RPL3, Class A1, 2.00% 1/25/20606,8,9 | 2,081 | 1,788 | ||||||
CS First Boston Mortgage Securities Corp., Series 2004-5, Class IVA1, 6.00% 9/25/20348 | 148 | 141 | ||||||
Finance of America Structured Securities Trust, Series 2019-JR1, Class A, 2.00% 3/25/20696,8 | 2,051 | 2,196 | ||||||
Finance of America Structured Securities Trust, Series 2019-JR2, Class A1, 2.00% 6/25/20696,8 | 6,250 | 6,425 | ||||||
Freddie Mac Structured Agency Credit Risk Debt Notes, Series 2015-DNA1, Class M3, (1-month USD-LIBOR + 3.30%) 7.689% 10/25/20278,9 | 235 | 237 | ||||||
Freddie Mac Structured Agency Credit Risk Debt Notes, Series 2022-DNA6, Class M1A, (30-day Average USD-SOFR + 2.15%) 6.078% 9/25/20426,8,9 | 996 | 998 | ||||||
Home Partners of America Trust, Series 2021-2, Class A, 1.901% 12/17/20266,8 | 4,304 | 3,724 | ||||||
Legacy Mortgage Asset Trust, Series 2019-GS7, Class A1, 6.25% 11/25/20596,8,9 | 1,042 | 1,042 | ||||||
MASTR Alternative Loan Trust, Series 2004-2, Class 2A1, 6.00% 2/25/20348 | 314 | 300 | ||||||
Mello Warehouse Securitization Trust, Series 2021-3, Class A, (1-month USD-LIBOR + 0.85%) 5.239% 11/25/20556,8,9 | 4,040 | 3,909 | ||||||
Onslow Bay Financial Mortgage Loan Trust, Series 2022-J1, Class A2, 2.50% 2/25/20526,8,9 | 2,784 | 2,248 | ||||||
RMF Proprietary Issuance Trust, Series 2019-1, Class A, 2.75% 10/25/20636,8,9 | 355 | 328 | ||||||
|
| |||||||
| 29,696 | ||||||||
|
| |||||||
Total mortgage-backed obligations | 1,878,858 | |||||||
|
| |||||||
U.S. Treasury bonds & notes 6.52% | ||||||||
U.S. Treasury 4.53% | ||||||||
U.S. Treasury 0.125% 2/28/2023 | 44,825 | 44,537 | ||||||
U.S. Treasury 2.50% 5/15/2024 | 700 | 679 | ||||||
U.S. Treasury 2.50% 5/31/2024 | 100,000 | 97,016 | ||||||
U.S. Treasury 3.25% 8/31/2024 | 22,613 | 22,143 | ||||||
U.S. Treasury 1.50% 9/30/2024 | 907 | 862 | ||||||
U.S. Treasury 4.50% 11/30/2024 | 760 | 760 | ||||||
138 American Funds Insurance Series
Table of Contents
Asset Allocation Fund (continued)
Bonds, notes & other debt instruments (continued)
| Principal amount | Value | |||||||
| (000) | (000) | |||||||
U.S. Treasury bonds & notes (continued) | ||||||||
U.S. Treasury (continued) | ||||||||
U.S. Treasury 1.00% 12/15/2024 | USD10,725 | $ | 10,038 | |||||
U.S. Treasury 3.00% 7/15/2025 | 3,165 | 3,066 | ||||||
U.S. Treasury 4.00% 12/15/2025 | 32,029 | 31,829 | ||||||
U.S. Treasury 0.375% 1/31/2026 | 45,000 | 40,052 | ||||||
U.S. Treasury 0.50% 2/28/2026 | 42,515 | 37,903 | ||||||
U.S. Treasury 1.625% 5/15/2026 | 1,500 | 1,381 | ||||||
U.S. Treasury 1.50% 8/15/2026 | 500 | 456 | ||||||
U.S. Treasury 0.75% 8/31/2026 | 52 | 46 | ||||||
U.S. Treasury 0.875% 9/30/2026 | 565 | 502 | ||||||
U.S. Treasury 1.125% 10/31/2026 | 471 | 421 | ||||||
U.S. Treasury 1.125% 2/28/2027 | 762 | 678 | ||||||
U.S. Treasury 2.375% 5/15/2027 | 880 | 820 | ||||||
U.S. Treasury 2.625% 5/31/2027 | 96,250 | 90,738 | ||||||
U.S. Treasury 0.50% 6/30/2027 | 36,300 | 31,057 | ||||||
U.S. Treasury 4.125% 9/30/2027 | 90,000 | 90,345 | ||||||
U.S. Treasury 3.875% 11/30/2027 | 39,923 | 39,707 | ||||||
U.S. Treasury 0.625% 12/31/2027 | 7,109 | 6,025 | ||||||
U.S. Treasury 2.875% 5/15/2028 | 5,217 | 4,926 | ||||||
U.S. Treasury 1.25% 9/30/2028 | 3,142 | 2,699 | ||||||
U.S. Treasury 1.50% 11/30/2028 | 50,000 | 43,417 | ||||||
U.S. Treasury 1.375% 12/31/2028 | 10,900 | 9,398 | ||||||
U.S. Treasury 2.875% 4/30/2029 | 50,000 | 46,843 | ||||||
U.S. Treasury 3.875% 11/30/2029 | 1,662 | 1,651 | ||||||
U.S. Treasury 1.50% 2/15/2030 | 36,651 | 31,236 | ||||||
U.S. Treasury 0.625% 5/15/2030 | 20,225 | 16,012 | ||||||
U.S. Treasury 2.875% 5/15/2032 | 50,000 | 46,102 | ||||||
U.S. Treasury 4.125% 11/15/2032 | 96,356 | 98,276 | ||||||
U.S. Treasury 1.125% 5/15/2040 | 62,775 | 39,393 | ||||||
U.S. Treasury 1.375% 11/15/2040 | 52,695 | 34,328 | ||||||
U.S. Treasury 1.75% 8/15/2041 | 47,854 | 32,834 | ||||||
U.S. Treasury 2.00% 11/15/2041 | 1,181 | 846 | ||||||
U.S. Treasury 4.00% 11/15/2042 | 21,751 | 21,312 | ||||||
U.S. Treasury 2.50% 2/15/2046 | 3,755 | 2,822 | ||||||
U.S. Treasury 3.00% 5/15/2047 | 9,355 | 7,690 | ||||||
U.S. Treasury 3.00% 2/15/2048 | 336 | 277 | ||||||
U.S. Treasury 2.00% 2/15/2050 | 13,825 | 9,184 | ||||||
U.S. Treasury 1.375% 8/15/2050 | 12,500 | 6,993 | ||||||
U.S. Treasury 2.375% 5/15/2051 | 4,757 | 3,430 | ||||||
U.S. Treasury 2.00% 8/15/2051 | 1,356 | 893 | ||||||
U.S. Treasury 2.25% 2/15/205211 | 72,025 | 50,351 | ||||||
U.S. Treasury 3.00% 8/15/205211 | 73,627 | 61,049 | ||||||
|
| |||||||
| 1,123,023 | ||||||||
|
| |||||||
U.S. Treasury inflation-protected securities 1.99% | ||||||||
U.S. Treasury Inflation-Protected Security 0.50% 4/15/202412 | 22,067 | 21,475 | ||||||
U.S. Treasury Inflation-Protected Security 0.125% 7/15/202412 | 76,769 | 74,363 | ||||||
U.S. Treasury Inflation-Protected Security 0.125% 10/15/202412 | 98,718 | 95,142 | ||||||
U.S. Treasury Inflation-Protected Security 0.25% 1/15/202512 | 25,161 | 24,151 | ||||||
U.S. Treasury Inflation-Protected Security 0.375% 7/15/202512 | 4,649 | 4,467 | ||||||
U.S. Treasury Inflation-Protected Security 0.125% 10/15/202512 | 3,905 | 3,711 | ||||||
U.S. Treasury Inflation-Protected Security 0.125% 4/15/202612 | 43,574 | 40,962 | ||||||
U.S. Treasury Inflation-Protected Security 0.125% 10/15/202612 | 15,266 | 14,319 | ||||||
U.S. Treasury Inflation-Protected Security 1.625% 10/15/202712 | 50,295 | 50,231 | ||||||
U.S. Treasury Inflation-Protected Security 0.75% 7/15/202812 | 20,774 | 19,790 | ||||||
U.S. Treasury Inflation-Protected Security 0.875% 1/15/202912 | 23,419 | 22,309 | ||||||
American Funds Insurance Series 139
Table of Contents
Asset Allocation Fund (continued)
Bonds, notes & other debt instruments (continued)
| Principal amount | Value | |||||||
| (000) | (000) | |||||||
U.S. Treasury bonds & notes (continued) | ||||||||
U.S. Treasury inflation-protected securities (continued) | ||||||||
U.S. Treasury Inflation-Protected Security 0.125% 1/15/203112 | USD27,071 | $ | 24,019 | |||||
U.S. Treasury Inflation-Protected Security 0.125% 1/15/203212 | 60,545 | 52,974 | ||||||
U.S. Treasury Inflation-Protected Security 1.00% 2/15/204912 | 55,158 | 46,174 | ||||||
|
| |||||||
| 494,087 | ||||||||
|
| |||||||
Total U.S. Treasury bonds & notes | 1,617,110 | |||||||
|
| |||||||
Corporate bonds, notes & loans 5.63% | ||||||||
Financials 1.27% | ||||||||
ACE INA Holdings, Inc. 3.35% 5/3/2026 | 880 | 843 | ||||||
ACE INA Holdings, Inc. 4.35% 11/3/2045 | 400 | 348 | ||||||
Advisor Group Holdings, LLC 6.25% 3/1/20286 | 4,470 | 4,115 | ||||||
AerCap Ireland Capital DAC 2.45% 10/29/2026 | 5,457 | 4,779 | ||||||
AerCap Ireland Capital DAC 3.00% 10/29/2028 | 4,501 | 3,779 | ||||||
AerCap Ireland Capital DAC 3.30% 1/30/2032 | 2,838 | 2,226 | ||||||
AerCap Ireland Capital DAC 3.85% 10/29/2041 | 1,970 | 1,400 | ||||||
AG Merger Sub II, Inc. 10.75% 8/1/20276 | 2,420 | 2,453 | ||||||
AG TTMT Escrow Issuer, LLC 8.625% 9/30/20276 | 1,072 | 1,083 | ||||||
AIB Group PLC 7.583% 10/14/2026 (USD-SOFR + 3.456% on 10/14/2025)6,13 | 7,750 | 7,899 | ||||||
Alliant Holdings Intermediate, LLC 4.25% 10/15/20276 | 2,100 | 1,884 | ||||||
Alliant Holdings Intermediate, LLC 5.875% 11/1/20296 | 2,295 | 1,890 | ||||||
Ally Financial, Inc. 8.00% 11/1/2031 | 3,000 | 3,127 | ||||||
American International Group, Inc. 2.50% 6/30/2025 | 10,533 | 9,926 | ||||||
AmWINS Group, Inc. 4.875% 6/30/20296 | 1,348 | 1,145 | ||||||
Aretec Escrow Issuer, Inc. 7.50% 4/1/20296 | 1,250 | 1,034 | ||||||
Banco Santander, SA 5.147% 8/18/2025 | 2,400 | 2,376 | ||||||
Bangkok Bank PCL 3.733% 9/25/2034 (5-year UST Yield Curve Rate T Note Constant Maturity + 1.90% on 9/25/2029)13 | 2,428 | 2,034 | ||||||
Bank of America Corp. 3.55% 3/5/2024 (3-month USD-LIBOR + 0.78% on 3/5/2023)13 | 6,000 | 5,978 | ||||||
Bank of America Corp. 1.197% 10/24/2026 (USD-SOFR + 1.01% on 10/24/2025)13 | 2,500 | 2,225 | ||||||
Bank of America Corp. 1.734% 7/22/2027 (USD-SOFR + 0.96% on 7/22/2026)13 | 1,565 | 1,373 | ||||||
Bank of America Corp. 3.419% 12/20/2028 (3-month USD-LIBOR + 1.04% on 12/20/2027)13 | 2,345 | 2,127 | ||||||
Bank of America Corp. 1.922% 10/24/2031 (USD-SOFR + 1.37% on 10/24/2030)13 | 1,000 | 766 | ||||||
Bank of Nova Scotia 1.625% 5/1/2023 | 5,000 | 4,948 | ||||||
Berkshire Hathaway, Inc. 2.75% 3/15/2023 | 1,615 | 1,608 | ||||||
Berkshire Hathaway, Inc. 3.125% 3/15/2026 | 500 | 480 | ||||||
Blackstone Private Credit Fund 7.05% 9/29/20256 | 2,510 | 2,493 | ||||||
BNP Paribas SA 2.159% 9/15/2029 (USD-SOFR + 1.218% on 9/15/2028)6,13 | 2,400 | 1,961 | ||||||
Castlelake Aviation Finance DAC 5.00% 4/15/20276 | 3,370 | 2,937 | ||||||
Citigroup, Inc. 5.61% 9/29/2026 (USD-SOFR + 1.546% on 12/29/2025)13 | 8,000 | 8,043 | ||||||
Citigroup, Inc. 2.976% 11/5/2030 (USD-SOFR + 1.422% on 11/5/2029)13 | 3,254 | 2,743 | ||||||
CME Group, Inc. 3.75% 6/15/2028 | 3,425 | 3,297 | ||||||
Coinbase Global, Inc. 3.375% 10/1/20286 | 2,625 | 1,391 | ||||||
Coinbase Global, Inc. 3.625% 10/1/20316 | 2,875 | 1,388 | ||||||
Compass Diversified Holdings 5.25% 4/15/20296 | 820 | 703 | ||||||
Compass Diversified Holdings 5.00% 1/15/20326 | 715 | 569 | ||||||
Corebridge Financial, Inc. 3.50% 4/4/20256 | 642 | 616 | ||||||
Corebridge Financial, Inc. 3.65% 4/5/20276 | 914 | 853 | ||||||
Corebridge Financial, Inc. 3.85% 4/5/20296 | 621 | 567 | ||||||
Corebridge Financial, Inc. 3.90% 4/5/20326 | 351 | 307 | ||||||
Corebridge Financial, Inc. 4.35% 4/5/20426 | 203 | 167 | ||||||
Corebridge Financial, Inc. 4.40% 4/5/20526 | 489 | 390 | ||||||
Crédit Agricole SA 4.375% 3/17/20256 | 850 | 822 | ||||||
Credit Suisse Group AG 3.80% 6/9/2023 | 1,875 | 1,826 | ||||||
Credit Suisse Group AG 4.207% 6/12/2024 (3-month USD-LIBOR + 1.24% on 6/12/2023)6,13 | 4,500 | 4,388 | ||||||
Credit Suisse Group AG 3.625% 9/9/2024 | 1,500 | 1,400 | ||||||
Credit Suisse Group AG 2.593% 9/11/2025 (USD-SOFR + 1.56% on 9/11/2024)6,13 | 1,568 | 1,387 | ||||||
Credit Suisse Group AG 2.193% 6/5/2026 (USD-SOFR + 2.044% on 6/5/2025)6,13 | 1,250 | 1,069 | ||||||
140 American Funds Insurance Series
Table of Contents
Asset Allocation Fund (continued)
Bonds, notes & other debt instruments (continued)
| Principal amount | Value | |||||||
| (000) | (000) | |||||||
Corporate bonds, notes & loans (continued) | ||||||||
Financials (continued) | ||||||||
Credit Suisse Group AG 3.869% 1/12/2029 (3-month USD-LIBOR + 1.41% on 1/12/2028)6,13 | USD | 800 | $ | 642 | ||||
Danske Bank AS 3.773% 3/28/2025 (1-year UST Yield Curve Rate T Note Constant Maturity + 1.45% on 3/28/2024)6,13 | 6,000 | 5,817 | ||||||
Deutsche Bank AG 2.129% 11/24/2026 (USD-SOFR + 1.87% on 11/24/2025)13 | 2,212 | 1,954 | ||||||
Deutsche Bank AG 2.311% 11/16/2027 (USD-SOFR + 1.219% on 11/16/2026)13 | 2,788 | 2,367 | ||||||
Deutsche Bank AG 2.552% 1/7/2028 (USD-SOFR + 1.318% on 1/7/2027)13 | 5,000 | 4,257 | ||||||
Digital Currency Group, Inc., Term Loan, (3-month USD-LIBOR + 7.00%) 8.00% 11/30/20263,9,14 | 709 | 616 | ||||||
Digital Currency Group, Inc., Term Loan, 8.75% 11/30/20263,14 | 945 | 758 | ||||||
DNB Bank ASA 5.896% 10/9/2026 (USD-SOFR + 1.95% on 10/9/2025)6,13 | 7,750 | 7,758 | ||||||
FS Energy and Power Fund 7.50% 8/15/20236 | 1,995 | 2,001 | ||||||
Goldman Sachs Group, Inc. 1.948% 10/21/2027 (USD-SOFR + 0.913% on 10/21/2026)13 | 2,198 | 1,925 | ||||||
Goldman Sachs Group, Inc. 2.64% 2/24/2028 (USD-SOFR + 1.114% on 2/24/2027)13 | 4,000 | 3,567 | ||||||
Goldman Sachs Group, Inc. 3.814% 4/23/2029 (3-month USD-LIBOR + 1.158% on 4/23/2028)13 | 390 | 357 | ||||||
Goldman Sachs Group, Inc. 2.615% 4/22/2032 (USD-SOFR + 1.281% on 4/22/2031)13 | 2,323 | 1,858 | ||||||
Goldman Sachs Group, Inc. 3.21% 4/22/2042 (USD-SOFR + 1.513% on 4/22/2041)13 | 2,000 | 1,448 | ||||||
Groupe BPCE SA 2.75% 1/11/20236 | 600 | 600 | ||||||
Groupe BPCE SA 5.70% 10/22/20236 | 2,250 | 2,234 | ||||||
Groupe BPCE SA 5.15% 7/21/20246 | 3,710 | 3,634 | ||||||
Groupe BPCE SA 1.00% 1/20/20266 | 3,000 | 2,633 | ||||||
Hightower Holding, LLC 6.75% 4/15/20296 | 870 | 731 | ||||||
HSBC Holdings PLC 4.25% 3/14/2024 | 3,000 | 2,948 | ||||||
HSBC Holdings PLC 2.633% 11/7/2025 (3-month USD-LIBOR + 1.14% on 11/7/2024)13 | 625 | 587 | ||||||
HSBC Holdings PLC 2.099% 6/4/2026 (USD-SOFR + 1.929% on 6/4/2025)13 | 3,000 | 2,733 | ||||||
HSBC Holdings PLC 3.973% 5/22/2030 (3-month USD-LIBOR + 1.61% on 5/22/2029)13 | 1,500 | 1,316 | ||||||
Intercontinental Exchange, Inc. 2.65% 9/15/2040 | 7,425 | 5,166 | ||||||
Intesa Sanpaolo SpA 3.375% 1/12/20236 | 750 | 750 | ||||||
Intesa Sanpaolo SpA 5.017% 6/26/20246 | 1,730 | 1,664 | ||||||
Intesa Sanpaolo SpA 3.25% 9/23/20246 | 750 | 712 | ||||||
Intesa Sanpaolo SpA 3.875% 7/14/20276 | 300 | 268 | ||||||
Intesa Sanpaolo SpA 8.248% 11/21/2033 (1-year UST Yield Curve Rate T Note Constant Maturity + 4.40% on 11/21/2032)6,13 | 4,600 | 4,680 | ||||||
JPMorgan Chase & Co. 3.559% 4/23/2024 (3-month USD-LIBOR + 0.73% on 4/23/2023)13 | 4,725 | 4,694 | ||||||
JPMorgan Chase & Co. 4.08% 4/26/2026 (USD-SOFR + 1.32% on 4/26/2025)13 | 6,000 | 5,831 | ||||||
JPMorgan Chase & Co. 4.323% 4/26/2028 (USD-SOFR + 1.56% on 4/26/2027)13 | 4,000 | 3,826 | ||||||
JPMorgan Chase & Co. 4.851% 7/25/2028 (USD-SOFR + 1.99% on 7/25/2027)13 | 3,740 | 3,652 | ||||||
JPMorgan Chase & Co. 4.586% 4/26/2033 (USD-SOFR + 1.80% on 4/26/2032)13 | 299 | 278 | ||||||
JPMorgan Chase & Co. 4.912% 7/25/2033 (USD-SOFR + 2.08% on 7/25/2032)13 | 3,982 | 3,803 | ||||||
Kasikornbank PCL HK 3.343% 10/2/2031 (5-year UST Yield Curve Rate T Note Constant Maturity + 1.70% on 10/2/2026)13 | 1,222 | 1,077 | ||||||
Lloyds Banking Group PLC 4.05% 8/16/2023 | 2,000 | 1,987 | ||||||
Lloyds Banking Group PLC 1.627% 5/11/2027 (1-year UST Yield Curve Rate T Note Constant Maturity + 0.85% on 5/11/2026)13 | 800 | 693 | ||||||
LPL Holdings, Inc. 4.625% 11/15/20276 | 2,700 | 2,527 | ||||||
LPL Holdings, Inc. 4.375% 5/15/20316 | 1,805 | 1,537 | ||||||
Marsh & McLennan Companies, Inc. 3.875% 3/15/2024 | 820 | 809 | ||||||
Marsh & McLennan Companies, Inc. 4.375% 3/15/2029 | 1,705 | 1,651 | ||||||
Marsh & McLennan Companies, Inc. 4.90% 3/15/2049 | 719 | 665 | ||||||
Marsh & McLennan Companies, Inc. 2.90% 12/15/2051 | 920 | 594 | ||||||
MGIC Investment Corp. 5.25% 8/15/2028 | 1,175 | 1,085 | ||||||
Morgan Stanley 3.737% 4/24/2024 (3-month USD-LIBOR + 0.847% on 4/24/2023)13 | 300 | 298 | ||||||
Morgan Stanley 4.679% 7/17/2026 (USD-SOFR + 1.669% on 7/17/2025)13 | 2,450 | 2,410 | ||||||
American Funds Insurance Series 141
Table of Contents
Asset Allocation Fund (continued)
Bonds, notes & other debt instruments (continued)
| Principal amount (000) | Value (000) | |||||||
Corporate bonds, notes & loans (continued) | ||||||||
Financials (continued) | ||||||||
Morgan Stanley 3.125% 7/27/2026 | USD | 325 | $ | 304 | ||||
MSCI, Inc. 3.625% 11/1/20316 | 2,225 | 1,843 | ||||||
National Australia Bank, Ltd. 1.887% 1/12/20276 | 5,000 | 4,450 | ||||||
Navient Corp. 5.50% 1/25/2023 | 1,594 | 1,594 | ||||||
Navient Corp. 6.125% 3/25/2024 | 8,030 | 7,879 | ||||||
Navient Corp. 5.875% 10/25/2024 | 1,005 | 974 | ||||||
Navient Corp. 6.75% 6/15/2026 | 300 | 285 | ||||||
Navient Corp. 5.50% 3/15/2029 | 5,980 | 4,888 | ||||||
New York Life Global Funding 2.35% 7/14/20266 | 590 | 544 | ||||||
Northwestern Mutual Global Funding 1.75% 1/11/20276 | 2,500 | 2,211 | ||||||
OneMain Finance Corp. 3.875% 9/15/2028 | 756 | 602 | ||||||
Owl Rock Capital Corp. 4.00% 3/30/2025 | 102 | 96 | ||||||
Owl Rock Capital Corp. 3.75% 7/22/2025 | 2,874 | 2,658 | ||||||
Owl Rock Capital Corp. 3.40% 7/15/2026 | 1,290 | 1,128 | ||||||
Owl Rock Capital Corp. II 4.625% 11/26/20246 | 2,305 | 2,194 | ||||||
Owl Rock Capital Corp. III 3.125% 4/13/2027 | 2,520 | 2,078 | ||||||
Owl Rock Core Income Corp. 4.70% 2/8/2027 | 2,500 | 2,258 | ||||||
Oxford Finance, LLC 6.375% 2/1/20276 | 1,125 | 1,049 | ||||||
PNC Financial Services Group, Inc. 3.90% 4/29/2024 | 2,000 | 1,977 | ||||||
Power Financial Corp., Ltd. 5.25% 8/10/2028 | 383 | 373 | ||||||
Power Financial Corp., Ltd. 6.15% 12/6/2028 | 350 | 356 | ||||||
Power Financial Corp., Ltd. 4.50% 6/18/2029 | 554 | 513 | ||||||
Power Financial Corp., Ltd. 3.95% 4/23/2030 | 1,213 | 1,067 | ||||||
Prudential Financial, Inc. 4.35% 2/25/2050 | 2,205 | 1,879 | ||||||
Prudential Financial, Inc. 3.70% 3/13/2051 | 755 | 580 | ||||||
Quicken Loans, LLC 3.625% 3/1/20296 | 1,505 | 1,195 | ||||||
Rabobank Nederland 4.375% 8/4/2025 | 4,500 | 4,397 | ||||||
Rocket Mortgage, LLC 2.875% 10/15/20266 | 2,110 | 1,812 | ||||||
Royal Bank of Canada 1.15% 6/10/2025 | 4,711 | 4,316 | ||||||
Ryan Specialty Group, LLC 4.375% 2/1/20306 | 270 | 234 | ||||||
Springleaf Finance Corp. 6.125% 3/15/2024 | 2,550 | 2,472 | ||||||
Starwood Property Trust, Inc. 5.50% 11/1/20236 | 1,160 | 1,152 | ||||||
Starwood Property Trust, Inc. 4.375% 1/15/20276 | 1,540 | 1,350 | ||||||
Swiss Re Finance (Luxembourg) SA 5.00% 4/2/2049 (5-year UST Yield Curve Rate T Note Constant Maturity + 3.582% on 4/2/2029)6,13 | 2,800 | 2,591 | ||||||
Toronto-Dominion Bank 2.65% 6/12/2024 | 625 | 605 | ||||||
Toronto-Dominion Bank 0.75% 9/11/2025 | 5,375 | 4,803 | ||||||
Toronto-Dominion Bank 1.25% 9/10/2026 | 2,425 | 2,124 | ||||||
Toronto-Dominion Bank 1.95% 1/12/2027 | 2,500 | 2,231 | ||||||
Toronto-Dominion Bank 2.45% 1/12/2032 | 1,500 | 1,219 | ||||||
Travelers Companies, Inc. 4.00% 5/30/2047 | 860 | 699 | ||||||
U.S. Bancorp 2.375% 7/22/2026 | 4,000 | 3,696 | ||||||
UBS Group AG 4.125% 9/24/20256 | 2,750 | 2,677 | ||||||
UniCredit SpA 4.625% 4/12/20276 | 625 | 586 | ||||||
Wells Fargo & Company 2.164% 2/11/2026 (3-month USD-LIBOR + 0.75% on 2/11/2025)13 | 8,000 | 7,464 | ||||||
Wells Fargo & Company 3.526% 3/24/2028 (USD-SOFR + 1.51% on 3/24/2027)13 | 4,337 | 4,024 | ||||||
Westpac Banking Corp. 2.75% 1/11/2023 | 1,750 | 1,749 | ||||||
Westpac Banking Corp. 2.894% 2/4/2030 (5-year UST Yield Curve Rate T Note Constant Maturity + 1.35% on 2/4/2025)13 | 3,000 | 2,753 | ||||||
Westpac Banking Corp. 2.668% 11/15/2035 (5-year UST Yield Curve Rate T Note Constant Maturity + 1.75% on 11/15/2030)13 | 3,325 | 2,478 | ||||||
Westpac Banking Corp. 2.963% 11/16/2040 | 1,500 | 996 | ||||||
|
| |||||||
| 315,964 | ||||||||
|
| |||||||
Energy 0.62% | ||||||||
Altera Infrastructure, LP 8.50% 7/15/20233,6,15 | 3,550 | 663 | ||||||
Antero Midstream Partners, LP 5.375% 6/15/20296 | 2,170 | 1,987 | ||||||
Antero Resources Corp. 7.625% 2/1/20296 | 955 | 962 | ||||||
Ascent Resources Utica Holdings, LLC 7.00% 11/1/20266 | 2,000 | 1,943 | ||||||
142 American Funds Insurance Series
Table of Contents
Asset Allocation Fund (continued)
Bonds, notes & other debt instruments (continued)
| Principal amount (000) | Value (000) | |||||||
Corporate bonds, notes & loans (continued) | ||||||||
Energy (continued) | ||||||||
Ascent Resources Utica Holdings, LLC 5.875% 6/30/20296 | USD | 1,270 | $ | 1,134 | ||||
Bonanza Creek Energy, Inc. 5.00% 10/15/20266 | 480 | 439 | ||||||
BP Capital Markets America, Inc. 2.772% 11/10/2050 | 681 | 438 | ||||||
Canadian Natural Resources, Ltd. 2.05% 7/15/2025 | 961 | 895 | ||||||
Canadian Natural Resources, Ltd. 4.95% 6/1/2047 | 1,559 | 1,360 | ||||||
Cheniere Energy, Inc. 4.625% 10/15/2028 | 4,645 | 4,207 | ||||||
Chesapeake Energy Corp. 4.875% 4/15/202215 | 7,225 | 163 | ||||||
Chesapeake Energy Corp. 5.50% 2/1/20266 | 685 | 662 | ||||||
Chesapeake Energy Corp. 5.875% 2/1/20296 | 2,240 | 2,126 | ||||||
CNX Midstream Partners, LP 4.75% 4/15/20306 | 1,055 | 867 | ||||||
CNX Resources Corp. 7.25% 3/14/20276 | 1,725 | 1,715 | ||||||
CNX Resources Corp. 6.00% 1/15/20296 | 2,675 | 2,465 | ||||||
CNX Resources Corp. 7.375% 1/15/20316 | 553 | 531 | ||||||
Comstock Resources, Inc. 5.875% 1/15/20306 | 450 | 387 | ||||||
Constellation Oil Services Holding SA 13.50% 6/30/20253,6 | 1,120 | 1,120 | ||||||
Constellation Oil Services Holding SA 4.00% PIK 12/31/202616 | 434 | 257 | ||||||
Crestwood Midstream Partners, LP 8.00% 4/1/20296 | 4,265 | 4,250 | ||||||
Diamond Foreign Asset Co. 9.00% Cash 4/22/20276,9,16 | 204 | 194 | ||||||
Diamond Foreign Asset Co. 9.00% Cash 4/22/202716 | 185 | 176 | ||||||
DT Midstream, Inc. 4.375% 6/15/20316 | 1,680 | 1,412 | ||||||
Enbridge Energy Partners, LP, Series B, 7.50% 4/15/2038 | 300 | 331 | ||||||
Enbridge, Inc. 4.00% 10/1/2023 | 278 | 276 | ||||||
Enbridge, Inc. 2.50% 1/15/2025 | 300 | 284 | ||||||
Enbridge, Inc. 3.70% 7/15/2027 | 62 | 58 | ||||||
Energy Transfer Operating, LP 5.00% 5/15/2050 | 1,869 | 1,502 | ||||||
Energy Transfer Partners, LP 4.50% 4/15/2024 | 1,210 | 1,193 | ||||||
Energy Transfer Partners, LP 4.75% 1/15/2026 | 2,494 | 2,432 | ||||||
Enterprise Products Operating, LLC 4.90% 5/15/2046 | 500 | 437 | ||||||
EQM Midstream Partners, LP 4.125% 12/1/2026 | 686 | 612 | ||||||
EQM Midstream Partners, LP 6.50% 7/1/20276 | 1,690 | 1,618 | ||||||
EQM Midstream Partners, LP 5.50% 7/15/2028 | 3,088 | 2,767 | ||||||
EQM Midstream Partners, LP 7.50% 6/1/20306 | 642 | 619 | ||||||
EQM Midstream Partners, LP 4.75% 1/15/20316 | 1,635 | 1,340 | ||||||
EQT Corp. 5.00% 1/15/2029 | 340 | 320 | ||||||
EQT Corp. 7.25% 2/1/203013 | 1,110 | 1,153 | ||||||
EQT Corp. 3.625% 5/15/20316 | 400 | 340 | ||||||
Equinor ASA 3.00% 4/6/2027 | 4,000 | 3,739 | ||||||
Equinor ASA 3.625% 9/10/2028 | 3,685 | 3,494 | ||||||
Exxon Mobil Corp. 2.019% 8/16/2024 | 643 | 615 | ||||||
Exxon Mobil Corp. 2.44% 8/16/2029 | 1,963 | 1,719 | ||||||
Exxon Mobil Corp. 3.452% 4/15/2051 | 1,000 | 758 | ||||||
Genesis Energy, LP 6.50% 10/1/2025 | 4,280 | 4,097 | ||||||
Genesis Energy, LP 6.25% 5/15/2026 | 1,805 | 1,654 | ||||||
Genesis Energy, LP 8.00% 1/15/2027 | 4,612 | 4,362 | ||||||
Genesis Energy, LP 7.75% 2/1/2028 | 470 | 433 | ||||||
Halliburton Company 3.80% 11/15/2025 | 6 | 6 | ||||||
Harvest Midstream I, LP 7.50% 9/1/20286 | 850 | 813 | ||||||
Hess Midstream Operations, LP 4.25% 2/15/20306 | 960 | 822 | ||||||
Hess Midstream Operations, LP 5.50% 10/15/20306 | 400 | 366 | ||||||
Hess Midstream Partners, LP 5.125% 6/15/20286 | 2,155 | 1,997 | ||||||
Hilcorp Energy I, LP 6.00% 4/15/20306 | 350 | 312 | ||||||
Hilcorp Energy I, LP 6.00% 2/1/20316 | 460 | 398 | ||||||
Holly Energy Partners, LP / Holly Energy Finance Corp. 6.375% 4/15/20276 | 545 | 536 | ||||||
Kinder Morgan, Inc. 5.45% 8/1/2052 | 1,238 | 1,118 | ||||||
Marathon Oil Corp. 4.40% 7/15/2027 | 1,005 | 961 | ||||||
MPLX, LP 4.125% 3/1/2027 | 500 | 473 | ||||||
MPLX, LP 2.65% 8/15/2030 | 4,273 | 3,472 | ||||||
MPLX, LP 4.50% 4/15/2038 | 750 | 635 | ||||||
MPLX, LP 4.70% 4/15/2048 | 1,101 | 874 | ||||||
New Fortress Energy, Inc. 6.75% 9/15/20256 | 1,065 | 1,010 | ||||||
New Fortress Energy, Inc. 6.50% 9/30/20266 | 2,435 | 2,266 | ||||||
American Funds Insurance Series 143
Table of Contents
Asset Allocation Fund (continued)
Bonds, notes & other debt instruments (continued)
Principal (000) | Value (000) | |||||||
Corporate bonds, notes & loans (continued) | ||||||||
Energy (continued) | ||||||||
NGL Energy Operating, LLC 7.50% 2/1/20266 | USD | 14,165 | $ | 12,637 | ||||
NGL Energy Partners, LP 6.125% 3/1/2025 | 3,422 | 2,794 | ||||||
Oasis Petroleum, Inc. 6.375% 6/1/20266 | 1,945 | 1,897 | ||||||
ONEOK, Inc. 5.85% 1/15/2026 | 347 | 352 | ||||||
Parkland Corp. 4.625% 5/1/20306 | 1,035 | 858 | ||||||
Petróleos Mexicanos 6.875% 10/16/2025 | 3,755 | 3,682 | ||||||
Petróleos Mexicanos 5.35% 2/12/2028 | 1,870 | 1,578 | ||||||
Petróleos Mexicanos 6.75% 9/21/2047 | 1,996 | 1,278 | ||||||
Pioneer Natural Resources Company 2.15% 1/15/2031 | 1,669 | 1,323 | ||||||
Plains All American Pipeline, LP 3.80% 9/15/2030 | 113 | 98 | ||||||
Range Resources Corp. 8.25% 1/15/2029 | 1,040 | 1,073 | ||||||
Range Resources Corp. 4.75% 2/15/20306 | 1,670 | 1,474 | ||||||
Rockies Express Pipeline, LLC 4.95% 7/15/20296 | 2,689 | 2,421 | ||||||
Southwestern Energy Co. 7.75% 10/1/2027 | 2,450 | 2,501 | ||||||
Southwestern Energy Co. 8.375% 9/15/2028 | 395 | 408 | ||||||
Southwestern Energy Co. 5.375% 2/1/2029 | 1,355 | 1,258 | ||||||
Southwestern Energy Co. 5.375% 3/15/2030 | 1,945 | 1,778 | ||||||
Southwestern Energy Co. 4.75% 2/1/2032 | 960 | 822 | ||||||
Statoil ASA 3.25% 11/10/2024 | 2,850 | 2,780 | ||||||
Statoil ASA 4.25% 11/23/2041 | 2,000 | 1,769 | ||||||
Sunoco, LP 4.50% 5/15/2029 | 1,050 | 920 | ||||||
Sunoco, LP 4.50% 4/30/2030 | 1,255 | 1,091 | ||||||
Targa Resources Partners, LP 5.50% 3/1/2030 | 2,260 | 2,130 | ||||||
Total SE 2.986% 6/29/2041 | 88 | 66 | ||||||
TransCanada PipeLines, Ltd. 4.25% 5/15/2028 | 1,090 | 1,034 | ||||||
TransCanada PipeLines, Ltd. 4.10% 4/15/2030 | 598 | 549 | ||||||
TransCanada PipeLines, Ltd. 4.75% 5/15/2038 | 2,000 | 1,790 | ||||||
TransCanada PipeLines, Ltd. 4.875% 5/15/2048 | 700 | 615 | ||||||
Valero Energy Corp. 4.00% 4/1/2029 | 4,000 | 3,773 | ||||||
Venture Global Calcasieu Pass, LLC 4.125% 8/15/20316 | 840 | 717 | ||||||
Weatherford International, Ltd. 11.00% 12/1/20246 | 497 | 509 | ||||||
Weatherford International, Ltd. 6.50% 9/15/20286 | 2,380 | 2,337 | ||||||
Weatherford International, Ltd. 8.625% 4/30/20306 | 7,690 | 7,398 | ||||||
Western Gas Partners, LP 4.50% 3/1/2028 | 3,018 | 2,785 | ||||||
Western Midstream Operating, LP 4.30% 2/1/203013 | 1,125 | 985 | ||||||
Williams Companies, Inc. 3.50% 11/15/2030 | 1,094 | 959 | ||||||
|
| |||||||
| 153,004 | ||||||||
|
| |||||||
Health care 0.60% | ||||||||
AbbVie, Inc. 3.80% 3/15/2025 | 206 | 201 | ||||||
AbbVie, Inc. 2.95% 11/21/2026 | 1,445 | 1,346 | ||||||
AdaptHealth, LLC 5.125% 3/1/20306 | 830 | 708 | ||||||
AmerisourceBergen Corp. 0.737% 3/15/2023 | 1,291 | 1,280 | ||||||
Amgen, Inc. 4.40% 2/22/2062 | 1,697 | 1,352 | ||||||
Anthem, Inc. 2.375% 1/15/2025 | 818 | 777 | ||||||
AstraZeneca Finance, LLC 1.20% 5/28/2026 | 3,786 | 3,375 | ||||||
AstraZeneca Finance, LLC 1.75% 5/28/2028 | 1,871 | 1,609 | ||||||
AstraZeneca Finance, LLC 2.25% 5/28/2031 | 742 | 619 | ||||||
AstraZeneca PLC 3.375% 11/16/2025 | 1,140 | 1,101 | ||||||
Bausch Health Companies, Inc. 5.00% 1/30/20286 | 1,735 | 836 | ||||||
Bausch Health Companies, Inc. 4.875% 6/1/20286 | 7,450 | 4,753 | ||||||
Bausch Health Companies, Inc. 5.00% 2/15/20296 | 1,000 | 481 | ||||||
Baxter International, Inc. 1.322% 11/29/2024 | 7,109 | 6,623 | ||||||
Baxter International, Inc. 1.915% 2/1/2027 | 4,739 | 4,208 | ||||||
Baxter International, Inc. 2.272% 12/1/2028 | 3,180 | 2,718 | ||||||
Bayer US Finance II, LLC 3.875% 12/15/20236 | 1,685 | 1,661 | ||||||
Becton, Dickinson and Company 3.363% 6/6/2024 | 198 | 194 | ||||||
Boston Scientific Corp. 3.45% 3/1/2024 | 313 | 307 | ||||||
Centene Corp. 4.25% 12/15/2027 | 565 | 531 | ||||||
Centene Corp. 2.45% 7/15/2028 | 1,325 | 1,121 | ||||||
144 American Funds Insurance Series
Table of Contents
Asset Allocation Fund (continued)
Bonds, notes & other debt instruments (continued)
Principal (000) | Value (000) | |||||||
Corporate bonds, notes & loans (continued) | ||||||||
Health care (continued) | ||||||||
Centene Corp. 4.625% 12/15/2029 | USD | 1,265 | $ | 1,159 | ||||
Cigna Corp. 3.75% 7/15/2023 | 245 | 243 | ||||||
Community Health Systems, Inc. 5.625% 3/15/20276 | 1,960 | 1,684 | ||||||
Community Health Systems, Inc. 5.25% 5/15/20306 | 3,675 | 2,778 | ||||||
Eli Lilly and Company 3.375% 3/15/2029 | 1,353 | 1,269 | ||||||
GlaxoSmithKline PLC 3.625% 5/15/2025 | 2,825 | 2,761 | ||||||
HCA, Inc. 3.375% 3/15/20296 | 804 | 708 | ||||||
HCA, Inc. 3.50% 9/1/2030 | 4,050 | 3,503 | ||||||
HCA, Inc. 3.625% 3/15/20326 | 1,000 | 849 | ||||||
HCA, Inc. 4.375% 3/15/20426 | 1,500 | 1,201 | ||||||
HCA, Inc. 4.625% 3/15/20526 | 1,450 | 1,135 | ||||||
Jazz Securities DAC 4.375% 1/15/20296 | 1,975 | 1,764 | ||||||
Merck & Co., Inc. 1.90% 12/10/2028 | 600 | 516 | ||||||
Merck & Co., Inc. 2.75% 12/10/2051 | 1,103 | 742 | ||||||
Molina Healthcare, Inc. 4.375% 6/15/20286 | 440 | 402 | ||||||
Molina Healthcare, Inc. 3.875% 11/15/20306 | 2,899 | 2,461 | ||||||
Molina Healthcare, Inc. 3.875% 5/15/20326 | 3,855 | 3,207 | ||||||
Novant Health, Inc. 3.168% 11/1/2051 | 3,750 | 2,608 | ||||||
Novartis Capital Corp. 1.75% 2/14/2025 | 1,250 | 1,179 | ||||||
Novartis Capital Corp. 2.00% 2/14/2027 | 2,386 | 2,174 | ||||||
Owens & Minor, Inc. 4.375% 12/15/2024 | 5,615 | 5,436 | ||||||
Owens & Minor, Inc. 4.50% 3/31/20296 | 4,175 | 3,334 | ||||||
Par Pharmaceutical, Inc. 7.50% 4/1/20276 | 7,303 | 5,566 | ||||||
Pfizer, Inc. 2.95% 3/15/2024 | 219 | 214 | ||||||
Shire PLC 2.875% 9/23/2023 | 1,365 | 1,342 | ||||||
Summa Health 3.511% 11/15/2051 | 1,655 | 1,123 | ||||||
Tenet Healthcare Corp. 4.875% 1/1/20266 | 11,225 | 10,638 | ||||||
Tenet Healthcare Corp. 4.25% 6/1/20296 | 2,060 | 1,788 | ||||||
Tenet Healthcare Corp. 4.375% 1/15/20306 | 1,925 | 1,670 | ||||||
Teva Pharmaceutical Finance Co. BV 6.00% 4/15/2024 | 7,016 | 6,891 | ||||||
Teva Pharmaceutical Finance Co. BV 7.125% 1/31/2025 | 935 | 931 | ||||||
Teva Pharmaceutical Finance Co. BV 3.15% 10/1/2026 | 17,790 | 15,594 | ||||||
Teva Pharmaceutical Finance Co. BV 5.125% 5/9/2029 | 7,495 | 6,684 | ||||||
Teva Pharmaceutical Finance Co. BV 4.10% 10/1/2046 | 3,550 | 2,178 | ||||||
UnitedHealth Group, Inc. 1.15% 5/15/2026 | 2,610 | 2,334 | ||||||
UnitedHealth Group, Inc. 5.30% 2/15/2030 | 2,500 | 2,582 | ||||||
UnitedHealth Group, Inc. 2.00% 5/15/2030 | 974 | 806 | ||||||
UnitedHealth Group, Inc. 4.20% 5/15/2032 | 767 | 730 | ||||||
UnitedHealth Group, Inc. 3.05% 5/15/2041 | 3,875 | 2,928 | ||||||
UnitedHealth Group, Inc. 3.25% 5/15/2051 | 2,504 | 1,804 | ||||||
UnitedHealth Group, Inc. 4.75% 5/15/2052 | 1,250 | 1,161 | ||||||
Valeant Pharmaceuticals International, Inc. 5.50% 11/1/20256 | 6,275 | 5,344 | ||||||
|
| |||||||
| 149,222 | ||||||||
|
| |||||||
Consumer discretionary 0.59% | ||||||||
Allied Universal Holdco, LLC 4.625% 6/1/20286 | 1,660 | 1,374 | ||||||
Amazon.com, Inc. 2.70% 6/3/2060 | 2,765 | 1,679 | ||||||
American Honda Finance Corp. 3.50% 2/15/2028 | 750 | 702 | ||||||
Asbury Automotive Group, Inc. 4.625% 11/15/20296 | 2,115 | 1,785 | ||||||
Atlas LuxCo 4 SARL 4.625% 6/1/20286 | 1,065 | 865 | ||||||
Bayerische Motoren Werke AG 2.25% 9/15/20236 | 300 | 294 | ||||||
Caesars Entertainment, Inc. 6.25% 7/1/20256 | 2,815 | 2,741 | ||||||
Carnival Corp. 4.00% 8/1/20286 | 3,875 | 3,167 | ||||||
Daimler Trucks Finance North America, LLC 3.50% 4/7/20256 | 2,000 | 1,920 | ||||||
Daimler Trucks Finance North America, LLC 2.00% 12/14/20266 | 2,400 | 2,118 | ||||||
Daimler Trucks Finance North America, LLC 3.65% 4/7/20276 | 450 | 421 | ||||||
Daimler Trucks Finance North America, LLC 2.375% 12/14/20286 | 1,350 | 1,137 | ||||||
Fertitta Entertainment, Inc. 4.625% 1/15/20296 | 3,580 | 3,034 | ||||||
Fertitta Entertainment, Inc. 6.75% 1/15/20306 | 1,790 | 1,447 | ||||||
First Student Bidco, Inc. 4.00% 7/31/20296 | 1,300 | 1,077 | ||||||
American Funds Insurance Series 145
Table of Contents
Asset Allocation Fund (continued)
Bonds, notes & other debt instruments (continued)
| Principal amount (000) | Value (000) | |||||||
Corporate bonds, notes & loans (continued) | ||||||||
Consumer discretionary (continued) | ||||||||
Ford Motor Credit Company, LLC 5.125% 6/16/2025 | USD | 3,855 | $ | 3,714 | ||||
Ford Motor Credit Company, LLC 4.542% 8/1/2026 | 2,455 | 2,266 | ||||||
Ford Motor Credit Company, LLC 2.70% 8/10/2026 | 2,110 | 1,835 | ||||||
General Motors Financial Co. 2.35% 2/26/2027 | 783 | 685 | ||||||
Hanesbrands, Inc. 4.875% 5/15/20266 | 2,700 | 2,417 | ||||||
Hilton Grand Vacations Borrower 5.00% 6/1/20296 | 3,580 | 3,083 | ||||||
Hilton Worldwide Holdings, Inc. 4.00% 5/1/20316 | 1,885 | 1,581 | ||||||
Home Depot, Inc. 1.50% 9/15/2028 | 3,000 | 2,556 | ||||||
Home Depot, Inc. 3.90% 12/6/2028 | 825 | 796 | ||||||
Home Depot, Inc. 2.95% 6/15/2029 | 4,000 | 3,627 | ||||||
Home Depot, Inc. 1.875% 9/15/2031 | 3,000 | 2,405 | ||||||
Home Depot, Inc. 4.25% 4/1/2046 | 2,000 | 1,742 | ||||||
Home Depot, Inc. 4.50% 12/6/2048 | 428 | 391 | ||||||
Hyundai Capital America 1.00% 9/17/20246 | 3,025 | 2,797 | ||||||
Hyundai Capital America 1.50% 6/15/20266 | 850 | 737 | ||||||
Hyundai Capital America 1.65% 9/17/20266 | 3,075 | 2,707 | ||||||
Hyundai Capital America 2.375% 10/15/20276 | 2,579 | 2,210 | ||||||
Hyundai Capital America 2.10% 9/15/20286 | 3,075 | 2,529 | ||||||
International Game Technology PLC 6.50% 2/15/20256 | 1,880 | 1,895 | ||||||
International Game Technology PLC 5.25% 1/15/20296 | 6,490 | 6,059 | ||||||
KB Home 7.25% 7/15/2030 | 1,295 | 1,260 | ||||||
Kontoor Brands, Inc. 4.125% 11/15/20296 | 910 | 745 | ||||||
Lindblad Expeditions, LLC 6.75% 2/15/20276 | 775 | 704 | ||||||
Lithia Motors, Inc. 3.875% 6/1/20296 | 2,900 | 2,388 | ||||||
Lithia Motors, Inc. 4.375% 1/15/20316 | 1,025 | 836 | ||||||
Marriott International, Inc. 2.75% 10/15/2033 | 2,500 | 1,914 | ||||||
McDonald’s Corp. 4.60% 9/9/2032 | 1,275 | 1,251 | ||||||
Melco International Development, Ltd. 5.75% 7/21/20286 | 1,710 | 1,433 | ||||||
Mercedes-Benz Finance North America, LLC 5.375% 11/26/20256 | 1,500 | 1,510 | ||||||
Mercedes-Benz Finance North America, LLC 5.25% 11/29/20276 | 2,875 | 2,895 | ||||||
NCL Corp., Ltd. 5.875% 2/15/20276 | 2,450 | 2,125 | ||||||
NCL Corp., Ltd. 7.75% 2/15/20296 | 1,375 | 1,037 | ||||||
Neiman Marcus Group, LLC 7.125% 4/1/20266 | 1,345 | 1,263 | ||||||
Party City Holdings, Inc. (6-month USD-LIBOR + 5.00%) 8.061% 7/15/20256,9 | 780 | 213 | ||||||
Party City Holdings, Inc. 8.75% 2/15/20266 | 3,440 | 998 | ||||||
Penske Automotive Group, Inc. 3.75% 6/15/2029 | 1,375 | 1,118 | ||||||
Premier Entertainment Sub, LLC 5.625% 9/1/20296 | 1,690 | 1,248 | ||||||
Premier Entertainment Sub, LLC 5.875% 9/1/20316 | 1,690 | 1,198 | ||||||
Real Hero Merger Sub 2, Inc. 6.25% 2/1/20296 | 715 | 491 | ||||||
Royal Caribbean Cruises, Ltd. 11.50% 6/1/20256 | 2,423 | 2,604 | ||||||
Royal Caribbean Cruises, Ltd. 4.25% 7/1/20266 | 3,120 | 2,526 | ||||||
Royal Caribbean Cruises, Ltd. 5.375% 7/15/20276 | 3,520 | 2,855 | ||||||
Royal Caribbean Cruises, Ltd. 8.25% 1/15/20296 | 1,408 | 1,417 | ||||||
Sally Holdings, LLC 5.625% 12/1/2025 | 2,705 | 2,610 | ||||||
Sands China, Ltd. 5.625% 8/8/2025 | 1,302 | 1,247 | ||||||
Sands China, Ltd. 2.80% 3/8/202713 | 2,075 | 1,780 | ||||||
Scientific Games Corp. 7.00% 5/15/20286 | 750 | 717 | ||||||
Scientific Games Corp. 7.25% 11/15/20296 | 2,240 | 2,154 | ||||||
Sonic Automotive, Inc. 4.625% 11/15/20296 | 3,035 | 2,434 | ||||||
Sonic Automotive, Inc. 4.875% 11/15/20316 | 1,325 | 1,043 | ||||||
Stellantis Finance US, Inc. 1.711% 1/29/20276 | 2,200 | 1,891 | ||||||
Stellantis Finance US, Inc. 5.625% 1/12/20286 | 2,500 | 2,480 | ||||||
Stellantis Finance US, Inc. 2.691% 9/15/20316 | 2,150 | 1,646 | ||||||
Stellantis Finance US, Inc. 6.375% 9/12/20326 | 2,000 | 1,980 | ||||||
Tempur Sealy International, Inc. 4.00% 4/15/20296 | 850 | 715 | ||||||
The Gap, Inc. 3.625% 10/1/20296 | 486 | 343 | ||||||
The Gap, Inc. 3.875% 10/1/20316 | 323 | 226 | ||||||
Toyota Motor Credit Corp. 0.80% 1/9/2026 | 429 | 383 | ||||||
Toyota Motor Credit Corp. 1.90% 1/13/2027 | 2,500 | 2,234 | ||||||
Travel + Leisure Co. 4.50% 12/1/20296 | 2,100 | 1,714 | ||||||
Volkswagen Group of America Finance, LLC 4.25% 11/13/20236 | 3,770 | 3,734 | ||||||
146 American Funds Insurance Series
Table of Contents
Asset Allocation Fund (continued)
Bonds, notes & other debt instruments (continued)
| Principal amount (000) | Value (000) | |||||||
Corporate bonds, notes & loans (continued) | ||||||||
Consumer discretionary (continued) | ||||||||
Volkswagen Group of America Finance, LLC 4.625% 11/13/20256 | USD3,845 | $ | 3,786 | |||||
Volkswagen Group of America Finance, LLC 3.20% 9/26/20266 | 3,201 | 2,972 | ||||||
Wheel Pros, Inc. 6.50% 5/15/20296 | 1,750 | 621 | ||||||
Wyndham Destinations, Inc. 4.625% 3/1/20306 | 1,300 | 1,080 | ||||||
Wyndham Worldwide Corp. 4.375% 8/15/20286 | 2,255 | 2,027 | ||||||
Wynn Las Vegas, LLC 4.25% 5/30/20236 | 2,193 | 2,165 | ||||||
|
| |||||||
| 145,804 | ||||||||
|
| |||||||
Communication services 0.53% | ||||||||
Alphabet, Inc. 1.998% 8/15/2026 | 3,000 | 2,762 | ||||||
Alphabet, Inc. 1.90% 8/15/2040 | 1,375 | 918 | ||||||
Alphabet, Inc. 2.25% 8/15/2060 | 1,265 | 719 | ||||||
AT&T, Inc. 3.50% 9/15/2053 | 5,140 | 3,492 | ||||||
CCO Holdings, LLC 4.75% 3/1/20306 | 2,500 | 2,162 | ||||||
CCO Holdings, LLC 4.50% 8/15/20306 | 3,500 | 2,899 | ||||||
CCO Holdings, LLC 4.25% 2/1/20316 | 3,875 | 3,117 | ||||||
CCO Holdings, LLC 4.75% 2/1/20326 | 2,150 | 1,747 | ||||||
CCO Holdings, LLC 4.50% 5/1/2032 | 2,710 | 2,162 | ||||||
Charter Communications Operating, LLC 4.908% 7/23/2025 | 500 | 491 | ||||||
Charter Communications Operating, LLC 3.70% 4/1/2051 | 2,000 | 1,223 | ||||||
Charter Communications Operating, LLC 3.90% 6/1/2052 | 3,000 | 1,895 | ||||||
Comcast Corp. 2.35% 1/15/2027 | 4,000 | 3,640 | ||||||
Comcast Corp. 3.20% 7/15/2036 | 375 | 305 | ||||||
Comcast Corp. 2.80% 1/15/2051 | 791 | 503 | ||||||
Comcast Corp. 2.887% 11/1/2051 | 2,571 | 1,663 | ||||||
CSC Holdings, LLC 3.375% 2/15/20316 | 1,875 | 1,226 | ||||||
DIRECTV Financing, LLC 5.875% 8/15/20276 | 3,655 | 3,277 | ||||||
DISH Network Corp. 11.75% 11/15/20276 | 3,700 | 3,815 | ||||||
Embarq Corp. 7.995% 6/1/2036 | 6,465 | 3,020 | ||||||
Fox Corp. 4.03% 1/25/2024 | 1,120 | 1,107 | ||||||
Frontier Communications Corp. 5.875% 10/15/20276 | 2,225 | 2,071 | ||||||
Frontier Communications Corp. 5.00% 5/1/20286 | 5,550 | 4,851 | ||||||
Frontier Communications Corp. 6.75% 5/1/20296 | 4,400 | 3,646 | ||||||
Frontier Communications Holdings, LLC 5.875% 11/1/2029 | 1,850 | 1,434 | ||||||
Frontier Communications Holdings, LLC 6.00% 1/15/20306 | 1,900 | 1,495 | ||||||
Frontier Communications Holdings, LLC 8.75% 5/15/20306 | 1,100 | 1,121 | ||||||
Gray Escrow II, Inc. 5.375% 11/15/20316 | 900 | 650 | ||||||
iHeartCommunications, Inc. 5.25% 8/15/20276 | 3,093 | 2,625 | ||||||
Intelsat Jackson Holding Co. 6.50% 3/15/20306 | 2,891 | 2,592 | ||||||
Ligado Networks, LLC 15.50% PIK 11/1/20236,16 | 4,712 | 1,537 | ||||||
Live Nation Entertainment, Inc. 3.75% 1/15/20286 | 1,350 | 1,154 | ||||||
Midas OpCo Holdings, LLC 5.625% 8/15/20296 | 3,205 | 2,649 | ||||||
Netflix, Inc. 4.875% 4/15/2028 | 1,250 | 1,210 | ||||||
Netflix, Inc. 5.875% 11/15/2028 | 2,175 | 2,210 | ||||||
Netflix, Inc. 6.375% 5/15/2029 | 50 | 52 | ||||||
Netflix, Inc. 5.375% 11/15/20296 | 25 | 24 | ||||||
News Corp. 3.875% 5/15/20296 | 875 | 760 | ||||||
News Corp. 5.125% 2/15/20326 | 550 | 501 | ||||||
Nexstar Broadcasting, Inc. 4.75% 11/1/20286 | 3,175 | 2,751 | ||||||
SBA Tower Trust 1.631% 11/15/20266 | 8,707 | 7,408 | ||||||
Scripps Escrow II, Inc. 3.875% 1/15/20296 | 2,325 | 1,869 | ||||||
Sinclair Television Group, Inc. 4.125% 12/1/20306 | 1,175 | 882 | ||||||
Sirius XM Radio, Inc. 4.00% 7/15/20286 | 3,575 | 3,118 | ||||||
Sirius XM Radio, Inc. 4.125% 7/1/20306 | 950 | 786 | ||||||
Sirius XM Radio, Inc. 3.875% 9/1/20316 | 1,975 | 1,545 | ||||||
Sprint Corp. 6.875% 11/15/2028 | 2,525 | �� | 2,627 | |||||
Take-Two Interactive Software, Inc. 3.30% 3/28/2024 | 3,175 | 3,102 | ||||||
Take-Two Interactive Software, Inc. 4.00% 4/14/2032 | 2,438 | 2,165 | ||||||
T-Mobile US, Inc. 1.50% 2/15/2026 | 500 | 448 | ||||||
T-Mobile US, Inc. 2.05% 2/15/2028 | 325 | 280 | ||||||
American Funds Insurance Series 147
Table of Contents
Asset Allocation Fund (continued)
Bonds, notes & other debt instruments (continued)
| Principal amount (000) | Value (000) | |||||||
Corporate bonds, notes & loans (continued) | ||||||||
Communication services (continued) | ||||||||
Univision Communications, Inc. 6.625% 6/1/20276 | USD5,800 | $ | 5,608 | |||||
Univision Communications, Inc. 4.50% 5/1/20296 | 3,475 | 2,913 | ||||||
Univision Communications, Inc. 7.375% 6/30/20306 | 225 | 215 | ||||||
Verizon Communications, Inc. 2.875% 11/20/2050 | 2,453 | 1,548 | ||||||
Virgin Media O2 4.25% 1/31/20316 | 4,525 | 3,673 | ||||||
Virgin Media Secured Finance PLC 4.50% 8/15/20306 | 2,115 | 1,771 | ||||||
VMED O2 UK Financing I PLC 4.75% 7/15/20316 | 225 | 183 | ||||||
Vodafone Group PLC 5.25% 5/30/2048 | 500 | 443 | ||||||
Vodafone Group PLC 4.25% 9/17/2050 | 4,350 | 3,337 | ||||||
WarnerMedia Holdings, Inc. 3.638% 3/15/20256 | 3,807 | 3,623 | ||||||
WarnerMedia Holdings, Inc. 3.755% 3/15/20276 | 1,018 | 918 | ||||||
WarnerMedia Holdings, Inc. 4.054% 3/15/20296 | 1,435 | 1,244 | ||||||
WarnerMedia Holdings, Inc. 4.279% 3/15/20326 | 2,903 | 2,399 | ||||||
WarnerMedia Holdings, Inc. 5.05% 3/15/20426 | 2,500 | 1,922 | ||||||
WarnerMedia Holdings, Inc. 5.141% 3/15/20526 | 1,500 | 1,096 | ||||||
Ziggo Bond Co. BV 5.125% 2/28/20306 | 1,775 | 1,436 | ||||||
Ziggo Bond Finance BV 4.875% 1/15/20306 | 725 | 608 | ||||||
|
| |||||||
| 132,643 | ||||||||
|
| |||||||
Industrials 0.53% | ||||||||
AAdvantage Loyalty IP, Ltd. 5.50% 4/20/20266 | 1,005 | 968 | ||||||
Allison Transmission Holdings, Inc. 3.75% 1/30/20316 | 3,445 | 2,838 | ||||||
Avis Budget Car Rental, LLC 5.75% 7/15/20276 | 1,025 | 929 | ||||||
Avis Budget Group, Inc. 5.375% 3/1/20296 | 2,450 | 2,099 | ||||||
Avolon Holdings Funding, Ltd. 3.95% 7/1/20246 | 1,587 | 1,520 | ||||||
Avolon Holdings Funding, Ltd. 4.25% 4/15/20266 | 1,126 | 1,022 | ||||||
Avolon Holdings Funding, Ltd. 4.375% 5/1/20266 | 1,975 | 1,802 | ||||||
Boeing Company 4.875% 5/1/2025 | 1,555 | 1,545 | ||||||
Boeing Company 3.10% 5/1/2026 | 251 | 236 | ||||||
Boeing Company 3.25% 2/1/2028 | 4,000 | 3,639 | ||||||
Boeing Company 5.15% 5/1/2030 | 1,100 | 1,076 | ||||||
Boeing Company 3.60% 5/1/2034 | 6,250 | 5,016 | ||||||
Boeing Company 5.805% 5/1/2050 | 4,000 | 3,729 | ||||||
Bombardier, Inc. 7.125% 6/15/20266 | 4,100 | 3,985 | ||||||
Bombardier, Inc. 7.875% 4/15/20276 | 8,070 | 7,844 | ||||||
Bombardier, Inc. 6.00% 2/15/20286 | 1,010 | 935 | ||||||
BWX Technologies, Inc. 4.125% 4/15/20296 | 1,025 | 899 | ||||||
Canadian Pacific Railway, Ltd. 1.75% 12/2/2026 | 1,385 | 1,236 | ||||||
Canadian Pacific Railway, Ltd. 2.45% 12/2/2031 | 1,738 | 1,444 | ||||||
Canadian Pacific Railway, Ltd. 3.10% 12/2/2051 | 829 | 561 | ||||||
Chart Industries, Inc. 7.50% 1/1/20306 | 1,347 | 1,356 | ||||||
Clarivate Science Holdings Corp. 3.875% 7/1/20286 | 590 | 512 | ||||||
Clarivate Science Holdings Corp. 4.875% 7/1/20296 | 520 | 443 | ||||||
CoreLogic, Inc. 4.50% 5/1/20286 | 6,075 | 4,669 | ||||||
Covanta Holding Corp. 4.875% 12/1/20296 | 1,035 | 849 | ||||||
CSX Corp. 4.25% 3/15/2029 | 1,062 | 1,024 | ||||||
CSX Corp. 2.50% 5/15/2051 | 1,125 | 688 | ||||||
Honeywell International, Inc. 2.30% 8/15/2024 | 2,640 | 2,536 | ||||||
Honeywell International, Inc. 1.35% 6/1/2025 | 5,947 | 5,503 | ||||||
Honeywell International, Inc. 2.70% 8/15/2029 | 1,470 | 1,310 | ||||||
Icahn Enterprises Finance Corp. 4.75% 9/15/2024 | 2,090 | 2,009 | ||||||
Icahn Enterprises, LP 5.25% 5/15/2027 | 1,185 | 1,088 | ||||||
Icahn Enterprises, LP 4.375% 2/1/2029 | 1,525 | 1,292 | ||||||
L3Harris Technologies, Inc. 1.80% 1/15/2031 | 2,625 | 2,021 | ||||||
Lockheed Martin Corp. 5.10% 11/15/2027 | 951 | 974 | ||||||
Lockheed Martin Corp. 5.25% 1/15/2033 | 1,742 | 1,802 | ||||||
Lockheed Martin Corp. 5.70% 11/15/2054 | 1,849 | 1,949 | ||||||
LSC Communications, Inc. 8.75% 10/15/20233,6,15 | 4,063 | 12 | ||||||
Masco Corp. 1.50% 2/15/2028 | 774 | 642 | ||||||
Masco Corp. 2.00% 2/15/2031 | 497 | 384 | ||||||
148 American Funds Insurance Series
Table of Contents
Asset Allocation Fund (continued)
Bonds, notes & other debt instruments (continued)
Principal (000) | Value (000) | |||||||
Corporate bonds, notes & loans (continued) | ||||||||
Industrials (continued) | ||||||||
Masco Corp. 3.125% 2/15/2051 | USD | 230 | $ | 144 | ||||
MasTec, Inc. 4.50% 8/15/20286 | 1,425 | 1,279 | ||||||
Mileage Plus Holdings, LLC 6.50% 6/20/20276 | 1,980 | 1,973 | ||||||
Norfolk Southern Corp. 3.05% 5/15/2050 | 2,746 | 1,852 | ||||||
Northrop Grumman Corp. 2.93% 1/15/2025 | 1,820 | 1,747 | ||||||
Northrop Grumman Corp. 3.25% 1/15/2028 | 3,495 | 3,229 | ||||||
Otis Worldwide Corp. 2.293% 4/5/2027 | 2,135 | 1,914 | ||||||
Roller Bearing Company of America, Inc. 4.375% 10/15/20296 | 195 | 169 | ||||||
Rolls-Royce PLC 5.75% 10/15/20276 | 1,940 | 1,851 | ||||||
Siemens AG 1.20% 3/11/20266 | 3,887 | 3,468 | ||||||
Siemens AG 1.70% 3/11/20286 | 3,700 | 3,167 | ||||||
SkyMiles IP, Ltd. 4.75% 10/20/20286 | 2,950 | 2,777 | ||||||
Spirit AeroSystems, Inc. 9.375% 11/30/20296 | 507 | 534 | ||||||
The Brink’s Co. 4.625% 10/15/20276 | 2,385 | 2,186 | ||||||
TransDigm, Inc. 6.25% 3/15/20266 | 3,476 | 3,436 | ||||||
TransDigm, Inc. 5.50% 11/15/2027 | 2,200 | 2,070 | ||||||
Triumph Group, Inc. 8.875% 6/1/20246 | 2,295 | 2,339 | ||||||
Triumph Group, Inc. 6.25% 9/15/20246 | 4,775 | 4,534 | ||||||
Triumph Group, Inc. 7.75% 8/15/2025 | 3,950 | 3,366 | ||||||
Union Pacific Corp. 2.40% 2/5/2030 | 2,414 | 2,071 | ||||||
Union Pacific Corp. 2.95% 3/10/2052 | 1,000 | 681 | ||||||
Union Pacific Corp. 3.839% 3/20/2060 | 546 | 425 | ||||||
Union Pacific Corp. 3.799% 4/6/2071 | 545 | 405 | ||||||
United Airlines, Inc. 4.375% 4/15/20266 | 975 | 905 | ||||||
United Airlines, Inc. 4.625% 4/15/20296 | 2,225 | 1,941 | ||||||
United Rentals, Inc. 3.875% 2/15/2031 | 2,050 | 1,723 | ||||||
United Technologies Corp. 3.65% 8/16/2023 | 52 | 52 | ||||||
United Technologies Corp. 3.95% 8/16/2025 | 3,155 | 3,085 | ||||||
United Technologies Corp. 4.125% 11/16/2028 | 1,075 | �� | 1,031 | |||||
Vertical U.S. Newco, Inc. 5.25% 7/15/20276 | 2,000 | 1,779 | ||||||
|
| |||||||
| 130,519 | ||||||||
|
| |||||||
Materials 0.40% | ||||||||
Alcoa Nederland Holding BV 4.125% 3/31/20296 | 1,175 | 1,044 | ||||||
Allegheny Technologies, Inc. 4.875% 10/1/2029 | 710 | 628 | ||||||
Allegheny Technologies, Inc. 5.125% 10/1/2031 | 1,110 | 983 | ||||||
Anglo American Capital PLC 2.25% 3/17/20286 | 484 | 408 | ||||||
Anglo American Capital PLC 2.625% 9/10/20306 | 2,500 | 2,037 | ||||||
Anglo American Capital PLC 3.95% 9/10/20506 | 1,281 | 942 | ||||||
Arconic Rolled Products Corp. 6.125% 2/15/20286 | 750 | 705 | ||||||
Avient Corp. 7.125% 8/1/20306 | 855 | 837 | ||||||
Ball Corp. 6.875% 3/15/2028 | 1,415 | 1,455 | ||||||
Ball Corp. 3.125% 9/15/2031 | 3,520 | 2,832 | ||||||
CAN-PACK SA 3.875% 11/15/20296 | 935 | 738 | ||||||
Celanese US Holdings, LLC 6.165% 7/15/2027 | 3,500 | 3,458 | ||||||
Chevron Phillips Chemical Co., LLC 3.30% 5/1/20236 | 595 | 591 | ||||||
Cleveland-Cliffs, Inc. 5.875% 6/1/2027 | 9,000 | 8,613 | ||||||
Cleveland-Cliffs, Inc. 4.625% 3/1/20296 | 1,825 | 1,622 | ||||||
Cleveland-Cliffs, Inc. 4.875% 3/1/20316 | 1,351 | 1,195 | ||||||
CVR Partners, LP 6.125% 6/15/20286 | 745 | 669 | ||||||
Dow Chemical Co. 3.60% 11/15/2050 | 1,328 | 955 | ||||||
First Quantum Minerals, Ltd. 6.50% 3/1/20246 | 2,204 | 2,159 | ||||||
First Quantum Minerals, Ltd. 7.50% 4/1/20256 | 11,350 | 11,071 | ||||||
First Quantum Minerals, Ltd. 6.875% 3/1/20266 | 3,625 | 3,438 | ||||||
First Quantum Minerals, Ltd. 6.875% 10/15/20276 | 4,240 | 3,987 | ||||||
FXI Holdings, Inc. 7.875% 11/1/20246 | 2,321 | 1,933 | ||||||
FXI Holdings, Inc. 12.25% 11/15/20266 | 4,492 | 3,726 | ||||||
Glencore Funding, LLC 4.125% 3/12/20246 | 945 | 930 | ||||||
International Flavors & Fragrances, Inc. 1.832% 10/15/20276 | 5,400 | 4,541 | ||||||
Kaiser Aluminum Corp. 4.625% 3/1/20286 | 2,495 | 2,181 | ||||||
American Funds Insurance Series 149
Table of Contents
Asset Allocation Fund (continued)
Bonds, notes & other debt instruments (continued)
| Principal amount (000) | Value (000) | |||||||
Corporate bonds, notes & loans (continued) | ||||||||
Materials (continued) | ||||||||
LSB Industries, Inc. 6.25% 10/15/20286 | USD860 | $ | 788 | |||||
LYB International Finance III, LLC 2.25% 10/1/2030 | 1,198 | 953 | ||||||
LYB International Finance III, LLC 3.625% 4/1/2051 | 2,537 | 1,708 | ||||||
LYB International Finance III, LLC 3.80% 10/1/2060 | 1,186 | 774 | ||||||
Methanex Corp. 5.125% 10/15/2027 | 6,300 | 5,854 | ||||||
Mineral Resources, Ltd. 8.50% 5/1/20306 | 1,525 | 1,548 | ||||||
Mosaic Co. 4.05% 11/15/2027 | 1,050 | 991 | ||||||
Nova Chemicals Corp. 4.25% 5/15/20296 | 1,875 | 1,536 | ||||||
Novelis Corp. 3.875% 8/15/20316 | 1,115 | 912 | ||||||
Praxair, Inc. 1.10% 8/10/2030 | 2,938 | 2,258 | ||||||
SCIH Salt Holdings, Inc. 4.875% 5/1/20286 | 3,485 | 2,997 | ||||||
SCIH Salt Holdings, Inc. 6.625% 5/1/20296 | 1,230 | 992 | ||||||
Sherwin-Williams Company 3.125% 6/1/2024 | 275 | 267 | ||||||
Sherwin-Williams Company 3.80% 8/15/2049 | 5,208 | 3,891 | ||||||
South32 Treasury, Ltd. 4.35% 4/14/20326 | 1,527 | 1,311 | ||||||
SPCM SA 3.375% 3/15/20306 | 600 | 484 | ||||||
Venator Finance SARL 9.50% 7/1/20256 | 1,825 | 1,323 | ||||||
Venator Finance SARL 5.75% 7/15/20256 | 5,845 | 2,005 | ||||||
Warrior Met Coal, Inc. 7.875% 12/1/20286 | 3,400 | 3,356 | ||||||
Westlake Chemical Corp. 4.375% 11/15/2047 | 500 | 378 | ||||||
|
| |||||||
| 98,004 | ||||||||
|
| |||||||
Utilities 0.31% | ||||||||
Ameren Corp. 2.50% 9/15/2024 | 969 | 927 | ||||||
Calpine Corp. 3.75% 3/1/20316 | 1,975 | 1,593 | ||||||
Commonwealth Edison Co. 4.35% 11/15/2045 | 1,085 | 931 | ||||||
Commonwealth Edison Co. 3.85% 3/15/2052 | 2,600 | 2,083 | ||||||
Dominion Resources, Inc., junior subordinated, 3.071% 8/15/202413 | 920 | 887 | ||||||
Duke Energy Carolinas, LLC 3.95% 11/15/2028 | 1,250 | 1,202 | ||||||
Duke Energy Corp. 4.50% 8/15/2032 | 2,000 | 1,879 | ||||||
Duke Energy Corp. 3.50% 6/15/2051 | 2,000 | 1,398 | ||||||
Duke Energy Florida, LLC 3.20% 1/15/2027 | 1,445 | 1,366 | ||||||
Duke Energy Indiana, Inc. 3.25% 10/1/2049 | 1,225 | 856 | ||||||
Duke Energy Progress, LLC 3.70% 10/15/2046 | 457 | 348 | ||||||
Duke Energy Progress, LLC 2.50% 8/15/2050 | 202 | 122 | ||||||
Duke Energy Progress, LLC 2.90% 8/15/2051 | 91 | 60 | ||||||
Edison International 3.55% 11/15/2024 | 2,200 | 2,125 | ||||||
EDP Finance BV 3.625% 7/15/20246 | 4,100 | 3,959 | ||||||
Electricité de France SA 4.75% 10/13/20356 | 1,250 | 1,057 | ||||||
Electricité de France SA 4.875% 9/21/20386 | 2,750 | 2,246 | ||||||
Electricité de France SA 5.60% 1/27/2040 | 525 | 481 | ||||||
Emera US Finance, LP 3.55% 6/15/2026 | 320 | 300 | ||||||
Enersis Américas SA 4.00% 10/25/2026 | 245 | 233 | ||||||
Entergy Corp. 2.80% 6/15/2030 | 3,325 | 2,816 | ||||||
Eversource Energy 3.80% 12/1/2023 | 2,730 | 2,700 | ||||||
FirstEnergy Corp. 3.40% 3/1/2050 | 2,250 | 1,489 | ||||||
FirstEnergy Transmission, LLC 2.866% 9/15/20286 | 675 | 590 | ||||||
NRG Energy, Inc. 3.625% 2/15/20316 | 1,875 | 1,429 | ||||||
Pacific Gas and Electric Co. 2.10% 8/1/2027 | 125 | 107 | ||||||
Pacific Gas and Electric Co. 2.50% 2/1/2031 | 2,941 | 2,289 | ||||||
Pacific Gas and Electric Co. 3.30% 8/1/2040 | 100 | 68 | ||||||
Pacific Gas and Electric Co. 3.50% 8/1/2050 | 1,250 | 781 | ||||||
PacifiCorp, First Mortgage Bonds, 4.125% 1/15/2049 | 4,000 | 3,293 | ||||||
PG&E Corp. 5.00% 7/1/2028 | 3,750 | 3,429 | ||||||
PG&E Corp. 5.25% 7/1/2030 | 3,400 | 3,099 | ||||||
Public Service Electric and Gas Co. 3.60% 12/1/2047 | 548 | 419 | ||||||
Public Service Electric and Gas Co. 3.15% 1/1/2050 | 2,451 | 1,727 | ||||||
Southern California Edison Co. 2.85% 8/1/2029 | 4,450 | 3,877 | ||||||
Southern California Edison Co. 6.00% 1/15/2034 | 2,500 | 2,620 | ||||||
Southern California Edison Co. 5.75% 4/1/2035 | 675 | 675 | ||||||
150 American Funds Insurance Series
Table of Contents
Asset Allocation Fund (continued)
Bonds, notes & other debt instruments (continued)
| Principal amount (000) | Value (000) | |||||||
Corporate bonds, notes & loans (continued) | ||||||||
Utilities (continued) | ||||||||
Southern California Edison Co. 5.35% 7/15/2035 | USD | 3,000 | $ | 2,915 | ||||
Southern California Edison Co. 4.00% 4/1/2047 | 264 | 208 | ||||||
Talen Energy Corp. 7.25% 5/15/20276 | 8,334 | 8,664 | ||||||
Talen Energy Corp., Term Loan B, (3-month USD-LIBOR + 3.75%) 7.821% 7/8/20269,14 | 2,815 | 2,861 | ||||||
Talen Energy Supply, LLC 7.625% 6/1/20286 | 1,180 | 1,232 | ||||||
Venture Global Calcasieu Pass, LLC 3.875% 8/15/20296 | 1,030 | 903 | ||||||
Virginia Electric and Power Co. 2.40% 3/30/2032 | 2,575 | 2,088 | ||||||
Xcel Energy, Inc. 2.60% 12/1/2029 | 1,950 | 1,669 | ||||||
|
| |||||||
| 76,001 | ||||||||
|
| |||||||
Real estate 0.28% | ||||||||
Alexandria Real Estate Equities, Inc. 3.80% 4/15/2026 | 315 | 305 | ||||||
Alexandria Real Estate Equities, Inc. 3.95% 1/15/2028 | 1,220 | 1,148 | ||||||
Alexandria Real Estate Equities, Inc. 2.75% 12/15/2029 | 1,940 | 1,654 | ||||||
Alexandria Real Estate Equities, Inc. 3.375% 8/15/2031 | 1,320 | 1,155 | ||||||
Alexandria Real Estate Equities, Inc. 1.875% 2/1/2033 | 4,095 | 3,056 | ||||||
Alexandria Real Estate Equities, Inc. 4.85% 4/15/2049 | 410 | 349 | ||||||
American Tower Corp. 1.45% 9/15/2026 | 2,369 | 2,070 | ||||||
American Tower Corp. 3.55% 7/15/2027 | 1,425 | 1,322 | ||||||
American Tower Corp. 3.60% 1/15/2028 | 1,000 | 921 | ||||||
American Tower Corp. 1.50% 1/31/2028 | 2,500 | 2,073 | ||||||
American Tower Corp. 2.30% 9/15/2031 | 1,500 | 1,170 | ||||||
American Tower Corp. 2.95% 1/15/2051 | 2,000 | 1,247 | ||||||
Anywhere Real Estate Group, LLC 5.75% 1/15/20296 | 2,260 | 1,712 | ||||||
Essex Portfolio, LP 3.875% 5/1/2024 | 1,000 | 980 | ||||||
Essex Portfolio, LP 3.50% 4/1/2025 | 6,825 | 6,587 | ||||||
Extra Space Storage, Inc. 2.35% 3/15/2032 | 1,385 | 1,051 | ||||||
GLP Capital, LP 3.35% 9/1/2024 | 1,263 | 1,212 | ||||||
Hospitality Properties Trust 4.35% 10/1/2024 | 560 | 510 | ||||||
Host Hotels & Resorts, LP 4.50% 2/1/2026 | 355 | 341 | ||||||
Howard Hughes Corp. 5.375% 8/1/20286 | 1,450 | 1,309 | ||||||
Howard Hughes Corp. 4.125% 2/1/20296 | 1,860 | 1,560 | ||||||
Howard Hughes Corp. 4.375% 2/1/20316 | 2,690 | 2,180 | ||||||
Invitation Homes Operating Partnership, LP 2.00% 8/15/2031 | 2,401 | 1,780 | ||||||
Iron Mountain, Inc. 5.25% 7/15/20306 | 3,785 | 3,298 | ||||||
Iron Mountain, Inc. 4.50% 2/15/20316 | 2,650 | 2,184 | ||||||
Kennedy-Wilson Holdings, Inc. 4.75% 3/1/2029 | 2,645 | 2,100 | ||||||
Kennedy-Wilson Holdings, Inc. 4.75% 2/1/2030 | 1,940 | 1,482 | ||||||
Kennedy-Wilson Holdings, Inc. 5.00% 3/1/2031 | 2,260 | 1,704 | ||||||
Ladder Capital Finance Holdings LLLP 4.25% 2/1/20276 | 3,757 | 3,163 | ||||||
Park Intermediate Holdings, LLC 4.875% 5/15/20296 | 2,280 | 1,933 | ||||||
Public Storage 1.85% 5/1/2028 | 2,490 | 2,140 | ||||||
Public Storage 1.95% 11/9/2028 | 2,027 | 1,733 | ||||||
Public Storage 2.30% 5/1/2031 | 719 | 585 | ||||||
RHP Hotel Properties, LP 4.50% 2/15/20296 | 1,300 | 1,123 | ||||||
RLJ Lodging Trust, LP 4.00% 9/15/20296 | 1,240 | 1,007 | ||||||
Scentre Group 3.50% 2/12/20256 | 3,075 | 2,945 | ||||||
Scentre Group 3.25% 10/28/20256 | 1,000 | 939 | ||||||
Scentre Group 3.75% 3/23/20276 | 2,430 | 2,241 | ||||||
Sun Communities Operating, LP 2.30% 11/1/2028 | 1,845 | 1,540 | ||||||
Sun Communities Operating, LP 2.70% 7/15/2031 | 876 | 694 | ||||||
UDR, Inc. 2.95% 9/1/2026 | 760 | 699 | ||||||
VICI Properties, LP 3.875% 2/15/20296 | 1,367 | 1,200 | ||||||
VICI Properties, LP 4.625% 12/1/20296 | 532 | 485 | ||||||
VICI Properties, LP 4.125% 8/15/20306 | 971 | 851 | ||||||
|
| |||||||
| 69,738 | ||||||||
|
| |||||||
American Funds Insurance Series 151
Table of Contents
Asset Allocation Fund (continued)
Bonds, notes & other debt instruments (continued)
Principal (000) | Value (000) | |||||||
Corporate bonds, notes & loans (continued) | ||||||||
Information technology 0.27% | ||||||||
Adobe, Inc. 1.90% 2/1/2025 | USD | 366 | $ | 346 | ||||
Almonde, Inc., Term Loan B, (3-month USD-LIBOR + 3.50%) 6.871% 6/13/20249,14 | 225 | 200 | ||||||
Almonde, Inc., Term Loan, (3-month USD-LIBOR + 7.25%) 10.621% 6/13/20259,14 | 4,150 | 3,121 | ||||||
Analog Devices, Inc. 1.70% 10/1/2028 | 1,286 | 1,092 | ||||||
Analog Devices, Inc. 2.10% 10/1/2031 | 1,212 | 982 | ||||||
Analog Devices, Inc. 2.80% 10/1/2041 | 2,961 | 2,179 | ||||||
Analog Devices, Inc. 2.95% 10/1/2051 | 1,955 | 1,327 | ||||||
Apple, Inc. 3.00% 2/9/2024 | 625 | 613 | ||||||
Apple, Inc. 3.35% 2/9/2027 | 40 | 38 | ||||||
Apple, Inc. 1.20% 2/8/2028 | 5,000 | 4,245 | ||||||
Apple, Inc. 3.95% 8/8/2052 | 3,500 | 2,994 | ||||||
Block, Inc. 3.50% 6/1/2031 | 2,325 | 1,858 | ||||||
Booz Allen Hamilton, Inc. 4.00% 7/1/20296 | 1,000 | 882 | ||||||
Broadcom, Inc. 1.95% 2/15/20286 | 1,407 | 1,191 | ||||||
Broadcom, Inc. 2.60% 2/15/20336 | 2,524 | 1,901 | ||||||
Broadcom, Inc. 3.469% 4/15/20346 | 1,771 | 1,418 | ||||||
CommScope Finance, LLC 6.00% 3/1/20266 | 1,600 | 1,480 | ||||||
Diebold Nixdorf, Inc. 9.375% 7/15/20256 | 10,434 | 7,462 | ||||||
Diebold Nixdorf, Inc., units, 8.50% PIK or 8.50% Cash 10/15/20263,6,16 | 6,909 | 4,162 | ||||||
Diebold Nixdorf, Inc., Term Loan, (USD-SOFR + 5.25%) 6.75% 7/15/20253,9,14 | 4,731 | 3,186 | ||||||
Fidelity National Information Services, Inc. 3.10% 3/1/2041 | 302 | 209 | ||||||
Finastra, Ltd., Term Loan B, (3-month EUR-EURIBOR + 3.00%) 4.00% 6/13/20249,14 | EUR | 1,343 | 1,243 | |||||
Fiserv, Inc. 3.50% 7/1/2029 | USD | 471 | 425 | |||||
Fiserv, Inc. 2.65% 6/1/2030 | 3,605 | 3,039 | ||||||
Gartner, Inc. 4.50% 7/1/20286 | 650 | 607 | ||||||
Intuit, Inc. 0.95% 7/15/2025 | 1,530 | 1,394 | ||||||
Intuit, Inc. 1.35% 7/15/2027 | 1,395 | 1,209 | ||||||
Intuit, Inc. 1.65% 7/15/2030 | 1,845 | 1,484 | ||||||
Mastercard, Inc. 2.00% 11/18/2031 | 3,874 | 3,120 | ||||||
Microsoft Corp. 2.921% 3/17/2052 | 4,814 | 3,431 | ||||||
NCR Corp. 5.125% 4/15/20296 | 1,650 | 1,383 | ||||||
PayPal Holdings, Inc. 2.65% 10/1/2026 | 662 | 612 | ||||||
PayPal Holdings, Inc. 2.30% 6/1/2030 | 616 | 507 | ||||||
Sabre GLBL, Inc. 7.375% 9/1/20256 | 946 | 911 | ||||||
Sabre GLBL, Inc. 11.25% 12/15/20276 | 1,157 | 1,192 | ||||||
Sabre Holdings Corp. 9.25% 4/15/20256 | 3,122 | 3,115 | ||||||
Synaptics, Inc. 4.00% 6/15/20296 | 875 | 738 | ||||||
Unisys Corp. 6.875% 11/1/20276 | 725 | 558 | ||||||
VeriSign, Inc. 2.70% 6/15/2031 | 625 | 511 | ||||||
Veritas US, Inc. 7.50% 9/1/20256 | 835 | 577 | ||||||
Viavi Solutions, Inc. 3.75% 10/1/20296 | 725 | 611 | ||||||
|
| |||||||
| 67,553 | ||||||||
|
| |||||||
Consumer staples 0.23% | ||||||||
7-Eleven, Inc. 0.80% 2/10/20246 | 1,700 | 1,618 | ||||||
7-Eleven, Inc. 0.95% 2/10/20266 | 825 | 723 | ||||||
7-Eleven, Inc. 1.30% 2/10/20286 | 2,500 | 2,076 | ||||||
Albertsons Companies, Inc. 3.50% 3/15/20296 | 1,230 | 1,035 | ||||||
Altria Group, Inc. 3.40% 2/4/2041 | 1,500 | 1,000 | ||||||
Altria Group, Inc. 3.70% 2/4/2051 | 1,395 | 879 | ||||||
Anheuser-Busch InBev NV 4.00% 4/13/2028 | 845 | 806 | ||||||
Anheuser-Busch InBev NV 4.35% 6/1/2040 | 2,500 | 2,208 | ||||||
Anheuser-Busch InBev NV 4.60% 4/15/2048 | 1,500 | 1,311 | ||||||
British American Tobacco PLC 3.222% 8/15/2024 | 2,826 | 2,723 | ||||||
British American Tobacco PLC 3.215% 9/6/2026 | 3,323 | 3,070 | ||||||
British American Tobacco PLC 4.54% 8/15/2047 | 940 | 668 | ||||||
Central Garden & Pet Co. 4.125% 4/30/20316 | 1,395 | 1,157 | ||||||
Coca-Cola Company 1.00% 3/15/2028 | 940 | 787 | ||||||
Conagra Brands, Inc. 1.375% 11/1/2027 | 4,615 | 3,852 | ||||||
Constellation Brands, Inc. 3.60% 2/15/2028 | 625 | 580 | ||||||
152 American Funds Insurance Series
Table of Contents
Asset Allocation Fund (continued)
Bonds, notes & other debt instruments (continued)
Principal amount (000) | Value (000) | |||||||
Corporate bonds, notes & loans (continued) | ||||||||
Consumer staples (continued) | ||||||||
Constellation Brands, Inc. 2.25% 8/1/2031 | USD | 1,487 | $ | 1,185 | ||||
Coty, Inc. 4.75% 1/15/20296 | 1,680 | 1,523 | ||||||
Imperial Tobacco Finance PLC 6.125% 7/27/20276 | 845 | 842 | ||||||
Kronos Acquisition Holdings, Inc. 5.00% 12/31/20266 | 2,990 | 2,590 | ||||||
Lamb Weston Holdings, Inc. 4.125% 1/31/20306 | 2,210 | 1,955 | ||||||
PepsiCo, Inc. 2.625% 10/21/2041 | 5,000 | 3,721 | ||||||
PepsiCo, Inc. 3.625% 3/19/2050 | 777 | 639 | ||||||
PepsiCo, Inc. 2.75% 10/21/2051 | 1,723 | 1,200 | ||||||
Philip Morris International, Inc. 2.875% 5/1/2024 | 788 | 765 | ||||||
Philip Morris International, Inc. 3.25% 11/10/2024 | 2,000 | 1,936 | ||||||
Philip Morris International, Inc. 0.875% 5/1/2026 | 2,990 | 2,630 | ||||||
Philip Morris International, Inc. 5.125% 11/17/2027 | 3,073 | 3,101 | ||||||
Philip Morris International, Inc. 3.375% 8/15/2029 | 788 | 711 | ||||||
Philip Morris International, Inc. 5.625% 11/17/2029 | 1,482 | 1,507 | ||||||
Philip Morris International, Inc. 1.75% 11/1/2030 | 2,956 | 2,322 | ||||||
Philip Morris International, Inc. 5.75% 11/17/2032 | 938 | 959 | ||||||
Post Holdings, Inc. 4.625% 4/15/20306 | 2,886 | 2,496 | ||||||
Prestige Brands International, Inc. 3.75% 4/1/20316 | 1,115 | 921 | ||||||
Reynolds American, Inc. 5.85% 8/15/2045 | 2,030 | 1,737 | ||||||
Simmons Foods, Inc. 4.625% 3/1/20296 | 560 | 457 | ||||||
|
| |||||||
| 57,690 | ||||||||
|
| |||||||
Total corporate bonds, notes & loans | 1,396,142 | |||||||
|
| |||||||
Asset-backed obligations 1.68% | ||||||||
Affirm Asset Securitization Trust, Series 2021-Z2, Class A, 1.17% 11/16/20266,8 | 1,050 | 1,005 | ||||||
Allegro CLO, Ltd., Series 2016-1A, Class AR2, (3-month USD-LIBOR + 0.95%) 5.029% 1/15/20306,8,9 | 2,205 | 2,182 | ||||||
Allegro CLO, Ltd., Series 2017-1A, Class AR, (3-month USD-LIBOR + 0.95%) 5.029% 10/16/20306,8,9 | 1,639 | 1,612 | ||||||
American Express Credit Account Master Trust, Series 2018-9, Class A, (1-month USD-LIBOR + 0.38%) 4.698% 4/15/20268,9 | 9,000 | 8,995 | ||||||
Ares CLO, Ltd., Series 2017-42A, Class AR, (3-month USD-LIBOR + 0.92%) 5.245% 1/22/20286,8,9 | 2,566 | 2,538 | ||||||
Avis Budget Rental Car Funding (AESOP), LLC, Series 2017-2A, Class A, 2.97% 3/20/20246,8 | 960 | 957 | ||||||
Avis Budget Rental Car Funding (AESOP), LLC, Series 2018-1A, Class A, 3.70% 9/20/20246,8 | 1,114 | 1,103 | ||||||
Avis Budget Rental Car Funding (AESOP), LLC, Series 2018-2A, Class A, 4.00% 3/20/20256,8 | 3,100 | 3,049 | ||||||
Avis Budget Rental Car Funding (AESOP), LLC, Series 2020-2, Class A, 2.02% 2/20/20276,8 | 539 | 489 | ||||||
Avis Budget Rental Car Funding (AESOP), LLC, Series 2020-2A, Class B, 2.96% 2/20/20276,8 | 138 | 124 | ||||||
Avis Budget Rental Car Funding (AESOP), LLC, Series 2021-1A, Class A, 1.38% 8/20/20276,8 | 11,617 | 10,133 | ||||||
BA Credit Card Trust, Series 2022-A2, Class A2, 5.00% 4/17/20288 | 6,633 | 6,706 | ||||||
Ballyrock CLO, Ltd., Series 2019-2A, Class A1AR, (3-month USD-LIBOR + 1.00%) 5.675% 11/20/20306,8,9 | 3,660 | 3,614 | ||||||
Bankers Healthcare Group Securitization Trust, Series 2021-A, Class A, 1.42% 11/17/20336,8 | 531 | 494 | ||||||
Castlelake Aircraft Securitization Trust, Series 2021-1, Class A, 2.868% 5/11/20376,8 | 4,807 | 4,092 | ||||||
Castlelake Aircraft Securitization Trust, Series 2017-1R, Class A, 2.741% 8/15/20416,8 | 665 | 582 | ||||||
Cent CLO, Ltd., Series 2014-21A, Class AR, (3-month USD-LIBOR + 0.97%) 5.328% 7/27/20306,8,9 | 5,164 | 5,089 | ||||||
CF Hippolyta, LLC, Series 2020-1, Class A1, 1.69% 7/15/20606,8 | 5,191 | 4,639 | ||||||
CF Hippolyta, LLC, Series 2020-1, Class A2, 1.99% 7/15/20606,8 | 1,746 | 1,444 | ||||||
CF Hippolyta, LLC, Series 2021-1, Class A1, 1.53% 3/15/20616,8 | 6,093 | 5,277 | ||||||
Citibank Credit Card Issuance Trust, Series 2017-A5, Class A5, (1-month USD-LIBOR + 0.62%) 4.981% 4/22/20268,9 | 4,960 | 4,963 | ||||||
American Funds Insurance Series 153
Table of Contents
Asset Allocation Fund (continued)
Bonds, notes & other debt instruments (continued)
Principal amount (000) | Value (000) | |||||||
Asset-backed obligations (continued) | ||||||||
CLI Funding VI, LLC, Series 2020-2A, Class A, 2.03% 9/15/20456,8 | USD | 1,446 | $ | 1,245 | ||||
CLI Funding VI, LLC, Series 2020-1A, Class A, 2.08% 9/18/20456,8 | 5,382 | 4,669 | ||||||
CLI Funding VI, LLC, Series 2020-3A, Class A, 2.07% 10/18/20456,8 | 1,170 | 1,017 | ||||||
CLI Funding VIII, LLC, Series 2021-1A, Class A, 1.64% 2/18/20466,8 | 1,607 | 1,373 | ||||||
Discover Card Execution Note Trust, Series 2018-A6, Class A6, (1-month USD-LIBOR + 0.39%) 4.708% 3/15/20268,9 | 11,400 | 11,397 | ||||||
Drive Auto Receivables Trust, Series 2020-1, Class C, 2.36% 3/16/20268 | 256 | 256 | ||||||
DriveTime Auto Owner Trust, Series 2022-3, Class A, 6.05% 10/15/20266,8 | 6,318 | 6,335 | ||||||
Dryden Senior Loan Fund, CLO, Series 2017-47A, Class A1R, (3-month USD-LIBOR + 0.98%) 5.059% 4/15/20286,8,9 | 5,181 | 5,131 | ||||||
EDvestinU Private Education Loan, LLC, Series 2021-A, Class A, 1.80% 11/25/20456,8 | 351 | 297 | ||||||
Enterprise Fleet Financing, LLC, Series 2022-1, Class A2, 3.03% 1/20/20286,8 | 6,513 | 6,341 | ||||||
Enterprise Fleet Financing, LLC, Series 2022-3, Class A2, 4.38% 7/20/20296,8 | 3,263 | 3,192 | ||||||
Enterprise Fleet Financing, LLC, Series 2022-4, Class A2, 5.76% 10/22/20296,8 | 5,092 | 5,109 | ||||||
Exeter Automobile Receivables Trust, Series 2022-6, Class A2, 5.73% 11/17/20258 | 1,100 | 1,101 | ||||||
FirstKey Homes Trust, Series 2020-SFR2, Class A, 1.266% 10/19/20376,8 | 5,999 | 5,320 | ||||||
Flagship Credit Auto Trust, Series 2022-4, Class A2, 6.15% 9/15/20266,8 | 3,272 | 3,292 | ||||||
Ford Credit Auto Owner Trust, Series 2018-2, Class A, 3.47% 1/15/20306,8 | 4,825 | 4,760 | ||||||
Ford Credit Auto Owner Trust, Series 2018-1, Class A, 3.52% 7/15/20306,8 | 6,000 | 5,885 | ||||||
Ford Credit Auto Owner Trust, Series 2018-1, Class A, 3.19% 7/15/20316,8 | 9,605 | 9,181 | ||||||
Ford Credit Auto Owner Trust, Series 2020-1, Class A, 2.04% 8/15/20316,8 | 8,861 | 8,318 | ||||||
GCI Funding I, LLC, Series 2020-1, Class A, 2.82% 10/18/20456,8 | 685 | 604 | ||||||
GCI Funding I, LLC, Series 2020-1, Class B, 3.81% 10/18/20456,8 | 275 | 245 | ||||||
Global SC Finance V SRL, Series 2019-1A, Class B, 4.81% 9/17/20396,8 | 2,443 | 2,294 | ||||||
Global SC Finance V SRL, Series 2020-1A, Class A, 2.17% 10/17/20406,8 | 10,273 | 9,116 | ||||||
Global SC Finance VII SRL, Series 2020-2A, Class A, 2.26% 11/19/20406,8 | 12,830 | 11,408 | ||||||
Global SC Finance VII SRL, Series 2021-1A, Class A, 1.86% 4/17/20416,8 | 4,021 | 3,468 | ||||||
Global SC Finance VII SRL, Series 2021-2A, Class A, 1.95% 8/17/20416,8 | 5,992 | 5,201 | ||||||
Global SC Finance VII SRL, Series 2021-2A, Class B, 2.49% 8/17/20416,8 | 474 | 402 | ||||||
Hertz Vehicle Financing III, LLC, Series 2021-A, Class B, 3.65% 6/30/20233,6,8 | 5,930 | 5,689 | ||||||
Hertz Vehicle Financing III, LLC, Series 2021-1A, Class A, 1.21% 12/26/20256,8 | 8,452 | 7,816 | ||||||
Hertz Vehicle Financing III, LLC, Series 2021-1A, Class B, 1.56% 12/26/20256,8 | 634 | 581 | ||||||
Hertz Vehicle Financing III, LLC, Series 2021-1A, Class C, 2.05% 12/26/20256,8 | 405 | 365 | ||||||
Hertz Vehicle Financing III, LLC, Series 2022-4A, Class A, 3.73% 9/25/20266,8 | 8,390 | 8,026 | ||||||
Hertz Vehicle Financing III, LLC, Series 2021-2A, Class A, 1.68% 12/27/20276,8 | 5,565 | 4,853 | ||||||
Hertz Vehicle Financing III, LLC, Series 2021-2A, Class B, 2.12% 12/27/20276,8 | 685 | 588 | ||||||
Hertz Vehicle Financing III, LLC, Series 2021-2A, Class C, 2.52% 12/27/20276,8 | 429 | 355 | ||||||
Hertz Vehicle Financing III, LLC, Series 2022-2A, Class A, 2.33% 6/26/20286,8 | 4,900 | 4,305 | ||||||
Hertz Vehicle Financing III, LLC, Series 2022-5A, Class A, 3.89% 9/25/20286,8 | 8,750 | 8,096 | ||||||
Longfellow Place CLO, Ltd., Series 2013-1A, Class AR3, (3-month USD-LIBOR + 1.00%) 5.079% 4/15/20296,8,9 | 1,090 | 1,087 | ||||||
Madison Park Funding, Ltd., CLO, Series 2015-17A, Class AR2, (3-month USD-LIBOR + 1.00%) 5.278% 7/21/20306,8,9 | 5,497 | 5,411 | ||||||
Marathon CLO, Ltd., Series 2017-9A, Class A1AR, (3-month USD-LIBOR + 1.15%) 5.229% 4/15/20296,8,9 | 2,311 | 2,288 | ||||||
Mercury Financial Credit Card Master Trust, Series 2021-1A, Class A, 1.54% 3/20/20266,8 | 4,700 | 4,486 | ||||||
Mission Lane Credit Card Master Trust, Series 2021-A, Class A, 1.59% 9/15/20266,8 | 1,900 | 1,840 | ||||||
Mission Lane Credit Card Master Trust, Series 2022-A, Class A, 6.92% 9/15/20276,8 | 2,531 | 2,473 | ||||||
Navient Student Loan Trust, Series 2021-C, Class A, 1.06% 10/15/20696,8 | 5,085 | 4,327 | ||||||
Navient Student Loan Trust, Series 2021-G, Class A, 1.58% 4/15/20706,8 | 5,969 | 5,062 | ||||||
Navigator Aircraft ABS, Ltd., Series 2021-1, Class A, 2.771% 11/15/20466,8 | 6,343 | 5,341 | ||||||
Nelnet Student Loan Trust, Series 2021-C, Class AFX, 1.32% 4/20/20626,8 | 10,468 | 9,303 | ||||||
Nelnet Student Loan Trust, Series 2021-A, Class APT1, 1.36% 4/20/20626,8 | 5,889 | 5,217 | ||||||
Nelnet Student Loan Trust, Series 2021-B, Class AFX, 1.42% 4/20/20626,8 | 10,010 | 8,901 | ||||||
New Economy Assets Phase 1 Issuer, LLC, Series 2021-1, Class A1, 1.91% 10/20/20616,8 | 23,051 | 19,520 | ||||||
Newark BSL CLO 2, Ltd., Series 2017-1A, Class A1R, (3-month USD-LIBOR + 0.97%) 5.328% 7/25/20306,8,9 | 1,752 | 1,733 | ||||||
Palmer Square Loan Funding, CLO, Series 2020-4, Class A1, (3-month USD-LIBOR + 1.00%) 5.757% 11/25/20286,8,9 | 1,415 | 1,405 | ||||||
154 American Funds Insurance Series
Table of Contents
Asset Allocation Fund (continued)
Bonds, notes & other debt instruments (continued)
Principal amount (000) | Value (000) | |||||||
Asset-backed obligations (continued) | ||||||||
Palmer Square Loan Funding, CLO, Series 2021-1, Class A1, (3-month USD-LIBOR + 0.90%) 5.143% 4/20/20296,8,9 | USD | 437 | $ | 433 | ||||
Palmer Square Loan Funding, CLO, Series 2021-4A, Class A1, (3-month USD-LIBOR + 0.80%) 4.879% 10/15/20296,8,9 | 8,431 | 8,324 | ||||||
Palmer Square Loan Funding, CLO, Series 2021-4A, Class A2, (3-month USD-LIBOR + 1.40%) 5.479% 10/15/20296,8,9 | 5,378 | 5,207 | ||||||
Palmer Square Loan Funding, CLO, Series 2022-5, Class A1, (3-month USD CME Term SOFR + 1.56%) 4.084% 1/15/20316,8,9 | 5,871 | 5,838 | ||||||
PG&E Wildfire Recovery Funding, LLC, Series 2022-A, Class A2, 4.263% 6/1/20368 | 2,725 | 2,534 | ||||||
PPM CLO, Ltd., Series 2022-6, Class A, (3-month USD CME Term SOFR + 2.45%) 2.45% 1/20/20316,8,9 | 9,947 | 9,947 | ||||||
Race Point CLO, Ltd., Series 2015-9A, Class A1A2, (3-month USD-LIBOR + 0.94%) 5.019% 10/15/20306,8,9 | 4,634 | 4,571 | ||||||
Santander Drive Auto Receivables Trust, Series 2022-5, Class A2, 3.98% 1/15/20258 | 4,359 | 4,337 | ||||||
Santander Drive Auto Receivables Trust, Series 2020-1, Class C, 4.11% 12/15/20258 | 646 | 643 | ||||||
Santander Drive Auto Receivables Trust, Series 2022-7, Class A2, 5.81% 1/15/20268 | 1,987 | 1,991 | ||||||
Santander Drive Auto Receivables Trust, Series 2022-5, Class A3, 4.11% 8/17/20268 | 4,101 | 4,027 | ||||||
SMB Private Education Loan Trust, Series 2021-A, Class A2A2, (1-month USD-LIBOR + 0.73%) 5.048% 1/15/20536,8,9 | 6,531 | 6,256 | ||||||
SOLRR Aircraft Aviation Holding, Ltd., Series 2021-1, Class A, 2.636% 10/15/20466,8 | 3,451 | 2,775 | ||||||
SPRITE, Ltd., Series 2021-1, Class A, 3.75% 11/15/20466,8 | 4,820 | 4,182 | ||||||
Stellar Jay Ireland DAC, Series 2021-1, Class A, 3.967% 10/15/20416,8 | 4,782 | 4,039 | ||||||
Stonepeak Infrastructure Partners, Series 2021-1A, Class AA, 2.301% 2/28/20336,8 | 2,480 | 2,209 | ||||||
Stonepeak Infrastructure Partners, Series 2021-1A, Class A, 2.675% 2/28/20336,8 | 2,048 | 1,770 | ||||||
Stratus Static CLO, Ltd., Series 2022-3, Class A, (3-month USD CME Term SOFR + 2.15%) 6.678% 10/20/20316,8,9 | 7,500 | 7,500 | ||||||
SuttonPark Structured Settlements, Series 2021-1, Class A, 1.95% 9/15/20756,8 | 3,286 | 2,989 | ||||||
TAL Advantage V, LLC, Series 2020-1A, Class A, 2.05% 9/20/20456,8 | 1,820 | 1,599 | ||||||
Textainer Marine Containers, Ltd., Series 2020-2A, Class A, 2.10% 9/20/20456,8 | 801 | 699 | ||||||
Textainer Marine Containers, Ltd., Series 2021-1A, Class A, 1.68% 2/20/20466,8 | 924 | 778 | ||||||
Textainer Marine Containers, Ltd., Series 2021-2A, Class A, 2.23% 4/20/20466,8 | 2,661 | 2,267 | ||||||
Toyota Auto Loan Extended Note Trust, Series 2019-1, Class A, 2.56% 11/25/20316,8 | 3,250 | 3,134 | ||||||
Toyota Auto Loan Extended Note Trust, Series 2020-1, Class A, 1.35% 5/25/20336,8 | 889 | 814 | ||||||
Toyota Auto Loan Extended Note Trust, Series 2021-1, Class A, 1.07% 2/27/20346,8,9 | 7,257 | 6,439 | ||||||
Triton Container Finance VIII, LLC, Series 2020-1, Class A, 2.11% 9/20/20456,8 | 10,345 | 8,870 | ||||||
Triton Container Finance VIII, LLC, Series 2021-1, Class A, 1.86% 3/20/20466,8 | 1,823 | 1,523 | ||||||
Westlake Automobile Receivables Trust, Series 2022-3, Class A2, 5.24% 7/15/20256,8 | 6,521 | 6,506 | ||||||
|
| |||||||
| 417,313 | ||||||||
|
| |||||||
Bonds & notes of governments & government agencies outside the U.S. 0.17% | ||||||||
CPPIB Capital, Inc. 2.75% 11/2/20276 | 6,600 | 6,096 | ||||||
European Investment Bank 0.75% 10/26/2026 | 6,194 | 5,433 | ||||||
OMERS Finance Trust 3.50% 4/19/20326 | 4,315 | 3,905 | ||||||
OMERS Finance Trust 4.00% 4/19/20526 | 4,315 | 3,459 | ||||||
Panama (Republic of) 3.298% 1/19/2033 | 4,365 | 3,545 | ||||||
Panama (Republic of) 4.50% 1/19/2063 | 1,035 | 733 | ||||||
Peru (Republic of) 1.862% 12/1/2032 | 2,525 | 1,848 | ||||||
Peru (Republic of) 2.78% 12/1/2060 | 3,775 | 2,214 | ||||||
Qatar (State of) 3.375% 3/14/20246 | 2,315 | 2,271 | ||||||
Qatar (State of) 4.00% 3/14/20296 | 745 | 733 | ||||||
Qatar (State of) 4.817% 3/14/20496 | 750 | 731 | ||||||
Swedish Export Credit Corp. 3.625% 9/3/2024 | 5,089 | 4,993 | ||||||
United Mexican States 2.659% 5/24/2031 | 2,703 | 2,187 | ||||||
United Mexican States 4.875% 5/19/2033 | 1,790 | 1,647 | ||||||
United Mexican States 3.771% 5/24/2061 | 1,528 | 971 | ||||||
|
| |||||||
| 40,766 | ||||||||
|
| |||||||
American Funds Insurance Series 155
Table of Contents
Asset Allocation Fund (continued)
Bonds, notes & other debt instruments (continued)
| Principal amount (000) | Value (000) | |||||||
Municipals 0.14% | ||||||||
California 0.02% | ||||||||
Golden State Tobacco Securitization Corp., Enhanced Tobacco Settlement Asset-Backed Bonds, Series 2021-A-1, 2.158% 6/1/2026 | USD | 1,200 | $ | 1,079 | ||||
Golden State Tobacco Securitization Corp., Enhanced Tobacco Settlement Asset-Backed Bonds, Series 2021-A-1, 2.332% 6/1/2027 | 1,660 | 1,454 | ||||||
Golden State Tobacco Securitization Corp., Enhanced Tobacco Settlement Asset-Backed Bonds, Series 2021-B, 2.746% 6/1/2034 | 495 | 398 | ||||||
Golden State Tobacco Securitization Corp., Enhanced Tobacco Settlement Asset-Backed Bonds, Series 2021-B, 3.293% 6/1/2042 | 1,170 | 869 | ||||||
Golden State Tobacco Securitization Corp., Enhanced Tobacco Settlement Asset-Backed Bonds, Series 2021-B, 3.00% 6/1/2046 | 2,470 | 2,288 | ||||||
|
| |||||||
| 6,088 | ||||||||
|
| |||||||
Connecticut 0.00% | ||||||||
Housing Fin. Auth., Housing Mortgage Fin. Program Bonds, Series 2014-A-1, 4.00% 11/15/2044 | 5 | 5 | ||||||
Housing Fin. Auth., Housing Mortgage Fin. Program Bonds, Series 2014-C-1, 4.00% 11/15/2044 | 10 | 10 | ||||||
|
| |||||||
| 15 | ||||||||
|
| |||||||
Florida 0.04% | ||||||||
Board of Administration Fin. Corp., Rev. Bonds, Series 2020-A, 1.705% 7/1/2027 | 5,335 | 4,649 | ||||||
Board of Administration Fin. Corp., Rev. Bonds, Series 2020-A, 2.154% 7/1/2030 | 5,365 | 4,399 | ||||||
|
| |||||||
| 9,048 | ||||||||
|
| |||||||
Guam 0.00% | ||||||||
A.B. Won Pat International Airport Auth., General Rev. Bonds, Series 2021-A, 3.839% 10/1/2036 | 240 | 196 | ||||||
A.B. Won Pat International Airport Auth., General Rev. Bonds, Series 2021-A, 4.46% 10/1/2043 | 315 | 246 | ||||||
|
| |||||||
| 442 | ||||||||
|
| |||||||
Illinois 0.01% | ||||||||
G.O. Bonds, Pension Funding, Series 2003, Assured Guaranty Municipal insured, 5.10% 6/1/2033 | 4,125 | 3,952 | ||||||
|
| |||||||
Maryland 0.00% | ||||||||
Community Dev. Administration, Dept. of Housing and Community Dev., Residential Rev. Ref. Bonds, Series 2014-E, 2.857% 9/1/2040 | 10 | 10 | ||||||
|
| |||||||
Minnesota 0.00% | ||||||||
Housing Fin. Agcy., Residential Housing Fin. Bonds, Series 2014-A, 4.00% 7/1/2038 | 30 | 30 | ||||||
|
| |||||||
New York 0.03% | ||||||||
Dormitory Auth., Taxable State Personal Income Tax Rev. Bonds (General Purpose), Series 2021-C, 1.187% 3/15/2026 (escrowed to maturity) | 2,865 | 2,556 | ||||||
Dormitory Auth., Taxable State Personal Income Tax Rev. Bonds (General Purpose), Series 2021-C, 1.748% 3/15/2028 | 4,745 | 4,036 | ||||||
|
| |||||||
| 6,592 | ||||||||
|
| |||||||
Ohio 0.02% | ||||||||
Cleveland-Cuyahoga Port Auth., Federal Lease Rev. Bonds (VA Cleveland Health Care Center Project), Series 2021, 4.425% 5/1/2031 | 5,110 | 4,314 | ||||||
|
| |||||||
South Carolina 0.00% | ||||||||
Housing Fin. Auth., Mortgage Rev. Ref. Bonds, Series 2014, AMT, 4.00% 7/1/2041 | 10 | 10 | ||||||
|
| |||||||
156 American Funds Insurance Series
Table of Contents
Asset Allocation Fund (continued)
Bonds, notes & other debt instruments (continued)
Principal amount (000) | Value (000) | |||||||
Municipals (continued) | ||||||||
South Dakota 0.00% | ||||||||
Housing Dev. Auth., Homeownership Mortgage Bonds, Series 2014-F, 4.00% 5/1/2034 | USD | 5 | $ | 5 | ||||
|
| |||||||
Tennessee 0.00% | ||||||||
Housing Dev. Agcy., Residential Fin. Program Bonds, Series 2013-2-A, AMT, 4.00% 7/1/2043 | 5 | 5 | ||||||
|
| |||||||
Wisconsin 0.02% | ||||||||
Public Fin. Auth., Federal Lease Rev. Bonds (Fort Sam Acquisition Fncg.), Series 2022, 4.95% 3/1/2034 | 5,865 | 5,213 | ||||||
|
| |||||||
Total municipals | 35,724 | |||||||
|
| |||||||
Total bonds, notes & other debt instruments (cost: $5,829,150,000) | 5,385,913 | |||||||
|
| |||||||
| Shares | ||||||||
Short-term securities 6.82% | ||||||||
Money market investments 6.61% | ||||||||
Capital Group Central Cash Fund 4.31%7,17 | 16,398,802 | 1,639,716 | ||||||
|
| |||||||
Money market investments purchased with collateral from securities on loan 0.21% | ||||||||
Goldman Sachs Financial Square Government Fund, Institutional Shares 4.15%17,18 | 20,644,758 | 20,645 | ||||||
Invesco Short-Term Investments Trust – Government & Agency Portfolio, Institutional Class 4.22%17,18 | 17,940,546 | 17,940 | ||||||
Capital Group Central Cash Fund 4.31%7,17,18 | 126,229 | 12,622 | ||||||
|
| |||||||
| 51,207 | ||||||||
|
| |||||||
Total short-term securities (cost: $1,690,721,000) | 1,690,923 | |||||||
|
| |||||||
Total investment securities 102.09% (cost: $21,116,750,000) | 25,318,386 | |||||||
Other assets less liabilities (2.09)% | (517,812 | ) | ||||||
|
| |||||||
Net assets 100.00% | $ | 24,800,574 | ||||||
|
| |||||||
Futures contracts
Contracts | Type | Number of contracts | Expiration | Notional amount (000) | Value and unrealized appreciation (depreciation) at 12/31/2022 (000) | |||||||||||||||
2 Year U.S. Treasury Note Futures | Long | 543 | March 2023 | USD111,357 | $ | 139 | ||||||||||||||
5 Year U.S. Treasury Note Futures | Long | 2,120 | March 2023 | 228,811 | (257 | ) | ||||||||||||||
10 Year U.S. Treasury Note Futures | Long | 1,324 | March 2023 | 148,681 | (1,571 | ) | ||||||||||||||
10 Year Ultra U.S. Treasury Note Futures | Short | 3,101 | March 2023 | (366,790 | ) | 2,180 | ||||||||||||||
20 Year U.S. Treasury Bond Futures | Long | 960 | March 2023 | 120,330 | (1,534 | ) | ||||||||||||||
30 Year Ultra U.S. Treasury Bond Futures | Long | 53 | March 2023 | 7,119 | (123 | ) | ||||||||||||||
|
| |||||||||||||||||||
| $ | (1,166 | ) | ||||||||||||||||||
|
| |||||||||||||||||||
American Funds Insurance Series 157
Table of Contents
Asset Allocation Fund (continued)
Swap contracts
Credit default swaps
Centrally cleared credit default swaps on credit indices — buy protection
Reference index | Financing rate paid | Payment frequency | Expiration date | Notional amount (000) | Value at 12/31/2022 (000) | Upfront premium received (000) | Unrealized depreciation at 12/31/2022 (000) | |||||||||||||||||||
CDX.NA.IG.39 | 1.00% | Quarterly | 12/20/2027 | USD238,057 | $ | (1,903 | ) | $ | (280 | ) | $ | (1,623 | ) | |||||||||||||
Investments in affiliates7
| Value of affiliates at 1/1/2022 (000) | Additions (000) | Reductions (000) | Net realized loss (000) | Net unrealized appreciation (depreciation) (000) | Value of affiliates at 12/31/2022 (000) | Dividend income (000) | ||||||||||||||||||||||
Common stocks 0.00% | ||||||||||||||||||||||||||||
Health care 0.00% | ||||||||||||||||||||||||||||
NuCana PLC (ADR)19 | $ | 7,086 | $ | — | $ | 2,674 | $ | (14,288 | ) | $ | 9,876 | $ | — | $ | — | |||||||||||||
Investment funds 5.51% | ||||||||||||||||||||||||||||
Capital Group Central Corporate Bond Fund | 1,617,261 | 83,203 | 40,000 | (10,186 | ) | (283,156 | ) | 1,367,122 | 43,890 | |||||||||||||||||||
Short-term securities 6.66% | ||||||||||||||||||||||||||||
Money market investments 6.61% | ||||||||||||||||||||||||||||
Capital Group Central Cash Fund 4.31%17 | 1,417,334 | 4,300,144 | 4,077,429 | (250 | ) | (83 | ) | 1,639,716 | 36,585 | |||||||||||||||||||
Money market investments purchased with collateral from securities on loan 0.05% | ||||||||||||||||||||||||||||
Capital Group Central Cash Fund 4.31%17,18 | 8,492 | 4,130 | 20 | 12,622 | — | 21 | ||||||||||||||||||||||
|
| |||||||||||||||||||||||||||
Total short-term securities | 1,652,338 | |||||||||||||||||||||||||||
|
|
|
|
|
|
|
| |||||||||||||||||||||
Total 12.17% | $ | (24,724 | ) | $ | (273,363 | ) | $ | 3,019,460 | $ | 80,475 | ||||||||||||||||||
|
|
|
|
|
|
|
| |||||||||||||||||||||
Restricted securities4 | Acquisition date | Cost (000) | Value (000) | Percent of net assets | ||||||||||||
Carbon Health Technologies, Inc., convertible preferred shares, | ||||||||||||||||
1.00% 7/9/2024 3 | 7/9/2021 | $ | 50,000 | $ | 63,388 | .26 | % | |||||||||
Rotech Healthcare, Inc.1,3 | 8/22/2014 | 6,949 | 19,703 | .08 | ||||||||||||
|
|
|
|
|
| |||||||||||
Total | $ | 56,949 | $ | 83,091 | .34 | % | ||||||||||
|
|
|
|
|
| |||||||||||
158 American Funds Insurance Series
Table of Contents
Asset Allocation Fund (continued)
| 1 | Security did not produce income during the last 12 months. |
| 2 | All or a portion of this security was on loan. The total value of all such securities was $67,688,000, which represented .27% of the net assets of the fund. Refer to Note 5 for more information on securities lending. |
| 3 | Value determined using significant unobservable inputs. |
| 4 | Restricted security, other than Rule 144A securities or commercial paper issued pursuant to Section 4(a)(2) of the Securities Act of 1933. The total value of all such restricted securities was $83,091,000, which represented .33% of the net assets of the fund. |
| 5 | Amount less than one thousand. |
| 6 | Acquired in a transaction exempt from registration under Rule 144A or, for commercial paper, Section 4(a)(2) of the Securities Act of 1933. May be resold in the U.S. in transactions exempt from registration, normally to qualified institutional buyers. The total value of all such securities was $1,155,580,000, which represented 4.66% of the net assets of the fund. |
| 7 | Affiliate of the fund or part of the same “group of investment companies” as the fund, as defined under the Investment Company Act of 1940, as amended. |
| 8 | Principal payments may be made periodically. Therefore, the effective maturity date may be earlier than the stated maturity date. |
| 9 | Coupon rate may change periodically. Reference rate and spread are as of the most recent information available. Some coupon rates are determined by the issuer or agent based on current market conditions; therefore, the reference rate and spread are not available. |
| 10 | Purchased on a TBA basis. |
| 11 | All or a portion of this security was pledged as collateral. The total value of pledged collateral was $8,779,000, which represented .04% of the net assets of the fund. |
| 12 | Index-linked bond whose principal amount moves with a government price index. |
| 13 | Step bond; coupon rate may change at a later date. |
| 14 | Loan participations and assignments; may be subject to legal or contractual restrictions on resale. The total value of all such loans was $8,799,000, which represented .04% of the net assets of the fund. |
| 15 | Scheduled interest and/or principal payment was not received. |
| 16 | Payment in kind; the issuer has the option of paying additional securities in lieu of cash. Payment methods and rates are as of the most recent payment when available. |
| 17 | Rate represents the seven-day yield at 12/31/2022. |
| 18 | Security purchased with cash collateral from securities on loan. Refer to Note 5 for more information on securities lending. |
| 19 | Affiliated issuer during the reporting period but no longer held at 12/31/2022. |
| 20 | Represents net activity. Refer to Note 5 for more information on securities lending. |
| 21 | Dividend income is included with securities lending income in the fund’s statement of operations and is not shown in this table. |
Key to abbreviations
ADR = American Depositary Receipts
Agcy. = Agency
AMT = Alternative Minimum Tax
Assn. = Association
Auth. = Authority
CAD = Canadian dollars
CLO = Collateralized Loan Obligations
CME = CME Group
CMO = Collateralized Mortgage Obligations
DAC = Designated Activity Company
Dept. = Department
Dev. = Development
EUR = Euros
EURIBOR = Euro Interbank Offered Rate
Fin. = Finance
Fncg. = Financing
G.O. = General Obligation
LIBOR = London Interbank Offered Rate
PIK = Payment In Kind
Ref. = Refunding
REIT = Real Estate Investment Trust
Rev. = Revenue
SOFR = Secured Overnight Financing Rate
TBA = To be announced
USD = U.S. dollars
Refer to the notes to financial statements.
American Funds Insurance Series 159
Table of Contents
American Funds Global Balanced Fund (formerly Global Balanced Fund)
Investment portfolio December 31, 2022
Common stocks 58.58%
| Shares | Value (000) | |||||||
Financials 10.64% | ||||||||
Zurich Insurance Group AG | 10,777 | $ | 5,150 | |||||
B3 SA-Brasil, Bolsa, Balcao | 2,047,634 | 5,123 | ||||||
HDFC Bank, Ltd. (ADR) | 25,988 | 1,778 | ||||||
HDFC Bank, Ltd. | 79,465 | 1,564 | ||||||
DNB Bank ASA | 156,181 | 3,092 | ||||||
AIA Group, Ltd. | 195,894 | 2,158 | ||||||
Toronto-Dominion Bank (CAD denominated) | 32,954 | 2,134 | ||||||
PNC Financial Services Group, Inc. | 11,839 | 1,870 | ||||||
Kotak Mahindra Bank, Ltd. | 78,279 | 1,722 | ||||||
DBS Group Holdings, Ltd. | 55,100 | 1,395 | ||||||
Citigroup, Inc. | 30,627 | 1,385 | ||||||
BlackRock, Inc. | 1,886 | 1,337 | ||||||
ING Groep NV | 98,239 | 1,199 | ||||||
United Overseas Bank, Ltd. | 47,600 | 1,092 | ||||||
BNP Paribas SA | 12,920 | 735 | ||||||
Nasdaq, Inc. | 11,966 | 734 | ||||||
JPMorgan Chase & Co. | 5,371 | 720 | ||||||
KBC Groep NV | 11,130 | 715 | ||||||
Münchener Rückversicherungs-Gesellschaft AG | 1,931 | 628 | ||||||
Aegon NV | 122,629 | 622 | ||||||
Bank Central Asia Tbk PT | 1,108,100 | 608 | ||||||
Tryg A/S | 24,243 | 575 | ||||||
Banco Santander, SA | 176,586 | 529 | ||||||
Ping An Insurance (Group) Company of China, Ltd., Class H | 66,500 | 439 | ||||||
Ping An Insurance (Group) Company of China, Ltd., Class A | 11,400 | 77 | ||||||
FinecoBank SpA | 26,543 | 442 | ||||||
Great-West Lifeco, Inc. | 17,334 | 401 | ||||||
CME Group, Inc., Class A | 2,292 | 385 | ||||||
Fairfax Financial Holdings, Ltd., subordinate voting shares | 506 | 300 | ||||||
Allfunds Group PLC | 18,078 | 126 | ||||||
Lufax Holding, Ltd. (ADR) | 47,602 | 92 | ||||||
|
| |||||||
| 39,127 | ||||||||
|
| |||||||
Industrials 8.37% | ||||||||
Raytheon Technologies Corp. | 71,227 | 7,188 | ||||||
General Electric Co. | 39,535 | 3,313 | ||||||
BAE Systems PLC | 264,063 | 2,729 | ||||||
Thales SA | 20,022 | 2,560 | ||||||
General Dynamics Corp. | 8,468 | 2,101 | ||||||
Carrier Global Corp. | 49,012 | 2,022 | ||||||
L3Harris Technologies, Inc. | 9,073 | 1,889 | ||||||
Siemens AG | 13,373 | 1,856 | ||||||
Honeywell International, Inc. | 6,585 | 1,411 | ||||||
RELX PLC | 46,732 | 1,295 | ||||||
CSX Corp. | 38,467 | 1,192 | ||||||
LIXIL Corp. | 54,500 | 831 | ||||||
Deutsche Post AG | 17,657 | 665 | ||||||
Safran SA | 4,525 | 565 | ||||||
Trelleborg AB, Class B | 11,334 | 262 | ||||||
Brenntag SE | 3,756 | 240 | ||||||
Melrose Industries PLC | 141,781 | 230 | ||||||
Airbus SE, non-registered shares | 1,805 | 215 | ||||||
NIBE Industrier AB, Class B | 21,550 | 201 | ||||||
|
| |||||||
| 30,765 | ||||||||
|
| |||||||
Health care 7.78% | ||||||||
Abbott Laboratories | 57,298 | 6,291 | ||||||
Gilead Sciences, Inc. | 30,992 | 2,661 | ||||||
Novartis AG | 28,897 | 2,617 | ||||||
Siemens Healthineers AG | 51,525 | 2,578 | ||||||
UnitedHealth Group, Inc. | 4,540 | 2,407 | ||||||
160 American Funds Insurance Series
Table of Contents
American Funds Global Balanced Fund (continued) (formerly Global Balanced Fund)
Common stocks (continued)
| Shares | Value (000) | |||||||
Health care (continued) | ||||||||
Thermo Fisher Scientific, Inc. | 3,354 | $ | 1,847 | |||||
AstraZeneca PLC | 12,615 | 1,712 | ||||||
Merck KGaA | 8,165 | 1,581 | ||||||
AbbVie, Inc. | 8,136 | 1,315 | ||||||
Stryker Corp. | 3,999 | 978 | ||||||
Amgen, Inc. | 3,365 | 884 | ||||||
Medtronic PLC | 11,261 | 875 | ||||||
Eurofins Scientific SE, non-registered shares | 11,316 | 815 | ||||||
BioMarin Pharmaceutical, Inc.1 | 6,615 | 685 | ||||||
Humana, Inc. | 1,166 | 597 | ||||||
Bayer AG | 10,117 | 522 | ||||||
Takeda Pharmaceutical Company, Ltd. | 8,400 | 262 | ||||||
|
| |||||||
| 28,627 | ||||||||
|
| |||||||
Information technology 6.47% | ||||||||
Broadcom, Inc. | 16,303 | 9,115 | ||||||
Microsoft Corp. | 31,123 | 7,464 | ||||||
Micron Technology, Inc. | 44,625 | 2,230 | ||||||
Taiwan Semiconductor Manufacturing Company, Ltd. | 97,000 | 1,414 | ||||||
GlobalWafers Co., Ltd. | 86,000 | 1,195 | ||||||
ServiceNow, Inc.1 | 2,184 | 848 | ||||||
Accenture PLC, Class A | 3,024 | 807 | ||||||
Apple, Inc. | 3,194 | 415 | ||||||
Applied Materials, Inc. | 2,383 | 232 | ||||||
Texas Instruments, Inc. | 380 | 63 | ||||||
|
| |||||||
| 23,783 | ||||||||
|
| |||||||
Consumer staples 5.34% | ||||||||
Nestlé SA | 35,802 | 4,135 | ||||||
Philip Morris International, Inc. | 36,010 | 3,645 | ||||||
ITC, Ltd. | 833,272 | 3,340 | ||||||
Imperial Brands PLC | 95,936 | 2,397 | ||||||
Seven & i Holdings Co., Ltd. | 39,200 | 1,677 | ||||||
Pernod Ricard SA | 5,580 | 1,097 | ||||||
British American Tobacco PLC | 27,475 | 1,090 | ||||||
Heineken NV | 7,506 | 705 | ||||||
Altria Group, Inc. | 14,317 | 654 | ||||||
Inner Mongolia Yili Industrial Group Co., Ltd., Class A | 104,700 | 465 | ||||||
Treasury Wine Estates, Ltd. | 27,708 | 256 | ||||||
Kweichow Moutai Co., Ltd., Class A | 721 | 178 | ||||||
|
| |||||||
| 19,639 | ||||||||
|
| |||||||
Utilities 4.80% | ||||||||
DTE Energy Company | 29,637 | 3,483 | ||||||
Power Grid Corporation of India, Ltd. | 1,007,658 | 2,594 | ||||||
NextEra Energy, Inc. | 28,214 | 2,359 | ||||||
Duke Energy Corp. | 16,849 | 1,735 | ||||||
E.ON SE | 157,688 | 1,574 | ||||||
Entergy Corp. | 10,025 | 1,128 | ||||||
Iberdrola, SA, non-registered shares | 77,458 | 906 | ||||||
ENN Energy Holdings, Ltd. | 64,000 | 893 | ||||||
Dominion Energy, Inc. | 14,276 | 875 | ||||||
National Grid PLC | 65,238 | 784 | ||||||
Enel SpA | 122,240 | 657 | ||||||
SembCorp Industries, Ltd. | 187,100 | 471 | ||||||
Public Service Enterprise Group, Inc. | 3,391 | 208 | ||||||
|
| |||||||
| 17,667 | ||||||||
|
| |||||||
American Funds Insurance Series 161
Table of Contents
American Funds Global Balanced Fund (continued) (formerly Global Balanced Fund)
Common stocks (continued)
| Shares | Value (000) | |||||||
Materials 4.33% | ||||||||
Freeport-McMoRan, Inc. | 87,143 | $ | 3,311 | |||||
Linde PLC | 6,504 | 2,122 | ||||||
BHP Group, Ltd. (CDI) | 62,248 | 1,919 | ||||||
Evonik Industries AG | 96,394 | 1,851 | ||||||
Fortescue Metals Group, Ltd. | 126,401 | 1,762 | ||||||
Rio Tinto PLC | 20,187 | 1,417 | ||||||
Shin-Etsu Chemical Co., Ltd. | 11,000 | 1,340 | ||||||
Vale SA (ADR), ordinary nominative shares | 64,102 | 1,088 | ||||||
UPM-Kymmene OYJ | 15,079 | 565 | ||||||
International Flavors & Fragrances, Inc. | 2,739 | 287 | ||||||
Air Liquide SA, non-registered shares | 1,874 | 267 | ||||||
|
| |||||||
| 15,929 | ||||||||
|
| |||||||
Energy 4.02% | ||||||||
Canadian Natural Resources, Ltd. (CAD denominated) | 125,963 | 6,995 | ||||||
Neste OYJ | 40,724 | 1,881 | ||||||
Shell PLC (GBP denominated) | 54,477 | 1,548 | ||||||
Chevron Corp. | 8,045 | 1,444 | ||||||
BP PLC | 184,567 | 1,073 | ||||||
DT Midstream, Inc. | 10,284 | 568 | ||||||
Baker Hughes Co., Class A | 17,643 | 521 | ||||||
TC Energy Corp. (CAD denominated) | 12,080 | 482 | ||||||
Woodside Energy Group, Ltd. (CDI) | 10,942 | 264 | ||||||
|
| |||||||
| 14,776 | ||||||||
|
| |||||||
Communication services 3.14% | ||||||||
Alphabet, Inc., Class A1 | 19,243 | 1,698 | ||||||
Alphabet, Inc., Class C1 | 7,907 | 701 | ||||||
Netflix, Inc.1 | 8,029 | 2,368 | ||||||
Singapore Telecommunications, Ltd. | 782,600 | 1,502 | ||||||
Comcast Corp., Class A | 30,643 | 1,072 | ||||||
BCE, Inc. | 22,635 | 995 | ||||||
Omnicom Group, Inc. | 10,624 | 867 | ||||||
Universal Music Group NV | 31,035 | 749 | ||||||
SoftBank Corp. | 54,400 | 615 | ||||||
Meta Platforms, Inc., Class A1 | 4,089 | 492 | ||||||
Electronic Arts, Inc. | 4,021 | 491 | ||||||
|
| |||||||
| 11,550 | ||||||||
|
| |||||||
Consumer discretionary 2.27% | ||||||||
LVMH Moët Hennessy-Louis Vuitton SE | 2,423 | 1,760 | ||||||
Cie. Financière Richemont SA, Class A | 8,551 | 1,107 | ||||||
Ferrari NV | 3,990 | 855 | ||||||
Ferrari NV (EUR denominated) | 1,039 | 222 | ||||||
General Motors Company | 27,725 | 933 | ||||||
Tesla, Inc.1 | 7,350 | 905 | ||||||
InterContinental Hotels Group PLC | 12,297 | 708 | ||||||
Starbucks Corp. | 4,596 | 456 | ||||||
Royal Caribbean Cruises, Ltd.1 | 8,302 | 410 | ||||||
Astra International Tbk PT | 1,050,300 | 383 | ||||||
Aptiv PLC1 | 2,518 | 234 | ||||||
D.R. Horton, Inc. | �� | 2,232 | 199 | |||||
Airbnb, Inc., Class A1 | 1,851 | 158 | ||||||
JD.com, Inc., Class A | 1,200 | 34 | ||||||
|
| |||||||
| 8,364 | ||||||||
|
| |||||||
162 American Funds Insurance Series
Table of Contents
American Funds Global Balanced Fund (continued) (formerly Global Balanced Fund)
Common stocks (continued)
| Shares | Value (000) | |||||||
Real estate 1.42% | ||||||||
Embassy Office Parks REIT | 342,621 | $ | 1,390 | |||||
Equinix, Inc. REIT | 2,059 | 1,349 | ||||||
CTP NV | 104,148 | 1,226 | ||||||
Digital Realty Trust, Inc. REIT | 4,683 | 470 | ||||||
Crown Castle, Inc. REIT | 3,025 | 410 | ||||||
Americold Realty Trust, Inc. REIT | 12,798 | 362 | ||||||
|
| |||||||
| 5,207 | ||||||||
|
| |||||||
Total common stocks (cost: $194,190,000) | 215,434 | |||||||
|
| |||||||
Preferred securities 0.40% | ||||||||
Financials 0.25% | ||||||||
Fannie Mae, Series S, 8.25% noncumulative preferred shares1 | 223,000 | 522 | ||||||
Federal Home Loan Mortgage Corp., Series Z, 8.375% noncumulative preferred shares1 | 192,000 | 389 | ||||||
|
| |||||||
| 911 | ||||||||
|
| |||||||
Consumer discretionary 0.15% | ||||||||
Dr. Ing. h.c. F. Porsche AG, nonvoting non-registered preferred shares1 | 5,497 | 558 | ||||||
|
| |||||||
Total preferred securities (cost: $1,986,000) | 1,469 | |||||||
|
| |||||||
Convertible stocks 0.34% | ||||||||
Utilities 0.23% | ||||||||
NextEra Energy, Inc., noncumulative convertible preferred units, 6.926% 9/1/2025 | 16,500 | 828 | ||||||
|
| |||||||
Health care 0.11% | ||||||||
Danaher Corp., Series B, cumulative convertible preferred shares, 5.00% 4/15/2023 | 300 | 407 | ||||||
|
| |||||||
Total convertible stocks (cost: $1,214,000) | 1,235 | |||||||
|
| |||||||
Investment funds 1.50% | ||||||||
Capital Group Central Corporate Bond Fund2 | 678,772 | 5,532 | ||||||
|
| |||||||
Total investment funds (cost: $5,481,000) | 5,532 | |||||||
|
| |||||||
Principal (000) | ||||||||
Bonds, notes & other debt instruments 34.19% | ||||||||
Bonds & notes of governments & government agencies outside the U.S. 13.26% | ||||||||
Abu Dhabi (Emirate of) 0.75% 9/2/20233 | USD | 275 | 267 | |||||
Agricultural Development Bank of China 3.75% 1/25/2029 | CNY | 550 | 83 | |||||
Asian Development Bank 1.125% 6/10/2025 | GBP | 100 | 112 | |||||
Australia (Commonwealth of), Series 152, 2.75% 11/21/2028 | AUD | 310 | 200 | |||||
Australia (Commonwealth of), Series 157, 1.50% 6/21/2031 | 1,055 | 591 | ||||||
Australia (Commonwealth of), Series 163, 1.00% 11/21/2031 | 150 | 79 | ||||||
Australia (Commonwealth of), Series 166, 3.00% 11/21/2033 | 2,250 | 1,388 | ||||||
Austria (Republic of) 0% 2/20/2031 | EUR | 660 | 553 | |||||
Brazil (Federative Republic of) 10.00% 1/1/2023 | BRL | 600 | 108 | |||||
Brazil (Federative Republic of) 0% 1/1/2024 | 1,700 | 284 | ||||||
Brazil (Federative Republic of) 10.00% 1/1/2025 | 900 | 163 | ||||||
Canada 0.75% 10/1/2024 | CAD | 1,125 | 785 | |||||
Canada 2.25% 6/1/2025 | 1,400 | 998 | ||||||
Canada 0.25% 3/1/2026 | 570 | 378 | ||||||
Canada 3.50% 3/1/2028 | 1,009 | 749 | ||||||
Chile (Republic of) 4.70% 9/1/2030 | CLP | 245,000 | 279 | |||||
American Funds Insurance Series 163
Table of Contents
American Funds Global Balanced Fund (continued) (formerly Global Balanced Fund)
Bonds, notes & other debt instruments (continued)
Principal amount (000) | Value (000) | |||||||
Bonds & notes of governments & government agencies outside the U.S. (continued) | ||||||||
China (People’s Republic of), Series 1910, 3.86% 7/22/2049 | CNY | 2,110 | $ | 336 | ||||
China (People’s Republic of), Series INBK, 3.39% 3/16/2050 | 1,600 | 235 | ||||||
China (People’s Republic of), Series INBK, 3.81% 9/14/2050 | 10,290 | 1,626 | ||||||
China Development Bank Corp., Series 2008, 2.89% 6/22/2025 | 3,240 | 470 | ||||||
China Development Bank Corp., Series 2004, 3.43% 1/14/2027 | 1,060 | 156 | ||||||
China Development Bank Corp., Series 2009, 3.39% 7/10/2027 | 8,580 | 1,258 | ||||||
China Development Bank Corp., Series 1805, 4.88% 2/9/2028 | 2,040 | 322 | ||||||
Colombia (Republic of), Series B, 5.75% 11/3/2027 | COP | 2,331,300 | 365 | |||||
Colombia (Republic of), Series B, 7.00% 3/26/2031 | 5,308,700 | 776 | ||||||
European Investment Bank 0.375% 9/15/2027 | EUR | 110 | 105 | |||||
European Investment Bank 0.25% 1/20/2032 | 860 | 717 | ||||||
European Union 0% 7/6/2026 | 100 | 97 | ||||||
European Union 0.25% 10/22/2026 | 50 | 48 | ||||||
French Republic O.A.T. 0.75% 2/25/2028 | 640 | 618 | ||||||
French Republic O.A.T. 0% 11/25/2030 | 1,320 | 1,128 | ||||||
French Republic O.A.T. 0% 5/25/2032 | 650 | 527 | ||||||
French Republic O.A.T. 2.00% 11/25/2032 | 610 | 596 | ||||||
French Republic O.A.T. 3.25% 5/25/2045 | 160 | 171 | ||||||
Germany (Federal Republic of) 0% 4/16/2027 | 950 | 915 | ||||||
Germany (Federal Republic of) 0% 8/15/2031 | 2,600 | 2,258 | ||||||
Germany (Federal Republic of) 0% 2/15/2032 | 540 | 463 | ||||||
Germany (Federal Republic of) 1.70% 8/15/2032 | 1,129 | 1,127 | ||||||
Germany (Federal Republic of) 1.00% 5/15/2038 | 640 | 548 | ||||||
Germany (Federal Republic of) 0% 8/15/2050 | 200 | 112 | ||||||
Germany (Federal Republic of) 0% 8/15/2052 | 260 | 139 | ||||||
Greece (Hellenic Republic of) 3.45% 4/2/2024 | 110 | 118 | ||||||
Greece (Hellenic Republic of) 3.375% 2/15/2025 | 300 | 321 | ||||||
Greece (Hellenic Republic of) 1.75% 6/18/2032 | 790 | 668 | ||||||
India (Republic of) 5.15% 11/9/2025 | INR | 8,000 | 92 | |||||
Indonesia (Republic of), Series 78, 8.25% 5/15/2029 | IDR | 1,833,000 | 127 | |||||
Indonesia (Republic of), Series 87, 6.50% 2/15/2031 | 1,253,000 | 78 | ||||||
Israel (State of) 2.875% 1/29/2024 | EUR | 200 | 213 | |||||
Israel (State of) 1.50% 1/18/2027 | 100 | 100 | ||||||
Italy (Republic of) 1.35% 4/1/2030 | 660 | 581 | ||||||
Italy (Republic of) 2.50% 12/1/2032 | 650 | 583 | ||||||
Japan, Series 17, 0.10% 9/10/20234 | JPY | 10,900 | 84 | |||||
Japan, Series 18, 0.10% 3/10/20244 | 21,660 | 169 | ||||||
Japan, Series 19, 0.10% 9/10/20244 | 31,620 | 247 | ||||||
Japan, Series 150, 0.005% 12/20/2026 | 84,950 | 644 | ||||||
Japan, Series 22, 0.10% 3/10/20274 | 26,454 | 211 | ||||||
Japan, Series 346, 0.10% 3/20/2027 | 134,150 | 1,018 | ||||||
Japan, Series 363, 0.10% 6/20/2031 | 56,000 | 412 | ||||||
Japan, Series 365, 0.10% 12/20/2031 | 317,600 | 2,340 | ||||||
Japan, Series 152, 1.20% 3/20/2035 | 264,400 | 2,109 | ||||||
Japan, Series 179, 0.50% 12/20/2041 | 71,600 | 476 | ||||||
Japan, Series 42, 1.70% 3/20/2044 | 50,150 | 408 | ||||||
Japan, Series 37, 0.60% 6/20/2050 | 26,950 | 162 | ||||||
Japan, Series 74, 1.00% 3/20/2052 | 178,400 | 1,178 | ||||||
Japan, Series 76, 1.40% 9/20/2052 | 80,350 | 586 | ||||||
KfW 1.125% 7/4/2025 | GBP | 95 | 106 | |||||
Malaysia (Federation of), Series 0119, 3.906% 7/15/2026 | MYR | 1,380 | 315 | |||||
Malaysia (Federation of), Series 0219, 3.885% 8/15/2029 | 620 | 140 | ||||||
Malaysia (Federation of), Series 0519, 3.757% 5/22/2040 | 270 | 57 | ||||||
Morocco (Kingdom of) 3.50% 6/19/2024 | EUR | 100 | 107 | |||||
Morocco (Kingdom of) 1.50% 11/27/2031 | 100 | 79 | ||||||
Netherlands (Kingdom of the) 5.50% 1/15/2028 | 100 | 121 | ||||||
Nova Scotia (Province of) 3.15% 12/1/2051 | CAD | 170 | 101 | |||||
Peru (Republic of) 2.392% 1/23/2026 | USD | 90 | 83 | |||||
Philippines (Republic of) 0.001% 4/12/2024 | JPY | 100,000 | 753 | |||||
164 American Funds Insurance Series
Table of Contents
American Funds Global Balanced Fund (continued) (formerly Global Balanced Fund)
Bonds, notes & other debt instruments (continued)
Principal (000) | Value (000) | |||||||
Bonds & notes of governments & government agencies outside the U.S. (continued) | ||||||||
Philippines (Republic of) 0.25% 4/28/2025 | EUR | 100 | $ | 99 | ||||
Philippines (Republic of) 1.648% 6/10/2031 | USD | 200 | 160 | |||||
Poland (Republic of), Series 1029, 2.75% 10/25/2029 | PLN | 410 | 74 | |||||
Portuguese Republic 0.475% 10/18/2030 | EUR | 230 | 199 | |||||
Romania 2.125% 3/7/2028 | 130 | 117 | ||||||
Romania 3.624% 5/26/2030 | 392 | 344 | ||||||
Romania 2.00% 1/28/2032 | 100 | 72 | ||||||
Romania 2.00% 4/14/2033 | 200 | 138 | ||||||
Romania 3.375% 2/8/2038 | 80 | 58 | ||||||
Romania 4.625% 4/3/2049 | 39 | 30 | ||||||
Romania 3.375% 1/28/2050 | 73 | 45 | ||||||
Russian Federation 7.00% 8/16/20235,6 | RUB | 16,600 | 77 | |||||
Russian Federation 2.875% 12/4/20255 | EUR | 200 | 90 | |||||
Russian Federation 4.25% 6/23/20275 | USD | 200 | 86 | |||||
Russian Federation 4.375% 3/21/20295 | 200 | 82 | ||||||
Russian Federation 6.90% 5/23/20295 | RUB | 28,250 | 123 | |||||
Russian Federation 7.65% 4/10/20305 | 38,320 | 166 | ||||||
Russian Federation 5.90% 3/12/20315 | 5,620 | 24 | ||||||
Russian Federation 6.90% 7/23/20315 | 18,200 | 79 | ||||||
Russian Federation 8.50% 9/17/20315 | 5,530 | 24 | ||||||
Russian Federation 7.70% 3/23/20335 | 23,030 | 100 | ||||||
Russian Federation 7.25% 5/10/20345 | 8,140 | 35 | ||||||
Serbia (Republic of) 3.125% 5/15/2027 | EUR | 385 | 356 | |||||
Serbia (Republic of) 2.05% 9/23/2036 | 185 | 112 | ||||||
South Africa (Republic of), Series R-2030, 8.00% 1/31/2030 | ZAR | 3,000 | 157 | |||||
Spain (Kingdom of) 0% 1/31/2027 | EUR | 335 | 317 | |||||
Spain (Kingdom of) 0.80% 7/30/2027 | 490 | 474 | ||||||
Spain (Kingdom of) 0.50% 10/31/2031 | 395 | 329 | ||||||
Spain (Kingdom of) 0.70% 4/30/2032 | 830 | 693 | ||||||
Tunisia (Republic of) 6.75% 10/31/2023 | 260 | 235 | ||||||
Tunisia (Republic of) 6.75% 10/31/2023 | 150 | 135 | ||||||
Ukraine 6.876% 5/21/20313,5 | USD | 250 | 48 | |||||
Ukraine 6.876% 5/21/20315 | 200 | 38 | ||||||
United Kingdom 2.75% 9/7/2024 | GBP | 50 | 60 | |||||
United Kingdom 1.25% 7/22/2027 | 410 | 447 | ||||||
United Kingdom 0.375% 10/22/2030 | 490 | 463 | ||||||
United Kingdom 0.25% 7/31/2031 | 160 | 145 | ||||||
United Kingdom 1.00% 1/31/2032 | 1,490 | 1,427 | ||||||
United Kingdom 4.25% 6/7/2032 | 1,165 | 1,474 | ||||||
United Kingdom 3.25% 1/22/2044 | 174 | 187 | ||||||
United Kingdom 1.25% 7/31/2051 | 413 | 270 | ||||||
United Mexican States, Series M, 5.75% 3/5/2026 | MXN | 18,200 | 846 | |||||
United Mexican States, Series M, 7.50% 6/3/2027 | 1,950 | 94 | ||||||
United Mexican States, Series M, 7.75% 5/29/2031 | 5,000 | 238 | ||||||
United Mexican States, Series M, 8.00% 11/7/2047 | 5,120 | 235 | ||||||
United Mexican States, Series M, 8.00% 7/31/2053 | 18,880 | 864 | ||||||
|
| |||||||
| 48,783 | ||||||||
|
| |||||||
U.S. Treasury bonds & notes 12.04% | ||||||||
U.S. Treasury 11.52% | ||||||||
U.S. Treasury 2.50% 3/31/2023 | USD | 1,182 | 1,177 | |||||
U.S. Treasury 2.75% 4/30/2023 | 1,485 | 1,477 | ||||||
U.S. Treasury 1.50% 2/29/2024 | 5,058 | 4,876 | ||||||
U.S. Treasury 2.50% 4/30/2024 | 995 | 967 | ||||||
U.S. Treasury 3.25% 8/31/2024 | 706 | 691 | ||||||
U.S. Treasury 1.50% 10/31/2024 | 1,300 | 1,232 | ||||||
U.S. Treasury 1.00% 12/15/2024 | 620 | 580 | ||||||
U.S. Treasury 1.75% 3/15/2025 | 98 | 93 | ||||||
U.S. Treasury 3.00% 7/15/2025 | 1,016 | 984 | ||||||
American Funds Insurance Series 165
Table of Contents
American Funds Global Balanced Fund (continued) (formerly Global Balanced Fund)
Bonds, notes & other debt instruments (continued)
Principal (000) | Value (000) | |||||||
U.S. Treasury bonds & notes (continued) | ||||||||
U.S. Treasury (continued) | ||||||||
U.S. Treasury 3.125% 8/15/2025 | USD | 18 | $ | 17 | ||||
U.S. Treasury 0.25% 8/31/2025 | 833 | 749 | ||||||
U.S. Treasury 4.50% 11/15/2025 | 178 | 179 | ||||||
U.S. Treasury 0.375% 11/30/2025 | 50 | 45 | ||||||
U.S. Treasury 0.50% 2/28/2026 | 500 | 446 | ||||||
U.S. Treasury 0.75% 3/31/2026 | 2,075 | 1,861 | ||||||
U.S. Treasury 0.875% 6/30/2026 | 74 | 66 | ||||||
U.S. Treasury 2.25% 2/15/2027 | 298 | 277 | ||||||
U.S. Treasury 1.875% 2/28/2027 | 6,696 | 6,133 | ||||||
U.S. Treasury 2.50% 3/31/2027 | 1,025 | 962 | ||||||
U.S. Treasury 2.75% 4/30/2027 | 6,460 | 6,125 | ||||||
U.S. Treasury 2.75% 7/31/2027 | 46 | 43 | ||||||
U.S. Treasury 3.125% 8/31/2027 | 2,160 | 2,078 | ||||||
U.S. Treasury 4.125% 9/30/2027 | 268 | 269 | ||||||
U.S. Treasury 4.125% 10/31/2027 | 357 | 358 | ||||||
U.S. Treasury 2.875% 5/15/2028 | 1,275 | 1,204 | ||||||
U.S. Treasury 2.875% 8/15/2028 | 557 | 525 | ||||||
U.S. Treasury 0.625% 5/15/2030 | 823 | 652 | ||||||
U.S. Treasury 0.625% 8/15/2030 | 650 | 512 | ||||||
U.S. Treasury 1.625% 5/15/2031 | 375 | 316 | ||||||
U.S. Treasury 1.25% 8/15/2031 | 395 | 321 | ||||||
U.S. Treasury 1.375% 11/15/2031 | 834 | 680 | ||||||
U.S. Treasury 1.875% 2/15/2032 | 779 | 661 | ||||||
U.S. Treasury 2.875% 5/15/2032 | 640 | 590 | ||||||
U.S. Treasury 2.75% 8/15/2032 | 1,279 | 1,164 | ||||||
U.S. Treasury 4.125% 11/15/2032 | 195 | 199 | ||||||
U.S. Treasury 1.875% 2/15/20417 | 920 | 652 | ||||||
U.S. Treasury 2.25% 5/15/20417 | 525 | 395 | ||||||
U.S. Treasury 2.875% 11/15/2046 | 400 | 322 | ||||||
U.S. Treasury 1.25% 5/15/2050 | 140 | 76 | ||||||
U.S. Treasury 2.375% 5/15/2051 | 490 | 353 | ||||||
U.S. Treasury 2.00% 8/15/2051 | 560 | 369 | ||||||
U.S. Treasury 1.875% 11/15/20517 | 686 | 437 | ||||||
U.S. Treasury 2.25% 2/15/20527 | 765 | 535 | ||||||
U.S. Treasury 2.875% 5/15/2052 | 273 | 220 | ||||||
U.S. Treasury 3.00% 8/15/2052 | 510 | 423 | ||||||
U.S. Treasury 4.00% 11/15/2052 | 70 | 70 | ||||||
|
| |||||||
| 42,361 | ||||||||
|
| |||||||
U.S. Treasury inflation-protected securities 0.52% | ||||||||
U.S. Treasury Inflation-Protected Security 0.125% 7/15/20244 | 829 | 803 | ||||||
U.S. Treasury Inflation-Protected Security 0.125% 10/15/20244 | 575 | 555 | ||||||
U.S. Treasury Inflation-Protected Security 0.375% 7/15/20274 | 367 | 346 | ||||||
U.S. Treasury Inflation-Protected Security 1.00% 2/15/20494 | 249 | 208 | ||||||
|
| |||||||
| 1,912 | ||||||||
|
| |||||||
Total U.S. Treasury bonds & notes | 44,273 | |||||||
|
| |||||||
Corporate bonds, notes & loans 5.64% | ||||||||
Financials 1.80% | ||||||||
ACE INA Holdings, Inc. 3.35% 5/3/2026 | 10 | 10 | ||||||
ACE INA Holdings, Inc. 4.35% 11/3/2045 | 20 | 17 | ||||||
AIA Group, Ltd. 0.88% 9/9/2033 (5-year EUR Annual Swap + 1.10% on 9/9/2028)8 | EUR | 200 | 167 | |||||
AIB Group PLC 7.583% 10/14/2026 (USD-SOFR + 3.456% on 10/14/2025)3,8 | USD | 200 | 204 | |||||
Allianz SE 4.75% perpetual bonds (3-month EUR-EURIBOR + 3.60% on 10/24/2023)8 | EUR | 100 | 106 | |||||
Banco de Sabadell, SA 2.625% 3/24/2026 | ||||||||
(5-year EUR Mid-Swap + 2.20% on 3/24/2025)8 | 100 | 101 | ||||||
Bank of America Corp. 0.976% 4/22/2025 (USD-SOFR + 0.69% on 4/22/2024)8 | USD | 200 | 188 | |||||
Bank of America Corp. 1.319% 6/19/2026 (USD-SOFR + 1.15% on 6/19/2025)8 | 500 | 451 | ||||||
Bank of America Corp. 1.734% 7/22/2027 (USD-SOFR + 0.96% on 7/22/2026)8 | 160 | 140 | ||||||
166 American Funds Insurance Series
Table of Contents
American Funds Global Balanced Fund (continued) (formerly Global Balanced Fund)
Bonds, notes & other debt instruments (continued)
Principal (000) | Value (000) | |||||||
Corporate bonds, notes & loans (continued) | ||||||||
Financials (continued) | ||||||||
Bank of America Corp. 3.419% 12/20/2028 | ||||||||
(3-month USD-LIBOR + 1.04% on 12/20/2027)8 | USD | 236 | $ | 214 | ||||
Bank of America Corp. 2.496% 2/13/2031 | ||||||||
(3-month USD-LIBOR + 0.99% on 2/13/2030)8 | 20 | 16 | ||||||
Barclays Bank PLC 5.304% 8/9/2026 | ||||||||
(1-year UST Yield Curve Rate T Note Constant Maturity + 2.30% on 8/9/2025)8 | 475 | 472 | ||||||
Citigroup, Inc. 0.981% 5/1/2025 (USD-SOFR + 0.669% on 5/1/2024)8 | 103 | 96 | ||||||
Citigroup, Inc. 3.106% 4/8/2026 (USD-SOFR + 2.842% on 3/8/2026)8 | 175 | 166 | ||||||
Citigroup, Inc. 1.462% 6/9/2027 (USD-SOFR + 0.67% on 6/9/2026)8 | 310 | 269 | ||||||
Citigroup, Inc. 3.07% 2/24/2028 (USD-SOFR + 1.28% on 2/24/2027)8 | 110 | 99 | ||||||
Citigroup, Inc. 4.91% 5/24/2033 (USD-SOFR + 2.086% on 5/24/2032)8 | 29 | 27 | ||||||
Commonwealth Bank of Australia 2.688% 3/11/20313 | 225 | 174 | ||||||
Corebridge Financial, Inc. 3.90% 4/5/20323 | 59 | 52 | ||||||
Deutsche Bank AG 2.311% 11/16/2027 (USD-SOFR + 1.219% on 11/16/2026)8 | 160 | 136 | ||||||
Deutsche Bank AG 4.00% 6/24/2032 | ||||||||
(3-month EUR-EURIBOR + 3.30% on 6/24/2027)8 | EUR | 100 | 95 | |||||
Goldman Sachs Group, Inc. 1.00% 3/18/20339 | 210 | 162 | ||||||
Goldman Sachs Group, Inc. 4.017% 10/31/2038 | ||||||||
(3-month USD-LIBOR + 1.373% on 10/31/2037)8 | USD | 78 | 64 | |||||
Groupe BPCE SA 5.70% 10/22/20233 | 200 | 199 | ||||||
Groupe BPCE SA 1.00% 4/1/2025 | EUR | 100 | 101 | |||||
HSBC Holdings PLC 4.292% 9/12/2026 | ||||||||
(3-month USD-LIBOR + 1.348% on 9/12/2025)8 | USD | 200 | 191 | |||||
JPMorgan Chase & Co. 1.578% 4/22/2027 (USD-SOFR + 0.885% on 4/22/2026)8 | 186 | 164 | ||||||
JPMorgan Chase & Co. 4.493% 3/24/2031 (USD-SOFR + 3.79% on 3/24/2030)8 | 160 | 150 | ||||||
Morgan Stanley 3.125% 7/27/2026 | 110 | 103 | ||||||
Morgan Stanley 0.985% 12/10/2026 (USD-SOFR + 0.72% on 12/10/2025)8 | 200 | 175 | ||||||
Morgan Stanley 1.593% 5/4/2027 (USD-SOFR + 0.879% on 5/4/2026)8 | 126 | 111 | ||||||
Morgan Stanley 2.699% 1/22/2031 (USD-SOFR + 1.143% on 1/22/2030)8 | 72 | 60 | ||||||
Morgan Stanley 2.95% 5/7/2032 (3-month EUR-EURIBOR + 1.245% on 5/7/2031)8 | EUR | 510 | 485 | |||||
New York Life Insurance Company 3.75% 5/15/20503 | USD | 23 | 18 | |||||
Nordea Bank AB 3.60% 6/6/20253 | 200 | 193 | ||||||
Royal Bank of Canada 1.20% 4/27/2026 | 175 | 156 | ||||||
UBS Group AG 4.49% 8/5/2025 | ||||||||
(1-year UST Yield Curve Rate T Note Constant Maturity + 1.60% on 8/5/2024)3,8 | 450 | 442 | ||||||
Wells Fargo & Company 3.526% 3/24/2028 (USD-SOFR + 1.51% on 3/24/2027)8 | 210 | 195 | ||||||
Wells Fargo & Company 2.393% 6/2/2028 (USD-SOFR + 2.10% on 6/2/2027)8 | 400 | 354 | ||||||
Wells Fargo & Company 4.611% 4/25/2053 (USD-SOFR + 2.13% on 4/25/2052)8 | 100 | 85 | ||||||
|
| |||||||
| 6,608 | ||||||||
|
| |||||||
Utilities 0.89% | ||||||||
Alabama Power Co. 3.00% 3/15/2052 | 250 | 166 | ||||||
CMS Energy Corp. 3.00% 5/15/2026 | 150 | 140 | ||||||
Consumers Energy Co. 3.60% 8/15/2032 | 250 | 228 | ||||||
Duke Energy Carolinas, LLC 3.05% 3/15/2023 | 280 | 279 | ||||||
Duke Energy Progress, LLC 3.70% 9/1/2028 | 75 | 71 | ||||||
E.ON SE 1.625% 3/29/2031 | EUR | 240 | 216 | |||||
Edison International 4.125% 3/15/2028 | USD | 160 | 149 | |||||
Enel Finance International SA 1.875% 7/12/20283 | 200 | 159 | ||||||
Enersis Américas SA 4.00% 10/25/2026 | 35 | 33 | ||||||
Entergy Louisiana, LLC 4.75% 9/15/2052 | 100 | 90 | ||||||
Exelon Corp. 3.40% 4/15/2026 | 150 | 143 | ||||||
FirstEnergy Corp. 3.50% 4/1/20283 | 35 | 32 | ||||||
Florida Power & Light Company 2.875% 12/4/2051 | 120 | 81 | ||||||
Interstate Power and Light Co. 2.30% 6/1/2030 | 50 | 41 | ||||||
NextEra Energy Capital Holdings, Inc. 2.75% 11/1/2029 | 232 | 201 | ||||||
Niagara Mohawk Power Corp. 3.508% 10/1/20243 | 85 | 82 | ||||||
Pacific Gas and Electric Co. 2.95% 3/1/2026 | 25 | 23 | ||||||
Pacific Gas and Electric Co. 2.10% 8/1/2027 | 100 | 86 | ||||||
American Funds Insurance Series 167
Table of Contents
American Funds Global Balanced Fund (continued) (formerly Global Balanced Fund)
Bonds, notes & other debt instruments (continued)
| Principal amount (000) | Value (000) | |||||||
Corporate bonds, notes & loans (continued) | ||||||||
Utilities (continued) | ||||||||
Pacific Gas and Electric Co. 3.00% 6/15/2028 | USD | 140 | $ | 121 | ||||
Pacific Gas and Electric Co. 4.65% 8/1/2028 | 114 | 105 | ||||||
Pacific Gas and Electric Co. 4.55% 7/1/2030 | 31 | 28 | ||||||
Pacific Gas and Electric Co. 2.50% 2/1/2031 | 600 | 467 | ||||||
Pacific Gas and Electric Co. 3.25% 6/1/2031 | 50 | 41 | ||||||
Pacific Gas and Electric Co. 3.50% 8/1/2050 | 137 | 86 | ||||||
Xcel Energy, Inc. 3.35% 12/1/2026 | 216 | 203 | ||||||
|
| |||||||
| 3,271 | ||||||||
|
| |||||||
Consumer discretionary 0.62% | ||||||||
Amazon.com, Inc. 2.80% 8/22/2024 | 45 | 44 | ||||||
Bayerische Motoren Werke AG 3.90% 4/9/20253 | 70 | 69 | ||||||
Bayerische Motoren Werke AG 4.15% 4/9/20303 | 70 | 67 | ||||||
Daimler Trucks Finance North America, LLC 3.65% 4/7/20273 | 150 | 140 | ||||||
General Motors Financial Co. 2.40% 4/10/2028 | 150 | 126 | ||||||
Hyundai Capital America 1.50% 6/15/20263 | 250 | 217 | ||||||
Hyundai Capital America 2.375% 10/15/20273 | 109 | 93 | ||||||
Hyundai Capital Services, Inc. 3.75% 3/5/20233 | 250 | 249 | ||||||
Royal Caribbean Cruises, Ltd. 11.50% 6/1/20253 | 222 | 239 | ||||||
Royal Caribbean Cruises, Ltd. 5.50% 4/1/20283 | 185 | 148 | ||||||
Royal Caribbean Cruises, Ltd. 8.25% 1/15/20293 | 70 | 70 | ||||||
Royal Caribbean Cruises, Ltd. 9.25% 1/15/20293 | 59 | 61 | ||||||
Stellantis Finance US, Inc. 5.625% 1/12/20283 | 400 | 397 | ||||||
Stellantis Finance US, Inc. 2.691% 9/15/20313 | 200 | 153 | ||||||
Toyota Motor Credit Corp. 3.375% 4/1/2030 | 33 | 30 | ||||||
Volkswagen International Finance NV 4.375% junior subordinated perpetual bonds | ||||||||
(9-year EUR Mid-Swap + 3.36% on 3/28/2031)8 | EUR | 200 | 175 | |||||
|
| |||||||
| 2,278 | ||||||||
|
| |||||||
Health care 0.45% | ||||||||
Aetna, Inc. 2.80% 6/15/2023 | USD | 10 | 10 | |||||
Amgen, Inc. 1.90% 2/21/2025 | 40 | 37 | ||||||
Amgen, Inc. 2.20% 2/21/2027 | 30 | 27 | ||||||
Amgen, Inc. 4.20% 3/1/2033 | 280 | 260 | ||||||
AstraZeneca Finance, LLC 2.25% 5/28/2031 | 69 | 57 | ||||||
AstraZeneca PLC 3.50% 8/17/2023 | 150 | 149 | ||||||
Becton, Dickinson and Company 3.734% 12/15/2024 | 10 | 10 | ||||||
Becton, Dickinson and Company 3.70% 6/6/2027 | 43 | 41 | ||||||
Becton, Dickinson and Company 2.823% 5/20/2030 | 28 | 24 | ||||||
Becton, Dickinson and Company 4.298% 8/22/2032 | 320 | 300 | ||||||
Cigna Corp. 4.125% 11/15/2025 | 80 | 78 | ||||||
EMD Finance, LLC 3.25% 3/19/20253 | 250 | 240 | ||||||
Stryker Corp. 0.75% 3/1/2029 | EUR | 210 | 188 | |||||
Takeda Pharmaceutical Company, Ltd. 2.25% 11/21/2026 | 100 | 102 | ||||||
UnitedHealth Group, Inc. 4.00% 5/15/2029 | USD | 135 | 129 | |||||
|
| |||||||
| 1,652 | ||||||||
|
| |||||||
Communication services 0.42% | ||||||||
AT&T, Inc. 2.75% 6/1/2031 | 375 | 312 | ||||||
AT&T, Inc. 2.55% 12/1/2033 | 64 | 49 | ||||||
Comcast Corp. 0% 9/14/2026 | EUR | 100 | 94 | |||||
Deutsche Telekom International Finance BV 9.25% 6/1/2032 | US | D45 | 56 | |||||
Netflix, Inc. 3.875% 11/15/20299 | EUR | 200 | 201 | |||||
Orange SA 9.00% 3/1/20318 | USD | 65 | 80 | |||||
T-Mobile US, Inc. 2.05% 2/15/2028 | 200 | 172 | ||||||
Verizon Communications, Inc. 0.375% 3/22/2029 | EUR | 140 | 121 | |||||
168 American Funds Insurance Series
Table of Contents
American Funds Global Balanced Fund (continued) (formerly Global Balanced Fund)
Bonds, notes & other debt instruments (continued)
| Principal amount | Value | |||||||
| (000) | (000) | |||||||
Corporate bonds, notes & loans (continued) | ||||||||
Communication services (continued) | ||||||||
Verizon Communications, Inc. 2.55% 3/21/2031 | USD | 325 | $ | 268 | ||||
Verizon Communications, Inc. 0.75% 3/22/2032 | EUR | 100 | 80 | |||||
WarnerMedia Holdings, Inc. 5.05% 3/15/20423 | USD | 168 | 129 | |||||
|
| |||||||
| 1,562 | ||||||||
|
| |||||||
Information technology 0.38% | ||||||||
Apple, Inc. 3.35% 8/8/2032 | 580 | 528 | ||||||
Broadcom, Inc. 4.00% 4/15/20293 | 21 | 19 | ||||||
Broadcom, Inc. 4.15% 11/15/2030 | 70 | 63 | ||||||
Broadcom, Inc. 3.419% 4/15/20333 | 53 | 43 | ||||||
Broadcom, Inc. 3.137% 11/15/20353 | 15 | 11 | ||||||
Lenovo Group, Ltd. 5.875% 4/24/2025 | 269 | 262 | ||||||
Mastercard, Inc. 2.00% 11/18/2031 | 102 | 82 | ||||||
Microsoft Corp. 2.40% 8/8/2026 | 187 | 175 | ||||||
Oracle Corp. 2.65% 7/15/2026 | 216 | 199 | ||||||
|
| |||||||
| 1,382 | ||||||||
|
| |||||||
Industrials 0.32% | ||||||||
Boeing Company 4.508% 5/1/2023 | 400 | 399 | ||||||
Canadian Pacific Railway, Ltd. 3.10% 12/2/2051 | 164 | 111 | ||||||
Carrier Global Corp. 2.242% 2/15/2025 | 6 | 6 | ||||||
Carrier Global Corp. 2.493% 2/15/2027 | 7 | 6 | ||||||
CSX Corp. 3.80% 4/15/2050 | 6 | 5 | ||||||
CSX Corp. 2.50% 5/15/2051 | 75 | 46 | ||||||
Lima Metro Line 2 Finance, Ltd. 5.875% 7/5/20343 | 95 | 92 | ||||||
MISC Capital Two (Labuan), Ltd. 3.75% 4/6/20273 | 200 | 181 | ||||||
Singapore Airlines, Ltd. 3.375% 1/19/2029 | 200 | 181 | ||||||
United Technologies Corp. 4.125% 11/16/2028 | 170 | 163 | ||||||
|
| |||||||
| 1,190 | ||||||||
|
| |||||||
Consumer staples 0.26% | ||||||||
Altria Group, Inc. 2.20% 6/15/2027 | EUR | 270 | 260 | |||||
Anheuser-Busch InBev NV 4.00% 4/13/2028 | USD | 100 | 95 | |||||
Anheuser-Busch InBev NV 4.75% 1/23/2029 | 220 | 218 | ||||||
British American Tobacco PLC 3.215% 9/6/2026 | 62 | 57 | ||||||
British American Tobacco PLC 4.70% 4/2/2027 | 67 | 64 | ||||||
British American Tobacco PLC 3.557% 8/15/2027 | 105 | 96 | ||||||
British American Tobacco PLC 3.462% 9/6/2029 | 75 | 65 | ||||||
Philip Morris International, Inc. 5.75% 11/17/2032 | 110 | 113 | ||||||
|
| |||||||
| 968 | ||||||||
|
| |||||||
Energy 0.24% | ||||||||
Canadian Natural Resources, Ltd. 2.95% 7/15/2030 | 161 | 136 | ||||||
Halliburton Company 3.80% 11/15/2025 | 2 | 2 | ||||||
Kinder Morgan, Inc. 4.30% 6/1/2025 | 165 | 162 | ||||||
Petróleos Mexicanos 6.75% 9/21/2047 | 107 | 69 | ||||||
Qatar Petroleum 3.125% 7/12/20413 | 270 | 208 | ||||||
Statoil ASA 3.70% 3/1/2024 | 50 | 49 | ||||||
TransCanada Corp. 5.875% 8/15/2076 (3-month USD-LIBOR + 4.64% on 8/15/2026)8 | 288 | 275 | ||||||
|
| |||||||
| 901 | ||||||||
|
| |||||||
Real estate 0.14% | ||||||||
American Tower Corp. 0.875% 5/21/2029 | EUR | 250 | 214 | |||||
Equinix, Inc. 2.15% 7/15/2030 | USD | 176 | 140 | |||||
Essex Portfolio, LP 3.50% 4/1/2025 | 120 | 116 | ||||||
Essex Portfolio, LP 3.375% 4/15/2026 | 40 | 38 | ||||||
|
| |||||||
| 508 | ||||||||
|
| |||||||
American Funds Insurance Series 169
Table of Contents
American Funds Global Balanced Fund (continued) (formerly Global Balanced Fund)
Bonds, notes & other debt instruments (continued)
| Principal amount | Value | |||||||
| (000) | (000) | |||||||
Corporate bonds, notes & loans (continued) | ||||||||
Materials 0.12% | ||||||||
Celanese US Holdings, LLC 5.337% 1/19/2029 | EUR | 300 | $ | 305 | ||||
Celanese US Holdings, LLC 6.379% 7/15/2032 | USD | 50 | 48 | |||||
Vale Overseas, Ltd. 3.75% 7/8/2030 | 94 | 82 | ||||||
|
| |||||||
| 435 | ||||||||
|
| |||||||
Total corporate bonds, notes & loans | 20,755 | |||||||
|
| |||||||
Mortgage-backed obligations 2.58% | ||||||||
Federal agency mortgage-backed obligations 1.56% | ||||||||
Fannie Mae Pool #FM7100 3.50% 6/1/205010 | 350 | 324 | ||||||
Fannie Mae Pool #CB2402 2.50% 12/1/205110 | 315 | 267 | ||||||
Fannie Mae Pool #BV9612 2.50% 4/1/205210 | 271 | 230 | ||||||
Fannie Mae Pool #FS2555 4.50% 7/1/205210 | 148 | 143 | ||||||
Fannie Mae Pool #MA4732 4.00% 9/1/205210 | 471 | 442 | ||||||
Fannie Mae Pool #BW3812 4.50% 9/1/205210 | 120 | 116 | ||||||
Fannie Mae Pool #MA4784 4.50% 10/1/205210 | 135 | 130 | ||||||
Fannie Mae Pool #BW7796 5.00% 10/1/205210 | 840 | 829 | ||||||
Fannie Mae Pool #BW1299 4.00% 11/1/205210 | 57 | 53 | ||||||
Fannie Mae Pool #BW1385 4.00% 12/1/205210 | 290 | 272 | ||||||
Freddie Mac Pool #ZJ9038 5.00% 6/1/202310 | — | 11 | — | 11 | ||||
Freddie Mac Pool #QE8253 4.50% 8/1/205210 | 200 | 193 | ||||||
Freddie Mac Pool #SD8256 4.00% 10/1/205210 | 100 | 94 | ||||||
Freddie Mac Pool #SD8257 4.50% 10/1/205210 | 513 | 494 | ||||||
Freddie Mac Pool #QF2182 4.50% 10/1/205210 | 84 | 81 | ||||||
Freddie Mac Pool #QF3955 4.00% 12/1/205210 | 238 | 224 | ||||||
Freddie Mac Pool #SD8275 4.50% 12/1/205210 | 75 | 72 | ||||||
Freddie Mac, Series K153, Class A2, Multi Family, 3.82% 1/25/203310 | 580 | 546 | ||||||
Government National Mortgage Assn. 3.50% 1/1/205310,12 | 1,350 | 1,241 | ||||||
|
| |||||||
| 5,751 | ||||||||
|
| |||||||
Other mortgage-backed securities 1.02% | ||||||||
Nordea Kredit 0.50% 10/1/204010 | DKK | 1,615 | 181 | |||||
Nykredit Realkredit AS, Series 01E, 1.50% 10/1/203710 | 502 | 62 | ||||||
Nykredit Realkredit AS, Series 01E, 0.50% 10/1/204010 | 7,234 | 809 | ||||||
Nykredit Realkredit AS, Series 01E, 1.50% 10/1/204010 | 1,281 | 158 | ||||||
Nykredit Realkredit AS, Series 01E, 0.50% 10/1/204310 | 20,442 | 2,228 | ||||||
Nykredit Realkredit AS, Series 01E, 0.50% 10/1/205010 | 1,365 | 136 | ||||||
Nykredit Realkredit AS, Series CCE, 1.00% 10/1/205010 | 590 | 63 | ||||||
Nykredit Realkredit AS, Series 01E, 1.00% 10/1/205310 | 862 | 90 | ||||||
Realkredit Danmark AS 1.00% 10/1/205310 | 194 | 20 | ||||||
|
| |||||||
| 3,747 | ||||||||
|
| |||||||
Total mortgage-backed obligations | 9,498 | |||||||
|
| |||||||
Asset-backed obligations 0.63% | ||||||||
AmeriCredit Automobile Receivables Trust, Series 2022-2, Class A2B, (30-day Average USD-SOFR + 1.15%) 4.958% 12/18/202510,13 | USD | 203 | 203 | |||||
CarMax Auto Owner Trust, Series 2022-3, Class A2B, (30-day Average USD-SOFR + 0.77%) 4.577% 9/15/202510,13 | 128 | 128 | ||||||
Exeter Automobile Receivables Trust, Series 2022-3A, Class A2, 3.45% 8/15/202410 | 56 | 56 | ||||||
Exeter Automobile Receivables Trust, Series 2022-4A, Class A2, 3.99% 8/15/202410 | 66 | 66 | ||||||
Ford Credit Auto Owner Trust, Series 2022-B, Class A2B, (30-day Average USD-SOFR + 0.60%) 4.407% 2/15/202510,13 | 111 | 111 | ||||||
GM Financial Automobile Leasing Trust, Series 2022-3, Class A2B, (30-day Average USD-SOFR + 0.71%) 4.536% 10/21/202410,13 | 110 | 110 | ||||||
GM Financial Consumer Automobile Receivables Trust, Series 2022-3, Class A2B, (30-day Average USD-SOFR + 0.60%) 4.408% 9/16/202510,13 | 121 | 121 | ||||||
Hyundai Auto Receivables Trust, Series 2022-B, Class A2B, (30-day Average USD-SOFR + 0.58%) 4.387% 5/15/202510,13 | 120 | 120 | ||||||
170 American Funds Insurance Series
Table of Contents
American Funds Global Balanced Fund (continued) (formerly Global Balanced Fund)
Bonds, notes & other debt instruments (continued)
| Principal amount | Value | |||||||||||
| (000) | (000) | |||||||||||
Asset-backed obligations (continued) | ||||||||||||
Nissan Auto Lease Trust, Series 2021-A, Class A3, 0.52% 8/15/202410 | USD302 | $ | 295 | |||||||||
Nissan Auto Lease Trust, Series 2022-A, Class A2B, | 283 | 283 | ||||||||||
Santander Drive Auto Receivables Trust, Series 2022-4, Class A2, 4.05% 7/15/202510 |
| 193 | 193 | |||||||||
Toyota Auto Receivables Owner Trust, Series 2022-C, Class A2B, | 40 | 40 | ||||||||||
Verizon Master Trust, Series 2022-3, Class A, 3.01% 5/20/2027 | 250 | 245 | ||||||||||
Volkswagen Auto Lease Trust, Series 2022-A, Class A2, 3.02% 10/21/202410 |
| 155 | 153 | |||||||||
Westlake Automobile Receivables Trust, Series 2022-2A, Class A2A, 3.36% 8/15/20253,10 | 181 | 180 | ||||||||||
|
| |||||||||||
| 2,304 | ||||||||||||
|
| |||||||||||
Municipals 0.04% | ||||||||||||
Ohio 0.02% | ||||||||||||
Turnpike and Infrastructure Commission, Turnpike Rev. Ref. Bonds (Infrastructure Projects), Series 2020-A, 3.216% 2/15/2048 | 100 | 72 | ||||||||||
|
| |||||||||||
Texas 0.02% | ||||||||||||
Grand Parkway Transportation Corp., Grand Parkway System Toll Rev. Ref. Bonds, |
| |||||||||||
Series 2020-B, 3.236% 10/1/2052 | 80 | 57 | ||||||||||
|
| |||||||||||
Total municipals | 129 | |||||||||||
|
| |||||||||||
Total bonds, notes & other debt instruments (cost: $141,023,000) | 125,742 | |||||||||||
|
| |||||||||||
| Weighted average yield at acquisition | ||||||||||||
Short-term securities 4.34% | ||||||||||||
Commercial paper 3.27% | ||||||||||||
British Columbia (Province of) 1/23/2023 | 3.996 | % | 2,560 | 2,553 | ||||||||
KfW 1/27/20233 | 3.890 | 4,500 | 4,485 | |||||||||
Toronto-Dominion Bank 1/27/20233 | 4.132 | 5,000 | 4,983 | |||||||||
|
| |||||||||||
| 12,021 | ||||||||||||
|
| |||||||||||
| Shares | ||||||||||||
Money market investments 1.07% | ||||||||||||
Capital Group Central Cash Fund 4.31%2,14 | 39,285 | 3,928 | ||||||||||
|
| |||||||||||
Total short-term securities (cost: $15,953,000) | 15,949 | |||||||||||
|
| |||||||||||
Total investment securities 99.35% (cost: $359,847,000) | 365,361 | |||||||||||
Other assets less liabilities 0.65% | 2,399 | |||||||||||
|
| |||||||||||
Net assets 100.00% | $ | 367,760 | ||||||||||
|
| |||||||||||
American Funds Insurance Series 171
Table of Contents
American Funds Global Balanced Fund (continued) (formerly Global Balanced Fund)
Futures contracts
Contracts | Type | Number of contracts | Expiration | Notional amount (000) | Value and unrealized appreciation (depreciation) at 12/31/2022 (000) | |||||||||||||||
2 Year U.S. Treasury Note Futures | Long | 5 | March 2023 | USD1,025 | $ | 1 | ||||||||||||||
5 Year Euro-Bobl Futures | Long | 49 | March 2023 | 6,071 | (205 | ) | ||||||||||||||
5 Year U.S. Treasury Note Futures | Long | 95 | March 2023 | 10,253 | (8 | ) | ||||||||||||||
10 Year Euro-Bund Futures | Long | 14 | March 2023 | 1,992 | (128 | ) | ||||||||||||||
10 Year Italy Government Bond Futures | Short | 1 | March 2023 | (116 | ) | 9 | ||||||||||||||
10 Year Japanese Government Bond Futures | Short | 1 | March 2023 | (1,108 | ) | 23 | ||||||||||||||
10 Year Australian Treasury Bond Futures | Long | 4 | March 2023 | 315 | (19 | ) | ||||||||||||||
10 Year Ultra U.S. Treasury Note Futures | Long | 6 | March 2023 | 710 | (6 | ) | ||||||||||||||
10 Year U.S. Treasury Note Futures | Short | 6 | March 2023 | (674 | ) | 4 | ||||||||||||||
10 Year UK Gilt Futures | Short | 2 | March 2023 | (241 | ) | 15 | ||||||||||||||
20 Year U.S. Treasury Bond Futures | Long | 4 | March 2023 | 501 | (11 | ) | ||||||||||||||
30 Year Euro-Buxl Futures | Long | 2 | March 2023 | 290 | (54 | ) | ||||||||||||||
30 Year Ultra U.S. Treasury Bond Futures | Short | 6 | March 2023 | (806 | ) | 6 | ||||||||||||||
|
| |||||||||||||||||||
| $ | (373 | ) | ||||||||||||||||||
|
| |||||||||||||||||||
Forward currency contracts
| Contract amount | Counterparty | Settlement date | Unrealized | |||||||||||
| Currency purchased (000) | Currency sold (000) | |||||||||||||
| KRW | 1,761,900 | USD | 1,337 | Citibank | 1/9/2023 | $63 | ||||||||
| USD | 687 | KRW | 894,770 | Bank of America | 1/9/2023 | (23) | ||||||||
| EUR | 2,560 | DKK | 19,040 | Standard Chartered Bank | 1/10/2023 | (1) | ||||||||
| USD | 203 | NZD | 320 | HSBC Bank | 1/10/2023 | (1) | ||||||||
| SEK | 1,270 | USD | 122 | UBS AG | 1/10/2023 | (1) | ||||||||
| USD | 511 | MYR | 2,250 | JPMorgan Chase | 1/10/2023 | (3) | ||||||||
| USD | 640 | AUD | 950 | HSBC Bank | 1/10/2023 | (7) | ||||||||
| USD | 445 | MXN | 8,853 | Goldman Sachs | 1/10/2023 | (8) | ||||||||
| EUR | 4,105 | USD | 4,324 | Goldman Sachs | 1/12/2023 | 74 | ||||||||
| CAD | 1,450 | USD | 1,063 | HSBC Bank | 1/12/2023 | 8 | ||||||||
| USD | 74 | CAD | 100 | HSBC Bank | 1/12/2023 | — 11 | ||||||||
| NZD | 470 | USD | 299 | Morgan Stanley | 1/12/2023 | (1) | ||||||||
| USD | 1,585 | EUR | 1,500 | BNP Paribas | 1/12/2023 | (21) | ||||||||
| JPY | 169,239 | USD | 1,256 | Bank of America | 1/13/2023 | 35 | ||||||||
| JPY | 89,090 | USD | 656 | Bank of America | 1/13/2023 | 24 | ||||||||
| USD | 278 | COP | 1,337,640 | Citibank | 1/13/2023 | 3 | ||||||||
| USD | 563 | CAD | 760 | Standard Chartered Bank | 1/13/2023 | 2 | ||||||||
| USD | 98 | GBP | 80 | Morgan Stanley | 1/13/2023 | 1 | ||||||||
| GBP | 240 | USD | 292 | Bank of New York Mellon | 1/13/2023 | (2) | ||||||||
| USD | 303 | MXN | 6,020 | UBS AG | 1/13/2023 | (5) | ||||||||
| JPY | 466,020 | USD | 3,428 | Standard Chartered Bank | 1/20/2023 | 133 | ||||||||
| JPY | 81,321 | AUD | 890 | HSBC Bank | 1/20/2023 | 15 | ||||||||
| JPY | 51,480 | USD | 380 | Standard Chartered Bank | 1/20/2023 | 14 | ||||||||
| USD | 112 | CLP | 100,000 | Bank of America | 1/23/2023 | (6) | ||||||||
| USD | 564 | BRL | 3,025 | Citibank | 1/23/2023 | (7) | ||||||||
| JPY | 118,440 | USD | 821 | Standard Chartered Bank | 1/27/2023 | 85 | ||||||||
| JPY | 172,080 | USD | 1,271 | BNP Paribas | 1/27/2023 | 46 | ||||||||
| JPY | 45,290 | USD | 313 | UBS AG | 1/27/2023 | 33 | ||||||||
| JPY | 78,800 | USD | 585 | Goldman Sachs | 1/27/2023 | 18 | ||||||||
| PLN | 4,260 | USD | 922 | Citibank | 2/2/2023 | 47 | ||||||||
172 American Funds Insurance Series
Table of Contents
American Funds Global Balanced Fund (continued) (formerly Global Balanced Fund)
Forward currency contracts (continued)
| Contract amount | Unrealized appreciation (depreciation) at 12/31/2022 (000) | |||||||||||||||
| Currency purchased (000) | Currency sold (000) | Counterparty | Settlement date | |||||||||||||
| USD | 245 | PLN | 1,150 | UBS AG | 2/2/2023 | $ | (17 | ) | ||||||||
| USD | 420 | PLN | 1,940 | Citibank | 2/2/2023 | (21 | ) | |||||||||
| PLN | 1,940 | USD | 468 | BNP Paribas | 2/2/2023 | (26 | ) | |||||||||
| KRW | 405,540 | USD | 307 | Standard Chartered Bank | 2/28/2023 | 16 | ||||||||||
| CNH | 8,530 | USD | 1,218 | Standard Chartered Bank | 3/6/2023 | 22 | ||||||||||
| JPY | 76,110 | USD | 565 | BNP Paribas | 3/6/2023 | 20 | ||||||||||
| EUR | 720 | USD | 757 | Bank of America | 3/6/2023 | 17 | ||||||||||
| KRW | 347,180 | USD | 267 | HSBC Bank | 3/6/2023 | 10 | ||||||||||
|
| |||||||||||||||
| $ | 536 | |||||||||||||||
|
| |||||||||||||||
Swap contracts
Interest rate swaps
Centrally cleared interest rate swaps
Receive | Pay | Value at 12/31/2022 (000) | Upfront premium paid (000) | Unrealized (depreciation) appreciation at 12/31/2022 (000) | ||||||||||||||||||||||
Rate | Payment | Rate | Payment | Expiration date | Notional amount (000) | |||||||||||||||||||||
1.2475% | Semi-annual | 3-month NZD-BBR-FRA | Quarterly | 8/20/2023 | NZD | 375 | $ | (6 | ) | $ | — | $ | (6 | ) | ||||||||||||
1.234974% | Semi-annual | 3-month NZD-BBR-FRA | Quarterly | 8/20/2023 | 3,197 | (51 | ) | — | (51 | ) | ||||||||||||||||
1.2375% | Semi-annual | 3-month NZD-BBR-FRA | Quarterly | 8/26/2023 | 1,178 | (20 | ) | — | (20 | ) | ||||||||||||||||
1.264% | Semi-annual | 3-month NZD-BBR-FRA | Quarterly | 8/27/2023 | 2,945 | (48 | ) | — | (48 | ) | ||||||||||||||||
1.26% | Semi-annual | 3-month NZD-BBR-FRA | Quarterly | 8/30/2023 | 486 | (8 | ) | — | (8 | ) | ||||||||||||||||
1.28% | Semi-annual | 3-month NZD-BBR-FRA | Quarterly | 8/31/2023 | 486 | (8 | ) | — | (8 | ) | ||||||||||||||||
1.30% | Semi-annual | 3-month NZD-BBR-FRA | Quarterly | 9/3/2023 | 533 | (9 | ) | — | (9 | ) | ||||||||||||||||
1.4975% | Semi-annual | 3-month NZD-BBR-FRA | Quarterly | 9/21/2023 | 1,001 | (17 | ) | — | (17 | ) | ||||||||||||||||
1.445% | Semi-annual | 3-month NZD-BBR-FRA | Quarterly | 9/28/2023 | 1,000 | (18 | ) | — | (18 | ) | ||||||||||||||||
1.4475% | Semi-annual | 3-month NZD-BBR-FRA | Quarterly | 9/29/2023 | 1,019 | (19 | ) | — | (19 | ) | ||||||||||||||||
1.4475% | Semi-annual | 3-month NZD-BBR-FRA | Quarterly | 9/30/2023 | 1,023 | (19 | ) | — | (19 | ) | ||||||||||||||||
1.5125% | Semi-annual | 3-month NZD-BBR-FRA | Quarterly | 10/14/2023 | 904 | (17 | ) | — | (17 | ) | ||||||||||||||||
1.53% | Semi-annual | 3-month NZD-BBR-FRA | Quarterly | 10/14/2023 | 1,031 | (20 | ) | — | (20 | ) | ||||||||||||||||
1.5625% | Semi-annual | 3-month NZD-BBR-FRA | Quarterly | 10/15/2023 | 1,029 | (19 | ) | — | (19 | ) | ||||||||||||||||
1.59% | Semi-annual | 3-month NZD-BBR-FRA | Quarterly | 10/18/2023 | 1,029 | (19 | ) | — | (19 | ) | ||||||||||||||||
1.62% | Semi-annual | 3-month NZD-BBR-FRA | Quarterly | 10/19/2023 | 1,144 | (21 | ) | — | (21 | ) | ||||||||||||||||
3.7697% | Semi-annual | 3-month NZD-BBR-FRA | Quarterly | 11/6/2023 | 5,500 | (47 | ) | — | (47 | ) | ||||||||||||||||
2.24% | Semi-annual | 3-month NZD-BBR-FRA | Quarterly | 11/8/2023 | 1,463 | (24 | ) | — | (24 | ) | ||||||||||||||||
2.2525% | Semi-annual | 3-month NZD-BBR-FRA | Quarterly | 11/8/2023 | 1,463 | (24 | ) | — | (24 | ) | ||||||||||||||||
2.20% | Semi-annual | 3-month NZD-BBR-FRA | Quarterly | 11/9/2023 | 123 | (2 | ) | — | (2 | ) | ||||||||||||||||
2.495% | Annual | SONIA | Annual | 5/5/2024 | GBP3,050 | (77 | ) | — | (77 | ) | ||||||||||||||||
2.42% | Annual | SONIA | Annual | 5/5/2024 | 6,100 | (160 | ) | — | (160 | ) | ||||||||||||||||
2.9588% | Annual | SONIA | Annual | 6/9/2024 | 4,180 | (84 | ) | — | (84 | ) | ||||||||||||||||
SONIA | Annual | 5.6325% | Annual | 9/25/2024 | 7,720 | (88 | ) | — | (88 | ) | ||||||||||||||||
6.59% | 28-day | 28-day MXN-TIIE | 28-day | 6/25/2026 | MXN | 2,000 | (7 | ) | — | (7 | ) | |||||||||||||||
6.585% | 28-day | 28-day MXN-TIIE | 28-day | 6/25/2026 | 2,600 | (10 | ) | — | (10 | ) | ||||||||||||||||
6.64% | 28-day | 28-day MXN-TIIE | 28-day | 6/25/2026 | 3,200 | (12 | ) | — | (12 | ) | ||||||||||||||||
6.6175% | 28-day | 28-day MXN-TIIE | 28-day | 6/25/2026 | 8,600 | (31 | ) | — | (31 | ) | ||||||||||||||||
6.633% | 28-day | 28-day MXN-TIIE | 28-day | 6/25/2026 | 8,900 | (32 | ) | — | (32 | ) | ||||||||||||||||
6.58% | 28-day | 28-day MXN-TIIE | 28-day | 6/25/2026 | 11,300 | (42 | ) | — | (42 | ) | ||||||||||||||||
7.59% | 28-day | 28-day MXN-TIIE | 28-day | 10/29/2026 | 2,500 | (6 | ) | — | (6 | ) | ||||||||||||||||
7.62% | 28-day | 28-day MXN-TIIE | 28-day | 10/29/2026 | 3,701 | (8 | ) | — | (8 | ) | ||||||||||||||||
7.66% | 28-day | 28-day MXN-TIIE | 28-day | 10/29/2026 | 6,100 | (13 | ) | — | (13 | ) | ||||||||||||||||
American Funds Insurance Series 173
Table of Contents
American Funds Global Balanced Fund (continued) (formerly Global Balanced Fund)
Swap contracts (continued)
Interest rate swaps (continued)
Centrally cleared interest rate swaps (continued)
Receive | Pay | Value at 12/31/2022 (000) | Upfront premium paid (000) | Unrealized (depreciation) appreciation at 12/31/2022 (000) | ||||||||||||||||||||||
Rate | Payment | Rate | Payment | Expiration date | Notional amount (000) | |||||||||||||||||||||
7.64% | 28-day | 28-day MXN-TIIE | 28-day | 10/29/2026 | MXN | 6,000 | $ | (13 | ) | $ | — | $ | (13 | ) | ||||||||||||
7.52% | 28-day | 28-day MXN-TIIE | 28-day | 10/30/2026 | 7,639 | (18 | ) | — | (18 | ) | ||||||||||||||||
9.07% | 28-day | 28-day MXN-TIIE | 28-day | 4/28/2027 | 20,400 | 8 | — | 8 | ||||||||||||||||||
|
|
|
|
|
| |||||||||||||||||||||
| $ | (1,009 | ) | $ | — | $ | (1,009 | ) | |||||||||||||||||||
|
|
|
|
|
| |||||||||||||||||||||
Credit default swaps
Centrally cleared credit default swaps on credit indices — sell protection
Financing rate | Payment frequency | Reference index | Expiration date | Notional amount15 (000) | Value at 12/31/202216 (000) | Upfront premium paid (000) | Unrealized appreciation at 12/31/2022 (000) | |||||||||||||||||||
1.00% | Quarterly | CDX.NA.IG.39 | 12/20/2027 | USD2,580 | $ | 20 | $ | 13 | $ | 7 | ||||||||||||||||
Investments in affiliates2
| Value of affiliates at 1/1/2022 (000) | Additions (000) | Reductions (000) | Net realized gain (000) | Net unrealized appreciation (000) | Value of affiliates at 12/31/2022 (000) | Dividend income (000) | ||||||||||||||||||||||
Investment funds 1.50% | $ | — | $ | 5,481 | $ | — | $ | — | $ | 51 | $ | 5,532 | $ | 50 | ||||||||||||||
Short-term securities 1.07% | ||||||||||||||||||||||||||||
Capital Group Central Cash Fund 4.31%14 | 1,127 | 144,034 | 141,236 | 3 | — | 3,928 | 343 | |||||||||||||||||||||
|
|
|
|
|
|
|
| |||||||||||||||||||||
Total 2.57% | $ | 3 | $ | 51 | $ | 9,460 | $ | 393 | ||||||||||||||||||||
|
|
|
|
|
|
|
| |||||||||||||||||||||
Restricted securities9
| Acquisition date(s) | Cost (000) | Value (000) | Percent of net assets | |||||||||||||
Netflix, Inc. 3.875% 11/15/2029 | 7/11/20222-7/12/2022 | $ | 191 | $ | 201 | .06 | % | |||||||||
Goldman Sachs Group, Inc. 1.00% 3/18/2033 | 5/19/2021 | 251 | 162 | .04 | ||||||||||||
|
|
|
|
|
| |||||||||||
Total | $ | 442 | $ | 363 | .10 | % | ||||||||||
|
|
|
|
|
| |||||||||||
174 American Funds Insurance Series
Table of Contents
American Funds Global Balanced Fund (continued) (formerly Global Balanced Fund)
| 1 | Security did not produce income during the last 12 months. |
| 2 | Part of the same “group of investment companies” as the fund as defined under the Investment Company Act of 1940, as amended. |
| 3 | Acquired in a transaction exempt from registration under Rule 144A or, for commercial paper, Section 4(a)(2) of the Securities Act of 1933. May be resold in the U.S. in transactions exempt from registration, normally to qualified institutional buyers. The total value of all such securities was $14,344,000, which represented 3.90% of the net assets of the fund. |
| 4 | Index-linked bond whose principal amount moves with a government price index. |
| 5 | Scheduled interest and/or principal payment was not received. |
| 6 | Value determined using significant unobservable inputs. |
| 7 | All or a portion of this security was pledged as collateral. The total value of pledged collateral was $758,000, which represented .21% of the net assets of the fund. |
| 8 | Step bond; coupon rate may change at a later date. |
| 9 | Restricted security, other than Rule 144A securities or commercial paper issued pursuant to Section 4(a)(2) of the Securities Act of 1933. The total value of all such restricted securities was $363,000, which represented .10% of the net assets of the fund. |
| 10 | Principal payments may be made periodically. Therefore, the effective maturity date may be earlier than the stated maturity date. |
| 11 | Amount less than one thousand. |
| 12 | Purchased on a TBA basis. |
| 13 | Coupon rate may change periodically. Reference rate and spread are as of the most recent information available. Some coupon rates are determined by the issuer or agent based on current market conditions; therefore, the reference rate and spread are not available. |
| 14 | Rate represents the seven-day yield at 12/31/2022. |
| 15 | The maximum potential amount the fund may pay as a protection seller should a credit event occur. |
| 16 | The prices and resulting values for credit default swap indices serve as an indicator of the current status of the payment/performance risk. As the value of a sell protection credit default swap increases or decreases, when compared to the notional amount of the swap, the payment/performance risk may decrease or increase, respectively. |
Key to abbreviations
ADR = American Depositary Receipts
Assn. = Association
AUD = Australian dollars
BBR = Bank Base Rate
BRL = Brazilian reais
CAD = Canadian dollars
CDI = CREST Depository Interest
CLP = Chilean pesos
CNH = Chinese yuan renminbi
CNY = Chinese yuan
COP = Colombian pesos
DKK = Danish kroner
EUR = Euros
EURIBOR = Euro Interbank Offered Rate
FRA = Forward Rate Agreement
GBP = British pounds
IDR = Indonesian rupiah
INR = Indian rupees
JPY = Japanese yen
KRW = South Korean won
LIBOR = London Interbank Offered Rate
MXN = Mexican pesos
MYR = Malaysian ringgits
NZD = New Zealand dollars
PLN = Polish zloty
Ref. = Refunding
REIT = Real Estate Investment Trust
Rev. = Revenue
RUB = Russian rubles
SEK = Swedish kronor
SOFR = Secured Overnight Financing Rate
SONIA = Sterling Overnight Interbank Average Rate
TBA = To be announced
TIIE = Equilibrium Interbank Interest Rate
USD = U.S. dollars
ZAR = South African rand
Refer to the notes to financial statements.
American Funds Insurance Series 175
Table of Contents
Investment portfolio December 31, 2022
Bonds, notes & other debt instruments 95.37%
Principal (000) | Value (000) | |||||||
Corporate bonds, notes & loans 34.59% | ||||||||
Financials 9.65% | ||||||||
ACE INA Holdings, Inc. 3.35% 5/3/2026 | USD | 2,025 | $ | 1,941 | ||||
ACE INA Holdings, Inc. 4.35% 11/3/2045 | 2,220 | 1,933 | ||||||
AerCap Ireland Capital DAC 1.65% 10/29/2024 | 5,996 | 5,535 | ||||||
AerCap Ireland Capital DAC 6.50% 7/15/2025 | 1,798 | 1,824 | ||||||
AerCap Ireland Capital DAC 1.75% 1/30/2026 | 2,841 | 2,503 | ||||||
AerCap Ireland Capital DAC 2.45% 10/29/2026 | 10,289 | 9,010 | ||||||
AerCap Ireland Capital DAC 3.00% 10/29/2028 | 10,345 | 8,686 | ||||||
AerCap Ireland Capital DAC 3.30% 1/30/2032 | 11,338 | 8,891 | ||||||
AerCap Ireland Capital DAC 3.40% 10/29/2033 | 5,120 | 3,896 | ||||||
AerCap Ireland Capital DAC 3.85% 10/29/2041 | 1,254 | 891 | ||||||
AerCap Ireland Capital, Ltd. / AerCap Global Aviation Trust 1.15% 10/29/2023 | 3,130 | 3,013 | ||||||
Ally Financial, Inc. 5.125% 9/30/2024 | 1,500 | 1,486 | ||||||
Ally Financial, Inc. 8.00% 11/1/2031 | 8,075 | 8,418 | ||||||
American Express Co. 4.42% 8/3/2033 (USD-SOFR + 1.76% on 8/3/2032)1 | 4,501 | 4,265 | ||||||
Arthur J. Gallagher & Co. 3.50% 5/20/2051 | 1,073 | 754 | ||||||
Banco Santander, SA 5.147% 8/18/2025 | 4,000 | 3,960 | ||||||
Banco Santander, SA 1.722% 9/14/2027 (1-year UST Yield Curve Rate T Note Constant Maturity + 0.90% on 9/14/2026)1 | 1,400 | 1,198 | ||||||
Bank of America Corp. 1.53% 12/6/2025 (USD-SOFR + 0.65% on 12/6/2024)1 | 1,970 | 1,818 | ||||||
Bank of America Corp. 1.658% 3/11/2027 (USD-SOFR + 0.91% on 3/11/2026)1 | 981 | 869 | ||||||
Bank of America Corp. 1.734% 7/22/2027 (USD-SOFR + 0.96% on 7/22/2026)1 | 7,989 | 7,009 | ||||||
Bank of America Corp. 4.376% 4/27/2028 (USD-SOFR + 1.58% on 4/27/2027)1 | 2,635 | 2,524 | ||||||
Bank of America Corp. 4.948% 7/22/2028 (USD-SOFR + 2.04% on 7/22/2027)1 | 11,107 | 10,866 | ||||||
Bank of America Corp. 6.204% 11/10/2028 (USD-SOFR + 1.99% on 11/10/2027)1 | 1,502 | 1,553 | ||||||
Bank of America Corp. 3.419% 12/20/2028 (3-month USD-LIBOR + 1.04% on 12/20/2027)1 | 10,129 | 9,189 | ||||||
Bank of America Corp. 2.087% 6/14/2029 (USD-SOFR + 1.06% on 6/14/2028)1 | 2,773 | 2,338 | ||||||
Bank of America Corp. 1.922% 10/24/2031 (USD-SOFR + 1.37% on 10/24/2030)1 | 21,177 | 16,224 | ||||||
Bank of America Corp. 2.687% 4/22/2032 (USD-SOFR + 1.32% on 4/22/2031)1 | 8,343 | 6,698 | ||||||
Bank of America Corp. 2.299% 7/21/2032 (USD-SOFR + 1.22% on 7/21/2031)1 | 36,155 | 27,930 | ||||||
Bank of America Corp. 2.572% 10/20/2032 (USD-SOFR + 1.21% on 10/20/2031)1 | 2,613 | 2,053 | ||||||
Bank of America Corp. 2.972% 2/4/2033 (USD-SOFR + 1.33% on 2/4/2032)1 | 4,089 | 3,305 | ||||||
Bank of America Corp. 4.571% 4/27/2033 (USD-SOFR + 1.83% on 4/27/2032)1 | 10,180 | 9,340 | ||||||
Bank of America Corp. 5.015% 7/22/2033 (USD-SOFR + 2.16% on 7/22/2032)1 | 7,947 | 7,568 | ||||||
Bank of Ireland Group PLC 6.253% 9/16/2026 (1-year UST Yield Curve Rate T Note Constant Maturity + 2.65% on 9/16/2025)1,2 | 4,850 | 4,814 | ||||||
Barclays Bank PLC 5.304% 8/9/2026 (1-year UST Yield Curve Rate T Note Constant Maturity + 2.30% on 8/9/2025)1 | 4,525 | 4,496 | ||||||
BNP Paribas SA 1.323% 1/13/2027 (USD-SOFR + 1.004% on 1/13/2026)1,2 | 7,581 | 6,634 | ||||||
BNP Paribas SA 2.591% 1/20/2028 (USD-SOFR + 1.228% on 1/20/2027)1,2 | 13,134 | 11,569 | ||||||
BNP Paribas SA 2.159% 9/15/2029 (USD-SOFR + 1.218% on 9/15/2028)1,2 | 3,594 | 2,936 | ||||||
BNP Paribas SA 2.871% 4/19/2032 (USD-SOFR + 1.387% on 4/19/2031)1,2 | 4,177 | 3,276 | ||||||
Canadian Imperial Bank of Commerce (CIBC) 3.60% 4/7/2032 | 1,303 | 1,152 | ||||||
Capital One Financial Corp. 1.343% 12/6/2024 (USD-SOFR + 0.69% on 12/6/2023)1 | 4,525 | 4,334 | ||||||
Capital One Financial Corp. 4.985% 7/24/2026 (USD-SOFR + 2.16% on 7/24/2025)1 | 2,430 | 2,382 | ||||||
Capital One Financial Corp. 4.927% 5/10/2028 (USD-SOFR + 2.057% on 5/10/2027)1 | 4,650 | 4,509 | ||||||
China Ping An Insurance Overseas (Holdings), Ltd. 2.85% 8/12/2031 | 1,126 | 880 | ||||||
CIT Group, Inc. 3.929% 6/19/2024 (USD-SOFR + 3.827% on 6/19/2023)1 | 5,410 | 5,364 | ||||||
Citigroup, Inc. 4.60% 3/9/2026 | 1,800 | 1,770 | ||||||
Citigroup, Inc. 1.462% 6/9/2027 (USD-SOFR + 0.67% on 6/9/2026)1 | 8,740 | 7,591 | ||||||
Citigroup, Inc. 3.07% 2/24/2028 (USD-SOFR + 1.28% on 2/24/2027)1 | 5,520 | 4,984 | ||||||
Citigroup, Inc. 4.658% 5/24/2028 (USD-SOFR + 1.887% on 5/24/2027)1 | 3,386 | 3,282 | ||||||
Citigroup, Inc. 3.057% 1/25/2033 (USD-SOFR + 1.351% on 1/25/2032)1 | 1,030 | 834 | ||||||
Citigroup, Inc. 3.785% 3/17/2033 (USD-SOFR + 1.939% on 3/17/2032)1 | 5,350 | 4,590 | ||||||
Citigroup, Inc. 4.91% 5/24/2033 (USD-SOFR + 2.086% on 5/24/2032)1 | 1,718 | 1,614 | ||||||
Citigroup, Inc. 6.27% 11/17/2033 (USD-SOFR + 2.338% on 11/17/2032)1 | 2,781 | 2,878 | ||||||
Corebridge Financial, Inc. 3.50% 4/4/20252 | 1,439 | 1,381 | ||||||
Corebridge Financial, Inc. 3.65% 4/5/20272 | 4,493 | 4,195 | ||||||
Corebridge Financial, Inc. 3.85% 4/5/20292 | 5,794 | 5,289 | ||||||
Corebridge Financial, Inc. 3.90% 4/5/20322 | 5,959 | 5,221 | ||||||
Corebridge Financial, Inc. 4.35% 4/5/20422 | 361 | 298 | ||||||
176 American Funds Insurance Series
Table of Contents
The Bond Fund of America (continued)
Bonds, notes & other debt instruments (continued)
| Principal amount | Value | |||||||
| (000) | (000) | |||||||
Corporate bonds, notes & loans (continued) | ||||||||
Financials (continued) | ||||||||
Corebridge Financial, Inc. 4.40% 4/5/20522 | USD | 1,352 | $ | 1,078 | ||||
Crédit Agricole SA 1.907% 6/16/2026 (USD-SOFR + 1.676% on 6/16/2025)1,2 | 4,450 | 4,060 | ||||||
Crédit Agricole SA 1.247% 1/26/2027 (USD-SOFR + 0.892% on 1/26/2026)1,2 | 2,450 | 2,145 | ||||||
Credit Suisse Group AG 3.80% 6/9/2023 | 15,327 | 14,927 | ||||||
Credit Suisse Group AG 2.593% 9/11/2025 (USD-SOFR + 1.56% on 9/11/2024)1,2 | 850 | 752 | ||||||
Credit Suisse Group AG 2.193% 6/5/2026 (USD-SOFR + 2.044% on 6/5/2025)1,2 | 7,609 | 6,505 | ||||||
Credit Suisse Group AG 1.305% 2/2/2027 (USD-SOFR + 0.98% on 2/2/2026)1,2 | 11,200 | 8,973 | ||||||
Credit Suisse Group AG 6.442% 8/11/2028 (USD-SOFR + 3.70% on 8/11/2027)1,2 | 1,265 | 1,154 | ||||||
Credit Suisse Group AG 4.194% 4/1/2031 (USD-SOFR + 3.73% on 4/1/2030)1,2 | 5,476 | 4,262 | ||||||
Credit Suisse Group AG 3.091% 5/14/2032 (USD-SOFR + 1.73% on 5/14/2031)1,2 | 7,369 | 5,106 | ||||||
Credit Suisse Group AG 6.537% 8/12/2033 (USD-SOFR + 3.92% on 8/12/2032)1,2 | 576 | 507 | ||||||
Credit Suisse Group AG 9.016% 11/15/2033 (USD-SOFR + 5.02% on 11/15/2032)1,2 | 6,658 | 6,835 | ||||||
Danske Bank AS 1.549% 9/10/2027 (1-year UST Yield Curve Rate T Note Constant Maturity + 0.73% on 9/10/2026)1,2 | 2,990 | 2,565 | ||||||
Danske Bank AS 4.298% 4/1/2028 (1-year UST Yield Curve Rate T Note Constant Maturity + 1.75% on 4/1/2027)1,2 | 2,975 | 2,740 | ||||||
Deutsche Bank AG 3.95% 2/27/2023 | 6,350 | 6,328 | ||||||
Deutsche Bank AG 0.898% 5/28/2024 | 2,500 | 2,339 | ||||||
Deutsche Bank AG 3.70% 5/30/2024 | 5,150 | 5,007 | ||||||
Deutsche Bank AG 2.222% 9/18/2024 (USD-SOFR + 2.159% on 9/18/2023)1 | 10,475 | 10,120 | ||||||
Deutsche Bank AG 3.961% 11/26/2025 (USD-SOFR + 2.581% on 11/26/2024)1 | 3,673 | 3,512 | ||||||
Deutsche Bank AG 4.10% 1/13/2026 | 7,305 | 7,029 | ||||||
Deutsche Bank AG 4.10% 1/13/2026 | 857 | 824 | ||||||
Deutsche Bank AG 2.129% 11/24/2026 (USD-SOFR + 1.87% on 11/24/2025)1 | 41,608 | 36,749 | ||||||
Deutsche Bank AG 2.311% 11/16/2027 (USD-SOFR + 1.219% on 11/16/2026)1 | 4,315 | 3,664 | ||||||
Deutsche Bank AG 2.552% 1/7/2028 (USD-SOFR + 1.318% on 1/7/2027)1 | 7,258 | 6,179 | ||||||
Deutsche Bank AG 3.547% 9/18/2031 (USD-SOFR + 3.043% on 9/18/2030)1 | 2,900 | 2,331 | ||||||
Discover Financial Services 6.70% 11/29/2032 | 1,475 | 1,504 | ||||||
DNB Bank ASA 1.535% 5/25/2027 (5-year UST Yield Curve Rate T Note Constant Maturity + 0.72% on 5/25/2026)1,2 | 1,200 | 1,045 | ||||||
GE Capital Funding, LLC 4.55% 5/15/2032 | 973 | 927 | ||||||
Goldman Sachs Group, Inc. 1.431% 3/9/2027 (USD-SOFR + 0.795% on 3/9/2026)1 | 3,030 | 2,660 | ||||||
Goldman Sachs Group, Inc. 1.542% 9/10/2027 (USD-SOFR + 0.818% on 9/10/2026)1 | 13,275 | 11,468 | ||||||
Goldman Sachs Group, Inc. 1.948% 10/21/2027 (USD-SOFR + 0.913% on 10/21/2026)1 | 13,961 | 12,226 | ||||||
Goldman Sachs Group, Inc. 2.64% 2/24/2028 (USD-SOFR + 1.114% on 2/24/2027)1 | 1,758 | 1,568 | ||||||
Goldman Sachs Group, Inc. 3.615% 3/15/2028 (USD-SOFR + 1.846% on 3/15/2027)1 | 7,403 | 6,907 | ||||||
Goldman Sachs Group, Inc. 4.482% 8/23/2028 (USD-SOFR + 1.725% on 8/23/2027)1 | 1,534 | 1,473 | ||||||
Goldman Sachs Group, Inc. 3.814% 4/23/2029 (3-month USD-LIBOR + 1.158% on 4/23/2028)1 | 9,600 | 8,786 | ||||||
Goldman Sachs Group, Inc. 3.102% 2/24/2033 (USD-SOFR + 1.41% on 2/24/2032)1 | 10,422 | 8,490 | ||||||
Goldman Sachs Group, Inc. 2.908% 7/21/2042 (USD-SOFR + 1.40% on 7/21/2041)1 | 3,160 | 2,161 | ||||||
Goldman Sachs Group, Inc. 5.30% junior subordinated perpetual bonds (3-month USD-LIBOR + 3.834% on 11/10/2026)1 | 1,750 | 1,665 | ||||||
Groupe BPCE SA 2.75% 1/11/20232 | 6,875 | 6,871 | ||||||
Groupe BPCE SA 5.70% 10/22/20232 | 28,166 | 27,963 | ||||||
Groupe BPCE SA 5.15% 7/21/20242 | 5,481 | 5,369 | ||||||
Groupe BPCE SA 1.625% 1/14/20252 | 2,980 | 2,776 | ||||||
Groupe BPCE SA 1.652% 10/6/2026 (USD-SOFR + 1.52% on 10/6/2025)1,2 | 6,350 | 5,649 | ||||||
Groupe BPCE SA 5.748% 7/19/2033 (USD-SOFR + 2.865% on 7/19/2032)1,2 | 6,195 | 5,908 | ||||||
HSBC Holdings PLC 2.251% 11/22/2027 (USD-SOFR + 1.10% on 11/22/2026)1 | 5,270 | 4,571 | ||||||
HSBC Holdings PLC 4.583% 6/19/2029 (3-month USD-LIBOR + 1.535% on 6/19/2028)1 | 6,410 | 5,913 | ||||||
HSBC Holdings PLC 2.206% 8/17/2029 (USD-SOFR + 1.285% on 8/17/2028)1 | 5,917 | 4,786 | ||||||
HSBC Holdings PLC 2.804% 5/24/2032 (USD-SOFR + 1.187% on 5/24/2031)1 | 5,250 | 4,074 | ||||||
HSBC Holdings PLC 5.402% 8/11/2033 (USD-SOFR + 2.87% on 8/11/2032)1 | 3,595 | 3,339 | ||||||
Huarong Finance 2017 Co., Ltd. 4.75% 4/27/2027 | 669 | 585 | ||||||
Huarong Finance 2017 Co., Ltd. 4.25% 11/7/2027 | 6,335 | 5,422 | ||||||
Huarong Finance 2019 Co., Ltd. (3-month USD-LIBOR + 1.125%) 5.824% 2/24/20233 | 2,750 | 2,741 | ||||||
Huarong Finance 2019 Co., Ltd. (3-month USD-LIBOR + 1.25%) 6.007% 2/24/20253 | 397 | 374 | ||||||
Huarong Finance II Co., Ltd. 5.50% 1/16/2025 | 6,669 | 6,328 | ||||||
American Funds Insurance Series 177
Table of Contents
The Bond Fund of America (continued)
Bonds, notes & other debt instruments (continued)
| Principal amount | Value | |||||||
| (000) | (000) | |||||||
Corporate bonds, notes & loans (continued) | ||||||||
Financials (continued) | ||||||||
Huarong Finance II Co., Ltd. 5.00% 11/19/2025 | USD | 480 | $ | 444 | ||||
Huarong Finance II Co., Ltd. 4.625% 6/3/2026 | 200 | 177 | ||||||
Huarong Finance II Co., Ltd. 4.875% 11/22/2026 | 2,106 | 1,886 | ||||||
Intercontinental Exchange, Inc. 4.35% 6/15/2029 | 8,710 | 8,433 | ||||||
Intercontinental Exchange, Inc. 4.60% 3/15/2033 | 4,601 | 4,408 | ||||||
Intercontinental Exchange, Inc. 4.95% 6/15/2052 | 5,327 | 4,963 | ||||||
Intesa Sanpaolo SpA 3.375% 1/12/20232 | 10,035 | 10,030 | ||||||
Intesa Sanpaolo SpA 5.017% 6/26/20242 | 68,143 | 65,545 | ||||||
Intesa Sanpaolo SpA 3.25% 9/23/20242 | 770 | 731 | ||||||
Intesa Sanpaolo SpA 5.71% 1/15/20262 | 15,400 | 14,816 | ||||||
Intesa Sanpaolo SpA 3.875% 7/14/20272 | 6,250 | 5,581 | ||||||
Intesa Sanpaolo SpA 3.875% 1/12/20282 | 1,986 | 1,753 | ||||||
Iron Mountain Information Management Services, Inc. 5.00% 7/15/20322 | 2,060 | 1,714 | ||||||
JPMorgan Chase & Co. 0.969% 6/23/2025 (USD-SOFR + 0.58% on 6/23/2024)1 | 5,870 | 5,475 | ||||||
JPMorgan Chase & Co. 1.561% 12/10/2025 (USD-SOFR + 0.605% on 12/10/2024)1 | 11,105 | 10,289 | ||||||
JPMorgan Chase & Co. 4.08% 4/26/2026 (USD-SOFR + 1.32% on 4/26/2025)1 | 3,620 | 3,518 | ||||||
JPMorgan Chase & Co. 1.578% 4/22/2027 (USD-SOFR + 0.885% on 4/22/2026)1 | 1,832 | 1,612 | ||||||
JPMorgan Chase & Co. 1.47% 9/22/2027 (USD-SOFR + 0.765% on 9/22/2026)1 | 5,965 | 5,172 | ||||||
JPMorgan Chase & Co. 2.947% 2/24/2028 (USD-SOFR + 1.17% on 2/24/2027)1 | 4,350 | 3,941 | ||||||
JPMorgan Chase & Co. 4.323% 4/26/2028 (USD-SOFR + 1.56% on 4/26/2027)1 | 12,080 | 11,555 | ||||||
JPMorgan Chase & Co. 4.851% 7/25/2028 (USD-SOFR + 1.99% on 7/25/2027)1 | 8,465 | 8,265 | ||||||
JPMorgan Chase & Co. 3.509% 1/23/2029 (3-month USD-LIBOR + 0.945% on 1/23/2028)1 | 9,600 | 8,729 | ||||||
JPMorgan Chase & Co. 2.069% 6/1/2029 (USD-SOFR + 1.015% on 6/1/2028)1 | 2,453 | 2,053 | ||||||
JPMorgan Chase & Co. 4.203% 7/23/2029 (3-month USD-LIBOR + 1.26% on 7/23/2028)1 | 11,980 | 11,186 | ||||||
JPMorgan Chase & Co. 2.522% 4/22/2031 (USD-SOFR + 2.04% on 4/22/2030)1 | 1,766 | 1,449 | ||||||
JPMorgan Chase & Co. 2.58% 4/22/2032 (USD-SOFR + 1.25% on 4/22/2031)1 | 4,802 | 3,858 | ||||||
JPMorgan Chase & Co. 2.545% 11/8/2032 (USD-SOFR + 1.18% on 11/8/2031)1 | 5,313 | 4,213 | ||||||
JPMorgan Chase & Co. 2.963% 1/25/2033 (USD-SOFR + 1.26% on 1/25/2032)1 | 553 | 452 | ||||||
JPMorgan Chase & Co. 4.586% 4/26/2033 (USD-SOFR + 1.80% on 4/26/2032)1 | 1,907 | 1,771 | ||||||
JPMorgan Chase & Co. 4.912% 7/25/2033 (USD-SOFR + 2.08% on 7/25/2032)1 | 5,475 | 5,229 | ||||||
Kasikornbank PCL HK 3.343% 10/2/2031 (5-year UST Yield Curve Rate T Note Constant Maturity + 1.70% on 10/2/2026)1 | 2,415 | 2,128 | ||||||
Keb Hana Bank 3.25% 3/30/20272 | 1,315 | 1,227 | ||||||
Lloyds Banking Group PLC 2.438% 2/5/2026 (1-year UST Yield Curve Rate T Note Constant Maturity + 1.00% on 2/5/2025)1 | 2,675 | 2,493 | ||||||
Marsh & McLennan Companies, Inc. 2.375% 12/15/2031 | 367 | 297 | ||||||
Marsh & McLennan Companies, Inc. 2.90% 12/15/2051 | 505 | 326 | ||||||
MetLife Capital Trust IV, junior subordinated, 7.875% 12/15/2067 (3-month USD-LIBOR + 3.96% on 12/1/2037)1,2 | 1,405 | 1,521 | ||||||
MetLife, Inc. 3.60% 11/13/2025 | 3,490 | 3,395 | ||||||
MetLife, Inc. 5.00% 7/15/2052 | 165 | 158 | ||||||
Mitsubishi UFJ Financial Group, Inc. 0.962% 10/11/2025 (1-year UST Yield Curve Rate T Note Constant Maturity + 0.45% on 10/11/2024)1 | 2,960 | 2,724 | ||||||
Mitsubishi UFJ Financial Group, Inc. 1.538% 7/20/2027 (1-year UST Yield Curve Rate T Note Constant Maturity + 0.75% on 7/20/2026)1 | 6,200 | 5,383 | ||||||
Mitsubishi UFJ Financial Group, Inc. 1.64% 10/13/2027 (1-year UST Yield Curve Rate T Note Constant Maturity + 0.67% on 10/13/2026)1 | 2,225 | 1,930 | ||||||
Mitsubishi UFJ Financial Group, Inc. 2.341% 1/19/2028 (1-year UST Yield Curve Rate T Note Constant Maturity + 0.83% on 1/19/2027)1 | 2,970 | 2,618 | ||||||
Mitsubishi UFJ Financial Group, Inc. 4.08% 4/19/2028 (1-year UST Yield Curve Rate T Note Constant Maturity + 1.30% on 4/19/2027)1 | 2,945 | 2,781 | ||||||
Mitsubishi UFJ Financial Group, Inc. 5.133% 7/20/2033 (1-year UST Yield Curve Rate T Note Constant Maturity + 2.125% on 7/20/2032)1 | 1,197 | 1,146 | ||||||
Mizuho Financial Group, Inc. 1.554% 7/9/2027 (1-year UST Yield Curve Rate T Note Constant Maturity + 0.75% on 7/9/2026)1 | 4,615 | 4,026 | ||||||
Mizuho Financial Group, Inc. 5.669% 9/13/2033 (1-year UST Yield Curve Rate T Note Constant Maturity + 2.40% on 9/13/2032)1 | 2,390 | 2,379 | ||||||
Morgan Stanley 0.791% 1/22/2025 (USD-SOFR + 0.509% on 1/22/2024)1 | 3,065 | 2,901 | ||||||
Morgan Stanley 2.72% 7/22/2025 (USD-SOFR + 1.152% on 7/22/2024)1 | 2,300 | 2,200 | ||||||
178 American Funds Insurance Series
Table of Contents
The Bond Fund of America (continued)
Bonds, notes & other debt instruments (continued)
Principal (000) | Value (000) | |||||||
Corporate bonds, notes & loans (continued) | ||||||||
Financials (continued) | ||||||||
Morgan Stanley 1.512% 7/20/2027 (USD-SOFR + 0.858% on 7/20/2026)1 | USD | 10,488 | $ | 9,114 | ||||
Morgan Stanley 4.21% 4/20/2028 (USD-SOFR + 1.61% on 4/20/2027)1 | 3,671 | 3,497 | ||||||
Morgan Stanley 6.296% 10/18/2028 (USD-SOFR + 2.44% on 10/18/2027)1 | 2,007 | 2,075 | ||||||
Morgan Stanley 2.239% 7/21/2032 (USD-SOFR + 1.178% on 7/21/2031)1 | 26,412 | 20,326 | ||||||
Morgan Stanley 2.511% 10/20/2032 (USD-SOFR + 1.20% on 10/20/2031)1 | 2,813 | 2,209 | ||||||
Morgan Stanley 2.943% 1/21/2033 (USD-SOFR + 1.29% on 1/21/2032)1 | 6,616 | 5,369 | ||||||
Morgan Stanley 4.889% 7/20/2033 (USD-SOFR + 2.077% on 7/20/2032)1 | 3,375 | 3,181 | ||||||
Morgan Stanley 6.342% 10/18/2033 (USD-SOFR + 2.565% on 10/18/2032)1 | 3,810 | 4,004 | ||||||
Morgan Stanley 5.297% 4/20/2037 (USD-SOFR + 2.62% on 4/20/2032)1 | 2,286 | 2,096 | ||||||
MSCI, Inc. 3.25% 8/15/20332 | 2,750 | 2,128 | ||||||
Navient Corp. 6.75% 6/25/2025 | 425 | 409 | ||||||
OneMain Holdings, Inc. 7.125% 3/15/2026 | 250 | 238 | ||||||
Rede D’Or Finance SARL 4.50% 1/22/20302 | 1,572 | 1,355 | ||||||
Santander Holdings USA, Inc. 3.50% 6/7/2024 | 8,325 | 8,092 | ||||||
Santander Holdings USA, Inc. 2.49% 1/6/20281 | 3,625 | 3,115 | ||||||
State Street Corp. 4.164% 8/4/2033 (USD-SOFR + 1.726% on 8/4/2032)1 | 1,640 | 1,520 | ||||||
Sumitomo Mitsui Banking Corp. 2.174% 1/14/2027 | 1,100 | 977 | ||||||
SVB Financial Group 4.70% junior subordinated perpetual bonds (5-year UST Yield Curve Rate T Note Constant Maturity + 3.064% on 11/15/2031)1 | 1,530 | 971 | ||||||
Synchrony Financial 4.375% 3/19/2024 | 3,640 | 3,576 | ||||||
Toronto-Dominion Bank 1.95% 1/12/2027 | 1,060 | 946 | ||||||
Travelers Companies, Inc. 2.55% 4/27/2050 | 768 | 478 | ||||||
U.S. Bancorp 4.548% 7/22/2028 (USD-SOFR + 1.66% on 7/27/2027)1 | 2,440 | 2,387 | ||||||
UBS Group AG 1.494% 8/10/2027 (1-year UST Yield Curve Rate T Note Constant Maturity + 0.85% on 8/10/2026)1,2 | 4,000 | 3,446 | ||||||
UniCredit SpA 4.625% 4/12/20272 | 1,395 | 1,307 | ||||||
UniCredit SpA 5.861% 6/19/2032 (5-year USD-ICE Swap + 3.703% on 6/19/2027)1,2 | 16,130 | 14,182 | ||||||
Vigorous Champion International, Ltd. 4.25% 5/28/2029 | 462 | 415 | ||||||
Wells Fargo & Company 2.406% 10/30/2025 (3-month USD-LIBOR + 0.825% on 10/30/2024)1 | 20,480 | 19,382 | ||||||
Wells Fargo & Company 3.908% 4/25/2026 (USD-SOFR + 1.32% on 4/25/2025)1 | 3,524 | 3,428 | ||||||
Wells Fargo & Company 3.526% 3/24/2028 (USD-SOFR + 1.51% on 3/24/2027)1 | 9,236 | 8,569 | ||||||
Wells Fargo & Company 4.808% 7/25/2028 (USD-SOFR + 1.98% on 7/25/2027)1 | 7,450 | 7,289 | ||||||
Wells Fargo & Company 3.35% 3/2/2033 (USD-SOFR + 1.50% on 3/2/2032)1 | 7,665 | 6,478 | ||||||
Wells Fargo & Company 4.897% 7/25/2033 (USD-SOFR + 4.897% on 7/25/2032)1 | 3,675 | 3,500 | ||||||
Wells Fargo & Company 4.611% 4/25/2053 (USD-SOFR + 2.13% on 4/25/2052)1 | 20,666 | 17,607 | ||||||
Willis North America, Inc. 4.65% 6/15/2027 | 1,290 | 1,248 | ||||||
|
| |||||||
| 986,796 | ||||||||
|
| |||||||
Utilities 4.42% | ||||||||
AEP Texas, Inc. 3.45% 5/15/2051 | 1,475 | 1,048 | ||||||
Alabama Power Co. 3.00% 3/15/2052 | 3,697 | 2,458 | ||||||
Alfa Desarrollo SpA 4.55% 9/27/20512 | 1,001 | 763 | ||||||
Ameren Corp. 4.50% 3/15/2049 | 2,875 | 2,634 | ||||||
Baltimore Gas & Electric 4.55% 6/1/2052 | 525 | 467 | ||||||
Berkshire Hathaway Energy Company 4.50% 2/1/2045 | 5,895 | 5,161 | ||||||
Comisión Federal de Electricidad 4.688% 5/15/20292 | 3,655 | 3,249 | ||||||
Comisión Federal de Electricidad 3.875% 7/26/20332 | 1,340 | 1,019 | ||||||
Connecticut Light and Power Co. 2.05% 7/1/2031 | 1,775 | 1,430 | ||||||
Consumers Energy Co. 4.05% 5/15/2048 | 1,413 | 1,173 | ||||||
Consumers Energy Co. 3.75% 2/15/2050 | 5,625 | 4,416 | ||||||
Consumers Energy Co. 3.10% 8/15/2050 | 4,123 | 2,883 | ||||||
Consumers Energy Co. 3.50% 8/1/2051 | 235 | 178 | ||||||
Duke Energy Corp. 3.75% 4/15/2024 | 3,826 | 3,760 | ||||||
Duke Energy Corp. 4.50% 8/15/2032 | 7,811 | 7,340 | ||||||
Duke Energy Corp. 3.50% 6/15/2051 | 1,139 | 796 | ||||||
Duke Energy Florida, LLC 3.40% 10/1/2046 | 5,669 | 4,098 | ||||||
Duke Energy Florida, LLC 3.00% 12/15/2051 | 711 | 480 | ||||||
Duke Energy Florida, LLC 5.95% 11/15/2052 | 575 | 616 | ||||||
American Funds Insurance Series 179
Table of Contents
The Bond Fund of America (continued)
Bonds, notes & other debt instruments (continued)
Principal (000) | Value (000) | |||||||
Corporate bonds, notes & loans (continued) | ||||||||
Utilities (continued) | ||||||||
Duke Energy Progress, LLC 3.70% 9/1/2028 | USD | 3,750 | $ | 3,530 | ||||
Duke Energy Progress, LLC 2.00% 8/15/2031 | 1,775 | 1,407 | ||||||
Duke Energy Progress, LLC 2.50% 8/15/2050 | 644 | 389 | ||||||
Edison International 3.55% 11/15/2024 | 6,850 | 6,618 | ||||||
Edison International 4.95% 4/15/2025 | 175 | 172 | ||||||
Edison International 5.75% 6/15/2027 | 3,181 | 3,196 | ||||||
Edison International 4.125% 3/15/2028 | 3,644 | 3,387 | ||||||
Edison International 6.95% 11/15/2029 | 2,525 | 2,643 | ||||||
Electricité de France SA 2.625% junior subordinated perpetual bonds (5-year EUR Mid-Swap + 2.86% on 6/1/2028)1 | EUR | 2,800 | 2,346 | |||||
Emera US Finance, LP 0.833% 6/15/2024 | USD | 600 | 560 | |||||
Emera US Finance, LP 2.639% 6/15/2031 | 4,400 | 3,456 | ||||||
Enel Società per Azioni 8.75% 9/24/2073 | ||||||||
(USD Semi Annual 30/360 (vs. 3-month USD-LIBOR) + 5.88% on 9/24/2023)1,2 | 1,000 | 1,003 | ||||||
ENN Clean Energy International Investment, Ltd. 3.375% 5/12/20262 | 1,310 | 1,143 | ||||||
Entergy Louisiana, LLC 4.20% 9/1/2048 | 6,325 | 5,207 | ||||||
Entergy Louisiana, LLC 4.75% 9/15/2052 | 1,525 | 1,377 | ||||||
Eversource Energy 3.80% 12/1/2023 | 5,000 | 4,945 | ||||||
FirstEnergy Corp. 1.60% 1/15/2026 | 20,066 | 17,774 | ||||||
FirstEnergy Corp. 3.50% 4/1/20282 | 2,400 | 2,191 | ||||||
FirstEnergy Corp. 4.10% 5/15/20282 | 425 | 401 | ||||||
FirstEnergy Corp. 2.65% 3/1/2030 | 12,524 | 10,234 | ||||||
FirstEnergy Corp. 2.25% 9/1/2030 | 13,707 | 10,904 | ||||||
FirstEnergy Corp., Series B, 4.40% 7/15/2027 (4.15% on 1/15/2023)1 | 12,178 | 11,355 | ||||||
FirstEnergy Transmission, LLC 2.866% 9/15/20282 | 4,000 | 3,498 | ||||||
Florida Power & Light Company 2.45% 2/3/2032 | 4,890 | 4,087 | ||||||
Florida Power & Light Company 2.875% 12/4/2051 | 9,334 | 6,305 | ||||||
Georgia Power Co. 3.70% 1/30/2050 | 275 | 206 | ||||||
Interchile SA 4.50% 6/30/20562 | 465 | 385 | ||||||
Israel Electric Corp., Ltd. 4.25% 8/14/20282 | 10,190 | 9,649 | ||||||
Israel Electric Corp., Ltd. 3.75% 2/22/20322 | 340 | 299 | ||||||
ITC Holdings Corp. 3.35% 11/15/2027 | 1,118 | 1,031 | ||||||
Jersey Central Power & Light Co. 2.75% 3/1/20322 | 525 | 425 | ||||||
Mississippi Power Co. 4.25% 3/15/2042 | 5,020 | 4,093 | ||||||
Monongahela Power Co. 3.55% 5/15/20272 | 1,700 | 1,600 | ||||||
NextEra Energy Capital Holdings, Inc. 1.875% 1/15/2027 | 2,772 | 2,457 | ||||||
Northern States Power Co. 4.50% 6/1/2052 | 3,328 | 3,035 | ||||||
Oncor Electric Delivery Company, LLC 4.15% 6/1/20322 | 1,035 | 980 | ||||||
Oncor Electric Delivery Company, LLC 4.55% 9/15/20322 | 975 | 958 | ||||||
Pacific Gas and Electric Co. 3.25% 6/15/2023 | 5,615 | 5,554 | ||||||
Pacific Gas and Electric Co. 3.40% 8/15/2024 | 2,000 | 1,920 | ||||||
Pacific Gas and Electric Co. 3.15% 1/1/2026 | 27,543 | 25,623 | ||||||
Pacific Gas and Electric Co. 2.95% 3/1/2026 | 10,850 | 9,956 | ||||||
Pacific Gas and Electric Co. 3.30% 3/15/2027 | 5,850 | 5,212 | ||||||
Pacific Gas and Electric Co. 3.30% 12/1/2027 | 12,289 | 10,865 | ||||||
Pacific Gas and Electric Co. 3.75% 7/1/2028 | 13,075 | 11,621 | ||||||
Pacific Gas and Electric Co. 4.65% 8/1/2028 | 7,900 | 7,278 | ||||||
Pacific Gas and Electric Co. 4.55% 7/1/2030 | 35,299 | 32,078 | ||||||
Pacific Gas and Electric Co. 2.50% 2/1/2031 | 19,695 | 15,326 | ||||||
Pacific Gas and Electric Co. 3.25% 6/1/2031 | 1,300 | 1,060 | ||||||
Pacific Gas and Electric Co. 3.30% 8/1/2040 | 8,898 | 6,055 | ||||||
Pacific Gas and Electric Co. 3.75% 8/15/2042 | 9,466 | 6,383 | ||||||
Pacific Gas and Electric Co. 4.75% 2/15/2044 | 336 | 258 | ||||||
Pacific Gas and Electric Co. 3.50% 8/1/2050 | 6,836 | 4,272 | ||||||
Public Service Electric and Gas Co. 3.20% 5/15/2029 | 6,000 | 5,456 | ||||||
Public Service Electric and Gas Co. 1.90% 8/15/2031 | 775 | 618 | ||||||
Public Service Electric and Gas Co. 3.10% 3/15/2032 | 7,500 | 6,577 | ||||||
Puget Energy, Inc. 3.65% 5/15/2025 | 300 | 286 | ||||||
Southern California Edison Co. 4.20% 3/1/2029 | 11,000 | 10,485 | ||||||
Southern California Edison Co. 2.85% 8/1/2029 | 8,200 | 7,144 | ||||||
Southern California Edison Co. 2.50% 6/1/2031 | 5,149 | 4,256 | ||||||
180 American Funds Insurance Series
Table of Contents
The Bond Fund of America (continued)
Bonds, notes & other debt instruments (continued)
Principal (000) | Value (000) | |||||||
Corporate bonds, notes & loans (continued) | ||||||||
Utilities (continued) | ||||||||
Southern California Edison Co. 5.95% 11/1/2032 | USD | 1,100 | $ | 1,166 | ||||
Southern California Edison Co. 5.75% 4/1/2035 | 4,549 | 4,546 | ||||||
Southern California Edison Co. 5.35% 7/15/2035 | 6,450 | 6,267 | ||||||
Southern California Edison Co. 5.625% 2/1/2036 | 7,051 | 6,888 | ||||||
Southern California Edison Co. 5.55% 1/15/2037 | 3,844 | 3,774 | ||||||
Southern California Edison Co. 5.95% 2/1/2038 | 5,121 | 5,188 | ||||||
Southern California Edison Co. 4.00% 4/1/2047 | 9,402 | 7,391 | ||||||
Southern California Edison Co. 4.125% 3/1/2048 | 5,765 | 4,628 | ||||||
Southern California Edison Co. 4.875% 3/1/2049 | 555 | 491 | ||||||
Southern California Edison Co. 3.65% 2/1/2050 | 8,086 | 5,943 | ||||||
Southern California Edison Co., Series C, 3.60% 2/1/2045 | 2,717 | 1,960 | ||||||
Southwestern Electric Power Co. 1.65% 3/15/2026 | 3,550 | 3,179 | ||||||
Southwestern Electric Power Co. 3.25% 11/1/2051 | 2,270 | 1,502 | ||||||
Union Electric Co. 2.15% 3/15/2032 | 3,175 | 2,518 | ||||||
Virginia Electric and Power Co. 2.30% 11/15/2031 | 2,425 | 1,958 | ||||||
Virginia Electric and Power Co. 2.40% 3/30/2032 | 5,345 | 4,333 | ||||||
WEC Energy Group, Inc. 2.20% 12/15/2028 | 1,575 | 1,336 | ||||||
Wisconsin Electric Power Co. 2.85% 12/1/2051 | 375 | 241 | ||||||
Wisconsin Power and Light Co. 1.95% 9/16/2031 | 525 | 413 | ||||||
Wisconsin Power and Light Co. 3.65% 4/1/2050 | 1,075 | 793 | ||||||
Xcel Energy, Inc. 3.30% 6/1/2025 | 5,650 | 5,428 | ||||||
Xcel Energy, Inc. 1.75% 3/15/2027 | 5,660 | 4,966 | ||||||
Xcel Energy, Inc. 2.60% 12/1/2029 | 2,925 | 2,504 | ||||||
Xcel Energy, Inc. 2.35% 11/15/2031 | 9,059 | 7,263 | ||||||
Xcel Energy, Inc. 4.60% 6/1/2032 | 11,675 | 11,185 | ||||||
|
| |||||||
| 451,359 | ||||||||
|
| |||||||
Consumer discretionary 4.21% | ||||||||
Allied Universal Holdco, LLC 4.625% 6/1/20282 | 335 | 277 | ||||||
Amazon.com, Inc. 3.30% 4/13/2027 | 1,760 | 1,673 | ||||||
Amazon.com, Inc. 1.65% 5/12/2028 | 3,860 | 3,321 | ||||||
Amazon.com, Inc. 3.45% 4/13/2029 | 1,305 | 1,222 | ||||||
Amazon.com, Inc. 3.60% 4/13/2032 | 6,830 | 6,271 | ||||||
Amazon.com, Inc. 2.875% 5/12/2041 | 650 | 488 | ||||||
Amazon.com, Inc. 3.10% 5/12/2051 | 9,380 | 6,727 | ||||||
Amazon.com, Inc. 3.95% 4/13/2052 | 1,635 | 1,362 | ||||||
Amazon.com, Inc. 3.25% 5/12/2061 | 4,100 | 2,828 | ||||||
Amazon.com, Inc. 4.10% 4/13/2062 | 470 | 391 | ||||||
Atlas LuxCo 4 SARL 4.625% 6/1/20282 | 255 | 207 | ||||||
Bath & Body Works, Inc. 6.875% 11/1/2035 | 740 | 659 | ||||||
Bayerische Motoren Werke AG 1.25% 8/12/20262 | 100 | 88 | ||||||
Bayerische Motoren Werke AG 3.45% 4/1/20272 | 1,075 | 1,016 | ||||||
Bayerische Motoren Werke AG 1.95% 8/12/20312 | 620 | 486 | ||||||
Bayerische Motoren Werke AG 3.70% 4/1/20322 | 1,350 | 1,210 | ||||||
Daimler Trucks Finance North America, LLC 1.125% 12/14/20232 | 3,015 | 2,898 | ||||||
Daimler Trucks Finance North America, LLC 1.625% 12/13/20242 | 4,950 | 4,597 | ||||||
Daimler Trucks Finance North America, LLC 3.50% 4/7/20252 | 1,750 | 1,680 | ||||||
Daimler Trucks Finance North America, LLC 3.65% 4/7/20272 | 4,140 | 3,875 | ||||||
Daimler Trucks Finance North America, LLC 2.375% 12/14/20282 | 3,975 | 3,348 | ||||||
Daimler Trucks Finance North America, LLC 2.50% 12/14/20312 | 9,625 | 7,486 | ||||||
DaimlerChrysler North America Holding Corp. 3.35% 2/22/20232 | 2,000 | 1,993 | ||||||
DaimlerChrysler North America Holding Corp. 1.75% 3/10/20232 | 8,000 | 7,953 | ||||||
Ford Motor Co. 2.90% 2/10/2029 | 1,065 | 852 | ||||||
Ford Motor Credit Company, LLC 5.125% 6/16/2025 | 3,870 | 3,729 | ||||||
Ford Motor Credit Company, LLC 4.271% 1/9/2027 | 18,542 | 16,803 | ||||||
Ford Motor Credit Company, LLC 4.125% 8/17/2027 | 39,080 | 35,066 | ||||||
Ford Motor Credit Company, LLC 3.815% 11/2/2027 | 3,790 | 3,337 | ||||||
Ford Motor Credit Company, LLC 7.35% 11/4/2027 | 6,289 | 6,460 | ||||||
Ford Motor Credit Company, LLC 5.113% 5/3/2029 | 4,205 | 3,817 | ||||||
General Motors Company 4.35% 4/9/2025 | 11,358 | 11,059 | ||||||
American Funds Insurance Series 181
Table of Contents
The Bond Fund of America (continued)
Bonds, notes & other debt instruments (continued)
Principal (000) | Value (000) | |||||||
Corporate bonds, notes & loans (continued) | ||||||||
Consumer discretionary (continued) | ||||||||
General Motors Company 6.125% 10/1/2025 | USD | 23,743 | $ | 24,188 | ||||
General Motors Company 5.40% 10/15/2029 | 781 | 747 | ||||||
General Motors Company 5.40% 4/1/2048 | 7,200 | 5,915 | ||||||
General Motors Financial Co. 3.25% 1/5/2023 | 964 | 964 | ||||||
General Motors Financial Co. 1.05% 3/8/2024 | 4,200 | 3,990 | ||||||
General Motors Financial Co. 1.50% 6/10/2026 | 6,712 | 5,837 | ||||||
General Motors Financial Co. 2.35% 2/26/2027 | 9,771 | 8,547 | ||||||
General Motors Financial Co. 2.40% 4/10/2028 | 13,909 | 11,722 | ||||||
General Motors Financial Co. 2.40% 10/15/2028 | 464 | 386 | ||||||
General Motors Financial Co. 3.60% 6/21/2030 | 465 | 392 | ||||||
General Motors Financial Co. 2.35% 1/8/2031 | 6,075 | 4,594 | ||||||
General Motors Financial Co. 2.70% 6/10/2031 | 5,495 | 4,223 | ||||||
Grand Canyon University 4.125% 10/1/2024 | 4,190 | 3,941 | ||||||
Home Depot, Inc. 2.95% 6/15/2029 | 6,081 | 5,515 | ||||||
Home Depot, Inc. 4.50% 12/6/2048 | 1,915 | 1,747 | ||||||
Hyundai Capital America 2.375% 2/10/20232 | 9,977 | 9,955 | ||||||
Hyundai Capital America 1.25% 9/18/20232 | 3,150 | 3,054 | ||||||
Hyundai Capital America 0.875% 6/14/20242 | 380 | 355 | ||||||
Hyundai Capital America 3.40% 6/20/20242 | 8,180 | 7,899 | ||||||
Hyundai Capital America 1.00% 9/17/20242 | 2,750 | 2,543 | ||||||
Hyundai Capital America 2.65% 2/10/20252 | 12,372 | 11,645 | ||||||
Hyundai Capital America 1.80% 10/15/20252 | 13,274 | 11,952 | ||||||
Hyundai Capital America 1.30% 1/8/20262 | 6,000 | 5,254 | ||||||
Hyundai Capital America 1.50% 6/15/20262 | 7,475 | 6,485 | ||||||
Hyundai Capital America 1.65% 9/17/20262 | 7,275 | 6,403 | ||||||
Hyundai Capital America 3.00% 2/10/20272 | 9,000 | 8,090 | ||||||
Hyundai Capital America 2.375% 10/15/20272 | 7,543 | 6,465 | ||||||
Hyundai Capital America 1.80% 1/10/20282 | 5,965 | 4,901 | ||||||
Hyundai Capital America 2.00% 6/15/20282 | 5,775 | 4,714 | ||||||
Hyundai Capital America 2.10% 9/15/20282 | 3,010 | 2,476 | ||||||
Hyundai Capital Services, Inc. 1.25% 2/8/20262 | 3,695 | 3,213 | ||||||
KIA Corp. 2.375% 2/14/20252 | 1,580 | 1,467 | ||||||
Marriott International, Inc. 5.75% 5/1/2025 | 330 | 333 | ||||||
Marriott International, Inc. 3.125% 6/15/2026 | 410 | 384 | ||||||
Marriott International, Inc. 5.00% 10/15/2027 | 4,470 | 4,418 | ||||||
Marriott International, Inc. 2.75% 10/15/2033 | 2,226 | 1,705 | ||||||
McDonald’s Corp. 2.125% 3/1/2030 | 2,482 | 2,082 | ||||||
McDonald’s Corp. 4.60% 9/9/2032 | 1,765 | 1,731 | ||||||
McDonald’s Corp. 4.45% 3/1/2047 | 3,535 | 3,082 | ||||||
McDonald’s Corp. 3.625% 9/1/2049 | 2,938 | 2,224 | ||||||
McDonald’s Corp. 5.15% 9/9/2052 | 730 | 704 | ||||||
Meituan Dianping 3.05% 10/28/20302 | 3,200 | 2,471 | ||||||
Nissan Motor Co., Ltd. 3.043% 9/15/20232 | 240 | 235 | ||||||
Nissan Motor Co., Ltd. 3.522% 9/17/20252 | 800 | 744 | ||||||
Nissan Motor Co., Ltd. 2.00% 3/9/20262 | 12,000 | 10,333 | ||||||
Nissan Motor Co., Ltd. 2.75% 3/9/20282 | 11,200 | 9,089 | ||||||
Nissan Motor Co., Ltd. 4.81% 9/17/20302 | 16,083 | 13,685 | ||||||
Sands China, Ltd. 2.80% 3/8/20271 | 2,368 | 2,031 | ||||||
Starbucks Corp. 3.75% 12/1/2047 | 3,785 | 2,891 | ||||||
Stellantis Finance US, Inc. 1.711% 1/29/20272 | 6,921 | 5,948 | ||||||
Stellantis Finance US, Inc. 5.625% 1/12/20282 | 825 | 818 | ||||||
Stellantis Finance US, Inc. 2.691% 9/15/20312 | 6,554 | 5,016 | ||||||
Stellantis Finance US, Inc. 6.375% 9/12/20322 | 12,065 | 11,946 | ||||||
Toyota Motor Credit Corp. 3.375% 4/1/2030 | 4,954 | 4,505 | ||||||
Volkswagen Group of America Finance, LLC 4.25% 11/13/20232 | 15,000 | 14,858 | ||||||
Volkswagen Group of America Finance, LLC 2.85% 9/26/20242 | 546 | 523 | ||||||
Volkswagen Group of America Finance, LLC 3.35% 5/13/20252 | 2,636 | 2,520 | ||||||
182 American Funds Insurance Series
Table of Contents
The Bond Fund of America (continued)
Bonds, notes & other debt instruments (continued)
Principal (000) | Value (000) | |||||||
Corporate bonds, notes & loans (continued) | ||||||||
Consumer discretionary (continued) | ||||||||
Volkswagen Group of America Finance, LLC 1.625% 11/24/20272 | USD | 2,550 | $ | 2,139 | ||||
Wyndham Destinations, Inc. 6.625% 7/31/20262 | 675 | 662 | ||||||
Wynn Resorts Finance, LLC 5.125% 10/1/20292 | 410 | 352 | ||||||
|
| |||||||
| 430,187 | ||||||||
|
| |||||||
Health care 3.84% | ||||||||
AbbVie, Inc. 3.20% 11/21/2029 | 8,482 | 7,666 | ||||||
AbbVie, Inc. 4.25% 11/21/2049 | 8 | 7 | ||||||
Amgen, Inc. 3.00% 2/22/2029 | 325 | 288 | ||||||
Amgen, Inc. 4.05% 8/18/2029 | 8,400 | 7,869 | ||||||
Amgen, Inc. 2.45% 2/21/2030 | 5,131 | 4,329 | ||||||
Amgen, Inc. 4.20% 3/1/2033 | 9,522 | 8,839 | ||||||
Amgen, Inc. 4.875% 3/1/2053 | 4,975 | 4,440 | ||||||
Amgen, Inc. 4.40% 2/22/2062 | 196 | 156 | ||||||
Anthem, Inc. 2.375% 1/15/2025 | 1,534 | 1,457 | ||||||
Anthem, Inc. 4.10% 5/15/2032 | 8,711 | 8,128 | ||||||
Anthem, Inc. 4.55% 5/15/2052 | 1,721 | 1,504 | ||||||
AstraZeneca Finance, LLC 1.75% 5/28/2028 | 1,429 | 1,229 | ||||||
AstraZeneca Finance, LLC 2.25% 5/28/2031 | 2,087 | 1,741 | ||||||
AstraZeneca PLC 4.00% 1/17/2029 | 5,920 | 5,694 | ||||||
Bausch Health Companies, Inc. 4.875% 6/1/20282 | 830 | 529 | ||||||
Baxter International, Inc. 2.539% 2/1/2032 | 3,906 | 3,113 | ||||||
Bayer US Finance II, LLC 4.25% 12/15/20252 | 17,570 | 17,043 | ||||||
Becton, Dickinson and Company 4.298% 8/22/2032 | 545 | 512 | ||||||
Centene Corp. 4.25% 12/15/2027 | 14,860 | 13,969 | ||||||
Centene Corp. 2.45% 7/15/2028 | 12,410 | 10,499 | ||||||
Centene Corp. 4.625% 12/15/2029 | 14,945 | 13,691 | ||||||
Centene Corp. 3.375% 2/15/2030 | 15,718 | 13,323 | ||||||
Centene Corp. 2.50% 3/1/2031 | 8,550 | 6,707 | ||||||
Centene Corp. 2.625% 8/1/2031 | 2,510 | 1,977 | ||||||
Danaher Corp. 2.80% 12/10/2051 | 1,090 | 725 | ||||||
Eli Lilly and Company 3.375% 3/15/2029 | 1,255 | 1,177 | ||||||
GE Healthcare Holding, LLC 5.65% 11/15/20272 | 4,895 | 4,961 | ||||||
GE Healthcare Holding, LLC 5.857% 3/15/20302 | 1,145 | 1,175 | ||||||
GE Healthcare Holding, LLC 5.905% 11/22/20322 | 8,640 | 8,980 | ||||||
GE Healthcare Holding, LLC 6.377% 11/22/20522 | 375 | 401 | ||||||
Gilead Sciences, Inc. 1.65% 10/1/2030 | 1,570 | 1,249 | ||||||
HCA, Inc. 3.125% 3/15/20272 | 755 | 688 | ||||||
HCA, Inc. 2.375% 7/15/2031 | 2,318 | 1,810 | ||||||
HCA, Inc. 3.625% 3/15/20322 | 5,000 | 4,244 | ||||||
HCA, Inc. 4.625% 3/15/20522 | 390 | 305 | ||||||
Johnson & Johnson 0.95% 9/1/2027 | 12,753 | 11,001 | ||||||
Johnson & Johnson 2.10% 9/1/2040 | 825 | 571 | ||||||
Johnson & Johnson 2.25% 9/1/2050 | 1,933 | 1,205 | ||||||
Laboratory Corporation of America Holdings 1.55% 6/1/2026 | 1,058 | 938 | ||||||
Laboratory Corporation of America Holdings 4.70% 2/1/2045 | 4,160 | 3,584 | ||||||
Merck & Co., Inc. 1.70% 6/10/2027 | 3,093 | 2,747 | ||||||
Merck & Co., Inc. 2.75% 12/10/2051 | 808 | 544 | ||||||
Regeneron Pharmaceuticals, Inc. 1.75% 9/15/2030 | 1,918 | 1,486 | ||||||
Roche Holdings, Inc. 1.93% 12/13/20282 | 7,845 | 6,720 | ||||||
Roche Holdings, Inc. 2.076% 12/13/20312 | 12,562 | 10,254 | ||||||
Roche Holdings, Inc. 2.607% 12/13/20512 | 645 | 421 | ||||||
Shire PLC 3.20% 9/23/2026 | 13,588 | 12,762 | ||||||
Teva Pharmaceutical Finance Co. BV 7.125% 1/31/2025 | 45,000 | 44,821 | ||||||
Teva Pharmaceutical Finance Co. BV 3.15% 10/1/2026 | 68,853 | 60,352 | ||||||
Teva Pharmaceutical Finance Co. BV 6.75% 3/1/2028 | 26,824 | 26,215 | ||||||
Teva Pharmaceutical Finance Co. BV 4.10% 10/1/2046 | 46,666 | 28,634 | ||||||
UnitedHealth Group, Inc. 3.75% 7/15/2025 | 5,410 | 5,294 | ||||||
UnitedHealth Group, Inc. 3.70% 5/15/2027 | 1,184 | 1,147 | ||||||
UnitedHealth Group, Inc. 4.00% 5/15/2029 | 2,231 | 2,136 | ||||||
American Funds Insurance Series 183
Table of Contents
The Bond Fund of America (continued)
Bonds, notes & other debt instruments (continued)
| Principal amount | Value | |||||||
| (000) | (000) | |||||||
Corporate bonds, notes & loans (continued) | ||||||||
Health care (continued) | ||||||||
UnitedHealth Group, Inc. 2.00% 5/15/2030 | USD | 855 | $ | 707 | ||||
UnitedHealth Group, Inc. 4.20% 5/15/2032 | 3,169 | 3,018 | ||||||
UnitedHealth Group, Inc. 3.05% 5/15/2041 | 1,300 | 982 | ||||||
UnitedHealth Group, Inc. 4.25% 6/15/2048 | 960 | 834 | ||||||
UnitedHealth Group, Inc. 3.25% 5/15/2051 | 927 | 668 | ||||||
UnitedHealth Group, Inc. 4.75% 5/15/2052 | 1,400 | 1,300 | ||||||
UnitedHealth Group, Inc. 4.95% 5/15/2062 | 294 | 277 | ||||||
UnitedHealth Group, Inc. 6.05% 2/15/2063 | 230 | 251 | ||||||
Zoetis, Inc. 5.60% 11/16/2032 | 2,850 | 2,964 | ||||||
|
| |||||||
| 392,258 | ||||||||
|
| |||||||
Communication services 3.31% | ||||||||
AT&T, Inc. 1.70% 3/25/2026 | 19,000 | 17,145 | ||||||
AT&T, Inc. 1.65% 2/1/2028 | 4,700 | 3,977 | ||||||
AT&T, Inc. 4.30% 2/15/2030 | 15,940 | 15,047 | ||||||
AT&T, Inc. 2.55% 12/1/2033 | 15,003 | 11,574 | ||||||
AT&T, Inc. 3.50% 9/15/2053 | 19,935 | 13,545 | ||||||
CCO Holdings, LLC 4.75% 2/1/20322 | 1,265 | 1,028 | ||||||
CCO Holdings, LLC 4.25% 1/15/20342 | 3,875 | 2,867 | ||||||
CCO Holdings, LLC and CCO Holdings Capital Corp. 5.125% 5/1/20272 | 4,800 | 4,484 | ||||||
CCO Holdings, LLC and CCO Holdings Capital Corp. 2.25% 1/15/2029 | 1,351 | 1,090 | ||||||
CCO Holdings, LLC and CCO Holdings Capital Corp. 2.80% 4/1/2031 | 8,212 | 6,412 | ||||||
CCO Holdings, LLC and CCO Holdings Capital Corp. 4.40% 4/1/2033 | 2,642 | 2,268 | ||||||
CCO Holdings, LLC and CCO Holdings Capital Corp. 5.75% 4/1/2048 | 5,000 | 4,114 | ||||||
CCO Holdings, LLC and CCO Holdings Capital Corp. 5.25% 4/1/2053 | 1,240 | 962 | ||||||
CenturyLink, Inc. 4.00% 2/15/20272 | 10,381 | 8,821 | ||||||
Comcast Corp. 3.15% 2/15/2028 | 7,200 | 6,660 | ||||||
Comcast Corp. 4.00% 3/1/2048 | 5,000 | 4,033 | ||||||
Meta Platforms, Inc. 4.45% 8/15/2052 | 3,775 | 3,019 | ||||||
Netflix, Inc. 4.875% 4/15/2028 | 23,259 | 22,511 | ||||||
Netflix, Inc. 5.875% 11/15/2028 | 29,196 | 29,664 | ||||||
Netflix, Inc. 6.375% 5/15/2029 | 5,078 | 5,235 | ||||||
Netflix, Inc. 5.375% 11/15/20292 | 15,350 | 14,917 | ||||||
Netflix, Inc. 4.875% 6/15/20302 | 18,215 | 17,018 | ||||||
News Corp. 5.125% 2/15/20322 | 1,300 | 1,185 | ||||||
SBA Tower Trust 1.631% 11/15/20262 | 6,741 | 5,735 | ||||||
Sirius XM Radio, Inc. 4.00% 7/15/20282 | 675 | 589 | ||||||
Sprint Corp. 7.625% 2/15/2025 | 6,665 | 6,895 | ||||||
Tencent Holdings, Ltd. 2.39% 6/3/20302 | 10,000 | 8,153 | ||||||
T-Mobile US, Inc. 3.50% 4/15/2025 | 3,275 | 3,152 | ||||||
T-Mobile US, Inc. 2.25% 2/15/2026 | 2,388 | 2,177 | ||||||
T-Mobile US, Inc. 2.625% 4/15/2026 | 9,691 | 8,899 | ||||||
T-Mobile US, Inc. 3.75% 4/15/2027 | 5,000 | 4,717 | ||||||
T-Mobile US, Inc. 2.625% 2/15/2029 | 3,117 | 2,643 | ||||||
T-Mobile US, Inc. 2.40% 3/15/2029 | 1,224 | 1,035 | ||||||
T-Mobile US, Inc. 3.875% 4/15/2030 | 4,500 | 4,087 | ||||||
T-Mobile US, Inc. 2.875% 2/15/2031 | 17,956 | 14,862 | ||||||
T-Mobile US, Inc. 3.00% 2/15/2041 | 2,100 | 1,490 | ||||||
T-Mobile US, Inc. 3.40% 10/15/2052 | 12,280 | 8,307 | ||||||
Verizon Communications, Inc. 4.329% 9/21/2028 | 1,539 | 1,483 | ||||||
Verizon Communications, Inc. 1.75% 1/20/2031 | 15,450 | 12,023 | ||||||
Verizon Communications, Inc. 2.55% 3/21/2031 | 7,535 | 6,215 | ||||||
Verizon Communications, Inc. 2.355% 3/15/2032 | 2,815 | 2,239 | ||||||
Verizon Communications, Inc. 3.40% 3/22/2041 | 2,050 | 1,549 | ||||||
Verizon Communications, Inc. 2.875% 11/20/2050 | 3,000 | 1,894 | ||||||
Verizon Communications, Inc. 3.55% 3/22/2051 | 1,975 | 1,416 | ||||||
Verizon Communications, Inc. 3.875% 3/1/2052 | 3,155 | 2,408 | ||||||
Vodafone Group PLC 4.25% 9/17/2050 | 3,050 | 2,340 | ||||||
WarnerMedia Holdings, Inc. 3.428% 3/15/20242 | 6,552 | 6,364 | ||||||
WarnerMedia Holdings, Inc. 3.638% 3/15/20252 | 3,056 | 2,909 | ||||||
184 American Funds Insurance Series
Table of Contents
The Bond Fund of America (continued)
Bonds, notes & other debt instruments (continued)
| Principal amount | Value | |||||||
| (000) | (000) | |||||||
Corporate bonds, notes & loans (continued) | ||||||||
Communication services (continued) | ||||||||
WarnerMedia Holdings, Inc. 3.755% 3/15/20272 | USD | 9,501 | $ | 8,569 | ||||
WarnerMedia Holdings, Inc. 4.054% 3/15/20292 | 1,316 | 1,141 | ||||||
WarnerMedia Holdings, Inc. 4.279% 3/15/20322 | 4,932 | 4,075 | ||||||
WarnerMedia Holdings, Inc. 5.05% 3/15/20422 | 3,147 | 2,419 | ||||||
WarnerMedia Holdings, Inc. 5.141% 3/15/20522 | 10,630 | 7,769 | ||||||
WarnerMedia Holdings, Inc. 5.391% 3/15/20622 | 2,802 | 2,057 | ||||||
ZipRecruiter, Inc. 5.00% 1/15/20302 | 1,500 | 1,239 | ||||||
|
| |||||||
| 338,426 | ||||||||
|
| |||||||
Industrials 3.13% | ||||||||
ADT Security Corp. 4.125% 8/1/20292 | 510 | 434 | ||||||
Air Lease Corp. 0.80% 8/18/2024 | 3,175 | 2,926 | ||||||
Air Lease Corp. 2.875% 1/15/2026 | 10,172 | 9,423 | ||||||
Air Lease Corp. 2.20% 1/15/2027 | 4,341 | 3,789 | ||||||
Air Lease Corp. 2.10% 9/1/2028 | 2,450 | 2,000 | ||||||
Avolon Holdings Funding, Ltd. 3.95% 7/1/20242 | 12,514 | 11,987 | ||||||
Avolon Holdings Funding, Ltd. 2.125% 2/21/20262 | 8,333 | 7,181 | ||||||
Avolon Holdings Funding, Ltd. 4.25% 4/15/20262 | 3,302 | 2,997 | ||||||
Avolon Holdings Funding, Ltd. 3.25% 2/15/20272 | 8,000 | 6,857 | ||||||
Avolon Holdings Funding, Ltd. 2.528% 11/18/20272 | 2,142 | 1,715 | ||||||
BNSF Funding Trust I, junior subordinated, 6.613% 12/15/2055 (3-month USD-LIBOR + 2.35% on 1/15/2026)1 | 1,680 | 1,590 | ||||||
Boeing Company 4.508% 5/1/2023 | 11,358 | 11,338 | ||||||
Boeing Company 1.95% 2/1/2024 | 5,646 | 5,441 | ||||||
Boeing Company 2.80% 3/1/2024 | 500 | 485 | ||||||
Boeing Company 4.875% 5/1/2025 | 32,512 | 32,292 | ||||||
Boeing Company 2.75% 2/1/2026 | 18,384 | 17,057 | ||||||
Boeing Company 2.196% 2/4/2026 | 18,411 | 16,748 | ||||||
Boeing Company 3.10% 5/1/2026 | 649 | 611 | ||||||
Boeing Company 2.70% 2/1/2027 | 6,473 | 5,852 | ||||||
Boeing Company 5.04% 5/1/2027 | 14,350 | 14,215 | ||||||
Boeing Company 3.25% 2/1/2028 | 11,379 | 10,353 | ||||||
Boeing Company 3.25% 3/1/2028 | 1,925 | 1,724 | ||||||
Boeing Company 5.15% 5/1/2030 | 42,874 | 41,935 | ||||||
Boeing Company 3.625% 2/1/2031 | 1,602 | 1,408 | ||||||
Boeing Company 3.90% 5/1/2049 | 1,411 | 997 | ||||||
Boeing Company 5.805% 5/1/2050 | 4,122 | 3,843 | ||||||
Canadian Pacific Railway, Ltd. 1.75% 12/2/2026 | 1,982 | 1,769 | ||||||
Canadian Pacific Railway, Ltd. 2.45% 12/2/2031 | 3,131 | 2,602 | ||||||
Canadian Pacific Railway, Ltd. 3.00% 12/2/2041 | 1,677 | 1,271 | ||||||
Canadian Pacific Railway, Ltd. 3.10% 12/2/2051 | 3,111 | 2,106 | ||||||
Carrier Global Corp. 3.377% 4/5/2040 | 15,000 | 11,443 | ||||||
CSX Corp. 4.10% 11/15/2032 | 8,010 | 7,534 | ||||||
CSX Corp. 4.50% 11/15/2052 | 6,670 | 5,828 | ||||||
Dun & Bradstreet Corp. 5.00% 12/15/20292 | 2,798 | 2,398 | ||||||
Eaton Corp. 4.15% 3/15/2033 | 1,518 | 1,416 | ||||||
Eaton Corp. 4.70% 8/23/2052 | 535 | 487 | ||||||
General Dynamics Corp. 3.625% 4/1/2030 | 675 | 629 | ||||||
Mexico City Airport Trust 5.50% 10/31/2046 | 1,959 | 1,512 | ||||||
Mexico City Airport Trust 5.50% 7/31/2047 | 5,909 | 4,564 | ||||||
Mexico City Airport Trust 5.50% 7/31/20472 | 1,132 | 874 | ||||||
MISC Capital Two (Labuan), Ltd. 3.75% 4/6/20272 | 2,690 | 2,441 | ||||||
Norfolk Southern Corp. 4.55% 6/1/2053 | 1,188 | 1,039 | ||||||
Northrop Grumman Corp. 3.25% 1/15/2028 | 10,845 | 10,021 | ||||||
Raytheon Technologies Corp. 1.90% 9/1/2031 | 3,087 | 2,431 | ||||||
Raytheon Technologies Corp. 2.375% 3/15/2032 | 1,321 | 1,073 | ||||||
Raytheon Technologies Corp. 2.82% 9/1/2051 | 665 | 434 | ||||||
Raytheon Technologies Corp. 3.03% 3/15/2052 | 1,190 | 812 | ||||||
Republic Services, Inc. 2.375% 3/15/2033 | 1,635 | 1,309 | ||||||
Spirit AeroSystems, Inc. 9.375% 11/30/20292 | 503 | 530 | ||||||
American Funds Insurance Series 185
Table of Contents
The Bond Fund of America (continued)
Bonds, notes & other debt instruments (continued)
| Principal amount | Value | |||||||
| (000) | (000) | |||||||
Corporate bonds, notes & loans (continued) | ||||||||
Industrials (continued) | ||||||||
Summit Digitel Infrastructure Private, Ltd. 2.875% 8/12/20312 | USD | 2,550 | $ | 1,962 | ||||
Triton Container International, Ltd. 1.15% 6/7/20242 | 1,609 | 1,489 | ||||||
Triton Container International, Ltd. 3.15% 6/15/20312 | 2,482 | 1,934 | ||||||
Union Pacific Corp. 2.15% 2/5/2027 | 2,213 | 2,002 | ||||||
Union Pacific Corp. 2.40% 2/5/2030 | 4,454 | 3,820 | ||||||
Union Pacific Corp. 2.375% 5/20/2031 | 3,938 | 3,326 | ||||||
Union Pacific Corp. 2.80% 2/14/2032 | 6,734 | 5,832 | ||||||
Union Pacific Corp. 3.375% 2/14/2042 | 530 | 424 | ||||||
Union Pacific Corp. 3.25% 2/5/2050 | 7,000 | 5,078 | ||||||
Union Pacific Corp. 2.95% 3/10/2052 | 1,405 | 957 | ||||||
United Rentals, Inc. 5.50% 5/15/2027 | 2,500 | 2,472 | ||||||
United Technologies Corp. 3.125% 5/4/2027 | 4,551 | 4,245 | ||||||
United Technologies Corp. 4.125% 11/16/2028 | 4,974 | 4,771 | ||||||
Waste Management, Inc. 4.15% 4/15/2032 | 2,155 | 2,057 | ||||||
|
| |||||||
| 320,090 | ||||||||
|
| |||||||
Energy 2.54% | ||||||||
Antero Resources Corp. 5.375% 3/1/20302 | 280 | 260 | ||||||
Apache Corp. 4.625% 11/15/2025 | 645 | 624 | ||||||
Apache Corp. 4.25% 1/15/2030 | 2,465 | 2,186 | ||||||
Apache Corp. 5.35% 7/1/2049 | 800 | 648 | ||||||
Baker Hughes Holdings, LLC 2.061% 12/15/2026 | 1,136 | 1,020 | ||||||
Canadian Natural Resources, Ltd. 2.05% 7/15/2025 | 754 | 702 | ||||||
Canadian Natural Resources, Ltd. 3.85% 6/1/2027 | 1,151 | 1,086 | ||||||
Cenovus Energy, Inc. 5.375% 7/15/2025 | 2,763 | 2,756 | ||||||
Cenovus Energy, Inc. 4.25% 4/15/2027 | 13,613 | 13,032 | ||||||
Cenovus Energy, Inc. 2.65% 1/15/2032 | 2,969 | 2,378 | ||||||
Cenovus Energy, Inc. 5.25% 6/15/2037 | 770 | 704 | ||||||
Cenovus Energy, Inc. 5.40% 6/15/2047 | 14,816 | 13,323 | ||||||
Cheniere Energy Partners, LP 3.25% 1/31/2032 | 937 | 746 | ||||||
Chevron Corp. 2.954% 5/16/2026 | 3,365 | 3,196 | ||||||
Chevron Corp. 3.078% 5/11/2050 | 692 | 500 | ||||||
Devon Energy Corp. 4.50% 1/15/2030 | 5,197 | 4,850 | ||||||
DT Midstream, Inc. 4.125% 6/15/20292 | 555 | 478 | ||||||
Ecopetrol SA 5.875% 5/28/2045 | 452 | 316 | ||||||
Enbridge, Inc. 4.00% 10/1/2023 | 1,500 | 1,488 | ||||||
Energy Transfer Partners, LP 6.25% junior subordinated perpetual bonds (3-month USD-LIBOR + 4.028% on 2/15/2023)1 | 7,850 | 6,682 | ||||||
Energy Transfer Partners, LP 6.625% junior subordinated perpetual bonds (3-month USD-LIBOR + 4.155% on 2/15/2049)1 | 500 | 373 | ||||||
EQT Corp. 5.70% 4/1/2028 | 1,223 | 1,218 | ||||||
EQT Corp. 7.25% 2/1/20301 | 7,500 | 7,791 | ||||||
Equinor ASA 3.625% 9/10/2028 | 4,928 | 4,673 | ||||||
Equinor ASA 3.125% 4/6/2030 | 20,000 | 18,004 | ||||||
Equinor ASA 3.25% 11/18/2049 | 5,687 | 4,159 | ||||||
Exxon Mobil Corp. 3.043% 3/1/2026 | 4,625 | 4,417 | ||||||
Exxon Mobil Corp. 2.61% 10/15/2030 | 1,040 | 911 | ||||||
Occidental Petroleum Corp. 8.875% 7/15/2030 | 630 | 712 | ||||||
Odebrecht Drilling Norbe 7.35% PIK 12/1/20262,4 | 40 | 22 | ||||||
Odebrecht Drilling Norbe 0% perpetual bonds2 | 1,150 | 3 | ||||||
Oleoducto Central SA 4.00% 7/14/20272 | 1,715 | 1,516 | ||||||
Oleoducto Central SA 4.00% 7/14/2027 | 350 | 309 | ||||||
Petróleos Mexicanos 3.50% 1/30/2023 | 1,500 | 1,496 | ||||||
Petróleos Mexicanos 6.875% 10/16/2025 | 5,000 | 4,903 | ||||||
Petróleos Mexicanos 6.875% 8/4/2026 | 24,876 | 23,550 | ||||||
Petróleos Mexicanos 6.49% 1/23/2027 | 20,653 | 18,867 | ||||||
Petróleos Mexicanos 6.50% 3/13/2027 | 31,829 | 29,102 | ||||||
Petróleos Mexicanos 6.50% 1/23/2029 | 3,139 | 2,694 | ||||||
Petróleos Mexicanos 8.75% 6/2/2029 | 5,805 | 5,451 | ||||||
Petróleos Mexicanos 6.70% 2/16/2032 | 14,854 | 11,693 | ||||||
186 American Funds Insurance Series
Table of Contents
The Bond Fund of America (continued)
Bonds, notes & other debt instruments (continued)
| Principal amount | Value | |||||||
| (000) | (000) | |||||||
Corporate bonds, notes & loans (continued) | ||||||||
Energy (continued) | ||||||||
Qatar Petroleum 2.25% 7/12/20312 | USD | 22,020 | $ | 18,281 | ||||
Qatar Petroleum 3.125% 7/12/20412 | 7,310 | 5,644 | ||||||
Qatar Petroleum 3.30% 7/12/20512 | 2,185 | 1,619 | ||||||
SA Global Sukuk, Ltd. 1.602% 6/17/20262 | 7,645 | 6,842 | ||||||
Sabine Pass Liquefaction, LLC 5.75% 5/15/2024 | 5,148 | 5,152 | ||||||
Shell International Finance BV 3.875% 11/13/2028 | 9,410 | 9,081 | ||||||
Shell International Finance BV 2.75% 4/6/2030 | 1,186 | 1,043 | ||||||
Southwestern Energy Co. 5.95% 1/23/20251 | 495 | 487 | ||||||
Total Capital Canada, Ltd. 2.75% 7/15/2023 | 2,140 | 2,113 | ||||||
Total Capital International 3.455% 2/19/2029 | 885 | 822 | ||||||
TransCanada PipeLines, Ltd. 4.10% 4/15/2030 | 1,578 | 1,449 | ||||||
Western Midstream Operating, LP 3.35% 2/1/20251 | 2,782 | 2,637 | ||||||
Western Midstream Operating, LP 4.30% 2/1/20301 | 2,202 | 1,927 | ||||||
Western Midstream Operating, LP 5.50% 2/1/20501 | 3,079 | 2,542 | ||||||
Williams Partners, LP 4.50% 11/15/2023 | 500 | 497 | ||||||
Williams Partners, LP 4.30% 3/4/2024 | 595 | 588 | ||||||
|
| |||||||
| 259,563 | ||||||||
|
| |||||||
Consumer staples 1.83% | ||||||||
7-Eleven, Inc. 1.80% 2/10/20312 | 4,676 | 3,582 | ||||||
7-Eleven, Inc. 2.80% 2/10/20512 | 5,000 | 3,082 | ||||||
Altria Group, Inc. 4.40% 2/14/2026 | 4,585 | 4,494 | ||||||
Altria Group, Inc. 4.50% 5/2/2043 | 1,585 | 1,196 | ||||||
Altria Group, Inc. 5.95% 2/14/2049 | 8,434 | 7,539 | ||||||
Anheuser-Busch InBev NV 4.75% 1/23/2029 | 7,500 | 7,419 | ||||||
Anheuser-Busch InBev NV 5.55% 1/23/2049 | 5,000 | 4,971 | ||||||
Anheuser-Busch InBev NV 4.50% 6/1/2050 | 1,355 | 1,192 | ||||||
British American Tobacco International Finance PLC 3.95% 6/15/20252 | 16,879 | 16,226 | ||||||
British American Tobacco International Finance PLC 1.668% 3/25/2026 | 4,070 | 3,611 | ||||||
British American Tobacco PLC 3.557% 8/15/2027 | 9,561 | 8,750 | ||||||
British American Tobacco PLC 4.448% 3/16/2028 | 3,065 | 2,844 | ||||||
British American Tobacco PLC 2.259% 3/25/2028 | 4,348 | 3,616 | ||||||
British American Tobacco PLC 4.742% 3/16/2032 | 2,675 | 2,381 | ||||||
British American Tobacco PLC 4.39% 8/15/2037 | 1,500 | 1,171 | ||||||
British American Tobacco PLC 4.54% 8/15/2047 | 13,490 | 9,582 | ||||||
British American Tobacco PLC 4.758% 9/6/2049 | 21,450 | 15,620 | ||||||
British American Tobacco PLC 5.65% 3/16/2052 | 430 | 356 | ||||||
Conagra Brands, Inc. 5.30% 11/1/2038 | 436 | 412 | ||||||
Conagra Brands, Inc. 5.40% 11/1/2048 | 57 | 53 | ||||||
Constellation Brands, Inc. 3.50% 5/9/2027 | 7,500 | 7,035 | ||||||
Constellation Brands, Inc. 4.35% 5/9/2027 | 890 | 868 | ||||||
Constellation Brands, Inc. 2.875% 5/1/2030 | 620 | 529 | ||||||
Constellation Brands, Inc. 2.25% 8/1/2031 | 1,487 | 1,185 | ||||||
Constellation Brands, Inc. 4.75% 5/9/2032 | 2,284 | 2,205 | ||||||
Imperial Tobacco Finance PLC 6.125% 7/27/20272 | 1,810 | 1,804 | ||||||
JBS USA Lux SA 2.50% 1/15/20272 | 3,880 | 3,399 | ||||||
JBS USA Lux SA 3.00% 2/2/20292 | 2,709 | 2,248 | ||||||
JBS USA Lux SA 5.50% 1/15/20302 | 435 | 415 | ||||||
JBS USA Lux SA 3.625% 1/15/20322 | 1,430 | 1,160 | ||||||
JBS USA Lux SA 3.00% 5/15/20322 | 3,430 | 2,635 | ||||||
JBS USA Lux SA 5.75% 4/1/20332 | 7,368 | 7,046 | ||||||
Kraft Heinz Company 5.50% 6/1/2050 | 2,725 | 2,619 | ||||||
PepsiCo, Inc. 1.95% 10/21/2031 | 6,979 | 5,658 | ||||||
Philip Morris International, Inc. 5.00% 11/17/2025 | 6,555 | 6,592 | ||||||
Philip Morris International, Inc. 5.125% 11/17/2027 | 4,898 | 4,942 | ||||||
Philip Morris International, Inc. 5.625% 11/17/2029 | 4,309 | 4,382 | ||||||
Philip Morris International, Inc. 5.75% 11/17/2032 | 6,327 | 6,470 | ||||||
Philip Morris International, Inc. 4.125% 3/4/2043 | 4,117 | 3,270 | ||||||
Philip Morris International, Inc. 4.875% 11/15/2043 | 5,433 | 4,774 | ||||||
PT Indofood CBP Sukses Makmur Tbk 3.398% 6/9/2031 | 3,110 | 2,590 | ||||||
American Funds Insurance Series 187
Table of Contents
The Bond Fund of America (continued)
Bonds, notes & other debt instruments (continued)
| Principal amount | Value | |||||||
| (000) | (000) | |||||||
Corporate bonds, notes & loans (continued) | ||||||||
Consumer staples (continued) | ||||||||
PT Indofood CBP Sukses Makmur Tbk 4.745% 6/9/2051 | USD | 685 | $ | 507 | ||||
Reynolds American, Inc. 4.45% 6/12/2025 | 14,570 | 14,267 | ||||||
Reynolds American, Inc. 5.85% 8/15/2045 | 1,688 | 1,445 | ||||||
Wal-Mart Stores, Inc. 4.15% 9/9/2032 | 570 | 557 | ||||||
Wal-Mart Stores, Inc. 4.50% 9/9/2052 | 480 | 460 | ||||||
|
| |||||||
| 187,159 | ||||||||
|
| |||||||
Information technology 0.82% | ||||||||
Analog Devices, Inc. 2.80% 10/1/2041 | 521 | 383 | ||||||
Apple, Inc. 2.70% 8/5/2051 | 7,080 | 4,701 | ||||||
Apple, Inc. 3.95% 8/8/2052 | 1,805 | 1,544 | ||||||
Block, Inc. 2.75% 6/1/2026 | 1,975 | 1,767 | ||||||
Block, Inc. 3.50% 6/1/2031 | 825 | 659 | ||||||
Broadcom Corp. 3.875% 1/15/2027 | 7,027 | 6,657 | ||||||
Broadcom, Inc. 4.00% 4/15/20292 | 1,470 | 1,338 | ||||||
Broadcom, Inc. 4.15% 4/15/20322 | 2,270 | 1,999 | ||||||
Broadcom, Inc. 3.469% 4/15/20342 | 33,872 | 27,121 | ||||||
Broadcom, Inc. 3.137% 11/15/20352 | 2,149 | 1,587 | ||||||
Broadcom, Inc. 3.187% 11/15/20362 | 4,803 | 3,465 | ||||||
Broadcom, Inc. 4.926% 5/15/20372 | 4,049 | 3,547 | ||||||
Global Payments, Inc. 2.90% 11/15/2031 | 1,005 | 795 | ||||||
Oracle Corp. 1.65% 3/25/2026 | 4,867 | 4,363 | ||||||
Oracle Corp. 2.30% 3/25/2028 | 6,875 | 5,967 | ||||||
Oracle Corp. 2.875% 3/25/2031 | 3,345 | 2,782 | ||||||
Oracle Corp. 3.95% 3/25/2051 | 4,869 | 3,490 | ||||||
PayPal Holdings, Inc. 5.05% 6/1/2052 | 3,775 | 3,439 | ||||||
salesforce.com, inc. 1.95% 7/15/2031 | 3,775 | 3,019 | ||||||
salesforce.com, inc. 2.70% 7/15/2041 | 875 | 628 | ||||||
salesforce.com, inc. 2.90% 7/15/2051 | 5,140 | 3,393 | ||||||
salesforce.com, inc. 3.05% 7/15/2061 | 265 | 170 | ||||||
VeriSign, Inc. 2.70% 6/15/2031 | 1,494 | 1,220 | ||||||
|
| |||||||
| 84,034 | ||||||||
|
| |||||||
Real estate 0.70% | ||||||||
American Tower Corp. 1.45% 9/15/2026 | 657 | 574 | ||||||
American Tower Corp. 3.65% 3/15/2027 | 2,291 | 2,143 | ||||||
Corporacion Inmobiliaria Vesta, SAB de CV, 3.625% 5/13/20312 | 395 | 318 | ||||||
Corporate Office Properties, LP 2.00% 1/15/2029 | 1,139 | 876 | ||||||
Corporate Office Properties, LP 2.75% 4/15/2031 | 1,547 | 1,161 | ||||||
Corporate Office Properties, LP 2.90% 12/1/2033 | 564 | 402 | ||||||
Equinix, Inc. 2.90% 11/18/2026 | 3,287 | 3,009 | ||||||
Equinix, Inc. 3.20% 11/18/2029 | 3,846 | 3,356 | ||||||
Equinix, Inc. 2.50% 5/15/2031 | 7,760 | 6,254 | ||||||
Equinix, Inc. 3.90% 4/15/2032 | 1,155 | 1,029 | ||||||
Equinix, Inc. 3.40% 2/15/2052 | 1,201 | 823 | ||||||
Extra Space Storage, Inc. 2.35% 3/15/2032 | 698 | 530 | ||||||
FibraSOMA 4.375% 7/22/20312 | 1,475 | 1,105 | ||||||
Hospitality Properties Trust 4.50% 3/15/2025 | 855 | 739 | ||||||
Hospitality Properties Trust 3.95% 1/15/2028 | 1,710 | 1,217 | ||||||
Howard Hughes Corp. 4.375% 2/1/20312 | 675 | 547 | ||||||
Invitation Homes Operating Partnership, LP 2.30% 11/15/2028 | 767 | 636 | ||||||
Invitation Homes Operating Partnership, LP 2.00% 8/15/2031 | 2,048 | 1,518 | ||||||
Invitation Homes Operating Partnership, LP 2.70% 1/15/2034 | 660 | 483 | ||||||
Iron Mountain, Inc. 4.875% 9/15/20272 | 1,605 | 1,479 | ||||||
Iron Mountain, Inc. 5.25% 3/15/20282 | 3,500 | 3,226 | ||||||
Iron Mountain, Inc. 5.25% 7/15/20302 | 675 | 588 | ||||||
Omega Healthcare Investors, Inc. 4.375% 8/1/2023 | 186 | 185 | ||||||
Piedmont Operating Partnership, LP 4.45% 3/15/2024 | 1,000 | 983 | ||||||
Public Storage 1.95% 11/9/2028 | 993 | 849 | ||||||
Public Storage 2.30% 5/1/2031 | 3,195 | 2,601 | ||||||
188 American Funds Insurance Series
Table of Contents
The Bond Fund of America (continued)
Bonds, notes & other debt instruments (continued)
| Principal amount | Value | |||||||
| (000) | (000) | |||||||
Corporate bonds, notes & loans (continued) | ||||||||
Real estate (continued) | ||||||||
Scentre Group 3.50% 2/12/20252 | USD | 4,565 | $ | 4,372 | ||||
Sun Communities Operating, LP 2.30% 11/1/2028 | 1,026 | 856 | ||||||
Sun Communities Operating, LP 2.70% 7/15/2031 | 3,877 | 3,070 | ||||||
VICI Properties, LP 4.375% 5/15/2025 | 670 | 652 | ||||||
VICI Properties, LP 4.75% 2/15/2028 | 6,844 | 6,505 | ||||||
VICI Properties, LP 4.95% 2/15/2030 | 5,515 | 5,257 | ||||||
VICI Properties, LP 4.125% 8/15/20302 | 425 | 373 | ||||||
VICI Properties, LP 5.125% 5/15/2032 | 11,766 | 10,917 | ||||||
VICI Properties, LP 5.625% 5/15/2052 | 2,695 | 2,388 | ||||||
|
| |||||||
| 71,021 | ||||||||
|
| |||||||
Materials 0.13% | ||||||||
Air Products and Chemicals, Inc. 2.70% 5/15/2040 | 2,911 | 2,178 | ||||||
Celanese US Holdings, LLC 6.05% 3/15/2025 | 195 | 194 | ||||||
Celanese US Holdings, LLC 6.165% 7/15/2027 | 2,875 | 2,840 | ||||||
Celanese US Holdings, LLC 6.33% 7/15/2029 | 775 | 755 | ||||||
Celanese US Holdings, LLC 6.379% 7/15/2032 | 2,055 | 1,960 | ||||||
Glencore Funding, LLC 2.625% 9/23/20312 | 790 | 631 | ||||||
Glencore Funding, LLC 3.375% 9/23/20512 | 370 | 242 | ||||||
International Flavors & Fragrances, Inc. 2.30% 11/1/20302 | 3,536 | 2,813 | ||||||
Methanex Corp. 5.125% 10/15/2027 | 510 | 474 | ||||||
Nova Chemicals Corp. 4.25% 5/15/20292 | 425 | 348 | ||||||
South32 Treasury, Ltd. 4.35% 4/14/20322 | 1,384 | 1,188 | ||||||
|
| |||||||
| 13,623 | ||||||||
|
| |||||||
Municipals 0.01% | ||||||||
Aeropuerto International de Tocume SA 4.00% 8/11/20412 | 730 | 603 | ||||||
Aeropuerto International de Tocume SA 5.125% 8/11/20612 | 565 | 464 | ||||||
|
| |||||||
| 1,067 | ||||||||
|
| |||||||
Total corporate bonds, notes & loans | 3,535,583 | |||||||
|
| |||||||
U.S. Treasury bonds & notes 27.43% | ||||||||
U.S. Treasury 14.76% | ||||||||
U.S. Treasury 0.125% 5/31/2023 | 39,035 | 38,325 | ||||||
U.S. Treasury 2.25% 12/31/2023 | 24,768 | 24,174 | ||||||
U.S. Treasury 1.50% 2/29/2024 | 9,807 | 9,455 | ||||||
U.S. Treasury 2.50% 4/30/2024 | 22,390 | 21,755 | ||||||
U.S. Treasury 0.375% 9/15/2024 | 15,740 | 14,672 | ||||||
U.S. Treasury 4.50% 11/30/2024 | 38,095 | 38,103 | ||||||
U.S. Treasury 3.00% 7/15/2025 | 97,643 | 94,593 | ||||||
U.S. Treasury 4.00% 12/15/2025 | 67,475 | 67,053 | ||||||
U.S. Treasury 0.375% 12/31/2025 | 44,080 | 39,409 | ||||||
U.S. Treasury 0.375% 1/31/2026 | 40,000 | 35,602 | ||||||
U.S. Treasury 0.75% 5/31/2026 | 20,625 | 18,401 | ||||||
U.S. Treasury 0.75% 8/31/2026 | 26,766 | 23,705 | ||||||
U.S. Treasury 1.375% 8/31/2026 | 45,000 | 40,809 | ||||||
U.S. Treasury 0.50% 4/30/2027 | 45,625 | 39,295 | ||||||
U.S. Treasury 2.75% 4/30/2027 | 11,500 | 10,903 | ||||||
U.S. Treasury 2.25% 11/15/20275 | 105,830 | 97,546 | ||||||
U.S. Treasury 6.125% 11/15/2027 | 24,000 | 26,188 | ||||||
U.S. Treasury 3.875% 11/30/2027 | 46,272 | 46,021 | ||||||
U.S. Treasury 1.25% 5/31/2028 | 21,480 | 18,605 | ||||||
U.S. Treasury 3.875% 11/30/2029 | 149 | 148 | ||||||
U.S. Treasury 3.875% 12/31/2029 | 5,750 | 5,710 | ||||||
U.S. Treasury 1.625% 5/15/2031 | 1,630 | 1,372 | ||||||
U.S. Treasury 4.125% 11/15/2032 | 15,000 | 15,299 | ||||||
U.S. Treasury 4.25% 5/15/2039 | 106,700 | 110,123 | ||||||
U.S. Treasury 1.125% 5/15/2040 | 124,213 | 77,947 | ||||||
U.S. Treasury 1.375% 11/15/2040 | 40,000 | 26,058 | ||||||
U.S. Treasury 1.875% 2/15/2041 | 46,900 | 33,221 | ||||||
American Funds Insurance Series 189
Table of Contents
The Bond Fund of America (continued)
Bonds, notes & other debt instruments (continued)
Principal amount (000) | Value (000) | |||||||
U.S. Treasury bonds & notes (continued) | ||||||||
U.S. Treasury (continued) | ||||||||
U.S. Treasury 2.00% 11/15/2041 | USD | 247 | $ | 177 | ||||
U.S. Treasury 2.375% 2/15/2042 | 3,271 | 2,500 | ||||||
U.S. Treasury 4.00% 11/15/2042 | 766 | 751 | ||||||
U.S. Treasury 3.00% 2/15/2049 | 123,340 | 102,162 | ||||||
U.S. Treasury 1.25% 5/15/2050 | 21,285 | 11,514 | ||||||
U.S. Treasury 2.00% 8/15/2051 | 1,587 | 1,044 | ||||||
U.S. Treasury 1.875% 11/15/2051 | 4,670 | 2,974 | ||||||
U.S. Treasury 3.00% 8/15/20525 | 493,436 | 409,137 | ||||||
U.S. Treasury 4.00% 11/15/2052 | 3,800 | 3,820 | ||||||
|
| |||||||
| 1,508,571 | ||||||||
|
| |||||||
U.S. Treasury inflation-protected securities 12.67% | ||||||||
U.S. Treasury Inflation-Protected Security 0.125% 1/15/20236 | 206,245 | 205,862 | ||||||
U.S. Treasury Inflation-Protected Security 0.625% 4/15/20236 | 85,927 | 85,102 | ||||||
U.S. Treasury Inflation-Protected Security 0.375% 7/15/20236 | 6,574 | 6,498 | ||||||
U.S. Treasury Inflation-Protected Security 0.625% 1/15/20246 | 255,440 | 250,190 | ||||||
U.S. Treasury Inflation-Protected Security 0.50% 4/15/20246 | 29,208 | 28,425 | ||||||
U.S. Treasury Inflation-Protected Security 0.125% 7/15/20246 | 250,395 | 242,546 | ||||||
U.S. Treasury Inflation-Protected Security 0.125% 10/15/20246 | 57,910 | 55,812 | ||||||
U.S. Treasury Inflation-Protected Security 0.25% 1/15/20256 | 26,921 | 25,840 | ||||||
U.S. Treasury Inflation-Protected Security 0.125% 4/15/20256 | 28,626 | 27,283 | ||||||
U.S. Treasury Inflation-Protected Security 0.375% 7/15/20256 | 71,002 | 68,225 | ||||||
U.S. Treasury Inflation-Protected Security 0.625% 1/15/20266 | 3,300 | 3,168 | ||||||
U.S. Treasury Inflation-Protected Security 0.125% 10/15/20266 | 13,368 | 12,538 | ||||||
U.S. Treasury Inflation-Protected Security 0.125% 4/15/20276 | 66,635 | 62,091 | ||||||
U.S. Treasury Inflation-Protected Security 0.375% 7/15/20276 | 85,852 | 80,941 | ||||||
U.S. Treasury Inflation-Protected Security 1.625% 10/15/20276 | 21,184 | 21,157 | ||||||
U.S. Treasury Inflation-Protected Security 0.50% 1/15/20285,6 | 90,600 | 85,240 | ||||||
U.S. Treasury Inflation-Protected Security 0.125% 1/15/20316 | 20,209 | 17,930 | ||||||
U.S. Treasury Inflation-Protected Security 0.125% 7/15/20316 | 13,385 | 11,811 | ||||||
U.S. Treasury Inflation-Protected Security 0.125% 2/15/20516 | 6,118 | 3,947 | ||||||
|
| |||||||
| 1,294,606 | ||||||||
|
| |||||||
Total U.S. Treasury bonds & notes | 2,803,177 | |||||||
|
| |||||||
Mortgage-backed obligations 25.81% | ||||||||
Federal agency mortgage-backed obligations 23.23% | ||||||||
Fannie Mae Pool #254764 5.50% 6/1/20237 | — | 8 | — | 8 | ||||
Fannie Mae Pool #AB1068 4.50% 5/1/20257 | 37 | 37 | ||||||
Fannie Mae Pool #256133 4.50% 1/1/20267 | 32 | 31 | ||||||
Fannie Mae Pool #AR3058 3.00% 1/1/20287 | 75 | 72 | ||||||
Fannie Mae Pool #AS8018 3.00% 9/1/20317 | 44 | 42 | ||||||
Fannie Mae Pool #BM4741 3.00% 4/1/20327 | 28 | 27 | ||||||
Fannie Mae Pool #913966 6.00% 2/1/20377 | 34 | 36 | ||||||
Fannie Mae Pool #945680 6.00% 9/1/20377 | 426 | 444 | ||||||
Fannie Mae Pool #924866 2.765% 10/1/20373,7 | 419 | 410 | ||||||
Fannie Mae Pool #988588 5.50% 8/1/20387 | 185 | 192 | ||||||
Fannie Mae Pool #889982 5.50% 11/1/20387 | 919 | 953 | ||||||
Fannie Mae Pool #AB1297 5.00% 8/1/20407 | 191 | 194 | ||||||
Fannie Mae Pool #AH8144 5.00% 4/1/20417 | 805 | 810 | ||||||
Fannie Mae Pool #AH9479 5.00% 4/1/20417 | 754 | 764 | ||||||
Fannie Mae Pool #AI1862 5.00% 5/1/20417 | 952 | 963 | ||||||
Fannie Mae Pool #AI3510 5.00% 6/1/20417 | 524 | 530 | ||||||
Fannie Mae Pool #AJ0704 5.00% 9/1/20417 | 444 | 452 | ||||||
Fannie Mae Pool #AJ5391 5.00% 11/1/20417 | 321 | 325 | ||||||
Fannie Mae Pool #MA4501 2.00% 12/1/20417 | 9,994 | 8,437 | ||||||
Fannie Mae Pool #MA4540 2.00% 2/1/20427 | 2,628 | 2,218 | ||||||
Fannie Mae Pool #AZ3904 4.00% 5/1/20457 | 42 | 40 | ||||||
Fannie Mae Pool #FM9416 3.50% 7/1/20457 | 2,819 | 2,610 | ||||||
Fannie Mae Pool #AL8522 3.50% 5/1/20467 | 896 | 833 | ||||||
Fannie Mae Pool #BD1968 4.00% 7/1/20467 | 792 | 757 | ||||||
190 American Funds Insurance Series
Table of Contents
The Bond Fund of America (continued)
Bonds, notes & other debt instruments (continued)
Principal amount (000) | Value (000) | |||||||
Mortgage-backed obligations (continued) | ||||||||
Federal agency mortgage-backed obligations (continued) | ||||||||
Fannie Mae Pool #BD5477 4.00% 7/1/20467 | USD | 137 | $ | 132 | ||||
Fannie Mae Pool #BE0592 4.00% 11/1/20467 | 313 | 295 | ||||||
Fannie Mae Pool #MA3058 4.00% 7/1/20477 | 42 | 40 | ||||||
Fannie Mae Pool #CA0770 3.50% 11/1/20477 | 4,696 | 4,364 | ||||||
Fannie Mae Pool #CA0706 4.00% 11/1/20477 | 91 | 87 | ||||||
Fannie Mae Pool #BM4413 4.50% 12/1/20477 | 2,854 | 2,812 | ||||||
Fannie Mae Pool #CA1189 3.50% 2/1/20487 | 1,384 | 1,285 | ||||||
Fannie Mae Pool #BJ5749 4.00% 5/1/20487 | 16 | 16 | ||||||
Fannie Mae Pool #BF0293 3.00% 7/1/20487 | 6,893 | 6,129 | ||||||
Fannie Mae Pool #BF0318 3.50% 8/1/20487 | 5,642 | 5,198 | ||||||
Fannie Mae Pool #FM4891 3.50% 10/1/20487 | 20,838 | 19,368 | ||||||
Fannie Mae Pool #BM4676 4.00% 10/1/20487 | 13 | 12 | ||||||
Fannie Mae Pool #FM3280 3.50% 5/1/20497 | 738 | 684 | ||||||
Fannie Mae Pool #CA3807 3.00% 7/1/20497 | 1,416 | 1,267 | ||||||
Fannie Mae Pool #CA3806 3.00% 7/1/20497 | 913 | 818 | ||||||
Fannie Mae Pool #FM1262 4.00% 7/1/20497 | 22,731 | 21,695 | ||||||
Fannie Mae Pool #FM0007 3.50% 9/1/20497 | 15,691 | 14,461 | ||||||
Fannie Mae Pool #FM1589 3.50% 9/1/20497 | 4,398 | 4,048 | ||||||
Fannie Mae Pool #FM1954 3.50% 11/1/20497 | 6,796 | 6,252 | ||||||
Fannie Mae Pool #CA5968 2.50% 6/1/20507 | 6,170 | 5,302 | ||||||
Fannie Mae Pool #FM5507 3.00% 7/1/20507 | 18,556 | 16,591 | ||||||
Fannie Mae Pool #CA6309 3.00% 7/1/20507 | 6,665 | 5,981 | ||||||
Fannie Mae Pool #BP6715 2.00% 9/1/20507 | 1 | 1 | ||||||
Fannie Mae Pool #CA7028 2.50% 9/1/20507 | 1,108 | 957 | ||||||
Fannie Mae Pool #BQ3005 2.50% 10/1/20507 | 1,935 | 1,646 | ||||||
Fannie Mae Pool #CA7257 2.50% 10/1/20507 | 314 | 270 | ||||||
Fannie Mae Pool #CA7599 2.50% 11/1/20507 | 7,463 | 6,437 | ||||||
Fannie Mae Pool #FM4897 3.00% 11/1/20507 | 18,989 | 17,095 | ||||||
Fannie Mae Pool #MA4208 2.00% 12/1/20507 | 12,762 | 10,450 | ||||||
Fannie Mae Pool #CA8828 2.50% 2/1/20517 | 6,306 | 5,420 | ||||||
Fannie Mae Pool #CB0290 2.00% 4/1/20517 | 21,666 | 17,724 | ||||||
Fannie Mae Pool #MA4305 2.00% 4/1/20517 | 33 | 27 | ||||||
Fannie Mae Pool #BR1035 2.00% 5/1/20517 | 20 | 16 | ||||||
Fannie Mae Pool #FM7510 3.00% 6/1/20517 | 242 | 213 | ||||||
Fannie Mae Pool #FM7900 2.50% 7/1/20517 | 533 | 457 | ||||||
Fannie Mae Pool #FM8442 2.50% 8/1/20517 | 9,106 | 7,723 | ||||||
Fannie Mae Pool #CB1527 2.50% 9/1/20517 | 1,264 | 1,074 | ||||||
Fannie Mae Pool #FS0965 2.00% 11/1/20517 | 156 | 128 | ||||||
Fannie Mae Pool #CB2402 2.50% 12/1/20517 | 4,932 | 4,181 | ||||||
Fannie Mae Pool #FM9846 2.50% 12/1/20517 | 569 | 483 | ||||||
Fannie Mae Pool #CB2787 3.50% 12/1/20517 | 27 | 25 | ||||||
Fannie Mae Pool #FS2776 2.50% 1/1/20527 | 3,264 | 2,769 | ||||||
Fannie Mae Pool #CB2765 2.00% 2/1/20527 | 6,870 | 5,649 | ||||||
Fannie Mae Pool #FS0647 3.00% 2/1/20527 | 41,218 | 36,792 | ||||||
Fannie Mae Pool #CB3744 2.50% 3/1/20527 | 1,000 | 848 | ||||||
Fannie Mae Pool #CB3170 3.00% 3/1/20527 | 392 | 345 | ||||||
Fannie Mae Pool #BV7773 2.50% 4/1/20527 | 9,356 | 7,942 | ||||||
Fannie Mae Pool #BV5370 2.50% 4/1/20527 | 8,486 | 7,196 | ||||||
Fannie Mae Pool #BV2994 2.50% 4/1/20527 | 3,401 | 2,887 | ||||||
Fannie Mae Pool #MA4578 2.50% 4/1/20527 | 780 | 662 | ||||||
Fannie Mae Pool #BV7521 2.50% 5/1/20527 | 1,000 | 848 | ||||||
Fannie Mae Pool #CB3495 3.00% 5/1/20527 | 1,174 | 1,031 | ||||||
Fannie Mae Pool #MA4599 3.00% 5/1/20527 | 500 | 439 | ||||||
Fannie Mae Pool #BV9975 2.50% 6/1/20527 | 3,301 | 2,802 | ||||||
Fannie Mae Pool #BV2452 3.00% 6/1/20527 | 739 | 649 | ||||||
Fannie Mae Pool #CB4159 4.00% 7/1/20527 | 1,689 | 1,586 | ||||||
Fannie Mae Pool #BW1001 4.50% 7/1/20527 | 675 | 651 | ||||||
Fannie Mae Pool #BV2562 4.50% 7/1/20527 | 522 | 503 | ||||||
Fannie Mae Pool #MA4699 3.50% 8/1/20527 | 900 | 819 | ||||||
Fannie Mae Pool #MA4700 4.00% 8/1/20527 | 2,823 | 2,651 | ||||||
Fannie Mae Pool #BV8024 4.00% 8/1/20527 | 2,138 | 2,008 | ||||||
American Funds Insurance Series 191
Table of Contents
The Bond Fund of America (continued)
Bonds, notes & other debt instruments (continued)
Principal amount (000) | Value (000) | |||||||
Mortgage-backed obligations (continued) | ||||||||
Federal agency mortgage-backed obligations (continued) | ||||||||
Fannie Mae Pool #BW9409 4.50% 8/1/20527 | USD | 1,998 | $ | 1,925 | ||||
Fannie Mae Pool #BW5751 4.50% 8/1/20527 | 1,983 | 1,910 | ||||||
Fannie Mae Pool #BW2284 4.50% 8/1/20527 | 1,944 | 1,873 | ||||||
Fannie Mae Pool #BW6191 4.50% 8/1/20527 | 999 | 965 | ||||||
Fannie Mae Pool #BW7611 4.50% 8/1/20527 | 974 | 938 | ||||||
Fannie Mae Pool #BW8077 4.50% 8/1/20527 | 90 | 86 | ||||||
Fannie Mae Pool #MA4732 4.00% 9/1/20527 | 9,060 | 8,508 | ||||||
Fannie Mae Pool #BW7326 4.00% 9/1/20527 | 1,831 | 1,720 | ||||||
Fannie Mae Pool #BW9348 4.00% 9/1/20527 | 1,588 | 1,491 | ||||||
Fannie Mae Pool #BW8103 4.00% 9/1/20527 | 1,504 | 1,412 | ||||||
Fannie Mae Pool #BV0952 4.50% 9/1/20527 | 4,153 | 4,001 | ||||||
Fannie Mae Pool #BW3812 4.50% 9/1/20527 | 3,994 | 3,848 | ||||||
Fannie Mae Pool #BW9386 4.50% 9/1/20527 | 2,996 | 2,888 | ||||||
Fannie Mae Pool #BV0957 4.50% 9/1/20527 | 2,996 | 2,887 | ||||||
Fannie Mae Pool #BW8692 4.50% 9/1/20527 | 999 | 963 | ||||||
Fannie Mae Pool #BW9180 4.50% 9/1/20527 | 420 | 405 | ||||||
Fannie Mae Pool #BW8497 4.50% 9/1/20527 | 65 | 63 | ||||||
Fannie Mae Pool #BW7702 4.50% 9/1/20527 | 42 | 40 | ||||||
Fannie Mae Pool #MA4761 5.00% 9/1/20527 | 36,426 | 35,956 | ||||||
Fannie Mae Pool #BW1295 3.50% 10/1/20527 | 574 | 522 | ||||||
Fannie Mae Pool #BW8980 4.00% 10/1/20527 | 5,933 | 5,571 | ||||||
Fannie Mae Pool #BW1210 4.00% 10/1/20527 | 4,482 | 4,208 | ||||||
Fannie Mae Pool #BW7356 4.00% 10/1/20527 | 3,728 | 3,500 | ||||||
Fannie Mae Pool #BX0509 4.00% 10/1/20527 | 1,604 | 1,506 | ||||||
Fannie Mae Pool #CB4794 4.50% 10/1/20527 | 15,949 | 15,370 | ||||||
Fannie Mae Pool #MA4784 4.50% 10/1/20527 | 10,684 | 10,294 | ||||||
Fannie Mae Pool #BW8745 4.50% 10/1/20527 | 4,974 | 4,792 | ||||||
Fannie Mae Pool #BX0097 4.50% 10/1/20527 | 2,995 | 2,885 | ||||||
Fannie Mae Pool #BW7795 4.50% 10/1/20527 | 496 | 478 | ||||||
Fannie Mae Pool #BW8592 4.50% 10/1/20527 | 149 | 143 | ||||||
Fannie Mae Pool #MA4820 6.50% 10/1/20527 | 294 | 303 | ||||||
Fannie Mae Pool #MA4854 2.50% 11/1/20527 | 902 | 765 | ||||||
Fannie Mae Pool #MA4803 3.50% 11/1/20527 | 7,069 | 6,431 | ||||||
Fannie Mae Pool #MA4804 4.00% 11/1/20527 | 9,106 | 8,550 | ||||||
Fannie Mae Pool #BW1310 4.00% 11/1/20527 | 1,677 | 1,574 | ||||||
Fannie Mae Pool #BX1042 4.50% 11/1/20527 | 548 | 528 | ||||||
Fannie Mae Pool #BX1516 4.50% 11/1/20527 | 542 | 523 | ||||||
Fannie Mae Pool #BX1035 4.50% 11/1/20527 | 308 | 297 | ||||||
Fannie Mae Pool #BX3075 4.50% 11/1/20527 | 291 | 280 | ||||||
Fannie Mae Pool #BX2558 4.50% 11/1/20527 | 62 | 60 | ||||||
Fannie Mae Pool #MA4805 4.50% 11/1/20527 | 36 | 35 | ||||||
Fannie Mae Pool #BW1380 4.50% 12/1/20527 | 13,486 | 12,993 | ||||||
Fannie Mae Pool #MA4840 4.50% 12/1/20527 | 4,721 | 4,549 | ||||||
Fannie Mae Pool #MA4841 5.00% 12/1/20527 | 4,013 | 3,961 | ||||||
Fannie Mae Pool #MA4877 6.50% 12/1/20527 | 58,203 | 59,707 | ||||||
Fannie Mae Pool #BX4022 6.50% 12/1/20527 | 200 | 205 | ||||||
Fannie Mae Pool #MA4868 5.00% 1/1/20537 | 8,583 | 8,472 | ||||||
Fannie Mae Pool #MA4895 6.50% 1/1/20537 | 4,225 | 4,335 | ||||||
Fannie Mae Pool #BF0145 3.50% 3/1/20577 | 11,899 | 10,887 | ||||||
Fannie Mae Pool #BF0264 3.50% 5/1/20587 | 9,059 | 8,322 | ||||||
Fannie Mae Pool #BF0332 3.00% 1/1/20597 | 19,463 | 17,158 | ||||||
Fannie Mae Pool #BF0497 3.00% 7/1/20607 | 22,447 | 19,666 | ||||||
Fannie Mae Pool #BF0585 4.50% 12/1/20617 | 1,326 | 1,293 | ||||||
Fannie Mae, Series 2001-4, Class GA, 9.00% 4/17/20253,7 | — | 8 | — | 8 | ||||
Fannie Mae, Series 2001-50, Class BA, 7.00% 10/25/20417 | 7 | 7 | ||||||
Fannie Mae, Series 2002-W3, Class A5, 7.50% 11/25/20417 | 17 | 19 | ||||||
Fannie Mae, Series 2002-W1, Class 2A, 4.915% 2/25/20423,7 | 21 | 21 | ||||||
Freddie Mac Pool #ZS8507 3.00% 11/1/20287 | 113 | 108 | ||||||
Freddie Mac Pool #ZK7590 3.00% 1/1/20297 | 2,445 | 2,346 | ||||||
Freddie Mac Pool #A15120 5.50% 10/1/20337 | 51 | 52 | ||||||
Freddie Mac Pool #QN1073 3.00% 12/1/20347 | 46 | 44 | ||||||
192 American Funds Insurance Series
Table of Contents
The Bond Fund of America (continued)
Bonds, notes & other debt instruments (continued)
Principal amount (000) | Value (000) | |||||||
Mortgage-backed obligations (continued) | ||||||||
Federal agency mortgage-backed obligations (continued) | ||||||||
Freddie Mac Pool #G05196 5.50% 10/1/20387 | USD | 50 | $ | 52 | ||||
Freddie Mac Pool #G05267 5.50% 12/1/20387 | 37 | 39 | ||||||
Freddie Mac Pool #G06020 5.50% 12/1/20397 | 72 | 75 | ||||||
Freddie Mac Pool #G05860 5.50% 2/1/20407 | 265 | 275 | ||||||
Freddie Mac Pool #A93948 4.50% 9/1/20407 | 157 | 156 | ||||||
Freddie Mac Pool #G06868 4.50% 4/1/20417 | 177 | 176 | ||||||
Freddie Mac Pool #G06841 5.50% 6/1/20417 | 422 | 439 | ||||||
Freddie Mac Pool #RB5138 2.00% 12/1/20417 | 2,632 | 2,222 | ||||||
Freddie Mac Pool #RB5145 2.00% 2/1/20427 | 2,569 | 2,169 | ||||||
Freddie Mac Pool #RB5148 2.00% 3/1/20427 | 5,501 | 4,643 | ||||||
Freddie Mac Pool #Z40130 3.00% 1/1/20467 | 20,778 | 18,802 | ||||||
Freddie Mac Pool #ZT2100 3.00% 4/1/20477 | 109 | 98 | ||||||
Freddie Mac Pool #G08789 4.00% 11/1/20477 | 628 | 603 | ||||||
Freddie Mac Pool #G61733 3.00% 12/1/20477 | 5,178 | 4,642 | ||||||
Freddie Mac Pool #G67709 3.50% 3/1/20487 | 13,489 | 12,616 | ||||||
Freddie Mac Pool #G61628 3.50% 9/1/20487 | 330 | 307 | ||||||
Freddie Mac Pool #Q58494 4.00% 9/1/20487 | 1,273 | 1,217 | ||||||
Freddie Mac Pool #ZN4842 3.50% 4/1/20497 | 751 | 693 | ||||||
Freddie Mac Pool #RA1369 3.50% 9/1/20497 | 1,997 | 1,840 | ||||||
Freddie Mac Pool #SD7508 3.50% 10/1/20497 | 10,988 | 10,187 | ||||||
Freddie Mac Pool #QA4673 3.00% 11/1/20497 | 29,606 | 26,538 | ||||||
Freddie Mac Pool #SD8090 2.00% 9/1/20507 | 1,362 | 1,115 | ||||||
Freddie Mac Pool #SD8106 2.00% 11/1/20507 | 2,836 | 2,321 | ||||||
Freddie Mac Pool #SD8128 2.00% 2/1/20517 | 115 | 94 | ||||||
Freddie Mac Pool #SD8134 2.00% 3/1/20517 | 191 | 156 | ||||||
Freddie Mac Pool #RA5288 2.00% 5/1/20517 | 2,916 | 2,387 | ||||||
Freddie Mac Pool #SD1852 2.50% 6/1/20517 | 13,776 | 11,687 | ||||||
Freddie Mac Pool #QC2817 2.50% 6/1/20517 | 2,789 | 2,389 | ||||||
Freddie Mac Pool #QC7173 2.50% 9/1/20517 | 3,203 | 2,723 | ||||||
Freddie Mac Pool #QD1746 2.50% 11/1/20517 | 3,044 | 2,585 | ||||||
Freddie Mac Pool #SD1385 2.50% 11/1/20517 | 1,671 | 1,434 | ||||||
Freddie Mac Pool #RA6485 3.00% 12/1/20517 | 35,637 | 31,327 | ||||||
Freddie Mac Pool #SD7552 2.50% 1/1/20527 | 11,001 | 9,407 | ||||||
Freddie Mac Pool #QD5725 2.50% 1/1/20527 | 2,995 | 2,544 | ||||||
Freddie Mac Pool #QD4799 2.50% 1/1/20527 | 1,000 | 848 | ||||||
Freddie Mac Pool #RA6608 3.00% 2/1/20527 | 888 | 780 | ||||||
Freddie Mac Pool #QD7089 3.50% 2/1/20527 | 867 | 790 | ||||||
Freddie Mac Pool #QE0327 2.50% 4/1/20527 | 1,000 | 849 | ||||||
Freddie Mac Pool #QE2020 2.50% 5/1/20527 | 7,000 | 5,941 | ||||||
Freddie Mac Pool #SD8219 2.50% 6/1/20527 | 73,484 | 62,311 | ||||||
Freddie Mac Pool #SD8220 3.00% 6/1/20527 | 3,363 | 2,957 | ||||||
Freddie Mac Pool #QE4855 3.50% 6/1/20527 | 68 | 62 | ||||||
Freddie Mac Pool #QE4084 6.50% 6/1/20527 | 333 | 345 | ||||||
Freddie Mac Pool #SD8234 2.50% 8/1/20527 | 5,524 | 4,684 | ||||||
Freddie Mac Pool #SD8237 4.00% 8/1/20527 | 2,186 | 2,053 | ||||||
Freddie Mac Pool #QE9057 4.00% 8/1/20527 | 1,368 | 1,285 | ||||||
Freddie Mac Pool #QE8065 4.50% 8/1/20527 | 4,104 | 3,954 | ||||||
Freddie Mac Pool #QE7539 4.50% 8/1/20527 | 2,160 | 2,083 | ||||||
Freddie Mac Pool #QE8253 4.50% 8/1/20527 | 1,712 | 1,649 | ||||||
Freddie Mac Pool #QE6903 4.50% 8/1/20527 | 248 | 239 | ||||||
Freddie Mac Pool #QE7702 4.50% 8/1/20527 | 35 | 34 | ||||||
Freddie Mac Pool #SD8242 3.00% 9/1/20527 | 73 | 64 | ||||||
Freddie Mac Pool #QE9625 4.00% 9/1/20527 | 1,763 | 1,655 | ||||||
Freddie Mac Pool #SD8244 4.00% 9/1/20527 | 1,457 | 1,368 | ||||||
Freddie Mac Pool #QE9919 4.50% 9/1/20527 | 23,534 | 22,676 | ||||||
Freddie Mac Pool #QF0313 4.50% 9/1/20527 | 9,988 | 9,636 | ||||||
Freddie Mac Pool #QF0660 4.50% 9/1/20527 | 2,996 | 2,889 | ||||||
Freddie Mac Pool #QE9813 4.50% 9/1/20527 | 406 | 392 | ||||||
Freddie Mac Pool #QF0820 4.50% 9/1/20527 | 366 | 353 | ||||||
Freddie Mac Pool #RA7930 4.50% 9/1/20527 | 306 | 295 | ||||||
Freddie Mac Pool #QF1205 4.50% 9/1/20527 | 298 | 287 | ||||||
American Funds Insurance Series 193
Table of Contents
The Bond Fund of America (continued)
Bonds, notes & other debt instruments (continued)
Principal amount | Value | |||||||
| (000) | (000) | |||||||
Mortgage-backed obligations (continued) | ||||||||
Federal agency mortgage-backed obligations (continued) | ||||||||
Freddie Mac Pool #QF0311 5.00% 9/1/20527 | USD17,998 | $ | 17,766 | |||||
Freddie Mac Pool #QF2029 3.00% 10/1/20527 | 696 | 612 | ||||||
Freddie Mac Pool #QF1464 4.00% 10/1/20527 | 1,691 | 1,588 | ||||||
Freddie Mac Pool #QF2379 4.50% 10/1/20527 | 4,994 | 4,816 | ||||||
Freddie Mac Pool #QF1254 4.50% 10/1/20527 | 3,226 | 3,108 | ||||||
Freddie Mac Pool #QF1849 4.50% 10/1/20527 | 2,140 | 2,062 | ||||||
Freddie Mac Pool #QF2136 4.50% 10/1/20527 | 1,908 | 1,838 | ||||||
Freddie Mac Pool #QF0819 4.50% 10/1/20527 | 863 | 833 | ||||||
Freddie Mac Pool #QF2380 4.50% 10/1/20527 | 632 | 611 | ||||||
Freddie Mac Pool #QF2845 4.50% 10/1/20527 | 537 | 518 | ||||||
Freddie Mac Pool #QF2182 4.50% 10/1/20527 | 303 | 292 | ||||||
Freddie Mac Pool #QF0866 4.50% 10/1/20527 | 126 | 121 | ||||||
Freddie Mac Pool #SD8263 3.00% 11/1/20527 | 14,713 | 12,932 | ||||||
Freddie Mac Pool #SD8264 3.50% 11/1/20527 | 4,331 | 3,940 | ||||||
Freddie Mac Pool #QF3144 3.50% 11/1/20527 | 673 | 614 | ||||||
Freddie Mac Pool #SD1896 4.00% 11/1/20527 | 20,313 | 19,355 | ||||||
Freddie Mac Pool #SD1894 4.00% 11/1/20527 | 7,177 | 6,853 | ||||||
Freddie Mac Pool #QF3364 4.00% 11/1/20527 | 2,753 | 2,585 | ||||||
Freddie Mac Pool #QF2936 4.50% 11/1/20527 | 2,907 | 2,801 | ||||||
Freddie Mac Pool #QF2846 4.50% 11/1/20527 | 998 | 961 | ||||||
Freddie Mac Pool #QF3276 5.50% 11/1/20527 | 703 | 707 | ||||||
Freddie Mac Pool #QF2862 6.50% 11/1/20527 | 100 | 103 | ||||||
Freddie Mac Pool #SD8280 6.50% 11/1/20527 | 53 | 54 | ||||||
Freddie Mac Pool #QF3956 4.50% 12/1/20527 | 18,992 | 18,299 | ||||||
Freddie Mac Pool #SD8275 4.50% 12/1/20527 | 2,480 | 2,390 | ||||||
Freddie Mac Pool #SD8276 5.00% 12/1/20527 | 32,354 | 31,937 | ||||||
Freddie Mac Pool #QF4754 5.00% 12/1/20527 | 3,000 | 2,961 | ||||||
Freddie Mac Pool #QF4185 6.50% 12/1/20527 | 668 | 685 | ||||||
Freddie Mac Pool #SD8284 3.00% 1/1/20537 | 4,597 | 4,040 | ||||||
Freddie Mac Pool #SD8288 5.00% 1/1/20537 | 1,671 | 1,649 | ||||||
Freddie Mac Pool #SD8282 6.50% 1/1/20537 | 59,134 | 60,661 | ||||||
Freddie Mac, Series 3061, Class PN, 5.50% 11/15/20357 | 58 | 58 | ||||||
Freddie Mac, Series 3318, Class JT, 5.50% 5/15/20377 | 125 | 126 | ||||||
Freddie Mac, Series 3146, Class PO, principal only, 0% 4/15/20367 | 121 | 100 | ||||||
Freddie Mac, Series 3156, Class PO, principal only, 0% 5/15/20367 | 118 | 99 | ||||||
Freddie Mac Seasoned Credit Risk Transfer Trust, Series 2018-3, Class MA, 3.50% 8/25/20577 | 8,360 | 7,937 | ||||||
Freddie Mac Seasoned Credit Risk Transfer Trust, Series 2019-2, Class MA, 3.50% 8/25/20587 | 1,930 | 1,821 | ||||||
Freddie Mac Seasoned Loan Structured Transaction Trust, Series 2022-1, Class A1, 3.50% 5/25/20327 | 10,720 | 10,343 | ||||||
Government National Mortgage Assn. 2.00% 1/1/20537,9 | 14,785 | 12,394 | ||||||
Government National Mortgage Assn. 3.00% 1/1/20537,9 | 9,533 | 8,491 | ||||||
Government National Mortgage Assn. 3.50% 1/1/20537,9 | 33,185 | 30,495 | ||||||
Government National Mortgage Assn. 4.00% 1/1/20537,9 | 33,300 | 31,515 | ||||||
Government National Mortgage Assn. 5.00% 1/1/20537,9 | 75,701 | 75,023 | ||||||
Government National Mortgage Assn. 5.50% 1/1/20537,9 | 4,775 | 4,803 | ||||||
Government National Mortgage Assn. 5.50% 2/1/20537,9 | 51,027 | 51,288 | ||||||
Government National Mortgage Assn. Pool #MA5817 4.00% 3/20/20497 | 12,379 | 11,844 | ||||||
Government National Mortgage Assn. Pool #MA6042 5.00% 7/20/20497 | 35 | 35 | ||||||
Government National Mortgage Assn. Pool #MA6221 4.50% 10/20/20497 | 5,200 | 5,081 | ||||||
Government National Mortgage Assn. Pool #MA6600 3.50% 4/20/20507 | 11,395 | 10,581 | ||||||
Government National Mortgage Assn. Pool #MA8346 4.00% 10/20/20527 | 10,072 | 9,541 | ||||||
Government National Mortgage Assn. Pool #MA8426 4.00% 11/20/20527 | 18,573 | 17,594 | ||||||
Government National Mortgage Assn. Pool #MA8427 4.50% 11/20/20527 | 62,302 | 60,506 | ||||||
Government National Mortgage Assn. Pool #MA8489 4.50% 12/20/20527 | 485 | 471 | ||||||
Uniform Mortgage-Backed Security 2.50% 1/1/20387,9 | 7,545 | 6,905 | ||||||
Uniform Mortgage-Backed Security 2.00% 1/1/20537,9 | 210,537 | 171,362 | ||||||
Uniform Mortgage-Backed Security 2.50% 1/1/20537,9 | 62,762 | 53,158 | ||||||
Uniform Mortgage-Backed Security 3.00% 1/1/20537,9 | 11,245 | 9,871 | ||||||
Uniform Mortgage-Backed Security 4.00% 1/1/20537,9 | 2,735 | 2,565 | ||||||
194 American Funds Insurance Series
Table of Contents
The Bond Fund of America (continued)
Bonds, notes & other debt instruments (continued)
| Principal amount (000) | Value (000) | |||||||
Mortgage-backed obligations (continued) | ||||||||
Federal agency mortgage-backed obligations (continued) | ||||||||
Uniform Mortgage-Backed Security 4.50% 1/1/20537,9 | USD5,931 | $ | 5,709 | |||||
Uniform Mortgage-Backed Security 5.00% 1/1/20537,9 | 42,025 | 41,417 | ||||||
Uniform Mortgage-Backed Security 5.50% 1/1/20537,9 | 212,640 | 213,231 | ||||||
Uniform Mortgage-Backed Security 6.00% 1/1/20537,9 | 10,275 | 10,430 | ||||||
Uniform Mortgage-Backed Security 3.50% 2/1/20537,9 | 10,960 | 9,965 | ||||||
Uniform Mortgage-Backed Security 4.00% 2/1/20537,9 | 76,136 | 71,431 | ||||||
Uniform Mortgage-Backed Security 5.00% 2/1/20537,9 | 13,100 | 12,908 | ||||||
Uniform Mortgage-Backed Security 6.00% 2/1/20537,9 | 112,000 | 113,591 | ||||||
Uniform Mortgage-Backed Security 6.50% 2/1/20537,9 | 215,026 | 219,946 | ||||||
|
| |||||||
| 2,374,821 | ||||||||
|
| |||||||
Commercial mortgage-backed securities 1.51% | ||||||||
Bank Commercial Mortgage Trust, Series 2019-BN16, Class A4, 4.005% 2/15/20527 | 770 | 722 | ||||||
Bank Commercial Mortgage Trust, Series 2019-BN17, Class A4, 3.714% 4/15/20527 | 100 | 92 | ||||||
Bank Commercial Mortgage Trust, Series 2018-BN10, Class A5, 3.688% 2/15/20617 | 205 | 191 | ||||||
Bank Commercial Mortgage Trust, Series 2018-BN10, Class A4, 3.428% 2/17/20617 | 127 | 117 | ||||||
Bank Commercial Mortgage Trust, Series 2018-BN12, Class A4, 4.255% 5/15/20613,7 | 2,444 | 2,335 | ||||||
Bank Commercial Mortgage Trust, Series 2019-BN19, Class A3, 3.183% 8/15/20617 | 1,018 | 900 | ||||||
Bank Commercial Mortgage Trust, Series 2020-BN26, Class A4, 2.403% 3/15/20637 | 295 | 247 | ||||||
Benchmark Mortgage Trust, Series 2018-B8, Class A5, 4.232% 1/15/20527 | 2,541 | 2,427 | ||||||
Benchmark Mortgage Trust, Series 2018-B7, Class A4, 4.51% 5/15/20533,7 | 781 | 757 | ||||||
BOCA Commercial Mortgage Trust, Series 2022-BOCA, Class A, (1-month USD CME Term SOFR + 1.77%) 6.105% 5/15/20392,3,7 | 8,575 | 8,420 | ||||||
BPR Trust, Series 2022-OANA, Class A, (1-month USD CME Term SOFR + 1.898%) 6.234% 4/15/20372,3,7 | 3,822 | 3,739 | ||||||
BX Trust, Series 2022-CSMO, Class A, (1-month USD CME Term SOFR + 2.115%) 6.45% 6/15/20272,3,7 | 8,476 | 8,431 | ||||||
BX Trust, Series 2021-VOLT, Class A, (1-month USD-LIBOR + 0.70%) 5.018% 9/15/20362,3,7 | 14,727 | 14,207 | ||||||
BX Trust, Series 2021-VOLT, Class B, (1-month USD-LIBOR + 0.95%) 5.268% 9/15/20362,3,7 | 570 | 539 | ||||||
BX Trust, Series 2021-ARIA, Class A, (1-month USD-LIBOR + 0.899%) 5.217% 10/15/20362,3,7 | 5,292 | 5,043 | ||||||
BX Trust, Series 2021-ARIA, Class B, (1-month USD-LIBOR + 1.297%) 5.615% 10/15/20362,3,7 | 995 | 936 | ||||||
BX Trust, Series 2021-ARIA Class C, (1-month USD-LIBOR + 1.646%) 5.964% 10/15/20362,3,7 | 996 | 931 | ||||||
BX Trust, Series 2021-RISE, Class A, (1-month USD-LIBOR + 0.74%) 5.065% 11/15/20362,3,7 | 12,622 | 12,131 | ||||||
BX Trust, Series 2022-IND, Class A, (1-month USD CME Term SOFR + 1.491%) 5.827% 4/15/20372,3,7 | 5,441 | 5,335 | ||||||
BX Trust, Series 2021-SOAR, Class A, (1-month USD-LIBOR + 0.67%) 4.988% 6/15/20382,3,7 | 3,741 | 3,608 | ||||||
BX Trust, Series 2021-SOAR, Class B, (1-month USD-LIBOR + 0.87%) 5.188% 6/15/20382,3,7 | 433 | 413 | ||||||
BX Trust, Series 2021-SOAR, Class C, (1-month USD-LIBOR + 1.10%) 5.418% 6/15/20382,3,7 | 293 | 278 | ||||||
BX Trust, Series 2021-SOAR, Class D, (1-month USD-LIBOR + 1.40%) 5.718% 6/15/20382,3,7 | 740 | 699 | ||||||
BX Trust, Series 2021-ACNT, Class A, (1-month USD-LIBOR + 0.85%) 5.168% 11/15/20382,3,7 | 9,979 | 9,616 | ||||||
BX Trust, Series 2021-ACNT, Class B, (1-month USD-LIBOR + 1.25%) 5.568% 11/15/20382,3,7 | 339 | 325 | ||||||
BX Trust, Series 2021-ACNT, Class C, (1-month USD-LIBOR + 1.50%) 5.818% 11/15/20382,3,7 | 100 | 95 | ||||||
BX Trust, Series 2021-ACNT, Class D, (1-month USD-LIBOR + 1.85%) 6.168% 11/15/20382,3,7 | 151 | 143 | ||||||
BX Trust, Series 2022-GPA, Class A, (1-month USD CME Term SOFR + 2.165%) 6.501% 10/15/20392,3,7 | 3,198 | 3,185 | ||||||
American Funds Insurance Series 195
Table of Contents
The Bond Fund of America (continued)
Bonds, notes & other debt instruments (continued)
Principal amount | Value | |||||||
| (000) | (000) | |||||||
Mortgage-backed obligations (continued) | ||||||||
Commercial mortgage-backed securities (continued) | ||||||||
Citigroup Commercial Mortgage Trust, Series 2016-GC36, Class A5, 3.616% 2/10/20497 | USD610 | $ | 574 | |||||
Commercial Mortgage Trust, Series 2014-LC15, Class AM, 4.198% 4/10/20477 | 350 | 339 | ||||||
CSAIL Commercial Mortgage Trust, Series 2015-C2, Class A3, 3.231% 6/15/20577 | 1,137 | 1,080 | ||||||
Deutsche Bank Commercial Mortgage Trust, Series 2016-C1, Class AM, 3.539% 5/10/20497 | 200 | 182 | ||||||
Extended Stay America Trust, Series 2021-ESH, Class A, (1-month USD-LIBOR + 1.08%) 5.398% 7/15/20382,3,7 | 2,811 | 2,735 | ||||||
Extended Stay America Trust, Series 2021-ESH, Class B, (1-month USD-LIBOR + 1.38%) 5.698% 7/15/20382,3,7 | 641 | 618 | ||||||
Extended Stay America Trust, Series 2021-ESH, Class C, (1-month USD-LIBOR + 1.70%) 6.018% 7/15/20382,3,7 | 875 | 841 | ||||||
Extended Stay America Trust, Series 2021-ESH, Class D, (1-month USD-LIBOR + 2.25%) 6.568% 7/15/20382,3,7 | 670 | 643 | ||||||
Fontainebleau Miami Beach Trust, CMO, Series 2019-FBLU, Class A, 3.144% 12/10/20362,7 | 304 | 284 | ||||||
Grace Mortgage Trust, Series 2020-GRCE, Class A, 2.347% 12/10/20402,7 | 1,897 | 1,458 | ||||||
Great Wolf Trust, Series 2019-WOLF, Class A, (1-month USD-LIBOR + 1.034%) 5.352% 12/15/20362,3,7 | 3,894 | 3,786 | ||||||
GS Mortgage Securities Trust, Series 2022-SHIP, Class A, (1-month USD CME Term SOFR + 0.731%) 5.067% 8/15/20242,3,7 | 1,317 | 1,300 | ||||||
GS Mortgage Securities Trust, Series 2017-GS7, Class A4, 3.43% 8/10/20507 | 400 | 369 | ||||||
GS Mortgage Securities Trust, Series 2019-GC38, Class A4, 3.968% 2/10/20527 | 100 | 93 | ||||||
GS Mortgage Securities Trust, Series 2020-GC47, Class A5, 2.377% 5/12/20537 | 1,536 | 1,271 | ||||||
ILPT Commercial Mortgage Trust, Series 2022-LPF2, Class A, (1-month USD CME Term SOFR + 2.245%) 6.581% 10/15/20392,3,7 | 3,391 | 3,398 | ||||||
JPMBB Commercial Mortgage Securities Trust, Series 2014-C18, Class A5, 4.079% 2/15/20477 | 3,280 | 3,206 | ||||||
JPMDB Commercial Mortgage Securities Trust, Series 2017-C5, Class A5, 3.694% 3/15/20507 | 640 | 599 | ||||||
JPMDB Commercial Mortgage Securities Trust, Series 2017-C7, Class A5, 3.409% 10/15/20507 | 240 | 221 | ||||||
JPMorgan Chase Commercial Mortgage Securities Trust, Series 2022-OPO, Class A, 3.024% 1/5/20392,7 | 7,867 | 6,739 | ||||||
JPMorgan Chase Commercial Mortgage Securities Trust, Series 2016-JP4, Class A4, 3.648% 12/15/20493,7 | 2,040 | 1,906 | ||||||
La Quinta Mortgage Trust, Series 2022-LAQ, Class A, (1-month USD CME Term SOFR + 1.724%) 6.059% 3/15/20392,3,7 | 848 | 831 | ||||||
LUXE Commercial Mortgage Trust, Series 2021-TRIP, Class A, (1-month USD-LIBOR + 1.05%) 5.368% 10/15/20382,3,7 | 1,576 | 1,510 | ||||||
MHC Commercial Mortgage Trust, CMO, Series 2021-MHC, Class A, (1-month USD-LIBOR + 0.801%) 5.119% 4/15/20262,3,7 | 154 | 150 | ||||||
Morgan Stanley Bank of America Merrill Lynch Trust, Series 2014-C17, Class A5, 3.741% 8/15/20477 | 5,446 | 5,277 | ||||||
Morgan Stanley Bank of America Merrill Lynch Trust, Series 2015-C22, Class A-4, 3.306% 4/15/20487 | 410 | 389 | ||||||
Morgan Stanley Bank of America Merrill Lynch Trust, Series 2016-C32, Class A-4, 3.72% 12/15/20497 | 245 | 230 | ||||||
Morgan Stanley Capital I Trust, Series 2015-UBS8, Class AS, 4.114% 12/15/20487 | 730 | 670 | ||||||
SLG Office Trust, Series 2021-OVA, Class A, 2.585% 7/15/20412,7 | 4,065 | 3,253 | ||||||
SREIT Trust, Series 2021-FLWR, Class A, (1-month USD-LIBOR + 0.577%) 4.894% 7/15/20362,3,7 | 9,351 | 8,989 | ||||||
SREIT Trust, Series 2021-FLWR, Class B, (1-month USD-LIBOR + 0.926%) 5.244% 7/15/20362,3,7 | 1,000 | 954 | ||||||
SREIT Trust, Series 2021-MFP, Class A, (1-month USD-LIBOR + 0.731%) 5.049% 11/15/20382,3,7 | 8,739 | 8,418 | ||||||
SREIT Trust, Series 2021-MFP, Class B, (1-month USD-LIBOR + 1.079%) 5.398% 11/15/20382,3,7 | 263 | 251 | ||||||
SREIT Trust, Series 2021-MFP, Class C, (1-month USD-LIBOR + 1.329%) 5.647% 11/15/20382,3,7 | 141 | 134 | ||||||
196 American Funds Insurance Series
Table of Contents
The Bond Fund of America (continued)
Bonds, notes & other debt instruments (continued)
| Principal amount | Value | |||||||
| (000) | (000) | |||||||
Mortgage-backed obligations (continued) | ||||||||
Commercial mortgage-backed securities (continued) | ||||||||
Wells Fargo Commercial Mortgage Trust, Series 2015-SG1, Class A-4, 3.789% 9/15/20487 | USD2,373 | $ | 2,267 | |||||
Wells Fargo Commercial Mortgage Trust, Series 2016-C37, Class A5, 3.794% 12/15/20497 | 2,550 | 2,406 | ||||||
Wells Fargo Commercial Mortgage Trust, Series 2019-C54, Class A4, 3.146% 12/15/20527 | 1,019 | 892 | ||||||
Wells Fargo Commercial Mortgage Trust, Series 2017-RC1, Class A4, 3.631% 1/15/20607 | 205 | 192 | ||||||
|
| |||||||
| 154,317 | ||||||||
|
| |||||||
Collateralized mortgage-backed obligations (privately originated) 1.07% | ||||||||
Arroyo Mortgage Trust, Series 2021-1R, Class A1, 1.175% 10/25/20482,3,7 | 2,864 | 2,263 | ||||||
Arroyo Mortgage Trust, Series 2020-1, Class A1A, 1.662% 3/25/20552,7 | 131 | 119 | ||||||
Arroyo Mortgage Trust, Series 2022-1, Class A1A, 2.495% 12/25/2056 (3.495% on 2/25/2026)1,2,7 | 6,000 | 5,521 | ||||||
Bellemeade Re, Ltd., Series 2019-3A, Class M1B, (1-month USD-LIBOR + 1.60%) 5.989% 7/25/20292,3,7 | 414 | 414 | ||||||
BRAVO Residential Funding Trust, Series 2020-RPL2, Class A1, 2.00% 5/25/20592,3,7 | 923 | 830 | ||||||
BRAVO Residential Funding Trust, Series 2020-RPL1, Class A1, 2.50% 5/26/20592,3,7 | 586 | 556 | ||||||
BRAVO Residential Funding Trust, Series 2022-RPL1, Class A1, 2.75% 9/25/20612,7 | 4,867 | 4,221 | ||||||
Cascade Funding Mortgage Trust, Series 2020-HB4, Class A, 0.946% 12/26/20302,3,7 | 425 | 413 | ||||||
Cascade Funding Mortgage Trust, Series 2021-HB7, Class A, 1.151% 10/27/20312,3,7 | 3,032 | 2,858 | ||||||
Cascade Funding Mortgage Trust, Series 2021-HB6, Class A, 0.898% 6/25/20362,3,7 | 1,700 | 1,616 | ||||||
CIM Trust, Series 2022-R2, Class A1, 3.75% 12/25/20612,3,7 | 6,893 | 6,513 | ||||||
Citigroup Mortgage Loan Trust, Series 2020-EXP1, Class A1A, 1.804% 5/25/20602,3,7 | 204 | 186 | ||||||
COLT Mortgage Loan Trust, Series 2021-5, Class A1, 1.726% 11/26/20662,3,7 | 1,660 | 1,406 | ||||||
Connecticut Avenue Securities Trust, Series 2022-R06, Class 1M1, (30-day Average USD-SOFR + 2.75%) 6.678% 5/25/20422,3,7 | 326 | 330 | ||||||
Credit Suisse Mortgage Trust, Series 2020-NET, Class A, 2.257% 8/15/20372,7 | 1,575 | 1,409 | ||||||
Credit Suisse Mortgage Trust, Series 2017-RPL3, Class A1, 2.00% 1/25/20602,3,7 | 1,611 | 1,384 | ||||||
Finance of America Structured Securities Trust, Series 2019-JR1, Class A, 2.00% 3/25/20692,7 | 2,051 | 2,196 | ||||||
Finance of America Structured Securities Trust, Series 2019-JR2, Class A1, 2.00% 6/25/20692,7 | 2,604 | 2,677 | ||||||
Flagstar Mortgage Trust, Series 2021-5INV, Class A2, 2.50% 7/25/20512,3,7 | 2,073 | 1,674 | ||||||
Flagstar Mortgage Trust, Series 2021-6INV, Class A4, 2.50% 8/25/20512,3,7 | 1,937 | 1,562 | ||||||
Flagstar Mortgage Trust, Series 2021-8INV, Class A3, 2.50% 9/25/20512,3,7 | 2,038 | 1,646 | ||||||
Flagstar Mortgage Trust, Series 2021-10INV, Class A3, 2.50% 10/25/20512,3,7 | 3,206 | 2,589 | ||||||
Flagstar Mortgage Trust, Series 2021-11INV, Class A4, 2.50% 11/25/20512,3,7 | 2,222 | 1,794 | ||||||
Freddie Mac Structured Agency Credit Risk Debt Notes, Series 2015-DNA3, Class M3, (1-month USD-LIBOR + 4.70%) 9.089% 4/25/20283,7 | 1,497 | 1,548 | ||||||
Freddie Mac Structured Agency Credit Risk Debt Notes, Series 2022-DNA3, Class M1A, (30-day Average USD-SOFR + 2.00%) 5.928% 4/25/20422,3,7 | 1,537 | 1,531 | ||||||
Freddie Mac Structured Agency Credit Risk Debt Notes, Series 2022-DNA4, Class M1A, (30-day Average USD-SOFR + 2.20%) 6.128% 5/25/20422,3,7 | 73 | 73 | ||||||
Freddie Mac Structured Agency Credit Risk Debt Notes, Series 2022-DNA5, Class M1A, (30-day Average USD-SOFR + 2.95%) 6.878% 6/25/20422,3,7 | 278 | 281 | ||||||
Freddie Mac Structured Agency Credit Risk Debt Notes, Series 2022-DNA6, Class M1A, (30-day Average USD-SOFR + 2.15%) 6.078% 9/25/20422,3,7 | 611 | 612 | ||||||
Freddie Mac Structured Agency Credit Risk Debt Notes, Series 2022-DNA6, Class M1B, (30-day Average USD-SOFR + 3.70%) 7.628% 9/25/20422,3,7 | 1,519 | 1,552 | ||||||
Freddie Mac Structured Agency Credit Risk Debt Notes, Series 2020-DNA2, Class M2, (1-month USD-LIBOR + 1.85%) 6.239% 2/25/20502,3,7 | 3,005 | 3,000 | ||||||
Freddie Mac Structured Agency Credit Risk Debt Notes, Series 2020-DNA4, Class B1, (1-month USD-LIBOR + 6.00%) 10.389% 8/25/20502,3,7 | 949 | 1,011 | ||||||
GCAT Trust, Series 2021-NQM6, Class A1, 1.855% 8/25/20662,3,7 | 3,494 | 2,935 | ||||||
Home Partners of America Trust, Series 2021-2, Class A, 1.901% 12/17/20262,7 | 5,380 | 4,654 | ||||||
Hundred Acre Wood Trust, Series 2021-INV1, Class A3, 2.50% 7/25/20512,3,7 | 882 | 712 | ||||||
Legacy Mortgage Asset Trust, Series 2022-GS1, Class A1, 4.00% 2/25/2061 (7.00% on 4/25/2025)1,2,7 | 3,534 | 3,273 | ||||||
American Funds Insurance Series 197
Table of Contents
The Bond Fund of America (continued)
Bonds, notes & other debt instruments (continued)
| Principal amount | Value | |||||||
| (000) | (000) | |||||||
Mortgage-backed obligations (continued) | ||||||||
Collateralized mortgage-backed obligations (privately originated) (continued) | ||||||||
Legacy Mortgage Asset Trust, Series 2021-GS2, Class A1, 1.75% 4/25/20612,3,7 | USD | 858 | $ | 780 | ||||
Legacy Mortgage Asset Trust, Series 2021-GS5, Class A1, 2.25% 7/25/2067 (5.25% on 11/25/2024)1,2,7 | 2,644 | 2,380 | ||||||
Mello Warehouse Securitization Trust, Series 2021-3, Class A, (1-month USD-LIBOR + 0.85%) 5.239% 11/25/20552,3,7 | 16,160 | 15,635 | ||||||
MFRA Trust, Series 2021-RPL1, Class A1, 1.131% 7/25/20602,3,7 | 3,088 | 2,720 | ||||||
PRKCM Trust, Series 2021-AFC2, Class A1, 2.071% 11/25/20562,3,7 | 3,558 | 2,965 | ||||||
Progress Residential Trust, Series 2022-SFR3, Class A, 3.20% 4/17/20392,7 | 1,132 | 1,028 | ||||||
Reverse Mortgage Investment Trust, Series 2021-HB1, Class A, | ||||||||
1.259% 11/25/20312,3,7 | 3,346 | 3,155 | ||||||
Towd Point Mortgage Trust, Series 2020-4, Class A1, 1.75% 10/25/20602,7 | 10,737 | 9,539 | ||||||
Treehouse Park Improvement Association No.1 - Anleihen 9.75% 12/1/20332,10 | 1,680 | 1,486 | ||||||
Tricon Residential Trust, Series 2021-SFR1, Class A, 1.943% 7/17/20382,7 | 5,033 | 4,381 | ||||||
|
| |||||||
| 109,428 | ||||||||
|
| |||||||
Total mortgage-backed obligations | 2,638,566 | |||||||
|
| |||||||
Asset-backed obligations 4.52% | ||||||||
Affirm Asset Securitization Trust, Series 2021-B, Class A, 1.03% 8/17/20262,7 | 701 | 665 | ||||||
Affirm Asset Securitization Trust, Series 2021-Z2, Class A, 1.17% 11/16/20262,7 | 672 | 643 | ||||||
Affirm Asset Securitization Trust, Series 2022-X1, Class A, 1.75% 2/15/20272,7 | 765 | 744 | ||||||
AGL CLO, Ltd., Series 2022-18A, Class A1, | ||||||||
(3-month USD CME Term SOFR + 1.32%) 5.308% 4/21/20312,3,7 | — | 8 | — | 8 | ||||
American Credit Acceptance Receivables Trust, Series 2020-3, Class C, 1.85% 6/15/20262,7 | 1,178 | 1,169 | ||||||
American Credit Acceptance Receivables Trust, Series 2020-3, Class D, 2.40% 6/15/20262,7 | 2,500 | 2,429 | ||||||
American Credit Acceptance Receivables Trust, Series 2022-3, Class B, 4.55% 10/13/20262,7 | 360 | 353 | ||||||
American Credit Acceptance Receivables Trust, Series 2021-1, Class C, 0.83% 3/15/20272,7 | 1,055 | 1,038 | ||||||
American Credit Acceptance Receivables Trust, Series 2021-1, Class D, 1.14% 3/15/20272,7 | 806 | 760 | ||||||
American Homes 4 Rent, Series 2014-SFR2, Class A, 3.786% 10/17/20362,7 | 1,136 | 1,097 | ||||||
American Homes 4 Rent, Series 2015-SFR2, Class A, 3.732% 10/17/20522,7 | 2,781 | 2,631 | ||||||
American Homes 4 Rent, Series 2015-SFR2, Class B, 4.295% 10/17/20522,7 | 396 | 376 | ||||||
AmeriCredit Automobile Receivables Trust, Series 2021-2, Class B, 0.69% 1/19/20277 | 997 | 935 | ||||||
AmeriCredit Automobile Receivables Trust, Series 2021-2, Class C, 1.01% 1/19/20277 | 1,109 | 1,009 | ||||||
AmeriCredit Automobile Receivables Trust, Series 2021-2, Class D, 1.29% 6/18/20277 | 2,613 | 2,319 | ||||||
Avis Budget Rental Car Funding (AESOP), LLC, Series 2018-2A, Class A, 4.00% 3/20/20252,7 | 2,755 | 2,710 | ||||||
Avis Budget Rental Car Funding (AESOP), LLC, Series 2019-2A, Class A, 3.35% 9/22/20252,7 | 2,210 | 2,137 | ||||||
Avis Budget Rental Car Funding (AESOP), LLC, Series 2020-1A, Class A, 2.33% 8/20/20262,7 | 7,689 | 7,124 | ||||||
Avis Budget Rental Car Funding (AESOP), LLC, Series 2020-2, Class A, 2.02% 2/20/20272,7 | 2,427 | 2,203 | ||||||
Avis Budget Rental Car Funding (AESOP), LLC, Series 2020-2A, Class B, 2.96% 2/20/20272,7 | 623 | 560 | ||||||
Avis Budget Rental Car Funding (AESOP), LLC, Series 2020-2A, Class C, 4.25% 2/20/20272,7 | 1,279 | 1,144 | ||||||
Avis Budget Rental Car Funding (AESOP), LLC, Series 2021-1A, Class A, 1.38% 8/20/20272,7 | 3,445 | 3,005 | ||||||
Avis Budget Rental Car Funding (AESOP), LLC, Series 2021-1A, Class B, 1.63% 8/20/20272,7 | 531 | 449 | ||||||
Avis Budget Rental Car Funding (AESOP), LLC, Series 2021-1A, Class C, 2.13% 8/20/20272,7 | 193 | 161 | ||||||
Ballyrock CLO, Ltd., Series 2019-2A, Class A1AR, (3-month USD-LIBOR + 1.00%) 5.675% 11/20/20302,3,7 | 575 | 568 | ||||||
198 American Funds Insurance Series
Table of Contents
The Bond Fund of America (continued)
Bonds, notes & other debt instruments (continued)
Principal amount (000) | Value (000) | |||||||
Asset-backed obligations (continued) | ||||||||
Bankers Healthcare Group Securitization Trust, Series 2021-B, Class A, 0.90% 10/17/20342,7 | USD | 180 | $ | 170 | ||||
Bankers Healthcare Group Securitization Trust, Series 2021-B, Class B, 1.67% 10/17/20342,7 | 269 | 227 | ||||||
Blackbird Capital II Aircraft Lease, Ltd. / Blackbird Capital II Aircraft Lease US, LLC, Series 2021-1, Class A, 2.443% 7/15/20462,7 | 3,951 | 3,250 | ||||||
Blackbird Capital II Aircraft Lease, Ltd. / Blackbird Capital II Aircraft Lease US, LLC, Series 2021-1, Class B, 3.446% 7/15/20462,7 | 497 | 375 | ||||||
CarMax Auto Owner Trust, Series 2019-2, Class C, 3.16% 2/18/20257 | 400 | 396 | ||||||
CarMax Auto Owner Trust, Series 2021-1, Class C, 0.94% 12/15/20267 | 210 | 190 | ||||||
CarMax Auto Owner Trust, Series 2021-1, Class D, 1.28% 7/15/20277 | 206 | 184 | ||||||
Carvana Auto Receivables Trust, Series 2021-N4, Class C, 1.72% 9/11/20287 | 538 | 514 | ||||||
Castlelake Aircraft Securitization Trust, Series 2021-1, Class A, 2.868% 5/11/20372,7 | 15,953 | 13,578 | ||||||
Castlelake Aircraft Securitization Trust, Series 2021-1, Class C, 3.464% 5/11/20372,7 | 6,185 | 5,238 | ||||||
Castlelake Aircraft Securitization Trust, Series 2021-1, Class C, 6.171% 5/11/20372,7 | 671 | 544 | ||||||
Castlelake Aircraft Securitization Trust, Series 2017-1R, Class A, 2.741% 8/15/20412,7 | 802 | 702 | ||||||
CF Hippolyta, LLC, Series 2020-1, Class A1, 1.69% 7/15/20602,7 | 18,679 | 16,693 | ||||||
CF Hippolyta, LLC, Series 2020-1, Class A2, 1.99% 7/15/20602,7 | 1,950 | 1,613 | ||||||
CF Hippolyta, LLC, Series 2020-1, Class B1, 2.28% 7/15/20602,7 | 3,395 | 2,969 | ||||||
CF Hippolyta, LLC, Series 2020-1, Class B2, 2.60% 7/15/20602,7 | 368 | 291 | ||||||
CF Hippolyta, LLC, Series 2021-1, Class A1, 1.53% 3/15/20612,7 | 6,053 | 5,242 | ||||||
CF Hippolyta, LLC, Series 2021-1, Class B1, 1.98% 3/15/20612,7 | 1,917 | 1,602 | ||||||
CF Hippolyta, LLC, Series 2022-1, Class A1, 5.97% 8/15/20622,7 | 15,132 | 14,821 | ||||||
CF Hippolyta, LLC, Series 2022-1, Class A2, 6.11% 8/15/20622,7 | 6,637 | 6,257 | ||||||
CLI Funding VI, LLC, Series 2020-2A, Class A, 2.03% 9/15/20452,7 | 2,298 | 1,978 | ||||||
CLI Funding VI, LLC, Series 2020-3A, Class A, 2.07% 10/18/20452,7 | 4,800 | 4,174 | ||||||
CLI Funding VIII, LLC, Series 2021-1A, Class A, 2.38% 2/18/20462,7 | 436 | 363 | ||||||
CPS Auto Receivables Trust, Series 2019-B, Class D, 3.69% 3/17/20252,7 | 249 | 248 | ||||||
CPS Auto Receivables Trust, Series 2019-C, Class D, 3.17% 6/16/20252,7 | 405 | 404 | ||||||
CPS Auto Receivables Trust, Series 2022-B, Class A, 2.88% 6/15/20262,7 | 1,883 | 1,849 | ||||||
CPS Auto Receivables Trust, Series 2021-A, Class C, 0.83% 9/15/20262,7 | 514 | 507 | ||||||
CPS Auto Receivables Trust, Series 2021-A, Class D, 1.16% 12/15/20262,7 | 590 | 559 | ||||||
CPS Auto Receivables Trust, Series 2022-B, Class B, 3.88% 8/15/20282,7 | 2,111 | 2,033 | ||||||
CPS Auto Receivables Trust, Series 2022-B, Class C, 4.33% 8/15/20282,7 | 2,797 | 2,658 | ||||||
Drive Auto Receivables Trust, Series 2021-1, Class B, 0.65% 7/15/20257 | 86 | 86 | ||||||
Drive Auto Receivables Trust, Series 2019-3, Class D, 3.18% 10/15/20267 | 3,890 | 3,844 | ||||||
Drive Auto Receivables Trust, Series 2021-1, Class C, 1.02% 6/15/20277 | 5,369 | 5,249 | ||||||
Drive Auto Receivables Trust, Series 2021-1, Class D, 1.45% 1/16/20297 | 4,053 | 3,800 | ||||||
DriveTime Auto Owner Trust, Series 2019-2A, Class D, 3.48% 2/18/20252,7 | 2,320 | 2,309 | ||||||
DriveTime Auto Owner Trust, Series 2019-3, Class D, 2.96% 4/15/20252,7 | 1,473 | 1,454 | ||||||
DriveTime Auto Owner Trust, Series 2020-3A, Class C, 1.47% 6/15/20262,7 | 817 | 791 | ||||||
DriveTime Auto Owner Trust, Series 2021-1A, Class C, 0.84% 10/15/20262,7 | 825 | 792 | ||||||
DriveTime Auto Owner Trust, Series 2021-1A, Class D, 1.16% 11/16/20262,7 | 449 | 414 | ||||||
DriveTime Auto Owner Trust, Series 2021-2A, Class B, 0.81% 1/15/20272,7 | 1,179 | 1,156 | ||||||
DriveTime Auto Owner Trust, Series 2021-2A, Class C, 1.10% 2/16/20272,7 | 1,231 | 1,170 | ||||||
DriveTime Auto Owner Trust, Series 2021-2A, Class D, 1.50% 2/16/20272,7 | 832 | 764 | ||||||
EDvestinU Private Education Loan, LLC, Series 2021-A, Class A, 1.80% 11/25/20452,7 | 428 | 362 | ||||||
Enterprise Fleet Financing, LLC, Series 2022-3, Class A3, 4.29% 7/20/20292,7 | 897 | 851 | ||||||
Enterprise Fleet Financing, LLC, Series 2022-3, Class A2, 4.38% 7/20/20292,7 | 1,380 | 1,350 | ||||||
Exeter Automobile Receivables Trust, Series 2019-2A, Class D, 3.71% 3/17/20252,7 | 3,251 | 3,218 | ||||||
Exeter Automobile Receivables Trust, Series 2020-3A, Class C, 1.32% 7/15/20257 | 401 | 397 | ||||||
Exeter Automobile Receivables Trust, Series 2019-3A, Class D, 3.11% 8/15/20252,7 | 3,405 | 3,352 | ||||||
Exeter Automobile Receivables Trust, Series 2021-2, Class B, 0.57% 9/15/20257 | 721 | 716 | ||||||
Exeter Automobile Receivables Trust, Series 2022-2A, Class A3, 2.80% 11/17/20257 | 1,162 | 1,150 | ||||||
Exeter Automobile Receivables Trust, Series 2022-6, Class A2, 5.73% 11/17/20257 | 587 | 588 | ||||||
Exeter Automobile Receivables Trust, Series 2020-1A, Class D, 2.73% 12/15/20252,7 | 893 | 875 | ||||||
Exeter Automobile Receivables Trust, Series 2021-2, Class C, 0.98% 6/15/20267 | 1,807 | 1,737 | ||||||
Exeter Automobile Receivables Trust, Series 2020-3A, Class D, 1.73% 7/15/20267 | 1,012 | 975 | ||||||
Exeter Automobile Receivables Trust, Series 2022-2A, Class B, 3.65% 10/15/20267 | 3,047 | 2,976 | ||||||
Exeter Automobile Receivables Trust, Series 2022-4A, Class B, 4.57% 1/15/20277 | 568 | 558 | ||||||
Exeter Automobile Receivables Trust, Series 2021-2, Class D, 1.40% 4/15/20277 | 2,612 | 2,388 | ||||||
American Funds Insurance Series 199
Table of Contents
The Bond Fund of America (continued)
Bonds, notes & other debt instruments (continued)
Principal amount (000) | Value (000) | |||||||
Asset-backed obligations (continued) | ||||||||
Exeter Automobile Receivables Trust, Series 2022-2A, Class D, 4.56% 7/17/20287 | USD1,201 | $ | 1,127 | |||||
FirstKey Homes Trust, Series 2020-SFR2, Class A, 1.266% 10/19/20372,7 | 17,959 | 15,928 | ||||||
FirstKey Homes Trust, Series 2021-SFR3, Class A, 2.135% 12/17/20382,7 | 1,380 | 1,195 | ||||||
FirstKey Homes Trust, Series 2022-SFR2, Class A, 4.145% 5/17/20392,7 | 1,733 | 1,628 | ||||||
Ford Credit Auto Owner Trust, Series 2018-2, Class A, 3.47% 1/15/20302,7 | 17,675 | 17,438 | ||||||
Ford Credit Auto Owner Trust, Series 2018-1, Class A, 3.19% 7/15/20312,7 | 30,070 | 28,744 | ||||||
GCI Funding I, LLC, Series 2020-1, Class A, 2.82% 10/18/20452,7 | 2,069 | 1,827 | ||||||
GCI Funding I, LLC, Series 2021-1, Class A, 2.38% 6/18/20462,7 | 1,421 | 1,210 | ||||||
GCI Funding I, LLC, Series 2021-1, Class B, 3.04% 6/18/20462,7 | 158 | 134 | ||||||
Global SC Finance VII SRL, Series 2020-2A, Class A, 2.26% 11/19/20402,7 | 2,868 | 2,550 | ||||||
Global SC Finance VII SRL, Series 2021-1A, Class A, 1.86% 4/17/20412,7 | 9,797 | 8,450 | ||||||
Global SC Finance VII SRL, Series 2021-2A, Class A, 1.95% 8/17/20412,7 | 2,739 | 2,378 | ||||||
Global SC Finance VII SRL, Series 2021-2A, Class B, 2.49% 8/17/20412,7 | 214 | 181 | ||||||
GM Financial Automobile Leasing Trust, Series 2020-2, Class C, 2.56% 7/22/20247 | 301 | 300 | ||||||
GM Financial Automobile Leasing Trust, Series 2020-2, Class D, 3.21% 12/20/20247 | 425 | 424 | ||||||
GM Financial Revolving Receivables Trust, Series 2022-1, Class A, 5.91% 10/11/20352,7 | 2,703 | 2,756 | ||||||
Hertz Vehicle Financing III, LLC, Series 2021-A, Class B, 3.65% 6/30/20232,7,10 | 8,590 | 8,241 | ||||||
Hertz Vehicle Financing III, LLC, Series 2021-1A, Class A, 1.21% 12/26/20252,7 | 12,703 | 11,748 | ||||||
Hertz Vehicle Financing III, LLC, Series 2021-1A, Class B, 1.56% 12/26/20252,7 | 1,171 | 1,074 | ||||||
Hertz Vehicle Financing III, LLC, Series 2021-1A, Class C, 2.05% 12/26/20252,7 | 810 | 731 | ||||||
Hertz Vehicle Financing III, LLC, Series 2021-2A, Class A, 1.68% 12/27/20272,7 | 17,770 | 15,498 | ||||||
Hertz Vehicle Financing III, LLC, Series 2021-2A, Class B, 2.12% 12/27/20272,7 | 1,264 | 1,085 | ||||||
Hertz Vehicle Financing III, LLC, Series 2021-2A, Class C, 2.52% 12/27/20272,7 | 859 | 710 | ||||||
LAD Auto Receivables Trust, Series 2021-1A, Class A, 1.30% 8/17/20262,7 | 866 | 842 | ||||||
LAD Auto Receivables Trust, Series 2021-1A, Class B, 1.94% 11/16/20262,7 | 304 | 285 | ||||||
LAD Auto Receivables Trust, Series 2022-1, Class A, 5.21% 6/15/20272,7 | 1,207 | 1,188 | ||||||
LAD Auto Receivables Trust, Series 2022-1, Class B, 5.87% 9/15/20272,7 | 438 | 426 | ||||||
LAD Auto Receivables Trust, Series 2022-1, Class C, 6.85% 4/15/20302,7 | 623 | 596 | ||||||
Madison Park Funding, Ltd., CLO, Series 2015-17A, Class AR2, (3-month USD-LIBOR + 1.00%) 5.278% 7/21/20302,3,7 | 892 | 878 | ||||||
Marathon CLO, Ltd., Series 2017-9A, Class A1AR, (3-month USD-LIBOR + 1.15%) 5.229% 4/15/20292,3,7 | 574 | 568 | ||||||
Mission Lane Credit Card Master Trust, Series 2021-A, Class A, 1.59% 9/15/20262,7 | 1,242 | 1,203 | ||||||
Mission Lane Credit Card Master Trust, Series 2021-A, Class B, 2.24% 9/15/20262,7 | 230 | 223 | ||||||
Mission Lane Credit Card Master Trust, Series 2022-B, Class A1, 8.25% 1/15/20287,10,11 | 1,006 | 1,006 | ||||||
Mission Lane Credit Card Master Trust, Series 2022-B, Class A2, 8.73% 1/15/20287,10,11 | 150 | 150 | ||||||
Navient Student Loan Trust, Series 2021-C, Class A, 1.06% 10/15/20692,7 | 4,052 | 3,449 | ||||||
Navient Student Loan Trust, Series 2021-EA, Class A, 0.97% 12/16/20692,7 | 2,516 | 2,110 | ||||||
Navient Student Loan Trust, Series 2021-G, Class A, 1.58% 4/15/20702,7 | 895 | 759 | ||||||
Navigator Aircraft ABS, Ltd., Series 2021-1, Class A, 2.771% 11/15/20462,7 | 4,396 | 3,702 | ||||||
Nelnet Student Loan Trust, Series 2021-C, Class AFX, 1.32% 4/20/20622,7 | 314 | 279 | ||||||
Nelnet Student Loan Trust, Series 2021-A, Class APT1, 1.36% 4/20/20622,7 | 5,377 | 4,762 | ||||||
Nelnet Student Loan Trust, Series 2021-B, Class AFX, 1.42% 4/20/20622,7 | 12,315 | 10,951 | ||||||
Nelnet Student Loan Trust, Series 2021-C, Class AFL, (1-month USD-LIBOR + 0.74%) 5.093% 4/20/20622,3,7 | 4,035 | 3,918 | ||||||
New Economy Assets Phase 1 Issuer, LLC, Series 2021-1, Class A1, 1.91% 10/20/20612,7 | 50,765 | 42,988 | ||||||
Newark BSL CLO 2, Ltd., Series 2017-1A, Class A1R, (3-month USD-LIBOR + 0.97%) 5.328% 7/25/20302,3,7 | 273 | 270 | ||||||
Oportun Funding, LLC, Series 2021-A, Class A, 1.21% 3/8/20282,7 | 240 | 224 | ||||||
Palmer Square Loan Funding, CLO, Series 2021-1, Class A1, (3-month USD-LIBOR + 0.90%) 5.143% 4/20/20292,3,7 | 256 | 253 | ||||||
PFS Financing Corp., Series 2021-B, Class A, 0.775% 8/17/20262,7 | 7,884 | 7,276 | ||||||
PFS Financing Corp., Series 2022-D, Class A, 4.27% 8/16/20272,7 | 1,721 | 1,681 | ||||||
Prestige Auto Receivables Trust, Series 2019-1A, Class C, 2.70% 10/15/20242,7 | 804 | 802 | ||||||
Prestige Auto Receivables Trust, Series 2019-1A, Class D, 3.01% 8/15/20252,7 | 1,355 | 1,341 | ||||||
Prodigy Finance DAC, Series 2021-1A, Class A, (1-month USD-LIBOR + 1.25%) 5.639% 7/25/20512,3,7 | 577 | 558 | ||||||
200 American Funds Insurance Series
Table of Contents
The Bond Fund of America (continued)
Bonds, notes & other debt instruments (continued)
| Principal amount (000) | Value (000) | |||||||
Asset-backed obligations (continued) | ||||||||
Santander Drive Auto Receivables Trust, Series 2019-2, Class D, 3.22% 7/15/20257 | USD1,584 | $ | 1,574 | |||||
Santander Drive Auto Receivables Trust, Series 2021-2, Class B, 0.59% 9/15/20257 | 523 | 521 | ||||||
Santander Drive Auto Receivables Trust, Series 2020-3, Class C, 1.12% 1/15/20267 | 1,480 | 1,467 | ||||||
Santander Drive Auto Receivables Trust, Series 2021-2, Class C, 0.90% 6/15/20267 | 2,812 | �� | 2,736 | |||||
Santander Drive Auto Receivables Trust, Series 2020-3, Class D, 1.64% 11/16/20267 | 2,211 | 2,120 | ||||||
Santander Drive Auto Receivables Trust, Series 2022-5, Class B, 4.43% 3/15/20277 | 917 | 892 | ||||||
Santander Drive Auto Receivables Trust, Series 2021-2, Class D, 1.35% 7/15/20277 | 1,802 | 1,686 | ||||||
Santander Drive Auto Receivables Trust, Series 2021-3, Class C, 0.95% 9/15/20277 | 1,677 | 1,613 | ||||||
Santander Drive Auto Receivables Trust, Series 2021-3, Class D, 1.33% 9/15/20277 | 2,236 | 2,073 | ||||||
Santander Drive Auto Receivables Trust, Series 2022-5, Class C, 4.74% 10/15/20287 | 856 | 828 | ||||||
SLAM, Ltd., Series 2021-1, Class A, 2.434% 6/15/20462,7 | 2,641 | 2,190 | ||||||
SLAM, Ltd., Series 2021-1, Class B, 3.422% 6/15/20462,7 | 487 | 397 | ||||||
SOLRR Aircraft Aviation Holding, Ltd., Series 2021-1, Class A, 2.636% 10/15/20462,7 | 2,392 | 1,923 | ||||||
SPRITE, Ltd., Series 2021-1, Class A, 3.75% 11/15/20462,7 | 3,233 | 2,805 | ||||||
Stellar Jay Ireland DAC, Series 2021-1, Class A, 3.967% 10/15/20412,7 | 451 | 381 | ||||||
Stonepeak Infrastructure Partners, Series 2021-1A, Class AA, 2.301% 2/28/20332,7 | 1,243 | 1,108 | ||||||
Stonepeak Infrastructure Partners, Series 2021-1A, Class A, 2.675% 2/28/20332,7 | 1,441 | 1,245 | ||||||
SuttonPark Structured Settlements, Series 2021-1, Class A, 1.95% 9/15/20752,7 | 2,300 | 2,092 | ||||||
TAL Advantage V, LLC, Series 2020-1A, Class A, 2.05% 9/20/20452,7 | 2,971 | 2,610 | ||||||
Textainer Marine Containers, Ltd., Series 2020-1A, Class A, 2.73% 8/21/20452,7 | 1,252 | 1,135 | ||||||
Textainer Marine Containers, Ltd., Series 2020-2A, Class A, 2.10% 9/20/20452,7 | 2,223 | 1,939 | ||||||
Textainer Marine Containers, Ltd., Series 2021-1A, Class A, 1.68% 2/20/20462,7 | 6,190 | 5,211 | ||||||
Textainer Marine Containers, Ltd., Series 2021-1A, Class B, 2.52% 2/20/20462,7 | 346 | 288 | ||||||
Textainer Marine Containers, Ltd., Series 2021-2A, Class A, 2.23% 4/20/20462,7 | 5,200 | 4,431 | ||||||
TIF Funding II, LLC, Series 2020-1A, Class A, 2.09% 8/20/20452,7 | 4,358 | 3,747 | ||||||
TIF Funding II, LLC, Series 2021-1A, Class B, 2.54% 2/20/20462,7 | 130 | 107 | ||||||
Toyota Auto Loan Extended Note Trust, Series 2019-1, Class A, 2.56% 11/25/20312,7 | 6,000 | 5,785 | ||||||
Triton Container Finance VIII, LLC, Series 2020-1, Class A, 2.11% 9/20/20452,7 | 10,418 | 8,932 | ||||||
Triton Container Finance VIII, LLC, Series 2021-1, Class A, 1.86% 3/20/20462,7 | 3,563 | 2,978 | ||||||
Triton Container Finance VIII, LLC, Series 2021-1A, Class B, 2.58% 3/20/20462,7 | 346 | 285 | ||||||
Westlake Automobile Receivables Trust, Series 2020-3A, Class C, 1.24% 11/17/20252,7 | 1,557 | 1,518 | ||||||
Westlake Automobile Receivables Trust, Series 2020-3A, Class D, 1.65% 2/17/20262,7 | 3,023 | 2,866 | ||||||
Westlake Automobile Receivables Trust, Series 2021-2, Class B, 0.62% 7/15/20262,7 | 1,690 | 1,632 | ||||||
Westlake Automobile Receivables Trust, Series 2021-2, Class C, 0.89% 7/15/20262,7 | 2,181 | 2,050 | ||||||
Westlake Automobile Receivables Trust, Series 2021-2, Class D, 1.23% 12/15/20262,7 | 1,446 | 1,318 | ||||||
|
| |||||||
| 461,708 | ||||||||
|
| |||||||
Municipals 1.62% | ||||||||
California 0.03% | ||||||||
G.O. Bonds, Series 2009, 7.50% 4/1/2034 | 2,100 | 2,541 | ||||||
Golden State Tobacco Securitization Corp., Enhanced Tobacco Settlement Asset-Backed Bonds, Series 2021-B, 2.746% 6/1/2034 | 650 | 523 | ||||||
|
| |||||||
| 3,064 | ||||||||
|
| |||||||
Illinois 1.47% | ||||||||
City of Chicago, Board of Education, Unlimited Tax G.O. Bonds (Dedicated Rev.), Series 2010-C, 6.319% 11/1/2029 | 65 | 61 | ||||||
City of Chicago, Board of Education, Unlimited Tax G.O. Bonds (Dedicated Rev.), Series 2009-E, 6.138% 12/1/2039 | 30,835 | 26,399 | ||||||
City of Chicago, Board of Education, Unlimited Tax G.O. Bonds (Dedicated Rev.), Series 2010-D, 6.519% 12/1/2040 | 8,945 | 7,689 | ||||||
City of Chicago, Board of Education, Unlimited Tax G.O. Bonds (Qualified School Construction Bonds), Series 2009-G, 1.75% 12/15/2025 | 2,500 | 2,155 | ||||||
| G.O. Bonds, Series 2013-B, 4.31% 4/1/2023 | 2,125 | 2,122 | ||||||
| G.O. Bonds, Pension Funding, Series 2003, 4.95% 6/1/2023 | 6,228 | 6,231 | ||||||
| G.O. Bonds, Pension Funding, Series 2003, 5.10% 6/1/2033 | 107,000 | 102,807 | ||||||
| G.O. Bonds, Taxable Build America Bonds, Series 2010-2, 5.95% 3/1/2023 | 3,210 | 3,215 | ||||||
|
| |||||||
| 150,679 | ||||||||
|
| |||||||
American Funds Insurance Series 201
Table of Contents
The Bond Fund of America (continued)
Bonds, notes & other debt instruments (continued)
Principal amount (000) | Value (000) | |||||||
Municipals (continued) | ||||||||
New York 0.05% | ||||||||
Dormitory Auth., Taxable State Personal Income Tax Rev. Bonds (General Purpose), Series 2021-C, 2.202% 3/15/2034 | USD6,390 | $ | 4,881 | |||||
|
| |||||||
Texas 0.03% | ||||||||
Grand Parkway Transportation Corp., Grand Parkway System Toll Rev. Ref. Bonds, Series 2020-B, 3.236% 10/1/2052 | 4,075 | 2,899 | ||||||
|
| |||||||
Wisconsin 0.04% | ||||||||
Public Fin. Auth., Federal Lease Rev. Bonds (Fort Sam Acquisition Fncg.), Series 2022, 4.95% 3/1/2034 | 4,580 | 4,071 | ||||||
|
| |||||||
Total municipals | 165,594 | |||||||
|
| |||||||
Bonds & notes of governments & government agencies outside the U.S. 1.29% | ||||||||
Chile (Republic of) 3.50% 1/31/2034 | 600 | 513 | ||||||
Chile (Republic of) 3.10% 5/7/2041 | 2,340 | 1,689 | ||||||
Chile (Republic of) 4.34% 3/7/2042 | 1,320 | 1,120 | ||||||
Chile (Republic of) 4.00% 1/31/2052 | 580 | 450 | ||||||
Colombia (Republic of) 4.125% 5/15/2051 | 3,120 | 1,878 | ||||||
Colombia (Republic of), Series B, 5.75% 11/3/2027 | COP | 24,813,800 | 3,883 | |||||
Dominican Republic 5.95% 1/25/20272 | USD8,100 | 7,954 | ||||||
Indonesia (Republic of) 4.65% 9/20/2032 | 2,690 | 2,638 | ||||||
Indonesia (Republic of) 3.35% 3/12/2071 | 1,660 | 1,109 | ||||||
Indonesia (Republic of), Series 91, 6.375% 4/15/2032 | IDR | 31,265,000 | 1,936 | |||||
Israel (State of) 1.00% 3/31/2030 | ILS | 11,800 | 2,799 | |||||
Israel (State of) 3.375% 1/15/2050 | USD | 4,750 | 3,670 | |||||
Israel (State of) 3.875% 7/3/2050 | 4,775 | 4,036 | ||||||
Malaysia (Federation of), Series 0219, 3.885% 8/15/2029 | MYR | 5,290 | 1,193 | |||||
Panama (Republic of) 3.362% 6/30/2031 | USD | 15,625 | 12,695 | |||||
Panama (Republic of) 3.87% 7/23/2060 | 7,500 | 4,863 | ||||||
Panama (Republic of) 4.50% 1/19/2063 | 395 | 280 | ||||||
Paraguay (Republic of) 5.00% 4/15/2026 | 1,250 | 1,248 | ||||||
Peru (Republic of) 6.35% 8/12/2028 | PEN | 5,840 | 1,463 | |||||
Peru (Republic of) 5.94% 2/12/2029 | 6,005 | 1,450 | ||||||
Peru (Republic of) 2.783% 1/23/2031 | USD | 2,155 | 1,788 | |||||
Peru (Republic of) 6.15% 8/12/2032 | PEN | 12,950 | 2,998 | |||||
Peru (Republic of) 3.60% 1/15/2072 | USD | 7,640 | 4,999 | |||||
Philippines (Republic of) 3.229% 3/29/2027 | 475 | 457 | ||||||
Philippines (Republic of) 3.20% 7/6/2046 | 4,900 | 3,598 | ||||||
Philippines (Republic of) 4.20% 3/29/2047 | 272 | 234 | ||||||
Poland (Republic of) 5.75% 11/16/2032 | 555 | 593 | ||||||
Portuguese Republic 5.125% 10/15/2024 | 24,775 | 24,868 | ||||||
PT Indonesia Asahan Aluminium Tbk 5.71% 11/15/20232 | 1,020 | 1,023 | ||||||
PT Indonesia Asahan Aluminium Tbk 4.75% 5/15/20252 | 1,270 | 1,251 | ||||||
PT Indonesia Asahan Aluminium Tbk 5.45% 5/15/20302 | 340 | 324 | ||||||
PT Indonesia Asahan Aluminium Tbk 5.80% 5/15/20502 | 1,150 | 966 | ||||||
Qatar (State of) 4.50% 4/23/20282 | 5,100 | 5,141 | ||||||
Qatar (State of) 5.103% 4/23/20482 | 3,400 | 3,425 | ||||||
Romania 3.75% 2/7/2034 | EUR | 5,625 | 4,515 | |||||
Saudi Arabia (Kingdom of) 3.628% 4/20/20272 | USD | 5,000 | 4,846 | |||||
Saudi Arabia (Kingdom of) 3.625% 3/4/20282 | 11,435 | 10,939 | ||||||
United Mexican States 4.875% 5/19/2033 | 2,175 | 2,001 | ||||||
United Mexican States 3.50% 2/12/2034 | 1,030 | 827 | ||||||
United Mexican States 4.40% 2/12/2052 | 440 | 325 | ||||||
|
| |||||||
| 131,985 | ||||||||
|
| |||||||
202 American Funds Insurance Series
Table of Contents
The Bond Fund of America (continued)
Bonds, notes & other debt instruments (continued)
| Principal amount | Value | |||||||
| (000) | (000) | |||||||
Federal agency bonds & notes 0.11% | ||||||||
Fannie Mae 2.125% 4/24/2026 | USD11,910 | $ | 11,160 | |||||
|
| |||||||
Total bonds, notes & other debt instruments (cost: $10,540,248,000) | 9,747,773 | |||||||
|
| |||||||
| Shares | ||||||||
Short-term securities 13.95% | ||||||||
Money market investments 13.95% | ||||||||
Capital Group Central Cash Fund 4.31%12,13 | 14,258,627 | 1,425,720 | ||||||
|
| |||||||
Total short-term securities (cost: $1,425,522,000) | 1,425,720 | |||||||
|
| |||||||
Total investment securities 109.32% (cost: $11,965,770,000) | 11,173,493 | |||||||
Other assets less liabilities (9.32)% | (952,411 | ) | ||||||
|
| |||||||
Net assets 100.00% | $ | 10,221,082 | ||||||
|
| |||||||
Futures contracts
Contracts | Type | Number of contracts | Expiration | Notional amount (000) | Value and unrealized appreciation (depreciation) at 12/31/2022 (000) | |||||||||||||||
3 Month SOFR Futures | Short | 658 | June 2023 | USD | (156,415) | $ | 2,698 | |||||||||||||
2 Year U.S. Treasury Note Futures | Short | 2,055 | March 2023 | (421,436 | ) | 1,029 | ||||||||||||||
5 Year Euro-Bobl Futures | Long | 1 | March 2023 | 124 | (4 | ) | ||||||||||||||
5 Year U.S. Treasury Note Futures | Long | 16,226 | March 2023 | 1,751,267 | (2,467 | ) | ||||||||||||||
10 Year U.S. Treasury Note Futures | Long | 2,294 | March 2023 | 257,609 | (1,391 | ) | ||||||||||||||
10 Year Ultra U.S. Treasury Note Futures | Short | 1,388 | March 2023 | (164,174 | ) | 2,514 | ||||||||||||||
20 Year U.S. Treasury Bond Futures | Long | 999 | March 2023 | 125,218 | (2,035 | ) | ||||||||||||||
30 Year Ultra U.S. Treasury Bond Futures | Long | 1,708 | March 2023 | 229,406 | (7,297 | ) | ||||||||||||||
|
| |||||||||||||||||||
| $ | (6,953 | ) | ||||||||||||||||||
|
| |||||||||||||||||||
Forward currency contracts
| Contract amount | Counterparty | Settlement date | Unrealized appreciation (depreciation) | |||||||||||||
| Currency purchased (000) | Currency sold (000) | at 12/31/2022 (000) | ||||||||||||||
| USD | 1,965 | IDR | 30,407,000 | Citibank | 1/9/2023 | $ | 11 | |||||||||
| USD | 3,158 | ILS | 10,725 | HSBC Bank | 1/11/2023 | 106 | ||||||||||
| USD | 1,173 | MYR | 5,150 | HSBC Bank | 1/11/2023 | (4 | ) | |||||||||
| USD | 1,248 | EUR | 1,180 | Morgan Stanley | 1/11/2023 | (16 | ) | |||||||||
| USD | 4,761 | COP | 22,893,650 | Citibank | 1/13/2023 | 52 | ||||||||||
| USD | 5,947 | EUR | 5,628 | JPMorgan Chase | 1/13/2023 | (84 | ) | |||||||||
| USD | 613 | EUR | 582 | JPMorgan Chase | 1/20/2023 | (11 | ) | |||||||||
| USD | 5,952 | PEN | 22,885 | Citibank | 1/23/2023 | (59 | ) | |||||||||
| JPY | 3,460,300 | USD | 24,759 | Morgan Stanley | 2/17/2023 | 1,783 | ||||||||||
| JPY | 3,432,900 | USD | 25,173 | Morgan Stanley | 2/17/2023 | 1,158 | ||||||||||
| JPY | 3,448,400 | USD | 25,841 | Morgan Stanley | 3/17/2023 | 711 | ||||||||||
|
| |||||||||||||||
| $ | 3,647 | |||||||||||||||
|
| |||||||||||||||
American Funds Insurance Series 203
Table of Contents
The Bond Fund of America (continued)
Swap contracts
Interest rate swaps
Centrally cleared interest rate swaps
Receive | Pay | Expiration date | Notional amount (000) | Value at 12/31/2022 (000) | Upfront premium paid (000) | Unrealized appreciation (depreciation) at 12/31/2022 (000) | ||||||||||||||||||||||||||
Rate | Payment frequency | Rate | Payment frequency | |||||||||||||||||||||||||||||
SOFR | Annual | 0.471% | Annual | 10/26/2023 | USD87,775 | $ | 3,103 | $ | — | $ | 3,103 | |||||||||||||||||||||
0.45801% | Annual | SOFR | Annual | 10/26/2023 | 85,775 | (3,041 | ) | — | (3,041 | ) | ||||||||||||||||||||||
3.497% | Annual | U.S. EFFR | Annual | 6/16/2024 | 27,000 | (479 | ) | — | (479 | ) | ||||||||||||||||||||||
3.52647% | Annual | U.S. EFFR | Annual | 6/16/2024 | 72,532 | (1,257 | ) | — | (1,257 | ) | ||||||||||||||||||||||
3.5291% | Annual | U.S. EFFR | Annual | 6/16/2024 | 78,378 | (1,355 | ) | — | (1,355 | ) | ||||||||||||||||||||||
3.4585% | Annual | U.S. EFFR | Annual | 6/17/2024 | 4,154 | (76 | ) | — | (76 | ) | ||||||||||||||||||||||
3.4325% | Annual | U.S. EFFR | Annual | 6/17/2024 | 19,800 | (369 | ) | — | (369 | ) | ||||||||||||||||||||||
4.5645% | Annual | U.S. EFFR | Annual | 10/19/2024 | 19,200 | (5 | ) | — | (5 | ) | ||||||||||||||||||||||
4.533% | Annual | U.S. EFFR | Annual | 10/20/2024 | 23,900 | (20 | ) | — | (20 | ) | ||||||||||||||||||||||
4.56% | Annual | U.S. EFFR | Annual | 10/27/2024 | 24,000 | (4 | ) | — | (4 | ) | ||||||||||||||||||||||
4.5245% | Annual | U.S. EFFR | Annual | 10/27/2024 | 28,800 | (23 | ) | — | (23 | ) | ||||||||||||||||||||||
3-month USD-LIBOR | Quarterly | 1.972% | Semi-annual | 4/26/2051 | 23,200 | 6,475 | — | 6,475 | ||||||||||||||||||||||||
3-month USD-LIBOR | Quarterly | 1.9855% | Semi-annual | 4/26/2051 | 8,580 | 2,374 | — | 2,374 | ||||||||||||||||||||||||
3-month USD-LIBOR | Quarterly | 1.9778% | Semi-annual | 4/28/2051 | 13,500 | 3,753 | — | 3,753 | ||||||||||||||||||||||||
|
|
|
|
|
| |||||||||||||||||||||||||||
| $ | 9,076 | $ | — | $ | 9,076 | |||||||||||||||||||||||||||
|
|
|
|
|
| |||||||||||||||||||||||||||
Credit default swaps
Centrally cleared credit default swaps on credit indices — buy protection
Reference index | Financing rate paid | Payment frequency | Expiration date | Notional amount (000) | Value at 12/31/2022 (000) | Upfront premium (received) paid (000) | Unrealized depreciation at 12/31/2022 (000) | |||||||||||||||||||||
CDX.NA.IG.39 | 1.00 | % | Quarterly | 12/20/2027 | USD74,676 | $ | (597 | ) | $ | (310 | ) | $ | (287 | ) | ||||||||||||||
CDX.NA.HY.39 | 5.00 | % | Quarterly | 12/20/2027 | 153,455 | (945 | ) | 5,777 | (6,722 | ) | ||||||||||||||||||
|
|
|
|
|
| |||||||||||||||||||||||
| $ | (1,542 | ) | $ | 5,467 | $ | (7,009 | ) | |||||||||||||||||||||
|
|
|
|
|
| |||||||||||||||||||||||
Investments in affiliates13
| Value of affiliate at 1/1/2022 (000) | Additions (000) | Reductions (000) | Net realized loss (000) | Net unrealized appreciation (000) | Value of affiliate at 12/31/2022 (000) | Dividend income (000) | ||||||||||||||||||||||
Short-term securities 13.95% | ||||||||||||||||||||||||||||
Money market investments 13.95% | ||||||||||||||||||||||||||||
Capital Group Central Cash Fund 4.31%12 | $ | 1,311,257 | $ | 4,011,285 | $ | 3,896,680 | $ | (218 | ) | $ | 76 | $ | 1,425,720 | $ | 34,880 | |||||||||||||
204 American Funds Insurance Series
Table of Contents
The Bond Fund of America (continued)
Restricted securities11
| Acquisition date | Cost (000) | Value (000) | Percent of net assets | |||||||||||||
Mission Lane Credit Card Master Trust, Series 2022-B, Class A1, 8.25% 1/15/20287,10 | 12/6/2022 | $ | 1,006 | $ | 1,006 | .01 | % | |||||||||
Mission Lane Credit Card Master Trust, Series 2022-B, Class A2, 8.73% 1/15/20287,10 | 12/6/2022 | 150 | 150 | .00 | ||||||||||||
|
|
|
|
|
| |||||||||||
Total | $ | 1,156 | $ | 1,156 | .01 | % | ||||||||||
|
|
|
|
|
| |||||||||||
| 1 | Step bond; coupon rate may change at a later date. |
| 2 | Acquired in a transaction exempt from registration under Rule 144A or, for commercial paper, Section 4(a)(2) of the Securities Act of 1933. May be resold in the U.S. in transactions exempt from registration, normally to qualified institutional buyers. The total value of all such securities was $1,530,868,000, which represented 14.98% of the net assets of the fund. |
| 3 | Coupon rate may change periodically. Reference rate and spread are as of the most recent information available. Some coupon rates are determined by the issuer or agent based on current market conditions; therefore, the reference rate and spread are not available. |
| 4 | Payment in kind; the issuer has the option of paying additional securities in lieu of cash. Payment methods and rates are as of the most recent payment when available. |
| 5 | All or a portion of this security was pledged as collateral. The total value of pledged collateral was $58,239,000, which represented .57% of the net assets of the fund. |
| 6 | Index-linked bond whose principal amount moves with a government price index. |
| 7 | Principal payments may be made periodically. Therefore, the effective maturity date may be earlier than the stated maturity date. |
| 8 | Amount less than one thousand. |
| 9 | Purchased on a TBA basis. |
| 10 | Value determined using significant unobservable inputs. |
| 11 | Restricted security, other than Rule 144A securities or commercial paper issued pursuant to Section 4(a)(2) of the Securities Act of 1933. The total value of all such restricted securities was $1,156,000, which represented .01% of the net assets of the fund. |
| 12 | Rate represents the seven-day yield at 12/31/2022. |
13 Part of the same “group of investment companies“ as the fund as defined under the Investment Company Act of 1940, as amended.
Key to abbreviations
Assn. = Association
Auth. = Authority
CLO = Collateralized Loan Obligations
CME = CME Group
CMO = Collateralized Mortgage Obligations
COP = Colombian pesos
DAC = Designated Activity Company
EFFR = Effective Federal Funds Rate
EUR = Euros
Fin. = Finance
Fncg. = Financing
G.O. = General Obligation
ICE = Intercontinental Exchange, Inc.
IDR = Indonesian rupiah
ILS = Israeli shekels
JPY = Japanese yen
LIBOR = London Interbank Offered Rate
MYR = Malaysian ringgits
PEN = Peruvian nuevos soles
PIK = Payment In Kind
Ref. = Refunding
Rev. = Revenue
SOFR = Secured Overnight Financing Rate
TBA = To be announced
USD = U.S. dollars
Refer to the notes to financial statements.
American Funds Insurance Series 205
Table of Contents
Investment portfolio December 31, 2022
Bonds, notes & other debt instruments 90.28%
Principal amount (000) | Value (000) | |||||||
Euros 19.79% | ||||||||
AIA Group, Ltd. 0.88% 9/9/2033 (5-year EUR Annual Swap + 1.10% on 9/9/2028)1 | EUR | 2,800 | $ | 2,333 | ||||
Allianz SE 4.75% perpetual bonds (3-month EUR-EURIBOR + 3.60% on 10/24/2023)1 | 4,200 | 4,471 | ||||||
Altria Group, Inc. 1.00% 2/15/2023 | 1,020 | 1,089 | ||||||
Altria Group, Inc. 2.20% 6/15/2027 | 2,900 | 2,795 | ||||||
Altria Group, Inc. 3.125% 6/15/2031 | 800 | 711 | ||||||
American Honda Finance Corp. 1.95% 10/18/2024 | 560 | 584 | ||||||
American Tower Corp. 0.45% 1/15/2027 | 2,525 | 2,321 | ||||||
American Tower Corp. 0.875% 5/21/2029 | 1,470 | 1,257 | ||||||
AT&T, Inc. 1.60% 5/19/2028 | 2,350 | 2,237 | ||||||
Austria (Republic of) 0% 2/20/2031 | 6,900 | 5,785 | ||||||
Banco de Sabadell, SA 2.625% 3/24/2026 (5-year EUR Mid-Swap + 2.20% on 3/24/2025)1 | 500 | 504 | ||||||
Bank of America Corp. 3.648% 3/31/2029 (3-month EUR-EURIBOR + 3.67% on 3/31/2028)1,2 | 5,000 | 5,177 | ||||||
CaixaBank, SA 2.25% 4/17/2030 (5-year EUR Annual (vs. 6-month EUR-EURIBOR) + 1.68% on 4/17/2025)1 | 2,400 | 2,345 | ||||||
Celanese US Holdings, LLC 4.777% 7/19/2026 | 235 | 240 | ||||||
Deutsche Bank AG 4.00% 6/24/2032 (3-month EUR-EURIBOR + 3.30% on 6/24/2027)1 | 700 | 665 | ||||||
Deutsche Telekom International Finance BV 7.50% 1/24/2033 | 200 | 273 | ||||||
Dow Chemical Co. 0.50% 3/15/2027 | 1,110 | 1,035 | ||||||
E.ON SE 1.625% 3/29/2031 | 810 | 731 | ||||||
Egypt (Arab Republic of) 5.625% 4/16/2030 | 300 | 224 | ||||||
Equinor ASA 1.375% 5/22/2032 | 2,550 | 2,267 | ||||||
European Investment Bank 0.25% 1/20/2032 | 4,900 | 4,085 | ||||||
European Investment Bank 1.50% 6/15/2032 | 1,000 | 932 | ||||||
European Union 0% 7/6/2026 | 1,600 | 1,545 | ||||||
European Union 0.25% 10/22/2026 | 610 | 591 | ||||||
European Union 0% 7/4/2031 | 705 | 584 | ||||||
European Union 0% 7/4/2035 | 220 | 159 | ||||||
European Union 0.20% 6/4/2036 | 1,500 | 1,080 | ||||||
Finland (Republic of) 1.50% 9/15/2032 | 3,380 | 3,154 | ||||||
French Republic O.A.T. 0.75% 2/25/2028 | 4,500 | 4,347 | ||||||
French Republic O.A.T. 0% 11/25/2030 | 19,550 | 16,712 | ||||||
French Republic O.A.T. 0% 5/25/2032 | 2,120 | 1,718 | ||||||
French Republic O.A.T. 2.00% 11/25/2032 | 4,260 | 4,162 | ||||||
French Republic O.A.T. 0.50% 5/25/2040 | 2,080 | 1,414 | ||||||
French Republic O.A.T. 0.75% 5/25/2052 | 5,930 | 3,416 | ||||||
Germany (Federal Republic of) 0% 4/11/2025 | 2,100 | 2,124 | ||||||
Germany (Federal Republic of) 0% 10/9/2026 | 6,060 | 5,908 | ||||||
Germany (Federal Republic of) 0% 4/16/2027 | 32,700 | 31,482 | ||||||
Germany (Federal Republic of) 1.30% 10/15/2027 | 3,580 | 3,626 | ||||||
Germany (Federal Republic of) 0% 2/15/2030 | 13,340 | 12,029 | ||||||
Germany (Federal Republic of) 0% 8/15/2030 | 15,050 | 13,413 | ||||||
Germany (Federal Republic of) 0% 8/15/2031 | 12,600 | 10,944 | ||||||
Germany (Federal Republic of) 1.70% 8/15/2032 | 10,906 | 10,887 | ||||||
Germany (Federal Republic of) 1.00% 5/15/2038 | 6,040 | 5,175 | ||||||
Germany (Federal Republic of) 0% 8/15/2050 | 1,200 | 673 | ||||||
Germany (Federal Republic of) 0% 8/15/2052 | 2,650 | 1,421 | ||||||
Goldman Sachs Group, Inc. 3.375% 3/27/20252 | 5,000 | 5,327 | ||||||
Goldman Sachs Group, Inc. 1.00% 3/18/20332 | 2,705 | 2,091 | ||||||
Greece (Hellenic Republic of) 3.375% 2/15/2025 | 5,825 | 6,236 | ||||||
Greece (Hellenic Republic of) 1.75% 6/18/2032 | 5,970 | 5,047 | ||||||
Groupe BPCE SA 4.625% 7/18/2023 | 1,200 | 1,296 | ||||||
Groupe BPCE SA 1.00% 4/1/2025 | 2,900 | 2,925 | ||||||
Intesa Sanpaolo SpA 6.625% 9/13/2023 | 510 | 557 | ||||||
Israel (State of) 2.875% 1/29/2024 | 1,180 | 1,258 | ||||||
Italy (Republic of) 1.85% 7/1/2025 | 17,700 | 18,218 | ||||||
Italy (Republic of) 1.35% 4/1/2030 | 7 | 6 | ||||||
Italy (Republic of) 2.50% 12/1/2032 | 9,610 | 8,613 | ||||||
JPMorgan Chase & Co. 0.389% 2/24/2028 (3-month EUR-EURIBOR + 0.65% on 2/24/2027)1,2 | 3,208 | 2,944 | ||||||
206 American Funds Insurance Series
Table of Contents
Capital World Bond Fund (continued)
Bonds, notes & other debt instruments (continued)
Principal amount (000) | Value (000) | |||||||
Euros (continued) | ||||||||
KfW 0.125% 6/30/2025 | EUR | 590 | $ | 590 | ||||
Lloyds Banking Group PLC 1.75% 9/7/2028 (5-year EUR-EURIBOR + 1.30% on 9/7/2023)1 | 2,400 | 2,472 | ||||||
Morgan Stanley 2.103% 5/8/2026 (3-month EUR-EURIBOR + 0.904% on 5/8/2025)1 | 580 | 592 | ||||||
Morgan Stanley 2.95% 5/7/2032 (3-month EUR-EURIBOR + 1.245% on 5/7/2031)1 | 1,535 | 1,460 | ||||||
Morocco (Kingdom of) 3.50% 6/19/2024 | 1,400 | 1,492 | ||||||
Morocco (Kingdom of) 1.50% 11/27/2031 | 3,300 | 2,617 | ||||||
Philippines (Republic of) 0.25% 4/28/2025 | 875 | 870 | ||||||
Portuguese Republic 0.475% 10/18/2030 | 1,610 | 1,395 | ||||||
Quebec (Province of) 0.25% 5/5/2031 | 920 | 764 | ||||||
Quebec (Province of) 0.50% 1/25/2032 | 1,155 | 957 | ||||||
Romania 2.125% 3/7/2028 | 1,440 | 1,291 | ||||||
Romania 1.75% 7/13/2030 | 2,560 | 1,913 | ||||||
Romania 2.00% 1/28/2032 | 1,605 | 1,153 | ||||||
Romania 3.75% 2/7/2034 | 530 | 425 | ||||||
Russian Federation 2.875% 12/4/20253 | 3,000 | 1,349 | ||||||
Russian Federation 2.875% 12/4/20253 | 1,500 | 674 | ||||||
Serbia (Republic of) 3.125% 5/15/2027 | 847 | 783 | ||||||
Serbia (Republic of) 1.50% 6/26/2029 | 3,353 | 2,584 | ||||||
Spain (Kingdom of) 0% 1/31/2027 | 2,325 | 2,198 | ||||||
Spain (Kingdom of) 0.80% 7/30/2027 | 8,970 | 8,674 | ||||||
Spain (Kingdom of) 1.45% 4/30/2029 | 1,890 | 1,824 | ||||||
Spain (Kingdom of) 1.25% 10/31/2030 | 1,295 | 1,191 | ||||||
Spain (Kingdom of) 0.50% 10/31/2031 | 4,645 | 3,873 | ||||||
Spain (Kingdom of) 0.70% 4/30/2032 | 4,785 | 3,993 | ||||||
Spain (Kingdom of) 1.90% 10/31/2052 | 1,010 | 695 | ||||||
State Grid Overseas Investment, Ltd. 1.375% 5/2/2025 | 441 | 442 | ||||||
State Grid Overseas Investment, Ltd. 2.125% 5/2/2030 | 200 | 177 | ||||||
Stryker Corp. 0.25% 12/3/2024 | 480 | 483 | ||||||
Stryker Corp. 0.75% 3/1/2029 | 980 | 877 | ||||||
Stryker Corp. 1.00% 12/3/2031 | 450 | 376 | ||||||
TOTAL SA 1.75% junior subordinated perpetual bonds (5-year EUR-EURIBOR + 1.765% on 4/4/2024)1 | 2,000 | 2,025 | ||||||
Toyota Motor Credit Corp. 0.125% 11/5/2027 | 1,850 | 1,684 | ||||||
Tunisia (Republic of) 6.75% 10/31/2023 | 5,109 | 4,612 | ||||||
Tunisia (Republic of) 6.75% 10/31/2023 | 1,295 | 1,169 | ||||||
Ukraine 6.75% 6/20/2028 | 3,119 | 619 | ||||||
Ukraine 6.75% 6/20/2028 | 1,225 | 243 | ||||||
Ukraine 4.375% 1/27/2032 | 2,705 | 476 | ||||||
Volkswagen International Finance NV 4.375% junior subordinated perpetual bonds (9-year EUR Mid-Swap + 3.36% on 3/28/2031)1 | 1,300 | 1,140 | ||||||
|
| |||||||
| 293,295 | ||||||||
|
| |||||||
Japanese yen 7.50% | ||||||||
Japan, Series 18, 0.10% 3/10/20244 | JPY | 1,064,481 | 8,293 | |||||
Japan, Series 19, 0.10% 9/10/20244 | 463,865 | 3,628 | ||||||
Japan, Series 346, 0.10% 3/20/2027 | 777,900 | 5,905 | ||||||
Japan, Series 356, 0.10% 9/20/2029 | 1,720,800 | 12,847 | ||||||
Japan, Series 116, 2.20% 3/20/2030 | 576,100 | 4,933 | ||||||
Japan, Series 26, 0.005% 3/10/20314 | 527,493 | 4,178 | ||||||
Japan, Series 362, 0.10% 3/20/2031 | 737,200 | 5,435 | ||||||
Japan, Series 365, 0.10% 12/20/2031 | 520,150 | 3,832 | ||||||
Japan, Series 145, 1.70% 6/20/2033 | 742,700 | 6,290 | ||||||
Japan, Series 152, 1.20% 3/20/2035 | 987,100 | 7,875 | ||||||
Japan, Series 21, 2.30% 12/20/2035 | 720,000 | 6,451 | ||||||
Japan, Series 162, 0.60% 9/20/2037 | 1,617,000 | 11,642 | ||||||
Japan, Series 179, 0.50% 12/20/2041 | 196,950 | 1,309 | ||||||
Japan, Series 37, 0.60% 6/20/2050 | 694,500 | 4,183 | ||||||
Japan, Series 70, 0.70% 3/20/2051 | 276,100 | 1,694 | ||||||
Japan, Series 73, 0.70% 12/20/2051 | 1,568,700 | 9,576 | ||||||
American Funds Insurance Series 207
Table of Contents
Capital World Bond Fund (continued)
Bonds, notes & other debt instruments (continued)
Principal amount (000) | Value (000) | |||||||
Japanese yen (continued) | ||||||||
Japan, Series 74, 1.00% 3/20/2052 | JPY | 626,900 | $ | 4,140 | ||||
Japan, Series 76, 1.40% 9/20/2052 | 296,450 | 2,162 | ||||||
Philippines (Republic of) 0.001% 4/12/2024 | 900,000 | 6,778 | ||||||
|
| |||||||
| 111,151 | ||||||||
|
| |||||||
British pounds 4.17% | ||||||||
American Honda Finance Corp. 0.75% 11/25/2026 | GBP | 1,420 | 1,470 | |||||
Asian Development Bank 1.125% 6/10/2025 | 1,240 | 1,393 | ||||||
KfW 1.125% 7/4/2025 | 1,165 | 1,305 | ||||||
Lloyds Banking Group PLC 7.625% 4/22/2025 | 655 | 835 | ||||||
Quebec (Province of) 2.25% 9/15/2026 | 1,870 | 2,083 | ||||||
United Kingdom 0.125% 1/30/2026 | 425 | 463 | ||||||
United Kingdom 1.25% 7/22/2027 | 3,060 | 3,335 | ||||||
United Kingdom 4.25% 12/7/2027 | 5,910 | 7,336 | ||||||
United Kingdom 4.75% 12/7/2030 | 8,230 | 10,732 | ||||||
United Kingdom 0.25% 7/31/2031 | 11,850 | 10,738 | ||||||
United Kingdom 1.00% 1/31/2032 | 10,970 | 10,504 | ||||||
United Kingdom 4.25% 6/7/2032 | 3,010 | 3,809 | ||||||
United Kingdom 0.625% 7/31/2035 | 210 | 171 | ||||||
United Kingdom 0.875% 1/31/2046 | 4,916 | 3,151 | ||||||
United Kingdom 1.25% 7/31/2051 | 6,635 | 4,338 | ||||||
United Kingdom 1.125% 10/22/2073 | 225 | 119 | ||||||
|
| |||||||
| 61,782 | ||||||||
|
| |||||||
Chinese yuan renminbi 2.84% | ||||||||
China (People’s Republic of), Series INBK, 2.75% 2/17/2032 | CNY | 25,660 | 3,646 | |||||
China (People’s Republic of), Series 1910, 3.86% 7/22/2049 | 103,240 | 16,440 | ||||||
China (People’s Republic of), Series INBK, 3.39% 3/16/2050 | 26,230 | 3,854 | ||||||
China (People’s Republic of), Series INBK, 3.81% 9/14/2050 | 51,550 | 8,146 | ||||||
China (People’s Republic of), Series INBK, 3.53% 10/18/2051 | 45,510 | 6,877 | ||||||
China Development Bank Corp., Series 1814, 4.15% 10/26/2025 | 20,900 | 3,133 | ||||||
|
| |||||||
| 42,096 | ||||||||
|
| |||||||
Canadian dollars 2.31% | ||||||||
Canada 0.75% 10/1/2024 | CAD | 14,570 | 10,169 | |||||
Canada 0.25% 3/1/2026 | 5,800 | 3,847 | ||||||
Canada 3.50% 3/1/2028 | 24,018 | 17,831 | ||||||
Canada 2.75% 12/1/2048 | 3,500 | 2,337 | ||||||
|
| |||||||
| 34,184 | ||||||||
|
| |||||||
Mexican pesos 2.13% | ||||||||
Petróleos Mexicanos 7.19% 9/12/2024 | MXN | 42,534 | 2,024 | |||||
United Mexican States 4.50% 12/4/20254 | 16,544 | 845 | ||||||
United Mexican States, Series M, 5.75% 3/5/2026 | 44,700 | 2,078 | ||||||
United Mexican States, Series M, 7.50% 6/3/2027 | 251,720 | 12,188 | ||||||
United Mexican States, Series M20, 8.50% 5/31/2029 | 140,400 | 7,013 | ||||||
United Mexican States, Series M30, 8.50% 11/18/2038 | 21,100 | 1,025 | ||||||
United Mexican States, Series M, 8.00% 11/7/2047 | 7,830 | 359 | ||||||
United Mexican States, Series M, 8.00% 7/31/2053 | 133,170 | 6,095 | ||||||
|
| |||||||
| 31,627 | ||||||||
|
| |||||||
Australian dollars 1.63% | ||||||||
Australia (Commonwealth of), Series 163, 1.00% 11/21/2031 | AUD | 5,789 | 3,061 | |||||
Australia (Commonwealth of), Series 166, 3.00% 11/21/2033 | 12,355 | 7,622 | ||||||
Australia (Commonwealth of), Series 167, 3.75% 5/21/2034 | 20,520 | 13,529 | ||||||
|
| |||||||
| 24,212 | ||||||||
|
| |||||||
208 American Funds Insurance Series
Table of Contents
Capital World Bond Fund (continued)
Bonds, notes & other debt instruments (continued)
Principal amount (000) | Value (000) | |||||||
Danish kroner 1.62% | ||||||||
Nordea Kredit 0.50% 10/1/20405 | DKK | 17,477 | $ | 1,955 | ||||
Nykredit Realkredit AS, Series 01E, 0.50% 10/1/20405 | 90,967 | 10,167 | ||||||
Nykredit Realkredit AS, Series 01E, 0.50% 10/1/20435 | 106,007 | 11,555 | ||||||
Realkredit Danmark AS 1.00% 10/1/20535 | 2,712 | 285 | ||||||
|
| |||||||
| 23,962 | ||||||||
|
| |||||||
South Korean won 0.52% | ||||||||
South Korea (Republic of), Series 2503, 1.50% 3/10/2025 | KRW | 5,183,670 | 3,908 | |||||
South Korea (Republic of), Series 2712, 2.375% 12/10/2027 | 5,158,930 | 3,821 | ||||||
|
| |||||||
| 7,729 | ||||||||
|
| |||||||
Colombian pesos 0.48% | ||||||||
Colombia (Republic of), Series B, 7.00% 3/26/2031 | COP | 31,310,800 | 4,575 | |||||
Colombia (Republic of), Series B, 7.25% 10/26/2050 | 21,884,200 | 2,569 | ||||||
|
| |||||||
| 7,144 | ||||||||
|
| |||||||
Chilean pesos 0.41% | ||||||||
Chile (Republic of) 4.00% 3/1/2023 | CLP | 2,300,000 | 2,681 | |||||
Chile (Republic of) 1.50% 3/1/20264 | 808,331 | 933 | ||||||
Chile (Republic of) 5.00% 10/1/2028 | 955,000 | 1,089 | ||||||
Chile (Republic of) 4.70% 9/1/2030 | 1,205,000 | 1,371 | ||||||
|
| |||||||
| 6,074 | ||||||||
|
| |||||||
Indonesian rupiah 0.37% | ||||||||
Indonesia (Republic of), Series 84, 7.25% 2/15/2026 | IDR | 22,733,000 | 1,495 | |||||
Indonesia (Republic of), Series 95, 6.375% 8/15/2028 | 3,136,000 | 200 | ||||||
Indonesia (Republic of), Series 78, 8.25% 5/15/2029 | 23,729,000 | 1,643 | ||||||
Indonesia (Republic of), Series 82, 7.00% 9/15/2030 | 2,930,000 | 190 | ||||||
Indonesia (Republic of), Series 68, 8.375% 3/15/2034 | 27,353,000 | 1,926 | ||||||
|
| |||||||
| 5,454 | ||||||||
|
| |||||||
Russian rubles 0.23% | ||||||||
Russian Federation 7.00% 8/16/20233,6 | RUB | 430,300 | 1,984 | |||||
Russian Federation 7.65% 4/10/20303 | 316,110 | 1,371 | ||||||
|
| |||||||
| 3,355 | ||||||||
|
| |||||||
Brazilian reais 0.21% | ||||||||
Brazil (Federative Republic of) 6.00% 8/15/20244 | BRL | 13,461 | 2,531 | |||||
Brazil (Federative Republic of) 10.00% 1/1/2025 | 3,300 | 598 | ||||||
|
| |||||||
| 3,129 | ||||||||
|
| |||||||
South African rand 0.20% | ||||||||
South Africa (Republic of), Series R-2030, 8.00% 1/31/2030 | ZAR | 30,120 | 1,581 | |||||
South Africa (Republic of), Series R-2048, 8.75% 2/28/2048 | 30,850 | 1,420 | ||||||
|
| |||||||
| 3,001 | ||||||||
|
| |||||||
Dominican pesos 0.15% | ||||||||
Dominican Republic 8.90% 2/15/2023 | DOP | 128,000 | 2,271 | |||||
|
| |||||||
Malaysian ringgits 0.15% | ||||||||
Malaysia (Federation of), Series 0519, 3.757% 5/22/2040 | MYR | 10,588 | 2,222 | |||||
|
| |||||||
Ukrainian hryvnia 0.11% | ||||||||
Ukraine 15.97% 4/19/20236 | UAH | 78,370 | 1,592 | |||||
|
| |||||||
Indian rupees 0.08% | ||||||||
India (Republic of) 5.15% 11/9/2025 | INR | 96,010 | 1,102 | |||||
|
| |||||||
American Funds Insurance Series 209
Table of Contents
Capital World Bond Fund (continued)
Bonds, notes & other debt instruments (continued)
Principal amount (000) | Value (000) | |||||||
Romanian leu 0.07% | ||||||||
Romania 4.75% 2/24/2025 | RON | 5,000 | $ | 1,038 | ||||
|
| |||||||
Polish zloty 0.06% | ||||||||
Poland (Republic of), Series 1029, 2.75% 10/25/2029 | PLN | 4,900 | 879 | |||||
|
| |||||||
Norwegian kroner 0.04% | ||||||||
Norway (Kingdom of) 2.125% 5/18/2032 | NOK | 6,615 | 619 | |||||
|
| |||||||
U.S. dollars 45.21% | ||||||||
1375209 BC, Ltd. 9.00% 1/30/20287 | USD | 60 | 59 | |||||
7-Eleven, Inc. 0.95% 2/10/20267 | 520 | 456 | ||||||
7-Eleven, Inc. 1.30% 2/10/20287 | 2,180 | 1,810 | ||||||
7-Eleven, Inc. 1.80% 2/10/20317 | 2,015 | 1,544 | ||||||
ACE INA Holdings, Inc. 3.35% 5/3/2026 | 195 | 187 | ||||||
ACE INA Holdings, Inc. 4.35% 11/3/2045 | 425 | 370 | ||||||
Advisor Group Holdings, LLC 6.25% 3/1/20287 | 295 | 272 | ||||||
AerCap Ireland Capital DAC 2.45% 10/29/2026 | 2,102 | 1,841 | ||||||
Aeropuerto International de Tocume SA 5.125% 8/11/20617 | 660 | 542 | ||||||
Aetna, Inc. 2.80% 6/15/2023 | 340 | 336 | ||||||
AG Merger Sub II, Inc. 10.75% 8/1/20277 | 256 | 260 | ||||||
AG TTMT Escrow Issuer, LLC 8.625% 9/30/20277 | 103 | 104 | ||||||
AIB Group PLC 7.583% 10/14/2026 (USD-SOFR + 3.456% on 10/14/2025)1,7 | 1,225 | 1,249 | ||||||
Alabama Power Co. 3.00% 3/15/2052 | 980 | 651 | ||||||
Albertsons Companies, Inc. 4.625% 1/15/20277 | 125 | 116 | ||||||
Albertsons Companies, Inc. 3.50% 3/15/20297 | 340 | 286 | ||||||
Alcoa Nederland Holding BV 4.125% 3/31/20297 | 75 | 67 | ||||||
Allegheny Technologies, Inc. 4.875% 10/1/2029 | 25 | 22 | ||||||
Allegheny Technologies, Inc. 5.125% 10/1/2031 | 45 | 40 | ||||||
Alliant Holdings Intermediate, LLC 6.75% 10/15/20277 | 280 | 252 | ||||||
Alliant Holdings Intermediate, LLC 5.875% 11/1/20297 | 90 | 74 | ||||||
Allied Universal Holdco, LLC 9.75% 7/15/20277 | 175 | 153 | ||||||
Allied Universal Holdco, LLC 6.00% 6/1/20297 | 300 | 218 | ||||||
Almonde, Inc., Term Loan, (3-month USD-LIBOR + 7.25%) 10.621% 6/13/20258,9 | 570 | 429 | ||||||
Altera Infrastructure, LP 8.50% 7/15/20233,6,7 | 555 | 104 | ||||||
Amazon.com, Inc. 1.50% 6/3/2030 | 2,040 | 1,644 | ||||||
American Electric Power Company, Inc. 1.00% 11/1/2025 | 250 | 224 | ||||||
American Express Co. 3.375% 5/3/2024 | 4,202 | 4,119 | ||||||
Amgen, Inc. 2.20% 2/21/2027 | 445 | 400 | ||||||
AmWINS Group, Inc. 4.875% 6/30/20297 | 220 | 187 | ||||||
Anglo American Capital PLC 3.95% 9/10/20507 | 521 | 383 | ||||||
Angola (Republic of) 9.50% 11/12/2025 | 3,580 | 3,693 | ||||||
Anywhere Real Estate Group, LLC 5.75% 1/15/20297 | 200 | 152 | ||||||
Anywhere Real Estate Group, LLC 5.25% 4/15/20307 | 130 | 95 | ||||||
Apple, Inc. 3.35% 8/8/2032 | 1,600 | 1,457 | ||||||
Ardagh Group SA 6.50% Cash 6/30/20277,10 | 210 | 146 | ||||||
Aretec Escrow Issuer, Inc. 7.50% 4/1/20297 | 180 | 149 | ||||||
Argentine Republic 0.50% 7/9/2030 (0.75% on 7/9/2023)1 | 1,921 | 523 | ||||||
Argentine Republic 1.50% 7/9/2035 (3.625% on 7/9/2023)1 | 3,025 | 775 | ||||||
Asbury Automotive Group, Inc. 5.00% 2/15/20327 | 55 | 45 | ||||||
Ascensus, Inc., Term Loan, (3-month USD-LIBOR + 6.50%) 10.25% 8/2/20298,9 | 120 | 106 | ||||||
Ascent Resources Utica Holdings, LLC 8.25% 12/31/20287 | 160 | 157 | ||||||
Ascent Resources Utica Holdings, LLC 5.875% 6/30/20297 | 55 | 49 | ||||||
AssuredPartners, Inc. 7.00% 8/15/20257 | 120 | 116 | ||||||
AssuredPartners, Inc. 5.625% 1/15/20297 | 365 | 301 | ||||||
AstraZeneca PLC 3.50% 8/17/2023 | 2,700 | 2,678 | ||||||
AT&T, Inc. 3.50% 9/15/2053 | 2,070 | 1,406 | ||||||
Atkore, Inc. 4.25% 6/1/20317 | 25 | 21 | ||||||
Atlantic Aviation FBO, Inc., Term Loan, (3-month USD-LIBOR + 2.75%) 7.134% 9/22/20288,9 | 149 | 147 | ||||||
210 American Funds Insurance Series
Table of Contents
Capital World Bond Fund (continued)
Bonds, notes & other debt instruments (continued)
Principal amount (000) | Value (000) | |||||||
U.S. dollars (continued) | ||||||||
Atlantic Aviation FBO, Inc., Term Loan, (3-month USD-LIBOR + 5.75%) 10.134% 9/21/20298,9 | USD | 213 | $ | 207 | ||||
Avantor Funding, Inc. 4.625% 7/15/20287 | 160 | 146 | ||||||
Avantor Funding, Inc. 3.875% 11/1/20297 | 90 | 76 | ||||||
B&G Foods, Inc. 5.25% 4/1/2025 | 65 | 57 | ||||||
B&G Foods, Inc. 5.25% 9/15/2027 | 220 | 169 | ||||||
Ball Corp. 6.875% 3/15/2028 | 108 | 111 | ||||||
Bank of America Corp. 2.456% 10/22/2025 (3-month USD-LIBOR + 0.87% on 10/22/2024)1 | 847 | 801 | ||||||
Bank of America Corp. 1.53% 12/6/2025 (USD-SOFR + 0.65% on 12/6/2024)1 | 6,260 | 5,778 | ||||||
Bank of America Corp. 1.734% 7/22/2027 (USD-SOFR + 0.96% on 7/22/2026)1 | 3,745 | 3,286 | ||||||
Bank of America Corp. 2.299% 7/21/2032 (USD-SOFR + 1.22% on 7/21/2031)1 | 4,780 | 3,693 | ||||||
Bank of Nova Scotia 2.45% 2/2/2032 | 2,100 | 1,695 | ||||||
Barclays Bank PLC 5.304% 8/9/2026 (1-year UST Yield Curve Rate T Note Constant Maturity + 2.30% on 8/9/2025)1 | 2,350 | 2,335 | ||||||
Barclays Bank PLC 5.501% 8/9/2028 (1-year UST Yield Curve Rate T Note Constant Maturity + 2.65% on 8/5/2027)1 | 1,290 | 1,252 | ||||||
Bath & Body Works, Inc. 6.625% 10/1/20307 | 120 | 113 | ||||||
Bath & Body Works, Inc. 6.875% 11/1/2035 | 75 | 67 | ||||||
Bausch Health Americas, Inc. 9.25% 4/1/20267 | 80 | 56 | ||||||
Bausch Health Companies, Inc. 5.75% 8/15/20277 | 140 | 96 | ||||||
Bausch Health Companies, Inc. 14.00% 10/15/20307 | 160 | 96 | ||||||
Bausch Health Companies, Inc. 5.25% 2/15/20317 | 160 | 78 | ||||||
Bayer AG 3.375% 10/8/20247 | 840 | 812 | ||||||
Bayer US Finance II, LLC 4.25% 12/15/20257 | 203 | 197 | ||||||
Bayerische Motoren Werke AG 3.90% 4/9/20257 | 900 | 881 | ||||||
Bayerische Motoren Werke AG 4.15% 4/9/20307 | 900 | 857 | ||||||
Beasley Mezzanine Holdings, LLC 8.625% 2/1/20267 | 30 | 18 | ||||||
Becton, Dickinson and Company 4.298% 8/22/2032 | 320 | 300 | ||||||
Berkshire Hathaway Energy Company 2.85% 5/15/2051 | 300 | 198 | ||||||
BIP-V Chinook Holdco, LLC 5.50% 6/15/20317 | 400 | 350 | ||||||
Blue Racer Midstream, LLC 7.625% 12/15/20257 | 65 | 65 | ||||||
BMC Software, Inc. 9.125% 3/1/20267 | 160 | 151 | ||||||
BMC Software, Inc., Term Loan, (3-month USD-LIBOR + 5.50%) 6.128% 3/31/20268,9 | 25 | 23 | ||||||
BNP Paribas SA 2.159% 9/15/2029 (USD-SOFR + 1.218% on 9/15/2028)1,7 | 700 | 572 | ||||||
BNP Paribas SA 2.871% 4/19/2032 (USD-SOFR + 1.387% on 4/19/2031)1,7 | 1,275 | 1,000 | ||||||
Boeing Company 5.15% 5/1/2030 | 2,855 | 2,792 | ||||||
Boeing Company 3.625% 2/1/2031 | 1,127 | 990 | ||||||
Bombardier, Inc. 7.125% 6/15/20267 | 60 | 58 | ||||||
Bombardier, Inc. 6.00% 2/15/20287 | 65 | 60 | ||||||
Bombardier, Inc. 7.45% 5/1/20347 | 125 | 126 | ||||||
Booz Allen Hamilton, Inc. 3.875% 9/1/20287 | 43 | 38 | ||||||
Booz Allen Hamilton, Inc. 4.00% 7/1/20297 | 132 | 116 | ||||||
Boyd Gaming Corp. 4.75% 12/1/2027 | 120 | 112 | ||||||
Boyd Gaming Corp. 4.75% 6/15/20317 | 45 | 39 | ||||||
Boyne USA, Inc. 4.75% 5/15/20297 | 107 | 95 | ||||||
Braskem Netherlands Finance BV 4.50% 1/31/20307 | 745 | 635 | ||||||
British American Tobacco PLC 2.789% 9/6/2024 | 1,150 | 1,101 | ||||||
British American Tobacco PLC 3.215% 9/6/2026 | 955 | 882 | ||||||
British American Tobacco PLC 3.557% 8/15/2027 | 1,545 | 1,414 | ||||||
British American Tobacco PLC 3.462% 9/6/2029 | 1,150 | 991 | ||||||
Broadcom, Inc. 4.00% 4/15/20297 | 250 | 228 | ||||||
Broadcom, Inc. 3.419% 4/15/20337 | 698 | 562 | ||||||
Broadcom, Inc. 3.469% 4/15/20347 | 48 | 38 | ||||||
Broadcom, Inc. 3.137% 11/15/20357 | 185 | 137 | ||||||
Broadcom, Inc. 3.75% 2/15/20517 | 926 | 643 | ||||||
BroadStreet Partners, Inc. 5.875% 4/15/20297 | 160 | 136 | ||||||
BWX Technologies, Inc. 4.125% 4/15/20297 | 195 | 171 | ||||||
Caesars Entertainment, Inc. 6.25% 7/1/20257 | 35 | 34 | ||||||
Caesars Entertainment, Inc. 4.625% 10/15/20297 | 15 | 12 | ||||||
Caesars Resort Collection, LLC 5.75% 7/1/20257 | 165 | 162 | ||||||
California Resources Corp. 7.125% 2/1/20267 | 100 | 96 | ||||||
American Funds Insurance Series 211
Table of Contents
Capital World Bond Fund (continued)
Bonds, notes & other debt instruments (continued)
Principal amount (000) | Value (000) | |||||||
U.S. dollars (continued) | ||||||||
Callon Petroleum Co. 7.50% 6/15/20307 | USD | 30 | $ | 27 | ||||
Canadian Pacific Railway, Ltd. 2.45% 12/2/2031 | 798 | 663 | ||||||
Canadian Pacific Railway, Ltd. 3.10% 12/2/2051 | 1,378 | 933 | ||||||
CAN-PACK SA 3.875% 11/15/20297 | 90 | 71 | ||||||
Carnival Corp. 6.00% 5/1/20297 | 100 | 67 | ||||||
CCO Holdings, LLC 4.75% 3/1/20307 | 135 | 117 | ||||||
CCO Holdings, LLC 4.50% 8/15/20307 | 255 | 211 | ||||||
CCO Holdings, LLC 4.25% 2/1/20317 | 155 | 125 | ||||||
CCO Holdings, LLC 4.50% 6/1/20337 | 162 | 125 | ||||||
CCO Holdings, LLC 4.25% 1/15/20347 | 70 | 52 | ||||||
CCO Holdings, LLC and CCO Holdings Capital Corp. 5.125% 5/1/20277 | 125 | 117 | ||||||
CCO Holdings, LLC and CCO Holdings Capital Corp. 3.75% 2/15/2028 | 2,650 | 2,394 | ||||||
CDI Escrow Issuer, Inc. 5.75% 4/1/20307 | 70 | 63 | ||||||
CDK Global, Inc. 7.25% 6/15/20297 | 55 | 54 | ||||||
Cedar Fair, LP 5.50% 5/1/20257 | 120 | 119 | ||||||
Centene Corp. 2.45% 7/15/2028 | 40 | 34 | ||||||
Centene Corp. 4.625% 12/15/2029 | 325 | 298 | ||||||
Centene Corp. 2.50% 3/1/2031 | 155 | 122 | ||||||
Central Garden & Pet Co. 4.125% 10/15/2030 | 74 | 61 | ||||||
Central Garden & Pet Co. 4.125% 4/30/20317 | 110 | 91 | ||||||
Charles River Laboratories International, Inc. 4.25% 5/1/20287 | 35 | 32 | ||||||
Charles River Laboratories International, Inc. 4.00% 3/15/20317 | 70 | 61 | ||||||
Cheniere Energy Partners, LP 4.50% 10/1/2029 | 160 | 144 | ||||||
Cheniere Energy Partners, LP 4.00% 3/1/2031 | 75 | 64 | ||||||
Cheniere Energy Partners, LP 3.25% 1/31/2032 | 56 | 45 | ||||||
Chesapeake Energy Corp. 4.875% 4/15/20223 | 915 | 21 | ||||||
Chesapeake Energy Corp. 5.875% 2/1/20297 | 130 | 123 | ||||||
Chesapeake Energy Corp. 6.75% 4/15/20297 | 30 | 29 | ||||||
Ciena Corp. 4.00% 1/31/20307 | 80 | 71 | ||||||
Cigna Corp. 2.375% 3/15/2031 | 375 | 308 | ||||||
Clarivate Science Holdings Corp. 3.875% 7/1/20287 | 45 | 39 | ||||||
Clarivate Science Holdings Corp. 4.875% 7/1/20297 | 55 | 47 | ||||||
Cleveland-Cliffs, Inc. 4.875% 3/1/20317 | 130 | 115 | ||||||
CMS Energy Corp. 3.875% 3/1/2024 | 100 | 98 | ||||||
CMS Energy Corp. 3.00% 5/15/2026 | 1,200 | 1,118 | ||||||
CNX Resources Corp. 7.25% 3/14/20277 | 240 | 239 | ||||||
Coinbase Global, Inc. 3.375% 10/1/20287 | 55 | 29 | ||||||
Coinbase Global, Inc. 3.625% 10/1/20317 | 85 | 41 | ||||||
Colombia (Republic of) 3.875% 4/25/2027 | 350 | 311 | ||||||
Commonwealth Bank of Australia 2.688% 3/11/20317 | 4,650 | 3,593 | ||||||
Compass Diversified Holdings 5.25% 4/15/20297 | 307 | 263 | ||||||
Compass Diversified Holdings 5.00% 1/15/20327 | 65 | 52 | ||||||
Comstock Resources, Inc. 6.75% 3/1/20297 | 110 | 99 | ||||||
Comstock Resources, Inc. 5.875% 1/15/20307 | 65 | 56 | ||||||
Constellation Oil Services Holding SA 4.00% PIK 12/31/202610 | 1,097 | 649 | ||||||
Constellium SE 3.75% 4/15/20297 | 125 | 102 | ||||||
Consumers Energy Co. 3.375% 8/15/2023 | 345 | 342 | ||||||
Consumers Energy Co. 3.60% 8/15/2032 | 1,600 | 1,462 | ||||||
Corebridge Financial, Inc. 3.90% 4/5/20327 | 748 | 655 | ||||||
CoreLogic, Inc. 4.50% 5/1/20287 | 364 | 280 | ||||||
CoreLogic, Inc., Term Loan, (3-month USD-LIBOR + 6.50%) 10.938% 6/4/20298,9 | 65 | 47 | ||||||
Corporate Office Properties, LP 2.75% 4/15/2031 | 1,212 | 910 | ||||||
Covanta Holding Corp. 4.875% 12/1/20297 | 25 | 21 | ||||||
Crédit Agricole SA 4.375% 3/17/20257 | 1,100 | 1,064 | ||||||
Crédit Agricole SA 1.907% 6/16/2026 (USD-SOFR + 1.676% on 6/16/2025)1,7 | 2,675 | 2,441 | ||||||
Credit Suisse Group AG 3.091% 5/14/2032 (USD-SOFR + 1.73% on 5/14/2031)1,7 | 1,000 | 693 | ||||||
Crestwood Midstream Partners, LP 6.00% 2/1/20297 | 85 | 78 | ||||||
Crestwood Midstream Partners, LP 8.00% 4/1/20297 | 100 | 100 | ||||||
Crown Castle International Corp. 2.50% 7/15/2031 | 767 | 620 | ||||||
CSX Corp. 3.80% 4/15/2050 | 75 | 59 | ||||||
CVR Partners, LP 6.125% 6/15/20287 | 100 | 90 | ||||||
Daimler Trucks Finance North America, LLC 3.65% 4/7/20277 | 725 | 679 | ||||||
212 American Funds Insurance Series
Table of Contents
Capital World Bond Fund (continued)
Bonds, notes & other debt instruments (continued)
Principal amount (000) | Value (000) | |||||||
U.S. dollars (continued) | ||||||||
Danske Bank AS 3.875% 9/12/20237 | USD | 1,675 | $ | 1,654 | ||||
Darling Ingredients, Inc. 6.00% 6/15/20307 | 245 | 240 | ||||||
DaVita, Inc. 4.625% 6/1/20307 | 65 | 52 | ||||||
Deluxe Corp. 8.00% 6/1/20297 | 20 | 16 | ||||||
Deutsche Bank AG 2.129% 11/24/2026 (USD-SOFR + 1.87% on 11/24/2025)1 | 850 | 751 | ||||||
Deutsche Bank AG 2.311% 11/16/2027 (USD-SOFR + 1.219% on 11/16/2026)1 | 1,160 | 985 | ||||||
Deutsche Telekom International Finance BV 9.25% 6/1/2032 | 930 | 1,166 | ||||||
Development Bank of Mongolia, LLC 7.25% 10/23/2023 | 1,980 | 1,777 | ||||||
Diamond Foreign Asset Co. 9.00% Cash 4/22/20277,9,10 | 25 | 24 | ||||||
Diamond Foreign Asset Co. 9.00% Cash 4/22/202710 | 22 | 21 | ||||||
Diamond Sports Group, LLC 6.625% 8/15/20277 | 310 | 3 | ||||||
Diebold Nixdorf, Inc. 9.375% 7/15/20257 | 309 | 221 | ||||||
Diebold Nixdorf, Inc., Term Loan, (USD-SOFR + 5.25%) 6.75% 7/15/20256,8,9 | 93 | 63 | ||||||
Digital Currency Group, Inc., Term Loan, (3-month USD-LIBOR + 7.00%) 8.00% 11/30/20266,8,9 | 17 | 15 | ||||||
Digital Currency Group, Inc., Term Loan, 8.75% 11/30/20266,8 | 22 | 18 | ||||||
DIRECTV Financing, LLC 5.875% 8/15/20277 | 110 | 99 | ||||||
DIRECTV Financing, LLC, Term Loan, | ||||||||
(3-month USD-LIBOR + 5.00%) 9.384% 8/2/20278,9 | 102 | 99 | ||||||
Discovery Communications, Inc. 3.625% 5/15/2030 | 468 | 387 | ||||||
DISH DBS Corp. 5.25% 12/1/20267 | 15 | 13 | ||||||
DISH Network Corp. 11.75% 11/15/20277 | 260 | 268 | ||||||
Dominican Republic 5.50% 1/27/20257 | 1,375 | 1,366 | ||||||
Dominican Republic 8.625% 4/20/20277 | 225 | 235 | ||||||
Dominican Republic 5.50% 2/22/20297 | 350 | 323 | ||||||
Dominican Republic 6.40% 6/5/20497 | 813 | 660 | ||||||
Duke Energy Progress, LLC 2.00% 8/15/2031 | 2,360 | 1,871 | ||||||
Dun & Bradstreet Corp. 5.00% 12/15/20297 | 197 | 169 | ||||||
Edison International 4.125% 3/15/2028 | 2,390 | 2,222 | ||||||
Edison International 5.00% junior subordinated perpetual bonds (5-year UST Yield Curve Rate T Note Constant Maturity + 3.901% on 3/15/2049)1 | 100 | 84 | ||||||
Electricité de France SA 4.875% 9/21/20387 | 795 | 649 | ||||||
Empresas Publicas de Medellin ESP 4.25% 7/18/20297 | 1,030 | 819 | ||||||
Enbridge, Inc. 4.00% 10/1/2023 | 600 | 595 | ||||||
Endo Luxembourg Finance Co. I SARL / Endo U.S., Inc. 6.125% 4/1/20297 | 205 | 156 | ||||||
Enel Finance International SA 1.375% 7/12/20267 | 1,248 | 1,077 | ||||||
Enel Finance International SA 1.875% 7/12/20287 | 1,227 | 977 | ||||||
Entegris Escrow Corp. 4.75% 4/15/20297 | 45 | 41 | ||||||
Entergy Corp. 0.90% 9/15/2025 | 750 | 669 | ||||||
Entergy Louisiana, LLC 4.75% 9/15/2052 | 1,275 | 1,151 | ||||||
EQM Midstream Partners, LP 6.50% 7/1/20277 | 225 | 215 | ||||||
EQM Midstream Partners, LP 7.50% 6/1/20307 | 45 | 43 | ||||||
EQM Midstream Partners, LP 6.50% 7/15/2048 | 40 | 30 | ||||||
EQT Corp. 7.25% 2/1/20301 | 40 | 42 | ||||||
Equinix, Inc. 1.80% 7/15/2027 | 1,145 | 982 | ||||||
Equinix, Inc. 2.15% 7/15/2030 | 3,216 | 2,566 | ||||||
Ethiopia (Federal Democratic Republic of) 6.625% 12/11/2024 | 3,910 | 2,457 | ||||||
Fair Isaac Corp. 4.00% 6/15/20287 | 120 | 109 | ||||||
Fannie Mae Pool #MA2754 3.00% 9/1/20265 | 59 | 57 | ||||||
Fannie Mae Pool #AO4151 3.50% 6/1/20425 | 108 | 101 | ||||||
Fannie Mae Pool #AP7888 3.50% 10/1/20425 | 338 | 316 | ||||||
Fannie Mae Pool #AQ0770 3.50% 11/1/20425 | 131 | 123 | ||||||
Fannie Mae Pool #FM8399 2.50% 8/1/20515 | 889 | 759 | ||||||
Fannie Mae Pool #BT9589 2.50% 8/1/20515 | 34 | 29 | ||||||
Fannie Mae Pool #CB1552 2.50% 9/1/20515 | 998 | 848 | ||||||
Fannie Mae Pool #BQ7435 2.50% 9/1/20515 | 97 | 83 | ||||||
Fannie Mae Pool #MA4414 2.50% 9/1/20515 | 33 | 28 | ||||||
Fannie Mae Pool #FS0031 2.50% 10/1/20515 | 336 | 284 | ||||||
Fannie Mae Pool #BT3056 2.50% 11/1/20515 | 721 | 613 | ||||||
Fannie Mae Pool #CB2402 2.50% 12/1/20515 | 3,207 | 2,718 | ||||||
Fannie Mae Pool #BU3413 2.50% 12/1/20515 | 807 | 685 | ||||||
Fannie Mae Pool #BU3058 2.50% 12/1/20515 | 268 | 227 | ||||||
American Funds Insurance Series 213
Table of Contents
Capital World Bond Fund (continued)
Bonds, notes & other debt instruments (continued)
Principal amount (000) | Value (000) | |||||||
U.S. dollars (continued) | ||||||||
Fannie Mae Pool #BV2930 2.50% 1/1/20525 | USD | 998 | $ | 846 | ||||
Fannie Mae Pool #BU8226 2.50% 2/1/20525 | 1,260 | 1,070 | ||||||
Fannie Mae Pool #BU1339 2.50% 2/1/20525 | 275 | 234 | ||||||
Fannie Mae Pool #BV0307 2.50% 2/1/20525 | 273 | 232 | ||||||
Fannie Mae Pool #BQ7473 2.50% 2/1/20525 | 158 | 134 | ||||||
Fannie Mae Pool #CB2866 2.50% 2/1/20525 | 95 | 81 | ||||||
Fannie Mae Pool #BV2189 2.50% 2/1/20525 | 62 | 53 | ||||||
Fannie Mae Pool #CB2876 2.50% 2/1/20525 | 31 | 27 | ||||||
Fannie Mae Pool #CB2809 2.50% 2/1/20525 | 32 | 27 | ||||||
Fannie Mae Pool #BV3694 2.50% 2/1/20525 | 32 | 27 | ||||||
Fannie Mae Pool #FS0647 3.00% 2/1/20525 | 2,865 | 2,557 | ||||||
Fannie Mae Pool #BV4040 2.50% 3/1/20525 | 1,645 | 1,398 | ||||||
Fannie Mae Pool #BV7520 2.50% 3/1/20525 | 864 | 734 | ||||||
Fannie Mae Pool #BV8086 2.50% 3/1/20525 | 809 | 690 | ||||||
Fannie Mae Pool #BU6885 2.50% 3/1/20525 | 808 | 686 | ||||||
Fannie Mae Pool #BV5642 2.50% 3/1/20525 | 94 | 80 | ||||||
Fannie Mae Pool #MA4578 2.50% 4/1/20525 | 4,881 | 4,140 | ||||||
Fannie Mae Pool #BV5332 2.50% 4/1/20525 | 1,929 | 1,638 | ||||||
Fannie Mae Pool #BQ7478 2.50% 4/1/20525 | 1,222 | 1,038 | ||||||
Fannie Mae Pool #CB3350 2.50% 4/1/20525 | 1,011 | 859 | ||||||
Fannie Mae Pool #BU8802 2.50% 4/1/20525 | 998 | 848 | ||||||
Fannie Mae Pool #BU8916 2.50% 4/1/20525 | 785 | 666 | ||||||
Fannie Mae Pool #BU6901 2.50% 4/1/20525 | 91 | 77 | ||||||
Fannie Mae Pool #MA4600 3.50% 5/1/20525 | 2,782 | 2,531 | ||||||
Fannie Mae Pool #BV8959 2.50% 6/1/20525 | 127 | 108 | ||||||
Fannie Mae Pool #FS2239 2.50% 7/1/20525 | 6,973 | 5,920 | ||||||
Fannie Mae Pool #FS2555 4.50% 7/1/20525 | 1,105 | 1,065 | ||||||
Fannie Mae Pool #BW6395 4.50% 8/1/20525 | 999 | 963 | ||||||
Fannie Mae Pool #BW5789 4.50% 8/1/20525 | 371 | 357 | ||||||
Fannie Mae Pool #BW1201 5.00% 9/1/20525 | 2,820 | 2,783 | ||||||
Fannie Mae Pool #MA4761 5.00% 9/1/20525 | 524 | 517 | ||||||
Fannie Mae Pool #MA4784 4.50% 10/1/20525 | 2,209 | 2,128 | ||||||
Fannie Mae Pool #MA4785 5.00% 10/1/20525 | 1,300 | 1,283 | ||||||
Fannie Mae Pool #MA4804 4.00% 11/1/20525 | 854 | 802 | ||||||
Fannie Mae Pool #MA4839 4.00% 12/1/20525 | 442 | 415 | ||||||
Fannie Mae Pool #MA4841 5.00% 12/1/20525 | 3,000 | 2,961 | ||||||
Fannie Mae Pool #MA4866 4.00% 1/1/20535 | 238 | 223 | ||||||
Fannie Mae Pool #MA4868 5.00% 1/1/20535 | 1,000 | 987 | ||||||
Fertitta Entertainment, Inc. 4.625% 1/15/20297 | 25 | 21 | ||||||
Fertitta Entertainment, Inc. 6.75% 1/15/20307 | 25 | 20 | ||||||
First Quantum Minerals, Ltd. 6.875% 3/1/20267 | 325 | 308 | ||||||
First Quantum Minerals, Ltd. 6.875% 10/15/20277 | 240 | 226 | ||||||
First Student Bidco, Inc. 4.00% 7/31/20297 | 85 | 70 | ||||||
FirstEnergy Corp., Series B, 4.40% 7/15/2027 (4.15% on 1/15/2023)1 | 1,800 | 1,678 | ||||||
FirstEnergy Transmission, LLC 2.866% 9/15/20287 | 2,325 | 2,033 | ||||||
Florida Power & Light Company 2.875% 12/4/2051 | 1,465 | 990 | ||||||
Ford Motor Co. 3.25% 2/12/2032 | 20 | 15 | ||||||
Ford Motor Credit Company, LLC 3.81% 1/9/2024 | 290 | 282 | ||||||
Ford Motor Credit Company, LLC 2.90% 2/16/2028 | 200 | 165 | ||||||
Ford Motor Credit Company, LLC 4.00% 11/13/2030 | 125 | 103 | ||||||
Freddie Mac Pool #ZS8588 3.00% 11/1/20305 | 47 | 45 | ||||||
Freddie Mac, Series K153, Class A2, Multi Family, 3.82% 1/25/20335 | 3,975 | 3,742 | ||||||
Freddie Mac Pool #QC7173 2.50% 9/1/20515 | 132 | 112 | ||||||
Freddie Mac Pool #QC9156 2.50% 10/1/20515 | 866 | 736 | ||||||
Freddie Mac Pool #QD1523 2.50% 11/1/20515 | 757 | 643 | ||||||
Freddie Mac Pool #QD2521 2.50% 12/1/20515 | 67 | 57 | ||||||
Freddie Mac Pool #SD0853 2.50% 1/1/20525 | 885 | 750 | ||||||
Freddie Mac Pool #QD9066 2.50% 2/1/20525 | 210 | 179 | ||||||
Freddie Mac Pool #QD7063 2.50% 2/1/20525 | 95 | 81 | ||||||
Freddie Mac Pool #QD9879 2.50% 3/1/20525 | 730 | 619 | ||||||
Freddie Mac Pool #QD9460 2.50% 3/1/20525 | 663 | 562 | ||||||
Freddie Mac Pool #RA6959 2.50% 3/1/20525 | 27 | 23 | ||||||
214 American Funds Insurance Series
Table of Contents
Capital World Bond Fund (continued)
Bonds, notes & other debt instruments (continued)
| Principal amount (000) | Value (000) | |||||||
U.S. dollars (continued) | ||||||||
Freddie Mac Pool #QD9200 2.50% 4/1/20525 | USD | 919 | $ | 780 | ||||
Freddie Mac Pool #QE0323 2.50% 4/1/20525 | 900 | 765 | ||||||
Freddie Mac Pool #QE2310 2.50% 4/1/20525 | 840 | 713 | ||||||
Freddie Mac Pool #QE4383 4.00% 6/1/20525 | 3,563 | 3,345 | ||||||
Freddie Mac Pool #QE6084 5.00% 7/1/20525 | 1,276 | 1,260 | ||||||
Freddie Mac Pool #QE8063 4.00% 8/1/20525 | 300 | 282 | ||||||
Freddie Mac Pool #QE8065 4.50% 8/1/20525 | 3,700 | 3,565 | ||||||
Freddie Mac Pool #QF0152 4.50% 9/1/20525 | 500 | 482 | ||||||
Freddie Mac Pool #QF1489 4.00% 10/1/20525 | 1,000 | 939 | ||||||
Freddie Mac Pool #SD8256 4.00% 10/1/20525 | 400 | 376 | ||||||
Freddie Mac Pool #SD8257 4.50% 10/1/20525 | 8,419 | 8,111 | ||||||
Freddie Mac Pool #QF0866 4.50% 10/1/20525 | 2,226 | 2,151 | ||||||
Freddie Mac Pool #QF1486 4.50% 10/1/20525 | 400 | 385 | ||||||
Freddie Mac Pool #QF3304 5.00% 10/1/20525 | 800 | 790 | ||||||
Freddie Mac Pool #SD8264 3.50% 11/1/20525 | 4,668 | 4,246 | ||||||
Freddie Mac Pool #QF3985 4.00% 11/1/20525 | 308 | 290 | ||||||
Freddie Mac Pool #SD8275 4.50% 12/1/20525 | 598 | 576 | ||||||
Freddie Mac Pool #SD8276 5.00% 12/1/20525 | 4,753 | 4,692 | ||||||
Freddie Mac Pool #SD8288 5.00% 1/1/20535 | 507 | 501 | ||||||
Frontier Communications Corp. 5.875% 10/15/20277 | 100 | 93 | ||||||
Frontier Communications Corp. 5.00% 5/1/20287 | 65 | 57 | ||||||
Frontier Communications Holdings, LLC 5.875% 11/1/2029 | 250 | 194 | ||||||
FS Energy and Power Fund 7.50% 8/15/20237 | 150 | 150 | ||||||
FXI Holdings, Inc. 12.25% 11/15/20267 | 497 | 412 | ||||||
Gartner, Inc. 3.75% 10/1/20307 | 70 | 60 | ||||||
General Motors Financial Co. 1.05% 3/8/2024 | 725 | 689 | ||||||
Genesis Energy, LP 8.00% 1/15/2027 | 125 | 118 | ||||||
Georgia (Republic of) 2.75% 4/22/20267 | 400 | 363 | ||||||
GoDaddy Operating Co. 3.50% 3/1/20297 | 80 | 67 | ||||||
Goldman Sachs Group, Inc. 1.542% 9/10/2027 (USD-SOFR + 0.818% on 9/10/2026)1 | 1,080 | 933 | ||||||
Goldman Sachs Group, Inc. 2.383% 7/21/2032 (USD-SOFR + 1.248% on 7/21/2031)1 | 726 | 565 | ||||||
Government National Mortgage Assn. 3.50% 1/1/20535,11 | 7,440 | 6,837 | ||||||
Gray Escrow II, Inc. 5.375% 11/15/20317 | 30 | 22 | ||||||
Group 1 Automotive, Inc. 4.00% 8/15/20287 | 145 | 123 | ||||||
Groupe BPCE SA 5.15% 7/21/20247 | 1,800 | 1,763 | ||||||
Grupo Energia Bogota SA ESP 4.875% 5/15/20307 | 660 | 593 | ||||||
Hanesbrands, Inc. 4.625% 5/15/20247 | 120 | 116 | ||||||
Hanesbrands, Inc. 4.875% 5/15/20267 | 100 | 90 | ||||||
Harsco Corp. 5.75% 7/31/20277 | 200 | 158 | ||||||
Harvest Midstream I, LP 7.50% 9/1/20287 | 25 | 24 | ||||||
HCA, Inc. 5.625% 9/1/2028 | 120 | 120 | ||||||
HealthEquity, Inc. 4.50% 10/1/20297 | 30 | 26 | ||||||
Hess Midstream Operations, LP 5.50% 10/15/20307 | 34 | 31 | ||||||
Hightower Holding, LLC 6.75% 4/15/20297 | 235 | 198 | ||||||
Hilcorp Energy I, LP 6.00% 4/15/20307 | 105 | 94 | ||||||
Hilcorp Energy I, LP 6.00% 2/1/20317 | 115 | 100 | ||||||
Hilton Worldwide Holdings, Inc. 4.875% 1/15/2030 | 25 | 23 | ||||||
Hilton Worldwide Holdings, Inc. 4.00% 5/1/20317 | 155 | 130 | ||||||
Honduras (Republic of) 6.25% 1/19/2027 | 2,083 | 1,843 | ||||||
Honduras (Republic of) 5.625% 6/24/2030 | 958 | 773 | ||||||
Howard Hughes Corp. 5.375% 8/1/20287 | 275 | 248 | ||||||
Howard Hughes Corp. 4.125% 2/1/20297 | 195 | 164 | ||||||
Howard Hughes Corp. 4.375% 2/1/20317 | 120 | 97 | ||||||
Howard Midstream Energy Partners, LLC 6.75% 1/15/20277 | 60 | 58 | ||||||
HSBC Holdings PLC 2.633% 11/7/2025 (3-month USD-LIBOR + 1.14% on 11/7/2024)1 | 305 | 287 | ||||||
HSBC Holdings PLC 4.292% 9/12/2026 (3-month USD-LIBOR + 1.348% on 9/12/2025)1 | 4,172 | 3,995 | ||||||
HSBC Holdings PLC 2.871% 11/22/2032 (USD-SOFR + 1.41% on 11/22/2031)1 | 921 | 706 | ||||||
Huarong Finance 2019 Co., Ltd. (3-month USD-LIBOR + 1.125%) 5.824% 2/24/20239 | 3,326 | 3,316 | ||||||
Huarong Finance 2019 Co., Ltd. (3-month USD-LIBOR + 1.25%) 6.007% 2/24/20259 | 363 | 342 | ||||||
Huarong Finance II Co., Ltd. 5.50% 1/16/2025 | 880 | 835 | ||||||
American Funds Insurance Series 215
Table of Contents
Capital World Bond Fund (continued)
Bonds, notes & other debt instruments (continued)
Principal amount (000) | Value (000) | |||||||
U.S. dollars (continued) | ||||||||
Huarong Finance II Co., Ltd. 5.00% 11/19/2025 | USD | 1,007 | $ | 931 | ||||
HUB International, Ltd. 7.00% 5/1/20267 | 315 | 309 | ||||||
Hyundai Capital America 0.875% 6/14/20247 | 1,200 | 1,120 | ||||||
Hyundai Capital America 1.50% 6/15/20267 | 2,375 | 2,061 | ||||||
Hyundai Capital America 1.65% 9/17/20267 | 269 | 237 | ||||||
Hyundai Capital America 2.00% 6/15/20287 | 600 | 490 | ||||||
Hyundai Capital Services, Inc. 3.75% 3/5/20237 | 2,450 | 2,442 | ||||||
iHeartCommunications, Inc. 5.25% 8/15/20277 | 80 | 68 | ||||||
Ingles Markets, Inc. 4.00% 6/15/20317 | 140 | 118 | ||||||
Intesa Sanpaolo SpA 5.017% 6/26/20247 | 3,270 | 3,145 | ||||||
Intesa Sanpaolo SpA 7.00% 11/21/20257 | 225 | 230 | ||||||
Iraq (Republic of) 6.752% 3/9/20237 | 545 | 539 | ||||||
Iron Mountain Information Management Services, Inc. 5.00% 7/15/20327 | 55 | 46 | ||||||
Iron Mountain, Inc. 5.25% 7/15/20307 | 235 | 205 | ||||||
Israel (State of) 3.375% 1/15/2050 | 1,470 | 1,136 | ||||||
Israel (State of) 3.875% 7/3/2050 | 795 | 672 | ||||||
Jacobs Entertainment, Inc. 6.75% 2/15/20297 | 25 | 23 | ||||||
JPMorgan Chase & Co. 4.912% 7/25/2033 (USD-SOFR + 2.08% on 7/25/2032)1 | 45 | 43 | ||||||
Kantar Group, LLC, Term Loan B2, (3-month USD-LIBOR + 4.50%) 9.23% 12/4/20268,9 | 64 | 60 | ||||||
KB Home 6.875% 6/15/2027 | 50 | 50 | ||||||
Keb Hana Bank 3.25% 3/30/20277 | 1,370 | 1,278 | ||||||
Kennedy-Wilson Holdings, Inc. 4.75% 3/1/2029 | 110 | 87 | ||||||
Kennedy-Wilson Holdings, Inc. 4.75% 2/1/2030 | 245 | 187 | ||||||
Kinetik Holdings, LP 5.875% 6/15/20307 | 50 | 47 | ||||||
Kronos Acquisition Holdings, Inc. 5.00% 12/31/20267 | 85 | 74 | ||||||
Kronos Acquisition Holdings, Inc. 7.00% 12/31/20277 | 140 | 115 | ||||||
LABL Escrow Issuer, LLC 10.50% 7/15/20277 | 45 | 42 | ||||||
Lamar Media Corp. 3.75% 2/15/2028 | 135 | 121 | ||||||
Lamar Media Corp. 3.625% 1/15/2031 | 160 | 132 | ||||||
Lamb Weston Holdings, Inc. 4.125% 1/31/20307 | 200 | 177 | ||||||
Lamb Weston Holdings, Inc. 4.375% 1/31/20327 | 60 | 53 | ||||||
Las Vegas Sands Corp. 3.20% 8/8/2024 | 25 | 24 | ||||||
LCM Investments Holdings II, LLC 4.875% 5/1/20297 | 110 | 88 | ||||||
Level 3 Financing, Inc. 3.75% 7/15/20297 | 210 | 151 | ||||||
Levi Strauss & Co. 3.50% 3/1/20317 | 115 | 91 | ||||||
Ligado Networks, LLC 15.50% PIK 11/1/20237,10 | 124 | 40 | ||||||
Lindblad Expeditions, LLC 6.75% 2/15/20277 | 5 | 5 | ||||||
Lithia Motors, Inc. 4.625% 12/15/20277 | 120 | 108 | ||||||
Live Nation Entertainment, Inc. 4.75% 10/15/20277 | 130 | 116 | ||||||
Lloyds Banking Group PLC 1.627% 5/11/2027 (1-year UST Yield Curve Rate T Note Constant Maturity + 0.85% on 5/11/2026)1 | 7,000 | 6,067 | ||||||
LPL Holdings, Inc. 4.625% 11/15/20277 | 485 | 454 | ||||||
LPL Holdings, Inc. 4.00% 3/15/20297 | 25 | 22 | ||||||
LSB Industries, Inc. 6.25% 10/15/20287 | 126 | 115 | ||||||
LSC Communications, Inc. 8.75% 10/15/20233,6,7 | 431 | 1 | ||||||
Mallinckrodt PLC 10.00% 4/15/20257 | 440 | 379 | ||||||
Marriott International, Inc. 2.75% 10/15/2033 | 5 | 4 | ||||||
Mastercard, Inc. 2.00% 11/18/2031 | 600 | 483 | ||||||
Match Group, Inc. 5.625% 2/15/20297 | 130 | 121 | ||||||
Meituan Dianping 2.125% 10/28/2025 | 1,730 | 1,532 | ||||||
Meituan Dianping 3.05% 10/28/20307 | 3,095 | 2,390 | ||||||
Methanex Corp. 5.125% 10/15/2027 | 55 | 51 | ||||||
Methanex Corp. 5.25% 12/15/2029 | 170 | 151 | ||||||
Mexico City Airport Trust 5.50% 7/31/2047 | 432 | 334 | ||||||
MGM Resorts International 5.50% 4/15/2027 | 90 | 84 | ||||||
Midas OpCo Holdings, LLC 5.625% 8/15/20297 | 145 | 120 | ||||||
Mileage Plus Holdings, LLC 6.50% 6/20/20277 | 63 | 63 | ||||||
Mineral Resources, Ltd. 8.00% 11/1/20277 | 155 | 159 | ||||||
Mineral Resources, Ltd. 8.50% 5/1/20307 | 25 | 25 | ||||||
MISC Capital Two (Labuan), Ltd. 3.75% 4/6/20277 | 3,236 | 2,937 | ||||||
Mohegan Gaming & Entertainment 8.00% 2/1/20267 | 105 | 98 | ||||||
216 American Funds Insurance Series
Table of Contents
Capital World Bond Fund (continued)
Bonds, notes & other debt instruments (continued)
Principal amount (000) | Value (000) | |||||||
U.S. dollars (continued) | ||||||||
Molina Healthcare, Inc. 4.375% 6/15/20287 | USD | 80 | $ | 73 | ||||
Molina Healthcare, Inc. 3.875% 11/15/20307 | 75 | 64 | ||||||
MoneyGram International, Inc. 5.375% 8/1/20267 | 50 | 51 | ||||||
Morgan Stanley 1.593% 5/4/2027 (USD-SOFR + 0.879% on 5/4/2026)1 | 2,164 | 1,901 | ||||||
Morgan Stanley 1.928% 4/28/2032 (USD-SOFR + 1.02% on 4/28/2031)1 | 1,396 | 1,057 | ||||||
Mozart Debt Merger Sub, Inc. 5.25% 10/1/20297 | 155 | 123 | ||||||
MSCI, Inc. 3.875% 2/15/20317 | 215 | 179 | ||||||
MSCI, Inc. 3.625% 11/1/20317 | 350 | 290 | ||||||
Murphy Oil Corp. 5.625% 5/1/2027 | 15 | 15 | ||||||
Murphy Oil USA, Inc. 4.75% 9/15/2029 | 48 | 44 | ||||||
Nabors Industries, Inc. 7.375% 5/15/20277 | 55 | 53 | ||||||
National Financial Partners Corp. 6.875% 8/15/20287 | 105 | 87 | ||||||
Nationstar Mortgage Holdings, Inc. 5.125% 12/15/20307 | 135 | 104 | ||||||
Navient Corp. 5.00% 3/15/2027 | 45 | 39 | ||||||
Navient Corp. 4.875% 3/15/2028 | 145 | 119 | ||||||
NCL Corp., Ltd. 5.875% 2/15/20277 | 80 | 69 | ||||||
NCR Corp. 5.25% 10/1/20307 | 15 | 12 | ||||||
Neiman Marcus Group, LLC 7.125% 4/1/20267 | 85 | 80 | ||||||
Netflix, Inc. 4.875% 4/15/2028 | 45 | 44 | ||||||
Netflix, Inc. 4.875% 6/15/20307 | 225 | 210 | ||||||
New Fortress Energy, Inc. 6.75% 9/15/20257 | 50 | 47 | ||||||
New Fortress Energy, Inc. 6.50% 9/30/20267 | 255 | 237 | ||||||
New York Life Global Funding 1.20% 8/7/20307 | 2,725 | 2,094 | ||||||
Newell Rubbermaid, Inc. 4.70% 4/1/2026 | 80 | 75 | ||||||
Nexstar Broadcasting, Inc. 4.75% 11/1/20287 | 255 | 221 | ||||||
Nexstar Escrow Corp. 5.625% 7/15/20277 | 115 | 106 | ||||||
NGL Energy Operating, LLC 7.50% 2/1/20267 | 215 | 192 | ||||||
NGL Energy Partners, LP 7.50% 11/1/2023 | 200 | 195 | ||||||
Niagara Mohawk Power Corp. 3.508% 10/1/20247 | 180 | 173 | ||||||
Northern Oil and Gas, Inc. 8.125% 3/1/20287 | 335 | 322 | ||||||
NorthRiver Midstream Finance, LP 5.625% 2/15/20267 | 105 | 100 | ||||||
NortonLifeLock, Inc. 7.125% 9/30/20307 | 160 | 157 | ||||||
Nova Chemicals Corp. 5.25% 6/1/20277 | 20 | 18 | ||||||
Novelis Corp. 4.75% 1/30/20307 | 80 | 71 | ||||||
Novelis Corp. 3.875% 8/15/20317 | 20 | 16 | ||||||
NuStar Logistics, LP 5.625% 4/28/2027 | 80 | 75 | ||||||
Oasis Petroleum, Inc. 6.375% 6/1/20267 | 35 | 34 | ||||||
Occidental Petroleum Corp. 6.375% 9/1/2028 | 194 | 196 | ||||||
Occidental Petroleum Corp. 8.875% 7/15/2030 | 25 | 28 | ||||||
Occidental Petroleum Corp. 6.625% 9/1/2030 | 125 | 129 | ||||||
Occidental Petroleum Corp. 6.125% 1/1/2031 | 65 | 66 | ||||||
Occidental Petroleum Corp. 6.45% 9/15/2036 | 18 | 18 | ||||||
Occidental Petroleum Corp. 6.60% 3/15/2046 | 15 | 15 | ||||||
State of Ohio, Turnpike and Infrastructure Commission, Turnpike Rev. Ref. Bonds (Infrastructure Projects), Series 2020-A, 3.216% 2/15/2048 | 1,410 | 1,008 | ||||||
Oleoducto Central SA 4.00% 7/14/20277 | 2,535 | 2,241 | ||||||
Oleoducto Central SA 4.00% 7/14/2027 | 630 | 557 | ||||||
Open Text Corp. 3.875% 2/15/20287 | 25 | 22 | ||||||
Open Text Corp., Term Loan B, (3-month USD-LIBOR + 3.50%) 3.50% 11/16/20298,9 | 155 | 151 | ||||||
Option Care Health, Inc. 4.375% 10/31/20297 | 25 | 22 | ||||||
Oracle Corp. 2.65% 7/15/2026 | 2,327 | 2,142 | ||||||
Oracle Corp. 3.25% 11/15/2027 | 1,880 | 1,730 | ||||||
Oracle Corp. 3.60% 4/1/2050 | 980 | 664 | ||||||
Oracle Corp. 3.95% 3/25/2051 | 22 | 16 | ||||||
Orange SA 9.00% 3/1/20311 | 2,434 | 2,985 | ||||||
Oxford Finance, LLC 6.375% 2/1/20277 | 30 | 28 | ||||||
Pacific Gas and Electric Co. 4.65% 8/1/2028 | 542 | 499 | ||||||
Pacific Gas and Electric Co. 3.30% 8/1/2040 | 6,850 | 4,661 | ||||||
Panama (Republic of) 3.75% 4/17/20267 | 465 | 439 | ||||||
Panther BF Aggregator 2, LP 6.25% 5/15/20267 | 44 | 43 | ||||||
Panther BF Aggregator 2, LP 8.50% 5/15/20277 | 85 | 83 | ||||||
Park Intermediate Holdings, LLC 4.875% 5/15/20297 | 65 | 55 | ||||||
American Funds Insurance Series 217
Table of Contents
Capital World Bond Fund (continued)
Bonds, notes & other debt instruments (continued)
Principal amount (000) | Value (000) | |||||||
U.S. dollars (continued) | ||||||||
Party City Holdings, Inc. 8.75% 2/15/20267 | USD | 5 | $ | 1 | ||||
Performance Food Group, Inc. 5.50% 10/15/20277 | 11 | 10 | ||||||
Peru (Republic of) 2.392% 1/23/2026 | 500 | 461 | ||||||
Petrobras Global Finance Co. 6.75% 6/3/2050 | 29 | 25 | ||||||
Petrobras Global Finance Co. 5.50% 6/10/2051 | 21 | 16 | ||||||
Petróleos Mexicanos 4.625% 9/21/2023 | 714 | 704 | ||||||
Petróleos Mexicanos 6.875% 10/16/2025 | 660 | 647 | ||||||
Petróleos Mexicanos 6.875% 8/4/2026 | 865 | 819 | ||||||
Petróleos Mexicanos 6.49% 1/23/2027 | 406 | 371 | ||||||
Petróleos Mexicanos 6.50% 3/13/2027 | 1,493 | 1,365 | ||||||
Petróleos Mexicanos 6.84% 1/23/2030 | 681 | 564 | ||||||
Petróleos Mexicanos 6.70% 2/16/2032 | 779 | 613 | ||||||
Petróleos Mexicanos 6.75% 9/21/2047 | 346 | 222 | ||||||
Petróleos Mexicanos 7.69% 1/23/2050 | 55 | 38 | ||||||
Petróleos Mexicanos 6.95% 1/28/2060 | 201 | 128 | ||||||
PG&E Corp. 5.00% 7/1/2028 | 145 | 133 | ||||||
PG&E Corp. 5.25% 7/1/2030 | 175 | 160 | ||||||
PGT Innovations, Inc. 4.375% 10/1/20297 | 5 | 4 | ||||||
Philip Morris International, Inc. 5.125% 11/17/2027 | 315 | 318 | ||||||
Philip Morris International, Inc. 5.625% 11/17/2029 | 420 | 427 | ||||||
Philip Morris International, Inc. 2.10% 5/1/2030 | 634 | 514 | ||||||
Philip Morris International, Inc. 5.75% 11/17/2032 | 1,554 | 1,589 | ||||||
Picard Midco, Inc. 6.50% 3/31/20297 | 235 | 198 | ||||||
Post Holdings, Inc. 5.625% 1/15/20287 | 85 | 80 | ||||||
Post Holdings, Inc. 5.50% 12/15/20297 | 80 | 73 | ||||||
Post Holdings, Inc. 4.625% 4/15/20307 | 444 | 384 | ||||||
Procter & Gamble Company 3.00% 3/25/2030 | 338 | 310 | ||||||
PT Indonesia Asahan Aluminium Tbk 5.71% 11/15/2023 | 960 | 963 | ||||||
PT Indonesia Asahan Aluminium Tbk 5.45% 5/15/20307 | 500 | 477 | ||||||
Qatar Petroleum 3.125% 7/12/20417 | 2,895 | 2,235 | ||||||
Radiology Partners, Inc. 9.25% 2/1/20287 | 245 | 138 | ||||||
Radiology Partners, Inc., Term Loan, (3-month USD-LIBOR + 4.25%) 8.639% 7/9/20258,9 | 10 | 8 | ||||||
Range Resources Corp. 4.75% 2/15/20307 | 145 | 128 | ||||||
Raptor Acquisition Corp. 4.875% 11/1/20267 | 180 | 160 | ||||||
Real Hero Merger Sub 2, Inc. 6.25% 2/1/20297 | 25 | 17 | ||||||
RLJ Lodging Trust, LP 4.00% 9/15/20297 | 25 | 20 | ||||||
Roller Bearing Company of America, Inc. 4.375% 10/15/20297 | 20 | 17 | ||||||
Royal Caribbean Cruises, Ltd. 11.50% 6/1/20257 | 57 | 61 | ||||||
Royal Caribbean Cruises, Ltd. 5.375% 7/15/20277 | 40 | 32 | ||||||
Royal Caribbean Cruises, Ltd. 9.25% 1/15/20297 | 160 | 165 | ||||||
RP Escrow Issuer, LLC 5.25% 12/15/20257 | 190 | 145 | ||||||
Russian Federation 4.25% 6/23/20273 | 1,400 | 602 | ||||||
Ryan Specialty Group, LLC 4.375% 2/1/20307 | 45 | 39 | ||||||
Sabre GLBL, Inc. 11.25% 12/15/20277 | 75 | 77 | ||||||
Sally Holdings, LLC 5.625% 12/1/2025 | 48 | 46 | ||||||
Santander Holdings USA, Inc. 3.244% 10/5/2026 | 3,750 | 3,485 | ||||||
Scentre Group 3.50% 2/12/20257 | 210 | 201 | ||||||
Scentre Group 3.75% 3/23/20277 | 110 | 101 | ||||||
Scientific Games Corp. 7.00% 5/15/20287 | 20 | 19 | ||||||
Scientific Games Holdings, LP 6.625% 3/1/20307 | 46 | 39 | ||||||
SCIH Salt Holdings, Inc. 4.875% 5/1/20287 | 115 | 99 | ||||||
Scotts Miracle-Gro Co. 4.50% 10/15/2029 | 140 | 114 | ||||||
Scotts Miracle-Gro Co. 4.375% 2/1/2032 | 55 | 42 | ||||||
Sealed Air Corp. 5.00% 4/15/20297 | 40 | 38 | ||||||
ServiceNow, Inc. 1.40% 9/1/2030 | 1,830 | 1,404 | ||||||
Silgan Holdings, Inc. 4.125% 2/1/2028 | 80 | 74 | ||||||
Simmons Foods, Inc. 4.625% 3/1/20297 | 160 | 130 | ||||||
Singapore Airlines, Ltd. 3.375% 1/19/2029 | 3,710 | 3,353 | ||||||
Sirius XM Radio, Inc. 4.00% 7/15/20287 | 195 | 170 | ||||||
Sirius XM Radio, Inc. 3.875% 9/1/20317 | 170 | 133 | ||||||
SkyMiles IP, Ltd. 4.75% 10/20/20287 | 25 | 24 | ||||||
218 American Funds Insurance Series
Table of Contents
Capital World Bond Fund (continued)
Bonds, notes & other debt instruments (continued)
Principal amount (000) | Value (000) | |||||||
U.S. dollars (continued) | ||||||||
SM Energy Co. 5.625% 6/1/2025 | USD | 55 | $ | 53 | ||||
SM Energy Co. 6.50% 7/15/2028 | 45 | 43 | ||||||
Sonic Automotive, Inc. 4.625% 11/15/20297 | 45 | 36 | ||||||
Sonic Automotive, Inc. 4.875% 11/15/20317 | 20 | 16 | ||||||
Southern California Edison Co. 2.85% 8/1/2029 | 200 | 174 | ||||||
Southwestern Energy Co. 5.95% 1/23/20251 | 110 | 108 | ||||||
Southwestern Energy Co. 7.75% 10/1/2027 | 20 | 20 | ||||||
Southwestern Energy Co. 8.375% 9/15/2028 | 30 | 31 | ||||||
Southwestern Energy Co. 5.375% 3/15/2030 | 135 | 123 | ||||||
Southwestern Energy Co. 4.75% 2/1/2032 | 105 | 90 | ||||||
Spirit AeroSystems, Inc. 9.375% 11/30/20297 | 17 | 18 | ||||||
Sprint Corp. 7.625% 3/1/2026 | 130 | 137 | ||||||
Sri Lanka (Democratic Socialist Republic of) 5.75% 4/18/20233 | 2,890 | 917 | ||||||
Stellantis Finance US, Inc. 1.711% 1/29/20277 | 1,500 | 1,289 | ||||||
Stellantis Finance US, Inc. 5.625% 1/12/20287 | 2,560 | 2,539 | ||||||
Stellantis Finance US, Inc. 2.691% 9/15/20317 | 453 | 347 | ||||||
Stericycle, Inc. 3.875% 1/15/20297 | 110 | 96 | ||||||
Studio City Finance, Ltd. 6.00% 7/15/20257 | 200 | 174 | ||||||
Sunoco, LP 4.50% 5/15/2029 | 290 | 254 | ||||||
Sunoco, LP 4.50% 4/30/2030 | 35 | 30 | ||||||
Surgery Center Holdings 10.00% 4/15/20277 | 103 | 105 | ||||||
SVB Financial Group 4.70% junior subordinated perpetual bonds (5-year UST Yield Curve Rate T Note Constant Maturity + 3.064% on 11/15/2031)1 | 12 | 8 | ||||||
Swiss Re Finance (Luxembourg) SA 5.00% 4/2/2049 (5-year UST Yield Curve Rate T Note Constant Maturity + 3.582% on 4/2/2029)1,7 | 800 | 740 | ||||||
Talen Energy Corp. 7.25% 5/15/20277 | 205 | 213 | ||||||
Tencent Holdings, Ltd. 3.24% 6/3/20507 | 3,450 | 2,188 | ||||||
Tenet Healthcare Corp. 4.875% 1/1/20267 | 245 | 232 | ||||||
Tenet Healthcare Corp. 6.125% 10/1/20287 | 25 | 22 | ||||||
Teva Pharmaceutical Finance Co. BV 6.00% 4/15/2024 | 4,600 | 4,518 | ||||||
Teva Pharmaceutical Finance Co. BV 7.125% 1/31/2025 | 3,710 | 3,695 | ||||||
Teva Pharmaceutical Finance Co. BV 3.15% 10/1/2026 | 110 | 96 | ||||||
State of Texas, Grand Parkway Transportation Corp., | ||||||||
Grand Parkway System Toll Rev. Ref. Bonds, Series 2020-B, 3.236% 10/1/2052 | 1,780 | 1,266 | ||||||
Thermo Fisher Scientific, Inc. 4.80% 11/21/2027 | 630 | 633 | ||||||
Tibco Software, Inc., Term Loan A, | ||||||||
(3-month USD CME Term SOFR + 4.50%) 9.18% 9/29/20288,9 | 245 | 218 | ||||||
T-Mobile US, Inc. 2.40% 3/15/2029 | 1,079 | 913 | ||||||
Toyota Motor Credit Corp. 3.375% 4/1/2030 | 453 | 412 | ||||||
TransDigm, Inc. 6.25% 3/15/20267 | 65 | 64 | ||||||
TransDigm, Inc. 5.50% 11/15/2027 | 35 | 33 | ||||||
TransDigm, Inc. 4.875% 5/1/2029 | 80 | 70 | ||||||
Transocean Guardian, Ltd. 5.875% 1/15/20247 | 10 | 10 | ||||||
Transocean Poseidon, Ltd. 6.875% 2/1/20277 | 66 | 64 | ||||||
Treehouse Park Improvement Association No.1 - Anleihen 9.75% 12/1/20336,7 | 100 | 88 | ||||||
Triumph Group, Inc. 6.25% 9/15/20247 | 35 | 33 | ||||||
U.S. Treasury 0.125% 1/31/2023 | 12,320 | 12,282 | ||||||
U.S. Treasury 2.625% 2/28/2023 | 6,900 | 6,882 | ||||||
U.S. Treasury 1.875% 8/31/2024 | 4,515 | 4,320 | ||||||
U.S. Treasury 3.25% 8/31/2024 | 1,065 | 1,043 | ||||||
U.S. Treasury 0.25% 8/31/2025 | 20,534 | 18,475 | ||||||
U.S. Treasury 2.875% 11/30/2025 | 5,400 | 5,198 | ||||||
U.S. Treasury 4.00% 12/15/2025 | 1,992 | 1,980 | ||||||
U.S. Treasury 0.375% 1/31/2026 | 14,610 | 13,004 | ||||||
U.S. Treasury 0.75% 8/31/2026 | 4,361 | 3,862 | ||||||
U.S. Treasury 0.875% 9/30/2026 | 11,098 | 9,858 | ||||||
U.S. Treasury 1.125% 10/31/2026 | 1,698 | 1,519 | ||||||
U.S. Treasury 2.50% 3/31/2027 | 9,560 | 8,975 | ||||||
U.S. Treasury 3.875% 11/30/2027 | 105,639 | 105,067 | ||||||
U.S. Treasury 1.625% 8/15/2029 | 10,760 | 9,336 | ||||||
U.S. Treasury 1.375% 11/15/203112 | 25,783 | 20,999 | ||||||
American Funds Insurance Series 219
Table of Contents
Capital World Bond Fund (continued)
Bonds, notes & other debt instruments (continued)
Principal amount (000) | Value (000) | |||||||
U.S. dollars (continued) | ||||||||
U.S. Treasury 1.875% 2/15/2032 | USD | 2,000 | $ | 1,696 | ||||
U.S. Treasury 4.125% 11/15/2032 | 1,169 | 1,192 | ||||||
U.S. Treasury 1.125% 5/15/2040 | 9,170 | 5,754 | ||||||
U.S. Treasury 1.875% 2/15/204112 | 18,740 | 13,274 | ||||||
U.S. Treasury 1.75% 8/15/2041 | 6,050 | 4,151 | ||||||
U.S. Treasury 2.375% 2/15/2042 | 2,872 | 2,195 | ||||||
U.S. Treasury 3.00% 8/15/2048 | 5,045 | 4,164 | ||||||
U.S. Treasury 2.00% 8/15/2051 | 5,755 | 3,788 | ||||||
U.S. Treasury 3.00% 8/15/205212 | 29,749 | 24,666 | ||||||
U.S. Treasury Inflation-Protected Security 0.125% 2/15/20514 | 3,239 | 2,089 | ||||||
UBS Group AG 1.008% 7/30/2024 (5-year UST Yield Curve Rate T Note Constant Maturity + 0.83% on 7/30/2023)1,7 | 1,950 | 1,897 | ||||||
UBS Group AG 4.49% 8/5/2025 (1-year UST Yield Curve Rate T Note Constant Maturity + 1.60% on 8/5/2024)1,7 | 2,265 | 2,228 | ||||||
UKG, Inc., Term Loan, (3-month USD-LIBOR + 5.25%) 8.998% 5/3/20278,9 | 75 | 69 | ||||||
Ukraine 7.75% 9/1/20243 | 6,210 | 1,544 | ||||||
Ukraine 7.75% 9/1/20263 | 1,570 | 338 | ||||||
Ukraine 6.876% 5/21/20313 | 1,269 | 244 | ||||||
Uniform Mortgage-Backed Security 5.00% 1/1/20535,11 | 2,100 | 2,070 | ||||||
Uniform Mortgage-Backed Security 5.50% 1/1/20535,11 | 10,300 | 10,329 | ||||||
Unisys Corp. 6.875% 11/1/20277 | 35 | 27 | ||||||
United Natural Foods, Inc. 6.75% 10/15/20287 | 235 | 226 | ||||||
United Rentals, Inc. 4.875% 1/15/2028 | 30 | 29 | ||||||
United Rentals, Inc. 6.00% 12/15/20297 | 315 | 314 | ||||||
Univision Communications, Inc. 4.50% 5/1/20297 | 240 | 201 | ||||||
Univision Communications, Inc. 7.375% 6/30/20307 | 145 | 139 | ||||||
US Foods, Inc. 4.625% 6/1/20307 | 35 | 31 | ||||||
Vail Resorts, Inc. 6.25% 5/15/20257 | 120 | 120 | ||||||
Valeant Pharmaceuticals International, Inc. 5.50% 11/1/20257 | 75 | 64 | ||||||
Valvoline, Inc. 3.625% 6/15/20317 | 85 | 70 | ||||||
Venator Finance SARL 9.50% 7/1/20257 | 185 | 134 | ||||||
Venator Finance SARL 5.75% 7/15/20257 | 140 | 48 | ||||||
Venture Global Calcasieu Pass, LLC 3.875% 8/15/20297 | 35 | 31 | ||||||
Venture Global Calcasieu Pass, LLC 4.125% 8/15/20317 | 125 | 107 | ||||||
Venture Global Calcasieu Pass, LLC 3.875% 11/1/20337 | 65 | 53 | ||||||
Verizon Communications, Inc. 3.15% 3/22/2030 | 575 | 508 | ||||||
Verizon Communications, Inc. 2.55% 3/21/2031 | 2,100 | 1,732 | ||||||
VICI Properties, LP 4.375% 5/15/2025 | 1,563 | 1,520 | ||||||
VICI Properties, LP 4.625% 12/1/20297 | 15 | 14 | ||||||
VICI Properties, LP 4.125% 8/15/20307 | 420 | 368 | ||||||
VZ Secured Financing BV 5.00% 1/15/20327 | 200 | 163 | ||||||
W. R. Grace Holdings, LLC 5.625% 8/15/20297 | 20 | 16 | ||||||
Warner Music Group 3.75% 12/1/20297 | 125 | 108 | ||||||
Warner Music Group 3.875% 7/15/20307 | 135 | 117 | ||||||
Warner Music Group 3.00% 2/15/20317 | 80 | 64 | ||||||
WarnerMedia Holdings, Inc. 4.279% 3/15/20327 | 917 | 758 | ||||||
WarnerMedia Holdings, Inc. 5.05% 3/15/20427 | 1,928 | 1,482 | ||||||
Warrior Met Coal, Inc. 7.875% 12/1/20287 | 140 | 138 | ||||||
WASH Multifamily Acquisition, Inc. 5.75% 4/15/20267 | 320 | 302 | ||||||
WEA Finance, LLC 3.75% 9/17/20247 | 535 | 506 | ||||||
Weatherford International, Ltd. 11.00% 12/1/20247 | 5 | 5 | ||||||
Weatherford International, Ltd. 6.50% 9/15/20287 | 65 | 64 | ||||||
Weatherford International, Ltd. 8.625% 4/30/20307 | 65 | 63 | ||||||
Wells Fargo & Company 3.526% 3/24/2028 (USD-SOFR + 1.51% on 3/24/2027)1 | 5,788 | 5,370 | ||||||
Wells Fargo & Company 4.611% 4/25/2053 (USD-SOFR + 2.13% on 4/25/2052)1 | 1,600 | 1,363 | ||||||
WESCO Distribution, Inc. 7.125% 6/15/20257 | 180 | 183 | ||||||
WESCO Distribution, Inc. 7.25% 6/15/20287 | 245 | 249 | ||||||
Western Global Airlines, LLC 10.375% 8/15/20257 | 15 | 11 | ||||||
Western Midstream Operating, LP 3.35% 2/1/20251 | 85 | 81 | ||||||
Western Midstream Operating, LP 4.75% 8/15/2028 | 65 | 59 | ||||||
Western Midstream Operating, LP 5.50% 2/1/20501 | 25 | 21 | ||||||
220 American Funds Insurance Series
Table of Contents
Capital World Bond Fund (continued)
Bonds, notes & other debt instruments (continued)
Principal amount (000) | Value (000) | |||||||||||
U.S. dollars (continued) | ||||||||||||
Westpac Banking Corp. 2.894% 2/4/2030 (5-year UST Yield Curve Rate T Note Constant Maturity + 1.35% on 2/4/2025)1 | USD | 1,250 | $ | 1,147 | ||||||||
WeWork Companies, LLC 5.00% 7/10/20257 | 50 | 17 | ||||||||||
Wyndham Destinations, Inc. 6.625% 7/31/20267 | 65 | 64 | ||||||||||
Wynn Las Vegas, LLC 4.25% 5/30/20237 | 38 | 38 | ||||||||||
Wynn Resorts Finance, LLC 7.75% 4/15/20257 | 180 | 179 | ||||||||||
Yahoo Holdings, Inc., Term Loan B, (1-month USD-LIBOR + 5.50%) 9.884% 9/1/20278,9 | 110 | 100 | ||||||||||
Ziggo Bond Co. BV 5.125% 2/28/20307 | 200 | 162 | ||||||||||
Ziggo Bond Finance BV 4.875% 1/15/20307 | 300 | 252 | ||||||||||
|
| |||||||||||
| 669,959 | ||||||||||||
|
| |||||||||||
Total bonds, notes & other debt instruments (cost: $1,515,444,000) | 1,337,877 | |||||||||||
|
| |||||||||||
Investment funds 3.29% | ||||||||||||
| Shares | ||||||||||||
U.S. dollars 3.29% | ||||||||||||
Capital Group Central Corporate Bond Fund13 | 5,972,524 | 48,676 | ||||||||||
|
| |||||||||||
Total investment funds (cost: $47,079,000) | 48,676 | |||||||||||
|
| |||||||||||
Preferred securities 0.00% | ||||||||||||
U.S. dollars 0.00% | ||||||||||||
ACR III LSC Holdings, LLC, Series B, preferred shares6,7,14 | 48 | 20 | ||||||||||
|
| |||||||||||
Total preferred securities (cost: $49,000) | 20 | |||||||||||
|
| |||||||||||
Common stocks 0.01% | ||||||||||||
U.S. dollars 0.01% | ||||||||||||
Constellation Oil Services Holding SA, Class B-16,14 | 1,214,969 | 134 | ||||||||||
Bighorn Permian Resources, LLC6 | 531 | — | 15 | |||||||||
|
| |||||||||||
Total common stocks (cost: $0) | 134 | |||||||||||
|
| |||||||||||
| Short-term securities 6.79% | ||||||||||||
Weighted average yield at acquisition | Principal amount (000) | |||||||||||
Commercial paper 6.78% | ||||||||||||
DNB Bank ASA 3/2/20237 | 4.273 | % | USD | 35,000 | 34,740 | |||||||
NRW.Bank 2/6/20237 | 4.192 | 31,100 | 30,957 | |||||||||
Oesterreich Kontrollbank 2/21/2023 | 4.245 | 35,000 | 34,773 | |||||||||
|
| |||||||||||
| 100,470 | ||||||||||||
|
| |||||||||||
| Shares | ||||||||||||
Money market investments 0.01% | ||||||||||||
Capital Group Central Cash Fund 4.31%13,16 | 1,674 | 167 | ||||||||||
|
| |||||||||||
Total short-term securities (cost: $100,664,000) | 100,637 | |||||||||||
|
| |||||||||||
Total investment securities 100.37% (cost: $1,663,236,000) | 1,487,344 | |||||||||||
Other assets less liabilities (0.37)% | (5,450 | ) | ||||||||||
|
| |||||||||||
Net assets 100.00% | $ | 1,481,894 | ||||||||||
|
| |||||||||||
American Funds Insurance Series 221
Table of Contents
Capital World Bond Fund (continued)
Futures contracts
Contracts | Type | Number of contracts | Expiration | Notional amount (000) | Value and unrealized (depreciation) appreciation at 12/31/2022 (000) | |||||||||||||||
2 Year Euro-Schatz Futures | Long | 60 | March 2023 | USD | 6,771 | $ | (87 | ) | ||||||||||||
2 Year U.S. Treasury Note Futures | Long | 130 | March 2023 | 26,660 | 31 | |||||||||||||||
5 Year Euro-Bobl Futures | Long | 236 | March 2023 | 29,242 | (987 | ) | ||||||||||||||
5 Year U.S. Treasury Note Futures | Long | 1,196 | March 2023 | 129,084 | (139 | ) | ||||||||||||||
10 Year Euro-Bund Futures | Long | 95 | March 2023 | 13,518 | (880 | ) | ||||||||||||||
10 Year Italy Government Bond Futures | Long | 71 | March 2023 | 8,278 | (663 | ) | ||||||||||||||
10 Year Japanese Government Bond Futures | Long | 9 | March 2023 | 9,975 | (41 | ) | ||||||||||||||
10 Year U.S. Treasury Note Futures | Long | 328 | March 2023 | 36,833 | (201 | ) | ||||||||||||||
10 Year Ultra U.S. Treasury Note Futures | Short | 175 | March 2023 | (20,699 | ) | 123 | ||||||||||||||
10 Year UK Gilt Futures | Short | 44 | March 2023 | (5,314 | ) | 335 | ||||||||||||||
20 Year U.S. Treasury Bond Futures | Long | 65 | March 2023 | 8,147 | (131 | ) | ||||||||||||||
30 Year Euro-Buxl Futures | Long | 57 | March 2023 | 8,252 | (1,530 | ) | ||||||||||||||
30 Year Ultra U.S. Treasury Bond Futures | Short | 170 | March 2023 | (22,833 | ) | 183 | ||||||||||||||
|
| |||||||||||||||||||
| $ | (3,987 | ) | ||||||||||||||||||
|
| |||||||||||||||||||
Forward currency contracts
| Contract amount | Unrealized appreciation (depreciation) | |||||||||||||||
| Currency purchased (000) | Currency sold (000) | Counterparty | Settlement date | at 12/31/2022 (000) | ||||||||||||
| KRW | 8,431,290 | USD | 6,478 | Bank of America | 1/9/2023 | $ | 219 | |||||||||
| HUF | 1,284,310 | EUR | 3,067 | UBS AG | 1/10/2023 | 145 | ||||||||||
| PLN | 20,540 | EUR | 4,330 | HSBC Bank | 1/10/2023 | 45 | ||||||||||
| DKK | 17,400 | USD | 2,465 | UBS AG | 1/10/2023 | 42 | ||||||||||
| PLN | 3,330 | USD | 739 | UBS AG | 1/10/2023 | 20 | ||||||||||
| SEK | 23,400 | USD | 2,256 | UBS AG | 1/10/2023 | (12 | ) | |||||||||
| USD | 6,519 | AUD | 9,680 | HSBC Bank | 1/10/2023 | (75 | ) | |||||||||
| USD | 2,058 | HUF | 818,090 | UBS AG | 1/10/2023 | (127 | ) | |||||||||
| EUR | 6,800 | USD | 7,143 | Bank of America | 1/11/2023 | 142 | ||||||||||
| CNH | 154,697 | USD | 22,271 | Citibank | 1/11/2023 | 105 | ||||||||||
| USD | 1,405 | EUR | 1,320 | Bank of America | 1/11/2023 | (9 | ) | |||||||||
| USD | 2,019 | EUR | 1,900 | Bank of America | 1/11/2023 | (17 | ) | |||||||||
| SEK | 22,100 | USD | 2,141 | Bank of America | 1/11/2023 | (22 | ) | |||||||||
| NZD | 1,070 | USD | 682 | Morgan Stanley | 1/12/2023 | (2 | ) | |||||||||
| JPY | 2,083,770 | USD | 15,470 | Bank of America | 1/13/2023 | 438 | ||||||||||
| CNH | 146,490 | USD | 21,104 | JPMorgan Chase | 1/13/2023 | 89 | ||||||||||
| USD | 4,476 | GBP | 3,660 | Morgan Stanley | 1/13/2023 | 50 | ||||||||||
| PLN | 18,110 | EUR | 3,807 | UBS AG | 1/13/2023 | 50 | ||||||||||
| CHF | 2,790 | USD | 2,985 | UBS AG | 1/13/2023 | 37 | ||||||||||
| USD | 3,682 | CAD | 4,970 | Standard Chartered Bank | 1/13/2023 | 11 | ||||||||||
| EUR | 9,477 | DKK | 70,470 | BNP Paribas | 1/13/2023 | (1 | ) | |||||||||
| USD | 807 | NOK | 7,930 | UBS AG | 1/13/2023 | (3 | ) | |||||||||
| USD | 19,831 | MXN | 394,043 | UBS AG | 1/13/2023 | (336 | ) | |||||||||
| EUR | 6,752 | PLN | 31,970 | HSBC Bank | 1/17/2023 | (48 | ) | |||||||||
| JPY | 6,231,228 | USD | 45,941 | Standard Chartered Bank | 1/20/2023 | 1,678 | ||||||||||
| JPY | 3,696,640 | USD | 27,194 | Standard Chartered Bank | 1/20/2023 | 1,056 | ||||||||||
| USD | 5,044 | HUF | 1,807,090 | Bank of America | 1/20/2023 | 232 | ||||||||||
| JPY | 573,812 | AUD | 6,280 | HSBC Bank | 1/20/2023 | 105 | ||||||||||
| CAD | 16,753 | USD | 12,310 | Bank of America | 1/20/2023 | 64 | ||||||||||
| CZK | 124,020 | USD | 5,572 | Goldman Sachs | 1/20/2023 | (92 | ) | |||||||||
| USD | 14,203 | DKK | 100,190 | Bank of America | 1/20/2023 | (244 | ) | |||||||||
222 American Funds Insurance Series
Table of Contents
Capital World Bond Fund (continued)
Forward currency contracts (continued)
| Contract amount | Unrealized appreciation (depreciation) | |||||||||||||||
| Currency purchased (000) | Currency sold (000) | Counterparty | Settlement date | at 12/31/2022 (000) | ||||||||||||
| USD | 5,215 | CZK | 124,020 | Morgan Stanley | 1/20/2023 | $ | (266 | ) | ||||||||
| HUF | 1,807,090 | USD | 5,519 | Bank of America | 1/20/2023 | (706 | ) | |||||||||
| EUR | 23,500 | USD | 24,897 | Bank of America | 1/23/2023 | 303 | ||||||||||
| USD | 2,087 | COP | 10,038,860 | Morgan Stanley | 1/23/2023 | 26 | ||||||||||
| CZK | 47,290 | EUR | 1,935 | UBS AG | 1/23/2023 | 14 | ||||||||||
| COP | 3,594,590 | USD | 753 | Bank of America | 1/23/2023 | (15 | ) | |||||||||
| USD | 10,027 | EUR | 9,480 | BNP Paribas | 1/23/2023 | (139 | ) | |||||||||
| THB | 84,660 | USD | 2,468 | Standard Chartered Bank | 1/26/2023 | (8 | ) | |||||||||
| JPY | 833,790 | USD | 5,779 | Standard Chartered Bank | 1/27/2023 | 599 | ||||||||||
| JPY | 1,210,240 | USD | 8,936 | BNP Paribas | 1/27/2023 | 322 | ||||||||||
| JPY | 419,350 | USD | 2,897 | UBS AG | 1/27/2023 | 310 | ||||||||||
| JPY | 559,100 | USD | 4,149 | Goldman Sachs | 1/27/2023 | 128 | ||||||||||
| PLN | 24,520 | USD | 5,913 | BNP Paribas | 2/2/2023 | (333 | ) | |||||||||
| KRW | 2,855,970 | USD | 2,161 | Standard Chartered Bank | 2/28/2023 | 110 | ||||||||||
| EUR | 14,020 | USD | 14,746 | Bank of America | 3/6/2023 | 330 | ||||||||||
| CNH | 64,940 | USD | 9,270 | Standard Chartered Bank | 3/6/2023 | 162 | ||||||||||
| JPY | 417,300 | USD | 3,097 | BNP Paribas | 3/6/2023 | 111 | ||||||||||
| KRW | 2,388,130 | USD | 1,834 | HSBC Bank | 3/6/2023 | 65 | ||||||||||
|
| |||||||||||||||
| $ | 4,553 | |||||||||||||||
|
| |||||||||||||||
Swap contracts
Interest rate swaps
Centrally cleared interest rate swaps
| Receive | Pay | Notional | Value at | Upfront premium | Unrealized depreciation | |||||||||||||||||||||
Rate | Payment frequency | Rate | Payment frequency | Expiration date | amount (000) | 12/31/2022 (000) | paid (000) | at 12/31/2022 (000) | ||||||||||||||||||
| 1.2475% | Semi-annual | 3-month NZD-BBR-FRA | Quarterly | 8/20/2023 | NZD | 4,428 | $ | (70 | ) | $ | — | $ | (70 | ) | ||||||||||||
| 1.234974% | Semi-annual | 3-month NZD-BBR-FRA | Quarterly | 8/20/2023 | 37,736 | (600 | ) | — | (600 | ) | ||||||||||||||||
| 1.2375% | Semi-annual | 3-month NZD-BBR-FRA | Quarterly | 8/26/2023 | 13,908 | (231 | ) | — | (231 | ) | ||||||||||||||||
| 1.264% | Semi-annual | 3-month NZD-BBR-FRA | Quarterly | 8/27/2023 | 34,764 | (572 | ) | — | (572 | ) | ||||||||||||||||
| 1.26% | Semi-annual | 3-month NZD-BBR-FRA | Quarterly | 8/30/2023 | 5,734 | (95 | ) | — | (95 | ) | ||||||||||||||||
| 1.28% | Semi-annual | 3-month NZD-BBR-FRA | Quarterly | 8/31/2023 | 5,734 | (95 | ) | — | (95 | ) | ||||||||||||||||
| 1.30% | Semi-annual | 3-month NZD-BBR-FRA | Quarterly | 9/3/2023 | 6,295 | (106 | ) | — | (106 | ) | ||||||||||||||||
| 1.4975% | Semi-annual | 3-month NZD-BBR-FRA | Quarterly | 9/21/2023 | 11,830 | (206 | ) | — | (206 | ) | ||||||||||||||||
| 1.445% | Semi-annual | 3-month NZD-BBR-FRA | Quarterly | 9/28/2023 | 11,817 | (215 | ) | — | (215 | ) | ||||||||||||||||
| 1.4475% | Semi-annual | 3-month NZD-BBR-FRA | Quarterly | 9/29/2023 | 12,043 | (220 | ) | — | (220 | ) | ||||||||||||||||
| 1.4475% | Semi-annual | 3-month NZD-BBR-FRA | Quarterly | 9/30/2023 | 12,093 | (221 | ) | — | (221 | ) | ||||||||||||||||
| 1.5125% | Semi-annual | 3-month NZD-BBR-FRA | Quarterly | 10/14/2023 | 10,675 | (203 | ) | — | (203 | ) | ||||||||||||||||
| 1.53% | Semi-annual | 3-month NZD-BBR-FRA | Quarterly | 10/14/2023 | 12,176 | (230 | ) | — | (230 | ) | ||||||||||||||||
| 1.5625% | Semi-annual | 3-month NZD-BBR-FRA | Quarterly | 10/15/2023 | 12,163 | (228 | ) | — | (228 | ) | ||||||||||||||||
| 1.59% | Semi-annual | 3-month NZD-BBR-FRA | Quarterly | 10/18/2023 | 12,163 | (228 | ) | — | (228 | ) | ||||||||||||||||
| 1.62% | Semi-annual | 3-month NZD-BBR-FRA | Quarterly | 10/19/2023 | 13,521 | (252 | ) | — | (252 | ) | ||||||||||||||||
| 2.2525% | Semi-annual | 3-month NZD-BBR-FRA | Quarterly | 11/8/2023 | 17,111 | (283 | ) | — | (283 | ) | ||||||||||||||||
| 2.24% | Semi-annual | 3-month NZD-BBR-FRA | Quarterly | 11/8/2023 | 17,111 | (284 | ) | — | (284 | ) | ||||||||||||||||
| 2.20% | Semi-annual | 3-month NZD-BBR-FRA | Quarterly | 11/9/2023 | 1,440 | (24 | ) | — | (24 | ) | ||||||||||||||||
| 2.495% | Annual | SONIA | Annual | 5/5/2024 | GBP | 7,210 | (183 | ) | — | (183 | ) | |||||||||||||||
| 2.42% | Annual | SONIA | Annual | 5/5/2024 | 42,400 | (1,114 | ) | — | (1,114 | ) | ||||||||||||||||
| 2.363% | Annual | SONIA | Annual | 5/11/2024 | 40,870 | (1,101 | ) | — | (1,101 | ) | ||||||||||||||||
| 2.628% | Annual | SONIA | Annual | 7/28/2024 | 40,530 | (1,386 | ) | — | (1,386 | ) | ||||||||||||||||
| SONIA | Annual | 5.6325% | Annual | 9/25/2024 | 41,140 | (468 | ) | — | (468 | ) | ||||||||||||||||
| 6.255% | 28-day | 28-day MXN-TIIE | 28-day | 5/22/2026 | MXN | 47,800 | (198 | ) | — | (198 | ) | |||||||||||||||
American Funds Insurance Series 223
Table of Contents
Capital World Bond Fund (continued)
Swap contracts (continued)
Interest rate swaps (continued)
Centrally cleared interest rate swaps (continued)
Receive | Pay | Notional | Value at | Upfront premium | Unrealized depreciation | |||||||||||||||||||||||
Rate | Payment frequency | Rate | Payment frequency | Expiration date | amount (000) | 12/31/2022 (000) | paid (000) | at 12/31/2022 (000) | ||||||||||||||||||||
6.19% | 28-day | 28-day MXN-TIIE | 28-day | 5/22/2026 | MXN | 48,400 | $ | (205) | $ | — | $ | (205) | ||||||||||||||||
6.16% | 28-day | 28-day MXN-TIIE | 28-day | 6/9/2026 | 58,800 | (253) | �� | 15 | (253) | |||||||||||||||||||
6.5375% | 28-day | 28-day MXN-TIIE | 28-day | 6/17/2026 | 14,000 | (52) | — | (52) | ||||||||||||||||||||
6.50% | 28-day | 28-day MXN-TIIE | 28-day | 6/17/2026 | 13,900 | (53) | — | (53) | ||||||||||||||||||||
6.47% | 28-day | 28-day MXN-TIIE | 28-day | 6/17/2026 | 14,200 | (55) | — | (55) | ||||||||||||||||||||
6.55% | 28-day | 28-day MXN-TIIE | 28-day | 6/17/2026 | 43,000 | (160) | — | 15 | (160) | |||||||||||||||||||
6.55% | 28-day | 28-day MXN-TIIE | 28-day | 6/18/2026 | 14,100 | (53) | — | (53) | ||||||||||||||||||||
6.50% | 28-day | 28-day MXN-TIIE | 28-day | 6/18/2026 | 27,800 | (106) | — | (106) | ||||||||||||||||||||
6.64% | 28-day | 28-day MXN-TIIE | 28-day | 6/25/2026 | 62,600 | (226) | — | (226) | ||||||||||||||||||||
6.633% | 28-day | 28-day MXN-TIIE | 28-day | 6/25/2026 | 172,500 | (623) | — | (623) | ||||||||||||||||||||
7.59% | 28-day | 28-day MXN-TIIE | 28-day | 10/29/2026 | 28,900 | (64) | — | (64) | ||||||||||||||||||||
7.62% | 28-day | 28-day MXN-TIIE | 28-day | 10/29/2026 | 43,375 | (94) | — | (94) | ||||||||||||||||||||
7.52% | 28-day | 28-day MXN-TIIE | 28-day | 10/30/2026 | 89,445 | (209) | — | (209) | ||||||||||||||||||||
|
|
|
|
|
| |||||||||||||||||||||||
| $ | (10,966) | $ | — | 15 | $ | (10,966) | ||||||||||||||||||||||
|
|
|
|
|
| |||||||||||||||||||||||
Credit default swaps
Centrally cleared credit default swaps on credit indices — buy protection
Reference index | Financing rate paid | Payment frequency | Expiration date | Notional amount (000) | Value at 12/31/2022 (000) | Upfront premium paid (000) | Unrealized depreciation at 12/31/2022 (000) | |||||||||||||||
CDX.EM.38 | 1.00% | Quarterly | 12/20/2027 | USD | 5,650 | $ | 331 | $ | 350 | $ | (19 | ) | ||||||||||
Centrally cleared credit default swaps on credit indices — sell protection
Financing rate | Payment frequency | Reference index | Expiration date | Notional amount17 | Value at 12/31/202218 (000) | Upfront premium (received) paid (000) | Unrealized appreciation at 12/31/2022 (000) | |||||||||||||||
5.00% | Quarterly | CDX.NA.HY.39 | 12/20/2027 | USD 19,138 | $ | 118 | $ | (134 | ) | $ | 252 | |||||||||||
1.00% | Quarterly | CDX.NA.IG.39 | 12/20/2027 | 97,747 | 781 | 547 | 234 | |||||||||||||||
|
|
|
|
|
| |||||||||||||||||
| $ | 899 | $ | 413 | $ | 486 | |||||||||||||||||
|
|
|
|
|
| |||||||||||||||||
Investments in affiliates13
| Value of affiliates at 1/1/2022 (000) | Additions (000) | Reductions (000) | Net realized gain (000) | Net unrealized appreciation (depreciation) (000) | Value of affiliates at 12/31/2022 (000) | Dividend income (000) | ||||||||||||||||||||||
Investment funds 3.29% | ||||||||||||||||||||||||||||
Capital Group Central Corporate Bond Fund | $ | — | $ | 47,078 | $ | — | $ | — | $ | 1,598 | $ | 48,676 | $ | 306 | ||||||||||||||
Short-term securities 0.01% | ||||||||||||||||||||||||||||
Money market investments 0.01% | ||||||||||||||||||||||||||||
Capital Group Central Cash Fund 4.31%16 | 144,080 | 923,691 | 1,067,610 | 17 | (11 | ) | 167 | 2,751 | ||||||||||||||||||||
|
|
|
|
|
|
|
| |||||||||||||||||||||
Total 3.30% | $ | 17 | $ | 1,587 | $ | 48,843 | $ | 3,057 | ||||||||||||||||||||
|
|
|
|
|
|
|
| |||||||||||||||||||||
224 American Funds Insurance Series
Table of Contents
Capital World Bond Fund (continued)
Restricted securities2
Acquisition date | Cost (000) | Value (000) | Percent of net assets | |||||||||||
Goldman Sachs Group, Inc. 3.375% 3/27/2025 | 5/19/2020 | $ | 5,689 | $ | 5,327 | .36 | % | |||||||
Goldman Sachs Group, Inc. 1.00% 3/18/2033 | 5/19/2021 | 3,239 | 2,091 | .14 | ||||||||||
Bank of America Corp. 3.648% 3/31/2029 (3-month EUR-EURIBOR + 3.67% on 3/31/2028)1 | 5/19/2020 | 6,045 | 5,177 | .35 | ||||||||||
JPMorgan Chase & Co. 0.389% 2/24/2028 (3-month EUR-EURIBOR + 0.65% on 2/24/2027)1 | 5/19/2020 | 3,381 | 2,944 | .20 | ||||||||||
|
|
|
|
|
| |||||||||
Total | $ | 18,354 | $ | 15,539 | 1.05 | % | ||||||||
|
|
|
|
|
| |||||||||
| 1 | Step bond; coupon rate may change at a later date. |
| 2 | Restricted security, other than Rule 144A securities or commercial paper issued pursuant to Section 4(a)(2) of the Securities Act of 1933. The total value of all such restricted securities was $15,539,000, which represented 1.05% of the net assets of the fund. |
| 3 | Scheduled interest and/or principal payment was not received. |
| 4 | Index-linked bond whose principal amount moves with a government price index. |
| 5 | Principal payments may be made periodically. Therefore, the effective maturity date may be earlier than the stated maturity date. |
| 6 | Value determined using significant unobservable inputs. |
| 7 | Acquired in a transaction exempt from registration under Rule 144A or, for commercial paper, Section 4(a)(2) of the Securities Act of 1933. May be resold in the U.S. in transactions exempt from registration, normally to qualified institutional buyers. The total value of all such securities was $166,829,000, which represented 11.26% of the net assets of the fund. |
| 8 | Loan participations and assignments; may be subject to legal or contractual restrictions on resale. The total value of all such loans was $1,760,000, which represented .12% of the net assets of the fund. |
| 9 | Coupon rate may change periodically. Reference rate and spread are as of the most recent information available. Some coupon rates are determined by the issuer or agent based on current market conditions; therefore, the reference rate and spread are not available. |
| 10 | Payment in kind; the issuer has the option of paying additional securities in lieu of cash. Payment methods and rates are as of the most recent payment when available. |
| 11 | Purchased on a TBA basis. |
| 12 | All or a portion of this security was pledged as collateral. The total value of pledged collateral was $12,515,000, which represented .84% of the net assets of the fund. |
| 13 | Part of the same “group of investment companies“ as the fund as defined under the Investment Company Act of 1940, as amended. |
| 14 | Security did not produce income during the last 12 months. |
| 15 | Amount less than one thousand. |
| 16 | Rate represents the seven-day yield at 12/31/2022. |
| 17 | The maximum potential amount the fund may pay as a protection seller should a credit event occur. |
| 18 | The prices and resulting values for credit default swap indices serve as an indicator of the current status of the payment/performance risk. As the value of a sell protection credit default swap increases or decreases, when compared to the notional amount of the swap, the payment/performance risk may decrease or increase, respectively. |
Key to abbreviations
| Assn. = Association | EUR = Euros | PLN = Polish zloty | ||
| AUD = Australian dollars | EURIBOR = Euro Interbank Offered Rate | Ref. = Refunding | ||
| BBR = Bank Base Rate | FRA = Forward Rate Agreement | Rev. = Revenue | ||
| BRL = Brazilian reais | GBP = British pounds | RON = Romanian leu | ||
| CAD = Canadian dollars | HUF = Hungarian forints | RUB = Russian rubles | ||
| CHF = Swiss francs | IDR = Indonesian rupiah | SEK = Swedish kronor | ||
| CLP = Chilean pesos | INR = Indian rupees | SOFR = Secured Overnight Financing Rate | ||
| CME = CME Group | JPY = Japanese yen | SONIA = Sterling Overnight Interbank Average Rate | ||
| CNH = Chinese yuan renminbi | KRW = South Korean won | TBA = To be announced | ||
| CNY = Chinese yuan | LIBOR = London Interbank Offered Rate | THB = Thai baht | ||
| COP = Colombian pesos | MXN = Mexican pesos | TIIE = Equilibrium Interbank Interest Rate | ||
| CZK = Czech korunas | MYR = Malaysian ringgits | UAH = Ukrainian hryvnia | ||
| DAC = Designated Activity Company | NOK = Norwegian kroner | USD = U.S. dollars | ||
| DKK = Danish kroner | NZD = New Zealand dollars | ZAR = South African rand | ||
DOP = Dominican pesos | PIK = Payment In Kind |
Refer to the notes to financial statements.
American Funds Insurance Series 225
Table of Contents
Investment portfolio December 31, 2022
Bonds, notes & other debt instruments 88.59%
Principal amount (000) | Value (000) | |||||||
Corporate bonds, notes & loans 88.51% | ||||||||
Energy 14.19% | ||||||||
Aethon United BR, LP / Aethon United Finance Corp. 8.25% 2/15/20261 | USD | 295 | $ | 293 | ||||
Altera Infrastructure, LP 8.50% 7/15/20231,2,3 | 2,009 | 375 | ||||||
Antero Midstream Partners, LP 5.375% 6/15/20291 | 570 | 522 | ||||||
Antero Resources Corp. 7.625% 2/1/20291 | 244 | 246 | ||||||
Antero Resources Corp. 5.375% 3/1/20301 | 230 | 214 | ||||||
Apache Corp. 6.00% 1/15/2037 | 165 | 153 | ||||||
Apache Corp. 5.10% 9/1/2040 | 695 | 578 | ||||||
Apache Corp. 4.75% 4/15/2043 | 265 | 200 | ||||||
Ascent Resources - Utica, LLC, Term Loan, (3-month USD-LIBOR + 9.00%) 10.00% 11/1/20251,4,5 | 228 | 242 | ||||||
Ascent Resources Utica Holdings, LLC 7.00% 11/1/20261 | 2,040 | 1,982 | ||||||
Ascent Resources Utica Holdings, LLC 9.00% 11/1/20271 | 170 | 210 | ||||||
Ascent Resources Utica Holdings, LLC 8.25% 12/31/20281 | 271 | 266 | ||||||
Ascent Resources Utica Holdings, LLC 5.875% 6/30/20291 | 1,245 | 1,112 | ||||||
BIP-V Chinook Holdco, LLC 5.50% 6/15/20311 | 1,610 | 1,409 | ||||||
Blue Racer Midstream, LLC 7.625% 12/15/20251 | 496 | 493 | ||||||
Bonanza Creek Energy, Inc. 5.00% 10/15/20261 | 905 | 829 | ||||||
California Resources Corp. 7.125% 2/1/20261 | 390 | 375 | ||||||
Callon Petroleum Co. 7.50% 6/15/20301 | 515 | 472 | ||||||
Centennial Resource Production, LLC 6.875% 4/1/20271 | 440 | 416 | ||||||
Cheniere Energy Partners, LP 4.50% 10/1/2029 | 938 | 846 | ||||||
Cheniere Energy Partners, LP 4.00% 3/1/2031 | 413 | 352 | ||||||
Cheniere Energy Partners, LP 3.25% 1/31/2032 | 615 | 490 | ||||||
Cheniere Energy, Inc. 4.625% 10/15/2028 | 3,831 | 3,470 | ||||||
Chesapeake Energy Corp. 4.875% 4/15/20222 | 4,300 | 97 | ||||||
Chesapeake Energy Corp. 5.50% 2/1/20261 | 1,000 | 966 | ||||||
Chesapeake Energy Corp. 5.875% 2/1/20291 | 1,670 | 1,585 | ||||||
Chesapeake Energy Corp. 6.75% 4/15/20291 | 380 | 371 | ||||||
CNX Midstream Partners, LP 4.75% 4/15/20301 | 280 | 230 | ||||||
CNX Resources Corp. 7.25% 3/14/20271 | 1,168 | 1,161 | ||||||
CNX Resources Corp. 6.00% 1/15/20291 | 1,669 | 1,538 | ||||||
CNX Resources Corp. 7.375% 1/15/20311 | 856 | 822 | ||||||
Comstock Resources, Inc. 6.75% 3/1/20291 | 910 | 823 | ||||||
Comstock Resources, Inc. 5.875% 1/15/20301 | 770 | 663 | ||||||
Constellation Oil Services Holding SA 4.00% PIK 12/31/20266 | 3,114 | 1,843 | ||||||
Continental Resources, Inc. 5.75% 1/15/20311 | 365 | 341 | ||||||
Crestwood Midstream Partners, LP 5.75% 4/1/2025 | 250 | 244 | ||||||
Crestwood Midstream Partners, LP 5.625% 5/1/20271 | 290 | 270 | ||||||
Crestwood Midstream Partners, LP 6.00% 2/1/20291 | 575 | 528 | ||||||
Crestwood Midstream Partners, LP 8.00% 4/1/20291 | 1,675 | 1,669 | ||||||
Devon Energy Corp. 5.875% 6/15/2028 | 202 | 205 | ||||||
Devon Energy Corp. 4.50% 1/15/2030 | 493 | 460 | ||||||
Diamond Foreign Asset Co. 9.00% Cash 4/22/20271,5,6 | 68 | 65 | ||||||
Diamond Foreign Asset Co. 9.00% Cash 4/22/20276 | 62 | 58 | ||||||
DT Midstream, Inc. 4.125% 6/15/20291 | 1,503 | 1,294 | ||||||
DT Midstream, Inc. 4.375% 6/15/20311 | 832 | 699 | ||||||
Energean Israel Finance, Ltd. 4.50% 3/30/20241 | 945 | 914 | ||||||
Energean Israel Finance, Ltd. 4.875% 3/30/20261 | 1,080 | 1,002 | ||||||
Energean Israel Finance, Ltd. 5.875% 3/30/20311 | 80 | 70 | ||||||
Energean PLC 6.50% 4/30/20271 | 380 | 354 | ||||||
EnLink Midstream Partners, LLC 5.625% 1/15/20281 | 445 | 425 | ||||||
EQM Midstream Partners, LP 4.125% 12/1/2026 | 127 | 113 | ||||||
EQM Midstream Partners, LP 7.50% 6/1/20271 | 405 | 397 | ||||||
EQM Midstream Partners, LP 6.50% 7/1/20271 | 2,345 | 2,245 | ||||||
EQM Midstream Partners, LP 5.50% 7/15/2028 | 881 | 789 | ||||||
EQM Midstream Partners, LP 4.50% 1/15/20291 | 835 | 703 | ||||||
EQM Midstream Partners, LP 7.50% 6/1/20301 | 1,078 | 1,040 | ||||||
EQM Midstream Partners, LP 4.75% 1/15/20311 | 1,645 | 1,348 | ||||||
EQM Midstream Partners, LP 6.50% 7/15/2048 | 910 | 684 | ||||||
EQT Corp. 6.125% 2/1/20257 | 250 | 251 | ||||||
EQT Corp. 5.00% 1/15/2029 | 290 | 273 | ||||||
226 American Funds Insurance Series
Table of Contents
American High-Income Trust (continued)
Bonds, notes & other debt instruments (continued)
Principal amount (000) | Value (000) | |||||||
Corporate bonds, notes & loans (continued) | ||||||||
Energy (continued) | ||||||||
EQT Corp. 7.25% 2/1/20307 | USD | 300 | $ | 312 | ||||
EQT Corp. 3.625% 5/15/20311 | 500 | 424 | ||||||
Genesis Energy, LP 5.625% 6/15/2024 | 120 | 116 | ||||||
Genesis Energy, LP 6.50% 10/1/2025 | 1,886 | 1,805 | ||||||
Genesis Energy, LP 6.25% 5/15/2026 | 320 | 293 | ||||||
Genesis Energy, LP 8.00% 1/15/2027 | 2,825 | 2,672 | ||||||
Genesis Energy, LP 7.75% 2/1/2028 | 87 | 80 | ||||||
Harbour Energy PLC 5.50% 10/15/20261 | 1,545 | 1,387 | ||||||
Harvest Midstream I, LP 7.50% 9/1/20281 | 1,947 | 1,863 | ||||||
Hess Midstream Operations, LP 4.25% 2/15/20301 | 1,300 | 1,113 | ||||||
Hess Midstream Operations, LP 5.50% 10/15/20301 | 630 | 577 | ||||||
Hess Midstream Partners, LP 5.125% 6/15/20281 | 851 | 788 | ||||||
Hilcorp Energy I, LP 6.25% 11/1/20281 | 145 | 132 | ||||||
Hilcorp Energy I, LP 5.75% 2/1/20291 | 985 | 878 | ||||||
Hilcorp Energy I, LP 6.00% 4/15/20301 | 922 | 821 | ||||||
Hilcorp Energy I, LP 6.00% 2/1/20311 | 728 | 631 | ||||||
Hilcorp Energy I, LP 6.25% 4/15/20321 | 835 | 722 | ||||||
Holly Energy Partners, LP / Holly Energy Finance Corp. 6.375% 4/15/20271 | 220 | 216 | ||||||
Holly Energy Partners, LP / Holly Energy Finance Corp. 5.00% 2/1/20281 | 260 | 237 | ||||||
Howard Midstream Energy Partners, LLC 6.75% 1/15/20271 | 460 | 442 | ||||||
Independence Energy Finance, LLC 7.25% 5/1/20261 | 500 | 472 | ||||||
Kinetik Holdings, LP 5.875% 6/15/20301 | 500 | 470 | ||||||
Murphy Oil Corp. 5.75% 8/15/2025 | 139 | 137 | ||||||
Murphy Oil Corp. 5.625% 5/1/2027 | 135 | 131 | ||||||
Murphy Oil Corp. 6.375% 7/15/2028 | 415 | 400 | ||||||
Murphy Oil USA, Inc. 4.75% 9/15/2029 | 820 | 752 | ||||||
Murphy Oil USA, Inc. 3.75% 2/15/20311 | 1,065 | 878 | ||||||
Nabors Industries, Inc. 7.375% 5/15/20271 | 1,540 | 1,494 | ||||||
Nabors Industries, Ltd. 7.25% 1/15/20261 | 320 | 302 | ||||||
Neptune Energy Group Holdings, Ltd. 6.625% 5/15/20251 | 1,250 | 1,216 | ||||||
New Fortress Energy, Inc. 6.75% 9/15/20251 | 1,625 | 1,541 | ||||||
New Fortress Energy, Inc. 6.50% 9/30/20261 | 4,175 | 3,885 | ||||||
NGL Energy Operating, LLC 7.50% 2/1/20261 | 8,670 | 7,735 | ||||||
NGL Energy Partners, LP 6.125% 3/1/2025 | 2,054 | 1,677 | ||||||
NGL Energy Partners, LP 7.50% 4/15/2026 | 650 | 498 | ||||||
Northern Oil and Gas, Inc. 8.125% 3/1/20281 | 1,805 | 1,735 | ||||||
NorthRiver Midstream Finance, LP 5.625% 2/15/20261 | 625 | 593 | ||||||
NuStar Logistics, LP 6.00% 6/1/2026 | 286 | 276 | ||||||
Oasis Petroleum, Inc. 6.375% 6/1/20261 | 995 | 970 | ||||||
Occidental Petroleum Corp. 5.875% 9/1/2025 | 710 | 709 | ||||||
Occidental Petroleum Corp. 6.375% 9/1/2028 | 225 | 227 | ||||||
Occidental Petroleum Corp. 8.875% 7/15/2030 | 650 | 735 | ||||||
Occidental Petroleum Corp. 6.625% 9/1/2030 | 990 | 1,025 | ||||||
Occidental Petroleum Corp. 6.125% 1/1/2031 | 640 | 647 | ||||||
Occidental Petroleum Corp. 6.45% 9/15/2036 | 125 | 128 | ||||||
Occidental Petroleum Corp. 6.60% 3/15/2046 | 605 | 624 | ||||||
Occidental Petroleum Corp. 4.20% 3/15/2048 | 165 | 127 | ||||||
Parkland Corp. 4.625% 5/1/20301 | 835 | 692 | ||||||
Patterson-UTI Energy, Inc. 5.15% 11/15/2029 | 80 | 72 | ||||||
PDC Energy, Inc. 5.75% 5/15/2026 | 600 | 574 | ||||||
Petrobras Global Finance Co. 6.75% 6/3/2050 | 288 | 252 | ||||||
Petrobras Global Finance Co. 5.50% 6/10/2051 | 202 | 155 | ||||||
Petróleos Mexicanos 6.875% 10/16/2025 | 350 | 343 | ||||||
Petróleos Mexicanos 8.75% 6/2/2029 | 732 | 687 | ||||||
Petrorio Luxembourg SARL 6.125% 6/9/20261 | 320 | 305 | ||||||
Range Resources Corp. 4.875% 5/15/2025 | 362 | 344 | ||||||
Range Resources Corp. 8.25% 1/15/2029 | 900 | 929 | ||||||
Range Resources Corp. 4.75% 2/15/20301 | 970 | 856 | ||||||
Rockies Express Pipeline, LLC 4.95% 7/15/20291 | 550 | 495 | ||||||
Sabine Pass Liquefaction, LLC 4.50% 5/15/2030 | 371 | 345 | ||||||
Sanchez Energy Corp. 7.25% 2/15/20231,2 | 739 | 12 | ||||||
American Funds Insurance Series 227
Table of Contents
American High-Income Trust (continued)
Bonds, notes & other debt instruments (continued)
| Principal amount (000) | Value (000) | |||||||
Corporate bonds, notes & loans (continued) | ||||||||
Energy (continued) | ||||||||
SM Energy Co. 5.625% 6/1/2025 | USD | 430 | $ | 413 | ||||
Southwestern Energy Co. 5.95% 1/23/20257 | 215 | 212 | ||||||
Southwestern Energy Co. 7.75% 10/1/2027 | 272 | 278 | ||||||
Southwestern Energy Co. 8.375% 9/15/2028 | 565 | 584 | ||||||
Southwestern Energy Co. 5.375% 2/1/2029 | 340 | 316 | ||||||
Southwestern Energy Co. 5.375% 3/15/2030 | 2,470 | 2,257 | ||||||
Southwestern Energy Co. 4.75% 2/1/2032 | 1,225 | 1,049 | ||||||
Suburban Propane Partners, LP / Suburban Energy Finance Corp. 5.00% 6/1/20311 | 335 | 285 | ||||||
Sunoco, LP 6.00% 4/15/2027 | 547 | 540 | ||||||
Sunoco, LP 5.875% 3/15/2028 | 290 | 275 | ||||||
Sunoco, LP 4.50% 5/15/2029 | 1,735 | 1,520 | ||||||
Sunoco, LP 4.50% 4/30/2030 | 1,680 | 1,461 | ||||||
Tallgrass Energy Partners, LP 7.50% 10/1/20251 | 85 | 86 | ||||||
Targa Resources Partners, LP 6.50% 7/15/2027 | 133 | 134 | ||||||
Targa Resources Partners, LP 6.875% 1/15/2029 | 915 | 924 | ||||||
Targa Resources Partners, LP 5.50% 3/1/2030 | 802 | 756 | ||||||
Targa Resources Partners, LP 4.875% 2/1/2031 | 695 | 629 | ||||||
Transocean Guardian, Ltd. 5.875% 1/15/20241 | 92 | 90 | ||||||
Transocean Poseidon, Ltd. 6.875% 2/1/20271 | 337 | 328 | ||||||
Transocean, Inc. 6.125% 8/1/20251 | 178 | 174 | ||||||
Transocean, Inc. 7.25% 11/1/20251 | 500 | 443 | ||||||
Transocean, Inc. 11.50% 1/30/20271 | 95 | 95 | ||||||
Transocean, Inc. 6.80% 3/15/2038 | 300 | 190 | ||||||
USA Compression Partners, LP 6.875% 4/1/2026 | 669 | 643 | ||||||
USA Compression Partners, LP 6.875% 9/1/2027 | 247 | 231 | ||||||
Venture Global Calcasieu Pass, LLC 4.125% 8/15/20311 | 2,795 | 2,386 | ||||||
Venture Global Calcasieu Pass, LLC 3.875% 11/1/20331 | 650 | 532 | ||||||
Weatherford International, Ltd. 11.00% 12/1/20241 | 185 | 189 | ||||||
Weatherford International, Ltd. 6.50% 9/15/20281 | 2,130 | 2,091 | ||||||
Weatherford International, Ltd. 8.625% 4/30/20301 | 3,485 | 3,353 | ||||||
Western Gas Partners, LP 4.50% 3/1/2028 | 979 | 904 | ||||||
Western Midstream Operating, LP 3.35% 2/1/20257 | 369 | 350 | ||||||
Western Midstream Operating, LP 4.75% 8/15/2028 | 160 | 146 | ||||||
Western Midstream Operating, LP 4.30% 2/1/20307 | 480 | 420 | ||||||
Western Midstream Operating, LP 5.50% 2/1/20507 | 770 | 636 | ||||||
|
| |||||||
| 117,959 | ||||||||
|
| |||||||
Consumer discretionary 12.43% |
| |||||||
Adient Global Holdings, Ltd. 4.875% 8/15/20261 | 525 | 490 | ||||||
Affinity Gaming 6.875% 12/15/20271 | 1,040 | 883 | ||||||
Allied Universal Holdco, LLC 6.625% 7/15/20261 | 508 | 466 | ||||||
Allied Universal Holdco, LLC 9.75% 7/15/20271 | 716 | 624 | ||||||
Allied Universal Holdco, LLC 4.625% 6/1/20281 | 490 | 406 | ||||||
Allied Universal Holdco, LLC 6.00% 6/1/20291 | 2,790 | 2,029 | ||||||
Asbury Automotive Group, Inc. 4.50% 3/1/2028 | 250 | 220 | ||||||
Asbury Automotive Group, Inc. 4.625% 11/15/20291 | 1,545 | 1,304 | ||||||
Asbury Automotive Group, Inc. 5.00% 2/15/20321 | 1,070 | 882 | ||||||
Atlas LuxCo 4 SARL 4.625% 6/1/20281 | 280 | 227 | ||||||
AutoNation, Inc. 2.40% 8/1/2031 | 610 | 440 | ||||||
Bath & Body Works, Inc. 6.625% 10/1/20301 | 540 | 508 | ||||||
Bath & Body Works, Inc. 6.875% 11/1/2035 | 1,316 | 1,172 | ||||||
Bath & Body Works, Inc. 6.75% 7/1/2036 | 655 | 577 | ||||||
Beazer Homes USA, Inc. 5.875% 10/15/2027 | 540 | 473 | ||||||
Boyd Gaming Corp. 4.75% 12/1/2027 | 441 | 411 | ||||||
Boyd Gaming Corp. 4.75% 6/15/20311 | 345 | 301 | ||||||
Boyne USA, Inc. 4.75% 5/15/20291 | 570 | 505 | ||||||
Caesars Entertainment, Inc. 6.25% 7/1/20251 | 1,085 | 1,056 | ||||||
Caesars Entertainment, Inc. 8.125% 7/1/20271 | 665 | 655 | ||||||
Caesars Entertainment, Inc. 4.625% 10/15/20291 | 560 | 457 | ||||||
Caesars Resort Collection, LLC 5.75% 7/1/20251 | 345 | 338 | ||||||
228 American Funds Insurance Series
Table of Contents
American High-Income Trust (continued)
Bonds, notes & other debt instruments (continued)
Principal amount (000) | Value (000) | |||||||
Corporate bonds, notes & loans (continued) | ||||||||
Consumer discretionary (continued) | ||||||||
Carnival Corp. 10.50% 2/1/20261 | USD | 1,405 | $ | 1,414 | ||||
Carnival Corp. 4.00% 8/1/20281 | 3,000 | 2,452 | ||||||
Carnival Corp. 6.00% 5/1/20291 | 655 | 438 | ||||||
Carnival Corp. 10.50% 6/1/20301 | 100 | 81 | ||||||
CDI Escrow Issuer, Inc. 5.75% 4/1/20301 | 615 | 552 | ||||||
CEC Entertainment, Inc. 6.75% 5/1/20261 | 320 | 298 | ||||||
Dana, Inc. 4.25% 9/1/2030 | 200 | 161 | ||||||
Dana, Inc. 4.50% 2/15/2032 | 375 | 300 | ||||||
Empire Communities Corp. 7.00% 12/15/20251 | 475 | 430 | ||||||
Empire Resorts, Inc. 7.75% 11/1/20261 | 470 | 378 | ||||||
Everi Holdings, Inc. 5.00% 7/15/20291 | 95 | 82 | ||||||
Fertitta Entertainment, Inc. 4.625% 1/15/20291 | 1,260 | 1,068 | ||||||
Fertitta Entertainment, Inc. 6.75% 1/15/20301 | 4,090 | 3,307 | ||||||
First Student Bidco, Inc. 4.00% 7/31/20291 | 2,135 | 1,769 | ||||||
Ford Motor Co. 5.291% 12/8/2046 | 70 | 54 | ||||||
Ford Motor Credit Company, LLC 5.125% 6/16/2025 | 2,215 | 2,134 | ||||||
Ford Motor Credit Company, LLC 3.375% 11/13/2025 | 465 | 421 | ||||||
Ford Motor Credit Company, LLC 4.542% 8/1/2026 | 1,460 | 1,348 | ||||||
Ford Motor Credit Company, LLC 2.70% 8/10/2026 | 350 | 304 | ||||||
Ford Motor Credit Company, LLC 4.271% 1/9/2027 | 525 | 476 | ||||||
Ford Motor Credit Company, LLC 4.95% 5/28/2027 | 370 | 346 | ||||||
Ford Motor Credit Company, LLC 4.125% 8/17/2027 | 835 | 749 | ||||||
Ford Motor Credit Company, LLC 3.815% 11/2/2027 | 880 | 775 | ||||||
Ford Motor Credit Company, LLC 2.90% 2/16/2028 | 300 | 248 | ||||||
Ford Motor Credit Company, LLC 5.113% 5/3/2029 | 200 | 182 | ||||||
Ford Motor Credit Company, LLC 4.00% 11/13/2030 | 570 | 469 | ||||||
Group 1 Automotive, Inc. 4.00% 8/15/20281 | 615 | 522 | ||||||
Hanesbrands, Inc. 4.625% 5/15/20241 | 1,945 | 1,887 | ||||||
Hanesbrands, Inc. 4.875% 5/15/20261 | 1,624 | 1,454 | ||||||
Hilton Grand Vacations Borrower 5.00% 6/1/20291 | 591 | 509 | ||||||
Hilton Worldwide Holdings, Inc. 3.75% 5/1/20291 | 200 | 173 | ||||||
Hilton Worldwide Holdings, Inc. 4.875% 1/15/2030 | 408 | 370 | ||||||
Hilton Worldwide Holdings, Inc. 4.00% 5/1/20311 | 1,520 | 1,275 | ||||||
International Game Technology PLC 6.50% 2/15/20251 | 911 | 918 | ||||||
International Game Technology PLC 4.125% 4/15/20261 | 915 | 855 | ||||||
International Game Technology PLC 5.25% 1/15/20291 | 4,120 | 3,846 | ||||||
Jacobs Entertainment, Inc. 6.75% 2/15/20291 | 505 | 456 | ||||||
KB Home 6.875% 6/15/2027 | 330 | 333 | ||||||
KB Home 7.25% 7/15/2030 | 330 | 321 | ||||||
Kontoor Brands, Inc. 4.125% 11/15/20291 | 370 | 303 | ||||||
Las Vegas Sands Corp. 3.20% 8/8/2024 | 400 | 378 | ||||||
LCM Investments Holdings II, LLC 4.875% 5/1/20291 | 2,565 | 2,057 | ||||||
Levi Strauss & Co. 3.50% 3/1/20311 | 430 | 342 | ||||||
Lindblad Expeditions, LLC 6.75% 2/15/20271 | 205 | 186 | ||||||
Lithia Motors, Inc. 4.625% 12/15/20271 | 270 | 244 | ||||||
Lithia Motors, Inc. 3.875% 6/1/20291 | 1,165 | 959 | ||||||
Lithia Motors, Inc. 4.375% 1/15/20311 | 830 | 677 | ||||||
LSF9 Atlantis Holdings, LLC / Victra Finance Corp. 7.75% 2/15/20261 | 335 | 297 | ||||||
M.D.C. Holdings, Inc. 6.00% 1/15/2043 | 573 | 468 | ||||||
Marriott International, Inc. 3.50% 10/15/2032 | 470 | 392 | ||||||
Marriott International, Inc. 2.75% 10/15/2033 | 430 | 329 | ||||||
Marriott Ownership Resorts, Inc. 4.50% 6/15/20291 | 370 | 307 | ||||||
Mattel, Inc. 3.75% 4/1/20291 | 490 | 431 | ||||||
Melco International Development, Ltd. 4.875% 6/6/20251 | 440 | 405 | ||||||
Melco International Development, Ltd. 5.75% 7/21/20281 | 595 | 498 | ||||||
Melco International Development, Ltd. 5.375% 12/4/20291 | 1,221 | 982 | ||||||
Melco Resorts Finance, Ltd. 5.25% 4/26/20261 | 300 | 264 | ||||||
Merlin Entertainment 5.75% 6/15/20261 | 492 | 461 | ||||||
MGM Resorts International 6.00% 3/15/2023 | 281 | 281 | ||||||
MGM Resorts International 5.50% 4/15/2027 | 401 | 374 | ||||||
Mohegan Gaming & Entertainment 8.00% 2/1/20261 | 370 | 347 | ||||||
American Funds Insurance Series 229
Table of Contents
American High-Income Trust (continued)
Bonds, notes & other debt instruments (continued)
Principal amount (000) | Value (000) | |||||||
Corporate bonds, notes & loans (continued) | ||||||||
Consumer discretionary (continued) | ||||||||
Motel 6 Operating, LP, Term Loan B, (1-month USD-LIBOR + 5.00%) 9.318% 9/9/20264,5 | USD | 512 | $ | 506 | ||||
NCL Corp., Ltd. 3.625% 12/15/20241 | 300 | 257 | ||||||
NCL Corp., Ltd. 5.875% 3/15/20261 | 405 | 319 | ||||||
NCL Corp., Ltd. 5.875% 2/15/20271 | 1,510 | 1,310 | ||||||
NCL Corp., Ltd. 7.75% 2/15/20291 | 360 | 271 | ||||||
Neiman Marcus Group, LLC 7.125% 4/1/20261 | 1,650 | 1,549 | ||||||
Panther BF Aggregator 2, LP 6.25% 5/15/20261 | 140 | 137 | ||||||
Panther BF Aggregator 2, LP 8.50% 5/15/20271 | 455 | 445 | ||||||
Party City Holdings, Inc. (6-month USD-LIBOR + 5.00%) 8.061% 7/15/20251,5 | 240 | 65 | ||||||
Party City Holdings, Inc. 8.75% 2/15/20261 | 7,577 | 2,197 | ||||||
Party City Holdings, Inc. 6.625% 8/1/20261 | 500 | 13 | ||||||
Penske Automotive Group, Inc. 3.75% 6/15/2029 | 670 | 545 | ||||||
PetSmart, Inc. 4.75% 2/15/20281 | 710 | 644 | ||||||
PetSmart, Inc. 7.75% 2/15/20291 | 1,190 | 1,120 | ||||||
Premier Entertainment Sub, LLC 5.625% 9/1/20291 | 1,065 | 787 | ||||||
Premier Entertainment Sub, LLC 5.875% 9/1/20311 | 375 | 266 | ||||||
QVC, Inc. 4.85% 4/1/2024 | 75 | 70 | ||||||
QVC, Inc. 4.375% 9/1/2028 | 121 | 73 | ||||||
Raptor Acquisition Corp. 4.875% 11/1/20261 | 550 | 489 | ||||||
Real Hero Merger Sub 2, Inc. 6.25% 2/1/20291 | 480 | 330 | ||||||
Royal Caribbean Cruises, Ltd. 11.50% 6/1/20251 | 2,371 | 2,548 | ||||||
Royal Caribbean Cruises, Ltd. 4.25% 7/1/20261 | 1,820 | 1,473 | ||||||
Royal Caribbean Cruises, Ltd. 5.50% 8/31/20261 | 715 | 602 | ||||||
Royal Caribbean Cruises, Ltd. 5.375% 7/15/20271 | 1,365 | 1,107 | ||||||
Royal Caribbean Cruises, Ltd. 3.70% 3/15/2028 | 1,370 | 1,009 | ||||||
Royal Caribbean Cruises, Ltd. 5.50% 4/1/20281 | 710 | 568 | ||||||
Royal Caribbean Cruises, Ltd. 8.25% 1/15/20291 | 1,775 | 1,786 | ||||||
Royal Caribbean Cruises, Ltd. 9.25% 1/15/20291 | 1,010 | 1,039 | ||||||
Sally Holdings, LLC 5.625% 12/1/2025 | 1,030 | 994 | ||||||
Sands China, Ltd. 5.625% 8/8/2025 | 275 | 263 | ||||||
Sands China, Ltd. 5.90% 8/8/2028 | 200 | 188 | ||||||
Sands China, Ltd. 4.875% 6/18/2030 | 550 | 484 | ||||||
Sands China, Ltd. 3.75% 8/8/20317 | 560 | 441 | ||||||
Scientific Games Corp. 8.625% 7/1/20251 | 1,215 | 1,242 | ||||||
Scientific Games Corp. 7.00% 5/15/20281 | 985 | 941 | ||||||
Scientific Games Corp. 7.25% 11/15/20291 | 960 | 923 | ||||||
Scientific Games Holdings, LP 6.625% 3/1/20301 | 845 | 715 | ||||||
Sonic Automotive, Inc. 4.625% 11/15/20291 | 1,565 | 1,255 | ||||||
Sonic Automotive, Inc. 4.875% 11/15/20311 | 2,180 | 1,717 | ||||||
Studio City Finance, Ltd. 6.00% 7/15/20251 | 690 | 599 | ||||||
Studio City Finance, Ltd. 5.00% 1/15/20291 | 550 | 407 | ||||||
Tempur Sealy International, Inc. 4.00% 4/15/20291 | 435 | 366 | ||||||
The Gap, Inc. 3.625% 10/1/20291 | 170 | 120 | ||||||
The Gap, Inc. 3.875% 10/1/20311 | 108 | 76 | ||||||
The Home Co., Inc. 7.25% 10/15/20251 | 660 | 568 | ||||||
Travel + Leisure Co. 6.00% 4/1/2027 | 205 | 195 | ||||||
Travel + Leisure Co. 4.50% 12/1/20291 | 1,155 | 943 | ||||||
Universal Entertainment Corp. 8.50% 12/11/20241 | 2,945 | 2,751 | ||||||
Vail Resorts, Inc. 6.25% 5/15/20251 | 315 | 316 | ||||||
VICI Properties, LP 4.25% 12/1/20261 | 462 | 432 | ||||||
VICI Properties, LP / VICI Note Co., Inc. 5.625% 5/1/20241 | 447 | 443 | ||||||
WASH Multifamily Acquisition, Inc. 5.75% 4/15/20261 | 1,245 | 1,175 | ||||||
Wheel Pros, Inc. 6.50% 5/15/20291 | 1,280 | 454 | ||||||
Wheel Pros, Inc., Term Loan, (3-month USD-LIBOR + 4.50%) 8.825% 5/11/20284,5 | 948 | 647 | ||||||
Wyndham Destinations, Inc. 6.625% 7/31/20261 | 695 | 681 | ||||||
Wyndham Destinations, Inc. 4.625% 3/1/20301 | 400 | 332 | ||||||
Wyndham Worldwide Corp. 4.375% 8/15/20281 | 765 | 688 | ||||||
Wynn Las Vegas, LLC 4.25% 5/30/20231 | 861 | 850 | ||||||
Wynn Macau, Ltd. 5.625% 8/26/20281 | 900 | 771 | ||||||
230 American Funds Insurance Series
Table of Contents
American High-Income Trust (continued)
Bonds, notes & other debt instruments (continued)
| Principal amount (000) | Value (000) | |||||||
Corporate bonds, notes & loans (continued) | ||||||||
Consumer discretionary (continued) | ||||||||
Wynn Resorts Finance, LLC 7.75% 4/15/20251 | USD | 494 | $ | 492 | ||||
Wynn Resorts Finance, LLC 5.125% 10/1/20291 | 482 | 414 | ||||||
Yahoo Holdings, Inc., Term Loan B, (1-month USD-LIBOR + 5.50%) 9.884% 9/1/20274,5 | 465 | 421 | ||||||
|
| |||||||
| 103,390 | ||||||||
|
| |||||||
Communication services 10.50% |
| |||||||
Altice France Holding SA 10.50% 5/15/20271 | 1,650 | 1,262 | ||||||
Altice France SA 5.125% 7/15/20291 | 1,677 | 1,260 | ||||||
Brightstar Escrow Corp. 9.75% 10/15/20251 | 140 | 129 | ||||||
Cablevision Systems Corp. 5.375% 2/1/20281 | 457 | 369 | ||||||
CCO Holdings, LLC 5.00% 2/1/20281 | 586 | 533 | ||||||
CCO Holdings, LLC 6.375% 9/1/20291 | 300 | 283 | ||||||
CCO Holdings, LLC 4.75% 3/1/20301 | 3,437 | 2,972 | ||||||
CCO Holdings, LLC 4.50% 8/15/20301 | 3,029 | 2,509 | ||||||
CCO Holdings, LLC 4.25% 2/1/20311 | 3,065 | 2,465 | ||||||
CCO Holdings, LLC 4.75% 2/1/20321 | 1,225 | 996 | ||||||
CCO Holdings, LLC 4.50% 5/1/2032 | 1,024 | 817 | ||||||
CCO Holdings, LLC 4.50% 6/1/20331 | 1,330 | 1,023 | ||||||
CCO Holdings, LLC 4.25% 1/15/20341 | 2,040 | 1,510 | ||||||
CCO Holdings, LLC and CCO Holdings Capital Corp. 5.50% 5/1/20261 | 102 | 99 | ||||||
CCO Holdings, LLC and CCO Holdings Capital Corp. 5.375% 6/1/20291 | 360 | 326 | ||||||
CCO Holdings, LLC and CCO Holdings Capital Corp. 2.80% 4/1/2031 | 140 | 109 | ||||||
Centerfield Media Parent, Inc. 6.625% 8/1/20261 | 960 | 616 | ||||||
Cinemark USA, Inc. 5.875% 3/15/20261 | 278 | 232 | ||||||
Clear Channel Worldwide Holdings, Inc. 7.75% 4/15/20281 | 570 | 417 | ||||||
Clear Channel Worldwide Holdings, Inc. 7.50% 6/1/20291 | 315 | 232 | ||||||
Cogent Communications Group, Inc. 3.50% 5/1/20261 | 450 | 409 | ||||||
Connect Finco SARL 6.75% 10/1/20261 | 725 | 673 | ||||||
Consolidated Communications, Inc. 5.00% 10/1/20281 | 225 | 166 | ||||||
CSC Holdings, LLC 6.50% 2/1/20291 | 600 | 492 | ||||||
CSC Holdings, LLC 3.375% 2/15/20311 | 700 | 458 | ||||||
Diamond Sports Group, LLC 5.375% 8/15/20261 | 503 | 60 | ||||||
Diamond Sports Group, LLC 6.625% 8/15/20271 | 1,056 | 12 | ||||||
DIRECTV Financing, LLC 5.875% 8/15/20271 | 3,010 | 2,699 | ||||||
DIRECTV Financing, LLC, Term Loan, (3-month USD-LIBOR + 5.00%) 9.384% 8/2/20274,5 | 1,655 | 1,613 | ||||||
DISH Network Corp. 11.75% 11/15/20271 | 3,950 | 4,073 | ||||||
Embarq Corp. 7.995% 6/1/2036 | 2,867 | 1,339 | ||||||
Epicor Software Corp., Term Loan, (3-month USD-LIBOR + 7.75%) 12.134% 7/31/20284,5 | 365 | 361 | ||||||
Frontier Communications Corp. 5.875% 10/15/20271 | 1,455 | 1,354 | ||||||
Frontier Communications Corp. 5.00% 5/1/20281 | 3,780 | 3,304 | ||||||
Frontier Communications Corp. 6.75% 5/1/20291 | 1,990 | 1,649 | ||||||
Frontier Communications Holdings, LLC 5.875% 11/1/2029 | 1,390 | 1,077 | ||||||
Frontier Communications Holdings, LLC 6.00% 1/15/20301 | 750 | 590 | ||||||
Frontier Communications Holdings, LLC 8.75% 5/15/20301 | 970 | 988 | ||||||
Gray Escrow II, Inc. 5.375% 11/15/20311 | 925 | 668 | ||||||
Gray Television, Inc. 5.875% 7/15/20261 | 203 | 181 | ||||||
Gray Television, Inc. 7.00% 5/15/20271 | 1,018 | 904 | ||||||
Gray Television, Inc. 4.75% 10/15/20301 | 397 | 288 | ||||||
iHeartCommunications, Inc. 5.25% 8/15/20271 | 1,995 | 1,693 | ||||||
iHeartCommunications, Inc. 4.75% 1/15/20281 | 250 | 204 | ||||||
Iliad Holding SAS 6.50% 10/15/20261 | 630 | 585 | ||||||
Kantar Group, LLC, Term Loan B2, (3-month USD-LIBOR + 4.50%) 9.23% 12/4/20264,5 | 385 | 357 | ||||||
Lamar Media Corp. 3.75% 2/15/2028 | 61 | 55 | ||||||
Lamar Media Corp. 4.875% 1/15/2029 | 300 | 277 | ||||||
Lamar Media Corp. 4.00% 2/15/2030 | 260 | 228 | ||||||
Level 3 Financing, Inc. 3.75% 7/15/20291 | 855 | 616 | ||||||
American Funds Insurance Series 231
Table of Contents
American High-Income Trust (continued)
Bonds, notes & other debt instruments (continued)
Principal amount (000) | Value (000) | |||||||
Corporate bonds, notes & loans (continued) | ||||||||
Communication services (continued) | ||||||||
Ligado Networks, LLC 15.50% PIK 11/1/20231,6 | USD | 2,149 | $ | 701 | ||||
Live Nation Entertainment, Inc. 4.75% 10/15/20271 | 250 | 223 | ||||||
Live Nation Entertainment, Inc. 3.75% 1/15/20281 | 425 | 363 | ||||||
Match Group, Inc. 4.625% 6/1/20281 | 308 | 275 | ||||||
Match Group, Inc. 5.625% 2/15/20291 | 300 | 280 | ||||||
McGraw-Hill Education, Inc. 5.75% 8/1/20281 | 520 | 438 | ||||||
Midas OpCo Holdings, LLC 5.625% 8/15/20291 | 3,110 | 2,570 | ||||||
Netflix, Inc. 4.875% 4/15/2028 | 310 | 300 | ||||||
News Corp. 3.875% 5/15/20291 | 1,620 | 1,408 | ||||||
News Corp. 5.125% 2/15/20321 | 1,760 | 1,604 | ||||||
Nexstar Broadcasting, Inc. 4.75% 11/1/20281 | 2,910 | 2,522 | ||||||
Nexstar Escrow Corp. 5.625% 7/15/20271 | 324 | 298 | ||||||
Scripps Escrow II, Inc. 3.875% 1/15/20291 | 750 | 603 | ||||||
Sinclair Television Group, Inc. 4.125% 12/1/20301 | 710 | 533 | ||||||
Sirius XM Radio, Inc. 3.125% 9/1/20261 | 1,600 | 1,423 | ||||||
Sirius XM Radio, Inc. 4.00% 7/15/20281 | 2,385 | 2,080 | ||||||
Sirius XM Radio, Inc. 4.125% 7/1/20301 | 445 | 368 | ||||||
Sirius XM Radio, Inc. 3.875% 9/1/20311 | 2,590 | 2,026 | ||||||
Sprint Corp. 7.625% 3/1/2026 | 480 | 506 | ||||||
Sprint Corp. 6.875% 11/15/2028 | 1,656 | 1,723 | ||||||
Sprint Corp. 8.75% 3/15/2032 | 1,751 | 2,088 | ||||||
TEGNA, Inc. 5.00% 9/15/2029 | 366 | 348 | ||||||
T-Mobile US, Inc. 3.375% 4/15/2029 | 860 | 759 | ||||||
Univision Communications, Inc. 5.125% 2/15/20251 | 3,195 | 3,049 | ||||||
Univision Communications, Inc. 6.625% 6/1/20271 | 3,050 | 2,949 | ||||||
Univision Communications, Inc. 4.50% 5/1/20291 | 4,500 | 3,772 | ||||||
Univision Communications, Inc. 7.375% 6/30/20301 | 935 | 895 | ||||||
Univision Communications, Inc., Term Loan, (3-month USD CME Term SOFR + 4.25%) 8.83% 6/24/20294,5 | 69 | 69 | ||||||
UPC Broadband Finco BV 4.875% 7/15/20311 | 430 | 359 | ||||||
Virgin Media O2 4.25% 1/31/20311 | 1,975 | 1,603 | ||||||
Virgin Media Secured Finance PLC 4.50% 8/15/20301 | 990 | 829 | ||||||
VZ Secured Financing BV 5.00% 1/15/20321 | 1,060 | 863 | ||||||
Warner Music Group 3.75% 12/1/20291 | 1,645 | 1,417 | ||||||
Warner Music Group 3.875% 7/15/20301 | 780 | 673 | ||||||
Warner Music Group 3.00% 2/15/20311 | 225 | 180 | ||||||
WarnerMedia Holdings, Inc. 4.279% 3/15/20321 | 298 | 246 | ||||||
Ziggo Bond Co. BV 5.125% 2/28/20301 | 419 | 339 | ||||||
Ziggo Bond Finance BV 4.875% 1/15/20301 | 1,350 | 1,132 | ||||||
|
| |||||||
| 87,346 | ||||||||
|
| |||||||
Materials 9.94% | ||||||||
Alcoa Nederland Holding BV 5.50% 12/15/20271 | 510 | 492 | ||||||
Alcoa Nederland Holding BV 4.125% 3/31/20291 | 430 | 382 | ||||||
Allegheny Technologies, Inc. 5.875% 12/1/2027 | 180 | 172 | ||||||
Allegheny Technologies, Inc. 4.875% 10/1/2029 | 1,575 | 1,394 | ||||||
Allegheny Technologies, Inc. 5.125% 10/1/2031 | 1,170 | 1,036 | ||||||
ArcelorMittal 7.00% 10/15/2039 | 488 | 497 | ||||||
ArcelorMittal 6.75% 3/1/2041 | 755 | 731 | ||||||
Arconic Corp. 6.00% 5/15/20251 | 360 | 355 | ||||||
Arconic Rolled Products Corp. 6.125% 2/15/20281 | 200 | 188 | ||||||
Ardagh Group SA 6.50% Cash 6/30/20271,6 | 422 | 294 | ||||||
Ardagh Metal Packaging Finance USA, LLC 6.00% 6/15/20271 | 750 | 735 | ||||||
Ardagh Metal Packaging Finance USA, LLC 3.25% 9/1/20281 | 500 | 425 | ||||||
Ardagh Metal Packaging Finance USA, LLC 4.00% 9/1/20291 | 550 | 437 | ||||||
Ardagh Packaging Finance 4.125% 8/15/20261 | 900 | 782 | ||||||
Avient Corp. 7.125% 8/1/20301 | 335 | 328 | ||||||
Axalta Coating Systems, LLC 4.75% 6/15/20271 | 460 | 426 | ||||||
Ball Corp. 6.875% 3/15/2028 | 1,065 | 1,095 | ||||||
Ball Corp. 2.875% 8/15/2030 | 160 | 128 | ||||||
232 American Funds Insurance Series
Table of Contents
American High-Income Trust (continued)
Bonds, notes & other debt instruments (continued)
Principal amount (000) | Value (000) | |||||||
Corporate bonds, notes & loans (continued) | ||||||||
Materials (continued) | ||||||||
Ball Corp. 3.125% 9/15/2031 | USD | 1,660 | $ | 1,335 | ||||
BWAY Parent Co., Inc. 5.50% 4/15/20241 | 1,464 | 1,427 | ||||||
BWAY Parent Co., Inc. 7.25% 4/15/20251 | 625 | 579 | ||||||
BWAY Parent Co., Inc., Term Loan, (3-month USD-LIBOR + 3.25%) 7.37% 4/3/20244,5 | 255 | 250 | ||||||
CAN-PACK SA 3.875% 11/15/20291 | 1,300 | 1,026 | ||||||
Cleveland-Cliffs, Inc. 6.75% 3/15/20261 | 262 | 263 | ||||||
Cleveland-Cliffs, Inc. 7.00% 3/15/2027 | 297 | 281 | ||||||
Cleveland-Cliffs, Inc. 5.875% 6/1/2027 | 3,243 | 3,104 | ||||||
Cleveland-Cliffs, Inc. 4.625% 3/1/20291 | 1,981 | 1,761 | ||||||
Cleveland-Cliffs, Inc. 4.875% 3/1/20311 | 2,875 | 2,543 | ||||||
Crown Holdings, Inc. 5.25% 4/1/20301 | 240 | 227 | ||||||
CVR Partners, LP 6.125% 6/15/20281 | 1,125 | 1,011 | ||||||
Element Solutions, Inc. 3.875% 9/1/20281 | 410 | 349 | ||||||
First Quantum Minerals, Ltd. 7.50% 4/1/20251 | 3,893 | 3,797 | ||||||
First Quantum Minerals, Ltd. 6.875% 3/1/20261 | 2,926 | 2,775 | ||||||
First Quantum Minerals, Ltd. 6.875% 10/15/20271 | 7,610 | 7,156 | ||||||
Freeport-McMoRan, Inc. 4.25% 3/1/2030 | 437 | 398 | ||||||
Freeport-McMoRan, Inc. 5.45% 3/15/2043 | 411 | 372 | ||||||
FXI Holdings, Inc. 7.875% 11/1/20241 | 6,248 | 5,204 | ||||||
FXI Holdings, Inc. 12.25% 11/15/20261 | 7,432 | 6,165 | ||||||
GPC Merger Sub, Inc. 7.125% 8/15/20281 | 334 | 279 | ||||||
Graphic Packaging International, LLC 3.75% 2/1/20301 | 790 | 673 | ||||||
Hexion, Inc., Term Loan, (3-month USD CME Term SOFR + 4.50%) 8.934% 3/15/20294,5 | 454 | 391 | ||||||
Kaiser Aluminum Corp. 4.625% 3/1/20281 | 638 | 558 | ||||||
LABL, Inc. 5.875% 11/1/20281 | 730 | 637 | ||||||
LABL, Inc. 8.25% 11/1/20291 | 490 | 391 | ||||||
LSB Industries, Inc. 6.25% 10/15/20281 | 1,620 | 1,484 | ||||||
Methanex Corp. 5.125% 10/15/2027 | 3,870 | 3,596 | ||||||
Methanex Corp. 5.25% 12/15/2029 | 1,217 | 1,082 | ||||||
Methanex Corp. 5.65% 12/1/2044 | 465 | 355 | ||||||
Mineral Resources, Ltd. 8.00% 11/1/20271 | 1,292 | 1,323 | ||||||
Mineral Resources, Ltd. 8.50% 5/1/20301 | 1,270 | 1,289 | ||||||
Neon Holdings, Inc. 10.125% 4/1/20261 | 595 | 508 | ||||||
Nova Chemicals Corp. 4.875% 6/1/20241 | 760 | 737 | ||||||
Nova Chemicals Corp. 5.25% 6/1/20271 | 2,036 | 1,834 | ||||||
Nova Chemicals Corp. 4.25% 5/15/20291 | 2,330 | 1,908 | ||||||
Novelis Corp. 3.25% 11/15/20261 | 825 | 741 | ||||||
Novelis Corp. 4.75% 1/30/20301 | 563 | 500 | ||||||
Novelis Corp. 3.875% 8/15/20311 | 1,122 | 918 | ||||||
Olin Corp. 5.625% 8/1/2029 | 200 | 190 | ||||||
Olin Corp. 5.00% 2/1/2030 | 180 | 165 | ||||||
Owens-Illinois, Inc. 5.875% 8/15/20231 | 191 | 190 | ||||||
Owens-Illinois, Inc. 6.375% 8/15/20251 | 265 | 260 | ||||||
SCIH Salt Holdings, Inc. 4.875% 5/1/20281 | 2,185 | 1,879 | ||||||
SCIH Salt Holdings, Inc. 6.625% 5/1/20291 | 1,225 | 988 | ||||||
Scotts Miracle-Gro Co. 4.50% 10/15/2029 | 379 | 308 | ||||||
Scotts Miracle-Gro Co. 4.375% 2/1/2032 | 455 | 344 | ||||||
Sealed Air Corp. 4.00% 12/1/20271 | 316 | 287 | ||||||
Sealed Air Corp. 5.00% 4/15/20291 | 690 | 650 | ||||||
Silgan Holdings, Inc. 4.125% 2/1/2028 | 377 | 350 | ||||||
SPCM SA 3.375% 3/15/20301 | 400 | 323 | ||||||
Summit Materials, LLC 6.50% 3/15/20271 | 360 | 353 | ||||||
Summit Materials, LLC 5.25% 1/15/20291 | 755 | 704 | ||||||
Trivium Packaging BV 5.50% 8/15/20261 | 330 | 303 | ||||||
Trivium Packaging BV 8.50% 8/15/20271 | 703 | 646 | ||||||
Tronox, Ltd. 4.625% 3/15/20291 | 730 | 608 | ||||||
Valvoline, Inc. 4.25% 2/15/20301 | 353 | 343 | ||||||
Valvoline, Inc. 3.625% 6/15/20311 | 410 | 337 | ||||||
Venator Finance SARL 9.50% 7/1/20251 | 1,538 | 1,115 | ||||||
American Funds Insurance Series 233
Table of Contents
American High-Income Trust (continued)
Bonds, notes & other debt instruments (continued)
Principal amount (000) | Value (000) | |||||||
Corporate bonds, notes & loans (continued) | ||||||||
Materials (continued) | ||||||||
Venator Finance SARL 5.75% 7/15/20251 | USD | 3,501 | $ | 1,201 | ||||
W. R. Grace Holdings, LLC 5.625% 8/15/20291 | 440 | 356 | ||||||
Warrior Met Coal, Inc. 7.875% 12/1/20281 | 1,680 | 1,658 | ||||||
|
| |||||||
| 82,682 | ||||||||
|
| |||||||
Health care 9.93% | ||||||||
1375209 BC, Ltd. 9.00% 1/30/20281 | 720 | 705 | ||||||
AdaptHealth, LLC 5.125% 3/1/20301 | 625 | 533 | ||||||
Avantor Funding, Inc. 4.625% 7/15/20281 | 2,380 | 2,167 | ||||||
Avantor Funding, Inc. 3.875% 11/1/20291 | 500 | 420 | ||||||
Bausch Health Americas, Inc. 9.25% 4/1/20261 | 1,789 | 1,255 | ||||||
Bausch Health Americas, Inc. 8.50% 1/31/20271 | 252 | 132 | ||||||
Bausch Health Companies, Inc. 9.00% 12/15/20251 | 1,591 | 1,258 | ||||||
Bausch Health Companies, Inc. 6.125% 2/1/20271 | 245 | 169 | ||||||
Bausch Health Companies, Inc. 5.75% 8/15/20271 | 865 | 590 | ||||||
Bausch Health Companies, Inc. 7.00% 1/15/20281 | 413 | 200 | ||||||
Bausch Health Companies, Inc. 5.00% 1/30/20281 | 1,357 | 653 | ||||||
Bausch Health Companies, Inc. 4.875% 6/1/20281 | 3,390 | 2,163 | ||||||
Bausch Health Companies, Inc. 5.00% 2/15/20291 | 310 | 149 | ||||||
Bausch Health Companies, Inc. 7.25% 5/30/20291 | 340 | 165 | ||||||
Bausch Health Companies, Inc. 5.25% 1/30/20301 | 1,712 | 824 | ||||||
Bausch Health Companies, Inc. 14.00% 10/15/20301 | 550 | 329 | ||||||
Bausch Health Companies, Inc. 5.25% 2/15/20311 | 3,762 | 1,828 | ||||||
Catalent Pharma Solutions, Inc. 5.00% 7/15/20271 | 290 | 270 | ||||||
Catalent Pharma Solutions, Inc. 3.125% 2/15/20291 | 285 | 227 | ||||||
Catalent Pharma Solutions, Inc. 3.50% 4/1/20301 | 1,310 | 1,036 | ||||||
Centene Corp. 4.25% 12/15/2027 | 344 | 323 | ||||||
Centene Corp. 2.45% 7/15/2028 | 2,255 | 1,908 | ||||||
Centene Corp. 4.625% 12/15/2029 | 2,035 | 1,864 | ||||||
Centene Corp. 3.375% 2/15/2030 | 422 | 358 | ||||||
Centene Corp. 3.00% 10/15/2030 | 720 | 592 | ||||||
Centene Corp. 2.50% 3/1/2031 | 1,245 | 977 | ||||||
Centene Corp. 2.625% 8/1/2031 | 400 | 315 | ||||||
Charles River Laboratories International, Inc. 4.25% 5/1/20281 | 561 | 518 | ||||||
Charles River Laboratories International, Inc. 3.75% 3/15/20291 | 680 | 602 | ||||||
Charles River Laboratories International, Inc. 4.00% 3/15/20311 | 400 | 347 | ||||||
Community Health Systems, Inc. 8.00% 3/15/20261 | 580 | 529 | ||||||
Community Health Systems, Inc. 5.625% 3/15/20271 | 1,645 | 1,414 | ||||||
Community Health Systems, Inc. 6.00% 1/15/20291 | 348 | 292 | ||||||
Community Health Systems, Inc. 6.875% 4/15/20291 | 240 | 124 | ||||||
Community Health Systems, Inc. 5.25% 5/15/20301 | 1,370 | 1,035 | ||||||
Community Health Systems, Inc. 4.75% 2/15/20311 | 100 | 73 | ||||||
DaVita, Inc. 4.625% 6/1/20301 | 850 | 686 | ||||||
Encompass Health Corp. 4.50% 2/1/2028 | 496 | 451 | ||||||
Encompass Health Corp. 4.75% 2/1/2030 | 285 | 251 | ||||||
Endo DAC 6.00% 6/30/20281,2 | 2,313 | 127 | ||||||
Endo DAC / Endo Finance, LLC / Endo Finco 9.50% 7/31/20271,2 | 311 | 44 | ||||||
Endo International PLC 5.875% 10/15/20241 | 520 | 413 | ||||||
Endo Luxembourg Finance Co. I SARL / Endo U.S., Inc. 6.125% 4/1/20291 | 660 | 502 | ||||||
Grifols Escrow Issuer SA 4.75% 10/15/20281 | 630 | 545 | ||||||
HCA, Inc. 5.625% 9/1/2028 | 1,300 | 1,295 | ||||||
HCA, Inc. 5.875% 2/1/2029 | 255 | 255 | ||||||
HCA, Inc. 3.50% 9/1/2030 | 1,215 | 1,051 | ||||||
HCA, Inc. 4.625% 3/15/20521 | 233 | 182 | ||||||
HCA, Inc. 7.50% 11/15/2095 | 250 | 269 | ||||||
HealthEquity, Inc. 4.50% 10/1/20291 | 600 | 525 | ||||||
IMS Health Holdings, Inc. 5.00% 10/15/20261 | 823 | 788 | ||||||
Jazz Securities DAC 4.375% 1/15/20291 | 461 | 412 | ||||||
Mallinckrodt PLC 10.00% 4/15/20251 | 939 | 808 | ||||||
Minerva Merger Sub, Inc. 6.50% 2/15/20301 | 640 | 473 | ||||||
234 American Funds Insurance Series
Table of Contents
American High-Income Trust (continued)
Bonds, notes & other debt instruments (continued)
Principal (000) | Value (000) | |||||||
Corporate bonds, notes & loans (continued) | ||||||||
Health care (continued) | ||||||||
Molina Healthcare, Inc. 4.375% 6/15/20281 | USD | 1,055 | $ | 965 | ||||
Molina Healthcare, Inc. 3.875% 11/15/20301 | 2,309 | 1,960 | ||||||
Molina Healthcare, Inc. 3.875% 5/15/20321 | 2,275 | 1,893 | ||||||
Mozart Debt Merger Sub, Inc. 3.875% 4/1/20291 | 220 | 178 | ||||||
Mozart Debt Merger Sub, Inc. 5.25% 10/1/20291 | 1,425 | 1,134 | ||||||
Option Care Health, Inc. 4.375% 10/31/20291 | 290 | 254 | ||||||
Organon Finance 1, LLC 4.125% 4/30/20281 | 535 | 475 | ||||||
Owens & Minor, Inc. 4.375% 12/15/2024 | 1,185 | 1,147 | ||||||
Owens & Minor, Inc. 4.50% 3/31/20291 | 1,145 | 914 | ||||||
Owens & Minor, Inc. 6.625% 4/1/20301 | 675 | 581 | ||||||
Par Pharmaceutical, Inc. 7.50% 4/1/20271 | 4,665 | 3,555 | ||||||
Radiology Partners, Inc. 9.25% 2/1/20281 | 1,873 | 1,054 | ||||||
Radiology Partners, Inc., Term Loan, (3-month USD-LIBOR + 4.25%) 8.639% 7/9/20254,5 | 95 | 80 | ||||||
RP Escrow Issuer, LLC 5.25% 12/15/20251 | 1,175 | 899 | ||||||
Select Medical Holdings Corp. 6.25% 8/15/20261 | 554 | 528 | ||||||
Surgery Center Holdings 10.00% 4/15/20271 | 244 | 249 | ||||||
Syneos Health, Inc. 3.625% 1/15/20291 | 530 | 423 | ||||||
Team Health Holdings, Inc. 6.375% 2/1/20251 | 704 | 407 | ||||||
Team Health Holdings, Inc., Term Loan B, (3-month USD CME Term SOFR + 5.25%) 9.573% 3/2/20274,5 | 276 | 209 | ||||||
Tenet Healthcare Corp. 4.625% 7/15/2024 | 130 | 127 | ||||||
Tenet Healthcare Corp. 4.875% 1/1/20261 | 5,600 | 5,307 | ||||||
Tenet Healthcare Corp. 6.25% 2/1/20271 | 500 | 481 | ||||||
Tenet Healthcare Corp. 5.125% 11/1/20271 | 265 | 247 | ||||||
Tenet Healthcare Corp. 4.625% 6/15/20281 | 890 | 798 | ||||||
Tenet Healthcare Corp. 6.125% 10/1/20281 | 740 | 664 | ||||||
Tenet Healthcare Corp. 4.25% 6/1/20291 | 990 | 859 | ||||||
Tenet Healthcare Corp. 4.375% 1/15/20301 | 1,340 | 1,162 | ||||||
Tenet Healthcare Corp. 6.875% 11/15/2031 | 100 | 90 | ||||||
Teva Pharmaceutical Finance Co. BV 6.00% 4/15/2024 | 3,379 | 3,319 | ||||||
Teva Pharmaceutical Finance Co. BV 7.125% 1/31/2025 | 1,984 | 1,976 | ||||||
Teva Pharmaceutical Finance Co. BV 3.15% 10/1/2026 | 3,314 | 2,905 | ||||||
Teva Pharmaceutical Finance Co. BV 4.75% 5/9/2027 | 570 | 516 | ||||||
Teva Pharmaceutical Finance Co. BV 6.75% 3/1/2028 | 1,888 | 1,845 | ||||||
Teva Pharmaceutical Finance Co. BV 5.125% 5/9/2029 | 6,865 | 6,123 | ||||||
Teva Pharmaceutical Finance Co. BV 4.10% 10/1/2046 | 412 | 253 | ||||||
Valeant Pharmaceuticals International, Inc. 5.50% 11/1/20251 | 4,190 | 3,568 | ||||||
|
| |||||||
| 82,566 | ||||||||
|
| |||||||
Industrials 8.97% | ||||||||
AAdvantage Loyalty IP, Ltd. 5.50% 4/20/20261 | 990 | 954 | ||||||
ADT Security Corp. 4.125% 8/1/20291 | 200 | 170 | ||||||
Allison Transmission Holdings, Inc. 3.75% 1/30/20311 | 1,235 | 1,017 | ||||||
Ashtead Capital, Inc. 5.50% 8/11/20321 | 600 | 576 | ||||||
Atkore, Inc. 4.25% 6/1/20311 | 385 | 331 | ||||||
Atlantic Aviation FBO, Inc., Term Loan, (3-month USD-LIBOR + 5.75%) 10.134% 9/21/20294,5 | 2,899 | 2,813 | ||||||
ATS Automation Tooling Systems, Inc. 4.125% 12/15/20281 | 275 | 238 | ||||||
Avis Budget Car Rental, LLC 5.75% 7/15/20271 | 885 | 802 | ||||||
Avis Budget Group, Inc. 5.375% 3/1/20291 | 1,215 | 1,041 | ||||||
Avolon Holdings Funding, Ltd. 5.25% 5/15/20241 | 660 | 647 | ||||||
Avolon Holdings Funding, Ltd. 2.528% 11/18/20271 | 2,098 | 1,680 | ||||||
BlueLinx Holdings, Inc. 6.00% 11/15/20291 | 500 | 416 | ||||||
Bohai Financial Investment Holding Co., Ltd. 4.50% 3/15/20231 | 132 | 132 | ||||||
Bombardier, Inc. 7.50% 3/15/20251 | 593 | 588 | ||||||
Bombardier, Inc. 7.125% 6/15/20261 | 3,395 | 3,300 | ||||||
Bombardier, Inc. 7.875% 4/15/20271 | 3,978 | 3,867 | ||||||
Bombardier, Inc. 6.00% 2/15/20281 | 1,335 | 1,236 | ||||||
Bombardier, Inc. 7.45% 5/1/20341 | 450 | 452 | ||||||
American Funds Insurance Series 235
Table of Contents
American High-Income Trust (continued)
Bonds, notes & other debt instruments (continued)
Principal amount (000) | Value (000) | |||||||
Corporate bonds, notes & loans (continued) | ||||||||
Industrials (continued) | ||||||||
Builders FirstSource, Inc. 4.25% 2/1/20321 | USD | 735 | $ | 597 | ||||
BWX Technologies, Inc. 4.125% 6/30/20281 | 515 | 464 | ||||||
BWX Technologies, Inc. 4.125% 4/15/20291 | 1,005 | 881 | ||||||
Chart Industries, Inc. 7.50% 1/1/20301 | 523 | 526 | ||||||
Clarivate Science Holdings Corp. 3.875% 7/1/20281 | 1,595 | 1,384 | ||||||
Clarivate Science Holdings Corp. 4.875% 7/1/20291 | 1,265 | 1,077 | ||||||
Clean Harbors, Inc. 4.875% 7/15/20271 | 766 | 727 | ||||||
CoreLogic, Inc. 4.50% 5/1/20281 | 4,279 | 3,288 | ||||||
CoreLogic, Inc., Term Loan, (3-month USD-LIBOR + 6.50%) 10.938% 6/4/20294,5 | 660 | 480 | ||||||
Covanta Holding Corp. 4.875% 12/1/20291 | 1,295 | 1,063 | ||||||
Covanta Holding Corp. 5.00% 9/1/2030 | 1,590 | 1,287 | ||||||
Dun & Bradstreet Corp. 5.00% 12/15/20291 | 1,585 | 1,358 | ||||||
Garda World Security Corp. 6.00% 6/1/20291 | 150 | 122 | ||||||
GFL Environmental, Inc. 3.50% 9/1/20281 | 765 | 673 | ||||||
Harsco Corp. 5.75% 7/31/20271 | 700 | 554 | ||||||
Herc Holdings, Inc. 5.50% 7/15/20271 | 200 | 187 | ||||||
Howmet Aerospace, Inc. 5.95% 2/1/2037 | 150 | 146 | ||||||
Icahn Enterprises Finance Corp. 4.75% 9/15/2024 | 1,080 | 1,038 | ||||||
Icahn Enterprises, LP 5.25% 5/15/2027 | 277 | 254 | ||||||
Icahn Enterprises, LP 4.375% 2/1/2029 | 675 | 572 | ||||||
JELD-WEN Holding, Inc. 4.875% 12/15/20271 | 543 | 410 | ||||||
LABL Escrow Issuer, LLC 6.75% 7/15/20261 | 450 | 425 | ||||||
LABL Escrow Issuer, LLC 10.50% 7/15/20271 | 1,310 | 1,221 | ||||||
LSC Communications, Inc. 8.75% 10/15/20231,2,3 | 8,933 | 27 | ||||||
LSC Communications, Inc., Term Loan B, (3-month USD-LIBOR + 4.50%) 7.75% 9/30/20222,3,4,5 | 301 | 1 | ||||||
Masonite International Corp. 3.50% 2/15/20301 | 530 | 429 | ||||||
MasTec, Inc. 4.50% 8/15/20281 | 460 | 413 | ||||||
Mileage Plus Holdings, LLC 6.50% 6/20/20271 | 3,543 | 3,530 | ||||||
Mueller Water Products, Inc. 4.00% 6/15/20291 | 275 | 242 | ||||||
Park River Holdings, Inc. 5.625% 2/1/20291 | 775 | 517 | ||||||
PGT Innovations, Inc. 4.375% 10/1/20291 | 1,125 | 943 | ||||||
Pitney Bowes, Inc. 6.875% 3/15/20271 | 600 | 514 | ||||||
PM General Purchaser, LLC 9.50% 10/1/20281 | 2,428 | 1,855 | ||||||
Prime Security Services Borrower, LLC 3.375% 8/31/20271 | 475 | 411 | ||||||
Prime Security Services Borrower, LLC 6.25% 1/15/20281 | 627 | 572 | ||||||
R.R. Donnelley & Sons Co. 6.125% 11/1/20261 | 375 | 351 | ||||||
Roller Bearing Company of America, Inc. 4.375% 10/15/20291 | 170 | 147 | ||||||
Rolls-Royce PLC 5.75% 10/15/20271 | 720 | 687 | ||||||
Sensata Technologies, Inc. 3.75% 2/15/20311 | 500 | 412 | ||||||
SkyMiles IP, Ltd. 4.75% 10/20/20281 | 1,975 | 1,859 | ||||||
Spirit AeroSystems, Inc. 4.60% 6/15/2028 | 1,410 | 1,141 | ||||||
Spirit AeroSystems, Inc. 9.375% 11/30/20291 | 980 | 1,033 | ||||||
SRS Distribution, Inc. 4.625% 7/1/20281 | 480 | 426 | ||||||
Stericycle, Inc. 5.375% 7/15/20241 | 1,135 | 1,120 | ||||||
Stericycle, Inc. 3.875% 1/15/20291 | 940 | 821 | ||||||
The Brink’s Co. 4.625% 10/15/20271 | 719 | 659 | ||||||
The Hertz Corp. 5.00% 12/1/20291 | 380 | 289 | ||||||
Titan International, Inc. 7.00% 4/30/2028 | 750 | 709 | ||||||
TransDigm, Inc. 6.25% 3/15/20261 | 1,638 | 1,619 | ||||||
TransDigm, Inc. 6.875% 5/15/2026 | 460 | 450 | ||||||
TransDigm, Inc. 6.375% 6/15/2026 | 240 | 234 | ||||||
TransDigm, Inc. 5.50% 11/15/2027 | 855 | 805 | ||||||
TransDigm, Inc. 4.625% 1/15/2029 | 155 | 137 | ||||||
TransDigm, Inc. 4.875% 5/1/2029 | 220 | 192 | ||||||
Triumph Group, Inc. 8.875% 6/1/20241 | 633 | 645 | ||||||
Triumph Group, Inc. 6.25% 9/15/20241 | 4,812 | 4,569 | ||||||
Triumph Group, Inc. 7.75% 8/15/2025 | 1,260 | 1,074 | ||||||
Uber Technologies, Inc. 8.00% 11/1/20261 | 498 | 501 | ||||||
United Airlines, Inc. 4.375% 4/15/20261 | 285 | 265 | ||||||
United Airlines, Inc. 4.625% 4/15/20291 | 505 | 441 | ||||||
236 American Funds Insurance Series
Table of Contents
American High-Income Trust (continued)
Bonds, notes & other debt instruments (continued)
Principal amount (000) | Value (000) | |||||||
Corporate bonds, notes & loans (continued) | ||||||||
Industrials (continued) | ||||||||
United Rentals, Inc. 4.875% 1/15/2028 | USD | 680 | $ | 646 | ||||
United Rentals, Inc. 6.00% 12/15/20291 | 910 | 906 | ||||||
United Rentals, Inc. 3.875% 2/15/2031 | 525 | 441 | ||||||
United Rentals, Inc. 3.75% 1/15/2032 | 450 | 368 | ||||||
Vertical U.S. Newco, Inc. 5.25% 7/15/20271 | 1,495 | 1,330 | ||||||
WESCO Distribution, Inc. 7.125% 6/15/20251 | 675 | 685 | ||||||
WESCO Distribution, Inc. 7.25% 6/15/20281 | 825 | 837 | ||||||
Western Global Airlines, LLC 10.375% 8/15/20251 | 475 | 357 | ||||||
|
| |||||||
| 74,604 | ||||||||
|
| |||||||
Financials 7.26% | ||||||||
Advisor Group Holdings, LLC 6.25% 3/1/20281 | 2,191 | 2,017 | ||||||
AG Merger Sub II, Inc. 10.75% 8/1/20271 | 3,800 | 3,852 | ||||||
AG TTMT Escrow Issuer, LLC 8.625% 9/30/20271 | 1,058 | 1,069 | ||||||
Alliant Holdings Intermediate, LLC 4.25% 10/15/20271 | 890 | 798 | ||||||
Alliant Holdings Intermediate, LLC 6.75% 10/15/20271 | 1,741 | 1,569 | ||||||
Alliant Holdings Intermediate, LLC 5.875% 11/1/20291 | 1,560 | 1,285 | ||||||
AmWINS Group, Inc. 4.875% 6/30/20291 | 1,260 | 1,070 | ||||||
Aretec Escrow Issuer, Inc. 7.50% 4/1/20291 | 2,875 | 2,379 | ||||||
Ascensus, Inc., Term Loan, (3-month USD-LIBOR + 6.50%) 10.25% 8/2/20294,5 | 1,245 | 1,096 | ||||||
AssuredPartners, Inc. 8.00% 5/15/20271 | 437 | 419 | ||||||
AssuredPartners, Inc. 5.625% 1/15/20291 | 365 | 301 | ||||||
Blackstone Private Credit Fund 7.05% 9/29/20251 | 640 | 636 | ||||||
BroadStreet Partners, Inc. 5.875% 4/15/20291 | 575 | 490 | ||||||
Castlelake Aviation Finance DAC 5.00% 4/15/20271 | 1,115 | 972 | ||||||
Coinbase Global, Inc. 3.375% 10/1/20281 | 1,320 | 699 | ||||||
Coinbase Global, Inc. 3.625% 10/1/20311 | 1,090 | 526 | ||||||
Compass Diversified Holdings 5.25% 4/15/20291 | 4,150 | 3,557 | ||||||
Compass Diversified Holdings 5.00% 1/15/20321 | 1,230 | 979 | ||||||
Credit Acceptance Corp. 5.125% 12/31/20241 | 275 | 259 | ||||||
Digital Currency Group, Inc., Term Loan, (3-month USD-LIBOR + 7.00%) 8.00% 11/30/20263,4,5 | 823 | 715 | ||||||
Digital Currency Group, Inc., Term Loan, 8.75% 11/30/20263,4 | 1,097 | 879 | ||||||
FS Energy and Power Fund 7.50% 8/15/20231 | 2,784 | 2,793 | ||||||
Hightower Holding, LLC 6.75% 4/15/20291 | 905 | 761 | ||||||
HUB International, Ltd. 7.00% 5/1/20261 | 2,080 | 2,040 | ||||||
HUB International, Ltd. 5.625% 12/1/20291 | 240 | 210 | ||||||
Iron Mountain Information Management Services, Inc. 5.00% 7/15/20321 | 725 | 603 | ||||||
JPMorgan Chase & Co. 2.956% 5/13/2031 (USD-SOFR + 2.515% on 5/13/2030)7 | 160 | 132 | ||||||
JPMorgan Chase & Co. 4.912% 7/25/2033 (USD-SOFR + 2.08% on 7/25/2032)7 | 490 | 468 | ||||||
LPL Holdings, Inc. 4.625% 11/15/20271 | 1,592 | 1,490 | ||||||
LPL Holdings, Inc. 4.00% 3/15/20291 | 1,900 | 1,656 | ||||||
LPL Holdings, Inc. 4.375% 5/15/20311 | 1,135 | 967 | ||||||
MGIC Investment Corp. 5.25% 8/15/2028 | 525 | 485 | ||||||
MSCI, Inc. 4.00% 11/15/20291 | 900 | 785 | ||||||
MSCI, Inc. 3.625% 9/1/20301 | 66 | 55 | ||||||
MSCI, Inc. 3.875% 2/15/20311 | 1,450 | 1,208 | ||||||
MSCI, Inc. 3.625% 11/1/20311 | 2,055 | 1,702 | ||||||
MSCI, Inc. 3.25% 8/15/20331 | 945 | 731 | ||||||
National Financial Partners Corp. 6.875% 8/15/20281 | 739 | 611 | ||||||
Navient Corp. 5.50% 1/25/2023 | 684 | 684 | ||||||
Navient Corp. 6.125% 3/25/2024 | 1,047 | 1,027 | ||||||
Navient Corp. 5.875% 10/25/2024 | 1,405 | 1,362 | ||||||
Navient Corp. 6.75% 6/25/2025 | 550 | 529 | ||||||
Navient Corp. 6.75% 6/15/2026 | 640 | 608 | ||||||
Navient Corp. 5.00% 3/15/2027 | 2,883 | 2,529 | ||||||
Navient Corp. 4.875% 3/15/2028 | 320 | 264 | ||||||
Navient Corp. 5.50% 3/15/2029 | 2,280 | 1,864 | ||||||
Navient Corp. 5.625% 8/1/2033 | 1,478 | 1,056 | ||||||
OneMain Finance Corp. 3.875% 9/15/2028 | 206 | 164 | ||||||
American Funds Insurance Series 237
Table of Contents
American High-Income Trust (continued)
Bonds, notes & other debt instruments (continued)
Principal amount (000) | Value (000) | |||||||
Corporate bonds, notes & loans (continued) | ||||||||
Financials (continued) | ||||||||
OneMain Holdings, Inc. 7.125% 3/15/2026 | USD | 1,335 | $ | 1,272 | ||||
Owl Rock Capital Corp. 3.75% 7/22/2025 | 600 | 555 | ||||||
Owl Rock Capital Corp. 3.40% 7/15/2026 | 290 | 254 | ||||||
Owl Rock Capital Corp. II 4.625% 11/26/20241 | 450 | 428 | ||||||
Owl Rock Capital Corp. III 3.125% 4/13/2027 | 600 | 495 | ||||||
Owl Rock Core Income Corp. 4.70% 2/8/2027 | 800 | 722 | ||||||
Oxford Finance, LLC 6.375% 2/1/20271 | 1,893 | 1,764 | ||||||
Quicken Loans, LLC 3.625% 3/1/20291 | 455 | 361 | ||||||
Rocket Mortgage, LLC 2.875% 10/15/20261 | 520 | 447 | ||||||
Ryan Specialty Group, LLC 4.375% 2/1/20301 | 615 | 533 | ||||||
Springleaf Finance Corp. 6.125% 3/15/2024 | 367 | 356 | ||||||
Springleaf Finance Corp. 6.625% 1/15/2028 | 340 | 314 | ||||||
Starwood Property Trust, Inc. 4.375% 1/15/20271 | 570 | 500 | ||||||
|
| |||||||
| 60,352 | ||||||||
|
| |||||||
Information technology 4.50% | ||||||||
Almonde, Inc., Term Loan B, (3-month USD-LIBOR + 3.50%) 6.871% 6/13/20244,5 | 270 | 239 | ||||||
Almonde, Inc., Term Loan, (3-month USD-LIBOR + 7.25%) 10.621% 6/13/20254,5 | 3,899 | 2,932 | ||||||
Black Knight, Inc. 3.625% 9/1/20281 | 410 | 357 | ||||||
Block, Inc. 2.75% 6/1/2026 | 1,455 | 1,302 | ||||||
Block, Inc. 3.50% 6/1/2031 | 1,570 | 1,255 | ||||||
BMC Software, Inc. 7.125% 10/2/20251 | 180 | 175 | ||||||
BMC Software, Inc. 9.125% 3/1/20261 | 240 | 227 | ||||||
BMC Software, Inc., Term Loan, (3-month USD-LIBOR + 5.50%) 6.128% 3/31/20264,5 | 1,170 | 1,080 | ||||||
Booz Allen Hamilton, Inc. 3.875% 9/1/20281 | 450 | 399 | ||||||
Booz Allen Hamilton, Inc. 4.00% 7/1/20291 | 580 | 511 | ||||||
CDK Global, Inc. 7.25% 6/15/20291 | 1,460 | 1,430 | ||||||
Ciena Corp. 4.00% 1/31/20301 | 440 | 388 | ||||||
CommScope Finance, LLC 6.00% 3/1/20261 | 430 | 398 | ||||||
CommScope Finance, LLC 8.25% 3/1/20271 | 360 | 280 | ||||||
CommScope Technologies, LLC 6.00% 6/15/20251 | 380 | 347 | ||||||
CommScope Technologies, LLC 5.00% 3/15/20271 | 220 | 150 | ||||||
Condor Merger Sub, Inc. 7.375% 2/15/20301 | 400 | 322 | ||||||
Diebold Nixdorf, Inc. 9.375% 7/15/20251 | 7,523 | 5,380 | ||||||
Diebold Nixdorf, Inc., units, 8.50% PIK or 8.50% Cash 10/15/20261,3,6 | 1,324 | 797 | ||||||
Diebold Nixdorf, Inc., Term Loan, (USD-SOFR + 5.25%) 6.75% 7/15/20253,4,5 | 2,084 | 1,404 | ||||||
Elastic NV 4.125% 7/15/20291 | 350 | 283 | ||||||
Entegris Escrow Corp. 4.75% 4/15/20291 | 790 | 722 | ||||||
Fair Isaac Corp. 4.00% 6/15/20281 | 1,195 | 1,087 | ||||||
Finastra, Ltd., Term Loan B, (3-month EUR-EURIBOR + 3.00%) 4.00% 6/13/20244,5 | EUR | 846 | 783 | |||||
Gartner, Inc. 4.50% 7/1/20281 | USD | 2,098 | 1,960 | |||||
Gartner, Inc. 3.625% 6/15/20291 | 154 | 135 | ||||||
Gartner, Inc. 3.75% 10/1/20301 | 1,001 | 864 | ||||||
GoDaddy Operating Co. 5.25% 12/1/20271 | 390 | 370 | ||||||
GoDaddy Operating Co. 3.50% 3/1/20291 | 210 | 176 | ||||||
Imola Merger Corp. 4.75% 5/15/20291 | 300 | 261 | ||||||
MicroStrategy, Inc. 6.125% 6/15/20281 | 325 | 233 | ||||||
MoneyGram International, Inc. 5.375% 8/1/20261 | 875 | 888 | ||||||
NCR Corp. 5.125% 4/15/20291 | 1,759 | 1,474 | ||||||
NortonLifeLock, Inc. 7.125% 9/30/20301 | 255 | 251 | ||||||
Open Text Corp., Term Loan B, (3-month USD-LIBOR + 3.50%) 3.50% 11/16/20294,5 | 355 | 347 | ||||||
Rocket Software, Inc. 6.50% 2/15/20291 | 455 | 359 | ||||||
Sabre GLBL, Inc. 7.375% 9/1/20251 | 133 | 128 | ||||||
Sabre GLBL, Inc. 11.25% 12/15/20271 | 877 | 904 | ||||||
Sabre Holdings Corp. 9.25% 4/15/20251 | 1,152 | 1,149 | ||||||
Synaptics, Inc. 4.00% 6/15/20291 | 375 | 316 | ||||||
Tibco Software, Inc., Term Loan A, (3-month USD CME Term SOFR + 4.50%) 9.18% 9/29/20284,5 | 1,255 | 1,117 | ||||||
UKG, Inc., Term Loan B, (3-month USD-LIBOR + 3.25%) 6.998% 5/4/20264,5 | 465 | 443 | ||||||
UKG, Inc., Term Loan, (3-month USD-LIBOR + 5.25%) 8.998% 5/3/20274,5 | 1,970 | 1,820 | ||||||
238 American Funds Insurance Series
Table of Contents
American High-Income Trust (continued)
Bonds, notes & other debt instruments (continued)
Principal amount (000) | Value (000) | |||||||
Corporate bonds, notes & loans (continued) | ||||||||
Information technology (continued) | ||||||||
Unisys Corp. 6.875% 11/1/20271 | USD | 1,385 | $ | 1,065 | ||||
VeriSign, Inc. 5.25% 4/1/2025 | 132 | 132 | ||||||
Veritas US, Inc. 7.50% 9/1/20251 | 285 | 197 | ||||||
Viavi Solutions, Inc. 3.75% 10/1/20291 | 230 | 194 | ||||||
Xerox Corp. 5.50% 8/15/20281 | 435 | 349 | ||||||
|
| |||||||
| 37,380 | ||||||||
|
| |||||||
Consumer staples 4.14% | ||||||||
Albertsons Companies, Inc. 4.625% 1/15/20271 | 1,060 | 987 | ||||||
Albertsons Companies, Inc. 5.875% 2/15/20281 | 190 | 181 | ||||||
Albertsons Companies, Inc. 3.50% 3/15/20291 | 3,468 | 2,917 | ||||||
Albertsons Companies, Inc. 4.875% 2/15/20301 | 615 | 550 | ||||||
B&G Foods, Inc. 5.25% 4/1/2025 | 1,377 | 1,210 | ||||||
B&G Foods, Inc. 5.25% 9/15/2027 | 2,093 | 1,608 | ||||||
Central Garden & Pet Co. 4.125% 10/15/2030 | 600 | 494 | ||||||
Central Garden & Pet Co. 4.125% 4/30/20311 | 1,005 | 833 | ||||||
Coty, Inc. 5.00% 4/15/20261 | 700 | 665 | ||||||
Coty, Inc. 6.50% 4/15/20261 | 460 | 442 | ||||||
Coty, Inc. 4.75% 1/15/20291 | 1,260 | 1,142 | ||||||
Darling Ingredients, Inc. 5.25% 4/15/20271 | 329 | 317 | ||||||
Darling Ingredients, Inc. 6.00% 6/15/20301 | 1,205 | 1,180 | ||||||
Edgewell Personal Care Co. 5.50% 6/1/20281 | 275 | 258 | ||||||
Energizer Holdings, Inc. 4.375% 3/31/20291 | 545 | 463 | ||||||
Ingles Markets, Inc. 4.00% 6/15/20311 | 345 | 291 | ||||||
Kraft Heinz Company 3.875% 5/15/2027 | 275 | 263 | ||||||
Kraft Heinz Company 4.375% 6/1/2046 | 306 | 250 | ||||||
Kronos Acquisition Holdings, Inc. 5.00% 12/31/20261 | 1,953 | 1,692 | ||||||
Kronos Acquisition Holdings, Inc. 7.00% 12/31/20271 | 3,040 | 2,504 | ||||||
Lamb Weston Holdings, Inc. 4.125% 1/31/20301 | 2,615 | 2,313 | ||||||
Lamb Weston Holdings, Inc. 4.375% 1/31/20321 | 715 | 626 | ||||||
Nestle Skin Health SA, Term Loan B3, (3-month USD-LIBOR + 3.75%) 8.48% 10/1/20264,5 | 784 | 753 | ||||||
Performance Food Group, Inc. 5.50% 10/15/20271 | 705 | 666 | ||||||
Performance Food Group, Inc. 4.25% 8/1/20291 | 483 | 419 | ||||||
Post Holdings, Inc. 5.625% 1/15/20281 | 1,199 | 1,130 | ||||||
Post Holdings, Inc. 5.50% 12/15/20291 | 811 | 736 | ||||||
Post Holdings, Inc. 4.625% 4/15/20301 | 3,355 | 2,901 | ||||||
Post Holdings, Inc. 4.50% 9/15/20311 | 1,350 | 1,137 | ||||||
Prestige Brands International, Inc. 5.125% 1/15/20281 | 103 | 97 | ||||||
Prestige Brands International, Inc. 3.75% 4/1/20311 | 1,275 | 1,053 | ||||||
Simmons Foods, Inc. 4.625% 3/1/20291 | 993 | 810 | ||||||
TreeHouse Foods, Inc. 4.00% 9/1/2028 | 1,415 | 1,205 | ||||||
United Natural Foods, Inc. 6.75% 10/15/20281 | 2,030 | 1,954 | ||||||
US Foods, Inc. 4.625% 6/1/20301 | 460 | 406 | ||||||
|
| |||||||
| 34,453 | ||||||||
|
| |||||||
Real estate 3.45% | ||||||||
Anywhere Real Estate Group, LLC 5.75% 1/15/20291 | 2,213 | 1,677 | ||||||
Anywhere Real Estate Group, LLC 5.25% 4/15/20301 | 957 | 699 | ||||||
Brookfield Property REIT, Inc. 5.75% 5/15/20261 | 1,304 | 1,193 | ||||||
Brookfield Property REIT, Inc. 4.50% 4/1/20271 | 194 | 162 | ||||||
Forestar Group, Inc. 3.85% 5/15/20261 | 465 | 408 | ||||||
Forestar Group, Inc. 5.00% 3/1/20281 | 92 | 79 | ||||||
Hospitality Properties Trust 4.35% 10/1/2024 | 145 | 132 | ||||||
Howard Hughes Corp. 5.375% 8/1/20281 | 1,447 | 1,306 | ||||||
Howard Hughes Corp. 4.125% 2/1/20291 | 2,043 | 1,714 | ||||||
Howard Hughes Corp. 4.375% 2/1/20311 | 2,258 | 1,830 | ||||||
Iron Mountain, Inc. 4.875% 9/15/20271 | 1,616 | 1,489 | ||||||
Iron Mountain, Inc. 5.25% 3/15/20281 | 1,214 | 1,119 | ||||||
Iron Mountain, Inc. 5.00% 7/15/20281 | 367 | 330 | ||||||
American Funds Insurance Series 239
Table of Contents
American High-Income Trust (continued)
Bonds, notes & other debt instruments (continued)
Principal amount (000) | Value (000) | |||||||
Corporate bonds, notes & loans (continued) | ||||||||
Real estate (continued) | ||||||||
Iron Mountain, Inc. 5.25% 7/15/20301 | USD | 2,880 | $ | 2,509 | ||||
Iron Mountain, Inc. 4.50% 2/15/20311 | 950 | 783 | ||||||
Kennedy-Wilson Holdings, Inc. 4.75% 3/1/2029 | 2,505 | 1,989 | ||||||
Kennedy-Wilson Holdings, Inc. 4.75% 2/1/2030 | 2,545 | 1,944 | ||||||
Kennedy-Wilson Holdings, Inc. 5.00% 3/1/2031 | 2,050 | 1,546 | ||||||
Ladder Capital Finance Holdings LLLP 5.25% 10/1/20251 | 740 | 697 | ||||||
Ladder Capital Finance Holdings LLLP 4.25% 2/1/20271 | 1,429 | 1,203 | ||||||
Ladder Capital Finance Holdings LLLP 4.75% 6/15/20291 | 100 | 81 | ||||||
Medical Properties Trust, Inc. 5.00% 10/15/2027 | 638 | 538 | ||||||
Medical Properties Trust, Inc. 3.50% 3/15/2031 | 239 | 164 | ||||||
Park Intermediate Holdings, LLC 4.875% 5/15/20291 | 820 | 695 | ||||||
RHP Hotel Properties, LP 4.50% 2/15/20291 | 535 | 462 | ||||||
RLJ Lodging Trust, LP 4.00% 9/15/20291 | 800 | 650 | ||||||
VICI Properties, LP 3.50% 2/15/20251 | 261 | 247 | ||||||
VICI Properties, LP 4.625% 6/15/20251 | 620 | 595 | ||||||
VICI Properties, LP 3.875% 2/15/20291 | 1,111 | 975 | ||||||
VICI Properties, LP 4.625% 12/1/20291 | 184 | 168 | ||||||
VICI Properties, LP 4.125% 8/15/20301 | 330 | 289 | ||||||
WeWork Companies, LLC 5.00% 7/10/20251 | 2,985 | 992 | ||||||
|
| |||||||
| 28,665 | ||||||||
|
| |||||||
Utilities 3.20% | ||||||||
AmeriGas Partners, LP 5.875% 8/20/2026 | 80 | 76 | ||||||
AmeriGas Partners, LP 5.75% 5/20/2027 | 324 | 302 | ||||||
Calpine Corp. 4.50% 2/15/20281 | 150 | 134 | ||||||
Calpine Corp. 5.125% 3/15/20281 | 518 | 463 | ||||||
Calpine Corp. 3.75% 3/1/20311 | 500 | 403 | ||||||
DPL, Inc. 4.125% 7/1/2025 | 555 | 522 | ||||||
Emera, Inc. 6.75% 6/15/2076 (3-month USD-LIBOR + 5.44% on 6/15/2026)7 | 1,155 | 1,113 | ||||||
FirstEnergy Corp. 2.65% 3/1/2030 | 624 | 510 | ||||||
FirstEnergy Corp. 2.25% 9/1/2030 | 980 | 780 | ||||||
FirstEnergy Corp. 7.375% 11/15/2031 | 337 | 380 | ||||||
FirstEnergy Corp. 3.40% 3/1/2050 | 510 | 337 | ||||||
FirstEnergy Corp., Series C, 5.35% 7/15/20477 | 475 | 425 | ||||||
FirstEnergy Transmission, LLC 2.866% 9/15/20281 | 265 | 232 | ||||||
FirstEnergy Transmission, LLC 4.55% 4/1/20491 | 100 | 81 | ||||||
NextEra Energy Partners, LP 4.25% 7/15/20241 | 122 | 118 | ||||||
NRG Energy, Inc. 3.625% 2/15/20311 | 845 | 644 | ||||||
Pacific Gas and Electric Co. 5.45% 6/15/2027 | 335 | 331 | ||||||
Pacific Gas and Electric Co. 2.10% 8/1/2027 | 116 | 99 | ||||||
Pacific Gas and Electric Co. 3.30% 12/1/2027 | 124 | 110 | ||||||
Pacific Gas and Electric Co. 3.75% 7/1/2028 | 10 | 9 | ||||||
Pacific Gas and Electric Co. 4.55% 7/1/2030 | 213 | 194 | ||||||
Pacific Gas and Electric Co. 2.50% 2/1/2031 | 393 | 306 | ||||||
Pacific Gas and Electric Co. 3.25% 6/1/2031 | 107 | 87 | ||||||
Pacific Gas and Electric Co. 3.30% 8/1/2040 | 280 | 190 | ||||||
Pacific Gas and Electric Co. 3.50% 8/1/2050 | 1,000 | 625 | ||||||
PG&E Corp. 5.00% 7/1/2028 | 3,150 | 2,881 | ||||||
PG&E Corp. 5.25% 7/1/2030 | 3,040 | 2,771 | ||||||
Talen Energy Corp. 10.50% 1/15/20261,2 | 2,987 | 1,434 | ||||||
Talen Energy Corp. 7.25% 5/15/20271 | 5,189 | 5,395 | ||||||
Talen Energy Corp. 6.625% 1/15/20281 | 130 | 133 | ||||||
Talen Energy Corp., Term Loan, (3-month USD CME Term SOFR + 4.75%) 9.008% 11/13/20234,5 | 3,085 | 3,116 | ||||||
Talen Energy Corp., Term Loan B, (3-month USD-LIBOR + 3.75%) 7.821% 7/8/20264,5 | 500 | 508 | ||||||
Talen Energy Supply, LLC 7.625% 6/1/20281 | 489 | 511 | ||||||
240 American Funds Insurance Series
Table of Contents
American High-Income Trust (continued)
Bonds, notes & other debt instruments (continued)
Principal amount (000) | Value (000) | |||||||
Corporate bonds, notes & loans (continued) | ||||||||
Utilities (continued) | ||||||||
Targa Resources Partners, LP 4.00% 1/15/2032 | USD | 190 | $ | 160 | ||||
Venture Global Calcasieu Pass, LLC 3.875% 8/15/20291 | 1,190 | 1,043 | ||||||
Vistra Operations Co., LLC 3.55% 7/15/20241 | 231 | 222 | ||||||
|
| |||||||
| 26,645 | ||||||||
|
| |||||||
Total corporate bonds, notes & loans | 736,042 | |||||||
|
| |||||||
Mortgage-backed obligations 0.08% | ||||||||
Collateralized mortgage-backed obligations 0.08% | ||||||||
Treehouse Park Improvement Association No.1 - Anleihen 9.75% 12/1/20331,3 | 712 | 630 | ||||||
|
| |||||||
Total bonds, notes & other debt instruments (cost: $842,910,000) | 736,672 | |||||||
|
| |||||||
Convertible bonds & notes 0.06% | ||||||||
Communication services 0.05% | ||||||||
DISH DBS Corp., convertible notes, 3.375% 8/15/2026 | 635 | 399 | ||||||
|
| |||||||
Energy 0.01% | ||||||||
Mesquite Energy, Inc., convertible notes, 13.14% Cash 7/15/20231,3,6 | 79 | 79 | ||||||
|
| |||||||
Total convertible bonds & notes (cost: $720,000) | 478 | |||||||
|
| |||||||
Convertible stocks 0.11% | ||||||||
| Shares | ||||||||
Utilities 0.06% | ||||||||
PG&E Corp., convertible preferred units, 5.50% 8/16/2023 | 3,350 | 483 | ||||||
|
| |||||||
Financials 0.05% | ||||||||
2020 Cash Mandatory Exchangeable Trust, convertible preferred shares, 5.25% 6/1/20231 | 411 | 472 | ||||||
|
| |||||||
Total convertible stocks (cost: $657,000) | 955 | |||||||
|
| |||||||
Common stocks 4.45% | ||||||||
Health care 2.60% | ||||||||
Rotech Healthcare, Inc.3,8,9 | 201,793 | 21,591 | ||||||
|
| |||||||
Energy 1.15% | ||||||||
Chesapeake Energy Corp. | 29,829 | 2,815 | ||||||
Weatherford International8 | 33,659 | 1,714 | ||||||
Ascent Resources - Utica, LLC, Class A3,8,9 | 6,297,894 | 1,260 | ||||||
Denbury, Inc.8 | 13,380 | 1,164 | ||||||
Diamond Offshore Drilling, Inc.8 | 110,972 | 1,154 | ||||||
California Resources Corp. | 17,202 | 748 | ||||||
Constellation Oil Services Holding SA, Class B-13,8 | 3,449,949 | 380 | ||||||
Altera Infrastructure, LP3,8 | 3,550 | 282 | ||||||
McDermott International, Ltd.8 | 82,509 | 26 | ||||||
Mesquite Energy, Inc.3,8 | 3,558 | 21 | ||||||
Bighorn Permian Resources, LLC3 | 2,894 | — | 10 | |||||
|
| |||||||
| 9,564 | ||||||||
|
| |||||||
Financials 0.32% | ||||||||
Jonah Energy Parent, LLC3 | 38,716 | 2,289 | ||||||
Navient Corp. | 20,000 | 329 | ||||||
|
| |||||||
| 2,618 | ||||||||
|
| |||||||
American Funds Insurance Series 241
Table of Contents
American High-Income Trust (continued)
Common stocks (continued)
| Shares | Value (000) | |||||||
Consumer discretionary 0.29% | ||||||||
NMG Parent, LLC8 | 9,965 | $ | 1,520 | |||||
MYT Holding Co., Class B3,8 | 608,846 | 913 | ||||||
|
| |||||||
| 2,433 | ||||||||
|
| |||||||
Information technology 0.05% | ||||||||
MoneyGram International, Inc.8 | 41,400 | 451 | ||||||
|
| |||||||
Communication services 0.04% | ||||||||
Intelsat SA3,8 | 8,164 | 196 | ||||||
iHeartMedia, Inc., Class A8 | 22,639 | 139 | ||||||
|
| |||||||
| 335 | ||||||||
|
| |||||||
Total common stocks (cost: $13,251,000) | 36,992 | |||||||
|
| |||||||
Preferred securities 0.32% | ||||||||
Consumer discretionary 0.27% | ||||||||
MYT Holdings, LLC, Series A, 10.00% preferred shares3,8 | 2,095,904 | 2,201 | ||||||
|
| |||||||
Industrials 0.05% | ||||||||
ACR III LSC Holdings, LLC, Series B, preferred shares1,3,8 | 1,022 | 428 | ||||||
|
| |||||||
Total preferred securities (cost: $2,933,000) | 2,629 | |||||||
|
| |||||||
Rights & warrants 0.10% | ||||||||
Consumer discretionary 0.10% | ||||||||
NMG Parent, LLC, warrants, expire 9/24/20278 | 27,111 | 826 | ||||||
|
| |||||||
Communication services 0.00% | ||||||||
Intelsat Jackson Holdings SA (CVR), Series A3,8 | 855 | 6 | ||||||
Intelsat Jackson Holdings SA (CVR), Series B3,8 | 855 | 6 | ||||||
|
| |||||||
| 12 | ||||||||
|
| |||||||
Total rights & warrants (cost: $173,000) | 838 | |||||||
|
| |||||||
Short-term securities 4.64% | ||||||||
Money market investments 4.64% | ||||||||
Capital Group Central Cash Fund 4.31%11,12 | 385,690 | 38,565 | ||||||
|
| |||||||
Total short-term securities (cost: $38,557,000) | 38,565 | |||||||
|
| |||||||
Total investment securities 98.27% (cost: $899,201,000) | 817,129 | |||||||
Other assets less liabilities 1.73% | 14,425 | |||||||
|
| |||||||
Net assets 100.00% | $ | 831,554 | ||||||
|
| |||||||
242 American Funds Insurance Series
Table of Contents
American High-Income Trust (continued)
Futures contracts
Contracts | Type | Number of contracts | Expiration | Notional amount (000) | Value and unrealized (depreciation) appreciation at 12/31/2022 (000) | |||||||||||||||
5 Year U.S. Treasury Note Futures | Long | 63 | March 2023 | USD | 6,799 | $ | (98 | ) | ||||||||||||
10 Year U.S. Treasury Note Futures | Short | 14 | March 2023 | (1,572 | ) | 10 | ||||||||||||||
30 Year Ultra U.S. Treasury Bond Futures | Short | 1 | March 2023 | (134 | ) | — | 10 | |||||||||||||
|
| |||||||||||||||||||
| $ | (88 | ) | ||||||||||||||||||
|
| |||||||||||||||||||
Swap contracts
Credit default swaps
Centrally cleared credit default swaps on credit indices — buy protection
Reference index | Financing rate paid | Payment frequency | Expiration date | Notional amount (000) | Value at 12/31/2022 (000) | Upfront premium paid (000) | Unrealized depreciation at 12/31/2022 (000) | |||||||||||||||||||||
CDX.NA.HY.39 | 5.00% | Quarterly | 12/20/2027 | USD | 8,050 | $ | (50 | ) | $ | 104 | $ | (154 | ) | |||||||||||||||
Investments in affiliates12
| Value of affiliate at 1/1/2022 (000) | Additions (000) | Reductions (000) | Net realized loss (000) | Net unrealized appreciation (000) | Value of affiliate at 12/31/2022 (000) | Dividend income (000) | ||||||||||||||||||||||
Short-term securities 4.64% | ||||||||||||||||||||||||||||
Money market investments 4.64% | ||||||||||||||||||||||||||||
Capital Group Central Cash Fund 4.31%11 | $ | 17,238 | $ | 219,950 | $ | 198,620 | $ | (7 | ) | $ | 4 | $ | 38,565 | $ | 610 | |||||||||||||
Restricted securities9
Acquisition date | Cost (000) | Value (000) | Percent of net assets | |||||||||
Rotech Healthcare, Inc.3,8 | 9/26/2013 | $ | 4,331 | $ | 21,591 | 2.60% | ||||||
Ascent Resources - Utica, LLC, Class A3,8 | 11/15/2016 | 302 | 1,260 | .15 | ||||||||
|
|
|
|
| ||||||||
Total | $ | 4,633 | $ | 22,851 | 2.75% | |||||||
|
|
|
|
| ||||||||
American Funds Insurance Series 243
Table of Contents
American High-Income Trust (continued)
| 1 | Acquired in a transaction exempt from registration under Rule 144A or, for commercial paper, Section 4(a)(2) of the Securities Act of 1933. May be resold in the U.S. in transactions exempt from registration, normally to qualified institutional buyers. The total value of all such securities was $544,764,000, which represented 65.51% of the net assets of the fund. |
| 2 | Scheduled interest and/or principal payment was not received. |
| 3 | Value determined using significant unobservable inputs. |
| 4 | Loan participations and assignments; may be subject to legal or contractual restrictions on resale. The total value of all such loans was $25,672,000, which represented 3.09% of the net assets of the fund. |
| 5 | Coupon rate may change periodically. Reference rate and spread are as of the most recent information available. Some coupon rates are determined by the issuer or agent based on current market conditions; therefore, the reference rate and spread are not available. |
| 6 | Payment in kind; the issuer has the option of paying additional securities in lieu of cash. Payment methods and rates are as of the most recent payment when available. |
| 7 | Step bond; coupon rate may change at a later date. |
| 8 | Security did not produce income during the last 12 months. |
| 9 | Restricted security, other than Rule 144A securities or commercial paper issued pursuant to Section 4(a)(2) of the Securities Act of 1933. The total value of all such restricted securities was $22,851,000, which represented 2.75% of the net assets of the fund. |
| 10 | Amount less than one thousand. |
| 11 | Rate represents the seven-day yield at 12/31/2022. |
| 12 | Part of the same “group of investment companies“ as the fund as defined under the Investment Company Act of 1940, as amended. |
Key to abbreviations
CME = CME Group
CVR = Contingent Value Rights
DAC = Designated Activity Company
EUR = Euros
EURIBOR = Euro Interbank Offered Rate
LIBOR = London Interbank Offered Rate
PIK = Payment In Kind
REIT = Real Estate Investment Trust
SOFR = Secured Overnight Financing Rate
USD = U.S. dollars
Refer to the notes to financial statements.
244 American Funds Insurance Series
Table of Contents
Investment portfolio December 31, 2022
Bonds, notes & other debt instruments 94.91%
Principal amount (000) | Value (000) | |||||||
Mortgage-backed obligations 80.19% | ||||||||
Federal agency mortgage-backed obligations 77.35% | ||||||||
Fannie Mae Pool #695412 5.00% 6/1/20331 | USD | — | 2 | $ | — | 2 | ||
Fannie Mae Pool #AD3566 5.00% 10/1/20351 | 2 | 2 | ||||||
Fannie Mae Pool #256583 5.00% 12/1/20361 | 32 | 32 | ||||||
Fannie Mae Pool #931768 5.00% 8/1/20391 | 1 | 1 | ||||||
Fannie Mae Pool #AC0794 5.00% 10/1/20391 | 5 | 5 | ||||||
Fannie Mae Pool #932606 5.00% 2/1/20401 | 2 | 2 | ||||||
Fannie Mae Pool #AE1248 5.00% 6/1/20411 | 8 | 8 | ||||||
Fannie Mae Pool #MA4387 2.00% 7/1/20411 | 19 | 16 | ||||||
Fannie Mae Pool #AJ1873 4.00% 10/1/20411 | 7 | 6 | ||||||
Fannie Mae Pool #AE1274 5.00% 10/1/20411 | 7 | 7 | ||||||
Fannie Mae Pool #AE1277 5.00% 11/1/20411 | 5 | 5 | ||||||
Fannie Mae Pool #MA4501 2.00% 12/1/20411 | 370 | 312 | ||||||
Fannie Mae Pool #AE1283 5.00% 12/1/20411 | 2 | 2 | ||||||
Fannie Mae Pool #MA4540 2.00% 2/1/20421 | 530 | 447 | ||||||
Fannie Mae Pool #AE1290 5.00% 2/1/20421 | 4 | 4 | ||||||
Fannie Mae Pool #MA4570 2.00% 3/1/20421 | 120 | 102 | ||||||
Fannie Mae Pool #AT0300 3.50% 3/1/20431 | 1 | 1 | ||||||
Fannie Mae Pool #AT3954 3.50% 4/1/20431 | 2 | 2 | ||||||
Fannie Mae Pool #AY1829 3.50% 12/1/20441 | 2 | 2 | ||||||
Fannie Mae Pool #FM9416 3.50% 7/1/20451 | 374 | 346 | ||||||
Fannie Mae Pool #BH3122 4.00% 6/1/20471 | 1 | 1 | ||||||
Fannie Mae Pool #BJ5015 4.00% 12/1/20471 | 39 | 37 | ||||||
Fannie Mae Pool #BK5232 4.00% 5/1/20481 | 20 | 19 | ||||||
Fannie Mae Pool #BK6840 4.00% 6/1/20481 | 27 | 25 | ||||||
Fannie Mae Pool #BK9743 4.00% 8/1/20481 | 8 | 8 | ||||||
Fannie Mae Pool #BK9761 4.50% 8/1/20481 | 5 | 5 | ||||||
Fannie Mae Pool #FM3280 3.50% 5/1/20491 | 98 | 91 | ||||||
Fannie Mae Pool #CA5496 3.00% 4/1/20501,3 | 1,215 | 1,089 | ||||||
Fannie Mae Pool #CA5968 2.50% 6/1/20501 | 54 | 46 | ||||||
Fannie Mae Pool #CA6593 2.50% 8/1/20501 | 560 | 482 | ||||||
Fannie Mae Pool #CA7257 2.50% 10/1/20501 | 126 | 109 | ||||||
Fannie Mae Pool #BQ3005 2.50% 10/1/20501 | 82 | 70 | ||||||
Fannie Mae Pool #MA4208 2.00% 12/1/20501 | 13 | 10 | ||||||
Fannie Mae Pool #CA8955 2.50% 2/1/20511 | 66 | 57 | ||||||
Fannie Mae Pool #CB0290 2.00% 4/1/20511 | 116 | 95 | ||||||
Fannie Mae Pool #MA4305 2.00% 4/1/20511 | 1 | 1 | ||||||
Fannie Mae Pool #CB0041 3.00% 4/1/20511 | 211 | 188 | ||||||
Fannie Mae Pool #FM7687 3.00% 6/1/20511 | 278 | 247 | ||||||
Fannie Mae Pool #FM7900 2.50% 7/1/20511 | 28 | 24 | ||||||
Fannie Mae Pool #CB1527 2.50% 9/1/20511 | 450 | 382 | ||||||
Fannie Mae Pool #FS0965 2.00% 11/1/20511 | 3 | 2 | ||||||
Fannie Mae Pool #FM9492 2.50% 11/1/20511 | 464 | 397 | ||||||
Fannie Mae Pool #FM9694 2.50% 11/1/20511 | 230 | 197 | ||||||
Fannie Mae Pool #CB2286 2.50% 12/1/20511 | 764 | 653 | ||||||
Fannie Mae Pool #BU3058 2.50% 12/1/20511 | 295 | 251 | ||||||
Fannie Mae Pool #FM9804 2.50% 12/1/20511 | 247 | 212 | ||||||
Fannie Mae Pool #FM9976 3.00% 12/1/20511 | 100 | 89 | ||||||
Fannie Mae Pool #CB2544 3.00% 1/1/20521 | 280 | 248 | ||||||
Fannie Mae Pool #BV3870 2.50% 2/1/20521 | 405 | 344 | ||||||
Fannie Mae Pool #FS0523 2.50% 2/1/20521 | 380 | 325 | ||||||
Fannie Mae Pool #BV8569 2.50% 4/1/20521 | 1,274 | 1,081 | ||||||
Fannie Mae Pool #MA4578 2.50% 4/1/20521 | 204 | 173 | ||||||
Fannie Mae Pool #CB4274 2.50% 7/1/20521 | 179 | 152 | ||||||
Fannie Mae Pool #BW0004 3.50% 7/1/20521 | 300 | 273 | ||||||
Fannie Mae Pool #CB4159 4.00% 7/1/20521 | 22 | 20 | ||||||
Fannie Mae Pool #MA4700 4.00% 8/1/20521 | 1,967 | 1,847 | ||||||
Fannie Mae Pool #BV8024 4.00% 8/1/20521 | 28 | 26 | ||||||
Fannie Mae Pool #BW7326 4.00% 9/1/20521 | 24 | 22 | ||||||
Fannie Mae Pool #BW9348 4.00% 9/1/20521 | 21 | 20 | ||||||
Fannie Mae Pool #BW8103 4.00% 9/1/20521 | 20 | 18 | ||||||
Fannie Mae Pool #BW9823 4.50% 9/1/20521 | 45 | 44 | ||||||
American Funds Insurance Series 245
Table of Contents
American Funds Mortgage Fund (continued)
Bonds, notes & other debt instruments (continued)
Principal amount (000) | Value (000) | |||||||
Mortgage-backed obligations (continued) | ||||||||
Federal agency mortgage-backed obligations (continued) | ||||||||
Fannie Mae Pool #CB5208 5.00% 9/1/20521 | USD | 599 | $ | 591 | ||||
Fannie Mae Pool #BW8980 4.00% 10/1/20521 | 77 | 72 | ||||||
Fannie Mae Pool #BW1210 4.00% 10/1/20521 | 58 | 54 | ||||||
Fannie Mae Pool #BW7356 4.00% 10/1/20521 | 48 | 45 | ||||||
Fannie Mae Pool #BX0509 4.00% 10/1/20521 | 21 | 20 | ||||||
Fannie Mae Pool #BW7795 4.50% 10/1/20521 | 477 | 460 | ||||||
Fannie Mae Pool #MA4784 4.50% 10/1/20521 | 4 | 4 | ||||||
Fannie Mae Pool #BW7121 5.00% 10/1/20521 | 577 | 570 | ||||||
Fannie Mae Pool #CB5380 5.00% 10/1/20521 | 203 | 200 | ||||||
Fannie Mae Pool #MA4803 3.50% 11/1/20521 | 38 | 34 | ||||||
Fannie Mae Pool #MA4804 4.00% 11/1/20521 | 575 | 540 | ||||||
Fannie Mae Pool #BW1310 4.00% 11/1/20521 | 22 | 21 | ||||||
Fannie Mae Pool #BX1516 4.50% 11/1/20521 | 469 | 452 | ||||||
Fannie Mae Pool #MA4841 5.00% 12/1/20521 | 1,000 | 987 | ||||||
Fannie Mae Pool #MA4866 4.00% 1/1/20531 | 68 | 64 | ||||||
Fannie Mae Pool #MA4868 5.00% 1/1/20531 | 495 | 489 | ||||||
Fannie Mae Pool #BF0379 3.50% 4/1/20591 | 146 | 134 | ||||||
Fannie Mae Pool #BF0481 3.50% 6/1/20601 | 173 | 159 | ||||||
Fannie Mae Pool #BF0497 3.00% 7/1/20601 | 53 | 46 | ||||||
Fannie Mae Pool #BF0585 4.50% 12/1/20611 | 56 | 54 | ||||||
Freddie Mac Pool #ZA1922 5.00% 2/1/20261 | 1 | 1 | ||||||
Freddie Mac Pool #ZS8950 5.00% 10/1/20291 | 2 | 2 | ||||||
Freddie Mac Pool #A18781 5.00% 3/1/20341 | 623 | 637 | ||||||
Freddie Mac Pool #RB5138 2.00% 12/1/20411 | 102 | 86 | ||||||
Freddie Mac Pool #RB5145 2.00% 2/1/20421 | 94 | 79 | ||||||
Freddie Mac Pool #RB5148 2.00% 3/1/20421 | 597 | 504 | ||||||
Freddie Mac Pool #Q15874 4.00% 2/1/20431 | 1 | 1 | ||||||
Freddie Mac Pool #760012 3.113% 4/1/20451,4 | 39 | 38 | ||||||
Freddie Mac Pool #760013 3.208% 4/1/20451,4 | 23 | 22 | ||||||
Freddie Mac Pool #760014 2.74% 8/1/20451,4 | 335 | 324 | ||||||
Freddie Mac Pool #760015 2.561% 1/1/20471,4 | 63 | 60 | ||||||
Freddie Mac Pool #Q47615 3.50% 4/1/20471 | 18 | 17 | ||||||
Freddie Mac Pool #Q52069 3.50% 11/1/20471 | 28 | 26 | ||||||
Freddie Mac Pool #Q55971 4.00% 5/1/20481 | 20 | 19 | ||||||
Freddie Mac Pool #Q56175 4.00% 5/1/20481 | 19 | 18 | ||||||
Freddie Mac Pool #Q55970 4.00% 5/1/20481 | 10 | 9 | ||||||
Freddie Mac Pool #Q56599 4.00% 6/1/20481 | 28 | 27 | ||||||
Freddie Mac Pool #Q58411 4.50% 9/1/20481 | 51 | 51 | ||||||
Freddie Mac Pool #Q58436 4.50% 9/1/20481 | 28 | 27 | ||||||
Freddie Mac Pool #Q58378 4.50% 9/1/20481 | 20 | 20 | ||||||
Freddie Mac Pool #RA1339 3.00% 9/1/20491,3 | 1,531 | 1,360 | ||||||
Freddie Mac Pool #QA2748 3.50% 9/1/20491 | 19 | 18 | ||||||
Freddie Mac Pool #SD7512 3.00% 2/1/20501 | 160 | 143 | ||||||
Freddie Mac Pool #SD8106 2.00% 11/1/20501 | 597 | 488 | ||||||
Freddie Mac Pool #SD8128 2.00% 2/1/20511 | 2 | 2 | ||||||
Freddie Mac Pool #SD8134 2.00% 3/1/20511 | 3 | 3 | ||||||
Freddie Mac Pool #RA5288 2.00% 5/1/20511 | 327 | 268 | ||||||
Freddie Mac Pool #RA6406 2.00% 11/1/20511 | 80 | 65 | ||||||
Freddie Mac Pool #SD7548 2.50% 11/1/20511 | 1,100 | 947 | ||||||
Freddie Mac Pool #SD1385 2.50% 11/1/20511 | 68 | 58 | ||||||
Freddie Mac Pool #SD7552 2.50% 1/1/20521 | 396 | 338 | ||||||
Freddie Mac Pool #RA6598 3.50% 1/1/20521 | 196 | 179 | ||||||
Freddie Mac Pool #SD7550 3.00% 2/1/20521 | 404 | 361 | ||||||
Freddie Mac Pool #SD0873 3.50% 2/1/20521,3 | 1,203 | 1,113 | ||||||
Freddie Mac Pool #QD7089 3.50% 2/1/20521 | 9 | 9 | ||||||
Freddie Mac Pool #SD1450 2.50% 3/1/20521 | 3,355 | 2,879 | ||||||
Freddie Mac Pool #SD7553 3.00% 3/1/20521 | 325 | 289 | ||||||
Freddie Mac Pool #QE6097 2.50% 7/1/20521 | 197 | 168 | ||||||
Freddie Mac Pool #SD8237 4.00% 8/1/20521 | 1,523 | 1,430 | ||||||
Freddie Mac Pool #QE9057 4.00% 8/1/20521 | 18 | 17 | ||||||
Freddie Mac Pool #SD8238 4.50% 8/1/20521 | 10 | 10 | ||||||
246 American Funds Insurance Series
Table of Contents
American Funds Mortgage Fund (continued)
Bonds, notes & other debt instruments (continued)
| Principal amount (000) | Value (000) | |||||||
Mortgage-backed obligations (continued) | ||||||||
Federal agency mortgage-backed obligations (continued) | ||||||||
Freddie Mac Pool #SD8244 4.00% 9/1/20521 | USD | 651 | $ | 612 | ||||
Freddie Mac Pool #QE9625 4.00% 9/1/20521 | 23 | 21 | ||||||
Freddie Mac Pool #RA7938 5.00% 9/1/20521 | 715 | 706 | ||||||
Freddie Mac Pool #QF1464 4.00% 10/1/20521 | 22 | 21 | ||||||
Freddie Mac Pool #SD8257 4.50% 10/1/20521 | 14 | 13 | ||||||
Freddie Mac Pool #SD8264 3.50% 11/1/20521 | 1,232 | 1,121 | ||||||
Freddie Mac Pool #SD8273 3.50% 11/1/20521 | 124 | 112 | ||||||
Freddie Mac Pool #QF3364 4.00% 11/1/20521 | 35 | 33 | ||||||
Freddie Mac Pool #SD1895 4.50% 11/1/20521 | 407 | 400 | ||||||
Freddie Mac Pool #SD8280 6.50% 11/1/20521 | 920 | 944 | ||||||
Freddie Mac Pool #SD8275 4.50% 12/1/20521 | 1,793 | 1,728 | ||||||
Freddie Mac Pool #SD8276 5.00% 12/1/20521 | 55 | 54 | ||||||
Freddie Mac Pool #SD8286 4.00% 1/1/20531 | 210 | 197 | ||||||
Freddie Mac Pool #SD8288 5.00% 1/1/20531 | 132 | 130 | ||||||
Freddie Mac Pool #SD8282 6.50% 1/1/20531 | 200 | 205 | ||||||
Freddie Mac, Series K152, Class A2, Multi Family, 3.80% 10/25/20321,4 | 207 | 196 | ||||||
Freddie Mac, Series K152, Class A2, Multi Family, 3.78% 11/25/20321 | 1,767 | 1,671 | ||||||
Freddie Mac Seasoned Credit Risk Transfer Trust, Series 2017-1, Class HA, 3.00% 1/25/20561,4 | 134 | 126 | ||||||
Freddie Mac Seasoned Credit Risk Transfer Trust, Series 2017-3, Class HT, 3.25% 7/25/20561 | 101 | 91 | ||||||
Freddie Mac Seasoned Credit Risk Transfer Trust, Series 2017-2, Class MA, 3.00% 8/25/20561 | 209 | 194 | ||||||
Freddie Mac Seasoned Credit Risk Transfer Trust, Series 2017-2, Class HA, 3.00% 8/25/20561,4 | 155 | 145 | ||||||
Freddie Mac Seasoned Credit Risk Transfer Trust, Series 2018-1, Class HT, 3.00% 5/25/20571 | 112 | 98 | ||||||
Freddie Mac Seasoned Credit Risk Transfer Trust, Series 2018-3, Class MA, 3.50% 8/25/20571 | 147 | 140 | ||||||
Freddie Mac Seasoned Credit Risk Transfer Trust, Series 2019-2, Class MT, 3.50% 8/26/20581 | 31 | 28 | ||||||
Freddie Mac Seasoned Credit Risk Transfer Trust, Series 2019-3, Class MT, 3.50% 10/25/20581 | 18 | 17 | ||||||
Freddie Mac Seasoned Loan Structured Transaction Trust, Series 2018-1, Class A1, 3.50% 6/25/20281 | 306 | 293 | ||||||
Freddie Mac Seasoned Loan Structured Transaction Trust, Series 2018-2, Class A1, 3.50% 11/25/20281 | 14 | 13 | ||||||
Freddie Mac Seasoned Loan Structured Transaction Trust, Series 2022-1, Class A1, 3.50% 5/25/20321 | 469 | 453 | ||||||
Government National Mortgage Assn. 2.00% 1/1/20531,5 | 174 | 146 | ||||||
Government National Mortgage Assn. 2.50% 1/1/20531,5 | 207 | 180 | ||||||
Government National Mortgage Assn. 3.00% 1/1/20531,5 | 388 | 346 | ||||||
Government National Mortgage Assn. 3.50% 1/1/20531,5 | 178 | 163 | ||||||
Government National Mortgage Assn. 5.00% 1/1/20531,5 | 7,330 | 7,264 | ||||||
Government National Mortgage Assn. 5.50% 1/1/20531,5 | 1,198 | 1,205 | ||||||
Government National Mortgage Assn. Pool #AH5894 3.75% 5/20/20341 | 693 | 678 | ||||||
Government National Mortgage Assn. Pool #AD0028 3.75% 7/20/20381 | 510 | 488 | ||||||
Government National Mortgage Assn. Pool #004410 4.00% 4/20/20391 | 54 | 52 | ||||||
Government National Mortgage Assn. Pool #AH5897 3.75% 7/20/20391 | 526 | 502 | ||||||
Government National Mortgage Assn. Pool #783690 6.00% 9/20/20391 | 81 | 86 | ||||||
Government National Mortgage Assn. Pool #004823 4.00% 10/20/20401 | 83 | 79 | ||||||
Government National Mortgage Assn. Pool #005104 5.00% 6/20/20411 | 169 | 170 | ||||||
Government National Mortgage Assn. Pool #005142 4.50% 8/20/20411 | 12 | 12 | ||||||
Government National Mortgage Assn. Pool #005165 6.50% 8/20/20411 | 83 | 84 | ||||||
Government National Mortgage Assn. Pool #AA5326 3.50% 5/20/20421 | 131 | 119 | ||||||
Government National Mortgage Assn. Pool #MA0366 3.50% 6/20/20421 | 198 | 182 | ||||||
Government National Mortgage Assn. Pool #AD4360 3.50% 7/20/20431 | 90 | 84 | ||||||
Government National Mortgage Assn. Pool #AH5884 4.25% 7/20/20441 | 1,034 | 997 | ||||||
Government National Mortgage Assn. Pool #MA8347 4.50% 10/20/20521 | 800 | 777 | ||||||
Government National Mortgage Assn. Pool #MA8426 4.00% 11/20/20521 | 140 | 133 | ||||||
Government National Mortgage Assn. Pool #MA8427 4.50% 11/20/20521 | 1,852 | 1,798 | ||||||
American Funds Insurance Series 247
Table of Contents
American Funds Mortgage Fund (continued)
Bonds, notes & other debt instruments (continued)
Principal amount (000) | Value (000) | |||||||
Mortgage-backed obligations (continued) | ||||||||
Federal agency mortgage-backed obligations (continued) | ||||||||
Government National Mortgage Assn. Pool #MA8489 4.50% 12/20/20521 | USD | 100 | $ | 97 | ||||
Government National Mortgage Assn. Pool #AN1825 4.619% 6/20/20651 | 195 | 192 | ||||||
Government National Mortgage Assn. Pool #AO0461 4.628% 8/20/20651 | 65 | 64 | ||||||
Government National Mortgage Assn. Pool #AO0409 4.617% 12/20/20651 | 128 | 126 | ||||||
Government National Mortgage Assn. Pool #AO0385 4.498% 1/20/20661 | 519 | 510 | ||||||
Government National Mortgage Assn. Pool #725897 5.20% 1/20/20661 | 1 | 1 | ||||||
Uniform Mortgage-Backed Security 4.00% 1/1/20381,5 | 125 | 122 | ||||||
Uniform Mortgage-Backed Security 2.00% 1/1/20531,5 | 1,191 | 969 | ||||||
Uniform Mortgage-Backed Security 4.50% 1/1/20531,5 | 1,882 | 1,812 | ||||||
Uniform Mortgage-Backed Security 5.50% 1/1/20531,5 | 4,837 | 4,851 | ||||||
Uniform Mortgage-Backed Security 6.00% 1/1/20531,5 | 1,958 | 1,988 | ||||||
Uniform Mortgage-Backed Security 6.50% 1/1/20531,5 | 3,690 | 3,780 | ||||||
Uniform Mortgage-Backed Security 4.00% 2/1/20531,5 | 130 | 122 | ||||||
Uniform Mortgage-Backed Security 6.00% 2/1/20531,5 | 1,132 | 1,148 | ||||||
|
| |||||||
| 68,880 | ||||||||
|
| |||||||
Collateralized mortgage-backed obligations (privately originated) 1.79% | ||||||||
Cascade Funding Mortgage Trust, Series 2020-HB4, Class A, 0.946% 12/26/20301,4,6 | 74 | 72 | ||||||
Cascade Funding Mortgage Trust, Series 2021-HB7, Class A, 1.151% 10/27/20311,4,6 | 95 | 89 | ||||||
Cascade Funding Mortgage Trust, Series 2021-HB6, Class A, 0.898% 6/25/20361,4,6 | 306 | 291 | ||||||
CIM Trust, Series 2022-R2, Class A1, 3.75% 12/25/20611,4,6 | 181 | 171 | ||||||
COLT Mortgage Loan Trust, Series 2021-5, Class A1, 1.726% 11/26/20661,4,6 | 87 | 74 | ||||||
Credit Suisse Mortgage Trust, Series 2017-RPL3, Class A1, 2.00% 1/25/20601,4,6 | 159 | 137 | ||||||
GCAT Trust, Series 2021-NQM6, Class A1, 1.855% 8/25/20661,4,6 | 28 | 24 | ||||||
GS Mortgage-Backed Securities Trust, Series 2022-PJ5, Class A4, 2.50% 10/25/20521,4,6 | 212 | 171 | ||||||
Mello Warehouse Securitization Trust, Series 2021-3, Class A, (1-month USD-LIBOR + 0.85%) 5.239% 11/25/20551,4,6 | 175 | 169 | ||||||
Mill City Mortgage Trust, Series 15-1, Class M2, 3.616% 6/25/20561,4,6 | 38 | 37 | ||||||
Onslow Bay Financial Mortgage Loan Trust, Series 2022-J1, Class A2, 2.50% 2/25/20521,4,6 | 138 | 111 | ||||||
Reverse Mortgage Investment Trust, Series 2021-HB1, Class A, 1.259% 11/25/20311,4,6 | 95 | 89 | ||||||
Towd Point Mortgage Trust, Series 2015-4, Class M2, 3.75% 4/25/20551,4,6 | 100 | 97 | ||||||
Towd Point Mortgage Trust, Series 2015-4, Class M1, 3.75% 4/25/20551,4,6 | 10 | 10 | ||||||
Towd Point Mortgage Trust, Series 2016-5, Class A1, 2.50% 10/25/20561,4,6 | 41 | 41 | ||||||
Towd Point Mortgage Trust, Series 2017-5, Class A1, 4.989% 2/25/20571,4,6 | 10 | 10 | ||||||
|
| |||||||
| 1,593 | ||||||||
|
| |||||||
Commercial mortgage-backed securities 1.05% | ||||||||
BOCA Commercial Mortgage Trust, Series 2022-BOCA, Class A, (1-month USD CME Term SOFR + 1.77%) 6.105% 5/15/20391,4,6 | 100 | 98 | ||||||
BX Trust, Series 2022-CSMO, Class A, (1-month USD CME Term SOFR + 2.115%) | 100 | 99 | ||||||
BX Trust, Series 2021-ARIA, Class A, (1-month USD-LIBOR + 0.899%) 5.217% 10/15/20361,4,6 | 606 | 578 | ||||||
LUXE Commercial Mortgage Trust, Series 2021-TRIP, Class A, (1-month USD-LIBOR + 1.05%) 5.368% 10/15/20381,4,6 | 164 | 158 | ||||||
|
| |||||||
| 933 | ||||||||
|
| |||||||
Total mortgage-backed obligations | 71,406 | |||||||
|
| |||||||
U.S. Treasury bonds & notes 12.04% | ||||||||
U.S. Treasury inflation-protected securities 10.83% | ||||||||
U.S. Treasury Inflation-Protected Security 0.125% 1/15/20237 | 714 | 713 | ||||||
U.S. Treasury Inflation-Protected Security 0.625% 4/15/20237 | 355 | 352 | ||||||
U.S. Treasury Inflation-Protected Security 0.375% 7/15/20237 | 522 | 516 | ||||||
U.S. Treasury Inflation-Protected Security 0.625% 1/15/20243,7 | 3,621 | 3,546 | ||||||
U.S. Treasury Inflation-Protected Security 0.50% 4/15/20247 | 2,024 | 1,970 | ||||||
U.S. Treasury Inflation-Protected Security 0.125% 7/15/20247 | 658 | 637 | ||||||
U.S. Treasury Inflation-Protected Security 0.125% 10/15/20247 | 107 | 104 | ||||||
248 American Funds Insurance Series
Table of Contents
American Funds Mortgage Fund (continued)
Bonds, notes & other debt instruments (continued)
Principal amount (000) | Value (000) | |||||||
U.S. Treasury bonds & notes (continued) | ||||||||
U.S. Treasury inflation-protected securities (continued) | ||||||||
U.S. Treasury Inflation-Protected Security 0.125% 10/15/20267 | USD | 65 | $ | 61 | ||||
U.S. Treasury Inflation-Protected Security 0.125% 1/15/20317 | 1,202 | 1,067 | ||||||
U.S. Treasury Inflation-Protected Security 0.75% 2/15/20427 | 426 | 357 | ||||||
U.S. Treasury Inflation-Protected Security 1.00% 2/15/20497 | 385 | 322 | ||||||
|
| |||||||
| 9,645 | ||||||||
|
| |||||||
U.S. Treasury 1.21% | ||||||||
U.S. Treasury 0.875% 1/31/2024 | 10 | 9 | ||||||
U.S. Treasury 1.25% 8/15/2031 | 443 | 360 | ||||||
U.S. Treasury 1.875% 2/15/2032 | 10 | 8 | ||||||
U.S. Treasury 1.875% 2/15/20413 | 690 | 489 | ||||||
U.S. Treasury 2.375% 2/15/2042 | 150 | 115 | ||||||
U.S. Treasury 3.25% 5/15/2042 | 60 | 53 | ||||||
U.S. Treasury 1.875% 11/15/2051 | 65 | 41 | ||||||
|
| |||||||
| 1,075 | ||||||||
|
| |||||||
Total U.S. Treasury bonds & notes | 10,720 | |||||||
|
| |||||||
Asset-backed obligations 2.68% | ||||||||
Ballyrock CLO, Ltd., Series 2019-2A, Class A1AR, (3-month USD-LIBOR + 1.00%) | 250 | 247 | ||||||
Bankers Healthcare Group Securitization Trust, Series 2021-A, Class A, 1.42% 11/17/20331,6 | 54 | 50 | ||||||
Bankers Healthcare Group Securitization Trust, Series 2021-B, Class A, 0.90% 10/17/20341,6 | 54 | 51 | ||||||
Capital One Multi-Asset Execution Trust, Series 2022-A3, Class A, 4.95% 10/15/20271 | 540 | 545 | ||||||
CF Hippolyta, LLC, Series 2020-1, Class A1, 1.69% 7/15/20601,6 | 286 | 256 | ||||||
CPS Auto Receivables Trust, Series 2022-B, Class A, 2.88% 6/15/20261,6 | 67 | 66 | ||||||
Hertz Vehicle Financing III, LLC, Series 2021-1A, Class A, 1.21% 12/26/20251,6 | 86 | 79 | ||||||
Navient Student Loan Trust, Series 2021-A, Class A, 0.84% 5/15/20691,6 | 116 | 101 | ||||||
Navient Student Loan Trust, Series 2021-C, Class A, 1.06% 10/15/20691,6 | 215 | 183 | ||||||
Nelnet Student Loan Trust, Series 2021-A, Class APT1, 1.36% 4/20/20621,6 | 193 | 171 | ||||||
Nelnet Student Loan Trust, Series 2021-C, Class AFL, (1-month USD-LIBOR + 0.74%) | 160 | 155 | ||||||
New Economy Assets Phase 1 Issuer, LLC, Series 2021-1, Class A1, 1.91% 10/20/20611,6 | 530 | 449 | ||||||
Santander Drive Auto Receivables Trust, Series 2022-6, Class A2, 4.37% 5/15/20251 | 35 | 35 | ||||||
|
| |||||||
| 2,388 | ||||||||
|
| |||||||
Total bonds, notes & other debt instruments (cost: $87,116,000) | 84,514 | |||||||
|
| |||||||
Short-term securities 25.67%
| Weighted average yield at acquisition | ||||||||||||
Commercial paper 14.04% | ||||||||||||
Chariot Funding, LLC 1/27/20236 | 4.150 | % | 2,000 | 1,993 | ||||||||
Citigroup Global Markets, Inc. 2/21/20236 | 4.580 | 2,000 | 1,987 | |||||||||
Henkel of America, Inc. 2/1/20236 | 4.300 | 2,000 | 1,992 | |||||||||
Honeywell International, Inc. 2/1/20236 | 4.100 | 2,000 | 1,992 | |||||||||
Johnson & Johnson 1/30/20236 | 4.190 | 1,000 | 996 | |||||||||
Procter & Gamble Co. 2/9/20236 | 4.300 | 500 | 498 | |||||||||
Procter & Gamble Co. 2/10/20236 | 4.250 | 1,500 | 1,492 | |||||||||
Roche Holdings, Inc. 1/3/20236 | 4.230 | 1,050 | 1,050 | |||||||||
Starbird Funding Corp. 1/3/20236 | 4.300 | 500 | 500 | |||||||||
|
| |||||||||||
| 12,500 | ||||||||||||
|
| |||||||||||
American Funds Insurance Series 249
Table of Contents
American Funds Mortgage Fund (continued)
Short-term securities (continued)
Weighted average yield at acquisition | Principal amount (000) | Value (000) | ||||||||||
Federal agency bills & notes 11.63% | ||||||||||||
Federal Farm Credit Banks 1/12/2023 | 3.880 | % | USD | 4,500 | $ | 4,495 | ||||||
Federal Home Loan Bank 1/11/2023 | 4.120 | 1,500 | 1,498 | |||||||||
Federal Home Loan Bank 2/28/2023 | 4.350 | 1,500 | 1,490 | |||||||||
Federal Home Loan Bank 3/3/2023 | 4.370 | 1,000 | 993 | |||||||||
Federal Home Loan Bank 3/22/2023 | 4.440 | 1,000 | 990 | |||||||||
Federal Home Loan Bank 3/24/2023 | 4.462 | 900 | 891 | |||||||||
|
| |||||||||||
| 10,357 | ||||||||||||
|
| |||||||||||
Total short-term securities (cost: $22,859,000) | 22,857 | |||||||||||
|
| |||||||||||
Total investment securities 120.58% (cost: $109,975,000) | 107,371 | |||||||||||
Other assets less liabilities (20.58)% | (18,328 | ) | ||||||||||
|
| |||||||||||
Net assets 100.00% | $ | 89,043 | ||||||||||
|
| |||||||||||
| Futures contracts | ||||||||||||||||||||
Contracts | Type | Number of contracts | Expiration | Notional amount (000) | Value and unrealized appreciation (depreciation) at 12/31/2022 (000) | |||||||||||||||
3 Month SOFR Futures | Short | 12 | June 2023 | USD | (2,853 | ) | $ | 49 | ||||||||||||
2 Year U.S. Treasury Note Futures | Short | 5 | March 2023 | (1,025 | ) | (1 | ) | |||||||||||||
5 Year U.S. Treasury Note Futures | Long | 144 | March 2023 | 15,542 | (19 | ) | ||||||||||||||
10 Year Ultra U.S. Treasury Note Futures | Long | 47 | March 2023 | 5,559 | (60 | ) | ||||||||||||||
10 Year U.S. Treasury Note Futures | Long | 5 | March 2023 | 562 | (3 | ) | ||||||||||||||
20 Year U.S. Treasury Bond Futures | Long | 18 | March 2023 | 2,256 | (28 | ) | ||||||||||||||
30 Year Ultra U.S. Treasury Bond Futures | Long | 12 | March 2023 | 1,612 | (13 | ) | ||||||||||||||
|
| |||||||||||||||||||
| $ | (75 | ) | ||||||||||||||||||
|
| |||||||||||||||||||
Swap contracts | | Expiration date |
| | Notional amount (000) |
| | Value at 12/31/2022 (000) |
| | Upfront premium paid (000) |
| | Unrealized appreciation at 12/31/2022 (000) |
| |||||||||||||||
Interest rate swaps | ||||||||||||||||||||||||||||||
Centrally cleared interest rate swaps | ||||||||||||||||||||||||||||||
Receive | Pay | |||||||||||||||||||||||||||||
Rate | Payment frequency | Rate | Payment frequency | |||||||||||||||||||||||||||
3-month USD-LIBOR | Quarterly | 0.81 | % | Semi-annual | 7/28/2045 | USD | 1,800 | $ | 795 | $ | 5 | $ | 790 | |||||||||||||||||
| 1 | Principal payments may be made periodically. Therefore, the effective maturity date may be earlier than the stated maturity date. |
| 2 | Amount less than one thousand. |
| 3 | All or a portion of this security was pledged as collateral. The total value of pledged collateral was $692,000, which represented .78% of the net assets of the fund. |
| 4 | Coupon rate may change periodically. Reference rate and spread are as of the most recent information available. Some coupon rates are determined by the issuer or agent based on current market conditions; therefore, the reference rate and spread are not available. |
| 5 | Purchased on a TBA basis. |
| 6 | Acquired in a transaction exempt from registration under Rule 144A or, for commercial paper, Section 4(a)(2) of the Securities Act of 1933. May be resold in the U.S. in transactions exempt from registration, normally to qualified institutional buyers. The total value of all such securities was $16,834,000, which represented 18.91% of the net assets of the fund. |
| 7 | Index-linked bond whose principal amount moves with a government price index. |
250 American Funds Insurance Series
Table of Contents
American Funds Mortgage Fund (continued)
Key to abbreviations
Assn. = Association
CLO = Collateralized Loan Obligations
CME = CME Group
LIBOR = London Interbank Offered Rate
SOFR = Secured Overnight Financing Rate
TBA = To be announced
USD = U.S. dollars
Refer to the notes to financial statements.
American Funds Insurance Series 251
Table of Contents
Investment portfolio December 31, 2022
Short-term securities 97.99%
Weighted average yield at acquisition | Principal amount (000) | Value (000) | ||||||||||
Commercial paper 76.48% | ||||||||||||
British Columbia (Province of) 3/6/2023 | 4.470 | % | USD | 7,400 | $ | 7,339 | ||||||
CAFCO, LLC 2/3/20231 | 4.300 | 1,250 | 1,245 | |||||||||
Caisse des Dépôts et Consignations 3/9/2023 | 4.490 | 12,000 | 11,899 | |||||||||
Canadian Imperial Holdings, Inc. 1/9/2023 | 4.080 | 10,000 | 9,988 | |||||||||
Chariot Funding, LLC 1/23/20231 | 4.400 | 5,000 | 4,985 | |||||||||
CHARTA, LLC 1/17/20231 | 4.330 | 10,000 | 9,978 | |||||||||
DBS Bank, Ltd. 3/14/20231 | 4.548 | 10,000 | 9,906 | |||||||||
DNB Bank ASA 3/13/20231 | 4.535 | 13,000 | 12,885 | |||||||||
Export Development Canada 2/6/2023 | 4.300 | 11,810 | 11,756 | |||||||||
Fairway Finance Company, LLC 1/18/20231 | 4.250 | 4,000 | 3,991 | |||||||||
Gotham Funding Corp. 1/10/20231 | 4.200 | 3,000 | 2,996 | |||||||||
Gotham Funding Corp. 3/28/20231 | 4.600 | 10,000 | 9,883 | |||||||||
Johnson & Johnson 2/27/20231 | 4.330 | 8,700 | 8,637 | |||||||||
Johnson & Johnson 3/6/20231 | 4.430 | 5,000 | 4,959 | |||||||||
KfW 2/15/20231 | 4.380 | 12,000 | 11,932 | |||||||||
Komatsu Finance America, Inc. 1/13/20231 | 4.330 | 5,000 | 4,992 | |||||||||
Komatsu Finance America, Inc. 1/18/20231 | 4.200 | 4,000 | 3,991 | |||||||||
Liberty Street Funding, LLC 1/18/20231 | 4.400 | 10,850 | 10,825 | |||||||||
Linde, Inc. 1/5/2023 | 4.010 | 13,000 | 12,991 | |||||||||
LMA-Americas, LLC 1/27/20231 | 4.300 | 10,000 | 9,966 | |||||||||
L’Oréal USA, Inc. 1/26/20231 | 4.240 | 10,000 | 9,967 | |||||||||
LVMH Moët Hennessy Louis Vuitton, Inc. 2/6/20231 | 4.400 | 10,000 | 9,953 | |||||||||
Manhattan Asset Funding Company, LLC 3/24/20231 | 4.650 | 9,700 | 9,596 | |||||||||
Mizuho Bank, Ltd. 1/31/20231 | 4.405 | 12,000 | 11,954 | |||||||||
Nestlé Finance International, Ltd. 1/19/20231 | 4.280 | 6,000 | 5,986 | |||||||||
NRW.Bank 3/8/20231 | 4.450 | 8,250 | 8,181 | |||||||||
Oesterreichische Kontrollbank 2/15/2023 | 4.390 | 13,000 | 12,926 | |||||||||
Procter & Gamble Co. 2/10/20231 | 4.250 | 13,050 | 12,984 | |||||||||
Québec (Province of) 2/1/20231 | 4.230 | 10,000 | 9,960 | |||||||||
Siemens Capital Co., LLC 1/18/20231 | 4.080 | 8,000 | 7,982 | |||||||||
Stadshypotek AB Handelsbanken, Inc. 1/18/20231 | 4.150 | 6,500 | 6,485 | |||||||||
Starbird Funding Corp. 1/3/20231 | 4.300 | 11,000 | 10,995 | |||||||||
Sumitomo Mitsui Trust Bank, Ltd. 2/3/20231 | 4.300 | 9,000 | 8,962 | |||||||||
Sumitomo Mitsui Trust Bank, Ltd. 2/7/20231 | 4.600 | 6,000 | 5,972 | |||||||||
Toronto-Dominion Bank 1/20/20231 | 4.300 | 10,000 | 9,975 | |||||||||
TotalEnergies Capital Canada, Ltd. 1/3/20231 | 4.280 | 13,000 | 12,994 | |||||||||
Toyota Credit de Puerto Rico Corp. 1/17/2023 | 4.340 | 3,550 | 3,542 | |||||||||
Toyota Industries Commercial Finance, Inc. 1/23/20231 | 4.120 | 1,100 | 1,097 | |||||||||
Toyota Industries Commercial Finance, Inc. 3/6/20231 | 4.450 | 6,000 | 5,951 | |||||||||
|
| |||||||||||
| 330,606 | ||||||||||||
|
| |||||||||||
Federal agency bills & notes 21.51% | ||||||||||||
Federal Home Loan Bank 2/1/2023 | 4.130 | 15,000 | 14,951 | |||||||||
Federal Home Loan Bank 2/15/2023 | 4.300 | 4,800 | 4,775 | |||||||||
Federal Home Loan Bank 2/17/2023 | 4.314 | 36,317 | 36,123 | |||||||||
Federal Home Loan Bank 2/22/2023 | 4.357 | 23,290 | 23,149 | |||||||||
Federal Home Loan Bank 3/3/2023 | 4.370 | 5,300 | 5,262 | |||||||||
Federal Home Loan Bank 3/22/2023 | 4.440 | 6,000 | 5,942 | |||||||||
Federal Home Loan Bank 3/24/2023 | 4.462 | 2,800 | 2,771 | |||||||||
|
| |||||||||||
| 92,973 | ||||||||||||
|
| |||||||||||
Total short-term securities (cost: $423,636,000) | 423,579 | |||||||||||
|
| |||||||||||
Total investment securities 97.99% (cost: $423,636,000) | 423,579 | |||||||||||
Other assets less liabilities 2.01% | 8,682 | |||||||||||
|
| |||||||||||
Net assets 100.00% | $ | 432,261 | ||||||||||
|
| |||||||||||
| 1 | Acquired in a transaction exempt from registration under Rule 144A or, for commercial paper, Section 4(a)(2) of the Securities Act of 1933. May be resold in the U.S. in transactions exempt from registration, normally to qualified institutional buyers. The total value of all such securities was $260,165,000, which represented 60.19% of the net assets of the fund. |
252 American Funds Insurance Series
Table of Contents
Ultra-Short Bond Fund (continued)
Key to abbreviations
USD = U.S. dollars
Refer to the notes to financial statements.
American Funds Insurance Series 253
Table of Contents
U.S. Government Securities Fund
Investment portfolio December 31, 2022
Bonds, notes & other debt instruments 93.28%
Principal amount (000) | Value (000) | |||||||
Mortgage-backed obligations 48.21% | ||||||||
Federal agency mortgage-backed obligations 48.21% | ||||||||
Fannie Mae Pool #406607 6.50% 8/1/20241 | USD | 10 | $ | 11 | ||||
Fannie Mae Pool #735070 6.50% 10/1/20241 | 1 | 1 | ||||||
Fannie Mae Pool #745316 6.50% 2/1/20261 | 56 | 58 | ||||||
Fannie Mae Pool #AL9870 6.50% 2/1/20281 | 45 | 46 | ||||||
Fannie Mae Pool #695412 5.00% 6/1/20331 | 1 | 1 | ||||||
Fannie Mae Pool #AD3566 5.00% 10/1/20351 | 6 | 6 | ||||||
Fannie Mae Pool #MA2588 4.00% 4/1/20361 | 666 | 642 | ||||||
Fannie Mae Pool #MA2746 4.00% 9/1/20361 | 1,376 | 1,326 | ||||||
Fannie Mae Pool #940890 6.50% 6/1/20371 | — | 2 | — | 2 | ||||
Fannie Mae Pool #256828 7.00% 7/1/20371 | 3 | 3 | ||||||
Fannie Mae Pool #256860 6.50% 8/1/20371 | 11 | 11 | ||||||
Fannie Mae Pool #888698 7.00% 10/1/20371 | 13 | 14 | ||||||
Fannie Mae Pool #970343 6.00% 2/1/20381 | 14 | 14 | ||||||
Fannie Mae Pool #931768 5.00% 8/1/20391 | 5 | 6 | ||||||
Fannie Mae Pool #AC0794 5.00% 10/1/20391 | 20 | 20 | ||||||
Fannie Mae Pool #932606 5.00% 2/1/20401 | 9 | 9 | ||||||
Fannie Mae Pool #AI1862 5.00% 5/1/20411 | 372 | 376 | ||||||
Fannie Mae Pool #AI3510 5.00% 6/1/20411 | 205 | 207 | ||||||
Fannie Mae Pool #AE1248 5.00% 6/1/20411 | 33 | 33 | ||||||
Fannie Mae Pool #AJ0704 5.00% 9/1/20411 | 174 | 176 | ||||||
Fannie Mae Pool #AJ1873 4.00% 10/1/20411 | 26 | 25 | ||||||
Fannie Mae Pool #AJ5391 5.00% 11/1/20411 | 125 | 127 | ||||||
Fannie Mae Pool #AE1277 5.00% 11/1/20411 | 18 | 18 | ||||||
Fannie Mae Pool #MA4501 2.00% 12/1/20411 | 2,961 | 2,500 | ||||||
Fannie Mae Pool #AE1283 5.00% 12/1/20411 | 10 | 10 | ||||||
Fannie Mae Pool #MA4540 2.00% 2/1/20421 | 1,366 | 1,153 | ||||||
Fannie Mae Pool #AE1290 5.00% 2/1/20421 | 18 | 18 | ||||||
Fannie Mae Pool #MA4570 2.00% 3/1/20421 | 884 | 746 | ||||||
Fannie Mae Pool #AT0300 3.50% 3/1/20431 | 5 | 5 | ||||||
Fannie Mae Pool #AT3954 3.50% 4/1/20431 | 8 | 7 | ||||||
Fannie Mae Pool #AT7161 3.50% 6/1/20431 | 41 | 39 | ||||||
Fannie Mae Pool #AY1829 3.50% 12/1/20441 | 8 | 7 | ||||||
Fannie Mae Pool #BE5017 3.50% 2/1/20451 | 63 | 59 | ||||||
Fannie Mae Pool #FM9416 3.50% 7/1/20451 | 4,487 | 4,155 | ||||||
Fannie Mae Pool #BE8740 3.50% 5/1/20471 | 57 | 53 | ||||||
Fannie Mae Pool #BE8742 3.50% 5/1/20471 | 17 | 15 | ||||||
Fannie Mae Pool #BH2846 3.50% 5/1/20471 | 8 | 7 | ||||||
Fannie Mae Pool #BH2848 3.50% 5/1/20471 | 7 | 6 | ||||||
Fannie Mae Pool #BH2847 3.50% 5/1/20471 | 5 | 5 | ||||||
Fannie Mae Pool #BH3122 4.00% 6/1/20471 | 5 | 5 | ||||||
Fannie Mae Pool #BJ5015 4.00% 12/1/20471 | 154 | 148 | ||||||
Fannie Mae Pool #BM3788 3.50% 3/1/20481 | 3,243 | 3,018 | ||||||
Fannie Mae Pool #BJ4901 3.50% 3/1/20481 | 43 | 40 | ||||||
Fannie Mae Pool #BK5232 4.00% 5/1/20481 | 79 | 75 | ||||||
Fannie Mae Pool #BK6840 4.00% 6/1/20481 | 106 | 102 | ||||||
Fannie Mae Pool #BK9743 4.00% 8/1/20481 | 31 | 30 | ||||||
Fannie Mae Pool #BK9761 4.50% 8/1/20481 | 20 | 20 | ||||||
Fannie Mae Pool #FM3280 3.50% 5/1/20491 | 1,170 | 1,084 | ||||||
Fannie Mae Pool #FM1062 3.50% 6/1/20491 | 436 | 408 | ||||||
Fannie Mae Pool #BJ8411 3.50% 8/1/20491 | 113 | 105 | ||||||
Fannie Mae Pool #CA4151 3.50% 9/1/20491 | 582 | 545 | ||||||
Fannie Mae Pool #FM1443 3.50% 9/1/20491 | 326 | 304 | ||||||
Fannie Mae Pool #FM2179 3.00% 1/1/20501 | 3,675 | 3,277 | ||||||
Fannie Mae Pool #CA6593 2.50% 8/1/20501 | 926 | 798 | ||||||
Fannie Mae Pool #BQ3005 2.50% 10/1/20501 | 604 | 514 | ||||||
Fannie Mae Pool #CA7257 2.50% 10/1/20501 | 195 | 168 | ||||||
Fannie Mae Pool #MA4208 2.00% 12/1/20501 | 228 | 187 | ||||||
Fannie Mae Pool #CB0290 2.00% 4/1/20511 | 926 | 757 | ||||||
Fannie Mae Pool #MA4305 2.00% 4/1/20511 | 11 | 9 | ||||||
Fannie Mae Pool #BR1035 2.00% 5/1/20511 | 6 | 5 | ||||||
Fannie Mae Pool #FM7687 3.00% 6/1/20511 | 5,752 | 5,108 | ||||||
254 American Funds Insurance Series
Table of Contents
U.S. Government Securities Fund (continued)
Bonds, notes & other debt instruments (continued)
Principal amount (000) | Value (000) | |||||||
Mortgage-backed obligations (continued) | ||||||||
Federal agency mortgage-backed obligations (continued) | ||||||||
Fannie Mae Pool #FM7900 2.50% 7/1/20511 | USD | 195 | $ | 167 | ||||
Fannie Mae Pool #CB1527 2.50% 9/1/20511 | 702 | 596 | ||||||
Fannie Mae Pool #FS0965 2.00% 11/1/20511 | 51 | 41 | ||||||
Fannie Mae Pool #BU3058 2.50% 12/1/20511 | 1,512 | 1,284 | ||||||
Fannie Mae Pool #CB2286 2.50% 12/1/20511 | 1,266 | 1,082 | ||||||
Fannie Mae Pool #FM9976 3.00% 12/1/20511 | 845 | 755 | ||||||
Fannie Mae Pool #CB2544 3.00% 1/1/20521 | 2,361 | 2,088 | ||||||
Fannie Mae Pool #FS0523 2.50% 2/1/20521 | 199 | 171 | ||||||
Fannie Mae Pool #FS0647 3.00% 2/1/20521 | 3,881 | 3,465 | ||||||
Fannie Mae Pool #CB3495 3.00% 5/1/20521 | 5,807 | 5,103 | ||||||
Fannie Mae Pool #MA4600 3.50% 5/1/20521 | 17,861 | 16,244 | ||||||
Fannie Mae Pool #CB3897 3.50% 6/1/20521 | 17,000 | 15,465 | ||||||
Fannie Mae Pool #CB3774 4.00% 6/1/20521 | 3,250 | 3,052 | ||||||
Fannie Mae Pool #FS2159 5.00% 6/1/20521 | 64 | 63 | ||||||
Fannie Mae Pool #BV2558 5.00% 6/1/20521 | 62 | 61 | ||||||
Fannie Mae Pool #CB4159 4.00% 7/1/20521 | 234 | 220 | ||||||
Fannie Mae Pool #MA4700 4.00% 8/1/20521 | 6,346 | 5,959 | ||||||
Fannie Mae Pool #BV8024 4.00% 8/1/20521 | 296 | 278 | ||||||
Fannie Mae Pool #BW9411 5.00% 8/1/20521 | 926 | 914 | ||||||
Fannie Mae Pool #FS2489 5.00% 8/1/20521 | 60 | 59 | ||||||
Fannie Mae Pool #MA4732 4.00% 9/1/20521 | 2,012 | 1,890 | ||||||
Fannie Mae Pool #BW7326 4.00% 9/1/20521 | 254 | 238 | ||||||
Fannie Mae Pool #BW9348 4.00% 9/1/20521 | 219 | 206 | ||||||
Fannie Mae Pool #BW8103 4.00% 9/1/20521 | 208 | 195 | ||||||
Fannie Mae Pool #BW1192 4.50% 9/1/20521 | 1,848 | 1,780 | ||||||
Fannie Mae Pool #BW6231 4.50% 9/1/20521 | 223 | 215 | ||||||
Fannie Mae Pool #BW1201 5.00% 9/1/20521 | 4,200 | 4,146 | ||||||
Fannie Mae Pool #BV0954 5.00% 9/1/20521 | 1,797 | 1,774 | ||||||
Fannie Mae Pool #BW8088 5.00% 9/1/20521 | 327 | 323 | ||||||
Fannie Mae Pool #BW8980 4.00% 10/1/20521 | 821 | 771 | ||||||
Fannie Mae Pool #BW1210 4.00% 10/1/20521 | 620 | 582 | ||||||
Fannie Mae Pool #BW7356 4.00% 10/1/20521 | 516 | 484 | ||||||
Fannie Mae Pool #BX0509 4.00% 10/1/20521 | 222 | 209 | ||||||
Fannie Mae Pool #MA4784 4.50% 10/1/20521 | 5,035 | 4,851 | ||||||
Fannie Mae Pool #BW9458 4.50% 10/1/20521 | 999 | 965 | ||||||
Fannie Mae Pool #BX0097 4.50% 10/1/20521 | 998 | 962 | ||||||
Fannie Mae Pool #BW8981 4.50% 10/1/20521 | 995 | 958 | ||||||
Fannie Mae Pool #BW8996 4.50% 10/1/20521 | 994 | 958 | ||||||
Fannie Mae Pool #CB4959 4.50% 10/1/20521 | 993 | 956 | ||||||
Fannie Mae Pool #BX0902 5.00% 10/1/20521 | 916 | 904 | ||||||
Fannie Mae Pool #CB5380 5.00% 10/1/20521 | 478 | 472 | ||||||
Fannie Mae Pool #BX0892 5.00% 10/1/20521 | 102 | 101 | ||||||
Fannie Mae Pool #MA4820 6.50% 10/1/20521 | 300 | 308 | ||||||
Fannie Mae Pool #MA4803 3.50% 11/1/20521 | 612 | 557 | ||||||
Fannie Mae Pool #MA4804 4.00% 11/1/20521 | 2,492 | 2,340 | ||||||
Fannie Mae Pool #BW1310 4.00% 11/1/20521 | 232 | 218 | ||||||
Fannie Mae Pool #BX1766 5.00% 11/1/20521 | 1,900 | 1,875 | ||||||
Fannie Mae Pool #MA4806 5.00% 11/1/20521 | 1,313 | 1,296 | ||||||
Fannie Mae Pool #BX1761 5.00% 11/1/20521 | 921 | 909 | ||||||
Fannie Mae Pool #BX1274 5.50% 11/1/20521 | 165 | 166 | ||||||
Fannie Mae Pool #MA4852 6.50% 11/1/20521 | 244 | 251 | ||||||
Fannie Mae Pool #MA4840 4.50% 12/1/20521 | 995 | 959 | ||||||
Fannie Mae Pool #BX1072 5.00% 12/1/20521 | 1,943 | 1,918 | ||||||
Fannie Mae Pool #BX4020 5.00% 12/1/20521 | 29 | 29 | ||||||
Fannie Mae Pool #MA4877 6.50% 12/1/20521 | 39,345 | 40,362 | ||||||
Fannie Mae Pool #BX1071 6.50% 12/1/20521 | 82 | 85 | ||||||
Fannie Mae Pool #MA4868 5.00% 1/1/20531 | 1,457 | 1,438 | ||||||
Fannie Mae Pool #MA4894 6.00% 1/1/20531 | 2,000 | 2,032 | ||||||
Fannie Mae Pool #MA4895 6.50% 1/1/20531 | 8,828 | 9,056 | ||||||
Fannie Mae Pool #BF0497 3.00% 7/1/20601 | 1,429 | 1,252 | ||||||
Fannie Mae Pool #BF0585 4.50% 12/1/20611 | 459 | 448 | ||||||
American Funds Insurance Series 255
Table of Contents
U.S. Government Securities Fund (continued)
Bonds, notes & other debt instruments (continued)
Principal amount (000) | Value (000) | |||||||
Mortgage-backed obligations (continued) | ||||||||
Federal agency mortgage-backed obligations (continued) | ||||||||
Fannie Mae, Series 2001-4, Class GA, 9.00% 4/17/20251,3 | USD | — | 2 | $ | — | 2 | ||
Fannie Mae, Series 2001-4, Class NA, 9.00% 10/25/20251,3 | — | 2 | — | 2 | ||||
Fannie Mae, Series 2014-M1, Class A2, Multi Family, 3.298% 7/25/20231,3 | 186 | 185 | ||||||
Fannie Mae, Series 2014-M3, Class A2, Multi Family, 3.501% 1/25/20241,3 | 368 | 361 | ||||||
Freddie Mac Pool #ZA2024 6.50% 9/1/20271 | 2 | 2 | ||||||
Freddie Mac Pool #1H1354 4.336% 11/1/20361,3 | 53 | 54 | ||||||
Freddie Mac Pool #C03518 5.00% 9/1/20401 | 279 | 283 | ||||||
Freddie Mac Pool #G06459 5.00% 5/1/20411 | 660 | 669 | ||||||
Freddie Mac Pool #RB5138 2.00% 12/1/20411 | 794 | 670 | ||||||
Freddie Mac Pool #RB5145 2.00% 2/1/20421 | 772 | 651 | ||||||
Freddie Mac Pool #RB5148 2.00% 3/1/20421 | 1,823 | 1,538 | ||||||
Freddie Mac Pool #Q15874 4.00% 2/1/20431 | 3 | 3 | ||||||
Freddie Mac Pool #Q17696 3.50% 4/1/20431 | 30 | 28 | ||||||
Freddie Mac Pool #Q19133 3.50% 6/1/20431 | 31 | 29 | ||||||
Freddie Mac Pool #Q23190 4.00% 11/1/20431 | 145 | 140 | ||||||
Freddie Mac Pool #Q28558 3.50% 9/1/20441 | 208 | 194 | ||||||
Freddie Mac Pool #760014 2.74% 8/1/20451,3 | 268 | 259 | ||||||
Freddie Mac Pool #Q47615 3.50% 4/1/20471 | 50 | 46 | ||||||
Freddie Mac Pool #Q52069 3.50% 11/1/20471 | 78 | 72 | ||||||
Freddie Mac Pool #Q54701 3.50% 3/1/20481 | 57 | 53 | ||||||
Freddie Mac Pool #Q54709 3.50% 3/1/20481 | 56 | 52 | ||||||
Freddie Mac Pool #Q54700 3.50% 3/1/20481 | 40 | 38 | ||||||
Freddie Mac Pool #Q54781 3.50% 3/1/20481 | 35 | 33 | ||||||
Freddie Mac Pool #Q54782 3.50% 3/1/20481 | 34 | 32 | ||||||
Freddie Mac Pool #Q54699 3.50% 3/1/20481 | 22 | 20 | ||||||
Freddie Mac Pool #Q54831 3.50% 3/1/20481 | 17 | 16 | ||||||
Freddie Mac Pool #Q54698 3.50% 3/1/20481 | 14 | 14 | ||||||
Freddie Mac Pool #G67711 4.00% 3/1/20481 | 1,407 | 1,351 | ||||||
Freddie Mac Pool #Q55971 4.00% 5/1/20481 | 78 | 75 | ||||||
Freddie Mac Pool #Q56175 4.00% 5/1/20481 | 74 | 71 | ||||||
Freddie Mac Pool #Q56590 3.50% 6/1/20481 | 27 | 25 | ||||||
Freddie Mac Pool #Q56589 3.50% 6/1/20481 | 17 | 16 | ||||||
Freddie Mac Pool #Q56599 4.00% 6/1/20481 | 114 | 109 | ||||||
Freddie Mac Pool #Q58411 4.50% 9/1/20481 | 204 | 202 | ||||||
Freddie Mac Pool #Q58436 4.50% 9/1/20481 | 110 | 109 | ||||||
Freddie Mac Pool #Q58378 4.50% 9/1/20481 | 80 | 79 | ||||||
Freddie Mac Pool #ZT0522 4.50% 9/1/20481 | 21 | 21 | ||||||
Freddie Mac Pool #QA0284 3.50% 6/1/20491 | 194 | 180 | ||||||
Freddie Mac Pool #QA2748 3.50% 9/1/20491 | 51 | 48 | ||||||
Freddie Mac Pool #RA1463 3.50% 10/1/20491 | 393 | 368 | ||||||
Freddie Mac Pool #RA1580 3.50% 10/1/20491 | 204 | 191 | ||||||
Freddie Mac Pool #SD8106 2.00% 11/1/20501 | 2,906 | 2,379 | ||||||
Freddie Mac Pool #SD8128 2.00% 2/1/20511 | 37 | 30 | ||||||
Freddie Mac Pool #SD8134 2.00% 3/1/20511 | 62 | 51 | ||||||
Freddie Mac Pool #RA5288 2.00% 5/1/20511 | 2,959 | 2,422 | ||||||
Freddie Mac Pool #SD0726 2.50% 10/1/20511 | 14,344 | 12,316 | ||||||
Freddie Mac Pool #RA6406 2.00% 11/1/20511 | 488 | 400 | ||||||
Freddie Mac Pool #SD1385 2.50% 11/1/20511 | 531 | 456 | ||||||
Freddie Mac Pool #SD7552 2.50% 1/1/20521 | 333 | 285 | ||||||
Freddie Mac Pool #SD7550 3.00% 2/1/20521 | 3,397 | 3,035 | ||||||
Freddie Mac Pool #SD0873 3.50% 2/1/20521 | 14,059 | 13,011 | ||||||
Freddie Mac Pool #QD7089 3.50% 2/1/20521 | 216 | 197 | ||||||
Freddie Mac Pool #SD7553 3.00% 3/1/20521 | 308 | 274 | ||||||
Freddie Mac Pool #8D0226 2.521% 5/1/20521,3 | 513 | 462 | ||||||
Freddie Mac Pool #QE6097 2.50% 7/1/20521 | 635 | 539 | ||||||
Freddie Mac Pool #SD8237 4.00% 8/1/20521 | 4,913 | 4,613 | ||||||
Freddie Mac Pool #QE9057 4.00% 8/1/20521 | 189 | 178 | ||||||
Freddie Mac Pool #QE6926 5.00% 8/1/20521 | 862 | 851 | ||||||
Freddie Mac Pool #QE8282 5.00% 8/1/20521 | 817 | 806 | ||||||
Freddie Mac Pool #QE8695 5.00% 8/1/20521 | 59 | 58 | ||||||
Freddie Mac Pool #QE7647 5.00% 8/1/20521 | 58 | 57 | ||||||
256 American Funds Insurance Series
Table of Contents
U.S. Government Securities Fund (continued)
Bonds, notes & other debt instruments (continued)
Principal amount (000) | Value (000) | |||||||
Mortgage-backed obligations (continued) | ||||||||
Federal agency mortgage-backed obligations (continued) | ||||||||
Freddie Mac Pool #SD1496 5.00% 8/1/20521 | USD | 54 | $ | 54 | ||||
Freddie Mac Pool #SD8244 4.00% 9/1/20521 | 3,275 | 3,076 | ||||||
Freddie Mac Pool #QE9625 4.00% 9/1/20521 | 244 | 229 | ||||||
Freddie Mac Pool #QF0671 4.50% 9/1/20521 | 503 | 485 | ||||||
Freddie Mac Pool #RA7938 5.00% 9/1/20521 | 11,870 | 11,717 | ||||||
Freddie Mac Pool #QF0311 5.00% 9/1/20521 | 1,324 | 1,307 | ||||||
Freddie Mac Pool #QF0151 5.00% 9/1/20521 | 799 | 789 | ||||||
Freddie Mac Pool #SD8246 5.00% 9/1/20521 | 225 | 222 | ||||||
Freddie Mac Pool #QF0706 5.00% 9/1/20521 | 64 | 64 | ||||||
Freddie Mac Pool #QF1464 4.00% 10/1/20521 | 234 | 220 | ||||||
Freddie Mac Pool #QF2136 4.50% 10/1/20521 | 999 | 962 | ||||||
Freddie Mac Pool #QF1431 4.50% 10/1/20521 | 999 | 962 | ||||||
Freddie Mac Pool #QF1765 4.50% 10/1/20521 | 995 | 958 | ||||||
Freddie Mac Pool #SD8257 4.50% 10/1/20521 | 743 | 716 | ||||||
Freddie Mac Pool #QF1305 5.00% 10/1/20521 | 74 | 73 | ||||||
Freddie Mac Pool #SD1710 5.00% 10/1/20521 | 26 | 26 | ||||||
Freddie Mac Pool #QF3364 4.00% 11/1/20521 | 381 | 358 | ||||||
Freddie Mac Pool #QF2445 4.50% 11/1/20521 | 4,769 | 4,595 | ||||||
Freddie Mac Pool #SD1895 4.50% 11/1/20521 | 1,272 | 1,249 | ||||||
Freddie Mac Pool #QF2560 4.50% 11/1/20521 | 999 | 965 | ||||||
Freddie Mac Pool #QF2846 4.50% 11/1/20521 | 998 | 961 | ||||||
Freddie Mac Pool #QF2936 4.50% 11/1/20521 | 969 | 934 | ||||||
Freddie Mac Pool #QF2976 5.00% 11/1/20521 | 81 | 80 | ||||||
Freddie Mac Pool #SD8275 4.50% 12/1/20521 | 36,151 | 34,831 | ||||||
Freddie Mac Pool #SD8276 5.00% 12/1/20521 | 1,866 | 1,842 | ||||||
Freddie Mac Pool #SD8281 6.50% 12/1/20521 | 2,000 | 2,052 | ||||||
Freddie Mac Pool #SD8285 3.50% 1/1/20531 | 346 | 314 | ||||||
Freddie Mac Pool #SD8286 4.00% 1/1/20531 | 199 | 187 | ||||||
Freddie Mac Pool #SD8288 5.00% 1/1/20531 | 7,348 | 7,253 | ||||||
Freddie Mac Pool #SD8282 6.50% 1/1/20531 | 10,431 | 10,701 | ||||||
Freddie Mac, Series 1567, Class A, (1-month USD-LIBOR + 0.40%) 2.547% 8/15/20231,3 | 1 | 1 | ||||||
Freddie Mac, Series K029, Class A2, Multi Family, 3.32% 2/25/20231 | 134 | 133 | ||||||
Freddie Mac, Series K035, Class A2, Multi Family, 3.458% 8/25/20231,3 | 2,526 | 2,502 | ||||||
Freddie Mac, Series K040, Class A2, Multi Family, 3.241% 9/25/20241 | 1,363 | 1,328 | ||||||
Freddie Mac Seasoned Credit Risk Transfer Trust, Series 2017-1, Class HA, 3.00% 1/25/20561,3 | 4,525 | 4,234 | ||||||
Freddie Mac Seasoned Credit Risk Transfer Trust, Series 2017-3, Class MT, 3.00% 7/25/20561 | 822 | 724 | ||||||
Freddie Mac Seasoned Credit Risk Transfer Trust, Series 2017-3, Class HT, 3.25% 7/25/20561 | 333 | 300 | ||||||
Freddie Mac Seasoned Credit Risk Transfer Trust, Series 2017-2, Class MA, 3.00% 8/25/20561 | 4,525 | 4,204 | ||||||
Freddie Mac Seasoned Credit Risk Transfer Trust, Series 2017-2, Class HA, 3.00% 8/25/20561,3 | 4,135 | 3,866 | ||||||
Freddie Mac Seasoned Credit Risk Transfer Trust, Series 2018-1, Class HT, 3.00% 5/25/20571 | 910 | 800 | ||||||
Freddie Mac Seasoned Credit Risk Transfer Trust, Series 2017-4, Class HT, 3.25% 6/25/20571,3 | 1,311 | 1,197 | ||||||
Freddie Mac Seasoned Credit Risk Transfer Trust, Series 2018-3, Class MA, 3.50% 8/25/20571 | 509 | 484 | ||||||
Freddie Mac Seasoned Credit Risk Transfer Trust, Series 2018-2, Class MT, 3.50% 11/25/20571 | 4,148 | 3,753 | ||||||
Freddie Mac Seasoned Credit Risk Transfer Trust, Series 2018-2, Class MA, 3.50% 11/26/20571 | 252 | 239 | ||||||
Freddie Mac Seasoned Credit Risk Transfer Trust, Series 2019-1, Class MT, 3.50% 7/25/20581 | 763 | 689 | ||||||
Freddie Mac Seasoned Credit Risk Transfer Trust, Series 2019-1, Class MA, 3.50% 7/25/20581 | 587 | 556 | ||||||
Freddie Mac Seasoned Credit Risk Transfer Trust, Series 2019-2, Class MA, 3.50% 8/25/20581 | 2,148 | 2,027 | ||||||
American Funds Insurance Series 257
Table of Contents
U.S. Government Securities Fund (continued)
Bonds, notes & other debt instruments (continued)
Principal amount (000) | Value (000) | |||||||
Mortgage-backed obligations (continued) | ||||||||
Federal agency mortgage-backed obligations (continued) | ||||||||
Freddie Mac Seasoned Credit Risk Transfer Trust, Series 2019-2, Class MT, 3.50% 8/26/20581 | USD | 731 | $ | 661 | ||||
Freddie Mac Seasoned Credit Risk Transfer Trust, Series 2019-3, Class MT, 3.50% 10/25/20581 | 396 | 358 | ||||||
Freddie Mac Seasoned Credit Risk Transfer Trust, Series 2019-4, Class MA, 3.00% 2/25/20591 | 1,819 | 1,687 | ||||||
Freddie Mac Seasoned Loan Structured Transaction Trust, Series 2018-1, Class A1, 3.50% 6/25/20281 | 4,262 | 4,070 | ||||||
Freddie Mac Seasoned Loan Structured Transaction Trust, Series 2018-2, Class A1, 3.50% 11/25/20281 | 18,482 | 17,646 | ||||||
Freddie Mac Seasoned Loan Structured Transaction Trust, Series 2019-3, Class A1C, 2.75% 11/25/20291 | 4,786 | 4,398 | ||||||
Freddie Mac Seasoned Loan Structured Transaction Trust, Series 2020-1, Class A1D, 2.00% 7/25/20301 | 1,377 | 1,231 | ||||||
Freddie Mac Seasoned Loan Structured Transaction Trust, Series 2020-1, Class A2D, 2.00% 7/25/20301 | 435 | 356 | ||||||
Freddie Mac Seasoned Loan Structured Transaction Trust, Series 2022-1, Class A1, 3.50% 5/25/20321 | 4,668 | 4,503 | ||||||
Government National Mortgage Assn. 2.00% 1/1/20531,4 | 1,395 | 1,169 | ||||||
Government National Mortgage Assn. 2.50% 1/1/20531,4 | 2,486 | 2,155 | ||||||
Government National Mortgage Assn. 3.00% 1/1/20531,4 | 1,755 | 1,563 | ||||||
Government National Mortgage Assn. 3.50% 1/1/20531,4 | 2,260 | 2,077 | ||||||
Government National Mortgage Assn. 5.00% 1/1/20531,4 | 6,848 | 6,787 | ||||||
Government National Mortgage Assn. 5.50% 1/1/20531,4 | 14,351 | 14,436 | ||||||
Government National Mortgage Assn. Pool #782365 6.00% 7/15/20381 | 84 | 89 | ||||||
Government National Mortgage Assn. Pool #700778 5.50% 10/15/20381 | 21 | 21 | ||||||
Government National Mortgage Assn. Pool #004269 6.50% 10/20/20381 | 164 | 176 | ||||||
Government National Mortgage Assn. Pool #698668 5.50% 11/15/20381 | 28 | 29 | ||||||
Government National Mortgage Assn. Pool #698406 5.00% 7/15/20391 | 186 | 190 | ||||||
Government National Mortgage Assn. Pool #783690 6.00% 9/20/20391 | 81 | 86 | ||||||
Government National Mortgage Assn. Pool #783689 5.50% 2/20/20401 | 2,598 | 2,758 | ||||||
Government National Mortgage Assn. Pool #783688 5.00% 6/20/20411 | 870 | 894 | ||||||
Government National Mortgage Assn. Pool #783687 4.50% 12/20/20411 | 570 | 562 | ||||||
Government National Mortgage Assn. Pool #MA0533 3.00% 11/20/20421 | 19 | 17 | ||||||
Government National Mortgage Assn. Pool #MA8347 4.50% 10/20/20521 | 675 | 656 | ||||||
Government National Mortgage Assn. Pool #MA8426 4.00% 11/20/20521 | 28,092 | 26,611 | ||||||
Government National Mortgage Assn. Pool #MA8427 4.50% 11/20/20521 | 32,820 | 31,874 | ||||||
Government National Mortgage Assn. Pool #MA8488 4.00% 12/20/20521 | 3,100 | 2,936 | ||||||
Government National Mortgage Assn. Pool #MA8489 4.50% 12/20/20521 | 13,100 | 12,722 | ||||||
Uniform Mortgage-Backed Security 2.00% 1/1/20381,4 | 1,115 | 992 | ||||||
Uniform Mortgage-Backed Security 2.50% 1/1/20381,4 | 2,275 | 2,082 | ||||||
Uniform Mortgage-Backed Security 4.00% 1/1/20381,4 | 920 | 897 | ||||||
Uniform Mortgage-Backed Security 2.00% 1/1/20531,4 | 14,849 | 12,086 | ||||||
Uniform Mortgage-Backed Security 4.50% 1/1/20531,4 | 4,574 | 4,402 | ||||||
Uniform Mortgage-Backed Security 5.50% 1/1/20531,4 | 53,779 | 53,928 | ||||||
Uniform Mortgage-Backed Security 6.00% 1/1/20531,4 | 29,742 | 30,190 | ||||||
Uniform Mortgage-Backed Security 6.50% 1/1/20531,4 | 81,263 | 83,237 | ||||||
Uniform Mortgage-Backed Security 4.00% 2/1/20531,4 | 1,392 | 1,306 | ||||||
Uniform Mortgage-Backed Security 5.50% 2/1/20531,4 | 31,200 | 31,271 | ||||||
Uniform Mortgage-Backed Security 6.00% 2/1/20531,4 | 19,158 | 19,430 | ||||||
|
| |||||||
| 723,593 | ||||||||
|
| |||||||
U.S. Treasury bonds & notes 39.79% | ||||||||
U.S. Treasury inflation-protected securities 26.16% | ||||||||
U.S. Treasury Inflation-Protected Security 0.125% 1/15/20235 | 21,974 | 21,933 | ||||||
U.S. Treasury Inflation-Protected Security 0.625% 4/15/20235 | 31,116 | 30,816 | ||||||
U.S. Treasury Inflation-Protected Security 0.375% 7/15/20235 | 21,857 | 21,606 | ||||||
U.S. Treasury Inflation-Protected Security 0.625% 1/15/20245 | 55,898 | 54,749 | ||||||
U.S. Treasury Inflation-Protected Security 0.50% 4/15/20245 | 14,570 | 14,179 | ||||||
U.S. Treasury Inflation-Protected Security 0.125% 7/15/20245 | 56,967 | 55,181 | ||||||
U.S. Treasury Inflation-Protected Security 0.125% 10/15/20245 | 26,585 | 25,622 | ||||||
258 American Funds Insurance Series
Table of Contents
U.S. Government Securities Fund (continued)
Bonds, notes & other debt instruments (continued)
Principal amount (000) | Value (000) | |||||||
U.S. Treasury bonds & notes (continued) | ||||||||
U.S. Treasury inflation-protected securities (continued) | ||||||||
U.S. Treasury Inflation-Protected Security 0.125% 4/15/20255 | USD | 8,421 | $ | 8,026 | ||||
U.S. Treasury Inflation-Protected Security 0.375% 7/15/20255 | 57,803 | 55,543 | ||||||
U.S. Treasury Inflation-Protected Security 0.125% 10/15/20255 | 7,805 | 7,419 | ||||||
U.S. Treasury Inflation-Protected Security 0.625% 1/15/20265 | 3,380 | 3,245 | ||||||
U.S. Treasury Inflation-Protected Security 0.125% 4/15/20265 | 5,750 | 5,406 | ||||||
U.S. Treasury Inflation-Protected Security 0.125% 10/15/20265 | 34,217 | 32,092 | ||||||
U.S. Treasury Inflation-Protected Security 0.125% 4/15/20275 | 7,315 | 6,817 | ||||||
U.S. Treasury Inflation-Protected Security 1.625% 10/15/20275 | 12,137 | 12,122 | ||||||
U.S. Treasury Inflation-Protected Security 0.125% 7/15/20305 | 7,293 | 6,528 | ||||||
U.S. Treasury Inflation-Protected Security 0.125% 1/15/20315 | 6,877 | 6,102 | ||||||
U.S. Treasury Inflation-Protected Security 0.125% 7/15/20315 | 1,001 | 883 | ||||||
U.S. Treasury Inflation-Protected Security 0.125% 1/15/20325 | 4,412 | 3,860 | ||||||
U.S. Treasury Inflation-Protected Security 2.125% 2/15/20415 | 422 | 446 | ||||||
U.S. Treasury Inflation-Protected Security 0.75% 2/15/20425 | 8,558 | 7,171 | ||||||
U.S. Treasury Inflation-Protected Security 0.625% 2/15/20435 | 4,523 | 3,648 | ||||||
U.S. Treasury Inflation-Protected Security 1.00% 2/15/20495 | 4,914 | 4,114 | ||||||
U.S. Treasury Inflation-Protected Security 0.25% 2/15/20505 | 337 | 227 | ||||||
U.S. Treasury Inflation-Protected Security 0.125% 2/15/20515 | 6,032 | 3,891 | ||||||
U.S. Treasury Inflation-Protected Security 0.125% 2/15/20525 | 1,459 | 943 | ||||||
|
| |||||||
| 392,569 | ||||||||
|
| |||||||
U.S. Treasury 13.63% | ||||||||
U.S. Treasury 0.50% 11/30/2023 | 12,069 | 11,611 | ||||||
U.S. Treasury 2.125% 11/30/2023 | — | 2 | — | 2 | ||||
U.S. Treasury 0.125% 12/15/2023 | 1,934 | 1,853 | ||||||
U.S. Treasury 2.25% 12/31/2023 | 1,332 | 1,300 | ||||||
U.S. Treasury 2.50% 1/31/2024 | 26,000 | 25,395 | ||||||
U.S. Treasury 1.50% 2/29/2024 | 369 | 356 | ||||||
U.S. Treasury 3.00% 7/31/2024 | 3,685 | 3,594 | ||||||
U.S. Treasury 2.75% 5/15/2025 | 7,459 | 7,193 | ||||||
U.S. Treasury 3.125% 8/15/2025 | 390 | 379 | ||||||
U.S. Treasury 3.50% 9/15/2025 | 28,000 | 27,447 | ||||||
U.S. Treasury 4.00% 12/15/2025 | 5,694 | 5,659 | ||||||
U.S. Treasury 2.625% 7/31/2029 | 19,809 | 18,245 | ||||||
U.S. Treasury 3.125% 8/31/2029 | 22,521 | 21,382 | ||||||
U.S. Treasury 3.875% 12/31/2029 | 2,905 | 2,885 | ||||||
U.S. Treasury 2.75% 8/15/2032 | 7,500 | 6,828 | ||||||
U.S. Treasury 1.125% 5/15/2040 | 7,000 | 4,393 | ||||||
U.S. Treasury 2.50% 2/15/2045 | 4,850 | 3,668 | ||||||
U.S. Treasury 2.50% 2/15/2046 | 3,900 | 2,931 | ||||||
U.S. Treasury 2.50% 5/15/2046 | 5,400 | 4,049 | ||||||
U.S. Treasury 2.875% 11/15/2046 | 2,700 | 2,174 | ||||||
U.S. Treasury 2.875% 5/15/2049 | 6,300 | 5,095 | ||||||
U.S. Treasury 2.25% 8/15/2049 | 1,635 | 1,157 | ||||||
U.S. Treasury 1.25% 5/15/20506 | 19,460 | 10,527 | ||||||
U.S. Treasury 1.375% 8/15/2050 | 4,330 | 2,423 | ||||||
U.S. Treasury 1.625% 11/15/20506 | 26,165 | 15,671 | ||||||
U.S. Treasury 1.875% 2/15/20516 | 6,672 | 4,264 | ||||||
U.S. Treasury 2.00% 8/15/2051 | 5,546 | 3,650 | ||||||
U.S. Treasury 1.875% 11/15/2051 | 3,164 | 2,015 | ||||||
U.S. Treasury 2.875% 5/15/2052 | 350 | 282 | ||||||
U.S. Treasury 3.00% 8/15/2052 | 7,025 | 5,825 | ||||||
U.S. Treasury 4.00% 11/15/2052 | 2,290 | 2,302 | ||||||
|
| |||||||
| 204,553 | ||||||||
|
| |||||||
Total U.S. Treasury bonds & notes | 597,122 | |||||||
|
| |||||||
American Funds Insurance Series 259
Table of Contents
U.S. Government Securities Fund (continued)
Bonds, notes & other debt instruments (continued)
Principal amount (000) | Value (000) | |||||||||||
Federal agency bonds & notes 5.28% | ||||||||||||
Export-Import Bank of the United States-Guaranteed, Ethiopian Leasing 2012, LLC 2.646% 5/12/2026 | USD | 308 | $ | 296 | ||||||||
Fannie Mae 7.125% 1/15/2030 | 2,000 | 2,353 | ||||||||||
Federal Home Loan Bank 3.25% 11/16/2028 | 6,500 | 6,250 | ||||||||||
Federal Home Loan Bank 5.50% 7/15/2036 | 300 | 328 | ||||||||||
Private Export Funding Corp. 3.55% 1/15/2024 | 3,190 | 3,143 | ||||||||||
Private Export Funding Corp. 1.40% 7/15/2028 | 3,000 | 2,536 | ||||||||||
Tennessee Valley Authority 0.75% 5/15/2025 | 3,700 | 3,390 | ||||||||||
Tennessee Valley Authority 2.875% 2/1/2027 | 5,000 | 4,742 | ||||||||||
Tennessee Valley Authority 4.65% 6/15/2035 | 1,780 | 1,764 | ||||||||||
Tennessee Valley Authority 5.88% 4/1/2036 | 875 | 971 | ||||||||||
Tennessee Valley Authority, Series A, 4.625% 9/15/2060 | 250 | 232 | ||||||||||
TVA Southaven 3.846% 8/15/2033 | 887 | 820 | ||||||||||
U.S. Agency for International Development, Israel (State of), Class 1A, 5.50% 9/18/2023 | 1,250 | 1,255 | ||||||||||
U.S. Agency for International Development, Jordan (Kingdom of) 3.00% 6/30/2025 | 14,779 | 14,231 | ||||||||||
U.S. Agency for International Development, Morocco (Kingdom of) 7.55% 7/15/2026 | 1,909 | 2,000 | ||||||||||
U.S. Department of Housing and Urban Development, Series 2015-A-9, 2.80% 8/1/2023 | 1,500 | 1,481 | ||||||||||
U.S. Department of Housing and Urban Development, Series 2015-A-10, 2.85% 8/1/2024 | 2,250 | 2,190 | ||||||||||
U.S. Department of Housing and Urban Development, Series 2015-A-11, 2.95% 8/1/2025 | 2,640 | 2,532 | ||||||||||
U.S. Department of Housing and Urban Development, Series 2015-A-12, 3.10% 8/1/2026 | 2,625 | 2,497 | ||||||||||
U.S. Department of Housing and Urban Development, Series 2015-A-13, 3.15% 8/1/2027 | 11,482 | 10,812 | ||||||||||
U.S. Department of Housing and Urban Development, Series 2015-A-14, 3.25% 8/1/2028 | 3,856 | 3,598 | ||||||||||
U.S. Department of Housing and Urban Development, Series 2015-A-15, 3.35% 8/1/2029 | 2,650 | 2,450 | ||||||||||
U.S. Department of Housing and Urban Development, Series 2015-A-16, 3.50% 8/1/2030 | 2,482 | 2,361 | ||||||||||
U.S. Department of Housing and Urban Development, Series 2015-A-17, 3.55% 8/1/2031 | 2,475 | 2,350 | ||||||||||
U.S. Department of Housing and Urban Development, Series 2015-A-18, 3.60% 8/1/2032 | 2,377 | 2,159 | ||||||||||
U.S. Department of Housing and Urban Development, Series 2015-A-19, 3.65% 8/1/2033 | 2,059 | 1,866 | ||||||||||
U.S. Department of Housing and Urban Development, Series 2015-A-20, 3.70% 8/1/2034 | 651 | 589 | ||||||||||
| 79,196 | ||||||||||||
|
| |||||||||||
Total bonds, notes & other debt instruments (cost: $1,480,306,000) | 1,399,911 | |||||||||||
|
| |||||||||||
| Short-term securities 21.20% | ||||||||||||
Weighted average yield at acquisition | ||||||||||||
Commercial paper 13.42% | ||||||||||||
CAFCO, LLC 2/3/20237 | 4.300 | % | 8,750 | 8,713 | ||||||||
Chariot Funding, LLC 1/3/20237 | 3.880 | 10,000 | 9,995 | |||||||||
Chariot Funding, LLC 1/27/20237 | 4.150 | 8,000 | 7,973 | |||||||||
Chariot Funding, LLC 2/10/20237 | 4.657 | 15,000 | 14,923 | |||||||||
CHARTA, LLC 1/11/20237 | 3.900 | 5,680 | 5,672 | |||||||||
Citigroup Global Markets, Inc. 2/21/20237 | 4.580 | 6,000 | 5,959 | |||||||||
Coca-Cola Co. 2/21/20237 | 4.200 | 15,000 | 14,903 | |||||||||
Honeywell International, Inc. 2/1/20237 | 4.100 | 3,000 | 2,988 | |||||||||
Honeywell International, Inc. 2/21/20237 | 4.310 | 15,300 | 15,201 | |||||||||
Honeywell International, Inc. 2/27/20237 | 4.300 | 6,050 | 6,006 | |||||||||
260 American Funds Insurance Series
Table of Contents
U.S. Government Securities Fund (continued)
Short-term securities (continued)
Weighted average yield at acquisition | Principal amount (000) | Value (000) | ||||||||||
Commercial paper (continued) | ||||||||||||
Johnson & Johnson 1/30/20237 | 4.190 | % | USD | 9,000 | $ | 8,967 | ||||||
Johnson & Johnson 2/13/20237 | 4.220 | 10,000 | 9,946 | |||||||||
Linde, Inc. 2/6/2023 | 4.340 | 15,000 | 14,932 | |||||||||
Paccar Financial Corp. 1/6/2023 | 4.110 | 20,000 | 19,983 | |||||||||
Procter & Gamble Co. 2/9/20237 | 4.300 | 14,500 | 14,428 | |||||||||
Procter & Gamble Co. 2/10/20237 | 4.250 | 18,500 | 18,406 | |||||||||
Roche Holdings, Inc. 1/3/20237 | 4.230 | 13,950 | 13,944 | |||||||||
Starbird Funding Corp. 1/3/20237 | 4.300 | 8,500 | 8,496 | |||||||||
|
| |||||||||||
| 201,435 | ||||||||||||
|
| |||||||||||
Federal agency bills & notes 6.19% | ||||||||||||
Federal Farm Credit Banks 1/12/2023 | 3.880 | 5,500 | 5,494 | |||||||||
Federal Home Loan Bank 1/3/2023 | 3.900 | 850 | 850 | |||||||||
Federal Home Loan Bank 1/11/2023 | 4.005 | 20,700 | 20,680 | |||||||||
Federal Home Loan Bank 2/8/2023 | 4.161 | 25,000 | 24,896 | |||||||||
Federal Home Loan Bank 2/10/2023 | 4.215 | 6,750 | 6,720 | |||||||||
Federal Home Loan Bank 2/22/2023 | 4.320 | 4,400 | 4,373 | |||||||||
Federal Home Loan Bank 2/24/2023 | 4.297 | 10,000 | 9,936 | |||||||||
Federal Home Loan Bank 3/3/2023 | 4.370 | 20,000 | 19,856 | |||||||||
|
| |||||||||||
| 92,805 | ||||||||||||
|
| |||||||||||
U.S. Treasury bills 1.59% | ||||||||||||
U.S. Treasury 11/2/2023 | 4.527 | 24,780 | 23,854 | |||||||||
|
| |||||||||||
Total short-term securities (cost: $318,108,000) | 318,094 | |||||||||||
|
| |||||||||||
Total investment securities 114.48% (cost: $1,798,414,000) | 1,718,005 | |||||||||||
Other assets less liabilities (14.48)% | (217,283 | ) | ||||||||||
|
| |||||||||||
Net assets 100.00% | $ | 1,500,722 | ||||||||||
|
| |||||||||||
Futures contracts
Contracts | Type | Number of contracts | Expiration | Notional amount (000) | Value and unrealized appreciation (depreciation) at 12/31/2022 (000) | |||||||||||||||
3 Month SOFR Futures | Short | 270 | June 2023 | USD | (64,183 | ) | $ | 920 | ||||||||||||
90 Day Eurodollar Futures | Long | 1,495 | September 2023 | 354,782 | (15,731 | ) | ||||||||||||||
90 Day Eurodollar Futures | Short | 923 | December 2023 | (219,697 | ) | 8,805 | ||||||||||||||
90 Day Eurodollar Futures | Short | 885 | December 2024 | (213,285 | ) | 4,539 | ||||||||||||||
2 Year U.S. Treasury Note Futures | Short | 298 | March 2023 | (61,113 | ) | 148 | ||||||||||||||
5 Year U.S. Treasury Note Futures | Long | 3,872 | March 2023 | 417,904 | (536 | ) | ||||||||||||||
10 Year U.S. Treasury Note Futures | Long | 603 | March 2023 | 67,715 | (373 | ) | ||||||||||||||
10 Year Ultra U.S. Treasury Note Futures | Long | 164 | March 2023 | 19,398 | (294 | ) | ||||||||||||||
20 Year U.S. Treasury Bond Futures | Long | 447 | March 2023 | 56,029 | (765 | ) | ||||||||||||||
30 Year Ultra U.S. Treasury Bond Futures | Short | 35 | March 2023 | (4,701 | ) | 111 | ||||||||||||||
|
| |||||||||||||||||||
| $ | (3,176 | ) | ||||||||||||||||||
|
| |||||||||||||||||||
American Funds Insurance Series 261
Table of Contents
U.S. Government Securities Fund (continued)
Swap contracts
Interest rate swaps
Centrally cleared interest rate swaps
Receive | Pay | Expiration date | Notional amount (000) | Value at 12/31/2022 (000) | Upfront premium paid (000) | Unrealized appreciation (depreciation) at 12/31/2022 (000) | ||||||||||||||||||||
Rate | Payment frequency | Rate | Payment frequency | |||||||||||||||||||||||
SOFR | Annual | 0.471% | Annual | 10/26/2023 | USD30,500 | $ | 1,078 | $ | — | $ | 1,078 | |||||||||||||||
0.45801% | Annual | SOFR | Annual | 10/26/2023 | 30,500 | (1,081 | ) | — | (1,081 | ) | ||||||||||||||||
0.241% | Annual | U.S. EFFR | Annual | 3/1/2024 | 119,400 | (6,219 | ) | — | (6,219 | ) | ||||||||||||||||
U.S. EFFR | Annual | 0.11% | Annual | 5/18/2024 | 97,600 | 4,372 | — | 4,372 | ||||||||||||||||||
3.497% | Annual | U.S. EFFR | Annual | 6/16/2024 | 24,000 | (426 | ) | — | (426 | ) | ||||||||||||||||
3.4585% | Annual | U.S. EFFR | Annual | 6/17/2024 | 3,697 | (68 | ) | — | (68 | ) | ||||||||||||||||
3.4325% | Annual | U.S. EFFR | Annual | 6/17/2024 | 17,700 | (330 | ) | — | (330 | ) | ||||||||||||||||
4.345% | Annual | U.S. EFFR | Annual | 9/29/2024 | 19,000 | (85 | ) | — | (85 | ) | ||||||||||||||||
4.197% | Annual | U.S. EFFR | Annual | 9/30/2024 | 19,000 | (131 | ) | — | (131 | ) | ||||||||||||||||
4.1735% | Annual | U.S. EFFR | Annual | 9/30/2024 | 19,400 | (142 | ) | — | (142 | ) | ||||||||||||||||
4.15% | Annual | U.S. EFFR | Annual | 10/6/2024 | 19,300 | (146 | ) | — | (146 | ) | ||||||||||||||||
4.5645% | Annual | U.S. EFFR | Annual | 10/19/2024 | 7,100 | (2 | ) | — | (2 | ) | ||||||||||||||||
4.533% | Annual | U.S. EFFR | Annual | 10/20/2024 | 8,800 | (7 | ) | — | (7 | ) | ||||||||||||||||
4.56% | Annual | U.S. EFFR | Annual | 10/27/2024 | 8,900 | (2 | ) | — | (2 | ) | ||||||||||||||||
4.5245% | Annual | U.S. EFFR | Annual | 10/27/2024 | 10,600 | (8 | ) | — | (8 | ) | ||||||||||||||||
U.S. EFFR | Annual | 0.1275% | Annual | 6/25/2025 | 20,100 | 1,938 | — | 1,938 | ||||||||||||||||||
U.S. EFFR | Annual | 0.126% | Annual | 6/25/2025 | 20,100 | 1,938 | — | 1,938 | ||||||||||||||||||
U.S. EFFR | Annual | 0.106% | Annual | 6/30/2025 | 22,492 | 2,187 | — | 2,187 | ||||||||||||||||||
3-month USD-LIBOR | Quarterly | 1.867% | Semi-annual | 7/11/2025 | 49,400 | 3,060 | — | 3,060 | ||||||||||||||||||
2.925% | Semi-annual | 3-month USD-LIBOR | Quarterly | 2/1/2028 | 12,800 | (616 | ) | — | (616 | ) | ||||||||||||||||
2.92% | Semi-annual | 3-month USD-LIBOR | Quarterly | 2/2/2028 | 12,200 | (590 | ) | — | (590 | ) | ||||||||||||||||
U.S. EFFR | Annual | 0.5385% | Annual | 3/26/2030 | 49,000 | 9,477 | — | 9,477 | ||||||||||||||||||
0.913% | Semi-annual | 3-month USD-LIBOR | Quarterly | 6/9/2030 | 31,000 | (5,918 | ) | — | (5,918 | ) | ||||||||||||||||
U.S. EFFR | Annual | 0.666% | Annual | 11/19/2030 | 15,500 | 3,075 | — | 3,075 | ||||||||||||||||||
3-month USD- | Quarterly | 2.963% | Semi-annual | 2/1/2038 | 9,800 | 486 | — | 486 | ||||||||||||||||||
3-month USD- | Quarterly | 2.986% | Semi-annual | 2/1/2038 | 7,800 | 375 | — | 375 | ||||||||||||||||||
0.833% | Semi-annual | 3-month USD-LIBOR | Quarterly | 4/3/2040 | 15,800 | (5,952 | ) | — | (5,952 | ) | ||||||||||||||||
3-month USD- | Quarterly | 0.811% | Semi-annual | 7/27/2050 | 5,110 | 2,464 | — | 2,464 | ||||||||||||||||||
SOFR | Annual | 2.85282% | Annual | 12/6/2052 | 540 | 38 | — | 38 | ||||||||||||||||||
SOFR | Annual | 2.93542% | Annual | 12/6/2052 | 550 | 31 | — | 31 | ||||||||||||||||||
|
|
|
|
|
| |||||||||||||||||||||
| $ | 8,796 | $ | — | $ | 8,796 | |||||||||||||||||||||
|
|
|
|
|
| |||||||||||||||||||||
| 1 | Principal payments may be made periodically. Therefore, the effective maturity date may be earlier than the stated maturity date. |
| 2 | Amount less than one thousand. |
| 3 | Coupon rate may change periodically. Reference rate and spread are as of the most recent information available. Some coupon rates are determined by the issuer or agent based on current market conditions; therefore, the reference rate and spread are not available. For short-term securities, the date of the next scheduled coupon rate change is considered to be the maturity date. |
| 4 | Purchased on a TBA basis. |
| 5 | Index-linked bond whose principal amount moves with a government price index. |
| 6 | All or a portion of this security was pledged as collateral. The total value of pledged collateral was $10,807,000, which represented .72% of the net assets of the fund. |
| 7 | Acquired in a transaction exempt from registration under Rule 144A or, for commercial paper, Section 4(a)(2) of the Securities Act of 1933. May be resold in the U.S. in transactions exempt from registration, normally to qualified institutional buyers. The total value of all such securities was $166,520,000, which represented 11.10% of the net assets of the fund. |
Key to abbreviations
| Assn. = Association | SOFR = Secured Overnight Financing Rate | |
| EFFR = Effective Federal Funds Rate | TBA = To be announced | |
| LIBOR = London Interbank Offered Rate | USD = U.S. dollars |
Refer to the notes to financial statements.
262 American Funds Insurance Series
Table of Contents
Investment portfolio December 31, 2022
| Shares | Value (000) | |||||||
Growth funds 85.30% | ||||||||
American Funds Insurance Series – Growth Fund, Class 1 | 5,078,871 | $ | 387,467 | |||||
|
| |||||||
Total growth funds (cost: $439,303,000) | 387,467 | |||||||
|
| |||||||
Fixed income funds 7.53% | ||||||||
American Funds Insurance Series – The Bond Fund of America, Class 1 | 3,634,107 | 34,197 | ||||||
|
| |||||||
Total fixed income funds (cost: $35,683,000) | 34,197 | |||||||
|
| |||||||
Short-term securities 2.48% | ||||||||
State Street Institutional U.S. Government Money Market Fund, Premier Class 4.12%1 | 11,266,894 | 11,267 | ||||||
|
| |||||||
Total short-term securities (cost: $11,267,000) | 11,267 | |||||||
|
| |||||||
Options purchased 0.04% | ||||||||
Options purchased* | 205 | |||||||
|
| |||||||
Total options purchased (cost: $1,216,000) | 205 | |||||||
|
| |||||||
Total investment securities 95.35% (cost: $487,469,000) | 433,136 | |||||||
Other assets less liabilities 4.65% | 21,106 | |||||||
|
| |||||||
Net assets 100.00% | $ | 454,242 | ||||||
|
| |||||||
*Options purchased
Put | ||||||||||||||||||||
Description | Number of contracts | Notional amount (000) | Exercise price | Expiration date | Value at 12/31/2022 (000) | |||||||||||||||
S&P 500 Index | 35 | USD | 13,438 | USD | 2,600.00 | 3/17/2023 | $ | 13 | ||||||||||||
S&P 500 Index | 70 | 26,877 | 2,700.00 | 3/17/2023 | 29 | |||||||||||||||
S&P 500 Index | 175 | 67,191 | 2,800.00 | 3/17/2023 | 87 | |||||||||||||||
S&P 500 Index | 5 | 1,920 | 2,850.00 | 3/17/2023 | 2 | |||||||||||||||
S&P 500 Index | 110 | 42,234 | 2,900.00 | 3/17/2023 | 74 | |||||||||||||||
|
| |||||||||||||||||||
| $ | 205 | |||||||||||||||||||
|
| |||||||||||||||||||
American Funds Insurance Series 263
Table of Contents
Managed Risk Growth Fund (continued)
Futures contracts
Contracts | Type | Number of contracts | Expiration | Notional amount (000) | Value and unrealized (depreciation) appreciation at 12/31/2022 (000) | |||||||||||||||
5 Year U.S. Treasury Note Futures | Long | 283 | March 2023 | USD | 30,544 | $ | (47 | ) | ||||||||||||
Nikkei 225 Index Contracts | Short | 3 | March 2023 | (590 | ) | 45 | ||||||||||||||
Japanese Yen Currency Contracts | Short | 7 | March 2023 | (674 | ) | (31 | ) | |||||||||||||
FTSE 100 Index Contracts | Short | 19 | March 2023 | (1,716 | ) | (1 | ) | |||||||||||||
British Pound Currency Contracts | Short | 24 | March 2023 | (1,812 | ) | 47 | ||||||||||||||
Mini MSCI Emerging Market Index Contracts | Short | 57 | March 2023 | (2,734 | ) | 42 | ||||||||||||||
Russell 2000 Mini Index Contracts | Short | 66 | March 2023 | (5,844 | ) | 156 | ||||||||||||||
Euro Stoxx 50 Index Contracts | Short | 314 | March 2023 | (12,714 | ) | 544 | ||||||||||||||
Euro Currency Contracts | Short | 101 | March 2023 | (13,577 | ) | (30 | ) | |||||||||||||
S&P Mid 400 E-mini Index Contracts | Short | 92 | March 2023 | (22,472 | ) | 455 | ||||||||||||||
S&P 500 E-mini Index Contracts | Short | 1,194 | March 2023 | (230,502 | ) | 6,305 | ||||||||||||||
|
| |||||||||||||||||||
| $ | 7,485 | |||||||||||||||||||
|
| |||||||||||||||||||
Investments in affiliates2
| Value of affiliates at 1/1/2022 (000) | Additions (000) | Reductions (000) | Net realized loss (000) | Net unrealized (depreciation) appreciation (000) | Value of affiliates at 12/31/2022 (000) | Dividend income (000) | Capital gain distributions received (000) | |||||||||||||||||||||||||
Growth funds 85.30% | ||||||||||||||||||||||||||||||||
American Funds Insurance Series – Growth Fund, | $ | 504,914 | $ | 458,729 | $ | 366,785 | $ | (17,443 | ) | $ | (191,948 | ) | $ | 387,467 | $ | 2,476 | $ | 60,090 | ||||||||||||||
Fixed income funds 7.53% | ||||||||||||||||||||||||||||||||
American Funds Insurance Series – The Bond Fund of America, Class 1 | 59,236 | 70,113 | 86,469 | (9,458 | ) | 775 | 34,197 | 1,344 | 443 | |||||||||||||||||||||||
|
|
|
|
|
|
|
|
|
| |||||||||||||||||||||||
Total 92.83% | $ | (26,901 | ) | $ | (191,173 | ) | $ | 421,664 | $ | 3,820 | $ | 60,533 | ||||||||||||||||||||
|
|
|
|
|
|
|
|
|
| |||||||||||||||||||||||
| 1 | Rate represents the seven-day yield at 12/31/2022. |
| 2 | Part of the same “group of investment companies” as the fund as defined under the Investment Company Act of 1940, as amended. |
Key to abbreviation
USD = U.S. dollars
Refer to the notes to financial statements.
264 American Funds Insurance Series
Table of Contents
Managed Risk International Fund
Investment portfolio December 31, 2022
| Shares | Value (000) | |||||||
Growth funds 84.51% | ||||||||
American Funds Insurance Series – International Fund, Class 1 | 6,952,007 | $ | 106,435 | |||||
|
| |||||||
Total growth funds (cost: $119,403,000) | 106,435 | |||||||
|
| |||||||
Fixed income funds 9.95% | ||||||||
American Funds Insurance Series – The Bond Fund of America, Class 1 | 1,331,210 | 12,527 | ||||||
|
| |||||||
Total fixed income funds (cost: $13,253,000) | 12,527 | |||||||
|
| |||||||
Short-term securities 2.09% | ||||||||
State Street Institutional U.S. Government Money Market Fund, Premier Class 4.12%1 | 2,635,506 | 2,636 | ||||||
|
| |||||||
Total short-term securities (cost: $2,636,000) | 2,636 | |||||||
|
| |||||||
Options purchased 0.14% | ||||||||
Options purchased* | 169 | |||||||
|
| |||||||
Total options purchased (cost: $399,000) | 169 | |||||||
|
| |||||||
Total investment securities 96.69% (cost: $135,691,000) | 121,767 | |||||||
Other assets less liabilities 3.31% | 4,167 | |||||||
|
| |||||||
Net assets 100.00% | $ | 125,934 | ||||||
|
| |||||||
*Options purchased
Put | ||||||||||||||||||||
Description | Number of contracts | Notional amount (000) | Exercise price | Expiration date | Value at 12/31/2022 (000) | |||||||||||||||
iShares MSCI EAFE ETF | 50 | USD328 | USD | 47.00 | 3/17/2023 | $ | — | 2 | ||||||||||||
iShares MSCI EAFE ETF | 1,700 | 11,159 | 48.00 | 3/17/2023 | 13 | |||||||||||||||
iShares MSCI EAFE ETF | 450 | 2,954 | 55.00 | 3/17/2023 | 11 | |||||||||||||||
iShares MSCI EAFE ETF | 1,375 | 9,025 | 43.00 | 6/16/2023 | 34 | |||||||||||||||
iShares MSCI EAFE ETF | 350 | 2,297 | 45.00 | 6/16/2023 | 15 | |||||||||||||||
iShares MSCI EAFE ETF | 200 | 1,313 | 46.00 | 6/16/2023 | 9 | |||||||||||||||
iShares MSCI EAFE ETF | 1,700 | 11,159 | 50.00 | 6/16/2023 | 87 | |||||||||||||||
|
| |||||||||||||||||||
| $ | 169 | |||||||||||||||||||
|
| |||||||||||||||||||
Futures contracts
Contracts | Type | Number of contracts | Expiration | Notional amount (000) | Value and unrealized (depreciation) appreciation at 12/31/2022 (000) | |||||||||||||||
5 Year U.S. Treasury Note Futures | Long | 75 | March 2023 | USD | 8,095 | $ | (13 | ) | ||||||||||||
S&P 500 E-mini Index Contracts | Short | 66 | March 2023 | (12,742 | ) | 351 | ||||||||||||||
Mini MSCI Emerging Market Index Contracts | Short | 394 | March 2023 | (18,900 | ) | 245 | ||||||||||||||
MSCI EAFE Index Contracts | Short | 279 | March 2023 | (27,194 | ) | 428 | ||||||||||||||
|
| |||||||||||||||||||
| $ | 1,011 | |||||||||||||||||||
|
| |||||||||||||||||||
American Funds Insurance Series 265
Table of Contents
Managed Risk International Fund (continued)
Investments in affiliates3
| Value of affiliates at 1/1/2022 (000) | Additions (000) | Reductions (000) | Net realized loss (000) | Net unrealized depreciation (000) | Value of affiliates at 12/31/2022 (000) | Dividend income (000) | Capital gain distributions received (000) | |||||||||||||||||||||||||
Growth funds 84.51% | ||||||||||||||||||||||||||||||||
American Funds Insurance Series – International Fund, Class 1 | $ | 136,987 | $ | 107,662 | $ | 92,768 | $ | (7,315 | ) | $ | (38,131 | ) | $ | 106,435 | $ | 2,273 | $ | 16,110 | ||||||||||||||
Fixed income funds 9.95% | ||||||||||||||||||||||||||||||||
American Funds Insurance Series – The Bond Fund of America, Class 1 | 16,071 | 14,150 | 15,224 | (2,409 | ) | (61 | ) | 12,527 | 427 | 160 | ||||||||||||||||||||||
|
|
|
|
|
|
|
|
|
| |||||||||||||||||||||||
Total 94.46% | $ | (9,724 | ) | $ | (38,192 | ) | $ | 118,962 | $ | 2,700 | $ | 16,270 | ||||||||||||||||||||
|
|
|
|
|
|
|
|
|
| |||||||||||||||||||||||
| 1 | Rate represents the seven-day yield at 12/31/2022. |
| 2 | Amount less than one thousand. |
| 3 | Part of the same “group of investment companies” as the fund as defined under the Investment Company Act of 1940, as amended. |
Key to abbreviation
USD = U.S. dollars
Refer to the notes to financial statements.
266 American Funds Insurance Series
Table of Contents
Managed Risk Washington Mutual Investors Fund
Investment portfolio December 31, 2022
| Shares | Value (000) | |||||||
Growth-and-income funds 84.89% | ||||||||
American Funds Insurance Series – Washington Mutual Investors Fund, Class 1 | 21,639,334 | $ | 274,603 | |||||
|
| |||||||
Total growth-and-income funds (cost: $299,529,000) | 274,603 | |||||||
|
| |||||||
Fixed income funds 9.99% | ||||||||
American Funds Insurance Series – U.S. Government Securities Fund, Class 1 | 3,235,124 | 32,319 | ||||||
|
| |||||||
Total fixed income funds (cost: $34,728,000) | 32,319 | |||||||
|
| |||||||
Short-term securities 2.32% | ||||||||
State Street Institutional U.S. Government Money Market Fund, Premier Class 4.12%1 | 7,500,680 | 7,501 | ||||||
|
| |||||||
Total short-term securities (cost: $7,501,000) | 7,501 | |||||||
|
| |||||||
Options purchased 0.09% | ||||||||
Options purchased* | 274 | |||||||
|
| |||||||
Total options purchased (cost: $1,254,000) | 274 | |||||||
|
| |||||||
Total investment securities 97.29% (cost: $343,012,000) | 314,697 | |||||||
Other assets less liabilities 2.71% | 8,775 | |||||||
|
| |||||||
Net assets 100.00% | $ | 323,472 | ||||||
|
| |||||||
*Options purchased
Put |
| |||||||||||||||||||
Description | Number of contracts | Notional amount (000) | Exercise price | Expiration date | Value at 12/31/2022 (000) | |||||||||||||||
S&P 500 Index | 15 | USD | 5,759 | USD | 2,500.00 | 3/17/2023 | $ | 4 | ||||||||||||
S&P 500 Index | 15 | 5,759 | 2,600.00 | 3/17/2023 | 6 | |||||||||||||||
S&P 500 Index | 80 | 30,716 | 2,700.00 | 3/17/2023 | 33 | |||||||||||||||
S&P 500 Index | 130 | 49,913 | 2,800.00 | 3/17/2023 | 65 | |||||||||||||||
S&P 500 Index | 45 | 17,278 | 2,850.00 | 3/17/2023 | 24 | |||||||||||||||
S&P 500 Index | 105 | 40,315 | 2,900.00 | 3/17/2023 | 70 | |||||||||||||||
S&P 500 Index | 30 | 11,519 | 2,825.00 | 6/16/2023 | 72 | |||||||||||||||
|
| |||||||||||||||||||
| $ | 274 | |||||||||||||||||||
|
| |||||||||||||||||||
Futures contracts
Contracts | Type | Number of contracts | Expiration | Notional amount (000) | Value and unrealized (depreciation) appreciation at 12/31/2022 (000) | |||||||||||||||
5 Year U.S. Treasury Note Futures | Long | 146 | March 2023 | USD | 15,758 | $ | (81 | ) | ||||||||||||
Russell 2000 Mini Index Contracts | Short | 1 | March 2023 | (89 | ) | 3 | ||||||||||||||
S&P Mid 400 E-mini Index Contracts | Short | 7 | March 2023 | (1,710 | ) | 31 | ||||||||||||||
Euro Stoxx 50 Index Contracts | Short | 47 | March 2023 | (1,903 | ) | 70 | ||||||||||||||
Euro Currency Contracts | Short | 15 | March 2023 | (2,016 | ) | (5 | ) | |||||||||||||
FTSE 100 Index Contracts | Short | 31 | March 2023 | (2,799 | ) | (5 | ) | |||||||||||||
American Funds Insurance Series 267
Table of Contents
Managed Risk Washington Mutual Investors Fund (continued)
Futures contracts (continued)
Contracts | Type | Number of Contracts | Expiration | Notional amount (000) | Value and unrealized (depreciation) appreciation at 12/31/2022 (000) | |||||||||||||||
British Pound Currency Contracts | Short | 38 | March 2023 | USD | (2,870 | ) | $ | 68 | ||||||||||||
S&P 500 E-mini Index Contracts | Short | 563 | March 2023 | (108,687 | ) | 2,521 | ||||||||||||||
|
| |||||||||||||||||||
| $ | 2,602 | |||||||||||||||||||
|
| |||||||||||||||||||
Investments in affiliates2
| Value of affiliates at 1/1/2022 (000) | Additions (000) | Reductions (000) | Net realized gain (loss) (000) | Net unrealized (depreciation) appreciation (000) | Value of affiliates at 12/31/2022 (000) | Dividend income (000) | Capital gain distributions received (000) | |||||||||||||||||||||||||
Growth-and-income funds 84.89% | ||||||||||||||||||||||||||||||||
American Funds Insurance Series – Washington Mutual Investors Fund, Class 1 | $ | 315,947 | $ | 235,449 | $ | 186,345 | $ | 38,519 | $ | (128,967 | ) | $ | 274,603 | $ | 5,946 | $ | 61,850 | |||||||||||||||
Fixed income funds 9.99% | ||||||||||||||||||||||||||||||||
American Funds Insurance Series – U.S. Government Securities Fund, Class 1 | 37,066 | 33,763 | 33,365 | (5,847 | ) | 702 | 32,319 | 1,347 | — | |||||||||||||||||||||||
|
|
|
|
|
|
|
|
|
| |||||||||||||||||||||||
Total 94.88% | $ | 32,672 | $ | (128,265 | ) | $ | 306,922 | $ | 7,293 | $ | 61,850 | |||||||||||||||||||||
|
|
|
|
|
|
|
|
|
| |||||||||||||||||||||||
| 1 | Rate represents the seven-day yield at 12/31/2022. |
| 2 | Part of the same “group of investment companies” as the fund as defined under the Investment Company Act of 1940, as amended. |
Key to abbreviation
USD = U.S. dollars
Refer to the notes to financial statements.
268 American Funds Insurance Series
Table of Contents
Managed Risk Growth-Income Fund
Investment portfolio December 31, 2022
| Shares | Value (000) | |||||||
Growth-and-income funds 79.84% | ||||||||
American Funds Insurance Series – Growth-Income Fund, Class 1 | 33,417,153 | $ | 1,677,875 | |||||
|
| |||||||
Total growth-and-income funds (cost: $1,757,211,000) | 1,677,875 | |||||||
|
| |||||||
Fixed income funds 14.97% | ||||||||
American Funds Insurance Series – The Bond Fund of America, Class 1 | 33,434,013 | 314,614 | ||||||
|
| |||||||
Total fixed income funds (cost: $348,317,000) | 314,614 | |||||||
|
| |||||||
Short-term securities 2.25% | ||||||||
State Street Institutional U.S. Government Money Market Fund, Premier Class 4.12%1 | 47,304,896 | 47,305 | ||||||
|
| |||||||
Total short-term securities (cost: $47,305,000) | 47,305 | |||||||
|
| |||||||
Options purchased 0.12% | ||||||||
Options purchased* | 2,485 | |||||||
|
| |||||||
Total options purchased (cost: $13,461,000) | 2,485 | |||||||
|
| |||||||
Total investment securities 97.18% (cost: $2,166,294,000) | 2,042,279 | |||||||
Other assets less liabilities 2.82% | 59,165 | |||||||
|
| |||||||
Net assets 100.00% | $ | 2,101,444 | ||||||
|
| |||||||
*Options purchased
Put | ||||||||||||||||||||
Description | Number of contracts | Notional amount (000) | Exercise price | Expiration date | Value at 12/31/2022 (000) | |||||||||||||||
S&P 500 Index | 420 | USD161,259 | USD2,700.00 | 3/17/2023 | $ | 172 | ||||||||||||||
S&P 500 Index | 1,500 | 575,925 | 2,800.00 | 3/17/2023 | 750 | |||||||||||||||
S&P 500 Index | 1,575 | 604,721 | 2,850.00 | 3/17/2023 | 838 | |||||||||||||||
S&P 500 Index | 1,080 | 414,666 | 2,900.00 | 3/17/2023 | 725 | |||||||||||||||
|
| |||||||||||||||||||
| $ | 2,485 | |||||||||||||||||||
|
| |||||||||||||||||||
Futures contracts
Contracts | Type | Number of contracts | Expiration | Notional amount (000) | Value and unrealized (depreciation) appreciation at 12/31/2022 (000) | |||||||||||||||
5 Year U.S. Treasury Note Futures | Long | 1,001 | March 2023 | USD108,038 | $ | (177 | ) | |||||||||||||
Nikkei 225 Index Contracts | Short | 1 | March 2023 | (197 | ) | 3 | ||||||||||||||
Japanese Yen Currency Contracts | Short | 3 | March 2023 | (289 | ) | (4 | ) | |||||||||||||
Russell 2000 Mini Index Contracts | Short | 52 | March 2023 | (4,604 | ) | 100 | ||||||||||||||
Mini MSCI Emerging Market Index Contracts | Short | 230 | March 2023 | (11,033 | ) | 137 | ||||||||||||||
FTSE 100 Index Contracts | Short | 189 | March 2023 | (17,066 | ) | (33 | ) | |||||||||||||
British Pound Currency Contracts | Short | 235 | March 2023 | (17,748 | ) | 433 | ||||||||||||||
Euro Stoxx 50 Index Contracts | Short | 579 | March 2023 | (23,445 | ) | 892 | ||||||||||||||
Euro Currency Contracts | Short | 187 | March 2023 | (25,138 | ) | (70 | ) | |||||||||||||
| American Funds Insurance Series | 269 |
Table of Contents
Managed Risk Growth-Income Fund (continued)
Futures contracts (continued)
Contracts | Type | Number of contracts | Expiration | Notional amount (000) | Value and unrealized (depreciation) appreciation at 12/31/2022 (000) | |||||||||||||||
S&P Mid 400 E-mini Index Contracts | Short | 210 | March 2023 | USD(51,295 | ) | $ | 773 | |||||||||||||
S&P 500 E-mini Index Contracts | Short | 3,266 | March 2023 | (630,501 | ) | 14,597 | ||||||||||||||
|
| |||||||||||||||||||
| $ | 16,651 | |||||||||||||||||||
|
| |||||||||||||||||||
Investments in affiliates2
| Value of affiliates at 1/1/2022 (000) | Additions (000) | Reductions (000) | Net realized gain (loss) (000) | Net unrealized depreciation (000) | Value of affiliates at 12/31/2022 (000) | Dividend income (000) | Capital gain distributions received (000) | |||||||||||||||||||||||||
Growth-and-income funds 79.84% | ||||||||||||||||||||||||||||||||
American Funds Insurance Series - Growth-Income Fund, Class 1 | $ | 2,125,192 | $ | 1,251,540 | $ | 1,173,057 | $ | 198,223 | $ | (724,023 | ) | $ | 1,677,875 | $ | 26,763 | $ | 175,737 | |||||||||||||||
Fixed income funds 14.97% | ||||||||||||||||||||||||||||||||
American Funds Insurance Series - The Bond Fund of America, Class 1 | 398,789 | 234,510 | 257,964 | (41,426 | ) | (19,295 | ) | 314,614 | 10,505 | 3,897 | ||||||||||||||||||||||
|
|
|
|
|
|
|
|
|
| |||||||||||||||||||||||
Total 94.81% | $ | 156,797 | $ | (743,318 | ) | $ | 1,992,489 | $ | 37,268 | $ | 179,634 | |||||||||||||||||||||
|
|
|
|
|
|
|
|
|
| |||||||||||||||||||||||
| 1 | Rate represents the seven-day yield at 12/31/2022. |
| 2 | Part of the same “group of investment companies” as the fund as defined under the Investment Company Act of 1940, as amended. |
Key to abbreviation
USD = U.S. dollars
Refer to the notes to financial statements.
| 270 | American Funds Insurance Series |
Table of Contents
Managed Risk Asset Allocation Fund
Investment portfolio December 31, 2022
| Shares | Value (000) | |||||||
Asset allocation funds 95.19% | ||||||||
American Funds Insurance Series – Asset Allocation Fund, Class 1 | 93,886,027 | $ | 2,084,270 | |||||
|
| |||||||
Total asset allocation funds (cost: $2,174,894,000) | 2,084,270 | |||||||
|
| |||||||
Short-term securities 3.19% | ||||||||
State Street Institutional U.S. Government Money Market Fund, Premier Class 4.12%1 | 69,776,962 | 69,777 | ||||||
|
| |||||||
Total short-term securities (cost: $69,777,000) | 69,777 | |||||||
|
| |||||||
Options purchased 0.02% | ||||||||
Options purchased* | 383 | |||||||
|
| |||||||
Total options purchased (cost: $1,887,000) | 383 | |||||||
|
| |||||||
Total investment securities 98.40% (cost: $2,246,558,000) | 2,154,430 | |||||||
Other assets less liabilities 1.60% | 35,042 | |||||||
|
| |||||||
Net assets 100.00% | $ | 2,189,472 | ||||||
|
| |||||||
*Options purchased
Put | ||||||||||||||||||||
Description | Number of contracts | Notional amount (000) | Exercise price | Expiration date | Value at 12/31/2022 (000) | |||||||||||||||
S&P 500 Index | 410 | USD | 157,419 | USD | 2,850.00 | 3/17/2023 | $ | 218 | ||||||||||||
S&P 500 Index | 245 | 94,068 | 2,900.00 | 3/17/2023 | 165 | |||||||||||||||
|
| |||||||||||||||||||
| $ | 383 | |||||||||||||||||||
|
| |||||||||||||||||||
Futures contracts
Contracts | Type | Number of contracts | Expiration | Notional amount (000) | Value and unrealized (depreciation) appreciation at 12/31/2022 (000) | |||||||||||||||
5 Year U.S. Treasury Note Futures | Long | 1,028 | March 2023 | USD | 110,952 | $ | (162 | ) | ||||||||||||
Mini MSCI Emerging Market Index Contracts | Short | 166 | March 2023 | (7,963 | ) | 100 | ||||||||||||||
FTSE 100 Index Contracts | Short | 89 | March 2023 | (8,036 | ) | (18 | ) | |||||||||||||
Russell 2000 Mini Index Contracts | Short | 93 | March 2023 | (8,235 | ) | 157 | ||||||||||||||
British Pound Currency Contracts | Short | 110 | March 2023 | (8,308 | ) | 196 | ||||||||||||||
Euro Stoxx 50 Index Contracts | Short | 399 | March 2023 | (16,156 | ) | 623 | ||||||||||||||
Euro Currency Contracts | Short | 124 | March 2023 | (16,669 | ) | (47 | ) | |||||||||||||
S&P Mid 400 E-mini Index Contracts | Short | 183 | March 2023 | (44,700 | ) | 548 | ||||||||||||||
S&P 500 E-mini Index Contracts | Short | 2,599 | March 2023 | (501,737 | ) | 12,185 | ||||||||||||||
|
| |||||||||||||||||||
| $ | 13,582 | |||||||||||||||||||
|
| |||||||||||||||||||
| American Funds Insurance Series | 271 |
Table of Contents
Managed Risk Asset Allocation Fund (continued)
Investments in affiliates2
| Value of affiliate at 1/1/2022 (000) | Additions (000) | Reductions (000) | Net realized gain (000) | Net unrealized depreciation (000) | Value of affiliate at 12/31/2022 (000) | Dividend income (000) | Capital gain distributions received (000) | |||||||||||||||||||||||||
Asset allocation funds 95.19% |
| |||||||||||||||||||||||||||||||
American Funds Insurance Series – Asset Allocation Fund, Class 1 | $ | 2,678,055 | $ | 1,104,342 | $ | 1,086,607 | $ | 55,156 | $ | (666,676 | ) | $ | 2,084,270 | $ | 46,591 | $ | 231,217 | |||||||||||||||
| 1 | Rate represents the seven-day yield at 12/31/2022. |
| 2 | Part of the same “group of investment companies“ as the fund as defined under the Investment Company Act of 1940, as amended. |
Key to abbreviation
USD = U.S. dollars
Refer to the notes to financial statements.
| 272 | American Funds Insurance Series |
Table of Contents
| (dollars in thousands) | ||||||||||||||||||||
| Global Growth Fund | Global Small Capitalization Fund | Growth Fund | International Fund | New World Fund | ||||||||||||||||
Assets: | ||||||||||||||||||||
Investment securities, at value: | ||||||||||||||||||||
Unaffiliated issuers | $ | 6,783,505 | $ | 2,874,530 | $ | 29,811,816 | $ | 6,445,629 | $ | 2,920,136 | ||||||||||
Affiliated issuers | 164,535 | 134,983 | 1,166,965 | 306,445 | 167,414 | |||||||||||||||
Cash | 695 | 32 | 1,221 | 1,055 | 671 | |||||||||||||||
Cash collateral received for securities on loan | — | 5,872 | 5,587 | 161 | 32 | |||||||||||||||
Cash collateral pledged for futures contracts | — | — | — | — | 161 | |||||||||||||||
Cash collateral pledged for swap contracts | — | — | — | — | — | |||||||||||||||
Cash denominated in currencies other than U.S. dollars | 6,010 | 86 | 1,197 | 1,640 | 929 | |||||||||||||||
Unrealized appreciation on open forward currency contracts | — | — | — | — | — | * | ||||||||||||||
Unrealized appreciation on unfunded commitments | — | — | — | — | — | |||||||||||||||
Receivables for: | ||||||||||||||||||||
Sales of investments | 9,427 | 47 | 4,581 | 1,634 | 4,534 | |||||||||||||||
Sales of fund’s shares | 1,203 | 347 | 53,171 | 1,486 | 1,478 | |||||||||||||||
Dividends and interest | 5,076 | 2,430 | 18,226 | 14,915 | 5,113 | |||||||||||||||
Variation margin on futures contracts | — | — | — | — | 27 | |||||||||||||||
Variation margin on centrally cleared swap contracts | — | — | — | — | — | * | ||||||||||||||
Securities lending income | 7 | 270 | 48 | 17 | 42 | |||||||||||||||
Currency translations | 961 | — | — | 47 | 90 | |||||||||||||||
Other | — | — | * | — | * | — | — | |||||||||||||
|
|
|
|
|
|
|
|
|
| |||||||||||
| 6,971,419 | 3,018,597 | 31,062,812 | 6,773,029 | 3,100,627 | ||||||||||||||||
|
|
|
|
|
|
|
|
|
| |||||||||||
Liabilities: | ||||||||||||||||||||
Collateral for securities on loan | — | 58,725 | 55,867 | 1,607 | 327 | |||||||||||||||
Unrealized depreciation on open forward currency contracts | — | — | — | — | 50 | |||||||||||||||
Unrealized depreciation on unfunded commitments | — | — | — | — | — | |||||||||||||||
Payables for: | ||||||||||||||||||||
Purchases of investments | 3,893 | 1,234 | 69,568 | 2,056 | 2,377 | |||||||||||||||
Repurchases of fund’s shares | 23,378 | 5,067 | 24,857 | 18,617 | 2,624 | |||||||||||||||
Investment advisory services | 2,202 | 1,519 | 8,498 | 2,792 | 1,351 | |||||||||||||||
Insurance administrative fees | 361 | 162 | 1,629 | 235 | 448 | |||||||||||||||
Services provided by related parties | 1,005 | 515 | 4,478 | 946 | 393 | |||||||||||||||
Trustees’ deferred compensation | 85 | 56 | 478 | 174 | 41 | |||||||||||||||
Variation margin on futures contracts | — | — | — | — | 41 | |||||||||||||||
Variation margin on centrally cleared swap contracts | — | — | — | — | — | * | ||||||||||||||
Non-U.S. taxes | 4,611 | 8,270 | 886 | 26,641 | 8,988 | |||||||||||||||
Other | 230 | 146 | 203 | 380 | 203 | |||||||||||||||
|
|
|
|
|
|
|
|
|
| |||||||||||
| 35,765 | 75,694 | 166,464 | 53,448 | 16,843 | ||||||||||||||||
|
|
|
|
|
|
|
|
|
| |||||||||||
Net assets at December 31, 2022 | $ | 6,935,654 | $ | 2,942,903 | $ | 30,896,348 | $ | 6,719,581 | $ | 3,083,784 | ||||||||||
|
|
|
|
|
|
|
|
|
| |||||||||||
Net assets consist of: | ||||||||||||||||||||
Capital paid in on shares of beneficial interest | $ | 4,528,931 | $ | 2,581,405 | $ | 20,120,055 | $ | 6,463,732 | $ | 2,578,375 | ||||||||||
Total distributable earnings (accumulated loss) | 2,406,723 | 361,498 | 10,776,293 | 255,849 | 505,409 | |||||||||||||||
|
|
|
|
|
|
|
|
|
| |||||||||||
Net assets at December 31, 2022 | $ | 6,935,654 | $ | 2,942,903 | $ | 30,896,348 | $ | 6,719,581 | $ | 3,083,784 | ||||||||||
|
|
|
|
|
|
|
|
|
| |||||||||||
Investment securities on loan, at value | $ | — | $ | 59,781 | $ | 54,504 | $ | 1,530 | $ | 311 | ||||||||||
Investment securities, at cost | ||||||||||||||||||||
Unaffiliated issuers | 4,940,295 | 2,530,368 | 20,939,019 | 5,790,481 | 2,388,619 | |||||||||||||||
Affiliated issuers | 164,509 | 133,831 | 1,166,747 | 306,396 | 167,393 | |||||||||||||||
Cash denominated in currencies other than U.S. dollars, at cost | 6,096 | 85 | 1,195 | 1,614 | 939 | |||||||||||||||
Refer to the end of the statements of assets and liabilities for footnotes.
Refer to the notes to financial statements.
| American Funds Insurance Series | 273 |
Table of Contents
| Financial statements (continued) | ||
| Statements of assets and liabilities at December 31, 2022 (continued) | ||
| (dollars in thousands) | ||||||||||||||||||||
| Washington Mutual Investors Fund | Capital World Growth and Income Fund | Growth- Income Fund | International Growth and Income Fund | Capital Income Builder | ||||||||||||||||
Assets: | ||||||||||||||||||||
Investment securities, at value: | ||||||||||||||||||||
Unaffiliated issuers | $ | 9,042,759 | $ | 1,728,292 | $ | 30,635,898 | $ | 293,962 | $ | 1,065,349 | ||||||||||
Affiliated issuers | 391,007 | 804 | 2,605,421 | 5,492 | 107,723 | |||||||||||||||
Cash | 2,877 | 739 | 2,141 | 75 | 826 | |||||||||||||||
Cash collateral received for securities on loan | 1,290 | 648 | 24,869 | 96 | 655 | |||||||||||||||
Cash collateral pledged for futures contracts | — | — | — | — | — | |||||||||||||||
Cash collateral pledged for swap contracts | — | — | — | — | — | |||||||||||||||
Cash denominated in currencies other than U.S. dollars | — | 1,728 | 844 | 556 | 753 | |||||||||||||||
Unrealized appreciation on open forward currency contracts | — | — | — | 5 | — | |||||||||||||||
Unrealized appreciation on unfunded commitments | — | — | — | — | — | |||||||||||||||
Receivables for: | ||||||||||||||||||||
Sales of investments | 19,678 | 4,368 | 3,486 | 1,304 | 17,973 | |||||||||||||||
Sales of fund’s shares | 1,698 | 332 | 11,206 | 54 | 475 | |||||||||||||||
Dividends and interest | 11,258 | 1,617 | 53,240 | 1,606 | 3,711 | |||||||||||||||
Variation margin on futures contracts | — | — | — | — | 2 | |||||||||||||||
Variation margin on centrally cleared swap contracts | — | — | — | — | 22 | |||||||||||||||
Securities lending income | 7 | 5 | 71 | 3 | 4 | |||||||||||||||
Currency translations | 3 | 252 | — | 75 | 101 | |||||||||||||||
Other | — | — | — | — | — | |||||||||||||||
|
|
|
|
|
|
|
|
|
| |||||||||||
| 9,470,577 | 1,738,785 | 33,337,176 | 303,228 | 1,197,594 | ||||||||||||||||
|
|
|
|
|
|
|
|
|
| |||||||||||
Liabilities: | ||||||||||||||||||||
Collateral for securities on loan | 12,908 | 6,480 | 248,693 | 962 | 6,553 | |||||||||||||||
Unrealized depreciation on open forward currency contracts | — | — �� | — | — | — | |||||||||||||||
Unrealized depreciation on unfunded commitments | — | — | — | — | — | |||||||||||||||
Payables for: | ||||||||||||||||||||
Purchases of investments | 2,823 | 1,089 | 28,952 | 197 | 49,380 | |||||||||||||||
Repurchases of fund’s shares | 7,197 | 4,367 | 62,689 | 744 | 1,446 | |||||||||||||||
Investment advisory services | 1,903 | 544 | 7,284 | 121 | 211 | |||||||||||||||
Insurance administrative fees | 706 | 118 | 1,021 | 74 | 328 | |||||||||||||||
Services provided by related parties | 1,072 | 299 | 3,696 | 69 | 143 | |||||||||||||||
Trustees’ deferred compensation | 99 | 25 | 530 | 14 | 7 | |||||||||||||||
Variation margin on futures contracts | — | — | — | — | 95 | |||||||||||||||
Variation margin on centrally cleared swap contracts | — | — | — | — | 25 | |||||||||||||||
Non-U.S. taxes | 159 | 410 | 1,143 | 35 | 320 | |||||||||||||||
Other | 10 | 55 | 201 | 15 | 20 | |||||||||||||||
|
|
|
|
|
|
|
|
|
| |||||||||||
| 26,877 | 13,387 | 354,209 | 2,231 | 58,528 | ||||||||||||||||
|
|
|
|
|
|
|
|
|
| |||||||||||
Net assets at December 31, 2022 | $ | 9,443,700 | $ | 1,725,398 | $ | 32,982,967 | $ | 300,997 | $ | 1,139,066 | ||||||||||
|
|
|
|
|
|
|
|
|
| |||||||||||
Net assets consist of: | ||||||||||||||||||||
Capital paid in on shares of beneficial interest | $ | 7,625,116 | $ | 1,532,409 | $ | 20,816,349 | $ | 322,284 | $ | 1,032,534 | ||||||||||
Total distributable earnings (accumulated loss) | 1,818,584 | 192,989 | 12,166,618 | (21,287 | ) | 106,532 | ||||||||||||||
|
|
|
|
|
|
|
|
|
| |||||||||||
Net assets at December 31, 2022 | $ | 9,443,700 | $ | 1,725,398 | $ | 32,982,967 | $ | 300,997 | $ | 1,139,066 | ||||||||||
|
|
|
|
|
|
|
|
|
| |||||||||||
Investment securities on loan, at value | $ | 12,432 | $ | 6,155 | $ | 240,456 | $ | 1,435 | $ | 6,251 | ||||||||||
Investment securities, at cost | ||||||||||||||||||||
Unaffiliated issuers | 7,334,340 | 1,456,490 | 20,399,086 | 290,864 | 933,032 | |||||||||||||||
Affiliated issuers | 390,957 | 804 | 2,605,095 | 5,489 | 113,396 | |||||||||||||||
Cash denominated in currencies other than U.S. dollars, at cost | — | 1,754 | 847 | 564 | 763 | |||||||||||||||
Refer to the end of the statements of assets and liabilities for footnotes.
Refer to the notes to financial statements.
| 274 | American Funds Insurance Series |
Table of Contents
| Financial statements (continued) | ||
| Statements of assets and liabilities at December 31, 2022 (continued) | ||
| (dollars in thousands) | ||||||||||||||||||||
| Asset Allocation Fund | American Funds Global Balanced Fund† | The Bond Fund of America | Capital World Bond Fund | American High-Income Trust | ||||||||||||||||
Assets: | ||||||||||||||||||||
Investment securities, at value: | ||||||||||||||||||||
Unaffiliated issuers | $ | 22,298,926 | $ | 355,901 | $ | 9,747,773 | $ | 1,438,501 | $ | 778,564 | ||||||||||
Affiliated issuers | 3,019,460 | 9,460 | 1,425,720 | 48,843 | 38,565 | |||||||||||||||
Cash | 4,463 | 142 | 3,761 | 431 | 1,024 | |||||||||||||||
Cash collateral received for securities on loan | 5,690 | — | — | — | — | |||||||||||||||
Cash collateral pledged for futures contracts | — | — | — | — | 99 | |||||||||||||||
Cash collateral pledged for swap contracts | — | — | — | — | 517 | |||||||||||||||
Cash denominated in currencies other than U.S. dollars | 592 | 86 | — | * | 732 | 5 | ||||||||||||||
Unrealized appreciation on open forward currency contracts | — | 686 | 3,821 | 7,008 | — | |||||||||||||||
Unrealized appreciation on unfunded commitments | — | — | — | 12 | 572 | |||||||||||||||
Receivables for: | ||||||||||||||||||||
Sales of investments | 139,321 | 2,041 | 780,689 | 21 | 1,605 | |||||||||||||||
Sales of fund’s shares | 1,899 | 327 | 10,460 | 165 | 585 | |||||||||||||||
Dividends and interest | 74,681 | 1,624 | 71,420 | 10,334 | 13,187 | |||||||||||||||
Variation margin on futures contracts | 194 | 29 | 494 | 326 | 2 | |||||||||||||||
Variation margin on centrally cleared swap contracts | 11 | 16 | 345 | 149 | 3 | |||||||||||||||
Securities lending income | 88 | — | — | — | — | |||||||||||||||
Currency translations | 79 | 18 | 70 | 429 | — | |||||||||||||||
Other | — | — | — | — | 3 | |||||||||||||||
|
|
|
|
|
|
|
|
|
| |||||||||||
| 25,545,404 | 370,330 | 12,044,553 | 1,506,951 | 834,731 | ||||||||||||||||
|
|
|
|
|
|
|
|
|
| |||||||||||
Liabilities: | ||||||||||||||||||||
Collateral for securities on loan | 56,897 | — | — | — | — | |||||||||||||||
Unrealized depreciation on open forward currency contracts | — | 150 | 174 | 2,455 | — | |||||||||||||||
Unrealized depreciation on unfunded commitments | 9 | — | — | 1 | 3 | |||||||||||||||
Payables for: | ||||||||||||||||||||
Purchases of investments | 647,278 | 1,470 | 1,812,910 | 19,999 | 2,546 | |||||||||||||||
Repurchases of fund’s shares | 24,374 | 477 | 4,453 | 677 | 164 | |||||||||||||||
Investment advisory services | 5,696 | 137 | 1,428 | 550 | 190 | |||||||||||||||
Insurance administrative fees | 3,321 | 69 | 614 | 33 | 49 | |||||||||||||||
Services provided by related parties | 2,697 | 66 | 1,048 | 217 | 153 | |||||||||||||||
Trustees’ deferred compensation | 304 | 4 | 124 | 26 | 32 | |||||||||||||||
Variation margin on futures contracts | 630 | 55 | 2,321 | 722 | 6 | |||||||||||||||
Variation margin on centrally cleared swap contracts | 13 | 23 | 394 | 222 | 2 | |||||||||||||||
Non-U.S. taxes | 3,511 | 100 | 5 | 51 | — | |||||||||||||||
Other | 100 | 19 | — | * | 104 | 32 | ||||||||||||||
|
|
|
|
|
|
|
|
|
| |||||||||||
| 744,830 | 2,570 | 1,823,471 | 25,057 | 3,177 | ||||||||||||||||
|
|
|
|
|
|
|
|
|
| |||||||||||
Net assets at December 31, 2022 | $ | 24,800,574 | $ | 367,760 | $ | 10,221,082 | $ | 1,481,894 | $ | 831,554 | ||||||||||
|
|
|
|
|
|
|
|
|
| |||||||||||
Net assets consist of: | ||||||||||||||||||||
Capital paid in on shares of beneficial interest | $ | 19,598,942 | $ | 316,997 | $ | 11,855,514 | $ | 1,808,688 | $ | 1,203,258 | ||||||||||
Total distributable earnings (accumulated loss) | 5,201,632 | 50,763 | (1,634,432 | ) | (326,794 | ) | (371,704 | ) | ||||||||||||
|
|
|
|
|
|
|
|
|
| |||||||||||
Net assets at December 31, 2022 | $ | 24,800,574 | $ | 367,760 | $ | 10,221,082 | $ | 1,481,894 | $ | 831,554 | ||||||||||
|
|
|
|
|
|
|
|
|
| |||||||||||
Investment securities on loan, at value | $ | 67,688 | $ | — | $ | — | $ | — | $ | — | ||||||||||
Investment securities, at cost | ||||||||||||||||||||
Unaffiliated issuers | 17,788,591 | 350,438 | 10,540,249 | 1,615,990 | 860,644 | |||||||||||||||
Affiliated issuers | 3,328,159 | 9,409 | 1,425,521 | 47,246 | 38,557 | |||||||||||||||
Cash denominated in currencies other than U.S. dollars, at cost | 594 | 86 | — | * | 728 | 5 | ||||||||||||||
Refer to the end of the statements of assets and liabilities for footnotes.
Refer to the notes to financial statements.
| American Funds Insurance Series | 275 |
Table of Contents
| Financial statements (continued) | ||
| Statements of assets and liabilities at December 31, 2022 (continued) | ||
(dollars in thousands) | ||||||||||||||||||||
| American Funds Mortgage Fund | Ultra-Short Bond Fund | U.S. Government Securities Fund | Managed Risk Growth Fund | Managed Risk International Fund | ||||||||||||||||
Assets: | ||||||||||||||||||||
Investment securities, at value: | ||||||||||||||||||||
Unaffiliated issuers | $ | 107,371 | $ | 423,579 | $ | 1,718,005 | $ | 11,472 | $ | 2,805 | ||||||||||
Affiliated issuers | — | — | — | 421,664 | 118,962 | |||||||||||||||
Cash | 2,692 | 9,083 | 40,936 | — | — | |||||||||||||||
Cash collateral received for securities on loan | — | — | — | — | — | |||||||||||||||
Cash collateral pledged for futures contracts | — | — | — | 15,705 | 2,698 | |||||||||||||||
Cash collateral pledged for swap contracts | — | — | — | — | — | |||||||||||||||
Cash denominated in currencies other than U.S. dollars | — | — | — | — | — | |||||||||||||||
Unrealized appreciation on open forward currency contracts | — | — | — | — | — | |||||||||||||||
Unrealized appreciation on unfunded commitments | — | — | — | — | — | |||||||||||||||
Receivables for: | ||||||||||||||||||||
Sales of investments | 9,780 | — | 134,003 | 6,691 | 1,022 | |||||||||||||||
Sales of fund’s shares | 42 | 322 | 2,930 | 237 | 18 | |||||||||||||||
Dividends and interest | 261 | 29 | 5,528 | 57 | 13 | |||||||||||||||
Variation margin on futures contracts | 2 | — | 185 | 1,011 | 602 | |||||||||||||||
Variation margin on centrally cleared swap contracts | 5 | — | 385 | — | — | |||||||||||||||
Securities lending income | — | — | — | — | — | |||||||||||||||
Currency translations | — | — | — | — | — | |||||||||||||||
Other | 1 | — | — | — | — | |||||||||||||||
|
|
|
|
|
|
|
|
|
| |||||||||||
| 120,154 | 433,013 | 1,901,972 | 456,837 | 126,120 | ||||||||||||||||
|
|
|
|
|
|
|
|
|
| |||||||||||
Liabilities: | ||||||||||||||||||||
Collateral for securities on loan | — | — | — | — | — | |||||||||||||||
Unrealized depreciation on open forward currency contracts | — | — | — | — | — | |||||||||||||||
Unrealized depreciation on unfunded commitments | — | — | — | — | — | |||||||||||||||
Payables for: | ||||||||||||||||||||
Purchases of investments | 31,002 | — | 398,190 | 2,108 | 19 | |||||||||||||||
Repurchases of fund’s shares | 22 | 504 | 1,200 | 4 | 43 | |||||||||||||||
Investment advisory services | 13 | 95 | 226 | 39 | 11 | |||||||||||||||
Insurance administrative fees | 25 | 50 | 119 | 287 | 80 | |||||||||||||||
Services provided by related parties | 21 | 92 | 310 | 93 | 26 | |||||||||||||||
Trustees’ deferred compensation | 3 | 11 | 44 | 3 | 1 | |||||||||||||||
Variation margin on futures contracts | 25 | — | 744 | 61 | 6 | |||||||||||||||
Variation margin on centrally cleared swap contracts | — | * | — | 415 | — | — | ||||||||||||||
Non-U.S. taxes | — | — | — | — | — | |||||||||||||||
Other | — | * | — | 2 | — | — | ||||||||||||||
|
|
|
|
|
|
|
|
|
| |||||||||||
| 31,111 | 752 | 401,250 | 2,595 | 186 | ||||||||||||||||
|
|
|
|
|
|
|
|
|
| |||||||||||
Net assets at December 31, 2022 | $ | 89,043 | $ | 432,261 | $ | 1,500,722 | $ | 454,242 | $ | 125,934 | ||||||||||
|
|
|
|
|
|
|
|
|
| |||||||||||
Net assets consist of: | ||||||||||||||||||||
Capital paid in on shares of beneficial interest | $ | 99,881 | $ | 429,623 | $ | 1,743,160 | $ | 471,757 | $ | 148,875 | ||||||||||
Total distributable earnings (accumulated loss) | (10,838 | ) | 2,638 | (242,438 | ) | (17,515 | ) | (22,941 | ) | |||||||||||
|
|
|
|
|
|
|
|
|
| |||||||||||
Net assets at December 31, 2022 | $ | 89,043 | $ | 432,261 | $ | 1,500,722 | $ | 454,242 | $ | 125,934 | ||||||||||
|
|
|
|
|
|
|
|
|
| |||||||||||
Investment securities on loan, at value | $ | — | $ | — | $ | — | $ | — | $ | — | ||||||||||
Investment securities, at cost | ||||||||||||||||||||
Unaffiliated issuers | 109,975 | 423,636 | 1,798,414 | 12,483 | 3,035 | |||||||||||||||
Affiliated issuers | — | — | — | 474,986 | 132,656 | |||||||||||||||
Cash denominated in currencies other than U.S. dollars, at cost | — | — | — | — | — | |||||||||||||||
Refer to the end of the statements of assets and liabilities for footnotes.
Refer to the notes to financial statements.
| 276 | American Funds Insurance Series |
Table of Contents
| Financial statements (continued) | ||
| Statements of assets and liabilities at December 31, 2022 (continued) | ||
| (dollars in thousands) | ||||||||||||
| Managed Risk Washington Mutual Investors Fund | Managed Risk Growth- Income Fund | Managed Risk Asset Allocation Fund | ||||||||||
Assets: | ||||||||||||
Investment securities, at value: | ||||||||||||
Unaffiliated issuers | $ | 7,775 | $ | 49,790 | $ | 70,160 | ||||||
Affiliated issuers | 306,922 | 1,992,489 | 2,084,270 | |||||||||
Cash | — | — | — | |||||||||
Cash collateral received for securities on loan | — | — | — | |||||||||
Cash collateral pledged for futures contracts | 6,746 | 43,741 | 34,859 | |||||||||
Cash collateral pledged for swap contracts | — | — | — | |||||||||
Cash denominated in currencies other than U.S. dollars | — | — | — | |||||||||
Unrealized appreciation on open forward currency contracts | — | — | — | |||||||||
Unrealized appreciation on unfunded commitments | — | — | — | |||||||||
Receivables for: | ||||||||||||
Sales of investments | 2,029 | 13,902 | 1,056 | |||||||||
Sales of fund’s shares | 72 | 11,603 | 104 | |||||||||
Dividends and interest | 36 | 229 | 280 | |||||||||
Variation margin on futures contracts | 363 | 2,759 | 2,144 | |||||||||
Variation margin on centrally cleared swap contracts | — | — | — | |||||||||
Securities lending income | — | — | — | |||||||||
Currency translations | — | — | — | |||||||||
Other | — | — | — | |||||||||
|
|
|
|
|
| |||||||
| 323,943 | 2,114,513 | 2,192,873 | ||||||||||
|
|
|
|
|
| |||||||
Liabilities: | ||||||||||||
Collateral for securities on loan | — | — | — | |||||||||
Unrealized depreciation on open forward currency contracts | — | — | — | |||||||||
Unrealized depreciation on unfunded commitments | — | — | — | |||||||||
Payables for: | ||||||||||||
Purchases of investments | 63 | 10,953 | — | |||||||||
Repurchases of fund’s shares | 92 | 420 | 1,215 | |||||||||
Investment advisory services | 28 | 179 | 188 | |||||||||
Insurance administrative fees | 201 | 1,304 | 1,381 | |||||||||
Services provided by related parties | 67 | 56 | 465 | |||||||||
Trustees’ deferred compensation | 3 | 14 | 29 | |||||||||
Variation margin on futures contracts | 17 | 143 | 123 | |||||||||
Variation margin on centrally cleared swap contracts | — | — | — | |||||||||
Non-U.S. taxes | — | — | — | |||||||||
Other | — | — | — | |||||||||
|
|
|
|
|
| |||||||
| 471 | 13,069 | 3,401 | ||||||||||
|
|
|
|
|
| |||||||
Net assets at December 31, 2022 | $ | 323,472 | $ | 2,101,444 | $ | 2,189,472 | ||||||
|
|
|
|
|
| |||||||
Net assets consist of: | ||||||||||||
Capital paid in on shares of beneficial interest | $ | 321,451 | $ | 1,965,919 | $ | 2,033,928 | ||||||
Total distributable earnings (accumulated loss) | 2,021 | 135,525 | 155,544 | |||||||||
|
|
|
|
|
| |||||||
Net assets at December 31, 2022 | $ | 323,472 | $ | 2,101,444 | $ | 2,189,472 | ||||||
|
|
|
|
|
| |||||||
Investment securities on loan, at value | $ | — | $ | — | $ | — | ||||||
Investment securities, at cost | ||||||||||||
Unaffiliated issuers | 8,755 | 60,766 | 71,664 | |||||||||
Affiliated issuers | 334,257 | 2,105,528 | 2,174,894 | |||||||||
Cash denominated in currencies other than U.S. dollars, at cost | — | — | — | |||||||||
Refer to the end of the statements of assets and liabilities for footnotes.
Refer to the notes to financial statements.
| American Funds Insurance Series | 277 |
Table of Contents
| Financial statements (continued) | ||
| Statements of assets and liabilities at December 31, 2022 (continued) | ||
| (dollars and shares in thousands, except per-share amounts) | ||||||||||||||||||||||
| Global Growth Fund | Global Small Capitalization Fund | Growth Fund | International Fund | New World Fund | ||||||||||||||||||
Shares of beneficial interest issued and outstanding (no stated par value) – unlimited shares authorized | ||||||||||||||||||||||
Class 1: | Net assets | $ | 3,104,085 | $ | 915,430 | $ | 13,660,417 | $ | 3,157,234 | $ | 1,610,310 | |||||||||||
Shares outstanding | 102,854 | 56,436 | 179,057 | 206,282 | 72,225 | |||||||||||||||||
Net asset value per share | $ | 30.18 | $ | 16.22 | $ | 76.29 | $ | 15.31 | $ | 22.30 | ||||||||||||
|
|
|
|
|
|
|
|
|
| |||||||||||||
Class 1A: | Net assets | $ | 14,317 | $ | 4,256 | $ | 187,432 | $ | 10,423 | $ | 8,868 | |||||||||||
Shares outstanding | 477 | 266 | 2,479 | 685 | 399 | |||||||||||||||||
Net asset value per share | $ | 30.04 | $ | 16.00 | $ | 75.61 | $ | 15.23 | $ | 22.19 | ||||||||||||
|
|
|
|
|
|
|
|
|
| |||||||||||||
Class 2: | Net assets | $ | 3,233,725 | $ | 1,762,209 | $ | 14,451,475 | $ | 3,163,979 | $ | 763,546 | |||||||||||
Shares outstanding | 108,539 | 115,167 | 191,651 | 207,745 | 34,672 | |||||||||||||||||
Net asset value per share | $ | 29.79 | $ | 15.30 | $ | 75.41 | $ | 15.23 | $ | 22.02 | ||||||||||||
|
|
|
|
|
|
|
|
|
| |||||||||||||
Class 3: | Net assets | $ | 187,905 | $ | 15,480 | |||||||||||||||||
Shares outstanding | Not applicable | Not applicable | 2,438 | 1,008 | Not applicable | |||||||||||||||||
Net asset value per share | $ | 77.09 | $ | 15.35 | ||||||||||||||||||
|
|
|
|
|
|
|
|
|
| |||||||||||||
Class 4: | Net assets | $ | 583,527 | $ | 261,008 | $ | 2,409,119 | $ | 372,465 | $ | 701,060 | |||||||||||
Shares outstanding | 19,774 | 17,087 | 32,713 | 24,843 | 32,104 | |||||||||||||||||
Net asset value per share | $ | 29.51 | $ | 15.28 | $ | 73.64 | $ | 14.99 | $ | 21.84 | ||||||||||||
|
|
|
|
|
|
|
|
|
| |||||||||||||
| Washington Mutual Investors Fund | Capital World Growth and Income Fund | Growth- Income Fund | International Growth and Income Fund | Capital Income Builder | ||||||||||||||||||
Shares of beneficial interest issued and outstanding (no stated par value) – unlimited shares authorized | ||||||||||||||||||||||
Class 1: | Net assets | $ | 5,506,834 | $ | 548,491 | $ | 19,692,010 | $ | 13,396 | $ | 586,560 | |||||||||||
Shares outstanding | 433,800 | 46,994 | 392,155 | 1,499 | 53,377 | |||||||||||||||||
Net asset value per share | $ | 12.69 | $ | 11.67 | $ | 50.21 | $ | 8.94 | $ | 10.99 | ||||||||||||
|
|
|
|
|
|
|
|
|
| |||||||||||||
Class 1A: | Net assets | $ | 64,036 | $ | 5,749 | $ | 28,316 | $ | 4,894 | $ | 9,764 | |||||||||||
Shares outstanding | 5,079 | 496 | 567 | 562 | 890 | |||||||||||||||||
Net asset value per share | $ | 12.61 | $ | 11.61 | $ | 49.93 | $ | 8.70 | $ | 10.98 | ||||||||||||
|
|
|
|
|
|
|
|
|
| |||||||||||||
Class 2: | Net assets | $ | 2,775,107 | $ | 982,987 | $ | 11,507,731 | $ | 162,036 | $ | 13,016 | |||||||||||
Shares outstanding | 222,723 | 84,464 | 232,660 | 18,628 | 1,185 | |||||||||||||||||
Net asset value per share | $ | 12.46 | $ | 11.64 | $ | 49.46 | $ | 8.70 | $ | 10.98 | ||||||||||||
|
|
|
|
|
|
|
|
|
| |||||||||||||
Class 3: | Net assets | $ | 124,729 | |||||||||||||||||||
Shares outstanding | Not applicable | Not applicable | 2,478 | Not applicable | Not applicable | |||||||||||||||||
Net asset value per share | $ | 50.33 | ||||||||||||||||||||
|
|
|
|
|
|
|
|
|
| |||||||||||||
Class 4: | Net assets | $ | 1,097,723 | $ | 188,171 | $ | 1,630,181 | $ | 120,671 | $ | 529,726 | |||||||||||
Shares outstanding | 88,991 | 16,576 | 33,460 | 14,090 | 48,314 | |||||||||||||||||
Net asset value per share | $ | 12.34 | $ | 11.35 | $ | 48.72 | $ | 8.56 | $ | 10.96 | ||||||||||||
|
|
|
|
|
|
|
|
|
| |||||||||||||
Refer to the end of the statements of assets and liabilities for footnotes.
Refer to the notes to financial statements.
| 278 | American Funds Insurance Series |
Table of Contents
| Financial statements (continued) | ||
| Statements of assets and liabilities at December 31, 2022 (continued) | ||
| (dollars and shares in thousands, except per-share amounts) | ||||||||||||||||||||||
| Asset Allocation Fund | American Funds Global Balanced Fund† | The Bond Fund of America | Capital World Bond Fund | American High-Income Trust | ||||||||||||||||||
Shares of beneficial interest issued and outstanding (no stated par value) – unlimited shares authorized | ||||||||||||||||||||||
Class 1: | Net assets | $ | 15,137,832 | $ | 96,407 | $ | 6,369,876 | $ | 663,191 | $ | 223,824 | |||||||||||
Shares outstanding | 681,900 | 7,682 | 676,909 | 69,436 | 26,230 | |||||||||||||||||
Net asset value per share | $ | 22.20 | $ | 12.55 | $ | 9.41 | $ | 9.55 | $ | 8.53 | ||||||||||||
|
|
|
|
|
|
|
|
|
| |||||||||||||
Class 1A: | Net assets | $ | 26,595 | $ | 2,555 | $ | 220,548 | $ | 1,344 | $ | 1,263 | |||||||||||
Shares outstanding | 1,203 | 204 | 23,592 | 141 | 148 | |||||||||||||||||
Net asset value per share | $ | 22.10 | $ | 12.49 | $ | 9.35 | $ | 9.50 | $ | 8.51 | ||||||||||||
|
|
|
|
|
|
|
|
|
| |||||||||||||
Class 2: | Net assets | $ | 4,227,802 | $ | 157,808 | $ | 2,843,749 | $ | 764,813 | $ | 521,241 | |||||||||||
Shares outstanding | 192,995 | 12,632 | 306,636 | 80,914 | 62,452 | |||||||||||||||||
Net asset value per share | $ | 21.91 | $ | 12.49 | $ | 9.27 | $ | 9.45 | $ | 8.35 | ||||||||||||
|
|
|
|
|
|
|
|
|
| |||||||||||||
Class 3: | Net assets | $ | 28,209 | $ | 8,471 | |||||||||||||||||
Shares outstanding | 1,269 | Not applicable | Not applicable | Not applicable | 987 | |||||||||||||||||
Net asset value per share | $ | 22.23 | $ | 8.58 | ||||||||||||||||||
|
|
|
|
|
|
|
|
|
| |||||||||||||
Class 4: | Net assets | $ | 5,380,136 | $ | 110,990 | $ | 786,909 | $ | 52,546 | $ | 76,755 | |||||||||||
Shares outstanding | 247,415 | 9,009 | 85,213 | 5,633 | 8,291 | |||||||||||||||||
Net asset value per share | $ | 21.75 | $ | 12.32 | $ | 9.23 | $ | 9.33 | $ | 9.26 | ||||||||||||
|
|
|
|
|
|
|
|
|
| |||||||||||||
| American Funds Mortgage Fund | Ultra-Short Bond Fund | U.S. Government Securities Fund | Managed Risk Growth Fund | Managed Risk International Fund | ||||||||||||||||||
Shares of beneficial interest issued and outstanding (no stated par value) – unlimited shares authorized | ||||||||||||||||||||||
Class 1: | Net assets | $ | 993 | $ | 50,347 | $ | 241,681 | |||||||||||||||
Shares outstanding | 105 | 4,436 | 24,189 | Not applicable | Not applicable | |||||||||||||||||
Net asset value per share | $ | 9.45 | $ | 11.35 | $ | 9.99 | ||||||||||||||||
|
|
|
|
|
|
|
|
|
| |||||||||||||
Class 1A: | Net assets | $ | 1,656 | $ | 10 | $ | 3,952 | |||||||||||||||
Shares outstanding | 177 | 1 | 397 | Not applicable | Not applicable | |||||||||||||||||
Net asset value per share | $ | 9.34 | $ | 11.35 | $ | 9.96 | ||||||||||||||||
|
|
|
|
|
|
|
|
|
| |||||||||||||
Class 2: | Net assets | $ | 46,324 | $ | 297,253 | $ | 1,058,577 | |||||||||||||||
Shares outstanding | 4,951 | 27,031 | 107,285 | Not applicable | Not applicable | |||||||||||||||||
Net asset value per share | $ | 9.36 | $ | 11.00 | $ | 9.87 | ||||||||||||||||
|
|
|
|
|
|
|
|
|
| |||||||||||||
Class 3: | Net assets | $ | 4,328 | $ | 6,507 | |||||||||||||||||
Shares outstanding | Not applicable | 389 | 649 | Not applicable | Not applicable | |||||||||||||||||
Net asset value per share | $ | 11.14 | $ | 10.02 | ||||||||||||||||||
|
|
|
|
|
|
|
|
|
| |||||||||||||
Class 4: | Net assets | $ | 40,070 | $ | 80,323 | $ | 190,005 | |||||||||||||||
Shares outstanding | 4,334 | 7,267 | 19,274 | Not applicable | Not applicable | |||||||||||||||||
| Net asset value per share | $ | 9.25 | $ | 11.05 | $ | 9.86 | ||||||||||||||||
|
|
|
|
|
|
|
|
|
| |||||||||||||
Class P1: | Net assets | $ | 9,249 | $ | 1,762 | |||||||||||||||||
Shares outstanding | Not applicable | Not applicable | Not applicable | 813 | 205 | |||||||||||||||||
Net asset value per share | $ | 11.37 | $ | 8.61 | ||||||||||||||||||
|
|
|
|
|
|
|
|
|
| |||||||||||||
Class P2: | Net assets | $ | 444,993 | $ | 124,172 | |||||||||||||||||
Shares outstanding | Not applicable | Not applicable | Not applicable | 39,434 | 14,470 | |||||||||||||||||
Net asset value per share | $ | 11.28 | $ | 8.58 | ||||||||||||||||||
|
|
|
|
|
|
|
|
|
| |||||||||||||
Refer to the end of the statements of assets and liabilities for footnotes.
Refer to the notes to financial statements.
| American Funds Insurance Series | 279 |
Table of Contents
| Financial statements (continued) | ||
| Statements of assets and liabilities at December 31, 2022 (continued) | ||
| (dollars and shares in thousands, except per-share amounts) | ||||||||||||||
| Managed Risk Washington Mutual Investors Fund | Managed Risk Growth- Income Fund | Managed Risk Asset Allocation Fund | ||||||||||||
Shares of beneficial interest issued and outstanding (no stated par value) – unlimited shares authorized | ||||||||||||||
Class P1: | Net assets | $ | 2,748 | $ | 1,833,437 | $ | 7,152 | |||||||
Shares outstanding | 244 | 146,536 | 575 | |||||||||||
Net asset value per share | $ | 11.24 | $ | 12.51 | $ | 12.43 | ||||||||
|
|
|
|
|
| |||||||||
Class P2: | Net assets | $ | 320,724 | $ | 268,007 | $ | 2,182,320 | |||||||
Shares outstanding | 28,686 | 21,540 | 180,515 | |||||||||||
Net asset value per share | $ | 11.18 | $ | 12.44 | $ | 12.09 | ||||||||
|
|
|
|
|
| |||||||||
| * | Amount less than one thousand. |
| † | Formerly Global Balanced Fund. |
Refer to the notes to financial statements.
| 280 | American Funds Insurance Series |
Table of Contents
| Financial statements (continued) | ||
| Statements of operations for the year ended December 31, 2022 | ||
| (dollars in thousands) | ||||||||||||||||||||
| Global Growth Fund | Global Small Capitalization Fund | Growth Fund | International Fund | New World Fund | ||||||||||||||||
Investment income: | ||||||||||||||||||||
Income (net of non-U.S. taxes1): | ||||||||||||||||||||
Dividends: | ||||||||||||||||||||
Unaffiliated issuers | $ | 99,453 | $ | 23,688 | $ | 315,299 | $ | 164,844 | $ | 57,252 | ||||||||||
Affiliated issuers | 9,353 | 3,871 | 22,361 | 9,392 | 4,331 | |||||||||||||||
|
|
|
|
|
|
|
|
|
| |||||||||||
| 108,806 | 27,559 | 337,660 | 174,236 | 61,583 | ||||||||||||||||
Interest from unaffiliated issuers | 53 | 25 | 1,956 | 2 | 7,384 | |||||||||||||||
European Union withholding tax reclaims | 782 | 264 | 818 | 5,544 | 358 | |||||||||||||||
Interest from European Union withholding tax reclaims | 71 | 3 | 22 | 920 | 14 | |||||||||||||||
Securities lending income (net of fees) | 178 | 2,281 | 1,158 | 1,331 | 338 | |||||||||||||||
|
|
|
|
|
|
|
|
|
| |||||||||||
| 109,890 | 30,132 | 341,614 | 182,033 | 69,677 | ||||||||||||||||
|
|
|
|
|
|
|
|
|
| |||||||||||
Fees and expenses1: | ||||||||||||||||||||
Investment advisory services | 36,131 | 21,657 | 109,146 | 35,444 | 21,012 | |||||||||||||||
Distribution services | 10,254 | 5,525 | 48,823 | 9,585 | 3,999 | |||||||||||||||
Insurance administrative services | 1,537 | 699 | 6,939 | 1,008 | 1,923 | |||||||||||||||
Transfer agent services | 1 | — | 2 | 6 | 1 | 1 | ||||||||||||||
Administrative services | 2,236 | 973 | 10,468 | 2,191 | 1,018 | |||||||||||||||
Accounting and administrative services | — | — | — | — | — | |||||||||||||||
Reports to shareholders | 77 | 41 | 299 | 90 | 34 | |||||||||||||||
Registration statement and prospectus | 27 | 14 | 136 | 54 | 14 | |||||||||||||||
Trustees’ compensation | 10 | 5 | 45 | 10 | 5 | |||||||||||||||
Auditing and legal | 79 | 92 | 105 | 90 | 109 | |||||||||||||||
Custodian | 868 | 430 | 384 | 1,246 | 758 | |||||||||||||||
Other | 8 | 51 | 24 | 8 | 51 | |||||||||||||||
|
|
|
|
|
|
|
|
|
| |||||||||||
Total fees and expenses before waivers/reimbursement | 51,228 | 29,487 | 176,375 | 49,727 | 28,924 | |||||||||||||||
Less waivers/reimbursement of fees and expenses: | ||||||||||||||||||||
Investment advisory services waivers | 5,162 | 1,011 | 1 | — | 3,759 | |||||||||||||||
Miscellaneous fee reimbursement | — | — | — | — | — | |||||||||||||||
|
|
|
|
|
|
|
|
|
| |||||||||||
Total waivers/reimbursement of fees and expenses | 5,162 | 1,011 | 1 | — | 3,759 | |||||||||||||||
|
|
|
|
|
|
|
|
|
| |||||||||||
Total fees and expenses after waivers/reimbursement | 46,066 | 28,476 | 176,374 | 49,727 | 25,165 | |||||||||||||||
|
|
|
|
|
|
|
|
|
| |||||||||||
Net investment income | 63,824 | 1,656 | 165,240 | 132,306 | 44,512 | |||||||||||||||
|
|
|
|
|
|
|
|
|
| |||||||||||
Net realized gain (loss) and unrealized depreciation: | ||||||||||||||||||||
Net realized gain (loss)1 on: | ||||||||||||||||||||
Investments in: | ||||||||||||||||||||
Unaffiliated issuers | 555,056 | 25,932 | 1,853,746 | (374,601 | ) | (3,895 | ) | |||||||||||||
Affiliated issuers | (71 | ) | (30 | ) | (325 | ) | (112 | ) | (44 | ) | ||||||||||
Futures contracts | — | — | — | — | 100 | |||||||||||||||
Forward currency contracts | — | — | — | — | 379 | |||||||||||||||
Swap contracts | — | — | — | — | (2 | ) | ||||||||||||||
Currency transactions | (1,864 | ) | 50 | 654 | (3,241 | ) | 72 | |||||||||||||
Capital gain distributions received from affiliated issuers | — | — | — | — | — | |||||||||||||||
|
|
|
|
|
|
|
|
|
| |||||||||||
| 553,121 | 25,952 | 1,854,075 | (377,954 | ) | (3,390 | ) | ||||||||||||||
|
|
|
|
|
|
|
|
|
| |||||||||||
Net unrealized (depreciation) appreciation1 on: | ||||||||||||||||||||
Investments in: | ||||||||||||||||||||
Unaffiliated issuers | (2,977,320 | ) | (1,267,074 | ) | (15,238,570 | ) | (1,582,438 | ) | (968,542 | ) | ||||||||||
Affiliated issuers | (19 | ) | (25,285 | ) | 22 | (57 | ) | 5 | ||||||||||||
Futures contracts | — | — | — | — | 129 | |||||||||||||||
Forward currency contracts | — | — | — | — | (30 | ) | ||||||||||||||
Swap contracts | — | — | — | — | 2 | |||||||||||||||
Currency translations | 395 | (145 | ) | (48 | ) | (351 | ) | (1,943 | ) | |||||||||||
|
|
|
|
|
|
|
|
|
| |||||||||||
| (2,976,944 | ) | (1,292,504 | ) | (15,238,596 | ) | (1,582,846 | ) | (970,379 | ) | |||||||||||
|
|
|
|
|
|
|
|
|
| |||||||||||
Net realized gain (loss) and unrealized depreciation | (2,423,823 | ) | (1,266,552 | ) | (13,384,521 | ) | (1,960,800 | ) | (973,769 | ) | ||||||||||
|
|
|
|
|
|
|
|
|
| |||||||||||
Net (decrease) increase in net assets resulting from operations | $ | (2,359,999 | ) | $ | (1,264,896 | ) | $ | (13,219,281 | ) | $ | (1,828,494 | ) | $ | (929,257 | ) | |||||
|
|
|
|
|
|
|
|
|
| |||||||||||
Refer to the end of the statements of operations for footnotes.
Refer to the notes to financial statements.
| American Funds Insurance Series | 281 |
Table of Contents
| Financial statements (continued) | ||
| Statements of operations for the year ended December 31, 2022 (continued) | ||
| (dollars in thousands) | ||||||||||||||||||||
| Washington Mutual Investors Fund | Capital World Growth and Income Fund | Growth- Income Fund | International Growth and Income Fund | Capital Income Builder | ||||||||||||||||
Investment income: | ||||||||||||||||||||
Income (net of non-U.S. taxes1): | ||||||||||||||||||||
Dividends: | ||||||||||||||||||||
Unaffiliated issuers | $ | 229,615 | $ | 49,442 | $ | 601,261 | $ | 11,087 | $ | 32,630 | ||||||||||
Affiliated issuers | 6,762 | 1,469 | 40,278 | 302 | 2,614 | |||||||||||||||
|
|
|
|
|
|
|
|
|
| |||||||||||
| 236,377 | 50,911 | 641,539 | 11,389 | 35,244 | ||||||||||||||||
Interest from unaffiliated issuers | 1 | 480 | 1,322 | — | 4,766 | |||||||||||||||
European Union withholding tax reclaims | — | — | 3,119 | 995 | 103 | |||||||||||||||
Interest from European Union withholding tax reclaims | — | — | 292 | 35 | — | |||||||||||||||
Securities lending income (net of fees) | 293 | 147 | 836 | 29 | 65 | |||||||||||||||
|
|
|
|
|
|
|
|
|
| |||||||||||
| 236,671 | 51,538 | 647,108 | 12,448 | 40,178 | ||||||||||||||||
|
|
|
|
|
|
|
|
|
| |||||||||||
Fees and expenses1: | ||||||||||||||||||||
Investment advisory services | 37,368 | 9,637 | 89,899 | 1,720 | 4,443 | |||||||||||||||
Distribution services | 10,015 | 3,172 | 35,861 | 726 | 1,368 | |||||||||||||||
Insurance administrative services | 2,882 | 499 | 4,286 | 306 | 1,362 | |||||||||||||||
Transfer agent services | 2 | — | 2 | 6 | — | 2 | — | 2 | ||||||||||||
Administrative services | 2,969 | 558 | 10,612 | 93 | 337 | |||||||||||||||
Accounting and administrative services | — | — | — | — | — | |||||||||||||||
Reports to shareholders | 65 | 23 | 285 | 9 | 10 | |||||||||||||||
Registration statement and prospectus | 29 | 5 | 109 | 5 | 3 | |||||||||||||||
Trustees’ compensation | 11 | 2 | 42 | 1 | 1 | |||||||||||||||
Auditing and legal | 52 | 69 | 102 | 82 | 70 | |||||||||||||||
Custodian | 275 | 259 | 469 | 20 | 101 | |||||||||||||||
Other | 5 | 6 | 23 | 22 | 1 | |||||||||||||||
|
|
|
|
|
|
|
|
|
| |||||||||||
Total fees and expenses before waivers/reimbursement | 53,673 | 14,230 | 141,694 | 2,984 | 7,696 | |||||||||||||||
Less waivers/reimbursement of fees and expenses: | ||||||||||||||||||||
Investment advisory services waivers | 14,561 | 2,866 | — | 295 | 1,989 | |||||||||||||||
Miscellaneous fee reimbursement | — | — | — | — | — | |||||||||||||||
|
|
|
|
|
|
|
|
|
| |||||||||||
Total waivers/reimbursement of fees and expenses | 14,561 | 2,866 | — | 295 | 1,989 | |||||||||||||||
|
|
|
|
|
|
|
|
|
| |||||||||||
Total fees and expenses after waivers/reimbursement | 39,112 | 11,364 | 141,694 | 2,689 | 5,707 | |||||||||||||||
|
|
|
|
|
|
|
|
|
| |||||||||||
Net investment income | 197,559 | 40,174 | 505,414 | 9,759 | 34,471 | |||||||||||||||
|
|
|
|
|
|
|
|
|
| |||||||||||
Net realized gain (loss) and unrealized depreciation: | ||||||||||||||||||||
Net realized gain (loss)1 on: | ||||||||||||||||||||
Investments in: | ||||||||||||||||||||
Unaffiliated issuers | 73,904 | (82,354 | ) | 1,822,012 | (25,009 | ) | (1,384 | ) | ||||||||||||
Affiliated issuers | (71 | ) | 8 | (316 | ) | (4 | ) | (691 | ) | |||||||||||
Futures contracts | — | — | — | — | (7,468 | ) | ||||||||||||||
Forward currency contracts | — | — | — | (54 | ) | 7 | ||||||||||||||
Swap contracts | — | — | — | — | 1,909 | |||||||||||||||
Currency transactions | (22 | ) | (382 | ) | (871 | ) | (231 | ) | (125 | ) | ||||||||||
Capital gain distributions received from affiliated issuers | — | — | — | — | — | |||||||||||||||
|
|
|
|
|
|
|
|
|
| |||||||||||
| 73,811 | (82,728 | ) | 1,820,825 | (25,298 | ) | (7,752 | ) | |||||||||||||
|
|
|
|
|
|
|
|
|
| |||||||||||
Net unrealized (depreciation) appreciation1 on: | ||||||||||||||||||||
Investments in: | ||||||||||||||||||||
Unaffiliated issuers | (1,207,072 | ) | (336,626 | ) | (9,143,460 | ) | (40,723 | ) | (104,188 | ) | ||||||||||
Affiliated issuers | 10 | (1 | ) | 130 | (2 | ) | (5,193 | ) | ||||||||||||
Futures contracts | — | — | — | — | (311 | ) | ||||||||||||||
Forward currency contracts | — | — | — | 5 | (2 | ) | ||||||||||||||
Swap contracts | — | — | — | — | 36 | |||||||||||||||
Currency translations | (3 | ) | (154 | ) | (173 | ) | 1 | 64 | ||||||||||||
|
|
|
|
|
|
|
|
|
| |||||||||||
| (1,207,065 | ) | (336,781 | ) | (9,143,503 | ) | (40,719 | ) | (109,594 | ) | |||||||||||
|
|
|
|
|
|
|
|
|
| |||||||||||
Net realized gain (loss) and unrealized depreciation | (1,133,254 | ) | (419,509 | ) | (7,322,678 | ) | (66,017 | ) | (117,346 | ) | ||||||||||
|
|
|
|
|
|
|
|
|
| |||||||||||
Net (decrease) increase in net assets resulting from operations | $ | (935,695 | ) | $ | (379,335 | ) | $ | (6,817,264 | ) | $ | (56,258 | ) | $ | (82,875 | ) | |||||
|
|
|
|
|
|
|
|
|
| |||||||||||
Refer to the end of the statements of operations for footnotes.
Refer to the notes to financial statements.
| 282 | American Funds Insurance Series |
Table of Contents
| Financial statements (continued) | ||
| Statements of operations for the year ended December 31, 2022 (continued) | ||
| (dollars in thousands) | ||||||||||||||||||||
| Asset Allocation Fund | American Funds Global Balanced Fund3 | The Bond Fund of America | Capital World Bond Fund | American High- Income Trust | ||||||||||||||||
Investment income: | ||||||||||||||||||||
Income (net of non-U.S. taxes1): | ||||||||||||||||||||
Dividends: | ||||||||||||||||||||
Unaffiliated issuers | $ | 388,405 | $ | 6,485 | $ | 1 | $ | 65 | $ | 3,225 | ||||||||||
Affiliated issuers | 80,475 | 393 | 34,880 | 3,057 | 610 | |||||||||||||||
|
|
|
|
|
|
|
|
|
| |||||||||||
| 468,880 | 6,878 | 34,881 | 3,122 | 3,835 | ||||||||||||||||
Interest from unaffiliated issuers | 178,663 | 3,237 | 331,418 | 44,637 | 52,726 | |||||||||||||||
European Union withholding tax reclaims | 23 | — | — | — | — | |||||||||||||||
Interest from European Union withholding tax reclaims | 9 | — | — | — | — | |||||||||||||||
Securities lending income (net of fees) | 631 | 7 | — | — | — | |||||||||||||||
|
|
|
|
|
|
|
|
|
| |||||||||||
| 648,206 | 10,122 | 366,299 | 47,759 | 56,561 | ||||||||||||||||
|
|
|
|
|
|
|
|
|
| |||||||||||
Fees and expenses1: | ||||||||||||||||||||
Investment advisory services | 70,034 | 2,063 | 39,380 | 7,727 | 3,914 | |||||||||||||||
Distribution services | 25,560 | 721 | 9,930 | 2,251 | 1,656 | |||||||||||||||
Insurance administrative services | 14,064 | 300 | 2,381 | 146 | 203 | |||||||||||||||
Transfer agent services | 4 | — | 2 | 2 | — | 2 | — | 2 | ||||||||||||
Administrative services | 7,927 | 118 | 3,334 | 492 | 271 | |||||||||||||||
Accounting and administrative services | — | — | — | — | — | |||||||||||||||
Reports to shareholders | 164 | 6 | 91 | 22 | 17 | |||||||||||||||
Registration statement and prospectus | 51 | 2 | 216 | 5 | 4 | |||||||||||||||
Trustees’ compensation | 30 | — | 2 | 12 | 2 | 2 | ||||||||||||||
Auditing and legal | 83 | 54 | 59 | 51 | 49 | |||||||||||||||
Custodian | 616 | 69 | 95 | 143 | 18 | |||||||||||||||
Other | 17 | 4 | 11 | 6 | 18 | |||||||||||||||
|
|
|
|
|
|
|
|
|
| |||||||||||
Total fees and expenses before waivers/reimbursement | 118,550 | 3,337 | 55,511 | 10,845 | 6,152 | |||||||||||||||
Less waivers/reimbursement of fees and expenses: | ||||||||||||||||||||
Investment advisory services waivers | — | 25 | 21,118 | 611 | 1,428 | |||||||||||||||
Miscellaneous fee reimbursement | — | — | — | — | — | |||||||||||||||
|
|
|
|
|
|
|
|
|
| |||||||||||
Total waivers/reimbursement of fees and expenses | — | 25 | 21,118 | 611 | 1,428 | |||||||||||||||
|
|
|
|
|
|
|
|
|
| |||||||||||
Total fees and expenses after waivers/reimbursement | 118,550 | 3,312 | 34,393 | 10,234 | 4,724 | |||||||||||||||
|
|
|
|
|
|
|
|
|
| |||||||||||
Net investment income | 529,656 | 6,810 | 331,906 | 37,525 | 51,837 | |||||||||||||||
|
|
|
|
|
|
|
|
|
| |||||||||||
Net realized gain (loss) and unrealized depreciation: | ||||||||||||||||||||
Net realized gain (loss)1 on: | ||||||||||||||||||||
Investments in: | ||||||||||||||||||||
Unaffiliated issuers | 867,100 | 41,092 | (720,113 | ) | (161,648 | ) | (27,908 | ) | ||||||||||||
Affiliated issuers | (24,724 | ) | 3 | (218 | ) | 17 | (7 | ) | ||||||||||||
Futures contracts | 65,437 | 539 | (136,499 | ) | (7,447 | ) | 1,533 | |||||||||||||
Forward currency contracts | — | (1,292 | ) | 1,795 | (18,216 | ) | — | |||||||||||||
Swap contracts | (73 | ) | 142 | 28,243 | (796 | ) | (82 | ) | ||||||||||||
Currency transactions | 4,210 | (235 | ) | (118 | ) | (3,040 | ) | 21 | ||||||||||||
Capital gain distributions received from affiliated issuers | — | — | — | — | — | |||||||||||||||
|
|
|
|
|
|
|
|
|
| |||||||||||
| 911,950 | 40,249 | (826,910 | ) | (191,130 | ) | (26,443 | ) | |||||||||||||
|
|
|
|
|
|
|
|
|
| |||||||||||
Net unrealized (depreciation) appreciation1 on: | ||||||||||||||||||||
Investments in: | ||||||||||||||||||||
Unaffiliated issuers | (5,229,896 | ) | (113,353 | ) | (1,058,517 | ) | (184,433 | ) | (118,628 | ) | ||||||||||
Affiliated issuers | (273,363 | ) | 51 | 76 | 1,587 | 4 | ||||||||||||||
Futures contracts | 13,070 | (454 | ) | (6,976 | ) | (3,811 | ) | 123 | ||||||||||||
Forward currency contracts | — | 725 | 4,002 | 4,071 | — | |||||||||||||||
Swap contracts | (1,575 | ) | (763 | ) | 12,978 | (6,561 | ) | (161 | ) | |||||||||||
Currency translations | 6 | 14 | 48 | 566 | (31 | ) | ||||||||||||||
|
|
|
|
|
|
|
|
|
| |||||||||||
| (5,491,758 | ) | (113,780 | ) | (1,048,389 | ) | (188,581 | ) | (118,693 | ) | |||||||||||
|
|
|
|
|
|
|
|
|
| |||||||||||
Net realized gain (loss) and unrealized depreciation | (4,579,808 | ) | (73,531 | ) | (1,875,299 | ) | (379,711 | ) | (145,136 | ) | ||||||||||
|
|
|
|
|
|
|
|
|
| |||||||||||
Net (decrease) increase in net assets resulting from operations | $ | (4,050,152 | ) | $ | (66,721 | ) | $ | (1,543,393 | ) | $ | (342,186 | ) | $ | (93,299 | ) | |||||
|
|
|
|
|
|
|
|
|
| |||||||||||
Refer to the end of the statements of operations for footnotes.
Refer to the notes to financial statements.
| American Funds Insurance Series | 283 |
Table of Contents
| Financial statements (continued) | ||
Statements of operations for the year ended December 31, 2022 (continued)
| ||
| (dollars in thousands) | ||||||||||||||||||||
| American Funds Mortgage Fund | Ultra-Short Bond Fund | U.S. Government Securities Fund | Managed Risk Growth Fund | Managed Risk International Fund | ||||||||||||||||
Investment income: | ||||||||||||||||||||
Income (net of non-U.S. taxes1): | ||||||||||||||||||||
Dividends: | ||||||||||||||||||||
Unaffiliated issuers | $ | — | $ | — | $ | — | $ | 265 | $ | 55 | ||||||||||
Affiliated issuers | — | — | — | 3,820 | 2,700 | |||||||||||||||
|
|
|
|
|
|
|
|
|
| |||||||||||
| — | — | — | 4,085 | 2,755 | ||||||||||||||||
Interest from unaffiliated issuers | 2,336 | 7,293 | 52,923 | — | — | |||||||||||||||
European Union withholding tax reclaims | — | — | — | — | — | |||||||||||||||
Interest from European Union withholding tax reclaims | — | — | — | — | — | |||||||||||||||
Securities lending income (net of fees) | — | — | — | — | — | |||||||||||||||
|
|
|
|
|
|
|
|
|
| |||||||||||
| 2,336 | 7,293 | 52,923 | 4,085 | 2,755 | ||||||||||||||||
|
|
|
|
|
|
|
|
|
| |||||||||||
Fees and expenses1: | ||||||||||||||||||||
Investment advisory services | 350 | 1,110 | 5,345 | 746 | 208 | |||||||||||||||
Distribution services | 228 | 889 | 3,494 | 1,219 | 342 | |||||||||||||||
Insurance administrative services | 105 | 173 | 522 | 1,244 | 346 | |||||||||||||||
Transfer agent services | — | 2 | — | 2 | — | 2 | — | 2 | — | 2 | ||||||||||
Administrative services | 31 | 121 | 503 | — | — | |||||||||||||||
Accounting and administrative services | — | — | — | 58 | 49 | |||||||||||||||
Reports to shareholders | 5 | 7 | 21 | 2 | 1 | |||||||||||||||
Registration statement and prospectus | 2 | 3 | 7 | 4 | 2 | |||||||||||||||
Trustees’ compensation | — | 2 | — | 2 | 2 | 1 | — | 2 | ||||||||||||
Auditing and legal | 44 | 43 | 46 | 16 | 16 | |||||||||||||||
Custodian | 17 | 1 | 29 | 6 | 7 | |||||||||||||||
Other | — | 2 | — | 2 | 1 | — | 2 | — | 2 | |||||||||||
|
|
|
|
|
|
|
|
|
| |||||||||||
Total fees and expenses before waivers/reimbursement | 782 | 2,347 | 9,970 | 3,296 | 971 | |||||||||||||||
Less waivers/reimbursement of fees and expenses: | ||||||||||||||||||||
Investment advisory services waivers | 158 | — | 2,256 | 249 | 69 | |||||||||||||||
Miscellaneous fee reimbursement | — | — | — | — | 32 | |||||||||||||||
|
|
|
|
|
|
|
|
|
| |||||||||||
Total waivers/reimbursement of fees and expenses | 158 | — | 2,256 | 249 | 101 | |||||||||||||||
|
|
|
|
|
|
|
|
|
| |||||||||||
Total fees and expenses after waivers/reimbursement | 624 | 2,347 | 7,714 | 3,047 | 870 | |||||||||||||||
|
|
|
|
|
|
|
|
|
| |||||||||||
Net investment income | 1,712 | 4,946 | 45,209 | 1,038 | 1,885 | |||||||||||||||
|
|
|
|
|
|
|
|
|
| |||||||||||
Net realized gain (loss) and unrealized depreciation: | ||||||||||||||||||||
Net realized gain (loss)1 on: | ||||||||||||||||||||
Investments in: | ||||||||||||||||||||
Unaffiliated issuers | (9,212 | ) | — | 2 | (104,839 | ) | (3,857 | ) | (1,108 | ) | ||||||||||
Affiliated issuers | — | — | — | (26,901 | ) | (9,724 | ) | |||||||||||||
Futures contracts | (2,688 | ) | — | (52,928 | ) | 1,884 | 4,007 | |||||||||||||
Forward currency contracts | — | — | — | — | — | |||||||||||||||
Swap contracts | 3,147 | — | 20,919 | — | — | |||||||||||||||
Currency transactions | — | — | — | 127 | 29 | |||||||||||||||
Capital gain distributions received from affiliated issuers | — | — | — | 60,533 | 16,270 | |||||||||||||||
|
|
|
|
|
|
|
|
|
| |||||||||||
| (8,753 | ) | — | 2 | (136,848 | ) | 31,786 | 9,474 | |||||||||||||
|
|
|
|
|
|
|
|
|
| |||||||||||
Net unrealized (depreciation) appreciation1 on: | ||||||||||||||||||||
Investments in: | ||||||||||||||||||||
Unaffiliated issuers | (3,365 | ) | (59 | ) | (99,107 | ) | 399 | 327 | ||||||||||||
Affiliated issuers | — | — | — | (191,173 | ) | (38,192 | ) | |||||||||||||
Futures contracts | (79 | ) | — | (3,785 | ) | 8,824 | 1,394 | |||||||||||||
Forward currency contracts | — | — | — | — | — | |||||||||||||||
Swap contracts | (1,585 | ) | — | (7,297 | ) | — | — | |||||||||||||
Currency translations | — | — | — | — | — | |||||||||||||||
|
|
|
|
|
|
|
|
|
| |||||||||||
| (5,029 | ) | (59 | ) | (110,189 | ) | (181,950 | ) | (36,471 | ) | |||||||||||
|
|
|
|
|
|
|
|
|
| |||||||||||
Net realized gain (loss) and unrealized depreciation | (13,782 | ) | (59 | ) | (247,037 | ) | (150,164 | ) | (26,997 | ) | ||||||||||
|
|
|
|
|
|
|
|
|
| |||||||||||
Net (decrease) increase in net assets resulting from operations | $ | (12,070 | ) | $ | 4,887 | $ | (201,828 | ) | $ | (149,126 | ) | $ | (25,112 | ) | ||||||
|
|
|
|
|
|
|
|
|
| |||||||||||
Refer to the end of the statements of operations for footnotes.
Refer to the notes to financial statements.
| 284 | American Funds Insurance Series |
Table of Contents
| Financial statements (continued) | ||
Statements of operations for the year ended December 31, 2022 (continued)
| ||
| (dollars in thousands) | ||||||||||||
| Managed Risk Washington Mutual Investors Fund | Managed Risk Growth- Income Fund | Managed Risk Asset Allocation Fund | ||||||||||
Investment income: | ||||||||||||
Income (net of non-U.S. taxes1): | ||||||||||||
Dividends: | ||||||||||||
Unaffiliated issuers | $ | 158 | $ | 1,054 | $ | 1,230 | ||||||
Affiliated issuers | 7,293 | 37,268 | 46,591 | |||||||||
|
|
|
|
|
| |||||||
| 7,451 | 38,322 | 47,821 | ||||||||||
Interest from unaffiliated issuers | — | — | — | |||||||||
European Union withholding tax reclaims | — | — | — | |||||||||
Interest from European Union withholding tax reclaims | — | — | — | |||||||||
Securities lending income (net of fees) | — | — | — | |||||||||
|
|
|
|
|
| |||||||
| 7,451 | 38,322 | 47,821 | ||||||||||
|
|
|
|
|
| |||||||
Fees and expenses1: | ||||||||||||
Investment advisory services | 499 | 3,399 | 3,572 | |||||||||
Distribution services | 824 | 720 | 5,935 | |||||||||
Insurance administrative services | 830 | 5,665 | 5,953 | |||||||||
Transfer agent services | — | 2 | — | 2 | — | 2 | ||||||
Administrative services | — | — | — | |||||||||
Accounting and administrative services | 53 | 96 | 98 | |||||||||
Reports to shareholders | 2 | 5 | 6 | |||||||||
Registration statement and prospectus | 3 | 10 | 13 | |||||||||
Trustees’ compensation | — | 2 | 2 | 3 | ||||||||
Auditing and legal | 16 | 18 | 19 | |||||||||
Custodian | 7 | 7 | 6 | |||||||||
Other | — | 2 | 1 | 1 | ||||||||
|
|
|
|
|
| |||||||
Total fees and expenses before waivers/reimbursement | 2,234 | 9,923 | 15,606 | |||||||||
Less waivers/reimbursement of fees and expenses: | ||||||||||||
Investment advisory services waivers | 166 | 1,135 | 1,192 | |||||||||
Miscellaneous fee reimbursement | — | — | — | |||||||||
|
|
|
|
|
| |||||||
Total waivers/reimbursement of fees and expenses | 166 | 1,135 | 1,192 | |||||||||
|
|
|
|
|
| |||||||
Total fees and expenses after waivers/reimbursement | 2,068 | 8,788 | 14,414 | |||||||||
|
|
|
|
|
| |||||||
Net investment income | 5,383 | 29,534 | 33,407 | |||||||||
|
|
|
|
|
| |||||||
Net realized gain (loss) and unrealized depreciation: | ||||||||||||
Net realized gain (loss)1 on: | ||||||||||||
Investments in: | ||||||||||||
Unaffiliated issuers | (3,288 | ) | (38,643 | ) | (5,894 | ) | ||||||
Affiliated issuers | 32,672 | 156,797 | 55,156 | |||||||||
Futures contracts | (4,543 | ) | (51,822 | ) | (47,767 | ) | ||||||
Forward currency contracts | — | — | — | |||||||||
Swap contracts | — | — | — | |||||||||
Currency transactions | 43 | 322 | 259 | |||||||||
Capital gain distributions received from affiliated issuers | 61,850 | 179,634 | 231,217 | |||||||||
|
|
|
|
|
| |||||||
| 86,734 | 246,288 | 232,971 | ||||||||||
|
|
|
|
|
| |||||||
Net unrealized (depreciation) appreciation1 on: | ||||||||||||
Investments in: | ||||||||||||
Unaffiliated issuers | 51 | 7,712 | 396 | |||||||||
Affiliated issuers | (128,265 | ) | (743,318 | ) | (666,676 | ) | ||||||
Futures contracts | 2,705 | 17,339 | 13,823 | |||||||||
Forward currency contracts | — | — | — | |||||||||
Swap contracts | — | — | — | |||||||||
Currency translations | — | — | — | |||||||||
|
|
|
|
|
| |||||||
| (125,509 | ) | (718,267 | ) | (652,457 | ) | |||||||
|
|
|
|
|
| |||||||
Net realized gain (loss) and unrealized depreciation | (38,775 | ) | (471,979 | ) | (419,486 | ) | ||||||
|
|
|
|
|
| |||||||
Net (decrease) increase in net assets resulting from operations | $ | (33,392 | ) | $ | (442,445 | ) | $ | (386,079 | ) | |||
|
|
|
|
|
| |||||||
| 1 | Additional information related to non-U.S. taxes and class-specific fees and expenses is included in the notes to financial statements. |
| 2 | Amount less than one thousand. |
| 3 | Formerly Global Balanced Fund. |
Refer to the notes to financial statements.
| American Funds Insurance Series | 285 |
Table of Contents
Financial statements (continued)
Statements of changes in net assets
| (dollars in thousands) | ||||||||||||||||||||||||
| Global Growth Fund | Global Small Capitalization Fund | Growth Fund | ||||||||||||||||||||||
| Year ended December 31, | Year ended December 31, | Year ended December 31, | ||||||||||||||||||||||
| 2022 | 2021 | 2022 | 2021 | 2022 | 2021 | |||||||||||||||||||
Operations: | ||||||||||||||||||||||||
Net investment income (loss) | $ | 63,824 | $ | 36,408 | $ | 1,656 | $ | (11,335 | ) | $ | 165,240 | $ | 87,664 | |||||||||||
Net realized gain (loss) | 553,121 | 846,935 | 25,952 | 1,098,836 | 1,854,075 | 5,061,178 | ||||||||||||||||||
Net unrealized (depreciation) appreciation | (2,976,944 | ) | 485,952 | (1,292,504 | ) | (710,657 | ) | (15,238,596 | ) | 3,147,345 | ||||||||||||||
|
|
|
|
|
|
|
|
|
|
|
| |||||||||||||
Net (decrease) increase in net assets resulting from operations | (2,359,999 | ) | 1,369,295 | (1,264,896 | ) | 376,844 | (13,219,281 | ) | 8,296,187 | |||||||||||||||
|
|
|
|
|
|
|
|
|
|
|
| |||||||||||||
Distributions paid to shareholders | (892,563 | ) | (486,343 | ) | (1,091,116 | ) | (123,155 | ) | (5,140,514 | ) | (5,437,958 | ) | ||||||||||||
Net capital share transactions | 597,636 | 466,658 | 721,994 | (989,509 | ) | 3,850,397 | 3,623,473 | |||||||||||||||||
|
|
|
|
|
|
|
|
|
|
|
| |||||||||||||
Total (decrease) increase in net assets | (2,654,926 | ) | 1,349,610 | (1,634,018 | ) | (735,820 | ) | (14,509,398 | ) | 6,481,702 | ||||||||||||||
Net assets: | ||||||||||||||||||||||||
Beginning of year | 9,590,580 | 8,240,970 | 4,576,921 | 5,312,741 | 45,405,746 | 38,924,044 | ||||||||||||||||||
|
|
|
|
|
|
|
|
|
| �� |
| |||||||||||||
End of year | $ | 6,935,654 | $ | 9,590,580 | $ | 2,942,903 | $ | 4,576,921 | $ | 30,896,348 | $ | 45,405,746 | ||||||||||||
|
|
|
|
|
|
|
|
|
|
|
| |||||||||||||
| International Fund | New World Fund | Washington Mutual Investors Fund | ||||||||||||||||||||||
| Year ended December 31, | Year ended December 31, | Year ended December 31, | ||||||||||||||||||||||
| 2022 | 2021 | 2022 | 2021 | 2022 | 2021 | |||||||||||||||||||
Operations: | ||||||||||||||||||||||||
Net investment income (loss) | $ | 132,306 | $ | 147,317 | $ | 44,512 | $ | 32,010 | $ | 197,559 | $ | 173,016 | ||||||||||||
Net realized gain (loss) | (377,954 | ) | 1,273,483 | (3,390 | ) | 318,018 | 73,811 | 2,286,033 | ||||||||||||||||
Net unrealized (depreciation) appreciation | (1,582,846 | ) | (1,501,184 | ) | (970,379 | ) | (136,128 | ) | (1,207,065 | ) | 81,431 | |||||||||||||
|
|
|
|
|
|
|
|
|
|
|
| |||||||||||||
Net (decrease) increase in net assets resulting from operations | (1,828,494 | ) | (80,384 | ) | (929,257 | ) | 213,900 | (935,695 | ) | 2,540,480 | ||||||||||||||
|
|
|
|
|
|
|
|
|
|
|
| |||||||||||||
Distributions paid to shareholders | (1,146,487 | ) | (249,096 | ) | (357,382 | ) | (185,700 | ) | (2,416,808 | ) | (166,149 | ) | ||||||||||||
Net capital share transactions | 265,209 | (832,025 | ) | (77,021 | ) | 176,091 | 1,331,066 | (488,260 | ) | |||||||||||||||
|
|
|
|
|
|
|
|
|
|
|
| |||||||||||||
Total (decrease) increase in net assets | (2,709,772 | ) | (1,161,505 | ) | (1,363,660 | ) | 204,291 | (2,021,437 | ) | 1,886,071 | ||||||||||||||
Net assets: | ||||||||||||||||||||||||
Beginning of year | 9,429,353 | 10,590,858 | 4,447,444 | 4,243,153 | 11,465,137 | 9,579,066 | ||||||||||||||||||
|
|
|
|
|
|
|
|
|
|
|
| |||||||||||||
End of year | $ | 6,719,581 | $ | 9,429,353 | $ | 3,083,784 | $ | 4,447,444 | $ | 9,443,700 | $ | 11,465,137 | ||||||||||||
|
|
|
|
|
|
|
|
|
|
|
| |||||||||||||
Refer to the end of the statements of changes in net assets for footnotes.
Refer to the notes to financial statements.
| 286 | American Funds Insurance Series |
Table of Contents
| Financial statements (continued) | ||
| Statements of changes in net assets (continued) | ||
| (dollars in thousands) | ||||||||||||||||||||||||
| Capital World Growth and Income Fund | Growth-Income Fund | International Growth and Income Fund | ||||||||||||||||||||||
| Year ended December 31, | Year ended December 31, | Year ended December 31, | ||||||||||||||||||||||
| 2022 | 2021 | 2022 | 2021 | 2022 | 2021 | |||||||||||||||||||
Operations: | ||||||||||||||||||||||||
Net investment income (loss) | $ | 40,174 | $ | 44,268 | $ | 505,414 | $ | 480,125 | $ | 9,759 | $ | 34,510 | ||||||||||||
Net realized gain (loss) | (82,728 | ) | 410,057 | 1,820,825 | 3,512,628 | (25,298 | ) | 357,845 | ||||||||||||||||
Net unrealized (depreciation) appreciation | (336,781 | ) | (139,980 | ) | (9,143,503 | ) | 4,888,658 | (40,719 | ) | (342,815 | ) | |||||||||||||
|
|
|
|
|
|
|
|
|
|
|
| |||||||||||||
Net (decrease) increase in net assets resulting from operations | (379,335 | ) | 314,345 | (6,817,264 | ) | 8,881,411 | (56,258 | ) | 49,540 | |||||||||||||||
|
|
|
|
|
|
|
|
|
|
|
| |||||||||||||
Distributions paid to shareholders | (454,298 | ) | (90,172 | ) | (3,956,410 | ) | (915,114 | ) | (154,047 | ) | (14,532 | ) | ||||||||||||
Net capital share transactions | 175,376 | (14,968 | ) | 804,156 | (3,505,347 | ) | 132,760 | (1,112,349 | ) | |||||||||||||||
|
|
|
|
|
|
|
|
|
|
|
| |||||||||||||
Total (decrease) increase in net assets | (658,257 | ) | 209,205 | (9,969,518 | ) | 4,460,950 | (77,545 | ) | (1,077,341 | ) | ||||||||||||||
Net assets: | ||||||||||||||||||||||||
Beginning of year | 2,383,655 | 2,174,450 | 42,952,485 | 38,491,535 | 378,542 | 1,455,883 | ||||||||||||||||||
|
|
|
|
|
|
|
|
|
|
|
| |||||||||||||
End of year | $ | 1,725,398 | $ | 2,383,655 | $ | 32,982,967 | $ | 42,952,485 | $ | 300,997 | $ | 378,542 | ||||||||||||
|
|
|
|
|
|
|
|
|
|
|
| |||||||||||||
| Capital Income Builder | Asset Allocation Fund | American Funds Global Balanced Fund* | ||||||||||||||||||||||
| Year ended December 31, | Year ended December 31, | Year ended December 31, | ||||||||||||||||||||||
| 2022 | 2021 | 2022 | 2021 | 2022 | 2021 | |||||||||||||||||||
Operations: | ||||||||||||||||||||||||
Net investment income (loss) | $ | 34,471 | $ | 32,730 | $ | 529,656 | $ | 496,078 | $ | 6,810 | $ | 4,583 | ||||||||||||
Net realized gain (loss) | (7,752 | ) | 44,998 | 911,950 | 2,982,523 | 40,249 | 24,122 | |||||||||||||||||
Net unrealized (depreciation) appreciation | (109,594 | ) | 81,302 | (5,491,758 | ) | 990,457 | (113,780 | ) | 17,602 | |||||||||||||||
|
|
|
|
|
|
|
|
|
|
|
| |||||||||||||
Net (decrease) increase in net assets resulting from operations | (82,875 | ) | 159,030 | (4,050,152 | ) | 4,469,058 | (66,721 | ) | 46,307 | |||||||||||||||
|
|
|
|
|
|
|
|
|
|
|
| |||||||||||||
Distributions paid to shareholders | (31,988 | ) | (29,764 | ) | (3,253,724 | ) | (1,541,316 | ) | (2,232 | ) | (29,247 | ) | ||||||||||||
Net capital share transactions | 109,402 | (81,691 | ) | 1,398,530 | (1,879,473 | ) | (30,663 | ) | (4,816 | ) | ||||||||||||||
|
|
|
|
|
|
|
|
|
|
|
| |||||||||||||
Total (decrease) increase in net assets | (5,461 | ) | 47,575 | (5,905,346 | ) | 1,048,269 | (99,616 | ) | 12,244 | |||||||||||||||
Net assets: | ||||||||||||||||||||||||
Beginning of year | 1,144,527 | 1,096,952 | 30,705,920 | 29,657,651 | 467,376 | 455,132 | ||||||||||||||||||
|
|
|
|
|
|
|
|
|
|
|
| |||||||||||||
End of year | $ | 1,139,066 | $ | 1,144,527 | $ | 24,800,574 | $ | 30,705,920 | $ | 367,760 | $ | 467,376 | ||||||||||||
|
|
|
|
|
|
|
|
|
|
|
| |||||||||||||
Refer to the end of the statements of changes in net assets for footnotes.
Refer to the notes to financial statements.
| American Funds Insurance Series | 287 |
Table of Contents
| Financial statements (continued) | ||
| Statements of changes in net assets (continued) | ||
| (dollars in thousands) | ||||||||||||||||||||||||
| The Bond Fund of America | Capital World Bond Fund | American High-Income Trust | ||||||||||||||||||||||
| Year ended December 31, | Year ended December 31, | Year ended December 31, | ||||||||||||||||||||||
| 2022 | 2021 | 2022 | 2021 | 2022 | 2021 | |||||||||||||||||||
Operations: | ||||||||||||||||||||||||
Net investment income (loss) | $ | 331,906 | $ | 215,953 | $ | 37,525 | $ | 42,586 | $ | 51,837 | $ | 47,176 | ||||||||||||
Net realized gain (loss) | (826,910 | ) | 129,232 | (191,130 | ) | 16,012 | (26,443 | ) | 7,485 | |||||||||||||||
Net unrealized (depreciation) appreciation | (1,048,389 | ) | (353,151 | ) | (188,581 | ) | (168,792 | ) | (118,693 | ) | 21,386 | |||||||||||||
|
|
|
|
|
|
|
|
|
|
|
| |||||||||||||
Net (decrease) increase in net assets resulting from operations | (1,543,393 | ) | (7,966 | ) | (342,186 | ) | (110,194 | ) | (93,299 | ) | 76,047 | |||||||||||||
|
|
|
|
|
|
|
|
|
|
|
| |||||||||||||
Distributions paid to shareholders | (462,954 | ) | (687,442 | ) | (30,830 | ) | (91,748 | ) | (67,772 | ) | (43,416 | ) | ||||||||||||
Net capital share transactions | (959,150 | ) | 2,474,568 | (230,098 | ) | (51,795 | ) | (59,810 | ) | 152,225 | ||||||||||||||
|
|
|
|
|
|
|
|
|
|
|
| |||||||||||||
Total (decrease) increase in net assets | (2,965,497 | ) | 1,779,160 | (603,114 | ) | (253,737 | ) | (220,881 | ) | 184,856 | ||||||||||||||
Net assets: | ||||||||||||||||||||||||
Beginning of year | 13,186,579 | 11,407,419 | 2,085,008 | 2,338,745 | 1,052,435 | 867,579 | ||||||||||||||||||
|
|
|
|
|
|
|
|
|
|
|
| |||||||||||||
End of year | $ | 10,221,082 | $ | 13,186,579 | $ | 1,481,894 | $ | 2,085,008 | $ | 831,554 | $ | 1,052,435 | ||||||||||||
|
|
|
|
|
|
|
|
|
|
|
| |||||||||||||
| American Funds Mortgage Fund | Ultra-Short Bond Fund | U.S. Government Securities Fund | ||||||||||||||||||||||
| Year ended December 31, | Year ended December 31, | Year ended December 31, | ||||||||||||||||||||||
| 2022 | 2021 | 2022 | 2021 | 2022 | 2021 | |||||||||||||||||||
Operations: | ||||||||||||||||||||||||
Net investment income (loss) | $ 1,712 | $ 1,555 | $ 4,946 | $ (1,883 | ) | $ 45,209 | $ 26,482 | |||||||||||||||||
Net realized gain (loss) | (8,753 | ) | (90 | ) | — | † | — | † | (136,848 | ) | (5,219 | ) | ||||||||||||
Net unrealized (depreciation) appreciation | (5,029 | ) | (2,808 | ) | (59 | ) | (4 | ) | (110,189 | ) | (36,820 | ) | ||||||||||||
|
|
|
|
|
|
|
|
|
|
|
| |||||||||||||
Net (decrease) increase in net assets resulting from operations | (12,070 | ) | (1,343 | ) | 4,887 | (1,887 | ) | (201,828 | ) | (15,557 | ) | |||||||||||||
|
|
|
|
|
|
|
|
|
|
|
| |||||||||||||
Distributions paid to shareholders | (1,793 | ) | (13,157 | ) | (2,237 | ) | — | (60,476 | ) | (209,728 | ) | |||||||||||||
Net capital share transactions | (231,492 | ) | 29,279 | 96,950 | (41,201 | ) | (402,273 | ) | 236,927 | |||||||||||||||
|
|
|
|
|
|
|
|
|
|
|
| |||||||||||||
Total (decrease) increase in net assets | (245,355 | ) | 14,779 | 99,600 | (43,088 | ) | (664,577 | ) | 11,642 | |||||||||||||||
Net assets: | ||||||||||||||||||||||||
Beginning of year | 334,398 | 319,619 | 332,661 | 375,749 | 2,165,299 | 2,153,657 | ||||||||||||||||||
|
|
|
|
|
|
|
|
|
|
|
| |||||||||||||
End of year | $ 89,043 | $334,398 | $432,261 | $332,661 | $1,500,722 | $2,165,299 | ||||||||||||||||||
|
|
|
|
|
|
|
|
|
|
|
| |||||||||||||
Refer to the end of the statements of changes in net assets for footnotes.
Refer to the notes to financial statements.
| 288 | American Funds Insurance Series |
Table of Contents
| Financial statements (continued) | ||
| Statements of changes in net assets (continued) | ||
| (dollars in thousands) | ||||||||||||||||||||||||
| Managed Risk Growth Fund | Managed Risk International Fund | Managed Risk Washington Mutual Investors Fund | ||||||||||||||||||||||
| Year ended December 31, | Year ended December 31, | Year ended December 31, | ||||||||||||||||||||||
| 2022 | 2021 | 2022 | 2021 | 2022 | 2021 | |||||||||||||||||||
Operations: | ||||||||||||||||||||||||
Net investment income (loss) | $ | 1,038 | $ | (392 | ) | $ | 1,885 | $ | 2,984 | $ | 5,383 | $ | 3,320 | |||||||||||
Net realized gain (loss) | 31,786 | 93,312 | 9,474 | 654 | 86,734 | 15,848 | ||||||||||||||||||
Net unrealized (depreciation) appreciation | (181,950 | ) | (21,491 | ) | (36,471 | ) | (10,287 | ) | (125,509 | ) | 38,411 | |||||||||||||
|
|
|
|
|
|
|
|
|
|
|
| |||||||||||||
Net (decrease) increase in net assets resulting from operations | (149,126 | ) | 71,429 | (25,112 | ) | (6,649 | ) | (33,392 | ) | 57,579 | ||||||||||||||
|
|
|
|
|
|
|
|
|
|
|
| |||||||||||||
Distributions paid to shareholders | (90,246 | ) | (27,384 | ) | (4,275 | ) | (931 | ) | (14,671 | ) | (6,019 | ) | ||||||||||||
Net capital share transactions | 97,021 | (11,898 | ) | (6,014 | ) | (654 | ) | (1,502 | ) | (34,883 | ) | |||||||||||||
|
|
|
|
|
|
|
|
|
|
|
| |||||||||||||
Total (decrease) increase in net assets | (142,351 | ) | 32,147 | (35,401 | ) | (8,234 | ) | (49,565 | ) | 16,677 | ||||||||||||||
Net assets: | ||||||||||||||||||||||||
Beginning of year | 596,593 | 564,446 | 161,335 | 169,569 | 373,037 | 356,360 | ||||||||||||||||||
|
|
|
|
|
|
|
|
|
|
|
| |||||||||||||
End of year | $ | 454,242 | $ | 596,593 | $ | 125,934 | $ | 161,335 | $ | 323,472 | $ | 373,037 | ||||||||||||
|
|
|
|
|
|
|
|
|
|
|
| |||||||||||||
| Managed Risk Growth-Income Fund | Managed Risk Asset Allocation Fund | |||||||||||||||
| Year ended December 31, | Year ended December 31, | |||||||||||||||
| 2022 | 2021 | 2022 | 2021 | |||||||||||||
Operations: | ||||||||||||||||
Net investment income (loss) | $ | 29,534 | $ | 23,938 | $ | 33,407 | $ | 29,121 | ||||||||
Net realized gain (loss) | 246,288 | 49,377 | 232,971 | 133,738 | ||||||||||||
Net unrealized (depreciation) appreciation | (718,267 | ) | 292,194 | (652,457 | ) | 169,648 | ||||||||||
|
|
|
|
|
|
|
| |||||||||
Net (decrease) increase in net assets resulting from operations | (442,445 | ) | 365,509 | (386,079 | ) | 332,507 | ||||||||||
|
|
|
|
|
|
|
| |||||||||
Distributions paid to shareholders | (99,803 | ) | (68,168 | ) | (138,964 | ) | (38,227 | ) | ||||||||
Net capital share transactions | (23,880 | ) | (64,385 | ) | (104,505 | ) | (254,031 | ) | ||||||||
|
|
|
|
|
|
|
| |||||||||
Total (decrease) increase in net assets | (566,128 | ) | 232,956 | (629,548 | ) | 40,249 | ||||||||||
Net assets: | ||||||||||||||||
Beginning of year | 2,667,572 | 2,434,616 | 2,819,020 | 2,778,771 | ||||||||||||
|
|
|
|
|
|
|
| |||||||||
End of year | $ | 2,101,444 | $ | 2,667,572 | $ | 2,189,472 | $ | 2,819,020 | ||||||||
|
|
|
|
|
|
|
| |||||||||
| * | Formerly Global Balanced Fund. |
| † | Amount less than one thousand. |
Refer to the notes to financial statements.
| American Funds Insurance Series | 289 |
Table of Contents
Notes to financial statements
1. Organization
American Funds Insurance Series (the “series”) is registered under the Investment Company Act of 1940, as amended (the “1940 Act”), as an open-end, diversified management investment company with 34 different funds (“the funds”), including 23 funds in the series covered in this report. The other 11 funds in the series are covered in separate reports. Six funds in the series are covered in the American Funds Insurance Series - Target Date Series report and five funds in the series are covered in the American Funds Insurance Series - Portfolio Series report. The assets of each fund are segregated, with each fund accounted for separately. Capital Research and Management Company (“CRMC”) is the series’ investment adviser. Milliman Financial Risk Management LLC (“Milliman FRM”) is the subadviser for the risk management strategy for eight of the funds (the “managed risk funds”), five of which are covered in this report.
The managed risk funds covered in this report are Managed Risk Growth Fund, Managed Risk International Fund, Managed Risk Washington Mutual Investors Fund, Managed Risk Growth-Income Fund and Managed Risk Asset Allocation Fund. The managed risk funds invest in other funds within the series (the “underlying funds”) and employ Milliman FRM to implement the risk management strategy, which consists of using hedging instruments — primarily exchange-traded options and futures contracts — to attempt to stabilize the volatility of the funds around target volatility levels and reduce the downside exposure of the funds during periods of significant market declines.
Shareholders approved a proposal to reorganize the series from a Massachusetts business trust to a Delaware statutory trust. The series reserved the right to delay implementing the reorganization and has elected to do so.
The investment objective(s) for each fund covered in this report are as follows:
Global Growth Fund — To provide long-term growth of capital.
Global Small Capitalization Fund — To provide long-term growth of capital.
Growth Fund — To provide growth of capital.
International Fund — To provide long-term growth of capital.
New World Fund — To provide long-term capital appreciation.
Washington Mutual Investors Fund — To produce income exceeding the average yield on U.S. stocks generally and to provide an opportunity for growth of principal consistent with sound common stock investing.
Capital World Growth and Income Fund — To provide long-term growth of capital while providing current income.
Growth-Income Fund — To achieve long-term growth of capital and income.
International Growth and Income Fund — To provide long-term growth of capital while providing current income.
Capital Income Builder — The two primary objectives are (1) to provide a level of current income that exceeds the average yield on U.S. stocks generally and (2) to provide a growing stream of income over the years. The secondary objective is to provide growth of capital.
Asset Allocation Fund — To provide high total return (including income and capital gains) consistent with preservation of capital over the long term.
American Funds Global Balanced Fund (formerly Global Balanced Fund) — Seeks the balanced accomplishment of three objectives: long-term growth of capital, conservation of principal and current income.
The Bond Fund of America — To provide as high a level of current income as is consistent with the preservation of capital.
Capital World Bond Fund — To provide, over the long term, a high level of total return consistent with prudent investment management.
American High-Income Trust — The primary objective is to provide a high level of current income. The secondary objective is capital appreciation.
| 290 | American Funds Insurance Series |
Table of Contents
American Funds Mortgage Fund — To provide current income and preservation of capital.
Ultra-Short Bond Fund — To provide current income, consistent with the maturity and quality standards applicable to the fund, and preservation of capital and liquidity.
U.S. Government Securities Fund — To provide a high level of current income consistent with prudent investment risk and preservation of capital.
Managed Risk Growth Fund — To provide growth of capital while seeking to manage volatility and provide downside protection.
Managed Risk International Fund — To provide long-term growth of capital while seeking to manage volatility and provide downside protection.
Managed Risk Washington Mutual Investors Fund — To produce income exceeding the average yield on U.S. stocks generally and to provide an opportunity for growth of principal consistent with sound common stock investing, in each case while seeking to manage volatility and provide downside protection.
Managed Risk Growth-Income Fund — To achieve long-term growth of capital and income while seeking to manage volatility and provide downside protection.
Managed Risk Asset Allocation Fund — To provide high total return (including income and capital gains) consistent with preservation of capital over the long term while seeking to manage volatility and provide downside protection.
Each fund in the series, except the managed risk funds, offers either four or five share classes (Classes 1, 1A, 2, 3 or 4); the managed risk funds offer two share classes (Classes P1 and P2). Holders of all share classes of each fund have equal pro rata rights to assets, dividends and liquidation proceeds of each fund held. Each share class of each fund has identical voting rights, except for the exclusive right to vote on matters affecting only its class. Share classes have different fees and expenses (“class-specific fees and expenses”), primarily due to different arrangements for certain distribution expenses. Differences in class-specific fees and expenses will result in differences in net investment income and, therefore, the payment of different per-share dividends by each class of each fund.
2. Significant accounting policies
Each fund is an investment company that applies the accounting and reporting guidance issued in Topic 946 by the U.S. Financial Accounting Standards Board. Each fund’s financial statements have been prepared to comply with U.S. generally accepted accounting principles (“U.S. GAAP”). These principles require the series’ investment adviser to make estimates and assumptions that affect reported amounts and disclosures. Actual results could differ from those estimates. Subsequent events, if any, have been evaluated through the date of issuance in the preparation of the financial statements. The funds follow the significant accounting policies described in this section, as well as the valuation policies described in the next section on valuation.
Cash — Cash may include amounts held in an interest bearing deposit facility.
Security transactions and related investment income — Security transactions are recorded by each fund as of the date the trades are executed with brokers. Realized gains and losses from security transactions are determined based on the specific identified cost of the securities. In the event a security is purchased with a delayed payment date, each fund will segregate liquid assets sufficient to meet their payment obligations. Dividend income is recognized on the ex-dividend date and interest income is recognized on an accrual basis. Market discounts, premiums and original issue discounts on fixed-income securities are amortized daily over the expected life of the security.
Fees and expenses — The fees and expenses of the underlying funds held by the managed risk funds are not included in the fees and expenses reported for each of the managed risk funds; however, they are indirectly reflected in the valuation of each of the underlying funds. These fees are included in the unaudited net effective expense ratios that are provided as additional information in the financial highlights tables.
| American Funds Insurance Series | 291 |
Table of Contents
Class allocations — Income, fees and expenses (other than class-specific fees and expenses), realized gains and losses and unrealized appreciation and depreciation are allocated daily among the various share classes of each fund based on their relative net assets. Class-specific fees and expenses, such as distribution expenses, are accrued daily and charged directly to the respective share class of each fund.
Distributions paid to shareholders — Income dividends and capital gain distributions are recorded on each fund’s ex-dividend date.
Currency translation — Assets and liabilities, including investment securities, denominated in currencies other than U.S. dollars are translated into U.S. dollars at the exchange rates supplied by one or more pricing vendors on the valuation date. Purchases and sales of investment securities and income and expenses are translated into U.S. dollars at the exchange rates on the dates of such transactions. The effects of changes in exchange rates on investment securities are included with the net realized gain or loss and net unrealized appreciation or depreciation on investments in the funds’ statements of operations. The realized gain or loss and unrealized appreciation or depreciation resulting from all other transactions denominated in currencies other than U.S. dollars are disclosed separately.
3. Valuation
CRMC, the series’ investment adviser, values the funds’ investments at fair value as defined by U.S. GAAP. The net asset value per share is calculated once daily as of the close of regular trading on the New York Stock Exchange, normally 4 p.m. New York time, each day the New York Stock Exchange is open.
Methods and inputs — The series’ investment adviser uses the following methods and inputs to establish the fair value of each fund’s assets and liabilities. Use of particular methods and inputs may vary over time based on availability and relevance as market and economic conditions evolve.
Equity securities, including depositary receipts, are generally valued at the official closing price of, or the last reported sale price on, the exchange or market on which such securities are traded, as of the close of business on the day the securities are being valued or, lacking any sales, at the last available bid price. Prices for each security are taken from the principal exchange or market on which the security trades. The value of an underlying fund is based on its reported net asset value.
Fixed-income securities, including short-term securities, are generally valued at evaluated prices obtained from third-party pricing vendors. Vendors value such securities based on one or more of the inputs described in the following table. The table provides examples of inputs that are commonly relevant for valuing particular classes of fixed-income securities in which the funds are authorized to invest. However, these classifications are not exclusive and any of the inputs may be used to value any other class of fixed-income security.
Fixed-income class | Examples of standard inputs | |
| All | Benchmark yields, transactions, bids, offers, quotations from dealers and trading systems, new issues, spreads and other relationships observed in the markets among comparable securities; and proprietary pricing models such as yield measures calculated using factors such as cash flows, financial or collateral performance and other reference data (collectively referred to as “standard inputs”) | |
| Corporate bonds, notes & loans; convertible securities | Standard inputs and underlying equity of the issuer | |
| Bonds & notes of governments & government agencies | Standard inputs and interest rate volatilities | |
| Mortgage-backed; asset-backed obligations | Standard inputs and cash flows, prepayment information, default rates, delinquency and loss assumptions, collateral characteristics, credit enhancements and specific deal information | |
| Municipal securities | Standard inputs and, for certain distressed securities, cash flows or liquidation values using a net present value calculation based on inputs that include, but are not limited to, financial statements and debt contracts | |
| 292 | American Funds Insurance Series |
Table of Contents
Securities with both fixed-income and equity characteristics, or equity securities traded principally among fixed-income dealers, are generally valued in the manner described for either equity or fixed-income securities, depending on which method is deemed most appropriate by the series’ investment adviser. The Capital Group Central Corporate Bond Fund (“CCBF”), a fund within the Capital Group Central Fund Series II, and Capital Group Central Cash Fund (“CCF”), a fund within the Capital Group Central Fund Series (collectively the “Central Funds“), are each valued based upon a floating net asset value, which fluctuates with changes in the value of each fund’s portfolio securities. The underlying securities are valued based on the policies and procedures in the Central Funds’ statements of additional information. The State Street Institutional U.S. Government Money Market Fund held by the managed risk funds is managed to maintain a $1.00 net asset value per share. The net asset value of each share class of each managed risk fund is calculated based on the reported net asset values of the underlying funds in which each fund invests.
Exchange-traded options and futures are generally valued at the official closing price for options and official settlement price for futures of the exchange or market on which such instruments are traded, as of the close of business on the day such instruments are being valued. Forward currency contracts are valued based on the spot and forward exchange rates obtained from a third-party pricing vendor. Swaps are generally valued using evaluated prices obtained from third-party pricing vendors who calculate these values based on market inputs that may include the yields of the indices referenced in the instrument and the relevant curve, dealer quotes, default probabilities and recovery rates, other reference data, and terms of the contract.
Securities and other assets for which representative market quotations are not readily available or are considered unreliable by the series’ investment adviser are fair valued as determined in good faith under fair value guidelines adopted by the series’ investment adviser and approved by the board of trustees as further described. The investment adviser follows fair valuation guidelines, consistent with U.S. Securities and Exchange Commission rules and guidance, to consider relevant principles and factors when making fair value determinations. The investment adviser considers relevant indications of value that are reasonably and timely available to it in determining the fair value to be assigned to a particular security, such as the type and cost of the security, contractual or legal restrictions on resale of the security, relevant financial or business developments of the issuer, actively traded similar or related securities, dealer or broker quotes, conversion or exchange rights on the security, related corporate actions, significant events occurring after the close of trading in the security, and changes in overall market conditions. In addition, the closing prices of equity securities and futures that trade in markets outside U.S. time zones may be adjusted to reflect significant events that occur after the close of local trading but before the net asset value of each share class of each fund is determined. Fair valuations of investments that are not actively trading involve judgment and may differ materially from valuations that would have been used had greater market activity occurred.
Processes and structure — The series’ board of trustees has designated the series’ investment adviser to make fair value determinations, subject to board oversight. The investment adviser has established a Joint Fair Valuation Committee (the “Fair Valuation Committee”) to administer, implement and oversee the fair valuation process, and to make fair value decisions. The Fair Valuation Committee regularly reviews its own fair value decisions, as well as decisions made under its standing instructions to the investment adviser’s valuation team. The Fair Valuation Committee reviews changes in fair value measurements from period to period and may, as deemed appropriate, update the fair valuation guidelines to better reflect the results of back testing and address new or evolving issues. The Fair Valuation Committee reports any changes to the fair valuation guidelines to the board of trustees. The series’ board and audit committee also regularly review reports that describe fair value determinations and methods.
The series’ investment adviser has also established a Fixed-Income Pricing Review Group to administer and oversee the fixed-income valuation process, including the use of fixed-income pricing vendors. This group regularly reviews pricing vendor information and market data. Pricing decisions, processes and controls over security valuation are also subject to additional internal reviews facilitated by the investment adviser’s global risk management group.
Classifications — The series’ investment adviser classifies the funds’ assets and liabilities into three levels based on the inputs used to value the assets or liabilities. Level 1 values are based on quoted prices in active markets for identical securities. Level 2 values are based on significant observable market inputs, such as quoted prices for similar securities and quoted prices in inactive markets. Certain securities trading outside the U.S. may transfer between Level 1 and Level 2 due to valuation adjustments resulting from significant market movements following the close of local trading. Level 3 values are based on significant unobservable inputs that reflect the investment adviser’s determination of assumptions that market participants might reasonably use in valuing the securities.
| American Funds Insurance Series | 293 |
Table of Contents
The valuation levels are not necessarily an indication of the risk or liquidity associated with the underlying investment. For example, U.S. government securities are reflected as Level 2 because the inputs used to determine fair value may not always be quoted prices in an active market. The tables on the following pages present the funds’ valuation levels as of December 31, 2022 (dollars in thousands):
Global Growth Fund
| Investment securities | ||||||||||||||||
| Level 1 | Level 2 | Level 3 | Total | |||||||||||||
Assets: | ||||||||||||||||
Common stocks: | ||||||||||||||||
Information technology | $ | 923,708 | $ | 643,291 | $ | — | $ | 1,566,999 | ||||||||
Health care | 1,027,635 | 489,438 | — | 1,517,073 | ||||||||||||
Consumer discretionary | 493,333 | 473,688 | — | 967,021 | ||||||||||||
Financials | 213,109 | 405,801 | — | * | 618,910 | |||||||||||
Consumer staples | 308,045 | 286,104 | — | 594,149 | ||||||||||||
Industrials | 203,723 | 319,481 | — | 523,204 | ||||||||||||
Energy | 163,263 | 172,648 | — | * | 335,911 | |||||||||||
Materials | 200,063 | 25,242 | — | 225,305 | ||||||||||||
Communication services | 146,303 | 39,149 | — | 185,452 | ||||||||||||
Real estate | — | 12,072 | — | 12,072 | ||||||||||||
Utilities | 7,666 | — | — | 7,666 | ||||||||||||
Preferred securities | — | 115,128 | — | 115,128 | ||||||||||||
Short-term securities | 164,535 | 114,615 | — | 279,150 | ||||||||||||
|
|
|
|
|
|
|
| |||||||||
Total | $ | 3,851,383 | $ | 3,096,657 | $ | — | * | $ | 6,948,040 | |||||||
|
|
|
|
|
|
|
| |||||||||
| * | Amount less than one thousand. |
Global Small Capitalization Fund
| Investment securities | ||||||||||||||||
| Level 1 | Level 2 | Level 3 | Total | |||||||||||||
Assets: | ||||||||||||||||
Common stocks: | ||||||||||||||||
Industrials | $ | 145,496 | $ | 462,740 | $ | — | $ | 608,236 | ||||||||
Information technology | 278,192 | 271,360 | 842 | 550,394 | ||||||||||||
Consumer discretionary | 319,599 | 207,610 | — | 527,209 | ||||||||||||
Health care | 368,441 | 133,632 | — | 502,073 | ||||||||||||
Financials | 82,339 | 175,020 | — | 257,359 | ||||||||||||
Materials | 8,263 | 96,602 | — | 104,865 | ||||||||||||
Real estate | 35,375 | 39,017 | — | 74,392 | ||||||||||||
Energy | 13,782 | 16,503 | 25,418 | 55,703 | ||||||||||||
Communication services | 25,084 | 27,091 | — | 52,175 | ||||||||||||
Utilities | 10,353 | 37,278 | — | 47,631 | ||||||||||||
Consumer staples | 18,150 | 27,079 | — | 45,229 | ||||||||||||
Preferred securities | 7,126 | — | 18,452 | 25,578 | ||||||||||||
Rights & warrants | — | 10,007 | — | 10,007 | ||||||||||||
Short-term securities | 148,662 | — | — | 148,662 | ||||||||||||
|
|
|
|
|
|
|
| |||||||||
Total | $ | 1,460,862 | $ | 1,503,939 | $ | 44,712 | $ | 3,009,513 | ||||||||
|
|
|
|
|
|
|
| |||||||||
The following table reconciles the valuation of the fund’s Level 3 investment securities and related transactions for the year ended December 31, 2022 (dollars in thousands):
| Beginning value at 1/1/2022 | Transfers into Level 3* | Purchases | Sales | Net realized gain | Unrealized depreciation† | Transfers out of Level 3* | Ending value at 12/31/2022 | |||||||||||||||||||||||||
Investment securities | $ | 44,963 | $ | — | $ | — | $ | — | $ | — | $ | (251 | ) | $ | — | $ | 44,712 | |||||||||||||||
Net unrealized depreciation during the period on Level 3 investment securities held at December 31, 2022 |
| $ | (251 | ) | ||||||||||||||||||||||||||||
| * | Transfers into or out of Level 3 are based on the beginning market value of the quarter in which they occurred. These transfers are the result of changes in the availability of pricing sources and/or in the observability of significant inputs used in valuing the securities. |
| † | Net unrealized depreciation is included in the related amounts on investments in the fund’s statement of operations. |
| 294 | American Funds Insurance Series |
Table of Contents
Unobservable inputs — Valuation of the fund’s Level 3 securities is based on significant unobservable inputs that reflect the investment adviser’s determination of assumptions that market participants might reasonably use in valuing the securities. The following table provides additional information used by the fund’s investment adviser to fair value the fund’s Level 3 securities (dollars in thousands):
| Value at 12/31/2022 | Valuation techniques | Unobservable inputs | Range (if applicable) | Weighted average* | Impact to valuation from an increase in input† | |||||||||
Common stocks | $ | 26,260 |
| Market comparable companies | Price/Cash flow multiple | 5.7x | 5.7x | Increase | ||||||
| EV/Sales multiple | 6.2x | 6.2x | Increase | |||||||||||
| DLOM | 16% | 16% | Decrease | |||||||||||
| Discount for lack of certainty | 10% | 10% | Decrease | |||||||||||
| Risk discount | 25% | 25% | Decrease | |||||||||||
| Transaction price | N/A | N/A | N/A | N/A | ||||||||||
Preferred securities |
| 18,452 |
| Market comparable companies | EV/Sales multiple | 6.2x - 12.9x | 11.0x | Increase | ||||||
| Risk discount | 25% | 25% | Decrease | |||||||||||
| Net adjustment (decrease) based on movement of market comparables | 44% | 44% | Decrease | |||||||||||
| DLOM | 10% | 10% | Decrease | |||||||||||
|
| |||||||||||||
Total | $ | 44,712 | ||||||||||||
|
| |||||||||||||
| * | Weighted average is by relative fair value. |
| † | This column represents the directional change in fair value of the Level 3 securities that would result in an increase from the corresponding input. Significant increases and decreases in these inputs in isolation could result in significantly higher or lower fair value measurements. |
Key to abbreviations
DLOM = Discount for lack of marketability
EV = Enterprise value
Growth Fund
| Investment securities | ||||||||||||||||
| Level 1 | Level 2 | Level 3 | Total | |||||||||||||
Assets: | ||||||||||||||||
Common stocks: | ||||||||||||||||
Information technology | $ | 5,461,425 | $ | 723,030 | $ | 4,704 | $ | 6,189,159 | ||||||||
Health care | 5,188,144 | 115,484 | 45,222 | 5,348,850 | ||||||||||||
Consumer discretionary | 4,793,527 | 439,744 | — | 5,233,271 | ||||||||||||
Communication services | 3,950,043 | 25,714 | — | 3,975,757 | ||||||||||||
Industrials | 3,112,991 | 255,410 | — | 3,368,401 | ||||||||||||
Energy | 1,737,621 | 91,688 | — | 1,829,309 | ||||||||||||
Financials | 1,796,618 | — | — | 1,796,618 | ||||||||||||
Materials | 973,571 | — | — | 973,571 | ||||||||||||
Consumer staples | 596,091 | 109,850 | — | 705,941 | ||||||||||||
Utilities | 243,420 | — | — | 243,420 | ||||||||||||
Real estate | 33,920 | — | — | 33,920 | ||||||||||||
Preferred securities | — | 21,366 | 36,770 | 58,136 | ||||||||||||
Convertible stocks | 7,202 | — | — | 7,202 | ||||||||||||
Convertible bonds & notes | — | — | 7,146 | 7,146 | ||||||||||||
Bonds, notes & other debt instruments | — | 15,245 | — | 15,245 | ||||||||||||
Short-term securities | 1,192,835 | — | — | 1,192,835 | ||||||||||||
|
|
|
|
|
|
|
| |||||||||
Total | $ | 29,087,408 | $ | 1,797,531 | $ | 93,842 | $ | 30,978,781 | ||||||||
|
|
|
|
|
|
|
| |||||||||
| American Funds Insurance Series | 295 |
Table of Contents
International Fund
| Investment securities | ||||||||||||||||
| Level 1 | Level 2 | Level 3 | Total | |||||||||||||
Assets: | ||||||||||||||||
Common stocks: | ||||||||||||||||
Industrials | $ | 64,860 | $ | 1,053,264 | $ | — | $ | 1,118,124 | ||||||||
Information technology | 296,778 | 622,282 | 4,282 | 923,342 | ||||||||||||
Health care | 29,009 | 812,708 | — | 841,717 | ||||||||||||
Materials | 397,065 | 317,708 | — | 714,773 | ||||||||||||
Energy | 172,457 | 531,541 | — | 703,998 | ||||||||||||
Consumer discretionary | 135,708 | 472,880 | — | 608,588 | ||||||||||||
Financials | 78,042 | 530,056 | — | 608,098 | ||||||||||||
Communication services | 185,096 | 231,351 | — | * | 416,447 | |||||||||||
Consumer staples | — | 289,938 | — | 289,938 | ||||||||||||
Utilities | — | 119,038 | — | 119,038 | ||||||||||||
Real estate | — | 39,066 | — | 39,066 | ||||||||||||
Preferred securities | 24,464 | 28,174 | 392 | 53,030 | ||||||||||||
Rights & warrants | — | 8,446 | — | 8,446 | ||||||||||||
Short-term securities | 307,469 | — | — | 307,469 | ||||||||||||
|
|
|
|
|
|
|
| |||||||||
Total | $ | 1,690,948 | $ | 5,056,452 | $ | 4,674 | $ | 6,752,074 | ||||||||
|
|
|
|
|
|
|
| |||||||||
| * | Amount less than one thousand. |
New World Fund
| Investment securities | ||||||||||||||||
| Level 1 | Level 2 | Level 3 | Total | |||||||||||||
Assets: | ||||||||||||||||
Common stocks: | ||||||||||||||||
Information technology | $ | 263,065 | $ | 173,417 | $ | 342 | $ | 436,824 | ||||||||
Financials | 67,929 | 361,956 | — | * | 429,885 | |||||||||||
Health care | 188,331 | 216,848 | — | 405,179 | ||||||||||||
Industrials | 108,081 | 225,883 | — | 333,964 | ||||||||||||
Consumer discretionary | 105,950 | 224,085 | — | * | 330,035 | |||||||||||
Materials | 162,789 | 82,689 | — | * | 245,478 | |||||||||||
Consumer staples | 60,987 | 131,035 | — | * | 192,022 | |||||||||||
Communication services | 81,746 | 76,207 | — | * | 157,953 | |||||||||||
Energy | 47,738 | 105,152 | — | * | 152,890 | |||||||||||
Utilities | 14,233 | 39,215 | — | 53,448 | ||||||||||||
Real estate | 12,965 | 36,156 | — | 49,121 | ||||||||||||
Preferred securities | 14,795 | 8,412 | 9,132 | 32,339 | ||||||||||||
Rights & warrants | 31 | 172 | — | 203 | ||||||||||||
Bonds, notes & other debt instruments | — | 100,586 | — | 100,586 | ||||||||||||
Short-term securities | 167,623 | — | — | 167,623 | ||||||||||||
|
|
|
|
|
|
|
| |||||||||
Total | $ | 1,296,263 | $ | 1,781,813 | $ | 9,474 | $ | 3,087,550 | ||||||||
|
|
|
|
|
|
|
| |||||||||
| Other investments† | ||||||||||||||||
| Level 1 | Level 2 | Level 3 | Total | |||||||||||||
Assets: | ||||||||||||||||
Unrealized appreciation on futures contracts | $ | 159 | $ | — | $ | — | $ | 159 | ||||||||
Unrealized appreciation on open forward currency contracts | — | — | * | — | — | * | ||||||||||
Unrealized appreciation on centrally cleared credit default swaps | — | 2 | — | 2 | ||||||||||||
Liabilities: | ||||||||||||||||
Unrealized depreciation on futures contracts | (66 | ) | — | — | (66 | ) | ||||||||||
Unrealized depreciation on open forward currency contracts | — | (50 | ) | — | (50 | ) | ||||||||||
|
|
|
|
|
|
|
| |||||||||
Total | $ | 93 | $ | (48 | ) | $ | — | $ | 45 | |||||||
|
|
|
|
|
|
|
| |||||||||
| * | Amount less than one thousand. |
| † | Futures contracts, forward currency contracts and credit default swaps are not included in the fund’s investment portfolio. |
Washington Mutual Investors Fund
As of December 31, 2022, all of the fund’s investment securities were classified as Level 1.
| 296 | American Funds Insurance Series |
Table of Contents
Capital World Growth and Income Fund
| Investment securities | ||||||||||||||||
| Level 1 | Level 2 | Level 3 | Total | |||||||||||||
Assets: | ||||||||||||||||
Common stocks: | ||||||||||||||||
Information technology | $ | 164,931 | $ | 106,647 | $ | — | $ | 271,578 | ||||||||
Health care | 186,991 | 74,725 | — | 261,716 | ||||||||||||
Financials | 110,259 | 113,094 | — | * | 223,353 | |||||||||||
Industrials | 103,918 | 113,308 | — | 217,226 | ||||||||||||
Consumer discretionary | 81,430 | 73,857 | — | 155,287 | ||||||||||||
Consumer staples | 63,755 | 66,879 | — | 130,634 | ||||||||||||
Materials | 69,657 | 51,505 | — | 121,162 | ||||||||||||
Energy | 73,762 | 34,823 | — | * | 108,585 | |||||||||||
Communication services | 53,364 | 32,366 | — | * | 85,730 | |||||||||||
Utilities | 25,266 | 24,999 | — | 50,265 | ||||||||||||
Real estate | 12,033 | 5,443 | — | 17,476 | ||||||||||||
Preferred securities | 263 | 2,512 | — | 2,775 | ||||||||||||
Convertible bonds & notes | — | 940 | — | 940 | ||||||||||||
Bonds, notes & other debt instruments | — | 6,016 | — | 6,016 | ||||||||||||
Short-term securities | 6,525 | 69,828 | — | 76,353 | ||||||||||||
|
|
|
|
|
|
|
| |||||||||
Total | $ | 952,154 | $ | 776,942 | $ | — | * | $ | 1,729,096 | |||||||
|
|
|
|
|
|
|
| |||||||||
| * | Amount less than one thousand. |
Growth-Income Fund
| Investment securities | ||||||||||||||||
| Level 1 | Level 2 | Level 3 | Total | |||||||||||||
Assets: | ||||||||||||||||
Common stocks: | ||||||||||||||||
Information technology | $ | 6,365,641 | $ | 293,106 | $ | — | $ | 6,658,747 | ||||||||
Industrials | 4,414,100 | 259,779 | — | 4,673,879 | ||||||||||||
Health care | 3,850,991 | 534,723 | — | 4,385,714 | ||||||||||||
Financials | 2,896,787 | — | — | 2,896,787 | ||||||||||||
Consumer discretionary | 2,446,056 | 132,438 | — | 2,578,494 | ||||||||||||
Communication services | 2,480,083 | — | — | 2,480,083 | ||||||||||||
Consumer staples | 1,457,094 | 454,816 | — | 1,911,910 | ||||||||||||
Energy | 1,578,057 | — | — | 1,578,057 | ||||||||||||
Utilities | 1,262,331 | 69,549 | — | 1,331,880 | ||||||||||||
Materials | 1,068,166 | — | — | 1,068,166 | ||||||||||||
Real estate | 608,248 | — | — | 608,248 | ||||||||||||
Convertible stocks | 274,424 | — | — | 274,424 | ||||||||||||
Bonds, notes & other debt instruments | — | 5,916 | — | 5,916 | ||||||||||||
Short-term securities | 2,789,014 | — | — | 2,789,014 | ||||||||||||
|
|
|
|
|
|
|
| |||||||||
Total | $ | 31,490,992 | $ | 1,750,327 | $ | — | $ | 33,241,319 | ||||||||
|
|
|
|
|
|
|
| |||||||||
| American Funds Insurance Series | 297 |
Table of Contents
International Growth and Income Fund
| Investment securities | ||||||||||||||||
| Level 1 | Level 2 | Level 3 | Total | |||||||||||||
Assets: | ||||||||||||||||
Common stocks: | ||||||||||||||||
Financials | $ | 6,118 | $ | 43,633 | $ | — | * | $ | 49,751 | |||||||
Industrials | 4,511 | 31,485 | — | 35,996 | ||||||||||||
Consumer discretionary | 2,509 | 32,958 | — | 35,467 | ||||||||||||
Consumer staples | 7,470 | 27,016 | — | 34,486 | ||||||||||||
Information technology | 1,668 | 30,886 | — | 32,554 | ||||||||||||
Health care | 1,316 | 29,812 | — | 31,128 | ||||||||||||
Energy | 8,708 | 14,672 | — | * | 23,380 | |||||||||||
Materials | 9,657 | 7,677 | — | * | 17,334 | |||||||||||
Communication services | 1,895 | 15,137 | — | * | 17,032 | |||||||||||
Utilities | 1,142 | 8,106 | — | 9,248 | ||||||||||||
Real estate | — | 4,820 | — | 4,820 | ||||||||||||
Preferred securities | 1,207 | 693 | — | 1,900 | ||||||||||||
Short-term securities | 6,358 | — | — | 6,358 | ||||||||||||
|
|
|
|
|
|
|
| |||||||||
Total | $ | 52,559 | $ | 246,895 | $ | — | * | $ | 299,454 | |||||||
|
|
|
|
|
|
|
| |||||||||
| Other investments† | ||||||||||||||||
| Level 1 | Level 2 | Level 3 | Total | |||||||||||||
Assets: | ||||||||||||||||
Unrealized appreciation on open forward currency contracts | $ | — | $ | 5 | $ | — | $ | 5 | ||||||||
| * | Amount less than one thousand. |
| † | Forward currency contracts are not included in the fund’s investment portfolio. |
Capital Income Builder
| Investment securities | ||||||||||||||||
| Level 1 | Level 2 | Level 3 | Total | |||||||||||||
Assets: | ||||||||||||||||
Common stocks: | ||||||||||||||||
Financials | $ | 85,911 | $ | 70,932 | $ | — | * | $ | 156,843 | |||||||
Consumer staples | 64,498 | 50,174 | — | 114,672 | ||||||||||||
Health care | 85,845 | 22,042 | — | 107,887 | ||||||||||||
Industrials | 47,860 | 35,750 | — | 83,610 | ||||||||||||
Information technology | 64,487 | 14,336 | — | 78,823 | ||||||||||||
Utilities | 39,280 | 31,786 | — | 71,066 | ||||||||||||
Energy | 52,011 | 16,387 | — | * | 68,398 | |||||||||||
Real estate | 56,684 | 11,518 | — | 68,202 | ||||||||||||
Materials | 20,977 | 12,204 | — | 33,181 | ||||||||||||
Consumer discretionary | 16,058 | 16,961 | — | 33,019 | ||||||||||||
Communication services | 17,155 | 15,258 | — | 32,413 | ||||||||||||
Preferred securities | — | 545 | — | 545 | ||||||||||||
Rights & warrants | 6 | — | — | 6 | ||||||||||||
Convertible stocks | 5,019 | — | — | 5,019 | ||||||||||||
Investment funds | 28,059 | — | — | 28,059 | ||||||||||||
Bonds, notes & other debt instruments: | ||||||||||||||||
U.S. Treasury bonds & notes | — | 107,548 | — | 107,548 | ||||||||||||
Mortgage-backed obligations | — | 69,718 | 89 | 69,807 | ||||||||||||
Corporate bonds, notes & loans | — | 19,621 | — | 19,621 | ||||||||||||
Asset-backed obligations | — | 9,532 | — | 9,532 | ||||||||||||
Bonds & notes of governments & government agencies outside the U.S. | — | 743 | — | 743 | ||||||||||||
Municipals | — | 228 | — | 228 | ||||||||||||
Short-term securities | 83,850 | — | — | 83,850 | ||||||||||||
|
|
|
|
|
|
|
| |||||||||
Total | $ | 667,700 | $ | 505,283 | $ | 89 | $ | 1,173,072 | ||||||||
|
|
|
|
|
|
|
| |||||||||
Refer to the end of the tables for footnotes.
| 298 | American Funds Insurance Series |
Table of Contents
| Other investments† | ||||||||||||||||
| Level 1 | Level 2 | Level 3 | Total | |||||||||||||
Assets: | ||||||||||||||||
Unrealized appreciation on futures contracts | $ | 60 | $ | — | $ | — | $ | 60 | ||||||||
Unrealized appreciation on centrally cleared interest rate swaps | — | 1,900 | — | 1,900 | ||||||||||||
Liabilities: | ||||||||||||||||
Unrealized depreciation on futures contracts | (139 | ) | — | — | (139 | ) | ||||||||||
Unrealized depreciation on centrally cleared interest rate swaps | — | (380 | ) | — | (380 | ) | ||||||||||
Unrealized depreciation on centrally cleared credit default swaps | — | (47 | ) | — | (47 | ) | ||||||||||
|
|
|
|
|
|
|
| |||||||||
Total | $ | (79 | ) | $ | 1,473 | $ | — | $ | 1,394 | |||||||
|
|
|
|
|
|
|
| |||||||||
| * | Amount less than one thousand. |
| † | Futures contracts, interest rate swaps and credit default swaps are not included in the fund’s investment portfolio. |
Asset Allocation Fund
| Investment securities | ||||||||||||||||
| Level 1 | Level 2 | Level 3 | Total | |||||||||||||
Assets: | ||||||||||||||||
Common stocks: | ||||||||||||||||
Health care | $ | 3,207,943 | $ | 95,928 | $ | 19,703 | $ | 3,323,574 | ||||||||
Consumer discretionary | 2,162,881 | 216,574 | — | 2,379,455 | ||||||||||||
Financials | 2,206,657 | 75,213 | 1,899 | 2,283,769 | ||||||||||||
Information technology | 2,171,644 | 29,717 | — | 2,201,361 | ||||||||||||
Consumer staples | 1,318,784 | 316,097 | — | 1,634,881 | ||||||||||||
Industrials | 1,531,415 | 12,088 | — | 1,543,503 | ||||||||||||
Communication services | 1,171,249 | — | — | 1,171,249 | ||||||||||||
Energy | 1,020,328 | — | 550 | 1,020,878 | ||||||||||||
Materials | 856,654 | — | — | 856,654 | ||||||||||||
Real estate | 236,814 | — | — | 236,814 | ||||||||||||
Utilities | 158,713 | — | — | 158,713 | ||||||||||||
Preferred securities | — | — | 189 | 189 | ||||||||||||
Rights & warrants | — | — | — | * | — | * | ||||||||||
Convertible stocks | — | — | 63,388 | 63,388 | ||||||||||||
Investment funds | 1,367,122 | — | — | 1,367,122 | ||||||||||||
Bonds, notes & other debt instruments: | ||||||||||||||||
Mortgage-backed obligations | — | 1,878,858 | — | 1,878,858 | ||||||||||||
U.S. Treasury bonds & notes | — | 1,617,110 | — | 1,617,110 | ||||||||||||
Corporate bonds, notes & loans | — | 1,385,625 | 10,517 | 1,396,142 | ||||||||||||
Asset-backed obligations | — | 411,624 | 5,689 | 417,313 | ||||||||||||
Bonds & notes of governments & government agencies outside the U.S. | — | 40,766 | — | 40,766 | ||||||||||||
Municipals | — | 35,724 | — | 35,724 | ||||||||||||
Short-term securities | 1,690,923 | — | — | 1,690,923 | ||||||||||||
|
|
|
|
|
|
|
| |||||||||
Total | $ | 19,101,127 | $ | 6,115,324 | $ | 101,935 | $ | 25,318,386 | ||||||||
|
|
|
|
|
|
|
| |||||||||
| Other investments† | ||||||||||||||||
| Level 1 | Level 2 | Level 3 | Total | |||||||||||||
Assets: | ||||||||||||||||
Unrealized appreciation on futures contracts | $ | 2,319 | $ | — | $ | — | $ | 2,319 | ||||||||
Liabilities: | ||||||||||||||||
Unrealized depreciation on futures contracts | (3,485 | ) | — | — | (3,485 | ) | ||||||||||
Unrealized depreciation on centrally cleared credit default swaps | — | (1,623 | ) | — | (1,623 | ) | ||||||||||
|
|
|
|
|
|
|
| |||||||||
Total | $ | (1,166 | ) | $ | (1,623 | ) | $ | — | $ | (2,789 | ) | |||||
|
|
|
|
|
|
|
| |||||||||
| * | Amount less than one thousand. |
| † | Futures contracts and credit default swaps are not included in the fund’s investment portfolio. |
| American Funds Insurance Series | 299 |
Table of Contents
American Funds Global Balanced Fund
| Investment securities | ||||||||||||||||
| Level 1 | Level 2 | Level 3 | Total | |||||||||||||
Assets: | ||||||||||||||||
Common stocks: | ||||||||||||||||
Financials | $ | 16,259 | $ | 22,868 | $ | — | $ | 39,127 | ||||||||
Industrials | 19,116 | 11,649 | — | 30,765 | ||||||||||||
Health care | 18,540 | 10,087 | — | 28,627 | ||||||||||||
Information technology | 21,174 | 2,609 | — | 23,783 | ||||||||||||
Consumer staples | 4,299 | 15,340 | — | 19,639 | ||||||||||||
Utilities | 9,788 | 7,879 | — | 17,667 | ||||||||||||
Materials | 6,808 | 9,121 | — | 15,929 | ||||||||||||
Energy | 10,010 | 4,766 | — | 14,776 | ||||||||||||
Communication services | 8,684 | 2,866 | — | 11,550 | ||||||||||||
Consumer discretionary | 4,150 | 4,214 | — | 8,364 | ||||||||||||
Real estate | 2,591 | 2,616 | — | 5,207 | ||||||||||||
Preferred securities | 911 | 558 | — | 1,469 | ||||||||||||
Convertible stocks | 1,235 | — | — | 1,235 | ||||||||||||
Investment funds | 5,532 | — | — | 5,532 | ||||||||||||
Bonds, notes & other debt instruments: | ||||||||||||||||
Bonds & notes of governments & government agencies outside the U.S. | — | 48,706 | 77 | 48,783 | ||||||||||||
U.S. Treasury bonds & notes | — | 44,273 | — | 44,273 | ||||||||||||
Corporate bonds, notes & loans | — | 20,755 | — | 20,755 | ||||||||||||
Mortgage-backed obligations | — | 9,498 | — | 9,498 | ||||||||||||
Asset-backed obligations | — | 2,304 | — | 2,304 | ||||||||||||
Municipals | — | 129 | — | 129 | ||||||||||||
Short-term securities | 3,928 | 12,021 | — | 15,949 | ||||||||||||
|
|
|
|
|
|
| �� | |||||||||
Total | $ | 133,025 | $ | 232,259 | $ | 77 | $ | 365,361 | ||||||||
|
|
|
|
|
|
|
| |||||||||
| Other investments* | ||||||||||||||||
| Level 1 | Level 2 | Level 3 | Total | |||||||||||||
Assets: | ||||||||||||||||
Unrealized appreciation on futures contracts | $ | 58 | $ | — | $ | — | $ | 58 | ||||||||
Unrealized appreciation on open forward currency contracts | — | 686 | — | 686 | ||||||||||||
Unrealized appreciation on centrally cleared interest rate swaps | — | 8 | — | 8 | ||||||||||||
Unrealized appreciation on centrally cleared credit default swaps | — | 7 | — | 7 | ||||||||||||
Liabilities: | ||||||||||||||||
Unrealized depreciation on futures contracts | (431 | ) | — | — | (431 | ) | ||||||||||
Unrealized depreciation on open forward currency contracts | — | (150 | ) | — | (150 | ) | ||||||||||
Unrealized depreciation on centrally cleared interest rate swaps | — | (1,017 | ) | — | (1,017 | ) | ||||||||||
|
|
|
|
|
|
|
| |||||||||
Total | $ | (373 | ) | $ | (466 | ) | $ | — | $ | (839 | ) | |||||
|
|
|
|
|
|
|
| |||||||||
| * | Futures contracts, forward currency contracts, interest rate swaps and credit default swaps are not included in the fund’s investment portfolio. |
The Bond Fund of America
| Investment securities | ||||||||||||||||
| Level 1 | Level 2 | Level 3 | Total | |||||||||||||
Assets: | ||||||||||||||||
Bonds, notes & other debt instruments: | ||||||||||||||||
Corporate bonds, notes & loans | $ | — | $ | 3,535,583 | $ | — | $ | 3,535,583 | ||||||||
U.S. Treasury bonds & notes | — | 2,803,177 | — | 2,803,177 | ||||||||||||
Mortgage-backed obligations | — | 2,637,080 | 1,486 | 2,638,566 | ||||||||||||
Asset-backed obligations | — | 452,311 | 9,397 | 461,708 | ||||||||||||
Municipals | — | 165,594 | — | 165,594 | ||||||||||||
Bonds & notes of governments & government agencies outside the U.S. | — | 131,985 | — | 131,985 | ||||||||||||
Federal agency bonds & notes | — | 11,160 | — | 11,160 | ||||||||||||
Short-term securities | 1,425,720 | — | — | 1,425,720 | ||||||||||||
|
|
|
|
|
|
|
| |||||||||
Total | $ | 1,425,720 | $ | 9,736,890 | $ | 10,883 | $ | 11,173,493 | ||||||||
|
|
|
|
|
|
|
| |||||||||
| 300 | American Funds Insurance Series |
Table of Contents
| Other investments* | ||||||||||||||||
| Level 1 | Level 2 | Level 3 | Total | |||||||||||||
Assets: | ||||||||||||||||
Unrealized appreciation on futures contracts | $ | 6,241 | $ | — | $ | — | $ | 6,241 | ||||||||
Unrealized appreciation on open forward currency contracts | — | 3,821 | — | 3,821 | ||||||||||||
Unrealized appreciation on centrally cleared interest rate swaps | — | 15,705 | — | 15,705 | ||||||||||||
Liabilities: | ||||||||||||||||
Unrealized depreciation on futures contracts | (13,194 | ) | — | — | (13,194 | ) | ||||||||||
Unrealized depreciation on open forward currency contracts | — | (174 | ) | — | (174 | ) | ||||||||||
Unrealized depreciation on centrally cleared interest rate swaps | — | (6,629 | ) | — | (6,629 | ) | ||||||||||
Unrealized depreciation on centrally cleared credit default swaps | — | (7,009 | ) | — | (7,009 | ) | ||||||||||
|
|
|
|
|
|
|
| |||||||||
Total | $ | (6,953 | ) | $ | 5,714 | $ | — | $ | (1,239 | ) | ||||||
|
|
|
|
|
|
|
| |||||||||
| * | Futures contracts, forward currency contracts, interest rate swaps and credit default swaps are not included in the fund’s investment portfolio. |
Capital World Bond Fund
| Investment securities | ||||||||||||||||
| Level 1 | Level 2 | Level 3 | Total | |||||||||||||
Assets: | ||||||||||||||||
Bonds, notes & other debt instruments: | ||||||||||||||||
Euros | $ | — | $ | 293,295 | $ | — | $ | 293,295 | ||||||||
Japanese yen | — | 111,151 | — | 111,151 | ||||||||||||
British pounds | — | 61,782 | — | 61,782 | ||||||||||||
Chinese yuan renminbi | — | 42,096 | — | 42,096 | ||||||||||||
Canadian dollars | — | 34,184 | — | 34,184 | ||||||||||||
Mexican pesos | — | 31,627 | — | 31,627 | ||||||||||||
Australian dollars | — | 24,212 | — | 24,212 | ||||||||||||
Danish kroner | — | 23,962 | — | 23,962 | ||||||||||||
South Korean won | — | 7,729 | — | 7,729 | ||||||||||||
Colombian pesos | — | 7,144 | — | 7,144 | ||||||||||||
Chilean pesos | — | 6,074 | — | 6,074 | ||||||||||||
Indonesian rupiah | — | 5,454 | — | 5,454 | ||||||||||||
Russian rubles | — | 1,371 | 1,984 | 3,355 | ||||||||||||
Brazilian reais | — | 3,129 | — | 3,129 | ||||||||||||
South African rand | — | 3,001 | — | 3,001 | ||||||||||||
Dominican pesos | — | 2,271 | — | 2,271 | ||||||||||||
Malaysian ringgits | — | 2,222 | — | 2,222 | ||||||||||||
Ukrainian hryvnia | — | — | 1,592 | 1,592 | ||||||||||||
Indian rupees | — | 1,102 | — | 1,102 | ||||||||||||
Romanian leu | — | 1,038 | — | 1,038 | ||||||||||||
Polish zloty | — | 879 | — | 879 | ||||||||||||
Norwegian kroner | — | 619 | — | 619 | ||||||||||||
U.S. dollars | — | 669,670 | 289 | 669,959 | ||||||||||||
Investment funds | 48,676 | — | — | 48,676 | ||||||||||||
Preferred securities | — | — | 20 | 20 | ||||||||||||
Common stocks | — | — | 134 | 134 | ||||||||||||
Short-term securities | 167 | 100,470 | — | 100,637 | ||||||||||||
|
|
|
|
|
|
|
| |||||||||
Total | $ | 48,843 | $ | 1,434,482 | $ | 4,019 | $ | 1,487,344 | ||||||||
|
|
|
|
|
|
|
| |||||||||
| American Funds Insurance Series | 301 |
Table of Contents
| Other investments* | ||||||||||||||||
| Level 1 | Level 2 | Level 3 | Total | |||||||||||||
Assets: | ||||||||||||||||
Unrealized appreciation on futures contracts | $ | 672 | $ | — | $ | — | $ | 672 | ||||||||
Unrealized appreciation on open forward currency contracts | — | 7,008 | — | 7,008 | ||||||||||||
Unrealized appreciation on centrally cleared credit default swaps | — | 486 | — | 486 | ||||||||||||
Liabilities: | ||||||||||||||||
Unrealized depreciation on futures contracts | (4,659 | ) | — | — | (4,659 | ) | ||||||||||
Unrealized depreciation on open forward currency contracts | — | (2,455 | ) | — | (2,455 | ) | ||||||||||
Unrealized depreciation on centrally cleared interest rate swaps | — | (10,966 | ) | — | (10,966 | ) | ||||||||||
Unrealized depreciation on centrally cleared credit default swaps | — | (19 | ) | — | (19 | ) | ||||||||||
|
|
|
|
|
|
|
| |||||||||
Total | $ | (3,987 | ) | $ | (5,946 | ) | $ | — | $ | (9,933 | ) | |||||
|
|
|
|
|
|
|
| |||||||||
| * | Futures contracts, forward currency contracts, interest rate swaps and credit default swaps are not included in the fund’s investment portfolio. |
American High-Income Trust
| Investment securities | ||||||||||||||||
| Level 1 | Level 2 | Level 3 | Total | |||||||||||||
Assets: | ||||||||||||||||
Bonds, notes & other debt instruments: | ||||||||||||||||
Corporate bonds, notes & loans | $ | — | $ | 731,844 | $ | 4,198 | $ | 736,042 | ||||||||
Mortgage-backed obligations | — | — | 630 | 630 | ||||||||||||
Convertible bonds & notes | — | 399 | 79 | 478 | ||||||||||||
Convertible stocks | 483 | 472 | — | 955 | ||||||||||||
Common stocks | 8,540 | 1,520 | 26,932 | 36,992 | ||||||||||||
Preferred securities | — | — | 2,629 | 2,629 | ||||||||||||
Rights & warrants | — | 826 | 12 | 838 | ||||||||||||
Short-term securities | 38,565 | — | — | 38,565 | ||||||||||||
|
|
|
|
|
|
|
| |||||||||
Total | $ | 47,588 | $ | 735,061 | $ | 34,480 | $ | 817,129 | ||||||||
|
|
|
|
|
|
|
| |||||||||
| Other investments1 | ||||||||||||||||
| Level 1 | Level 2 | Level 3 | Total | |||||||||||||
Assets: | ||||||||||||||||
Unrealized appreciation on futures contracts | $ | 10 | $ | — | $ | — | $ | 10 | ||||||||
Liabilities: | ||||||||||||||||
Unrealized depreciation on futures contracts | (98 | ) | — | — | (98 | ) | ||||||||||
Unrealized depreciation on centrally cleared credit default swaps | — | (154 | ) | — | (154 | ) | ||||||||||
|
|
|
|
|
|
|
| |||||||||
Total | $ | (88 | ) | $ | (154 | ) | $ | — | $ | (242 | ) | |||||
|
|
|
|
|
|
|
| |||||||||
| 1 | Futures contracts and credit default swaps are not included in the investment portfolio. |
The following table reconciles the valuation of the fund’s Level 3 investment securities and related transactions for the year ended
December 31, 2022 (dollars in thousands):
| Beginning value at 1/1/2022 | Transfers into Level 32 | Purchases | Sales | Net realized gain3 | Unrealized depreciation3 | Transfers out of Level 32 | Ending value at 12/31/2022 | |||||||||||||||||||||||||
Investment securities | $ | 40,411 | $ | 3,989 | $ | 4,058 | $ | (11,715 | ) | $ | 883 | $ | (3,084 | ) | $ | (62 | ) | $ | 34,480 | |||||||||||||
Net unrealized depreciation during the period on Level 3 investment securities held at December 31, 2022 |
| $ | (1,467 | ) | ||||||||||||||||||||||||||||
| 2 | Transfers into or out of Level 3 are based on the beginning market value of the quarter in which they occurred. These transfers are the result of changes in the availability of pricing sources and/or in the observability of significant inputs used in valuing the securities. |
| 3 | Net realized gain and unrealized depreciation are included in the related amounts on investments in the fund’s statement of operations. |
| 302 | American Funds Insurance Series |
Table of Contents
Unobservable inputs — Valuation of the fund’s Level 3 securities is based on significant unobservable inputs that reflect the investment adviser’s determination of assumptions that market participants might reasonably use in valuing the securities. The following table provides additional information used by the fund’s investment adviser to fair value the fund’s Level 3 securities (dollars in thousands):
| Value at 12/31/2022 | Valuation techniques | Unobservable inputs | Range (if applicable) | Weighted average* | Impact to valuation from an increase in input† | |||||||||
| Bonds, notes & other debt instruments | $ | 4,828 |
| Estimated recovery value | Expected proceeds | N/A | N/A | N/A | ||||||
| EV/EBITDA multiple | 7.5x | 7.5x | Increase | |||||||||||
| DLOM | 15% | 15% | Decrease | |||||||||||
| Vendor price | N/A | N/A | N/A | |||||||||||
| Yield analysis | Yield | 15.7% - 16.0% | 15.8% | Decrease | ||||||||||
Transaction | Transaction price | N/A | N/A | N/A | ||||||||||
| Net adjustment (decrease) based on movement of market comparables | 10% | 10% | ||||||||||||
| Convertible bonds & notes | 79 | Transaction | Transaction price | N/A | N/A | N/A | ||||||||
| Common stocks | 26,932 | Estimated recovery value | Expected proceeds | N/A | N/A | N/A | ||||||||
| EV/EBITDA multiple | 7.5x | 7.5x | Increase | |||||||||||
| DLOM | 15% | 15% | Decrease | |||||||||||
| Vendor price | N/A | N/A | N/A | |||||||||||
| Risk discount | 90% | 90% | Decrease | |||||||||||
| Net adjustment (decrease) based on movement of market comparables | 20% | 20% | Decrease | |||||||||||
| Market comparable companies | EV/EBITDA multiple | 3.7x | 3.7x | Increase | ||||||||||
| EV/EBITDA less CapEx multiple | 10.2x | 10.2x | Increase | |||||||||||
| DLOM | 17% | 17% | Decrease | |||||||||||
| Transaction | Transaction price | N/A | N/A | N/A | ||||||||||
| Discount for lack of certainty | 5% | 5% | Decrease | |||||||||||
| Indicative market quotation | Broker quote | N/A | N/A | N/A | ||||||||||
| Preferred securities |
| 2,629 |
| Indicative market quotation | Broker quote | N/A | N/A | N/A | ||||||
| Market comparable companies | EV/EBITDA multiple | 3.5x | 3.5x | Increase | ||||||||||
| DLOM | 30% | 30% | Decrease | |||||||||||
| Rights & warrants | 12 | Indicative market quotation | Broker quote | N/A | N/A | N/A | ||||||||
|
| |||||||||||||
| Total | $ | 34,480 | ||||||||||||
|
| |||||||||||||
| * | Weighted average is by relative fair value. |
| † | This column represents the directional change in fair value of the Level 3 securities that would result in an increase from the corresponding input. Significant increases and decreases in these inputs in isolation could result in significantly higher or lower fair value measurements. |
Key to abbreviations and symbols
CapEx = Capital expenditures
DLOM = Discount for lack of marketability
EBITDA = Earnings before income taxes, depreciation and amortization
EV = Enterprise value
| American Funds Insurance Series | 303 |
Table of Contents
American Funds Mortgage Fund
| Investment securities | ||||||||||||||||
| Level 1 | Level 2 | Level 3 | Total | |||||||||||||
Assets: | ||||||||||||||||
Bonds, notes & other debt instruments: | ||||||||||||||||
Mortgage-backed obligations | $ | — | $ | 71,406 | $ | — | $ | 71,406 | ||||||||
U.S. Treasury bonds & notes | — | 10,720 | — | 10,720 | ||||||||||||
Asset-backed obligations | — | 2,388 | — | 2,388 | ||||||||||||
Short-term securities | — | 22,857 | — | 22,857 | ||||||||||||
|
|
|
|
|
|
|
| |||||||||
Total | $ | — | $ | 107,371 | $ | — | $ | 107,371 | ||||||||
|
|
|
|
|
|
|
| |||||||||
| Other investments* | ||||||||||||||||
| Level 1 | �� | Level 2 | Level 3 | Total | ||||||||||||
Assets: | ||||||||||||||||
Unrealized appreciation on futures contracts | $ | 49 | $ | — | $ | — | $ | 49 | ||||||||
Unrealized appreciation on centrally cleared interest rate swaps | — | 790 | — | 790 | ||||||||||||
Liabilities: | ||||||||||||||||
Unrealized depreciation on futures contracts | (124 | ) | — | — | (124 | ) | ||||||||||
|
|
|
|
|
|
|
| |||||||||
Total | $ | (75 | ) | $ | 790 | $ | — | $ | 715 | |||||||
|
|
|
|
|
|
|
| |||||||||
| * | Futures contracts and interest rate swaps are not included in the fund’s investment portfolio. |
Ultra-Short Bond Fund
As of December 31, 2022, all of the fund’s investment securities were classified as Level 2.
U.S. Government Securities Fund
| Investment securities | ||||||||||||||||
| Level 1 | Level 2 | Level 3 | Total | |||||||||||||
Assets: | ||||||||||||||||
Bonds, notes & other debt instruments: | ||||||||||||||||
Mortgage-backed obligations | $ | — | $ | 723,593 | $ | — | $ | 723,593 | ||||||||
U.S. Treasury bonds & notes | — | 597,122 | — | 597,122 | ||||||||||||
Federal agency bonds & notes | — | 79,196 | — | 79,196 | ||||||||||||
Short-term securities | — | 318,094 | — | 318,094 | ||||||||||||
|
|
|
|
|
|
|
| |||||||||
Total | $ | — | $ | 1,718,005 | $ | — | $ | 1,718,005 | ||||||||
|
|
|
|
|
|
|
| |||||||||
| Other investments* | ||||||||||||||||
| Level 1 | Level 2 | Level 3 | Total | |||||||||||||
Assets: | ||||||||||||||||
Unrealized appreciation on futures contracts | $ | 14,523 | $ | — | $ | — | $ | 14,523 | ||||||||
Unrealized appreciation on centrally cleared interest rate swaps | — | 30,519 | — | 30,519 | ||||||||||||
Liabilities: | ||||||||||||||||
Unrealized depreciation on futures contracts | (17,699 | ) | — | — | (17,699 | ) | ||||||||||
Unrealized depreciation on centrally cleared interest rate swaps | — | (21,723 | ) | — | (21,723 | ) | ||||||||||
|
|
|
|
|
|
|
| |||||||||
Total | $ | (3,176 | ) | $ | 8,796 | $ | — | $ | 5,620 | |||||||
|
|
|
|
|
|
|
| |||||||||
| * | Futures contracts and interest rate swaps are not included in the fund’s investment portfolio. |
Managed Risk Growth Fund
As of December 31, 2022, all of the fund’s investments were classified as Level 1.
Managed Risk International Fund
As of December 31, 2022, all of the fund’s investments were classified as Level 1.
Managed Risk Washington Mutual Investors Fund
As of December 31, 2022, all of the fund’s investments were classified as Level 1.
| 304 | American Funds Insurance Series |
Table of Contents
Managed Risk Growth-Income Fund
As of December 31, 2022, all of the fund’s investments were classified as Level 1.
Managed Risk Asset Allocation Fund
As of December 31, 2022, all of the fund’s investments were classified as Level 1.
4. Risk factors
Investing in the funds may involve certain risks including, but not limited to, those described below.
Market conditions — The prices of, and the income generated by, the common stocks, bonds and other securities held by a fund may decline — sometimes rapidly or unpredictably — due to various factors, including events or conditions affecting the general economy or particular industries or companies; overall market changes; local, regional or global political, social or economic instability; governmental, governmental agency or central bank responses to economic conditions; and currency exchange rate, interest rate and commodity price fluctuations. These risks may be heightened in the case of smaller capitalization stocks.
Economies and financial markets throughout the world are highly interconnected. Economic, financial or political events, trading and tariff arrangements, wars, terrorism, cybersecurity events, natural disasters, public health emergencies (such as the spread of infectious disease) and other circumstances in one country or region, including actions taken by governmental or quasi-governmental authorities in response to any of the foregoing, could have impacts on global economies or markets. As a result, whether or not a fund invests in securities of issuers located in or with significant exposure to the countries affected, the value and liquidity of a fund’s investments may be negatively affected by developments in other countries and regions.
Issuer risks — The prices of, and the income generated by, securities held by a fund may decline in response to various factors directly related to the issuers of such securities, including reduced demand for an issuer’s goods or services, poor management performance, major litigation, investigations or other controversies related to the issuer, changes in the issuer’s financial condition or credit rating, changes in government regulations affecting the issuer or its competitive environment and strategic initiatives such as mergers, acquisitions or dispositions and the market response to any such initiatives.
Investing in income-oriented stocks — The value of a fund’s securities and income provided by a fund may be reduced by changes in the dividend policies of, and the capital resources available for dividend payments at, the companies in which the fund invests.
Investing in growth-oriented stocks — Growth-oriented common stocks and other equity-type securities (such as preferred stocks, convertible preferred stocks and convertible bonds) may involve larger price swings and greater potential for loss than other types of investments. These risks may be even greater in the case of smaller capitalization stocks.
Investing in small companies — Investing in smaller companies may pose additional risks. For example, it is often more difficult to value or dispose of small company stocks and more difficult to obtain information about smaller companies than about larger companies. Furthermore, smaller companies often have limited product lines, operating histories, markets and/or financial resources, may be dependent on one or a few key persons for management, and can be more susceptible to losses. Moreover, the prices of their stocks may be more volatile than stocks of larger, more established companies, particularly during times of market turmoil.
Investing outside the U.S. — Securities of issuers domiciled outside the U.S., or with significant operations or revenues outside the U.S., may lose value because of adverse political, social, economic or market developments (including social instability, regional conflicts, terrorism and war) in the countries or regions in which the issuers operate or generate revenue. These securities may also lose value due to changes in foreign currency exchange rates against the U.S. dollar and/or currencies of other countries. Issuers of these securities may be more susceptible to actions of foreign governments, such as nationalization, currency blockage or the imposition of price controls, sanctions, or punitive taxes, each of which could adversely impact the value of these securities. Securities markets in certain countries may be more volatile and/or less liquid than those in the U.S. Investments outside the U.S. may also be subject to different regulatory, legal, accounting, auditing, financial reporting and recordkeeping requirements, and may be more difficult to value, than those in the U.S. In addition, the value of investments outside the U.S. may be reduced by foreign taxes, including foreign withholding taxes on interest and dividends. Further, there may be increased risks of delayed settlement of securities purchased or sold by the fund, which could impact the liquidity of the fund’s portfolio. The risks of investing outside the U.S. may be heightened in connection with investments in emerging markets.
| American Funds Insurance Series | 305 |
Table of Contents
Investing in developing countries — Investing in countries with developing economies and/or markets may involve risks in addition to and greater than those generally associated with investing in developed countries. For instance, developing countries tend to have less developed political, economic and legal systems than those in developed countries. Accordingly, the governments of these countries may be less stable and more likely to intervene in the market economy, for example, by imposing capital controls, nationalizing a company or industry, placing restrictions on foreign ownership and on withdrawing sale proceeds of securities from the country, and/or imposing punitive taxes that could adversely affect the prices of securities. Information regarding issuers in developing countries may be limited, incomplete or inaccurate, and such issuers may not be subject to regulatory, accounting, auditing, and financial reporting and recordkeeping standards comparable to those to which issuers in developed countries are subject. A fund’s rights with respect to its investments in developing countries, if any, will generally be governed by local law, which may make it difficult or impossible for the fund to pursue legal remedies or to obtain and enforce judgments in local courts. In addition, the economies of these countries may be dependent on relatively few industries, may have limited access to capital and may be more susceptible to changes in local and global trade conditions and downturns in the world economy. Securities markets in these countries can also be relatively small and have substantially lower trading volumes. As a result, securities issued in these countries may be more volatile and less liquid, and may be more difficult to value, than securities issued in countries with more developed economies and/or markets. Less certainty with respect to security valuations may lead to additional challenges and risks in calculating a fund’s net asset value. Additionally, developing countries are more likely to experience problems with the clearing and settling of trades and the holding of securities by banks, agents and depositories that are less established than those in developed countries.
Investing in emerging markets — Investing in emerging markets may involve risks in addition to and greater than those generally associated with investing in the securities markets of developed countries. For instance, emerging market countries tend to have less developed political, economic and legal systems than those in developed countries. Accordingly, the governments of these countries may be less stable and more likely to intervene in the market economy, for example, by imposing capital controls, nationalizing a company or industry, placing restrictions on foreign ownership and on withdrawing sale proceeds of securities from the country, and/or imposing punitive taxes that could adversely affect the prices of securities. Information regarding issuers in emerging markets may be limited, incomplete or inaccurate, and such issuers may not be subject to regulatory, accounting, auditing, and financial reporting and recordkeeping standards comparable to those to which issuers in more developed markets are subject. A fund’s rights with respect to its investments in emerging markets, if any, will generally be governed by local law, which may make it difficult or impossible for the fund to pursue legal remedies or to obtain and enforce judgments in local courts. In addition, the economies of these countries may be dependent on relatively few industries, may have limited access to capital and may be more susceptible to changes in local and global trade conditions and downturns in the world economy. Securities markets in these countries can also be relatively small and have substantially lower trading volumes. As a result, securities issued in these countries may be more volatile and less liquid, and may be more difficult to value, than securities issued in countries with more developed economies and/or markets. Less certainty with respect to security valuations may lead to additional challenges and risks in calculating a fund’s net asset value. Additionally, emerging markets are more likely to experience problems with the clearing and settling of trades and the holding of securities by banks, agents and depositories that are less established than those in developed countries.
Investing in debt instruments — The prices of, and the income generated by, bonds and other debt securities held by a fund may be affected by factors such as the interest rates, maturities and credit quality of these securities.
Rising interest rates will generally cause the prices of bonds and other debt securities to fall. Also, when interest rates rise, issuers are less likely to refinance existing debt securities, causing the average life of such securities to extend. A general rise in interest rates may cause investors to sell debt securities on a large scale, which could also adversely affect the price and liquidity of debt securities and could also result in increased redemptions from a fund. Falling interest rates may cause an issuer to redeem, call or refinance a debt security before its stated maturity, which may result in a fund failing to recoup the full amount of its initial investment and having to reinvest the proceeds in lower yielding securities. Longer maturity debt securities generally have greater sensitivity to changes in interest rates and may be subject to greater price fluctuations than shorter maturity debt securities.
Bonds and other debt securities are also subject to credit risk, which is the possibility that the credit strength of an issuer or guarantor will weaken or be perceived to be weaker, and/or an issuer of a debt security will fail to make timely payments of principal or interest and the security will go into default. Changes in actual or perceived creditworthiness may occur quickly. A downgrade or default affecting any of a fund’s securities could cause the value of a fund’s shares to decrease. Lower quality debt securities generally have higher rates of interest and may be subject to greater price fluctuations than higher quality debt securities. Credit risk is gauged, in part, by the credit ratings of the debt securities in which a fund invests. However, ratings are only the opinions of the rating agencies issuing them and are not guarantees as to credit quality or an evaluation of market risk. The fund’s investment adviser relies on its own credit analysts to research issuers and issues in assessing credit and default risks.
| 306 | American Funds Insurance Series |
Table of Contents
Investing in lower rated debt instruments — Lower rated bonds and other lower rated debt securities generally have higher rates of interest and involve greater risk of default or price declines due to changes in the issuer’s creditworthiness than those of higher quality debt securities. The market prices of these securities may fluctuate more than the prices of higher quality debt securities and may decline significantly in periods of general economic difficulty. These risks may be increased with respect to investments in junk bonds.
Investing in derivatives — The use of derivatives involves a variety of risks, which may be different from, or greater than, the risks associated with investing in traditional securities, such as stocks and bonds. Changes in the value of a derivative may not correlate perfectly with, and may be more sensitive to market events than, the underlying asset, rate or index, and a derivative instrument may cause a fund to lose significantly more than its initial investment. Derivatives may be difficult to value, difficult for a fund to buy or sell at an opportune time or price and difficult, or even impossible, to terminate or otherwise offset. A fund’s use of derivatives may result in losses to the fund, and investing in derivatives may reduce a fund’s returns and increase a fund’s price volatility. A fund’s counterparty to a derivative transaction (including, if applicable, the fund’s clearing broker, the derivatives exchange or the clearinghouse) may be unable or unwilling to honor its financial obligations in respect of the transaction. In certain cases, the fund may be hindered or delayed in exercising remedies against or closing out derivative instruments with a counterparty, which may result in additional losses.
Derivatives are also subject to operational risk (such as documentation issues, settlement issues and systems failures) and legal risk (such as insufficient documentation, insufficient capacity or authority of a counterparty, and issues with the legality or enforceability of a contract).
Currency — The prices of, and the income generated by, many debt securities held by a fund may also be affected by changes in relative currency values. If the U.S. dollar appreciates against foreign currencies, the value in U.S. dollars of a fund’s securities denominated in such currencies would generally fall and vice versa.
Investing in mortgage-related and other asset-backed securities — Mortgage-related securities, such as mortgage-backed securities, and other asset-backed securities, include debt obligations that represent interests in pools of mortgages or other income-bearing assets, such as residential mortgage loans, home equity loans, mortgages on commercial buildings, consumer loans and equipment leases. While such securities are subject to the risks associated with investments in debt instruments generally (for example, credit, extension and interest rate risks), they are also subject to other and different risks. Mortgage-backed and other asset-backed securities are subject to changes in the payment patterns of borrowers of the underlying debt, potentially increasing the volatility of the securities and a fund’s net asset value. When interest rates fall, borrowers are more likely to refinance or prepay their debt before its stated maturity. This may result in a fund having to reinvest the proceeds in lower yielding securities, effectively reducing a fund’s income. Conversely, if interest rates rise and borrowers repay their debt more slowly than expected, the time in which the mortgage-backed and other asset-backed securities are paid off could be extended, reducing a fund’s cash available for reinvestment in higher yielding securities. Mortgage-backed securities are also subject to the risk that underlying borrowers will be unable to meet their obligations and the value of property that secures the mortgages may decline in value and be insufficient, upon foreclosure, to repay the associated loans. Investments in asset-backed securities are subject to similar risks.
Investing in future delivery contracts — A fund may enter into contracts, such as to-be-announced contracts and mortgage dollar rolls, that involve a fund selling mortgage-related securities and simultaneously contracting to repurchase similar securities for delivery at a future date at a predetermined price. This can increase a fund’s market exposure, and the market price of the securities that the fund contracts to repurchase could drop below their purchase price. While a fund can preserve and generate capital through the use of such contracts by, for example, realizing the difference between the sale price and the future purchase price, the income generated by the fund may be reduced by engaging in such transactions. In addition, these transactions increase the turnover rate of a fund.
Investing in inflation-linked bonds — The values of inflation-linked bonds generally fluctuate in response to changes in real interest rates - i.e., rates of interest after factoring in inflation. A rise in real interest rates may cause the prices of inflation-linked securities to fall, while a decline in real interest rates may cause the prices to increase. Inflation-linked bonds may experience greater losses than other debt securities with similar durations when real interest rates rise faster than nominal interest rates. There can be no assurance that the value of an inflation-linked security will be directly correlated to changes in interest rates; for example, if interest rates rise for reasons other than inflation, the increase may not be reflected in the security’s inflation measure.
Investing in inflation-linked bonds may also reduce a fund’s distributable income during periods of deflation. If prices for goods and services decline throughout the economy, the principal and income on inflation-linked securities may decline and result in losses to a fund.
| American Funds Insurance Series | 307 |
Table of Contents
Investing in securities backed by the U.S. government — Securities backed by the U.S. Treasury or the full faith and credit of the U.S. government are guaranteed only as to the timely payment of interest and principal when held to maturity. Accordingly, the current market values for these securities will fluctuate with changes in interest rates and the credit rating of the U.S. government. Securities issued by U.S. government-sponsored entities and federal agencies and instrumentalities that are not backed by the full faith and credit of the U.S. government are neither issued nor guaranteed by the U.S. government. U.S. government securities are subject to market risk, interest rate risk and credit risk.
Investing in repurchase agreements — Upon entering into a repurchase agreement, a fund purchases a security from a bank or broker-dealer, which simultaneously commits to repurchase the security within a specified time at the fund’s cost with interest. The security purchased by the fund constitutes collateral for the seller’s repurchase obligation. If the party agreeing to repurchase should default, the fund may seek to sell the security it holds as collateral. The fund may incur a loss if the value of the collateral securing the repurchase obligation falls below the repurchase price. The fund may also incur disposition costs and encounter procedural delays in connection with liquidating the collateral.
Interest rate risk — The values and liquidity of the securities held by a fund may be affected by changing interest rates. For example, the values of these securities may decline when interest rates rise and increase when interest rates fall. Longer maturity debt securities generally have greater sensitivity to changes in interest rates and may be subject to greater price fluctuations than shorter maturity debt securities. A fund may invest in variable and floating rate securities. When a fund holds variable or floating rate securities, a decrease in market interest rates will adversely affect the income received from such securities and the net asset value of a fund’s shares. Although the values of such securities are generally less sensitive to interest rate changes than those of other debt securities, the value of variable and floating rate securities may decline if their interest rates do not rise as quickly, or as much, as market interest rates. Conversely, floating rate securities will not generally increase in value if interest rates decline. During periods of extremely low short-term interest rates, a fund may not be able to maintain a positive yield and, in relatively low interest rate environments, there are heightened risks associated with rising interest rates.
Credit and liquidity support — Changes in the credit quality of banks and financial institutions providing credit and liquidity support features with respect to securities held by a fund could cause the values of these securities to decline.
Asset allocation — A fund’s percentage allocation to equity securities, debt securities and money market instruments could cause the fund to underperform relative to relevant benchmarks and other funds with similar investment objectives.
Liquidity risk — Certain fund holdings may be or may become difficult or impossible to sell, particularly during times of market turmoil. Liquidity may be impacted by the lack of an active market for a holding, legal or contractual restrictions on resale, or the reduced number and capacity of market participants to make a market in such holding. Market prices for less liquid or illiquid holdings may be volatile or difficult to determine, and reduced liquidity may have an adverse impact on the market price of such holdings. Additionally, the sale of less liquid or illiquid holdings may involve substantial delays (including delays in settlement) and additional costs and the fund may be unable to sell such holdings when necessary to meet its liquidity needs, or to try to limit losses, or may be forced to sell at a loss.
Management — The investment adviser to the funds actively manages the funds’ investments. Consequently, the funds are subject to the risk that the methods and analyses, including models, tools and data, employed by the investment adviser in this process may be flawed or incorrect and may not produce the desired results. This could cause the funds to lose value or their investment results to lag relevant benchmarks or other funds with similar objectives.
Investing in the managed risk funds may involve additional risks including, but not limited to, those described below.
Fund structure — The managed risk funds invest in underlying funds and incur expenses related to those underlying funds. In addition, investors in the managed risk funds will incur fees to pay for certain expenses related to the operations of the managed risk funds. An investor holding the underlying fund directly would incur lower overall expenses but would not receive the benefit of the managed risk strategy. Additionally, in accordance with an exemption under the Investment Company Act of 1940, as amended, the investment adviser considers only proprietary funds when selecting underlying investment options and allocations. This means that the fund’s investment adviser did not, nor does it expect to, consider any unaffiliated funds as underlying investment options for the fund. This strategy could raise certain conflicts of interest when choosing underlying investments for the fund, including the selection of funds that result in greater compensation to the adviser or funds with relatively lower historical investment results. The investment adviser has policies and procedures designed to mitigate material conflicts of interest that may arise in connection with its management of the fund.
| 308 | American Funds Insurance Series |
Table of Contents
Management — The managed risk funds are subject to the risk that the managed risk strategy or the methods employed by the subadviser in implementing the managed risk strategy may not produce the desired results. This could cause the managed risk funds to lose value or their investment results to lag relevant benchmarks or other funds with similar objectives.
Underlying fund risks — Because the managed risk funds’ investments consist of investments in underlying funds, the managed risk funds’ risks are directly related to the risks of the respective underlying fund in which each managed risk fund invests. For this reason, it is important to understand the risks associated with investing both in the managed risk fund and in each of the underlying funds.
Investing in options and futures contracts — In addition to the risks generally associated with investing in derivative instruments, options and futures contracts are subject to the creditworthiness of the clearing organizations, exchanges and, in the case of futures, futures commission merchants with which a fund transacts. While both options and futures contracts are generally liquid instruments, under certain market conditions, options and futures may be deemed to be illiquid. For example, a fund may be temporarily prohibited from closing out its position in an options or futures contract if intraday price change limits or limits on trading volume imposed by the applicable exchange are triggered. If a fund is unable to close out a position on an options or futures contract, the fund would remain subject to the risk of adverse price movements until the fund is able to close out the position in question. The ability of a fund to successfully utilize options and futures contracts may depend in part upon the ability of the fund’s investment adviser or subadviser to accurately forecast interest rates and other economic factors and to assess and predict the impact of such economic factors on the options and futures in which the fund invests. If the investment adviser or subadviser incorrectly forecasts economic developments or incorrectly predicts the impact of such developments on the options and futures in which it invests, a fund could suffer losses. Whereas the risk of loss on a put option purchased by the fund is limited to the initial cost of the option, the amount of a potential loss on a futures contract could greatly exceed the relatively small initial amount invested in entering the futures position.
Hedging — There may be imperfect or even negative correlation between the prices of the options and futures contracts in which a fund invests and the prices of the underlying securities or indexes which the fund seeks to hedge. For example, options and futures contracts may not provide an effective hedge because changes in options and futures contract prices may not track those of the underlying securities or indexes they are intended to hedge. In addition, there are significant differences between the securities market, on the one hand, and the options and futures markets, on the other, that could result in an imperfect correlation between the markets, causing a given hedge not to achieve its objectives. The degree of imperfection of correlation depends on circumstances such as variations in speculative market demand for options and futures, including technical influences in options and futures trading, and differences between the financial instruments being hedged and the instruments underlying the standard contracts available for trading. A decision as to whether, when and how to hedge involves the exercise of skill and judgment, and even a well-conceived hedge may be unsuccessful to some degree because of market behavior or unexpected interest rate trends. In addition, the fund’s investment in exchange-traded options and futures and their resulting costs could limit the fund’s gains in rising markets relative to those of the underlying funds, or to those of unhedged funds in general.
Short positions — The fund may suffer losses from short positions in futures contracts. Losses from short positions in futures contracts occur when the underlying index increases in value. As the underlying index increases in value, the holder of the short position in the corresponding futures contract is required to pay the difference in value of the futures contract resulting from the increase in the index on a daily basis. Losses from a short position in an index futures contract could potentially be very large if the value of the underlying index rises dramatically in a short period of time.
Nondiversification risk — As nondiversified funds, the managed risk funds have the ability to invest a larger percentage of their assets in the securities of a smaller number of issuers than diversified funds. To the extent that a managed risk fund invests a larger percentage of its assets in securities of one or more issuers, poor performance by these securities could have a greater adverse impact on the fund’s investment results.
| American Funds Insurance Series | 309 |
Table of Contents
5. Certain investment techniques
Securities lending — Some of the funds have entered into securities lending transactions in which the funds earn income by lending investment securities to brokers, dealers or other institutions. Each transaction involves three parties: the fund, acting as the lender of the securities, a borrower, and a lending agent that acts as an intermediary.
Securities lending transactions are entered into by the fund under the securities lending agreement with the lending agent. The lending agent facilitates the exchange of securities between the lender and the borrower, generally provides protection from borrower default, marks to market the value of collateral daily, secures additional collateral from the borrower if it falls below preset terms, and may reinvest the collateral on behalf of the fund according to agreed parameters. The lending agent has indemnified the fund against losses resulting from borrower default. Although risk is mitigated by the collateral and indemnification, the fund could experience a delay in recovering its securities and a potential loss of income or value if the borrower fails to return the securities, collateral investments decline in value or the lending agent fails to perform.
The borrower is required to post highly liquid assets, such as cash or U.S. government securities, as collateral for the loan in an amount at least equal to the value of the securities loaned. Investments made with cash collateral are recognized as assets in the fund’s investment portfolio. The same amount is recorded as a liability in the fund’s statement of assets and liabilities. While securities are on loan, the fund will continue to receive the equivalent of the interest, dividends or other distributions paid by the issuer, as well as a portion of the interest on the investment of the collateral. Additionally, although the fund does not have the right to vote on securities while they are on loan, the fund has a right to consent on corporate actions and a right to recall loaned securities to vote on proposals affecting them. The borrower is obligated to return the loaned security at the conclusion of the loan or, during the pendency of the loan, on demand from the fund.
The following table presents the value of the securities on loan, the type and value of collateral received and the value of the investment securities purchased, if any, from the cash collateral received by each fund (dollars in thousands):
| Collateral received | ||||||||||||||||
Funds | Value of investment securities on loan | Cash | U.S. government securities | Value of investment securities purchased | ||||||||||||
Global Small Capitalization Fund | $ | 59,781 | $ | 58,725 | $ | 4,519 | $ | 52,853 | ||||||||
Growth Fund | 54,504 | 55,867 | — | 50,280 | ||||||||||||
International Fund | 1,530 | 1,607 | — | 1,446 | ||||||||||||
New World Fund | 311 | 327 | — | 295 | ||||||||||||
Washington Mutual Investors Fund | 12,432 | 12,908 | — | 11,618 | ||||||||||||
Capital World Growth and Income Fund | 6,155 | 6,480 | — | 5,832 | ||||||||||||
Growth-Income Fund | 240,456 | 248,693 | — | 223,824 | ||||||||||||
International Growth and Income Fund | 1,435 | 962 | 585 | 866 | ||||||||||||
Capital Income Builder | 6,251 | 6,553 | — | 5,898 | ||||||||||||
Asset Allocation Fund | 67,688 | 56,897 | 17,890 | 51,207 | ||||||||||||
Investment securities purchased from cash collateral are disclosed in the investment portfolio as short-term securities. Securities received as collateral, if any, are not recognized as fund assets. The contractual maturity of collateral received under the securities lending agreement is classified as overnight and continuous.
Index-linked bonds — Some of the funds have invested in index-linked bonds, which are fixed-income securities whose principal value is periodically adjusted to a government price index. Over the life of an index-linked bond, interest is paid on the adjusted principal value. Increases or decreases in the principal value of index-linked bonds are recorded as interest income in the fund’s statement of operations.
Mortgage dollar rolls — Some of the funds have entered into mortgage dollar roll transactions in which the fund sells a mortgage-backed security to a counterparty and simultaneously enters into an agreement with the same counterparty to buy back a similar security on a specific future date at a predetermined price. Mortgage dollar rolls are accounted for as purchase and sale transactions, which may increase the funds’ portfolio turnover rates.
| 310 | American Funds Insurance Series |
Table of Contents
Loan transactions — Some of the funds have entered into loan transactions in which the fund acquires a loan either through an agent, by assignment from another holder, or as a participation interest in another holder’s portion of a loan. The loan is often administered by a financial institution that acts as agent for the holders of the loan, and the fund may be required to receive approval from the agent and/or borrower prior to the sale of the investment. The loan’s interest rate and maturity date may change based on the terms of the loan, including potential early payments of principal.
Short-term securities — The managed risk funds hold shares of State Street Institutional U.S. Government Money Market Fund, a cash management vehicle offered and managed by State Street Bank and Trust Company.
Unfunded commitments — Asset Allocation Fund, Capital World Bond Fund and American High-Income Trust have participated in transactions that involve unfunded commitments, which may obligate each fund to purchase new or additional bonds and/or purchase additional shares of the applicable issuer if certain contingencies are met. As of December 31, 2022, the maximum exposure from these unfunded commitments for Asset Allocation Fund, Capital World Bond Fund and American High-Income Trust was $5,000,000, $150,000 and $4,155,000, respectively, which would represent 0.02%, 0.01% and 0.50%, respectively, of the net assets of each fund should such commitments become due. Unrealized appreciation on these unfunded commitments for Capital World Bond Fund and American High-Income Trust of $12,000 and $572,000, respectively, is disclosed as unrealized appreciation on unfunded commitments in each fund’s statement of assets and liabilities, and unrealized depreciation on these unfunded commitments for Asset Allocation Fund, Capital World Bond Fund and American High-Income Trust of $9,000, $1,000 and $3,000, respectively, is disclosed as unrealized depreciation on unfunded commitments in each fund’s statement of assets and liabilities. Both are included in net unrealized (depreciation) appreciation on investments in unaffiliated issuers in each fund’s statement of operations.
Options contracts — The managed risk funds have entered into options contracts, which give the holder of the option, in return for a premium payment, the right to buy from (in the case of a call) or sell to (in the case of a put) the writer of the option, the security underlying the option (or the cash value of the index underlying the option) at a specified price. As part of their managed risk strategy, the funds will at times purchase put options on equity indexes in standardized contracts traded on foreign or domestic securities exchanges, boards of trade, or similar entities. By purchasing a put option on an equity index, the funds obtain the right (but not the obligation) to sell the cash value of the index underlying the option at a specified exercise price, and in return for this right, the funds pay the current market price, or the option premium, for the option.
The funds may terminate their position in a put option by allowing the option to expire or by exercising the option. If the option is allowed to expire, the funds will lose the entire premium. If the option is exercised, the funds complete the sale of the underlying instrument (or delivers the cash value of the index underlying the option) at the exercise price. The funds may also terminate a put option position by entering into opposing close-out transactions in advance of the option expiration date.
Premiums paid on options purchased, as well as the daily fluctuation in market value, are included in investment securities from unaffiliated issuers in each fund’s statement of assets and liabilities. Realized gains or losses are recorded at the time the option contract is closed or expires. Net realized gains or losses and net unrealized appreciation or depreciation from options contracts are recorded in investments in unaffiliated issuers in each fund’s statement of operations.
Futures contracts — Some of the funds have entered into futures contracts, which provide for the future sale by one party and purchase by another party of a specified amount of a specific financial instrument for a specified price, date, time and place designated at the time the contract is made. Futures contracts are used to strategically manage the fund’s interest rate sensitivity by increasing or decreasing the duration of the fund or a portion of the fund’s portfolio. For the managed risk funds, futures contracts are used to strategically manage portfolio volatility and downside equity risk.
Upon entering into futures contracts, and to maintain the fund’s open positions in futures contracts, the fund is required to deposit with a futures broker, known as a futures commission merchant (“FCM“), in a segregated account in the name of the FCM an amount of cash, U.S. government securities or other liquid securities, known as initial margin. The margin required for a particular futures contract is set by the exchange on which the contract is traded to serve as collateral, and may be significantly modified from time to time by the exchange during the term of the contract.
On a daily basis, each fund pays or receives variation margin based on the increase or decrease in the value of the futures contracts and records variation margin on futures contracts in each fund’s statement of assets and liabilities. Futures contracts may involve a risk of loss in excess of the variation margin shown on each fund’s statement of assets and liabilities. Each fund records realized gains or losses at the time the futures contract is closed or expires. Net realized gains or losses and net unrealized appreciation or depreciation from futures contracts are recorded in each fund’s statement of operations.
| American Funds Insurance Series | 311 |
Table of Contents
Forward currency contracts — Some of the funds have entered into forward currency contracts, which represent agreements to exchange currencies on specific future dates at predetermined rates. The series’ investment adviser uses forward currency contracts to manage the fund’s exposure to changes in exchange rates. Upon entering into these contracts, risks may arise from the potential inability of counterparties to meet the terms of their contracts and from possible movements in exchange rates.
On a daily basis, the series’ investment adviser values forward currency contracts based on the applicable exchange rates and records unrealized appreciation or depreciation for open forward currency contracts in each fund’s statement of assets and liabilities. Realized gains or losses are recorded at the time the forward contract is closed or offset by another contract with the same broker for the same settlement date and currency. Closed forward currency contracts that have not reached their settlement date are included in the respective receivables or payables for closed forward currency contracts in each fund’s statement of assets and liabilities. Net realized gains or losses from closed forward currency contracts and net unrealized appreciation or depreciation from open forward currency contracts are recorded in each fund’s statement of operations.
Swap contracts — Some of the funds have entered into swap agreements, which are two-party contracts entered into primarily by institutional investors for a specified time period. In a typical swap transaction, two parties agree to exchange the returns earned or realized from one or more underlying assets or rates of return. Swap agreements can be traded on a swap execution facility (SEF) and cleared through a central clearinghouse (cleared), traded over-the-counter (OTC) and cleared, or traded bilaterally and not cleared. Because clearing interposes a central clearinghouse as the ultimate counterparty to each participant’s swap, and margin is required to be exchanged under the rules of the clearinghouse, central clearing is intended to decrease (but not eliminate) counterparty risk relative to uncleared bilateral swaps. To the extent the funds enter into bilaterally negotiated swap transactions, the funds will enter into swap agreements only with counterparties that meet certain credit standards and subject to agreed collateralized procedures. The term of a swap can be days, months or years and certain swaps may be less liquid than others.
Upon entering into a centrally cleared swap contract, the funds are required to deposit cash, U.S. government securities or other liquid securities, which is known as initial margin. Generally, the initial margin required for a particular swap is set and held as collateral by the clearinghouse on which the contract is cleared. The amount of initial margin required may be significantly modified from time to time by the clearinghouse during the term of the contract.
On a daily basis, interest accruals related to the exchange of future payments are recorded as a receivable and payable in the funds’ statement of assets and liabilities for centrally cleared swaps and as unrealized appreciation or depreciation in the funds’ statement of assets and liabilities for bilateral swaps. For centrally cleared swaps, the fund also pays or receives a variation margin based on the increase or decrease in the value of the swaps, including accrued interest as applicable, and records variation margin in the statement of assets and liabilities. The funds record realized gains and losses on both the net accrued interest and any gain or loss recognized at the time the swap is closed or expires. Net realized gains or losses, as well as any net unrealized appreciation or depreciation, from swaps are recorded in the funds’ statement of operations.
Swap agreements can take different forms. Some of the funds have entered into the following types of swap agreements:
Interest rate swaps — Some of the funds have entered into interest rate swaps, which seek to manage the interest rate sensitivity of the fund by increasing or decreasing the duration of the funds or a portion of the funds’ portfolio. An interest rate swap is an agreement between two parties to exchange or swap payments based on changes in an interest rate or rates. Typically, one interest rate is fixed and the other is variable based on a designated short-term interest rate such as the Secured Overnight Financing Rate (SOFR), prime rate or other benchmark. In other types of interest rate swaps, known as basis swaps, the parties agree to swap variable interest rates based on different designated short-term interest rates. Interest rate swaps generally do not involve the delivery of securities or other principal amounts. Rather, cash payments are exchanged by the parties based on the application of the designated interest rates to a notional amount, which is the predetermined dollar principal of the trade upon which payment obligations are computed. Accordingly, the funds’ current obligation or right under the swap agreement is generally equal to the net amount to be paid or received under the swap agreement based on the relative value of the position held by each party.
| 312 | American Funds Insurance Series |
Table of Contents
Credit default swap indices — Some of the funds have entered into centrally cleared credit default swap indices, including CDX and iTraxx indices (collectively referred to as “CDSIs”), in order to assume exposure to a diversified portfolio of credits or to hedge against existing credit risks. A CDSI is based on a portfolio of credit default swaps with similar characteristics, such as credit default swaps on high-yield bonds. In a typical CDSI transaction, one party (the protection buyer) is obligated to pay the other party (the protection seller) a stream of periodic payments over the term of the contract. If a credit event, such as a default or restructuring, occurs with respect to any of the underlying reference obligations, the protection seller must pay the protection buyer the loss on those credits.
The funds may enter into a CDSI transaction as either protection buyer or protection seller. If the funds are protection buyers, they would pay the counterparty a periodic stream of payments over the term of the contract and would not recover any of those payments if no credit events were to occur with respect to any of the underlying reference obligations. However, if a credit event did occur, the funds, as protection buyers, would have the right to deliver the referenced debt obligations or a specified amount of cash, depending on the terms of the applicable agreement, and to receive the par value of such debt obligations from the counterparty protection seller. As protection sellers, the funds would receive fixed payments throughout the term of the contract if no credit events were to occur with respect to any of the underlying reference obligations. If a credit event were to occur, however, the value of any deliverable obligation received by the funds, coupled with the periodic payments previously received by the funds, may be less than the full notional value that the funds, as a protection seller, pays to the counterparty protection buyer, effectively resulting in a loss of value to the funds. Furthermore, as protection sellers, the funds would effectively add leverage to their portfolio because it would have investment exposure to the notional amount of the swap transaction.
The following table presents the average month-end notional amounts of options contracts purchased, futures contracts, forward currency contracts, interest rate swaps and credit default swaps while held for each fund (dollars in thousands):
| Options contracts purchased | Futures contracts | Forward currency contracts | Interest rate swaps | Credit default swaps | ||||||||||||||||
New World Fund | Not applicable | $ | 25,541 | $ | 4,534 | Not applicable | $ | 2,230 | ||||||||||||
International Growth and Income Fund | Not applicable | Not applicable | 785 | Not applicable | Not applicable | |||||||||||||||
Capital Income Builder | Not applicable | 77,835 | 97 | * | $ | 24,014 | 5,645 | |||||||||||||
Asset Allocation Fund | Not applicable | 1,604,889 | Not applicable | Not applicable | 184,454 | |||||||||||||||
Global Balanced Fund | Not applicable | 14,924 | 29,040 | 35,865 | 4,634 | |||||||||||||||
The Bond Fund of America | Not applicable | 3,326,801 | 90,045 | 516,484 | 199,116 | |||||||||||||||
Capital World Bond Fund | Not applicable | 297,755 | 449,743 | 384,936 | 92,966 | |||||||||||||||
American High-Income Trust | Not applicable | 9,021 | Not applicable | Not applicable | 10,272 | |||||||||||||||
American Funds Mortgage Fund | Not applicable | 31,977 | Not applicable | 4,025 | Not applicable | |||||||||||||||
U.S. Government Securities Fund | Not applicable | 2,339,082 | Not applicable | 1,287,321 | Not applicable | |||||||||||||||
Managed Risk Growth Fund | $ | 269,349 | 170,792 | Not applicable | Not applicable | Not applicable | ||||||||||||||
Managed Risk International Fund | 63,717 | 11,008 | Not applicable | Not applicable | Not applicable | |||||||||||||||
Managed Risk Washington Mutual Investors Fund | 242,721 | 39,716 | Not applicable | Not applicable | Not applicable | |||||||||||||||
Managed Risk Growth-Income Fund | 2,353,130 | 267,681 | Not applicable | Not applicable | Not applicable | |||||||||||||||
Managed Risk Asset Allocation Fund | 418,987 | 290,562 | Not applicable | Not applicable | Not applicable | |||||||||||||||
| * | No contracts were held at the end of the reporting period; amount represents the average month-end notional amount of contracts while they were held. |
| American Funds Insurance Series | 313 |
Table of Contents
The following tables identify the location and fair value amounts on each fund’s statement of assets and liabilities and/or the effect on each fund’s statement of operations resulting from each fund’s use of options, futures contracts, forward currency contracts, interest rate swaps and/or credit default swaps as of, or for the year ended, December 31, 2022 (dollars in thousands):
New World Fund
Assets | Liabilities | |||||||||||||
Contracts | Risk type | Location on statement of assets and liabilities | Value | Location on statement of assets and liabilities | Value | |||||||||
Futures | Interest | Unrealized appreciation1 | $ | 159 | Unrealized depreciation1 | $ | 66 | |||||||
Forward currency | Currency | Unrealized appreciation on open forward currency contracts | — | 2 | Unrealized depreciation on open forward currency contracts | 50 | ||||||||
Swap (centrally cleared) | Credit | Unrealized appreciation1 | 2 | Unrealized depreciation1 | — | |||||||||
|
|
|
| |||||||||||
| $ | 161 | $ | 116 | |||||||||||
|
|
|
| |||||||||||
Net realized gain (loss) | Net unrealized appreciation (depreciation) | |||||||||||||
Contracts | Risk type | Location on statement of operations | Value | Location on statement of operations | Value | |||||||||
Futures | Interest | Net realized gain on futures contracts | $ | 100 | Net unrealized appreciation on futures contracts | $ | 129 | |||||||
Forward currency | Currency | Net realized gain on forward currency contracts | 379 | Net unrealized depreciation on forward currency contracts | (30 | ) | ||||||||
Swap | Credit | Net realized loss on swap contracts | (2 | ) | Net unrealized appreciation on swap contracts | 2 | ||||||||
|
|
|
| |||||||||||
| $ | 477 | $ | 101 | |||||||||||
|
|
|
| |||||||||||
International Growth and Income Fund
Assets | Liabilities | |||||||||||||
Contracts | Risk type | Location on statement of assets and liabilities | Value | Location on statement of assets and liabilities | Value | |||||||||
Forward currency | Currency | Unrealized appreciation on open forward currency contracts | $ | 5 | Unrealized depreciation on open forward currency contracts | $ | — | |||||||
Net realized loss | Net unrealized appreciation | |||||||||||||
Contracts | Risk type | Location on statement of operations | Value | Location on statement of operations | Value | |||||||||
Forward currency | Currency | Net realized loss on forward currency contracts | $ | (54) | Net unrealized appreciation on forward currency contracts | $ | 5 | |||||||
Refer to the end of the tables for footnotes.
| 314 | American Funds Insurance Series |
Table of Contents
Capital Income Builder
Assets | Liabilities | |||||||||||||
Contracts | Risk type | Location on statement of assets and liabilities | Value | Location on statement of assets and liabilities | Value | |||||||||
Futures | Interest | Unrealized appreciation1 | $ | 60 | Unrealized depreciation1 | $ | 139 | |||||||
Swap (centrally cleared) | Interest | Unrealized appreciation1 | 1,900 | Unrealized depreciation1 | 380 | |||||||||
Swap (centrally cleared) | Credit | Unrealized appreciation1 | — | Unrealized depreciation1 | 47 | |||||||||
|
|
|
| |||||||||||
| $ | 1,960 | $ | 566 | |||||||||||
|
|
|
| |||||||||||
Net realized (loss) gain | Net unrealized (depreciation) appreciation | |||||||||||||
Contracts | Risk type | Location on statement of operations | Value | Location on statement of operations | Value | |||||||||
Futures | Interest | Net realized loss on futures contracts | $ | (7,468 | ) | Net unrealized depreciation on futures contracts | $ | (311 | ) | |||||
Forward currency | Currency | Net realized gain on forward currency contracts | 7 | Net unrealized depreciation on forward currency contracts | (2 | ) | ||||||||
Swap | Interest | Net realized gain on swap contracts | 1,864 | Net unrealized appreciation on swap contracts | 69 | |||||||||
Swap | Credit | Net realized gain on swap contracts | 45 | Net unrealized depreciation on swap contracts | (33 | ) | ||||||||
|
|
|
| |||||||||||
| $ | (5,552 | ) | $ | (277 | ) | |||||||||
|
|
|
| |||||||||||
Asset Allocation Fund
Assets | Liabilities | |||||||||||||
Contracts | Risk type | Location on statement of assets and | Value | Location on statement of assets and | Value | |||||||||
Futures | Interest | Unrealized appreciation1 | $ | 2,319 | Unrealized depreciation1 | $ | 3,485 | |||||||
Swap (centrally cleared) | Credit | Unrealized appreciation1 | — | Unrealized depreciation1 | 1,623 | |||||||||
|
|
|
| |||||||||||
| $ | 2,319 | $ | 5,108 | |||||||||||
|
|
|
| |||||||||||
Net realized gain (loss) | Net unrealized appreciation (depreciation) | |||||||||||||
Contracts | Risk type | Location on statement of operations | Value | Location on statement of operations | Value | |||||||||
Futures | Interest | Net realized gain on futures contracts | $ | 65,437 | Net unrealized appreciation on futures contracts | $ | 13,070 | |||||||
Swap | Credit | Net realized loss on swap contracts | (73 | ) | Net unrealized depreciation on swap contracts | (1,575 | ) | |||||||
|
|
|
| |||||||||||
| $ | 65,364 | $ | 11,495 | |||||||||||
|
|
|
| |||||||||||
Refer to the end of the tables for footnotes.
| American Funds Insurance Series | 315 |
Table of Contents
American Funds Global Balanced Fund
Assets | Liabilities | |||||||||||||
Contracts | Risk type | Location on statement of assets and liabilities | Value | Location on statement of assets and liabilities | Value | |||||||||
Futures | Interest | Unrealized appreciation1 | $ | 58 | Unrealized depreciation1 | $ | 431 | |||||||
Forward currency | Currency | Unrealized appreciation on open forward currency contracts | 686 | Unrealized depreciation on open forward currency contracts | 150 | |||||||||
Swap (centrally cleared) | Interest | Unrealized appreciation1 | 8 | Unrealized depreciation1 | 1,017 | |||||||||
Swap (centrally cleared) | Credit | Unrealized appreciation1 | 7 | Unrealized depreciation1 | — | |||||||||
|
|
|
| |||||||||||
| $ | 759 | $ | 1,598 | |||||||||||
|
|
|
| |||||||||||
Net realized gain (loss) | Net unrealized (depreciation) appreciation | |||||||||||||
Contracts | Risk type | Location on statement of operations | Value | Location on statement of operations | Value | |||||||||
Futures | Interest | Net realized gain on futures contracts | $ | 539 | Net unrealized depreciation on futures contracts | $ | (454 | ) | ||||||
Forward currency | Currency | Net realized loss on forward currency contracts | (1,292 | ) | Net unrealized appreciation on forward currency contracts | 725 | ||||||||
Swap | Interest | Net realized gain on swap contracts | 94 | Net unrealized depreciation on swap contracts | (772 | ) | ||||||||
Swap | Credit | Net realized gain on swap contracts | 48 | Net unrealized appreciation on swap contracts | 9 | |||||||||
|
|
|
| |||||||||||
| $ | (611 | ) | $ | (492 | ) | |||||||||
|
|
|
| |||||||||||
The Bond Fund of America
Assets | Liabilities | |||||||||||||
Contracts | Risk type | Location on statement of assets and liabilities | Value | Location on statement of assets and liabilities | Value | |||||||||
Futures | Interest | Unrealized appreciation1 | $ | 6,241 | Unrealized depreciation1 | $ | 13,194 | |||||||
Forward currency | Currency | Unrealized appreciation on open forward currency contracts | 3,821 | Unrealized depreciation on open forward currency contracts | 174 | |||||||||
Swap (centrally cleared) | Interest | Unrealized appreciation1 | 15,705 | Unrealized depreciation1 | 6,629 | |||||||||
Swap (centrally cleared) | Credit | Unrealized appreciation1 | — | Unrealized depreciation1 | 7,009 | |||||||||
|
|
|
| |||||||||||
| $ | 25,767 | $ | 27,006 | |||||||||||
|
|
|
| |||||||||||
Refer to the end of the tables for footnotes.
| 316 | American Funds Insurance Series |
Table of Contents
Net realized (loss) gain | Net unrealized (depreciation) appreciation | |||||||||||||
Contracts | Risk type | Location on statement of operations | Value | Location on statement of operations | Value | |||||||||
Futures | Interest | Net realized loss on futures contracts | $ | (136,499 | ) | Net unrealized depreciation on futures contracts | $ | (6,976 | ) | |||||
Forward currency | Currency | Net realized gain on forward currency contracts | 1,795 | Net unrealized appreciation on forward currency contracts | 4,002 | |||||||||
Swap | Interest | Net realized gain on swap contracts | 26,807 | Net unrealized appreciation on swap contracts | 20,061 | |||||||||
Swap | Credit | Net realized gain on swap contracts | 1,436 | Net unrealized depreciation on swap contracts | (7,083 | ) | ||||||||
|
|
|
| |||||||||||
| $ | (106,461 | ) | $ | 10,004 | ||||||||||
|
|
|
| |||||||||||
Capital World Bond Fund
Assets | Liabilities | |||||||||||||
Contracts | Risk type | Location on statement of assets and | Value | Location on statement of assets and | Value | |||||||||
Futures | Interest | Unrealized appreciation1 | $ | 672 | Unrealized depreciation1 | $ | 4,659 | |||||||
Forward currency | Currency | Unrealized appreciation on open forward currency contracts | 7,008 | Unrealized depreciation on open forward currency contracts | 2,455 | |||||||||
Swap (centrally cleared) | Interest | Unrealized appreciation1 | — | Unrealized depreciation1 | 10,966 | |||||||||
Swap (centrally cleared) | Credit | Unrealized appreciation1 | 486 | Unrealized depreciation1 | 19 | |||||||||
|
|
|
| |||||||||||
| $ | 8,166 | $ | 18,099 | |||||||||||
|
|
|
| |||||||||||
Net realized (loss) gain | Net unrealized (depreciation) appreciation | |||||||||||||
Contracts | Risk type | Location on statement of operations | Value | Location on statement of operations | Value | |||||||||
Futures | Interest | Net realized loss on futures contracts | $ | (7,447 | ) | Net unrealized depreciation on futures contracts | $ | (3,811 | ) | |||||
Forward currency | Currency | Net realized loss on forward currency contracts | (18,216 | ) | Net unrealized appreciation on forward currency contracts | 4,071 | ||||||||
Swap | Interest | Net realized loss on swap contracts | (2,331 | ) | Net unrealized depreciation on swap contracts | (7,110 | ) | |||||||
Swap | Credit | Net realized gain on swap contracts | 1,535 | Net unrealized appreciation on swap contracts | 549 | |||||||||
|
|
|
| |||||||||||
| $ | (26,459 | ) | $ | (6,301 | ) | |||||||||
|
|
|
| |||||||||||
American High-Income Trust
Assets | Liabilities | |||||||||||||
Contracts | Risk type | Location on statement of assets and liabilities | Value | Location on statement of assets and liabilities | Value | |||||||||
Futures | Interest | Unrealized appreciation1 | $ | 10 | Unrealized depreciation1 | $ | 98 | |||||||
Swap (centrally cleared) | Credit | Unrealized appreciation1 | — | Unrealized depreciation1 | 154 | |||||||||
|
|
|
| |||||||||||
| $ | 10 | $ | 252 | |||||||||||
|
|
|
| |||||||||||
Refer to the end of the tables for footnotes.
| American Funds Insurance Series | 317 |
Table of Contents
Net realized gain (loss) | Net unrealized appreciation (depreciation) | |||||||||||||
Contracts | Risk type | Location on statement of operations | Value | Location on statement of operations | Value | |||||||||
Futures | Interest | Net realized gain on futures contracts | $ | 1,533 | Net unrealized appreciation on futures contracts | $ | 123 | |||||||
Swap | Credit | Net realized loss on swap contracts | (82 | ) | Net unrealized depreciation on swap contracts | (161 | ) | |||||||
|
|
|
| |||||||||||
| $ | 1,451 | $ | (38 | ) | ||||||||||
|
|
|
| |||||||||||
American Funds Mortgage Fund
Assets | Liabilities | |||||||||||||
Contracts | Risk type | Location on statement of assets and | Value | Location on statement of assets and | Value | |||||||||
Futures | Interest | Unrealized appreciation1 | $ | 49 | Unrealized depreciation1 | $ | 124 | |||||||
Swap (centrally cleared) | Interest | Unrealized appreciation1 | 790 | Unrealized depreciation1 | — | |||||||||
|
|
|
| |||||||||||
| $ | 839 | $ | 124 | |||||||||||
|
|
|
| |||||||||||
Net realized (loss) gain | Net unrealized depreciation | |||||||||||||
Contracts | Risk type | Location on statement of operations | Value | Location on statement of operations | Value | |||||||||
Futures | Interest | Net realized loss on futures contracts | $ | (2,688 | ) | Net unrealized depreciation on futures contracts | $ | (79 | ) | |||||
Swap | Interest | Net realized gain on swap contracts | 3,147 | Net unrealized depreciation on swap contracts | (1,585 | ) | ||||||||
|
|
|
| |||||||||||
| $ | 459 | $ | (1,664 | ) | ||||||||||
|
|
|
| |||||||||||
U.S. Government Securities Fund
Assets | Liabilities | |||||||||||||
Contracts | Risk type | Location on statement of assets and | Value | Location on statement of assets and | Value | |||||||||
Futures | Interest | Unrealized appreciation1 | $ | 14,523 | Unrealized depreciation1 | $ | 17,699 | |||||||
Swap (centrally cleared) | Interest | Unrealized appreciation1 | 30,519 | Unrealized depreciation1 | 21,723 | |||||||||
|
|
|
| |||||||||||
| $ | 45,042 | $ | 39,422 | |||||||||||
|
|
|
| |||||||||||
Net realized (loss) gain | Net unrealized depreciation | |||||||||||||
Contracts | Risk type | Location on statement of operations | Value | Location on statement of operations | Value | |||||||||
Futures | Interest | Net realized loss on futures contracts | $ | (52,928 | ) | Net unrealized depreciation on futures contracts | $ | (3,785 | ) | |||||
Swap | Interest | Net realized gain on swap contracts | 20,919 | Net unrealized depreciation on swap contracts | (7,297 | ) | ||||||||
|
|
|
| |||||||||||
| $ | (32,009 | ) | $ | (11,082 | ) | |||||||||
|
|
|
| |||||||||||
Refer to the end of the tables for footnotes.
| 318 | American Funds Insurance Series |
Table of Contents
Managed Risk Growth Fund
Assets | Liabilities | |||||||||||||
Contracts | Risk type | Location on statement of assets and liabilities | Value | Location on statement of assets and liabilities | Value | |||||||||
Options purchased | Equity | Investment securities from unaffiliated issuers3 | $ | 205 | Investment securities from unaffiliated issuers3 | $ | — | |||||||
Futures | Currency | Unrealized appreciation1 | 47 | Unrealized depreciation1 | 61 | |||||||||
Futures | Equity | Unrealized appreciation1 | 7,547 | Unrealized depreciation1 | 1 | |||||||||
Futures | Interest | Unrealized appreciation1 | — | Unrealized depreciation1 | 47 | |||||||||
|
|
|
| |||||||||||
| $ | 7,799 | $ | 109 | |||||||||||
|
|
|
| |||||||||||
Net realized (loss) gain | Net unrealized appreciation | |||||||||||||
Contracts | Risk type | Location on statement of operations | Value | Location on statement of operations | Value | |||||||||
Options purchased | Equity | Net realized loss on investments in unaffiliated issuers | $ | (3,857 | ) | Net unrealized appreciation on investments in unaffiliated issuers | $ | 399 | ||||||
Futures | Currency | Net realized gain on futures contracts | 463 | Net unrealized appreciation on futures contracts | 52 | |||||||||
Futures | Equity | Net realized gain on futures contracts | 12,863 | Net unrealized appreciation on futures contracts | 8,762 | |||||||||
Futures | Interest | Net realized loss on futures contracts | (11,442 | ) | Net unrealized appreciation on futures contracts | 10 | ||||||||
|
|
|
| |||||||||||
| $ | (1,973 | ) | $ | 9,223 | ||||||||||
|
|
|
| |||||||||||
Managed Risk International Fund
Assets | Liabilities | |||||||||||||
Contracts | Risk type | Location on statement of assets and liabilities | Value | Location on statement of assets and liabilities | Value | |||||||||
Options purchased | Equity | Investment securities from unaffiliated issuers3 | $ | 169 | Investment securities from unaffiliated issuers3 | $ | — | |||||||
Futures | Currency | Unrealized appreciation1 | — | Unrealized depreciation1 | — | |||||||||
Futures | Equity | Unrealized appreciation1 | 1,024 | Unrealized depreciation1 | — | |||||||||
Futures | Interest | Unrealized appreciation1 | — | Unrealized depreciation1 | 13 | |||||||||
|
|
|
| |||||||||||
| $ | 1,193 | $ | 13 | |||||||||||
|
|
|
| |||||||||||
Net realized (loss) gain | Net unrealized appreciation | |||||||||||||
Contracts | Risk type | Location on statement of operations | Value | Location on statement of operations | Value | |||||||||
Options purchased | Equity | Net realized loss on investments in unaffiliated issuers | $ | (1,108 | ) | Net unrealized appreciation on investments in unaffiliated issuers | $ | 327 | ||||||
Futures | Currency | Net realized gain on futures contracts | — | Net unrealized appreciation on futures contracts | — | |||||||||
Futures | Equity | Net realized gain on futures contracts | 6,799 | Net unrealized appreciation on futures contracts | 57 | |||||||||
Futures | Interest | Net realized loss on futures contracts | (2,792 | ) | Net unrealized appreciation on futures contracts | 1,337 | ||||||||
|
|
|
| |||||||||||
| $ | 2,899 | $ | 1,721 | |||||||||||
|
|
|
| |||||||||||
Refer to the end of the tables for footnotes.
| American Funds Insurance Series | 319 |
Table of Contents
Managed Risk Washington Mutual Investors Fund
Assets | Liabilities | |||||||||||||
Contracts | Risk type | Location on statement of assets and liabilities | Value | Location on statement of assets and liabilities | Value | |||||||||
Options purchased | Equity | Investment securities from unaffiliated issuers3 | $ | 274 | Investment securities from unaffiliated issuers3 | $ | — | |||||||
Futures | Currency | Unrealized appreciation1 | 68 | Unrealized depreciation1 | 5 | |||||||||
Futures | Equity | Unrealized appreciation1 | 2,625 | Unrealized depreciation1 | 5 | |||||||||
Futures | Interest | Unrealized appreciation1 | — | Unrealized depreciation1 | 81 | |||||||||
|
|
|
| |||||||||||
| $ | 2,967 | $ | 91 | |||||||||||
|
|
|
| |||||||||||
Net realized (loss) gain | Net unrealized appreciation (depreciation) | |||||||||||||
Contracts | Risk type | Location on statement of operations | Value | Location on statement of operations | Value | |||||||||
Options purchased | Equity | Net realized loss on investments in unaffiliated issuers | $ | (3,288 | ) | Net unrealized appreciation on investments in unaffiliated issuers | $ | 51 | ||||||
Futures | Currency | Net realized gain on futures contracts | 270 | Net unrealized appreciation on futures contracts | 68 | |||||||||
Futures | Equity | Net realized gain on futures contracts | 1,194 | Net unrealized appreciation on futures contracts | 2,690 | |||||||||
Futures | Interest | Net realized loss on futures contracts | (6,007 | ) | Net unrealized depreciation on futures contracts | (53 | ) | |||||||
|
|
|
| |||||||||||
| $ | (7,831 | ) | $ | 2,756 | ||||||||||
|
|
|
| |||||||||||
Managed Risk Growth-Income Fund
Assets | Liabilities | |||||||||||||
Contracts | Risk type | Location on statement of assets and | Value | Location on statement of assets and | Value | |||||||||
Options purchased | Equity | Investment securities from unaffiliated issuers3 | $ | 2,485 | Investment securities from unaffiliated issuers3 | $ | — | |||||||
Futures | Currency | Unrealized appreciation1 | 433 | Unrealized depreciation1 | 74 | |||||||||
Futures | Equity | Unrealized appreciation1 | 16,502 | Unrealized depreciation1 | 33 | |||||||||
Futures | Interest | Unrealized appreciation1 | — | Unrealized depreciation1 | 177 | |||||||||
|
|
|
| |||||||||||
| $ | 19,420 | $ | 284 | |||||||||||
|
|
|
| |||||||||||
Net realized (loss) gain | Net unrealized appreciation (depreciation) | |||||||||||||
Contracts | Risk type | Location on statement of operations | Value | Location on statement of operations | Value | |||||||||
Options purchased | Equity | Net realized loss on investments in unaffiliated issuers | $ | (38,643 | ) | Net unrealized appreciation on investments in unaffiliated issuers | $ | 7,712 | ||||||
Futures | Currency | Net realized gain on futures contracts | 1,635 | Net unrealized appreciation on futures contracts | 368 | |||||||||
Futures | Equity | Net realized loss on futures contracts | (12,730 | ) | Net unrealized appreciation on futures contracts | 17,087 | ||||||||
Futures | Interest | Net realized loss on futures contracts | (40,727 | ) | Net unrealized depreciation on futures contracts | (116 | ) | |||||||
|
|
|
| |||||||||||
| $ | (90,465 | ) | $ | 25,051 | ||||||||||
|
|
|
| |||||||||||
Refer to the end of the tables for footnotes.
| 320 | American Funds Insurance Series |
Table of Contents
Managed Risk Asset Allocation Fund
Assets | Liabilities | |||||||||||||
Contracts | Risk type | Location on statement of assets and | Value | Location on statement of assets and | Value | |||||||||
Options purchased | Equity | Investment securities from unaffiliated issuers3 | $ | 383 | Investment securities from unaffiliated issuers3 | $ | — | |||||||
Futures | Currency | Unrealized appreciation1 | 196 | Unrealized depreciation1 | 47 | |||||||||
Futures | Equity | Unrealized appreciation1 | 13,613 | Unrealized depreciation1 | 18 | |||||||||
Futures | Interest | Unrealized appreciation1 | — | Unrealized depreciation1 | 162 | |||||||||
|
|
|
| |||||||||||
| $ | 14,192 | $ | 227 | |||||||||||
|
|
|
| |||||||||||
Net realized (loss) gain | Net unrealized appreciation (depreciation) | |||||||||||||
Contracts | Risk type | Location on statement of operations | Value | Location on statement of operations | Value | |||||||||
Options purchased | Equity | Net realized loss on investments in unaffiliated issuers | $ | (5,894 | ) | Net unrealized appreciation on investments in unaffiliated issuers | $ | 396 | ||||||
Futures | Currency | Net realized gain on futures contracts | 1,468 | Net unrealized appreciation on futures contracts | 158 | |||||||||
Futures | Equity | Net realized loss on futures contracts | (9,987 | ) | Net unrealized appreciation on futures contracts | 13,720 | ||||||||
Futures | Interest | Net realized loss on futures contracts | (39,248 | ) | Net unrealized depreciation on futures contracts | (55 | ) | |||||||
|
|
|
| |||||||||||
| $ | (53,661 | ) | $ | 14,219 | ||||||||||
|
|
|
| |||||||||||
| 1 | Includes cumulative appreciation/depreciation on futures contracts, centrally cleared interest rate swaps and/or centrally cleared credit default swaps as reported in the applicable table following each fund’s investment portfolio. Only current day’s variation margin is reported within each fund’s statement of assets and liabilities. |
| 2 | Amount less than one thousand. |
| 3 | Includes options purchased as reported in each fund’s investment portfolio. |
Collateral — Some funds either receive or pledge highly liquid assets, such as cash or U.S. government securities, as collateral due to securities lending and/or their use of futures contracts, forward currency contracts, interest rate swaps, credit default swaps and/or future delivery contracts. For securities lending, each participating fund receives collateral in exchange for lending investment securities. The lending agent may reinvest collateral from securities lending transactions according to agreed parameters. For futures contracts, centrally cleared interest rate swaps and centrally cleared credit default swaps, the program calls for each participating fund to pledge collateral for initial and variation margin by contract. For forward currency contracts, the program calls for each participating fund to either receive or pledge collateral based on the net gain or loss on unsettled contracts by counterparty. For future delivery contracts, the program calls for each participating fund to either receive or pledge collateral based on the net gain or loss on unsettled contracts by certain counterparties. The purpose of the collateral is to cover potential losses that could occur in the event that either party cannot meet its contractual obligation. Non-cash collateral pledged by each participating fund, if any, is disclosed in each fund’s investment portfolio, and cash collateral pledged by each participating fund, if any, is held in a segregated account with the fund’s custodian, which is reflected as pledged cash collateral in each fund’s statement of assets and liabilities.
Rights of offset — Funds that hold forward currency contracts have enforceable master netting agreements with certain counterparties, where amounts payable by each party to the other in the same currency (with the same settlement date and with the same counter-party) are settled net of each party’s payment obligation. If an early termination date occurs under these agreements following an event of default or termination event, all obligations of each party to its counterparty are settled net through a single payment in a single currency (“close-out netting“). For financial reporting purposes, the funds do not offset financial assets and financial liabilities that are subject to these master netting arrangements in the statements of assets and liabilities.
| American Funds Insurance Series | 321 |
Table of Contents
The following tables present each fund’s forward currency contracts by counterparty that are subject to master netting agreements but that are not offset in the funds’ statements of assets and liabilities. The net amount column shows the impact of offsetting on the funds’ statement of assets and liabilities as of December 31, 2022, if close-out netting was exercised (dollars in thousands):
New World Fund
| Gross amounts not offset in the statement of assets and liabilities and subject to a master netting agreement | ||||||||||||||||||||
Counterparty | Gross amounts recognized in the statement of assets and liabilities | Available to offset | Non-cash collateral* | Cash collateral* | Net amount | |||||||||||||||
Assets: | ||||||||||||||||||||
Barclays Bank PLC | $ | — | † | $ | — | $ | — | $ | — | $ | — | † | ||||||||
Liabilities: | ||||||||||||||||||||
Goldman Sachs | $ | 26 | $ | — | $ | — | $ | — | $ | 26 | ||||||||||
JPMorgan Chase | 24 | — | — | — | 24 | |||||||||||||||
|
|
|
|
|
|
|
|
|
| |||||||||||
Total | $ | 50 | $ | — | $ | — | $ | — | $ | 50 | ||||||||||
|
|
|
|
|
|
|
|
|
| |||||||||||
International Growth and Income Fund
| Gross amounts not offset in the statement of assets and liabilities and subject to a master netting agreement | ||||||||||||||||||||
Counterparty | Gross amounts recognized in the statement of assets and liabilities | Available to offset | Non-cash collateral* | Cash collateral* | Net amount | |||||||||||||||
Assets: | ||||||||||||||||||||
UBS AG | $ | 5 | $ | — | $ | — | $ | — | $ | 5 | ||||||||||
American Funds Global Balanced Fund
| Gross amounts not offset in the statement of assets and liabilities and subject to a master netting agreement | ||||||||||||||||||||
Counterparty | Gross amounts recognized in the statement of assets and liabilities | Available to offset | Non-cash collateral* | Cash collateral* | Net amount | |||||||||||||||
Assets: | ||||||||||||||||||||
Bank of America | $ | 76 | $ | (29 | ) | $ | — | $ | (47 | ) | $ | — | ||||||||
BNP Paribas | 66 | (47 | ) | — | — | 19 | ||||||||||||||
Citibank | 113 | (28 | ) | — | — | 85 | ||||||||||||||
Goldman Sachs | 92 | (8 | ) | — | — | 84 | ||||||||||||||
HSBC Bank | 33 | (8 | ) | — | — | 25 | ||||||||||||||
Morgan Stanley | 1 | (1 | ) | — | — | — | ||||||||||||||
Standard Chartered Bank | 272 | (1 | ) | — | — | 271 | ||||||||||||||
UBS AG | 33 | (23 | ) | — | — | 10 | ||||||||||||||
|
|
|
|
|
|
|
|
|
| |||||||||||
Total | $ | 686 | $ | (145 | ) | $ | — | $ | (47 | ) | $ | 494 | ||||||||
|
|
|
|
|
|
|
|
|
| |||||||||||
Liabilities: | ||||||||||||||||||||
Bank of America | $ | 29 | $ | (29 | ) | $ | — | $ | — | $ | — | |||||||||
Bank of New York Mellon | 2 | — | — | — | 2 | |||||||||||||||
BNP Paribas | 47 | (47 | ) | — | — | — | ||||||||||||||
Citibank | 28 | (28 | ) | — | — | — | ||||||||||||||
Goldman Sachs | 8 | (8 | ) | — | — | — | ||||||||||||||
HSBC Bank | 8 | (8 | ) | — | — | — | ||||||||||||||
JPMorgan Chase | 3 | — | — | — | 3 | |||||||||||||||
Morgan Stanley | 1 | (1 | ) | — | — | — | ||||||||||||||
Standard Chartered Bank | 1 | (1 | ) | — | — | — | ||||||||||||||
UBS AG | 23 | (23 | ) | — | — | — | ||||||||||||||
|
|
|
|
|
|
|
|
|
| |||||||||||
Total | $ | 150 | $ | (145 | ) | $ | — | $ | — | $ | 5 | |||||||||
|
|
|
|
|
|
|
|
|
| |||||||||||
Refer to the end of the tables for footnotes.
| 322 | American Funds Insurance Series |
Table of Contents
The Bond Fund of America
| Gross amounts not offset in the statement of assets and liabilities and subject to a master netting agreement | ||||||||||||||||||||
Counterparty | Gross amounts recognized in the statement of assets and liabilities | Available to offset | Non-cash collateral* | Cash collateral* | Net amount | |||||||||||||||
Assets: | ||||||||||||||||||||
Citibank | $ | 63 | $ | (59 | ) | $ | — | $ | — | $ | 4 | |||||||||
HSBC Bank | 106 | (4 | ) | — | — | 102 | ||||||||||||||
Morgan Stanley | 3,652 | (16 | ) | — | (2,380 | ) | 1,256 | |||||||||||||
|
|
|
|
|
|
|
|
|
| |||||||||||
Total | $ | 3,821 | $ | (79 | ) | $ | — | $ | (2,380 | ) | $ | 1,362 | ||||||||
|
|
|
|
|
|
|
|
|
| |||||||||||
Liabilities: | ||||||||||||||||||||
Citibank | $ | 59 | $ | (59 | ) | $ | — | $ | — | $ | — | |||||||||
HSBC Bank | 4 | (4 | ) | — | — | — | ||||||||||||||
JPMorgan Chase | 95 | — | — | — | 95 | |||||||||||||||
Morgan Stanley | 16 | (16 | ) | — | — | — | ||||||||||||||
|
|
|
|
|
|
|
|
|
| |||||||||||
Total | $ | 174 | $ | (79 | ) | $ | — | $ | — | $ | 95 | |||||||||
|
|
|
|
|
|
|
|
|
| |||||||||||
Capital World Bond Fund
| Gross amounts not offset in the statement of assets and liabilities and subject to a master netting agreement | ||||||||||||||||||||
Counterparty | Gross amounts recognized in the statement of assets and liabilities | Available to offset | Non-cash collateral* | Cash collateral* | Net amount | |||||||||||||||
Assets: | ||||||||||||||||||||
Bank of America | $ | 1,728 | $ | (1,013 | ) | $ | (59 | ) | $ | — | $ | 656 | ||||||||
BNP Paribas | 433 | (433 | ) | — | — | — | ||||||||||||||
Citibank | 105 | — | �� | — | — | 105 | ||||||||||||||
Goldman Sachs | 128 | (92 | ) | — | — | 36 | ||||||||||||||
HSBC Bank | 215 | (123 | ) | — | (92 | ) | — | |||||||||||||
JPMorgan Chase | 89 | — | — | — | 89 | |||||||||||||||
Morgan Stanley | 76 | (76 | ) | — | — | — | ||||||||||||||
Standard Chartered Bank | 3,616 | (8 | ) | — | (2,190 | ) | 1,418 | |||||||||||||
UBS AG | 618 | (478 | ) | — | — | 140 | ||||||||||||||
|
|
|
|
|
|
|
|
|
| |||||||||||
Total | $ | 7,008 | $ | (2,223 | ) | $ | (59 | ) | $ | (2,282 | ) | $ | 2,444 | |||||||
|
|
|
|
|
|
|
|
|
| |||||||||||
Liabilities: | ||||||||||||||||||||
Bank of America | $ | 1,013 | $ | (1,013 | ) | $ | — | $ | — | $ | — | |||||||||
BNP Paribas | 473 | (433 | ) | (40 | ) | — | — | |||||||||||||
Goldman Sachs | 92 | (92 | ) | — | — | — | ||||||||||||||
HSBC Bank | 123 | (123 | ) | — | — | — | ||||||||||||||
Morgan Stanley | 268 | (76 | ) | — | — | 192 | ||||||||||||||
Standard Chartered Bank | 8 | (8 | ) | — | — | — | ||||||||||||||
UBS AG | 478 | (478 | ) | — | — | — | ||||||||||||||
|
|
|
|
|
|
|
|
|
| |||||||||||
Total | $ | 2,455 | $ | (2,223 | ) | $ | (40 | ) | $ | — | $ | 192 | ||||||||
|
|
|
|
|
|
|
|
|
| |||||||||||
| * | Collateral is shown on a settlement basis. |
| † | Amount less than one thousand. |
6. Taxation and distributions
Federal income taxation — Each fund complies with the requirements under Subchapter M of the Internal Revenue Code applicable to regulated investment companies and intends to distribute substantially all of its net taxable income and net capital gains each year. The funds are not subject to income taxes to the extent such distributions are made. Therefore, no federal income tax provision is required.
As of and during the year ended December 31, 2022, none of the funds had a liability for any unrecognized tax benefits. Each fund recognizes interest and penalties, if any, related to unrecognized tax benefits as income tax expense in their respective statements of operations. During the year, none of the funds incurred any significant interest or penalties.
| American Funds Insurance Series | 323 |
Table of Contents
Each fund’s tax returns are generally not subject to examination by federal, state and, if applicable, non-U.S. tax authorities after the expiration of each jurisdiction’s statute of limitations, which is typically three years after the date of filing but can be extended in certain jurisdictions.
Non-U.S. taxation — Dividend and interest income, if any, are recorded net of non-U.S. taxes paid. The funds may file withholding tax reclaims in certain jurisdictions to recover a portion of amounts previously withheld. As a result of rulings from European courts, the funds filed for additional reclaims related to prior years. These reclaims are recorded when the amount is known and there are no significant uncertainties on collectability. During the year ended December 31, 2022, some of the funds recognized reclaims (net of fees and the effect of realized gain or loss from currency translations) and interest related to European court rulings as follows (dollars in thousands):
Fund | Reclaims | Fees | Interest | |||||||||
Global Growth Fund | $ | 782 | $ | 700 | $ | 71 | ||||||
Global Small Capitalization Fund | 264 | 1 | 3 | |||||||||
Growth Fund | 818 | 41 | 22 | |||||||||
International Fund | 5,544 | 1,191 | 920 | |||||||||
New World Fund | 358 | 110 | 14 | |||||||||
Growth-Income Fund | 3,119 | 674 | 292 | |||||||||
International Growth and Income Fund | 995 | 133 | 35 | |||||||||
Capital Income Builder | 103 | — | — | |||||||||
Asset Allocation Fund | 23 | 115 | 9 | |||||||||
The reclaims and interest are included in each fund’s statements of operations. Gains realized by the funds on the sale of securities in certain countries, if any, may be subject to non-U.S. taxes. If applicable, the funds record an estimated deferred tax liability based on unrealized gains to provide for potential non-U.S. taxes payable upon the sale of these securities.
Distributions — Distributions determined on a tax basis may differ from net investment income and net realized gains for financial reporting purposes. These differences are due primarily to different treatment for items such as currency gains and losses; short-term capital gains and losses; capital losses related to sales of certain securities within 30 days of purchase; unrealized appreciation of certain investments in securities outside the U.S.; deferred expenses; cost of investments sold; paydowns on fixed-income securities; net capital losses; net operating losses; non-U.S. taxes on capital gains; amortization of premiums and discounts and income on certain investments. The fiscal year in which amounts are distributed may differ from the year in which the net investment income and net realized gains are recorded by the funds for financial reporting purposes. The funds may also designate a portion of the amount paid to redeeming shareholders as a distribution for tax purposes.
Additional tax basis disclosures for each fund as of December 31, 2022, were as follows (dollars in thousands):
| Global Growth Fund | Global Small Capitalization Fund | Growth Fund | International Fund | New World Fund | Washington Mutual Investors Fund | |||||||||||||||||||
Undistributed ordinary income | $ | 18,515 | $ | 1,947 | $ | 58,974 | $ | 15,623 | $ | 8,333 | $ | 45,061 | ||||||||||||
Undistributed long-term capital gains | 549,285 | 39,017 | 1,978,732 | — | — | 89,689 | ||||||||||||||||||
Capital loss carryforward* | — | — | — | (374,845 | ) | — | — | |||||||||||||||||
|
|
|
|
|
|
|
|
|
|
|
| |||||||||||||
Gross unrealized appreciation on investments | 2,375,954 | 670,857 | 11,042,046 | 1,336,912 | 734,224 | 2,118,125 | ||||||||||||||||||
Gross unrealized depreciation on investments | (532,719 | ) | (341,080 | ) | (2,302,474 | ) | (696,377 | ) | (227,842 | ) | (434,198 | ) | ||||||||||||
Net unrealized appreciation (depreciation) on investments | 1,843,235 | 329,777 | 8,739,572 | 640,535 | 506,382 | 1,683,927 | ||||||||||||||||||
|
|
|
|
|
|
|
|
|
|
|
| |||||||||||||
Cost of investments | 5,104,805 | 2,679,736 | 22,239,209 | 6,111,539 | 2,581,084 | 7,749,839 | ||||||||||||||||||
|
|
|
|
|
|
|
|
|
|
|
| |||||||||||||
Reclassification from (to) total distributable earnings/accumulated loss to (from) capital paid in on shares of beneficial interest | (2 | ) | 1 | (1 | ) | — | 2,307 | — | ||||||||||||||||
|
|
|
|
|
|
|
|
|
|
|
| |||||||||||||
Refer to the end of the tables for footnote.
| 324 | American Funds Insurance Series |
Table of Contents
| Capital World Growth and Income Fund | Growth- Income Fund | International Growth and Income Fund | Capital Income Builder | Asset Allocation Fund | American Funds Global Balanced Fund | |||||||||||||||||||
Undistributed ordinary income | $ | 6,716 | $ | 117,578 | $ | 1,209 | $ | 10,957 | $ | 120,979 | $ | 2,667 | ||||||||||||
Undistributed long-term capital gains | — | 1,825,597 | — | — | 958,605 | 44,806 | ||||||||||||||||||
Capital loss carryforward* | (72,176 | ) | — | (23,828 | ) | (28,240 | ) | — | — | |||||||||||||||
|
|
|
|
|
|
|
|
|
|
|
| |||||||||||||
Gross unrealized appreciation on investments | 404,604 | 11,485,057 | 40,113 | 172,719 | 5,621,631 | 32,081 | ||||||||||||||||||
Gross unrealized depreciation on investments | (145,788 | ) | (1,261,066 | ) | (38,777 | ) | (48,638 | ) | (1,495,405 | ) | (28,506 | ) | ||||||||||||
Net unrealized appreciation (depreciation) on investments | 258,816 | 10,223,991 | 1,336 | 124,081 | 4,126,226 | 3,575 | ||||||||||||||||||
|
|
|
|
|
|
|
|
|
|
|
| |||||||||||||
Cost of investments | 1,470,280 | 23,017,328 | 298,123 | 1,050,210 | 21,189,651 | 360,934 | ||||||||||||||||||
|
|
|
|
|
|
|
|
|
|
|
| |||||||||||||
Reclassification from (to) total distributable earnings/accumulated loss to (from) capital paid in on shares of beneficial interest | — | 1 | (2 | ) | 1 | — | (5 | ) | ||||||||||||||||
|
|
|
|
|
|
|
|
|
|
|
| |||||||||||||
| The Bond Fund of America | Capital World Bond Fund | American High-Income Trust | American Funds Mortgage Fund | Ultra-Short Bond Fund | U.S. Government Securities Fund | |||||||||||||||||||
Undistributed ordinary income | $ | 58,751 | $ | — | $ | 9,376 | $ | 529 | $ | 2,708 | $ | 8,185 | ||||||||||||
Capital loss carryforward* | (907,300 | ) | (133,685 | ) | (298,537 | ) | (9,549 | ) | (1 | ) | (177,836 | ) | ||||||||||||
|
|
|
|
|
|
|
|
|
|
|
| |||||||||||||
Gross unrealized appreciation on investments | 59,386 | 15,710 | 31,393 | 1,496 | 27 | 52,241 | ||||||||||||||||||
Gross unrealized depreciation on investments | (845,293 | ) | (205,368 | ) | (114,413 | ) | (3,313 | ) | (84 | ) | (124,942 | ) | ||||||||||||
Net unrealized appreciation (depreciation) on investments | (785,907 | ) | (189,658 | ) | (83,020 | ) | (1,817 | ) | (57 | ) | (72,701 | ) | ||||||||||||
|
|
|
|
|
|
|
|
|
|
|
| |||||||||||||
Cost of investments | 11,952,694 | 1,666,306 | 899,803 | 109,898 | 423,636 | 1,796,326 | ||||||||||||||||||
|
|
|
|
|
|
|
|
|
|
|
| |||||||||||||
Reclassification from (to) total distributable earnings/accumulated loss to (from) capital paid in on shares of beneficial interest | — | (18,935 | ) | — | — | — | — | |||||||||||||||||
|
|
|
|
|
|
|
|
|
|
|
| |||||||||||||
| Managed Risk Growth Fund | Managed Risk International Fund | Managed Risk Washington Mutual Investors Fund | Managed Risk Growth- Income Fund | Managed Risk Asset Allocation Fund | ||||||||||||||||
Undistributed ordinary income | $ | 5,720 | $ | 1,966 | $ | 5,613 | $ | 29,224 | $ | 35,270 | ||||||||||
Undistributed long-term capital gains | 105,958 | 8,883 | 41,991 | 263,419 | 248,376 | |||||||||||||||
Capital loss carryforward utilized | — | 12,234 | 23,718 | — | — | |||||||||||||||
|
|
|
|
|
|
|
|
|
| |||||||||||
Gross unrealized appreciation on investments | 1,057 | 229 | 981 | 10,979 | 1,506 | |||||||||||||||
Gross unrealized depreciation on investments | (130,250 | ) | (34,019 | ) | (46,563 | ) | (168,097 | ) | (129,608 | ) | ||||||||||
Net unrealized appreciation (depreciation) on investments | (129,193 | ) | (33,790 | ) | (45,582 | ) | (157,118 | ) | (128,102 | ) | ||||||||||
|
|
|
|
|
|
|
|
|
| |||||||||||
Cost of investments | 569,814 | 156,568 | 362,881 | 2,216,048 | 2,296,114 | |||||||||||||||
|
|
|
|
|
|
|
|
|
| |||||||||||
| * | Each fund’s capital loss carryforward will be used to offset any capital gains realized by the fund in future years. Funds with a capital loss carryforward will not make distributions from capital gains while a capital loss carryforward remains. |
| American Funds Insurance Series | 325 |
Table of Contents
Distributions paid by each fund were characterized for tax purposes as follows (dollars in thousands):
Global Growth Fund
| Year ended December 31, 2022 | Year ended December 31, 2021 | |||||||||||||||||||||||
Share class | Ordinary income | Long-term capital gains | Total distributions paid | Ordinary income | Long-term capital gains | Total distributions paid | ||||||||||||||||||
Class 1 | $ | 39,498 | $ | 361,119 | $ | 400,617 | $ | 23,870 | $ | 193,074 | $ | 216,944 | ||||||||||||
Class 1A | 141 | 1,617 | 1,758 | 55 | 645 | 700 | ||||||||||||||||||
Class 2 | 32,689 | 386,947 | 419,636 | 15,210 | 221,402 | 236,612 | ||||||||||||||||||
Class 4 | 4,312 | 66,240 | 70,552 | 1,339 | 30,748 | 32,087 | ||||||||||||||||||
|
|
|
|
|
|
|
|
|
|
|
| |||||||||||||
Total | $ | 76,640 | $ | 815,923 | $ | 892,563 | $ | 40,474 | $ | 445,869 | $ | 486,343 | ||||||||||||
|
|
|
|
|
|
|
|
|
|
|
| |||||||||||||
Global Small Capitalization Fund
| Year ended December 31, 2022 | Year ended December 31, 2021 | |||||||||||||||||||||||
Share class | Ordinary income | Long-term capital gains | Total distributions paid | Ordinary income | Long-term capital gains | Total distributions paid | ||||||||||||||||||
Class 1 | $ | 47,544 | $ | 285,173 | $ | 332,717 | $ | — | $ | 55,655 | $ | 55,655 | ||||||||||||
Class 1A | 209 | 1,252 | 1,461 | — | 39 | 39 | ||||||||||||||||||
Class 2 | 94,748 | 568,298 | 663,046 | — | 60,246 | 60,246 | ||||||||||||||||||
Class 4 | 13,417 | 80,475 | 93,892 | — | 7,215 | 7,215 | ||||||||||||||||||
|
|
|
|
|
|
|
|
|
|
|
| |||||||||||||
Total | $ | 155,918 | $ | 935,198 | $ | 1,091,116 | $ | — | $ | 123,155 | $ | 123,155 | ||||||||||||
|
|
|
|
|
|
|
|
|
|
|
| |||||||||||||
Growth Fund
| Year ended December 31, 2022 | Year ended December 31, 2021 | |||||||||||||||||||||||
Share class | Ordinary income | Long-term capital gains | Total distributions paid | Ordinary income | Long-term capital gains | Total distributions paid | ||||||||||||||||||
Class 1 | $ | 319,915 | $ | 1,912,725 | $ | 2,232,640 | $ | 181,380 | $ | 2,073,422 | $ | 2,254,802 | ||||||||||||
Class 1A | 3,677 | 23,411 | 27,088 | 701 | 9,031 | 9,732 | ||||||||||||||||||
Class 2 | 311,929 | 2,152,577 | 2,464,506 | 167,439 | 2,610,409 | 2,777,848 | ||||||||||||||||||
Class 3 | 4,207 | 28,163 | 32,370 | 2,435 | 35,107 | 37,542 | ||||||||||||||||||
Class 4 | 43,665 | 340,245 | 383,910 | 17,483 | 340,551 | 358,034 | ||||||||||||||||||
|
|
|
|
|
|
|
|
|
|
|
| |||||||||||||
Total | $ | 683,393 | $ | 4,457,121 | $ | 5,140,514 | $ | 369,438 | $ | 5,068,520 | $ | 5,437,958 | ||||||||||||
|
|
|
|
|
|
|
|
|
|
|
| |||||||||||||
International Fund
| Year ended December 31, 2022 | Year ended December 31, 2021 | |||||||||||||||||||||||
Share class | Ordinary income | Long-term capital gains | Total distributions paid | Ordinary income | Long-term capital gains | Total distributions paid | ||||||||||||||||||
Class 1 | $ | 94,903 | $ | 448,918 | $ | 543,821 | $ | 131,730 | $ | — | $ | 131,730 | ||||||||||||
Class 1A | 281 | 1,398 | 1,679 | 281 | — | 281 | ||||||||||||||||||
Class 2 | 86,539 | 450,228 | 536,767 | 105,815 | — | 105,815 | ||||||||||||||||||
Class 3 | 431 | 2,195 | 2,626 | 545 | — | 545 | ||||||||||||||||||
Class 4 | 9,244 | 52,350 | 61,594 | 10,725 | — | 10,725 | ||||||||||||||||||
|
|
|
|
|
|
|
|
|
|
|
| |||||||||||||
Total | $ | 191,398 | $ | 955,089 | $ | 1,146,487 | $ | 249,096 | $ | — | $ | 249,096 | ||||||||||||
|
|
|
|
|
|
|
|
|
|
|
| |||||||||||||
326 American Funds Insurance Series
Table of Contents
New World Fund
| Year ended December 31, 2022 | Year ended December 31, 2021 | |||||||||||||||||||||||
Share class | Ordinary income | Long-term capital gains | Total distributions paid | Ordinary income | Long-term capital gains | Total distributions paid | ||||||||||||||||||
Class 1 | $ | 60,201 | $ | 129,123 | $ | 189,324 | $ | 26,785 | $ | 78,257 | $ | 105,042 | ||||||||||||
Class 1A | 317 | 724 | 1,041 | 77 | 273 | 350 | ||||||||||||||||||
Class 2 | 26,575 | 61,661 | 88,236 | 9,450 | 36,498 | 45,948 | ||||||||||||||||||
Class 4 | 22,718 | 56,063 | 78,781 | 5,794 | 28,566 | 34,360 | ||||||||||||||||||
|
|
|
|
|
|
|
|
|
|
|
| |||||||||||||
Total | $ | 109,811 | $ | 247,571 | $ | 357,382 | $ | 42,106 | $ | 143,594 | $ | 185,700 | ||||||||||||
|
|
|
|
|
|
|
|
|
|
|
| |||||||||||||
Washington Mutual Investors Fund
| Year ended December 31, 2022 | Year ended December 31, 2021 | |||||||||||||||||||||||
Share class | Ordinary income | Long-term capital gains | Total distributions paid | Ordinary income | Long-term capital gains | Total distributions paid | ||||||||||||||||||
Class 1 | $ | 351,097 | $ | 1,068,126 | $ | 1,419,223 | $ | 104,666 | $ | — | $ | 104,666 | ||||||||||||
Class 1A | 3,359 | 10,665 | 14,024 | 2,211 | — | 2,211 | ||||||||||||||||||
Class 2 | 173,751 | 551,636 | 725,387 | 46,652 | — | 46,652 | ||||||||||||||||||
Class 4 | 61,406 | 196,768 | 258,174 | 12,620 | — | 12,620 | ||||||||||||||||||
|
|
|
|
|
|
|
|
|
|
|
| |||||||||||||
Total | $ | 589,613 | $ | 1,827,195 | $ | 2,416,808 | $ | 166,149 | $ | — | $ | 166,149 | ||||||||||||
|
|
|
|
|
|
|
|
|
|
|
| |||||||||||||
Capital World Growth and Income Fund
| Year ended December 31, 2022 | Year ended December 31, 2021 | |||||||||||||||||||||||
Share class | Ordinary income | Long-term capital gains | Total distributions paid | Ordinary income | Long-term capital gains | Total distributions paid | ||||||||||||||||||
Class 1 | $ | 32,166 | $ | 109,599 | $ | 141,765 | $ | 14,543 | $ | 16,997 | $ | 31,540 | ||||||||||||
Class 1A | 337 | 1,188 | 1,525 | 99 | 67 | 166 | ||||||||||||||||||
Class 2 | 57,060 | 205,827 | 262,887 | 20,948 | 29,988 | 50,936 | ||||||||||||||||||
Class 4 | 10,246 | 37,875 | 48,121 | 3,094 | 4,436 | 7,530 | ||||||||||||||||||
|
|
|
|
|
|
|
|
|
|
|
| |||||||||||||
Total | $ | 99,809 | $ | 354,489 | $ | 454,298 | $ | 38,684 | $ | 51,488 | $ | 90,172 | ||||||||||||
|
|
|
|
|
|
|
|
|
|
|
| |||||||||||||
Growth-Income Fund
| Year ended December 31, 2022 | Year ended December 31, 2021 | |||||||||||||||||||||||
Share class | Ordinary income | Long-term capital gains | Total distributions paid | Ordinary income | Long-term capital gains | Total distributions paid | ||||||||||||||||||
Class 1 | $ | 597,601 | $ | 1,754,172 | $ | 2,351,773 | $ | 328,564 | $ | 239,575 | $ | 568,139 | ||||||||||||
Class 1A | 784 | 2,464 | 3,248 | 308 | 185 | 493 | ||||||||||||||||||
Class 2 | 328,556 | 1,071,265 | 1,399,821 | 164,258 | 145,765 | 310,023 | ||||||||||||||||||
Class 3 | 3,597 | 11,428 | 15,025 | 1,864 | 1,578 | 3,442 | ||||||||||||||||||
Class 4 | 41,526 | 145,017 | 186,543 | 16,599 | 16,418 | 33,017 | ||||||||||||||||||
|
|
|
|
|
|
|
|
|
|
|
| |||||||||||||
Total | $ | 972,064 | $ | 2,984,346 | $ | 3,956,410 | $ | 511,593 | $ | 403,521 | $ | 915,114 | ||||||||||||
|
|
|
|
|
|
|
|
|
|
|
| |||||||||||||
International Growth and Income Fund
| Year ended December 31, 2022 | Year ended December 31, 2021 | |||||||||||||||||||||||
Share class | Ordinary income | Long-term capital gains | Total distributions paid | Ordinary income | Long-term capital gains | Total distributions paid | ||||||||||||||||||
Class 1 | $ | 397 | $ | 6,104 | $ | 6,501 | $ | 4,585 | $ | — | $ | 4,585 | ||||||||||||
Class 1A | 147 | 2,108 | 2,255 | 140 | — | 140 | ||||||||||||||||||
Class 2 | 4,951 | 81,276 | 86,227 | 6,218 | — | 6,218 | ||||||||||||||||||
Class 4 | 3,387 | 55,677 | 59,064 | 3,589 | — | 3,589 | ||||||||||||||||||
|
|
|
|
|
|
|
|
|
|
|
| |||||||||||||
Total | $ | 8,882 | $ | 145,165 | $ | 154,047 | $ | 14,532 | $ | — | $ | 14,532 | ||||||||||||
|
|
|
|
|
|
|
|
|
|
|
| |||||||||||||
American Funds Insurance Series 327
Table of Contents
Capital Income Builder
| Year ended December 31, 2022 | Year ended December 31, 2021 | |||||||||||||||||||||||
Share class | Ordinary income | Long-term capital gains | Total distributions paid | Ordinary income | Long-term capital gains | Total distributions paid | ||||||||||||||||||
Class 1 | $ | 17,636 | $ | — | $ | 17,636 | $ | 16,222 | $ | — | $ | 16,222 | ||||||||||||
Class 1A | 270 | — | 270 | 218 | — | 218 | ||||||||||||||||||
Class 2 | 354 | — | 354 | 315 | — | 315 | ||||||||||||||||||
Class 4 | 13,728 | — | 13,728 | 13,009 | — | 13,009 | ||||||||||||||||||
|
|
|
|
|
|
|
|
|
|
|
| |||||||||||||
Total | $ | 31,988 | $ | — | $ | 31,988 | $ | 29,764 | $ | — | $ | 29,764 | ||||||||||||
|
|
|
|
|
|
|
|
|
|
|
| |||||||||||||
Asset Allocation Fund
| Year ended December 31, 2022 | Year ended December 31, 2021 | |||||||||||||||||||||||
Share class | Ordinary income | Long-term capital gains | Total distributions paid | Ordinary income | Long-term capital gains | Total distributions paid | ||||||||||||||||||
Class 1 | $ | 476,426 | $ | 1,525,081 | $ | 2,001,507 | $ | 424,814 | $ | 579,353 | $ | 1,004,167 | ||||||||||||
Class 1A | 708 | 2,098 | 2,806 | 423 | 457 | 880 | ||||||||||||||||||
Class 2 | 124,332 | 440,697 | 565,029 | 108,045 | 154,751 | 262,796 | ||||||||||||||||||
Class 3 | 845 | 2,914 | 3,759 | 717 | 976 | 1,693 | ||||||||||||||||||
Class 4 | 142,374 | 538,249 | 680,623 | 107,752 | 164,028 | 271,780 | ||||||||||||||||||
|
|
|
|
|
|
|
|
|
|
|
| |||||||||||||
Total | $ | 744,685 | $ | 2,509,039 | $ | 3,253,724 | $ | 641,751 | $ | 899,565 | $ | 1,541,316 | ||||||||||||
|
|
|
|
|
|
|
|
|
|
|
| |||||||||||||
American Funds Global Balanced Fund
| Year ended December 31, 2022 | Year ended December 31, 2021 | |||||||||||||||||||||||
Share class | Ordinary income | Long-term capital gains | Total distributions paid | Ordinary income | Long-term capital gains | Total distributions paid | ||||||||||||||||||
Class 1 | $ | 72 | $ | 498 | $ | 570 | $ | 1,680 | $ | 6,058 | $ | 7,738 | ||||||||||||
Class 1A | 2 | 13 | 15 | 45 | 189 | 234 | ||||||||||||||||||
Class 2 | 123 | 850 | 973 | 2,431 | 10,638 | 13,069 | ||||||||||||||||||
Class 4 | 85 | 589 | 674 | 1,305 | 6,901 | 8,206 | ||||||||||||||||||
|
|
|
|
|
|
|
|
|
|
|
| |||||||||||||
Total | $ | 282 | $ | 1,950 | $ | 2,232 | $ | 5,461 | $ | 23,786 | $ | 29,247 | ||||||||||||
|
|
|
|
|
|
|
|
|
|
|
| |||||||||||||
The Bond Fund of America
| Year ended December 31, 2022 | Year ended December 31, 2021 | |||||||||||||||||||||||
Share class | Ordinary income | Long-term capital gains | Total distributions paid | Ordinary income | Long-term capital gains | Total distributions paid | ||||||||||||||||||
Class 1 | $ | 235,158 | $ | 60,668 | $ | 295,826 | $ | 301,454 | $ | 133,858 | $ | 435,312 | ||||||||||||
Class 1A | 7,470 | 1,700 | 9,170 | 408 | 193 | 601 | ||||||||||||||||||
Class 2 | 98,333 | 27,763 | 126,096 | 138,464 | 69,578 | 208,042 | ||||||||||||||||||
Class 4 | 24,749 | 7,113 | 31,862 | 28,710 | 14,777 | 43,487 | ||||||||||||||||||
|
|
|
|
|
|
|
|
|
|
|
| |||||||||||||
Total | $ | 365,710 | $ | 97,244 | $ | 462,954 | $ | 469,036 | $ | 218,406 | $ | 687,442 | ||||||||||||
|
|
|
|
|
|
|
|
|
|
|
| |||||||||||||
Capital World Bond Fund
| Year ended December 31, 2022 | Year ended December 31, 2021 | |||||||||||||||||||||||
Share class | Ordinary income | Long-term capital gains | Total distributions paid | Ordinary income | Long-term capital gains | Total distributions paid | ||||||||||||||||||
Class 1 | $ | 2,151 | $ | 11,752 | $ | 13,903 | $ | 34,401 | $ | 10,279 | $ | 44,680 | ||||||||||||
Class 1A | 3 | 20 | 23 | 34 | 7 | 41 | ||||||||||||||||||
Class 2 | 2,087 | 13,752 | 15,839 | 33,715 | 10,855 | 44,570 | ||||||||||||||||||
Class 4 | 120 | 945 | 1,065 | 1,845 | 612 | 2,457 | ||||||||||||||||||
|
|
|
|
|
|
|
|
|
|
|
| |||||||||||||
Total | $ | 4,361 | $ | 26,469 | $ | 30,830 | $ | 69,995 | $ | 21,753 | $ | 91,748 | ||||||||||||
|
|
|
|
|
|
|
|
|
|
|
| |||||||||||||
328 American Funds Insurance Series
Table of Contents
American High-Income Trust
| Year ended December 31, 2022 | Year ended December 31, 2021 | |||||||||||||||||||||||
Share class | Ordinary income | Long-term capital gains | Total distributions paid | Ordinary income | Long-term capital gains | Total distributions paid | ||||||||||||||||||
Class 1 | $ | 18,444 | $ | — | $ | 18,444 | $ | 11,054 | $ | — | $ | 11,054 | ||||||||||||
Class 1A | 100 | — | 100 | 59 | — | 59 | ||||||||||||||||||
Class 2 | 42,707 | — | 42,707 | 28,636 | — | 28,636 | ||||||||||||||||||
Class 3 | 694 | — | 694 | 429 | — | 429 | ||||||||||||||||||
Class 4 | 5,827 | — | 5,827 | 3,238 | — | 3,238 | ||||||||||||||||||
|
|
|
|
|
|
|
|
|
|
|
| |||||||||||||
Total | $ | 67,772 | $ | — | $ | 67,772 | $ | 43,416 | $ | — | $ | 43,416 | ||||||||||||
|
|
|
|
|
|
|
|
|
|
|
| |||||||||||||
American Funds Mortgage Fund
| Year ended December 31, 2022 | Year ended December 31, 2021 | |||||||||||||||||||||||
Share class | Ordinary income | Long-term capital gains | Total distributions paid | Ordinary income | Long-term capital gains | Total distributions paid | ||||||||||||||||||
Class 1 | $ | 15 | $ | — | $ | 15 | $ | 6,294 | $ | 3,087 | $ | 9,381 | ||||||||||||
Class 1A | 37 | — | 37 | 39 | 18 | 57 | ||||||||||||||||||
Class 2 | 995 | — | 995 | 1,448 | 784 | 2,232 | ||||||||||||||||||
Class 4 | 746 | — | 746 | 936 | 551 | 1,487 | ||||||||||||||||||
|
|
|
|
|
|
|
|
|
|
|
| |||||||||||||
Total | $ | 1,793 | $ | — | $ | 1,793 | $ | 8,717 | $ | 4,440 | $ | 13,157 | ||||||||||||
|
|
|
|
|
|
|
|
|
|
|
| |||||||||||||
Ultra-Short Bond Fund
| Year ended December 31, 2022 | Year ended December 31, 2021 | |||||||||||||||||||||||
Share class | Ordinary income | Long-term capital gains | Total distributions paid | Ordinary income | Long-term capital gains | Total distributions paid | ||||||||||||||||||
Class 1 | $ | 348 | $ | — | $ | 348 | $ | — | $ | — | $ | — | ||||||||||||
Class 1A | — | † | — | — | † | — | — | — | ||||||||||||||||
Class 2 | 1,570 | — | 1,570 | — | — | — | ||||||||||||||||||
Class 3 | 26 | — | 26 | — | — | — | ||||||||||||||||||
Class 4 | 293 | — | 293 | — | — | — | ||||||||||||||||||
|
|
|
|
|
|
|
|
|
|
|
| |||||||||||||
Total | $ | 2,237 | $ | — | $ | 2,237 | $ | — | $ | — | $ | — | ||||||||||||
|
|
|
|
|
|
|
|
|
|
|
| |||||||||||||
U.S. Government Securities Fund
| Year ended December 31, 2022 | Year ended December 31, 2021 | |||||||||||||||||||||||
Share class | Ordinary income | Long-term capital gains | Total distributions paid | Ordinary income | Long-term capital gains | Total distributions paid | ||||||||||||||||||
Class 1 | $ | 10,360 | $ | — | $ | 10,360 | $ | 30,987 | $ | 9,355 | $ | 40,342 | ||||||||||||
Class 1A | 153 | — | 153 | 389 | 129 | 518 | ||||||||||||||||||
Class 2 | 42,631 | — | 42,631 | 108,143 | 36,124 | 144,267 | ||||||||||||||||||
Class 3 | 292 | — | 292 | 714 | 234 | 948 | ||||||||||||||||||
Class 4 | 7,040 | — | 7,040 | 17,596 | 6,057 | 23,653 | ||||||||||||||||||
|
|
|
|
|
|
|
|
|
|
|
| |||||||||||||
Total | $ | 60,476 | $ | — | $ | 60,476 | $ | 157,829 | $ | 51,899 | $ | 209,728 | ||||||||||||
|
|
|
|
|
|
|
|
|
|
|
| |||||||||||||
Refer to the end of the tables for footnote.
American Funds Insurance Series 329
Table of Contents
Managed Risk Growth Fund
| Year ended December 31, 2022 | Year ended December 31, 2021 | |||||||||||||||||||||||
Share class | Ordinary income | Long-term capital gains | Total distributions paid | Ordinary income | Long-term capital gains | Total distributions paid | ||||||||||||||||||
Class P1 | $ | 162 | $ | 1,634 | $ | 1,796 | $ | 106 | $ | 409 | $ | 515 | ||||||||||||
Class P2 | 6,629 | 81,821 | 88,450 | 3,159 | 23,710 | 26,869 | ||||||||||||||||||
|
|
|
|
|
|
|
|
|
|
|
| |||||||||||||
Total | $ | 6,791 | $ | 83,455 | $ | 90,246 | $ | 3,265 | $ | 24,119 | $ | 27,384 | ||||||||||||
|
|
|
|
|
|
|
|
|
|
|
| |||||||||||||
Managed Risk International Fund
| Year ended December 31, 2022 | Year ended December 31, 2021 | |||||||||||||||||||||||
Share class | Ordinary income | Long-term capital gains | Total distributions paid | Ordinary income | Long-term capital gains | Total distributions paid | ||||||||||||||||||
Class P1 | $ | 69 | $ | — | $ | 69 | $ | 14 | $ | — | $ | 14 | ||||||||||||
Class P2 | 4,206 | — | 4,206 | 917 | — | 917 | ||||||||||||||||||
|
|
|
|
|
|
|
|
|
|
|
| |||||||||||||
Total | $ | 4,275 | $ | — | $ | 4,275 | $ | 931 | $ | — | $ | 931 | ||||||||||||
|
|
|
|
|
|
|
|
|
|
|
| |||||||||||||
Managed Risk Washington Mutual Investors Fund
| Year ended December 31, 2022 | Year ended December 31, 2021 | |||||||||||||||||||||||
Share class | Ordinary income | Long-term capital gains | Total distributions paid | Ordinary income | Long-term capital gains | Total distributions paid | ||||||||||||||||||
Class P1 | $ | 127 | $ | — | $ | 127 | $ | 40 | $ | — | $ | 40 | ||||||||||||
Class P2 | 14,544 | — | 14,544 | 5,979 | — | 5,979 | ||||||||||||||||||
|
|
|
|
|
|
|
|
|
|
|
| |||||||||||||
Total | $ | 14,671 | $ | — | $ | 14,671 | $ | 6,019 | $ | — | $ | 6,019 | ||||||||||||
|
|
|
|
|
|
|
|
|
|
|
| |||||||||||||
Managed Risk Growth-Income Fund
| Year ended December 31, 2022 | Year ended December 31, 2021 | |||||||||||||||||||||||
Share class | Ordinary income | Long-term capital gains | Total distributions paid | Ordinary income | Long-term capital gains | Total distributions paid | ||||||||||||||||||
Class P1 | $ | 43,232 | $ | 44,484 | $ | 87,716 | $ | 30,716 | $ | 29,380 | $ | 60,096 | ||||||||||||
Class P2 | 5,626 | 6,461 | 12,087 | 3,713 | 4,359 | 8,072 | ||||||||||||||||||
|
|
|
|
|
|
|
|
|
|
|
| |||||||||||||
Total | $ | 48,858 | $ | 50,945 | $ | 99,803 | $ | 34,429 | $ | 33,739 | $ | 68,168 | ||||||||||||
|
|
|
|
|
|
|
|
|
|
|
| |||||||||||||
Managed Risk Asset Allocation Fund
| Year ended December 31, 2022 | Year ended December 31, 2021 | |||||||||||||||||||||||
Share class | Ordinary income | Long-term capital gains | Total distributions paid | Ordinary income | Long-term capital gains | Total distributions paid | ||||||||||||||||||
Class P1 | $ | 176 | $ | 254 | $ | 430 | $ | 114 | $ | — | $ | 114 | ||||||||||||
Class P2 | 51,616 | 86,918 | 138,534 | 38,113 | — | 38,113 | ||||||||||||||||||
|
|
|
|
|
|
|
|
|
|
|
| |||||||||||||
Total | $ | 51,792 | $ | 87,172 | $ | 138,964 | $ | 38,227 | $ | — | $ | 38,227 | ||||||||||||
|
|
|
|
|
|
|
|
|
|
|
| |||||||||||||
| † | Amount less than one thousand. |
7. Fees and transactions
CRMC, the series’ investment adviser, is the parent company of American Funds Distributors®, Inc. (“AFD”), the distributor of the series’ shares, and American Funds Service Company® (“AFS”), the series’ transfer agent. CRMC, AFD and AFS are considered related parties to the series.
330 American Funds Insurance Series
Table of Contents
Investment advisory services — The series has an investment advisory and service agreement with CRMC that provides for monthly fees accrued daily. These fees are based on annual rates that generally decrease as net asset levels increase. CRMC receives investment advisory fees from the underlying funds held by the managed risk funds, which are included in the unaudited net effective expense ratios that are provided as additional information in the financial highlights tables. Subadvisory fees for the managed risk funds are paid by CRMC to Milliman FRM. The managed risk funds are not responsible for paying any subadvisory fees.
The series’ board of trustees approved a revised investment advisory and services agreement effective May 1, 2022. The revised agreement provides investment advisory services fees based on revised annual rates and net asset levels for some of the funds. The following table discloses the annual rates and net asset levels before and after the revised contract became effective:
| Prior to May 1, 2022 | Effective May 1, 2022 | |||||||||||||||||||||||||||||||
| Rates | Net asset levels (in billions) | Rates | Net asset levels (in billions) | |||||||||||||||||||||||||||||
Fund | Beginning with | Ending with | Up to | In excess of | Beginning with | Ending with | Up to | In excess of | ||||||||||||||||||||||||
Global Growth Fund | .690 | % | .445 | % | $ | .6 | $ | 8.0 | .475 | % | .435 | % | $ | 15.0 | $ | 15.0 | ||||||||||||||||
Global Small Capitalization Fund | .800 | .635 | .6 | 5.0 | .647 | .615 | 15.0 | 15.0 | ||||||||||||||||||||||||
Growth Fund | .500 | .280 | .6 | 34.0 | .500 | .275 | .6 | 44.0 | ||||||||||||||||||||||||
International Fund | .690 | .430 | .5 | 21.0 | .478 | .430 | 15.0 | 21.0 | ||||||||||||||||||||||||
New World Fund | .850 | .580 | .5 | 4.0 | .577 | .510 | 15.0 | 15.0 | ||||||||||||||||||||||||
Washington Mutual Investors Fund | .500 | .350 | .6 | 10.5 | .374 | .350 | 15.0 | 15.0 | ||||||||||||||||||||||||
Capital World Growth and Income Fund | .690 | .480 | .6 | 3.0 | .475 | .435 | 15.0 | 15.0 | ||||||||||||||||||||||||
Growth-Income Fund | .500 | .219 | .6 | 34.0 | .500 | .217 | .6 | 44.0 | ||||||||||||||||||||||||
International Growth and Income Fund | .690 | .500 | .5 | 1.5 | .478 | .450 | 15.0 | 15.0 | ||||||||||||||||||||||||
Capital Income Builder | .500 | .410 | .6 | 1.0 | .357 | .330 | 15.0 | 15.0 | ||||||||||||||||||||||||
Asset Allocation Fund | .500 | .240 | .6 | 21.0 | .500 | .236 | .6 | 34.0 | ||||||||||||||||||||||||
American Funds Global Balanced Fund | .660 | .510 | .5 | 1.0 | .446 | .420 | 15.0 | 15.0 | ||||||||||||||||||||||||
The Bond Fund of America | .480 | .320 | .6 | 13.0 | .352 | .320 | 15.0 | 15.0 | ||||||||||||||||||||||||
Capital World Bond Fund | .570 | .450 | 1.0 | 3.0 | .431 | .360 | 15.0 | 15.0 | ||||||||||||||||||||||||
American High-Income Trust | .500 | .420 | .6 | 2.0 | .404 | .386 | 15.0 | 15.0 | ||||||||||||||||||||||||
American Funds Mortgage Fund | .420 | .290 | .6 | 3.0 | .295 | .280 | 15.0 | 15.0 | ||||||||||||||||||||||||
Ultra-Short Bond Fund | .320 | .270 | 1.0 | 2.0 | .257 | .242 | 15.0 | 15.0 | ||||||||||||||||||||||||
U.S. Government Securities Fund | .420 | .290 | .6 | 3.0 | .295 | .280 | 15.0 | 15.0 | ||||||||||||||||||||||||
Investment advisory services waivers — CRMC is waiving a portion of its investment advisory services fees for some of the funds. During the year ended December 31, 2022, CRMC waived $1,000 in fees for Growth Fund in advance of the revised investment advisory and service agreement effective May 1, 2022. CRMC also waived a portion of its investment advisory services fees for the following funds based on the rates listed:
Fund | Waiver rates prior to May 1, 2022 | Waiver rates effective May 1, 2022 | ||||||
Global Growth Fund | Not applicable | .11 | % | |||||
Global Small Capitalization Fund | Not applicable | .05 | ||||||
New World Fund | .18 | % | .07 | |||||
Washington Mutual Investors Fund | .16 | .11 | ||||||
Capital World Growth and Income Fund | .23 | .14 | ||||||
International Growth and Income Fund | .14 | .01 | ||||||
Capital Income Builder | .25 | .14 | ||||||
American Funds Global Balanced Fund | Not applicable | .01 | ||||||
The Bond Fund of America | .19 | .19 | ||||||
Capital World Bond Fund | .10 | .10 | ||||||
American High-Income Trust | .19 | .14 | ||||||
American Funds Mortgage Fund | .21 | .12 | ||||||
U.S. Government Securities Fund | .16 | .12 | ||||||
Managed Risk Growth Fund | .05 | .05 | ||||||
Managed Risk International Fund | .05 | .05 | ||||||
Managed Risk Washington Mutual Investors Fund | .05 | .05 | ||||||
Managed Risk Growth-Income Fund | .05 | .05 | ||||||
Managed Risk Asset Allocation Fund | .05 | .05 | ||||||
American Funds Insurance Series 331
Table of Contents
The waiver rates for each fund, except Growth Fund, will be in effect through at least May 1, 2023, and may only be modified or terminated with the approval of the series’ board. For the year ended December 31, 2022, total investment advisory services fees waived by CRMC were $58,051,000. CRMC does not intend to recoup these waivers. Investment advisory fees in each fund’s statement of operations are presented gross of any waivers from CRMC.
The range of rates, net asset levels and the current annualized rates of average daily net assets for each fund before and after any investment advisory services waivers, if applicable, are as follows:
| Rates | Net asset level (in billions) | For the year ended December 31, 2022, | For the year ended 2022, | |||||||||||||||||||||
Fund | Beginning with | Ending with | Up to | In excess of | before waiver | after waiver | ||||||||||||||||||
Global Growth Fund | .475 | % | .435 | % | $ | 15.0 | $ | 15.0 | .485 | % | .415 | % | ||||||||||||
Global Small Capitalization Fund | .647 | .615 | 15.0 | 15.0 | .668 | .637 | ||||||||||||||||||
Growth Fund | .500 | .275 | .6 | 44.0 | .313 | .313 | ||||||||||||||||||
International Fund | .478 | .430 | 15.0 | 21.0 | .485 | .485 | ||||||||||||||||||
New World Fund | .577 | .510 | 15.0 | 15.0 | .619 | .509 | ||||||||||||||||||
Washington Mutual Investors Fund | .374 | .350 | 15.0 | 15.0 | .378 | .230 | ||||||||||||||||||
Capital World Growth and Income Fund | .475 | .435 | 15.0 | 15.0 | .518 | .364 | ||||||||||||||||||
Growth-Income Fund | .500 | .217 | .6 | 44.0 | .254 | .254 | ||||||||||||||||||
International Growth and Income Fund | .478 | .450 | 15.0 | 15.0 | .555 | .460 | ||||||||||||||||||
Capital Income Builder | .357 | .330 | 15.0 | 15.0 | .395 | .218 | ||||||||||||||||||
Asset Allocation Fund | .500 | .236 | .6 | 34.0 | .265 | .265 | ||||||||||||||||||
American Funds Global Balanced Fund | .446 | .420 | 15.0 | 15.0 | .523 | .517 | ||||||||||||||||||
The Bond Fund of America | .352 | .320 | 15.0 | 15.0 | .354 | .164 | ||||||||||||||||||
Capital World Bond Fund | .431 | .360 | 15.0 | 15.0 | .471 | .433 | ||||||||||||||||||
American High-Income Trust | .404 | .386 | 15.0 | 15.0 | .433 | .275 | ||||||||||||||||||
American Funds Mortgage Fund | .295 | .280 | 15.0 | 15.0 | .346 | .189 | ||||||||||||||||||
Ultra-Short Bond Fund | .257 | .242 | 15.0 | 15.0 | .275 | .275 | ||||||||||||||||||
U.S. Government Securities Fund | .295 | .280 | 15.0 | 15.0 | .319 | .184 | ||||||||||||||||||
Managed Risk Growth Fund | .150 | all | .150 | .100 | ||||||||||||||||||||
Managed Risk International Fund | .150 | all | .150 | .100 | ||||||||||||||||||||
Managed Risk Washington Mutual Investors Fund | .150 | all | .150 | .100 | ||||||||||||||||||||
Managed Risk Growth-Income Fund | .150 | all | .150 | .100 | ||||||||||||||||||||
Managed Risk Asset Allocation Fund | .150 | all | .150 | .100 | ||||||||||||||||||||
Class-specific fees and expenses — Expenses that are specific to individual share classes are accrued directly to the respective share class. The principal class-specific fees and expenses are further described below:
Distribution services — The series has plans of distribution for all share classes except Class 1. Under the plans, the board of trustees approves certain categories of expenses that are used to finance activities primarily intended to sell fund shares. The plans provide for payments to pay service fees to firms that have entered into agreements with the series. These payments, based on an annualized percentage of average daily net assets, range from 0.18% to 0.50% as noted in the table below. In some cases, the board of trustees has limited the amounts that may be paid to less than the maximum allowed by the plans.
Share class | Currently approved limits | Plan limits | ||||||
Class 1A | 0.00 | % | 0.25 | % | ||||
Class 2 | 0.25 | 0.25 | ||||||
Class 3 | 0.18 | 0.18 | ||||||
Class 4 | 0.25 | 0.25 | ||||||
Class P1 | 0.00 | 0.25 | ||||||
Class P2 | 0.25 | 0.50 | ||||||
332 American Funds Insurance Series
Table of Contents
Insurance administrative services — The series has an insurance administrative services plan for Class 1A, 4, P1 and P2 shares. Under the plan, these share classes pay 0.25% of each insurance company’s respective average daily net assets in each share class to compensate the insurance companies for services provided to their separate accounts and contractholders for which the shares of the fund are beneficially owned as underlying investments of such contractholders’ annuities. These services include, but are not limited to, maintenance, shareholder communications and transactional services. The insurance companies are not related parties to the series.
Transfer agent services — The series has a shareholder services agreement with AFS under which the funds compensate AFS for providing transfer agent services to all of the funds’ share classes. These services include recordkeeping, shareholder communications and transaction processing. In addition, the managed risk funds reimburse AFS for amounts paid to third parties for performing transfer agent services on behalf of fund shareholders.
Administrative services — The series has an administrative services agreement with CRMC under which each fund compensates CRMC for providing administrative services to all of the funds’ share classes except Class P1 and P2 shares. Administrative services are provided by CRMC and its affiliates to help assist third parties providing non-distribution services to fund shareholders. These services include providing in-depth information on each fund and market developments that impact fund investments.
Administrative services also include, but are not limited to, coordinating, monitoring and overseeing third parties that provide services to fund shareholders. The agreement provides each fund, other than the managed risk funds, the ability to charge an administrative services fee at the annual rate of 0.05% of average daily net assets attributable to each share class. Currently each fund, other than the managed-risk funds, pays CRMC an administrative services fee at the annual rate of 0.03% of average daily net assets of each share class for CRMC’s provision of administrative services. For the managed risk funds, CRMC receives administrative services fees at an annual rate of 0.03% of average daily net assets from Class 1 shares of the underlying funds for administrative services provided to the series.
Accounting and administrative services — The managed risk funds have a subadministration agreement with Bank of New York Mellon (“BNY Mellon“) under which the fund compensates BNY Mellon for providing accounting and administrative services to each of the managed risk funds’ share classes. These services include, but are not limited to, fund accounting (including calculation of net asset value), financial reporting and tax services. BNY Mellon is not a related party to the managed risk funds.
Class-specific expenses under the agreements described above were as follows (dollars in thousands):
Global Growth Fund
Share class | Distribution services | Insurance administrative services | Administrative services | |||||||||
Class 1 | Not applicable | Not applicable | $ | 1,002 | ||||||||
Class 1A | $ | — | $ | 37 | 4 | |||||||
Class 2 | 8,754 | Not applicable | 1,050 | |||||||||
Class 4 | 1,500 | 1,500 | 180 | |||||||||
|
|
|
|
|
| |||||||
Total class-specific expenses | $ | 10,254 | $ | 1,537 | $ | 2,236 | ||||||
|
|
|
|
|
| |||||||
Global Small Capitalization Fund
Share class | Distribution services | Insurance administrative services | Administrative services | |||||||||
Class 1 | Not applicable | Not applicable | $ | 308 | ||||||||
Class 1A | $ | — | $ | 11 | 1 | |||||||
Class 2 | 4,837 | Not applicable | 581 | |||||||||
Class 4 | 688 | 688 | 83 | |||||||||
|
|
|
|
|
| |||||||
Total class-specific expenses | $ | 5,525 | $ | 699 | $ | 973 | ||||||
|
|
|
|
|
| |||||||
Growth Fund
Share class | Distribution services | Insurance administrative services | Administrative services | |||||||||
Class 1 | Not applicable | Not applicable | $ | 4,542 | ||||||||
Class 1A | $ | — | $ | 407 | 49 | |||||||
Class 2 | 41,888 | Not applicable | 5,026 | |||||||||
Class 3 | 403 | Not applicable | 67 | |||||||||
Class 4 | 6,532 | 6,532 | 784 | |||||||||
|
|
|
|
|
| |||||||
Total class-specific expenses | $ | 48,823 | $ | 6,939 | $ | 10,468 | ||||||
|
|
|
|
|
| |||||||
International Fund
Share class | Distribution services | Insurance administrative services | Administrative services | |||||||||
Class 1 | Not applicable | Not applicable | $ | 1,036 | ||||||||
Class 1A | $ | — | $ | 26 | 3 | |||||||
Class 2 | 8,573 | Not applicable | 1,029 | |||||||||
Class 3 | 30 | Not applicable | 5 | |||||||||
Class 4 | 982 | 982 | 118 | |||||||||
|
|
|
|
|
| |||||||
Total class-specific expenses | $ | 9,585 | $ | 1,008 | $ | 2,191 | ||||||
|
|
|
|
|
| |||||||
American Funds Insurance Series 333
Table of Contents
New World Fund
Share class | Distribution services | Insurance administrative services | Administrative services | |||||||||
Class 1 | Not applicable | Not applicable | $ | 535 | ||||||||
Class 1A | $ | — | $ | 25 | 3 | |||||||
Class 2 | 2,101 | Not applicable | 252 | |||||||||
Class 4 | 1,898 | 1,898 | 228 | |||||||||
|
|
|
|
|
| |||||||
Total class-specific expenses | $ | 3,999 | $ | 1,923 | $ | 1,018 | ||||||
|
|
|
|
|
| |||||||
Washington Mutual Investors Fund
Share class | Distribution services | Insurance administrative services | Administrative services | |||||||||
Class 1 | Not applicable | Not applicable | $ | 1,738 | ||||||||
Class 1A | $ | — | $ | 243 | 29 | |||||||
Class 2 | 7,376 | Not applicable | 885 | |||||||||
Class 4 | 2,639 | 2,639 | 317 | |||||||||
|
|
|
|
|
| |||||||
Total class-specific expenses | $ | 10,015 | $ | 2,882 | $ | 2,969 | ||||||
|
|
|
|
|
| |||||||
Capital World Growth and Income Fund
Share class | Distribution services | Insurance administrative services | Administrative services | |||||||||
Class 1 | Not applicable | Not applicable | $ | 175 | ||||||||
Class 1A | $ | — | $ | 15 | 2 | |||||||
Class 2 | 2,689 | Not applicable | 323 | |||||||||
Class 4 | 483 | 484 | 58 | |||||||||
|
|
|
|
|
| |||||||
Total class-specific expenses | $ | 3,172 | $ | 499 | $ | 558 | ||||||
|
|
|
|
|
| |||||||
Growth-Income Fund
Share class | Distribution services | Insurance administrative services | Administrative services | |||||||||
Class 1 | Not applicable | Not applicable | $ | 6,289 | ||||||||
Class 1A | $ | — | $ | 73 | 9 | |||||||
Class 2 | 31,403 | Not applicable | 3,768 | |||||||||
Class 3 | 245 | Not applicable | 41 | |||||||||
Class 4 | 4,213 | 4,213 | 505 | |||||||||
|
|
|
|
|
| |||||||
Total class-specific expenses | $ | 35,861 | $ | 4,286 | $ | 10,612 | ||||||
|
|
|
|
|
| |||||||
International Growth and Income Fund
Share class | Distribution services | Insurance administrative services | Administrative services | |||||||||
Class 1 | Not applicable | Not applicable | $ | 4 | ||||||||
Class 1A | $ | — | $ | 12 | 2 | |||||||
Class 2 | 432 | Not applicable | 52 | |||||||||
Class 4 | 294 | 294 | 35 | |||||||||
|
|
|
|
|
| |||||||
Total class-specific expenses | $ | 726 | $ | 306 | $ | 93 | ||||||
|
|
|
|
|
| |||||||
Capital Income Builder
Share class | Distribution services | �� | Insurance administrative services | Administrative services | ||||||||
Class 1 | Not applicable | Not applicable | $ | 170 | ||||||||
Class 1A | $ | — | $ | 24 | 3 | |||||||
Class 2 | 31 | Not applicable | 4 | |||||||||
Class 4 | 1,337 | 1,338 | 160 | |||||||||
|
|
|
|
|
| |||||||
Total class-specific expenses | $ | 1,368 | $ | 1,362 | $ | 337 | ||||||
|
|
|
|
|
| |||||||
Asset Allocation Fund
Share class | Distribution services | Insurance administrative services | Administrative services | |||||||||
Class 1 | Not applicable | Not applicable | $ | 4,850 | ||||||||
Class 1A | $ | — | $ | 62 | 8 | |||||||
Class 2 | 11,503 | Not applicable | 1,380 | |||||||||
Class 3 | 55 | Not applicable | 9 | |||||||||
Class 4 | 14,002 | 14,002 | 1,680 | |||||||||
|
|
|
|
|
| |||||||
Total class-specific expenses | $ | 25,560 | $ | 14,064 | $ | 7,927 | ||||||
|
|
|
|
|
| |||||||
American Funds Global Balanced Fund
Share class | Distribution services | Insurance administrative services | Administrative services | |||||||||
Class 1 | Not applicable | Not applicable | $ | 31 | ||||||||
Class 1A | $ | — | $ | 7 | 1 | |||||||
Class 2 | 428 | Not applicable | 51 | |||||||||
Class 4 | 293 | 293 | 35 | |||||||||
|
|
|
|
|
| |||||||
Total class-specific expenses | $ | 721 | $ | 300 | $ | 118 | ||||||
|
|
|
|
|
| |||||||
The Bond Fund of America
Share class | Distribution services | Insurance administrative services | Administrative services | |||||||||
Class 1 | Not applicable | Not applicable | $ | 2,100 | ||||||||
Class 1A | $ | — | $ | 354 | 43 | |||||||
Class 2 | 7,903 | Not applicable | 948 | |||||||||
Class 4 | 2,027 | 2,027 | 243 | |||||||||
|
|
|
|
|
| |||||||
Total class-specific expenses | $ | 9,930 | $ | 2,381 | $ | 3,334 | ||||||
|
|
|
|
|
| |||||||
Refer to the end of the tables for footnote.
Capital World Bond Fund
Share class | Distribution services | Insurance administrative services | Administrative services | |||||||||
Class 1 | Not applicable | Not applicable | $ | 222 | ||||||||
Class 1A | $ | — | $ | 4 | — | * | ||||||
Class 2 | 2,109 | Not applicable | 253 | |||||||||
Class 4 | 142 | 142 | 17 | |||||||||
|
|
|
|
|
| |||||||
Total class-specific expenses | $ | 2,251 | $ | 146 | $ | 492 | ||||||
|
|
|
|
|
| |||||||
334 American Funds Insurance Series
Table of Contents
American High-Income Trust
Share class | Distribution services | Insurance administrative services | Administrative services | |||||||||
Class 1 | Not applicable | Not applicable | $ | 71 | ||||||||
Class 1A | $ | — | $ | 3 | — | * | ||||||
Class 2 | 1,440 | Not applicable | 173 | |||||||||
Class 3 | 16 | Not applicable | 3 | |||||||||
Class 4 | 200 | 200 | 24 | |||||||||
|
|
|
|
|
| |||||||
Total class-specific expenses | $ | 1,656 | $ | 203 | $ | 271 | ||||||
|
|
|
|
|
| |||||||
American Funds Mortgage Fund
Share class | Distribution services | Insurance administrative services | Administrative services | |||||||||
Class 1 | Not applicable | Not applicable | $ | 3 | ||||||||
Class 1A | $ | — | $ | 4 | 1 | |||||||
Class 2 | 127 | Not applicable | 15 | |||||||||
Class 4 | 101 | 101 | 12 | |||||||||
|
|
|
|
|
| |||||||
Total class-specific expenses | $ | 228 | $ | 105 | $ | 31 | ||||||
|
|
|
|
|
| |||||||
Ultra-Short Bond Fund
Share class | Distribution services | Insurance administrative services | Administrative services | |||||||||
Class 1 | Not applicable | Not applicable | $ | 14 | ||||||||
Class 1A | $ | — | $ | — | — | * | ||||||
Class 2 | 707 | Not applicable | 85 | |||||||||
Class 3 | 9 | Not applicable | 1 | |||||||||
Class 4 | 173 | 173 | 21 | |||||||||
|
|
|
|
|
| |||||||
Total class-specific expenses | $ | 889 | $ | 173 | $ | 121 | ||||||
|
|
|
|
|
| |||||||
U.S. Government Securities Fund
Share class | Distribution services | Insurance administrative services | Administrative services | |||||||||
Class 1 | Not applicable | Not applicable | $ | 81 | ||||||||
Class 1A | $ | — | $ | 10 | 1 | |||||||
Class 2 | 2,967 | Not applicable | 356 | |||||||||
Class 3 | 15 | Not applicable | 3 | |||||||||
Class 4 | 512 | 512 | 62 | |||||||||
|
|
|
|
|
| |||||||
Total class-specific expenses | $ | 3,494 | $ | 522 | $ | 503 | ||||||
|
|
|
|
|
| |||||||
Managed Risk Growth Fund
Share class | Distribution services | Insurance administrative services | ||||||
Class P1 | Not applicable | $ | 25 | |||||
Class P2 | $ | 1,219 | 1,219 | |||||
|
|
|
| |||||
Total class-specific expenses | $ | 1,219 | $ | 1,244 | ||||
|
|
|
| |||||
Managed Risk International Fund
Share class | Distribution services | Insurance administrative services | ||||||
Class P1 | Not applicable | $ | 4 | |||||
Class P2 | $ | 342 | 342 | |||||
|
|
|
| |||||
Total class-specific expenses | $ | 342 | $ | 346 | ||||
|
|
|
| |||||
Managed Risk Washington Mutual Investors Fund
Share class | Distribution services | Insurance administrative services | ||||||
Class P1 | Not applicable | $ | 6 | |||||
Class P2 | $ | 824 | 824 | |||||
|
|
|
| |||||
Total class-specific expenses | $ | 824 | $ | 830 | ||||
|
|
|
| |||||
Managed Risk Growth-Income Fund
Share class | Distribution services | Insurance administrative services | ||||||
Class P1 | Not applicable | $ | 4,945 | |||||
Class P2 | $ | 720 | 720 | |||||
|
|
|
| |||||
Total class-specific expenses | $ | 720 | $ | 5,665 | ||||
|
|
|
| |||||
Managed Risk Asset Allocation Fund
Share class | Distribution services | Insurance administrative services | ||||||
Class P1 | Not applicable | $ | 18 | |||||
Class P2 | $ | 5,935 | 5,935 | |||||
|
|
|
| |||||
Total class-specific expenses | $ | 5,935 | $ | 5,953 | ||||
|
|
|
| |||||
| * | Amount less than one thousand. |
American Funds Insurance Series 335
Table of Contents
Miscellaneous fee reimbursements — CRMC reimbursed a portion of miscellaneous fees and expenses for Managed Risk International Fund. These reimbursements may be adjusted or discontinued by CRMC, subject to any restrictions in the series’ prospectus. For the year ended December 31, 2022, total fees and expenses reimbursed by CRMC were $32,000. CRMC does not intend to recoup these reimbursements. Fees and expenses in each fund’s statement of operations are presented gross of any reimbursements from CRMC.
Trustees’ deferred compensation — Trustees who are unaffiliated with CRMC may elect to defer the cash payment of part or all of their compensation. These deferred amounts, which remain as liabilities of the funds, are treated as if invested in one or more of the American Funds. These amounts represent general, unsecured liabilities of the funds and vary according to the total returns of the selected funds. Trustees’ compensation, shown on the accompanying financial statements, reflects current fees (either paid in cash or deferred) and a net decrease in the value of the deferred amounts as follows (dollars in thousands):
Fund | Current fees | Decrease in value of deferred amounts | Total trustees’ compensation | |||||||||
Global Growth Fund | $ | 21 | $ | (11 | ) | $ | 10 | |||||
Global Small Capitalization Fund | 10 | (5 | ) | 5 | ||||||||
Growth Fund | 99 | (54 | ) | 45 | ||||||||
International Fund | 21 | (11 | ) | 10 | ||||||||
New World Fund | 10 | (5 | ) | 5 | ||||||||
Washington Mutual Investors Fund | 27 | (16 | ) | 11 | ||||||||
Capital World Growth and Income Fund | 5 | (3 | ) | 2 | ||||||||
Growth-Income Fund | 98 | (56 | ) | 42 | ||||||||
International Growth and Income Fund | 1 | — | * | 1 | ||||||||
Capital Income Builder | 3 | (2 | ) | 1 | ||||||||
Asset Allocation Fund | 73 | (43 | ) | 30 | ||||||||
American Funds Global Balanced Fund | 1 | (1 | ) | — | * | |||||||
The Bond Fund of America | 31 | (19 | ) | 12 | ||||||||
Capital World Bond Fund | 5 | (3 | ) | 2 | ||||||||
American High-Income Trust | 3 | (1 | ) | 2 | ||||||||
American Funds Mortgage Fund | — | * | — | * | — | * | ||||||
Ultra-Short Bond Fund | 1 | (1 | ) | — | * | |||||||
U.S. Government Securities Fund | 5 | (3 | ) | 2 | ||||||||
Managed Risk Growth Fund | 2 | (1 | ) | 1 | ||||||||
Managed Risk International Fund | — | * | — | * | — | * | ||||||
Managed Risk Washington Mutual Investors Fund | 1 | (1 | ) | — | * | |||||||
Managed Risk Growth-Income Fund | 6 | (4 | ) | 2 | ||||||||
Managed Risk Asset Allocation Fund | 7 | (4 | ) | 3 | ||||||||
| * | Amount less than one thousand. |
Affiliated officers and trustees — Officers and certain trustees of the series are or may be considered to be affiliated with CRMC, AFD and AFS. No affiliated officers or trustees received any compensation directly from any fund in the series.
Investments in CCBF and CCF — Some of the funds hold shares of CCBF, a corporate bond fund, and/or CCF, an institutional prime money market fund ,which are both managed by CRMC. CCBF seeks to provide maximum total return consistent with capital preservation and prudent risk management by investing primarily in corporate debt instruments. CCBF is used as an investment vehicle for some of the funds’ corporate bond investments. CCF invests in high-quality, short-term money market instruments. CCF is used as the primary investment vehicle for some of the funds’ short-term investments. Both CCBF and CCF shares are only available for purchase by CRMC, its affiliates, and other funds managed by CRMC or its affiliates, and are not available to the public. CRMC does not receive an investment advisory services fee from either CCBF or CCF.
Security transactions with related funds — The funds may purchase from, or sell securities to, other CRMC-managed funds (or funds managed by certain affiliates of CRMC) under procedures adopted by the fund’s board of trustees. The funds involved in such transactions are considered related by virtue of having a common investment adviser (or affiliated investment advisers), common trustees and/or common officers. When such transactions occur, each transaction is executed at the current market price of the security and no brokerage commissions or fees are paid in accordance with Rule 17a-7 of the 1940 Act.
336 American Funds Insurance Series
Table of Contents
The following table presents purchase and sale transactions between each fund and related funds, and net realized loss or gain from such sales, if any, as of December 31, 2022 (dollars in thousands):
Fund | Purchases | Sales | Net realized (loss) gain | |||||||||
Global Growth Fund | $ | 49,680 | $ | 71,818 | $ | (20,300 | ) | |||||
Global Small Capitalization Fund | 57,920 | 34,601 | 1,035 | |||||||||
Growth Fund | 261,401 | 361,390 | 36,542 | |||||||||
International Fund | 104,003 | 132,023 | (15,330 | ) | ||||||||
New World Fund | 32,986 | 51,119 | 1,384 | |||||||||
Washington Mutual Investors Fund | 78,899 | 86,050 | (13,933 | ) | ||||||||
Capital World Growth and Income Fund | 29,485 | 42,194 | (1,316 | ) | ||||||||
Growth-Income Fund | 260,856 | 367,634 | 60,804 | |||||||||
International Growth and Income Fund | 3,035 | 3,711 | (301 | ) | ||||||||
Capital Income Builder | 11,219 | 9,127 | 1,159 | |||||||||
Asset Allocation Fund | 217,739 | 147,808 | (22,154 | ) | ||||||||
American Funds Global Balanced Fund | 2,864 | 3,686 | (19 | ) | ||||||||
The Bond Fund of America | 1,289 | 6,983 | (541 | ) | ||||||||
Capital World Bond Fund | 58 | 14,120 | (947 | ) | ||||||||
American High-Income Trust | 57 | 29,194 | (1,415 | ) | ||||||||
8. Indemnifications
The series’ organizational documents provide board members and officers with indemnification against certain liabilities or expenses in connection with the performance of their duties to the series. In the normal course of business, the series may also enter into contracts that provide general indemnifications. Each fund’s maximum exposure under these arrangements is unknown since it is dependent on future claims that may be made against the series. The risk of material loss from such claims is considered remote. Insurance policies are also available to the series’ board members and officers.
9. Committed line of credit
Global Small Capitalization Fund, New World Fund and American High-Income Trust participate with other funds managed by CRMC in a $1.5 billion credit facility (the “line of credit”) to be utilized for temporary purposes to fund shareholder redemptions. Each fund has agreed to pay commitment fees on its pro-rata portion of the line of credit, which are reflected in other expenses in each fund’s statement of operations. None of the funds borrowed on this line of credit at any time during the year ended December 31, 2022.
American Funds Insurance Series 337
Table of Contents
10. Capital share transactions
Capital share transactions in each fund were as follows (dollars and shares in thousands):
Global Growth Fund
| Sales* | Reinvestments of distributions | Repurchases* | Net increase (decrease) | |||||||||||||||||||||||||||||
Share class | Amount | Shares | Amount | Shares | Amount | Shares | Amount | Shares | ||||||||||||||||||||||||
Year ended December 31, 2022 | ||||||||||||||||||||||||||||||||
Class 1 | $ | 434,070 | 13,042 | $ | 400,617 | 12,733 | $ | (553,744 | ) | (16,845 | ) | $ | 280,943 | 8,930 | ||||||||||||||||||
Class 1A | 2,997 | 91 | 1,758 | 56 | (2,085 | ) | (65 | ) | 2,670 | 82 | ||||||||||||||||||||||
Class 2 | 92,048 | 2,700 | 419,636 | 13,511 | (295,933 | ) | (9,100 | ) | 215,751 | 7,111 | ||||||||||||||||||||||
Class 4 | 99,092 | 2,978 | 70,552 | 2,294 | (71,372 | ) | (2,195 | ) | 98,272 | 3,077 | ||||||||||||||||||||||
|
|
|
|
|
|
|
|
|
|
|
|
|
|
|
| |||||||||||||||||
Total net increase (decrease) | $ | 628,207 | 18,811 | $ | 892,563 | 28,594 | $ | (923,134 | ) | (28,205 | ) | $ | 597,636 | 19,200 | ||||||||||||||||||
|
|
|
|
|
|
|
|
|
|
|
|
|
|
|
| |||||||||||||||||
Year ended December 31, 2021 | ||||||||||||||||||||||||||||||||
Class 1 | $ | 683,154 | 15,421 | $ | 216,944 | 5,062 | $ | (307,264 | ) | (6,960 | ) | $ | 592,834 | 13,523 | ||||||||||||||||||
Class 1A | 6,731 | 151 | 700 | 17 | (2,591 | ) | (58 | ) | 4,840 | 110 | ||||||||||||||||||||||
Class 2 | 69,770 | 1,607 | 236,612 | 5,601 | (588,817 | ) | (13,514 | ) | (282,435 | ) | (6,306 | ) | ||||||||||||||||||||
Class 4 | 167,855 | 3,876 | 32,087 | 766 | (48,523 | ) | (1,127 | ) | 151,419 | 3,515 | ||||||||||||||||||||||
|
|
|
|
|
|
|
|
|
|
|
|
|
|
|
| |||||||||||||||||
Total net increase (decrease) | $ | 927,510 | 21,055 | $ | 486,343 | 11,446 | $ | (947,195 | ) | (21,659 | ) | $ | 466,658 | 10,842 | ||||||||||||||||||
|
|
|
|
|
|
|
|
|
|
|
|
|
|
|
| |||||||||||||||||
Global Small Capitalization Fund
| Sales* | Reinvestments of distributions | Repurchases* | Net (decrease) increase | |||||||||||||||||||||||||||||
Share class | Amount | Shares | Amount | Shares | Amount | Shares | Amount | Shares | ||||||||||||||||||||||||
Year ended December 31, 2022 | ||||||||||||||||||||||||||||||||
Class 1 | $ | 187,481 | 9,235 | $ | 331,498 | 19,030 | $ | (570,697 | ) | (21,774 | ) | $ | (51,718 | ) | 6,491 | |||||||||||||||||
Class 1A | 989 | 43 | 1,461 | 85 | (276 | ) | (15 | ) | 2,174 | 113 | ||||||||||||||||||||||
Class 2 | 111,019 | 5,043 | 663,046 | 40,307 | (118,512 | ) | (6,722 | ) | 655,553 | 38,628 | ||||||||||||||||||||||
Class 4 | 56,480 | 2,653 | 93,892 | 5,707 | (34,387 | ) | (1,715 | ) | 115,985 | 6,645 | ||||||||||||||||||||||
|
|
|
|
|
|
|
|
|
|
|
|
|
|
|
| |||||||||||||||||
Total net increase (decrease) | $ | 355,969 | 16,974 | $ | 1,089,897 | 65,129 | $ | (723,872 | ) | (30,226 | ) | $ | 721,994 | 51,877 | ||||||||||||||||||
|
|
|
|
|
|
|
|
|
|
|
|
|
|
|
| |||||||||||||||||
Year ended December 31, 2021 | ||||||||||||||||||||||||||||||||
Class 1 | $ | 216,763 | 6,235 | $ | 55,510 | 1,581 | $ | (1,077,292 | ) | (31,128 | ) | $ | (805,019 | ) | (23,312 | ) | ||||||||||||||||
Class 1A | 4,095 | 118 | 39 | 1 | (153 | ) | (4 | ) | 3,981 | 115 | ||||||||||||||||||||||
Class 2 | 59,596 | 1,785 | 60,246 | 1,778 | (374,611 | ) | (11,071 | ) | (254,769 | ) | (7,508 | ) | ||||||||||||||||||||
Class 4 | 89,704 | 2,662 | 7,215 | 212 | (30,621 | ) | (901 | ) | 66,298 | 1,973 | ||||||||||||||||||||||
|
|
|
|
|
|
|
|
|
|
|
|
|
|
|
| |||||||||||||||||
Total net increase (decrease) | $ | 370,158 | 10,800 | $ | 123,010 | 3,572 | $ | (1,482,677 | ) | (43,104 | ) | $ | (989,509 | ) | (28,732 | ) | ||||||||||||||||
|
|
|
|
|
|
|
|
|
|
|
|
|
|
|
| |||||||||||||||||
Refer to the end of the tables for footnotes.
338 American Funds Insurance Series
Table of Contents
Growth Fund
| Sales* | Reinvestments of distributions | Repurchases* | Net increase (decrease) | |||||||||||||||||||||||||||||
Share class | Amount | Shares | Amount | Shares | Amount | Shares | Amount | Shares | ||||||||||||||||||||||||
Year ended December 31, 2022 | ||||||||||||||||||||||||||||||||
Class 1 | $ | 2,593,666 | 29,149 | $ | 2,228,505 | 26,120 | $ | (3,051,097 | ) | (31,275 | ) | $ | 1,771,074 | 23,994 | ||||||||||||||||||
Class 1A | 133,124 | 1,387 | 27,088 | 320 | (15,271 | ) | (181 | ) | 144,941 | 1,526 | ||||||||||||||||||||||
Class 2 | 520,092 | 5,686 | 2,464,507 | 29,214 | (1,621,163 | ) | (17,346 | ) | 1,363,436 | 17,554 | ||||||||||||||||||||||
Class 3 | 1,224 | 14 | 32,371 | 376 | (28,004 | ) | (296 | ) | 5,591 | 94 | ||||||||||||||||||||||
Class 4 | 409,323 | 4,647 | 383,909 | 4,657 | (227,877 | ) | (2,558 | ) | 565,355 | 6,746 | ||||||||||||||||||||||
|
|
|
|
|
|
|
|
|
|
|
|
|
|
|
| |||||||||||||||||
Total net increase (decrease) | $ | 3,657,429 | 40,883 | $ | 5,136,380 | 60,687 | $ | (4,943,412 | ) | (51,656 | ) | $ | 3,850,397 | 49,914 | ||||||||||||||||||
|
|
|
|
|
|
|
|
|
|
|
|
|
|
|
| |||||||||||||||||
Year ended December 31, 2021 | ||||||||||||||||||||||||||||||||
Class 1 | $ | 2,916,865 | 22,963 | $ | 2,251,516 | 19,653 | $ | (2,207,142 | ) | (17,684 | ) | $ | 2,961,239 | 24,932 | ||||||||||||||||||
Class 1A | 68,640 | 560 | 9,733 | 86 | (25,312 | ) | (198 | ) | 53,061 | 448 | ||||||||||||||||||||||
Class 2 | 432,245 | 3,495 | 2,777,848 | 24,558 | (3,289,822 | ) | (26,755 | ) | (79,729 | ) | 1,298 | |||||||||||||||||||||
Class 3 | 1,972 | 15 | 37,541 | 326 | (37,449 | ) | (298 | ) | 2,064 | 43 | ||||||||||||||||||||||
Class 4 | 553,762 | 4,582 | 358,034 | 3,232 | (224,958 | ) | (1,864 | ) | 686,838 | 5,950 | ||||||||||||||||||||||
|
|
|
|
|
|
|
|
|
|
|
|
|
|
|
| |||||||||||||||||
Total net increase (decrease) | $ | 3,973,484 | 31,615 | $ | 5,434,672 | 47,855 | $ | (5,784,683 | ) | (46,799 | ) | $ | 3,623,473 | 32,671 | ||||||||||||||||||
|
|
|
|
|
|
|
|
|
|
|
|
|
|
|
| |||||||||||||||||
International Fund
| Sales* | Reinvestments of distributions | Repurchases* | Net (decrease) increase | |||||||||||||||||||||||||||||
Share class | Amount | Shares | Amount | Shares | Amount | Shares | Amount | Shares | ||||||||||||||||||||||||
Year ended December 31, 2022 | ||||||||||||||||||||||||||||||||
Class 1 | $ | 280,536 | 15,960 | $ | 543,821 | 32,473 | $ | (1,015,741 | ) | (51,244 | ) | $ | (191,384 | ) | (2,811 | ) | ||||||||||||||||
Class 1A | 2,247 | 127 | 1,679 | 101 | (1,009 | ) | (63 | ) | 2,917 | 165 | ||||||||||||||||||||||
Class 2 | 189,379 | 10,637 | 536,766 | 32,189 | (347,301 | ) | (20,471 | ) | 378,844 | 22,355 | ||||||||||||||||||||||
Class 3 | 87 | 5 | 2,627 | 156 | (1,366 | ) | (79 | ) | 1,348 | 82 | ||||||||||||||||||||||
Class 4 | 65,571 | 3,703 | 61,594 | 3,751 | (53,681 | ) | (3,200 | ) | 73,484 | 4,254 | ||||||||||||||||||||||
|
|
|
|
|
|
|
|
|
|
|
|
|
|
|
| |||||||||||||||||
Total net increase (decrease) | $ | 537,820 | 30,432 | $ | 1,146,487 | 68,670 | $ | (1,419,098 | ) | (75,057 | ) | $ | 265,209 | 24,045 | ||||||||||||||||||
|
|
|
|
|
|
|
|
|
|
|
|
|
|
|
| |||||||||||||||||
Year ended December 31, 2021 | ||||||||||||||||||||||||||||||||
Class 1 | $ | 366,681 | 15,339 | $ | 131,729 | 5,782 | $ | (1,253,303 | ) | (51,135 | ) | $ | (754,893 | ) | (30,014 | ) | ||||||||||||||||
Class 1A | 4,570 | 192 | 281 | 13 | (2,479 | ) | (103 | ) | 2,372 | 102 | ||||||||||||||||||||||
Class 2 | 264,867 | 11,161 | 105,815 | 4,673 | (502,502 | ) | (20,818 | ) | (131,820 | ) | (4,984 | ) | ||||||||||||||||||||
Class 3 | 125 | 5 | 546 | 24 | (3,534 | ) | (146 | ) | (2,863 | ) | (117 | ) | ||||||||||||||||||||
Class 4 | 95,888 | 4,069 | 10,725 | 480 | (51,434 | ) | (2,169 | ) | 55,179 | 2,380 | ||||||||||||||||||||||
|
|
|
|
|
|
|
|
|
|
|
|
|
|
|
| |||||||||||||||||
Total net increase (decrease) | $ | 732,131 | 30,766 | $ | 249,096 | 10,972 | $ | (1,813,252 | ) | (74,371 | ) | $ | (832,025 | ) | (32,633 | ) | ||||||||||||||||
|
|
|
|
|
|
|
|
|
|
|
|
|
|
|
| |||||||||||||||||
Refer to the end of the tables for footnotes.
American Funds Insurance Series 339
Table of Contents
New World Fund
| Sales* | Reinvestments of distributions | Repurchases* | Net (decrease) increase | |||||||||||||||||||||||||||||
Share class | Amount | Shares | Amount | Shares | Amount | Shares | Amount | Shares | ||||||||||||||||||||||||
Year ended December 31, 2022 | ||||||||||||||||||||||||||||||||
Class 1 | $ | 91,026 | 3,688 | $ | 189,325 | 7,939 | $ | (434,293 | ) | (16,140 | ) | $ | (153,942 | ) | (4,513 | ) | ||||||||||||||||
Class 1A | 1,549 | 60 | 1,040 | 44 | (1,769 | ) | (76 | ) | 820 | 28 | ||||||||||||||||||||||
Class 2 | 72,626 | 2,937 | 88,236 | 3,744 | (163,288 | ) | (6,534 | ) | (2,426 | ) | 147 | |||||||||||||||||||||
Class 4 | 133,209 | 5,310 | 78,780 | 3,371 | (133,462 | ) | (5,583 | ) | 78,527 | 3,098 | ||||||||||||||||||||||
|
|
|
|
|
|
|
|
|
|
|
|
|
|
|
| |||||||||||||||||
Total net increase (decrease) | $ | 298,410 | 11,995 | $ | 357,381 | 15,098 | $ | (732,812 | ) | (28,333 | ) | $ | (77,021 | ) | (1,240 | ) | ||||||||||||||||
|
|
|
|
|
|
|
|
|
|
|
|
|
|
|
| |||||||||||||||||
Year ended December 31, 2021 | ||||||||||||||||||||||||||||||||
Class 1 | $ | 180,001 | 5,517 | $ | 104,795 | 3,183 | $ | (165,865 | ) | (5,053 | ) | $ | 118,931 | 3,647 | ||||||||||||||||||
Class 1A | 14,137 | 436 | 350 | 11 | (21,114 | ) | (642 | ) | (6,627 | ) | (195 | ) | ||||||||||||||||||||
Class 2 | 82,347 | 2,547 | 45,947 | 1,410 | (159,868 | ) | (4,915 | ) | (31,574 | ) | (958 | ) | ||||||||||||||||||||
Class 4 | 135,084 | 4,224 | 34,360 | 1,061 | (74,083 | ) | (2,295 | ) | 95,361 | 2,990 | ||||||||||||||||||||||
|
|
|
|
|
|
|
|
|
|
|
|
|
|
|
| |||||||||||||||||
Total net increase (decrease) | $ | 411,569 | 12,724 | $ | 185,452 | 5,665 | $ | (420,930 | ) | (12,905 | ) | $ | 176,091 | 5,484 | ||||||||||||||||||
|
|
|
|
|
|
|
|
|
|
|
|
|
|
|
| |||||||||||||||||
Washington Mutual Investors Fund
| Sales* | Reinvestments of distributions | Repurchases* | Net increase (decrease) | |||||||||||||||||||||||||||||
Share class | Amount | Shares | Amount | Shares | Amount | Shares | Amount | Shares | ||||||||||||||||||||||||
Year ended December 31, 2022 | ||||||||||||||||||||||||||||||||
Class 1 | $ | 311,628 | 22,333 | $ | 1,412,614 | 106,476 | $ | (1,024,832 | ) | (69,053 | ) | $ | 699,410 | 59,756 | ||||||||||||||||||
Class 1A | 33,907 | 2,321 | 14,025 | 1,066 | (125,110 | ) | (7,699 | ) | (77,178 | ) | (4,312 | ) | ||||||||||||||||||||
Class 2 | 48,719 | 3,523 | 725,386 | 55,707 | (414,058 | ) | (28,659 | ) | 360,047 | 30,571 | ||||||||||||||||||||||
Class 4 | 238,615 | 16,711 | 258,174 | 20,025 | (148,002 | ) | (10,093 | ) | 348,787 | 26,643 | ||||||||||||||||||||||
|
|
|
|
|
|
|
|
|
|
|
|
|
|
|
| |||||||||||||||||
Total net increase (decrease) | $ | 632,869 | 44,888 | $ | 2,410,199 | 183,274 | $ | (1,712,002 | ) | (115,504 | ) | $ | 1,331,066 | 112,658 | ||||||||||||||||||
|
|
|
|
|
|
|
|
|
|
|
|
|
|
|
| |||||||||||||||||
Year ended December 31, 2021 | ||||||||||||||||||||||||||||||||
Class 1 | $ | 740,227 | 42,419 | $ | 104,068 | 6,017 | $ | (1,150,862 | ) | (70,448 | ) | $ | (306,567 | ) | (22,012 | ) | ||||||||||||||||
Class 1A | 128,020 | 7,779 | 2,211 | 129 | (4,020 | ) | (244 | ) | 126,211 | 7,664 | ||||||||||||||||||||||
Class 2 | �� | 51,950 | 3,263 | 46,652 | 2,739 | (508,810 | ) | (31,581 | ) | (410,208 | ) | (25,579 | ) | |||||||||||||||||||
Class 4 | 156,222 | 9,709 | 12,620 | 746 | (66,538 | ) | (4,145 | ) | 102,304 | 6,310 | ||||||||||||||||||||||
|
|
|
|
|
|
|
|
|
|
|
|
|
|
|
| |||||||||||||||||
Total net increase (decrease) | $ | 1,076,419 | 63,170 | $ | 165,551 | 9,631 | $ | (1,730,230 | ) | (106,418 | ) | $ | (488,260 | ) | (33,617 | ) | ||||||||||||||||
|
|
|
|
|
|
|
|
|
|
|
|
|
|
|
| |||||||||||||||||
Capital World Growth and Income Fund
| Sales* | Reinvestments of distributions | Repurchases* | Net (decrease) increase | |||||||||||||||||||||||||||||
Share class | Amount | Shares | Amount | Shares | Amount | Shares | Amount | Shares | ||||||||||||||||||||||||
Year ended December 31, 2022 | ||||||||||||||||||||||||||||||||
Class 1 | $ | 286,528 | 22,239 | $ | 137,343 | 10,946 | $ | (434,782 | ) | (30,278 | ) | $ | (10,911 | ) | 2,907 | |||||||||||||||||
Class 1A | 1,618 | 116 | 1,525 | 122 | (1,079 | ) | (91 | ) | 2,064 | 147 | ||||||||||||||||||||||
Class 2 | 15,274 | 1,157 | 262,887 | 21,001 | (144,703 | ) | (10,617 | ) | 133,458 | 11,541 | ||||||||||||||||||||||
Class 4 | 25,643 | 1,909 | 48,121 | 3,940 | (22,999 | ) | (1,756 | ) | 50,765 | 4,093 | ||||||||||||||||||||||
|
|
|
|
|
|
|
|
|
|
|
|
|
|
|
| |||||||||||||||||
Total net increase (decrease) | $ | 329,063 | 25,421 | $ | 449,876 | 36,009 | $ | (603,563 | ) | (42,742 | ) | $ | 175,376 | 18,688 | ||||||||||||||||||
|
|
|
|
|
|
|
|
|
|
|
|
|
|
|
| |||||||||||||||||
Year ended December 31, 2021 | ||||||||||||||||||||||||||||||||
Class 1 | $ | 171,552 | 9,531 | $ | 30,555 | 1,698 | $ | (117,328 | ) | (6,578 | ) | $ | 84,779 | 4,651 | ||||||||||||||||||
Class 1A | 4,092 | 231 | 166 | 9 | (605 | ) | (34 | ) | 3,653 | 206 | ||||||||||||||||||||||
Class 2 | 21,440 | 1,205 | 50,935 | 2,838 | (216,241 | ) | (12,206 | ) | (143,866 | ) | (8,163 | ) | ||||||||||||||||||||
Class 4 | 49,326 | 2,833 | 7,530 | 427 | (16,390 | ) | (939 | ) | 40,466 | 2,321 | ||||||||||||||||||||||
|
|
|
|
|
|
|
|
|
|
|
|
|
|
|
| |||||||||||||||||
Total net increase (decrease) | $ | 246,410 | 13,800 | $ | 89,186 | 4,972 | $ | (350,564 | ) | (19,757 | ) | $ | (14,968 | ) | (985 | ) | ||||||||||||||||
|
|
|
|
|
|
|
|
|
|
|
|
|
|
|
| |||||||||||||||||
Refer to the end of the tables for footnotes.
340 American Funds Insurance Series
Table of Contents
Growth-Income Fund
| Sales* | Reinvestments of distributions | Repurchases* | Net increase (decrease) | |||||||||||||||||||||||||||||
Share class | Amount | Shares | Amount | Shares | Amount | Shares | Amount | Shares | ||||||||||||||||||||||||
Year ended December 31, 2022 | ||||||||||||||||||||||||||||||||
Class 1 | $ | 2,026,623 | 38,323 | $ | 2,348,918 | 43,972 | $ | (3,853,406 | ) | (68,861 | ) | $ | 522,135 | 13,434 | ||||||||||||||||||
Class 1A | 4,813 | 89 | 3,248 | 61 | (3,333 | ) | (64 | ) | 4,728 | 86 | ||||||||||||||||||||||
Class 2 | 119,436 | 2,219 | 1,399,821 | 26,589 | (1,455,432 | ) | (26,710 | ) | 63,825 | 2,098 | ||||||||||||||||||||||
Class 3 | 766 | 15 | 15,025 | 280 | (15,511 | ) | (279 | ) | 280 | 16 | ||||||||||||||||||||||
Class 4 | 180,173 | 3,342 | 186,543 | 3,596 | (153,528 | ) | (2,879 | ) | 213,188 | 4,059 | ||||||||||||||||||||||
|
|
|
|
|
|
|
|
|
|
|
|
|
|
|
| |||||||||||||||||
Total net increase (decrease) | $ | 2,331,811 | 43,988 | $ | 3,953,555 | 74,498 | $ | (5,481,210 | ) | (98,793 | ) | $ | 804,156 | 19,693 | ||||||||||||||||||
|
|
|
|
|
|
|
|
|
|
|
|
|
|
|
| |||||||||||||||||
Year ended December 31, 2021 | ||||||||||||||||||||||||||||||||
Class 1 | $ | 778,306 | 12,603 | $ | 567,351 | 8,928 | $ | (3,472,494 | ) | (56,343 | ) | $ | (2,126,837 | ) | (34,812 | ) | ||||||||||||||||
Class 1A | 14,065 | 224 | 493 | 8 | (2,433 | ) | (39 | ) | 12,125 | 193 | ||||||||||||||||||||||
Class 2 | 143,239 | 2,361 | 310,023 | 4,964 | (2,027,406 | ) | (33,135 | ) | (1,574,144 | ) | (25,810 | ) | ||||||||||||||||||||
Class 3 | 1,007 | 16 | 3,442 | 54 | (23,575 | ) | (379 | ) | (19,126 | ) | (309 | ) | ||||||||||||||||||||
Class 4 | 302,016 | 4,995 | 33,018 | 536 | (132,399 | ) | (2,191 | ) | 202,635 | 3,340 | ||||||||||||||||||||||
|
|
|
|
|
|
|
|
|
|
|
|
|
|
|
| |||||||||||||||||
Total net increase (decrease) | $ | 1,238,633 | 20,199 | $ | 914,327 | 14,490 | $ | (5,658,307 | ) | (92,087 | ) | $ | (3,505,347 | ) | (57,398 | ) | ||||||||||||||||
|
|
|
|
|
|
|
|
|
|
|
|
|
|
|
| |||||||||||||||||
International Growth and Income Fund
| Sales* | Reinvestments of distributions | Repurchases* | Net (decrease) increase | |||||||||||||||||||||||||||||
Share class | Amount | Shares | Amount | Shares | Amount | Shares | Amount | Shares | ||||||||||||||||||||||||
Year ended December 31, 2022 | ||||||||||||||||||||||||||||||||
Class 1 | $ | 2,793 | 220 | $ | 6,501 | 686 | $ | (16,761 | ) | (946 | ) | $ | (7,467 | ) | (40 | ) | ||||||||||||||||
Class 1A | 1,041 | 92 | 2,255 | 244 | (921 | ) | (61 | ) | 2,375 | 275 | ||||||||||||||||||||||
Class 2 | 7,743 | 664 | 86,227 | 9,344 | (24,550 | ) | (2,262 | ) | 69,420 | 7,746 | ||||||||||||||||||||||
Class 4 | 23,335 | 2,027 | 59,065 | 6,499 | (13,968 | ) | (1,295 | ) | 68,432 | 7,231 | ||||||||||||||||||||||
|
|
|
|
|
|
|
|
|
|
|
|
|
|
|
| |||||||||||||||||
Total net increase (decrease) | $ | 34,912 | 3,003 | $ | 154,048 | 16,773 | $ | (56,200 | ) | (4,564 | ) | $ | 132,760 | 15,212 | ||||||||||||||||||
|
|
|
|
|
|
|
|
|
|
|
|
|
|
|
| |||||||||||||||||
Year ended December 31, 2021 | ||||||||||||||||||||||||||||||||
Class 1 | $ | 48,015 | 2,368 | $ | 4,294 | 210 | $ | (1,169,382 | ) | (59,936 | ) | $ | (1,117,073 | ) | (57,358 | ) | ||||||||||||||||
Class 1A | 2,986 | 152 | 141 | 7 | (561 | ) | (28 | ) | 2,566 | 131 | ||||||||||||||||||||||
Class 2 | 8,004 | 401 | 6,218 | 322 | (29,755 | ) | (1,507 | ) | (15,533 | ) | (784 | ) | ||||||||||||||||||||
Class 4 | 27,229 | 1,381 | 3,589 | 188 | (13,127 | ) | (671 | ) | 17,691 | 898 | ||||||||||||||||||||||
|
|
|
|
|
|
|
|
|
|
|
|
|
|
|
| |||||||||||||||||
Total net increase (decrease) | $ | 86,234 | 4,302 | $ | 14,242 | 727 | $ | (1,212,825 | ) | (62,142 | ) | $ | (1,112,349 | ) | (57,113 | ) | ||||||||||||||||
|
|
|
|
|
|
|
|
|
|
|
|
|
|
|
| |||||||||||||||||
Refer to the end of the tables for footnotes.
American Funds Insurance Series 341
Table of Contents
Capital Income Builder
| Sales* | Reinvestments of distributions | Repurchases* | Net increase (decrease) | |||||||||||||||||||||||||||||
Share class | Amount | Shares | Amount | Shares | Amount | Shares | Amount | Shares | ||||||||||||||||||||||||
Year ended December 31, 2022 | ||||||||||||||||||||||||||||||||
Class 1 | $ | 177,351 | 15,800 | $ | 17,636 | 1,573 | $ | (114,944 | ) | (10,289 | ) | $ | 80,043 | 7,084 | ||||||||||||||||||
Class 1A | 2,218 | 196 | 270 | 24 | (1,259 | ) | (111 | ) | 1,229 | 109 | ||||||||||||||||||||||
Class 2 | 2,390 | 211 | 355 | 32 | (1,006 | ) | (88 | ) | 1,739 | 155 | ||||||||||||||||||||||
Class 4 | 94,517 | 8,303 | 13,728 | 1,228 | (81,854 | ) | (7,293 | ) | 26,391 | 2,238 | ||||||||||||||||||||||
|
|
|
|
|
|
|
|
|
|
|
|
|
|
|
| |||||||||||||||||
Total net increase (decrease) | $ | 276,476 | 24,510 | $ | 31,989 | 2,857 | $ | (199,063 | ) | (17,781 | ) | $ | 109,402 | 9,586 | ||||||||||||||||||
|
|
|
|
|
|
|
|
|
|
|
|
|
|
|
| |||||||||||||||||
Year ended December 31, 2021 | ||||||||||||||||||||||||||||||||
Class 1 | $ | 107,711 | 9,192 | $ | 16,222 | 1,379 | $ | (252,397 | ) | (21,377 | ) | $ | (128,464 | ) | (10,806 | ) | ||||||||||||||||
Class 1A | 2,434 | 206 | 218 | 19 | (451 | ) | (39 | ) | 2,201 | 186 | ||||||||||||||||||||||
Class 2 | 5,007 | 428 | 315 | 27 | (1,572 | ) | (134 | ) | 3,750 | 321 | ||||||||||||||||||||||
Class 4 | 70,040 | 6,029 | 13,009 | 1,105 | (42,227 | ) | (3,629 | ) | 40,822 | 3,505 | ||||||||||||||||||||||
|
|
|
|
|
|
|
|
|
|
|
|
|
|
|
| |||||||||||||||||
Total net increase (decrease) | $ | 185,192 | 15,855 | $ | 29,764 | 2,530 | $ | (296,647 | ) | (25,179 | ) | $ | (81,691 | ) | (6,794 | ) | ||||||||||||||||
|
|
|
|
|
|
|
|
|
|
|
|
|
|
|
| |||||||||||||||||
Asset Allocation Fund
| Sales* | Reinvestments of distributions | Repurchases* | Net increase (decrease) | |||||||||||||||||||||||||||||
Share class | Amount | Shares | Amount | Shares | Amount | Shares | Amount | Shares | ||||||||||||||||||||||||
Year ended December 31, 2022 | ||||||||||||||||||||||||||||||||
Class 1 | $ | 1,365,105 | 57,634 | $ | 2,001,507 | 85,450 | $ | (2,607,782 | ) | (108,817 | ) | $ | 758,830 | 34,267 | ||||||||||||||||||
Class 1A | 8,603 | 375 | 2,806 | 121 | (2,839 | ) | (126 | ) | 8,570 | 370 | ||||||||||||||||||||||
Class 2 | 58,248 | 2,413 | 565,030 | 24,435 | (581,503 | ) | (24,252 | ) | 41,775 | 2,596 | ||||||||||||||||||||||
Class 3 | 126 | 5 | 3,759 | 160 | (3,377 | ) | (141 | ) | 508 | 24 | ||||||||||||||||||||||
Class 4 | 332,209 | 13,862 | 680,622 | 29,650 | (423,984 | ) | (17,975 | ) | 588,847 | 25,537 | ||||||||||||||||||||||
|
|
|
|
|
|
|
|
|
|
|
|
|
|
|
| |||||||||||||||||
Total net increase (decrease) | $ | 1,764,291 | 74,289 | $ | 3,253,724 | 139,816 | $ | (3,619,485 | ) | (151,311 | ) | $ | 1,398,530 | 62,794 | ||||||||||||||||||
|
|
|
|
|
| �� |
|
|
|
|
|
|
|
|
| |||||||||||||||||
Year ended December 31, 2021 | ||||||||||||||||||||||||||||||||
Class 1 | $ | 1,077,099 | 38,077 | $ | 1,004,165 | 35,557 | $ | (4,395,063 | ) | (151,941 | ) | $ | (2,313,799 | ) | (78,307 | ) | ||||||||||||||||
Class 1A | 8,925 | 315 | 880 | 31 | (1,749 | ) | (63 | ) | 8,056 | 283 | ||||||||||||||||||||||
Class 2 | 117,974 | 4,243 | 262,797 | 9,420 | (649,009 | ) | (23,286 | ) | (268,238 | ) | (9,623 | ) | ||||||||||||||||||||
Class 3 | 1,030 | 36 | 1,693 | 60 | (2,340 | ) | (83 | ) | 383 | 13 | ||||||||||||||||||||||
Class 4 | 687,105 | 24,820 | 271,781 | 9,809 | (264,761 | ) | (9,619 | ) | 694,125 | 25,010 | ||||||||||||||||||||||
|
|
|
|
|
|
|
|
|
|
|
|
|
|
|
| |||||||||||||||||
Total net increase (decrease) | $ | 1,892,133 | 67,491 | $ | 1,541,316 | 54,877 | $ | (5,312,922 | ) | (184,992 | ) | $ | (1,879,473 | ) | (62,624 | ) | ||||||||||||||||
|
|
|
|
|
|
|
|
|
|
|
|
|
|
|
| |||||||||||||||||
Refer to the end of the tables for footnotes.
342 American Funds Insurance Series
Table of Contents
American Funds Global Balanced Fund
| Sales* | Reinvestments of distributions | Repurchases* | Net (decrease) increase | |||||||||||||||||||||||||||||
Share class | Amount | Shares | Amount | Shares | Amount | Shares | Amount | Shares | ||||||||||||||||||||||||
Year ended December 31, 2022 | ||||||||||||||||||||||||||||||||
Class 1 | $ | 37,857 | 3,046 | $ | 570 | 44 | $ | (45,473 | ) | (3,593 | ) | $ | (7,046 | ) | (503 | ) | ||||||||||||||||
Class 1A | 160 | 12 | 15 | 1 | (857 | ) | (63 | ) | (682 | ) | (50 | ) | ||||||||||||||||||||
Class 2 | 3,979 | 308 | 974 | 74 | (24,238 | ) | (1,876 | ) | (19,285 | ) | (1,494 | ) | ||||||||||||||||||||
Class 4 | 9,992 | 779 | 674 | 52 | (14,316 | ) | (1,139 | ) | (3,650 | ) | (308 | ) | ||||||||||||||||||||
|
|
|
|
|
|
|
|
|
|
|
|
|
|
|
| |||||||||||||||||
Total net increase (decrease) | $ | 51,988 | 4,145 | $ | 2,233 | 171 | $ | (84,884 | ) | (6,671 | ) | $ | (30,663 | ) | (2,355 | ) | ||||||||||||||||
|
|
|
|
|
|
|
|
|
|
|
|
|
|
|
| |||||||||||||||||
Year ended December 31, 2021 | ||||||||||||||||||||||||||||||||
Class 1 | $ | 9,259 | 623 | $ | 7,739 | 533 | $ | (40,506 | ) | (2,798 | ) | $ | (23,508 | ) | (1,642 | ) | ||||||||||||||||
Class 1A | 925 | 63 | 233 | 16 | (252 | ) | (17 | ) | 906 | 62 | ||||||||||||||||||||||
Class 2 | 5,621 | 383 | 13,069 | 902 | (27,137 | ) | (1,828 | ) | (8,447 | ) | (543 | ) | ||||||||||||||||||||
Class 4 | 28,503 | 1,957 | 8,206 | 572 | (10,476 | ) | (713 | ) | 26,233 | 1,816 | ||||||||||||||||||||||
|
|
|
|
|
|
|
|
|
|
|
|
|
|
|
| |||||||||||||||||
Total net increase (decrease) | $ | 44,308 | 3,026 | $ | 29,247 | 2,023 | $ | (78,371 | ) | (5,356 | ) | $ | (4,816 | ) | (307 | ) | ||||||||||||||||
|
|
|
|
|
|
|
|
|
|
|
|
|
|
|
| |||||||||||||||||
The Bond Fund of America
| Sales* | Reinvestments of distributions | Repurchases* | Net (decrease) increase | |||||||||||||||||||||||||||||
Share class | Amount | Shares | Amount | Shares | Amount | Shares | Amount | Shares | ||||||||||||||||||||||||
Year ended December 31, 2022 | ||||||||||||||||||||||||||||||||
Class 1 | $ | 1,045,629 | 102,870 | $ | 293,730 | 29,996 | $ | (2,254,686 | ) | (218,872 | ) | $ | (915,327 | ) | (86,006 | ) | ||||||||||||||||
Class 1A | 222,556 | 22,066 | 9,170 | 944 | (5,163 | ) | (515 | ) | 226,563 | 22,495 | ||||||||||||||||||||||
Class 2 | 49,800 | 5,005 | 126,095 | 13,059 | (487,579 | ) | (48,690 | ) | (311,684 | ) | (30,626 | ) | ||||||||||||||||||||
Class 4 | 123,107 | 12,517 | 31,861 | 3,314 | (113,670 | ) | (11,505 | ) | 41,298 | 4,326 | ||||||||||||||||||||||
|
|
|
|
|
|
|
|
|
|
|
|
|
|
|
| |||||||||||||||||
Total net increase (decrease) | $ | 1,441,092 | 142,458 | $ | 460,856 | 47,313 | $ | (2,861,098 | ) | (279,582 | ) | $ | (959,150 | ) | (89,811 | ) | ||||||||||||||||
|
|
|
|
|
|
|
|
|
|
|
|
|
|
|
| |||||||||||||||||
Year ended December 31, 2021 | ||||||||||||||||||||||||||||||||
Class 1 | $ | 2,441,954 | 212,866 | $ | 432,376 | 38,456 | $ | (737,146 | ) | (64,100 | ) | $ | 2,137,184 | 187,222 | ||||||||||||||||||
Class 1A | 5,329 | 464 | 601 | 54 | (2,565 | ) | (223 | ) | 3,365 | 295 | ||||||||||||||||||||||
Class 2 | 204,371 | 17,879 | 208,042 | 18,765 | (302,247 | ) | (26,735 | ) | 110,166 | 9,909 | ||||||||||||||||||||||
Class 4 | 240,539 | 21,228 | 43,487 | 3,939 | (60,173 | ) | (5,327 | ) | 223,853 | 19,840 | ||||||||||||||||||||||
|
|
|
|
|
|
|
|
|
|
|
|
|
|
|
| |||||||||||||||||
Total net increase (decrease) | $ | 2,892,193 | 252,437 | $ | 684,506 | 61,214 | $ | (1,102,131 | ) | (96,385 | ) | $ | 2,474,568 | 217,266 | ||||||||||||||||||
|
|
|
|
|
|
|
|
|
|
|
|
|
|
|
| |||||||||||||||||
Capital World Bond Fund
| Sales* | Reinvestments of distributions | Repurchases* | Net (decrease) increase | |||||||||||||||||||||||||||||
Share class | Amount | Shares | Amount | Shares | Amount | Shares | Amount | Shares | ||||||||||||||||||||||||
Year ended December 31, 2022 | ||||||||||||||||||||||||||||||||
Class 1 | $ | 63,069 | 6,354 | $ | 13,903 | 1,398 | $ | (234,228 | ) | (22,105 | ) | $ | (157,256 | ) | (14,353 | ) | ||||||||||||||||
Class 1A | 470 | 46 | 24 | 2 | (371 | ) | (38 | ) | 123 | 10 | ||||||||||||||||||||||
Class 2 | 32,696 | 3,225 | 15,838 | 1,606 | (121,387 | ) | (11,954 | ) | (72,853 | ) | (7,123 | ) | ||||||||||||||||||||
Class 4 | 7,078 | 688 | 1,065 | 109 | (8,255 | ) | (838 | ) | (112 | ) | (41 | ) | ||||||||||||||||||||
|
|
|
|
|
|
|
|
|
|
|
|
|
|
|
| |||||||||||||||||
Total net increase (decrease) | $ | 103,313 | 10,313 | $ | 30,830 | 3,115 | $ | (364,241 | ) | (34,935 | ) | $ | (230,098 | ) | (21,507 | ) | ||||||||||||||||
|
|
|
|
|
|
|
|
|
|
|
|
|
|
|
| |||||||||||||||||
Year ended December 31, 2021 | ||||||||||||||||||||||||||||||||
Class 1 | $ | 129,119 | 10,361 | $ | 44,414 | 3,661 | $ | (305,638 | ) | (24,399 | ) | $ | (132,105 | ) | (10,377 | ) | ||||||||||||||||
Class 1A | 1,155 | 95 | 40 | 3 | (261 | ) | (21 | ) | 934 | 77 | ||||||||||||||||||||||
Class 2 | 83,201 | 6,733 | 44,570 | 3,700 | (58,585 | ) | (4,813 | ) | 69,186 | 5,620 | ||||||||||||||||||||||
Class 4 | 19,357 | 1,604 | 2,457 | 206 | (11,624 | ) | (951 | ) | 10,190 | 859 | ||||||||||||||||||||||
|
|
|
|
|
|
|
|
|
|
|
|
|
|
|
| |||||||||||||||||
Total net increase (decrease) | $ | 232,832 | 18,793 | $ | 91,481 | 7,570 | $ | (376,108 | ) | (30,184 | ) | $ | (51,795 | ) | (3,821 | ) | ||||||||||||||||
|
|
|
|
|
|
|
|
|
|
|
|
|
|
|
| |||||||||||||||||
Refer to the end of the tables for footnotes.
American Funds Insurance Series 343
Table of Contents
American High-Income Trust
| Sales* | Reinvestments of distributions | Repurchases* | Net (decrease) increase | |||||||||||||||||||||||||||||
Share class | Amount | Shares | Amount | Shares | Amount | Shares | Amount | Shares | ||||||||||||||||||||||||
Year ended December 31, 2022 | ||||||||||||||||||||||||||||||||
Class 1 | $ | 29,406 | 3,042 | $ | 17,917 | 2,062 | $ | (58,971 | ) | (6,116 | ) | $ | (11,648 | ) | (1,012 | ) | ||||||||||||||||
Class 1A | 362 | 39 | 100 | 11 | (426 | ) | (45 | ) | 36 | 5 | ||||||||||||||||||||||
Class 2 | 7,171 | 758 | 42,707 | 5,019 | (98,679 | ) | (10,782 | ) | (48,801 | ) | (5,005 | ) | ||||||||||||||||||||
Class 3 | 432 | 46 | 695 | 79 | (1,385 | ) | (149 | ) | (258 | ) | (24 | ) | ||||||||||||||||||||
Class 4 | 65,309 | 6,490 | 5,827 | 619 | (70,275 | ) | (6,997 | ) | 861 | 112 | ||||||||||||||||||||||
|
|
|
|
|
|
|
|
|
|
|
|
|
|
|
| |||||||||||||||||
Total net increase (decrease) | $ | 102,680 | 10,375 | $ | 67,246 | 7,790 | $ | (229,736 | ) | (24,089 | ) | $ | (59,810 | ) | (5,924 | ) | ||||||||||||||||
|
|
|
|
|
|
|
|
|
|
|
|
|
|
|
| |||||||||||||||||
Year ended December 31, 2021 | ||||||||||||||||||||||||||||||||
Class 1 | $ | 160,559 | 15,547 | $ | 10,757 | 1,060 | $ | (19,514 | ) | (1,906 | ) | $ | 151,802 | 14,701 | ||||||||||||||||||
Class 1A | 915 | 89 | 59 | 5 | (548 | ) | (53 | ) | 426 | 41 | ||||||||||||||||||||||
Class 2 | 20,019 | 2,003 | 28,636 | 2,874 | (66,675 | ) | (6,630 | ) | (18,020 | ) | (1,753 | ) | ||||||||||||||||||||
Class 3 | 908 | 88 | 429 | 42 | (1,328 | ) | (129 | ) | 9 | 1 | ||||||||||||||||||||||
Class 4 | 143,656 | 13,002 | 3,238 | 295 | (128,886 | ) | (11,648 | ) | 18,008 | 1,649 | ||||||||||||||||||||||
|
|
|
|
|
|
|
|
|
|
|
|
|
|
|
| |||||||||||||||||
Total net increase (decrease) | $ | 326,057 | 30,729 | $ | 43,119 | 4,276 | $ | (216,951 | ) | (20,366 | ) | $ | 152,225 | 14,639 | ||||||||||||||||||
|
|
|
|
|
|
|
|
|
|
|
|
|
|
|
| |||||||||||||||||
American Funds Mortgage Fund
| Sales* | Reinvestments of distributions | Repurchases* | Net (decrease) increase | |||||||||||||||||||||||||||||
Share class | Amount | Shares | Amount | Shares | Amount | Shares | Amount | Shares | ||||||||||||||||||||||||
Year ended December 31, 2022 | ||||||||||||||||||||||||||||||||
Class 1 | $ | 784 | 78 | $ | 15 | 2 | $ | (229,165 | ) | (21,726 | ) | $ | (228,366 | ) | (21,646 | ) | ||||||||||||||||
Class 1A | 662 | 67 | 37 | 4 | (1,033 | ) | (103 | ) | (334 | ) | (32 | ) | ||||||||||||||||||||
Class 2 | 3,214 | 326 | 995 | 103 | (9,402 | ) | (951 | ) | (5,193 | ) | (522 | ) | ||||||||||||||||||||
Class 4 | 10,671 | 1,091 | 746 | 78 | (9,016 | ) | (920 | ) | 2,401 | 249 | ||||||||||||||||||||||
|
|
|
|
|
|
|
|
|
|
|
|
|
|
|
| |||||||||||||||||
Total net increase (decrease) | $ | 15,331 | 1,562 | $ | 1,793 | 187 | $ | (248,616 | ) | (23,700 | ) | $ | (231,492 | ) | (21,951 | ) | ||||||||||||||||
|
|
|
|
|
|
|
|
|
|
|
|
|
|
|
| |||||||||||||||||
Year ended December 31, 2021 | ||||||||||||||||||||||||||||||||
Class 1 | $ | 35,679 | 3,267 | $ | 9,382 | 880 | $ | (27,270 | ) | (2,517 | ) | $ | 17,791 | 1,630 | ||||||||||||||||||
Class 1A | 1,498 | 139 | 57 | 5 | (436 | ) | (40 | ) | 1,119 | 104 | ||||||||||||||||||||||
Class 2 | 6,415 | 588 | 2,232 | 210 | (5,928 | ) | (547 | ) | 2,719 | 251 | ||||||||||||||||||||||
Class 4 | 11,056 | 1,029 | 1,486 | 142 | (4,892 | ) | (457 | ) | 7,650 | 714 | ||||||||||||||||||||||
|
|
|
|
|
|
|
|
|
|
|
|
|
|
|
| |||||||||||||||||
Total net increase (decrease) | $ | 54,648 | 5,023 | $ | 13,157 | 1,237 | $ | (38,526 | ) | (3,561 | ) | $ | 29,279 | 2,699 | ||||||||||||||||||
|
|
|
|
|
|
|
|
|
|
|
|
|
|
|
| |||||||||||||||||
Refer to the end of the tables for footnotes.
344 American Funds Insurance Series
Table of Contents
Ultra-Short Bond Fund
| Sales* | Reinvestments of distributions | Repurchases* | Net increase (decrease) | |||||||||||||||||||||||||||||
Share class | Amount | Shares | Amount | Shares | Amount | Shares | Amount | Shares | ||||||||||||||||||||||||
Year ended December 31, 2022 | ||||||||||||||||||||||||||||||||
Class 1 | $ | 33,573 | 2,975 | $ | 348 | 31 | $ | (20,904 | ) | (1,853 | ) | $ | 13,017 | 1,153 | ||||||||||||||||||
Class 1A | — | — | — | † | — | † | — | — | — | † | — | † | ||||||||||||||||||||
Class 2 | 117,586 | 10,755 | 1,569 | 143 | (68,709 | ) | (6,275 | ) | 50,446 | 4,623 | ||||||||||||||||||||||
Class 3 | 735 | 67 | 26 | 2 | (1,082 | ) | (97 | ) | (321 | ) | (28 | ) | ||||||||||||||||||||
Class 4 | 84,873 | 7,721 | 293 | 27 | (51,358 | ) | (4,671 | ) | 33,808 | 3,077 | ||||||||||||||||||||||
|
|
|
|
|
|
|
|
|
|
|
|
|
|
|
| |||||||||||||||||
Total net increase (decrease) | $ | 236,767 | 21,518 | $ | 2,236 | 203 | $ | (142,053 | ) | (12,896 | ) | $ | 96,950 | 8,825 | ||||||||||||||||||
|
|
|
|
|
|
|
|
|
|
|
|
|
|
|
| |||||||||||||||||
Year ended December 31, 2021 | ||||||||||||||||||||||||||||||||
Class 1 | $ | 16,242 | 1,439 | $ | — | — | $ | (22,707 | ) | (2,011 | ) | $ | (6,465 | ) | (572 | ) | ||||||||||||||||
Class 1A | — | — | — | — | — | — | — | — | ||||||||||||||||||||||||
Class 2 | 86,233 | 7,864 | — | — | (127,622 | ) | (11,640 | ) | (41,389 | ) | (3,776 | ) | ||||||||||||||||||||
Class 3 | 1,253 | 113 | — | — | (915 | ) | (83 | ) | 338 | 30 | ||||||||||||||||||||||
Class 4 | 35,704 | 3,232 | — | — | (29,389 | ) | (2,660 | ) | 6,315 | 572 | ||||||||||||||||||||||
|
|
|
|
|
|
|
|
|
|
|
|
|
|
|
| |||||||||||||||||
Total net increase (decrease) | $ | 139,432 | 12,648 | $ | — | — | $ | (180,633 | ) | (16,394 | ) | $ | (41,201 | ) | (3,746 | ) | ||||||||||||||||
|
|
|
|
|
|
|
|
|
|
|
|
|
|
|
| |||||||||||||||||
U.S. Government Securities Fund
| Sales* | Reinvestments of distributions | Repurchases* | Net (decrease) increase | |||||||||||||||||||||||||||||
Share class | Amount | Shares | Amount | Shares | Amount | Shares | Amount | Shares | ||||||||||||||||||||||||
Year ended December 31, 2022 | ||||||||||||||||||||||||||||||||
Class 1 | $ | 69,422 | 6,446 | $ | 10,134 | 987 | $ | (316,401 | ) | (27,982 | ) | $ | (236,845 | ) | (20,549 | ) | ||||||||||||||||
Class 1A | 2,902 | 273 | 153 | 15 | (3,237 | ) | (300 | ) | (182 | ) | (12 | ) | ||||||||||||||||||||
Class 2 | 43,941 | 4,115 | 42,631 | 4,200 | (233,844 | ) | (21,667 | ) | (147,272 | ) | (13,352 | ) | ||||||||||||||||||||
Class 3 | 308 | 28 | 292 | 28 | (2,508 | ) | (236 | ) | (1,908 | ) | (180 | ) | ||||||||||||||||||||
Class 4 | 67,334 | 6,331 | 7,040 | 695 | (90,440 | ) | (8,406 | ) | (16,066 | ) | (1,380 | ) | ||||||||||||||||||||
|
|
|
|
|
|
|
|
|
|
|
|
|
|
|
| |||||||||||||||||
Total net increase (decrease) | $ | 183,907 | 17,193 | $ | 60,250 | 5,925 | $ | (646,430 | ) | (58,591 | ) | $ | (402,273 | ) | (35,473 | ) | ||||||||||||||||
|
|
|
|
|
|
|
|
|
|
|
|
|
|
|
| |||||||||||||||||
Year ended December 31, 2021 | ||||||||||||||||||||||||||||||||
Class 1 | $ | 213,039 | 17,786 | $ | 38,963 | 3,337 | $ | (115,497 | ) | (9,263 | ) | $ | 136,505 | 11,860 | ||||||||||||||||||
Class 1A | 4,388 | 354 | 518 | 44 | (3,192 | ) | (265 | ) | 1,714 | 133 | ||||||||||||||||||||||
Class 2 | 91,122 | 7,303 | 144,267 | 12,514 | (129,818 | ) | (10,810 | ) | 105,571 | 9,007 | ||||||||||||||||||||||
Class 3 | 1,023 | 86 | 948 | 81 | (1,549 | ) | (126 | ) | 422 | 41 | ||||||||||||||||||||||
Class 4 | 87,885 | 7,227 | 23,653 | 2,055 | (118,823 | ) | (9,719 | ) | (7,285 | ) | (437 | ) | ||||||||||||||||||||
|
|
|
|
|
|
|
|
|
|
|
|
|
|
|
| |||||||||||||||||
Total net increase (decrease) | $ | 397,457 | 32,756 | $ | 208,349 | 18,031 | $ | (368,879 | ) | (30,183 | ) | $ | 236,927 | 20,604 | ||||||||||||||||||
|
|
|
|
|
|
|
|
|
|
|
|
|
|
|
| |||||||||||||||||
Managed Risk Growth Fund
| Sales* | Reinvestments of distributions | Repurchases* | Net increase (decrease) | |||||||||||||||||||||||||||||
Share class | Amount | Shares | Amount | Shares | Amount | Shares | Amount | Shares | ||||||||||||||||||||||||
Year ended December 31, 2022 | ||||||||||||||||||||||||||||||||
Class P1 | $ | 1,679 | 122 | $ | 1,796 | 147 | $ | (2,034 | ) | (134 | ) | $ | 1,441 | 135 | ||||||||||||||||||
Class P2 | 37,760 | 2,684 | 88,450 | 7,291 | (30,630 | ) | (2,253 | ) | 95,580 | 7,722 | ||||||||||||||||||||||
|
|
|
|
|
|
|
|
|
|
|
|
|
|
|
| |||||||||||||||||
Total net increase (decrease) | $ | 39,439 | 2,806 | $ | 90,246 | 7,438 | $ | (32,664 | ) | (2,387 | ) | $ | 97,021 | 7,857 | ||||||||||||||||||
|
|
|
|
|
|
|
|
|
|
|
|
|
|
|
| |||||||||||||||||
Year ended December 31, 2021 | ||||||||||||||||||||||||||||||||
Class P1 | $ | 3,593 | 199 | $ | 515 | 30 | $ | (3,079 | ) | (172 | ) | $ | 1,029 | 57 | ||||||||||||||||||
Class P2 | 39,055 | 2,202 | 26,869 | 1,558 | (78,851 | ) | (4,405 | ) | (12,927 | ) | (645 | ) | ||||||||||||||||||||
|
|
|
|
|
|
|
|
|
|
|
|
|
|
|
| |||||||||||||||||
Total net increase (decrease) | $ | 42,648 | 2,401 | $ | 27,384 | 1,588 | $ | (81,930 | ) | (4,577 | ) | $ | (11,898 | ) | (588 | ) | ||||||||||||||||
|
|
|
|
|
|
|
|
|
|
|
|
|
|
|
| |||||||||||||||||
Refer to the end of the tables for footnotes.
American Funds Insurance Series 345
Table of Contents
Managed Risk International Fund
| Sales* | Reinvestments of distributions | Repurchases* | Net increase (decrease) | |||||||||||||||||||||||||||||
Share class | Amount | Shares | Amount | Shares | Amount | Shares | Amount | Shares | ||||||||||||||||||||||||
Year ended December 31, 2022 | ||||||||||||||||||||||||||||||||
Class P1 | $ | 578 | 62 | $ | 69 | 8 | $ | (323 | ) | (37 | ) | $ | 324 | 33 | ||||||||||||||||||
Class P2 | 5,403 | 564 | 4,206 | 470 | (15,947 | ) | (1,788 | ) | (6,338 | ) | (754 | ) | ||||||||||||||||||||
|
|
|
|
|
|
|
| �� |
|
|
|
|
|
|
| |||||||||||||||||
Total net increase (decrease) | $ | 5,981 | 626 | $ | 4,275 | 478 | $ | (16,270 | ) | (1,825 | ) | $ | (6,014 | ) | (721 | ) | ||||||||||||||||
|
|
|
|
|
|
|
|
|
|
|
|
|
|
|
| |||||||||||||||||
Year ended December 31, 2021 | ||||||||||||||||||||||||||||||||
Class P1 | $ | 887 | 80 | $ | 14 | 1 | $ | (531 | ) | (48 | ) | $ | 370 | 33 | ||||||||||||||||||
Class P2 | 12,803 | 1,181 | 917 | 80 | (14,744 | ) | (1,323 | ) | (1,024 | ) | (62 | ) | ||||||||||||||||||||
|
|
|
|
|
|
|
|
|
|
|
|
|
|
|
| |||||||||||||||||
Total net increase (decrease) | $ | 13,690 | 1,261 | $ | 931 | 81 | $ | (15,275 | ) | (1,371 | ) | $ | (654 | ) | (29 | ) | ||||||||||||||||
|
|
|
|
|
|
|
|
|
|
|
|
|
|
|
| |||||||||||||||||
Managed Risk Washington Mutual Investors Fund
| Sales* | Reinvestments of distributions | Repurchases* | Net increase (decrease) | |||||||||||||||||||||||||||||
Share class | Amount | Shares | Amount | Shares | Amount | Shares | Amount | Shares | ||||||||||||||||||||||||
Year ended December 31, 2022 | ||||||||||||||||||||||||||||||||
Class P1 | $ | 1,026 | 86 | $ | 127 | 11 | $ | (498 | ) | (43 | ) | $ | 655 | 54 | ||||||||||||||||||
Class P2 | 22,662 | 1,947 | 14,544 | 1,281 | (39,363 | ) | (3,307 | ) | (2,157 | ) | (79 | ) | ||||||||||||||||||||
|
|
|
|
|
|
|
|
|
|
|
|
|
|
|
| |||||||||||||||||
Total net increase (decrease) | $ | 23,688 | 2,033 | $ | 14,671 | 1,292 | $ | (39,861 | ) | (3,350 | ) | $ | (1,502 | ) | (25 | ) | ||||||||||||||||
|
|
|
|
|
|
|
|
|
|
|
|
|
|
|
| |||||||||||||||||
Year ended December 31, 2021 | ||||||||||||||||||||||||||||||||
Class P1 | $ | 971 | 80 | $ | 40 | 3 | $ | (343 | ) | (29 | ) | $ | 668 | 54 | ||||||||||||||||||
Class P2 | 9,743 | 800 | 5,979 | 487 | (51,273 | ) | (4,254 | ) | (35,551 | ) | (2,967 | ) | ||||||||||||||||||||
|
|
|
|
|
|
|
|
|
|
|
|
|
|
|
| |||||||||||||||||
Total net increase (decrease) | $ | 10,714 | 880 | $ | 6,019 | 490 | $ | (51,616 | ) | (4,283 | ) | $ | (34,883 | ) | (2,913 | ) | ||||||||||||||||
|
|
|
|
|
|
|
|
|
|
|
|
|
|
|
| |||||||||||||||||
Managed Risk Growth-Income Fund
| Sales* | Reinvestments of distributions | Repurchases* | Net decrease | |||||||||||||||||||||||||||||
Share class | Amount | Shares | Amount | Shares | Amount | Shares | Amount | Shares | ||||||||||||||||||||||||
Year ended December 31, 2022 | ||||||||||||||||||||||||||||||||
Class P1 | $ | 49,558 | 3,678 | $ | 87,716 | 6,731 | $ | (157,932 | ) | (11,880 | ) | $ | (20,658 | ) | (1,471 | ) | ||||||||||||||||
Class P2 | 13,539 | 1,010 | 12,087 | 932 | (28,848 | ) | (2,135 | ) | (3,222 | ) | (193 | ) | ||||||||||||||||||||
|
|
|
|
|
|
|
|
|
|
|
|
|
|
|
| |||||||||||||||||
Total net increase (decrease) | $ | 63,097 | 4,688 | $ | 99,803 | 7,663 | $ | (186,780 | ) | (14,015 | ) | $ | (23,880 | ) | (1,664 | ) | ||||||||||||||||
|
|
|
|
|
|
|
|
|
|
|
|
|
|
|
| |||||||||||||||||
Year ended December 31, 2021 | ||||||||||||||||||||||||||||||||
Class P1 | $ | 64,192 | 4,303 | $ | 60,096 | 4,023 | $ | (175,764 | ) | (11,680 | ) | $ | (51,476 | ) | (3,354 | ) | ||||||||||||||||
Class P2 | 14,838 | 1,008 | 8,072 | 546 | (35,819 | ) | (2,404 | ) | (12,909 | ) | (850 | ) | ||||||||||||||||||||
|
|
|
|
|
|
|
|
|
|
|
|
|
|
|
| |||||||||||||||||
Total net increase (decrease) | $ | 79,030 | 5,311 | $ | 68,168 | 4,569 | $ | (211,583 | ) | (14,084 | ) | $ | (64,385 | ) | (4,204 | ) | ||||||||||||||||
|
|
|
|
|
|
|
|
|
|
|
|
|
|
|
| |||||||||||||||||
Refer to the end of the tables for footnotes.
346 American Funds Insurance Series
Table of Contents
Managed Risk Asset Allocation Fund
| Sales* | Reinvestments of distributions | Repurchases* | Net increase (decrease) | |||||||||||||||||||||||||||||
Share class | Amount | Shares | Amount | Shares | Amount | Shares | Amount | Shares | ||||||||||||||||||||||||
Year ended December 31, 2022 | ||||||||||||||||||||||||||||||||
Class P1 | $ | 1,649 | 120 | $ | 430 | 34 | $ | (675 | ) | (52 | ) | $ | 1,404 | 102 | ||||||||||||||||||
Class P2 | 38,665 | 2,998 | 138,534 | 11,152 | (283,108 | ) | (22,026 | ) | (105,909 | ) | (7,876 | ) | ||||||||||||||||||||
|
|
|
|
|
|
|
|
|
|
|
|
|
|
|
| |||||||||||||||||
Total net increase (decrease) | $ | 40,314 | 3,118 | $ | 138,964 | 11,186 | $ | (283,783 | ) | (22,078 | ) | $ | (104,505 | ) | (7,774 | ) | ||||||||||||||||
|
|
|
|
|
|
|
|
|
|
|
|
|
|
|
| |||||||||||||||||
Year ended December 31, 2021 | ||||||||||||||||||||||||||||||||
Class P1 | $ | 2,097 | 141 | $ | 114 | 8 | $ | (899 | ) | (60 | ) | $ | 1,312 | 89 | ||||||||||||||||||
Class P2 | 57,616 | 4,016 | 38,113 | 2,632 | (351,072 | ) | (24,507 | ) | (255,343 | ) | (17,859 | ) | ||||||||||||||||||||
|
|
|
|
|
|
|
|
|
|
|
|
|
|
|
| |||||||||||||||||
Total net increase (decrease) | $ | 59,713 | 4,157 | $ | 38,227 | 2,640 | $ | (351,971 | ) | (24,567 | ) | $ | (254,031 | ) | (17,770 | ) | ||||||||||||||||
|
|
|
|
|
|
|
|
|
|
|
|
|
|
|
| |||||||||||||||||
| * | Includes exchanges between share classes of the fund. |
| † | Amount less than one thousand. |
11. Ownership concentration
At December 31, 2022, American Funds Insurance Series - Portfolio Series - Managed Risk Growth and Income Portfolio held 18% and 17% of the outstanding shares of American Funds Insurance Series - Capital World Growth and Income Fund and American Funds Insurance Series - Capital Income Builder, respectively. In addition, American Funds Insurance Series - Portfolio Series - Managed Risk Global Allocation Portfolio held 25% of the outstanding shares of American Funds Insurance Series - American Funds Global Balanced Fund.
12. Investment transactions and other disclosures
The following tables present additional information for each fund for the year ended December 31, 2022 (dollars in thousands):
| Global Growth Fund | Global Small Capitalization Fund | Growth Fund | International Fund | New World Fund | Washington Mutual Investors Fund | |||||||||||||||||||
Purchases of investment securities* | $ | 2,020,468 | $ | 1,224,731 | $ | 10,017,065 | $ | 2,810,699 | $ | 1,260,720 | $ | 2,833,147 | ||||||||||||
Sales of investment securities* | 2,146,215 | 1,218,842 | 10,662,318 | 2,867,081 | 1,624,730 | 3,802,409 | ||||||||||||||||||
Non-U.S. taxes paid on dividend income | 6,202 | 2,117 | 9,817 | 9,312 | 3,655 | 1,964 | ||||||||||||||||||
Non-U.S. taxes paid on interest income | — | — | — | — | 5 | — | ||||||||||||||||||
Non-U.S. taxes paid on realized gains | 1,408 | 5,338 | — | 8,023 | 4,440 | — | ||||||||||||||||||
Non-U.S. taxes provided on unrealized appreciation | 5,103 | 9,184 | — | 25,364 | 8,906 | — | ||||||||||||||||||
| Capital World Growth and Income Fund | Growth- Income Fund | International Growth and Income Fund | Capital Income Builder | Asset Allocation Fund | American Funds Global Balanced Fund | |||||||||||||||||||
Purchases of investment securities* | $ | 749,437 | $ | 8,339,283 | $ | 142,556 | $ | 1,242,326 | $ | 27,267,262 | $ | 392,565 | ||||||||||||
Sales of investment securities* | 985,479 | 12,308,349 | 139,199 | 1,167,109 | 28,617,726 | 407,112 | ||||||||||||||||||
Non-U.S. taxes paid on dividend income | 2,593 | 9,673 | 744 | 1,500 | 9,616 | 372 | ||||||||||||||||||
Non-U.S. taxes paid on interest income | — | — | — | — | — | 11 | ||||||||||||||||||
Non-U.S. taxes paid on realized gains | 173 | — | † | 51 | 46 | — | 43 | |||||||||||||||||
Non-U.S. taxes provided on unrealized appreciation | 568 | — | 58 | 349 | 2,592 | 83 | ||||||||||||||||||
Refer to the end of the tables for footnotes.
American Funds Insurance Series 347
Table of Contents
| The Bond Fund of America | Capital World Bond Fund | American High-Income Trust | American Funds Mortgage Fund | Ultra-Short Bond Fund | U.S. Government Securities Fund | |||||||||||||||||||
Purchases of investment securities* | $ | 38,975,446 | $ | 1,910,865 | $ | 293,093 | $ | 1,134,922 | $ | — | $ | 9,478,478 | ||||||||||||
Sales of investment securities* | 37,928,493 | 2,233,596 | 378,913 | 1,243,904 | — | 9,100,700 | ||||||||||||||||||
Non-U.S. taxes paid on interest income | 22 | 135 | — | — | — | — | ||||||||||||||||||
Non-U.S. taxes paid on realized gains | — | 333 | — | — | — | — | ||||||||||||||||||
Non-U.S. taxes provided on unrealized appreciation | — | 117 | — | — | — | — | ||||||||||||||||||
| Managed Risk Growth Fund | Managed Risk International Fund | Managed Risk Washington Mutual Investors Fund | Managed Risk Growth- Income Fund | Managed Risk Asset Allocation Fund | ||||||||||||||||
Purchases of investment securities* | $ | 528,842 | $ | 121,812 | $ | 269,212 | $ | 1,486,050 | $ | 1,104,342 | ||||||||||
Sales of investment securities* | 453,254 | 107,992 | 219,710 | 1,431,021 | 1,086,607 | |||||||||||||||
| * | Excludes short-term securities and U.S. government obligations, if any. |
| † | Amount less than one thousand. |
348 American Funds Insurance Series
Table of Contents
Financial highlights
| (Loss) income from investment operations1 | Dividends and distributions | |||||||||||||||||||||||||||||||||||||||||||||||||||
| Year ended | Net asset value, beginning of year | Net investment income | Net (losses) gains on securities (both realized and unrealized) | Total from investment operations | Dividends (from net investment income) | Distributions (from capital gains) | Total dividends and distributions | Net asset value, end of year | Total return2 | Net assets, end of year (in millions) | Ratio of expenses to average net assets before waivers3 | Ratio of expenses to average net assets after waivers2,3 | Ratio of net income to average net assets2 | |||||||||||||||||||||||||||||||||||||||
Global Growth Fund |
| |||||||||||||||||||||||||||||||||||||||||||||||||||
Class 1: | ||||||||||||||||||||||||||||||||||||||||||||||||||||
12/31/2022 | $ | 45.46 | $ | .34 | $ | (11.34 | ) | $ | (11.00 | ) | $ | (.31 | ) | $ | (3.97 | ) | $ | (4.28 | ) | $ | 30.18 | (24.54 | )% | $ | 3,104 | .53 | % | .46 | % | 1.01 | % | |||||||||||||||||||||
12/31/2021 | 41.16 | .25 | 6.48 | 6.73 | (.26 | ) | (2.17 | ) | (2.43 | ) | 45.46 | 16.72 | 4,270 | .55 | .54 | .56 | ||||||||||||||||||||||||||||||||||||
12/31/2020 | 32.57 | .20 | 9.56 | 9.76 | (.21 | ) | (.96 | ) | (1.17 | ) | 41.16 | 30.79 | 3,309 | .56 | .56 | .59 | ||||||||||||||||||||||||||||||||||||
12/31/2019 | 25.74 | .32 | 8.60 | 8.92 | (.41 | ) | (1.68 | ) | (2.09 | ) | 32.57 | 35.61 | 2,515 | .56 | .56 | 1.07 | ||||||||||||||||||||||||||||||||||||
12/31/2018 | 30.51 | .29 | (2.65 | ) | (2.36 | ) | (.28 | ) | (2.13 | ) | (2.41 | ) | 25.74 | (8.81 | ) | 1,942 | .55 | .55 | .98 | |||||||||||||||||||||||||||||||||
Class 1A: | ||||||||||||||||||||||||||||||||||||||||||||||||||||
12/31/2022 | 45.28 | .26 | (11.31 | ) | (11.05 | ) | (.22 | ) | (3.97 | ) | (4.19 | ) | 30.04 | (24.73 | ) | 14 | .78 | .71 | .78 | |||||||||||||||||||||||||||||||||
12/31/2021 | 41.02 | .14 | 6.46 | 6.60 | (.17 | ) | (2.17 | ) | (2.34 | ) | 45.28 | 16.45 | 18 | .80 | .79 | .33 | ||||||||||||||||||||||||||||||||||||
12/31/2020 | 32.47 | .12 | 9.52 | 9.64 | (.13 | ) | (.96 | ) | (1.09 | ) | 41.02 | 30.49 | 12 | .81 | .81 | .34 | ||||||||||||||||||||||||||||||||||||
12/31/2019 | 25.69 | .25 | 8.55 | 8.80 | (.34 | ) | (1.68 | ) | (2.02 | ) | 32.47 | 35.22 | 8 | .81 | .81 | .83 | ||||||||||||||||||||||||||||||||||||
12/31/2018 | 30.46 | .23 | (2.66 | ) | (2.43 | ) | (.21 | ) | (2.13 | ) | (2.34 | ) | 25.69 | (9.02 | ) | 5 | .80 | .80 | .77 | |||||||||||||||||||||||||||||||||
Class 2: | ||||||||||||||||||||||||||||||||||||||||||||||||||||
12/31/2022 | 44.94 | .25 | (11.21 | ) | (10.96 | ) | (.22 | ) | (3.97 | ) | (4.19 | ) | 29.79 | (24.74 | ) | 3,234 | .78 | .71 | .76 | |||||||||||||||||||||||||||||||||
12/31/2021 | 40.72 | .13 | 6.41 | 6.54 | (.15 | ) | (2.17 | ) | (2.32 | ) | 44.94 | 16.42 | 4,559 | .80 | .80 | .30 | ||||||||||||||||||||||||||||||||||||
12/31/2020 | 32.24 | .12 | 9.44 | 9.56 | (.12 | ) | (.96 | ) | (1.08 | ) | 40.72 | 30.47 | 4,387 | .81 | .81 | .34 | ||||||||||||||||||||||||||||||||||||
12/31/2019 | 25.50 | .24 | 8.51 | 8.75 | (.33 | ) | (1.68 | ) | (2.01 | ) | 32.24 | 35.28 | 3,895 | .81 | .81 | .83 | ||||||||||||||||||||||||||||||||||||
12/31/2018 | 30.24 | .22 | (2.63 | ) | (2.41 | ) | (.20 | ) | (2.13 | ) | (2.33 | ) | 25.50 | (9.04 | ) | 3,306 | .80 | .80 | .73 | |||||||||||||||||||||||||||||||||
Class 4: | ||||||||||||||||||||||||||||||||||||||||||||||||||||
12/31/2022 | 44.57 | .17 | (11.12 | ) | (10.95 | ) | (.14 | ) | (3.97 | ) | (4.11 | ) | 29.51 | (24.92 | ) | 584 | 1.03 | .96 | .52 | |||||||||||||||||||||||||||||||||
12/31/2021 | 40.45 | .03 | 6.35 | 6.38 | (.09 | ) | (2.17 | ) | (2.26 | ) | 44.57 | 16.14 | 744 | 1.05 | 1.04 | .07 | ||||||||||||||||||||||||||||||||||||
12/31/2020 | 32.05 | .03 | 9.38 | 9.41 | (.05 | ) | (.96 | ) | (1.01 | ) | 40.45 | 30.17 | 533 | 1.06 | 1.06 | .09 | ||||||||||||||||||||||||||||||||||||
12/31/2019 | 25.39 | .17 | 8.45 | 8.62 | (.28 | ) | (1.68 | ) | (1.96 | ) | 32.05 | 34.87 | 382 | 1.06 | 1.06 | .57 | ||||||||||||||||||||||||||||||||||||
12/31/2018 | 30.13 | .14 | (2.60 | ) | (2.46 | ) | (.15 | ) | (2.13 | ) | (2.28 | ) | 25.39 | (9.24 | ) | 249 | 1.05 | 1.05 | .47 | |||||||||||||||||||||||||||||||||
Refer to the end of the tables for footnotes.
American Funds Insurance Series 349
Table of Contents
Financial highlights (continued)
| (Loss) income from investment operations1 | Dividends and distributions | |||||||||||||||||||||||||||||||||||||||||||||||||||
| Year ended | Net asset value, beginning of year | Net investment income (loss) | Net (losses) gains on securities (both realized and unrealized) | Total from investment operations | Dividends (from net investment income) | Distributions (from capital gains) | Total dividends and distributions | Net asset value, end of year | Total return2 | Net assets, end of year (in millions) | Ratio of expenses to waivers3 | Ratio of expenses to assets after waivers2,3 | Ratio of net income (loss) to average net assets2 | |||||||||||||||||||||||||||||||||||||||
Global Small Capitalization Fund |
| |||||||||||||||||||||||||||||||||||||||||||||||||||
Class 1: | ||||||||||||||||||||||||||||||||||||||||||||||||||||
12/31/2022 | $ | 34.17 | $ | .05 | $ | (9.50 | ) | $ | (9.45 | ) | $ | — | $ | (8.50 | ) | $ | (8.50 | ) | $ | 16.22 | (29.37 | )% | $ | 916 | .72 | % | .69 | % | .24 | % | ||||||||||||||||||||||
12/31/2021 | 32.64 | (.02 | ) | 2.32 | 2.30 | — | (.77 | ) | (.77 | ) | 34.17 | 6.98 | 1,707 | .74 | .74 | (.07 | ) | |||||||||||||||||||||||||||||||||||
12/31/2020 | 26.80 | (.01 | ) | 7.49 | 7.48 | (.05 | ) | (1.59 | ) | (1.64 | ) | 32.64 | 30.04 | 2,391 | .75 | .75 | (.06 | ) | ||||||||||||||||||||||||||||||||||
12/31/2019 | 21.75 | .12 | 6.61 | 6.73 | (.10 | ) | (1.58 | ) | (1.68 | ) | 26.80 | 31.84 | 2,050 | .75 | .75 | .48 | ||||||||||||||||||||||||||||||||||||
12/31/2018 | 25.38 | .11 | (2.51 | ) | (2.40 | ) | (.09 | ) | (1.14 | ) | (1.23 | ) | 21.75 | (10.31 | ) | 1,453 | .73 | .73 | .42 | |||||||||||||||||||||||||||||||||
Class 1A: | ||||||||||||||||||||||||||||||||||||||||||||||||||||
12/31/2022 | 33.93 | — | 4 | (9.43 | ) | (9.43 | ) | — | (8.50 | ) | (8.50 | ) | 16.00 | (29.54 | ) | 4 | .97 | .94 | — | 5 | ||||||||||||||||||||||||||||||||
12/31/2021 | 32.49 | (.07 | ) | 2.28 | 2.21 | — | (.77 | ) | (.77 | ) | 33.93 | 6.73 | 5 | .99 | .99 | (.21 | ) | |||||||||||||||||||||||||||||||||||
12/31/2020 | 26.74 | (.09 | ) | 7.48 | 7.39 | (.05 | ) | (1.59 | ) | (1.64 | ) | 32.49 | 29.72 | 1 | .99 | .99 | (.33 | ) | ||||||||||||||||||||||||||||||||||
12/31/2019 | 21.71 | .05 | 6.61 | 6.66 | (.05 | ) | (1.58 | ) | (1.63 | ) | 26.74 | 31.56 | 1 | .99 | .99 | .22 | ||||||||||||||||||||||||||||||||||||
12/31/2018 | 25.36 | .05 | (2.52 | ) | (2.47 | ) | (.04 | ) | (1.14 | ) | (1.18 | ) | 21.71 | (10.56 | ) | — | 6 | .98 | .98 | .21 | ||||||||||||||||||||||||||||||||
Class 2: | ||||||||||||||||||||||||||||||||||||||||||||||||||||
12/31/2022 | 32.94 | — | 4 | (9.14 | ) | (9.14 | ) | — | (8.50 | ) | (8.50 | ) | 15.30 | (29.55 | ) | 1,762 | .97 | .94 | — | 5 | ||||||||||||||||||||||||||||||||
12/31/2021 | 31.56 | (.10 | ) | 2.25 | 2.15 | — | (.77 | ) | (.77 | ) | 32.94 | 6.74 | 2,521 | .99 | .99 | (.30 | ) | |||||||||||||||||||||||||||||||||||
12/31/2020 | 26.02 | (.08 | ) | 7.25 | 7.17 | (.04 | ) | (1.59 | ) | (1.63 | ) | 31.56 | 29.72 | 2,653 | 1.00 | 1.00 | (.31 | ) | ||||||||||||||||||||||||||||||||||
12/31/2019 | 21.16 | .05 | 6.43 | 6.48 | (.04 | ) | (1.58 | ) | (1.62 | ) | 26.02 | 31.52 | 2,363 | 1.00 | 1.00 | .22 | ||||||||||||||||||||||||||||||||||||
12/31/2018 | 24.72 | .04 | (2.44 | ) | (2.40 | ) | (.02 | ) | (1.14 | ) | (1.16 | ) | 21.16 | (10.55 | ) | 2,056 | .98 | .98 | .17 | |||||||||||||||||||||||||||||||||
Class 4: | ||||||||||||||||||||||||||||||||||||||||||||||||||||
12/31/2022 | 32.96 | (.05 | ) | (9.13 | ) | (9.18 | ) | — | (8.50 | ) | (8.50 | ) | 15.28 | (29.69 | ) | 261 | 1.22 | 1.19 | (.25 | ) | ||||||||||||||||||||||||||||||||
12/31/2021 | 31.67 | (.18 | ) | 2.24 | 2.06 | — | (.77 | ) | (.77 | ) | 32.96 | 6.43 | 344 | 1.24 | 1.24 | (.53 | ) | |||||||||||||||||||||||||||||||||||
12/31/2020 | 26.16 | (.14 | ) | 7.27 | 7.13 | (.03 | ) | (1.59 | ) | (1.62 | ) | 31.67 | 29.39 | 268 | 1.25 | 1.25 | (.56 | ) | ||||||||||||||||||||||||||||||||||
12/31/2019 | 21.28 | (.01 | ) | 6.47 | 6.46 | — | 4 | (1.58 | ) | (1.58 | ) | 26.16 | 31.24 | 206 | 1.25 | 1.25 | (.04 | ) | ||||||||||||||||||||||||||||||||||
12/31/2018 | 24.91 | (.02 | ) | (2.46 | ) | (2.48 | ) | (.01 | ) | (1.14 | ) | (1.15 | ) | 21.28 | (10.80 | ) | 146 | 1.24 | 1.24 | (.08 | ) | |||||||||||||||||||||||||||||||
Refer to the end of the tables for footnotes.
350 American Funds Insurance Series
Table of Contents
Financial highlights (continued)
| (Loss) income from investment operations1 | Dividends and distributions | |||||||||||||||||||||||||||||||||||||||||||||||
| Year ended | Net asset value, beginning of year | Net investment income (loss) | Net (losses) gains on securities (both realized and unrealized) | Total from investment operations | Dividends (from net investment income) | Distributions (from capital gains) | Total dividends and distributions | Net asset value, end of year | Total return | Net assets, end of year (in millions) | Ratio of expenses to average net assets3 | Ratio of net income (loss) to average net assets | ||||||||||||||||||||||||||||||||||||
Growth Fund | ||||||||||||||||||||||||||||||||||||||||||||||||
Class 1: | ||||||||||||||||||||||||||||||||||||||||||||||||
12/31/2022 | $ | 127.58 | $ | .58 | $ | (37.03 | ) | $ | (36.45 | ) | $ | (.53 | ) | $ | (14.31 | ) | $ | (14.84 | ) | $ | 76.29 | (29.75 | )% | $ | 13,660 | .35 | % | .64 | % | |||||||||||||||||||
12/31/2021 | 120.22 | .46 | 24.29 | 24.75 | (.58 | ) | (16.81 | ) | (17.39 | ) | 127.58 | 22.30 | 19,783 | .34 | .37 | |||||||||||||||||||||||||||||||||
12/31/2020 | 81.22 | .43 | 41.28 | 41.71 | (.53 | ) | (2.18 | ) | (2.71 | ) | 120.22 | 52.45 | 15,644 | .35 | .46 | |||||||||||||||||||||||||||||||||
12/31/2019 | 69.96 | .83 | 19.63 | 20.46 | (.76 | ) | (8.44 | ) | (9.20 | ) | 81.22 | 31.11 | 10,841 | .35 | 1.09 | |||||||||||||||||||||||||||||||||
12/31/2018 | 77.85 | .64 | .25 | .89 | (.54 | ) | (8.24 | ) | (8.78 | ) | 69.96 | (.01 | ) | 8,474 | .34 | .81 | ||||||||||||||||||||||||||||||||
Class 1A: | ||||||||||||||||||||||||||||||||||||||||||||||||
12/31/2022 | 126.70 | .39 | (36.79 | ) | (36.40 | ) | (.38 | ) | (14.31 | ) | (14.69 | ) | 75.61 | (29.93 | ) | 187 | .60 | .45 | ||||||||||||||||||||||||||||||
12/31/2021 | 119.59 | .16 | 24.11 | 24.27 | (.35 | ) | (16.81 | ) | (17.16 | ) | 126.70 | 21.97 | 121 | .59 | .13 | |||||||||||||||||||||||||||||||||
12/31/2020 | 80.92 | .20 | 41.05 | 41.25 | (.40 | ) | (2.18 | ) | (2.58 | ) | 119.59 | 52.07 | 60 | .60 | .21 | |||||||||||||||||||||||||||||||||
12/31/2019 | 69.77 | .65 | 19.55 | 20.20 | (.61 | ) | (8.44 | ) | (9.05 | ) | 80.92 | 30.79 | 18 | .60 | .85 | |||||||||||||||||||||||||||||||||
12/31/2018 | 77.74 | .47 | .24 | .71 | (.44 | ) | (8.24 | ) | (8.68 | ) | 69.77 | (.26 | ) | 10 | .59 | .60 | ||||||||||||||||||||||||||||||||
Class 2: | ||||||||||||||||||||||||||||||||||||||||||||||||
12/31/2022 | 126.28 | .35 | (36.62 | ) | (36.27 | ) | (.29 | ) | (14.31 | ) | (14.60 | ) | 75.41 | (29.94 | ) | 14,452 | .60 | .38 | ||||||||||||||||||||||||||||||
12/31/2021 | 119.18 | .15 | 24.03 | 24.18 | (.27 | ) | (16.81 | ) | (17.08 | ) | 126.28 | 21.97 | 21,986 | .59 | .12 | |||||||||||||||||||||||||||||||||
12/31/2020 | 80.57 | .19 | 40.89 | 41.08 | (.29 | ) | (2.18 | ) | (2.47 | ) | 119.18 | 52.10 | 20,594 | .60 | .21 | |||||||||||||||||||||||||||||||||
12/31/2019 | 69.48 | .63 | 19.47 | 20.10 | (.57 | ) | (8.44 | ) | (9.01 | ) | 80.57 | 30.77 | 15,885 | .60 | .83 | |||||||||||||||||||||||||||||||||
12/31/2018 | 77.35 | .44 | .27 | .71 | (.34 | ) | (8.24 | ) | (8.58 | ) | 69.48 | (.25 | ) | 13,701 | .59 | .55 | ||||||||||||||||||||||||||||||||
Class 3: | ||||||||||||||||||||||||||||||||||||||||||||||||
12/31/2022 | 128.68 | .42 | (37.35 | ) | (36.93 | ) | (.35 | ) | (14.31 | ) | (14.66 | ) | 77.09 | (29.89 | ) | 188 | .53 | .45 | ||||||||||||||||||||||||||||||
12/31/2021 | 121.13 | .24 | 24.47 | 24.71 | (.35 | ) | (16.81 | ) | (17.16 | ) | 128.68 | 22.07 | 302 | .52 | .19 | |||||||||||||||||||||||||||||||||
12/31/2020 | 81.84 | .26 | 41.56 | 41.82 | (.35 | ) | (2.18 | ) | (2.53 | ) | 121.13 | 52.20 | 279 | .53 | .28 | |||||||||||||||||||||||||||||||||
12/31/2019 | 70.44 | .69 | 19.77 | 20.46 | (.62 | ) | (8.44 | ) | (9.06 | ) | 81.84 | 30.86 | 213 | .53 | .90 | |||||||||||||||||||||||||||||||||
12/31/2018 | 78.32 | .50 | .26 | .76 | (.40 | ) | (8.24 | ) | (8.64 | ) | 70.44 | (.18 | ) | 187 | .52 | .62 | ||||||||||||||||||||||||||||||||
Class 4: | ||||||||||||||||||||||||||||||||||||||||||||||||
12/31/2022 | 123.79 | .12 | (35.87 | ) | (35.75 | ) | (.09 | ) | (14.31 | ) | (14.40 | ) | 73.64 | (30.11 | ) | 2,409 | .85 | .14 | ||||||||||||||||||||||||||||||
12/31/2021 | 117.24 | (.15 | ) | 23.59 | 23.44 | (.08 | ) | (16.81 | ) | (16.89 | ) | 123.79 | 21.69 | 3,214 | .84 | (.13 | ) | |||||||||||||||||||||||||||||||
12/31/2020 | 79.41 | (.04 | ) | 40.24 | 40.20 | (.19 | ) | (2.18 | ) | (2.37 | ) | 117.24 | 51.71 | 2,347 | .85 | (.04 | ) | |||||||||||||||||||||||||||||||
12/31/2019 | 68.64 | .44 | 19.19 | 19.63 | (.42 | ) | (8.44 | ) | (8.86 | ) | 79.41 | 30.44 | 1,513 | .85 | .59 | |||||||||||||||||||||||||||||||||
12/31/2018 | 76.56 | .24 | .28 | .52 | (.20 | ) | (8.24 | ) | (8.44 | ) | 68.64 | (.50 | ) | 1,076 | .84 | .31 | ||||||||||||||||||||||||||||||||
Refer to the end of the tables for footnotes.
American Funds Insurance Series 351
Table of Contents
Financial highlights (continued)
| (Loss) income from investment operations1 | Dividends and distributions | |||||||||||||||||||||||||||||||||||||||||||||||
| Year ended | Net asset value, beginning of year | Net investment income | Net (losses) gains on securities (both realized and unrealized) | Total from investment operations | Dividends (from net investment income) | Distributions (from capital gains) | Total dividends and distributions | Net asset value, end of year | Total return | Net assets, end of year (in millions) | Ratio of expenses to average net assets3 | Ratio of net income to average net assets | ||||||||||||||||||||||||||||||||||||
International Fund |
| |||||||||||||||||||||||||||||||||||||||||||||||
Class 1: | ||||||||||||||||||||||||||||||||||||||||||||||||
12/31/2022 | $ | 22.70 | $ | .34 | $ | (4.79 | ) | $ | (4.45 | ) | $ | (.34 | ) | $ | (2.60 | ) | $ | (2.94 | ) | $ | 15.31 | (20.57 | )% | $ | 3,157 | .54 | % | 1.95 | % | |||||||||||||||||||
12/31/2021 | 23.64 | .38 | (.67 | ) | (.29 | ) | (.65 | ) | — | (.65 | ) | 22.70 | (1.23 | ) | 4,747 | .55 | 1.57 | |||||||||||||||||||||||||||||||
12/31/2020 | 20.86 | .14 | 2.82 | 2.96 | (.18 | ) | — | (.18 | ) | 23.64 | 14.28 | 5,652 | .55 | .71 | ||||||||||||||||||||||||||||||||||
12/31/2019 | 17.66 | .30 | 3.74 | 4.04 | (.34 | ) | (.50 | ) | (.84 | ) | 20.86 | 23.21 | 5,353 | .54 | 1.54 | |||||||||||||||||||||||||||||||||
12/31/2018 | 21.71 | .34 | (2.97 | ) | (2.63 | ) | (.40 | ) | (1.02 | ) | (1.42 | ) | 17.66 | (12.94 | ) | 4,811 | .53 | 1.62 | ||||||||||||||||||||||||||||||
Class 1A: | ||||||||||||||||||||||||||||||||||||||||||||||||
12/31/2022 | 22.61 | .30 | (4.78 | ) | (4.48 | ) | (.30 | ) | (2.60 | ) | (2.90 | ) | 15.23 | (20.80 | ) | 10 | .79 | 1.73 | ||||||||||||||||||||||||||||||
12/31/2021 | 23.55 | .33 | (.67 | ) | (.34 | ) | (.60 | ) | — | (.60 | ) | 22.61 | (1.47 | ) | 12 | .80 | 1.39 | |||||||||||||||||||||||||||||||
12/31/2020 | 20.80 | .08 | 2.81 | 2.89 | (.14 | ) | — | (.14 | ) | 23.55 | 13.96 | 10 | .80 | .43 | ||||||||||||||||||||||||||||||||||
12/31/2019 | 17.62 | .25 | 3.72 | 3.97 | (.29 | ) | (.50 | ) | (.79 | ) | 20.80 | 22.90 | 7 | .79 | 1.27 | |||||||||||||||||||||||||||||||||
12/31/2018 | 21.67 | .27 | (2.93 | ) | (2.66 | ) | (.37 | ) | (1.02 | ) | (1.39 | ) | 17.62 | (13.11 | ) | 5 | .78 | 1.32 | ||||||||||||||||||||||||||||||
Class 2: | ||||||||||||||||||||||||||||||||||||||||||||||||
12/31/2022 | 22.60 | .29 | (4.76 | ) | (4.47 | ) | (.30 | ) | (2.60 | ) | (2.90 | ) | 15.23 | (20.79 | ) | 3,164 | .79 | 1.71 | ||||||||||||||||||||||||||||||
12/31/2021 | 23.54 | .33 | (.68 | ) | (.35 | ) | (.59 | ) | — | (.59 | ) | 22.60 | (1.49 | ) | 4,190 | .80 | 1.35 | |||||||||||||||||||||||||||||||
12/31/2020 | 20.78 | .09 | 2.80 | 2.89 | (.13 | ) | — | (.13 | ) | 23.54 | 13.97 | 4,481 | .80 | .46 | ||||||||||||||||||||||||||||||||||
12/31/2019 | 17.60 | .25 | 3.72 | 3.97 | (.29 | ) | (.50 | ) | (.79 | ) | 20.78 | 22.88 | 4,311 | .79 | 1.29 | |||||||||||||||||||||||||||||||||
12/31/2018 | 21.63 | .29 | (2.95 | ) | (2.66 | ) | (.35 | ) | (1.02 | ) | (1.37 | ) | 17.60 | (13.13 | ) | 3,875 | .78 | 1.40 | ||||||||||||||||||||||||||||||
Class 3: | ||||||||||||||||||||||||||||||||||||||||||||||||
12/31/2022 | 22.76 | .31 | (4.81 | ) | (4.50 | ) | (.31 | ) | (2.60 | ) | (2.91 | ) | 15.35 | (20.76 | ) | 16 | .72 | 1.78 | ||||||||||||||||||||||||||||||
12/31/2021 | 23.69 | .34 | (.67 | ) | (.33 | ) | (.60 | ) | — | (.60 | ) | 22.76 | (1.39 | ) | 21 | .73 | 1.41 | |||||||||||||||||||||||||||||||
12/31/2020 | 20.92 | .10 | 2.81 | 2.91 | (.14 | ) | — | (.14 | ) | 23.69 | 14.00 | 25 | .73 | .53 | ||||||||||||||||||||||||||||||||||
12/31/2019 | 17.70 | .27 | 3.75 | 4.02 | (.30 | ) | (.50 | ) | (.80 | ) | 20.92 | 23.05 | 25 | .72 | 1.37 | |||||||||||||||||||||||||||||||||
12/31/2018 | 21.75 | .31 | (2.98 | ) | (2.67 | ) | (.36 | ) | (1.02 | ) | (1.38 | ) | 17.70 | (13.10 | ) | 24 | .71 | 1.48 | ||||||||||||||||||||||||||||||
Class 4: | ||||||||||||||||||||||||||||||||||||||||||||||||
12/31/2022 | 22.31 | .25 | (4.71 | ) | (4.46 | ) | (.26 | ) | (2.60 | ) | (2.86 | ) | 14.99 | (21.02 | ) | 373 | 1.04 | 1.47 | ||||||||||||||||||||||||||||||
12/31/2021 | 23.25 | .27 | (.67 | ) | (.40 | ) | (.54 | ) | — | (.54 | ) | 22.31 | (1.71 | ) | 459 | 1.05 | 1.13 | |||||||||||||||||||||||||||||||
12/31/2020 | 20.54 | .04 | 2.76 | 2.80 | (.09 | ) | — | (.09 | ) | 23.25 | 13.66 | 423 | 1.05 | .21 | ||||||||||||||||||||||||||||||||||
12/31/2019 | 17.40 | .20 | 3.69 | 3.89 | (.25 | ) | (.50 | ) | (.75 | ) | 20.54 | 22.67 | 379 | 1.04 | 1.03 | |||||||||||||||||||||||||||||||||
12/31/2018 | 21.42 | .23 | (2.93 | ) | (2.70 | ) | (.30 | ) | (1.02 | ) | (1.32 | ) | 17.40 | (13.41 | ) | 295 | 1.03 | 1.13 | ||||||||||||||||||||||||||||||
Refer to the end of the tables for footnotes.
352 American Funds Insurance Series
Table of Contents
Financial highlights (continued)
| (Loss) income from investment operations1 | Dividends and distributions | |||||||||||||||||||||||||||||||||||||||||||||||||||
| Year ended | Net asset value, beginning of year | Net investment income | Net (losses) gains on securities (both realized and unrealized) | Total from investment operations | Dividends (from net investment income) | Distributions (from capital gains) | Total dividends and distributions | Net asset value, end of year | Total return2 | Net assets, end of year (in millions) | Ratio of expenses to average net assets before waivers3 | Ratio of expenses to average net assets after waivers2,3 | Ratio of net income to average net assets2 | |||||||||||||||||||||||||||||||||||||||
New World Fund |
| |||||||||||||||||||||||||||||||||||||||||||||||||||
Class 1: | ||||||||||||||||||||||||||||||||||||||||||||||||||||
12/31/2022 | $ | 31.83 | $ | .37 | $ | (7.17 | ) | $ | (6.80 | ) | $ | (.39 | ) | $ | (2.34 | ) | $ | (2.73 | ) | $ | 22.30 | (21.86 | )% | $ | 1,610 | .68 | % | .57 | % | 1.48 | % | |||||||||||||||||||||
12/31/2021 | 31.59 | .29 | 1.38 | 1.67 | (.36 | ) | (1.07 | ) | (1.43 | ) | 31.83 | 5.16 | 2,443 | .74 | .56 | .88 | ||||||||||||||||||||||||||||||||||||
12/31/2020 | 25.84 | .15 | 5.93 | 6.08 | (.06 | ) | (.27 | ) | (.33 | ) | 31.59 | 23.89 | 2,309 | .76 | .64 | .58 | ||||||||||||||||||||||||||||||||||||
12/31/2019 | 20.98 | .28 | 5.79 | 6.07 | (.29 | ) | (.92 | ) | (1.21 | ) | 25.84 | 29.47 | 2,129 | .76 | .76 | 1.18 | ||||||||||||||||||||||||||||||||||||
12/31/2018 | 25.30 | .27 | (3.65 | ) | (3.38 | ) | (.27 | ) | (.67 | ) | (.94 | ) | 20.98 | (13.83 | ) | 1,702 | .77 | .77 | 1.11 | |||||||||||||||||||||||||||||||||
Class 1A: | ||||||||||||||||||||||||||||||||||||||||||||||||||||
12/31/2022 | 31.70 | .30 | (7.15 | ) | (6.85 | ) | (.32 | ) | (2.34 | ) | (2.66 | ) | 22.19 | (22.09 | ) | 9 | .93 | .82 | 1.24 | |||||||||||||||||||||||||||||||||
12/31/2021 | 31.43 | .17 | 1.41 | 1.58 | (.24 | ) | (1.07 | ) | (1.31 | ) | 31.70 | 4.90 | 12 | .99 | .81 | .54 | ||||||||||||||||||||||||||||||||||||
12/31/2020 | 25.74 | .07 | 5.92 | 5.99 | (.03 | ) | (.27 | ) | (.30 | ) | 31.43 | 23.63 | 18 | 1.01 | .87 | .26 | ||||||||||||||||||||||||||||||||||||
12/31/2019 | 20.92 | .22 | 5.76 | 5.98 | (.24 | ) | (.92 | ) | (1.16 | ) | 25.74 | 29.11 | 4 | 1.01 | 1.01 | .92 | ||||||||||||||||||||||||||||||||||||
12/31/2018 | 25.25 | .21 | (3.64 | ) | (3.43 | ) | (.23 | ) | (.67 | ) | (.90 | ) | 20.92 | (14.02 | ) | 2 | 1.02 | 1.02 | .91 | |||||||||||||||||||||||||||||||||
Class 2: | ||||||||||||||||||||||||||||||||||||||||||||||||||||
12/31/2022 | 31.48 | .30 | (7.10 | ) | (6.80 | ) | (.32 | ) | (2.34 | ) | (2.66 | ) | 22.02 | (22.10 | ) | 764 | .93 | .82 | 1.24 | |||||||||||||||||||||||||||||||||
12/31/2021 | 31.25 | .20 | 1.38 | 1.58 | (.28 | ) | (1.07 | ) | (1.35 | ) | 31.48 | 4.92 | 1,086 | .99 | .81 | .63 | ||||||||||||||||||||||||||||||||||||
12/31/2020 | 25.59 | .08 | 5.87 | 5.95 | (.02 | ) | (.27 | ) | (.29 | ) | 31.25 | 23.58 | 1,109 | 1.01 | .89 | .34 | ||||||||||||||||||||||||||||||||||||
12/31/2019 | 20.79 | .22 | 5.73 | 5.95 | (.23 | ) | (.92 | ) | (1.15 | ) | 25.59 | 29.15 | 981 | 1.01 | 1.01 | .93 | ||||||||||||||||||||||||||||||||||||
12/31/2018 | 25.07 | .20 | (3.61 | ) | (3.41 | ) | (.20 | ) | (.67 | ) | (.87 | ) | 20.79 | (14.04 | ) | 843 | 1.02 | 1.02 | .85 | |||||||||||||||||||||||||||||||||
Class 4: | ||||||||||||||||||||||||||||||||||||||||||||||||||||
12/31/2022 | 31.24 | .24 | (7.03 | ) | (6.79 | ) | (.27 | ) | (2.34 | ) | (2.61 | ) | 21.84 | (22.25 | ) | 701 | 1.18 | 1.07 | .99 | |||||||||||||||||||||||||||||||||
12/31/2021 | 31.04 | .12 | 1.36 | 1.48 | (.21 | ) | (1.07 | ) | (1.28 | ) | 31.24 | 4.63 | 906 | 1.24 | 1.06 | .38 | ||||||||||||||||||||||||||||||||||||
12/31/2020 | 25.47 | .02 | 5.83 | 5.85 | (.01 | ) | (.27 | ) | (.28 | ) | 31.04 | 23.29 | 807 | 1.26 | 1.14 | .08 | ||||||||||||||||||||||||||||||||||||
12/31/2019 | 20.71 | .16 | 5.70 | 5.86 | (.18 | ) | (.92 | ) | (1.10 | ) | 25.47 | 28.82 | 646 | 1.26 | 1.26 | .67 | ||||||||||||||||||||||||||||||||||||
12/31/2018 | 24.99 | .14 | (3.59 | ) | (3.45 | ) | (.16 | ) | (.67 | ) | (.83 | ) | 20.71 | (14.25 | ) | 464 | 1.27 | 1.27 | .61 | |||||||||||||||||||||||||||||||||
Refer to the end of the tables for footnotes.
American Funds Insurance Series 353
Table of Contents
Financial highlights (continued)
| (Loss) income from investment operations1 | Dividends and distributions | |||||||||||||||||||||||||||||||||||||||||||||||||||
| Year ended | Net asset value, beginning of year | Net investment income | Net (losses) gains on securities (both realized and unrealized) | Total from investment operations | Dividends (from net investment income) | Distributions (from capital gains) | Total dividends and distributions | Net asset value, end of year | Total return2 | Net assets, end of year (in millions) | Ratio of expenses to average net assets before waivers3 | Ratio of expenses to average net assets after waivers2,3 | Ratio of net income to average net assets2 | |||||||||||||||||||||||||||||||||||||||
Washington Mutual Investors Fund |
| |||||||||||||||||||||||||||||||||||||||||||||||||||
Class 1: | ||||||||||||||||||||||||||||||||||||||||||||||||||||
12/31/2022 | $ | 18.09 | $ | .31 | $ | (1.69 | ) | $ | (1.38 | ) | $ | (.30 | ) | $ | (3.72 | ) | $ | (4.02 | ) | $ | 12.69 | (8.28 | )% | $ | 5,507 | .41 | % | .26 | % | 2.13 | % | |||||||||||||||||||||
12/31/2021 | 14.35 | .29 | 3.73 | 4.02 | (.28 | ) | — | (.28 | ) | 18.09 | 28.12 | 6,766 | .42 | .31 | 1.79 | |||||||||||||||||||||||||||||||||||||
12/31/2020 | 13.56 | .25 | .95 | 1.20 | (.26 | ) | (.15 | ) | (.41 | ) | 14.35 | 9.04 | 5,684 | .43 | .43 | 2.00 | ||||||||||||||||||||||||||||||||||||
12/31/2019 | 12.38 | .30 | 2.25 | 2.55 | (.30 | ) | (1.07 | ) | (1.37 | ) | 13.56 | 21.66 | 5,559 | .42 | .42 | 2.28 | ||||||||||||||||||||||||||||||||||||
12/31/2018 | 14.96 | .31 | (1.44 | ) | (1.13 | ) | (.31 | ) | (1.14 | ) | (1.45 | ) | 12.38 | (8.45 | ) | 4,810 | .41 | .41 | 2.13 | |||||||||||||||||||||||||||||||||
Class 1A: | ||||||||||||||||||||||||||||||||||||||||||||||||||||
12/31/2022 | 17.96 | .27 | (1.67 | ) | (1.40 | ) | (.23 | ) | (3.72 | ) | (3.95 | ) | 12.61 | (8.45 | ) | 64 | .66 | .51 | 1.76 | |||||||||||||||||||||||||||||||||
12/31/2021 | 14.28 | .27 | 3.67 | 3.94 | (.26 | ) | — | (.26 | ) | 17.96 | 27.70 | 169 | .67 | .53 | 1.62 | |||||||||||||||||||||||||||||||||||||
12/31/2020 | 13.51 | .23 | .93 | 1.16 | (.24 | ) | (.15 | ) | (.39 | ) | 14.28 | 8.79 | 25 | .67 | .67 | 1.78 | ||||||||||||||||||||||||||||||||||||
12/31/2019 | 12.35 | .26 | 2.24 | 2.50 | (.27 | ) | (1.07 | ) | (1.34 | ) | 13.51 | 21.35 | 9 | .67 | .67 | 2.03 | ||||||||||||||||||||||||||||||||||||
12/31/2018 | 14.94 | .26 | (1.42 | ) | (1.16 | ) | (.29 | ) | (1.14 | ) | (1.43 | ) | 12.35 | (8.67 | ) | 3 | .66 | .66 | 1.84 | |||||||||||||||||||||||||||||||||
Class 2: | ||||||||||||||||||||||||||||||||||||||||||||||||||||
12/31/2022 | 17.83 | .26 | (1.65 | ) | (1.39 | ) | (.26 | ) | (3.72 | ) | (3.98 | ) | 12.46 | (8.45 | ) | 2,775 | .66 | .51 | 1.88 | |||||||||||||||||||||||||||||||||
12/31/2021 | 14.15 | .25 | 3.67 | 3.92 | (.24 | ) | — | (.24 | ) | 17.83 | 27.78 | 3,426 | .67 | .56 | 1.54 | |||||||||||||||||||||||||||||||||||||
12/31/2020 | 13.39 | .22 | .91 | 1.13 | (.22 | ) | (.15 | ) | (.37 | ) | 14.15 | 8.68 | 3,082 | .68 | .68 | 1.75 | ||||||||||||||||||||||||||||||||||||
12/31/2019 | 12.24 | .26 | 2.22 | 2.48 | (.26 | ) | (1.07 | ) | (1.33 | ) | 13.39 | 21.38 | 3,093 | .67 | .67 | 2.03 | ||||||||||||||||||||||||||||||||||||
12/31/2018 | 14.80 | .27 | (1.42 | ) | (1.15 | ) | (.27 | ) | (1.14 | ) | (1.41 | ) | 12.24 | (8.66 | ) | 2,850 | .66 | .66 | 1.88 | |||||||||||||||||||||||||||||||||
Class 4: | ||||||||||||||||||||||||||||||||||||||||||||||||||||
12/31/2022 | 17.71 | .23 | (1.64 | ) | (1.41 | ) | (.24 | ) | (3.72 | ) | (3.96 | ) | 12.34 | (8.69 | ) | 1,098 | .91 | .77 | 1.64 | |||||||||||||||||||||||||||||||||
12/31/2021 | 14.06 | .21 | 3.65 | 3.86 | (.21 | ) | — | (.21 | ) | 17.71 | 27.51 | 1,104 | .92 | .81 | 1.30 | |||||||||||||||||||||||||||||||||||||
12/31/2020 | 13.31 | .19 | .91 | 1.10 | (.20 | ) | (.15 | ) | (.35 | ) | 14.06 | 8.47 | 788 | .93 | .93 | 1.51 | ||||||||||||||||||||||||||||||||||||
12/31/2019 | 12.19 | .23 | 2.20 | 2.43 | (.24 | ) | (1.07 | ) | (1.31 | ) | 13.31 | 21.03 | 621 | .92 | .92 | 1.78 | ||||||||||||||||||||||||||||||||||||
12/31/2018 | 14.77 | .23 | (1.42 | ) | (1.19 | ) | (.25 | ) | (1.14 | ) | (1.39 | ) | 12.19 | (8.92 | ) | 368 | .91 | .91 | 1.62 | |||||||||||||||||||||||||||||||||
Refer to the end of the tables for footnotes.
354 American Funds Insurance Series
Table of Contents
Financial highlights (continued)
| (Loss) income from investment operations1 | Dividends and distributions | |||||||||||||||||||||||||||||||||||||||||||||||||||
| Year ended | Net asset value, beginning of year | Net investment income | Net (losses) gains on securities (both realized and unrealized) | Total from investment operations | Dividends (from net investment income) | Distributions (from capital gains) | Total dividends and distributions | Net asset value, end of year | Total return2 | Net assets, end of year (in millions) | Ratio of expenses to average net assets before waivers3 | Ratio of expenses to average net assets after waivers2,3 | Ratio of net income to average net assets2 | |||||||||||||||||||||||||||||||||||||||
Capital World Growth and Income Fund |
| |||||||||||||||||||||||||||||||||||||||||||||||||||
Class 1: | ||||||||||||||||||||||||||||||||||||||||||||||||||||
12/31/2022 | $ | 18.42 | $ | .32 | $ | (3.28 | ) | $ | (2.96 | ) | $ | (.34 | ) | $ | (3.45 | ) | $ | (3.79 | ) | $ | 11.67 | (17.13 | )% | $ | 548 | .57 | % | .41 | % | 2.36 | % | |||||||||||||||||||||
12/31/2021 | 16.67 | .38 | 2.10 | 2.48 | (.33 | ) | (.40 | ) | (.73 | ) | 18.42 | 15.03 | 812 | .63 | .47 | 2.14 | ||||||||||||||||||||||||||||||||||||
12/31/2020 | 15.92 | .22 | 1.14 | 1.36 | (.23 | ) | (.38 | ) | (.61 | ) | 16.67 | 9.03 | 657 | .66 | .66 | 1.49 | ||||||||||||||||||||||||||||||||||||
12/31/2019 | 13.02 | .31 | 3.67 | 3.98 | (.32 | ) | (.76 | ) | (1.08 | ) | 15.92 | 31.39 | 625 | .65 | .65 | 2.08 | ||||||||||||||||||||||||||||||||||||
12/31/2018 | 15.81 | .29 | (1.62 | ) | (1.33 | ) | (.28 | ) | (1.18 | ) | (1.46 | ) | 13.02 | (9.36 | ) | 492 | .63 | .63 | 1.94 | |||||||||||||||||||||||||||||||||
Class 1A: | ||||||||||||||||||||||||||||||||||||||||||||||||||||
12/31/2022 | 18.34 | .28 | (3.25 | ) | (2.97 | ) | (.31 | ) | (3.45 | ) | (3.76 | ) | 11.61 | (17.29 | ) | 6 | .82 | .66 | 2.13 | |||||||||||||||||||||||||||||||||
12/31/2021 | 16.62 | .37 | 2.06 | 2.43 | (.31 | ) | (.40 | ) | (.71 | ) | 18.34 | 14.71 | 7 | .88 | .70 | 2.08 | ||||||||||||||||||||||||||||||||||||
12/31/2020 | 15.88 | .18 | 1.13 | 1.31 | (.19 | ) | (.38 | ) | (.57 | ) | 16.62 | 8.78 | 2 | .90 | .90 | 1.23 | ||||||||||||||||||||||||||||||||||||
12/31/2019 | 13.00 | .26 | 3.68 | 3.94 | (.30 | ) | (.76 | ) | (1.06 | ) | 15.88 | 31.04 | 2 | .90 | .90 | 1.77 | ||||||||||||||||||||||||||||||||||||
12/31/2018 | 15.81 | .26 | (1.63 | ) | (1.37 | ) | (.26 | ) | (1.18 | ) | (1.44 | ) | 13.00 | (9.62 | ) | 1 | .88 | .88 | 1.74 | |||||||||||||||||||||||||||||||||
Class 2: | ||||||||||||||||||||||||||||||||||||||||||||||||||||
12/31/2022 | 18.38 | .28 | (3.26 | ) | (2.98 | ) | (.31 | ) | (3.45 | ) | (3.76 | ) | 11.64 | (17.33 | ) | 983 | .82 | .66 | 2.11 | |||||||||||||||||||||||||||||||||
12/31/2021 | 16.63 | .33 | 2.11 | 2.44 | (.29 | ) | (.40 | ) | (.69 | ) | 18.38 | 14.78 | 1,340 | .88 | .73 | 1.85 | ||||||||||||||||||||||||||||||||||||
12/31/2020 | 15.89 | .18 | 1.13 | 1.31 | (.19 | ) | (.38 | ) | (.57 | ) | 16.63 | 8.73 | 1,349 | .91 | .91 | 1.23 | ||||||||||||||||||||||||||||||||||||
12/31/2019 | 12.99 | .27 | 3.68 | 3.95 | (.29 | ) | (.76 | ) | (1.05 | ) | 15.89 | 31.14 | 1,366 | .90 | .90 | 1.84 | ||||||||||||||||||||||||||||||||||||
12/31/2018 | 15.78 | .26 | (1.63 | ) | (1.37 | ) | (.24 | ) | (1.18 | ) | (1.42 | ) | 12.99 | (9.63 | ) | 1,228 | .88 | .88 | 1.70 | |||||||||||||||||||||||||||||||||
Class 4: | ||||||||||||||||||||||||||||||||||||||||||||||||||||
12/31/2022 | 18.04 | .24 | (3.20 | ) | (2.96 | ) | (.28 | ) | (3.45 | ) | (3.73 | ) | 11.35 | (17.57 | ) | 188 | 1.07 | .91 | 1.86 | |||||||||||||||||||||||||||||||||
12/31/2021 | 16.35 | .29 | 2.06 | 2.35 | (.26 | ) | (.40 | ) | (.66 | ) | 18.04 | 14.46 | 225 | 1.13 | .97 | 1.65 | ||||||||||||||||||||||||||||||||||||
12/31/2020 | 15.63 | .14 | 1.12 | 1.26 | (.16 | ) | (.38 | ) | (.54 | ) | 16.35 | 8.55 | 166 | 1.16 | 1.16 | .97 | ||||||||||||||||||||||||||||||||||||
12/31/2019 | 12.81 | .23 | 3.61 | 3.84 | (.26 | ) | (.76 | ) | (1.02 | ) | 15.63 | 30.73 | 145 | 1.15 | 1.15 | 1.56 | ||||||||||||||||||||||||||||||||||||
12/31/2018 | 15.60 | .21 | (1.60 | ) | (1.39 | ) | (.22 | ) | (1.18 | ) | (1.40 | ) | 12.81 | (9.89 | ) | 95 | 1.13 | 1.13 | 1.43 | |||||||||||||||||||||||||||||||||
Refer to the end of the tables for footnotes.
American Funds Insurance Series 355
Table of Contents
Financial highlights (continued)
| (Loss) income from investment operations1 | Dividends and distributions | |||||||||||||||||||||||||||||||||||||||||||||||
| Year ended | Net asset value, beginning of year | Net investment income | Net (losses) gains on securities (both realized and unrealized) | Total from investment operations | Dividends (from net investment income) | Distributions (from capital gains) | Total dividends and distributions | Net asset value, end of year | Total return | Net assets, end of year (in millions) | Ratio of expenses to average net assets3 | Ratio of net income to average net assets | ||||||||||||||||||||||||||||||||||||
Growth-Income Fund |
| |||||||||||||||||||||||||||||||||||||||||||||||
Class 1: | ||||||||||||||||||||||||||||||||||||||||||||||||
12/31/2022 | $ | 67.35 | $ | .85 | $ | (11.50 | ) | $ | (10.65 | ) | $ | (.83 | ) | $ | (5.66 | ) | $ | (6.49 | ) | $ | 50.21 | (16.28 | )% | $ | 19,692 | .29 | % | 1.54 | % | |||||||||||||||||||
12/31/2021 | 55.38 | .79 | 12.64 | 13.43 | (.86 | ) | (.60 | ) | (1.46 | ) | 67.35 | 24.42 | 25,507 | .29 | 1.28 | |||||||||||||||||||||||||||||||||
12/31/2020 | 50.71 | .75 | 6.02 | 6.77 | (.80 | ) | (1.30 | ) | (2.10 | ) | 55.38 | 13.81 | 22,903 | .29 | 1.52 | |||||||||||||||||||||||||||||||||
12/31/2019 | 45.39 | 1.00 | 10.40 | 11.40 | (.92 | ) | (5.16 | ) | (6.08 | ) | 50.71 | 26.46 | 21,057 | .29 | 2.05 | |||||||||||||||||||||||||||||||||
12/31/2018 | 50.22 | .84 | (1.25 | ) | (.41 | ) | (.84 | ) | (3.58 | ) | (4.42 | ) | 45.39 | (1.55 | ) | 16,783 | .28 | 1.65 | ||||||||||||||||||||||||||||||
Class 1A: | ||||||||||||||||||||||||||||||||||||||||||||||||
12/31/2022 | 67.02 | .71 | (11.44 | ) | (10.73 | ) | (.70 | ) | (5.66 | ) | (6.36 | ) | 49.93 | (16.48 | ) | 28 | .54 | 1.30 | ||||||||||||||||||||||||||||||
12/31/2021 | 55.16 | .65 | 12.55 | 13.20 | (.74 | ) | (.60 | ) | (1.34 | ) | 67.02 | 24.08 | 32 | .53 | 1.04 | |||||||||||||||||||||||||||||||||
12/31/2020 | 50.54 | .63 | 5.99 | 6.62 | (.70 | ) | (1.30 | ) | (2.00 | ) | 55.16 | 13.55 | 16 | .54 | 1.28 | |||||||||||||||||||||||||||||||||
12/31/2019 | 45.28 | .89 | 10.36 | 11.25 | (.83 | ) | (5.16 | ) | (5.99 | ) | 50.54 | 26.14 | 11 | .54 | 1.82 | |||||||||||||||||||||||||||||||||
12/31/2018 | 50.15 | .72 | (1.25 | ) | (.53 | ) | (.76 | ) | (3.58 | ) | (4.34 | ) | 45.28 | (1.78 | ) | 7 | .53 | 1.43 | ||||||||||||||||||||||||||||||
Class 2: | ||||||||||||||||||||||||||||||||||||||||||||||||
12/31/2022 | 66.44 | .70 | (11.33 | ) | (10.63 | ) | (.69 | ) | (5.66 | ) | (6.35 | ) | 49.46 | (16.50 | ) | 11,508 | .54 | 1.29 | ||||||||||||||||||||||||||||||
12/31/2021 | 54.66 | .63 | 12.45 | 13.08 | (.70 | ) | (.60 | ) | (1.30 | ) | 66.44 | 24.10 | 15,319 | .54 | 1.03 | |||||||||||||||||||||||||||||||||
12/31/2020 | 50.08 | .62 | 5.93 | 6.55 | (.67 | ) | (1.30 | ) | (1.97 | ) | 54.66 | 13.54 | 14,012 | .54 | 1.27 | |||||||||||||||||||||||||||||||||
12/31/2019 | 44.90 | .87 | 10.27 | 11.14 | (.80 | ) | (5.16 | ) | (5.96 | ) | 50.08 | 26.14 | 13,586 | .53 | 1.80 | |||||||||||||||||||||||||||||||||
12/31/2018 | 49.71 | .71 | (1.23 | ) | (.52 | ) | (.71 | ) | (3.58 | ) | (4.29 | ) | 44.90 | (1.79 | ) | 12,035 | .53 | 1.40 | ||||||||||||||||||||||||||||||
Class 3: | ||||||||||||||||||||||||||||||||||||||||||||||||
12/31/2022 | 67.48 | .75 | (11.51 | ) | (10.76 | ) | (.73 | ) | (5.66 | ) | (6.39 | ) | 50.33 | (16.43 | ) | 125 | .47 | 1.36 | ||||||||||||||||||||||||||||||
12/31/2021 | 55.49 | .68 | 12.65 | 13.33 | (.74 | ) | (.60 | ) | (1.34 | ) | 67.48 | 24.18 | 166 | .47 | 1.10 | |||||||||||||||||||||||||||||||||
12/31/2020 | 50.81 | .66 | 6.02 | 6.68 | (.70 | ) | (1.30 | ) | (2.00 | ) | 55.49 | 13.60 | 154 | .47 | 1.34 | |||||||||||||||||||||||||||||||||
12/31/2019 | 45.47 | .91 | 10.43 | 11.34 | (.84 | ) | (5.16 | ) | (6.00 | ) | 50.81 | 26.24 | 156 | .46 | 1.87 | |||||||||||||||||||||||||||||||||
12/31/2018 | 50.29 | .75 | (1.25 | ) | (.50 | ) | (.74 | ) | (3.58 | ) | (4.32 | ) | 45.47 | (1.72 | ) | 140 | .46 | 1.47 | ||||||||||||||||||||||||||||||
Class 4: | ||||||||||||||||||||||||||||||||||||||||||||||||
12/31/2022 | 65.57 | .56 | (11.18 | ) | (10.62 | ) | (.57 | ) | (5.66 | ) | (6.23 | ) | 48.72 | (16.70 | ) | 1,630 | .79 | 1.05 | ||||||||||||||||||||||||||||||
12/31/2021 | 53.99 | .48 | 12.28 | 12.76 | (.58 | ) | (.60 | ) | (1.18 | ) | 65.57 | 23.80 | 1,928 | .79 | .79 | |||||||||||||||||||||||||||||||||
12/31/2020 | 49.52 | .49 | 5.85 | 6.34 | (.57 | ) | (1.30 | ) | (1.87 | ) | 53.99 | 13.25 | 1,407 | .79 | 1.02 | |||||||||||||||||||||||||||||||||
12/31/2019 | 44.47 | .74 | 10.18 | 10.92 | (.71 | ) | (5.16 | ) | (5.87 | ) | 49.52 | 25.86 | 1,216 | .79 | 1.56 | |||||||||||||||||||||||||||||||||
12/31/2018 | 49.31 | .58 | (1.23 | ) | (.65 | ) | (.61 | ) | (3.58 | ) | (4.19 | ) | 44.47 | (2.05 | ) | 899 | .78 | 1.15 | ||||||||||||||||||||||||||||||
Refer to the end of the tables for footnotes.
356 American Funds Insurance Series
Table of Contents
Financial highlights (continued)
| (Loss) income from investment operations1 | Dividends and distributions | |||||||||||||||||||||||||||||||||||||||||||||||||||
| Year ended | Net asset value, beginning of year | Net investment income | Net (losses) gains on securities (both realized and unrealized) | Total from investment operations | Dividends (from net investment income) | Distributions (from capital gains) | Total dividends and distributions | Net asset value, end of year | Total return2 | Net assets, end of year (in millions) | Ratio of expenses to average net assets before waivers3 | Ratio of expenses to average net assets after | Ratio of net income to average net assets2 | |||||||||||||||||||||||||||||||||||||||
International Growth and Income Fund |
| |||||||||||||||||||||||||||||||||||||||||||||||||||
Class 1: | ||||||||||||||||||||||||||||||||||||||||||||||||||||
12/31/2022 | $ | 19.62 | $ | .39 | $ | (3.09 | ) | $ | (2.70 | ) | $ | (.28 | ) | $ | (7.70 | ) | $ | (7.98 | ) | $ | 8.94 | (15.00 | )% | $ | 13 | .64 | % | .54 | % | 3.29 | % | |||||||||||||||||||||
12/31/2021 | 19.01 | .54 | .53 | 1.07 | (.46 | ) | — | (.46 | ) | 19.62 | 5.64 | 30 | .67 | .67 | 2.70 | |||||||||||||||||||||||||||||||||||||
12/31/2020 | 18.18 | .27 | .85 | 1.12 | (.29 | ) | — | (.29 | ) | 19.01 | 6.24 | 1,120 | .68 | .68 | 1.70 | |||||||||||||||||||||||||||||||||||||
12/31/2019 | 15.35 | .46 | 3.03 | 3.49 | (.47 | ) | (.19 | ) | (.66 | ) | 18.18 | 23.06 | 1,140 | .66 | .66 | 2.73 | ||||||||||||||||||||||||||||||||||||
12/31/2018 | 17.72 | .45 | (2.39 | ) | (1.94 | ) | (.43 | ) | — | (.43 | ) | 15.35 | (11.00 | ) | 1,034 | .65 | .65 | 2.62 | ||||||||||||||||||||||||||||||||||
Class 1A: | ||||||||||||||||||||||||||||||||||||||||||||||||||||
12/31/2022 | 19.39 | .35 | (3.05 | ) | (2.70 | ) | (.29 | ) | (7.70 | ) | (7.99 | ) | 8.70 | (15.31 | ) | 5 | .88 | .79 | 3.15 | |||||||||||||||||||||||||||||||||
12/31/2021 | 18.97 | .50 | .52 | 1.02 | (.60 | ) | — | (.60 | ) | 19.39 | 5.39 | 6 | .94 | .92 | 2.50 | |||||||||||||||||||||||||||||||||||||
12/31/2020 | 18.15 | .22 | .85 | 1.07 | (.25 | ) | — | (.25 | ) | 18.97 | 5.98 | 3 | .93 | .93 | 1.38 | |||||||||||||||||||||||||||||||||||||
12/31/2019 | 15.33 | .41 | 3.04 | 3.45 | (.44 | ) | (.19 | ) | (.63 | ) | 18.15 | 22.76 | 2 | .91 | .91 | 2.41 | ||||||||||||||||||||||||||||||||||||
12/31/2018 | 17.70 | .41 | (2.39 | ) | (1.98 | ) | (.39 | ) | — | (.39 | ) | 15.33 | (11.24 | ) | 2 | .90 | .90 | 2.35 | ||||||||||||||||||||||||||||||||||
Class 2: | ||||||||||||||||||||||||||||||||||||||||||||||||||||
12/31/2022 | 19.38 | .36 | (3.05 | ) | (2.69 | ) | (.29 | ) | (7.70 | ) | (7.99 | ) | 8.70 | (15.25 | ) | 162 | .88 | .78 | 3.24 | |||||||||||||||||||||||||||||||||
12/31/2021 | 18.95 | .48 | .53 | 1.01 | (.58 | ) | — | (.58 | ) | 19.38 | 5.37 | 211 | .93 | .92 | 2.44 | |||||||||||||||||||||||||||||||||||||
12/31/2020 | 18.12 | .23 | .85 | 1.08 | (.25 | ) | — | (.25 | ) | 18.95 | 6.01 | 221 | .93 | .93 | 1.43 | |||||||||||||||||||||||||||||||||||||
12/31/2019 | 15.30 | .42 | 3.02 | 3.44 | (.43 | ) | (.19 | ) | (.62 | ) | 18.12 | 22.76 | 257 | .91 | .91 | 2.49 | ||||||||||||||||||||||||||||||||||||
12/31/2018 | 17.66 | .41 | (2.38 | ) | (1.97 | ) | (.39 | ) | — | (.39 | ) | 15.30 | (11.23 | ) | 230 | .90 | .90 | 2.38 | ||||||||||||||||||||||||||||||||||
Class 4: | ||||||||||||||||||||||||||||||||||||||||||||||||||||
12/31/2022 | 19.23 | .33 | (3.04 | ) | (2.71 | ) | (.26 | ) | (7.70 | ) | (7.96 | ) | 8.56 | (15.52 | ) | 121 | 1.13 | 1.04 | 3.01 | |||||||||||||||||||||||||||||||||
12/31/2021 | 18.82 | .44 | .51 | .95 | (.54 | ) | — | (.54 | ) | 19.23 | 5.09 | 132 | 1.18 | 1.17 | 2.21 | |||||||||||||||||||||||||||||||||||||
12/31/2020 | 18.01 | .19 | .83 | 1.02 | (.21 | ) | — | (.21 | ) | 18.82 | 5.73 | 112 | 1.18 | 1.18 | 1.19 | |||||||||||||||||||||||||||||||||||||
12/31/2019 | 15.22 | .37 | 3.01 | 3.38 | (.40 | ) | (.19 | ) | (.59 | ) | 18.01 | 22.47 | 101 | 1.16 | 1.16 | 2.18 | ||||||||||||||||||||||||||||||||||||
12/31/2018 | 17.58 | .36 | (2.36 | ) | (2.00 | ) | (.36 | ) | — | (.36 | ) | 15.22 | (11.46 | ) | 71 | 1.15 | 1.15 | 2.10 | ||||||||||||||||||||||||||||||||||
Refer to the end of the tables for footnotes.
American Funds Insurance Series 357
Table of Contents
Financial highlights (continued)
| (Loss) income from investment operations1 | Dividends and distributions | |||||||||||||||||||||||||||||||||||||||||||||||||||
| Year ended | Net asset value, beginning of year | Net investment income | Net (losses) gains on securities (both realized and unrealized) | Total from investment operations | Dividends (from net investment income) | Distributions (from capital gains) | Total dividends and distributions | Net asset value, end of year | Total return2 | Net assets, end of year (in millions) | Ratio of expenses to assets before waivers3 | Ratio of expenses to average net assets after waivers2,3 | Ratio of net income to average net assets2 | |||||||||||||||||||||||||||||||||||||||
Capital Income Builder |
| |||||||||||||||||||||||||||||||||||||||||||||||||||
Class 1: | ||||||||||||||||||||||||||||||||||||||||||||||||||||
12/31/2022 | $ | 12.17 | $ | .37 | $ | (1.21 | ) | $ | (.84 | ) | $ | (.34 | ) | $ | — | $ | (.34 | ) | $ | 10.99 | (6.90 | )% | $ | 586 | .44 | % | .26 | % | 3.31 | % | ||||||||||||||||||||||
12/31/2021 | 10.87 | .37 | 1.28 | 1.65 | (.35 | ) | — | (.35 | ) | 12.17 | 15.31 | 563 | .53 | .27 | 3.19 | |||||||||||||||||||||||||||||||||||||
12/31/2020 | 10.73 | .31 | .15 | .46 | (.32 | ) | — | (.32 | ) | 10.87 | 4.64 | 621 | .53 | .35 | 3.07 | |||||||||||||||||||||||||||||||||||||
12/31/2019 | 9.37 | .32 | 1.36 | 1.68 | (.32 | ) | — | (.32 | ) | 10.73 | 18.16 | 533 | .53 | .53 | 3.17 | |||||||||||||||||||||||||||||||||||||
12/31/2018 | 10.40 | .31 | (1.00 | ) | (.69 | ) | (.32 | ) | (.02 | ) | (.34 | ) | 9.37 | (6.77 | ) | 317 | .54 | .54 | 3.08 | |||||||||||||||||||||||||||||||||
Class 1A: | ||||||||||||||||||||||||||||||||||||||||||||||||||||
12/31/2022 | 12.15 | .34 | (1.19 | ) | (.85 | ) | (.32 | ) | — | (.32 | ) | 10.98 | (7.06 | ) | 10 | .69 | .52 | 3.06 | ||||||||||||||||||||||||||||||||||
12/31/2021 | 10.86 | .34 | 1.27 | 1.61 | (.32 | ) | — | (.32 | ) | 12.15 | 14.95 | 10 | .78 | .52 | 2.94 | |||||||||||||||||||||||||||||||||||||
12/31/2020 | 10.72 | .28 | .16 | .44 | (.30 | ) | — | (.30 | ) | 10.86 | 4.38 | 6 | .78 | .60 | 2.81 | |||||||||||||||||||||||||||||||||||||
12/31/2019 | 9.36 | .29 | 1.37 | 1.66 | (.30 | ) | — | (.30 | ) | 10.72 | 17.90 | 6 | .78 | .78 | 2.84 | |||||||||||||||||||||||||||||||||||||
12/31/2018 | 10.39 | .28 | (.99 | ) | (.71 | ) | (.30 | ) | (.02 | ) | (.32 | ) | 9.36 | (7.01 | ) | 2 | .79 | .79 | 2.82 | |||||||||||||||||||||||||||||||||
Class 2: | ||||||||||||||||||||||||||||||||||||||||||||||||||||
12/31/2022 | 12.16 | .34 | (1.20 | ) | (.86 | ) | (.32 | ) | — | (.32 | ) | 10.98 | (7.13 | ) | 13 | .69 | .51 | 3.06 | ||||||||||||||||||||||||||||||||||
12/31/2021 | 10.87 | .34 | 1.27 | 1.61 | (.32 | ) | — | (.32 | ) | 12.16 | 14.94 | 13 | .78 | .52 | 2.93 | |||||||||||||||||||||||||||||||||||||
12/31/2020 | 10.72 | .29 | .16 | .45 | (.30 | ) | — | (.30 | ) | 10.87 | 4.48 | 8 | .78 | .60 | 2.83 | |||||||||||||||||||||||||||||||||||||
12/31/2019 | 9.36 | .30 | 1.35 | 1.65 | (.29 | ) | — | (.29 | ) | 10.72 | 17.89 | 6 | .78 | .78 | 2.91 | |||||||||||||||||||||||||||||||||||||
12/31/2018 | 10.40 | .28 | (1.00 | ) | (.72 | ) | (.30 | ) | (.02 | ) | (.32 | ) | 9.36 | (7.08 | ) | 4 | .79 | .79 | 2.83 | |||||||||||||||||||||||||||||||||
Class 4: | ||||||||||||||||||||||||||||||||||||||||||||||||||||
12/31/2022 | 12.14 | .31 | (1.20 | ) | (.89 | ) | (.29 | ) | — | (.29 | ) | 10.96 | (7.37 | ) | 530 | .94 | .76 | 2.81 | ||||||||||||||||||||||||||||||||||
12/31/2021 | 10.85 | .31 | 1.27 | 1.58 | (.29 | ) | — | (.29 | ) | 12.14 | 14.68 | 559 | 1.03 | .77 | 2.69 | |||||||||||||||||||||||||||||||||||||
12/31/2020 | 10.71 | .26 | .15 | .41 | (.27 | ) | — | (.27 | ) | 10.85 | 4.11 | 462 | 1.03 | .85 | 2.55 | |||||||||||||||||||||||||||||||||||||
12/31/2019 | 9.35 | .27 | 1.36 | 1.63 | (.27 | ) | — | (.27 | ) | 10.71 | 17.62 | 454 | 1.03 | 1.03 | 2.68 | |||||||||||||||||||||||||||||||||||||
12/31/2018 | 10.38 | .26 | (1.00 | ) | (.74 | ) | (.27 | ) | (.02 | ) | (.29 | ) | 9.35 | (7.25 | ) | 352 | 1.04 | 1.04 | 2.58 | |||||||||||||||||||||||||||||||||
Refer to the end of the tables for footnotes.
358 American Funds Insurance Series
Table of Contents
Financial highlights (continued)
| (Loss) income from investment operations1 | Dividends and distributions | |||||||||||||||||||||||||||||||||||||||||||||||
| Year ended | Net asset value, beginning of year | Net investment income | Net (losses) gains on securities (both realized and unrealized) | Total from investment operations | Dividends (from net investment income) | Distributions (from capital gains) | Total dividends and distributions | Net asset value, end of year | Total return | Net assets, end of year (in millions) | Ratio of expenses to average net assets3 | Ratio of net income to average net assets | ||||||||||||||||||||||||||||||||||||
Asset Allocation Fund |
| |||||||||||||||||||||||||||||||||||||||||||||||
Class 1: | ||||||||||||||||||||||||||||||||||||||||||||||||
12/31/2022 | $ | 29.08 | $ | .52 | $ | (4.24 | ) | $ | (3.72 | ) | $ | (.51 | ) | $ | (2.65 | ) | $ | (3.16 | ) | $ | 22.20 | (13.19 | )% | $ | 15,138 | .30 | % | 2.15 | % | |||||||||||||||||||
12/31/2021 | 26.50 | .48 | 3.54 | 4.02 | (.50 | ) | (.94 | ) | (1.44 | ) | 29.08 | 15.40 | 18,836 | .30 | 1.71 | |||||||||||||||||||||||||||||||||
12/31/2020 | 24.05 | .43 | 2.59 | 3.02 | (.46 | ) | (.11 | ) | (.57 | ) | 26.50 | 12.71 | 19,238 | .30 | 1.80 | |||||||||||||||||||||||||||||||||
12/31/2019 | 21.29 | .51 | 3.94 | 4.45 | (.50 | ) | (1.19 | ) | (1.69 | ) | 24.05 | 21.54 | 17,730 | .29 | 2.21 | |||||||||||||||||||||||||||||||||
12/31/2018 | 23.71 | .48 | (1.43 | ) | (.95 | ) | (.44 | ) | (1.03 | ) | (1.47 | ) | 21.29 | (4.35 | ) | 14,627 | .28 | 2.04 | ||||||||||||||||||||||||||||||
Class 1A: | ||||||||||||||||||||||||||||||||||||||||||||||||
12/31/2022 | 28.97 | .46 | (4.22 | ) | (3.76 | ) | (.46 | ) | (2.65 | ) | (3.11 | ) | 22.10 | (13.43 | ) | 27 | .55 | 1.95 | ||||||||||||||||||||||||||||||
12/31/2021 | 26.42 | .42 | 3.52 | 3.94 | (.45 | ) | (.94 | ) | (1.39 | ) | 28.97 | 15.13 | 24 | .55 | 1.49 | |||||||||||||||||||||||||||||||||
12/31/2020 | 23.99 | .37 | 2.58 | 2.95 | (.41 | ) | (.11 | ) | (.52 | ) | 26.42 | 12.43 | 14 | .55 | 1.56 | |||||||||||||||||||||||||||||||||
12/31/2019 | 21.26 | .45 | 3.92 | 4.37 | (.45 | ) | (1.19 | ) | (1.64 | ) | 23.99 | 21.19 | 11 | .54 | 1.95 | |||||||||||||||||||||||||||||||||
12/31/2018 | 23.69 | .42 | (1.42 | ) | (1.00 | ) | (.40 | ) | (1.03 | ) | (1.43 | ) | 21.26 | (4.58 | ) | 7 | .53 | 1.82 | ||||||||||||||||||||||||||||||
Class 2: | ||||||||||||||||||||||||||||||||||||||||||||||||
12/31/2022 | 28.74 | .46 | (4.19 | ) | (3.73 | ) | (.45 | ) | (2.65 | ) | (3.10 | ) | 21.91 | (13.41 | ) | 4,228 | .55 | 1.90 | ||||||||||||||||||||||||||||||
12/31/2021 | 26.21 | .41 | 3.49 | 3.90 | (.43 | ) | (.94 | ) | (1.37 | ) | 28.74 | 15.10 | 5,473 | .55 | 1.46 | |||||||||||||||||||||||||||||||||
12/31/2020 | 23.79 | .37 | 2.56 | 2.93 | (.40 | ) | (.11 | ) | (.51 | ) | 26.21 | 12.46 | 5,242 | .55 | 1.55 | |||||||||||||||||||||||||||||||||
12/31/2019 | 21.08 | .45 | 3.89 | 4.34 | (.44 | ) | (1.19 | ) | (1.63 | ) | 23.79 | 21.23 | 5,154 | .54 | 1.96 | |||||||||||||||||||||||||||||||||
12/31/2018 | 23.49 | .41 | (1.41 | ) | (1.00 | ) | (.38 | ) | (1.03 | ) | (1.41 | ) | 21.08 | (4.60 | ) | 4,668 | .53 | 1.78 | ||||||||||||||||||||||||||||||
Class 3: | ||||||||||||||||||||||||||||||||||||||||||||||||
12/31/2022 | 29.12 | .48 | (4.25 | ) | (3.77 | ) | (.47 | ) | (2.65 | ) | (3.12 | ) | 22.23 | (13.37 | ) | 28 | .48 | 1.97 | ||||||||||||||||||||||||||||||
12/31/2021 | 26.53 | .43 | 3.55 | 3.98 | (.45 | ) | (.94 | ) | (1.39 | ) | 29.12 | 15.22 | 36 | .48 | 1.53 | |||||||||||||||||||||||||||||||||
12/31/2020 | 24.08 | .39 | 2.59 | 2.98 | (.42 | ) | (.11 | ) | (.53 | ) | 26.53 | 12.50 | 33 | .48 | 1.62 | |||||||||||||||||||||||||||||||||
12/31/2019 | 21.32 | .47 | 3.93 | 4.40 | (.45 | ) | (1.19 | ) | (1.64 | ) | 24.08 | 21.30 | 32 | .47 | 2.02 | |||||||||||||||||||||||||||||||||
12/31/2018 | 23.73 | .43 | (1.41 | ) | (.98 | ) | (.40 | ) | (1.03 | ) | (1.43 | ) | 21.32 | (4.49 | ) | 29 | .46 | 1.85 | ||||||||||||||||||||||||||||||
Class 4: | ||||||||||||||||||||||||||||||||||||||||||||||||
12/31/2022 | 28.56 | .39 | (4.16 | ) | (3.77 | ) | (.39 | ) | (2.65 | ) | (3.04 | ) | 21.75 | (13.66 | ) | 5,380 | .80 | 1.66 | ||||||||||||||||||||||||||||||
12/31/2021 | 26.06 | .34 | 3.47 | 3.81 | (.37 | ) | (.94 | ) | (1.31 | ) | 28.56 | 14.84 | 6,337 | .80 | 1.22 | |||||||||||||||||||||||||||||||||
12/31/2020 | 23.67 | .31 | 2.54 | 2.85 | (.35 | ) | (.11 | ) | (.46 | ) | 26.06 | 12.16 | 5,131 | .80 | 1.30 | |||||||||||||||||||||||||||||||||
12/31/2019 | 20.99 | .39 | 3.87 | 4.26 | (.39 | ) | (1.19 | ) | (1.58 | ) | 23.67 | 20.92 | 4,493 | .79 | 1.71 | |||||||||||||||||||||||||||||||||
12/31/2018 | 23.40 | .35 | (1.40 | ) | (1.05 | ) | (.33 | ) | (1.03 | ) | (1.36 | ) | 20.99 | (4.83 | ) | 3,594 | .78 | 1.54 | ||||||||||||||||||||||||||||||
Refer to the end of the tables for footnotes.
American Funds Insurance Series 359
Table of Contents
Financial highlights (continued)
| (Loss) income from investment operations1 | Dividends and distributions | |||||||||||||||||||||||||||||||||||||||||||||||||||
| Year ended | Net asset value, beginning of year | Net investment income | Net (losses) gains on securities (both realized and unrealized) | Total from investment operations | Dividends (from net investment income) | Distributions (from capital gains) | Total dividends and | Net asset value, end | Total return2 | Net assets, end of year (in millions) | Ratio of expenses to average net assets before | Ratio of expenses to average net assets after waivers2,3 | Ratio of net income to average net assets2 | |||||||||||||||||||||||||||||||||||||||
American Funds Global Balanced Fund |
| |||||||||||||||||||||||||||||||||||||||||||||||||||
Class 1: | ||||||||||||||||||||||||||||||||||||||||||||||||||||
12/31/2022 | $ | 14.73 | $ | .26 | $ | (2.37 | ) | $ | (2.11 | ) | $ | — | $ | (.07 | ) | $ | (.07 | ) | $ | 12.55 | (14.33 | )% | $ | 96 | .59 | % | .58 | % | 1.99 | % | ||||||||||||||||||||||
12/31/2021 | 14.19 | .18 | 1.37 | 1.55 | (.19 | ) | (.82 | ) | (1.01 | ) | 14.73 | 11.05 | 120 | .73 | .73 | 1.24 | ||||||||||||||||||||||||||||||||||||
12/31/2020 | 13.51 | .17 | 1.24 | 1.41 | (.19 | ) | (.54 | ) | (.73 | ) | 14.19 | 10.53 | 139 | .72 | .72 | 1.29 | ||||||||||||||||||||||||||||||||||||
12/31/2019 | 11.67 | .24 | 2.17 | 2.41 | (.20 | ) | (.37 | ) | (.57 | ) | 13.51 | 20.79 | 134 | .72 | .72 | 1.88 | ||||||||||||||||||||||||||||||||||||
12/31/2018 | 12.75 | .23 | (.96 | ) | (.73 | ) | (.20 | ) | (.15 | ) | (.35 | ) | 11.67 | (5.81 | ) | 110 | .72 | .72 | 1.82 | |||||||||||||||||||||||||||||||||
Class 1A: | ||||||||||||||||||||||||||||||||||||||||||||||||||||
12/31/2022 | 14.70 | .22 | (2.36 | ) | (2.14 | ) | — | (.07 | ) | (.07 | ) | 12.49 | (14.56 | ) | 3 | .84 | .84 | 1.71 | ||||||||||||||||||||||||||||||||||
12/31/2021 | 14.16 | .15 | 1.36 | 1.51 | (.15 | ) | (.82 | ) | (.97 | ) | 14.70 | 10.83 | 4 | .98 | .98 | 1.02 | ||||||||||||||||||||||||||||||||||||
12/31/2020 | 13.49 | .14 | 1.23 | 1.37 | (.16 | ) | (.54 | ) | (.70 | ) | 14.16 | 10.25 | 3 | .97 | .97 | 1.03 | ||||||||||||||||||||||||||||||||||||
12/31/2019 | 11.65 | .21 | 2.17 | 2.38 | (.17 | ) | (.37 | ) | (.54 | ) | 13.49 | 20.54 | 2 | .97 | .97 | 1.63 | ||||||||||||||||||||||||||||||||||||
12/31/2018 | 12.74 | .18 | (.94 | ) | (.76 | ) | (.18 | ) | (.15 | ) | (.33 | ) | 11.65 | (6.03 | ) | 2 | .98 | .98 | 1.44 | |||||||||||||||||||||||||||||||||
Class 2: | ||||||||||||||||||||||||||||||||||||||||||||||||||||
12/31/2022 | 14.70 | .22 | (2.36 | ) | (2.14 | ) | — | (.07 | ) | (.07 | ) | 12.49 | (14.56 | ) | 158 | .84 | .83 | 1.73 | ||||||||||||||||||||||||||||||||||
12/31/2021 | 14.16 | .15 | 1.36 | 1.51 | (.15 | ) | (.82 | ) | (.97 | ) | 14.70 | 10.79 | 208 | .98 | .98 | 1.01 | ||||||||||||||||||||||||||||||||||||
12/31/2020 | 13.48 | .14 | 1.23 | 1.37 | (.15 | ) | (.54 | ) | (.69 | ) | 14.16 | 10.30 | 208 | .97 | .97 | 1.03 | ||||||||||||||||||||||||||||||||||||
12/31/2019 | 11.65 | .21 | 2.16 | 2.37 | (.17 | ) | (.37 | ) | (.54 | ) | 13.48 | 20.44 | 207 | .97 | .97 | 1.64 | ||||||||||||||||||||||||||||||||||||
12/31/2018 | 12.72 | .20 | (.96 | ) | (.76 | ) | (.16 | ) | (.15 | ) | (.31 | ) | 11.65 | (6.01 | ) | 185 | .97 | .97 | 1.57 | |||||||||||||||||||||||||||||||||
Class 4: | ||||||||||||||||||||||||||||||||||||||||||||||||||||
12/31/2022 | 14.53 | .19 | (2.33 | ) | (2.14 | ) | — | (.07 | ) | (.07 | ) | 12.32 | (14.73 | ) | 111 | 1.09 | 1.08 | 1.49 | ||||||||||||||||||||||||||||||||||
12/31/2021 | 14.02 | .11 | 1.34 | 1.45 | (.12 | ) | (.82 | ) | (.94 | ) | 14.53 | 10.46 | 135 | 1.23 | 1.23 | .77 | ||||||||||||||||||||||||||||||||||||
12/31/2020 | 13.36 | .10 | 1.22 | 1.32 | (.12 | ) | (.54 | ) | (.66 | ) | 14.02 | 10.00 | 105 | 1.22 | 1.22 | .78 | ||||||||||||||||||||||||||||||||||||
12/31/2019 | 11.55 | .18 | 2.14 | 2.32 | (.14 | ) | (.37 | ) | (.51 | ) | 13.36 | 20.21 | 94 | 1.22 | 1.22 | 1.37 | ||||||||||||||||||||||||||||||||||||
12/31/2018 | 12.63 | .17 | (.96 | ) | (.79 | ) | (.14 | ) | (.15 | ) | (.29 | ) | 11.55 | (6.31 | ) | 69 | 1.22 | 1.22 | 1.34 | |||||||||||||||||||||||||||||||||
Refer to the end of the tables for footnotes.
360 American Funds Insurance Series
Table of Contents
Financial highlights (continued)
| (Loss) income from investment operations1 | Dividends and distributions | |||||||||||||||||||||||||||||||||||||||||||||||||||
| Year ended | Net asset value, beginning of year | Net investment income | Net (losses) gains on securities (both realized and unrealized) | Total from investment operations | Dividends (from net investment income) | Distributions (from capital gains) | Total dividends and distributions | Net asset value, end of year | Total return2 | Net assets, end of year (in millions) | Ratio of expenses to average net assets before waivers3 | Ratio of expenses to average net assets after waivers2,3 | Ratio of net income to average net assets2 | |||||||||||||||||||||||||||||||||||||||
The Bond Fund of America |
| |||||||||||||||||||||||||||||||||||||||||||||||||||
Class 1: | ||||||||||||||||||||||||||||||||||||||||||||||||||||
12/31/2022 | $ | 11.21 | $ | .31 | $ | (1.67 | ) | $ | (1.36 | ) | $ | (.32 | ) | $ | (.12 | ) | $ | (.44 | ) | $ | 9.41 | (12.26 | )% | $ | 6,370 | .39 | % | .20 | % | 3.09 | % | |||||||||||||||||||||
12/31/2021 | 11.89 | .21 | (.23 | ) | (.02 | ) | (.19 | ) | (.47 | ) | (.66 | ) | 11.21 | (.14 | ) | 8,555 | .39 | .26 | 1.84 | |||||||||||||||||||||||||||||||||
12/31/2020 | 11.17 | .23 | .87 | 1.10 | (.27 | ) | (.11 | ) | (.38 | ) | 11.89 | 9.96 | 6,844 | .40 | .40 | 2.00 | ||||||||||||||||||||||||||||||||||||
12/31/2019 | 10.47 | .30 | .71 | 1.01 | (.31 | ) | — | (.31 | ) | 11.17 | 9.70 | 6,481 | .39 | .39 | 2.76 | |||||||||||||||||||||||||||||||||||||
12/31/2018 | 10.82 | .29 | (.35 | ) | (.06 | ) | (.28 | ) | (.01 | ) | (.29 | ) | 10.47 | (.45 | ) | 5,962 | .38 | .38 | 2.70 | |||||||||||||||||||||||||||||||||
Class 1A: | ||||||||||||||||||||||||||||||||||||||||||||||||||||
12/31/2022 | 11.16 | .31 | (1.69 | ) | (1.38 | ) | (.31 | ) | (.12 | ) | (.43 | ) | 9.35 | (12.49 | ) | 220 | .64 | .45 | 3.15 | |||||||||||||||||||||||||||||||||
12/31/2021 | 11.84 | .18 | (.23 | ) | (.05 | ) | (.16 | ) | (.47 | ) | (.63 | ) | 11.16 | (.36 | ) | 12 | .64 | .51 | 1.59 | |||||||||||||||||||||||||||||||||
12/31/2020 | 11.13 | .20 | .87 | 1.07 | (.25 | ) | (.11 | ) | (.36 | ) | 11.84 | 9.68 | 9 | .65 | .65 | 1.74 | ||||||||||||||||||||||||||||||||||||
12/31/2019 | 10.45 | .27 | .71 | .98 | (.30 | ) | — | (.30 | ) | 11.13 | 9.36 | 7 | .64 | .64 | 2.48 | |||||||||||||||||||||||||||||||||||||
12/31/2018 | 10.80 | .26 | (.33 | ) | (.07 | ) | (.27 | ) | (.01 | ) | (.28 | ) | 10.45 | (.60 | ) | 3 | .63 | .63 | 2.50 | |||||||||||||||||||||||||||||||||
Class 2: | ||||||||||||||||||||||||||||||||||||||||||||||||||||
12/31/2022 | 11.06 | .28 | (1.66 | ) | (1.38 | ) | (.29 | ) | (.12 | ) | (.41 | ) | 9.27 | (12.58 | ) | 2,844 | .64 | .45 | 2.84 | |||||||||||||||||||||||||||||||||
12/31/2021 | 11.73 | .18 | (.22 | ) | (.04 | ) | (.16 | ) | (.47 | ) | (.63 | ) | 11.06 | (.31 | ) | 3,729 | .64 | .52 | 1.57 | |||||||||||||||||||||||||||||||||
12/31/2020 | 11.02 | .20 | .86 | 1.06 | (.24 | ) | (.11 | ) | (.35 | ) | 11.73 | 9.73 | 3,840 | .65 | .65 | 1.75 | ||||||||||||||||||||||||||||||||||||
12/31/2019 | 10.34 | .27 | .70 | .97 | (.29 | ) | — | (.29 | ) | 11.02 | 9.36 | 3,561 | .64 | .64 | 2.51 | |||||||||||||||||||||||||||||||||||||
12/31/2018 | 10.69 | .26 | (.34 | ) | (.08 | ) | (.26 | ) | (.01 | ) | (.27 | ) | 10.34 | (.71 | ) | 3,524 | .63 | .63 | 2.45 | |||||||||||||||||||||||||||||||||
Class 4: | ||||||||||||||||||||||||||||||||||||||||||||||||||||
12/31/2022 | 11.01 | .26 | (1.65 | ) | (1.39 | ) | (.27 | ) | (.12 | ) | (.39 | ) | 9.23 | (12.75 | ) | 787 | .89 | .70 | 2.61 | |||||||||||||||||||||||||||||||||
12/31/2021 | 11.69 | .15 | (.22 | ) | (.07 | ) | (.14 | ) | (.47 | ) | (.61 | ) | 11.01 | (.59 | ) | 891 | .89 | .76 | 1.34 | |||||||||||||||||||||||||||||||||
12/31/2020 | 11.00 | .17 | .85 | 1.02 | (.22 | ) | (.11 | ) | (.33 | ) | 11.69 | 9.38 | 714 | .90 | .90 | 1.48 | ||||||||||||||||||||||||||||||||||||
12/31/2019 | 10.33 | .24 | .70 | .94 | (.27 | ) | — | (.27 | ) | 11.00 | 9.08 | 502 | .89 | .89 | 2.25 | |||||||||||||||||||||||||||||||||||||
12/31/2018 | 10.68 | .23 | (.33 | ) | (.10 | ) | (.24 | ) | (.01 | ) | (.25 | ) | 10.33 | (.89 | ) | 366 | .88 | .88 | 2.22 | |||||||||||||||||||||||||||||||||
Refer to the end of the tables for footnotes.
American Funds Insurance Series 361
Table of Contents
Financial highlights (continued)
| (Loss) income from investment operations1 | Dividends and distributions | |||||||||||||||||||||||||||||||||||||||||||||||||||
| Year ended | Net asset value, beginning of year | Net investment income | Net (losses) gains on securities (both realized and unrealized) | Total from investment operations | Dividends (from net investment income) | Distributions (from capital gains) | Total dividends and distributions | Net asset value, end of year | Total return2 | Net assets, end of year (in millions) | Ratio of expenses to average net assets before waivers3 | Ratio of expenses to average net assets after waivers2,3 | Ratio of net income to average net assets2 | |||||||||||||||||||||||||||||||||||||||
Capital World Bond Fund |
| |||||||||||||||||||||||||||||||||||||||||||||||||||
Class 1: | ||||||||||||||||||||||||||||||||||||||||||||||||||||
12/31/2022 | $ | 11.79 | $ | .25 | $ | (2.30 | ) | $ | (2.05 | ) | $ | (.03 | ) | $ | (.16 | ) | $ | (.19 | ) | $ | 9.55 | (17.43 | )% | $ | 663 | .51 | % | .48 | % | 2.43 | % | |||||||||||||||||||||
12/31/2021 | 12.94 | .25 | (.85 | ) | (.60 | ) | (.24 | ) | (.31 | ) | (.55 | ) | 11.79 | (4.73 | ) | 988 | .60 | .50 | 2.06 | |||||||||||||||||||||||||||||||||
12/31/2020 | 12.12 | .26 | .95 | 1.21 | (.18 | ) | (.21 | ) | (.39 | ) | 12.94 | 10.17 | 1,219 | .59 | .52 | 2.08 | ||||||||||||||||||||||||||||||||||||
12/31/2019 | 11.42 | .31 | .61 | .92 | (.22 | ) | — | (.22 | ) | 12.12 | 8.08 | 1,077 | .58 | .58 | 2.60 | |||||||||||||||||||||||||||||||||||||
12/31/2018 | 11.88 | .30 | (.44 | ) | (.14 | ) | (.28 | ) | (.04 | ) | (.32 | ) | 11.42 | (1.14 | ) | 1,015 | .57 | .57 | 2.56 | |||||||||||||||||||||||||||||||||
Class 1A: | ||||||||||||||||||||||||||||||||||||||||||||||||||||
12/31/2022 | 11.76 | .22 | (2.30 | ) | (2.08 | ) | (.02 | ) | (.16 | ) | (.18 | ) | 9.50 | (17.69 | ) | 1 | .76 | .73 | 2.19 | |||||||||||||||||||||||||||||||||
12/31/2021 | 12.91 | .23 | (.85 | ) | (.62 | ) | (.22 | ) | (.31 | ) | (.53 | ) | 11.76 | (4.88 | ) | 1 | .85 | .75 | 1.85 | |||||||||||||||||||||||||||||||||
12/31/2020 | 12.10 | .23 | .95 | 1.18 | (.16 | ) | (.21 | ) | (.37 | ) | 12.91 | 9.89 | 1 | .83 | .76 | 1.83 | ||||||||||||||||||||||||||||||||||||
12/31/2019 | 11.41 | .28 | .60 | .88 | (.19 | ) | — | (.19 | ) | 12.10 | 7.75 | 1 | .83 | .83 | 2.35 | |||||||||||||||||||||||||||||||||||||
12/31/2018 | 11.87 | .27 | (.43 | ) | (.16 | ) | (.26 | ) | (.04 | ) | (.30 | ) | 11.41 | (1.29 | ) | 1 | .82 | .82 | 2.36 | |||||||||||||||||||||||||||||||||
Class 2: | ||||||||||||||||||||||||||||||||||||||||||||||||||||
12/31/2022 | 11.70 | .22 | (2.29 | ) | (2.07 | ) | (.02 | ) | (.16 | ) | (.18 | ) | 9.45 | (17.70 | ) | 765 | .76 | .73 | 2.18 | |||||||||||||||||||||||||||||||||
12/31/2021 | 12.84 | .22 | (.84 | ) | (.62 | ) | (.21 | ) | (.31 | ) | (.52 | ) | 11.70 | (4.92 | ) | 1,030 | .85 | .75 | 1.82 | |||||||||||||||||||||||||||||||||
12/31/2020 | 12.03 | .22 | .95 | 1.17 | (.15 | ) | (.21 | ) | (.36 | ) | 12.84 | 9.90 | 1,058 | .84 | .77 | 1.83 | ||||||||||||||||||||||||||||||||||||
12/31/2019 | 11.34 | .28 | .60 | .88 | (.19 | ) | — | (.19 | ) | 12.03 | 7.77 | 1,002 | .83 | .83 | 2.35 | |||||||||||||||||||||||||||||||||||||
12/31/2018 | 11.79 | .27 | (.43 | ) | (.16 | ) | (.25 | ) | (.04 | ) | (.29 | ) | 11.34 | (1.33 | ) | 1,032 | .82 | .82 | 2.32 | |||||||||||||||||||||||||||||||||
Class 4: | ||||||||||||||||||||||||||||||||||||||||||||||||||||
12/31/2022 | 11.57 | .19 | (2.25 | ) | (2.06 | ) | (.02 | ) | (.16 | ) | (.18 | ) | 9.33 | (17.84 | ) | 53 | 1.01 | .98 | 1.94 | |||||||||||||||||||||||||||||||||
12/31/2021 | 12.71 | .19 | (.84 | ) | (.65 | ) | (.18 | ) | (.31 | ) | (.49 | ) | 11.57 | (5.18 | ) | 66 | 1.10 | 1.00 | 1.57 | |||||||||||||||||||||||||||||||||
12/31/2020 | 11.92 | .19 | .94 | 1.13 | (.13 | ) | (.21 | ) | (.34 | ) | 12.71 | 9.62 | 61 | 1.09 | 1.02 | 1.58 | ||||||||||||||||||||||||||||||||||||
12/31/2019 | 11.24 | .24 | .60 | .84 | (.16 | ) | — | (.16 | ) | 11.92 | 7.54 | 49 | 1.08 | 1.08 | 2.09 | |||||||||||||||||||||||||||||||||||||
12/31/2018 | 11.70 | .24 | (.43 | ) | (.19 | ) | (.23 | ) | (.04 | ) | (.27 | ) | 11.24 | (1.61 | ) | 40 | 1.07 | 1.07 | 2.09 | |||||||||||||||||||||||||||||||||
Refer to the end of the tables for footnotes.
362 American Funds Insurance Series
Table of Contents
Financial highlights (continued)
| (Loss) income from investment operations1 | Dividends and distributions | |||||||||||||||||||||||||||||||||||||||||||||||||||
| Year ended | Net asset value, beginning of year | Net investment income | Net (losses) gains on securities (both realized and unrealized) | Total from investment operations | Dividends (from net investment income) | Distributions (from capital gains) | Total dividends and distributions | Net asset value, end of year | Total return2 | Net assets, end of year (in millions) | Ratio of expenses to average net assets before waivers3 | Ratio of expenses to average after waivers2,3 | Ratio of net income to average net assets2 | |||||||||||||||||||||||||||||||||||||||
American High-Income Trust |
| |||||||||||||||||||||||||||||||||||||||||||||||||||
Class 1: | ||||||||||||||||||||||||||||||||||||||||||||||||||||
12/31/2022 | $ | 10.19 | $ | .56 | $ | (1.47 | ) | $ | (.91 | ) | $ | (.75 | ) | $ | — | $ | (.75 | ) | $ | 8.53 | (9.01 | )% | $ | 224 | .47 | % | .32 | % | 5.95 | % | ||||||||||||||||||||||
12/31/2021 | 9.80 | .51 | .34 | .85 | (.46 | ) | — | (.46 | ) | 10.19 | 8.74 | 278 | .53 | .37 | 4.95 | |||||||||||||||||||||||||||||||||||||
12/31/2020 | 9.87 | .61 | .17 | .78 | (.85 | ) | — | (.85 | ) | 9.80 | 8.21 | 123 | .52 | .52 | 6.46 | |||||||||||||||||||||||||||||||||||||
12/31/2019 | 9.34 | .67 | .52 | 1.19 | (.66 | ) | — | (.66 | ) | 9.87 | 12.85 | 525 | .51 | .51 | 6.71 | |||||||||||||||||||||||||||||||||||||
12/31/2018 | 10.19 | .64 | (.84 | ) | (.20 | ) | (.65 | ) | — | (.65 | ) | 9.34 | (2.15 | ) | 501 | .50 | .50 | 6.32 | ||||||||||||||||||||||||||||||||||
Class 1A: | ||||||||||||||||||||||||||||||||||||||||||||||||||||
12/31/2022 | 10.16 | .53 | (1.46 | ) | (.93 | ) | (.72 | ) | — | (.72 | ) | 8.51 | (9.29 | ) | 1 | .72 | .57 | 5.70 | ||||||||||||||||||||||||||||||||||
12/31/2021 | 9.78 | .49 | .33 | .82 | (.44 | ) | — | (.44 | ) | 10.16 | 8.42 | 1 | .78 | .64 | 4.75 | |||||||||||||||||||||||||||||||||||||
12/31/2020 | 9.86 | .56 | .20 | .76 | (.84 | ) | — | (.84 | ) | 9.78 | 7.94 | 1 | .78 | .78 | 5.85 | |||||||||||||||||||||||||||||||||||||
12/31/2019 | 9.33 | .65 | .51 | 1.16 | (.63 | ) | — | (.63 | ) | 9.86 | 12.61 | 1 | .75 | .75 | 6.47 | |||||||||||||||||||||||||||||||||||||
12/31/2018 | 10.18 | .62 | (.84 | ) | (.22 | ) | (.63 | ) | — | (.63 | ) | 9.33 | (2.35 | ) | 1 | .75 | .75 | 6.11 | ||||||||||||||||||||||||||||||||||
Class 2: | ||||||||||||||||||||||||||||||||||||||||||||||||||||
12/31/2022 | 9.98 | .52 | (1.43 | ) | (.91 | ) | (.72 | ) | — | (.72 | ) | 8.35 | (9.26 | ) | 521 | .72 | .57 | 5.68 | ||||||||||||||||||||||||||||||||||
12/31/2021 | 9.61 | .48 | .33 | .81 | (.44 | ) | — | (.44 | ) | 9.98 | 8.42 | 673 | .78 | .65 | 4.80 | |||||||||||||||||||||||||||||||||||||
12/31/2020 | 9.70 | .55 | .19 | .74 | (.83 | ) | — | (.83 | ) | 9.61 | 7.94 | 665 | .78 | .78 | 5.88 | |||||||||||||||||||||||||||||||||||||
12/31/2019 | 9.19 | .64 | .50 | 1.14 | (.63 | ) | — | (.63 | ) | 9.70 | 12.55 | 667 | .76 | .76 | 6.45 | |||||||||||||||||||||||||||||||||||||
12/31/2018 | 10.03 | .61 | (.83 | ) | (.22 | ) | (.62 | ) | — | (.62 | ) | 9.19 | (2.34 | ) | 661 | .75 | .75 | 6.07 | ||||||||||||||||||||||||||||||||||
Class 3: | ||||||||||||||||||||||||||||||||||||||||||||||||||||
12/31/2022 | 10.24 | .54 | (1.47 | ) | (.93 | ) | (.73 | ) | — | (.73 | ) | 8.58 | (9.25 | ) | 9 | .65 | .50 | 5.76 | ||||||||||||||||||||||||||||||||||
12/31/2021 | 9.84 | .50 | .34 | .84 | (.44 | ) | — | (.44 | ) | 10.24 | 8.60 | 10 | .71 | .58 | 4.86 | |||||||||||||||||||||||||||||||||||||
12/31/2020 | 9.92 | .57 | .19 | .76 | (.84 | ) | — | (.84 | ) | 9.84 | 7.93 | 10 | .71 | .71 | 5.94 | |||||||||||||||||||||||||||||||||||||
12/31/2019 | 9.38 | .66 | .52 | 1.18 | (.64 | ) | — | (.64 | ) | 9.92 | 12.70 | 10 | .69 | .69 | 6.52 | |||||||||||||||||||||||||||||||||||||
12/31/2018 | 10.23 | .63 | (.85 | ) | (.22 | ) | (.63 | ) | — | (.63 | ) | 9.38 | (2.33 | ) | 10 | .68 | .68 | 6.14 | ||||||||||||||||||||||||||||||||||
Class 4: | ||||||||||||||||||||||||||||||||||||||||||||||||||||
12/31/2022 | 10.99 | .55 | (1.58 | ) | (1.03 | ) | (.70 | ) | — | (.70 | ) | 9.26 | (9.53 | ) | 77 | .97 | .82 | 5.44 | ||||||||||||||||||||||||||||||||||
12/31/2021 | 10.54 | .50 | .36 | .86 | (.41 | ) | — | (.41 | ) | 10.99 | 8.18 | 90 | 1.03 | .89 | 4.52 | |||||||||||||||||||||||||||||||||||||
12/31/2020 | 10.56 | .57 | .22 | .79 | (.81 | ) | — | (.81 | ) | 10.54 | 7.74 | 69 | 1.03 | 1.03 | 5.58 | |||||||||||||||||||||||||||||||||||||
12/31/2019 | 9.96 | .67 | .54 | 1.21 | (.61 | ) | — | (.61 | ) | 10.56 | 12.27 | 63 | 1.01 | 1.01 | 6.21 | |||||||||||||||||||||||||||||||||||||
12/31/2018 | 10.82 | .63 | (.90 | ) | (.27 | ) | (.59 | ) | — | (.59 | ) | 9.96 | (2.64 | ) | 31 | 1.00 | 1.00 | 5.83 | ||||||||||||||||||||||||||||||||||
Refer to the end of the tables for footnotes.
American Funds Insurance Series 363
Table of Contents
Financial highlights (continued)
| (Loss) income from investment operations1 | Dividends and distributions | |||||||||||||||||||||||||||||||||||||||||||||||||||
| Year ended | Net asset value, beginning of year | Net investment income | Net (losses) gains on securities (both realized and unrealized) | Total from investment operations | Dividends (from net investment income) | Distributions (from capital gains) | Total dividends and distributions | Net asset value, end of year | Total return2 | Net assets, end of year (in millions) | Ratio of expenses to average net assets before waivers | Ratio of expenses to average after waivers2 | Ratio of net income to average net assets2 | |||||||||||||||||||||||||||||||||||||||
American Funds Mortgage Fund |
| |||||||||||||||||||||||||||||||||||||||||||||||||||
Class 1: | ||||||||||||||||||||||||||||||||||||||||||||||||||||
12/31/2022 | $ | 10.63 | $ | .07 | $ | (1.10 | ) | $ | (1.03 | ) | $ | (.15 | ) | $ | — | $ | (.15 | ) | $ | 9.45 | (9.76 | )% | $ | 1 | .45 | % | .25 | % | .70 | % | ||||||||||||||||||||||
12/31/2021 | 11.11 | .06 | (.09 | ) | (.03 | ) | (.08 | ) | (.37 | ) | (.45 | ) | 10.63 | (.32 | ) | 231 | .49 | .29 | .58 | |||||||||||||||||||||||||||||||||
12/31/2020 | 10.56 | .10 | .64 | .74 | (.17 | ) | (.02 | ) | (.19 | ) | 11.11 | 6.98 | 224 | .48 | .36 | .93 | ||||||||||||||||||||||||||||||||||||
12/31/2019 | 10.30 | .24 | .30 | .54 | (.28 | ) | — | (.28 | ) | 10.56 | 5.30 | 210 | .47 | .47 | 2.26 | |||||||||||||||||||||||||||||||||||||
12/31/2018 | 10.47 | .20 | (.14 | ) | .06 | (.23 | ) | — | (.23 | ) | 10.30 | .58 | 209 | .48 | .48 | 1.97 | ||||||||||||||||||||||||||||||||||||
Class 1A: | ||||||||||||||||||||||||||||||||||||||||||||||||||||
12/31/2022 | 10.59 | .19 | (1.24 | ) | (1.05 | ) | (.20 | ) | — | (.20 | ) | 9.34 | (10.03 | ) | 2 | .69 | .54 | 1.91 | ||||||||||||||||||||||||||||||||||
12/31/2021 | 11.08 | .04 | (.10 | ) | (.06 | ) | (.06 | ) | (.37 | ) | (.43 | ) | 10.59 | (.47 | ) | 2 | .74 | .54 | .33 | |||||||||||||||||||||||||||||||||
12/31/2020 | 10.55 | .07 | .63 | .70 | (.15 | ) | (.02 | ) | (.17 | ) | 11.08 | 6.63 | 1 | .73 | .59 | .61 | ||||||||||||||||||||||||||||||||||||
12/31/2019 | 10.28 | .22 | .30 | .52 | (.25 | ) | — | (.25 | ) | 10.55 | 5.09 | 1 | .71 | .71 | 2.04 | |||||||||||||||||||||||||||||||||||||
12/31/2018 | 10.46 | .18 | (.14 | ) | .04 | (.22 | ) | — | (.22 | ) | 10.28 | .36 | 1 | .73 | .73 | 1.77 | ||||||||||||||||||||||||||||||||||||
Class 2: | ||||||||||||||||||||||||||||||||||||||||||||||||||||
12/31/2022 | 10.61 | .18 | (1.23 | ) | (1.05 | ) | (.20 | ) | — | (.20 | ) | 9.36 | (9.94 | ) | 46 | .69 | .54 | 1.87 | ||||||||||||||||||||||||||||||||||
12/31/2021 | 11.09 | .04 | (.10 | ) | (.06 | ) | (.05 | ) | (.37 | ) | (.42 | ) | 10.61 | (.57 | ) | 58 | .74 | .54 | .33 | |||||||||||||||||||||||||||||||||
12/31/2020 | 10.54 | .08 | .63 | .71 | (.14 | ) | (.02 | ) | (.16 | ) | 11.09 | 6.72 | 58 | .73 | .60 | .68 | ||||||||||||||||||||||||||||||||||||
12/31/2019 | 10.28 | .21 | .31 | .52 | (.26 | ) | — | (.26 | ) | 10.54 | 5.04 | 56 | .72 | .72 | 2.01 | |||||||||||||||||||||||||||||||||||||
12/31/2018 | 10.45 | .18 | (.15 | ) | .03 | (.20 | ) | — | (.20 | ) | 10.28 | .32 | 57 | .73 | .73 | 1.72 | ||||||||||||||||||||||||||||||||||||
Class 4: | ||||||||||||||||||||||||||||||||||||||||||||||||||||
12/31/2022 | 10.49 | .16 | (1.22 | ) | (1.06 | ) | (.18 | ) | — | (.18 | ) | 9.25 | (10.16 | ) | 40 | .94 | .79 | 1.66 | ||||||||||||||||||||||||||||||||||
12/31/2021 | 10.97 | .01 | (.09 | ) | (.08 | ) | (.03 | ) | (.37 | ) | (.40 | ) | 10.49 | (.78 | ) | 43 | .99 | .79 | .08 | |||||||||||||||||||||||||||||||||
12/31/2020 | 10.44 | .04 | .63 | .67 | (.12 | ) | (.02 | ) | (.14 | ) | 10.97 | 6.38 | 37 | .98 | .85 | .41 | ||||||||||||||||||||||||||||||||||||
12/31/2019 | 10.19 | .18 | .31 | .49 | (.24 | ) | — | (.24 | ) | 10.44 | 4.80 | 28 | .97 | .97 | 1.71 | |||||||||||||||||||||||||||||||||||||
12/31/2018 | 10.38 | .15 | (.15 | ) | — | 4 | (.19 | ) | — | (.19 | ) | 10.19 | .07 | 24 | .98 | .98 | 1.49 | |||||||||||||||||||||||||||||||||||
Refer to the end of the tables for footnotes.
364 American Funds Insurance Series
Table of Contents
Financial highlights (continued)
| Income (loss) from investment operations1 | Dividends and distributions | |||||||||||||||||||||||||||||||||||||||||||||||
| Year ended | Net asset value, beginning of year | Net investment (loss) | Net (losses) gains on securities (both realized and unrealized) | Total from investment operations | Dividends (from net investment income) | Distributions (from capital gains) | Total dividends and distributions | Net asset value, end of year | Total return | Net assets, end of year (in millions) | Ratio of expenses to average net assets | Ratio of net income (loss) to average net assets | ||||||||||||||||||||||||||||||||||||
Ultra-Short Bond Fund |
| |||||||||||||||||||||||||||||||||||||||||||||||
Class 1: | ||||||||||||||||||||||||||||||||||||||||||||||||
12/31/2022 | $ | 11.27 | $ | .17 | $ | (.01 | ) | $ | .16 | $ | (.08 | ) | $ | — | $ | (.08 | ) | $ | 11.35 | 1.42 | % | $ | 51 | .32 | % | 1.48 | % | |||||||||||||||||||||
12/31/2021 | 11.31 | (.03 | ) | (.01 | ) | (.04 | ) | — | — | — | 11.27 | (.35 | ) | 37 | .37 | (.28 | ) | |||||||||||||||||||||||||||||||
12/31/2020 | 11.30 | .02 | .02 | .04 | (.03 | ) | — | (.03 | ) | 11.31 | .34 | 44 | .37 | .16 | ||||||||||||||||||||||||||||||||||
12/31/2019 | 11.31 | .22 | — | 4 | .22 | (.23 | ) | — | (.23 | ) | 11.30 | 1.92 | 30 | .36 | 1.92 | |||||||||||||||||||||||||||||||||
12/31/2018 | 11.29 | .18 | — | 4 | .18 | (.16 | ) | — | (.16 | ) | 11.31 | 1.58 | 37 | .35 | 1.60 | |||||||||||||||||||||||||||||||||
Class 1A: | ||||||||||||||||||||||||||||||||||||||||||||||||
12/31/2022 | 11.28 | .16 | (.01 | ) | .15 | (.08 | ) | — | (.08 | ) | 11.35 | 1.32 | — | 6 | .31 | 1.40 | ||||||||||||||||||||||||||||||||
12/31/2021 | 11.31 | (.03 | ) | — | 4 | (.03 | ) | — | — | — | 11.28 | (.27 | ) | — | 6 | .36 | (.28 | ) | ||||||||||||||||||||||||||||||
12/31/2020 | 11.30 | .03 | .01 | .04 | (.03 | ) | — | (.03 | ) | 11.31 | .32 | — | 6 | .35 | .26 | |||||||||||||||||||||||||||||||||
12/31/2019 | 11.31 | .22 | — | 4 | .22 | (.23 | ) | — | (.23 | ) | 11.30 | 1.92 | — | 6 | .37 | 1.90 | ||||||||||||||||||||||||||||||||
12/31/2018 | 11.29 | .18 | — | 4 | .18 | (.16 | ) | — | (.16 | ) | 11.31 | 1.58 | — | 6 | .35 | 1.60 | ||||||||||||||||||||||||||||||||
Class 2: | ||||||||||||||||||||||||||||||||||||||||||||||||
12/31/2022 | 10.93 | .13 | — | 4 | .13 | (.06 | ) | — | (.06 | ) | 11.00 | 1.17 | 297 | .57 | 1.23 | |||||||||||||||||||||||||||||||||
12/31/2021 | 10.99 | (.06 | ) | — | 4 | (.06 | ) | — | — | — | 10.93 | (.55 | ) | 245 | .62 | (.53 | ) | |||||||||||||||||||||||||||||||
12/31/2020 | 11.01 | — | 4 | — | 4 | — | 4 | (.02 | ) | — | (.02 | ) | 10.99 | .03 | 288 | .62 | (.05 | ) | ||||||||||||||||||||||||||||||
12/31/2019 | 11.03 | .18 | — | 4 | .18 | (.20 | ) | — | (.20 | ) | 11.01 | 1.62 | 230 | .61 | 1.66 | |||||||||||||||||||||||||||||||||
12/31/2018 | 11.01 | .15 | — | 4 | .15 | (.13 | ) | — | (.13 | ) | 11.03 | 1.36 | 247 | .60 | 1.34 | |||||||||||||||||||||||||||||||||
Class 3: | ||||||||||||||||||||||||||||||||||||||||||||||||
12/31/2022 | 11.07 | .13 | — | 4 | .13 | (.06 | ) | — | (.06 | ) | 11.14 | 1.19 | 4 | .50 | 1.19 | |||||||||||||||||||||||||||||||||
12/31/2021 | 11.12 | (.05 | ) | — | 4 | (.05 | ) | — | — | — | 11.07 | (.45 | ) | 5 | .55 | (.46 | ) | |||||||||||||||||||||||||||||||
12/31/2020 | 11.13 | — | 4 | .02 | .02 | (.03 | ) | — | (.03 | ) | 11.12 | .13 | 4 | .55 | .03 | |||||||||||||||||||||||||||||||||
12/31/2019 | 11.14 | .20 | — | 4 | .20 | (.21 | ) | — | (.21 | ) | 11.13 | 1.76 | 3 | .54 | 1.74 | |||||||||||||||||||||||||||||||||
12/31/2018 | 11.12 | .16 | (.01 | ) | .15 | (.13 | ) | — | (.13 | ) | 11.14 | 1.38 | 4 | .53 | 1.42 | |||||||||||||||||||||||||||||||||
Class 4: | ||||||||||||||||||||||||||||||||||||||||||||||||
12/31/2022 | 11.00 | .12 | (.03 | ) | .09 | (.04 | ) | — | (.04 | ) | 11.05 | .83 | 80 | .82 | 1.05 | |||||||||||||||||||||||||||||||||
12/31/2021 | 11.08 | (.09 | ) | .01 | (.08 | ) | — | — | — | 11.00 | (.72 | ) | 46 | .87 | (.79 | ) | ||||||||||||||||||||||||||||||||
12/31/2020 | 11.13 | (.04 | ) | .01 | (.03 | ) | (.02 | ) | — | (.02 | ) | 11.08 | (.25 | ) | 40 | .87 | (.35 | ) | ||||||||||||||||||||||||||||||
12/31/2019 | 11.15 | .16 | — | 4 | .16 | (.18 | ) | — | (.18 | ) | 11.13 | 1.40 | 22 | .86 | 1.40 | |||||||||||||||||||||||||||||||||
12/31/2018 | 11.13 | .12 | .01 | .13 | (.11 | ) | — | (.11 | ) | 11.15 | 1.14 | 18 | .86 | 1.11 | ||||||||||||||||||||||||||||||||||
Refer to the end of the tables for footnotes.
American Funds Insurance Series 365
Table of Contents
Financial highlights (continued)
| (Loss) income from investment operations1 | Dividends and distributions | |||||||||||||||||||||||||||||||||||||||||||||||||||
| Year ended | Net asset value, beginning of year | Net investment income | Net (losses) gains on securities (both realized and unrealized) | Total from investment operations | Dividends (from net investment income) | Distributions (from capital gains) | Total dividends and distributions | Net asset value, end of year | Total return2 | Net assets, end of year (in millions) | Ratio of expenses to average net assets before waivers | Ratio of expenses to average net assets after waivers2 | Ratio of net income to average net assets2 | |||||||||||||||||||||||||||||||||||||||
U.S. Government Securities Fund |
| |||||||||||||||||||||||||||||||||||||||||||||||||||
Class 1: | ||||||||||||||||||||||||||||||||||||||||||||||||||||
12/31/2022 | $ | 11.67 | $ | .32 | $ | (1.56 | ) | $ | (1.24 | ) | $ | (.44 | ) | $ | — | $ | (.44 | ) | $ | 9.99 | (10.75 | )% | $ | 242 | .36 | % | .22 | % | 2.90 | % | ||||||||||||||||||||||
12/31/2021 | 13.04 | .18 | (.26 | ) | (.08 | ) | (.18 | ) | (1.11 | ) | (1.29 | ) | 11.67 | (.44 | ) | 522 | .39 | .29 | 1.50 | |||||||||||||||||||||||||||||||||
12/31/2020 | 12.34 | .16 | 1.07 | 1.23 | (.26 | ) | (.27 | ) | (.53 | ) | 13.04 | 10.09 | 429 | .38 | .38 | 1.21 | ||||||||||||||||||||||||||||||||||||
12/31/2019 | 11.94 | .25 | .43 | .68 | (.28 | ) | — | (.28 | ) | 12.34 | 5.69 | 1,418 | .37 | .37 | 2.07 | |||||||||||||||||||||||||||||||||||||
12/31/2018 | 12.08 | .24 | (.13 | ) | .11 | (.25 | ) | — | (.25 | ) | 11.94 | .91 | 1,445 | .36 | .36 | 2.02 | ||||||||||||||||||||||||||||||||||||
Class 1A: | ||||||||||||||||||||||||||||||||||||||||||||||||||||
12/31/2022 | 11.63 | .29 | (1.55 | ) | (1.26 | ) | (.41 | ) | — | (.41 | ) | 9.96 | (10.93 | ) | 4 | .60 | .47 | 2.70 | ||||||||||||||||||||||||||||||||||
12/31/2021 | 13.00 | .16 | (.26 | ) | (.10 | ) | (.16 | ) | (1.11 | ) | (1.27 | ) | 11.63 | (.65 | ) | 5 | .64 | .53 | 1.28 | |||||||||||||||||||||||||||||||||
12/31/2020 | 12.32 | .09 | 1.10 | 1.19 | (.24 | ) | (.27 | ) | (.51 | ) | 13.00 | 9.75 | 4 | .64 | .64 | .69 | ||||||||||||||||||||||||||||||||||||
12/31/2019 | 11.93 | .22 | .43 | .65 | (.26 | ) | — | (.26 | ) | 12.32 | 5.42 | 2 | .62 | .62 | 1.82 | |||||||||||||||||||||||||||||||||||||
12/31/2018 | 12.08 | .22 | (.14 | ) | .08 | (.23 | ) | — | (.23 | ) | 11.93 | .70 | 1 | .61 | .61 | 1.82 | ||||||||||||||||||||||||||||||||||||
Class 2: | ||||||||||||||||||||||||||||||||||||||||||||||||||||
12/31/2022 | 11.53 | .29 | (1.54 | ) | (1.25 | ) | (.41 | ) | — | (.41 | ) | 9.87 | (10.95 | ) | 1,059 | .61 | .47 | 2.69 | ||||||||||||||||||||||||||||||||||
12/31/2021 | 12.89 | .15 | (.25 | ) | (.10 | ) | (.15 | ) | (1.11 | ) | (1.26 | ) | 11.53 | (.62 | ) | 1,391 | .64 | .54 | 1.24 | |||||||||||||||||||||||||||||||||
12/31/2020 | 12.21 | .09 | 1.10 | 1.19 | (.24 | ) | (.27 | ) | (.51 | ) | 12.89 | 9.80 | 1,439 | .64 | .64 | .73 | ||||||||||||||||||||||||||||||||||||
12/31/2019 | 11.82 | .22 | .42 | .64 | (.25 | ) | — | (.25 | ) | 12.21 | 5.31 | 1,343 | .62 | .62 | 1.82 | |||||||||||||||||||||||||||||||||||||
12/31/2018 | 11.96 | .21 | (.14 | ) | .07 | (.21 | ) | — | (.21 | ) | 11.82 | .73 | 1,323 | .61 | .61 | 1.77 | ||||||||||||||||||||||||||||||||||||
Class 3: | ||||||||||||||||||||||||||||||||||||||||||||||||||||
12/31/2022 | 11.70 | .30 | (1.57 | ) | (1.27 | ) | (.41 | ) | — | (.41 | ) | 10.02 | (10.90 | ) | 6 | .54 | .40 | 2.76 | ||||||||||||||||||||||||||||||||||
12/31/2021 | 13.07 | .16 | (.26 | ) | (.10 | ) | (.16 | ) | (1.11 | ) | (1.27 | ) | 11.70 | (.62 | ) | 9 | .57 | .47 | 1.31 | |||||||||||||||||||||||||||||||||
12/31/2020 | 12.37 | .10 | 1.12 | 1.22 | (.25 | ) | (.27 | ) | (.52 | ) | 13.07 | 9.91 | 10 | .57 | .57 | .78 | ||||||||||||||||||||||||||||||||||||
12/31/2019 | 11.97 | .23 | .43 | .66 | (.26 | ) | — | (.26 | ) | 12.37 | 5.49 | 9 | .55 | .55 | 1.88 | |||||||||||||||||||||||||||||||||||||
12/31/2018 | 12.11 | .22 | (.14 | ) | .08 | (.22 | ) | — | (.22 | ) | 11.97 | .71 | 9 | .54 | .54 | 1.84 | ||||||||||||||||||||||||||||||||||||
Class 4: | ||||||||||||||||||||||||||||||||||||||||||||||||||||
12/31/2022 | 11.52 | .26 | (1.54 | ) | (1.28 | ) | (.38 | ) | — | (.38 | ) | 9.86 | (11.19 | ) | 190 | .85 | .72 | 2.45 | ||||||||||||||||||||||||||||||||||
12/31/2021 | 12.88 | .12 | (.25 | ) | (.13 | ) | (.12 | ) | (1.11 | ) | (1.23 | ) | 11.52 | (.88 | ) | 238 | .89 | .79 | .98 | |||||||||||||||||||||||||||||||||
12/31/2020 | 12.22 | .05 | 1.10 | 1.15 | (.22 | ) | (.27 | ) | (.49 | ) | 12.88 | 9.48 | 272 | .89 | .89 | .42 | ||||||||||||||||||||||||||||||||||||
12/31/2019 | 11.84 | .19 | .42 | .61 | (.23 | ) | — | (.23 | ) | 12.22 | 5.14 | 124 | .87 | .87 | 1.56 | |||||||||||||||||||||||||||||||||||||
12/31/2018 | 11.98 | .18 | (.12 | ) | .06 | (.20 | ) | — | (.20 | ) | 11.84 | .50 | 91 | .86 | .86 | 1.53 | ||||||||||||||||||||||||||||||||||||
Refer to the end of the tables for footnotes.
366 American Funds Insurance Series
Table of Contents
Financial highlights (continued)
| (Loss) income from investment operations1 | Dividends and distributions | |||||||||||||||||||||||||||||||||||||||||||||||||||||||
| Year ended | Net asset value, beginning of year | Net investment income (loss) | Net (losses) gains on securities (both realized and unrealized) | Total from Investment operations | Dividends (from net Investment income) | Distributions (from capital gains) | Total dividends and distributions | Net asset value, end of year | Total return2 | Net assets, end of year (in millions) | Ratio of expenses to average net assets before waivers/ reimburse- ments7 | Ratio of expenses to average net assets after waivers/ reimburse- ments2,7 | Net effective expense ratio2,8,9 | Ratio of net income to average net assets2 | ||||||||||||||||||||||||||||||||||||||||||
Managed Risk Growth Fund |
| |||||||||||||||||||||||||||||||||||||||||||||||||||||||
Class P1: | ||||||||||||||||||||||||||||||||||||||||||||||||||||||||
12/31/2022 | $ | 18.53 | $ | .06 | $ | (4.46 | ) | $ | (4.40 | ) | $ | (.22 | ) | $ | (2.54 | ) | $ | (2.76 | ) | $ | 11.37 | (24.62 | )% | $ | 9 | .41 | % | .36 | % | .69 | % | .47 | % | |||||||||||||||||||||||
12/31/2021 | 17.25 | .04 | 2.16 | 2.20 | (.18 | ) | (.74 | ) | (.92 | ) | 18.53 | 13.08 | 13 | .41 | .36 | .69 | .19 | |||||||||||||||||||||||||||||||||||||||
12/31/2020 | 13.78 | .07 | 4.20 | 4.27 | (.12 | ) | (.68 | ) | (.80 | ) | 17.25 | 32.45 | 11 | .42 | .37 | .72 | .49 | |||||||||||||||||||||||||||||||||||||||
12/31/2019 | 12.30 | .15 | 2.44 | 2.59 | (.19 | ) | (.92 | ) | (1.11 | ) | 13.78 | 22.01 | 6 | .42 | .37 | .73 | 1.19 | |||||||||||||||||||||||||||||||||||||||
12/31/2018 | 13.22 | .11 | (.04 | ) | .07 | (.10 | ) | (.89 | ) | (.99 | ) | 12.30 | (.04 | )10 | 3 | .42 | 10 | .37 | 10 | .71 | 10 | .82 | 10 | |||||||||||||||||||||||||||||||||
Class P2: | ||||||||||||||||||||||||||||||||||||||||||||||||||||||||
12/31/2022 | 18.42 | .03 | (4.45 | ) | (4.42 | ) | (.18 | ) | (2.54 | ) | (2.72 | ) | 11.28 | (24.88 | ) | 445 | .67 | .62 | .95 | .20 | ||||||||||||||||||||||||||||||||||||
12/31/2021 | 17.11 | (.01 | ) | 2.16 | 2.15 | (.10 | ) | (.74 | ) | (.84 | ) | 18.42 | 12.89 | 584 | .67 | .62 | .95 | (.07 | ) | |||||||||||||||||||||||||||||||||||||
12/31/2020 | 13.71 | .03 | 4.16 | 4.19 | (.11 | ) | (.68 | ) | (.79 | ) | 17.11 | 32.03 | 554 | .67 | .62 | .97 | .20 | |||||||||||||||||||||||||||||||||||||||
12/31/2019 | 12.21 | .09 | 2.45 | 2.54 | (.12 | ) | (.92 | ) | (1.04 | ) | 13.71 | 21.74 | 434 | .68 | .63 | .99 | .73 | |||||||||||||||||||||||||||||||||||||||
12/31/2018 | 13.14 | .06 | (.04 | ) | .02 | (.06 | ) | (.89 | ) | (.95 | ) | 12.21 | (.37 | ) | 340 | .68 | .63 | .97 | .46 | |||||||||||||||||||||||||||||||||||||
Managed Risk International Fund |
| |||||||||||||||||||||||||||||||||||||||||||||||||||||||
Class P1: | ||||||||||||||||||||||||||||||||||||||||||||||||||||||||
12/31/2022 | $ | 10.55 | $ | .15 | $ | (1.75 | ) | $ | (1.60 | ) | $ | (.34 | ) | $ | — | $ | (.34 | ) | $ | 8.61 | (15.27 | )%10 | $ | 2 | .44 | %10 | .37 | %10 | .87 | %10 | 1.70 | %10 | ||||||||||||||||||||||||
12/31/2021 | 11.07 | .24 | (.67 | ) | (.43 | ) | (.09 | ) | — | (.09 | ) | 10.55 | (3.92 | )10 | 2 | .44 | 10 | .36 | 10 | .87 | 10 | 2.12 | 10 | |||||||||||||||||||||||||||||||||
12/31/2020 | 11.01 | .08 | .22 | .30 | (.16 | ) | (.08 | ) | (.24 | ) | 11.07 | 3.13 | 10 | 2 | .43 | 10 | .35 | 10 | .86 | 10 | .82 | 10 | ||||||||||||||||||||||||||||||||||
12/31/2019 | 9.82 | .17 | 1.54 | 1.71 | (.20 | ) | (.32 | ) | (.52 | ) | 11.01 | 17.91 | 10 | 1 | .41 | 10 | .33 | 10 | .84 | 10 | 1.64 | 10 | ||||||||||||||||||||||||||||||||||
12/31/2018 | 11.25 | .32 | (1.44 | ) | (1.12 | ) | (.26 | ) | (.05 | ) | (.31 | ) | 9.82 | (10.11 | )10 | — | 6 | .33 | 10 | .28 | 10 | .77 | 10 | 3.02 | 10 | |||||||||||||||||||||||||||||||
Class P2: | ||||||||||||||||||||||||||||||||||||||||||||||||||||||||
12/31/2022 | 10.48 | .12 | (1.74 | ) | (1.62 | ) | (.28 | ) | — | (.28 | ) | 8.58 | (15.54 | ) | 124 | .70 | .63 | 1.13 | 1.36 | |||||||||||||||||||||||||||||||||||||
12/31/2021 | 10.99 | .20 | (.65 | ) | (.45 | ) | (.06 | ) | — | (.06 | ) | 10.48 | (4.13 | ) | 160 | .71 | .63 | 1.14 | 1.79 | |||||||||||||||||||||||||||||||||||||
12/31/2020 | 10.92 | .04 | .23 | .27 | (.12 | ) | (.08 | ) | (.20 | ) | 10.99 | 2.80 | 168 | .71 | .63 | 1.14 | .42 | |||||||||||||||||||||||||||||||||||||||
12/31/2019 | 9.76 | .13 | 1.55 | 1.68 | (.20 | ) | (.32 | ) | (.52 | ) | 10.92 | 17.64 | 165 | .71 | .63 | 1.14 | 1.21 | |||||||||||||||||||||||||||||||||||||||
12/31/2018 | 11.15 | .16 | (1.32 | ) | (1.16 | ) | (.18 | ) | (.05 | ) | (.23 | ) | 9.76 | (10.50 | ) | 151 | .69 | .64 | 1.13 | 1.49 | ||||||||||||||||||||||||||||||||||||
Managed Risk Washington Mutual Investors Fund |
| |||||||||||||||||||||||||||||||||||||||||||||||||||||||
Class P1: | ||||||||||||||||||||||||||||||||||||||||||||||||||||||||
12/31/2022 | $ | 12.95 | $ | .23 | $ | (1.38 | ) | $ | (1.15 | ) | $ | (.56 | ) | $ | — | $ | (.56 | ) | $ | 11.24 | (8.92 | )%10 | $ | 3 | .41 | %10 | .36 | %10 | .75 | %10 | 1.96 | %10 | ||||||||||||||||||||||||
12/31/2021 | 11.24 | .16 | 1.79 | 1.95 | (.24 | ) | — | (.24 | ) | 12.95 | 17.46 | 10 | 2 | .41 | 10 | .36 | 10 | .77 | 10 | 1.33 | 10 | |||||||||||||||||||||||||||||||||||
12/31/2020 | 12.01 | .18 | (.35 | ) | (.17 | ) | (.26 | ) | (.34 | ) | (.60 | ) | 11.24 | (.93 | )10 | 2 | .40 | 10 | .35 | 10 | .76 | 10 | 1.66 | 10 | ||||||||||||||||||||||||||||||||
12/31/2019 | 11.28 | .25 | 1.28 | 1.53 | (.20 | ) | (.60 | ) | (.80 | ) | 12.01 | 14.14 | 10 | 1 | .38 | 10 | .33 | 10 | .74 | 10 | 2.14 | 10 | ||||||||||||||||||||||||||||||||||
12/31/2018 | 13.04 | .40 | (1.27 | ) | (.87 | ) | (.45 | ) | (.44 | ) | (.89 | ) | 11.28 | (6.99 | )10 | — | 6 | .33 | 10 | .28 | 10 | .67 | 10 | 3.21 | 10 | |||||||||||||||||||||||||||||||
Class P2: | ||||||||||||||||||||||||||||||||||||||||||||||||||||||||
12/31/2022 | 12.88 | .19 | (1.37 | ) | (1.18 | ) | (.52 | ) | — | (.52 | ) | 11.18 | (9.16 | ) | 321 | .67 | .62 | 1.01 | 1.62 | |||||||||||||||||||||||||||||||||||||
12/31/2021 | 11.18 | .11 | 1.79 | 1.90 | (.20 | ) | — | (.20 | ) | 12.88 | 17.11 | 371 | .68 | .62 | 1.03 | .91 | ||||||||||||||||||||||||||||||||||||||||
12/31/2020 | 11.91 | .13 | (.33 | ) | (.20 | ) | (.19 | ) | (.34 | ) | (.53 | ) | 11.18 | (1.25 | ) | 355 | .68 | .63 | 1.04 | 1.18 | ||||||||||||||||||||||||||||||||||||
12/31/2019 | 11.21 | .18 | 1.31 | 1.49 | (.19 | ) | (.60 | ) | (.79 | ) | 11.91 | 13.88 | 365 | .68 | .63 | 1.04 | 1.62 | |||||||||||||||||||||||||||||||||||||||
12/31/2018 | 12.96 | .19 | (1.10 | ) | (.91 | ) | (.40 | ) | (.44 | ) | (.84 | ) | 11.21 | (7.38 | ) | 336 | .68 | .63 | 1.02 | 1.49 | ||||||||||||||||||||||||||||||||||||
Refer to the end of the tables for footnotes.
American Funds Insurance Series 367
Table of Contents
Financial highlights (continued)
| (Loss) income from investment operations1 | Dividends and distributions | |||||||||||||||||||||||||||||||||||||||||||||||||||||||
| Year ended | Net asset value, beginning of year | Net investment income (loss) | Net (losses) gains on securities (both realized and unrealized) | Total from Investment operations | Dividends investment income) | Distributions (from capital gains) | Total dividends and distributions | Net asset value, end of year | Total return2 | Net assets, end of year (in millions) | Ratio of expenses to average net assets before waivers/ reimburse- ments7 | Ratio of expenses to average net assets after waivers/ reimburse- ments2,7 | Net effective expense ratio2,8,9 | Ratio of net income | ||||||||||||||||||||||||||||||||||||||||||
Managed Risk Growth-Income Fund |
| |||||||||||||||||||||||||||||||||||||||||||||||||||||||
Class P1: | ||||||||||||||||||||||||||||||||||||||||||||||||||||||||
12/31/2022 | $ | 15.73 | $ | .18 | $ | (2.79 | ) | $ | (2.61 | ) | $ | (.30 | ) | $ | (.31 | ) | $ | (.61 | ) | $ | 12.51 | (16.74 | )% | $ | 1,833 | .41 | % | .36 | % | .65 | % | 1.33 | % | |||||||||||||||||||||||
12/31/2021 | 14.01 | .14 | 1.99 | 2.13 | (.21 | ) | (.20 | ) | (.41 | ) | 15.73 | 15.32 | 2,328 | .41 | .36 | .66 | .96 | |||||||||||||||||||||||||||||||||||||||
12/31/2020 | 13.76 | .17 | 1.08 | 1.25 | (.26 | ) | (.74 | ) | (1.00 | ) | 14.01 | 9.85 | 2,120 | .41 | .36 | .66 | 1.24 | |||||||||||||||||||||||||||||||||||||||
12/31/2019 | 11.73 | .22 | 2.01 | 2.23 | (.10 | ) | (.10 | ) | (.20 | ) | 13.76 | 19.14 | 1,987 | .42 | .37 | .67 | 1.71 | |||||||||||||||||||||||||||||||||||||||
12/31/2018 | 12.66 | (.02 | ) | (.15 | ) | (.17 | ) | (.19 | ) | (.57 | ) | (.76 | ) | 11.73 | (1.66 | ) | 1,662 | .40 | .35 | .64 | (.20 | ) | ||||||||||||||||||||||||||||||||||
Class P2: | ||||||||||||||||||||||||||||||||||||||||||||||||||||||||
12/31/2022 | 15.64 | .15 | (2.78 | ) | (2.63 | ) | (.26 | ) | (.31 | ) | (.57 | ) | 12.44 | (16.93 | ) | 268 | .66 | .61 | .90 | 1.10 | ||||||||||||||||||||||||||||||||||||
12/31/2021 | 13.93 | .10 | 1.98 | 2.08 | (.17 | ) | (.20 | ) | (.37 | ) | 15.64 | 15.05 | 340 | .66 | .61 | .91 | �� | .70 | ||||||||||||||||||||||||||||||||||||||
12/31/2020 | 13.69 | .14 | 1.07 | 1.21 | (.23 | ) | (.74 | ) | (.97 | ) | 13.93 | 9.58 | 315 | .66 | .61 | .91 | 1.02 | |||||||||||||||||||||||||||||||||||||||
12/31/2019 | 11.67 | .19 | 2.00 | 2.19 | (.07 | ) | (.10 | ) | (.17 | ) | 13.69 | 18.84 | 283 | .67 | .62 | .92 | 1.47 | |||||||||||||||||||||||||||||||||||||||
12/31/2018 | 12.58 | .16 | (.36 | ) | (.20 | ) | (.14 | ) | (.57 | ) | (.71 | ) | 11.67 | (1.97 | ) | 230 | .69 | .64 | .93 | 1.25 | ||||||||||||||||||||||||||||||||||||
Managed Risk Asset Allocation Fund |
| |||||||||||||||||||||||||||||||||||||||||||||||||||||||
Class P1: | ||||||||||||||||||||||||||||||||||||||||||||||||||||||||
12/31/2022 | $ | 15.33 | $ | .24 | $ | (2.34 | ) | $ | (2.10 | ) | $ | (.32 | ) | $ | (.48 | ) | $ | (.80 | ) | $ | 12.43 | (13.75 | )% | $ | 7 | .41 | % | .36 | % | .64 | % | 1.80 | % | |||||||||||||||||||||||
12/31/2021 | 13.84 | .21 | 1.55 | 1.76 | (.27 | ) | — | (.27 | ) | 15.33 | 12.82 | 7 | .41 | .36 | .66 | 1.43 | ||||||||||||||||||||||||||||||||||||||||
12/31/2020 | 13.81 | .25 | .51 | .76 | (.21 | ) | (.52 | ) | (.73 | ) | 13.84 | 6.10 | 5 | .41 | .36 | .66 | 1.91 | |||||||||||||||||||||||||||||||||||||||
12/31/2019 | 12.23 | .26 | 1.92 | 2.18 | (.03 | ) | (.57 | ) | (.60 | ) | 13.81 | 18.25 | 2 | .41 | .36 | .65 | 2.01 | |||||||||||||||||||||||||||||||||||||||
12/31/2018 | 13.59 | .22 | (.80 | ) | (.58 | ) | (.25 | ) | (.53 | ) | (.78 | ) | 12.23 | (4.63 | ) | 2 | .37 | .32 | .59 | 1.67 | ||||||||||||||||||||||||||||||||||||
Class P2: | ||||||||||||||||||||||||||||||||||||||||||||||||||||||||
12/31/2022 | 14.93 | .18 | (2.25 | ) | (2.07 | ) | (.29 | ) | (.48 | ) | (.77 | ) | 12.09 | (13.97 | ) | 2,182 | .66 | .61 | .89 | 1.40 | ||||||||||||||||||||||||||||||||||||
12/31/2021 | 13.45 | .15 | 1.53 | 1.68 | (.20 | ) | — | (.20 | ) | 14.93 | 12.50 | 2,812 | .66 | .61 | .91 | 1.03 | ||||||||||||||||||||||||||||||||||||||||
12/31/2020 | 13.46 | .15 | .56 | .71 | (.20 | ) | (.52 | ) | (.72 | ) | 13.45 | 5.88 | 2,773 | .66 | .61 | .91 | 1.15 | |||||||||||||||||||||||||||||||||||||||
12/31/2019 | 12.22 | .19 | 1.93 | 2.12 | (.31 | ) | (.57 | ) | (.88 | ) | 13.46 | 17.98 | 2,830 | .66 | .61 | .90 | 1.51 | |||||||||||||||||||||||||||||||||||||||
12/31/2018 | 13.55 | .17 | (.79 | ) | (.62 | ) | (.18 | ) | (.53 | ) | (.71 | ) | 12.22 | (4.89 | ) | 2,541 | .62 | .57 | .84 | 1.27 | ||||||||||||||||||||||||||||||||||||
Refer to the end of the tables for footnotes.
368 American Funds Insurance Series
Table of Contents
Financial highlights (continued)
Portfolio turnover rate for all share classes excluding mortgage dollar roll transactions11,12 | Year ended December 31, | |||||||||||||||||||
| 2022 | 2021 | 2020 | 2019 | 2018 | ||||||||||||||||
Capital Income Builder | 48 | % | 60 | % | 110 | % | 44 | % | 42 | % | ||||||||||
Asset Allocation Fund | 42 | 45 | 49 | 47 | 34 | |||||||||||||||
American Funds Global Balanced Fund | 111 | 36 | 68 | 60 | 30 | |||||||||||||||
The Bond Fund of America | 77 | 87 | 72 | 146 | 98 | |||||||||||||||
Capital World Bond Fund | 114 | 64 | 88 | 110 | 78 | |||||||||||||||
American Funds Mortgage Fund | 56 | 38 | 123 | 84 | 60 | |||||||||||||||
U.S. Government Securities Fund | 77 | 126 | 112 | 103 | 76 | |||||||||||||||
Portfolio turnover rate for all share classes including mortgage dollar roll transactions11,12 | Year ended December 31, | |||||||||||||||||||
| 2022 | 2021 | 2020 | 2019 | 2018 | ||||||||||||||||
Global Growth Fund | 29 | % | 18 | % | 17 | % | 14 | % | 25 | % | ||||||||||
Global Small Capitalization Fund | 40 | 29 | 38 | 50 | 43 | |||||||||||||||
Growth Fund | 29 | 25 | 32 | 21 | 35 | |||||||||||||||
International Fund | 42 | 44 | 40 | 32 | 29 | |||||||||||||||
New World Fund | 40 | 43 | 70 | 38 | 58 | |||||||||||||||
Washington Mutual Investors Fund | 30 | 90 | 40 | 37 | 49 | |||||||||||||||
Capital World Growth and Income Fund | 42 | 85 | 36 | 29 | 49 | |||||||||||||||
Growth-Income Fund | 25 | 24 | 33 | 27 | 39 | |||||||||||||||
International Growth and Income Fund | 48 | 41 | 56 | 28 | 38 | |||||||||||||||
Capital Income Builder | 126 | 93 | 184 | 72 | 98 | |||||||||||||||
Asset Allocation Fund | 118 | 124 | 145 | 79 | 86 | |||||||||||||||
American Funds Global Balanced Fund | 126 | 39 | 86 | 74 | 51 | |||||||||||||||
The Bond Fund of America | 415 | 456 | 461 | 373 | 514 | |||||||||||||||
Capital World Bond Fund | 188 | 91 | 145 | 159 | 125 | |||||||||||||||
American High-Income Trust | 34 | 56 | 78 | 58 | 67 | |||||||||||||||
American Funds Mortgage Fund | 1141 | 975 | 1143 | 350 | 811 | |||||||||||||||
Ultra-Short Bond Fund | — | 13 | — | 13 | — | 13 | — | 13 | — | 13 | ||||||||||
U.S. Government Securities Fund | 695 | 433 | 867 | 277 | 446 | |||||||||||||||
Managed Risk Growth Fund | 97 | 32 | 80 | 10 | 7 | |||||||||||||||
Managed Risk International Fund | 82 | 24 | 71 | 8 | 8 | |||||||||||||||
Managed Risk Washington Mutual Investors Fund | 70 | 16 | 101 | 13 | 11 | |||||||||||||||
Managed Risk Growth-Income Fund | 67 | 13 | 38 | 6 | 14 | |||||||||||||||
Managed Risk Asset Allocation Fund | 48 | 5 | 30 | 8 | 12 | |||||||||||||||
| 1 | Based on average shares outstanding. |
| 2 | This column reflects the impact of certain waivers/reimbursements from CRMC. During some of the years shown, CRMC waived a portion of investment advisory services fees on some funds, including each of the managed risk funds. In addition, during some of the years shown, CRMC reimbursed a portion of miscellaneous fees and expenses for some of the managed risk funds. |
| 3 | Ratios do not include expenses of any Central Funds. The fund indirectly bears its proportionate share of the expenses of any Central Funds, if applicable. |
| 4 | Amount less than $.01. |
| 5 | Amount less than .01%. |
| 6 | Amount less than $1 million. |
| 7 | This column does not include expenses of the underlying funds in which each fund invests. |
| 8 | This column reflects the net effective expense ratios for each fund and class, which include each class’s expense ratio combined with the weighted average net expense ratio of the underlying funds for the periods presented. Refer to the expense example for further information regarding fees and expenses. |
| 9 | Unaudited. |
| 10 | All or a significant portion of assets in this class consisted of seed capital invested by CRMC and/or its affiliates. Certain fees (including, where applicable, fees for distribution services) are not charged or accrued on these seed capital assets. If such fees were paid by the fund on seed capital assets, fund expenses would have been higher and net income and total return would have been lower. |
| 11 | Refer to Note 5 for further information on mortgage dollar rolls. |
| 12 | Rates do not include the fund’s portfolio activity with respect to any Central Funds, if applicable. |
| 13 | Amount is either less than 1% or there is no turnover. |
Refer to the notes to financial statements.
American Funds Insurance Series 369
Table of Contents
Report of Independent Registered Public Accounting Firm
To the Board of Trustees of American Funds Insurance Series and Shareholders of Global Growth Fund, Global Small Capitalization Fund, Growth Fund, International Fund, New World Fund®, Washington Mutual Investors Fund, Capital World Growth and Income Fund®, Growth-Income Fund, International Growth and Income Fund, Capital Income Builder®, Asset Allocation Fund, American Funds® Global Balanced Fund, The Bond Fund of America®, Capital World Bond Fund®, American High-Income Trust®, American Funds Mortgage Fund®, Ultra-Short Bond Fund, U.S. Government Securities Fund®, Managed Risk Growth Fund, Managed Risk International Fund, Managed Risk Washington Mutual Investors Fund, Managed Risk Growth-Income Fund and Managed Risk Asset Allocation Fund
Opinions on the Financial Statements
We have audited the accompanying statements of assets and liabilities, including the investment portfolios, of Global Growth Fund, Global Small Capitalization Fund, Growth Fund, International Fund, New World Fund®, Washington Mutual Investors Fund, Capital World Growth and Income Fund®, Growth-Income Fund, International Growth and Income Fund, Capital Income Builder®, Asset Allocation Fund, American Funds® Global Balanced Fund (formerly Global Balanced Fund), The Bond Fund of America®, Capital World Bond Fund®, American High Income Trust®, American Funds Mortgage Fund®, Ultra-Short Bond Fund, U.S. Government Securities Fund®, Managed Risk Growth Fund, Managed Risk International Fund, Managed Risk Washington Mutual Investors Fund, Managed Risk Growth-Income Fund and Managed Risk Asset Allocation Fund (twenty-three of the funds constituting American Funds Insurance Series, hereafter collectively referred to as the “Funds“) as of December 31, 2022, the related statements of operations for the year ended December 31, 2022, the statements of changes in net assets for each of the two years in the period ended December 31, 2022, including the related notes, and the financial highlights for each of the five years in the period ended December 31, 2022 (collectively referred to as the “financial statements”). In our opinion, the financial statements present fairly, in all material respects, the financial position of each of the Funds as of December 31, 2022, the results of each of their operations for the year then ended, the changes in each of their net assets for each of the two years in the period ended December 31, 2022 and each of the financial highlights for each of the five years in the period ended December 31, 2022 in conformity with accounting principles generally accepted in the United States of America.
Basis for Opinions
These financial statements are the responsibility of the Funds’ management. Our responsibility is to express an opinion on the Funds’ financial statements based on our audits. We are a public accounting firm registered with the Public Company Accounting Oversight Board (United States) (PCAOB) and are required to be independent with respect to the Funds in accordance with the U.S. federal securities laws and the applicable rules and regulations of the Securities and Exchange Commission and the PCAOB.
We conducted our audits of these financial statements in accordance with the standards of the PCAOB. Those standards require that we plan and perform the audit to obtain reasonable assurance about whether the financial statements are free of material misstatement, whether due to error or fraud.
Our audits included performing procedures to assess the risks of material misstatement of the financial statements, whether due to error or fraud, and performing procedures that respond to those risks. Such procedures included examining, on a test basis, evidence regarding the amounts and disclosures in the financial statements. Our audits also included evaluating the accounting principles used and significant estimates made by management, as well as evaluating the overall presentation of the financial statements. Our procedures included confirmation of securities owned as of December 31, 2022 by correspondence with the custodian, transfer agent and brokers; when replies were not received from brokers, we performed other auditing procedures. We believe that our audits provide a reasonable basis for our opinions.
/s/PricewaterhouseCoopers LLP
Los Angeles, California
February 13, 2023
We have served as the auditor of one or more investment companies in The Capital Group Companies Investment Company Complex since 1934.
370 American Funds Insurance Series
Table of Contents
| Expense example | unaudited |
The funds in American Funds Insurance Series serve as the underlying investment vehicle for various insurance products. As an owner of an insurance contract that invests in one of the funds in the series, you incur two types of costs: (1) transaction costs, such as initial sales charges on purchase payments and contingent deferred sales charges on redemptions (loads), and (2) ongoing costs, including management fees, distribution and service (12b-1) fees, and other expenses. Additional fees are charged by the insurance companies related to the various benefits they provide. This example is intended to help you understand your ongoing costs (in dollars) of investing in the underlying funds so you can compare these costs with the ongoing costs of investing in other mutual funds that serve a similar function in other annuity products. The example is based on an investment of $1,000 invested at the beginning of the period and held for the entire six-month period (July 1, 2022, through December 31, 2022).
Actual expenses:
The first line of each share class in the tables on the following pages provides information about actual account values and actual expenses. You may use the information in this line, together with the amount you invested, to estimate the expenses that you paid over the period. Simply divide your account value by $1,000 (for example, an $8,600 account value divided by $1,000 = 8.6), then multiply the result by the number in the first line under the heading titled “Expenses paid during period” to estimate the expenses you paid on your account during this period.
Hypothetical example for comparison purposes:
The second line of each share class in the tables on the following pages provides information about hypothetical account values and hypothetical expenses based on the actual expense ratio for the share class and an assumed rate of return of 5.00% per year before expenses, which is not the actual return of the share class. The hypothetical account values and expenses may not be used to estimate the actual ending account balance or expenses you paid for the period. You may use this information to compare the ongoing costs of investing in the fund and other funds. To do so, compare this 5.00% hypothetical example with the 5.00% hypothetical examples that appear in the shareholder reports of the other funds.
Notes:
Additional fees are charged by the insurance companies related to the various benefits they provide. You can estimate the impact of these fees by adding the amount of the fees to the total estimated expenses you paid on your account during the period as calculated above. In addition, your ending account value would be lower by the amount of these fees.
Note that the expenses shown in the tables on the following pages are meant to highlight your ongoing costs only and do not reflect any transactional costs. Therefore, the second line of each share class in the tables is useful in comparing ongoing costs only and will not help you determine the relative total costs of owning different funds. In addition, if these transactional costs were included, your costs would have been higher.
American Funds Insurance Series 371
Table of Contents
Expense example (continued)
Beginning account value 7/1/2022 | Ending account value 12/31/2022 | Expenses paid during period1 | Annualized expense ratio | |||||||||||||
Global Growth Fund | ||||||||||||||||
Class 1 — actual return | $ | 1,000.00 | $ | 1,045.68 | $ | 2.11 | .41 | % | ||||||||
Class 1 — assumed 5% return | 1,000.00 | 1,023.14 | 2.09 | .41 | ||||||||||||
Class 1A — actual return | 1,000.00 | 1,044.04 | 3.40 | .66 | ||||||||||||
Class 1A — assumed 5% return | 1,000.00 | 1,021.88 | 3.36 | .66 | ||||||||||||
Class 2 — actual return | 1,000.00 | 1,043.99 | 3.40 | .66 | ||||||||||||
Class 2 — assumed 5% return | 1,000.00 | 1,021.88 | 3.36 | .66 | ||||||||||||
Class 4 — actual return | 1,000.00 | 1,042.74 | 4.69 | .91 | ||||||||||||
Class 4 — assumed 5% return | 1,000.00 | 1,020.62 | 4.63 | .91 | ||||||||||||
Global Small Capitalization Fund | ||||||||||||||||
Class 1 — actual return | $ | 1,000.00 | $ | 1,038.40 | $ | 3.34 | .65 | % | ||||||||
Class 1 — assumed 5% return | 1,000.00 | 1,021.93 | 3.31 | .65 | ||||||||||||
Class 1A — actual return | 1,000.00 | 1,036.94 | 4.62 | .90 | ||||||||||||
Class 1A — assumed 5% return | 1,000.00 | 1,020.67 | 4.58 | .90 | ||||||||||||
Class 2 — actual return | 1,000.00 | 1,037.29 | 4.62 | .90 | ||||||||||||
Class 2 — assumed 5% return | 1,000.00 | 1,020.67 | 4.58 | .90 | ||||||||||||
Class 4 — actual return | 1,000.00 | 1,035.94 | 5.90 | 1.15 | ||||||||||||
Class 4 — assumed 5% return | 1,000.00 | 1,019.41 | 5.85 | 1.15 | ||||||||||||
Growth Fund | ||||||||||||||||
Class 1 — actual return | $ | 1,000.00 | $ | 1,000.70 | $ | 1.77 | .35 | % | ||||||||
Class 1 — assumed 5% return | 1,000.00 | 1,023.44 | 1.79 | .35 | ||||||||||||
Class 1A — actual return | 1,000.00 | 999.41 | 3.02 | .60 | ||||||||||||
Class 1A — assumed 5% return | 1,000.00 | 1,022.18 | 3.06 | .60 | ||||||||||||
Class 2 — actual return | 1,000.00 | 999.43 | 3.02 | .60 | ||||||||||||
Class 2 — assumed 5% return | 1,000.00 | 1,022.18 | 3.06 | .60 | ||||||||||||
Class 3 — actual return | 1,000.00 | 999.93 | 2.67 | .53 | ||||||||||||
Class 3 — assumed 5% return | 1,000.00 | 1,022.53 | 2.70 | .53 | ||||||||||||
Class 4 — actual return | 1,000.00 | 998.12 | 4.28 | .85 | ||||||||||||
Class 4 — assumed 5% return | 1,000.00 | 1,020.92 | 4.33 | .85 | ||||||||||||
International Fund | ||||||||||||||||
Class 1 — actual return | $ | 1,000.00 | $ | 1,025.33 | $ | 2.71 | .53 | % | ||||||||
Class 1 — assumed 5% return | 1,000.00 | 1,022.53 | 2.70 | .53 | ||||||||||||
Class 1A — actual return | 1,000.00 | 1,024.07 | 3.98 | .78 | ||||||||||||
Class 1A — assumed 5% return | 1,000.00 | 1,021.27 | 3.97 | .78 | ||||||||||||
Class 2 — actual return | 1,000.00 | 1,023.84 | 3.98 | .78 | ||||||||||||
Class 2 — assumed 5% return | 1,000.00 | 1,021.27 | 3.97 | .78 | ||||||||||||
Class 3 — actual return | 1,000.00 | 1,024.24 | 3.62 | .71 | ||||||||||||
Class 3 — assumed 5% return | 1,000.00 | 1,021.63 | 3.62 | .71 | ||||||||||||
Class 4 — actual return | 1,000.00 | 1,022.83 | 5.25 | 1.03 | ||||||||||||
Class 4 — assumed 5% return | 1,000.00 | 1,020.01 | 5.24 | 1.03 | ||||||||||||
New World Fund | ||||||||||||||||
Class 1 — actual return | $ | 1,000.00 | $ | 1,024.46 | $ | 2.91 | .57 | % | ||||||||
Class 1 — assumed 5% return | 1,000.00 | 1,022.33 | 2.91 | .57 | ||||||||||||
Class 1A — actual return | 1,000.00 | 1,022.80 | 4.18 | .82 | ||||||||||||
Class 1A — assumed 5% return | 1,000.00 | 1,021.07 | 4.18 | .82 | ||||||||||||
Class 2 — actual return | 1,000.00 | 1,022.92 | 4.18 | .82 | ||||||||||||
Class 2 — assumed 5% return | 1,000.00 | 1,021.07 | 4.18 | .82 | ||||||||||||
Class 4 — actual return | 1,000.00 | 1,021.54 | 5.45 | 1.07 | ||||||||||||
Class 4 — assumed 5% return | 1,000.00 | 1,019.81 | 5.45 | 1.07 | ||||||||||||
Refer to the end of the tables for footnotes.
372 American Funds Insurance Series
Table of Contents
Expense example (continued)
Beginning account value 7/1/2022 | Ending account value 12/31/2022 | Expenses paid during period1 | Annualized expense ratio | |||||||||||||
Washington Mutual Investors Fund | ||||||||||||||||
Class 1 — actual return | $ | 1,000.00 | $ | 1,052.84 | $ | 1.40 | .27 | % | ||||||||
Class 1 — assumed 5% return | 1,000.00 | 1,023.84 | 1.38 | .27 | ||||||||||||
Class 1A — actual return | 1,000.00 | 1,052.10 | 2.69 | .52 | ||||||||||||
Class 1A — assumed 5% return | 1,000.00 | 1,022.58 | 2.65 | .52 | ||||||||||||
Class 2 — actual return | 1,000.00 | 1,052.45 | 2.69 | .52 | ||||||||||||
Class 2 — assumed 5% return | 1,000.00 | 1,022.58 | 2.65 | .52 | ||||||||||||
Class 4 — actual return | 1,000.00 | 1,051.21 | 3.98 | .77 | ||||||||||||
Class 4 — assumed 5% return | 1,000.00 | 1,021.32 | 3.92 | .77 | ||||||||||||
Capital World Growth and Income Fund | ||||||||||||||||
Class 1 — actual return | $ | 1,000.00 | $ | 1,051.64 | $ | 2.12 | .41 | % | ||||||||
Class 1 — assumed 5% return | 1,000.00 | 1,023.14 | 2.09 | .41 | ||||||||||||
Class 1A — actual return | 1,000.00 | 1,050.71 | 3.41 | .66 | ||||||||||||
Class 1A — assumed 5% return | 1,000.00 | 1,021.88 | 3.36 | .66 | ||||||||||||
Class 2 — actual return | 1,000.00 | 1,050.34 | 3.41 | .66 | ||||||||||||
Class 2 — assumed 5% return | 1,000.00 | 1,021.88 | 3.36 | .66 | ||||||||||||
Class 4 — actual return | 1,000.00 | 1,048.71 | 4.70 | .91 | ||||||||||||
Class 4 — assumed 5% return | 1,000.00 | 1,020.62 | 4.63 | .91 | ||||||||||||
Growth-Income Fund | ||||||||||||||||
Class 1 — actual return | $ | 1,000.00 | $ | 1,042.31 | $ | 1.49 | .29 | % | ||||||||
Class 1 — assumed 5% return | 1,000.00 | 1,023.74 | 1.48 | .29 | ||||||||||||
Class 1A — actual return | 1,000.00 | 1,041.04 | 2.78 | .54 | ||||||||||||
Class 1A — assumed 5% return | 1,000.00 | 1,022.48 | 2.75 | .54 | ||||||||||||
Class 2 — actual return | 1,000.00 | 1,041.03 | 2.78 | .54 | ||||||||||||
Class 2 — assumed 5% return | 1,000.00 | 1,022.48 | 2.75 | .54 | ||||||||||||
Class 3 — actual return | 1,000.00 | 1,041.33 | 2.42 | .47 | ||||||||||||
Class 3 — assumed 5% return | 1,000.00 | 1,022.84 | 2.40 | .47 | ||||||||||||
Class 4 — actual return | 1,000.00 | 1,039.68 | 4.06 | .79 | ||||||||||||
Class 4 — assumed 5% return | 1,000.00 | 1,021.22 | 4.02 | .79 | ||||||||||||
International Growth and Income Fund | ||||||||||||||||
Class 1 — actual return | $ | 1,000.00 | $ | 1,049.28 | $ | 3.00 | .58 | % | ||||||||
Class 1 — assumed 5% return | 1,000.00 | 1,022.28 | 2.96 | .58 | ||||||||||||
Class 1A — actual return | 1,000.00 | 1,047.38 | 4.28 | .83 | ||||||||||||
Class 1A — assumed 5% return | 1,000.00 | 1,021.02 | 4.23 | .83 | ||||||||||||
Class 2 — actual return | 1,000.00 | 1,048.38 | 4.29 | .83 | ||||||||||||
Class 2 — assumed 5% return | 1,000.00 | 1,021.02 | 4.23 | .83 | ||||||||||||
Class 4 — actual return | 1,000.00 | 1,046.04 | 5.57 | 1.08 | ||||||||||||
Class 4 — assumed 5% return | 1,000.00 | 1,019.76 | 5.50 | 1.08 | ||||||||||||
Capital Income Builder | ||||||||||||||||
Class 1 — actual return | $ | 1,000.00 | $ | 1,030.31 | $ | 1.38 | .27 | % | ||||||||
Class 1 — assumed 5% return | 1,000.00 | 1,023.84 | 1.38 | .27 | ||||||||||||
Class 1A — actual return | 1,000.00 | 1,029.07 | 2.66 | .52 | ||||||||||||
Class 1A — assumed 5% return | 1,000.00 | 1,022.58 | 2.65 | .52 | ||||||||||||
Class 2 — actual return | 1,000.00 | 1,028.17 | 2.66 | .52 | ||||||||||||
Class 2 — assumed 5% return | 1,000.00 | 1,022.58 | 2.65 | .52 | ||||||||||||
Class 4 — actual return | 1,000.00 | 1,026.94 | 3.93 | .77 | ||||||||||||
Class 4 — assumed 5% return | 1,000.00 | 1,021.32 | 3.92 | .77 | ||||||||||||
Refer to the end of the tables for footnotes.
American Funds Insurance Series 373
Table of Contents
Expense example (continued)
Beginning account value 7/1/2022 | Ending account value 12/31/2022 | Expenses paid during period1 | Annualized expense ratio | |||||||||||||
Asset Allocation Fund | ||||||||||||||||
Class 1 — actual return | $ | 1,000.00 | $ | 1,030.72 | $ | 1.54 | .30 | % | ||||||||
Class 1 — assumed 5% return | 1,000.00 | 1,023.69 | 1.53 | .30 | ||||||||||||
Class 1A — actual return | 1,000.00 | 1,029.04 | 2.81 | .55 | ||||||||||||
Class 1A — assumed 5% return | 1,000.00 | 1,022.43 | 2.80 | .55 | ||||||||||||
Class 2 — actual return | 1,000.00 | 1,029.79 | 2.81 | .55 | ||||||||||||
Class 2 — assumed 5% return | 1,000.00 | 1,022.43 | 2.80 | .55 | ||||||||||||
Class 3 — actual return | 1,000.00 | 1,029.98 | 2.46 | .48 | ||||||||||||
Class 3 — assumed 5% return | 1,000.00 | 1,022.79 | 2.45 | .48 | ||||||||||||
Class 4 — actual return | 1,000.00 | 1,027.95 | 4.09 | .80 | ||||||||||||
Class 4 — assumed 5% return | 1,000.00 | 1,021.17 | 4.08 | .80 | ||||||||||||
American Funds Global Balanced Fund | ||||||||||||||||
Class 1 — actual return | $ | 1,000.00 | $ | 1,023.65 | $ | 2.65 | .52 | % | ||||||||
Class 1 — assumed 5% return | 1,000.00 | 1,022.58 | 2.65 | .52 | ||||||||||||
Class 1A — actual return | 1,000.00 | 1,022.93 | 3.93 | .77 | ||||||||||||
Class 1A — assumed 5% return | 1,000.00 | 1,021.32 | 3.92 | .77 | ||||||||||||
Class 2 — actual return | 1,000.00 | 1,022.09 | 3.92 | .77 | ||||||||||||
Class 2 — assumed 5% return | 1,000.00 | 1,021.32 | 3.92 | .77 | ||||||||||||
Class 4 — actual return | 1,000.00 | 1,021.56 | 5.20 | 1.02 | ||||||||||||
Class 4 — assumed 5% return | 1,000.00 | 1,020.06 | 5.19 | 1.02 | ||||||||||||
The Bond Fund of America | ||||||||||||||||
Class 1 — actual return | $ | 1,000.00 | $ | 974.47 | $ | 1.00 | .20 | % | ||||||||
Class 1 — assumed 5% return | 1,000.00 | 1,024.20 | 1.02 | .20 | ||||||||||||
Class 1A — actual return | 1,000.00 | 973.31 | 2.24 | .45 | ||||||||||||
Class 1A — assumed 5% return | 1,000.00 | 1,022.94 | 2.29 | .45 | ||||||||||||
Class 2 — actual return | 1,000.00 | 972.85 | 2.24 | .45 | ||||||||||||
Class 2 — assumed 5% return | 1,000.00 | 1,022.94 | 2.29 | .45 | ||||||||||||
Class 4 — actual return | 1,000.00 | 971.88 | 3.48 | .70 | ||||||||||||
Class 4 — assumed 5% return | 1,000.00 | 1,021.68 | 3.57 | .70 | ||||||||||||
Capital World Bond Fund | ||||||||||||||||
Class 1 — actual return | $ | 1,000.00 | $ | 983.53 | $ | 2.40 | .48 | % | ||||||||
Class 1 — assumed 5% return | 1,000.00 | 1,022.79 | 2.45 | .48 | ||||||||||||
Class 1A — actual return | 1,000.00 | 982.42 | 3.65 | .73 | ||||||||||||
Class 1A — assumed 5% return | 1,000.00 | 1,021.53 | 3.72 | .73 | ||||||||||||
Class 2 — actual return | 1,000.00 | 982.33 | 3.65 | .73 | ||||||||||||
Class 2 — assumed 5% return | 1,000.00 | 1,021.53 | 3.72 | .73 | ||||||||||||
Class 4 — actual return | 1,000.00 | 981.07 | 4.89 | .98 | ||||||||||||
Class 4 — assumed 5% return | 1,000.00 | 1,020.27 | 4.99 | .98 | ||||||||||||
American High-Income Trust | ||||||||||||||||
Class 1 — actual return | $ | 1,000.00 | $ | 1,038.86 | $ | 1.59 | .31 | % | ||||||||
Class 1 — assumed 5% return | 1,000.00 | 1,023.64 | 1.58 | .31 | ||||||||||||
Class 1A — actual return | 1,000.00 | 1,037.88 | 2.88 | .56 | ||||||||||||
Class 1A — assumed 5% return | 1,000.00 | 1,022.38 | 2.85 | .56 | ||||||||||||
Class 2 — actual return | 1,000.00 | 1,037.22 | 2.88 | .56 | ||||||||||||
Class 2 — assumed 5% return | 1,000.00 | 1,022.38 | 2.85 | .56 | ||||||||||||
Class 3 — actual return | 1,000.00 | 1,038.14 | 2.52 | .49 | ||||||||||||
Class 3 — assumed 5% return | 1,000.00 | 1,022.74 | 2.50 | .49 | ||||||||||||
Class 4 — actual return | 1,000.00 | 1,036.07 | 4.16 | .81 | ||||||||||||
Class 4 — assumed 5% return | 1,000.00 | 1,021.12 | 4.13 | .81 | ||||||||||||
Refer to the end of the tables for footnotes.
374 American Funds Insurance Series
Table of Contents
Expense example (continued)
Beginning account value 7/1/2022 | Ending account value 12/31/2022 | Expenses paid during period1 | Annualized expense ratio | |||||||||||||
American Funds Mortgage Fund | ||||||||||||||||
Class 1 — actual return | $ | 1,000.00 | $ | 968.01 | $ | 1.64 | .33 | % | ||||||||
Class 1 — assumed 5% return | 1,000.00 | 1,023.54 | 1.68 | .33 | ||||||||||||
Class 1A — actual return | 1,000.00 | 966.87 | 2.88 | .58 | ||||||||||||
Class 1A — assumed 5% return | 1,000.00 | 1,022.28 | 2.96 | .58 | ||||||||||||
Class 2 — actual return | 1,000.00 | 967.70 | 2.93 | .59 | ||||||||||||
Class 2 — assumed 5% return | 1,000.00 | 1,022.23 | 3.01 | .59 | ||||||||||||
Class 4 — actual return | 1,000.00 | 966.53 | 4.16 | .84 | ||||||||||||
Class 4 — assumed 5% return | 1,000.00 | 1,020.97 | 4.28 | .84 | ||||||||||||
Ultra-Short Bond Fund | ||||||||||||||||
Class 1 — actual return | $ | 1,000.00 | $ | 1,013.26 | $ | 1.57 | .31 | % | ||||||||
Class 1 — assumed 5% return | 1,000.00 | 1,023.64 | 1.58 | .31 | ||||||||||||
Class 1A — actual return | 1,000.00 | 1,013.23 | 1.52 | .30 | ||||||||||||
Class 1A — assumed 5% return | 1,000.00 | 1,023.69 | 1.53 | .30 | ||||||||||||
Class 2 — actual return | 1,000.00 | 1,012.64 | 2.84 | .56 | ||||||||||||
Class 2 — assumed 5% return | 1,000.00 | 1,022.38 | 2.85 | .56 | ||||||||||||
Class 3 — actual return | 1,000.00 | 1,012.86 | 2.49 | .49 | ||||||||||||
Class 3 — assumed 5% return | 1,000.00 | 1,022.74 | 2.50 | .49 | ||||||||||||
Class 4 — actual return | 1,000.00 | 1,010.10 | 4.10 | .81 | ||||||||||||
Class 4 — assumed 5% return | 1,000.00 | 1,021.12 | 4.13 | .81 | ||||||||||||
U.S. Government Securities Fund | ||||||||||||||||
Class 1 — actual return | $ | 1,000.00 | $ | 960.56 | $ | 1.09 | .22 | % | ||||||||
Class 1 — assumed 5% return | 1,000.00 | 1,024.10 | 1.12 | .22 | ||||||||||||
Class 1A — actual return | 1,000.00 | 959.29 | 2.27 | .46 | ||||||||||||
Class 1A — assumed 5% return | 1,000.00 | 1,022.89 | 2.35 | .46 | ||||||||||||
Class 2 — actual return | 1,000.00 | 959.68 | 2.27 | .46 | ||||||||||||
Class 2 — assumed 5% return | 1,000.00 | 1,022.89 | 2.35 | .46 | ||||||||||||
Class 3 — actual return | 1,000.00 | 959.92 | 1.93 | .39 | ||||||||||||
Class 3 — assumed 5% return | 1,000.00 | 1,023.24 | 1.99 | .39 | ||||||||||||
Class 4 — actual return | 1,000.00 | 958.46 | 3.50 | .71 | ||||||||||||
Class 4 — assumed 5% return | 1,000.00 | 1,021.63 | 3.62 | .71 | ||||||||||||
Refer to the end of the tables for footnotes.
American Funds Insurance Series 375
Table of Contents
Expense example (continued)
Beginning account value 7/1/2022 | Ending account value 12/31/2022 | Expenses paid during period1,2 | Annualized expense ratio2 | Effective expenses paid during period3 | Effective annualized expense ratio4 | |||||||||||||||||||
Managed Risk Growth Fund |
| |||||||||||||||||||||||
Class P1 – actual return | $ | 1,000.00 | $ | 968.78 | $ | 1.84 | .37 | % | $ | 3.42 | .69 | % | ||||||||||||
Class P1 – assumed 5% return | 1,000.00 | 1,023.34 | 1.89 | .37 | 3.52 | .69 | ||||||||||||||||||
Class P2 – actual return | 1,000.00 | 967.08 | 3.07 | .62 | 4.71 | .95 | ||||||||||||||||||
Class P2 – assumed 5% return | 1,000.00 | 1,022.08 | 3.16 | .62 | 4.84 | .95 | ||||||||||||||||||
Managed Risk International Fund |
| |||||||||||||||||||||||
Class P1 – actual return | $ | 1,000.00 | $ | 1,004.86 | $ | 1.82 | .36 | % | $ | 4.40 | .87 | % | ||||||||||||
Class P1 – assumed 5% return | 1,000.00 | 1,023.39 | 1.84 | .36 | 4.43 | .87 | ||||||||||||||||||
Class P2 – actual return | 1,000.00 | 1,003.52 | 3.13 | .62 | 5.71 | 1.13 | ||||||||||||||||||
Class P2 – assumed 5% return | 1,000.00 | 1,022.08 | 3.16 | .62 | 5.75 | 1.13 | ||||||||||||||||||
Managed Risk Washington Mutual Investors Fund |
| |||||||||||||||||||||||
Class P1 – actual return | $ | 1,000.00 | $ | 1,005.83 | $ | 1.87 | .37 | % | $ | 3.79 | .75 | % | ||||||||||||
Class P1 – assumed 5% return | 1,000.00 | 1,023.34 | 1.89 | .37 | 3.82 | .75 | ||||||||||||||||||
Class P2 – actual return | 1,000.00 | 1,004.38 | 3.18 | .63 | 5.10 | 1.01 | ||||||||||||||||||
Class P2 – assumed 5% return | 1,000.00 | 1,022.03 | 3.21 | .63 | 5.14 | 1.01 | ||||||||||||||||||
Managed Risk Growth-Income Fund |
| |||||||||||||||||||||||
Class P1 – actual return | $ | 1,000.00 | $ | 989.69 | $ | 1.81 | .36 | % | $ | 3.26 | .65 | % | ||||||||||||
Class P1 – assumed 5% return | 1,000.00 | 1,023.39 | 1.84 | .36 | 3.31 | .65 | ||||||||||||||||||
Class P2 – actual return | 1,000.00 | 989.03 | 3.06 | .61 | 4.51 | .90 | ||||||||||||||||||
Class P2 – assumed 5% return | 1,000.00 | 1,022.13 | 3.11 | .61 | 4.58 | .90 | ||||||||||||||||||
Managed Risk Asset Allocation Fund |
| |||||||||||||||||||||||
Class P1 – actual return | $ | 1,000.00 | $ | 1,007.60 | $ | 1.82 | .36 | % | $ | 3.24 | .64 | % | ||||||||||||
Class P1 – assumed 5% return | 1,000.00 | 1,023.39 | 1.84 | .36 | 3.26 | .64 | ||||||||||||||||||
Class P2 – actual return | 1,000.00 | 1,006.19 | 3.03 | .60 | 4.50 | .89 | ||||||||||||||||||
Class P2 – assumed 5% return | 1,000.00 | 1,022.18 | 3.06 | .60 | 4.53 | .89 | ||||||||||||||||||
| 1 | The “expenses paid during period” are equal to the “annualized expense ratio,” multiplied by the average account value over the period, multiplied by the number of days in the period, and divided by 365 (to reflect the one-half year period). |
| 2 | The “expenses paid during period” and “annualized expense ratio” do not include the expenses of the underlying funds in which each fund invests. |
| 3 | The “effective expenses paid during period” are equal to the “effective annualized expense ratio,” multiplied by the average account value over the period, multiplied by the number of days in the period, and divided by 365 (to reflect the period). |
| 4 | The “effective annualized expense ratio” reflects the net annualized expense ratio of the class plus the class’s pro-rata share of the weighted average expense ratio of the underlying funds in which it invests. |
376 American Funds Insurance Series
Table of Contents
| Liquidity Risk Management Program | unaudited |
The series has adopted a liquidity risk management program (the “program”). The series’ board has designated Capital Research and Management Company (“CRMC”) as the administrator of the program. Personnel of CRMC or its affiliates conduct the day-to-day operation of the program pursuant to policies and procedures administered by the Capital Group Liquidity Risk Management Committee.
Under the program, CRMC manages each fund’s liquidity risk, which is the risk that the fund could not meet shareholder redemption requests without significant dilution of remaining shareholders’ interests in the fund. This risk is managed by monitoring the degree of liquidity of each fund’s investments, limiting the amount of each fund’s illiquid investments, and utilizing various risk management tools and facilities available to each fund for meeting shareholder redemptions, among other means. CRMC’s process of determining the degree of liquidity of each fund’s investments is supported by one or more third-party liquidity assessment vendors.
The series’ board reviewed a report prepared by CRMC regarding the operation and effectiveness of the program for the period October 1, 2021, through September 30, 2022. No significant liquidity events impacting any of the funds were noted in the report. In addition, CRMC provided its assessment that the program had been effective in managing each fund’s liquidity risk.
American Funds Insurance Series 377
Table of Contents
This page intentionally left blank.
378 American Funds Insurance Series
Table of Contents
This page intentionally left blank.
American Funds Insurance Series 379
Table of Contents
This page intentionally left blank.
380 American Funds Insurance Series
Table of Contents
This page intentionally left blank.
American Funds Insurance Series 381
Table of Contents
Board of trustees and other officers
Independent trustees1
Name and year of birth | Year first elected a trustee of the series2 | Principal occupation(s) during past five years | Number of portfolios in fund complex overseen by trustee | Other directorships3 held by trustee | ||||
Francisco G. Cigarroa, MD, 1957 | 2021 | Professor of Surgery, University of Texas Health San Antonio; Trustee, Ford Foundation; Clayton Research Scholar, Clayton Foundation for Biomedical Research | 86 | None | ||||
James G. Ellis, 1947 | 2010 | Former Dean and Professor of Marketing, Marshall School of Business, University of Southern California | 96 | Advanced Merger Partners; EVe Mobility Acquisition Corp (acquisitions of companies in the electric vehicle market); J. G. Boswell (agricultural production); Mercury General Corporation | ||||
Nariman Farvardin, 1956 | 2018 | President, Stevens Institute of Technology | 91 | None | ||||
Jennifer C. Feikin, 1968 | 2022 | Business Advisor; previously held positions at Google, AOL, 20th Century Fox and McKinsey & Company; Trustee, The Nature Conservancy of Utah; former Trustee, The Nature Conservancy of California; former Director, First Descents | 97 | Hertz Global Holdings, Inc. | ||||
Leslie Stone Heisz, 1961 | 2022 | Former Managing Director, Lazard (retired, 2010); Director, Kaiser Permanente (California public benefit corporation); former Lecturer, UCLA Anderson School of Management | 97 | Edwards Lifesciences; Public Storage | ||||
Mary Davis Holt, 1950 | 2015–2016; 2017 | Principal, Mary Davis Holt Enterprises, LLC (leadership development consulting); former Partner, Flynn Heath Holt Leadership, LLC (leadership consulting); former COO, Time Life Inc. (1993–2003) | 87 | None | ||||
Merit E. Janow, 1958 | 2007 | Dean Emerita and Professor of Practice, International Economic Law & International Affairs, Columbia University, School of International and Public Affairs | 93 | Aptiv (autonomous and green vehicle technology); Mastercard Incorporated | ||||
Margaret Spellings, 1957 Chair of the Board (Independent and Non-Executive) | 2010 | President and CEO, Texas 2036; former President, Margaret Spellings & Company (public policy and strategic consulting); former President, The University of North Carolina; former President, George W. Bush Presidential Center | 91 | None | ||||
Alexandra Trower, 1964 | 2018 | Former Executive Vice President, Global Communications and Corporate Officer, The Estée Lauder Companies | 86 | None | ||||
Paul S. Williams, 1959 | 2020 | Former Partner/Managing Director, Major, Lindsey & Africa (executive recruiting firm) | 86 | Air Transport Services Group, Inc. (aircraft leasing and air cargo transportation); Compass Minerals, Inc. (producer of salt and specialty fertilizers); Public Storage, Inc. | ||||
Interested trustees4,5
Name, year of birth and position with | Year first elected a trustee or officer of the series2 | Principal occupation(s) during past five years and positions held with affiliated entities or the principal underwriter of the series | Number of portfolios in fund complex overseen by trustee | Other directorships3 held by trustee | ||||
Donald D. O’Neal, 1960 Co-President and Trustee | 1998 | Partner — Capital International Investors, Capital Research and Management Company; Partner — Capital International Investors, Capital Bank and Trust Company5 | 35 | None | ||||
Michael C. Gitlin, 1970 Trustee | 2019 | Partner — Capital Fixed Income Investors, Capital Research and Management Company; Vice Chairman and Director, Capital Research and Management Company; Director, The Capital Group Companies, Inc.5 | 86 | None | ||||
The series statement of additional information includes further details about the series trustees and is available without charge upon request by calling American Funds Service Company at (800) 421-4225 or by visiting the Capital Group website at capitalgroup.com/afis. The address for all trustees and officers of the series is 333 South Hope Street, Los Angeles, CA 90071. Attention: Secretary.
382 American Funds Insurance Series
Table of Contents
Other officers5
Name, year of birth and position with series | Year first elected an officer of the series2 | Principal occupation(s) during past five years and positions held with affiliated entities or the principal underwriter of the series | ||
Alan N. Berro, 1960 Co-President | 1998 | Partner — Capital World Investors, Capital Research and Management Company; Partner — Capital World Investors, Capital Bank and Trust Company5; Director, The Capital Group Companies, Inc.5 | ||
Maria Manotok, 1974 Principal Executive Officer | 2012 | Senior Vice President and Senior Counsel — Fund Business Management Group, Capital Research and Management Company; Chair, Senior Vice President, Senior Counsel and Director, Capital International, Inc.5; Senior Vice President, Secretary and Director, Capital Group Companies Global5; Senior Vice President, Secretary and Director, Capital Group International, Inc.5 | ||
Michael W. Stockton, 1967 Executive Vice President | 2021 | Senior Vice President — Fund Business Management Group, Capital Research and Management Company | ||
Patrice Collette, 1967 Senior Vice President | 2022 | Partner — Capital World Investors, Capital International, Inc.5 | ||
Peter Eliot, 1971 Senior Vice President | 2022 | Partner — Capital International Investors, Capital Research and Management Company | ||
Irfan M. Furniturewala, 1971 Senior Vice President | 2022 | Partner — Capital International Investors, Capital Research and Management Company | ||
Sung Lee, 1966 Senior Vice President | 2008 | Partner — Capital Research Global Investors, Capital International, Inc.5; Director, The Capital Group Companies, Inc.5 | ||
Keiko McKibben, 1969 Senior Vice President | 2010 | Partner — Capital Research Global Investors, Capital Research and Management Company | ||
Carlos A. Schonfeld, 1971 Senior Vice President | 2022 | Partner — Capital International Investors, Capital Research and Management Company; Director, Capital International Limited5 | ||
Alan J. Wilson, 1961 Senior Vice President | 2022 | Partner — Capital World Investors, Capital Research and Management Company; Director, Capital Research and Management Company | ||
Steven I. Koszalka, 1964 Secretary | 2003 | Vice President — Fund Business Management Group, Capital Research and Management Company | ||
Gregory F. Niland, 1971 Treasurer | 2008 | Vice President — Investment Operations, Capital Research and Management Company | ||
Susan K. Countess, 1966 Assistant Secretary | 2014 | Associate — Fund Business Management Group, Capital Research and Management Company | ||
Sandra Chuon, 1972 Assistant Treasurer | 2019 | Vice President — Investment Operations, Capital Research and Management Company | ||
Brian C. Janssen, 1972 Assistant Treasurer | 2015 | Senior Vice President — Investment Operations, Capital Research and Management Company | ||
| 1 | The term independent trustee refers to a trustee who is not an “interested person” of the series within the meaning of the Investment Company Act of 1940. |
| 2 | Trustees and officers of the series serve until their resignation, removal or retirement. |
| 3 | This includes all directorships/trusteeships (other than those in the American Funds or other funds managed by Capital Research and Management Company or its affiliates) that are held by each trustee as a trustee or director of a public company or a registered investment company. |
| 4 | The term interested trustee refers to a trustee who is an “interested person” within the meaning of the Investment Company Act of 1940, on the basis of their affiliation with the series investment adviser, Capital Research and Management Company, or affiliated entities (including the series principal underwriter). |
| 5 | Company affiliated with Capital Research and Management Company. |
American Funds Insurance Series 383
Table of Contents
Office of the series
333 South Hope Street
Los Angeles, CA 90071-1406
Investment adviser
Capital Research and Management Company
333 South Hope Street
Los Angeles, CA 90071-1406
Investment subadviser
Milliman Financial Risk Management LLC
(Managed Risk Funds only)
71 South Wacker Drive, 31st Floor
Chicago, IL 60606-4637
Custodian of assets
State Street Bank and Trust Company
One Lincoln Street
Boston, MA 02111-2900
Counsel
Morgan, Lewis & Bockius LLP
One Federal Street
Boston, MA 02110-1726
Independent registered public accounting firm
PricewaterhouseCoopers LLP
601 South Figueroa Street
Los Angeles, CA 90017-3874
384 American Funds Insurance Series
Table of Contents
Investors should carefully consider investment objectives, risks, charges and expenses. This and other important information is contained in the series prospectuses and summary prospectuses, which can be obtained from your financial professional and should be read carefully before investing. You may also call American Funds Service Company (AFS) at (800) 421-4225 or visit the Capital Group website at capitalgroup.com/afis.
“American Funds Proxy Voting Procedures and Principles” — which describes how we vote proxies relating to portfolio securities — is available on the Capital Group website or upon request by calling AFS. The series files its proxy voting record with the U.S. Securities and Exchange Commission (SEC) for the 12 months ended June 30 by August 31. The proxy voting record is available free of charge on the SEC website at sec.gov and on the Capital Group website.
American Funds Insurance Series files a complete list of its portfolio holdings with the SEC for the first and third quarters of each fiscal year on Form NPORT-P. This filing is available free of charge on the SEC website and our website.
This report is for the information of American Funds Insurance Series investors, but it also may be used as sales literature when preceded or accompanied by the current prospectuses or summary prospectuses for American Funds Insurance Series and the prospectus for the applicable insurance contract, which give details about charges, expenses, investment objectives and operating policies of the series. If used as sales material after March 31, 2023, this report must be accompanied by a statistical update for the most recently completed calendar quarter.
Fund attribution data was produced using FactSet, a third-party software system, based on daily portfolios. Securities in their initial period of acquisition may not be included in this analysis. The analysis includes equity investments only and excludes forward contracts and fixed income investments, if applicable. It does not account for buy-and-sell transactions that might have occurred intraday. As a result, average portfolio weight percentages are approximate, and the actual average portfolio weight percentages might be higher or lower. Data elements, such as pricing, income, market cap, etc., were provided by FactSet. The indexes provided for attribution are based on FactSet’s methodology. The indexes are broad-based market benchmarks and may not be used by Capital Group® as the sole comparative index for the funds. Capital Group believes the software and information from FactSet to be reliable. However, Capital Group cannot be responsible for inaccuracies, incomplete information or updating of information by FactSet.
Hedge instruments, including exchange-traded futures contracts and exchange-traded put options, may not provide an effective hedge of the underlying securities because changes in the prices of such instruments may not track those of the securities they are intended to hedge. In addition, the managed risk strategy may not effectively protect the funds from market declines and will limit the funds’ participation in market gains. The use of the managed risk strategy could cause the funds’ returns to lag those of the applicable underlying funds in certain rising market conditions.
BLOOMBERG® is a trademark and service mark of Bloomberg Finance L.P. and its affiliates (collectively “Bloomberg”). Bloomberg or Bloomberg’s licensors own all proprietary rights in the Bloomberg Indices. Neither Bloomberg nor Bloomberg’s licensors approves or endorses this material, or guarantees the accuracy or completeness of any information herein, or makes any warranty, express or implied, as to the results to be obtained therefrom and, to the maximum extent allowed by law, neither shall have any liability or responsibility for injury or damages arising in connection therewith.
MSCI has not approved, reviewed or produced this report, makes no express or implied warranties or representations and is not liable whatsoever for any data in the report. You may not redistribute the MSCI data or use it as a basis for other indices or investment products.
The S&P 500 Index is a product of S&P Dow Jones Indices LLC and/or its affiliates and has been licensed for use by Capital Group. Copyright © 2023 S&P Dow Jones Indices LLC, a division of S&P Global, and/or its affiliates. All rights reserved. Redistribution or reproduction in whole or in part is prohibited without written permission of S&P Dow Jones Indices LLC.
American Funds Distributors, Inc., member FINRA.
Table of Contents
The Capital Advantage®
Since 1931, Capital Group, home of American Funds, has helped investors pursue long-term investment success. Our consistent approach — in combination with The Capital SystemTM — has resulted in superior outcomes.
| Aligned with investor success | The Capital System | American Funds Insurance Series’ superior outcomes | ||
| We base our decisions on a long-term perspective, which we believe aligns our goals with the interests of our clients. American Funds Insurance Series portfolio managers average 28 years of investment industry experience, including 23 years at our company, reflecting a career commitment to our long-term approach.1 | The Capital System combines individual accountability with teamwork. Funds using The Capital System are divided into portions that are managed independently by investment professionals with diverse backgrounds, ages and investment approaches. An extensive global research effort is the backbone of our system. | American Funds Insurance Series equity funds have beaten their comparable Lipper indexes in 89% of 10-year periods and 100% of 20-year periods.2 Our fixed income funds have helped investors achieve diversification through attention to correlation between bonds and equities.3 We strive to keep management fees competitive. Over the past 20 years, most funds’ fees have been below industry averages.4 | ||
| 1 | Portfolio manager experience as of the American Funds Insurance Series prospectus dated May 1, 2022. |
| 2 | Based on Class 1 share results for rolling calendar-year periods starting the first full calendar year after each fund’s inception through December 31, 2021. Periods covered are the shorter of the fund’s lifetime or since the inception date of the comparable Lipper index or average. The comparable Lipper indexes are: Capital World Funds Index (Global Growth Fund, Capital World Growth and Income Fund), Growth Funds Index (Growth Fund), International Funds Index (International Fund), Emerging Markets Funds Index (New World Fund), Growth & Income Funds Index (Washington Mutual Investors Fund, Growth and Income Fund) and Balanced Funds Index (Asset Allocation Fund). The Lipper Global Small-/Mid-Cap Funds Average was used for Global Small Capitalization Fund. Lipper source: Refinitiv Lipper. There have been periods when the fund has lagged the index. |
| 3 | Based on Class 1 share results as of December 31, 2021. Three of our five fixed income funds showed a three-year correlation below 0.3. Standard & Poor’s 500 Index was used as an equity market proxy. Correlation based on monthly total returns. Correlation is a statistical measure of how two securities move in relation to each other. A correlation ranges from –1 to 1. A positive correlation close to 1 implies that as one security moves, either up or down, the other security will move in “lockstep,” in the same direction. A negative correlation close to –1 indicates that the securities have moved in the opposite direction. |
| 4 | Based on management fees for the 20-year period ended December 31, 2021, versus comparable Lipper categories, excluding funds of funds. |
All Capital Group trademarks mentioned are owned by The Capital Group Companies, Inc., an affiliated company or fund. All other company and product names mentioned are the property of their respective companies. |
Lit. No. INGEARX-998-0223P Printed in USA RCG/PHX/8074-S90141 © 2023 Capital Group. All rights reserved.
R3180AR4.6 (2/23)
Table of Contents
Item 2. Code of Ethics.
SunAmerica Series Trust (“the registrant”) has adopted a Code of Ethics applicable to its Principal Executive and Principal Accounting Officers pursuant to Section 406 of the Sarbanes-Oxley Act of 2002 (the “Code”). During the fiscal year ended December 31, 2022, there were no reportable waivers or implicit waivers to a provision of the Code that applies to the registrant’s Principal Executive and Principal Accounting Officers (the “Covered Officers”).
Item 3. Audit Committee Financial Expert.
The registrant’s Board of Trustees has determined that Garrett Bouton, Tracey C. Doi, Jane Jelenko and Charles H. Self III each qualify as audit committee financial experts, as defined in Item 3(b) of Form N-CSR. Mr. Bouton, Ms. Doi, Ms. Jelenko and Mr. Self III are considered “independent” purposes of Item 3(a)(2) of Form N-CSR.
Item 4. Principal Accountant Fees and Services.
| (a)-(d) | Aggregate fees relating to the five series referred to in Item 1 that were billed to the registrant for the last two fiscal years for services rendered by the registrant’s principal accountant were as follows: |
| 2021 | 2022 | |||||||
(a) Audit Fees | $ | 111,434 | $ | 114,777 | ||||
(b) Audit-Related Fees | $ | 0 | $ | 0 | ||||
(c) Tax Fees | $ | 44,197 | $ | 39,945 | ||||
(d) All Other Fees | $ | 0 | $ | 0 | ||||
Audit Fees include amounts related to the audit of the registrant’s annual financial statements and services normally provided by the principal accountant in connection with statutory and regulatory filings. Tax Fees principally include tax compliance, tax advice, tax planning and preparation of tax returns.
Aggregate fees relating to the five series referred to in Item 1 that were billed to the investment adviser and Adviser Affiliates (as defined below in Item 4 (e)) that are required to be pre-approved pursuant to paragraph (c)(7)(ii) of Rule 2-01 of Regulation S-X for the last two fiscal years for services rendered by the registrant’s principal accountant were as follows:
| 2021 | 2022 | |||||||
(b) Audit-Related Fees | $ | 0 | $ | 0 | ||||
(c) Tax Fees | $ | 0 | $ | 0 | ||||
(d) All Other Fees | $ | 515,090 | $ | 297,806 | ||||
| (e) | (1) The registrant’s audit committee pre-approves all audit services provided by the registrant’s principal accountant for the registrant and all non-audit services provided by the registrant’s principal accountant for the registrant, its investment adviser and any entity controlling, controlled by, or under common control with the investment adviser (“Adviser Affiliates”) that provides ongoing services to the registrant, if the engagement by the investment adviser or Adviser Affiliates relates directly to the operations and financial reporting of the registrant. The audit committee has not presently established any pre-approval policies and procedures that permit the pre-approval of the above services other than by the full audit committee. Certain de minimis exceptions are allowed for non-audit services in accordance with Rule 2-01(c)(7)(i)(C) of Regulation S-X as set forth in the registrant’s audit committee minutes. |
(2) No services included in (b)-(d) above in connection with fees billed to the registrant or the investment adviser or Adviser Affiliates were approved pursuant to paragraph (c)(7)(i)(C) of Rule 2-01 of Regulation S-X.
| (f) | Not applicable. |
| (g) | The aggregate fees billed for the most recent fiscal year and the preceding fiscal year by the registrant’s principal accountant for non-audit services rendered to the registrant, its investment adviser, and Adviser Affiliates that provide ongoing services to the registrant for 2021 and 2022 were $1,035,382 and $337,751, respectively. |
| (h) | Non-audit services rendered to the registrant’s investment adviser and any Adviser Affiliates that provides ongoing services to the registrant that were not pre-approved pursuant to paragraph (c)(7)(ii) of Rule 2-01 of Regulation S-X were considered by the registrant’s audit committee as to whether they were compatible with maintaining the principal accountant’s independence. |
Item 5. Audit Committee of Listed Registrants.
Not applicable.
Item 6. Investments.
(a) Included in Item 1 to the Form.
(b) Not applicable.
Table of Contents
Item 7. Disclosure of Proxy Voting Policies and Procedures for Closed-End Management Investment Companies.
Not applicable.
Item 8. Portfolio Managers of Closed-End Management Investment Companies.
Not applicable.
Item 9. Purchases of Equity Securities by Closed-End Management Investment Company and Affiliated Purchasers.
Not applicable.
Item 10. Submission of Matters to a Vote of Security Holders.
There were no material changes to the procedures by which shareholders may recommend nominees to the registrant’s Board of Trustees that were implemented after the registrant last provided disclosure in response to the requirements of Item 407(c)(2)(iv) of Regulation S-K (17 CFR 229.407) (as required by item 22(b)(15)) of Schedule 14A (17 CFR 240.14a-101), or this Item 10.
Item 11. Controls and Procedures.
(a) An evaluation was performed within 90 days of the filing of this report, under the supervision and with the participation of the registrant’s management, including the President and Treasurer, of the effectiveness of the design and operation of the registrant’s disclosure controls and procedures (as defined under Rule 30a-3(c) under the Investment Company Act of 1940 (17 CFR 270.30a-3(c))). Based on that evaluation, the registrant’s management, including the President and Treasurer, concluded that the registrant’s disclosure controls and procedures are effective.
(b) There was no change in the registrant’s internal control over financial reporting (as defined in Rule 30a-3(d) under the Investment Company Act of 1940 (17 CFR 270.30a-3(d))) that occurred during the period covered by this report that has materially affected, or is reasonably likely to materially affect, the registrant’s internal control over financial reporting.
Table of Contents
Item 12. Disclosure of Securities Lending Activities for Closed-End Management Investment Companies.
Not applicable. |
Item 13. Exhibits.
(3) Not applicable.
(4) Not applicable.
SIGNATURES
Pursuant to the requirements of the Securities Exchange Act of 1934 and the Investment Company Act of 1940, the registrant has duly caused this report to be signed on its behalf by the undersigned, thereunto duly authorized.
| SunAmerica Series Trust | ||
| By: | /s/ John T. Genoy | |
| John T. Genoy | ||
| President | ||
Date: March 10, 2023
Pursuant to the requirements of the Securities Exchange Act of 1934 and the Investment Company Act of 1940, this report has been signed below by the following persons on behalf of the registrant and in the capacities and on the dates indicated.
| By: | /s/ John T. Genoy | |
| John T. Genoy | ||
| President | ||
Date: March 10, 2023
| By: | /s/ Gregory R. Kingston | |
| Gregory R. Kingston | ||
| Treasurer | ||
Date: March 10, 2023