Table of Contents
UNITED STATES
SECURITIES AND EXCHANGE COMMISSION
Washington, D.C. 20549
FORM N-CSR
CERTIFIED SHAREHOLDER REPORT OF REGISTERED
MANAGEMENT INVESTMENT COMPANIES
Investment Company Act file number 811-07238
SUNAMERICA SERIES TRUST
(Exact name of registrant as specified in charter)
21650 Oxnard Street, Woodlands Hills, CA 91367
(Address of principal executive offices) (Zip code)
John T. Genoy
President
SunAmerica Asset Management, LLC
Harborside 5, 185 Hudson Street, Suite 3300
Jersey City, NJ 07311
(Name and address of agent for service)
Registrant’s telephone number, including area code: (201) 324-6414
Date of fiscal year end: December 31
Date of reporting period: December 31, 2021
Table of Contents
Item 1. Reports to Stockholders
This filing is on behalf of three of the sixty-one Investment Company Series of SunAmerica Series Trust.
Table of Contents
SUNAMERICA SERIES TRUST
(PORTFOLIOS FORMERLY SERIESOFTHE ANCHOR SERIES TRUST)
ANNUAL REPORT
DECEMBER 31, 2021
Table of Contents
| 1 | ||||
| 2 | ||||
| 4 | ||||
| 8 | ||||
| 20 | ||||
| 32 | ||||
| 33 | ||||
| 34 | ||||
| 35 | ||||
| 49 | ||||
| 52 | ||||
| 53 | ||||
| 55 | ||||
| 56 | ||||
Approval of the Investment Advisory and Management Agreement and Subadvisory Agreements | 60 |
Table of Contents
Dear SunAmerica Series Trust Investor:
We are pleased to present our annual report for the SunAmerica Series Trust, the underlying investment portfolios for the series of variable products issued by our Life Companies.
The following report contains the investment portfolio information and the financial statements of the SunAmerica Series Trust portfolios for the reporting period ended December 31, 2021. The report may also contain information on portfolios not currently available in your variable contract.
We believe this information will give you some insight into the performance of your underlying investments. If you have any questions, please contact your investment representative, or you may contact us directly at 1-800-445-7862.
Thank you for the confidence you place in us with your financial future, and we look forward to reporting to you once again in six months.
Sincerely,

John T. Genoy
President
SunAmerica Series Trust
Note: All performance figures quoted are for the SunAmerica Series Trust. They do not reflect fees and charges associated with the variable annuity. Past performance is no guarantee of future results. Annuities are long-term investment vehicles designed for retirement purposes. Early withdrawal may be subject to withdrawal charges and if taken prior to age 59 1/2, a 10% federal tax penalty may apply. An investment in a variable annuity involves investment risk, including possible loss of principal. The contract, when redeemed, may be worth more or less than the total amount invested.
Investments in stocks and bonds are subject to risks, including stock market and interest rate fluctuations. Investments in growth stocks as well as small and mid-cap company stocks may be subject to volatile price swings and therefore present a greater potential for loss than other investments. Investments in non-U.S. stocks and bonds are subject to additional risks such as fluctuations in foreign currencies, political and economic instability, differences in securities regulation and accounting standards, foreign tax laws, and limited availability of public information. Income seeking investment strategies may not be realized due to changes in dividend policies or the availability of capital resources.
Investments that concentrate on one economic sector or geographic region are generally subject to greater volatility than more diverse investments. Investments in real estate investment trusts (REITs) involve risks such as refinancing, economic conditions in the real estate industry, changes in property values, dependency on real estate management, and other risks associated with a concentration in one sector or geographic region. Investments in securities related to gold and other precious metals and minerals are speculative and impacted by a host of worldwide economic, financial and political factors.
Investments in debt securities are subject to credit risk (i.e., the risk that an issuer might not pay interest when due or repay principal at maturity of the obligation). Investments in lower-rated bonds and “junk bonds” are considered speculative due to the heightened risk of default and are subject to unpredictable losses as a result of changes in the issuer’s creditworthiness.
Investments in derivatives are subject to heightened risk; gains or losses from non-hedging positions may be substantially greater than the cost of the position. Active trading may result in high portfolio turnover and correspondingly greater transaction costs for the portfolio and underlying portfolios.
There can be no assurance that the Portfolios will meet their investment objectives. A full description of the investment goals, principal strategies, and risks for each Portfolio are provided in the prospectus.
Investments are not guaranteed or endorsed by any bank, is not a deposit or obligation of any bank, and is not federally insured by Federal Deposit Corporation (FDIC), the Federal Reserve Board or any other federal government agency.
* Not FDIC or NCUA/NCUSIF Insured
* May Lose Value * No Bank of Credit Union Guarantee
* Not a Deposit * Not insured by any Federal Government Agency
| ||
| 1 |
Table of Contents
SUNAMERICA SERIES TRUST
EXPENSE EXAMPLE December 31, 2021 |
(unaudited)
Disclosure of Portfolio Expenses in Shareholder Reports
As a shareholder of a separate series (a “Portfolio”) in the SunAmerica Series Trust (the “Trust”), you incur ongoing costs, including management fees and/or service (12b-1) fees and other Portfolio expenses. The example is intended to help you understand your ongoing costs (in dollars) of investing in the Portfolios and to compare these costs with the ongoing costs of investing in other mutual funds. The example is based on an investment of $1,000 invested at July 1, 2021 and held until December 31, 2021. Shares of the Trust are not offered directly to the public. Instead, shares are currently issued and redeemed only in connection with investments in and payments under variable annuity contracts and variable life insurance policies (“Variable Contracts”) offered by life insurance companies affiliated with SunAmerica Asset Management, LLC, the Trust’s investment adviser and manager, as well as non-affiliated life insurance companies. The fees and expenses associated with the Variable Contracts are not included in these examples, and had such fees and expenses been included, your costs would have been higher. Please see your variable contract prospectus for more details on the fees associated with the Variable Contract.
Actual Expenses
The “Actual” section of the table provides information about your actual account values and actual expenses. You may use the information in these columns, together with the amount you invested, to estimate the expenses that you paid over the period. Simply divide your account value by $1,000 (for example, an $8,600 account value divided by $1,000 = 8.6), then multiply the result by the number in the column under the heading entitled “Expenses Paid During the Six Months Ended December 31, 2021” to estimate the expenses you paid on your account during this period. The “Expenses Paid During the Six Months Ended December 31, 2021” column and the “Annualized Expense Ratio” column do not include fees and expenses that may be charged by the Variable Contracts in which the Portfolios are offered. Had these fees and expenses been included, the “Expenses Paid During the Six Months Ended December 31, 2021” column would have been higher and the “Ending Account Value” column would have been lower.
Hypothetical Example for Comparison Purposes
The “Hypothetical” section of the table provides information about hypothetical account values and hypothetical expenses based on each Portfolio’s actual expense ratio and an annual rate of return of 5% before expenses, which is not the Portfolio’s actual return. The hypothetical account values and expenses may not be used to estimate the actual ending account balance or expenses you paid for the period. You may use this information to compare the ongoing costs of investing in these Portfolios and other funds. To do so, compare this 5% hypothetical example with the 5% hypothetical examples that appear in the shareholder reports of other funds. The “Expenses Paid During the Six Months Ended December 31, 2021” column and the “Annualized Expense Ratio” column do not include fees and expenses that may be charged by the Variable Contracts in which the Portfolios are offered. Had these fees and expenses been included, the “Expenses Paid During the Six Months Ended December 31, 2021” column would have been higher and the “Ending Account Value” column would have been lower.
Please note that the expenses shown in the table are meant to highlight your ongoing costs only and do not reflect any fees and expenses that may be charged by the Variable Contracts. Please refer to your variable contract prospectus for more information. Therefore, the “Hypothetical” example is useful in comparing ongoing costs only and will not help you determine the relative total costs of owning different funds. In addition, if these fees and expenses were included, your costs would have been higher.
| ||
| 2 |
Table of Contents
SUNAMERICA SERIES TRUST
EXPENSE EXAMPLE (continued) December 31, 2021 |
(unaudited)
| Actual | Hypothetical | |||||||||||||||||||||||||||
| Portfolio | Beginning Account Value at July 1, 2021 | Ending December 31, | Expenses Paid December 31, | Beginning Account Value at July 1, 2021 | Ending December 31, | Expenses Paid December 31, | Annualized Expense Ratio* | |||||||||||||||||||||
SA Wellington Capital Appreciation | ||||||||||||||||||||||||||||
Class 1 | $ | 1,000.00 | $ | 990.99 | $ | 3.66 | $ | 1,000.00 | $ | 1,021.53 | $ | 3.72 | 0.73 | % | ||||||||||||||
Class 2 | $ | 1,000.00 | $ | 990.24 | $ | 4.41 | $ | 1,000.00 | $ | 1,020.77 | $ | 4.48 | 0.88 | % | ||||||||||||||
Class 3 | $ | 1,000.00 | $ | 989.84 | $ | 4.92 | $ | 1,000.00 | $ | 1,020.27 | $ | 4.99 | 0.98 | % | ||||||||||||||
SA Wellington Government and Quality Bond | ||||||||||||||||||||||||||||
Class 1 | $ | 1,000.00 | $ | 998.09 | $ | 2.82 | $ | 1,000.00 | $ | 1,022.38 | $ | 2.85 | 0.56 | % | ||||||||||||||
Class 2 | $ | 1,000.00 | $ | 996.97 | $ | 3.57 | $ | 1,000.00 | $ | 1,021.63 | $ | 3.62 | 0.71 | % | ||||||||||||||
Class 3 | $ | 1,000.00 | $ | 996.93 | $ | 4.08 | $ | 1,000.00 | $ | 1,021.12 | $ | 4.13 | 0.81 | % | ||||||||||||||
SA Wellington Strategic Multi-Asset# | ||||||||||||||||||||||||||||
Class 1 | $ | 1,000.00 | $ | 1,018.29 | $ | 4.37 | $ | 1,000.00 | $ | 1,020.87 | $ | 4.38 | 0.86 | % | ||||||||||||||
Class 3 | $ | 1,000.00 | $ | 1,017.20 | $ | 5.64 | $ | 1,000.00 | $ | 1,019.61 | $ | 5.65 | 1.11 | % | ||||||||||||||
| * | Expenses are equal to each Portfolio’s annualized expense ratio multiplied by the average account value over the period, multiplied by 184 days in the period then divided by 365 days (to reflect the one-half year period). These ratios do not reflect fees and expenses associated with the Variable Contracts. If such fees and expenses had been included, the expenses would have been higher. Please refer to your Variable Contract prospectus for details on the expenses that apply to the Variable Contracts of the insurance companies. |
| # | During the stated period, the investment adviser either waived a portion of or all fees and assumed a portion of or all expenses for the Portfolios or through recoupment provisions, recovered a portion of or all fees and expenses waived or reimbursed in the previous two fiscal years. As a result, if these fees and expenses had not been waived or assumed, the “Actual/Hypothetical Ending Account Value” would have been lower and the “Actual/Hypothetical Expenses Paid During the Six Months Ended December 31, 2021” and “Annualized Expense Ratio” would have been higher. If these fees and expenses had not been recouped, the “Actual/Hypothetical Ending Account Value” would have been higher and the “Actual/Hypothetical Expenses Paid During the Six Months Ended December 31, 2021” and the “Annualized Expense Ratio” would have been lower. |
| ||
| 3 |
Table of Contents
SunAmerica Series Trust SA Wellington Capital Appreciation Portfolio
PORTFOLIO PROFILE — December 31, 2021 — (unaudited)
Industry Allocation*
Internet Content-Entertainment | 8.7 | % | ||
Enterprise Software/Service | 8.1 | |||
Web Portals/ISP | 7.5 | |||
E-Commerce/Services | 7.1 | |||
Electronic Components-Semiconductors | 7.1 | |||
E-Commerce/Products | 3.8 | |||
Auto-Cars/Light Trucks | 3.7 | |||
Medical Products | 3.4 | |||
Finance-Credit Card | 3.3 | |||
Retail-Apparel/Shoe | 3.2 | |||
Networking Products | 3.1 | |||
Retail-Misc./Diversified | 2.5 | |||
Retail-Perfume & Cosmetics | 2.2 | |||
Computer Software | 2.1 | |||
Building Products-Air & Heating | 1.7 | |||
Repurchase Agreements | 1.7 | |||
Commercial Services-Finance | 1.7 | |||
Data Processing/Management | 1.6 | |||
Applications Software | 1.6 | |||
Communications Software | 1.5 | |||
Medical-Biomedical/Gene | 1.5 | |||
Diagnostic Kits | 1.4 | |||
Multimedia | 1.4 | |||
Building-Residential/Commercial | 1.3 | |||
Brewery | 1.2 | |||
Diagnostic Equipment | 1.2 | |||
Drug Delivery Systems | 1.1 | |||
Internet Security | 1.1 | |||
Distribution/Wholesale | 1.1 | |||
Energy-Alternate Sources | 1.1 | |||
Machinery-General Industrial | 1.1 | |||
Semiconductor Equipment | 1.0 | |||
Internet Gambling | 1.0 | |||
Building-Mobile Home/Manufactured Housing | 1.0 | |||
Entertainment Software | 1.0 | |||
Chemicals-Specialty | 0.9 | |||
Exchange-Traded Funds | 0.8 | |||
Lighting Products & Systems | 0.7 | |||
Medical-Outpatient/Home Medical | 0.7 | |||
Medical-Wholesale Drug Distribution | 0.6 | |||
Racetracks | 0.6 | |||
Commercial Services | 0.5 | |||
Veterinary Diagnostics | 0.3 | |||
|
| |||
| 98.2 | % | |||
|
|
| * | Calculated as a percentage of net assets |
| ||
| 4 |
Table of Contents
SunAmerica Series Trust SA Wellington Capital Appreciation Portfolio
PORTFOLIO OF INVESTMENTS — December 31, 2021
| Security Description | Shares | Value (Note 2) | ||||||
COMMON STOCKS — 95.7% |
| |||||||
Applications Software — 1.6% |
| |||||||
Five9, Inc.† | 153,770 | $ | 21,115,696 | |||||
IronSource, Ltd., Class A† | 1,974,651 | 15,283,799 | ||||||
Magic Leap, Inc., Class A†(1)(2) | 186 | 2,500 | ||||||
|
| |||||||
| 36,401,995 | ||||||||
|
| |||||||
Auto-Cars/Light Trucks — 3.7% |
| |||||||
Tesla, Inc.† | 79,615 | 84,135,540 | ||||||
|
| |||||||
Brewery — 1.2% |
| |||||||
Constellation Brands, Inc., Class A | 111,102 | 27,883,269 | ||||||
|
| |||||||
Building Products-Air & Heating — 1.7% |
| |||||||
Johnson Controls International PLC | 482,736 | 39,251,264 | ||||||
|
| |||||||
Building-Mobile Home/Manufactured Housing — 1.0% |
| |||||||
Thor Industries, Inc. | 215,742 | 22,387,547 | ||||||
|
| |||||||
Building-Residential/Commercial — 1.3% |
| |||||||
Lennar Corp., Class A | 250,280 | 29,072,525 | ||||||
|
| |||||||
Chemicals-Specialty — 0.9% |
| |||||||
Albemarle Corp. | 83,801 | 19,590,160 | ||||||
|
| |||||||
Commercial Services — 0.5% |
| |||||||
CoStar Group, Inc.† | 140,115 | 11,073,288 | ||||||
|
| |||||||
Commercial Services-Finance — 1.7% |
| |||||||
Block, Inc., Class A† | 224,590 | 36,273,531 | ||||||
Payoneer Global, Inc.† | 174,700 | 1,284,045 | ||||||
|
| |||||||
| 37,557,576 | ||||||||
|
| |||||||
Communications Software — 1.5% |
| |||||||
RingCentral, Inc., Class A† | 183,723 | 34,420,504 | ||||||
|
| |||||||
Computer Software — 2.1% |
| |||||||
MongoDB, Inc.† | 47,925 | 25,369,099 | ||||||
ZoomInfo Technologies, Inc.† | 356,346 | 22,877,413 | ||||||
|
| |||||||
| 48,246,512 | ||||||||
|
| |||||||
Data Processing/Management — 1.6% |
| |||||||
Fair Isaac Corp.† | 85,159 | 36,930,903 | ||||||
|
| |||||||
Diagnostic Equipment — 1.2% |
| |||||||
Danaher Corp. | 84,175 | 27,694,417 | ||||||
|
| |||||||
Diagnostic Kits — 1.4% |
| |||||||
Exact Sciences Corp.† | 416,760 | 32,436,431 | ||||||
|
| |||||||
Distribution/Wholesale — 1.1% |
| |||||||
Copart, Inc.† | 162,966 | 24,708,905 | ||||||
|
| |||||||
Drug Delivery Systems — 1.1% |
| |||||||
DexCom, Inc.† | 47,441 | 25,473,445 | ||||||
|
| |||||||
E-Commerce/Products — 3.8% |
| |||||||
Amazon.com, Inc.† | 25,554 | 85,205,724 | ||||||
|
| |||||||
E-Commerce/Services — 7.1% |
| |||||||
Airbnb, Inc., Class A† | 346,491 | 57,687,287 | ||||||
Booking Holdings, Inc.† | 14,270 | 34,237,012 | ||||||
Match Group, Inc.† | 335,598 | 44,382,835 | ||||||
Uber Technologies, Inc.† | 565,660 | 23,718,124 | ||||||
|
| |||||||
| 160,025,258 | ||||||||
|
| |||||||
Electronic Components-Semiconductors — 7.1% |
| |||||||
Advanced Micro Devices, Inc.† | 591,791 | 85,158,725 | ||||||
Marvell Technology, Inc. | 61,607 | 5,389,996 | ||||||
NVIDIA Corp. | 235,214 | 69,178,790 | ||||||
|
| |||||||
| 159,727,511 | ||||||||
|
| |||||||
| Security Description | Shares | Value (Note 2) | ||||||
Energy-Alternate Sources — 1.1% |
| |||||||
SolarEdge Technologies, Inc.† | 87,696 | $ | 24,604,867 | |||||
|
| |||||||
Enterprise Software/Service — 8.1% |
| |||||||
Guidewire Software, Inc.† | 222,661 | 25,278,703 | ||||||
Paycom Software, Inc.† | 100,190 | 41,597,886 | ||||||
salesforce.com, Inc.† | 96,812 | 24,602,834 | ||||||
UiPath, Inc., Class A† | 707,312 | 30,506,366 | ||||||
Workday, Inc., Class A† | 219,294 | 59,906,735 | ||||||
|
| |||||||
| 181,892,524 | ||||||||
|
| |||||||
Entertainment Software — 1.0% |
| |||||||
Electronic Arts, Inc. | 167,210 | 22,054,999 | ||||||
|
| |||||||
Finance-Credit Card — 3.3% |
| |||||||
Mastercard, Inc., Class A | 207,060 | 74,400,799 | ||||||
|
| |||||||
Internet Content-Entertainment — 8.7% |
| |||||||
Meta Platforms, Inc., Class A† | 230,905 | 77,664,897 | ||||||
Roku, Inc.† | 105,403 | 24,052,964 | ||||||
Snap, Inc., Class A† | 487,556 | 22,929,759 | ||||||
Spotify Technology SA† | 237,796 | 55,651,398 | ||||||
Twitter, Inc.† | 336,642 | 14,549,667 | ||||||
|
| |||||||
| 194,848,685 | ||||||||
|
| |||||||
Internet Gambling — 1.0% |
| |||||||
DraftKings, Inc., Class A† | 842,041 | 23,130,866 | ||||||
|
| |||||||
Internet Security — 1.1% |
| |||||||
Palo Alto Networks, Inc.† | 45,568 | 25,370,440 | ||||||
|
| |||||||
Lighting Products & Systems — 0.7% |
| |||||||
Universal Display Corp. | 95,750 | 15,801,622 | ||||||
|
| |||||||
Machinery-General Industrial — 1.1% |
| |||||||
Middleby Corp.† | 124,709 | 24,537,743 | ||||||
|
| |||||||
Medical Products — 3.4% |
| |||||||
ABIOMED, Inc.† | 134,722 | 48,388,101 | ||||||
Inspire Medical Systems, Inc.† | 119,215 | 27,426,603 | ||||||
|
| |||||||
| 75,814,704 | ||||||||
|
| |||||||
Medical-Biomedical/Gene — 1.5% |
| |||||||
Ascendis Pharma A/S ADR† | 59,573 | 8,014,356 | ||||||
Illumina, Inc.† | 66,877 | 25,442,686 | ||||||
|
| |||||||
| 33,457,042 | ||||||||
|
| |||||||
Medical-Drugs — 0.0% |
| |||||||
Reata Pharmaceuticals, Inc., Class A† | 34,940 | 921,368 | ||||||
|
| |||||||
Medical-Outpatient/Home Medical — 0.7% |
| |||||||
Oak Street Health, Inc.† | 471,520 | 15,626,173 | ||||||
|
| |||||||
Medical-Wholesale Drug Distribution — 0.6% |
| |||||||
GoodRx Holdings, Inc., Class A† | 435,720 | 14,239,330 | ||||||
|
| |||||||
Multimedia — 1.4% |
| |||||||
Walt Disney Co.† | 197,928 | 30,657,068 | ||||||
|
| |||||||
Networking Products — 3.1% |
| |||||||
Arista Networks, Inc.† | 491,793 | 70,695,244 | ||||||
|
| |||||||
Racetracks — 0.6% |
| |||||||
Penn National Gaming, Inc.† | 258,048 | 13,379,789 | ||||||
|
| |||||||
Retail-Apparel/Shoe — 3.2% |
| |||||||
Lululemon Athletica, Inc.† | 72,950 | 28,556,277 | ||||||
Ross Stores, Inc. | 375,420 | 42,902,998 | ||||||
|
| |||||||
| 71,459,275 | ||||||||
|
| |||||||
Retail-Misc./Diversified — 2.5% |
| |||||||
Five Below, Inc.† | 266,537 | 55,143,840 | ||||||
|
| |||||||
| ||
| 5 |
Table of Contents
SunAmerica Series Trust SA Wellington Capital Appreciation Portfolio
PORTFOLIO OF INVESTMENTS — December 31, 2021 — (continued)
| Security Description | Shares/ Principal Amount | Value (Note 2) | ||||||
COMMON STOCKS (continued) |
| |||||||
Retail-Perfume & Cosmetics — 2.2% |
| |||||||
Ulta Beauty, Inc.† | 118,760 | $ | 48,969,498 | |||||
|
| |||||||
Semiconductor Equipment — 1.0% |
| |||||||
MKS Instruments, Inc. | 134,908 | 23,496,926 | ||||||
|
| |||||||
Veterinary Diagnostics — 0.3% |
| |||||||
Elanco Animal Health, Inc.† | 195,478 | 5,547,666 | ||||||
|
| |||||||
Web Portals/ISP — 7.5% |
| |||||||
Alphabet, Inc., Class A† | 58,268 | 168,804,727 | ||||||
|
| |||||||
Total Common Stocks |
| 2,157,077,969 | ||||||
|
| |||||||
CONVERTIBLE PREFERRED SECURITIES — 0.0% |
| |||||||
Advertising Services — 0.0% |
| |||||||
Nanigans, Inc., Series B†(1)(2) | 126,818 | 0 | ||||||
|
| |||||||
EXCHANGE-TRADED FUNDS — 0.8% |
| |||||||
iShares Russell 1000 Growth ETF | 62,709 | 19,163,243 | ||||||
|
| |||||||
WARRANTS — 0.0% |
| |||||||
Advertising Services — 0.0% |
| |||||||
Nanigans, Inc.†(1)(2) | 299,097 | 0 | ||||||
|
| |||||||
Total Long-Term Investment Securities |
| 2,176,241,212 | ||||||
|
| |||||||
REPURCHASE AGREEMENTS — 1.7% |
| |||||||
Bank of America Securities LLC Joint Repurchase Agreement(3) | $ | 8,695,000 | 8,695,000 | |||||
Barclays Capital, Inc. Joint Repurchase Agreement(3) | 6,765,000 | 6,765,000 | ||||||
BNP Paribas SA Joint Repurchase Agreement(3) | 5,860,000 | 5,860,000 | ||||||
Deutsche Bank AG Joint Repurchase Agreement(3) | 8,570,000 | 8,570,000 | ||||||
RBS Securities, Inc. Joint Repurchase Agreement(3) | 8,570,000 | 8,570,000 | ||||||
|
| |||||||
Total Repurchase Agreements |
| 38,460,000 | ||||||
|
| |||||||
TOTAL INVESTMENTS | 98.2 | % | 2,214,701,212 | |||||
Other assets less liabilities | 1.8 | 39,792,060 | ||||||
|
|
|
| |||||
NET ASSETS | 100.0 | % | $ | 2,254,493,272 | ||||
|
|
|
| |||||
| † | Non-income producing security |
| (1) | Denotes a restricted security that: (a) cannot be offered for public sale without first being registered, or being able to take advantage of an exemption from registration, under the Securities Act of 1933, as amended (the “1933 Act”); (b) is subject to a contractual restriction on public sales; or (c) is otherwise subject to a restriction on sales by operation of applicable law. Restricted securities are valued pursuant to Note 2. Certain restricted securities held by the Portfolio may not be sold except in exempt transactions or in a public offering registered under the 1933 Act. The Portfolio has no right to demand registration of these securities. The risk of investing in certain restricted securities is greater than the risk of investing in the securities of widely held, publicly traded companies. To the extent applicable, lack of a secondary market and resale restrictions may result in the inability of a Portfolio to sell a security at a fair price and may substantially delay the sale of the security. In addition, certain restricted securities may exhibit greater price volatility than securities for which secondary markets exist. As of December 31, 2021, the Portfolio held the following restricted securities: |
Description | Acquisition Date | Shares | Acquisition Cost | Value | Value Per Share | % of Net Assets | ||||||||||||||||||
Common Stocks | ||||||||||||||||||||||||
Magic Leap, Inc., Class A | 12/28/2015 | 186 | $ | 2,157,962 | $ | 2,500 | $ | 13.44 | 0.00 | % | ||||||||||||||
Convertible Preferred Securities |
| |||||||||||||||||||||||
Nanigans, Inc., Series B | 03/16/2015 | 126,818 | 1,384,662 | 0 | 0.00 | 0.00 | ||||||||||||||||||
Warrants |
| |||||||||||||||||||||||
Nanigans, Inc. | 12/14/2021 | 299,097 | 0 | 0 | 0.00 | 0.00 | ||||||||||||||||||
|
|
|
| |||||||||||||||||||||
| $ | 2,500 | 0.00 | % | |||||||||||||||||||||
|
|
|
| |||||||||||||||||||||
| (2) | Securities classified as Level 3 (see Note 2). |
| (3) | See Note 2 for details of Joint Repurchase Agreements. |
| (4) | See Note 6 for cost of investments on a tax basis. |
ADR — American Depositary Receipt
ETF — Exchange-Traded Fund
| ||
| 6 |
Table of Contents
SunAmerica Series Trust SA Wellington Capital Appreciation Portfolio
PORTFOLIO OF INVESTMENTS — December 31, 2021 — (continued)
The following is a summary of the inputs used to value the Portfolio’s net assets as of December 31, 2021 (see Note 2):
| Level 1 - Unadjusted Quoted Prices | Level 2 - Other Observable Inputs | Level 3 - Significant Unobservable Inputs | Total | |||||||||||||
ASSETS: | ||||||||||||||||
Investments at Value:* | ||||||||||||||||
Common Stocks: | ||||||||||||||||
Application Software | $ | 36,399,495 | $ | — | $ | 2,500 | $ | 36,401,995 | ||||||||
Other Industries | 2,120,675,974 | — | — | 2,120,675,974 | ||||||||||||
Convertible Preferred Securities | — | — | 0 | 0 | ||||||||||||
Exchange-Traded Funds | 19,163,243 | — | — | 19,163,243 | ||||||||||||
Warrants | — | — | 0 | 0 | ||||||||||||
Repurchase Agreements | — | 38,460,000 | — | 38,460,000 | ||||||||||||
|
|
|
|
|
|
|
| |||||||||
Total Investments at Value | $ | 2,176,238,712 | $ | 38,460,000 | $ | 2,500 | $ | 2,214,701,212 | ||||||||
|
|
|
|
|
|
|
| |||||||||
| * | For a detailed presentation of investments, please refer to the Portfolio of Investments. |
At the beginning and end of the reporting period, Level 3 investments in securities were not considered a material portion of the Portfolio. There were no material Level 3 transfers during the reporting period.
See Notes to Financial Statements
| ||
| 7 |
Table of Contents
SunAmerica Series Trust SA Wellington Government and Quality Bond Portfolio
PORTFOLIO PROFILE — December 31, 2021 — (unaudited)
Industry Allocation*
United States Treasury Notes | 26.2 | % | ||
Repurchase Agreements | 19.3 | |||
Uniform Mtg. Backed Securities | 12.6 | |||
United States Treasury Bonds | 11.0 | |||
Diversified Financial Services | 9.9 | |||
Diversified Banking Institutions | 7.9 | |||
Government National Mtg. Assoc. | 6.5 | |||
Federal National Mtg. Assoc. | 3.6 | |||
Federal Home Loan Mtg. Corp. | 3.5 | |||
Banks-Commercial | 3.1 | |||
Electric-Integrated | 1.6 | |||
Medical-Hospitals | 1.5 | |||
Municipal Bonds & Notes | 1.4 | |||
Insurance-Life/Health | 1.4 | |||
Banks-Super Regional | 1.0 | |||
Pipelines | 0.9 | |||
Sovereign | 0.7 | |||
Telecom Services | 0.6 | |||
Cable/Satellite TV | 0.5 | |||
Banks-Fiduciary | 0.5 | |||
Gas-Distribution | 0.4 | |||
Electric-Distribution | 0.4 | |||
Apparel Manufacturers | 0.4 | |||
Medical Labs & Testing Services | 0.3 | |||
Medical-HMO | 0.3 | |||
Insurance-Mutual | 0.3 | |||
Real Estate Investment Trusts | 0.3 | |||
Oil Companies-Integrated | 0.3 | |||
Electronic Components-Semiconductors | 0.2 | |||
Telephone-Integrated | 0.2 | |||
Enterprise Software/Service | 0.2 | |||
Schools | 0.1 | |||
Brewery | 0.1 | |||
Insurance-Multi-line | 0.1 | |||
Building Societies | 0.1 | |||
Computers | 0.1 | |||
|
| |||
| 117.5% | ||||
|
|
Credit Quality†#
Aaa | 68.9 | % | ||
Aa | 3.7 | |||
A | 15.7 | |||
Baa | 3.5 | |||
Not Rated@ | 8.2 | |||
|
| |||
| 100.0 | % | |||
|
|
| † | Source: Moody’s |
| # | Calculated as a percentage of total debt issues |
| @ | Represents debt issues that either have no rating, or the rating is unavailable from the data source. |
| * | Calculated as a percentage of net assets |
| ||
| 8 |
Table of Contents
SunAmerica Series Trust SA Wellington Government and Quality Bond Portfolio
PORTFOLIO OF INVESTMENTS — December 31, 2021
| Security Description | Principal Amount | Value (Note 2) | ||||||
ASSET BACKED SECURITIES — 9.9% | ||||||||
Diversified Financial Services — 9.9% | ||||||||
Aaset Trust | $ | 670,095 | $ | 600,411 | ||||
Aligned Data Centers Issuer LLC | 4,010,000 | 3,949,762 | ||||||
Angel Oak Mtg. Trust I LLC VRS | 6,727,202 | 6,665,522 | ||||||
Angel Oak Mtg. Trust I LLC VRS | 346,942 | 346,522 | ||||||
Angel Oak Mtg. Trust I LLC VRS | 281,253 | 282,347 | ||||||
Angel Oak Mtg. Trust I LLC VRS | 216,684 | 217,455 | ||||||
Angel Oak Mtg. Trust I LLC VRS | 415,622 | 415,904 | ||||||
Apidos CLO FRS | 3,600,000 | 3,591,367 | ||||||
ARI Fleet Lease Trust | 90,753 | 90,880 | ||||||
Bain Capital Credit CLO, Ltd. FRS | 1,540,000 | 1,539,606 | ||||||
BANK | 7,380,000 | 7,431,826 | ||||||
Battalion CLO, Ltd. FRS | 910,000 | 909,538 | ||||||
Bayview Koitere Fund Trust VRS | 1,000,854 | 1,016,848 | ||||||
Benefit Street Partners, Ltd. FRS | 795,000 | 796,173 | ||||||
BFLD Trust FRS | 2,140,000 | 2,141,670 | ||||||
BlueMountain CLO XXXI, Ltd. FRS | 2,000,000 | 1,998,994 | ||||||
BX Commercial Mtg. Trust FRS | 4,455,000 | 4,439,801 | ||||||
BX Trust FRS | 9,100,000 | 9,009,348 | ||||||
| Security Description | Principal Amount | Value (Note 2) | ||||||
Diversified Financial Services (continued) |
| |||||||
BX Trust FRS | $ | 3,975,000 | $ | 3,965,031 | ||||
BXHPP Trust FRS | 4,335,000 | 4,312,217 | ||||||
Castlelake Aircraft Structured Trust | 901,711 | 888,904 | ||||||
CF Hippolyta LLC | 1,403,355 | 1,377,286 | ||||||
CFMT LLC | 7,858,735 | 7,834,541 | ||||||
Cloud Pass-Through Trust VRS | 16,104 | 16,155 | ||||||
COLT Mtg. Loan Trust VRS | 4,462,282 | 4,419,980 | ||||||
COLT Mtg. Loan Trust VRS | 3,453,839 | 3,443,925 | ||||||
COLT Mtg. Loan Trust VRS | 462,386 | 461,895 | ||||||
Columbia Cent CLO, Ltd. FRS | 1,765,000 | 1,764,559 | ||||||
Columbia Cent CLO, Ltd. FRS | 3,510,000 | 3,509,115 | ||||||
COMM Mtg. Trust | 1,020,000 | 1,022,720 | ||||||
Credit Acceptance Auto Loan Trust | 5,205,000 | 5,205,359 | ||||||
CSMC Trust VRS | 1,980,000 | 1,974,806 | ||||||
Enterprise Fleet Financing LLC | 2,560 | 2,564 | ||||||
FirstKey Homes Trust | 4,875,643 | 4,757,534 | ||||||
FirstKey Homes Trust | 3,515,000 | 3,511,657 | ||||||
Flagstar Mtg. Trust VRS | 2,089,520 | 2,107,085 | ||||||
| ||
| 9 |
Table of Contents
SunAmerica Series Trust SA Wellington Government and Quality Bond Portfolio
PORTFOLIO OF INVESTMENTS — December 31, 2021 — (continued)
| Security Description | Principal Amount | Value (Note 2) | ||||||
ASSET BACKED SECURITIES (continued) |
| |||||||
Diversified Financial Services (continued) |
| |||||||
Flagstar Mtg. Trust VRS | $ | 1,175,623 | $ | 1,193,770 | ||||
Ford Credit Auto Lease Trust | 1,585,000 | 1,572,429 | ||||||
Ford Credit Auto Owner Trust | 835,000 | 824,112 | ||||||
Ford Credit Auto Owner Trust | 725,000 | 720,951 | ||||||
Home Partners of America Trust | 3,702,826 | 3,658,234 | ||||||
Horizon Aircraft Finance, Ltd. | 746,999 | 731,471 | ||||||
Horizon Aircraft Finance, Ltd. | 420,517 | 412,033 | ||||||
Life Mtg. Trust FRS | 895,000 | 893,055 | ||||||
MACH 1, Ltd. | 435,718 | 426,369 | ||||||
Madison Park Funding, Ltd. FRS | 7,957,479 | 7,960,550 | ||||||
Magnetite, Ltd. FRS | 5,427,408 | 5,434,268 | ||||||
MetLife Securitization Trust VRS | 634,037 | 645,783 | ||||||
Mill City Mtg. Loan Trust VRS | 18,453 | 18,455 | ||||||
Mill City Mtg. Loan Trust VRS | 560,237 | 567,172 | ||||||
MMAF Equipment Finance LLC | 2,960,000 | 3,035,717 | ||||||
New Economy Assets Phase 1 Sponsor LLC | 3,985,000 | 3,908,477 | ||||||
OHA Credit Funding 3, Ltd. FRS | 4,550,000 | 4,546,392 | ||||||
OneMain Direct Auto Receivables Trust | 112,976 | 113,006 | ||||||
Rockland Park CLO, Ltd. FRS | 1,825,000 | 1,824,542 | ||||||
| Security Description | Principal Amount | Value (Note 2) | ||||||
Diversified Financial Services (continued) |
| |||||||
SCF Equipment Leasing LLC | $ | 5,815,000 | $ | 5,794,722 | ||||
SFAVE Commercial Mtg. Securities Trust VRS | 1,340,000 | 1,453,137 | ||||||
SoFi Consumer Loan Program Trust | 1,259,963 | 1,254,958 | ||||||
SoFi Consumer Loan Program Trust | 281,935 | 283,038 | ||||||
Sound Point, Ltd. FRS | 4,700,000 | 4,705,969 | ||||||
SREIT Trust FRS | 4,550,000 | 4,518,085 | ||||||
STARR II | 512,540 | 509,469 | ||||||
Starwood Mtg. Residential Trust VRS | 3,023,476 | 3,019,227 | ||||||
Symphony CLO XVII, Ltd. FRS | 973,920 | 973,725 | ||||||
Towd Point Mtg. Trust VRS | 64,358 | 64,374 | ||||||
Towd Point Mtg. Trust VRS | 1,069,633 | 1,087,013 | ||||||
Towd Point Mtg. Trust VRS | 520,568 | 527,143 | ||||||
Treman Park CLO, Ltd. FRS | 3,506,132 | 3,504,583 | ||||||
Vantage Data Centers Issuer LLC | 771,567 | 788,171 | ||||||
Vantage Data Centers LLC | 3,280,000 | 3,206,442 | ||||||
Venture XIII CLO, Ltd. FRS | 2,905,000 | 2,902,731 | ||||||
Wells Fargo Mtg. Backed Securities Trust VRS | 5,840,337 | 5,902,619 | ||||||
|
| |||||||
Total Asset Backed Securities |
| 175,001,499 | ||||||
|
| |||||||
| ||
| 10 |
Table of Contents
SunAmerica Series Trust SA Wellington Government and Quality Bond Portfolio
PORTFOLIO OF INVESTMENTS — December 31, 2021 — (continued)
| Security Description | Principal Amount | Value (Note 2) | ||||||
U.S. CORPORATE BONDS & NOTES — 14.0% |
| |||||||
Apparel Manufacturers — 0.4% |
| |||||||
VF Corp. | $ | 995,000 | $ | 1,041,207 | ||||
VF Corp. | 5,740,000 | 5,959,691 | ||||||
|
| |||||||
| 7,000,898 | ||||||||
|
| |||||||
Banks-Fiduciary — 0.5% |
| |||||||
National Securities Clearing Corp. | 8,905,000 | 8,671,341 | ||||||
|
| |||||||
Banks-Super Regional — 1.0% |
| |||||||
US Bancorp | 10,145,000 | 10,117,966 | ||||||
US Bancorp | 400,000 | 495,845 | ||||||
Wells Fargo & Co. | 2,760,000 | 2,820,409 | ||||||
Wells Fargo & Co. | 1,780,000 | 1,871,156 | ||||||
Wells Fargo & Co. | 1,770,000 | 1,821,212 | ||||||
Wells Fargo & Co. | 585,000 | 710,341 | ||||||
|
| |||||||
| 17,836,929 | ||||||||
|
| |||||||
Brewery — 0.1% |
| |||||||
Anheuser-Busch InBev Worldwide, Inc. | 1,725,000 | 2,114,158 | ||||||
|
| |||||||
Cable/Satellite TV — 0.5% |
| |||||||
Comcast Corp. | 850,000 | 758,014 | ||||||
Comcast Corp. | 1,921,000 | 1,865,233 | ||||||
Comcast Corp. | 1,675,000 | 1,602,502 | ||||||
Comcast Corp. | 2,535,000 | 2,768,773 | ||||||
Comcast Corp. | 1,524,000 | 1,760,865 | ||||||
Comcast Corp. | 200,000 | 234,375 | ||||||
|
| |||||||
| 8,989,762 | ||||||||
|
| |||||||
| Security Description | Principal Amount | Value (Note 2) | ||||||
Computers — 0.1% |
| |||||||
Apple, Inc. | $ | 1,050,000 | $ | 1,122,943 | ||||
|
| |||||||
Diversified Banking Institutions — 4.2% |
| |||||||
Bank of America Corp. | 4,575,000 | 4,544,286 | ||||||
Bank of America Corp. | 5,285,000 | 5,202,343 | ||||||
Bank of America Corp. | 1,547,000 | 1,579,069 | ||||||
Bank of America Corp. | 5,015,000 | 5,293,656 | ||||||
Bank of America Corp. | 1,950,000 | 2,055,318 | ||||||
Bank of America Corp. | 2,245,000 | 2,417,854 | ||||||
Bank of America Corp. | 2,645,000 | 2,916,057 | ||||||
Goldman Sachs Group, Inc. | 7,705,000 | 7,552,016 | ||||||
Goldman Sachs Group, Inc. | 3,380,000 | 3,331,822 | ||||||
Goldman Sachs Group, Inc. | 1,995,000 | 2,011,602 | ||||||
Goldman Sachs Group, Inc. | 2,075,000 | 2,177,642 | ||||||
Goldman Sachs Group, Inc. | 2,565,000 | 2,792,251 | ||||||
JPMorgan Chase & Co. | 2,895,000 | 2,791,527 | ||||||
JPMorgan Chase & Co. | 7,900,000 | 8,010,592 | ||||||
JPMorgan Chase & Co. | 4,520,000 | 5,133,981 | ||||||
Morgan Stanley | 1,505,000 | 1,439,726 | ||||||
Morgan Stanley | 3,110,000 | 3,110,646 | ||||||
Morgan Stanley | 4,975,000 | 5,396,981 | ||||||
Morgan Stanley | 6,125,000 | 6,494,225 | ||||||
|
| |||||||
| 74,251,594 | ||||||||
|
| |||||||
| ||
| 11 |
Table of Contents
SunAmerica Series Trust SA Wellington Government and Quality Bond Portfolio
PORTFOLIO OF INVESTMENTS — December 31, 2021 — (continued)
| Security Description | Principal Amount | Value (Note 2) | ||||||
U.S. CORPORATE BONDS & NOTES (continued) |
| |||||||
Electric-Distribution — 0.2% |
| |||||||
Mid-Atlantic Interstate Transmission LLC | $ | 3,646,000 | $ | 4,007,606 | ||||
|
| |||||||
Electric-Integrated — 1.6% |
| |||||||
Consolidated Edison Co of New York Inc | 2,135,000 | 2,142,085 | ||||||
Georgia Power Co. | 1,905,000 | 2,032,707 | ||||||
Georgia Power Co. | 455,000 | 519,442 | ||||||
Georgia Power Co. | 625,000 | 739,099 | ||||||
NextEra Energy Capital Holdings, Inc. | 5,560,000 | 5,506,125 | ||||||
Niagara Mohawk Power Corp. | 3,820,000 | 3,654,127 | ||||||
San Diego Gas & Electric Co. | 1,052,000 | 1,247,396 | ||||||
SCE Recovery Funding LLC | 1,438,477 | 1,371,738 | ||||||
SCE Recovery Funding LLC | 630,000 | 601,174 | ||||||
SCE Recovery Funding LLC | 365,000 | 350,746 | ||||||
South Carolina Electric & Gas Co. | 265,000 | 331,149 | ||||||
South Carolina Electric & Gas Co. | 1,195,000 | 1,615,585 | ||||||
South Carolina Electric & Gas Co. | 2,400,000 | 3,377,750 | ||||||
Southern California Edison Co. | 885,000 | 886,313 | ||||||
Southern California Edison Co. | 430,000 | 459,288 | ||||||
Westar Energy, Inc. | 3,200,000 | 3,330,782 | ||||||
|
| |||||||
| 28,165,506 | ||||||||
|
| |||||||
Electronic Components-Semiconductors — 0.2% |
| |||||||
Intel Corp. | 3,560,000 | 3,655,968 | ||||||
|
| |||||||
| Security Description | Principal Amount | Value (Note 2) | ||||||
Enterprise Software/Service — 0.2% |
| |||||||
Oracle Corp. | $ | 1,805,000 | $ | 1,773,709 | ||||
Oracle Corp. | 910,000 | 902,244 | ||||||
|
| |||||||
| 2,675,953 | ||||||||
|
| |||||||
Gas-Distribution — 0.4% |
| |||||||
Boston Gas Co. | 995,000 | 1,015,129 | ||||||
Boston Gas Co. | 1,655,000 | 1,718,132 | ||||||
Brooklyn Union Gas Co. | 1,170,000 | 1,230,180 | ||||||
KeySpan Gas East Corp. | 3,525,000 | 3,599,628 | ||||||
|
| |||||||
| 7,563,069 | ||||||||
|
| |||||||
Insurance-Life/Health — 1.4% |
| |||||||
Athene Global Funding | 8,470,000 | 8,524,886 | ||||||
Brighthouse Financial Global Funding | 600,000 | 594,968 | ||||||
Brighthouse Financial Global Funding | 6,290,000 | 6,207,554 | ||||||
Equitable Financial Life Global Funding | 3,405,000 | 3,302,191 | ||||||
Equitable Financial Life Global Funding | 5,985,000 | 5,890,254 | ||||||
|
| |||||||
| 24,519,853 | ||||||||
|
| |||||||
Insurance-Multi-line — 0.1% |
| |||||||
Metropolitan Life Global Funding I | 1,330,000 | 1,435,027 | ||||||
|
| |||||||
Insurance-Mutual — 0.3% |
| |||||||
New York Life Global Funding | 4,655,000 | 4,824,862 | ||||||
Northwestern Mutual Life Insurance Co. | 294,000 | 325,163 | ||||||
|
| |||||||
| 5,150,025 | ||||||||
|
| |||||||
Medical Labs & Testing Services — 0.3% |
| |||||||
Roche Holdings, Inc. | 5,080,000 | 5,280,632 | ||||||
|
| |||||||
| ||
| 12 |
Table of Contents
SunAmerica Series Trust SA Wellington Government and Quality Bond Portfolio
PORTFOLIO OF INVESTMENTS — December 31, 2021 — (continued)
| Security Description | Principal Amount | Value (Note 2) | ||||||
U.S. CORPORATE BONDS & NOTES (continued) |
| |||||||
Medical-HMO — 0.3% |
| |||||||
UnitedHealth Group, Inc. | $ | 1,155,000 | $ | 1,147,866 | ||||
UnitedHealth Group, Inc. | 1,165,000 | 1,263,721 | ||||||
UnitedHealth Group, Inc. | 825,000 | 1,025,465 | ||||||
|
| |||||||
| 3,437,052 | ||||||||
|
| |||||||
Medical-Hospitals — 1.5% |
| |||||||
Bon Secours Mercy Health, Inc. | 840,000 | 825,883 | ||||||
Children’s Hospital | 1,890,000 | 1,867,838 | ||||||
CommonSpirit Health | 6,100,000 | 6,920,552 | ||||||
Dignity Health | 1,242,000 | 1,314,850 | ||||||
Kaiser Foundation Hospitals | 3,915,000 | 3,947,544 | ||||||
Mercy Health | 2,700,000 | 2,895,191 | ||||||
Mercy Health | 2,645,000 | 2,977,237 | ||||||
Piedmont Healthcare, Inc. | 6,525,000 | 6,354,014 | ||||||
Sutter Health | 950,000 | 949,637 | ||||||
|
| |||||||
| 28,052,746 | ||||||||
|
| |||||||
Multimedia — 0.0% |
| |||||||
NBCUniversal Media LLC | 505,000 | 613,700 | ||||||
|
| |||||||
Oil Companies-Integrated — 0.1% |
| |||||||
Exxon Mobil Corp. | 845,000 | 876,684 | ||||||
|
| |||||||
Real Estate Investment Trusts — 0.3% |
| |||||||
SBA Tower Trust | 1,555,000 | 1,530,397 | ||||||
SBA Tower Trust | 810,000 | 808,933 | ||||||
SBA Tower Trust | 1,030,000 | 1,056,936 | ||||||
| Security Description | Principal Amount | Value (Note 2) | ||||||
Real Estate Investment Trusts (continued) |
| |||||||
SBA Tower Trust | $ | 1,495,000 | $ | 1,502,235 | ||||
|
| |||||||
| 4,898,501 | ||||||||
|
| |||||||
Schools — 0.1% |
| |||||||
Stanford University | 1,970,000 | 2,202,926 | ||||||
|
| |||||||
Special Purpose Entity — 0.0% |
| |||||||
Postal Square LP | 230,800 | 238,531 | ||||||
|
| |||||||
Telephone-Integrated — 0.2% |
| |||||||
Verizon Communications, Inc. | 470,000 | 546,179 | ||||||
Verizon Communications, Inc. | 2,000,000 | 2,332,708 | ||||||
|
| |||||||
| 2,878,887 | ||||||||
|
| |||||||
Transport-Rail — 0.0% |
| |||||||
Burlington Northern Santa Fe LLC | 500,000 | 632,507 | ||||||
|
| |||||||
Transport-Services — 0.0% |
| |||||||
Federal Express Corp. | 123,098 | 123,294 | ||||||
|
| |||||||
Total U.S. Corporate Bonds & Notes |
| 246,396,092 | ||||||
|
| |||||||
FOREIGN CORPORATE BONDS & NOTES — 8.6% |
| |||||||
Banks-Commercial — 3.1% |
| |||||||
Banque Federative du Credit Mutuel SA | 11,525,000 | 11,373,572 | ||||||
Cooperatieve Rabobank UA | 4,015,000 | 3,897,489 | ||||||
Danske Bank A/S | 10,225,000 | 9,995,916 | ||||||
Danske Bank A/S | 1,350,000 | 1,404,247 | ||||||
DNB Bank ASA | 3,860,000 | 3,807,274 | ||||||
DNB Boligkreditt AS | 1,780,000 | 1,788,964 | ||||||
ING Groep NV | 2,045,000 | 2,236,689 | ||||||
NBK SPC, Ltd. | 6,250,000 | 6,090,250 | ||||||
| ||
| 13 |
Table of Contents
SunAmerica Series Trust SA Wellington Government and Quality Bond Portfolio
PORTFOLIO OF INVESTMENTS — December 31, 2021 — (continued)
| Security Description | Principal Amount | Value (Note 2) | ||||||
FOREIGN CORPORATE BONDS & NOTES (continued) |
| |||||||
Banks-Commercial (continued) |
| |||||||
NBK SPC, Ltd. | $ | 7,345,000 | $ | 7,399,353 | ||||
Standard Chartered PLC | 3,310,000 | 3,272,624 | ||||||
Toronto-Dominion Bank | 4,000,000 | 4,003,600 | ||||||
|
| |||||||
| 55,269,978 | ||||||||
|
| |||||||
Building Societies — 0.1% |
| |||||||
Nationwide Building Society | 1,180,000 | 1,189,622 | ||||||
|
| |||||||
Diversified Banking Institutions — 3.7% |
| |||||||
Bank of Nova Scotia | 6,570,000 | 6,852,644 | ||||||
BNP Paribas SA | 2,955,000 | 2,895,814 | ||||||
BNP Paribas SA | 1,905,000 | 1,960,955 | ||||||
BNP Paribas SA | 390,000 | 393,772 | ||||||
BNP Paribas SA | 2,025,000 | 2,127,050 | ||||||
Credit Agricole SA | 5,165,000 | 5,404,311 | ||||||
Credit Agricole SA | 1,175,000 | 1,217,470 | ||||||
Credit Suisse Group AG FRS | 3,725,000 | 3,763,132 | ||||||
Credit Suisse Group AG | 2,655,000 | 2,844,085 | ||||||
HSBC Holdings PLC | 4,815,000 | 4,711,365 | ||||||
HSBC Holdings PLC | 3,795,000 | 3,723,300 | ||||||
HSBC Holdings PLC | 5,475,000 | 5,498,183 | ||||||
HSBC Holdings PLC | 1,305,000 | 1,317,381 | ||||||
HSBC Holdings PLC | 7,310,000 | 7,581,108 | ||||||
HSBC Holdings PLC | 670,000 | 786,927 | ||||||
| Security Description | Principal Amount | Value (Note 2) | ||||||
Diversified Banking Institutions (continued) |
| |||||||
Macquarie Group, Ltd. | $ | 8,960,000 | $ | 8,819,186 | ||||
Societe Generale SA | 1,355,000 | 1,355,709 | ||||||
UBS Group AG | 4,760,000 | 4,646,222 | ||||||
|
| |||||||
| 65,898,614 | ||||||||
|
| |||||||
Oil Companies-Integrated — 0.2% |
| |||||||
Qatar Petroleum | 2,215,000 | 2,238,514 | ||||||
Shell International Finance BV | 1,000,000 | 1,064,699 | ||||||
Statoil ASA | 211,000 | 214,722 | ||||||
|
| |||||||
| 3,517,935 | ||||||||
|
| |||||||
Pipelines — 0.9% |
| |||||||
Galaxy Pipeline Assets Bidco, Ltd. | 15,405,000 | 15,098,751 | ||||||
|
| |||||||
Telecom Services — 0.6% |
| |||||||
NBN Co., Ltd. | 6,485,000 | 6,450,037 | ||||||
NBN Co., Ltd. | 350,000 | 351,653 | ||||||
NTT Finance Corp. | 4,270,000 | 4,191,340 | ||||||
|
| |||||||
| 10,993,030 | ||||||||
|
| |||||||
Total Foreign Corporate Bonds & Notes | 151,967,930 | |||||||
|
| |||||||
FOREIGN GOVERNMENT OBLIGATIONS — 0.9% |
| |||||||
Electric-Distribution — 0.2% |
| |||||||
Hydro-Quebec | 3,000,000 | 3,007,378 | ||||||
|
| |||||||
Sovereign — 0.7% |
| |||||||
Kingdom of Saudi Arabia | 2,110,000 | 2,159,682 | ||||||
Republic of Chile | 6,925,000 | 6,734,563 | ||||||
State of Qatar | 3,335,000 | 3,467,233 | ||||||
|
| |||||||
| 12,361,478 | ||||||||
|
| |||||||
Total Foreign Government Obligations | 15,368,856 | |||||||
|
| |||||||
| ||
| 14 |
Table of Contents
SunAmerica Series Trust SA Wellington Government and Quality Bond Portfolio
PORTFOLIO OF INVESTMENTS — December 31, 2021 — (continued)
| Security Description | Principal Amount | Value (Note 2) | ||||||
MUNICIPAL BONDS & NOTES — 1.4% |
| |||||||
Municipal Bonds & Notes — 1.4% |
| |||||||
Bay Area Toll Authority | $ | 70,000 | $ | 122,444 | ||||
Chicago Transit Authority | 1,365,000 | 1,922,490 | ||||||
Chicago Transit Authority | 145,000 | 204,221 | ||||||
City of San Antonio, Texas Electric & Gas Systems | 515,000 | 518,100 | ||||||
Foothill-Eastern Transportation Corridor Agency | 2,670,000 | 2,854,211 | ||||||
Golden State Tobacco Securitization Corp. | 100,000 | 100,595 | ||||||
Golden State Tobacco Securitization Corp. | 200,000 | 203,471 | ||||||
Golden State Tobacco Securitization Corp. | 505,000 | 517,300 | ||||||
Illinois Municipal Electric Agency | 1,910,000 | 2,466,965 | ||||||
Kansas Development Finance Authority | 1,555,000 | 1,543,614 | ||||||
Kansas Development Finance Authority | 685,000 | 747,779 | ||||||
Metropolitan Transportation Authority Revenue Bonds | 100,000 | 113,056 | ||||||
Municipal Electric Authority of Georgia | 1,435,000 | 2,184,711 | ||||||
Oregon School Boards Association | 2,534,152 | 2,801,233 | ||||||
Philadelphia Authority for Industrial Development | 2,845,000 | 3,575,127 | ||||||
| Security Description | Principal Amount | Value (Note 2) | ||||||
Municipal Bonds & Notes (continued) |
| |||||||
Sales Tax Securitization Corp. | $ | 1,515,000 | $ | 1,930,073 | ||||
State of Wisconsin | 1,905,000 | 2,142,502 | ||||||
Utility Debt Securitization Authority | 1,016,000 | 1,042,472 | ||||||
|
| |||||||
Total Municipal Bonds & Notes | 24,990,364 | |||||||
|
| |||||||
U.S. GOVERNMENT AGENCIES — 26.2% |
| |||||||
Federal Home Loan Mtg. Corp. — 3.5% |
| |||||||
2.00% due 03/01/2051 | 7,198,205 | 7,186,032 | ||||||
2.50% due 10/01/2031 | 2,771,297 | 2,872,856 | ||||||
2.50% due 12/01/2051 | 4,275,000 | 4,380,580 | ||||||
3.00% due 11/01/2046 | 16,215,778 | 17,113,528 | ||||||
3.00% due 12/01/2046 | 4,512,829 | 4,762,774 | ||||||
4.00% due 09/01/2026 | 285,295 | 299,949 | ||||||
4.00% due 12/01/2040 | 1,830,099 | 2,004,338 | ||||||
6.00% due 12/01/2039 | 100,908 | 111,781 | ||||||
7.50% due 05/01/2027 | 343 | 376 | ||||||
Federal Home Loan Mtg. Corp. Multifamily Structured Pass Through Certs. | 3,890,000 | 3,953,642 | ||||||
Federal Home Loan Mtg. Corp. REMIC | 1,573,579 | 1,574,919 | ||||||
Series 4142, Class PT | 1,154,595 | 1,159,637 | ||||||
Series 4122, Class AB | 305,536 | 300,413 | ||||||
Series 4166, Class PB | 312,254 | 316,644 | ||||||
Series 4000, Class GA | 262,157 | 266,485 | ||||||
Series 4654, Class KA | 3,429,692 | 3,527,622 | ||||||
Series 4758, Class CA | 2,132,769 | 2,244,572 | ||||||
Federal Home Loan Mtg. Corp. SCRT | 8,623,320 | 8,844,258 | ||||||
Series 2019-3, Class MA | 1,309,907 | 1,361,236 | ||||||
|
| |||||||
| 62,281,642 | ||||||||
|
| |||||||
Federal National Mtg. Assoc. — 3.6% |
| |||||||
2.00% due 09/01/2031 | 176,567 | 181,571 | ||||||
2.00% due 11/01/2031 | 247,473 | 254,471 | ||||||
2.00% due 12/01/2031 | 833,154 | 856,507 | ||||||
2.47% due 05/01/2025 | 3,097,146 | 3,196,485 | ||||||
2.50% due 03/01/2030 | 2,844,991 | 2,955,643 | ||||||
2.50% due 07/01/2050 | 4,261,361 | 4,366,612 | ||||||
2.50% due 12/01/2051 | 4,275,000 | 4,379,031 | ||||||
2.68% due 05/01/2025 | 5,824,352 | 6,042,328 | ||||||
2.99% due 10/01/2025 | 2,003,527 | 2,109,912 | ||||||
3.00% due 05/01/2027 | 269,042 | 282,323 | ||||||
| ||
| 15 |
Table of Contents
SunAmerica Series Trust SA Wellington Government and Quality Bond Portfolio
PORTFOLIO OF INVESTMENTS — December 31, 2021 — (continued)
| Security Description | Principal Amount | Value (Note 2) | ||||||
U.S. GOVERNMENT AGENCIES (continued) |
| |||||||
Federal National Mtg. Assoc. (continued) |
| |||||||
3.00% due 06/01/2027 | $ | 120,798 | $ | 126,791 | ||||
3.00% due 08/01/2027 | 69,977 | 73,581 | ||||||
3.00% due 10/01/2046 | 5,445,581 | 5,742,812 | ||||||
3.01% due 12/01/2024 | 3,480,234 | 3,637,011 | ||||||
3.07% due 02/01/2025 | 700,000 | 733,776 | ||||||
3.09% due 10/01/2025 | 956,459 | 1,010,348 | ||||||
3.12% due 05/01/2033 | 2,562,411 | 2,790,511 | ||||||
4.00% due 09/01/2026 | 1,677,544 | 1,765,626 | ||||||
4.00% due 01/01/2046 | 2,440,805 | 2,650,869 | ||||||
4.00% due 02/01/2046 | 2,665,566 | 2,898,562 | ||||||
4.50% due 11/01/2026 | 189,556 | 196,989 | ||||||
4.50% due 01/01/2027 | 176,265 | 183,773 | ||||||
4.50% due 05/01/2039 | 15,511 | 17,140 | ||||||
4.50% due 06/01/2039 | 49,259 | 52,821 | ||||||
4.50% due 08/01/2039 | 4,412 | 4,877 | ||||||
4.50% due 11/01/2040 | 185,028 | 198,231 | ||||||
4.50% due 12/01/2040 | 122,720 | 135,626 | ||||||
4.50% due 07/01/2041 | 220,769 | 244,070 | ||||||
4.50% due 06/01/2043 | 141,689 | 154,309 | ||||||
4.50% due 10/01/2043 | 196,318 | 210,483 | ||||||
5.50% due 03/01/2038 | 183,367 | 209,692 | ||||||
5.50% due 06/01/2038 | 18,066 | 20,658 | ||||||
5.50% due 08/01/2038 | 18,694 | 21,394 | ||||||
5.50% due 09/01/2039 | 8,631 | 9,830 | ||||||
5.50% due 06/01/2040 | 5,060 | 5,594 | ||||||
6.50% due 02/01/2038 | 31,822 | 36,699 | ||||||
6.50% due 10/01/2039 | 33,054 | 37,993 | ||||||
Federal National Mtg. Assoc. REMIC FRS | 213,598 | 213,642 | ||||||
Federal National Mtg. Assoc. REMIC | ||||||||
Series 2013-9, Class PT | 994,646 | 995,911 | ||||||
Series 2012-103, Class HB | 3,379,259 | 3,405,962 | ||||||
Series 2017-51, Class AP | 8,766,733 | 9,039,221 | ||||||
Series 2019-6, Class GJ | 531,440 | 552,255 | ||||||
Series 2018-77, Class PA | 1,777,605 | 1,837,163 | ||||||
|
| |||||||
| 63,839,103 | ||||||||
|
| |||||||
Government National Mtg. Assoc. — 6.5% |
| |||||||
2.00% due January 30 TBA | 16,900,000 | 17,061,078 | ||||||
2.50% due January 30 TBA | 29,250,000 | 29,970,967 | ||||||
3.00% due January 30 TBA | 28,750,000 | 29,757,373 | ||||||
4.00% due 02/15/2041 | 342,541 | 370,392 | ||||||
4.00% due 09/15/2041 | 343,150 | 372,874 | ||||||
4.00% due 08/15/2042 | 114,953 | 129,001 | ||||||
4.00% due January 30 TBA | 24,250,000 | 25,540,176 | ||||||
4.50% due 05/15/2040 | 250,769 | 281,424 | ||||||
4.50% due 06/15/2040 | 203,328 | 227,040 | ||||||
4.50% due 07/15/2040 | 330,773 | 370,748 | ||||||
4.50% due 05/15/2042 | 106,618 | 118,687 | ||||||
4.50% due January 30 TBA | 3,025,000 | 3,195,274 | ||||||
5.00% due 07/15/2033 | 430,635 | 484,622 | ||||||
5.00% due 10/15/2033 | 28,370 | 32,280 | ||||||
5.00% due 11/15/2033 | 3,467 | 3,906 | ||||||
5.00% due 12/15/2033 | 8,342 | 9,479 | ||||||
| Security Description | Principal Amount | Value (Note 2) | ||||||
Government National Mtg. Assoc. (continued) |
| |||||||
5.00% due 01/15/2034 | $ | 65,061 | $ | 73,235 | ||||
5.00% due 02/15/2034 | 27,598 | 31,062 | ||||||
5.00% due 03/15/2034 | 1,258 | 1,413 | ||||||
5.00% due 05/15/2034 | 4,956 | 5,686 | ||||||
5.00% due 06/15/2035 | 2,938 | 3,393 | ||||||
5.00% due 09/15/2035 | 38,656 | 43,966 | ||||||
5.00% due 11/15/2035 | 11,705 | 13,213 | ||||||
5.00% due 12/15/2035 | 9,691 | 11,059 | ||||||
5.00% due 02/15/2036 | 6,247 | 7,031 | ||||||
5.00% due 09/15/2036 | 1,056 | 1,187 | ||||||
5.00% due 07/15/2038 | 27,924 | 31,437 | ||||||
5.00% due 08/15/2038 | 10,868 | 12,512 | ||||||
5.00% due 11/15/2038 | 32,299 | 36,940 | ||||||
5.00% due 12/15/2038 | 129,642 | 149,675 | ||||||
5.00% due 06/15/2039 | 144,499 | 166,369 | ||||||
5.00% due 08/15/2039 | 31,448 | 36,128 | ||||||
5.00% due 04/15/2041 | 98,342 | 113,227 | ||||||
5.50% due 10/15/2032 | 698 | 769 | ||||||
5.50% due 02/15/2033 | 51,360 | 56,467 | ||||||
5.50% due 05/15/2033 | 26,129 | 29,590 | ||||||
5.50% due 06/15/2033 | 30,984 | 35,094 | ||||||
5.50% due 07/15/2033 | 5,200 | 5,725 | ||||||
5.50% due 08/15/2033 | 289 | 317 | ||||||
5.50% due 09/15/2033 | 1,740 | 1,978 | ||||||
5.50% due 11/15/2033 | 38,127 | 42,049 | ||||||
5.50% due 01/15/2034 | 6,828 | 7,774 | ||||||
5.50% due 02/15/2034 | 14,509 | 16,522 | ||||||
5.50% due 03/15/2034 | 216,147 | 240,320 | ||||||
5.50% due 04/15/2034 | 11,693 | 13,381 | ||||||
5.50% due 05/15/2034 | 21,299 | 23,640 | ||||||
5.50% due 06/15/2034 | 2,412 | 2,651 | ||||||
5.50% due 07/15/2034 | 3,891 | 4,281 | ||||||
5.50% due 08/15/2034 | 6,809 | 7,491 | ||||||
5.50% due 09/15/2034 | 123,662 | 135,922 | ||||||
5.50% due 10/15/2034 | 67,573 | 74,328 | ||||||
5.50% due 04/15/2036 | 20,147 | 22,181 | ||||||
6.00% due 06/15/2028 | 6,406 | 7,045 | ||||||
6.00% due 08/15/2028 | 17,501 | 19,288 | ||||||
6.00% due 09/15/2028 | 22,067 | 24,269 | ||||||
6.00% due 12/15/2028 | 19,738 | 21,749 | ||||||
6.00% due 04/15/2029 | 1,145 | 1,262 | ||||||
6.00% due 01/15/2032 | 1,929 | 2,134 | ||||||
6.00% due 02/15/2032 | 195 | 214 | ||||||
6.00% due 07/15/2032 | 4,278 | 4,714 | ||||||
6.00% due 09/15/2032 | 5,305 | 5,839 | ||||||
6.00% due 10/15/2032 | 101,784 | 112,946 | ||||||
6.00% due 11/15/2032 | 6,623 | 7,289 | ||||||
6.00% due 01/15/2033 | 1,229 | 1,351 | ||||||
6.00% due 02/15/2033 | 4,741 | 5,394 | ||||||
6.00% due 03/15/2033 | 8,347 | 9,195 | ||||||
6.00% due 04/15/2033 | 24,437 | 26,895 | ||||||
6.00% due 05/15/2033 | 42,325 | 46,564 | ||||||
6.00% due 12/15/2033 | 10,967 | 12,735 | ||||||
6.00% due 08/15/2034 | 2,360 | 2,650 | ||||||
6.00% due 09/15/2034 | 45,404 | 50,025 | ||||||
6.00% due 10/15/2034 | 12,482 | 13,735 | ||||||
6.00% due 05/15/2036 | 9,561 | 10,911 | ||||||
6.00% due 06/15/2036 | 128,992 | 149,517 | ||||||
6.00% due 07/15/2036 | 1,165,340 | 1,327,834 | ||||||
6.00% due 08/15/2036 | 45,946 | 53,336 | ||||||
6.00% due 12/15/2036 | 60,513 | 69,603 | ||||||
6.00% due 02/15/2037 | 31,399 | 36,283 | ||||||
6.00% due 08/15/2037 | 20,002 | 22,761 | ||||||
| ||
| 16 |
Table of Contents
SunAmerica Series Trust SA Wellington Government and Quality Bond Portfolio
PORTFOLIO OF INVESTMENTS — December 31, 2021 — (continued)
| Security Description | Principal Amount | Value (Note 2) | ||||||
U.S. GOVERNMENT AGENCIES (continued) |
| |||||||
Government National Mtg. Assoc. (continued) |
| |||||||
6.00% due 01/15/2038 | $ | 115,271 | $ | 133,156 | ||||
6.00% due 03/15/2038 | 58,589 | 66,714 | ||||||
6.00% due 07/15/2038 | 38,677 | 44,902 | ||||||
6.00% due 08/15/2038 | 88,052 | 100,949 | ||||||
6.00% due 09/15/2038 | 138,282 | 157,354 | ||||||
6.00% due 10/15/2038 | 250,619 | 286,830 | ||||||
6.00% due 11/15/2038 | 48,260 | 55,878 | ||||||
6.00% due 12/15/2038 | 86,435 | 99,344 | ||||||
6.00% due 01/15/2039 | 86,808 | 98,033 | ||||||
6.00% due 02/15/2039 | 56,089 | 63,451 | ||||||
6.00% due 04/15/2039 | 67,157 | 73,927 | ||||||
6.00% due 12/15/2039 | 54,565 | 63,178 | ||||||
6.00% due 03/15/2040 | 175,575 | 193,536 | ||||||
6.00% due 04/15/2040 | 21,277 | 24,570 | ||||||
6.00% due 06/15/2041 | 73,460 | 85,239 | ||||||
6.50% due 06/15/2023 | 192 | 210 | ||||||
6.50% due 07/15/2023 | 2,301 | 2,524 | ||||||
6.50% due 08/15/2023 | 344 | 377 | ||||||
6.50% due 10/15/2023 | 540 | 592 | ||||||
6.50% due 11/15/2023 | 2,886 | 3,165 | ||||||
6.50% due 12/15/2023 | 9,517 | 10,443 | ||||||
6.50% due 02/15/2027 | 435 | 477 | ||||||
6.50% due 12/15/2027 | 957 | 1,057 | ||||||
6.50% due 01/15/2028 | 8,725 | 9,573 | ||||||
6.50% due 02/15/2028 | 3,835 | 4,235 | ||||||
6.50% due 03/15/2028 | 8,497 | 9,347 | ||||||
6.50% due 04/15/2028 | 5,816 | 6,407 | ||||||
6.50% due 05/15/2028 | 21,733 | 23,847 | ||||||
6.50% due 06/15/2028 | 27,494 | 30,216 | ||||||
6.50% due 07/15/2028 | 20,505 | 22,515 | ||||||
6.50% due 08/15/2028 | 13,327 | 14,648 | ||||||
6.50% due 09/15/2028 | 16,786 | 18,420 | ||||||
6.50% due 10/15/2028 | 16,451 | 18,062 | ||||||
6.50% due 11/15/2028 | 24,033 | 26,416 | ||||||
6.50% due 12/15/2028 | 21,546 | 23,744 | ||||||
6.50% due 02/15/2029 | 2,310 | 2,541 | ||||||
6.50% due 03/15/2029 | 10,253 | 11,250 | ||||||
6.50% due 04/15/2029 | 2,367 | 2,597 | ||||||
6.50% due 05/15/2029 | 41,332 | 45,348 | ||||||
6.50% due 06/15/2029 | 4,370 | 4,794 | ||||||
6.50% due 03/15/2031 | 1,067 | 1,171 | ||||||
6.50% due 04/15/2031 | 188 | 212 | ||||||
6.50% due 05/15/2031 | 35,555 | 39,088 | ||||||
6.50% due 06/15/2031 | 6,824 | 7,487 | ||||||
6.50% due 07/15/2031 | 25,757 | 28,260 | ||||||
6.50% due 08/15/2031 | 7,413 | 8,133 | ||||||
6.50% due 09/15/2031 | 43,359 | 47,832 | ||||||
6.50% due 10/15/2031 | 14,753 | 16,420 | ||||||
6.50% due 11/15/2031 | 10,202 | 11,194 | ||||||
6.50% due 01/15/2032 | 78,983 | 86,977 | ||||||
6.50% due 02/15/2032 | 30,108 | 33,218 | ||||||
6.50% due 04/15/2032 | 10,185 | 11,272 | ||||||
6.50% due 05/15/2032 | 945 | 1,037 | ||||||
7.00% due 11/15/2031 | 6,719 | 7,364 | ||||||
7.00% due 03/15/2032 | 7,972 | 9,037 | ||||||
7.00% due 01/15/2033 | 9,680 | 11,042 | ||||||
7.00% due 05/15/2033 | 27,677 | 31,461 | ||||||
7.00% due 07/15/2033 | 16,350 | 18,425 | ||||||
7.00% due 11/15/2033 | 26,124 | 29,799 | ||||||
8.00% due 10/15/2029 | 294 | 295 | ||||||
8.00% due 12/15/2029 | 261 | 262 | ||||||
8.00% due 01/15/2030 | 3,865 | 3,947 | ||||||
| Security Description | Principal Amount | Value (Note 2) | ||||||
Government National Mtg. Assoc. (continued) |
| |||||||
8.00% due 03/15/2030 | $ | 91 | $ | 91 | ||||
8.00% due 04/15/2030 | 12,299 | 12,379 | ||||||
8.00% due 08/15/2030 | 749 | 752 | ||||||
8.00% due 09/15/2030 | 14,225 | 14,477 | ||||||
8.00% due 11/15/2030 | 1,338 | 1,411 | ||||||
8.00% due 02/15/2031 | 28,973 | 31,372 | ||||||
8.00% due 03/15/2031 | 7,173 | 7,201 | ||||||
Government National Mtg. Assoc. REMIC | ||||||||
Series 2005-74, Class HA | 6,860 | 7,222 | ||||||
Series 2005-74, Class HB | 91,910 | 100,843 | ||||||
Series 2005-74, Class HC | 53,173 | 59,766 | ||||||
|
| |||||||
| 113,908,185 | ||||||||
|
| |||||||
Uniform Mtg. Backed Securities — 12.6% |
| |||||||
2.00% due January 15 TBA | 17,185,000 | 17,603,885 | ||||||
2.00% due January 30 TBA | 72,075,000 | 71,889,182 | ||||||
2.00% due February 30 TBA | 35,500,000 | 35,337,921 | ||||||
2.50% due January 30 TBA | 58,861,000 | 60,081,906 | ||||||
3.00% due January 30 TBA | 36,815,000 | 38,156,734 | ||||||
|
| |||||||
| 223,069,628 | ||||||||
|
| |||||||
Total U.S. Government Agencies |
| 463,098,558 | ||||||
|
| |||||||
U.S. GOVERNMENT TREASURIES — 37.2% |
| |||||||
United States Treasury Bonds — 11.0% |
| |||||||
1.63% due 11/15/2050 | 3,060,000 | 2,864,327 | ||||||
1.75% due 08/15/2041 | 26,555,000 | 25,828,887 | ||||||
1.88% due 02/15/2041 | 45,000 | 44,682 | ||||||
1.88% due 11/15/2051 | 24,185,000 | 24,105,643 | ||||||
2.00% due 11/15/2041 | 30,570,000 | 31,018,997 | ||||||
2.00% due 08/15/2051 | 18,050,000 | 18,484,328 | ||||||
2.25% due 08/15/2049(7) | 2,805,000 | 3,015,046 | ||||||
2.50% due 02/15/2045 | 7,555,000 | 8,339,126 | ||||||
2.50% due 05/15/2046 | 915,000 | 1,015,150 | ||||||
2.75% due 08/15/2047 | 2,965,000 | 3,463,954 | ||||||
2.75% due 11/15/2047 | 7,783,000 | 9,097,293 | ||||||
2.88% due 05/15/2043 | 24,845,000 | 28,967,717 | ||||||
2.88% due 08/15/2045 | 6,205,000 | 7,312,205 | ||||||
2.88% due 05/15/2049 | 8,265,000 | 9,997,099 | ||||||
3.38% due 05/15/2044 | 2,895,000 | 3,657,086 | ||||||
3.63% due 02/15/2044 | 13,550,000 | 17,692,277 | ||||||
|
| |||||||
| 194,903,817 | ||||||||
|
| |||||||
United States Treasury Notes — 26.2% |
| |||||||
0.13% due 07/31/2023 | 3,200,000 | 3,175,125 | ||||||
0.25% due 06/15/2023 | 5,470,000 | 5,444,787 | ||||||
0.25% due 09/30/2023 | 29,630,000 | 29,423,979 | ||||||
0.25% due 03/15/2024 | 5,200,000 | 5,138,656 | ||||||
0.25% due 05/15/2024 | 11,245,000 | 11,093,895 | ||||||
0.25% due 05/31/2025 | 16,910,000 | 16,454,223 | ||||||
0.25% due 06/30/2025 | 33,840,000 | 32,888,250 | ||||||
0.25% due 07/31/2025 | 6,000,000 | 5,822,109 | ||||||
0.25% due 08/31/2025 | 16,550,000 | 16,038,631 | ||||||
0.25% due 09/30/2025 | 9,070,000 | 8,786,562 | ||||||
0.38% due 10/31/2023 | 5,315,000 | 5,284,273 | ||||||
0.38% due 04/15/2024 | 10,800,000 | 10,693,687 | ||||||
0.38% due 11/30/2025 | 21,835,000 | 21,185,068 | ||||||
0.38% due 12/31/2025 | 13,800,000 | 13,382,227 | ||||||
0.38% due 01/31/2026 | 8,125,000 | 7,864,111 | ||||||
0.50% due 11/30/2023 | 13,315,000 | 13,265,589 | ||||||
0.50% due 02/28/2026 | 10,500,000 | 10,206,738 | ||||||
| ||
| 17 |
Table of Contents
SunAmerica Series Trust SA Wellington Government and Quality Bond Portfolio
PORTFOLIO OF INVESTMENTS — December 31, 2021 — (continued)
| Security Description | Principal Amount | Value (Note 2) | ||||||
U.S. GOVERNMENT TREASURIES (continued) |
| |||||||
United States Treasury Notes (continued) |
| |||||||
0.63% due 10/15/2024 | $ | 3,050,000 | $ | 3,025,934 | ||||
0.75% due 11/15/2024 | 15,985,000 | 15,898,831 | ||||||
0.75% due 03/31/2026 | 12,620,000 | 12,386,826 | ||||||
0.75% due 04/30/2026 | 7,225,000 | 7,085,580 | ||||||
0.75% due 05/31/2026 | 6,080,000 | 5,958,400 | ||||||
0.88% due 06/30/2026 | 12,320,000 | 12,131,350 | ||||||
0.88% due 09/30/2026 | 18,655,000 | 18,333,638 | ||||||
1.00% due 12/15/2024 | 3,550,000 | 3,554,715 | ||||||
1.13% due 10/31/2026 | 12,000,000 | 11,927,813 | ||||||
1.25% due 11/30/2026 | 19,735,000 | 19,735,000 | ||||||
1.25% due 12/31/2026 | 13,600,000 | 13,594,682 | ||||||
1.25% due 03/31/2028 | 8,380,000 | 8,312,240 | ||||||
1.25% due 08/15/2031 | 14,480,000 | 14,174,562 | ||||||
1.38% due 11/15/2031 | 17,020,000 | 16,825,866 | ||||||
1.50% due 11/30/2028 | 7,845,000 | 7,882,999 | ||||||
1.63% due 10/31/2026 | 7,005,000 | 7,127,861 | ||||||
1.63% due 05/15/2031 | 2,165,000 | 2,194,769 | ||||||
1.75% due 06/30/2024 | 2,905,000 | 2,968,887 | ||||||
2.63% due 12/31/2023 | 15,000,000 | 15,560,742 | ||||||
2.88% due 09/30/2023 | 14,325,000 | 14,872,260 | ||||||
2.88% due 10/31/2023 | 32,065,000 | 33,332,570 | ||||||
|
| |||||||
| 463,033,435 | ||||||||
|
| |||||||
Total U.S. Government Treasuries | 657,937,252 | |||||||
|
| |||||||
Total Long-Term Investment Securities | 1,734,760,551 | |||||||
|
| |||||||
REPURCHASE AGREEMENTS — 19.3% |
| |||||||
Bank of America Securities LLC Joint Repurchase Agreement(6) | 77,220,000 | 77,220,000 | ||||||
Barclays Capital, Inc. Joint Repurchase Agreement(6) | 60,110,000 | 60,110,000 | ||||||
BNP Paribas SA Joint Repurchase Agreement(6) | 52,095,000 | 52,095,000 | ||||||
Deutsche Bank AG Joint Repurchase Agreement(6) | 76,140,000 | 76,140,000 | ||||||
RBS Securities, Inc. Joint Repurchase Agreement(6) | 76,140,000 | 76,140,000 | ||||||
|
| |||||||
Total Repurchase Agreements | 341,705,000 | |||||||
|
| |||||||
| Value (Note 2) | ||||||||
TOTAL INVESTMENTS | 117.5 | % | $ | 2,076,465,551 | ||||
Liabilities in excess of other assets | (17.5 | ) | (309,366,378 | ) | ||||
|
|
|
| |||||
NET ASSETS | 100.0 | % | $ | 1,767,099,173 | ||||
|
|
|
| |||||
| * | Securities exempt from registration under Rule 144A of the Securities Act of 1933. These securities may be sold in transactions exempt from registration, normally to qualified institutional buyers. The Portfolio has no right to demand registration of these securities. At December 31, 2021, the aggregate value of these securities was $357,230,267 representing 20.2% of net assets. |
| (1) | Certain variable rate securities are not based on a published reference rate and spread but are determined by the issuer or agent and are based on current market conditions. These securities do not indicate a reference rate and spread in their description above. |
| (2) | Collateralized Mortgage Obligation |
| (3) | Collateralized Loan Obligation |
| (4) | Commercial Mortgage Backed Security |
| (5) | See Note 6 for cost of investments on a tax basis. |
| (6) | See Note 2 for details of Joint Repurchase Agreements. |
| (7) | The security or a portion thereof was pledged as collateral to cover margin requirements for open futures contracts. |
REMIC — Real Estate Mortgage Investment Conduit
SCRT — Seasoned Credit Risk Transfer Trust
TBA — Securities purchased on a forward commitment basis with an approximate principal amount and no definite maturity date. The actual principal amount and maturity date will be determined upon settlement date.
FRS — Floating Rate Security
VRS — Variable Rate Security
The rates shown on FRS and VRS are the current interest rates at December 31, 2021 and unless noted otherwise, the dates shown are the original maturity dates.
Index Legend
1 ML — 1 Month USD LIBOR
3 ML — 3 Month USD LIBOR
| Futures Contracts | ||||||||||||||||||||
Number of | Type | Description | Expiration Month | Notational Basis* | Notational Value* | Unrealized Appreciation | ||||||||||||||
| 45 | Long | U.S. Treasury Ultra 10 Year Notes | March 2022 | $ | 6,579,454 | $ | 6,589,688 | $ | 10,234 | |||||||||||
|
| |||||||||||||||||||
Unrealized (Depreciation) | ||||||||||||||||||||
| 182 | Long | U.S. Treasury 2 Year Notes | March 2022 | $ | 39,719,538 | $ | 39,707,281 | $ | (12,257 | ) | ||||||||||
| 65 | Long | U.S. Treasury 10 Year Notes | March 2022 | 8,504,344 | 8,480,469 | (23,875 | ) | |||||||||||||
|
| |||||||||||||||||||
| (36,132 | ) | |||||||||||||||||||
|
| |||||||||||||||||||
Net Unrealized Appreciation (Depreciation) | $ | (25,898 | ) | |||||||||||||||||
|
| |||||||||||||||||||
| * | Notational basis refers to the contractual amount agreed upon at inception of the open contract; notational value represents the current value of the open contract. |
| ||
| 18 |
Table of Contents
SunAmerica Series Trust SA Wellington Government and Quality Bond Portfolio
PORTFOLIO OF INVESTMENTS — December 31, 2021 — (continued)
The following is a summary of the inputs used to value the Portfolio’s net assets as of December 31, 2021 (see Note 2):
| Level 1 - Unadjusted Quoted Prices | Level 2 - Other Observable Inputs | Level 3 - Significant Unobservable Inputs | Total | |||||||||||||
ASSETS: | ||||||||||||||||
Investments at Value:* | ||||||||||||||||
Asset Backed Securities | $ | — | $ | 175,001,499 | $ | — | $ | 175,001,499 | ||||||||
U.S. Corporate Bonds & Notes | — | 246,396,092 | — | 246,396,092 | ||||||||||||
Foreign Corporate Bonds & Notes | — | 151,967,930 | — | 151,967,930 | ||||||||||||
Foreign Government Obligations | — | 15,368,856 | — | 15,368,856 | ||||||||||||
Municipal Bond & Notes | — | 24,990,364 | — | 24,990,364 | ||||||||||||
U.S. Government Agencies | — | 463,098,558 | — | 463,098,558 | ||||||||||||
U.S. Government Treasuries | — | 657,937,252 | — | 657,937,252 | ||||||||||||
Repurchase Agreements | — | 341,705,000 | — | 341,705,000 | ||||||||||||
|
|
|
|
|
|
|
| |||||||||
Total Investments at Value | $ | — | $ | 2,076,465,551 | $ | — | $ | 2,076,465,551 | ||||||||
|
|
|
|
|
|
|
| |||||||||
Other Financial Instruments:+ | ||||||||||||||||
Futures Contracts | $ | 10,234 | $ | — | $ | — | $ | 10,234 | ||||||||
|
|
|
|
|
|
|
| |||||||||
LIABILITIES: | ||||||||||||||||
Other Financial Instruments:+ | ||||||||||||||||
Futures Contracts | $ | 36,132 | $ | — | $ | — | $ | 36,132 | ||||||||
|
|
|
|
|
|
|
| |||||||||
| * | For a detailed presentation of investments, please refer to the Portfolio of Investments. |
| + | Amounts represent unrealized appreciation/depreciation as of the end of the reporting period. |
See Notes to Financial Statements
| ||
| 19 |
Table of Contents
SunAmerica Series Trust SA Wellington Strategic Multi-Asset Portfolio
PORTFOLIO PROFILE — December 31, 2021 — (unaudited)
Industry Allocation*
Sovereign | 21.3 | % | ||
United States Treasury Notes | 6.8 | |||
E-Commerce/Products | 3.1 | |||
Diversified Banking Institutions | 2.8 | |||
United States Treasury Bonds | 2.7 | |||
Repurchase Agreements | 2.7 | |||
Commercial Services-Finance | 2.3 | |||
Enterprise Software/Service | 2.3 | |||
Real Estate Investment Trusts | 2.2 | |||
Retail-Apparel/Shoe | 2.0 | |||
Banks-Commercial | 2.0 | |||
Electronic Components-Semiconductors | 1.9 | |||
Medical-HMO | 1.8 | |||
E-Commerce/Services | 1.8 | |||
Finance-Credit Card | 1.8 | |||
Distribution/Wholesale | 1.8 | |||
Web Portals/ISP | 1.7 | |||
Auto-Cars/Light Trucks | 1.5 | |||
Oil Companies-Exploration & Production | 1.5 | |||
Finance-Investment Banker/Broker | 1.4 | |||
Metal-Diversified | 1.4 | |||
Medical-Biomedical/Gene | 1.3 | |||
Medical-Drugs | 1.2 | |||
Applications Software | 1.1 | |||
Internet Content-Information/News | 1.1 | |||
Diversified Manufacturing Operations | 1.1 | |||
Private Equity | 1.0 | |||
Wireless Equipment | 1.0 | |||
Audio/Video Products | 0.9 | |||
Finance-Leasing Companies | 0.9 | |||
Machinery-General Industrial | 0.9 | |||
Industrial Automated/Robotic | 0.9 | |||
Electronic Measurement Instruments | 0.9 | |||
Oil Refining & Marketing | 0.8 | |||
Computer Aided Design | 0.8 | |||
Computers | 0.8 | |||
Pharmacy Services | 0.8 | |||
Medical Labs & Testing Services | 0.8 | |||
Building Products-Air & Heating | 0.8 | |||
Insurance Brokers | 0.7 | |||
Retail-Jewelry | 0.7 | |||
Medical Products | 0.7 | |||
Data Processing/Management | 0.7 | |||
Retail-Restaurants | 0.7 | |||
Building-Residential/Commercial | 0.7 | |||
Consulting Services | 0.7 | |||
Machine Tools & Related Products | 0.7 | |||
Theaters | 0.7 | |||
Semiconductor Components-Integrated Circuits | 0.6 | |||
Entertainment Software | 0.6 | |||
Cosmetics & Toiletries | 0.6 | |||
Internet Application Software | 0.5 | |||
Computer Data Security | 0.5 | |||
Internet Content-Entertainment | 0.5 | |||
Exchange-Traded Funds | 0.5 | |||
Human Resources | 0.4 | |||
Building-Heavy Construction | 0.4 | |||
Drug Delivery Systems | 0.4 | |||
Finance-Other Services | 0.4 | |||
Communications Software | 0.3 | |||
Rental Auto/Equipment | 0.3 |
Transport-Truck | 0.3 | % | ||
Semiconductor Equipment | 0.2 | |||
Diagnostic Equipment | 0.2 | |||
Electronic Connectors | 0.2 | |||
Electric-Generation | 0.2 | |||
Commercial Paper | 0.1 | |||
Diversified Financial Services | 0.1 | |||
Insurance-Life/Health | 0.1 | |||
Telephone-Integrated | 0.1 | |||
Transport-Rail | 0.1 | |||
Electric-Integrated | 0.1 | |||
Finance-Auto Loans | 0.1 | |||
Cable/Satellite TV | 0.1 | |||
Food-Confectionery | 0.1 | |||
Environmental Consulting & Engineering | 0.1 | |||
Computer Services | 0.1 | |||
Decision Support Software | 0.1 | |||
|
| |||
| 98.5 | % | |||
|
|
| * | Calculated as a percentage of net assets |
| ||
| 20 |
Table of Contents
SunAmerica Series Trust SA Wellington Strategic Multi-Asset Portfolio
PORTFOLIO OF INVESTMENTS — December 31, 2021
| Security Description | Shares | Value (Note 2) | ||||||||||
COMMON STOCKS(1) — 62.4% |
| |||||||||||
Applications Software — 1.1% |
| |||||||||||
Intuit, Inc. | 698 | $ | 448,967 | |||||||||
Roper Technologies, Inc. | 2,680 | 1,318,185 | ||||||||||
|
| |||||||||||
| 1,767,152 | ||||||||||||
|
| |||||||||||
Audio/Video Products — 0.9% |
| |||||||||||
Sony Group Corp. | 11,600 | 1,459,706 | ||||||||||
|
| |||||||||||
Auto-Cars/Light Trucks — 1.4% |
| |||||||||||
Ferrari NV | 4,120 | 1,067,116 | ||||||||||
Ford Motor Co. | 26,677 | 554,081 | ||||||||||
Tesla, Inc.† | 509 | 537,901 | ||||||||||
|
| |||||||||||
| 2,159,098 | ||||||||||||
|
| |||||||||||
Banks-Commercial — 2.0% |
| |||||||||||
HDFC Bank, Ltd. ADR | 3,696 | 240,498 | ||||||||||
ICICI Bank, Ltd. ADR | 43,634 | 863,517 | ||||||||||
KBC Group NV | 22,768 | 1,956,026 | ||||||||||
|
| |||||||||||
| 3,060,041 | ||||||||||||
|
| |||||||||||
Building Products-Air & Heating — 0.8% |
| |||||||||||
Daikin Industries, Ltd. | 5,200 | 1,179,414 | ||||||||||
|
| |||||||||||
Building-Heavy Construction — 0.4% |
| |||||||||||
Cellnex Telecom SA* | 10,517 | 612,809 | ||||||||||
|
| |||||||||||
Building-Residential/Commercial — 0.7% |
| |||||||||||
Lennar Corp., Class A | 9,237 | 1,072,970 | ||||||||||
|
| |||||||||||
Commercial Services-Finance — 2.3% |
| |||||||||||
Allfunds Group Plc† | 22,218 | 437,506 | ||||||||||
Block, Inc., Class A† | 1,459 | 235,643 | ||||||||||
Global Payments, Inc. | 5,387 | 728,215 | ||||||||||
IHS Markit, Ltd. | 9,539 | 1,267,924 | ||||||||||
S&P Global, Inc. | 1,981 | 934,893 | ||||||||||
|
| |||||||||||
| 3,604,181 | ||||||||||||
|
| |||||||||||
Communications Software — 0.3% |
| |||||||||||
RingCentral, Inc., Class A† | 2,872 | 538,069 | ||||||||||
|
| |||||||||||
Computer Aided Design — 0.8% |
| |||||||||||
Autodesk, Inc.† | 4,516 | 1,269,854 | ||||||||||
|
| |||||||||||
Computer Data Security — 0.5% |
| |||||||||||
Varonis Systems, Inc.† | 16,915 | 825,114 | ||||||||||
|
| |||||||||||
Computers — 0.8% |
| |||||||||||
Apple, Inc. | 6,792 | 1,206,056 | ||||||||||
|
| |||||||||||
Consulting Services — 0.7% |
| |||||||||||
Booz Allen Hamilton Holding Corp. | 12,021 | 1,019,261 | ||||||||||
|
| |||||||||||
Cosmetics & Toiletries — 0.6% |
| |||||||||||
Proya Cosmetics Co., Ltd., Class A | 27,658 | 903,989 | ||||||||||
|
| |||||||||||
Data Processing/Management — 0.7% |
| |||||||||||
Fidelity National Information Services, Inc. | 10,075 | 1,099,686 | ||||||||||
|
| |||||||||||
Decision Support Software — 0.1% |
| |||||||||||
MSCI, Inc. | 160 | 98,030 | ||||||||||
|
| |||||||||||
Diagnostic Equipment — 0.2% |
| |||||||||||
Danaher Corp. | 834 | 274,394 | ||||||||||
|
| |||||||||||
Distribution/Wholesale — 1.8% |
| |||||||||||
Copart, Inc.† | 7,811 | 1,184,304 | ||||||||||
LKQ Corp. | 26,671 | 1,601,060 | ||||||||||
|
| |||||||||||
| 2,785,364 | ||||||||||||
|
| |||||||||||
| Security Description | Shares | Value (Note 2) | ||||||||||
Diversified Banking Institutions — 2.6% |
| |||||||||||
JPMorgan Chase & Co. | 11,878 | $ | 1,880,882 | |||||||||
Mitsubishi UFJ Financial Group, Inc. | 201,200 | 1,093,018 | ||||||||||
UniCredit SpA | 63,625 | 981,087 | ||||||||||
|
| |||||||||||
| 3,954,987 | ||||||||||||
|
| |||||||||||
Diversified Manufacturing Operations — 1.1% |
| |||||||||||
Siemens AG | 9,856 | 1,713,230 | ||||||||||
|
| |||||||||||
Drug Delivery Systems — 0.4% |
| |||||||||||
DexCom, Inc.† | 1,026 | 550,911 | ||||||||||
|
| |||||||||||
E-Commerce/Products — 3.1% |
| |||||||||||
Amazon.com, Inc.† | 989 | 3,297,662 | ||||||||||
Chewy, Inc., Class A† | 12,614 | 743,848 | ||||||||||
Coupang, Inc.† | 11,777 | 346,008 | ||||||||||
Sea, Ltd. ADR† | 1,480 | 331,091 | ||||||||||
|
| |||||||||||
| 4,718,609 | ||||||||||||
|
| |||||||||||
E-Commerce/Services — 1.8% |
| |||||||||||
Airbnb, Inc., Class A† | 5,640 | 939,004 | ||||||||||
Match Group, Inc.† | 6,205 | 820,611 | ||||||||||
Uber Technologies, Inc.† | 25,267 | 1,059,445 | ||||||||||
|
| |||||||||||
| 2,819,060 | ||||||||||||
|
| |||||||||||
Electronic Components-Semiconductors — 1.9% |
| |||||||||||
Advanced Micro Devices, Inc.† | 6,694 | 963,267 | ||||||||||
Marvell Technology, Inc. | 22,199 | 1,942,190 | ||||||||||
|
| |||||||||||
| 2,905,457 | ||||||||||||
|
| |||||||||||
Electronic Connectors — 0.2% |
| |||||||||||
TE Connectivity, Ltd. | 1,456 | 234,911 | ||||||||||
|
| |||||||||||
Electronic Measurement Instruments — 0.9% |
| |||||||||||
Agilent Technologies, Inc. | 8,539 | 1,363,251 | ||||||||||
|
| |||||||||||
Enterprise Software/Service — 2.3% |
| |||||||||||
Avalara, Inc.† | 6,415 | 828,241 | ||||||||||
salesforce.com, Inc.† | 10,889 | 2,767,221 | ||||||||||
|
| |||||||||||
| 3,595,462 | ||||||||||||
|
| |||||||||||
Entertainment Software — 0.6% |
| |||||||||||
Electronic Arts, Inc. | 7,050 | 929,895 | ||||||||||
|
| |||||||||||
Environmental Consulting & Engineering — 0.1% |
| |||||||||||
Tetra Tech, Inc. | 604 | 102,559 | ||||||||||
|
| |||||||||||
Finance-Credit Card — 1.8% |
| |||||||||||
Visa, Inc., Class A | 12,947 | 2,805,744 | ||||||||||
|
| |||||||||||
Finance-Investment Banker/Broker — 1.3% |
| |||||||||||
Charles Schwab Corp. | 17,573 | 1,477,889 | ||||||||||
XP, Inc., Class A† | 20,874 | 599,919 | ||||||||||
|
| |||||||||||
| 2,077,808 | ||||||||||||
|
| |||||||||||
Finance-Leasing Companies — 0.8% |
| |||||||||||
AerCap Holdings NV† | 19,152 | 1,252,924 | ||||||||||
|
| |||||||||||
Finance-Other Services — 0.3% |
| |||||||||||
Coinbase Global, Inc., Class A† | 1,679 | 423,729 | ||||||||||
|
| |||||||||||
Human Resources — 0.4% |
| |||||||||||
Recruit Holdings Co., Ltd. | 10,304 | 624,528 | ||||||||||
|
| |||||||||||
Industrial Automated/Robotic — 0.9% |
| |||||||||||
Keyence Corp. | 2,230 | 1,401,238 | ||||||||||
|
| |||||||||||
Insurance Brokers — 0.7% |
| |||||||||||
Marsh & McLennan Cos., Inc. | 6,638 | 1,153,817 | ||||||||||
|
| |||||||||||
| ||
| 21 |
Table of Contents
SunAmerica Series Trust SA Wellington Strategic Multi-Asset Portfolio
PORTFOLIO OF INVESTMENTS — December 31, 2021 — (continued)
| Security Description | Shares | Value (Note 2) | ||||||||||
COMMON STOCKS (continued) |
| |||||||||||
Internet Application Software — 0.5% |
| |||||||||||
Shopify, Inc., Class A† | 605 | $ | 833,321 | |||||||||
|
| |||||||||||
Internet Content-Entertainment — 0.5% |
| |||||||||||
Netflix, Inc.† | 1,256 | 756,665 | ||||||||||
|
| |||||||||||
Internet Content-Information/News — 1.1% |
| |||||||||||
Tencent Holdings, Ltd. | 29,300 | 1,716,467 | ||||||||||
|
| |||||||||||
Machine Tools & Related Products — 0.7% |
| |||||||||||
Techtronic Industries Co., Ltd. | 51,000 | 1,015,087 | ||||||||||
|
| |||||||||||
Machinery-General Industrial — 0.9% |
| |||||||||||
Middleby Corp.† | 2,020 | 397,455 | ||||||||||
Westinghouse Air Brake Technologies Corp. | 11,063 | 1,019,013 | ||||||||||
|
| |||||||||||
| 1,416,468 | ||||||||||||
|
| |||||||||||
Medical Labs & Testing Services — 0.8% |
| |||||||||||
Lonza Group AG | 1,315 | 1,099,104 | ||||||||||
WuXi AppTec Co., Ltd.* | 4,751 | 82,255 | ||||||||||
|
| |||||||||||
| 1,181,359 | ||||||||||||
|
| |||||||||||
Medical Products — 0.7% |
| |||||||||||
Baxter International, Inc. | 13,052 | 1,120,384 | ||||||||||
|
| |||||||||||
Medical-Biomedical/Gene — 1.2% |
| |||||||||||
Argenx SE ADR† | 662 | 231,826 | ||||||||||
Ascendis Pharma A/S ADR† | 3,857 | 518,882 | ||||||||||
Illumina, Inc.† | 928 | 353,048 | ||||||||||
Moderna, Inc.† | 209 | 53,082 | ||||||||||
Seagen, Inc.† | 4,211 | 651,021 | ||||||||||
|
| |||||||||||
| 1,807,859 | ||||||||||||
|
| |||||||||||
Medical-Drugs — 1.1% |
| |||||||||||
AstraZeneca PLC | 9,668 | 1,135,613 | ||||||||||
Eisai Co., Ltd. | 4,207 | 238,859 | ||||||||||
Eli Lilly & Co. | 1,154 | 318,758 | ||||||||||
|
| |||||||||||
| 1,693,230 | ||||||||||||
|
| |||||||||||
Medical-HMO — 1.7% |
| |||||||||||
Anthem, Inc. | 3,016 | 1,398,037 | ||||||||||
UnitedHealth Group, Inc. | 2,529 | 1,269,912 | ||||||||||
|
| |||||||||||
| 2,667,949 | ||||||||||||
|
| |||||||||||
Metal-Diversified — 1.4% |
| |||||||||||
Anglo American PLC | 52,020 | 2,123,616 | ||||||||||
|
| |||||||||||
Oil Companies-Exploration & Production — 1.5% |
| |||||||||||
ConocoPhillips | 25,807 | 1,862,749 | ||||||||||
Occidental Petroleum Corp. | 13,419 | 389,017 | ||||||||||
|
| |||||||||||
| 2,251,766 | ||||||||||||
|
| |||||||||||
Oil Refining & Marketing — 0.8% |
| |||||||||||
Reliance Industries, Ltd. GDR* | 20,452 | 1,307,906 | ||||||||||
|
| |||||||||||
Pharmacy Services — 0.8% |
| |||||||||||
CVS Health Corp. | 11,469 | 1,183,142 | ||||||||||
|
| |||||||||||
Private Equity — 1.0% |
| |||||||||||
Ares Management Corp., Class A | 10,149 | 824,810 | ||||||||||
Intermediate Capital Group PLC | 26,755 | 794,540 | ||||||||||
|
| |||||||||||
| 1,619,350 | ||||||||||||
|
| |||||||||||
Real Estate Investment Trusts — 2.2% |
| |||||||||||
Alexandria Real Estate Equities, Inc. | 8,723 | 1,944,880 | ||||||||||
Prologis, Inc. | 8,747 | 1,472,645 | ||||||||||
|
| |||||||||||
| 3,417,525 | ||||||||||||
|
| |||||||||||
| Security Description | Shares/ Principal Amount(1) | Value (Note 2) | ||||||||||
Rental Auto/Equipment — 0.3% |
| |||||||||||
Localiza Rent a Car SA | 48,800 | $ | 464,345 | |||||||||
|
| |||||||||||
Retail-Apparel/Shoe — 2.0% |
| |||||||||||
Burlington Stores, Inc.† | 5,278 | 1,538,590 | ||||||||||
Li Ning Co., Ltd. | 93,500 | 1,023,427 | ||||||||||
Zalando SE†* | 7,397 | 599,104 | ||||||||||
|
| |||||||||||
| 3,161,121 | ||||||||||||
|
| |||||||||||
Retail-Jewelry — 0.7% |
| |||||||||||
Cie Financiere Richemont SA | 7,505 | 1,127,974 | ||||||||||
|
| |||||||||||
Retail-Restaurants — 0.7% |
| |||||||||||
Chipotle Mexican Grill, Inc.† | 605 | 1,057,691 | ||||||||||
|
| |||||||||||
Semiconductor Components-Integrated Circuits — 0.6% |
| |||||||||||
Taiwan Semiconductor Manufacturing Co., Ltd. | 44,000 | 978,061 | ||||||||||
|
| |||||||||||
Semiconductor Equipment — 0.2% |
| |||||||||||
ASML Holding NV | 479 | 385,393 | ||||||||||
|
| |||||||||||
Theaters — 0.7% |
| |||||||||||
Live Nation Entertainment, Inc.† | 8,445 | 1,010,782 | ||||||||||
|
| |||||||||||
Transport-Truck — 0.3% |
| |||||||||||
Old Dominion Freight Line, Inc. | 1,277 | 457,651 | ||||||||||
|
| |||||||||||
Web Portals/ISP — 1.7% |
| |||||||||||
Alphabet, Inc., Class C† | 927 | 2,682,358 | ||||||||||
|
| |||||||||||
Wireless Equipment — 1.0% |
| |||||||||||
Motorola Solutions, Inc. | 4,771 | 1,296,281 | ||||||||||
Samsung SDI Co., Ltd.† | 350 | 192,849 | ||||||||||
|
| |||||||||||
| 1,489,130 | ||||||||||||
|
| |||||||||||
Total Common Stocks | 96,489,908 | |||||||||||
|
| |||||||||||
EXCHANGE-TRADED FUNDS — 0.5% |
| |||||||||||
iShares MSCI ACWI ETF | 5,349 | 565,817 | ||||||||||
iShares MSCI Japan ETF | 2,182 | 146,107 | ||||||||||
|
| |||||||||||
Total Exchange-Traded Funds | 711,924 | |||||||||||
|
| |||||||||||
U.S. CORPORATE BONDS & NOTES — 1.3% |
| |||||||||||
Cable/Satellite TV — 0.1% |
| |||||||||||
Comcast Corp. | EUR | 100,000 | 112,295 | |||||||||
|
| |||||||||||
Computer Services — 0.1% |
| |||||||||||
International Business Machines Corp. | 100,000 | 100,915 | ||||||||||
|
| |||||||||||
Diversified Banking Institutions — 0.2% |
| |||||||||||
Bank of America Corp. | 100,000 | 100,733 | ||||||||||
Goldman Sachs Group, Inc. | 105,000 | 104,733 | ||||||||||
JPMorgan Chase & Co. | 70,000 | 70,537 | ||||||||||
| ||
| 22 |
Table of Contents
SunAmerica Series Trust SA Wellington Strategic Multi-Asset Portfolio
PORTFOLIO OF INVESTMENTS — December 31, 2021 — (continued)
| Security Description | Principal Amount(1) | Value (Note 2) | ||||||||||
U.S. CORPORATE BONDS & NOTES (continued) |
| |||||||||||
Diversified Banking Institutions (continued) |
| |||||||||||
Morgan Stanley | $ | 130,000 | $ | 129,562 | ||||||||
|
| |||||||||||
| 405,565 | ||||||||||||
|
| |||||||||||
Electric-Integrated — 0.1% |
| |||||||||||
NextEra Energy Capital Holdings, Inc. | 140,000 | 139,727 | ||||||||||
|
| |||||||||||
Finance-Investment Banker/Broker — 0.1% |
| |||||||||||
Charles Schwab Corp. | 80,000 | 79,657 | ||||||||||
|
| |||||||||||
Finance-Other Services — 0.1% |
| |||||||||||
Intercontinental Exchange, Inc. | 55,000 | 54,874 | ||||||||||
Nasdaq, Inc. | 45,000 | 44,935 | ||||||||||
|
| |||||||||||
| 99,809 | ||||||||||||
|
| |||||||||||
Food-Confectionery — 0.1% |
| |||||||||||
Mondelez International, Inc. | EUR | 100,000 | 111,972 | |||||||||
|
| |||||||||||
Insurance-Life/Health — 0.1% |
| |||||||||||
Equitable Financial Life Global Funding | 160,000 | 159,237 | ||||||||||
Principal Life Global Funding II | 25,000 | 24,713 | ||||||||||
|
| |||||||||||
| 183,950 | ||||||||||||
|
| |||||||||||
Medical-Biomedical/Gene — 0.1% |
| |||||||||||
Gilead Sciences, Inc. | 86,000 | 85,647 | ||||||||||
|
| |||||||||||
Medical-Drugs — 0.1% |
| |||||||||||
AbbVie, Inc. | 80,000 | 81,124 | ||||||||||
Bristol-Myers Squibb Co. | 120,000 | 119,477 | ||||||||||
|
| |||||||||||
| 200,601 | ||||||||||||
|
| |||||||||||
Medical-HMO — 0.1% |
| |||||||||||
Anthem, Inc. | 150,000 | 149,396 | ||||||||||
UnitedHealth Group, Inc. | 15,000 | 14,951 | ||||||||||
|
| |||||||||||
| 164,347 | ||||||||||||
|
| |||||||||||
| Security Description | Principal Amount(1) | Value (Note 2) | ||||||||||
Real Estate Investment Trusts — 0.0% |
| |||||||||||
American Tower Corp. | $ | 45,000 | $ | 44,335 | ||||||||
|
| |||||||||||
Retail-Restaurants — 0.0% |
| |||||||||||
Starbucks Corp. | 30,000 | 30,098 | ||||||||||
|
| |||||||||||
Telephone-Integrated — 0.1% |
| |||||||||||
AT&T, Inc. | 80,000 | 78,370 | ||||||||||
Verizon Communications, Inc. | 105,000 | 105,285 | ||||||||||
|
| |||||||||||
| 183,655 | ||||||||||||
|
| |||||||||||
Total U.S. Corporate Bonds & Notes | 1,942,573 | |||||||||||
|
| |||||||||||
FOREIGN CORPORATE BONDS & NOTES — 0.7% |
| |||||||||||
Auto-Cars/Light Trucks — 0.1% |
| |||||||||||
Daimler International Finance BV | GBP | 135,000 | 182,768 | |||||||||
|
| |||||||||||
Diversified Financial Services — 0.1% |
| |||||||||||
GE Capital Canada Funding Co. | CAD | 242,000 | 191,723 | |||||||||
|
| |||||||||||
Electric-Distribution — 0.0% |
| |||||||||||
E.ON SE | EUR | 50,000 | 57,111 | |||||||||
|
| |||||||||||
Electric-Generation — 0.2% |
| |||||||||||
Electricite de France SA | EUR | 200,000 | 228,078 | |||||||||
|
| |||||||||||
Finance-Auto Loans — 0.1% |
| |||||||||||
FCA Bank SpA | EUR | 100,000 | 114,507 | |||||||||
|
| |||||||||||
Finance-Leasing Companies — 0.1% |
| |||||||||||
AerCap Ireland Capital DAC/AerCap Global Aviation Trust | 180,000 | 179,240 | ||||||||||
|
| |||||||||||
Transport-Rail — 0.1% |
| |||||||||||
Canadian Pacific Railway Co. | 145,000 | 145,185 | ||||||||||
|
| |||||||||||
Total Foreign Corporate Bonds & Notes | 1,098,612 | |||||||||||
|
| |||||||||||
| ||
| 23 |
Table of Contents
SunAmerica Series Trust SA Wellington Strategic Multi-Asset Portfolio
PORTFOLIO OF INVESTMENTS — December 31, 2021 — (continued)
| Security Description | Principal Amount(1) | Value (Note 2) | ||||||||||
FOREIGN GOVERNMENT OBLIGATIONS — 21.3% |
| |||||||||||
Sovereign — 21.3% |
| |||||||||||
Commonwealth of Australia | AUD | 112,000 | $ | 79,947 | ||||||||
Commonwealth of Australia | AUD | 216,000 | 151,334 | |||||||||
Commonwealth of Australia | AUD | 187,000 | 117,949 | |||||||||
Commonwealth of Australia | AUD | 173,000 | 135,299 | |||||||||
Commonwealth of Australia | AUD | 35,000 | 27,371 | |||||||||
Commonwealth of Australia | AUD | 139,000 | 112,921 | |||||||||
Commonwealth of Australia | AUD | 374,000 | 304,213 | |||||||||
Commonwealth of Australia | AUD | 25,000 | 21,085 | |||||||||
Commonwealth of Australia | AUD | 46,000 | 39,232 | |||||||||
Federal Republic of Germany | EUR | 31,000 | 35,939 | |||||||||
Federal Republic of Germany | EUR | 385,000 | 448,020 | |||||||||
Federal Republic of Germany | EUR | 520,000 | 609,050 | |||||||||
Federal Republic of Germany | EUR | 103,000 | 119,375 | |||||||||
Federal Republic of Germany | EUR | 147,000 | 167,844 | |||||||||
Federal Republic of Germany | EUR | 42,000 | 46,321 | |||||||||
Federal Republic of Germany | EUR | 78,000 | 115,038 | |||||||||
Federal Republic of Germany | EUR | 751,000 | 868,266 | |||||||||
Federal Republic of Germany | EUR | 131,000 | 282,824 | |||||||||
Government of Canada | CAD | 179,000 | 141,322 | |||||||||
| Security Description | Principal Amount(1) | Value (Note 2) | ||||||||||
Sovereign (continued) |
| |||||||||||
Government of Canada | CAD | 209,000 | $ | 162,416 | ||||||||
Government of Canada | CAD | 197,000 | 144,226 | |||||||||
Government of Canada | CAD | 96,000 | 76,586 | |||||||||
Government of Canada | CAD | 196,000 | 156,898 | |||||||||
Government of Canada | CAD | 116,000 | 97,875 | |||||||||
Government of Canada | CAD | 19,000 | 18,537 | |||||||||
Government of Canada | CAD | 171,000 | 184,043 | |||||||||
Government of Canada | CAD | 15,000 | 16,468 | |||||||||
Government of France | EUR | 483,000 | 554,262 | |||||||||
Government of France | EUR | 190,000 | 218,887 | |||||||||
Government of France | EUR | 267,000 | 308,626 | |||||||||
Government of France | EUR | 1,216,000 | 1,405,727 | |||||||||
Government of France | EUR | 885,000 | 988,320 | |||||||||
Government of France | EUR | 175,000 | 190,243 | |||||||||
Government of France | EUR | 229,000 | 276,262 | |||||||||
Government of France | EUR | 46,000 | 58,058 | |||||||||
Government of France | EUR | 61,000 | 80,552 | |||||||||
Government of France | EUR | 49,000 | 69,943 | |||||||||
Government of France | EUR | 35,000 | 51,240 | |||||||||
| ||
| 24 |
Table of Contents
SunAmerica Series Trust SA Wellington Strategic Multi-Asset Portfolio
PORTFOLIO OF INVESTMENTS — December 31, 2021 — (continued)
| Security Description | Principal Amount(1) | Value (Note 2) | ||||||||||
FOREIGN GOVERNMENT OBLIGATIONS (continued) |
| |||||||||||
Sovereign (continued) |
| |||||||||||
Government of France | EUR | 45,000 | $ | 96,445 | ||||||||
Government of France | EUR | 153,000 | 297,906 | |||||||||
Government of Japan | JPY | 3,100,000 | 27,193 | |||||||||
Government of Japan | JPY | 20,900,000 | 183,351 | |||||||||
Government of Japan | JPY | 149,050,000 | 1,310,391 | |||||||||
Government of Japan | JPY | 93,950,000 | 822,673 | |||||||||
Government of Japan | JPY | 58,700,000 | 504,423 | |||||||||
Government of Japan | JPY | 17,100,000 | 150,386 | |||||||||
Government of Japan | JPY | 35,450,000 | 286,700 | |||||||||
Government of Japan | JPY | 53,200,000 | 419,232 | |||||||||
Government of Japan | JPY | 62,400,000 | 546,997 | |||||||||
Government of Japan | JPY | 71,250,000 | 629,964 | |||||||||
Government of Japan | JPY | 2,200,000 | 19,418 | |||||||||
Government of Japan | JPY | 91,850,000 | 834,451 | |||||||||
Government of Japan | JPY | 57,300,000 | 584,930 | |||||||||
Government of Japan | JPY | 5,400,000 | 59,066 | |||||||||
Government of Japan | JPY | 9,800,000 | 108,643 | |||||||||
Government of Japan | JPY | 17,300,000 | 173,164 | |||||||||
Government of Japan | JPY | 44,600,000 | 510,614 | |||||||||
Government of Japan | JPY | 117,700,000 | 1,357,106 | |||||||||
Government of Malaysia | MYR | 122,000 | 27,053 | |||||||||
| Security Description | Principal Amount(1) | Value (Note 2) | ||||||||||
Sovereign (continued) |
| |||||||||||
Government of Malaysia | MYR | 75,000 | $ | 18,152 | ||||||||
Government of Malaysia | MYR | 462,000 | 112,622 | |||||||||
Government of Malaysia | MYR | 70,000 | 16,870 | |||||||||
Government of Malaysia | MYR | 180,000 | 44,730 | |||||||||
Government of Malaysia | MYR | 173,000 | 45,164 | |||||||||
Kingdom of Belgium | EUR | 225,000 | 260,193 | |||||||||
Kingdom of Belgium | EUR | 48,000 | 53,677 | |||||||||
Kingdom of Belgium | EUR | 279,000 | 341,383 | |||||||||
Kingdom of Belgium | EUR | 93,000 | 126,527 | |||||||||
Kingdom of Belgium | EUR | 99,000 | 185,715 | |||||||||
Kingdom of Denmark | DKK | 570,000 | 90,968 | |||||||||
Kingdom of Denmark | DKK | 327,000 | 88,821 | |||||||||
Kingdom of Norway | NOK | 377,000 | 41,088 | |||||||||
Kingdom of Norway | NOK | 564,000 | 64,792 | |||||||||
Kingdom of Spain | EUR | 265,000 | 304,629 | |||||||||
Kingdom of Spain | EUR | 779,000 | 892,304 | |||||||||
Kingdom of Spain | EUR | 160,000 | 180,757 | |||||||||
Kingdom of Spain | EUR | 149,000 | 172,108 | |||||||||
Kingdom of Spain | EUR | 390,000 | 441,254 | |||||||||
| ||
| 25 |
Table of Contents
SunAmerica Series Trust SA Wellington Strategic Multi-Asset Portfolio
PORTFOLIO OF INVESTMENTS — December 31, 2021 — (continued)
| Security Description | Principal Amount(1) | Value (Note 2) | ||||||||||
FOREIGN GOVERNMENT OBLIGATIONS (continued) |
| |||||||||||
Sovereign (continued) |
| |||||||||||
Kingdom of Spain | EUR | 120,000 | $ | 133,019 | ||||||||
Kingdom of Spain | EUR | 114,000 | 146,418 | |||||||||
Kingdom of Spain | EUR | 120,000 | 179,360 | |||||||||
Kingdom of Spain | EUR | 50,000 | 85,677 | |||||||||
Kingdom of Spain | EUR | 24,000 | 32,198 | |||||||||
Kingdom of Spain | EUR | 20,000 | 37,408 | |||||||||
Kingdom of Sweden | SEK | 750,000 | 81,731 | |||||||||
Kingdom of the Netherlands | EUR | 102,000 | 117,573 | |||||||||
Kingdom of the Netherlands | EUR | 191,000 | 221,550 | |||||||||
Kingdom of the Netherlands | EUR | 115,000 | 131,410 | |||||||||
Kingdom of the Netherlands | EUR | 186,000 | 205,558 | |||||||||
Kingdom of the Netherlands | EUR | 55,000 | 57,186 | |||||||||
Republic of Austria | EUR | 35,000 | 39,557 | |||||||||
Republic of Austria | EUR | 48,000 | 49,917 | |||||||||
Republic of Austria | EUR | 159,000 | 190,668 | |||||||||
Republic of Austria | EUR | 52,000 | 60,868 | |||||||||
Republic of Austria | EUR | 17,000 | 16,826 | |||||||||
Republic of Austria | EUR | 4,000 | 7,017 | |||||||||
| Security Description | Principal Amount(1) | Value (Note 2) | ||||||||||
Sovereign (continued) |
| |||||||||||
Republic of Austria | EUR | 83,000 | $ | 119,789 | ||||||||
Republic of Finland | EUR | 27,000 | 30,736 | |||||||||
Republic of Finland | EUR | 35,000 | 35,743 | |||||||||
Republic of Finland | EUR | 48,000 | 57,410 | |||||||||
Republic of Finland | EUR | 33,000 | 41,804 | |||||||||
Republic of Ireland | EUR | 67,000 | 74,381 | |||||||||
Republic of Ireland | EUR | 30,000 | 36,163 | |||||||||
Republic of Ireland | EUR | 77,000 | 94,696 | |||||||||
Republic of Ireland | EUR | 31,000 | 40,605 | |||||||||
Republic of Ireland | EUR | 25,000 | 33,301 | |||||||||
Republic of Italy | EUR | 425,000 | 484,637 | |||||||||
Republic of Italy | EUR | 959,000 | 1,074,980 | |||||||||
Republic of Italy | EUR | 90,000 | 99,916 | |||||||||
Republic of Italy | EUR | 71,000 | 76,947 | |||||||||
Republic of Italy | EUR | 149,000 | 172,357 | |||||||||
Republic of Italy | EUR | 472,000 | 526,507 | |||||||||
Republic of Italy | EUR | $ | 139,000 | 145,664 | ||||||||
Republic of Italy | EUR | 68,000 | 79,991 | |||||||||
Republic of Italy | EUR | 196,000 | 209,372 | |||||||||
Republic of Italy | EUR | 44,000 | 52,669 | |||||||||
| ||
| 26 |
Table of Contents
SunAmerica Series Trust SA Wellington Strategic Multi-Asset Portfolio
PORTFOLIO OF INVESTMENTS — December 31, 2021 — (continued)
| Security Description | Principal Amount(1) | Value (Note 2) | ||||||||||
FOREIGN GOVERNMENT OBLIGATIONS (continued) |
| |||||||||||
Sovereign (continued) |
| |||||||||||
Republic of Italy | EUR | 33,000 | $ | 35,203 | ||||||||
Republic of Italy | EUR | 41,000 | 47,141 | |||||||||
Republic of Italy | EUR | 271,000 | 326,239 | |||||||||
Republic of Italy | EUR | 40,000 | 43,542 | |||||||||
Republic of Italy | EUR | 5,000 | 6,598 | |||||||||
Republic of Italy | EUR | 34,000 | 43,722 | |||||||||
Republic of Italy | EUR | 107,000 | 141,404 | |||||||||
Republic of Italy | EUR | 151,000 | 210,308 | |||||||||
Republic of Italy | EUR | 35,000 | 61,220 | |||||||||
Republic of Poland | PLN | 199,000 | 40,684 | |||||||||
Republic of Poland | PLN | 375,000 | 86,321 | |||||||||
Republic of Singapore | SGD | 20,000 | 14,073 | |||||||||
Republic of Singapore | SGD | 29,000 | 23,891 | |||||||||
Republic of Singapore | SGD | 35,000 | 28,352 | |||||||||
Republic of Singapore | SGD | 41,000 | 35,087 | |||||||||
Republic of Singapore | SGD | 74,000 | 60,466 | |||||||||
State of Israel | ILS | 531,000 | 175,699 | |||||||||
State of Israel | ILS | 238,000 | 73,996 | |||||||||
United Kingdom Gilt Treasury | GBP | 324,000 | 436,657 | |||||||||
United Kingdom Gilt Treasury | GBP | 218,000 | 291,729 | |||||||||
| Security Description | Principal Amount(1) | Value (Note 2) | ||||||||||
Sovereign (continued) |
| |||||||||||
United Kingdom Gilt Treasury | GBP | 1,079,000 | $ | 1,364,480 | ||||||||
United Kingdom Gilt Treasury | GBP | 378,000 | 500,962 | |||||||||
United Kingdom Gilt Treasury | GBP | 118,000 | 134,874 | |||||||||
United Kingdom Gilt Treasury | GBP | 368,000 | 498,938 | |||||||||
United Kingdom Gilt Treasury | GBP | 96,000 | 131,008 | |||||||||
United Kingdom Gilt Treasury | GBP | 97,000 | 130,053 | |||||||||
United Kingdom Gilt Treasury | GBP | 113,000 | 156,790 | |||||||||
United Kingdom Gilt Treasury | GBP | 115,000 | 157,212 | |||||||||
United Kingdom Gilt Treasury | GBP | 69,000 | 144,732 | |||||||||
United Kingdom Gilt Treasury | GBP | 45,000 | 89,176 | |||||||||
United Kingdom Gilt Treasury | GBP | 207,000 | 426,535 | |||||||||
United Kingdom Gilt Treasury | GBP | 34,000 | 76,296 | |||||||||
United Mexican States | MXN | 1,519,400 | 69,947 | |||||||||
United Mexican States | MXN | 154,100 | 7,458 | |||||||||
United Mexican States | MXN | 1,183,600 | 60,826 | |||||||||
United Mexican States | MXN | 1,914,000 | 100,121 | |||||||||
United Mexican States | MXN | 543,800 | 31,897 | |||||||||
|
| |||||||||||
Total Foreign Government Obligations | 32,859,625 | |||||||||||
|
| |||||||||||
U.S. GOVERNMENT TREASURIES — 9.5% |
| |||||||||||
United States Treasury Bonds — 2.7% |
| |||||||||||
1.38% due 11/15/2040 | $ | 682,000 | 623,524 | |||||||||
1.75% due 08/15/2041 | 758,000 | 737,273 | ||||||||||
1.88% due 02/15/2051 | 513,000 | 509,874 | ||||||||||
2.00% due 02/15/2050 | 775,000 | 790,712 | ||||||||||
| ||
| 27 |
Table of Contents
SunAmerica Series Trust SA Wellington Strategic Multi-Asset Portfolio
PORTFOLIO OF INVESTMENTS — December 31, 2021 — (continued)
| Security Description | Principal Amount(1) | Value (Note 2) | ||||||||||
U.S. GOVERNMENT TREASURIES (continued) |
| |||||||||||
United States Treasury Bonds (continued) |
| |||||||||||
2.00% due 08/15/2051 | $ | 272,000 | $ | 278,545 | ||||||||
2.88% due 05/15/2043 | 43,000 | 50,135 | ||||||||||
3.00% due 02/15/2048 | 323,500 | 396,401 | ||||||||||
3.75% due 08/15/2041 | 157,000 | 205,652 | ||||||||||
4.50% due 02/15/2036 | 173,000 | 238,213 | ||||||||||
5.00% due 05/15/2037 | 271,000 | 395,279 | ||||||||||
|
| |||||||||||
| 4,225,608 | ||||||||||||
|
| |||||||||||
United States Treasury Notes — 6.8% |
| |||||||||||
0.13% due 11/30/2022 | 1,568,000 | 1,564,448 | ||||||||||
0.13% due 01/31/2023 | 517,000 | 515,223 | ||||||||||
0.13% due 08/31/2023 | 614,000 | 608,651 | ||||||||||
0.25% due 09/30/2025 | 1,408,000 | 1,364,000 | ||||||||||
0.38% due 03/31/2022 | 680,000 | 680,461 | ||||||||||
0.38% due 01/31/2026 | 1,309,000 | 1,266,969 | ||||||||||
0.50% due 03/31/2025(2) | 624,000 | 613,836 | ||||||||||
0.50% due 02/28/2026 | 495,000 | 481,175 | ||||||||||
0.75% due 04/30/2026 | 339,000 | 332,458 | ||||||||||
0.75% due 08/31/2026 | 225,000 | 220,096 | ||||||||||
1.25% due 08/15/2031 | 1,340,000 | 1,311,734 | ||||||||||
1.63% due 10/31/2026 | 167,000 | 169,929 | ||||||||||
2.13% due 06/30/2022 | 361,000 | 364,356 | ||||||||||
2.38% due 05/15/2029 | 141,000 | 150,413 | ||||||||||
2.50% due 05/15/2024 | 768,000 | 797,970 | ||||||||||
2.75% due 02/15/2028 | 48,000 | 51,919 | ||||||||||
|
| |||||||||||
| 10,493,638 | ||||||||||||
|
| |||||||||||
Total U.S. Government Treasuries | 14,719,246 | |||||||||||
|
| |||||||||||
Total Long-Term Investment Securities | 147,821,888 | |||||||||||
|
| |||||||||||
SHORT-TERM INVESTMENT SECURITIES — 0.1% |
| |||||||||||
Commercial Paper — 0.1% |
| |||||||||||
Royal Bank of Canada | CAD | 300,000 | 237,150 | |||||||||
|
| |||||||||||
REPURCHASE AGREEMENTS — 2.7% |
| |||||||||||
Bank of America Securities LLC Joint Repurchase Agreement(3) | 945,000 | 945,000 | ||||||||||
Barclays Capital, Inc. Joint Repurchase Agreement(3) | 725,000 | 725,000 | ||||||||||
BNP Paribas SA Joint Repurchase Agreement(3) | 625,000 | 625,000 | ||||||||||
Deutsche Bank AG Joint Repurchase Agreement(3) | 915,000 | 915,000 | ||||||||||
RBS Securities, Inc. Joint Repurchase Agreement(3) | 915,000 | 915,000 | ||||||||||
|
| |||||||||||
Total Repurchase Agreements | 4,125,000 | |||||||||||
|
| |||||||||||
TOTAL INVESTMENTS | 98.5 | % | 152,184,038 | |||||||||
Other assets less liabilities | 1.5 | 2,378,223 | ||||||||||
|
|
|
| |||||||||
NET ASSETS | 100.0 | % | $ | 154,562,261 | ||||||||
|
|
|
| |||||||||
| † | Non-income producing security |
| * | Securities exempt from registration under Rule 144A of the Securities Act of 1933. These securities may be sold in transactions exempt from registration, normally to qualified institutional buyers. The Portfolio has no right to demand registration of these securities. At December 31, 2021, the aggregate value of these securities was $8,658,012 representing 5.6% of net assets. |
| (1) | Denominated in United States dollars unless otherwise indicated. |
| (2) | The security or a portion thereof was pledged as collateral to cover margin requirements for open futures contracts. |
| (3) | See Note 2 for details of Joint Repurchase Agreements. |
| (4) | See Note 6 for cost of investments on a tax basis. |
| ADR | — American Depositary Receipt |
| ETF | — Exchange-Traded Fund |
| GDR | — Global Depositary Receipt |
Currency Legend
| AUD | — Australian Dollar |
| CAD | — Canadian Dollar |
| DKK | — Danish Krone |
| EUR | — Euro Currency |
| GBP | — British Sterling Pound |
| ILS | — Israeli New Shekel |
| JPY | — Japanese Yen |
| MXN | — Mexican Peso |
| MYR | — Malaysian Ringgit |
| NOK | — Norwegian Krone |
| PLN | — Poland Zloty |
| SEK | — Swedish Krona |
| SGD | — Singapore Dollar |
| ||
| 28 |
Table of Contents
SunAmerica Series Trust SA Wellington Strategic Multi-Asset Portfolio
PORTFOLIO OF INVESTMENTS — December 31, 2021 — (continued)
| Futures Contracts | ||||||||||||||||||||
| Number of Contracts | Type | Description | Expiration Month | Notional Basis* | Notional Value* | Unrealized Appreciation | ||||||||||||||
| 12 | Long | U.S. Treasury 10 Year Notes | March 2022 | $ | 1,549,661 | $ | 1,565,625 | $ | 15,964 | |||||||||||
| 4 | Long | U.S. Treasury Ultra Bonds | March 2022 | 772,893 | 788,500 | 15,607 | ||||||||||||||
| 4 | Short | Euro-BOBL | March 2022 | 610,373 | 606,775 | 3,598 | ||||||||||||||
| 2 | Short | Euro-BUND | March 2022 | 395,400 | 390,209 | 5,191 | ||||||||||||||
|
| |||||||||||||||||||
| $ | 40,360 | |||||||||||||||||||
|
| |||||||||||||||||||
| Unrealized (Depreciation) | ||||||||||||||||||||
| 5 | Long | Australian 10 Year Bonds | March 2022 | $ | 506,760 | $ | 506,256 | $ | (504) | |||||||||||
| 1 | Long | Euro-BUXL | March 2022 | 246,257 | 235,373 | (10,884 | ) | |||||||||||||
| 3 | Long | Euro-Schatz | March 2022 | 383,093 | 382,638 | (455 | ) | |||||||||||||
| 14 | Long | U.S. Treasury 5 Year Notes | March 2022 | 1,695,644 | 1,693,672 | (1,972 | ) | |||||||||||||
| 14 | Short | Long Gilt | March 2022 | 2,358,405 | 2,366,817 | (8,412 | ) | |||||||||||||
| 2 | Short | U.S. Treasury Ultra 10 Year Notes | March 2022 | 288,170 | 292,875 | (4,705 | ) | |||||||||||||
|
| |||||||||||||||||||
| $ | (26,932 | ) | ||||||||||||||||||
|
| |||||||||||||||||||
Net Unrealized Appreciation (Depreciation) | $ | 13,428 | ||||||||||||||||||
|
| |||||||||||||||||||
| * | Notional basis refers to the contractual amount agreed upon at inception of the open contract; notional value represents the current value of the open contract. |
| Forward Foreign Currency Contracts | ||||||||||||||||||||||
| Counterparty | Contract to Deliver | In Exchange For | Delivery Date | Unrealized Appreciation | Unrealized (Depreciation) | |||||||||||||||||
Bank of America N.A. | AUD | 38,000 | USD | 26,766 | 01/11/2022 | $ | — | $ | (881 | ) | ||||||||||||
| MXN | 550,000 | USD | 26,468 | 01/11/2022 | — | (363 | ) | |||||||||||||||
| RUB | 3,930,000 | USD | 53,241 | 01/11/2022 | 903 | — | ||||||||||||||||
| RUB | 3,930,000 | USD | 52,332 | 02/04/2022 | 97 | — | ||||||||||||||||
| USD | 27,142 | CHF | 25,000 | 01/11/2022 | 299 | — | ||||||||||||||||
| USD | 52,615 | RUB | 3,930,000 | 01/11/2022 | — | (277 | ) | |||||||||||||||
|
|
|
| |||||||||||||||||||
| 1,299 | (1,521 | ) | ||||||||||||||||||||
|
|
|
| |||||||||||||||||||
Barclays Bank PLC | DKK | 1,235,000 | USD | 188,938 | 01/11/2022 | — | (158 | ) | ||||||||||||||
| EUR | 14,534,000 | USD | 16,518,016 | 01/11/2022 | — | (31,190 | ) | |||||||||||||||
| ILS | 793,000 | USD | 251,066 | 01/11/2022 | — | (4,007 | ) | |||||||||||||||
| USD | 26,648 | GBP | 20,000 | 01/11/2022 | 422 | — | ||||||||||||||||
| USD | 76,994 | ZAR | 1,250,000 | 01/11/2022 | 1,376 | — | ||||||||||||||||
|
|
|
| |||||||||||||||||||
| 1,798 | (35,355 | ) | ||||||||||||||||||||
|
|
|
| |||||||||||||||||||
BNP Paribas SA | AUD | 40,000 | USD | 28,148 | 01/11/2022 | — | (954 | ) | ||||||||||||||
| CAD | 1,665,000 | USD | 1,300,400 | 01/11/2022 | — | (15,852 | ) | |||||||||||||||
| CHF | 109,000 | USD | 118,878 | 01/11/2022 | — | (766 | ) | |||||||||||||||
| EUR | 196,000 | USD | 220,969 | 01/11/2022 | — | (2,208 | ) | |||||||||||||||
| MYR | 1,096,000 | USD | 259,901 | 01/11/2022 | — | (3,541 | ) | |||||||||||||||
|
|
|
| |||||||||||||||||||
| — | (23,321 | ) | ||||||||||||||||||||
|
|
|
| |||||||||||||||||||
Citibank N.A. | EUR | 48,000 | USD | 54,266 | 01/11/2022 | — | (390 | ) | ||||||||||||||
| SEK | 250,000 | USD | 27,432 | 01/11/2022 | — | (236 | ) | |||||||||||||||
| USD | 26,472 | JPY | 3,000,000 | 01/11/2022 | — | (391 | ) | |||||||||||||||
| USD | 26,385 | SEK | 240,000 | 01/11/2022 | 176 | — | ||||||||||||||||
|
|
|
| |||||||||||||||||||
| 176 | (1,017 | ) | ||||||||||||||||||||
|
|
|
| |||||||||||||||||||
| ||
| 29 |
Table of Contents
SunAmerica Series Trust SA Wellington Strategic Multi-Asset Portfolio
PORTFOLIO OF INVESTMENTS — December 31, 2021 — (continued)
| Forward Foreign Currency Contracts | ||||||||||||||||||||||
| Counterparty | Contract to Deliver | In Exchange For | Delivery Date | Unrealized Appreciation | Unrealized (Depreciation) | |||||||||||||||||
Deutsche Bank AG | AUD | 1,408,000 | USD | 1,008,183 | 01/11/2022 | $ | — | $ | (16,224 | ) | ||||||||||||
| USD | 143,924 | AUD | 201,000 | 01/11/2022 | 2,316 | — | ||||||||||||||||
|
|
|
| |||||||||||||||||||
| 2,316 | (16,224 | ) | ||||||||||||||||||||
|
|
|
| |||||||||||||||||||
Goldman Sachs International | TWD | 985,000 | USD | 35,672 | 01/11/2022 | 116 | — | |||||||||||||||
| ZAR | 420,000 | USD | 26,581 | 01/11/2022 | 249 | — | ||||||||||||||||
|
|
|
| |||||||||||||||||||
| 365 | — | |||||||||||||||||||||
|
|
|
| |||||||||||||||||||
HSBC Bank PLC | SGD | 20,000 | USD | 14,643 | 01/11/2022 | — | (198 | ) | ||||||||||||||
|
|
|
| |||||||||||||||||||
JPMorgan Chase Bank N.A | EUR | 24,000 | USD | 27,185 | 01/11/2022 | — | (143 | ) | ||||||||||||||
| JPY | 14,634,000 | USD | 129,413 | 01/11/2022 | 2,189 | — | ||||||||||||||||
| PLN | 588,000 | USD | 140,940 | 01/11/2022 | — | (4,942 | ) | |||||||||||||||
| SEK | 800,000 | USD | 88,287 | 01/11/2022 | — | (251 | ) | |||||||||||||||
| USD | 44,274 | AUD | 61,000 | 01/11/2022 | 107 | — | ||||||||||||||||
| USD | 27,063 | EUR | 24,000 | 01/11/2022 | 265 | — | ||||||||||||||||
| USD | 376,771 | JPY | 43,333,000 | 01/11/2022 | — | (45 | ) | |||||||||||||||
| USD | 48,873 | NZD | 72,000 | 01/11/2022 | 437 | — | ||||||||||||||||
| USD | 73,940 | SEK | 670,000 | 01/11/2022 | 210 | — | ||||||||||||||||
|
|
|
| |||||||||||||||||||
| 3,208 | (5,381 | ) | ||||||||||||||||||||
|
|
|
| |||||||||||||||||||
Morgan Stanley & Co. International PLC | EUR | 200,000 | USD | 225,675 | 01/18/2022 | — | (2,088 | ) | ||||||||||||||
| GBP | 135,000 | USD | 182,069 | 01/13/2022 | — | (658 | ) | |||||||||||||||
| NZD | 200,000 | USD | 136,799 | 01/11/2022 | — | (174 | ) | |||||||||||||||
| SGD | 211,000 | USD | 154,386 | 01/11/2022 | — | (2,182 | ) | |||||||||||||||
| USD | 27,195 | EUR | 24,000 | 01/11/2022 | 132 | — | ||||||||||||||||
| USD | 212,792 | EUR | 187,000 | 02/04/2022 | 240 | — | ||||||||||||||||
| USD | 67,720 | GBP | 50,000 | 02/04/2022 | — | (47 | ) | |||||||||||||||
|
|
|
| |||||||||||||||||||
| 372 | (5,149 | ) | ||||||||||||||||||||
|
|
|
| |||||||||||||||||||
Royal Bank of Canada | EUR | 277,000 | USD | 313,790 | 01/11/2022 | — | (1,618 | ) | ||||||||||||||
| MXN | 5,946,000 | USD | 278,965 | 01/11/2022 | — | (11,105 | ) | |||||||||||||||
| USD | 92,425 | MXN | 1,970,000 | 01/11/2022 | 3,679 | — | ||||||||||||||||
|
|
|
| |||||||||||||||||||
| 3,679 | (12,723 | ) | ||||||||||||||||||||
|
|
|
| |||||||||||||||||||
State Street Bank & Trust Company | CAD | 300,000 | USD | 234,288 | 01/05/2022 | — | (2,875 | ) | ||||||||||||||
| CAD | 55,000 | USD | 43,518 | 02/04/2022 | 39 | — | ||||||||||||||||
| CHF | 25,000 | USD | 27,068 | 01/11/2022 | — | (373 | ) | |||||||||||||||
| JPY | 3,100,000 | USD | 27,477 | 01/11/2022 | 526 | — | ||||||||||||||||
| USD | 28,640 | AUD | 40,000 | 01/11/2022 | 462 | — | ||||||||||||||||
| USD | 26,352 | SEK | 240,000 | 01/11/2022 | 209 | — | ||||||||||||||||
|
|
|
| |||||||||||||||||||
| 1,236 | (3,248 | ) | ||||||||||||||||||||
|
|
|
| |||||||||||||||||||
Toronto Dominion Bank | GBP | 3,386,000 | USD | 4,518,979 | 01/11/2022 | — | (64,083 | ) | ||||||||||||||
| NOK | 928,000 | USD | 102,509 | 01/11/2022 | — | (2,852 | ) | |||||||||||||||
| USD | 154,511 | CAD | 199,000 | 01/11/2022 | 2,807 | — | ||||||||||||||||
| USD | 97,207 | NOK | 880,000 | 01/11/2022 | 2,705 | — | ||||||||||||||||
|
|
|
| |||||||||||||||||||
| 5,512 | (66,935 | ) | ||||||||||||||||||||
|
|
|
| |||||||||||||||||||
UBS AG | GBP | 50,000 | USD | 66,204 | 01/11/2022 | — | (1,472 | ) | ||||||||||||||
| JPY | 1,009,388,000 | USD | 8,961,990 | 01/11/2022 | 186,639 | — | ||||||||||||||||
| SEK | 240,000 | USD | 26,556 | 01/11/2022 | — | (5 | ) | |||||||||||||||
| USD | 12,058 | PLN | 50,000 | 01/11/2022 | 350 | — | ||||||||||||||||
|
|
|
| |||||||||||||||||||
| 186,989 | (1,477 | ) | ||||||||||||||||||||
|
|
|
| |||||||||||||||||||
Unrealized Appreciation (Depreciation) |
| $ | 206,950 | $ | (172,549 | ) | ||||||||||||||||
|
|
|
| |||||||||||||||||||
| ||
| 30 |
Table of Contents
SunAmerica Series Trust SA Wellington Strategic Multi-Asset Portfolio
PORTFOLIO OF INVESTMENTS — December 31, 2021 — (continued)
AUD — Australian Dollar
CAD — Canadian Dollar
CHF — Swiss Franc
DKK — Danish Krone
EUR — Euro Currency
GBP — British Sterling Pound
ILS — Israeli New Shekel
JPY — Japanese Yen
MXN — Mexican Peso
MYR — Malaysian Ringgit
NOK — Norwegian Krone
NZD — New Zealand Dollar
PLN — Polish Zloty
RUB – Russian Ruble
SEK – Swedish Krona
SGD — Singapore Dollar
TWD — New Taiwan Dollar
USD — United States Dollar
ZAR — South African Rand
The following is a summary of the inputs used to value the Portfolio’s net assets as of December 31, 2021 (see Note 2):
| Level 1 - Unadjusted Quoted Prices | Level 2 - Other Observable Inputs | Level 3 - Significant Unobservable Inputs | Total | |||||||||||||
ASSETS: | ||||||||||||||||
Investments at Value:* | ||||||||||||||||
Common Stocks | $ | 96,489,908 | $ | — | $ | — | $ | 96,489,908 | ||||||||
Exchange-Traded Funds | 711,924 | — | — | 711,924 | ||||||||||||
U.S. Corporate Bonds & Notes | — | 1,942,573 | — | 1,942,573 | ||||||||||||
Foreign Corporate Bonds & Notes | — | 1,098,612 | — | 1,098,612 | ||||||||||||
Foreign Government Obligations | — | 32,859,625 | — | 32,859,625 | ||||||||||||
U.S. Government Treasuries | — | 14,719,246 | — | 14,719,246 | ||||||||||||
Short Term Investments | — | 237,150 | — | 237,150 | ||||||||||||
Repurchase Agreements | — | 4,125,000 | — | 4,125,000 | ||||||||||||
|
|
|
|
|
|
|
| |||||||||
Total Investments at Value | $ | 97,201,832 | $ | 54,982,206 | $ | — | $ | 152,184,038 | ||||||||
|
|
|
|
|
|
|
| |||||||||
Other Financial Instruments:+ | ||||||||||||||||
Futures Contracts | $ | 40,360 | $ | — | $ | — | $ | 40,360 | ||||||||
Forward Foreign Currency Contracts | — | 206,950 | — | 206,950 | ||||||||||||
|
|
|
|
|
|
|
| |||||||||
Total Other Financial Instruments | $ | 40,360 | $ | 206,950 | $ | — | $ | 247,310 | ||||||||
|
|
|
|
|
|
|
| |||||||||
LIABILITIES: | ||||||||||||||||
Other Financial Instruments:+ | ||||||||||||||||
Futures Contracts | $ | 26,932 | $ | — | $ | — | $ | 26,932 | ||||||||
Forward Foreign Currency Contracts | — | 172,549 | $ | — | 172,549 | |||||||||||
|
|
|
|
|
|
|
| |||||||||
Total Other Financial Instruments | $ | 26,932 | $ | 172,549 | $ | — | $ | 199,481 | ||||||||
|
|
|
|
|
|
|
| |||||||||
| * | For a detailed presentation of investments, please refer to the Portfolio of Investments. |
| + | Amounts represent unrealized appreciation/depreciation as of the end of the reporting period. |
See Notes to Financial Statements
| ||
| 31 |
Table of Contents
SunAmerica Series Trust
STATEMENTS OF ASSETS AND LIABILITIES — December 31, 2021
| SA Wellington Capital Appreciation Portfolio | SA Wellington Government and Quality Bond Portfolio | SA Wellington Strategic Multi-Asset Portfolio | ||||||||||
ASSETS: | ||||||||||||
Investments at value (unaffiliated)* | $ | 2,176,241,212 | $ | 1,734,760,551 | $ | 148,059,038 | ||||||
Repurchase agreements (cost approximates value) | 38,460,000 | 341,705,000 | 4,125,000 | |||||||||
Cash | 5,357 | 249,589 | 3,002 | |||||||||
Foreign cash* | 9,128 | — | 1,875 | |||||||||
Receivable for: | ||||||||||||
Fund shares sold | 32,565,745 | 27,561,903 | 2,117,946 | |||||||||
Dividends and interest | 371,153 | 5,444,006 | 206,528 | |||||||||
Investments sold | 29,630,724 | 14,766,729 | 605,355 | |||||||||
Investments sold on an extended settlement basis | — | 65,083,211 | 44,546 | |||||||||
Prepaid expenses and other assets | 17,835 | 15,222 | 4,528 | |||||||||
Due from investment adviser for expense reimbursements/fee waivers | 23,582 | — | 60,659 | |||||||||
Variation margin on futures contracts | — | 18,289 | 7,944 | |||||||||
Unrealized appreciation on forward foreign currency contracts | — | — | 206,950 | |||||||||
|
| |||||||||||
Total assets | 2,277,324,736 | 2,189,604,500 | 155,443,371 | |||||||||
|
| |||||||||||
LIABILITIES: | ||||||||||||
Payable for: | ||||||||||||
Fund shares redeemed | 63,095 | 288,797 | 6,030 | |||||||||
Investments purchased | 20,785,045 | 14,103,653 | 381,384 | |||||||||
Investments purchased on an extended settlement basis | — | 406,870,284 | 22,241 | |||||||||
Investment advisory and management fees | 1,309,022 | 783,222 | 127,997 | |||||||||
Service fees — Class 2 | 8,400 | 2,459 | — | |||||||||
Service fees — Class 3 | 281,216 | 145,195 | 28,519 | |||||||||
Transfer agent fees and expenses | — | — | — | |||||||||
Trustees’ fees and expenses | 7,352 | 7,464 | 1,083 | |||||||||
Other accrued expenses | 377,334 | 304,052 | 136,484 | |||||||||
Variation margin on futures contracts | — | — | 4,506 | |||||||||
Due to broker | — | 201 | 317 | |||||||||
Unrealized depreciation on forward foreign currency contracts | — | — | 172,549 | |||||||||
|
| |||||||||||
Total liabilities | 22,831,464 | 422,505,327 | 881,110 | |||||||||
|
| |||||||||||
Net Assets | $ | 2,254,493,272 | $ | 1,767,099,173 | 154,562,261 | |||||||
|
| |||||||||||
NET ASSETS REPRESENTED BY: | ||||||||||||
Capital paid-in | $ | 1,576,501,276 | $ | 1,716,304,949 | $ | 132,961,777 | ||||||
Total accumulated earnings (loss) | 677,991,996 | 50,794,224 | 21,600,484 | |||||||||
|
| |||||||||||
NET ASSETS | $ | 2,254,493,272 | $ | 1,767,099,173 | $ | 154,562,261 | ||||||
|
| |||||||||||
Class 1 (unlimited shares authorized): | ||||||||||||
Net assets | $ | 812,818,059 | $ | 1,041,985,338 | $ | 16,357,462 | ||||||
Shares of beneficial interest issued and outstanding | 15,240,543 | 68,064,802 | 1,614,289 | |||||||||
Net asset value, offering and redemption price per share | $ | 53.33 | $ | 15.31 | $ | 10.13 | ||||||
|
| |||||||||||
Class 2 (unlimited shares authorized): | ||||||||||||
Net assets | $ | 66,091,965 | $ | 19,762,450 | $ | — | ||||||
Shares of beneficial interest issued and outstanding | 1,361,702 | 1,286,428 | — | |||||||||
Net asset value, offering and redemption price per share | $ | 48.54 | $ | 15.36 | $ | — | ||||||
|
| |||||||||||
Class 3 (unlimited shares authorized): | ||||||||||||
Net assets | $ | 1,375,583,248 | $ | 705,351,385 | $ | 138,204,799 | ||||||
Shares of beneficial interest issued and outstanding | 30,246,805 | 46,205,605 | 13,740,404 | |||||||||
Net asset value, offering and redemption price per share | $ | 45.48 | $ | 15.27 | $ | 10.06 | ||||||
|
| |||||||||||
| ||||||||||||
* Cost | ||||||||||||
Investments (unaffiliated) | 2,015,980,942 | $ | 1,711,175,103 | 140,498,778 | ||||||||
|
| |||||||||||
Foreign cash | $ | 9,108 | $ | — | $ | 1,498 | ||||||
|
| |||||||||||
See Notes to Financial Statements
| ||
| 32 |
Table of Contents
SunAmerica Series Trust
STATEMENTS OF OPERATIONS — For the Year Ended December 31, 2021
| SA Wellington Capital Appreciation Portfolio | SA Wellington Government and Quality Bond Portfolio | SA Wellington Strategic Multi-Asset Portfolio | ||||||||||
INVESTMENT INCOME: | ||||||||||||
Dividends (unaffiliated) | $ | 3,957,928 | $ | — | $ | 852,642 | ||||||
Interest (unaffiliated) | 10,557 | 28,107,131 | 275,878 | |||||||||
|
| |||||||||||
Total investment income* | 3,968,485 | 28,107,131 | 1,128,520 | |||||||||
|
| |||||||||||
EXPENSES: | ||||||||||||
Investment advisory and management fees | 14,134,747 | 9,556,864 | 1,337,924 | |||||||||
Service fee: | ||||||||||||
Class 2 | 94,864 | 30,453 | — | |||||||||
Class 3 | 2,764,401 | 1,758,999 | 291,786 | |||||||||
Transfer agent fees and expenses | 2,673 | 3,207 | 1,069 | |||||||||
Custodian and accounting fees | 218,616 | 247,232 | 92,233 | |||||||||
Reports to shareholders | 49,529 | 36,206 | 9,496 | |||||||||
Audit and tax fees | 50,577 | 62,310 | 65,128 | |||||||||
Legal fees | 92,015 | 82,311 | 26,404 | |||||||||
Trustees’ fees and expenses | 147,029 | 137,352 | 9,122 | |||||||||
Interest expense | — | — | — | |||||||||
Other expenses | 64,722 | 67,062 | 36,749 | |||||||||
|
| |||||||||||
Total expenses before fee waivers, expense reimbursements, expense recoupments, custody credits and fees paid indirectly | 17,619,173 | 11,981,996 | 1,869,911 | |||||||||
|
| |||||||||||
Fees waived and expenses reimbursed by investment adviser (Note 3) | — | — | (427,508 | ) | ||||||||
Fees paid indirectly (Note 4) | (7,434 | ) | — | (640 | ) | |||||||
|
| |||||||||||
Net expenses | 17,611,739 | 11,981,996 | 1,441,763 | |||||||||
|
| |||||||||||
Net investment income (loss) | (13,643,254 | ) | 16,125,135 | (313,243 | ) | |||||||
|
| |||||||||||
NET REALIZED AND UNREALIZED GAIN (LOSS) ON INVESTMENTS AND FOREIGN CURRENCIES: | ||||||||||||
Net realized gain (loss) on: | ||||||||||||
Investments (unaffiliated) | 535,025,769 | 21,967,836 | 14,270,756 | |||||||||
Futures contracts | — | 2,484,023 | (59,996 | ) | ||||||||
Forward contracts | — | — | 1,715,487 | |||||||||
Net realized foreign exchange gain (loss) on other assets and liabilities | (3,866 | ) | — | (536 | ) | |||||||
|
| |||||||||||
Net realized gain (loss) on investments and foreign currencies | 535,021,903 | 24,451,859 | 15,925,711 | |||||||||
|
| |||||||||||
Change in unrealized appreciation (depreciation) on: | ||||||||||||
Investments (unaffiliated) | (436,085,760 | ) | (75,005,959 | ) | (6,766,253 | ) | ||||||
Futures contracts | — | 8,438 | 19,441 | |||||||||
Forward contracts | — | — | 481,764 | |||||||||
Forward sales contracts | — | 70,432 | — | |||||||||
Change in unrealized foreign exchange gain (loss) on other assets and liabilities | (150 | ) | — | (4,412 | ) | |||||||
|
| |||||||||||
Net unrealized gain (loss) on investments and foreign currencies | (436,085,910 | ) | (74,927,089 | ) | (6,269,460 | ) | ||||||
|
| |||||||||||
Net realized and unrealized gain (loss) on investments and foreign currencies | 98,935,993 | (50,475,230 | ) | 9,656,251 | ||||||||
|
| |||||||||||
NET INCREASE (DECREASE) IN NET ASSETS RESULTING FROM OPERATIONS | $ | 85,292,739 | $ | (34,350,095 | ) | $ | 9,343,008 | |||||
|
| |||||||||||
| ||||||||||||
* Net of foreign withholding taxes on interest and dividends of | $ | — | $ | 1,744 | $ | 27,634 | ||||||
|
| |||||||||||
See Notes to Financial Statements
| ||
| 33 |
Table of Contents
SunAmerica Series Trust
STATEMENTS OF CHANGES IN NET ASSETS
| SA Wellington Capital Appreciation Portfolio | SA Wellington Government and Quality Bond Portfolio | SA Wellington Strategic Multi-Asset Portfolio | ||||||||||||||||||||||
For the | For the year ended December 31, 2020 | For the | For the year ended December 31, 2020 | For the | For the year ended December 31, 2020 | |||||||||||||||||||
INCREASE (DECREASE) IN NET ASSETS | ||||||||||||||||||||||||
OPERATIONS: | ||||||||||||||||||||||||
Net investment income (loss) | $ | (13,643,254 | ) | $ | (8,114,361 | ) | $ | 16,125,135 | $ | 25,013,852 | $ | (313,243 | ) | $ | (29,605 | ) | ||||||||
Net realized gain (loss) on investments and foreign currencies | 535,021,903 | 491,264,596 | 24,451,859 | 30,895,434 | 15,925,711 | 4,424,748 | ||||||||||||||||||
Net unrealized gain (loss) on investments and foreign currencies | (436,085,910 | ) | 328,650,263 | (74,927,089 | ) | 52,268,187 | (6,269,460 | ) | 9,335,062 | |||||||||||||||
|
|
|
|
|
|
|
|
|
|
|
| |||||||||||||
Net increase (decrease) in net assets resulting from operations | 85,292,739 | 811,800,498 | (34,350,095 | ) | 108,177,473 | 9,343,008 | 13,730,205 | |||||||||||||||||
|
|
|
|
|
|
|
|
|
|
|
| |||||||||||||
Distributions to shareholders from: | ||||||||||||||||||||||||
Distributable earnings — Class 1 | (181,574,685 | ) | (82,477,470 | ) | (35,062,787 | ) | (22,270,170 | ) | (652,452 | ) | (367,277 | ) | ||||||||||||
Distributable earnings — Class 2 | (14,567,862 | ) | (6,303,612 | ) | (600,561 | ) | (446,652 | ) | — | — | ||||||||||||||
Distributable earnings — Class 3 | (287,200,720 | ) | (92,110,658 | ) | (21,158,410 | ) | (13,153,683 | ) | (4,855,565 | ) | (1,479,942 | ) | ||||||||||||
|
|
|
|
|
|
|
|
|
|
|
| |||||||||||||
Total distributions to shareholders | (483,343,267 | ) | (180,891,740 | ) | (56,821,758 | ) | (35,870,505 | ) | (5,508,017 | ) | (1,847,219 | ) | ||||||||||||
|
|
|
|
|
|
|
|
|
|
|
| |||||||||||||
Net increase (decrease) in net assets resulting from capital share transactions (Note 7) | 776,740,571 | (166,798,964 | ) | 40,176,622 | 189,339,056 | 44,204,741 | 28,351,327 | |||||||||||||||||
|
|
|
|
|
|
|
|
|
|
|
| |||||||||||||
Total increase (decrease) in net assets | 378,690,043 | 464,109,794 | (50,995,231 | ) | 261,646,024 | 48,039,732 | 40,234,313 | |||||||||||||||||
|
|
|
|
|
|
|
|
|
|
|
| |||||||||||||
NET ASSETS: | ||||||||||||||||||||||||
Beginning of period | 1,875,803,229 | 1,411,693,435 | 1,818,094,404 | 1,556,448,380 | 106,522,529 | 66,288,216 | ||||||||||||||||||
|
|
|
|
|
|
|
|
|
|
|
| |||||||||||||
End of period | $ | 2,254,493,272 | $ | 1,875,803,229 | $ | 1,767,099,173 | $ | 1,818,094,404 | $ | 154,562,261 | $ | 106,522,529 | ||||||||||||
|
|
|
|
|
|
|
|
|
|
|
| |||||||||||||
See Notes to Financial Statements
| ||
| 34 |
Table of Contents
SUNAMERICA SERIES TRUST
December 31, 2021
Note 1. Organization
SunAmerica Series Trust (the “Trust”), organized as a Massachusetts business trust on September 11, 1992, is an open-end management investment company. The Trust is comprised of sixty-one separate investment series, three of which are included in this report: SA Wellington Capital Appreciation Portfolio, SA Wellington Government and Quality Bond Portfolio, and SA Wellington Strategic Multi-Asset Portfolio, (collectively, the “Portfolios”). SunAmerica Asset Management, LLC (“SAAMCo” or the “Adviser”), an indirect majority-owned subsidiary of American International Group, Inc., a Delaware corporation (“AIG”), serves as investment adviser for all Portfolios of the Trust.
Shares of the Trust are issued and redeemed only in connection with investments in and payments under variable annuity contracts and variable life policies. Shares of the Portfolios are held by separate accounts of American General Life Insurance Company, a Texas life insurer (“AGL”), The United States Life Insurance Company in the City of New York, a New York life insurer (“USL”), The Variable Annuity Life Insurance Company, a Texas life insurer (“VALIC”) and variable annuity contracts issued by Nassau Life Insurance Company (“Nassau”), an unaffiliated life insurance company. AGL, USL and VALIC are indirect majority-owned subsidiaries of AIG. The life insurance companies listed above are collectively referred to as the “Life Companies.” All shares may be purchased or redeemed at net asset value without any sales or redemption charges.
Class 1 shares, Class 2 shares and Class 3 shares of each Portfolio may be offered in connection with certain Variable Contracts. Class 2 and Class 3 shares of a given Portfolio are identical in all respects to Class 1 shares of the same Portfolio, except that (i) each class may bear differing amounts of certain class-specific expenses, (ii) Class 2 and Class 3 shares are subject to service fees, while Class 1 shares are not, and (iii) Class 2 and Class 3 shares have voting rights on matters that pertain to the Rule 12b-1 plan adopted with respect to Class 2 and Class 3 shares. Class 2 and Class 3 shares of each Portfolio pay service fees at an annual rate of 0.15% and 0.25%, respectively, of each class’s average daily net assets.
Effective November 8, 2021, the SA Wellington Capital Appreciation Portfolio, the SA Wellington Government and Quality Bond Portfolio and the SA Wellington Strategic Multi-Asset Portfolio acquired all of the assets and liabilities of the SA Wellington Capital Appreciation Portfolio (the “Predecessor Capital Appreciation Portfolio”), the SA Wellington Government and Quality Bond Portfolio (the “Predecessor Government and Quality Bond Portfolio”) and the SA Wellington Strategic Multi-Asset Portfolio (the “Predecessor Strategic Multi-Asset Portfolio” and collectively with the Predecessor Capital Appreciation Portfolio and the Predecessor Government and Quality Bond Portfolio, the “Predecessor Portfolios” and each, a “Predecessor Portfolio”), respectively, each a series of Anchor Series Trust (the “Predecessor Trust”) through tax-free reorganizations (collectively, the “Reorganization”). As a result of the Reorganization, each Portfolio adopted the performance and financial history of the corresponding Predecessor Portfolio. The Reorganization resulted in each Predecessor Portfolio effectively becoming a series of the Trust. Each Predecessor Portfolio had the same investment goal, strategies, portfolio management team and contractual fees and expenses as those of the corresponding Portfolio as of the date of the Reorganization.
The investment goal for each Portfolio is as follows:
The SA Wellington Capital Appreciation Portfolio seeks long-term capital appreciation. Its strategy is to invest in growth equity securities across a wide range of industries and companies, using a wide-ranging and flexible stock selection approach.
The SA Wellington Government and Quality Bond Portfolio seeks relatively high current income, liquidity and security of principal. Its strategy is to invest, under normal circumstances, at least 80% of net assets in obligations issued, guaranteed or insured by the U.S. Government, its agencies or instrumentalities and in high quality corporate fixed income securities (rated AA– or better by Standard & Poor’s Corporation or Aa3 or better by Moody’s Investor Services, Inc. or its equivalent by any other nationally recognized statistical rating organization).
The SA Wellington Strategic Multi-Asset Portfolio seeks high long-term total investment return. Its strategy is to invest the Portfolio’s assets among global equity and global fixed income securities to achieve total investment return.
Indemnifications: The Trust’s organizational documents provide officers and trustees with a limited indemnification against liabilities arising out of the performance of their duties to the Trust. In addition, pursuant to Indemnification Agreements between the Trust and each of the current trustees who is not an “interested person,” as defined in Section 2(a)(19) of the Investment Company Act of 1940, as amended (the “1940 Act”), of the Trust (collectively, the “Disinterested Trustees”), the Trust provides the Disinterested Trustees with a limited indemnification against liabilities arising out of the performance of their duties to the Trust, whether such liabilities are asserted during or after their service as trustees. In addition, in the normal course of business, the Trust enters into contracts that contain the obligation to indemnify others. The Trust’s maximum exposure under these arrangements is unknown. Currently, however, the Trust expects the risk of loss to be remote.
Note 2. Significant Accounting Policies
The preparation of financial statements in accordance with U.S. generally accepted accounting principles (“GAAP”) requires management to make estimates and assumptions that affect the reported amounts and disclosures in the financial statements. Actual results could differ from those estimates and those differences could be significant. The Portfolios are considered investment companies
| ||
| 35 |
Table of Contents
under GAAP and follow the accounting and reporting guidance applicable to investment companies. The following is a summary of significant accounting policies consistently followed by the Trust in the preparation of its financial statements:
Security Valuation
In accordance with the authoritative guidance on fair value measurements and disclosures under GAAP, the Portfolios disclose the fair value of their investments in a hierarchy that prioritizes the inputs to valuation techniques used to measure the fair value. In accordance with GAAP, fair value is defined as the price that the Portfolios would receive upon selling an asset or transferring a liability in a timely transaction to an independent third party in the principal or most advantageous market. GAAP establishes a three-tier hierarchy to provide more transparency around the inputs used to measure fair value and to establish classification of fair value measurements for disclosure purposes. Inputs refer broadly to the assumptions that market participants would use in pricing the asset or liability, including assumptions about risk. Inputs may be observable or unobservable. Observable inputs are inputs that reflect the assumptions market participants would use in pricing the asset or liability developed based on market data obtained from sources independent of the reporting entity. Unobservable inputs are inputs that reflect the reporting entity’s own assumptions about the assumptions market participants would use in pricing the asset or liability developed based on the best information available in the circumstances. The three tiers are as follows:
Level 1 — Unadjusted quoted prices in active markets for identical securities
Level 2 — Other significant observable inputs (including quoted prices for similar securities, interest rates, prepayment speeds, credit risk, referenced indices, quoted prices in inactive markets, adjusted quoted prices in active markets, adjusted quoted prices on foreign equity securities that were adjusted in accordance with pricing procedures approved by the Board of Trustees (the “Board”), etc.)
Level 3 — Significant unobservable inputs (includes inputs that reflect the Portfolios’ own assumptions about the assumptions market participants would use in pricing the security, developed based on the best information available under the circumstances)
Changes in valuation techniques may result in transfers in or out of an investment’s assigned Level within the hierarchy. The methodology used for valuing investments is not necessarily an indication of the risk associated with investing in those investments and the determination of the significance of a particular input to the fair value measurement in its entirety requires judgment and consideration of factors specific to each security.
The availability of observable inputs can vary from security to security and is affected by a wide variety of factors, including, for example, the type of security, whether the security is recently issued and not yet established in the marketplace, the liquidity of markets, and other characteristics particular to the security. To the extent that valuation is based on models or inputs that are less observable or unobservable in the market, the determination of fair value requires more judgment. Accordingly, the degree of judgment exercised in determining fair value is greatest for instruments categorized in Level 3.
The summary of each Portfolio’s assets and liabilities classified in the fair value hierarchy as of December 31, 2021, is reported on a schedule at the end of each Portfolio’s Portfolio of Investments.
Stocks are generally valued based upon closing sales prices reported on recognized securities exchanges on which the securities are principally traded and are generally categorized as Level 1. Stocks listed on the NASDAQ are valued using the NASDAQ Official Closing Price (“NOCP”). Generally, the NOCP will be the last sale price unless the reported trade for the stock is outside the range of the bid/ask price. In such cases, the NOCP will be normalized to the nearer of the bid or ask price. For listed securities having no sales reported and for unlisted securities, such securities will be valued based upon the last reported bid price.
As of the close of regular trading on the New York Stock Exchange (“NYSE”), securities traded primarily on security exchanges outside the United States are valued at the last sale price on such exchanges on the day of valuation, or if there is no sale on the day of valuation, at the last-reported bid price. If a security’s price is available from more than one exchange, the Portfolios use the exchange that is the primary market for the security. Such securities are generally categorized as Level 1. However, depending on the foreign market, closing prices may be up to 15 hours old when they are used to price a Portfolio’s shares, and the Portfolio may determine that certain closing prices do not reflect the fair value of the security. This determination will be based on the review of a number of factors, including developments in foreign markets, the performance of U.S. securities markets, and the performance of instruments trading in U.S. markets that represent foreign securities and baskets of foreign securities. If a Portfolio determines that closing prices do not reflect the fair value of the securities, the Portfolio will adjust the previous closing prices in accordance with pricing procedures approved by the Board to reflect what it believes to be the fair value of the securities as of the close of regular trading on the NYSE. The Portfolios may also fair value securities in other situations, for example, when a particular foreign market is closed but a Portfolio is open. For foreign equity securities and foreign equity futures contracts, the Portfolios use an outside pricing service to provide it with closing market prices and information used for adjusting those prices, and when so adjusted, such securities and futures are generally categorized as Level 2.
Bonds, debentures, and other debt securities, are valued at evaluated bid prices obtained for the day of valuation from a Board-approved pricing service, and are generally categorized as Level 2. The pricing service may use valuation models or matrix pricing which considers information with respect to comparable bond and note transactions, quotations from bond dealers, or by reference to other securities that are considered comparable in such characteristics as rating, interest rate, and maturity date, option adjusted spread models, prepayments projections, interest rate spreads, and yield curves to determine current value. If a price is unavailable from a Board-approved pricing service, the securities may be priced at the mean of two independent quotes obtained from brokers.
| ||
| 36 |
Table of Contents
Senior floating rate loans (“Loans”) are valued at the average of available bids in the market for such Loans, as provided by a Board-approved loan pricing service, and are generally categorized as Level 2.
Investments in registered investment companies that do not trade on an exchange are valued at the end of day net asset value per share. Investments in registered investment companies that trade on an exchange are valued at the last sales price or official closing price as of the close of the customary trading session on the exchange where the security is principally traded. Investments in registered investment companies are generally categorized as Level 1.
Futures contracts traded on national securities exchanges are valued at the quoted daily settlement price established by the exchange on which they trade reported by a Board-approved pricing service, and are generally categorized as Level 1. Option contracts traded on national securities exchanges are valued at the mean of the last bid and ask price reported by a Board-approved pricing service as of the close of the exchange on which they are traded, and are generally categorized as Level 1. Option contracts traded in the over-the-counter (“OTC”) market are valued at the mid-valuation provided by a Board-approved pricing service, and are generally categorized as Level 2. Forward foreign currency contracts (“forward contracts”) are valued at the 4:00 p.m. Eastern Time forward rate and are generally categorized as Level 2.
Other securities are valued on the basis of last sale or bid price (if a last sale price is not available) which is, in the opinion of the Adviser, the broadest and most representative market, that may be either a securities exchange or OTC market and are generally categorized as Level 1 or Level 2.
The Board is responsible for the share valuation process and has adopted policies and procedures (the “PRC Procedures”) for valuing the securities and other assets held by the Portfolios, including procedures for the fair valuation of securities and other assets for which market quotations are not readily available or are unreliable. The PRC Procedures provide for the establishment of a pricing review committee, which is responsible for, among other things, making certain determinations in connection with the Trust’s fair valuation procedures. Securities for which market quotations are not readily available or the values of which may be significantly impacted by the occurrence of developments or significant events are generally categorized as Level 3. There is no single standard for making fair value determinations, which may result in prices that vary from those of other funds.
Derivative Instruments
Forward Foreign Currency Contracts: During the period, the SA Wellington Strategic Multi-Asset Portfolio used forward contracts to attempt to protect the value of securities and related receivables and payables against changes in future foreign exchange rates, to manage and/or gain exposure to certain foreign currencies and/or to attempt to enhance return.
A forward contract is an agreement between two parties to buy or sell currency at a set price on a future date. The market value of the contract will fluctuate with changes in currency exchange rates. The contract is marked-to-market daily using the forward rate and the cumulative change in market value is recorded by a Portfolio as unrealized appreciation or depreciation. On the settlement date, a Portfolio records either realized gains or losses equal to the difference between the value of the contract at the time it was opened and the value at the time it was closed.
Risks to the Portfolios of entering into forward contracts include counterparty risk, market risk and illiquidity risk. Counterparty risk arises upon entering into these contracts from the potential inability of counterparties to meet the terms of their contracts. If the counterparty defaults, a Portfolio’s loss will generally consist of the net amount of contractual payments that the Portfolio has not yet received though the Portfolio’s maximum exposure due to counterparty risk could extend to the notional amount of the contract. Market risk is the risk that the value of the forward contract will depreciate due to unfavorable changes in the exchange rates. These contracts may involve market risk in excess of the unrealized appreciation or depreciation reported on the Statement of Assets and Liabilities. Illiquidity risk arises because the secondary market for forwards may have less liquidity relative to markets for other securities. Currency transactions are also subject to risks different from those of other portfolio transactions. Because currency control is of great importance to the issuing governments and influences economic planning and policy, purchases and sales of currency and related instruments can be adversely affected by government exchange controls, limitations or restrictions on repatriation of currency, and manipulations or exchange restrictions imposed by governments.
Forward foreign currency contracts outstanding at the end of the period, if any, are reported on a schedule at the end of the Portfolio’s Portfolio of Investments.
Futures: During the period, SA Wellington Government and Quality Bond and the SA Wellington Strategic Multi-Asset Portfolios used futures contracts to attempt to increase or decrease exposure to equity, bond and currency markets and to manage duration and yield curve positioning.
A futures contract is an agreement between two parties to buy and sell a financial instrument at a set price on a future date. Upon entering into a futures transaction, a Portfolio will be required to segregate an initial margin payment of cash or other liquid securities with the futures commission merchant (the “broker”). Subsequent payments are made or received by the Portfolio as a result of changes in the value of the contract and/or changes in the value of the initial margin requirement. Such receipts or payments are recorded in the Statements of Assets and Liabilities as variation margin for changes in the value of the contracts and as cash collateral for futures contracts for the changes in the value of the initial margin requirement. When a contract is closed, the Portfolios record a realized gain or loss equal to the difference between the value of the contract at the time it was opened and the value at the time it was closed.
| ||
| 37 |
Table of Contents
The primary risk to the Portfolios of entering into futures contracts is market risk. Market risk is the risk that there will be an unfavorable change in the interest rate, value or currency rate of the underlying security or securities. Futures contracts involve, to varying degrees, risk of loss in excess of the variation margin disclosed on the Statements of Assets and Liabilities. There may also be trading restrictions or limitations imposed by an exchange, and government regulations may restrict trading in futures contracts. While the Portfolios will generally only purchase exchange-traded futures, due to market conditions, there may not always be a liquid secondary market for a futures contract and, as a result, a Portfolio may be unable to close out its futures contracts at a time which is advantageous. In addition, if a Portfolio has insufficient cash to meet margin requirements, the Portfolio may need to sell other investments, including at disadvantageous times. There is generally minimal counterparty risk to the Portfolios since the futures contracts are generally exchange-traded.
Futures contracts outstanding at the end of the period, if any, are reported on a schedule at the end of the Portfolio’s Portfolio of Investments.
Master Agreements: Certain Portfolios that hold derivative instruments and other financial instruments may be a party to ISDA (International Swaps and Derivatives Association, Inc.) Master Agreements or similar agreements (“Master Agreements”) with certain counterparties that govern such instruments. Master Agreements may contain provisions regarding, among other things, the parties’ general obligations, representations, agreements, collateral requirements, events of default and early termination. Collateral can be in the form of cash or securities as agreed to by a Portfolio and applicable counterparty. Collateral requirements are generally determined based on a Portfolio’s net position with each counterparty. Master Agreements may also include certain provisions that require a Portfolio to post additional collateral upon the occurrence of certain events, such as when a Portfolio’s net assets fall below a specified level. In addition, Master Agreements typically specify certain standard termination events, such as failure of a party to pay or deliver, credit support defaults and other events of default. Termination events applicable to a Portfolio may also occur upon a decline in a Portfolio’s net assets below a specified level over a certain period of time. Additional termination events applicable to counterparties may occur upon a decline in a counterparty’s long-term and short-term credit ratings below a specified level, or upon a decline in the ratings of a counterparty’s credit support provider. Upon the occurrence of a termination event, the other party may elect to terminate early and cause settlement of all instruments outstanding pursuant to a particular Master Agreement, including the payment of any losses and costs resulting from such early termination, as reasonably determined by the terminating party. Any decision by one or more of a Portfolio’s counterparties to elect early termination could cause a Portfolio to accelerate the payment of liabilities, which settlement amounts could be in excess of the amount of assets that are already posted as collateral. Typically, the Master Agreement will permit a single net payment in the event of default. Note, however, that bankruptcy or insolvency laws of a particular jurisdiction may impose restrictions on or prohibitions against the right of offset in bankruptcy, insolvency or other events. As a result, the early termination with respect to derivative instruments subject to Master Agreements that are in a net liability position could be material to a Portfolio’s financial statements. The Portfolios do not offset derivative assets and derivative liabilities that are subject to netting arrangements in the Statement of Assets and Liabilities.
The following tables represent the value of derivatives held as of December 31, 2021, by their primary underlying risk exposure and respective location on the Statements of Assets and Liabilities and the effect of derivatives on the Statements of Operations for the year ended December 31, 2021. For a detailed presentation of derivatives held as of December 31, 2021, please refer to a schedule at the end of each Portfolio’s Portfolio of Investments.
| Asset Derivatives | Liability Derivatives | |||||||||||||||
| Futures Contracts(1)(4) | Foreign Forward Exchange Contracts(2) | Futures Contracts(1)(4) | Foreign Forward Exchange Contract(3) | |||||||||||||
Portfolio | Interest Rate Contracts | Interest Rate Contracts | ||||||||||||||
SA Wellington Government and Quality Bond | $ | 18,289 | $ | — | $ | — | $ | — | ||||||||
SA Wellington Strategic Multi-Asset | 7,944 | — | 4,506 | — | ||||||||||||
| Foreign Exchange Contracts | Foreign Exchange Contracts | |||||||||||||||
SA Wellington Strategic Multi-Asset | — | 206,950 | — | 172,549 | ||||||||||||
Statement of Assets and Liabilities Location:
| (1) | Variation margin on futures contracts |
| (2) | Unrealized appreciation on forward foreign currency contracts |
| (3) | Unrealized depreciation on forward foreign currency contracts |
| (4) | The variation margin on futures contracts is included in the cumulative appreciation (depreciation) as reported on each Portfolio’s Portfolio of Investments in the following amounts: |
Portfolio | Cumulative Appreciation (Depreciation) | |||
SA Wellington Government and Quality Bond | $ | (25,898 | ) | |
SA Wellington Strategic Multi-Asset | 13,428 | |||
| ||
| 38 |
Table of Contents
| Realized Gain (Loss) on Derivatives Recognized in Statement of Operations | ||||||||||||
Portfolio | Futures Contracts(1) | Purchased Options(2) | Foreign Forward Exchange Contracts(3) | |||||||||
| Interest Rate Contracts | ||||||||||||
SA Wellington Government and Quality Bond | $ | 2,484,023 | $ | — | $ | — | ||||||
SA Wellington Strategic Multi-Asset | (59,996 | ) | — | — | ||||||||
| Foreign Exchange Contracts | ||||||||||||
SA Wellington Strategic Multi-Asset | — | — | 1,715,487 | |||||||||
| Change in Unrealized Appreciation (Depreciation) on Derivatives Recognized in Statement of Operations | ||||||||||||
Portfolio | Futures Contracts(4) | Purchased Options(5) | Foreign Forward Exchange Contracts(6) | |||||||||
| Interest Rate Contracts | ||||||||||||
SA Wellington Government and Quality Bond | $ | 8,438 | $ | — | $ | — | ||||||
SA Wellington Strategic Multi-Asset | 19,441 | — | — | |||||||||
| Foreign Exchange Contracts | ||||||||||||
SA Wellington Strategic Multi-Asset | — | — | 481,764 | |||||||||
Statement of Operations Location:
| (1) | Net realized gain (loss) on futures contracts |
| (2) | Net realized gain (loss) on investments |
| (3) | Net realized gain (loss) on forward contracts |
| (4) | Change in unrealized appreciation (depreciation) on futures contracts |
| (5) | Change in unrealized appreciation (depreciation) on investments |
| (6) | Change in unrealized appreciation (depreciation) on forward contracts |
The following table represents the average monthly balances of derivatives held during the year ended December 31, 2021.
| Average Amount Outstanding During the Period | ||||||||
Portfolio | Futures Contracts(1) | Forward Foreign Currency Contracts(1) | ||||||
SA Wellington Government and Quality Bond | $ | 37,056,297 | $ | — | ||||
SA Wellington Strategic Multi-Asset | 5,291,528 | 81,479,294 | ||||||
| (1) | Amounts represent notional amounts in US dollars. |
The following table sets forth the Portfolios’ derivative assets and liabilities by counterparty, net of amounts available for offset under Master Agreements and net of the related collateral pledged (received) as of December 31, 2021. The repurchase agreements held by the Portfolios as of December 31, 2021, are also subject to Master Agreements but are not included in the following table. See each Portfolio’s Portfolio of Investments and the Notes to the Financial Statements for more information about the Portfolios’ holdings in repurchase agreements.
| SA Wellington Strategic Multi-Asset Portfolio | Net Derivative Assets (Liabilities) | Collateral Pledged/ (Received)(2) | Net Amount(3) | |||||||||||||||||||||||||||||||||||||||||
| Derivative Assets(1) | Derivative Liabilities(1) | |||||||||||||||||||||||||||||||||||||||||||
Counterparty | Forward Foreign Currency Contracts | OTC Swaps | Options Purchased | Total | Forward Foreign Currency Contracts | OTC Swaps | Options Written | Total | ||||||||||||||||||||||||||||||||||||
Bank of America N.A. | $ | 1,299 | $ | — | $ | — | $ | 1,299 | $ | 1,521 | $ | — | $ | — | $ | 1,521 | $ | (222 | ) | $ | — | $ | (222 | ) | ||||||||||||||||||||
Barclays Bank PLC | 1,798 | — | — | 1,798 | 35,355 | — | — | 35,355 | (33,557 | ) | — | (33,557 | ) | |||||||||||||||||||||||||||||||
BNP Paribas SA | — | — | — | — | 23,321 | — | — | 23,321 | (23,321 | ) | — | (23,321 | ) | |||||||||||||||||||||||||||||||
Citibank N.A. | 176 | — | — | 176 | 1,017 | — | — | 1,017 | (841 | ) | — | (841 | ) | |||||||||||||||||||||||||||||||
Deutsche Bank AG | 2,316 | — | — | 2,316 | 16,224 | — | — | 16,224 | (13,908 | ) | — | (13,908 | ) | |||||||||||||||||||||||||||||||
Goldman Sachs International | 365 | — | — | 365 | — | — | — | — | 365 | — | 365 | |||||||||||||||||||||||||||||||||
HSBC Bank PLC | — | — | — | — | 198 | — | — | 198 | (198 | ) | — | (198 | ) | |||||||||||||||||||||||||||||||
JPMorgan Chase Bank N.A. | 3,208 | — | — | 3,208 | 5,381 | — | — | 5,381 | (2,173 | ) | — | (2,173 | ) | |||||||||||||||||||||||||||||||
Morgan Stanley & Co. International PLC | 372 | — | — | 372 | 5,149 | — | — | 5,149 | (4,777 | ) | — | (4,777 | ) | |||||||||||||||||||||||||||||||
Royal Bank of Canada | 3,679 | — | — | 3,679 | 12,723 | — | — | 12,723 | (9,044 | ) | — | (9,044 | ) | |||||||||||||||||||||||||||||||
State Street Bank & Trust Company | 1,236 | — | — | 1,236 | 3,248 | — | — | 3,248 | (2,012 | ) | — | (2,012 | ) | |||||||||||||||||||||||||||||||
Toronto Dominion Bank | 5,512 | — | — | 5,512 | 66,935 | — | — | 66,935 | (61,423 | ) | — | (61,423 | ) | |||||||||||||||||||||||||||||||
UBS AG | 186,989 | — | — | 186,989 | 1,477 | — | — | 1,477 | 185,512 | — | 185,512 | |||||||||||||||||||||||||||||||||
|
|
|
|
|
|
|
|
|
|
|
|
|
|
|
|
|
|
|
|
|
| |||||||||||||||||||||||
| $ | 206,950 | $ | — | $ | — | $ | 206,950 | $ | 172,549 | $ | — | $ | — | $ | 172,549 | $ | 34,401 | $ | — | $ | 34,401 | |||||||||||||||||||||||
|
|
|
|
|
|
|
|
|
|
|
|
|
|
|
|
|
|
|
|
|
| |||||||||||||||||||||||
| (1) | Gross amounts of recognized assets and liabilities not offset in the Statements of Assets and Liabilities. |
| ||
| 39 |
Table of Contents
| (2) | For each respective counterparty, collateral pledged or (received) is limited to an amount not to exceed 100% of the net amount of the derivative asset or liability in the table above. |
| (3) | Net amount represents the net amount due (to) or from counterparty in the event of a default based on the contractual set-off rights under the agreement. |
Foreign Currency Translation: The books and records of the Portfolios are maintained in U.S. dollars. Assets and liabilities denominated in foreign currencies and commitments under forward foreign currency contracts are translated into U.S. dollars based on the exchange rate of such currencies against U.S. dollars on the date of valuation.
The Portfolios do not isolate that portion of the results of operations arising as a result of changes in the foreign exchange rates from the changes in the market prices of securities held at the end of the period.
Similarly, the Portfolios do not isolate the effect of changes in foreign exchange rates from the changes in the market prices of portfolio securities sold during the period.
Realized foreign exchange gains and losses on other assets and liabilities and change in unrealized foreign exchange gains and losses on other assets and liabilities located in the Statements of Operations include realized foreign exchange gains and losses from currency gains or losses between the trade and the settlement dates of securities transactions, the difference between the amounts of interest, dividends and foreign withholding taxes recorded on the Portfolios’ books and the U.S. dollar equivalent amounts actually received or paid and changes in the unrealized foreign exchange gains and losses relating to the other assets and liabilities arising as a result of changes in the exchange rates.
Securities Transactions, Investment Income, Expenses, Dividends and Distributions to Shareholders: Security transactions are recorded on a trade date basis. Realized gains and losses on the sale of investments are calculated on the identified cost basis. For financial statement purposes, the Portfolios amortize all premiums and accrete all discounts on fixed income securities.
Interest income is accrued daily from settlement date except when collection is not expected. Dividend income is recorded on the ex-dividend date except for certain dividends from foreign securities, which are recorded as soon as the Trust is informed after the ex-dividend date. Paydown gains and losses on mortgage and asset-backed securities are recorded as components of interest income on the Statement of Operations.
Portfolios which earn foreign income and capital gains may be subject to foreign withholding taxes and capital gains taxes at various rates. Under applicable foreign law, a withholding of tax may be imposed on interest, dividends, and capital gains from the sale of foreign securities at various rates. India, Thailand, and certain other countries’ tax regulations require that taxes be paid on capital gains realized by a Portfolio.
Distributions received from a Portfolio’s investments in U.S. real estate investment trusts (“REITS”) often include a “return of capital” which is recorded as a reduction to the cost basis of the securities held.
Net investment income, expenses other than class specific expenses, and realized and unrealized gains and losses are allocated daily to each class of shares based upon the relative net asset value of outstanding shares of each class of share at the beginning of the day (after adjusting for current capital shares activity of the respective class).
Expenses common to all Portfolios are allocated among the Portfolios based upon relative net assets or other appropriate allocation methods. In all other respects, expenses are charged to each Portfolio as incurred on a specific identification basis.
Dividends from net investment income and capital gain distributions, if any, are paid annually. The Portfolios record dividends and distributions to their shareholders on the ex-dividend date.
The amount of dividends and distributions from net investment income and net realized capital gains are determined in accordance with federal income tax regulations, which may differ from GAAP. These “book/tax” differences are either considered temporary or permanent in nature. To the extent these differences are permanent in nature, such amounts are reclassified within the capital accounts at fiscal year end based on their federal tax-basis treatment; temporary differences do not require reclassification. Net assets are not affected by these reclassifications.
Each Portfolio is considered a separate entity for tax purposes and intends to comply with the requirements of the Internal Revenue Code, as amended, applicable to regulated investment companies and distribute all of its taxable income, including any net capital gains on investments, to its shareholders. Each Portfolio also intends to distribute sufficient net investment income and net capital gains, if any, so that it will not be subject to excise tax on undistributed income and gains. Therefore, no federal income tax or excise tax provision is required.
The Portfolios recognize the tax benefits of uncertain tax positions only when the position is more likely than not to be sustained, assuming examination by tax authorities. Management has analyzed each Portfolio’s tax positions and concluded that no liability for unrecognized tax benefits should be recorded related to uncertain tax positions. The Portfolios are not aware of any tax provisions for which it is reasonably possible that the total amounts of unrecognized tax benefits will change materially in the next twelve months. The Portfolios file U.S. federal and certain state income tax returns. The Portfolios federal tax returns for the prior three fiscal years remain subject to examination by the Internal Revenue Service.
Repurchase Agreements: The Portfolios, along with other affiliated registered investment companies, pursuant to procedures adopted by the Board and applicable guidance from the Securities and Exchange Commission (“SEC”), may transfer uninvested cash balances into a single joint account, the daily aggregate balance of which is invested in one or more repurchase agreements collateralized by U.S. Treasury or federal agency obligations. In a repurchase agreement, the seller of a security agrees to repurchase the security at a mutually agreed-upon time and price, which reflects the effective rate of return for the term of the agreement. For repurchase agreements and joint repurchase agreements, the Trust’s custodian takes possession of the collateral pledged for investments in such repurchase agreements
| ||
| 40 |
Table of Contents
(“repo” or collectively “repos”). The underlying collateral is valued daily on a mark to market basis, plus accrued interest to ensure that the value, at the time the agreement is entered into, is equal to at least 102% of the repurchase price, including accrued interest. In the event of default of the obligation to repurchase, a Portfolio has the right to liquidate the collateral and apply the proceeds in satisfaction of the obligation. If the seller defaults and the value of the collateral declines or if bankruptcy proceedings are commenced with respect to the seller of the security, realization of the collateral by a Portfolio may be delayed or limited.
As of December 31, 2021, the following Portfolios held an undivided interest in a joint repurchase agreement with Bank of America Securities LLC:
Portfolio | Percentage Ownership | Principal Amount | ||||||
SA Wellington Capital Appreciation | 9.03 | % | $ | 8,695,000 | ||||
SA Wellington Government and Quality Bond | 80.17 | 77,220,000 | ||||||
SA Wellington Strategic Multi-Asset | 0.98 | 945,000 | ||||||
As of such date, the repurchase agreement in that joint account and the collateral thereof were as follows:
Bank of America Securities LLC, dated December 31, 2021, bearing interest at a rate of 0.04% per annum, with a principal amount of $96,320,000, a repurchase price of $96,320,321, and a maturity date of January 3, 2022. The repurchase agreement is collateralized by the following:
Type of Collateral | Interest Rate | Maturity Date | Principal Amount | Value | ||||||||||||
U.S. Treasury Notes | 1.25 | % | 12/31/2026 | $ | 98,370,000 | $ | 98,288,860 | |||||||||
As of December 31, 2021, the following Portfolios held an undivided interest in a joint repurchase agreement with Barclays Capital, Inc.:
Portfolio | Percentage Ownership | Principal Amount | ||||||
SA Wellington Capital Appreciation | 9.02 | % | $ | 6,765,000 | ||||
SA Wellington Government and Quality Bond | 80.15 | 60,110,000 | ||||||
SA Wellington Strategic Multi-Asset | 0.97 | 725,000 | ||||||
As of such date, the repurchase agreement in that joint account and the collateral thereof were as follows:
Barclays Capital, Inc., dated December 31, 2021, bearing interest at a rate of 0.05% per annum, with a principal amount of $75,000,000, a repurchase price of $75,000,313, and a maturity date of January 3, 2022. The repurchase agreement is collateralized by the following:
Type of Collateral | Interest Rate | Maturity Date | Principal Amount | Value | ||||||||||||
U.S. Treasury Bonds | 3.38 | % | 11/15/2048 | $ | 58,286,000 | $ | 76,405,153 | |||||||||
As of December 31, 2021, the following Portfolios held an undivided interest in a joint repurchase agreement with BNP Paribas SA:
Portfolio | Percentage Ownership | Principal Amount | ||||||
SA Wellington Capital Appreciation | 9.02 | % | $ | 5,860,000 | ||||
SA Wellington Government and Quality Bond | 80.15 | 52,095,000 | ||||||
SA Wellington Strategic Multi-Asset | 0.96 | 625,000 | ||||||
As of such date, the repurchase agreement in that joint account and the collateral thereof were as follows:
BNP Paribas SA, dated December 31, 2021, bearing interest at a rate of 0.05% per annum, with a principal amount of $65,000,000, a repurchase price of $65,000,271, and a maturity date of January 3, 2022. The repurchase agreement is collateralized by the following:
Type of Collateral | Interest Rate | Maturity Date | Principal Amount | Value | ||||||||||||
U.S. Treasury Bonds | 2.25 | % | 08/15/2046 | $ | 62,275,400 | $ | 66,220,073 | |||||||||
As of December 31, 2021, the following Portfolios held an undivided interest in a joint repurchase agreement with Deutsche Bank AG:
Portfolio | Percentage Ownership | Principal Amount | ||||||
SA Wellington Capital Appreciation | 9.02 | % | $ | 8,570,000 | ||||
SA Wellington Government and Quality Bond | 80.15 | 76,140,000 | ||||||
SA Wellington Strategic Multi-Asset | 0.96 | 915,000 | ||||||
As of such date, the repurchase agreement in that joint account and the collateral thereof were as follows:
Deutsche Bank AG, dated December 31, 2021, bearing interest at a rate of 0.03% per annum, with a principal amount of $95,000,000, a repurchase price of $95,000,238, and a maturity date of January 3, 2022. The repurchase agreement is collateralized by the following:
Type of Collateral | Interest Rate | Maturity Date | Principal Amount | Value | ||||||||||||
U.S. Treasury Notes | 0.75 | % | 03/31/2026 | $ | 98,626,000 | $ | 96,954,193 | |||||||||
| ||
| 41 |
Table of Contents
As of December 31, 2021, the following Portfolios held an undivided interest in a joint repurchase agreement with RBS Securities, Inc.:
Portfolio | Percentage Ownership | Principal Amount | ||||||
SA Wellington Capital Appreciation | 9.02 | % | $ | 8,570,000 | ||||
SA Wellington Government and Quality Bond | 80.15 | 76,140,000 | ||||||
SA Wellington Strategic Multi-Asset | 0.96 | 915,000 | ||||||
As of such date, the repurchase agreement in that joint account and the collateral thereof were as follows:
RBS Securities, Inc., dated December 31, 2021, bearing interest at a rate of 0.03% per annum, with a principal amount of $95,000,000, a repurchase price of $95,000,238, and a maturity date of January 3, 2022. The repurchase agreement is collateralized by the following:
Type of Collateral | Interest Rate | Maturity Date | Principal Amount | Value | ||||||||||||
U.S. Treasury Notes | 0.75 | % | 12/31/2023 | $ | 96,940,000 | $ | 96,972,302 | |||||||||
Mortgage-Backed Dollar Rolls: Certain Portfolios may enter into dollar rolls using “to be announced” (“TBA”) mortgage-backed securities (“TBA Rolls”). TBA Roll transactions involve the sale of mortgage or other asset backed securities with the commitment to purchase substantially similar securities on a specified future date. The Portfolios’ policy is to record the components of TBA Rolls as purchase/sale transactions. Any difference between the purchase and sale price is recorded as a realized gain or loss on the date the transaction is entered into. TBA Roll transactions involve the risk that the market value of the securities held by a Portfolio may decline below the price of the securities that the Portfolio has sold but is obligated to repurchase under the agreement. In the event that the buyer of securities in a TBA Roll transaction files bankruptcy or becomes insolvent, a Portfolio’s use of the proceeds from the sale of the securities may be restricted pending a determination by the other party, or its trustee or receiver, whether to enforce the Portfolio’s obligation to repurchase the securities. Mortgage-Backed Dollar Rolls outstanding at the end of the period, if any, are included in investments purchased/sold on an extended settlement basis in the Statement of Assets and Liabilities.
When-Issued Securities and Forward Commitments: Certain Portfolios may purchase or sell when-issued securities, including TBA securities that have been authorized, but not yet issued in the market. In addition, a Portfolio may purchase or sell securities on a forward commitment basis. A forward commitment involves entering into a contract to purchase or sell securities, typically on an extended settlement basis, for a fixed price at a future date. The Portfolios may engage in when-issued or forward commitment transactions in order to secure what is considered to be an advantageous price and yield at the time of entering into the obligation. The purchase of securities on a when-issued or forward commitment basis involves a risk of loss if the value of the security to be purchased declines before the settlement date. Conversely, the sale of securities on a when-issued or forward commitment basis involves the risk that the value of the securities sold may increase before the settlement date. Securities purchased or sold on a when-issued or forward commitment basis outstanding at the end of the period, if any, are included in investments purchased/sold on an extended settlement basis in the Statement of Assets and Liabilities.
Stripped Mortgage-Backed Securities: Stripped Mortgage-Backed Securities (“SMBS”) are multiple-class mortgage-backed securities. SMBS are often structured with two classes that receive different proportions of the interest and principal distributions on a pool of mortgage assets. SMBS have greater market volatility than other types of U.S. government securities in which a Portfolio invests. A common type of SMBS has one class receiving some of the interest and all or most of the principal (the “principal only” class) from the mortgage pool, while the other class will receive all or most of the interest (the “interest only” class). The yield to maturity on an interest only class is extremely sensitive not only to changes in prevailing interest rates, but also to the rate of principal payments, including principal prepayments, on the underlying pool of mortgage assets, and a rapid rate of principal payment may have a material adverse effect on a Portfolio’s yield.
LIBOR Risk: A Portfolio’s investments, payment obligations and financing terms may be based on floating rates, such as LIBOR, Euro Interbank Offered Rate and other similar types of reference rates (each, a “Reference Rate”). On July 27, 2017, the Chief Executive of the UK Financial Conduct Authority (“FCA”), which regulates LIBOR, announced that the FCA will no longer persuade nor require banks to submit rates for the calculation of LIBOR and certain other Reference Rates after 2021. On March 5, 2021, the FCA and LIBOR’s administrator announced that most LIBOR settings will no longer be published after June 30, 2023. Such announcements indicate that the continuation of LIBOR and other Reference Rates on the current basis cannot and will not be guaranteed. These announcements and any additional regulatory or market changes may have an adverse impact on a Portfolio or its investments.
Regulators and market participants are working together to identify or develop successor Reference Rates. It is expected that market participants will focus on the transition mechanisms by which the Reference Rates in existing contracts or instruments may be amended, whether through market wide protocols, fallback contractual provisions, bespoke negotiations or amendments or otherwise. Nonetheless, the termination of certain Reference Rates presents risks to a Portfolio. At this time, it is not possible to completely identify or predict the effect of any such changes, any establishment of alternative Reference Rates or any other reforms to Reference Rates that may be enacted in the UK or elsewhere. The elimination of a Reference Rate or any other changes or reforms to the determination or supervision of Reference Rates, and these changes could have an adverse impact on the market for or value of any securities or payments linked to those Reference Rates and other financial obligations held by a Portfolio or on its overall financial condition or results of operations. In addition, any substitute Reference Rate and any pricing adjustments imposed by a regulator or by counterparties or otherwise may adversely affect a Portfolio’s performance and/or net asset value.
| ||
| 42 |
Table of Contents
Recent Accounting and Regulatory Developments: In March 2020, FASB issued ASU No. 2020-04, Reference Rate Reform (Topic 848); Facilitation of the Effects of Reference Rate Reform on Financial Reporting, which provides, optional, temporary relief with respect to the financial reporting of contracts subject to certain types of modifications due to the planned discontinuation of the LIBOR and LIBOR based reference rates as of the end of 2021. The temporary relief provided by ASU 2020-04 is effective for certain reference rate-related contract modifications that occur during the period March 12, 2020 through December 31, 2022. Management is evaluating the potential impact of ASU 2020-04 to the financial statements.
On December 3, 2020, the SEC announced that it voted to adopt a new rule that establishes an updated regulatory framework for fund valuation practices (the “Rule”). The Rule, in part, provides (i) a framework for determining fair value in good faith and (ii) provides for a fund Board’s assignment of its responsibility for the execution of valuation-related activities to a fund’s investment adviser. Further, the SEC is rescinding previously issued guidance on related issues. The Rule became effective on March 8, 2021 and has a compliance date of September 8, 2022 (eighteen months following the effective date). Management is currently evaluating the Rule and its impact to the Portfolios.
Note 3. Investment Advisory Agreement and Other Transactions with Affiliates
The Trust has entered into an Investment Advisory and Management Agreement (the “Management Agreement”) with SAAMCo with respect to each Portfolio. SAAMCo serves as investment adviser and manager for each of the Portfolios. The Management Agreement provides that SAAMCo shall act as investment adviser to the Trust; manage the Trust’s investments; administer its business affairs; furnish offices, necessary facilities and equipment; provide clerical, bookkeeping and administrative services; and permit any of its officers or employees to serve, without compensation, as trustees or officers of the Trust, if duly elected to such positions.
The Trust pays SAAMCo a monthly fee, calculated daily at the following annual percentages of each Portfolio’s average daily net assets:
| Portfolio | Average Daily Net Assets | Management Fee | ||||||
| SA Wellington Capital Appreciation | $0-$50 million | .750% | ||||||
| > $50 million | .725% | |||||||
| > $100 million | .700% | |||||||
| SA Wellington Government and Quality Bond | $0-$200 million | .625% | ||||||
| > $200 million | .575% | |||||||
| > $500 million | .500% | |||||||
| Portfolio | Average Daily Net Assets | Management Fee | ||||||
| SA Wellington Strategic Multi-Asset | $0-$200 million | 1.000% | ||||||
| > $200 million | .875% | |||||||
| > $500 million | .800% | |||||||
The organization described below acts as a subadviser to the Trust and each of its Portfolios pursuant to a Subadvisory Agreement with SAAMCo. Under the Subadvisory Agreement, the subadviser manages the investment and reinvestment of the assets of the respective Portfolios.
The subadviser is independent of SAAMCo and discharges its responsibilities subject to the policies of the Trust’s Trustees and the oversight and supervision of SAAMCo, which pays the subadviser fees.
Subadviser | Portfolio | |
Wellington Management Company LLP | SA Wellington Capital Appreciation | |
| SA Wellington Government and Quality Bond | ||
| SA Wellington Strategic Multi-Asset |
Class 2 and Class 3 shares of each Portfolio are subject to a Rule 12b-1 plan that provides for service fees payable at the annual rate of 0.15% and 0.25%, respectively of the average daily net assets of such Class 2 and Class 3 shares, respectively. The service fees will be used to compensate the Life Companies for expenditures made to financial intermediaries for providing services to contract holders who are the indirect beneficial owners of the Portfolios’ Class 2 and Class 3 shares.
The Trust has entered into a Master Transfer Agency and Services Agreement with VALIC Retirement Services Company (“VRSCO”), a majority owned subsidiary of the Variable Annuity Life Insurance Company (“VALIC”), which is an affiliate of the Adviser. Under the agreement, VRSCO provides services, which include the issuance and redemption of shares, payment of dividends between the Trust and their “institutional” shareholders and certain shareholder reporting services including confirmation of transactions, statements of account and tax reporting. The Trust, and certain other mutual funds advised by SAAMCo pay VRSCO an annual fee in the aggregate amount of $150,000 for Transfer Agency Services provided pursuant to the agreement, which is allocated based on shareholder accounts. Accordingly, for the year ended December 31, 2021, transfer agent fees were paid (see Statement of Operations) based on the aforementioned agreement.
SAAMCo has contractually agreed to waive fees and/or reimburse expenses, if necessary, for the SA Wellington Strategic Multi-Asset Portfolio, so that the annual operating expenses do not exceed 0.86% for Class 1 shares and 1.11% for Class 3 shares, respectively. For the purposes of waived fee and/or reimbursed expense calculations, annual operating expenses shall not include extraordinary expenses (i.e., expenses that are unusual in nature and infrequent in occurrence, such as litigation), or acquired fund fees and expenses, brokerage commissions and other transactional expenses relating to the purchase and sale of portfolio securities, interest, taxes and
| ||
| 43 |
Table of Contents
governmental fees, and other expenses not incurred in the ordinary course of a Portfolio’s business. Any waivers and/or reimbursements made by SAAMCo with respect to the SA Wellington Strategic Multi-Asset Portfolio other than investment advisory fees waived, are subject to recoupment from a Portfolio within two years after the occurrence of the waivers and/or reimbursements, provided that a Portfolio is able to effect such payment to SAAMCo and remains in compliance with the contractual expense limitations in effect at the time the waivers and/or reimbursements were made. The contractual fee waivers and/or expense limitations may be modified or discontinued prior to April 30, 2023, only with the approval of the Board. For the year ended December 31, 2021, pursuant to the contractual expense limitations mentioned above, SAAMCo waived fees and/or reimbursed expenses as follows:
| Portfolio | Amount | |||
SA Wellington Strategic Multi-Asset — Class 1 | $ | 54,396 | ||
SA Wellington Strategic Multi-Asset — Class 3 | 373,112 | |||
For the year ended December 31, 2021, the amounts repaid to the Adviser which are included in the Statement of Operations along with the remaining balance subject to recoupment are as follows:
| Amount Recouped | Balance Subject to Recoupment | |||||||||||
| Portfolio | December 31, 2021 | December 31, 2022 | December 31, 2023 | |||||||||
SA Wellington Strategic Multi-Asset — Class 1 | $ | — | $ | 68,561 | $ | 54,396 | ||||||
SA Wellington Strategic Multi-Asset — Class 3 | — | 270,271 | 373,112 | |||||||||
At December 31, 2021, the following affiliates owned outstanding shares of the following Portfolios:
| Holder | ||||||||||||||||||||||||||||||||||||
| Portfolio | USL | AGL | VALIC | SunAmerica Series Trust VCP SA Dynamic Allocation Portfolio | SunAmerica Series Trust VCP SA Dynamic Strategy Portfolio | Seasons Series Trust SA Allocation Balanced Portfolio | Seasons Series Trust SA Allocation Growth Portfolio | Seasons Series Trust SA Allocation Moderate Growth Portfolio | Seasons Series Trust SA Allocation Moderate Portfolio | |||||||||||||||||||||||||||
SA Wellington Capital Appreciation | 3.70 | % | 88.70 | % | 0.58 | % | 6.77 | % | — | % | — | % | — | % | — | % | — | % | ||||||||||||||||||
SA Wellington Government and Quality Bond | 2.17 | 43.49 | 0.35 | 35.02 | 13.11 | 1.72 | 0.67 | 1.94 | 1.52 | |||||||||||||||||||||||||||
SA Wellington Strategic Multi-Asset | 6.32 | 91.51 | 1.54 | — | — | — | — | — | — | |||||||||||||||||||||||||||
Note 4. Expense Reductions
Through expense offset arrangements resulting from broker commission recapture, a portion of the expenses of certain Portfolios have been reduced. For the year ended December 31, 2021, the amount of expense reductions received by each Portfolio used to offset non-affiliated expenses are reflected as Fees paid indirectly in the Statement of Operations.
Note 5. Purchases and Sales of Investment Securities
The cost of purchases and proceeds from sales and maturities of long-term investments for the year ended December 31, 2021 were as follows:
Portfolio | Purchases of Investment Securities (excluding U.S. Government Securities) | Sales of Investment Securities (excluding U.S. Government Securities) | Purchases of U.S. Government Securities | Sales of U.S. Government Securities | ||||||||||||
SA Wellington Capital Appreciation | $ | 2,180,800,402 | $ | 2,205,012,085 | $ | — | $ | — | ||||||||
SA Wellington Government and Quality Bond | 391,684,284 | 319,972,191 | 762,968,789 | 852,522,727 | ||||||||||||
SA Wellington Strategic Multi-Asset | 134,709,266 | 102,239,613 | 11,562,830 | 6,982,679 | ||||||||||||
| ||
| 44 |
Table of Contents
Note 6. Federal Income Taxes
The following details the tax basis of distributions as well as the components of distributable earnings. The tax basis components of distributable earnings differ from the amounts reflected in the Statements of Assets and Liabilities by temporary book/tax differences primarily arising from wash sales, investments in passive foreign investment companies, investments in real estate investment trusts, investments in regulated investment companies, straddles, amortization for premium/discount, investments in partnerships, treatment of defaulted securities and derivative transactions.
| For the year ended December 31, 2021 | ||||||||||||||||||||
| Distributable Earnings | Tax Distributions | |||||||||||||||||||
Portfolio | Ordinary Income | Long-Term Gains, Capital and Other Losses | Unrealized Appreciation (Depreciation)* | Ordinary Income | Long-Term Capital Gains | |||||||||||||||
SA Wellington Capital Appreciation | $ | 223,686,960 | $ | 296,816,999 | $ | 157,488,038 | $ | 257,134,733 | $ | 226,208,534 | ||||||||||
SA Wellington Government and Quality Bond | 31,095,004 | 8,046,483 | 21,703,416 | 45,330,635 | 11,491,123 | |||||||||||||||
SA Wellington Strategic Multi-Asset | 7,036,137 | 7,711,794 | 7,062,631 | 4,001,154 | 1,506,863 | |||||||||||||||
| * | Unrealized appreciation (depreciation) includes amounts for derivatives and other assets and liabilities denominated in foreign currency. |
| For the year ended December 31, 2020 | ||||||||
| Tax Distributions | ||||||||
Portfolio | Ordinary Income | Long-Term Capital Gains | ||||||
SA Wellington Capital Appreciation | $ | 17,747,232 | $ | 163,144,508 | ||||
SA Wellington Government and Quality Bond | 35,870,505 | — | ||||||
SA Wellington Strategic Multi-Asset | 787,779 | 1,059,440 | ||||||
For the year ended December 31, 2021, the reclassifications arising from book/tax differences resulted in increases (decreases) that were primarily due to treatment of foreign currency, principal paydown adjustments, adjustments due to mergers, net operating loss offset to short-term capital gains, amortization of premium/discount and sale of passive foreign investment companies to the components of net assets as follows:
Portfolio | Accumulated Undistributed Net Investment Income (Loss) | Accumulated Undistributed Net Realized Gain (Loss) | Capital Paid-in | |||||||||
SA Wellington Capital Appreciation | $ | 13,643,254 | $ | (15,851,764 | ) | $ | 2,208,510 | |||||
SA Wellington Government and Quality Bond | 2,926,100 | (2,926,100 | ) | — | ||||||||
SA Wellington Strategic Multi-Asset | 2,098,708 | (2,098,708 | ) | — | ||||||||
As of December 31, 2021, the amounts of the aggregate unrealized gain (loss) and the cost of investment securities for federal income tax purposes, including short-term securities and repurchase agreements, were as follows:
Portfolio | Aggregate Unrealized Gain | Aggregate Unrealized Loss | Net Unrealized Gain (Loss) | Cost of Investments | ||||||||||||
SA Wellington Capital Appreciation | $ | 284,816,332 | $ | (127,331,103 | ) | $ | 157,485,229 | $ | 2,057,215,983 | |||||||
SA Wellington Government and Quality Bond | 34,066,940 | (12,363,524 | ) | 21,703,416 | 2,054,762,135 | |||||||||||
SA Wellington Strategic Multi-Asset | 12,948,928 | (5,886,032 | ) | 7,062,896 | 145,114,677 | |||||||||||
| ||
| 45 |
Table of Contents
Note 7. Capital Share Transactions
Transactions in capital shares of each class of each Portfolio were as follows:
| SA Wellington Capital Appreciation Portfolio | ||||||||||||||||||||||||||||||||
| Class 1 | Class 2 | |||||||||||||||||||||||||||||||
| For the year ended December 31, 2021 | For the year ended December 31, 2020 | For the year ended December 31, 2021 | For the year ended December 31, 2020 | |||||||||||||||||||||||||||||
| Shares | Amount | Shares | Amount | Shares | Amount | Shares | Amount | |||||||||||||||||||||||||
Shares sold | 122,580 | $ | 7,254,287 | 567,523 | $ | 22,588,349 | 23,666 | $ | 1,317,538 | 20,883 | $ | 880,194 | ||||||||||||||||||||
Shares issued in merger@ | 492,840 | 28,259,876 | — | — | 161,299 | 8,419,089 | — | — | ||||||||||||||||||||||||
Reinvested dividends | 3,337,770 | 181,574,685 | 1,400,772 | 82,477,470 | 294,122 | 14,567,862 | 114,925 | 6,303,612 | ||||||||||||||||||||||||
Shares redeemed | (2,195,536 | ) | (141,698,986 | ) | (4,769,904 | ) | (255,226,418 | ) | (177,246 | ) | (10,411,700 | ) | (211,311 | ) | (10,430,591 | ) | ||||||||||||||||
|
|
|
|
|
|
|
|
|
|
|
|
|
|
|
| |||||||||||||||||
Net increase (decrease) | 1,757,654 | $ | 75,389,862 | (2,801,609 | ) | $ | (150,160,599 | ) | 301,841 | $ | 13,892,789 | (75,503 | ) | $ | (3,246,785 | ) | ||||||||||||||||
|
|
|
|
|
|
|
|
|
|
|
|
|
|
|
| |||||||||||||||||
| Class 3 | ||||||||||||||||||||||||||||||||
| For the year ended December 31, 2021 | For the year ended December 31, 2020 | |||||||||||||||||||||||||||||||
| Shares | Amount | Shares | Amount | |||||||||||||||||||||||||||||
Shares sold | 4,242,616 | $ | 233,767,278 | 1,074,990 | $ | 54,242,630 | ||||||||||||||||||||||||||
Shares issued in merger@ | 4,284,431 | 209,571,239 | — | — | ||||||||||||||||||||||||||||
Reinvested dividends | 6,187,004 | 287,200,720 | 1,761,872 | 92,110,658 | ||||||||||||||||||||||||||||
Shares redeemed | (783,272 | ) | (43,081,317 | ) | (3,211,070 | ) | (159,744,868 | ) | ||||||||||||||||||||||||
|
|
|
|
|
|
|
| |||||||||||||||||||||||||
Net increase (decrease) | 13,930,779 | $ | 687,457,920 | (374,208 | ) | $ | (13,391,580 | ) | ||||||||||||||||||||||||
|
|
|
|
|
|
|
| |||||||||||||||||||||||||
| SA Wellington Government and Quality Bond Portfolio | ||||||||||||||||||||||||||||||||
| Class 1 | Class 2 | |||||||||||||||||||||||||||||||
| For the year ended December 31, 2021 | For the year ended December 31, 2020 | For the year ended December 31, 2021 | For the year ended December 31, 2020 | |||||||||||||||||||||||||||||
| Shares | Amount | Shares | Amount | Shares | Amount | Shares | Amount | |||||||||||||||||||||||||
Shares sold | 10,523,075 | $ | 165,783,088 | 18,869,778 | $ | 303,420,373 | 94,481 | $ | 1,470,306 | 229,082 | $ | 3,689,098 | ||||||||||||||||||||
Reinvested dividends | 2,290,188 | 35,062,787 | 1,389,281 | 22,270,170 | 39,073 | 600,561 | 27,777 | 446,652 | ||||||||||||||||||||||||
Shares redeemed | (10,648,049 | ) | (167,854,297 | ) | (10,865,822 | ) | (173,045,115 | ) | (255,234 | ) | (4,048,824 | ) | (240,682 | ) | (3,885,965 | ) | ||||||||||||||||
|
|
|
|
|
|
|
|
|
|
|
|
|
|
|
| |||||||||||||||||
Net increase (decrease) | 2,165,214 | $ | 32,991,578 | 9,393,237 | $ | 152,645,428 | (121,680 | ) | $ | (1,977,957 | ) | 16,177 | $ | 249,785 | ||||||||||||||||||
|
|
|
|
|
|
|
|
|
|
|
|
|
|
|
| |||||||||||||||||
| ||||||||||||||||||||||||||||||||
| Class 3 | ||||||||||||||||||||||||||||||||
| For the year ended December 31, 2021 | For the year ended December 31, 2020 | |||||||||||||||||||||||||||||||
| Shares | Amount | Shares | Amount | |||||||||||||||||||||||||||||
Shares sold | 5,517,146 | $ | 85,641,094 | 10,614,954 | $ | 171,159,307 | ||||||||||||||||||||||||||
Reinvested dividends | 1,384,712 | 21,158,410 | 822,619 | 13,153,683 | ||||||||||||||||||||||||||||
Shares redeemed | (6,208,076 | ) | (97,636,503 | ) | (9,254,765 | ) | (147,869,147 | ) | ||||||||||||||||||||||||
|
|
|
|
|
|
|
| |||||||||||||||||||||||||
Net increase (decrease) | 693,782 | $ | 9,163,001 | 2,182,808 | $ | 36,443,843 | ||||||||||||||||||||||||||
|
|
|
|
|
|
|
| |||||||||||||||||||||||||
| SA Wellington Strategic Multi-Asset Portfolio | ||||||||||||||||||||||||||||||||
| Class 1 | Class 3 | |||||||||||||||||||||||||||||||
| For the year ended December 31, 2021 | For the year ended December 31, 2020 | For the year ended December 31, 2021 | For the year ended December 31, 2020 | |||||||||||||||||||||||||||||
| Shares | Amount | Shares | Amount | Shares | Amount | Shares | Amount | |||||||||||||||||||||||||
Shares sold | 21,374 | $ | 216,900 | 96,658 | $ | 796,152 | 4,425,186 | $ | 44,383,819 | 3,633,772 | $ | 32,730,282 | ||||||||||||||||||||
Reinvested dividends | 65,441 | 652,452 | 40,008 | 367,277 | 490,461 | 4,855,565 | 162,097 | 1,479,942 | ||||||||||||||||||||||||
Shares redeemed | (214,489 | ) | (2,176,531 | ) | (223,294 | ) | (1,922,293 | ) | (371,215 | ) | (3,727,464 | ) | (615,062 | ) | (5,100,033 | ) | ||||||||||||||||
|
|
|
|
|
|
|
|
|
|
|
|
|
|
|
| |||||||||||||||||
Net increase (decrease) | (127,674 | ) | $ | (1,307,179 | ) | (86,628 | ) | $ | (758,864 | ) | 4,544,432 | $ | 45,511,920 | 3,180,807 | $ | 29,110,191 | ||||||||||||||||
|
|
|
|
|
|
|
|
|
|
|
|
|
|
|
| |||||||||||||||||
| @ | See Note 13 |
Note 8. Line of Credit
The Trust, along with certain other funds managed by the Adviser, has access to a $75 million committed unsecured line of credit and a $50 million uncommitted unsecured line of credit. The committed and uncommitted lines of credit are renewable on an annual basis with State Street Bank and Trust Company (“State Street”), the Trust’s custodian. Interest on each of the committed and uncommitted lines of credit is payable at a variable rate per annum equal to the Applicable Rate plus one and one quarter of one percent (1.25%). The Applicable Rate per annum shall be equal to the higher of (a) the Federal Funds Effective Rate on such date and (b) the Overnight Bank Funding Rate on
| ||
| 46 |
Table of Contents
such date, plus, in each case, 10 basis points. Notwithstanding anything to the contrary, if the Federal Funds Effective Rate or the Overnight Bank Funding Rate shall be less than zero, then the Federal Funds Effective Rate or the Overnight Bank Funding Rate, shall be deemed to be zero for the purposes of determining the rate. The Trust has paid State Street for its own account, the Portfolio’s ratable portion of an upfront fee in an amount equal to $40,000 in the aggregate for the uncommitted line of credit made available by State Street to certain other funds managed by the Adviser, which are also party to the uncommitted line of credit. There is also a commitment fee of 30 basis points per annum on the daily unused portion of the committed line of credit. Borrowings under the line of credit will commence when the respective Portfolio’s cash shortfall exceeds $100,000.
For the year ended December 31, 2021, the Portfolios did not utilize the line of credit.
Note 9. Interfund Lending Agreement
Pursuant to the exemptive relief granted by the SEC, the Portfolios are permitted to participate in an interfund lending program among investment companies advised by SAAMCo or an affiliate. The interfund lending program allows the participating Portfolios to borrow money from and lend money to each other for temporary or emergency purposes. An interfund loan will be made under this facility only if the participating Portfolios receive a more favorable interest rate than would otherwise be available from a typical bank for a comparable transaction. For the year ended December 31, 2021, none of the Portfolios participated in this program.
Note 10. Investment Concentration
The SA Wellington Strategic Multi-Asset Portfolio invests internationally, including in “emerging market” countries. Emerging market securities involve risks not typically associated with investing in securities of issuers in more developed markets. The markets of emerging market countries are typically more volatile and potentially less liquid than more developed countries. These securities may be denominated in currencies other than U.S. dollars. While investing internationally may reduce portfolio risk by increasing the diversification of portfolio investments, the value of the investment may be affected by fluctuating currency values, changing local and regional economic, political and social conditions, and greater market volatility.
Each Portfolio may invest in obligations issued by agencies and instrumentalities of the U.S. Government that may vary in the level of support they receive from the government. The government may choose not to provide financial support to government sponsored agencies or instrumentalities if it is not legally obligated to do so, and if the issuer defaults, a fund holding securities of such issuer might not be able to recover its investment from the U.S. Government. As a result of the SA Wellington Government and Quality Bond Portfolio concentration in such investments, this portfolio may be subject to risks associated with U.S. Government agencies or instrumentalities.
Note 11. Security Transactions with Affiliated Portfolios
The Portfolios are permitted to transfer securities by purchasing from and/or selling to other affiliated funds under certain conditions approved by the Board. The affiliated funds involved in such transactions must have a common investment adviser or investment advisers which are affiliated persons of each other, common Trustees, and/or common officers in compliance with Rule 17a-7 of the 1940 Act. Pursuant to the Act, such a transaction must be either a purchase or a sale, for no consideration other than cash payment against prompt delivery of the security at the current market price. No brokerage commission or fee (except for the customary transfer fees), or other remuneration is paid in connection with such transaction. For the year ended December 31, 2021, the following Portfolios engaged in security transactions with affiliated Portfolios:
Portfolio | Cost of Purchases | Proceeds from Sales | Realized Gain/(Loss) | |||||||||
SA Wellington Capital Appreciation | $ | 1,736,546 | $ | 1,094,920 | $ | (26,758 | ) | |||||
SA Wellington Strategic Multi-Asset | — | 75,420 | 92 | |||||||||
Note 12. Other Matters
The coronavirus pandemic and the related governmental and public responses have had and may continue to have an impact on the Portfolio’s investments and net asset value and have led and may continue to lead to increased market volatility and the potential for illiquidity in certain classes of securities and sectors of the market. Preventative or protective actions that governments may take in respect of pandemic or epidemic diseases may result in periods of business disruption, business closures, inability to obtain raw materials, supplies and component parts, and reduced or disrupted operations for the issuers in which the Portfolio invests. Government intervention in markets may impact interest rates, market volatility and security pricing. The occurrence, reoccurrence and pendency of such diseases could adversely affect the economies (including through changes in business activity and increased unemployment) and financial markets either in specific countries or worldwide.
Note 13. Portfolio Mergers
Pursuant to an Agreement and Plan of Reorganization, all of the assets and liabilities of the SA Columbia Technology Portfolio (a “Target Portfolio”), a series of SunAmerica Series Trust, were transferred in a tax-free exchange to the SA Wellington Capital Appreciation Portfolio (an “Acquiring Portfolio”), in exchange for shares of the SA Wellington Capital Appreciation Portfolio. The reorganization was consummated on November 8, 2021.
| ||
| 47 |
Table of Contents
The table below shows the following information for the Reorganization:
| • | The exchange ratio of shares of the Target Portfolio that were exchanged tax-free for shares of the Acquiring Portfolio. |
| • | The number and value of shares of the Acquiring Portfolio issued in connection with the acquisition of the Target Portfolio. |
| • | The value and identified cost as of the respective Reorganization Date of the assets in the investment portfolio of the Target Portfolio. These were the principal assets acquired by the Acquiring Portfolio. |
| Acquiring Portfolio | Target Portfolio | Exchange Ratio | Number of Shares Issued by Acquiring Portfolio | Value of Shares Issued by Acquiring Portfolio | Value of Assets in the Investment Portfolio of the Target Portfolio | Cost of Assets in the Investment Portfolio of the Target Portfolio | ||||||||||||||||
SA Wellington Capital Appreciation | SA Columbia Technology | $ | 236,965,300 | $ | 196,337,930 | |||||||||||||||||
Class 1 | 0.1603 | 492,840 | $ | 28,259,876 | ||||||||||||||||||
Class 2 | 0.1648 | 161,299 | $ | 8,419,089 | ||||||||||||||||||
Class 3 | 0.1682 | 4,284,431 | $ | 209,571,239 | ||||||||||||||||||
For financial statement purposes, assets received and shares issued by the Acquiring Portfolio were recorded at value; however, the cost basis of the investments received from the Target Portfolio was carried forward to align ongoing reporting of the Acquiring Portfolio’s realized and unrealized gains and losses with amounts distributable to shareholders for tax purposes.
The following is a summary of the shares outstanding, net assets, net asset value per share and net unrealized appreciation depreciation) immediately before and after the Reorganization:
| SA Wellington Capital Appreciation Portfolio | ||||||||||||||||
Target Portfolio | Shares Outstanding | Net Assets | Net Asset Value Per Share | Net Unrealized Appreciation (Depreciation) | ||||||||||||
SA Columbia Technology | ||||||||||||||||
Class 1 | 3,075,436 | $ | 28,259,876 | $ | 9.19 | $ | 6,565,106 | |||||||||
Class 2 | 978,964 | $ | 8,419,089 | $ | 8.60 | $ | 4,998,714 | |||||||||
Class 3 | 25,471,734 | $ | 209,571,239 | $ | 8.23 | $ | 29,063,550 | |||||||||
Acquiring Portfolio | Shares Outstanding | Net Assets | Net Asset Value Per Share | Net Unrealized Appreciation (Depreciation) | ||||||||||||
SA Wellington Capital Appreciation | ||||||||||||||||
Class 1 | 15,019,164 | $ | 861,211,506 | $ | 57.34 | $ | 264,189,520 | |||||||||
Class 2 | 1,230,585 | $ | 64,231,130 | $ | 52.20 | $ | 12,049,891 | |||||||||
Class 3 | 24,974,713 | $ | 1,221,630,351 | $ | 48.91 | $ | 131,727,803 | |||||||||
Post Reorganization | Shares Outstanding | Net Assets | Net Asset Value Per Share | Net Unrealized Appreciation (Depreciation) | ||||||||||||
SA Wellington Capital Appreciation Portfolio | ||||||||||||||||
Class 1 | 15,512,004 | $ | 889,471,381 | $ | 57.34 | $ | 270,754,626 | |||||||||
Class 2 | 1,391,884 | $ | 72,650,219 | $ | 52.20 | $ | 17,048,605 | |||||||||
Class 3 | 29,259,144 | $ | 1,431,201,590 | $ | 48.91 | $ | 160,791,353 | |||||||||
Assuming the Reorganization had been completed on January 1, 2021, the beginning of the reporting period for the Acquiring Portfolio, the unaudited pro forma results of operations for the period ended December 31, 2021, are as follows:
Acquiring Portfolio | Net Investment Income (loss) | Net Realized/ unrealized gains (losses) | Change in Net Assets Resulting from Operations | |||||||||
SA Wellington Capital Appreciation | $ | (14,317,524 | ) | $ | 153,024,738 | $ | 138,707,214 | |||||
Because the combined investment portfolio has been managed as a single integrated portfolio since the Reorganization was completed, it is not practicable to separate the amounts of revenue and earnings of the Target Portfolio that have been included in the Statement of Operations since the Reorganization Date.
| ||
| 48 |
Table of Contents
SUNAMERICA SERIES TRUST
| Period ended | Net Asset Value beginning of period | Net investment income (loss)(1) | Net realized & unrealized gain (loss) on investments | Total from investment operations | Dividends declared from net investment income | Distributions from net realized gain on investments | Total dividends and distributions | Net Asset Value end of period | Total Return(2) | Net Assets end of period (000’s) | Ratio of expenses to average net assets(3) | Ratio of net investment income (loss) to average net assets(3) | Portfolio turnover rate | |||||||||||||||||||||||||||||||||||||||
| SA Wellington Capital Appreciation Portfolio Class 1 |
| |||||||||||||||||||||||||||||||||||||||||||||||||||
| 12/31/17 | $ | 38.15 | $ | 0.02 | $ | 12.31 | $ | 12.33 | $ | — | $ | (3.72 | ) | $ | (3.72 | ) | $ | 46.76 | 32.78 | % | $ | 656,955 | 0.74 | % | 0.05 | % | 77 | % | ||||||||||||||||||||||||
| 12/31/18 | 46.76 | (0.11 | ) | 0.27 | 0.16 | — | (6.62 | ) | (6.62 | ) | 40.30 | (0.75 | ) | 706,136 | 0.74 | (0.23 | ) | 91 | ||||||||||||||||||||||||||||||||||
| 12/31/19 | 40.30 | (0.15 | ) | 11.88 | 11.73 | — | (8.43 | ) | (8.43 | ) | 43.60 | 31.17 | 709,996 | 0.74 | (0.31 | ) | 70 | |||||||||||||||||||||||||||||||||||
| 12/31/20 | 43.60 | (0.20 | ) | 27.70 | 27.50 | — | (6.30 | ) | (6.30 | ) | 64.80 | 64.53 | 873,694 | 0.74 | (0.39 | ) | 118 | |||||||||||||||||||||||||||||||||||
| 12/31/21(6) | 64.80 | (0.34 | ) | 4.29 | 3.95 | (4) | — | (15.42 | ) | (15.42 | ) | 53.33 | 5.63 | 812,818 | 0.73 | (0.53 | ) | 110 | (5) | |||||||||||||||||||||||||||||||||
| SA Wellington Capital Appreciation Portfolio Class 2 |
| |||||||||||||||||||||||||||||||||||||||||||||||||||
| 12/31/17 | 36.77 | (0.05 | ) | 11.85 | 11.80 | — | (3.72 | ) | (3.72 | ) | 44.85 | 32.57 | 50,028 | 0.89 | (0.11 | ) | 77 | |||||||||||||||||||||||||||||||||||
| 12/31/18 | 44.85 | (0.19 | ) | 0.30 | 0.11 | — | (6.62 | ) | (6.62 | ) | 38.34 | (0.90 | ) | 42,600 | 0.89 | (0.39 | ) | 91 | ||||||||||||||||||||||||||||||||||
| 12/31/19 | 38.34 | (0.21 | ) | 11.25 | 11.04 | — | (8.43 | ) | (8.43 | ) | 40.95 | 30.95 | 46,494 | 0.89 | (0.46 | ) | 70 | |||||||||||||||||||||||||||||||||||
| 12/31/20 | 40.95 | (0.27 | ) | 25.96 | 25.69 | — | (6.30 | ) | (6.30 | ) | 60.34 | 64.28 | 63,956 | 0.89 | (0.54 | ) | 118 | |||||||||||||||||||||||||||||||||||
| 12/31/21(6) | 60.34 | (0.40 | ) | 4.02 | 3.62 | (4) | — | (15.42 | ) | (15.42 | ) | 48.54 | 5.49 | 66,092 | 0.88 | (0.68 | ) | 110 | (5) | |||||||||||||||||||||||||||||||||
| SA Wellington Capital Appreciation Portfolio Class 3 |
| |||||||||||||||||||||||||||||||||||||||||||||||||||
| 12/31/17 | 35.87 | (0.09 | ) | 11.56 | 11.47 | — | (3.72 | ) | (3.72 | ) | 43.62 | 32.46 | 643,066 | 0.99 | (0.21 | ) | 77 | |||||||||||||||||||||||||||||||||||
| 12/31/18 | 43.62 | (0.23 | ) | 0.31 | 0.08 | — | (6.62 | ) | (6.62 | ) | 37.08 | (1.00 | ) | 549,342 | 0.99 | (0.49 | ) | 91 | ||||||||||||||||||||||||||||||||||
| 12/31/19 | 37.08 | (0.24 | ) | 10.85 | 10.61 | — | (8.43 | ) | (8.43 | ) | 39.26 | 30.84 | 655,204 | 0.99 | (0.56 | ) | 70 | |||||||||||||||||||||||||||||||||||
| 12/31/20 | 39.26 | (0.30 | ) | 24.84 | 24.54 | — | (6.30 | ) | (6.30 | ) | 57.50 | 64.11 | 938,153 | 0.99 | (0.64 | ) | 118 | |||||||||||||||||||||||||||||||||||
| 12/31/21(6) | 57.50 | (0.43 | ) | 3.83 | 3.40 | (4) | — | (15.42 | ) | (15.42 | ) | 45.48 | 5.37 | 1,375,583 | 0.98 | (0.79 | ) | 110 | (5) | |||||||||||||||||||||||||||||||||
| (1) | Calculated based upon average shares outstanding. |
| (2) | Total return does not reflect expenses that apply to the separate accounts of the Life Companies. If such expenses had been included, the total return would have been lower for each period presented. Total return includes expense reductions. |
| (3) | Excludes expense reductions. If these expense reductions had been applied, the ratio of expenses to average net assets would have been lower and the ratio of net investment income (loss) to average net assets would have been higher by the following (See Note 4): |
Portfolio | 12/31/17 | 12/31/18 | 12/31/19 | 12/31/20 | 12/31/21 | |||||||||||||||
SA Wellington Capital Appreciation Class 1 | 0.00 | % | 0.00 | % | 0.00 | % | 0.00 | % | 0.00 | % | ||||||||||
SA Wellington Capital Appreciation Class 2 | 0.00 | 0.00 | 0.00 | 0.00 | 0.00 | |||||||||||||||
SA Wellington Capital Appreciation Class 3 | 0.00 | 0.00 | 0.00 | 0.00 | 0.00 | |||||||||||||||
| (4) | Includes the effect of a merger. |
| (5) | Excludes purchases/sales due to merger. |
| (6) | Effective November 8, 2021, the Predecessor Portfolio was reorganized into the Portfolio (Acquiring Portfolio) (see Note 1). The performance and financial history prior to November 8, 2021 are that of the Predecessor Portfolio. |
See Notes to Financial Statements
| ||
| 49 |
Table of Contents
SUNAMERICA SERIES TRUST
FINANCIAL HIGHLIGHTS — (continued)
| Period ended | Net Asset Value beginning of period | Net investment income (loss)(1) | Net realized & unrealized gain (loss) on investments | Total from investment operations | Dividends declared from net investment income | Distributions from net realized gain on investments | Total dividends and distributions | Net Asset Value end of period | Total Return(2) | Net Assets end of period (000’s) | Ratio of expenses to average net assets | Ratio of net investment income (loss) to average net assets | Portfolio turnover rate | |||||||||||||||||||||||||||||||||||||||
| SA Wellington Government and Quality Bond Portfolio Class 1 |
| |||||||||||||||||||||||||||||||||||||||||||||||||||
| 12/31/17 | $ | 14.88 | $ | 0.28 | $ | 0.16 | $ | 0.44 | $ | (0.28 | ) | $ | — | $ | (0.28 | ) | $ | 15.04 | 2.97 | % | $ | 801,507 | 0.58 | % | 1.86 | % | 33 | % | ||||||||||||||||||||||||
| 12/31/18 | 15.04 | 0.34 | (0.34 | ) | 0.00 | (0.31 | ) | (0.01 | ) | (0.32 | ) | 14.72 | 0.04 | 777,915 | 0.57 | 2.28 | 16 | |||||||||||||||||||||||||||||||||||
| 12/31/19 | 14.72 | 0.35 | 0.73 | 1.08 | (0.41 | ) | — | (0.41 | ) | 15.39 | 7.32 | 869,709 | 0.57 | 2.29 | 43 | |||||||||||||||||||||||||||||||||||||
| 12/31/20 | 15.39 | 0.26 | 0.83 | 1.09 | (0.33 | ) | (0.02 | ) | (0.35 | ) | 16.13 | 7.11 | 1,063,081 | 0.57 | 1.59 | 41 | ||||||||||||||||||||||||||||||||||||
| 12/31/21(3) | 16.13 | 0.15 | (0.45 | ) | (0.30 | ) | (0.26 | ) | (0.26 | ) | (0.52 | ) | 15.31 | (1.86 | ) | 1,041,985 | 0.56 | 0.99 | 65 | |||||||||||||||||||||||||||||||||
| SA Wellington Government and Quality Bond Portfolio Class 2 |
| |||||||||||||||||||||||||||||||||||||||||||||||||||
| 12/31/17 | 14.90 | 0.26 | 0.16 | 0.42 | (0.25 | ) | — | (0.25 | ) | 15.07 | 2.85 | 27,824 | 0.72 | 1.72 | 33 | |||||||||||||||||||||||||||||||||||||
| 12/31/18 | 15.07 | 0.32 | (0.33 | ) | (0.01 | ) | (0.29 | ) | (0.01 | ) | (0.30 | ) | 14.76 | (0.08 | ) | 22,895 | 0.72 | 2.12 | 16 | |||||||||||||||||||||||||||||||||
| 12/31/19 | 14.76 | 0.33 | 0.73 | 1.06 | (0.38 | ) | — | (0.38 | ) | 15.44 | 7.19 | 21,489 | 0.72 | 2.14 | 43 | |||||||||||||||||||||||||||||||||||||
| 12/31/20 | 15.44 | 0.24 | 0.83 | 1.07 | (0.31 | ) | (0.02 | ) | (0.33 | ) | 16.18 | 6.92 | 22,787 | 0.72 | 1.46 | 41 | ||||||||||||||||||||||||||||||||||||
| 12/31/21(3) | 16.18 | 0.13 | (0.46 | ) | (0.33 | ) | (0.23 | ) | (0.26 | ) | (0.49 | ) | 15.36 | (2.03 | ) | 19,762 | 0.71 | 0.84 | 65 | |||||||||||||||||||||||||||||||||
| SA Wellington Government and Quality Bond Portfolio Class 3 |
| |||||||||||||||||||||||||||||||||||||||||||||||||||
| 12/31/17 | 14.83 | 0.24 | 0.17 | 0.41 | (0.24 | ) | — | (0.24 | ) | 15.00 | 2.78 | 751,516 | 0.82 | 1.62 | 33 | |||||||||||||||||||||||||||||||||||||
| 12/31/18 | 15.00 | 0.30 | (0.34 | ) | (0.04 | ) | (0.27 | ) | (0.01 | ) | (0.28 | ) | 14.68 | (0.24 | ) | 625,760 | 0.82 | 2.03 | 16 | |||||||||||||||||||||||||||||||||
| 12/31/19 | 14.68 | 0.31 | 0.73 | 1.04 | (0.37 | ) | — | (0.37 | ) | 15.35 | 7.06 | 665,250 | 0.82 | 2.04 | 43 | |||||||||||||||||||||||||||||||||||||
| 12/31/20 | 15.35 | 0.22 | 0.83 | 1.05 | (0.29 | ) | (0.02 | ) | (0.31 | ) | 16.09 | 6.88 | 732,226 | 0.82 | 1.36 | 41 | ||||||||||||||||||||||||||||||||||||
| 12/31/21(3) | 16.09 | 0.12 | (0.46 | ) | (0.34 | ) | (0.22 | ) | (0.26 | ) | (0.48 | ) | 15.27 | (2.10 | ) | 705,351 | 0.81 | 0.74 | 65 | |||||||||||||||||||||||||||||||||
| (1) | Calculated based upon average shares outstanding. |
| (2) | Total return does not reflect expenses that apply to the separate accounts of the Life Companies. If such expenses had been included, the total return would have been lower for each period presented. |
| (3) | Effective November 8, 2021, the Predecessor Portfolio was reorganized into the Portfolio (Acquiring Portfolio) (see Note 1). The performance and financial history prior to November 8, 2021 are that of the Predecessor Portfolio. |
See Notes to Financial Statements
| ||
| 50 |
Table of Contents
SUNAMERICA SERIES TRUST
FINANCIAL HIGHLIGHTS — (continued)
| Period ended | Net Asset Value beginning of period | Net investment income (loss)(1) | Net realized & unrealized gain (loss) on investments | Total from investment operations | Dividends declared from net investment income | Distributions from net realized gain on investments | Total dividends and distributions | Net Asset Value end of period | Total Return(2) | Net Assets end of period (000’s) | Ratio of expenses to average net assets(3)(4) | Ratio of net investment income (loss) to average net assets(3)(4) | Portfolio turnover rate | |||||||||||||||||||||||||||||||||||||||
| SA Wellington Strategic Multi-Asset Portfolio Class 1 |
| |||||||||||||||||||||||||||||||||||||||||||||||||||
| 12/31/17 | $ | 7.02 | $ | 0.07 | $ | 1.07 | $ | 1.14 | $ | (0.02 | ) | $ | — | $ | (0.02 | ) | $ | 8.14 | 16.26 | % | $ | 18,244 | 0.86 | % | 0.93 | % | 117 | % | ||||||||||||||||||||||||
| 12/31/18 | 8.14 | 0.05 | (0.65 | ) | (0.60 | ) | (0.10 | ) | (0.31 | ) | (0.41 | ) | 7.13 | (7.49 | ) | 15,202 | 0.86 | 0.61 | 83 | |||||||||||||||||||||||||||||||||
| 12/31/19 | 7.13 | 0.05 | 1.31 | 1.36 | (0.01 | ) | (0.00 | ) | (0.01 | ) | 8.48 | 19.08 | 15,509 | 0.86 | 0.62 | 105 | ||||||||||||||||||||||||||||||||||||
| 12/31/20 | 8.48 | 0.02 | 1.51 | 1.53 | (0.10 | ) | (0.12 | ) | (0.22 | ) | 9.79 | 18.12 | 17,048 | 0.86 | 0.18 | 105 | ||||||||||||||||||||||||||||||||||||
| 12/31/21(5) | 9.79 | (0.00 | ) | 0.74 | 0.74 | (0.03 | ) | (0.37 | ) | (0.40 | ) | 10.13 | 7.65 | 16,357 | 0.86 | (0.01 | ) | 85 | ||||||||||||||||||||||||||||||||||
| SA Wellington Strategic Multi-Asset Portfolio Class 3 |
| |||||||||||||||||||||||||||||||||||||||||||||||||||
| 12/31/17 | 7.01 | 0.03 | 1.10 | 1.13 | (0.02 | ) | — | (0.02 | ) | 8.12 | 16.08 | 13,231 | 1.11 | 0.43 | 117 | |||||||||||||||||||||||||||||||||||||
| 12/31/18 | 8.12 | 0.03 | (0.66 | ) | (0.63 | ) | (0.08 | ) | (0.31 | ) | (0.39 | ) | 7.10 | (7.81 | ) | 30,078 | 1.11 | 0.38 | 83 | |||||||||||||||||||||||||||||||||
| 12/31/19 | 7.10 | 0.03 | 1.31 | 1.34 | — | (0.00 | ) | (0.00 | ) | 8.44 | 18.88 | 50,779 | 1.11 | 0.35 | 105 | |||||||||||||||||||||||||||||||||||||
| 12/31/20 | 8.44 | (0.01 | ) | 1.50 | 1.49 | (0.08 | ) | (0.12 | ) | (0.20 | ) | 9.73 | 17.80 | 89,474 | 1.11 | (0.09 | ) | 105 | ||||||||||||||||||||||||||||||||||
| 12/31/21(5) | 9.73 | (0.03 | ) | 0.75 | 0.72 | (0.02 | ) | (0.37 | ) | (0.39 | ) | 10.06 | 7.47 | 138,205 | 1.11 | (0.27 | ) | 85 | ||||||||||||||||||||||||||||||||||
| (1) | Calculated based upon average shares outstanding. |
| (2) | Total return does not reflect expenses that apply to the separate accounts of the Life Companies. If such expenses had been included, the total return would have been lower for each period presented. Total return includes expense reimbursements (recoupments) and expense reductions. |
| (3) | Excludes expense reductions. If these expense reductions had been applied, the ratio of expenses to average net assets would have been lower and the ratio of net investment income (loss) to average net assets would have been higher by the following (See Note 4): |
Portfolio | 12/31/17 | 12/31/18 | 12/31/19 | 12/31/20 | 12/31/21 | |||||||||||||||
SA Wellington Strategic Multi-Asset Class 1 | 0.00 | % | 0.00 | % | 0.00 | % | 0.00 | % | 0.00 | % | ||||||||||
SA Wellington Strategic Multi-Asset Class 3 | 0.00 | 0.00 | 0.00 | 0.00 | 0.00 | |||||||||||||||
| (4) | Net of the following expense reimbursements/fee waivers (based on average net assets) (See Note 3): |
Portfolio | 12/31/17 | 12/31/18 | 12/31/19 | 12/31/20 | 12/31/21 | |||||||||||||||
SA Wellington Strategic Multi-Asset Class 1 | 0.86 | % | 0.60 | % | 0.50 | % | 0.44 | % | 0.32 | % | ||||||||||
SA Wellington Strategic Multi-Asset Class 3 | 0.86 | 0.58 | 0.51 | 0.44 | 0.32 | |||||||||||||||
| (5) | Effective November 8, 2021, the Predecessor Portfolio was reorganized into the Portfolio (Acquiring Portfolio) (see Note 1). The performance and financial history prior to November 8, 2021 are that of the Predecessor Portfolio. |
See Notes to Financial Statements
| ||
| 51 |
Table of Contents
SUNAMERICA SERIES TRUST
REPORT OF INDEPENDENT REGISTERED
PUBLIC ACCOUNTING FIRM
To the Board of Trustees of SunAmerica Series Trust and Shareholders of SA Wellington Capital Appreciation Portfolio, SA Wellington Government and Quality Bond Portfolio and SA Wellington Strategic Multi-Asset Portfolio.
Opinions on the Financial Statements
We have audited the accompanying statements of assets and liabilities, including the portfolios of investments, of SA Wellington Capital Appreciation Portfolio, SA Wellington Government and Quality Bond Portfolio and SA Wellington Strategic Multi-Asset Portfolio (three of the portfolios constituting SunAmerica Series Trust, hereafter collectively referred to as the “Portfolios”) as of December 31, 2021, the related statements of operations for the year ended December 31, 2021 and the statements of changes in net assets for each of the two years in the period ended December 31, 2021, including the related notes, and the financial highlights for each of the five years in the period ended December 31, 2021 (collectively referred to as the “financial statements”). In our opinion, the financial statements present fairly, in all material respects, the financial position of each of the Portfolios as of December 31, 2021, the results of each of their operations for the year then ended, the changes in each of their net assets for each of the two years in the period ended December 31, 2021 and each of the financial highlights for each of the five years in the period ended December 31, 2021 in conformity with accounting principles generally accepted in the United States of America.
Basis for Opinions
These financial statements are the responsibility of the Portfolios’ management. Our responsibility is to express an opinion on the Portfolios’ financial statements based on our audits. We are a public accounting firm registered with the Public Company Accounting Oversight Board (United States) (“PCAOB”) and are required to be independent with respect to the Portfolios in accordance with the U.S. federal securities laws and the applicable rules and regulations of the Securities and Exchange Commission and the PCAOB.
We conducted our audits of these financial statements in accordance with the standards of the PCAOB. Those standards require that we plan and perform the audit to obtain reasonable assurance about whether the financial statements are free of material misstatement, whether due to error or fraud.
Our audits included performing procedures to assess the risks of material misstatement of the financial statements, whether due to error or fraud, and performing procedures that respond to those risks. Such procedures included examining, on a test basis, evidence regarding the amounts and disclosures in the financial statements. Our audits also included evaluating the accounting principles used and significant estimates made by management, as well as evaluating the overall presentation of the financial statements. Our procedures included confirmation of securities owned as of December 31, 2021 by correspondence with the custodian, transfer agent and brokers; when replies were not received, we performed other auditing procedures. We believe that our audits provide a reasonable basis for our opinions.
/s/ PricewaterhouseCoopers LLP
Houston, Texas
February 25, 2022
We have served as the auditor of one or more investment companies in the SunAmerica annuity family of funds (consisting of SunAmerica Series Trust and Seasons Series Trust) since at least 1986. We have not been able to determine the specific year we began serving as auditor.
| ||
| 52 |
Table of Contents
SUNAMERICA SERIES TRUST
TRUSTEES AND OFFICERS INFORMATION (unaudited)
The following table contains information regarding the Trustees and Officers that oversee operations of the Portfolios and other investment companies within the Fund complex.
Name and Age† | Position Held | Term of | Principal Occupation(s) | Number of Portfolios in Fund Complex Overseen by Trustee(1) | Other Directorships | |||||||
Disinterested Trustees | ||||||||||||
| Garrett F. Bouton Age: 77 | Trustee | 2007 – Present | Retired (2003-Present); Managing Director and CEO, Barclays Global Investors (1996-2003). | 80 | Chairman/Director, The LECG Group (consulting services) (2006-2010). | |||||||
| Tracey C. Doi Age: 60 | Trustee | 2021 – Present | Chief Financial Officer of Toyota Motor North America(2000-Present); Board Member, City National Bank (2016-Present); Board Member, National Asian American Chamber of Commerce (2012-Present); Board Governor, Japanese American National Museum (2005-Present); Board Member, 2020 Women on Boards (nonprofit leadership organization) (2017-Present); Board Member, National Association of Corporate Directors, North Texas (nonprofit leadership organization) (2020-Present); Board Member, Quest Diagnostics Incorporated (2021-Present). | 80 | None | |||||||
| Jane Jelenko Age: 73 | Trustee | 2006 – Present | Retired Partner KPMG, LLP and Managing Director Bearingpoint, Inc. (formerly KPMG Consulting). (2003-Present). | 80 | Director, Countrywide Bank (2003-2008) and Director, Cathay General Bancorp and Cathay Bank (banking) (2012-Present). | |||||||
| Gilbert T. Ray Age: 76 | Trustee | 2001 – Present | Retired Partner, O’Melveny & Myers LLP (law firm) (2000-Present). | 80 | Director, Advanced Auto Parts, Inc. (retail, auto and home supply stores) (2002-2016); Director, Watson, Wyatt Worldwide (services — management consulting services) (2000-2009); Director Dine Equity (services — restaurant) (2004-Present); Director Diamond Rock Hospitality (financial — real estate) (2005-Present); Director, Towers Watson & Co. (services — management consulting services) (2010-2016). | |||||||
| Charles H. Self III Age: 63 | Trustee | 2021 - Present | Chief Operating Officer, Chief Compliance Officer and Chief Investment Officer of iSectors (2014-Present); Chief Investment Officer of Sumnicht & Associates (2014-Present). | 80 | ||||||||
| Bruce G. Willison Age: 73 | Trustee and Chairman | 2001 – Present | Professor of Management, Anderson School at UCLA (1999-2011); Dean, Anderson School at UCLA (1999-2005); co-founder, Grandpoint Capital, Inc. (2009-2010). | 80 | Director, GrandPoint Bank (banking). (2011-Present); Director, Indy Mac Bancorp (banking) (2003-2008); Director, Move, Inc. (internet real estate site) (2003-Present); Director, Healthnet International, Inc. (business services) (2000-2016). | |||||||
Interested Trustee | ||||||||||||
| John T. Genoy (2) Age:53 | President and Trustee | 2007 - Present | President, SAAMCo (Present); Chief Financial Officer, SAAMCo (2002-Present); Senior Vice President, SAAMCo (2004-Present); Chief Operating Officer, SAAMCo (2006-Present). | 80 | ||||||||
| ||
| 53 |
Table of Contents
SUNAMERICA SERIES TRUST
TRUSTEES AND OFFICERS INFORMATION (unaudited) — (continued)
Name and Age† | Position Held | Term of Office and Time Served(4) | Principal Occupation(s) During Past 5 Years | Number of Portfolios in Fund Complex Overseen by Officer(1) | Other Directorships Held by Officer(3) | |||||
Officers | ||||||||||
| Kathleen D. Fuentes Age: 52 | Chief Legal Officer, Vice President, and Secretary | 2015 – Present | Vice President and Deputy General Counsel, SAAMCo (2004-Present). | N/A | N/A | |||||
| Christopher C. Joe Age: 52 | Chief Compliance Officer and Vice President | 2017-Present | Chief Compliance Officer, AIG Funds, Seasons Series Trust, SunAmerica Series Trust and VALIC Company I (2017-Present); Chief Compliance Officer, VALIC Retirement Services Company (2017-Present); Chief Compliance Officer, Invesco Powershares (2012-2017); Chief Compliance Officer, Invesco Investment Advisers, LLC (2010- 2013); U.S. Compliance Director, Invesco, Ltd (2006-2014); Deputy Chief Compliance Officer, Invesco Advisers, Inc. (2014-2015). | N/A | N/A | |||||
Gregory N. Bressler Age: 55 | Vice President and Assistant Secretary | 2005 – Present | Senior Vice President and General Counsel, SAAMCo (2005-Present). | N/A | N/A | |||||
Gregory R. Kingston Age 55 | Treasurer | 2014 – Present | Vice President, SAAMCo (2001-Present); Head of Mutual Fund Administration (2014-Present). | N/A | N/A | |||||
Shawn Parry Age: 49 | Vice President and Assistant Treasurer | 2014 – Present | Vice President, SAAMCo (2014-Present); Assistant Vice President, SAAMCo (2005-2014). | N/A | N/A | |||||
Donna McManus Age: 60 | Vice President and Assistant Treasurer | 2014 – Present | Vice President, SAAMCo (2014-Present); Managing Director, BNY Mellon (2009-2014). | N/A | N/A | |||||
Matthew J. Hackethal Age: 50 | Anti-Money Laundering Compliance Officer | 2006 – Present | Acting Chief Compliance Officer (2016-2017); Chief Compliance Officer, SAAMCo (2006-Present) and Vice President, SAAMCo (2011 to Present). | N/A | N/A | |||||
| Salimah Shamji Age: 50 | Vice President | 2020 – Present | Vice President, SAAMCo (2008-Present). | N/A | N/A | |||||
| Christopher J. Tafone Age: 46 | Vice President and Assistant Secretary | 2021 – Present (Vice President); 2016 - Present (Assistant Secretary) | Vice President, SAAMCo (2016- Present); General Counsel, AIG Life & Retirement (2016-Present). | N/A | N/A | |||||
| † | The business address for each Trustee and Officer is 21650 Oxnard Street, 10th Floor, Woodland Hills, CA 91367. |
| (1) | The “Fund Complex” consists of all registered investment company portfolios for which SAAMCo serves as investment adviser or administrator. The “Fund Complex” includes the Trust (61 portfolios), Seasons Series Trust (19 portfolios) and VALIC Company I (37 portfolios). |
| (2) | Interested Trustee, as defined within the Investment Company Act of 1940, because he serves as President and COO of SunAmerica. |
| (3) | Directorships of companies required to report to the Securities and Exchange Commission under the Securities Exchange Act of 1934 (i.e. “Public Company”) registered under the 1940 Act. |
| (4) | Trustees serve until their successors are duly elected and qualified. Each officer will hold office for an indefinite term until the date he or she resigns or retires or until his/her successor is duly elected and qualifies. |
Additional information concerning the Trustees and Officers is contained in the Statement of Additional Information and is available without charge by calling (800) 445-7862.
| ||
| 54 |
Table of Contents
SUNAMERICA SERIES TRUST
SHAREHOLDERS TAX INFORMATION (unaudited)
Certain tax information regarding SunAmerica Series Trust is required to be provided to shareholders based upon each Portfolio’s income and capital gain distributions for the taxable year ended December 31, 2021.
During the year ended December 31, 2021, the Portfolios paid the following dividends per share along with the percentage of ordinary income dividends that qualified for the dividends received deductions for corporations:
Portfolio | Total Dividends | Net Investment Income | Net Short-Term Capital Gains* | Net Long-Term Capital Gains | Qualifying % for the Dividends Received Deductions | |||||||||||||||
SA Wellington Capital Appreciation Class 1 | $ | 15.42 | $ | — | $ | 8.20 | $ | 7.22 | 1.64 | % | ||||||||||
SA Wellington Capital Appreciation Class 2 | 15.42 | — | 8.20 | 7.22 | 1.64 | |||||||||||||||
SA Wellington Capital Appreciation Class 3 | 15.42 | — | 8.20 | 7.22 | 1.64 | |||||||||||||||
SA Wellington Government and Quality Bond Class 1 | 0.52 | 0.26 | 0.16 | 0.10 | — | |||||||||||||||
SA Wellington Government and Quality Bond Class 2 | 0.49 | 0.23 | 0.16 | 0.10 | — | |||||||||||||||
SA Wellington Government and Quality Bond Class 3 | 0.48 | 0.22 | 0.16 | 0.10 | — | |||||||||||||||
SA Wellington Strategic Multi-Asset Class 1 | 0.40 | 0.03 | 0.27 | 0.10 | 7.85 | |||||||||||||||
SA Wellington Strategic Multi-Asset Class 3 | 0.39 | 0.02 | 0.27 | 0.10 | 7.85 | |||||||||||||||
| * | Short-term capital gains are treated as ordinary income for tax purposes |
| ||
| 55 |
Table of Contents
COMPARISONS: PORTFOLIOS VS. INDEXES (unaudited)
As required by the Securities and Exchange Commission, the following graphs compare the performance of a $10,000 investment in each Portfolio to a $10,000 investment in a comparable securities index over the ten year period ended December 31, 2021. Importantly, such indices represent “paper” Portfolios and do not reflect the costs and expenses of actual investing. Following each graph is a discussion of portfolio performance and factors affecting performance over the year ended December 31, 2021.
The following graphs and tables show the performance of the Portfolios of the SunAmerica Series Trust and include all trust expenses, but no insurance company expenses associated with the variable annuity contract or variable life insurance policy, and no insurance company contingent deferred sales charge. No expenses are deducted from the performance of the indices. All dividends are assumed to be reinvested.
Market indices referenced are unmanaged. You cannot invest directly in an index. Investments in stocks and bonds are subject to risk, including stock market and interest-rate fluctuations. Investments in non-U.S. stocks are subject to additional risks, including political and social instability, differing securities regulations and accounting standards, and limited public information. Mortgage-backed securities are subject to prepayment, which can result in reinvestment of principal at lower yields. Money market instruments generally offer stability and income, but an investment in these securities, like investments in other Portfolios, is not guaranteed by the U.S. government or any other entity.
Past performance is no guarantee of future results.
Securities listed may or may not be a part of current Portfolio construction.
| ||
| 56 |
Table of Contents
Equity Portfolios
Wellington Management Company LLP
SA Wellington Capital Appreciation Portfolio — Class 1 (unaudited)
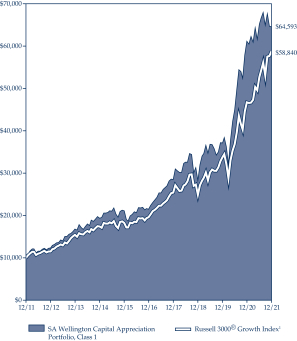
| SA Wellington Capital Appreciation Portfolio |
| |||||||||||
| Average Annual Total Returns as of 12/31/21 |
| |||||||||||
| Class 1* | Class 2* | Class 3* | ||||||||||
1-year | 5.63% | 5.49% | 5.37% | |||||||||
5-year | 24.61% | 24.43% | 24.30% | |||||||||
10-year | 20.51% | 20.33% | 20.21% | |||||||||
Since Inception | 13.83% | 11.90% | 14.63% | |||||||||
| * | Inception date for Class 1: 03/23/87; Class 2: 07/09/01; Class 3: 09/30/02 |
| 1 | The Russell 3000® Growth Index measures the performance of those Russell 3000® Index companies with higher price-to-book ratios and higher forecasted growth values. The stocks in this index are also members of either the Russell 1000® Growth or the Russell 2000® Growth Indices. |
Note: The performance data quoted represents past performance; past performance does not guarantee future results; the investment return and principal value of an investment will fluctuate so that an investor’s shares, when redeemed, may be worth more or less than their original cost; current performance may be lower or higher than the performance data quoted. Please visit aig.com/annuities for performance data current to the most recent month-end.
The SA Wellington Capital Appreciation Portfolio — Class 1 shares posted a return of 5.63% for the 12-month period ending December 31, 2021, compared to a 25.85% return for the Russell 3000® Growth Index.
Sector returns within the Index were positive in all 11 sectors during the year. Energy [+53.28%] and real estate [+35.56%] were the strongest performing sectors. Health care [+14.44%] and utilities [+15.44%] were bottom-performing sectors during the period.
Relative underperformance was driven by weak security selection, particularly within the information technology, communication services, and health care sectors. Within information technology, not holding Microsoft detracted from relative results along with the Portfolio’s underweight position in NVIDIA and overweight position in RingCentral. The Portfolio’s overweight positions in Arista Networks and Advanced Micro Devices contributed to relative results.
Sector allocation, a result of the Portfolio’s bottom-up stock selection process, also detracted from relative results, due to the Portfolio’s overweight to the consumer discretionary sector and underweight to the information technology sector. This was partially offset by the Portfolio’s underweight to the financials and industrials sectors.
The Portfolio ended the period most overweight the communication services and consumer discretionary sectors and most underweight the information technology and consumer staples sectors in relation to the Russell 3000® Growth Index.
Past performance is no guarantee of future results.
Securities listed may or may not be a part of current Portfolio construction.
| ||
| 57 |
Table of Contents
Fixed-Income Portfolios
Wellington Management Company LLP
SA Wellington Government and Quality Bond Portfolio — Class 1 (unaudited)
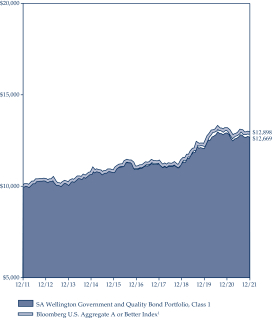
| SA Wellington Government and Quality Bond Portfolio | ||||||||||
| Average Annual Total Returns as of 12/31/21 | ||||||||||
| Class 1* | Class 2* | Class 3* | ||||||||
1-year | -1.86% | -2.03% | -2.10% | |||||||
5-year | 3.05% | 2.91% | 2.81% | |||||||
10-year | 2.39% | 2.25% | 2.15% | |||||||
Since Inception | 6.09% | 3.53% | 3.06% | |||||||
| * | Inception date for Class 1: 09/05/84; Class 2: 07/09/01; Class 3: 09/30/02 |
| 1 | The Bloomberg U.S. Aggregate A or Better Index is a subset of the Bloomberg U.S. Aggregate Bond Index and indices, which include index components for government and corporate bonds, agency mortgage pass-through securities, and asset-backed securities. However, the Bloomberg U.S. Aggregate A or Better Index excludes BBB bonds. |
Note: The performance data quoted represents past performance; past performance does not guarantee future results; the investment return and principal value of an investment will fluctuate so that an investor’s shares, when redeemed, may be worth more or less than their original cost; current performance may be lower or higher than the performance data quoted. Please visit aig.com/annuities for performance data current to the most recent month-end.
The SA Wellington Government and Quality Bond Portfolio — Class 1 shares posted a return of -1.86% for the 12-month period ending December 31, 2021, compared to a -1.74% return for the Bloomberg U.S. Aggregate A or Better Index.
On an absolute return basis, Treasuries [-2.32%] had mixed results relative to non-Treasury sectors: U.S. mortgage-backed securities (MBS) [-1.04%], commercial mortgage-backed securities (CMBS) [-1.16%], asset-backed securities (ABS) [-0.34%], and taxable municipals [+1.45%].
Within agency MBS, the Portfolio’s out-of-benchmark allocation to collateralized mortgage obligations (CMOs) detracted from relative returns. Within investment grade credit, the Portfolio’s underweight to and security selection within industrials detracted from relative performance.
Investment grade credit in aggregate contributed to relative performance due to a positive impact from an overweight to and security selection within taxable municipals, financials, and utilities. An underweight to and security selection within agency MBS contributed, particularly pass throughs. An out-of-benchmark allocation to collateralized loan obligations (CLOs) contributed. Security selection within CMBS also contributed. Net duration and yield curve positioning contributed to relative returns.
The Portfolio ended the year with the following approximate sector allocations: 38% U.S. government, 28% MBS, 25% credit, 5% ABS, 4% CMBS, and 0% cash and cash equivalents. From a quality standpoint, over 74% of the Portfolio’s assets at year-end were invested in securities rated AAA. The Portfolio ended the period with a modestly longer effective duration than the benchmark.
The Portfolio held exchange traded Treasury futures throughout the period to manage duration and yield curve positioning. On an absolute basis, Treasury futures contributed over the period.
Past performance is no guarantee of future results.
Securities listed may or may not be a part of current Portfolio construction.
| ||
| 58 |
Table of Contents
Balanced Portfolios
Wellington Management Company LLP
SA Wellington Strategic Multi-Asset Portfolio — Class 1 (unaudited)
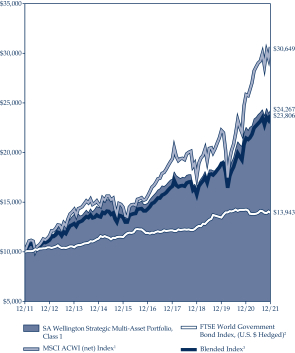
SA Wellington Strategic Multi-Asset Portfolio Average Annual Total Returns as of 12/31/21 |
| |||||||
| Class 1* | Class 3* | |||||||
1-year | 7.65% | 7.47% | ||||||
5-year | 10.25% | 10.00% | ||||||
10-year | 9.27% | N/A | ||||||
Since Inception | 8.03% | 9.24% | ||||||
| * | Inception date for Class 1: 03/23/87; Class 3: 09/26/16 |
| 1 | The MSCI ACWI (net) Index is a free-float adjusted market capitalization index that is designed to measure equity performance in the global developed and emerging markets and in 50 global and developed markets. MSCI uses an arbitrary sampling of stocks and aims to capture 85% of the total market capitalization at both the country and industry levels. The net index approximates the minimum possible dividend reinvestment and assumes that the dividend is reinvested after the deduction of withholding tax, applying the rate to nonresident individuals who do not benefit from double taxation treaties. |
| 2 | The FTSE World Government Bond Index (U.S. $ Hedged) measures the performance of fixed-rate investment grade sovereign bonds, currency hedged to the USD. The Index is a widely used benchmark that currently comprises sovereign debt from over 20 countries. The Index provides a broad benchmark for the global sovereign fixed income market. |
| 3 | The Blended Index consists of 65% MSCI ACWI (net) Index and 35% FTSE World Government Bond Index (U.S. $ Hedged) (the “Blended Index”). |
Note: The performance data quoted represents past performance; past performance does not guarantee future results; the investment return and principal value of an investment will fluctuate so that an investor’s shares, when redeemed, may be worth more or less than their original cost; current performance may be lower or higher than the performance data quoted. Please visit aig.com/annuities for performance data current to the most recent month-end.
The SA Wellington Strategic Multi-Asset Portfolio — Class 1 shares posted a return of 7.65% for the 12-month period ending December 31, 2021, compared to a 18.54% return for the MSCI ACWI (net) Index, a -2.29% return for the FTSE World Government Bond Index (U.S. $ Hedged), and a 10.95% return for the blended benchmark. The blended benchmark is comprised of 65% MSCI ACWI (net) Index and 35% FTSE World Government Bond Index (U.S. $ Hedged).
The global equity portion of the Portfolio underperformed the MSCI ACWI (net) Index for the year. Weak stock selection, primarily in the information technology sector, was the primary driver of relative underperformance. This was partially offset by stronger selection in the communication services, real estate, and materials sectors. From a regional perspective, stock selection within North America and Developed Europe & Middle East ex-United Kingdom detracted most while holdings in Japan contributed to relative performance. From a country perspective, stock selection in the United States and France detracted most while stock selection in Belgium and Japan contributed to relative performance. Sector allocation, a result of the bottom-up fundamental process, also detracted from relative returns. The Portfolio’s underweight position in the financials sector and overweight positions in the communication services and consumer discretionary sectors weighed on relative performance.
The global bond portion of the Portfolio outperformed the FTSE World Government Bond (U.S. $ Hedged) Index during the period. Active duration, currency, credit, and country strategies contributed to relative performance, while active yield curve strategies were neutral to results.
During the period, the Portfolio held currency forwards. When viewed in isolation, currency forwards contributed to the Portfolio’s absolute performance.
Past performance is no guarantee of future results.
Securities listed may or may not be a part of current Portfolio construction.
| ||
| 59 |
Table of Contents
APPROVAL OF ADVISORY AND SUBADVISORY AGREEMENTS
December 31, 2021 (unaudited)
At a meeting held on May 12, 2021, the Board of Trustees (the “Board”) of SunAmerica Series Trust (the “Trust”), including the Trustees who are not interested persons of the Trust, as defined in the Investment Company Act of 1940, as amended (the “Independent Trustees”), approved for an initial two-year term the Investment Advisory and Management Agreement between SunAmerica Asset Management, LLC (“SunAmerica” or the “Adviser”) and the Trust (the “Advisory Agreement”), on behalf of the SA Wellington Capital Appreciation Portfolio, SA Wellington Government and Quality Bond Portfolio and SA Wellington Strategic Multi-Asset Portfolio (each, a “Portfolio” and collectively, the “Portfolios), and the Subadvisory Agreement between SunAmerica and Wellington Management Company LLP (“Wellington” or the “Subadviser”) with respect to the Portfolios. In addition, the Board approved an Expense Limitation Agreement between SunAmerica and the Trust with respect to the SA Wellington Strategic Multi-Asset Portfolio, to be effective from the Portfolio’s inception through April 30, 2023. The Advisory Agreement, Subadvisory Agreement and Expense Limitation Agreement are referred to collectively herein as the “Advisory Contracts.”
The creation of the Portfolios was approved in connection with proposed reorganizations of the SA Wellington Capital Appreciation Portfolio, SA Wellington Government and Quality Bond Portfolio and SA Wellington Strategic Multi-Asset Portfolio, existing series of Anchor Series Trust (each such series, a “Target Fund”), into the Portfolios.
In connection with the approval of the Advisory Contracts, the Board received materials related to certain factors used in its consideration whether to approve the Advisory Contracts. Those factors included:
| (1) | the requirements of the Portfolios in the areas of investment supervisory and administrative services; |
| (2) | the nature, extent and quality of the investment advisory, administrative, operational and compliance services to be provided by SunAmerica, including a review of the potential performance of each Portfolio, and SunAmerica’s oversight of the Subadviser; |
| (3) | the size and structure of the investment advisory fee and any other material payments to be made to the Adviser and Subadviser and, in connection therewith, a review of the costs of services to be provided and the profits to be realized by the Adviser and its affiliates from the relationship with the Portfolios; |
| (4) | the expenses to be paid by the Portfolios, including each Portfolio’s expected total operating expenses and any applicable expense limitation; |
| (5) | the extent to which the Adviser realizes economies of scale and shares them with the Trust; |
| (6) | the organizational capability, resources, personnel and financial condition of the Adviser and Subadviser and their affiliates; and |
| (7) | the fees to be paid by the Adviser to the Subadviser for managing the Portfolios. |
In addition, the Board considered (a) the historical relationship between the Trust and SunAmerica; (b) the possibility that services of the type required by the Portfolios might be better obtained from other organizations; (c) the conditions and trends prevailing in the economy, the securities markets and the investment company industry; and (d) the reasonableness of the amount of the fee to be retained by the Adviser in light of the services to be provided by the Adviser and the Subadviser. The Board also took into account extensive information from SunAmerica and Wellington regarding their services provided to the Trust and Seasons Series Trust (together, the “Trusts”), which materials the Board reviewed at its October 7, 2020, meeting in connection with its consideration of the renewal of the Advisory and Subadvisory Agreements with respect to the Trusts’ existing portfolios (collectively, the “Existing Advisory Contracts”).
The Independent Trustees were separately represented by counsel that is independent of SunAmerica and the Subadviser in connection with their consideration of approval of the Advisory Contracts. The matters discussed below were also considered separately by the Independent Trustees in executive session during which their independent counsel provided guidance to the Independent Trustees.
The Board received information regarding each Portfolio’s proposed advisory and subadvisory fees compared to advisory and subadvisory fee rates of a group of funds with similar investment strategies and/or objectives, as applicable (respectively, the “Expense Group/Universe” and the “Subadvised Expense Group/Universe”), as selected and prepared by an independent third-party provider of investment company data. The Board also received performance data and expense information prepared by management.
Nature, Extent and Quality of Services.
The Board, including the Independent Trustees, considered the nature, quality and extent of services provided by SunAmerica to the Trust and to be provided by SunAmerica and Wellington to the Portfolios. In making its evaluation, the Board considered that
| ||
| 60 |
Table of Contents
SunAmerica will act as adviser for the Portfolios, manage the daily business affairs of the Trust, and obtain and evaluate economic, statistical and financial information to formulate and implement investment policies and provide oversight with respect to the daily management of the Portfolios’ assets allocated to the Subadviser, subject to the Trustees’ oversight and control. It was also noted that SunAmerica’s advisory fees will compensate SunAmerica for services such as monitoring Portfolio performance, selecting and replacing subadvisers, and ensuring that the Subadviser’s style adheres to the prospectus and statement of additional information as well as other administrative, compliance and legal services.
The Board noted that SunAmerica is responsible for overseeing the performance of services by the Trust’s custodian, transfer agent and dividend disbursing agent. The Board also noted that SunAmerica is responsible for the financial, legal and accounting records required to be maintained by the Portfolios and for the administration of the Trust’s business affairs, including providing such office space, bookkeeping, accounting, clerical, secretarial and administrative services (exclusive of, and in addition to, any such service provided by any others retained by the Trust or any of the Trust’s portfolios) and such executive and other personnel as may be necessary for the operations of the Portfolios. The Board considered that SunAmerica monitors and reviews the activities of third-party service providers that may provide additional administrative services.
In addition, the Board considered the key personnel of SunAmerica who will be involved in the investment management, administration, compliance and risk management activities with respect to the Portfolios. The Board also considered the compensation program for SunAmerica’s investment professionals.
With respect to the Subadviser, the Board noted that Wellington will be responsible for providing investment management services on a day-to-day basis. In such role, Wellington will (i) determine the securities to be purchased or sold and execute such documents on behalf of the Portfolios as may be necessary in connection therewith; (ii) provide SunAmerica with records concerning its activities; and (iii) render regular reports to SunAmerica and to officers and Trustees of the Trust concerning their discharge of the foregoing responsibilities. The Board reviewed the history, structure and size, and investment experience of the Subadviser. The Board considered the personnel of the Subadviser who will be involved in the investment management, administration, compliance and risk management activities with respect to the Portfolios, as well as current and projected staffing levels and compensation practices. The Board was informed that in management’s judgment, the Subadviser has the size, viability and resources to attract and retain highly qualified investment professionals.
The Board reviewed the qualifications, background and responsibilities of SunAmerica’s staff and the Subadviser’s staff who will be responsible for providing investment management services to the Portfolios and other key personnel of SunAmerica in addition to current and projected staffing levels and compensation practices.
The Board considered SunAmerica’s reputation and long-standing relationship with the Trust and considered the Trust’s relationship with affiliated life insurance companies that will offer the Portfolios through variable annuity and variable life insurance products. The Board considered SunAmerica’s experience in providing management and investment advisory and administrative services to advisory clients. The Board also considered SunAmerica’s code of ethics and its risk management process, and that SunAmerica has developed internal procedures, adopted by the Board, for monitoring compliance with the investment objectives, policies and restrictions of the Trust’s portfolios as set forth in the Trust’s registration statement.
The Board also reviewed and considered SunAmerica’s and the Subadviser’s compliance and regulatory history, including information about whether any were involved in any litigation, regulatory actions or investigations that could impair their ability to serve as an adviser or subadviser to the Portfolios. The Board considered SunAmerica’s and the Subadviser’s risk assessment and risk management processes. The Board concluded that there was no information provided that would have a material adverse effect on SunAmerica’s or the Subadviser’s ability to provide services to the Trust.
The Board concluded that it was satisfied with the nature, quality and extent of the services provided by or to be provided by SunAmerica and the Subadviser and that there was a reasonable basis on which to conclude that they would provide high quality services to the Trust.
Portfolio Fees and Expenses; Investment Performance.
The Board, including the Independent Trustees, noted that the proposed advisory and subadvisory fee schedules for each Portfolio are identical to the advisory and subadvisory fee schedules of the corresponding Target Fund. The Board received and reviewed information regarding each Portfolio’s proposed fees (actual or contractual management fees, subadvisory fees, non-management fees, and 12b-1 fees, if applicable) and expense ratios compared against such fees and expense ratios of the applicable Expense Group/Universe for the Portfolio. Such fees and expense ratios were compared both before and after expense waivers, caps and reimbursements, if any. It was noted that with respect to subadvisory fees, SunAmerica negotiates such fees at arm’s length. The Board also considered that the subadvisory fees will be paid by SunAmerica out of its advisory fee and not by the Portfolios, and that subadvisory fees may vary widely within a Subadvised Expense Group/Universe for various reasons, including market pricing demands, existing relationships, experience and success, and individual client needs. The Board further considered the amount of subadvisory fees to be paid out by SunAmerica and the amount of the management fees which it will retain and determined that these amounts were reasonable in light of the services to be performed by SunAmerica and the Subadviser, respectively.
| ||
| 61 |
Table of Contents
To assist in analyzing the reasonableness of the advisory and subadvisory fees, the Board received a report prepared independently by Broadridge Financial Solutions, Inc. (“Broadridge”) as well as information provided by management. The Board also considered advisory fees received by the Adviser and the Subadviser with respect to other mutual funds and accounts with similar investment strategies to the Portfolios each advises. Based on the information from Broadridge, the Board reviewed detailed information about peer groups of comparable mutual funds based on various factors such as the type of fund (those underlying variable insurance products), comparable investment objectives and strategies, among other factors. Referred to herein are Expense Groups and Performance Groups/Universes that represent those peer groups of funds used to compare expenses and performance, respectively. The Trustees noted that the expense information as a whole was useful in assessing whether SunAmerica and Wellington would be providing services at a cost that was competitive with other similar funds.
The Board considered that each Portfolio is expected to have the same investment objective and substantially similar strategies and portfolio management team as those of its corresponding Target Fund. The performance information was provided with respect to those Target Funds and included annualized returns for the period since inception and the one-, three-, five- and ten-year periods ended March 31, 2021 from Broadridge and performance information as of December 31, 2020 from management. On a quarterly basis, the Board will monitor and review various materials presented and prepared by management, including but not limited to each Portfolio’s overall performance, performance relative to the Portfolio’s benchmark and Morningstar and Broadridge peer groups and the Subadviser’s performance within the Portfolio. The Board considered that management will make particular note of any of the Trust’s portfolios that may require closer monitoring or potential corrective action by the Board.
As part of its review of the Portfolio’s proposed fees and expenses and similar fund performance, the Board considered information, including but not limited to the following expense and performance information, provided by Broadridge and management, in making its determinations.
| • | SA Wellington Capital Appreciation Portfolio. The Board considered that the Portfolio’s proposed actual management fees and total expenses were above the medians of its Expense Group. The Board took into consideration management’s discussion of the Portfolio’s proposed fees and expenses. |
The Board considered that the Target Fund outperformed its benchmark index for the one-, three-, five- and ten-year periods. The Board also noted that the Target Fund performed below the medians of its Performance Group for the same periods. The Board took into account management’s discussion of the Target Fund’s performance, including that past performance is not necessarily indicative of future results, and acknowledged that the actual results of the Portfolio may differ.
| • | SA Wellington Government and Quality Bond Portfolio. The Board considered that the Portfolio’s proposed actual management fees and total expenses were slightly above the medians of its Expense Group. The Board took into consideration management’s discussion of the Portfolio’s proposed fees and expenses. |
The Board considered that the Target Fund performed above its benchmark index for the one-, three-, five- and ten-year periods. The Board also considered that the Target Fund performed above the medians of its Performance Group for the one- and three-year periods and below those medians for the five- and ten-year periods. The Board took into account management’s discussion of the Target Fund’s performance, including that past performance is not necessarily indicative of future results, and acknowledged that the actual results of the Portfolio may differ.
| • | SA Wellington Strategic Multi-Asset Portfolio. The Board considered that the Portfolio’s proposed actual management fees and total expenses were above the medians of its Expense Group. The Board took into consideration management’s discussion of the Portfolio’s proposed fees and expenses and noted that, pursuant to an Expense Limitation Agreement, SunAmerica is proposing to waive its fees and/or reimburse expenses to the extent necessary to cap the Portfolio’s annual fund operating expenses at 0.86% and 1.11% for Class 1 shares and Class 3 shares, respectively, for the period from the Portfolio’s inception through April 30, 2023. |
The Board considered that the Target Fund performed below its benchmark index for the one-, three-, five- and ten-year periods. The Board also considered that the Target Fund performed below the medians of its Performance Group for the same periods. The Board took into account management’s discussion of the Target Fund’s performance, including that past performance is not necessarily indicative of future results, and acknowledged that the actual results of the Portfolio may differ.
In light of all the factors considered, the Board determined that the potential performance for the Portfolios should be satisfactory.
The Board noted that the expense and performance information as a whole was useful in assessing whether the Subadviser would provide services at a cost that was competitive with other similar funds.
Cost of Services & Benefits Derived.
With respect to indirect costs and benefits, the Board was informed, based on management’s judgment, that any indirect costs to be incurred by SunAmerica in connection with rendering investment advisory services to the Portfolios should be inconsequential to the analysis of the adequacy of the advisory fees, and that any collateral benefits to be derived as a result of providing advisory services to the Portfolios should be minimal and not impact the reasonableness of the advisory fee. The Board considered that SunAmerica is paid
| ||
| 62 |
Table of Contents
an administrative services fee of up to 0.04% of the average daily net asset value of the Trust’s portfolios pursuant to an arrangement between SunAmerica and certain affiliated life insurance companies (the “Life Companies”). The Board considered that the Trust also pays VALIC Retirement Services Company, an affiliate of SunAmerica, a fee for the provision of recordkeeping and shareholder services to contract owners and participants.
In connection with benefits derived from the Trust, the Board considered that the Life Companies may benefit as a result of their direct ownership of the Portfolios’ shares, which amounts may be significant. It was noted that in calculating their corporate income tax liability as insurance companies, the Life Companies, as corporate mutual fund shareholders, may exclude a portion of the ordinary dividends paid by underlying U.S. equities in the Portfolios to the same extent the Portfolios receive certain dividends with respect to shares of stock issued by domestic corporations, subject to applicable tax laws and regulations. In addition, the Life Companies may also rely on foreign tax credits with respect to certain foreign securities held by the Portfolios. Finally, the Board considered that the Life Companies receive financial support from SunAmerica for distribution-related activities, including administrative, marketing and other servicing activities, including payments to help offset costs for marketing activities and training (including training of registered representatives of AIG Capital Services, Inc., an affiliate of SunAmerica) to support sales of the Portfolios, as well as occasional gifts, entertainment or other compensation as incentives. It was noted that such payments may be derived from 12b-1 (service) fees that are deducted directly from the assets of the Portfolio or from investment management fees received by SunAmerica.
In addition, the Board considered that, because the Portfolios’ shares are offered as investment options through the variable annuity or life contracts issued by the Life Companies (the “Variable Contracts”), the investment objectives, strategies and performance of the Portfolios may positively or negatively impact a Life Company’s ability to hedge and the related hedging costs associated with guarantees that the Life Company may provide as the issuer of the Variable Contracts.
The Board concluded that any benefits that SunAmerica and its affiliates could be expected to receive with regard to providing investment advisory and other services to the Portfolios were reasonable.
Profitability and Economies of Scale.
The Board noted that the information provided by management and the Subadviser did not address economies of scale or the profitability of SunAmerica, the Subadviser and their affiliates with respect to their relationship with the Portfolios, because the Portfolios have not yet commenced operations and the Advisory Contracts are not yet in effect. The Board noted that it had received information related to SunAmerica’s profitability as well as the profitability of certain affiliates with respect to the services they provide to the Trusts’ existing portfolios in connection with its consideration of the renewal of the Existing Advisory Contracts. The Board further noted that it had determined that the profitability to SunAmerica in connection with its relationship to the Trust was reasonable.
It was noted, as mentioned above, that the subadvisory fees to be paid pursuant to the Subadvisory Agreement will be paid by SunAmerica out of the advisory fees that it will receive under the Advisory Agreement. The Trustees also relied on the ability of SunAmerica to negotiate the Subadvisory Agreement and the fees thereunder at arm’s length. It was noted that SunAmerica reviewed a number of factors in determining appropriate subadvisory fees payable to the Subadviser. Such factors included a review of (1) style class peers primarily within the variable annuity universe; (2) key competitor analysis; (3) portfolio analysis; and (4) special considerations such as competitor subaccount characteristics, uniqueness of the product and the manager’s prestige. The Board determined that the projected profitability to the Subadviser in connection with its relationship with the Portfolios is therefore not a material factor in its consideration of the Subadvisory Agreement.
The Board noted that it had previously received and considered information regarding economies of scale expected to be achieved by the Trust in connection with the consideration of the renewal of the Existing Advisory Contracts. It was noted that the advisory fees of the Portfolios contain breakpoints that will reduce the fees paid by each Portfolio as its assets increase. The Board also considered that SunAmerica has proposed contractual expense caps with respect to the SA Wellington Strategic Multi-Asset Portfolio, which was noted earlier in the discussion of fees. It was also noted that as a result of being part of a complex of mutual funds advised or administered by SunAmerica, the Trust is able to share common resources and may share certain expenses, which could result in the Portfolios experiencing lower expenses than they otherwise would achieve if the Trust were a stand-alone entity. The Board concluded that any potential economies of scale would be shared between the Trust and SunAmerica in an appropriate manner.
The Board considered that the Subadvisory Agreement also contains breakpoints in the fee schedules, however, since SunAmerica, and not the Trust, will be responsible for the payment of the fees pursuant to the Subadvisory Agreement, the Trust will not directly benefit from any reduction in subadvisory fee rates. For similar reasons as stated above with respect to the Subadviser’s potential profitability and its costs of providing services, the Board concluded that the potential for economies of scale in the Subadviser’s management of the Portfolios are not a material factor in its consideration at this time.
Terms of Advisory Contracts.
The Board, including the Independent Trustees, reviewed the terms of the Advisory Contracts including the duties and responsibilities to be undertaken by SunAmerica and the Subadviser as discussed above. The Board considered that SunAmerica will pay all of its own expenses in connection with the performance of its duties, as well as the salaries, fees and expenses of the officers of the Trust who are employees of SunAmerica. The Board also reviewed the terms of payment for services to be rendered and noted that SunAmerica will
| ||
| 63 |
Table of Contents
compensate the Subadviser out of the fees it receives from the Trust. The Board noted that the Subadvisory Agreement provides that the Subadviser will pay all of its own expenses in connection with the performance of its duties as well as the cost of maintaining the staff and personnel as necessary for it to perform its obligations. The Board also considered other terms and conditions of the Advisory Contracts.
Conclusions.
In reaching its decision to recommend the approval of the Advisory Contracts, the Board did not identify any single factor as being controlling, but based its recommendation on each of the factors it considered and each Trustee attributes different weight to the various factors. Based upon the materials it reviewed, the representations made to it and the considerations described above, and as part of its deliberations, the Board, including the Independent Trustees, concluded that SunAmerica and the Subadviser each possess the capability and resources to perform the duties required of it under its respective Advisory Contract.
Further, based upon its review of the Advisory Contracts, the materials provided, and the considerations described above, the Board, including the Independent Trustees, concluded that: (1) the terms of the Advisory Contracts are reasonable, fair and will be in the best interest of the Portfolios and their respective shareholders, and (2) the advisory fee rates and subadvisory fee rates are fair and reasonable in light of the usual and customary charges made for services of the same nature and quality and the other factors considered.
| ||
| 64 |
Table of Contents
VOTING PROXIES ON TRUST PORTFOLIO SECURITIES
A description of the policies and procedures that the Trust uses to determine how to vote proxies related to securities held in the Trust‘s Portfolios which is available in the Trust‘s Statement of Additional Information, may be obtained without charge upon request, by calling (800) 445-SUN2. This information is also available from the EDGAR database on the U.S. Securities and Exchange Commission‘s website at http://www.sec.gov.
PROXY VOTING RECORD ON TRUST PORTFOLIO SECURITIES
Information regarding how the SunAmerica Series Trust Portfolios voted proxies relating to securities held in the Trust‘s Portfolios during the most recent twelve month period ended June 30 is available, once filed with the U.S. Securities and Exchange Commission, without charge, upon request, by calling (800) 445-SUN2 or on the U.S. Securities and Exchange Commission‘s website at http://www.sec.gov.
DISCLOSURE OF QUARTERLY PORTFOLIO HOLDINGS
The Trust is required to file its complete schedule of portfolio holdings with the U.S. Securities and Exchange Commission for the first and third quarters of each fiscal year on Form N-PORT. The Trust’s Forms N-PORT are available on the U.S. Securities and Exchange Commission’s website at http://www.sec.gov.
This report is submitted solely for the general information of shareholders of the Trust. Distribution of this report to persons other than shareholders of the Trust is authorized only in connection with a currently effective prospectus, setting forth details of the Trust, which must precede or accompany this report.
| ||
| 65 |
Table of Contents
Annuity Service Center P.O. Box 15570 Amarillo, TX 79105-5570
CHANGE SERVICE REQUESTED |

THISREPORTISNOTAUTHORIZEDFORDISTRIBUTIONTOPROSPECTIVEPURCHASERSUNLESSACCOMPANIEDORPRECEDEDBYACURRENTPROSPECTUS.
G1112AR.18 (2/22)
Table of Contents
Item 2. Code of Ethics.
SunAmerica Series Trust (“the registrant”) has adopted a Code of Ethics applicable to its Principal Executive and Principal Accounting Officers pursuant to Section 406 of the Sarbanes-Oxley Act of 2002 (the “Code”). During the fiscal year ended December 31, 2021, there were no reportable waivers or implicit waivers to a provision of the Code that applies to the registrant’s Principal Executive and Principal Accounting Officers (the “Covered Officers”).
Item 3. Audit Committee Financial Expert.
The registrant’s Board of Trustees has determined that Garrett Bouton, Tracey C. Doi, Jane Jelenko and Charles H. Self III each qualify as audit committee financial experts, as defined in Item 3(b) of Form N-CSR. Messrs. Bouton and Self III and Mses. Doi and Jelenko are considered “independent” for purposes of Item 3(a)(2) of Form N-CSR.
Item 4. Principal Accountant Fees and Services.
| (a)-(d) | Aggregate fees billed to the registrant for the last two fiscal years for services rendered by the registrant’s principal accountant were as follows: |
| 2020 | 2021 | |||||||
(a) Audit Fees | $ | 109,247 | $ | 139,158 | ||||
(b) Audit-Related Fees | $ | 0 | $ | 0 | ||||
(c) Tax Fees | $ | 52,718 | $ | 24,343 | ||||
(d) All Other Fees | $ | 0 | $ | 0 | ||||
Audit Fees include amounts related to the audit of the registrant’s annual financial statements and services normally provided by the principal accountant in connection with statutory and regulatory filings. Tax Fees principally include tax compliance, tax advice, tax planning and preparation of tax returns.
Aggregate fees billed to the investment adviser and Adviser Affiliates (as defined below in Item 4 (e)) that are required to be pre-approved pursuant to paragraph (c)(7)(ii) of Rule 2-01 of Regulation S-X for the last two fiscal years for services rendered by the registrant’s principal accountant were as follows:
| 2020 | 2021 | |||||||
(b) Audit-Related Fees | $ | 0 | $ | 0 | ||||
(c) Tax Fees | $ | 0 | $ | 0 | ||||
(d) All Other Fees | $ | 309,361 | $ | 564,390 | ||||
| (e) | (1) The registrant’s audit committee pre-approves all audit services provided by the registrant’s principal accountant for the registrant and all non-audit services provided by the registrant’s principal accountant for the registrant, its investment adviser and any entity controlling, controlled by, or under common control with the investment adviser (“Adviser Affiliates”) that provides ongoing services to the registrant, if the engagement by the investment adviser or Adviser Affiliates relates directly to the operations and financial reporting of the registrant. The audit committee has not presently established any pre-approval policies and procedures that permit the pre-approval of the above services other than by the full audit committee. Certain de minimis exceptions are allowed for non-audit services in accordance with Rule 2-01(c)(7)(i)(C) of Regulation S-X as set forth in the registrant’s audit committee minutes. |
(2) No services included in (b)-(d) above in connection with fees billed to the registrant or the investment adviser or Adviser Affiliates were approved pursuant to paragraph (c)(7)(i)(C) of Rule 2-01 of Regulation S-X.
| (f) | Not applicable. |
| (g) | The aggregate fees billed for the most recent fiscal year and the preceding fiscal year by the registrant’s principal accountant for non-audit services rendered to the registrant, its investment adviser, and Adviser Affiliates that provide ongoing services to the registrant for 2020 and 2021 were $362,079 and $1,015,528, respectively. |
| (h) | Non-audit services rendered to the registrant’s investment adviser and any Adviser Affiliates that provides ongoing services to the registrant that were not pre-approved pursuant to paragraph (c)(7)(ii) of Rule 2-01 of Regulation S-X were considered by the registrant’s audit committee as to whether they were compatible with maintaining the principal accountant’s independence. |
Item 5. Audit Committee of Listed Registrants.
Not applicable.
Item 6. Investments.
Included in Item 1 to the Form.
Table of Contents
Item 7. Disclosure of Proxy Voting Policies and Procedures for Closed-End Management Investment Companies.
Not applicable.
Item 8. Portfolio Managers of Closed-End Management Investment Companies.
Not applicable.
Item 9. Purchases of Equity Securities by Closed-End Management Investment Company and Affiliated Purchasers.
Not applicable.
Item 10. Submission of Matters to a Vote of Security Holders.
There were no material changes to the procedures by which shareholders may recommend nominees to the registrant’s Board of Trustees that were implemented after the registrant last provided disclosure in response to the requirements of Item 407(c)(2)(iv) of Regulation S-K (17 CFR 229.407) (as required by item 22(b)(15)) of Schedule 14A (17 CFR 240.14a-101), or this Item 10.
Item 11. Controls and Procedures.
(a) An evaluation was performed within 90 days of the filing of this report, under the supervision and with the participation of the registrant’s management, including the President and Treasurer, of the effectiveness of the design and operation of the registrant’s disclosure controls and procedures (as defined under Rule 30a-3(c) under the Investment Company Act of 1940 (17 CFR 270.30a-3(c))). Based on that evaluation, the registrant’s management, including the President and Treasurer, concluded that the registrant’s disclosure controls and procedures are effective.
(b) There was no change in the registrant’s internal control over financial reporting (as defined in Rule 30a-3(d) under the Investment Company Act of 1940 (17 CFR 270.30a-3(d))) that occurred during the period covered by this report that has materially affected, or is reasonably likely to materially affect, the registrant’s internal control over financial reporting.
Table of Contents
Item 12. Disclosure of Securities Lending Activities for Closed-End Management Investment Companies.
Not applicable. |
Item 13. Exhibits.
| (a) |
(3) Not applicable.
(4) Not applicable.
| (b) |
SIGNATURES
Pursuant to the requirements of the Securities Exchange Act of 1934 and the Investment Company Act of 1940, the registrant has duly caused this report to be signed on its behalf by the undersigned, thereunto duly authorized.
| SunAmerica Series Trust | ||
| By: | /s/ John T. Genoy | |
| John T. Genoy | ||
| President | ||
Date: March 10, 2022
Pursuant to the requirements of the Securities Exchange Act of 1934 and the Investment Company Act of 1940, this report has been signed below by the following persons on behalf of the registrant and in the capacities and on the dates indicated.
| By: | /s/ John T. Genoy | |
| John T. Genoy | ||
| President | ||
Date: March 10, 2022
| By: | /s/ Gregory R. Kingston | |
Gregory R. Kingston | ||
| Treasurer | ||
Date: March 10, 2022