Washington, D.C. 20549
Erich M. Patten
Form N-CSR is to be used by management investment companies to file reports with the Commission not later than 10 days after the transmission to stockholders of any report that is required to be transmitted to stockholders under Rule 30e-1 under the Investment Company Act of 1940 (17 CFR 270.30e-1). The Commission may use the information provided on Form N-CSR in its regulatory, disclosure review, inspection, and policymaking roles.
A registrant is required to disclose the information specified by Form N-CSR, and the Commission will make this information public. A registrant is not required to respond to the collection of information contained in Form N-CSR unless the Form displays a currently valid Office of Management and Budget ("OMB") control number. Please direct comments concerning the accuracy of the information collection burden estimate and any suggestions for reducing the burden to Secretary, Securities and Exchange Commission, 450 Fifth Street, NW, Washington, DC 20549-0609. The OMB has reviewed this collection of information under the clearance requirements of 44 U.S.C. § 3507.
 | The Cutler Trust | |
SEMI-ANNUAL REPORT
December 31, 2010
(Unaudited)
CUTLER EQUITY FUND TABLE OF CONTENTS |
| | Page |
Letter to Shareholders | 3 |
Performance Information | 5 |
Portfolio Information | 6 |
Schedule of Investments | 7 |
Statement of Assets and Liabilities | 10 |
Statement of Operations | 11 |
Statements of Changes in Net Assets | 12 |
Financial Highlights | 13 |
Notes to Financial Statements | 14 |
About Your Fund’s Expenses | 19 |
Additional Information | 20 |
CUTLER EQUITY FUND LETTER TO SHAREHOLDERS |
To The Cutler Trust Shareholders:
Please find enclosed the contents of the Cutler Equity Fund’s (the “Fund”) semi-annual report dated December 31st, 2010. The S&P 500 Index finished 2010 with a second consecutive year of positive gains, returning 15.06% over the past 12 months. The Fund also had a strong showing, posting a 17.11% gain net of all fees and expenses. As always, Cutler Investment Counsel, LLC (“Cutler”) managed the portfolio using our dividend-based criteria. 2010’s outperformance can be attributed to strong stock selection and portfolio positioning that occurred during the previous volatile years.
We believe that investors should be cautious in the current environment. While equity valuations remain attractive versus other asset classes, introducing additional portfolio risk is not prudent at this time. Cutler believes that the most attractive values in today’s equity markets are in the high quality, dividend paying stocks that comprise the Fund’s portfolio. While at times more volatile assets such as small-capitalization stocks may appear attractive for investors, we believe there are potential challenges which make the more conservative approach prudent at this time. A few potential investment risks we are monitoring include:
| | • | An increase in inflation pressure. We have been advocating inflation as a potential risk for several years, but for many consumers it appears inflation has recently arrived. While inflation pressures are still moderate domestically, the fast growing Asian economies have experienced high single-digit inflation. Commodities were one of the best performing assets this past year. Gold prices were up nearly 30% in 2010. The UN index of food recently reached all-time highs. Oil is once again marching toward $100/barrel. Yet entering 2011, US-monetary policy was still dovish toward inflation as the Fed continues an inflationary monetary policy. Unfortunately, we believe the Fed will ultimately be successful in the pursuit of higher inflation. |
| | • | Rising interest rates. For investors, it is not a matter of “if” but “when” rates will rise. We believe that rising rates may occur by the end of 2011, a situation that may strain fixed income and real estate investments. While equities would be the most attractive investment in this situation, if the result was an economic slowdown, investors of equities could see a negative market reaction. |
| | • | Dollar weakness. While this has not been an investment risk lately, there are several economic trends that may put pressure on the dollar in the near future. The most obvious currency is the Chinese renminbi, which the US government continues to advocate strengthening versus the dollar. The current US Central Bank policy, coupled with the US budget crisis, creates an environment where investors may be less attracted to US currency. Strong economic growth could alleviate these concerns, but that growth has yet to emerge. |
While these risks may sound bleak, we are ultimately bullish on the US economy and the equity markets. The challenge for Cutler is to identify companies best situated to take advantage of these investment themes, and we believe the current portfolio is well-positioned to do so. Given our market outlook, we would remain advocates of the staid investment approach followed by the Cutler Equity Fund.
Thank you for your continued support.
Sincerely,
 |  |
Matthew C. Patten Chairman The Cutler Trust | Erich M. Patten Portfolio Manager Cutler Investment Counsel, LLC |
The views in this report were those of Cutler Investment Counsel, LLC as of December 31, 2010 and may not reflect their views on the date this report is first published or anytime thereafter. These views are intended to assist shareholders in understanding their investment in the Fund and do not constitute investment advice.
Before investing you should carefully consider the Fund’s investment objectives, risks, charges and expenses. This and other information is in the prospectus, a copy of which may be obtained by calling 1-800-228-8537. Please read the prospectus carefully before you invest. Past performance is not predictive of future performance. Investment results and principal value will fluctuate so that shares, when redeemed, may be worth more or less than their original cost. Current performance may be higher or lower than the performance data quoted. Performance data current to the most recent month-end, are available by calling 800-228-8537.
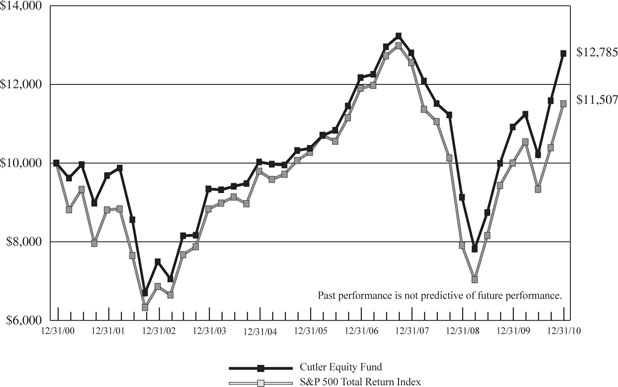
CUTLER EQUITY FUND PERFORMANCE INFORMATION December 31, 2010 (Unaudited) |
| Comparison of the Change in Value of a $10,000 Investment in |
| Cutler Equity Fund and the S&P 500 Total Return Index |
Average Annual Total Returns(a) (for periods ended December 31, 2010) |
| | 1 Year | 5 Years | 10 Years |
| Cutler Equity Fund | 17.11% | 4.27% | 2.49% |
| S&P 500 Total Return Index | 15.06% | 2.29% | 1.41% |
| (a) | Returns shown do not reflect the deduction of taxes a shareholder would pay on Fund distributions or the redemption of Fund shares. |
Cutler Equity Fund (the “Fund”) is managed pursuant to an equity income strategy. The investment adviser and Board of Trustees believe the S&P 500 Total Return Index is the most appropriate benchmark for the Fund due to its focus on large capitalization securities and broad index membership.
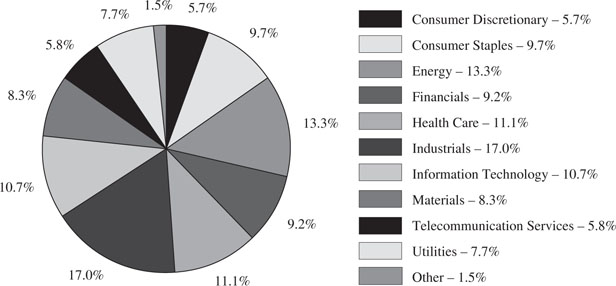
CUTLER EQUITY FUND PORTFOLIO INFORMATION December 31, 2010 (Unaudited) |
| Sector Allocation (% of Net Assets) |
CUTLER EQUITY FUND SCHEDULE OF INVESTMENTS December 31, 2010 (Unaudited) |
| | | | | |
| | | Consumer Discretionary — 5.7% | | | |
| | | Multiline Retail — 3.2% | | | |
| | 28,950 | | Nordstrom, Inc. | | $ | 1,226,901 | |
| | | | | | | | |
| | | | Specialty Retail — 2.5% | | | | |
| | 27,080 | | Home Depot, Inc. (The) | | | 949,425 | |
| | | | | | | | |
| | | | Consumer Staples — 9.7% | | | | |
| | | | Beverages — 2.8% | | | | |
| | 16,190 | | PepsiCo, Inc. | | | 1,057,693 | |
| | | | | | | | |
| | | | Food & Staples Retailing — 2.2% | | | | |
| | 28,350 | | Sysco Corp. | | | 833,490 | |
| | | | | | | | |
| | | | Food Products — 2.5% | | | | |
| | 32,475 | | Archer-Daniels-Midland Co. | | | 976,848 | |
| | | | | | | | |
| | | | Household Products — 2.2% | | | | |
| | 13,240 | | Kimberly-Clark Corp. | | | 834,650 | |
| | | | | | | | |
| | | | Energy — 13.3% | | | | |
| | | | Energy Equipment & Services — 3.8% | | | | |
| | 35,470 | | Halliburton Co. | | | 1,448,240 | |
| | | | | | | | |
| | | | Oil, Gas & Consumable Fuels — 9.5% | | | | |
| | 16,100 | | Chevron Corp. | | | 1,469,125 | |
| | 16,650 | | ConocoPhillips | | | 1,133,865 | |
| | 14,155 | | Exxon Mobil Corp. | | | 1,035,013 | |
| | | | | | | 3,638,003 | |
| | | | Financials — 9.2% | | | | |
| | | | Consumer Finance — 3.4% | | | | |
| | 30,115 | | American Express Co. | | | 1,292,536 | |
| | | | | | | | |
| | | | Insurance — 3.1% | | | | |
| | 20,140 | | Chubb Corp. (The) | | | 1,201,150 | |
| | | | | | | | |
| | | | Thrifts & Mortgage Finance — 2.7% | | | | |
| | 79,960 | | Hudson City Bancorp, Inc. | | | 1,018,690 | |
| | | | | | | | |
| | | | Health Care — 11.1% | | | | |
| | | | Health Care Equipment & Supplies — 2.9% | | | | |
| | 13,340 | | Becton, Dickinson and Co. | | | 1,127,497 | |
CUTLER EQUITY FUND SCHEDULE OF INVESTMENTS (Continued) |
| | COMMON STOCKS — 98.5% (Continued) | | | |
| | | Health Care — 11.1% (Continued) | | | |
| | | Pharmaceuticals — 8.2% | | | |
| | 40,240 | | Bristol-Myers Squibb Co. | | $ | 1,065,555 | |
| | 16,850 | | Johnson & Johnson | | | 1,042,172 | |
| | 28,130 | | Merck & Co., Inc. | | | 1,013,805 | |
| | | | | | | 3,121,532 | |
| | | | Industrials — 17.0% | | | | |
| | | | Aerospace & Defense — 6.1% | | | | |
| | 18,920 | | Honeywell International, Inc. | | | 1,005,787 | |
| | 16,850 | | United Technologies Corp. | | | 1,326,432 | |
| | | | | | | 2,332,219 | |
| | | | Electrical Equipment — 3.1% | | | | |
| | 20,700 | | Emerson Electric Co. | | | 1,183,419 | |
| | | | | | | | |
| | | | Machinery — 4.3% | | | | |
| | 17,620 | | Caterpillar, Inc. | | | 1,650,289 | |
| | | | | | | | |
| | | | Road & Rail — 3.5% | | | | |
| | 14,680 | | Union Pacific Corp. | | | 1,360,249 | |
| | | | | | | | |
| | | | Information Technology — 10.7% | | | | |
| | | | IT Services — 4.0% | | | | |
| | 10,500 | | International Business Machines Corp. | | | 1,540,980 | |
| | | | | | | | |
| | | | Semiconductors & Semiconductor Equipment — 6.7% | | | | |
| | 52,000 | | Intel Corp. | | | 1,093,560 | |
| | 45,130 | | Texas Instruments, Inc. | | | 1,466,725 | |
| | | | | | | 2,560,285 | |
| | | | Materials — 8.3% | | | | |
| | | | Chemicals — 6.1% | | | | |
| | 30,720 | | E.I. du Pont de Nemours and Co. | | | 1,532,314 | |
| | 11,380 | | Monsanto Co. | | | 792,503 | |
| | | | | | | 2,324,817 | |
| | | | Metals & Mining — 2.2% | | | | |
| | 19,335 | | Nucor Corp. | | | 847,260 | |
| | | | | | | | |
| | | | Telecommunication Services — 5.8% | | | | |
| | | | Diversified Telecommunication Services — 5.8% | | | | |
| | 37,305 | | AT&T, Inc. | | | 1,096,021 | |
| | 31,705 | | Verizon Communications, Inc. | | | 1,134,405 | |
| | | | | | | 2,230,426 | |
| | | | Utilities — 7.7% | | | | |
| | | | Gas Utilities — 4.3% | | | | |
| | 24,920 | | National Fuel Gas Co. | | | 1,635,250 | |
CUTLER EQUITY FUND SCHEDULE OF INVESTMENTS (Continued) |
| | COMMON STOCKS — 98.5% (Continued) | | | |
| | | Utilities — 7.7% (Continued) | | | |
| | | Multi-Utilities — 3.4% | | | |
| | 26,010 | | Consolidated Edison, Inc. | | $ | 1,289,316 | |
| | | | | | | | |
| | | | Total Common Stocks (Cost $26,825,129) | | $ | 37,681,165 | |
| | MONEY MARKET FUNDS — 1.4% | | | |
| | 546,653 | | Fidelity Institutional Money Market Portfolio - Select Class, 0.16% (a) (Cost $546,653) | | $ | 546,653 | |
| | | | | | | | |
| | | | Total Investments at Value — 99.9% (Cost $27,371,782) | | $ | 38,227,818 | |
| | | | | | | | |
| | | | Other Assets in Excess of Liabilities — 0.1% | | | 28,508 | |
| | | | | | | | |
| | | | Net Assets — 100.0% | | $ | 38,256,326 | |
| (a) | Variable rate security. The rate shown is the 7-day effective yield as of December 31, 2010. |
| | |
| See accompanying notes to financial statements. |
CUTLER EQUITY FUND STATEMENT OF ASSETS AND LIABILITIES December 31, 2010 (Unaudited) |
| ASSETS | | | |
| Investments in securities: | | | |
At acquisition cost | | $ | 27,371,782 | |
At value (Note 2) | | $ | 38,227,818 | |
Dividends receivable | | | 56,010 | |
Receivable for capital shares sold | | | 113,748 | |
Other assets | | | 17,296 | |
Total assets | | | 38,414,872 | |
| | | | | |
| LIABILITIES | | | | |
Dividends payable | | | 113,664 | |
Payable for capital shares redeemed | | | 1,000 | |
Payable to Adviser (Note 3) | | | 25,875 | |
Payable to administrator (Note 3) | | | 6,000 | |
Other accrued expenses | | | 12,007 | |
Total liabilities | | | 158,546 | |
| | | | | |
NET ASSETS | | $ | 38,256,326 | |
| | | | | |
| NET ASSETS CONSIST OF: | | | | |
Paid-in capital | | $ | 39,612,628 | |
Accumulated undistributed net investment income | | | 1,968 | |
| Accumulated net realized losses from security transactions | | | (12,214,306 | ) |
Net unrealized appreciation on investments | | | 10,856,036 | |
NET ASSETS | | $ | 38,256,326 | |
| | | | | |
Shares of beneficial interest outstanding (unlimited number of shares authorized,
no par value) | | | 3,352,939 | |
| | | | | |
| Net asset value, offering price and redemption price per share (Note 2) | | $ | 11.41 | |
| See accompanying notes to financial statements. |
CUTLER EQUITY FUND STATEMENT OF OPERATIONS For the Six Months Ended December 31, 2010 (Unaudited) |
| INVESTMENT INCOME | | | |
Dividend income | | $ | 502,338 | |
| | | | | |
| EXPENSES | | | | |
Investment advisory fees (Note 3) | | | 131,881 | |
Administration fees (Note 3) | | | 36,000 | |
Professional fees | | | 19,488 | |
Trustees’ fees and expenses | | | 15,228 | |
Registration fees | | | 8,994 | |
Insurance expense | | | 8,840 | |
Shareholder servicing fees (Note 3) | | | 7,667 | |
Custody and bank service fees | | | 6,635 | |
Printing of shareholder reports | | | 4,551 | |
Postage and supplies | | | 2,591 | |
Other expenses | | | 4,303 | |
Total expenses | | | 246,178 | |
| | | | | |
NET INVESTMENT INCOME | | | 256,160 | |
| | | | | |
| REALIZED AND UNREALIZED GAINS ON INVESTMENTS | | | | |
Net realized gains from investments | | | 352,120 | |
| Net change in unrealized appreciation/depreciation on investments | | | 7,155,151 | |
| NET REALIZED AND UNREALIZED GAINS ON INVESTMENTS | | | 7,507,271 | |
| | | | | |
| NET INCREASE IN NET ASSETS FROM OPERATIONS | | $ | 7,763,431 | |
| See accompanying notes to financial statements. |
CUTLER EQUITY FUND STATEMENTS OF CHANGES IN NET ASSETS |
| | Six Months Ended December 31, 2010 (Unaudited) | | | | |
| FROM OPERATIONS | | | | | | |
Net investment income | | $ | 256,160 | | | $ | 574,804 | |
Net realized gains (losses) from investments | | | 352,120 | | | | (237,993 | ) |
Net change in unrealized appreciation/
depreciation on investments | | | 7,155,151 | | | | 4,304,169 | |
Net increase in net assets from operations | | | 7,763,431 | | | | 4,640,980 | |
| | | | | | | | | |
| DISTRIBUTIONS TO SHAREHOLDERS | | | | | | | | |
From net investment income | | | (256,037 | ) | | | (583,288 | ) |
| | | | | | | | | |
| CAPITAL SHARE TRANSACTIONS | | | | | | | | |
Proceeds from shares sold | | | 3,143,010 | | | | 3,908,041 | |
Net asset value of shares issued in reinvestment
of distributions to shareholders | | | 256,001 | | | | 574,993 | |
Payments for shares redeemed | | | (3,765,263 | ) | | | (5,015,169 | ) |
Net decrease from capital share transactions | | | (366,252 | ) | | | (532,135 | ) |
| | | | | | | | | |
TOTAL INCREASE IN NET ASSETS | | | 7,141,142 | | | | 3,525,557 | |
| | | | | | | | | |
| NET ASSETS | | | | | | | | |
Beginning of period | | | 31,115,184 | | | | 27,589,627 | |
End of period | | $ | 38,256,326 | | | $ | 31,115,184 | |
| | | | | | | | | |
ACCUMULATED UNDISTRIBUTED NET
INVESTMENT INCOME | | $ | 1,968 | | | $ | 1,845 | |
| | | | | | | | | |
| CAPITAL SHARE ACTIVITY | | | | | | | | |
Shares sold | | | 293,028 | | | | 401,859 | |
Shares reinvested | | | 23,688 | | | | 60,214 | |
Shares redeemed | | | (354,373 | ) | | | (518,336 | ) |
Net decrease in shares outstanding | | | (37,657 | ) | | | (56,263 | ) |
Shares outstanding at beginning of period | | | 3,390,596 | | | | 3,446,859 | |
Shares outstanding at end of period | | | 3,352,939 | | | | 3,390,596 | |
| See accompanying notes to financial statements. |
CUTLER EQUITY FUND FINANCIAL HIGHLIGHTS |
Per Share Data for a Share Outstanding Throughout Each Period | |
| | | Six Months Ended Dec. 31, 2010 | | | | |
| | | | | | | | | | | | | | | | | | | |
| Net asset value at beginning of period | | $ | 9.18 | | | $ | 8.00 | | | $ | 10.80 | | | $ | 12.34 | | | $ | 10.46 | | | $ | 9.75 | |
| | | | | | | | | | | | | | | | | | | | | | | | | |
| Income (loss) from investment operations: | | | | | | | | | | | | | | | | | | | | | | | | |
| Net investment income | | | 0.08 | | | | 0.17 | | | | 0.21 | | | | 0.18 | | | | 0.16 | | | | 0.15 | |
Net realized and unrealized gains
(losses) on investments | | | 2.23 | | | | 1.18 | | | | (2.80 | ) | | | (1.54 | ) | | | 1.88 | | | | 0.71 | |
| Total from investment operations | | | 2.31 | | | | 1.35 | | | | (2.59 | ) | | | (1.36 | ) | | | 2.04 | | | | 0.86 | |
| | | | | | | | | | | | | | | | | | | | | | | | | |
| Less distributions from: | | | | | | | | | | | | | | | | | | | | | | | | |
| Net investment income | | | (0.08 | ) | | | (0.17 | ) | | | (0.21 | ) | | | (0.18 | ) | | | (0.16 | ) | | | (0.15 | ) |
| | | | | | | | | | | | | | | | | | | | | | | | | |
| Net asset value at end of period | | $ | 11.41 | | | $ | 9.18 | | | $ | 8.00 | | | $ | 10.80 | | | $ | 12.34 | | | $ | 10.46 | |
| | | | | | | | | | | | | | | | | | | | | | | | | |
Total return (a) | | | 25.18% | (b) | | | 16.82% | | | | (24.06% | ) | | | (11.13% | ) | | | 19.59% | | | | 8.86% | |
| | | | | | | | | | | | | | | | | | | | | | | | | |
| Net assets at end of period (000’s) | | $ | 38,256 | | | $ | 31,115 | | | $ | 27,590 | | | $ | 34,549 | | | $ | 40,512 | | | $ | 38,083 | |
| | | | | | | | | | | | | | | | | | | | | | | | | |
| Ratios/supplementary data: | | | | | | | | | | | | | | | | | | | | | | | | |
Ratio of net expenses to
average net assets (c) | | | 1.40% | (d) | | | 1.40% | | | | 1.40% | | | | 1.31% | | | | 1.30% | | | | 1.26% | |
| | | | | | | | | | | | | | | | | | | | | | | | | |
Ratio of net investment income
to average net assets | | | 1.46% | (d) | | | 1.76% | | | | 2.45% | | | | 1.48% | | | | 1.36% | | | | 1.44% | |
| | | | | | | | | | | | | | | | | | | | | | | | | |
Portfolio turnover rate | | | 2% | (b) | | | 13% | | | | 21% | | | | 13% | | | | 10% | | | | 21% | |
| (a) | Total return is a measure of the change in value of an investment in the Fund over the period covered, which assumes any dividends or capital gains distributions are reinvested in shares of the Fund. Returns shown do not reflect the deduction of taxes a shareholder would pay on Fund distributions or the redemption of Fund shares. |
| | |
| (b) | Not annualized. |
| | |
| (c) | Absent waivers by the Fund’s investment adviser, the ratio of total expenses to average net assets would have been 1.42% and 1.50% for the years ended June 30, 2010 and 2009, respectively (Note 3). |
| | |
| (d) | Annualized. |
| | |
| See accompanying notes to financial statements. |
CUTLER EQUITY FUND NOTES TO FINANCIAL STATEMENTS December 31, 2010 (Unaudited) |
Cutler Equity Fund (the “Fund”) is a diversified series of The Cutler Trust (the “Trust”). The Trust is a Delaware statutory trust that is registered as an open-end management investment company under the Investment Company Act of 1940. The Fund is the only series of the Trust. Under its Trust Instrument, the Trust is authorized to issue an unlimited number of Fund shares of beneficial interest without par value. The Fund commenced operations on October 2, 1992.
The Fund seeks current income and long-term capital appreciation.
| 2. | Significant Accounting Policies |
The following summarizes the significant accounting policies of the Fund:
Securities Valuation — Portfolio securities are valued as of the close of business of the regular session of the principal exchange where the security is traded. Exchange traded securities for which market quotations are readily available are valued using the last reported sales price provided by independent pricing services as of the close of trading on the New York Stock Exchange (normally 4:00 p.m. Eastern time), on each Fund business day. In the absence of a sale, such securities are valued at the mean of the last bid and asked price. Securities which are quoted by NASDAQ are valued at the NASDAQ Official Closing Price. Non-exchange traded securities for which over-the-counter quotations are available are generally valued at the mean between the closing bid and asked pr ices. Money market instruments that mature in sixty days or less may be valued at amortized cost unless the Fund’s investment adviser believes another valuation is more appropriate.
The Fund values securities at fair value pursuant to procedures adopted by the Board of Trustees if (1) market quotations are insufficient or not readily available or (2) the Fund’s investment adviser believes that the prices or values available are unreliable due to, among other things, the occurrence of events after the close of the securities markets on which the Fund’s securities primarily trade but before the time as of which the Fund calculates its net asset value. Fair valued securities will be classified as Level 2 or 3 within the fair value hierarchy, depending on the inputs used. Investments in money market funds have been valued at amortized cost, which approximates fair value absent unusual circumstances.
Accounting principles generally accepted in the United States (“GAAP”) establish a single authoritative definition of fair value, set out a framework for measuring fair value and require additional disclosures about fair value measurements.
Various inputs are used in determining the value of the Fund’s investments. These inputs are summarized in the three broad levels listed below:
| | • | Level 1 – quoted prices in active markets for identical securities |
| | • | Level 2 – other significant observable inputs |
| | • | Level 3 – significant unobservable inputs |
CUTLER EQUITY FUND NOTES TO FINANCIAL STATEMENTS (Continued) |
The inputs or methodology used for valuing securities are not necessarily an indication of the risks associated with investing in those securities. The inputs used to measure fair value may fall into different levels of the fair value hierarchy. In such cases, for disclosure purposes, the level in the fair value hierarchy within which the fair value measurement falls in its entirety is determined based on the lowest level input that is significant to the fair value measurement.
The following is a summary of the inputs used to value the Fund’s investments as of December 31, 2010 by security type:
| | | | | | | | | | | | |
Common Stocks | | $ | 37,681,165 | | | $ | — | | | $ | — | | | $ | 37,681,165 | |
Money Market Funds | | | 546,653 | | | | — | | | | — | | | | 546,653 | |
Total | | $ | 38,227,818 | | | $ | — | | | $ | — | | | $ | 38,227,818 | |
See the Fund’s Schedule of Investments for a listing of the common stocks valued using Level 1 inputs by industry type. During the six months ended December 31, 2010, the Fund did not have any significant transfers in and out of Level 1 or Level 2. There were no Level 2 or Level 3 securities or derivative instruments held in the Fund during the six months ended or as of December 31, 2010.
Share Valuation — The net asset value per share of the Fund is calculated daily by dividing the total value of the Fund’s assets, less liabilities, by the number of shares outstanding. The offering price and redemption price per share of the Fund is equal to the net asset value per share.
Estimates — The preparation of financial statements in conformity with GAAP requires management to make estimates and assumptions that affect the reported amounts of assets and liabilities and disclosures of contingent assets and liabilities at the date of the financial statements and the reported amounts of income and expenses during the reporting period. Actual results could differ from those estimates.
Security Transactions, Investment Income and Realized Gains and Losses — Investment transactions are accounted for on trade date. Dividend income is recorded on the ex-dividend date. Interest income is recorded as earned. Gains and losses on securities sold are determined on a specific identification basis.
Distributions to Shareholders — Distributions to shareholders of net investment income, if any, are declared and paid quarterly. Capital gain distributions, if any, are distributed to shareholders annually. Distributions are based on amounts calculated in accordance with applicable federal income tax regulations, which may differ from GAAP. These differences are due primarily to differing treatments of income and gains on various investment securities held by the Fund, timing differences and differing characterizations of distributions made by the Fund. Dividends and distributions are recorded on the ex-dividend date. The tax character of distributions paid during the periods ended December 31, 2010 and June 30, 2010 was ordinary income.
CUTLER EQUITY FUND NOTES TO FINANCIAL STATEMENTS (Continued) |
Federal Income Taxes — The Fund intends to comply with the special provisions of Subchapter M of the Internal Revenue Code applicable to regulated investment companies. As provided therein, in any fiscal year in which the Fund so qualifies and distributes at least 90% of its taxable net income, the Fund (but not the shareholders) will be relieved of federal income tax on income distributed. Accordingly, no provision for income taxes has been made.
In order to avoid imposition of the excise tax applicable to regulated investment companies, it is also the Fund’s intention to declare and pay as dividends in each calendar year at least 98% of its investment income (earned during the calendar year) and 98% of its net realized gains (earned during the twelve months ended October 31) plus undistributed amounts from prior years.
The following information is computed on a tax basis for each item as of December 31, 2010:
| Tax cost of portfolio investments | | $ | 27,392,824 | |
| Gross unrealized appreciation | | $ | 11,653,241 | |
| Gross unrealized depreciation | | | (818,247 | ) |
| Net unrealized appreciation | | | 10,834,994 | |
| Undistributed ordinary income | | | 1,968 | |
| Capital loss carryforwards | | | (12,513,909 | ) |
| Post-October losses | | | (40,238 | ) |
| Other gains | | | 360,883 | |
| Accumulated deficit | | $ | (1,356,302 | ) |
The difference between the federal income tax cost of portfolio investments and the financial statement cost is due to certain timing differences in the recognition of capital gains or losses under income tax regulations and GAAP. These “book/tax” differences are temporary in nature and are due to losses deferred due to wash sales.
As of June 30, 2010, the Fund had capital loss carryforwards of $12,513,909, of which $5,747,725 expires June 30, 2011, $2,687,016 expires June 30, 2012, $340,161 expires June 30, 2014 and $3,739,007 expires June 30, 2018. In addition, the Fund had net capital losses of $40,238 during the period November 1, 2009 through June 30, 2010 which are treated for federal income tax purposes as arising during the Fund’s tax year ending June 30, 2011. These capital loss carryforwards and “post-October” losses may be utilized in the current and future years to offset net realized capital gains, if any, prior to distributing such gains to shareholders.
The Fund recognizes the tax benefits or expenses of uncertain tax positions only when the position is “more-likely-than-not” to be sustained assuming examination by tax authorities. Management has reviewed the tax positions taken on Federal income tax returns for all open tax years (tax years ended June 30, 2006 though June 30, 2010) and has concluded that no provision for unrecognized tax benefits or expenses is required in these financial statements.
CUTLER EQUITY FUND NOTES TO FINANCIAL STATEMENTS (Continued) |
| 3. | Transactions with Affiliates |
Investment Adviser — Cutler Investment Counsel, LLC (the “Adviser”) is the investment adviser to the Fund. Pursuant to an Investment Advisory Agreement, the Fund pays the Adviser a fee, which is accrued daily and paid monthly, at an annual rate of 0.75% of the Fund’s average daily net assets.
Effective November 1, 2010, the Adviser undertook to limit the total operating expenses of the Fund to 1.40% of average daily net assets until November 1, 2011. Prior to November 1, 2010, the Adviser voluntarily undertook to limit the total operating expenses of the Fund to 1.40% of average daily net assets. No such waivers were necessary during the six months ended December 31, 2010.
Certain officers of the Trust are also officers of the Adviser.
Administration and Other Services — Under the terms of a Mutual Fund Services Agreement between the Trust and Ultimus Fund Solutions, LLC (“Ultimus”), Ultimus provides administrative, pricing, accounting, dividend disbursing, shareholder servicing and transfer agent services for the Fund. For these services, Ultimus receives a monthly fee from the Fund at an annual rate of 0.15% of the Fund’s average daily net assets up to $500 million; 0.125% on the next $500 million of such assets; and 0.10% on such assets in excess of $1 billion, subject to a minimum monthly fee of $6,000. In addition, the Fund pays out-of-pocket expenses including, but not limited to, postage, supplies and costs of pricing the Fund’s portfolio securities.
Certain officers of the Trust are also officers of Ultimus, or of Ultimus Fund Distributors, LLC, the principal underwriter of the Fund’s shares and an affiliate of Ultimus.
Shareholder Service Plan — The Fund may pay shareholder servicing fees not to exceed an annual rate of 0.25% of the Fund’s average daily net assets. These fees may be paid to various financial institutions that provide shareholder and account maintenance services.
| 4. | Securities Transactions |
The cost of purchases and proceeds from sales of investment securities, other than short-term investments, amounted to $834,273 and $1,424,988, respectively, during the six months ended December 31, 2010.
| 5. | Contingencies and Commitments |
The Fund indemnifies the Trust’s officers and Board of Trustees for certain liabilities that might arise from their performance of their duties to the Fund. Additionally, in the normal course of business the Fund enters into contracts that contain a variety of representations and warranties and which provide general indemnifications. The Fund’s maximum exposure under these arrangements is unknown, as this would involve future claims that may be made against the Fund that have not yet occurred. However, based on experience, the Fund expects the risk of loss to be remote.
CUTLER EQUITY FUND NOTES TO FINANCIAL STATEMENTS (Continued) |
| 6. | Recent Accounting Pronouncement |
In January 2010, the Financial Accounting Standards Board (“FASB”) issued Accounting Standards Update (“ASU”) No. 2010-06 “Improving Disclosures about Fair Value Measurements.” ASU No. 2010-06 amends FASB Accounting Standards Codification Topic 820, Fair Value Measurements and Disclosures, to require additional disclosures regarding fair value measurements. Certain disclosures required by ASU No. 2010-06 are effective for interim and annual reporting periods beginning after December 15, 2009 and others for fiscal years beginning after December 15, 2010 and for interim periods within those fiscal years. Management is currently evaluating the impact ASU No. 2010-06 will have on the Fund’s financial statement disclosures.
The Fund is required to recognize in the financial statements the effects of all subsequent events that provide additional evidence about conditions that existed as of the date of the Statement of Assets and Liabilities. For non-recognized subsequent events that must be disclosed to keep the financial statements from being misleading, the Fund is required to disclose the nature of the event as well as an estimate of its financial effect, or a statement that such an estimate cannot be made. Management has evaluated subsequent events through the issuance of these financial statements and has noted no such events.
CUTLER EQUITY FUND ABOUT YOUR FUND’S EXPENSES (Unaudited) |
We believe it is important for you to understand the impact of costs on your investment. As a shareholder of the Fund, you incur ongoing costs, including management fees and other Fund expenses. These ongoing costs, which are deducted from the Fund’s gross income, directly reduce the investment return of the Fund.
A mutual fund’s ongoing costs are expressed as a percentage of its average net assets. This figure is known as the expense ratio. The following examples are intended to help you understand the ongoing costs (in dollars) of investing in the Fund and to compare these costs with the ongoing costs of investing in other mutual funds. The examples below are based on an investment of $1,000 made at the beginning of the period shown (July 1, 2010) and held for the entire period (December 31, 2010).
The table below illustrates the Fund’s costs in two ways:
Actual Fund return – This section helps you to estimate the actual expenses that you paid over the period. The “Ending Account Value” shown is derived from the Fund’s actual return, and the third column shows the dollar amount of operating expenses that would have been paid by an investor who started with $1,000 in the Fund. You may use the information here, together with the amount you invested, to estimate the expenses that you paid over the period.
To do so, simply divide your account value by $1,000 (for example, an $8,600 account value divided by $1,000 = 8.6), then multiply the result by the number given for the Fund under the heading “Expenses Paid During Period.”
Hypothetical 5% return – This section is intended to help you compare the Fund’s ongoing costs with those of other mutual funds. It assumes that the Fund had an annual return of 5% before expenses during the period shown, but that the expense ratio is unchanged. In this case, because the return used is not the Fund’s actual return, the results do not apply to your investment. The example is useful in making comparisons because the Securities and Exchange Commission (the “SEC”) requires all mutual funds to calculate expenses based on a 5% return. You can assess the Fund’s ongoing costs by comparing this hypothetical example with the hypothetical examples that appear in shareholder reports of other funds.
Note that expenses shown in the table are meant to highlight and help you compare ongoing costs only. The Fund does not charge transaction fees, such as purchase or redemption fees, nor does it impose any sales loads.
The calculations assume no shares were bought or sold during the period. Your actual costs may have been higher or lower, depending on the amount of your investment and the timing of any purchases or redemptions.
CUTLER EQUITY FUND ABOUT YOUR FUND’S EXPENSES (Unaudited) (Continued) |
More information about the Fund’s expenses, including annual expense ratios over the past five years, can be found in this report. For additional information on operating expenses and other shareholder costs, please refer to the Fund’s prospectus.
| | | Beginning Account Value July 1, 2010 | | | Ending Account Value December 31, 2010 | | | Expenses Paid During Period* | |
| Based on Actual Fund Return | | $ | 1,000.00 | | | $ | 1,251.80 | | | $ | 7.95 | |
| Based on Hypothetical 5% Return (before expenses) | | $ | 1,000.00 | | | $ | 1,018.15 | | | $ | 7.12 | |
| * | Expenses are equal to the Fund’s annualized expense ratio of 1.40% for the period, multiplied by the average account value over the period, multiplied by 184/365 (to reflect the one-half year period). |
ADDITIONAL INFORMATION (Unaudited)
A description of the policies and procedures that the Fund uses to determine how to vote proxies relating to securities held in the Fund’s portfolio is available without charge, upon request, by calling 1-800-228-8537 or on the SEC’s website at http://www.sec.gov. Information regarding how the Fund voted proxies relating to portfolio securities during the most recent 12-month period ended June 30 is also available without charge upon request by calling 1-800-228-8537 or on the SEC’s website at http://www.sec.gov.
The Trust files a complete listing of the Fund’s portfolio holdings with the SEC as of the first and third quarters of each fiscal year on Form N-Q. The filings are available without charge, upon request, by calling 1-800-228-8537. Furthermore, you may obtain a copy of the filings on the SEC’s website at http://www.sec.gov. The Trust’s Forms N-Q may also be reviewed and copied at the SEC’s Public Reference Room in Washington, DC, and information on the operation of the Public Reference Room may be obtained by calling 1-800-SEC-0330.
This page intentionally left blank.
The registrant has not adopted procedures by which shareholders may recommend nominees to the registrant’s board of trustees.
(a) Based on their evaluation of the registrant’s disclosure controls and procedures (as defined in Rule 30a-3(c) under the Investment Company Act of 1940) as of a date within 90 days of the filing date of this report, the registrant’s principal executive officer and principal financial officer have concluded that such disclosure controls and procedures are reasonably designed and are operating effectively to ensure that material information relating to the registrant, including its consolidated subsidiaries, is made known to them by others within those entities, particularly during the period in which this report is being prepared, and that the information required in filings on Form N-CSR is recorded, processed, summarized, and reported on a timely basis.
(b) There were no changes in the registrant’s internal control over financial reporting (as defined in Rule 30a-3(d) under the Investment Company Act of 1940) that occurred during the second fiscal quarter of the period covered by this report that have materially affected, or are reasonably likely to materially affect, the registrant’s internal control over financial reporting.
File the exhibits listed below as part of this Form. Letter or number the exhibits in the sequence indicated.
(a)(1) Any code of ethics, or amendment thereto, that is the subject of the disclosure required by Item 2, to the extent that the registrant intends to satisfy the Item 2 requirements through filing of an exhibit: Not required
(a)(2) A separate certification for each principal executive officer and principal financial officer of the registrant as required by Rule 30a-2(a) under the Act (17 CFR 270.30a-2(a)): Attached hereto
(a)(3) Any written solicitation to purchase securities under Rule 23c-1 under the Act (17 CFR 270.23c-1) sent or given during the period covered by the report by or on behalf of the registrant to 10 or more persons: Not applicable
(b) Certifications required by Rule 30a-2(b) under the Act (17 CFR 270.30a-2(b)): Attached hereto
Pursuant to the requirements of the Securities Exchange Act of 1934 and the Investment Company Act of 1940, the registrant has duly caused this report to be signed on its behalf by the undersigned, thereunto duly authorized.
Pursuant to the requirements of the Securities Exchange Act of 1934 and the Investment Company Act of 1940, this report has been signed below by the following persons on behalf of the registrant and in the capacities and on the dates indicated.