| OMB APPROVAL |
OMB Number: 3235-0570 Expires: January 31, 2014 Estimated average burden hours per response: 20.6 |
UNITED STATES
SECURITIES AND EXCHANGE COMMISSION
Washington, D.C. 20549
FORM N-CSR
CERTIFIED SHAREHOLDER REPORT OF REGISTERED
MANAGEMENT INVESTMENT COMPANIES
Investment Company Act file number ___811-07242
(Exact name of registrant as specified in charter)
| 525 Bigham Knoll Jacksonville, Oregon | 97530 |
| (Address of principal executive offices) | (Zip code) |
Erich M. Patten
Cutler Investment Counsel, LLC 525 Bigham Knoll Jacksonville, Oregon 97530
(Name and address of agent for service)
Registrant's telephone number, including area code: (541) 770-9000
Date of fiscal year end: June 30, 2014
Date of reporting period: December 31, 2013
Form N-CSR is to be used by management investment companies to file reports with the Commission not later than 10 days after the transmission to stockholders of any report that is required to be transmitted to stockholders under Rule 30e-1 under the Investment Company Act of 1940 (17 CFR 270.30e-1). The Commission may use the information provided on Form N-CSR in its regulatory, disclosure review, inspection, and policymaking roles.
A registrant is required to disclose the information specified by Form N-CSR, and the Commission will make this information public. A registrant is not required to respond to the collection of information contained in Form N-CSR unless the Form displays a currently valid Office of Management and Budget ("OMB") control number. Please direct comments concerning the accuracy of the information collection burden estimate and any suggestions for reducing the burden to Secretary, Securities and Exchange Commission, 450 Fifth Street, NW, Washington, DC 20549-0609. The OMB has reviewed this collection of information under the clearance requirements of 44 U.S.C. § 3507.
Item 1. Reports to Stockholders.
CUTLER EQUITY FUND
CUTLER FIXED INCOME FUND
SEMI-ANNUAL REPORT
December 31, 2013
(Unaudited)
THE CUTLER TRUST TABLE OF CONTENTS |
| | Page |
| Letter to Shareholders | 2 |
| Performance Information | 4 |
| Portfolio Information | 6 |
| Schedules of Investments | 7 |
| Statements of Assets and Liabilities | 14 |
| Statements of Operations | 15 |
| Statements of Changes in Net Assets | 16 |
| Financial Highlights | 18 |
| Notes to Financial Statements | 20 |
| About Your Fund’s Expenses | 27 |
| Additional Information | 29 |
| Results of Special Meeting of Shareholders | 30 |
| Privacy Notice | 31 |
THE CUTLER TRUST LETTER TO SHAREHOLDERS |
To the Cutler Trust Shareholders:
This Semi-Annual Report includes performance, holdings, and other important information regarding your investment in the Cutler Equity Fund and the Cutler Fixed Income Fund as of December 31, 2013.
All of us at Cutler would like to thank the Trust shareholders for your support this past year. For equity investors, 2013 was a banner year. The Equity Fund was up over 29% net of all fees and expenses. While this return was slightly lower than the S&P 500 Index, it remains in-line with our overall strategy objective to maintain a less risky portfolio than the overall market. Conversely, bond investors experienced a rare year of negative returns in 2013 (the Fixed Income Fund returned -2.6%). This was not unexpected by most market participants; bonds entered the year at historically low-yields, which is a scenario that limits the potential returns for this asset class. The divergence of equity market returns and fixed income market returns emphasizes the importance of asset allocation for most investors. We continue to believe that for most individuals, bonds remain an important “insurance” policy for their retirement nest egg. Stocks may continue to climb, but carry far greater risk. If stocks should sell-off due to economic weakness or other exogenous factors, bonds are a likely beneficiary.
As we move into 2014, we would advise clients to review your asset allocation and rebalance as appropriate. The 10-year U.S. Treasury rose from 1.75% to 3.03% last year, a gain in yield of 1.28% and a total return of -7.81%. This relative rise in yield is less likely to be repeated in 2014. In our view, stocks remain the better long-term investment, especially in a period of very low interest rates, but also have much greater short-term risk.
Cutler’s equity strategy remains unchanged from last year. We will continue to focus on U.S. companies with at least a 10-year history of continuous dividend payments. We believe this is the best long-term approach for equity investors, and we are unwavering in our commitment to this staid portion of the stock market. For bond investors, we are increasing our search for quality CMBS (Commercial Mortgage Back Securities) for marginal yield improvements, and believe the best risk/reward to be in the 5-7 year portion of the yield curve. We feel that bonds will not have a similar retreat in 2014 that we experienced in 2013, despite the early indication that the Federal Reserve will reduce its bond purchase program, named QE3, by $10 billion a month.
Cutler is proud of our client service tradition, and would be happy to discuss the Cutler Trust or any questions you may have about your investment. Please feel free to give us a call if you would like a meeting or a conversation with our investment team.
Best regards,
 |  |
| Matthew Patten | Xavier Urpi |
| President | Director of Fixed Income |
THE CUTLER TRUST LETTER TO SHAREHOLDERS (Continued) |
Before investing you should carefully consider the Cutler Funds’ investment objectives, risks, charges and expenses. This and other information is in the prospectus, a copy of which may be obtained by calling 1-800-228-8537. Please read the prospectus carefully before you invest.
The views in this report were those of the Cutler Trust’s investment adviser as of December 31, 2013 and may not reflect its views on the date this report is first published or anytime thereafter. These views are intended to assist shareholders in understanding their investment in the Cutler Funds and do not constitute investment advice.
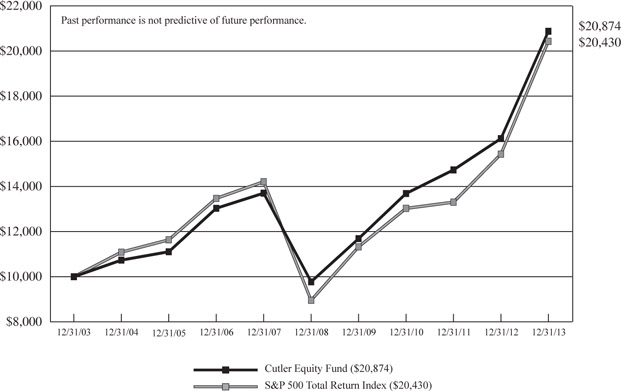
CUTLER EQUITY FUND PERFORMANCE INFORMATION December 31, 2013 (Unaudited) |
Comparison of the Change in Value of a $10,000 Investment in
Cutler Equity Fund and the S&P 500 Total Return Index
Average Annual Total Returns(a) (for periods ended December 31, 2013) |
| | | | | |
| Cutler Equity Fund | 29.48% | 16.39% | 7.64% | |
| S&P 500 Total Return Index | 32.39% | 17.94% | 7.41% | |
| | | | | | |
| (a) | Returns shown do not reflect the deduction of taxes a shareholder would pay on Fund distributions or the redemption of Fund shares. | |
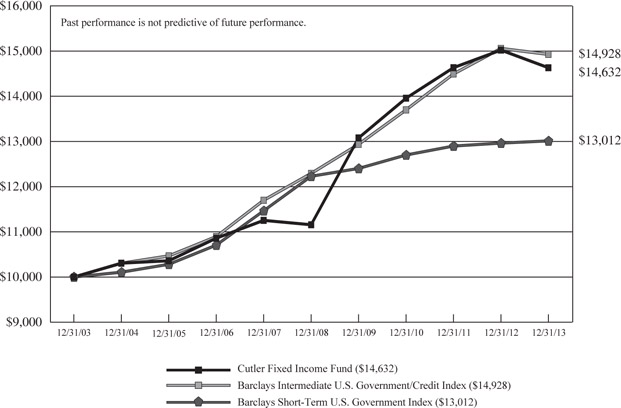
CUTLER FIXED INCOME FUND PERFORMANCE INFORMATION December 31, 2013 (Unaudited) |
Comparison of the Change in Value of a $10,000 Investment in
Cutler Fixed Income Fund, Barclays Intermediate U.S. Government/Credit Index and
Barclays Short-Term U.S. Government Index
Average Annual Total Returns(a) (for periods ended December 31, 2013) |
| | | | | |
| Cutler Fixed Income Fund | -2.60% | 5.57% | 3.88% | |
| Barclays Intermediate U.S. Government/Credit Index | -0.86% | 3.96% | 4.09% | |
| Barclays Short-Term U.S. Government Index | 0.37% | 1.25% | 2.67% | |
| | | | | | |
| (a) | Returns shown do not reflect the deduction of taxes a shareholder would pay on Fund distributions or the redemption of Fund shares. | |
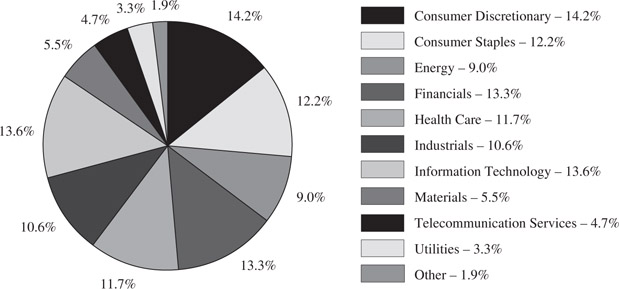
CUTLER EQUITY FUND PORTFOLIO INFORMATION December 31, 2013 (Unaudited) |
Asset Allocation (% of Net Assets)
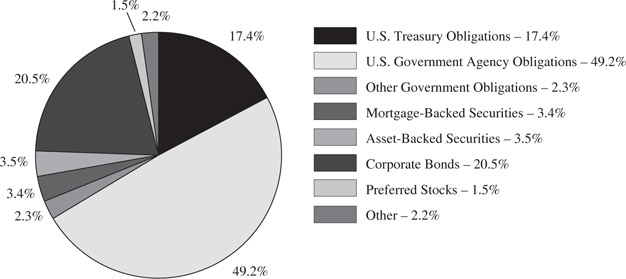
CUTLER FIXED INCOME FUND PORTFOLIO INFORMATION December 31, 2013 (Unaudited) |
Asset Allocation (% of Net Assets)
CUTLER EQUITY FUND SCHEDULE OF INVESTMENTS December 31, 2013 (Unaudited) |
| | | | | | |
| Consumer Discretionary — 14.2% | | | | | | |
| Hotels, Restaurants & Leisure — 2.4% | | | | | | |
| McDonald's Corporation | | | 28,405 | | | $ | 2,756,137 | |
| | | | | | | | | |
| Media — 3.3% | | | | | | | | |
| Walt Disney Company (The) | | | 48,992 | | | | 3,742,989 | |
| | | | | | | | | |
| Multiline Retail — 5.1% | | | | | | | | |
| Nordstrom, Inc. | | | 54,385 | | | | 3,360,993 | |
| Target Corporation | | | 38,140 | | | | 2,413,118 | |
| | | | | | | | 5,774,111 | |
| Specialty Retail — 3.4% | | | | | | | | |
| Home Depot, Inc. (The) | | | 46,200 | | | | 3,804,108 | |
| | | | | | | | | |
| Consumer Staples — 12.2% | | | | | | | | |
| Beverages — 2.6% | | | | | | | | |
| PepsiCo, Inc. | | | 35,495 | | | | 2,943,955 | |
| | | | | | | | | |
| Food & Staples Retailing — 1.9% | | | | | | | | |
| Sysco Corporation | | | 60,595 | | | | 2,187,479 | |
| | | | | | | | | |
| Food Products — 2.4% | | | | | | | | |
| Archer-Daniels-Midland Company | | | 62,135 | | | | 2,696,659 | |
| | | | | | | | | |
| Household Products — 5.3% | | | | | | | | |
| Kimberly-Clark Corporation | | | 28,490 | | | | 2,976,066 | |
| Procter & Gamble Company (The) | | | 36,130 | | | | 2,941,343 | |
| | | | | | | | 5,917,409 | |
| Energy — 9.0% | | | | | | | | |
| Oil, Gas & Consumable Fuels — 9.0% | | | | | | | | |
| Chevron Corporation | | | 29,820 | | | | 3,724,816 | |
| ConocoPhillips | | | 41,830 | | | | 2,955,290 | |
| Exxon Mobil Corporation | | | 33,881 | | | | 3,428,757 | |
| | | | | | | | 10,108,863 | |
| Financials — 13.3% | | | | | | | | |
| Capital Markets — 3.4% | | | | | | | | |
| Charles Schwab Corporation (The) | | | 145,095 | | | | 3,772,470 | |
| | | | | | | | | |
| Commercial Banks — 2.9% | | | | | | | | |
| M&T Bank Corporation | | | 28,340 | | | | 3,299,343 | |
| | | | | | | | | |
| Consumer Finance — 3.8% | | | | | | | | |
| American Express Company | | | 47,395 | | | | 4,300,148 | |
CUTLER EQUITY FUND SCHEDULE OF INVESTMENTS |
COMMON STOCKS — 98.1% (Continued) | | | | | | |
| Financials — 13.3% (Continued) | | | | | | |
| Insurance — 3.2% | | | | | | |
| Chubb Corporation (The) | | | 37,670 | | | $ | 3,640,052 | |
| | | | | | | | | |
| Health Care — 11.7% | | | | | | | | |
| Health Care Equipment & Supplies — 2.7% | | | | | | | | |
| Becton, Dickinson & Company | | | 27,525 | | | | 3,041,237 | |
| | | | | | | | | |
| Pharmaceuticals — 9.0% | | | | | | | | |
| Bristol-Myers Squibb Company | | | 67,240 | | | | 3,573,806 | |
| Johnson & Johnson | | | 37,170 | | | | 3,404,400 | |
| Merck & Company, Inc. | | | 62,790 | | | | 3,142,640 | |
| | | | | | | | 10,120,846 | |
| Industrials — 10.6% | | | | | | | | |
| Aerospace & Defense — 3.2% | | | | | | | | |
| United Technologies Corporation | | | 32,010 | | | | 3,642,738 | |
| | | | | | | | | |
| Electrical Equipment — 2.4% | | | | | | | | |
| Emerson Electric Company | | | 38,735 | | | | 2,718,422 | |
| | | | | | | | | |
| Machinery — 5.0% | | | | | | | | |
| Caterpillar, Inc. | | | 30,280 | | | | 2,749,727 | |
| Deere & Company | | | 31,244 | | | | 2,853,515 | |
| | | | | | | | 5,603,242 | |
| Information Technology — 13.6% | | | | | | | | |
| Communications Equipment — 2.1% | | | | | | | | |
| QUALCOMM, Inc. | | | 32,639 | | | | 2,423,446 | |
| | | | | | | | | |
| Computers & Peripherals — 3.1% | | | | | | | | |
| International Business Machines Corporation | | | 18,565 | | | | 3,482,237 | |
| | | | | | | | | |
| Semiconductors & Semiconductor Equipment — 5.7% | | | | | | | | |
| Intel Corporation | | | 104,965 | | | | 2,724,891 | |
| Texas Instruments, Inc. | | | 83,900 | | | | 3,684,049 | |
| | | | | | | | 6,408,940 | |
| Software — 2.7% | | | | | | | | |
| Microsoft Corporation | | | 80,425 | | | | 3,010,308 | |
| | | | | | | | | |
| Materials — 5.5% | | | | | | | | |
| Chemicals — 5.5% | | | | | | | | |
| E.I. du Pont de Nemours and Company | | | 55,905 | | | | 3,632,148 | |
| Monsanto Company | | | 21,715 | | | | 2,530,883 | |
| | | | | | | | 6,163,031 | |
CUTLER EQUITY FUND SCHEDULE OF INVESTMENTS (Continued) |
COMMON STOCKS — 98.1% (Continued) | | | | | | |
| Telecommunication Services — 4.7% | | | | | | |
| Diversified Telecommunication Services — 4.7% | | | | | | |
| AT&T, Inc. | | | 68,940 | | | $ | 2,423,931 | |
| Verizon Communications, Inc. | | | 58,960 | | | | 2,897,294 | |
| | | | | | | | 5,321,225 | |
| Utilities — 3.3% | | | | | | | | |
| Gas Utilities — 3.3% | | | | | | | | |
| National Fuel Gas Company | | | 52,145 | | | | 3,723,153 | |
| | | | | | | | | |
Total Common Stocks (Cost $75,990,173) | | | | | | $ | 110,602,548 | |
MONEY MARKET FUNDS — 1.8% | | | | | | |
Invesco STIT-STIC Prime Portfolio (The) - Institutional Class, 0.06% (a) (Cost $2,010,896) | | | 2,010,896 | | | $ | 2,010,896 | |
| | | | | | | | | |
Total Investments at Value — 99.9% (Cost $78,001,069) | | | | | | $ | 112,613,444 | |
| | | | | | | | | |
| Other Assets in Excess of Liabilities — 0.1% | | | | | | | 119,141 | |
| | | | | | | | | |
| Net Assets — 100.0% | | | | | | $ | 112,732,585 | |
| (a) | The rate shown is the 7-day effective yield as of December 31, 2013. |
See accompanying notes to financial statements.
CUTLER FIXED INCOME FUND SCHEDULE OF INVESTMENTS December 31, 2013 (Unaudited) |
U.S. TREASURY OBLIGATIONS — 17.4% | | | | | | | | | |
| U.S. Treasury Notes | | | 1.000 | % | 09/30/16 | | $ | 1,125,000 | | | $ | 1,134,668 | |
| U.S. Treasury Notes | | | 1.375 | % | 05/31/20 | | | 1,000,000 | | | | 947,734 | |
| U.S. Treasury Bonds | | | 6.250 | % | 08/15/23 | | | 400,000 | | | | 513,813 | |
Total U.S. Treasury Obligations (Cost $2,588,248) | | | $ | 2,596,215 | |
U.S. GOVERNMENT AGENCY OBLIGATIONS — 49.2% | | | | | | | | | |
| Federal Farm Credit Bank — 3.6% | | | | | | | | | | |
| Federal Farm Credit Bank | | | 1.550 | % | 01/24/20 | | $ | 500,000 | | | $ | 473,006 | |
| Federal Farm Credit Bank | | | 2.250 | % | 08/15/22 | | | 65,000 | | | | 59,571 | |
| | | | | | | | | | | | | 532,577 | |
| Federal Home Loan Bank — 19.3% | | | | | | | | | | | | | |
| Federal Home Loan Bank | | | 1.460 | % | 12/13/19 | | | 500,000 | | | | 473,221 | |
| Federal Home Loan Bank | | | 1.000 | %(a) | 05/28/20 | | | 400,000 | | | | 383,258 | |
| Federal Home Loan Bank | | | 1.000 | %(a) | 02/14/23 | | | 500,000 | | | | 477,201 | |
| Federal Home Loan Bank | | | 1.124 | %(a) | 03/27/23 | | | 500,000 | | | | 475,314 | |
| Federal Home Loan Bank | | | 1.000 | %(a) | 06/20/23 | | | 550,000 | | | | 533,742 | |
| Federal Home Loan Bank | | | 1.249 | %(a) | 08/28/24 | | | 500,000 | | | | 454,234 | |
| Federal Home Loan Bank | | | 1.749 | %(a) | 08/28/24 | | | 100,000 | | | | 91,381 | |
| | | | | | | | | | | | | 2,888,351 | |
| Federal Home Loan Mortgage Corporation — 5.7% | | | | | | | | | | | | | |
| Federal Home Loan Mortgage Corporation | | | 0.500 | % | 01/11/16 | | | 325,000 | | | | 325,028 | |
| Federal Home Loan Mortgage Corporation | | | 1.250 | % | 11/30/17 | | | 65,000 | | | | 64,125 | |
| Federal Home Loan Mortgage Corporation | | | 1.500 | % | 06/24/20 | | | 500,000 | | | | 466,146 | |
| | | | | | | | | | | | | 855,299 | |
| Federal National Mortgage Association — 12.7% | | | | | | | | | | | | | |
| Federal National Mortgage Association | | | 1.000 | % | 02/27/17 | | | 350,000 | | | | 350,456 | |
| Federal National Mortgage Association | | | 1.000 | % | 12/27/18 | | | 500,000 | | | | 474,572 | |
| Federal National Mortgage Association | | | 1.200 | % | 04/25/19 | | | 500,000 | | | | 479,234 | |
| Federal National Mortgage Association | | | 0.999 | %(a) | 01/30/20 | | | 500,000 | | | | 477,521 | |
| Federal National Mortgage Association | | | 2.000 | % | 03/27/20 | | | 60,000 | | | | 58,386 | |
| Federal National Mortgage Association | | | 2.200 | % | 10/25/22 | | | 64,000 | | | | 58,411 | |
| | | | | | | | | | | | | 1,898,580 | |
CUTLER FIXED INCOME FUND SCHEDULE OF INVESTMENTS (Continued) |
U.S. GOVERNMENT AGENCY OBLIGATIONS — 49.2% (Continued) | | | | | | | | | |
| Financing Corporation (FICO) — 4.4% | | | | | | | | | | |
| Financing Corporation (FICO) | | | 9.800 | % | 11/30/17 | | $ | 500,000 | | | $ | 651,708 | |
| | | | | | | | | | | | | | |
| Private Export Funding Corporation — 2.5% | | | | | | | | | | | | | |
| Private Export Funding Corporation | | | 4.300 | % | 12/15/21 | | | 350,000 | | | | 380,227 | |
| | | | | | | | | | | | | | |
| U.S. Department of Housing and Urban Development — 1.0% | | | | | | | | | | | | | |
| U.S. Department of Housing and Urban Development | | | 4.130 | % | 08/01/25 | | | 150,000 | | | | 153,561 | |
| | | | | | | | | | | | | | |
Total U.S. Government Agency Obligations (Cost $7,603,910) | | | $ | 7,360,303 | |
OTHER GOVERNMENT OBLIGATIONS — 2.3% | | | | | | | | | |
| Province of Manitoba (Cost $355,996) | | | 1.300 | % | 04/03/17 | | $ | 350,000 | | | $ | 352,793 | |
MORTGAGE-BACKED SECURITIES — 3.4% | | | | | | | | | |
| Federal Home Loan Mortgage Corporation — 0.7% | | | | | | | | | | |
| FHLMC, Pool #J13584 | | | 3.500 | % | 11/01/25 | | $ | 71,161 | | | $ | 74,398 | |
| FHLMC, Series 1963-Z | | | 7.500 | % | 01/01/27 | | | 32,812 | | | | 37,922 | |
| | | | | | | | | | | | | 112,320 | |
| Federal National Mortgage Association — 2.6% | | | | | | | | | | | | | |
| FNMA, Series 2003-3-HJ | | | 5.000 | % | 02/01/18 | | | 27,205 | | | | 28,897 | |
| FNMA, Pool #899237 | | | 5.000 | % | 03/01/22 | | | 19,257 | | | | 20,780 | |
| FNMA, Series 2002-93-A1 | | | 6.500 | % | 03/01/32 | | | 61,645 | | | | 67,630 | |
| Multifamily REMIC Trust, Series 2006-M1-D | | | 5.385 | %(a) | 06/01/19 | | | 250,000 | | | | 271,216 | |
| | | | | | | | | | | | | 388,523 | |
| Government National Mortgage Association — 0.1% | | | | | | | | | | | | | |
| GNMA, Pool #577742 | | | 5.500 | % | 09/01/17 | | | 9,890 | | | | 10,622 | |
| | | | | | | | | | | | | | |
Total Mortgage-Backed Securities (Cost $498,217) | | | $ | 511,465 | |
CUTLER FIXED INCOME FUND SCHEDULE OF INVESTMENTS (Continued) |
ASSET-BACKED SECURITIES — 3.5% | | | | | | | | | |
| Ford Credit Auto Owner Trust, | | | | | | | | | | |
| Series 2012-A-A3 | | | 0.840 | % | 04/15/15 | | $ | 135,276 | | | $ | 135,553 | |
| FPL Recovery Funding, | | | | | | | | | | | | | |
| Series 2007-A-A3 | | | 5.127 | % | 08/01/17 | | | 215,626 | | | | 222,744 | |
| Mercedes-Benz Auto Receivables Trust, | | | | | | | | | | | | | |
| Series 2011-1-A3 | | | 0.850 | % | 03/15/14 | | | 33,682 | | | | 33,705 | |
| RSB Bond Company, LLC, | | | | | | | | | | | | | |
| Series 2007-A-A2 | | | 5.720 | % | 04/01/16 | | | 132,596 | | | | 139,700 | |
Total Asset-Backed Securities (Cost $542,584) | | | $ | 531,702 | |
| | | | | | | | | |
| Consumer Discretionary —2.3% | | | | | | | | | | |
| Fortune Brands, Inc. | | | 5.375 | % | 01/15/16 | | $ | 321,000 | | | $ | 347,403 | |
| | | | | | | | | | | | | | |
| Energy — 4.4% | | | | | | | | | | | | | |
| Anadarko Petroleum Corporation | | | 5.950 | % | 09/15/16 | | | 400,000 | | | | 445,626 | |
| Buckeye Partners, L.P. | | | 4.875 | % | 02/01/21 | | | 200,000 | | | | 204,670 | |
| | | | | | | | | | | | | 650,296 | |
| Financials — 6.8% | | | | | | | | | | | | | |
| Bank of America Corporation | | | 3.750 | % | 07/12/16 | | | 250,000 | | | | 265,779 | |
| Biomed Realty, L.P. | | | 3.850 | % | 04/15/16 | | | 200,000 | | | | 208,832 | |
| Finial Holdings, Inc. | | | 7.125 | % | 10/15/23 | | | 250,000 | | | | 278,787 | |
| Senior Housing Properties Trust | | | 4.300 | % | 01/15/16 | | | 250,000 | | | | 260,412 | |
| | | | | | | | | | | | | 1,013,810 | |
| Industrials — 2.7% | | | | | | | | | | | | | |
| Domtar Corporation | | | 10.750 | % | 06/01/17 | | | 120,000 | | | | 149,774 | |
| Iron Mountain, Inc. | | | 8.375 | % | 08/15/21 | | | 83,000 | | | | 89,433 | |
| Valmont Industries, Inc. | | | 6.625 | % | 04/20/20 | | | 150,000 | | | | 168,295 | |
| | | | | | | | | | | | | 407,502 | |
| Telecommunication Services — 3.4% | | | | | | | | | | | | | |
| Scripps Networks Interactive, Inc. | | | 2.700 | % | 12/15/16 | | | 300,000 | | | | 311,898 | |
| Verizon Communications, Inc. | | | 2.000 | % | 11/01/16 | | | 185,000 | | | | 188,767 | |
| | | | | | | | | | | | | 500,665 | |
| Utilities — 0.9% | | | | | | | | | | | | | |
| Sempra Energy | | | 6.500 | % | 06/01/16 | | | 125,000 | | | | 140,650 | |
| | | | | | | | | | | | | | |
Total Corporate Bonds (Cost $2,983,241) | | | $ | 3,060,326 | |
CUTLER FIXED INCOME FUND SCHEDULE OF INVESTMENTS (Continued) |
| | | | | | |
| Citigroup Capital XIII (Cost $208,800) | | | 8,000 | | | $ | 218,000 | |
MONEY MARKET FUNDS — 2.1% | | | | | | |
Invesco STIT-STIC Prime Portfolio (The) - Institutional Class, 0.06% (b) (Cost $311,368) | | | 311,368 | | | $ | 311,368 | |
| | | | | | | | | |
Total Investments at Value — 99.9% (Cost $15,092,364) | | | | | | $ | 14,942,172 | |
| | | | | | | | | |
| Other Assets in Excess of Liabilities — 0.1% | | | | | | | 8,746 | |
| | | | | | | | | |
| Net Assets — 100.0% | | | | | | $ | 14,950,918 | |
| (a) | Variable rate security. The rate shown is the effective interest rate as of December 31, 2013. |
| (b) | The rate shown is the 7-day effective yield as of December 31, 2013. |
See accompanying notes to financial statements.
THE CUTLER TRUST STATEMENTS OF ASSETS AND LIABILITIES December 31, 2013 (Unaudited) |
| | | | | | |
| ASSETS | | | | | | |
| Investments in securities: | | | | | | |
| At acquisition cost | | $ | 78,001,069 | | | $ | 15,092,364 | |
| At value (Note 2) | | $ | 112,613,444 | | | $ | 14,942,172 | |
| Dividends and interest receivable | | | 206,915 | | | | 88,864 | |
| Receivable for capital shares sold | | | 124,177 | | | | 4,264 | |
| Other assets | | | 21,328 | | | | 9,180 | |
| Total assets | | | 112,965,864 | | | | 15,044,480 | |
| | | | | | | | | |
| LIABILITIES | | | | | | | | |
| Dividends payable | | | 14,786 | | | | 938 | |
| Payable for capital shares redeemed | | | 117,447 | | | | 71,427 | |
| Payable to Adviser (Note 3) | | | 70,129 | | | | 6,428 | |
| Payable to administrator (Note 3) | | | 14,000 | | | | 6,000 | |
| Other accrued expenses | | | 16,917 | | | | 8,769 | |
| Total liabilities | | | 233,279 | | | | 93,562 | |
| | | | | | | | | |
| NET ASSETS | | $ | 112,732,585 | | | $ | 14,950,918 | |
| | | | | | | | | |
| NET ASSETS CONSIST OF: | | | | | | | | |
| Paid-in capital | | $ | 82,840,668 | | | $ | 15,375,382 | |
| Accumulated (distributions in excess of) net investment income | | | 6,299 | | | | (156,422 | ) |
| Accumulated net realized losses from security transactions | | | (4,726,757 | ) | | | (117,850 | ) |
| Net unrealized appreciation (depreciation) on investments | | | 34,612,375 | | | | (150,192 | ) |
| NET ASSETS | | $ | 112,732,585 | | | $ | 14,950,918 | |
| | | | | | | | | |
Shares of beneficial interest outstanding
(unlimited number of shares authorized, no par value) | | | 6,805,755 | | | | 1,523,249 | |
| | | | | | | | | |
Net asset value, offering price and redemption
price per share (Note 2) | | $ | 16.56 | | | $ | 9.82 | |
See accompanying notes to financial statements.
THE CUTLER TRUST STATEMENTS OF OPERATIONS For the Six Months Ended December 31, 2013 (Unaudited) |
| | | | | | |
| INVESTMENT INCOME | | | | | | |
| Dividend income | | $ | 1,420,632 | | | $ | 7,959 | |
| Interest | | | — | | | | 158,619 | |
| Total investment income | | | 1,420,632 | | | | 166,578 | |
| | | | | | | | | |
| EXPENSES | | | | | | | | |
| Investment advisory fees (Note 3) | | | 400,789 | | | | 39,279 | |
| Administration fees (Note 3) | | | 82,699 | | | | 38,500 | |
| Shareholder servicing fees (Note 3) | | | 43,140 | | | | — | |
| Professional fees | | | 23,585 | | | | 15,698 | |
| Registration and filing fees | | | 14,754 | | | | 10,615 | |
| Trustees’ fees (Note 3) | | | 13,584 | | | | 2,041 | |
| Custody and bank service fees | | | 11,244 | | | | 3,009 | |
| Postage and supplies | | | 9,605 | | | | 3,648 | |
| Insurance expense | | | 8,229 | | | | 1,531 | |
| Printing of shareholder reports | | | 4,264 | | | | 3,101 | |
| Other expenses | | | 1,878 | | | | 4,176 | |
| Total expenses | | | 613,771 | | | | 121,598 | |
| | | | | | | | | |
| NET INVESTMENT INCOME | | | 806,861 | | | | 44,980 | |
| | | | | | | | | |
| REALIZED AND UNREALIZED GAINS (LOSSES) ON INVESTMENTS | | | | | | | | |
| Net realized gains from investment transactions | | | 1,219,375 | | | | 21,262 | |
| Net change in unrealized appreciation/depreciation on investments | | | 10,265,894 | | | | (140,618 | ) |
NET REALIZED AND UNREALIZED GAINS
(LOSSES) ON INVESTMENTS | | | 11,485,269 | | | | (119,356 | ) |
| | | | | | | | | |
NET INCREASE (DECREASE) IN NET ASSETS
FROM OPERATIONS | | $ | 12,292,130 | | | $ | (74,376 | ) |
See accompanying notes to financial statements.
CUTLER EQUITY FUND STATEMENTS OF CHANGES IN NET ASSETS |
| | Six Months Ended December 31, 2013 (Unaudited) | | | | |
| FROM OPERATIONS | | | | | | |
| Net investment income | | $ | 806,861 | | | $ | 1,299,888 | |
| Net realized gains from investment transactions | | | 1,219,375 | | | | 5,596,759 | |
Net change in unrealized appreciation/
depreciation on investments | | | 10,265,894 | | | | 8,035,588 | |
| Net increase in net assets from operations | | | 12,292,130 | | | | 14,932,235 | |
| | | | | | | | | |
| DISTRIBUTIONS TO SHAREHOLDERS | | | | | | | | |
| From net investment income | | | (802,852 | ) | | | (1,299,568 | ) |
| From net realized gains | | | (537,818 | ) | | | — | |
| Decrease in net assets from distributions to shareholders | | | (1,340,670 | ) | | | (1,299,568 | ) |
| | | | | | | | | |
| CAPITAL SHARE TRANSACTIONS | | | | | | | | |
| Net assets received in conjunction with fund merger (Note 1) | | | — | | | | 39,854,719 | |
| Proceeds from shares sold | | | 8,166,387 | | | | 14,366,370 | |
Net asset value of shares issued in reinvestment of
distributions to shareholders | | | 1,315,819 | | | | 1,275,355 | |
| Payments for shares redeemed | | | (8,884,898 | ) | | | (17,361,050 | ) |
| Net increase from capital share transactions | | | 597,308 | | | | 38,135,394 | |
| | | | | | | | | |
| TOTAL INCREASE IN NET ASSETS | | | 11,548,768 | | | | 51,768,061 | |
| | | | | | | | | |
| NET ASSETS | | | | | | | | |
| Beginning of period | | | 101,183,817 | | | | 49,415,756 | |
| End of period | | $ | 112,732,585 | | | $ | 101,183,817 | |
| | | | | | | | | |
| ACCUMULATED NET INVESTMENT INCOME | | $ | 6,299 | | | $ | 2,290 | |
| | | | | | | | | |
| CAPITAL SHARE ACTIVITY | | | | | | | | |
| Shares issued in conjunction with fund merger (Note 1) | | | — | | | | 3,000,712 | |
| Shares sold | | | 521,401 | | | | 1,036,434 | |
| Shares reinvested | | | 81,216 | | | | 91,319 | |
| Shares redeemed | | | (568,364 | ) | | | (1,246,656 | ) |
| Net increase in shares outstanding | | | 34,253 | | | | 2,881,809 | |
| Shares outstanding at beginning of period | | | 6,771,502 | | | | 3,889,693 | |
| Shares outstanding at end of period | | | 6,805,755 | | | | 6,771,502 | |
See accompanying notes to financial statements.
CUTLER FIXED INCOME FUND STATEMENTS OF CHANGES IN NET ASSETS |
| | Six Months Ended December 31, 2013 (Unaudited) | | | Nine Months Ended June 30, 2013(a) | | | Year Ended September 30, 2012 | |
| FROM OPERATIONS | | | | | | | | | |
| Net investment income | | $ | 44,980 | | | $ | 126,189 | | | $ | 423,430 | |
| Net realized gains from investment transactions | | | 21,262 | | | | 415,303 | | | | 48,861 | |
Net change in unrealized appreciation/
depreciation on investments | | | (140,618 | ) | | | (912,631 | ) | | | 564,710 | |
Net increase (decrease) in net assets
from operations | | | (74,376 | ) | | | (371,139 | ) | | | 1,037,001 | |
| | | | | | | | | | | | | |
| DISTRIBUTIONS TO SHAREHOLDERS | | | | | | | | | | | | |
| From net investment income | | | (109,652 | ) | | | (337,075 | ) | | | (759,169 | ) |
| From net realized gains | | | (73,212 | ) | | | — | | | | — | |
Decrease in net assets from distributions
to shareholders | | | (182,864 | ) | | | (337,075 | ) | | | (759,169 | ) |
| | | | | | | | | | | | | |
| CAPITAL SHARE TRANSACTIONS | | | | | | | | | | | | |
| Proceeds from shares sold | | | 335,191 | | | | 3,732,372 | | | | 1,315,387 | |
Net asset value of shares issued in
reinvestment of distributions to shareholders | | | 181,300 | | | | 332,113 | | | | 748,299 | |
| Payments for shares redeemed | | | (1,570,251 | ) | | | (6,787,295 | ) | | | (3,890,718 | ) |
| Net decrease from capital share transactions | | | (1,053,760 | ) | | | (2,722,810 | ) | | | (1,827,032 | ) |
| | | | | | | | | | | | | |
| TOTAL DECREASE IN NET ASSETS | | | (1,311,000 | ) | | | (3,431,024 | ) | | | (1,549,200 | ) |
| | | | | | | | | | | | | |
| NET ASSETS | | | | | | | | | | | | |
| Beginning of period | | | 16,261,918 | | | | 19,692,942 | | | | 21,242,142 | |
| End of period | | $ | 14,950,918 | | | $ | 16,261,918 | | | $ | 19,692,942 | |
| | | | | | | | | | | | | |
DISTRIBUTIONS IN EXCESS OF NET
INVESTMENT INCOME | | $ | (156,422 | ) | | $ | (230,861 | ) | | $ | (187,551 | ) |
| | | | | | | | | | | | | |
| CAPITAL SHARE ACTIVITY | | | | | | | | | | | | |
| Shares sold | | | 33,694 | | | | 362,833 | | | | 125,933 | |
| Shares reinvested | | | 18,372 | | | | 32,493 | | | | 72,122 | |
| Shares redeemed | | | (157,877 | ) | | | (659,094 | ) | | | (372,758 | ) |
| Net decrease in shares outstanding | | | (105,811 | ) | | | (263,768 | ) | | | (174,703 | ) |
| Shares outstanding at beginning of period | | | 1,629,060 | | | | 1,892,828 | | | | 2,067,531 | |
| Shares outstanding at end of period | | | 1,523,249 | | | | 1,629,060 | | | | 1,892,828 | |
| (a) | Fund changed fiscal year end to June 30. |
See accompanying notes to financial statements.
CUTLER EQUITY FUND FINANCIAL HIGHLIGHTS |
| Per Share Data for a Share Outstanding Throughout Each Period | | | | | | | | | | | | | | | |
| | | | Six Months Ended Dec. 31, 2013 | | | | Years Ended June 30, | |
| | | | | | | | 2013 | | | | 2012 | | | | 2011 | | | | 2010 | | | | 2009 | |
| | | | | | | | | | | | | | | | | | | | | | | | | |
Net asset value at
beginning of period | | $ | 14.94 | | | $ | 12.70 | | | $ | 12.18 | | | $ | 9.18 | | | $ | 8.00 | | | $ | 10.80 | |
| | | | | | | | | | | | | | | | | | | | | | | | | |
Income (loss) from
investment operations: | | | | | | | | | | | | | | | | | | | | | | | | |
| Net investment income | | | 0.12 | | | | 0.19 | | | | 0.19 | | | | 0.18 | | | | 0.17 | | | | 0.21 | |
| Net realized and unrealized gains (losses) on investments | | | 1.70 | | | | 2.24 | | | | 0.52 | | | | 3.00 | | | | 1.18 | | | | (2.80 | ) |
| Total from investment operations | | | 1.82 | | | | 2.43 | | | | 0.71 | | | | 3.18 | | | | 1.35 | | | | (2.59 | ) |
| | | | | | | | | | | | | | | | | | | | | | | | | |
| Less distributions from: | | | | | | | | | | | | | | | | | | | | | | | | |
| Net investment income | | | (0.12 | ) | | | (0.19 | ) | | | (0.19 | ) | | | (0.18 | ) | | | (0.17 | ) | | | (0.21 | ) |
| Net realized gains | | | (0.08 | ) | | | — | | | | — | | | | — | | | | — | | | | — | |
| Total distributions | | | (0.20 | ) | | | (0.19 | ) | | | (0.19 | ) | | | (0.18 | ) | | | (0.17 | ) | | | (0.21 | ) |
| | | | | | | | | | | | | | | | | | | | | | | | | |
| Net asset value at end of period | | $ | 16.56 | | | $ | 14.94 | | | $ | 12.70 | | | $ | 12.18 | | | $ | 9.18 | | | $ | 8.00 | |
| | | | | | | | | | | | | | | | | | | | | | | | | |
Total return (a) | | | 12.21% | (b) | | | 19.26% | | | | 5.90% | | | | 34.73% | | | | 16.82% | | | | (24.06% | ) |
| | | | | | | | | | | | | | | | | | | | | | | | | |
| Net assets at end of period (000’s) | | $ | 112,733 | | | $ | 101,184 | | | $ | 49,416 | | | $ | 45,386 | | | $ | 31,115 | | | $ | 27,590 | |
| | | | | | | | | | | | | | | | | | | | | | | | | |
| Ratios/supplementary data: | | | | | | | | | | | | | | | | | | | | | | | | |
| | | | | | | | | | | | | | | | | | | | | | | | | |
Ratio of net expenses to
average net assets (c) | | | 1.15% | (d) | | | 1.15% | | | | 1.27% | | | | 1.33% | | | | 1.40% | | | | 1.40% | |
| | | | | | | | | | | | | | | | | | | | | | | | | |
Ratio of net investment income
to average net assets | | 1.51% | (d) | | | 1.53% | | | | 1.57% | | | | 1.59% | | | | 1.76% | | | | 2.45% | |
| | | | | | | | | | | | | | | | | | | | | | | | | |
| Portfolio turnover rate | | | 5% | (b) | | | 8% | (e) | | | 9% | | | | 15% | | | | 13% | | | | 21% | |
| (a) | Total return is a measure of the change in value of an investment in the Fund over the period covered, which assumes any dividends or capital gains distributions are reinvested in shares of the Fund. Returns shown do not reflect the deduction of taxes a shareholder would pay on Fund distributions or the redemption of Fund shares. |
| (c) | Absent voluntary fee waivers by the Fund’s investment adviser, the ratio of total expenses to average net assets would have been 1.42% and 1.50% for the years ended June 30, 2010 and 2009, respectively. |
| (e) | Excludes the value of securities sold to realign the Fund’s portfolio following the merger with The Elite Growth & Income Fund (Note 1). |
See accompanying notes to financial statements.
CUTLER FIXED INCOME FUND FINANCIAL HIGHLIGHTS | |
Per Share Data for a Share Outstanding Throughout Each Period | |
| | | Six Months Ended Dec. 31, 2013 | | | | | | Years Ended September 30, | |
| | | (Unaudited) | | | 2013(a) | | | 2012 | | | 2011 | | | 2010 | | | 2009 | | | 2008 | |
| | | | | | | | | | | | | | | | | | | | | | |
Net asset value at
beginning of period | | $ | 9.98 | | | $ | 10.40 | | | $ | 10.27 | | | $ | 10.79 | | | $ | 10.33 | | | $ | 9.20 | | | $ | 9.73 | |
| | | | | | | | | | | | | | | | | | | | | | | | | | | | | |
Income (loss) from
investment operations: | | | | | | | | | | | | | | | | | | | | | | | | | | | |
| Net investment income | | 0.02 | | | | 0.05 | | | | 0.21 | | | | 0.28 | | | | 0.33 | | | | 0.39 | | | | 0.42 | |
| Net realized and unrealized gains (losses) on investments | | (0.06 | ) | | | (0.27 | ) | | | 0.31 | | | | (0.09 | ) | | | 0.55 | | | | 1.09 | | | | (0.50 | ) |
| Total from investment operations | | | (0.04 | ) | | | (0.22 | ) | | | 0.52 | | | | 0.19 | | | | 0.88 | | | | 1.48 | | | | (0.08 | ) |
| | | | | | | | | | | | | | | | | | | | | | | | | | | | | |
| Less distributions from: | | | | | | | | | | | | | | | | | | | | | | | | | | | | |
| Net investment income | | (0.07 | ) | | | (0.20 | ) | | | (0.39 | ) | | | (0.46 | ) | | | (0.38 | ) | | | (0.35 | ) | | | (0.45 | ) |
| Net realized gains | | | (0.05 | ) | | | — | | | | — | | | | (0.25 | ) | | | (0.04 | ) | | | — | | | | — | |
| Total distributions | | | (0.12 | ) | | | (0.20 | ) | | | (0.39 | ) | | | (0.71 | ) | | | (0.42 | ) | | | (0.35 | ) | | | (0.45 | ) |
| | | | | | | | | | | | | | | | | | | | | | | | | | | | | |
| Net asset value at end of period | | $ | 9.82 | | | $ | 9.98 | | | $ | 10.40 | | | $ | 10.27 | | | $ | 10.79 | | | $ | 10.33 | | | $ | 9.20 | |
| | | | | | | | | | | | | | | | | | | | | | | | | | | | | |
Total return (b) | | | (0.41% | )(c) | | | (2.16% | )(c) | | | 5.07% | | | | 1.87% | | | | 8.74% | | | | 16.53% | | | | (0.90% | ) |
| | | | | | | | | | | | | | | | | | | | | | | | | | | | | |
Net assets at end of
period (000’s) | | $ | 14,951 | | | $ | 16,262 | | | $ | 19,693 | | | $ | 21,242 | | | $ | 21,320 | | | $ | 17,199 | | | $ | 15,211 | |
| | | | | | | | | | | | | | | | | | | | | | | | | | | | | |
| Ratios/supplementary data: | | | | | | | | | | | | | | | | | | | | | | | | | |
| | | | | | | | | | | | | | | | | | | | | | | | | | | | | |
Ratio of net expenses to average net assets (d) | | 1.55% | (e) | | | 1.54% | (e) | | | 1.52% | | | | 1.28% | | | | 1.33% | | | | 1.48% | | | | 1.05% | |
| | | | | | | | | | | | | | | | | | | | | | | | | | | | | |
| Ratio of net investment income to average net assets | | | 0.57% | (e) | | | 0.95% | (e) | | | 2.03% | | | | 2.51% | | | | 3.20% | | | | 4.11% | | | | 4.30% | |
| | | | | | | | | | | | | | | | | | | | | | | | | | | | | |
| Portfolio turnover rate | | | 23% | (c) | | | 34% | (c) | | | 53% | | | | 83% | | | | 75% | | | | 100% | | | | 106% | |
| (a) | Fund changed fiscal year end to June 30. |
| (b) | Total return is a measure of the change in value of an investment in the Fund over the period covered, which assumes any dividends or capital gains distributions are reinvested in shares of the Fund. Returns shown do not reflect the deduction of taxes a shareholder would pay on Fund distributions or the redemption of Fund shares. |
| (d) | Absent voluntary fee waivers by the Fund’s investment adviser, the ratio of total expenses to average net assets would have been 1.56% and 1.24% for the years ended September 30, 2009 and 2008, respectively. |
See accompanying notes to financial statements.
THE CUTLER TRUST NOTES TO FINANCIAL STATEMENTS December 31, 2013 (Unaudited) |
1. Organization
Cutler Equity Fund and Cutler Fixed Income Fund (the “Funds”) are each a diversified series of The Cutler Trust (the “Trust”). The Trust is a Delaware statutory trust that is registered as an open-end management investment company under the Investment Company Act of 1940 (the “1940 Act”). Under its Trust Instrument, the Trust is authorized to issue an unlimited number of Fund shares of beneficial interest without par value.
Cutler Equity Fund commenced operations on October 2, 1992. On September 28, 2012, Cutler Equity Fund consummated a tax-free merger with The Elite Growth & Income Fund, previously a series of The Elite Group of Mutual Funds. Pursuant to the terms of the agreement governing the merger, each share of The Elite Growth & Income Fund was converted into an equivalent dollar amount of shares of Cutler Equity Fund, based on the net asset value of Cutler Equity Fund and The Elite Growth & Income Fund as of September 27, 2012 ($13.28 and $15.66, respectively), resulting in a conversion ratio of 1.17897958 shares of Cutler Equity Fund for each share of The Elite Growth & Income Fund. Cutler Equity Fund issued 3,000,712 shares to shareholders of The Elite Growth & Income Fund. The basis of the assets transferred from The Elite Growth & Income Fund reflected the historical basis of the assets as of the date of the tax-free merger. Net assets of Cutler Equity Fund and The Elite Growth & Income Fund as of the merger date were $53,639,332 and $39,854,719, including unrealized appreciation on investments of $14,347,666 and $4,099,684, respectively. In addition, The Elite Growth & Income Fund’s net assets included accumulated realized capital losses of $6,906,206. Total net assets immediately after the merger were $93,494,051.
The Elite Income Fund (the “Predecessor Fund”), a series of The Elite Group of Mutual Funds, was reorganized into Cutler Fixed Income Fund (the “Reorganization”) effective September 28, 2012, pursuant to an Agreement and Plan of Reorganization dated August 27, 2012. The Reorganization was approved by the shareholders of the Predecessor Fund at a meeting held on September 27, 2012. The Predecessor Fund transferred all its assets to Cutler Fixed Income Fund in exchange for shares of Cutler Fixed Income Fund and the assumption by Cutler Fixed Income Fund of all the known liabilities of the Predecessor Fund. Cutler Fixed Income Fund did not have any significant assets or liabilities immediately prior to the consummation of the Reorganization. The Reorganization was treated as a tax-free reorganization for federal income tax purposes and, accordingly, the basis of the assets transferred reflect the historical basis of the assets as of the date of the Reorganization.
Cutler Equity Fund seeks current income and long-term capital appreciation.
Cutler Fixed Income Fund seeks to achieve high income over the long-term.
THE CUTLER TRUST NOTES TO FINANCIAL STATEMENTS (Continued) |
2. Significant Accounting Policies
The following summarizes the significant accounting policies of the Funds. The policies are in conformity with accounting principles generally accepted in the United States of America (“GAAP”).
Securities Valuation — Portfolio securities are valued as of the close of business of the regular session of the principal exchange where the security is traded. Exchange traded securities for which market quotations are readily available are valued using the last reported sales price provided by independent pricing services as of the close of trading on the New York Stock Exchange (“NYSE”) (normally 4:00 p.m. Eastern time), on each Fund business day. In the absence of a sale, such securities are valued at the mean of the last bid and asked price. Securities which are quoted by NASDAQ are valued at the NASDAQ Official Closing Price. Non-exchange traded securities for which over-the-counter quotations are available are generally valued at the closing bid price. Money market instruments that mature in sixty days or less may be valued at amortized cost unless the Funds’ investment adviser believes another valuation is more appropriate. Investments in shares of other open-end investment companies are valued at net asset value per share.
The Funds value securities at fair value pursuant to procedures adopted by the Board of Trustees if (1) market quotations are insufficient or not readily available or (2) the Funds’ investment adviser believes that the prices or values available are unreliable due to, among other things, the occurrence of events after the close of the securities markets on which the Funds’ securities primarily trade but before the time as of which the Funds calculate their net asset values. Fair valued securities will be classified as Level 2 or 3 within the fair value hierarchy (see below), depending on the inputs used.
GAAP establishes a single authoritative definition of fair value, sets out a framework for measuring fair value and requires additional disclosures about fair value measurements.
Various inputs are used in determining the value of each Fund’s investments. These inputs are summarized in the three broad levels listed below:
| | • | Level 1 – quoted prices in active markets for identical securities |
| | • | Level 2 – other significant observable inputs |
| | • | Level 3 – significant unobservable inputs |
Fixed income securities held by Cutler Fixed Income Fund are classified as Level 2 since the values for the fixed income securities are based on prices provided by an independent pricing service that utilizes various “other significant observable inputs” including bid and ask quotations, prices of similar securities and interest rates, among other factors.
THE CUTLER TRUST NOTES TO FINANCIAL STATEMENTS (Continued) |
The inputs or methodology used for valuing securities are not necessarily an indication of the risks associated with investing in those securities. The inputs used to measure fair value may fall into different levels of the fair value hierarchy. In such cases, for disclosure purposes, the level in the fair value hierarchy within which the fair value measurement falls in its entirety is determined based on the lowest level input that is significant to the fair value measurement.
The following is a summary of the inputs used to value each Fund’s investments as of December 31, 2013 by security type:
| | | | | | | | | | | | |
| Common Stocks | | $ | 110,602,548 | | | $ | — | | | $ | — | | | $ | 110,602,548 | |
| Money Market Funds | | | 2,010,896 | | | | — | | | | — | | | | 2,010,896 | |
| Total | | $ | 112,613,444 | | | $ | — | | | $ | — | | | $ | 112,613,444 | |
| | | | | | | | | | | | |
| U.S. Treasury Obligations | | $ | — | | | $ | 2,596,215 | | | $ | — | | | $ | 2,596,215 | |
| U.S. Government Agency Obligations | | | — | | | | 7,360,303 | | | | — | | | | 7,360,303 | |
| Other Government Obligations | | | — | | | | 352,793 | | | | — | | | | 352,793 | |
| Mortgage-Backed Securities | | | — | | | | 511,465 | | | | — | | | | 511,465 | |
| Asset-Backed Securities | | | — | | | | 531,702 | | | | — | | | | 531,702 | |
| Corporate Bonds | | | — | | | | 3,060,326 | | | | — | | | | 3,060,326 | |
| Preferred Stocks | | | 218,000 | | | | — | | | | — | | | | 218,000 | |
| Money Market Funds | | | 311,368 | | | | — | | | | — | | | | 311,368 | |
| Total | | $ | 529,368 | | | $ | 14,412,804 | | | $ | — | | | $ | 14,942,172 | |
Refer to each Fund’s Schedule of Investments for a listing of the securities by security type and sector or industry type. As of December 31, 2013, the Funds did not have any transfers in and out of any Level. There were no Level 3 securities or derivative instruments held by the Funds as of December 31, 2013. It is the Funds’ policy to recognize transfers into and out of any Level at the end of the reporting period.
Share valuation — The net asset value per share of each Fund is calculated daily by dividing the total value of its assets, less liabilities, by the number of shares outstanding. The offering price and redemption price per share of each Fund is equal to its net asset value per share.
THE CUTLER TRUST NOTES TO FINANCIAL STATEMENTS (Continued) |
Estimates — The preparation of financial statements in conformity with GAAP requires management to make estimates and assumptions that affect the reported amounts of assets and liabilities and disclosures of contingent assets and liabilities at the date of the financial statements and the reported amounts of income and expenses during the reporting period. Actual results could differ from those estimates.
Security Transactions, Investment Income and Realized Gains and Losses — Investment transactions are accounted for on trade date. Dividend income is recorded on the ex-dividend date. Interest income is recorded as earned. Discounts and premiums on fixed income securities are amortized using the effective interest method. Gains and losses on securities sold are determined on a specific identification basis.
Distributions to Shareholders — Distributions to shareholders of net investment income, if any, are paid quarterly. Capital gain distributions, if any, are distributed to shareholders annually. Distributions are based on amounts calculated in accordance with applicable federal income tax regulations, which may differ from GAAP. These differences are due primarily to differing treatments of income and gains on various investment securities held by the Funds, timing differences and differing characterizations of distributions made by the Funds. Dividends and distributions are recorded on the ex-dividend date. The tax character of distributions paid by Cutler Equity Fund during the periods ended December 31, 2013 and June 30, 2013 and the tax character of distributions paid by Cutler Fixed Income Fund during the periods ended December 31, 2013, June 30, 2013 and September 30, 2012 was as follows:
| | | | | | | | | | |
| Cutler Equity Fund | 12/31/2013 | | $ | 802,852 | | | $ | 537,818 | | | $ | 1,340,670 | |
| | 6/30/2013 | | $ | 1,299,568 | | | $ | — | | | $ | 1,299,568 | |
| | | | | | | | | | |
| Cutler Fixed Income Fund | 12/31/2013 | | $ | 109,652 | | | $ | 73,212 | | | $ | 182,864 | |
| | 6/30/2013 | | $ | 337,075 | | | $ | — | | | $ | 337,075 | |
| | 9/30/2012 | | $ | 759,169 | | | $ | — | | | $ | 759,169 | |
Federal income tax — The Funds intend to continue to qualify each year as a “regulated investment company” under Subchapter M of the Internal Revenue Code of 1986 (the “Code”). By so qualifying, the Funds will not be subject to federal income taxes to the extent they distribute their net investment income and any realized capital gains in accordance with the Code. Accordingly, no provision for income taxes has been made.
THE CUTLER TRUST NOTES TO FINANCIAL STATEMENTS (Continued) |
In order to avoid imposition of the excise tax applicable to regulated investment companies, it is also each Fund’s intention to declare as dividends in each calendar year at least 98% of its net investment income (earned during the calendar year) and 98.2% of its net realized capital gains (earned during the twelve months ended October 31) plus undistributed amounts from prior years.
The following information is computed on a tax basis for each item as of December 31, 2013:
| | | | | | |
| Tax cost of portfolio investments | | $ | 78,020,768 | | | $ | 15,248,953 | |
| Gross unrealized appreciation | | $ | 34,891,890 | | | $ | 108,475 | |
| Gross unrealized depreciation | | | (299,214 | ) | | | (415,256 | ) |
| Net unrealized appreciation (depreciation) on investments | | | 34,592,676 | | | | (306,781 | ) |
| Undistributed ordinary income | | | 17,050 | | | | 712 | |
| Capital loss carryforwards | | | (5,926,433 | ) | | | — | |
| Undistributed long-term gains | | | 4,035 | | | | 393 | |
| Other gains (losses) | | | 1,219,375 | | | | (117,850 | ) |
| Other temporary differences | | | (14,786 | ) | | | (938 | ) |
| Accumulated earnings (deficit) | | $ | 29,891,917 | | | $ | (424,464 | ) |
The difference between the federal income tax cost of portfolio investments and the financial statement cost for the Funds is due to certain differences in the recognition of capital gains and losses under income tax regulations and GAAP. These “book/tax” differences are temporary in nature and are related to losses deferred due to wash sales for Cutler Equity Fund and amortization of bond premiums and discounts for Cutler Fixed Income Fund.
For the six months ended December 31, 2013, Cutler Fixed Income Fund reclassified $139,111 of distributions in excess of net investment income against accumulated net realized losses from security transactions on the Statements of Assets and Liabilities. Such reclassification, the result of permanent differences between financial statement and income tax reporting requirements, has no effect on the Fund’s net assets or net asset value per share.
As of June 30, 2013, Cutler Equity Fund had capital loss carryforwards of $5,926,433, consisting of short-term losses of $4,635,458 (with a maximum amount of $1,299,264 available in each year) which expire on June 30, 2018; and short-term losses of $250,862 and long-term losses of $1,040,113 which have no expiration date. These capital loss carryforwards may be utilized in the current and future years to offset net realized capital gains, if any, prior to distributing such gains to shareholders.
THE CUTLER TRUST NOTES TO FINANCIAL STATEMENTS (Continued) |
Under the Regulated Investment Company Modernization Act of 2010 (the “Act”), newly recognized net capital losses may be carried forward indefinitely, and their character is retained as short-term and/or long-term losses. Under the law in effect prior to the Act, net capital losses were carried forward for eight years and treated as short-term losses. As a transition rule, the Act requires that post-enactment net capital losses be used before pre-enactment net capital losses. Therefore, there may be a greater likelihood that all or a portion of Cutler Equity Fund’s pre-enactment capital loss carryovers may expire without being utilized.
The Funds recognize the tax benefits or expenses of uncertain tax positions only when the position is “more-likely-than-not” to be sustained assuming examination by tax authorities. Management has reviewed the tax positions taken on Federal income tax returns for the current tax year and all other open tax years (tax years ended June 30, 2010 through June 30, 2013 for Cutler Equity Fund and tax years ended September 30, 2010 through September 30, 2012 and June 30, 2013 for Cutler Fixed Income Fund) and has concluded that no provision for unrecognized tax benefits or expenses is required in these financial statements.
3. Transactions with Related Parties
Investment Adviser — Cutler Investment Counsel, LLC (the “Adviser”) is the investment adviser to the Funds. Pursuant to an Investment Advisory Agreement, Cutler Equity Fund and Cutler Fixed Income Fund pay the Adviser a fee, which is accrued daily and paid monthly, at an annual rate of 0.75% and 0.50%, respectively, of average daily net assets.
The Adviser has entered into an Expense Limitation Agreement under which it has agreed to reduce its investment advisory fees from Cutler Equity Fund and to pay such Fund’s expenses until at least November 1, 2014 to the extent necessary to limit annual ordinary operating expenses to 1.15% of average daily net assets. Any such fee reductions by the Adviser, or payments by the Adviser of expenses which are Cutler Equity Fund’s obligation, are subject to repayment by the Fund, provided that the repayment does not cause the Fund’s ordinary operating expenses to exceed the annual expense limit of 1.15%, and provided further that the fees and expenses which are the subject of the repayment were incurred within three years of the repayment. No advisory fee reductions or expense reimbursements were required during the six months ended December 31, 2013.
Certain officers of the Trust are also officers of the Adviser.
Administration and Other Services — Under the terms of a Mutual Fund Services Agreement between the Trust and Ultimus Fund Solutions, LLC (“Ultimus”), Ultimus provides administrative, pricing, accounting, dividend disbursing, shareholder servicing and transfer agent services for the Funds. For these services, the Funds pay Ultimus customary fees. In addition, each Fund pays out-of-pocket expenses including, but not limited to, postage, supplies and costs of pricing the Funds’ portfolio securities.
THE CUTLER TRUST NOTES TO FINANCIAL STATEMENTS (Continued) |
Certain officers of the Trust are also officers of Ultimus, or of Ultimus Fund Distributors, LLC, the principal underwriter of the Funds’ shares and an affiliate of Ultimus.
Shareholder Service Plan — Each Fund may pay shareholder servicing fees not to exceed an annual rate of 0.25% of its average daily net assets. These fees may be paid to various financial institutions that provide shareholder and account maintenance services. During the six months ended December 31, 2013, Cutler Equity Fund and Cutler Fixed Income Fund paid $43,140 and $0, respectively, for such services.
Compensation of Trustees — Trustees and officers affiliated with the Adviser or Ultimus are not compensated by the Trust for their services. Each Trustee who is not an affiliated person of the Adviser or Ultimus (“Independent Trustee”) receives from the Trust an annual retainer of $7,500, payable quarterly, plus a fee of $1,250 for attendance at each meeting of the Board of Trustees.
4. Securities Transactions
During the six months ended December 31, 2013, cost of purchases and proceeds from sales and maturities of investment securities, other than short-term investments and U.S. government securities, totaled $5,039,901 and $5,332,179, respectively, for Cutler Equity Fund and $0 and $2,615,433, respectively, for Cutler Fixed Income Fund.
5. Contingencies and Commitments
The Funds indemnify the Trust’s officers and Trustees for certain liabilities that might arise from their performance of their duties to the Funds. Additionally, in the normal course of business the Funds enter into contracts that contain a variety of representations and warranties and which provide general indemnifications. The Funds’ maximum exposure under these arrangements is unknown, as this would involve future claims that may be made against the Funds that have not yet occurred. However, based on experience, the Funds expect the risk of loss to be remote.
The Funds are required to recognize in the financial statements the effects of all subsequent events that provide additional evidence about conditions that existed as of the date of the Statements of Assets and Liabilities. For non-recognized subsequent events that must be disclosed to keep the financial statements from being misleading, the Funds are required to disclose the nature of the event as well as an estimate of its financial effect, or a statement that such an estimate cannot be made. Management has evaluated subsequent events through the issuance of these financial statements and has noted no such events.
THE CUTLER TRUST ABOUT YOUR FUND’S EXPENSES (Unaudited) |
We believe it is important for you to understand the impact of costs on your investment. All mutual funds have operating expenses. As a shareholder of the Funds, you incur ongoing costs, including management fees and other operating expenses. These ongoing costs, which are deducted from each Fund’s gross income, directly reduce the investment return of the Funds.
A mutual fund’s ongoing costs are expressed as a percentage of its average net assets. This figure is known as the expense ratio. The following examples are intended to help you understand the ongoing costs (in dollars) of investing in the Funds and to compare these costs with the ongoing costs of investing in other mutual funds. The examples below are based on an investment of $1,000 made at the beginning of the period shown and held for the entire period (July 1, 2013 through December 31, 2013).
The table below illustrates each Fund’s ongoing costs in two ways:
Actual fund return – This section helps you to estimate the actual expenses that you paid over the period. The “Ending Account Value” shown is derived from each Fund’s actual return, and the third column shows the dollar amount of operating expenses that would have been paid by an investor who started with $1,000 in the Funds. You may use the information here, together with the amount you invested, to estimate the expenses that you paid over the period.
To do so, simply divide your account value by $1,000 (for example, an $8,600 account value divided by $1,000 = 8.6), then multiply the result by the number given for the Funds under the heading “Expenses Paid During Period.”
Hypothetical 5% return – This section is intended to help you compare the Funds’ ongoing costs with those of other mutual funds. It assumes that each Fund had an annual return of 5% before expenses during the period shown, but that the expense ratio is unchanged. In this case, because the returns used are not the Funds’ actual returns, the results do not apply to your investment. The example is useful in making comparisons because the Securities and Exchange Commission (“SEC”) requires all mutual funds to calculate expenses based on a 5% return. You can assess each Fund’s ongoing costs by comparing this hypothetical example with the hypothetical examples that appear in shareholder reports of other funds.
Note that expenses shown in the table are meant to highlight and help you compare ongoing costs only. The Funds do not charge transaction fees, such as purchase or redemption fees, nor do they impose any sales loads.
The calculations assume no shares were bought or sold during the period. Your actual costs may have been higher or lower, depending on the amount of your investment and the timing of any purchases or redemptions.
THE CUTLER TRUST ABOUT YOUR FUND’S EXPENSES (Unaudited) (Continued) |
More information about the Funds’ expenses, including annual expense ratios for the past five fiscal years, can be found in this report. For additional information on operating expenses and other shareholder costs, please refer to each Fund’s prospectus.
| Beginning Account Value July 1, 2013 | Ending Account Value December 31, 2013 | Expenses Paid During Period* |
| Based on Actual Fund Return | $1,000.00 | $1,122.10 | $6.15 |
| Based on Hypothetical 5% Return (before expenses) | $1,000.00 | $1,019.41 | $5.85 |
| | * | Expenses are equal to Cutler Equity Fund’s annualized expense ratio of 1.15% for the period, multiplied by the average account value over the period, multiplied by 184/365 (to reflect the one-half year period). |
| Beginning Account Value July 1, 2013 | Ending Account Value December 31, 2013 | Expenses Paid During Period* |
| Based on Actual Fund Return | $1,000.00 | $995.90 | $7.80 |
| Based on Hypothetical 5% Return (before expenses) | $1,000.00 | $1,017.39 | $7.88 |
| | * | Expenses are equal to Cutler Fixed Income Fund’s annualized expense ratio of 1.55% for the period, multiplied by the average account value over the period, multiplied by 184/365 (to reflect the one-half year period). |
THE CUTLER TRUST ADDITIONAL INFORMATION (Unaudited) |
A description of the policies and procedures that the Funds use to determine how to vote proxies relating to securities held in the Funds’ portfolios is available without charge, upon request, by calling 1-800-228-8537 or on the SEC’s website at http://www.sec.gov. Information regarding how the Funds voted proxies relating to portfolio securities during the most recent 12-month period ended June 30 is also available without charge upon request by calling 1-800-228-8537 or on the SEC’s website at http://www.sec.gov.
The Trust files a complete listing of the Funds’ portfolio holdings with the SEC as of the end of the first and third quarters of each fiscal year on Form N-Q. The filings are available without charge, upon request, by calling 1-800-228-8537. Furthermore, you may obtain a copy of the filings on the SEC’s website at http://www.sec.gov. The Trust’s Forms N-Q may also be reviewed and copied at the SEC’s Public Reference Room in Washington, DC, and information on the operation of the Public Reference Room may be obtained by calling 1-800-SEC-0330.
THE CUTLER TRUST
RESULTS OF SPECIAL MEETING OF SHAREHOLDERS
(Unaudited)
On August 30, 2013, a Special Meeting of Shareholders of the Cutler Equity Fund and the Cutler Fixed Income Fund (the “Funds”), each a series of The Cutler Trust (the “Trust”) was held for the purpose of voting on the following Proposal:
Proposal: To elect four individuals to serve on the Board of Trustees of the Trust.
A total of 8,351,041.051 shares of the Funds were entitled to vote on the Proposal. A total of 2,755,843.547 shares constituted a quorum of voters for purposes of the Proposal. A total of 3,435,878.100 shares were voted, representing 41.143% of total shares.
Shareholders of record on July 22, 2013 voted to approve the election of Matthew C. Patten, John P. Cooney, Robert F. Turner and Edward T. Alter to serve on the Board of Trustees of the Trust. The votes cast with respect to the Proposal were as follows:
| | |
| | | |
| Matthew C. Patten | 3,423,370.755 | 0 | 12,507.345 |
| John P. Cooney | 3,423,370.755 | 0 | 12,507.345 |
| Robert F. Turner | 3,423,370.755 | 0 | 12,507.345 |
| Edward T. Alter | 3,423,370.755 | 0 | 12,507.345 |
Rev. August 2010
|
| FACTS | WHAT DOES THE CUTLER TRUST DO WITH YOUR PERSONAL INFORMATION? |
| | | | |
| Why? | Financial companies choose how they share your personal information. Federal law gives consumers the right to limit some but not all sharing. Federal law also requires us to tell you how we collect, share, and protect your personal information. Please read this notice carefully to understand what we do. |
| | | | |
| What? | The types of personal information we collect and share depend on the product or service you have with us. This information can include: § Social Security number § Assets § Retirement Assets § Transaction History § Checking Account Information § Purchase History § Account Balances § Account Transactions § Wire Transfer Instructions When you are no longer our customer, we continue to share your information as described in this notice. |
| | | | |
| How? | All financial companies need to share your personal information to run their everyday business. In the section below, we list the reasons financial companies can share their customers’ personal information; the reasons The Cutler Trust chooses to share; and whether you can limit this sharing. |
| | | | |
| Reasons we can share your personal information | Does The Cutler Trust share? | Can you limit this sharing? |
For our everyday business purposes – Such as to process your transactions, maintain your account(s), respond to court orders and legal investigations, or report to credit bureaus | Yes | No |
For our marketing purposes – to offer our products and services to you | No | We don’t share |
| For joint marketing with other financial companies | No | We don’t share |
For our affiliates’ everyday business purposes – information about your transactions and experiences | No | We don’t share |
For our affiliates’ everyday business purposes – information about your creditworthiness | No | We don’t share |
| For nonaffiliates to market to you | No | We don’t share |
| | |
| Questions? | Call 1-888-288-5374 |
| Who we are |
| Who is providing this notice? | The Cutler Trust Ultimus Fund Distributors, LLC (Distributor) Ultimus Fund Solutions, LLC (Administrator) |
| What we do |
How does The Cutler Trust protect my personal information? | To protect your personal information from unauthorized access and use, we use security measures that comply with federal law. These measures include computer safeguards and secured files and buildings. Our service providers are held accountable for adhering to strict policies and procedures to prevent any misuse of your nonpublic personal information. |
| How does The Cutler Trust collect my personal information? | We collect your personal information, for example, when you § Open an account § Provide account information § Give us your contact information § Make deposits or withdrawals from your account § Make a wire transfer § Tell us where to send the money § Tell us who receives the money § Show your government-issued ID § Show your driver’s license We also collect your personal information from other companies. |
| Why can’t I limit all sharing? | Federal law gives you the right to limit only § Sharing for affiliates’ everyday business purposes – information about your creditworthiness § Affiliates from using your information to market to you § Sharing for nonaffiliates to market to you State laws and individual companies may give you additional rights to limit sharing. |
| | |
| Definitions |
| Affiliates | Companies related by common ownership or control. They can be financial and nonfinancial companies. § Cutler Investment Counsel, LLC, the investment adviser to The Cutler Trust, could be deemed to be an affiliate. |
| Nonaffiliates | Companies not related by common ownership or control. They can be financial and nonfinancial companies § The Cutler Trust does not share with nonaffiliates so they can market to you. |
| Joint marketing | A formal agreement between nonaffiliated financial companies that together market financial products or services to you. § The Cutler Trust does not jointly market. |
This page intentionally left blank.
CUTLER INVESTMENT COUNSEL, LLC
INVESTMENT ADVISER TO THE TRUST
525 Bigham Knoll
Jacksonville, OR 97530
(800)228-8537 • (541)770-9000
Fax:(541)779-0006
info@cutler.com
Item 2. Code of Ethics.
Not required
Item 3. Audit Committee Financial Expert.
Not required
Item 4. Principal Accountant Fees and Services.
Not required
Item 5. Audit Committee of Listed Registrants.
Not applicable
Item 6. Schedule of Investments.
| (a) | Not applicable [schedule filed with Item 1] |
Item 7. Disclosure of Proxy Voting Policies and Procedures for Closed-End Management Investment Companies.
Not applicable
Item 8. Portfolio Managers of Closed-End Management Investment Companies.
Not applicable
Item 9. Purchases of Equity Securities by Closed-End Management Investment Company and Affiliated Purchasers.
Not applicable
Item 10. Submission of Matters to a Vote of Security Holders.
The registrant has not adopted procedures by which shareholders may recommend nominees to the registrant’s board of trustees.
Item 11. Controls and Procedures.
(a) Based on their evaluation of the registrant’s disclosure controls and procedures (as defined in Rule 30a-3(c) under the Investment Company Act of 1940) as of a date within 90 days of the filing date of this report, the registrant’s principal executive officer and principal financial officer have concluded that such disclosure controls and procedures are reasonably designed and are operating effectively to ensure that material information relating to the registrant, including its consolidated subsidiaries, is made known to them by others within those entities, particularly during the period in which this report is being prepared, and that the information required in filings on Form N-CSR is recorded, processed, summarized, and reported on a timely basis.
(b) There were no changes in the registrant’s internal control over financial reporting (as defined in Rule 30a-3(d) under the Investment Company Act of 1940) that occurred during the second fiscal quarter of the period covered by this report that have materially affected, or are reasonably likely to materially affect, the registrant’s internal control over financial reporting.
Item 12. Exhibits.
File the exhibits listed below as part of this Form. Letter or number the exhibits in the sequence indicated.
(a)(1) Any code of ethics, or amendment thereto, that is the subject of the disclosure required by Item 2, to the extent that the registrant intends to satisfy the Item 2 requirements through filing of an exhibit: Not required
(a)(2) A separate certification for each principal executive officer and principal financial officer of the registrant as required by Rule 30a-2(a) under the Act (17 CFR 270.30a-2(a)): Attached hereto
(a)(3) Any written solicitation to purchase securities under Rule 23c-1 under the Act (17 CFR 270.23c-1) sent or given during the period covered by the report by or on behalf of the registrant to 10 or more persons: Not applicable
(b) Certifications required by Rule 30a-2(b) under the Act (17 CFR 270.30a-2(b)): Attached hereto
| Exhibit 99.CERT | Certifications required by Rule 30a-2(a) under the Act |
| | |
| Exhibit 99.906CERT | Certifications required by Rule 30a-2(b) under the Act |
SIGNATURES
Pursuant to the requirements of the Securities Exchange Act of 1934 and the Investment Company Act of 1940, the registrant has duly caused this report to be signed on its behalf by the undersigned, thereunto duly authorized.
(Registrant) The Cutler Trust
| By (Signature and Title)* | /s/ Erich M. Patten | |
| | | Erich M. Patten, President | |
| Date | February 21, 2014 | | |
Pursuant to the requirements of the Securities Exchange Act of 1934 and the Investment Company Act of 1940, this report has been signed below by the following persons on behalf of the registrant and in the capacities and on the dates indicated.
| By (Signature and Title)* | /s/ Erich M. Patten | |
| | | Erich M. Patten, President | |
| Date | February 21, 2014 | | |
| | | | |
| By (Signature and Title)* | /s/ Matthew C. Patten | |
| | | Matthew C. Patten, Treasurer | |
| Date | February 21, 2014 | | |
* Print the name and title of each signing officer under his or her signature.