Matthew C. Patten
Form N-CSR is to be used by management investment companies to file reports with the Commission not later than 10 days after the transmission to stockholders of any report that is required to be transmitted to stockholders under Rule 30e-1 under the Investment Company Act of 1940 (17 CFR 270.30e-1). The Commission may use the information provided on Form N-CSR in its regulatory, disclosure review, inspection, and policymaking roles.
A registrant is required to disclose the information specified by Form N-CSR, and the Commission will make this information public. A registrant is not required to respond to the collection of information contained in Form N-CSR unless the Form displays a currently valid Office of Management and Budget ("OMB") control number. Please direct comments concerning the accuracy of the information collection burden estimate and any suggestions for reducing the burden to the Secretary, Securities and Exchange Commission, 450 Fifth Street, NW, Washington, DC 20549-0609. The OMB has reviewed this collection of information under the clearance requirements of 44 U.S.C. § 3507.
Item 1. Reports to Stockholders.

CUTLER EQUITY FUND
CUTLER FIXED INCOME FUND
CUTLER EMERGING MARKETS FUND
SEMI-ANNUAL REPORT
December 31, 2016
(Unaudited)
THE CUTLER TRUST
TABLE OF CONTENTS
| | Page |
Letter to Shareholders | 2 |
Performance Information | 4 |
Portfolio Information | 7 |
Schedules of Investments | 10 |
Statements of Assets and Liabilities | 21 |
Statements of Operations | 22 |
Statements of Changes in Net Assets | 23 |
Financial Highlights | 26 |
Notes to Financial Statements | 29 |
About Your Fund’s Expenses | 40 |
Additional Information | 42 |
1
THE CUTLER TRUST
LETTER TO SHAREHOLDERS
To the Cutler Trust Shareholders:
Enclosed is the Semi-Annual Report for the Cutler Trust for the period ended December 31, 2016. Please take a few minutes to review this information, which includes performance, holdings, and other important information regarding your investment in the Cutler Equity Fund, the Cutler Emerging Markets Fund, and the Cutler Fixed Income Fund.
The past year represented an inflection point. The obvious, politics, has been at the forefront of investors’ attention. As we embark on a period of reduced regulation, those investments anticipated to be unburdened by regulatory oversight in the new regime have benefitted. Notably, as Dodd-Frank continues to be re-examined, the banking sector has been a significant market leader. The broader stock market seems to have put aside the risks from unclear policy initiatives and has instead priced in the upside of lower tax rates and less red tape. The S&P 500 Total Return Index finished the calendar year up 11.96%.
While politics has dominated the headlines, it was not the only inflection last year. Quite possibly, 2016 marked the end of the decade’s long bull market in fixed income. Despite positive returns for the year, yields generally rose after climactic buying last February. We do not anticipate seeing such widespread negative yielding instruments anytime soon. While we see pressure for long-term U.S. rates to hold their value, the Federal Reserve has continued to take a modestly hawkish tact. Of course, any hiccup in the economic outlook could derail this process. In our view, bonds remain a viable investment and appropriate diversification tool for most investors. 2016 appears to have established a new trend of rising rates; however, the severity of this new trend will continue to be hotly debated.
Throughout much of this equity bull market, growth has been a market leader over value. The election changed the trend with value emerging as a market leader. This has continued into 2017, likely due to financials being the dominant sector in many value indexes. Growth, associated with global technology firms, has been subject to more hostile trade and tariff rhetoric.
As we progress into 2017, we anticipate currency and government policy as the two biggest market influencers in the near term. Will the new policies translate into market gains? Will a trade war ensue? Can proposed tariffs weaken the dollar, ultimately helping emerging markets stocks? The questions will be fundamental to the sustainability of the current eight-year U.S. equity bull market and we will be watching on your behalf.
2
THE CUTLER TRUST
LETTER TO SHAREHOLDERS (Continued)
Thank you for your continued confidence in Cutler. We continue to provide periodic market updates and commentary on our website www.cutler.com. There you can also sign-up for our newsletter or periodic webinars. And as always, feel free to call us anytime with questions about your investments.
Best regards,

| 
|
Erich Patten | Xavier Urpi |
Chief Investment Officer | Director of Fixed Income |
Before investing you should carefully consider the Cutler Funds’ investment objectives, risks, charges and expenses. This and other information is in the prospectus, a copy of which may be obtained by calling 1-800-228-8537. Please read the prospectus carefully before you invest.
The views in this report were those of the Cutler Funds’ investment adviser as of December 31, 2016 and may not reflect its views on the date this report is first published or anytime thereafter. These views are intended to assist shareholders in understanding their investment in the Cutler Funds and do not constitute investment advice.
3
CUTLER EQUITY FUND
PERFORMANCE INFORMATION
December 31, 2016 (Unaudited)
Comparison of the Change in Value of a $10,000 Investment in
Cutler Equity Fund and S&P 500 Total Return Index
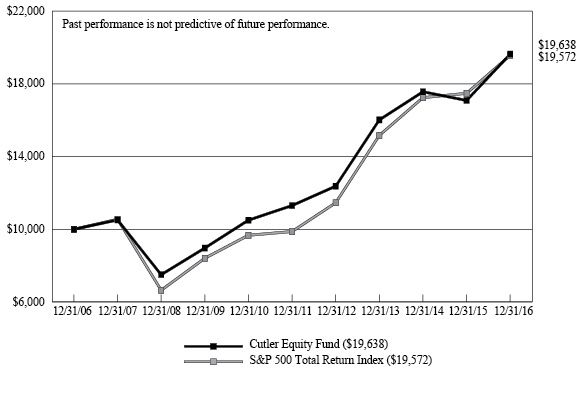
Average Annual Total Returns
(for periods ended December 31, 2016) |
| | 1 Year | 5 Years | 10 Years | |
Cutler Equity Fund(a) | 14.93% | 11.68% | 6.98% | |
S&P 500 Total Return Index(b) | 11.96% | 14.66% | 6.95% | |
| | | | | | |
(a) | Returns shown do not reflect the deduction of taxes a shareholder would pay on Fund distributions or the redemption of Fund shares. | |
(b) | The S&P 500 Total Return Index is a market capitalization weighted index that is widely used as a barometer of U.S. stock market performance. The index is unmanaged and shown for illustration purposes only. An investor cannot invest in an index and its returns are not indicative of the performance of any specific investment. | |
4
CUTLER FIXED INCOME FUND
PERFORMANCE INFORMATION
December 31, 2016 (Unaudited)
Comparison of the Change in Value of a $10,000 Investment in
Cutler Fixed Income Fund, Bloomberg Barclays Intermediate U.S. Government/Credit Index
and Bloomberg Barclays Short-Term U.S. Government Index
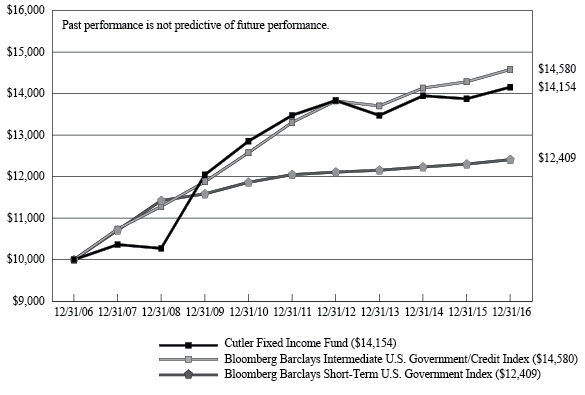
Average Annual Total Returns
(for periods ended December 31, 2016) |
| | 1 Year | 5 Years | 10 Years | |
Cutler Fixed Income Fund(a) | 2.02% | 0.99% | 3.54% | |
Bloomberg Barclays Intermediate U.S. Government/Credit Index(b) | 2.08% | 1.85% | 3.84% | |
Bloomberg Barclays Short-Term U.S. Government Index(b) | 0.87% | 0.59% | 2.18% | |
| | | | | | |
(a) | Returns shown do not reflect the deduction of taxes a shareholder would pay on Fund distributions or the redemption of Fund shares. | |
(b) | The Bloomberg Barclays Intermediate U.S. Government/Credit Index and the Bloomberg Barclays Short-Term U.S. Government Index cover intermediate and short-term, respectively, fixed income securities of the U.S government and publicly-issued U.S. corporate and foreign debentures and secured notes that meet specified maturity, liquidity, and quality requirements. The indices are unmanaged and shown for illustration purposes only. An investor cannot invest in an index and its returns are not indicative of the performance or any specific investment. | |
5
CUTLER EMERGING MARKETS FUND
PERFORMANCE INFORMATION
December 31, 2016 (Unaudited)
Comparison of the Change in Value of a $10,000 Investment in
Cutler Emerging Markets Fund and MSCI Emerging Markets Index
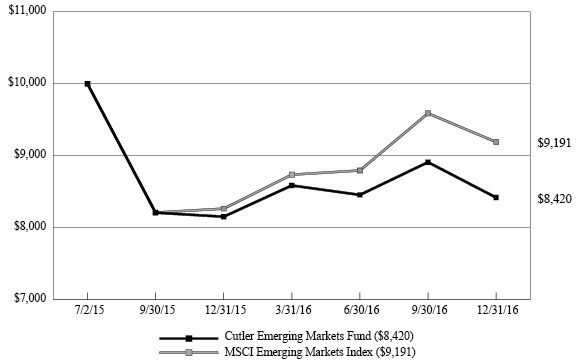
Average Annual Total Returns
(for periods ended December 31, 2016) |
| | 1 Year | Since
Inception(b) | |
Cutler Emerging Markets Fund(a) | 3.27% | (10.82%) | |
MSCI Emerging Markets Index(c) | 11.19% | (5.46%) | |
| | | | | |
(a) | Returns shown do not reflect the deduction of taxes a shareholder would pay on Fund distributions or the redemption of Fund shares. | |
(b) | The Fund commenced operations on July 2, 2015. | |
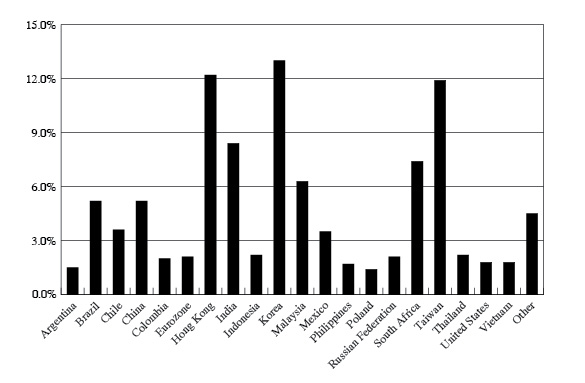
(c) | The MSCI Emerging Markets Index captures large and mid cap representation across 23 emerging markets: Brazil, Chile, China, Colombia, Czech Republic, Egypt, Greece, Hungary, India, Indonesia, Korea, Malaysia, Mexico, Peru, Philippines, Poland, Russia, Qatar, South Africa, Taiwan, Thailand, Turkey and United Arab Emirates. The index is unmanaged and shown for illustration purposes only. An investor cannot invest in an index and its returns are not indicative of the performance of any specific investment. | |
6
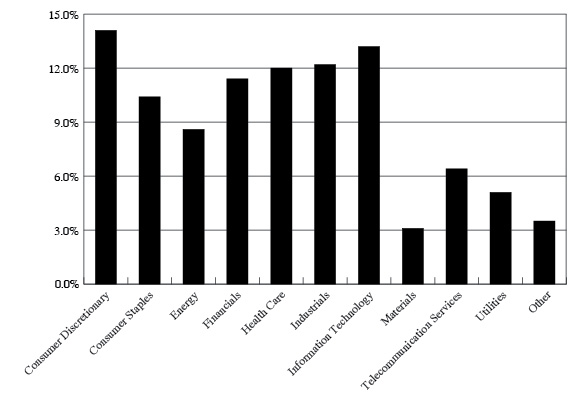
CUTLER EQUITY FUND
PORTFOLIO INFORMATION
December 31, 2016 (Unaudited)
Sector Allocation (% of Net Assets)
7
CUTLER FIXED INCOME FUND
PORTFOLIO INFORMATION
December 31, 2016 (Unaudited)
Asset Allocation (% of Net Assets)

8
CUTLER EMERGING MARKETS FUND
PORTFOLIO INFORMATION
December 31, 2016 (Unaudited)
Country Allocation (% of Net Assets)
9
CUTLER EQUITY FUND
SCHEDULE OF INVESTMENTS
December 31, 2016 (Unaudited) | |
COMMON STOCKS — 96.5% | | Shares | | | Value | |
Consumer Discretionary — 14.1% | | | | | | |
Hotels, Restaurants & Leisure — 3.5% | | | | | | |
McDonald's Corporation | | | 39,655 | | | $ | 4,826,807 | |
| | | | | | | | | |
Media — 3.7% | | | | | | | | |
Walt Disney Company (The) | | | 48,992 | | | | 5,105,946 | |
| | | | | | | | | |
Multi-Line Retail — 3.0% | | | | | | | | |
Target Corporation | | | 57,650 | | | | 4,164,059 | |
| | | | | | | | | |
Specialty Retail — 3.9% | | | | | | | | |
Home Depot, Inc. (The) | | | 40,700 | | | | 5,457,056 | |
| | | | | | | | | |
Consumer Staples — 10.4% | | | | | | | | |
Beverages — 2.9% | | | | | | | | |
PepsiCo, Inc. | | | 37,995 | | | | 3,975,417 | |
| | | | | | | | | |
Food & Staples Retailing — 4.8% | | | | | | | | |
Kroger Company (The) | | | 85,206 | | | | 2,940,459 | |
Wal-Mart Stores, Inc. | | | 53,677 | | | | 3,710,154 | |
| | | | | | | | 6,650,613 | |
Household Products — 2.7% | | | | | | | | |
Procter & Gamble Company (The) | | | 45,130 | | | | 3,794,531 | |
| | | | | | | | | |
Energy — 8.6% | | | | | | | | |
Energy Equipment & Services — 1.7% | | | | | | | | |
Schlumberger Ltd. | | | 27,000 | | | | 2,266,650 | |
| | | | | | | | | |
Oil, Gas & Consumable Fuels — 6.9% | | | | | | | | |
Chevron Corporation | | | 43,820 | | | | 5,157,614 | |
Exxon Mobil Corporation | | | 49,563 | | | | 4,473,557 | |
| | | | | | | | 9,631,171 | |
Financials — 11.4% | | | | | | | | |
Banks — 3.2% | | | | | | | | |
M&T Bank Corporation | | | 28,340 | | | | 4,433,226 | |
| | | | | | | | | |
Capital Markets — 5.7% | | | | | | | | |
BlackRock, Inc. | | | 11,484 | | | | 4,370,121 | |
Northern Trust Corporation | | | 39,000 | | | | 3,472,950 | |
| | | | | | | | 7,843,071 | |
Consumer Finance — 2.5% | | | | | | | | |
American Express Company | | | 47,395 | | | | 3,511,022 | |
10
CUTLER EQUITY FUND
SCHEDULE OF INVESTMENTS (Continued) | |
COMMON STOCKS — 96.5% (Continued) | | Shares | | | Value | |
Health Care — 12.0% | | | | | | |
Health Care Equipment & Supplies — 3.3% | | | | | | |
Becton, Dickinson & Company | | | 27,525 | | | $ | 4,556,764 | |
| | | | | | | | | |
Pharmaceuticals — 8.7% | | | | | | | | |
Bristol-Myers Squibb Company | | | 71,490 | | | | 4,177,875 | |
Johnson & Johnson | | | 37,170 | | | | 4,282,356 | |
Merck & Company, Inc. | | | 62,790 | | | | 3,696,447 | |
| | | | | | | | 12,156,678 | |
Industrials — 12.2% | | | | | | | | |
Aerospace & Defense — 2.7% | | | | | | | | |
United Technologies Corporation | | | 34,510 | | | | 3,782,986 | |
| | | | | | | | | |
Air Freight & Logistics — 3.1% | | | | | | | | |
United Parcel Service, Inc. - Class B | | | 37,950 | | | | 4,350,588 | |
| | | | | | | | | |
Machinery — 6.4% | | | | | | | | |
Caterpillar, Inc. | | | 44,280 | | | | 4,106,527 | |
Deere & Company | | | 45,944 | | | | 4,734,070 | |
| | | | | | | | 8,840,597 | |
Information Technology — 13.2% | | | | | | | | |
Semiconductors & Semiconductor Equipment — 9.6% | | | | | | | | |
Intel Corporation | | | 107,465 | | | | 3,897,755 | |
QUALCOMM, Inc. | | | 56,924 | | | | 3,711,445 | |
Texas Instruments, Inc. | | | 78,900 | | | | 5,757,333 | |
| | | | | | | | 13,366,533 | |
Software — 3.6% | | | | | | | | |
Microsoft Corporation | | | 81,425 | | | | 5,059,750 | |
| | | | | | | | | |
Materials — 3.1% | | | | | | | | |
Chemicals — 3.1% | | | | | | | | |
E.I. du Pont de Nemours and Company | | | 58,405 | | | | 4,286,927 | |
| | | | | | | | | |
Telecommunication Services — 6.4% | | | | | | | | |
Diversified Telecommunication Services — 6.4% | | | | | | | | |
AT&T, Inc. | | | 109,403 | | | | 4,652,909 | |
Verizon Communications, Inc. | | | 80,786 | | | | 4,312,357 | |
| | | | | | | | 8,965,266 | |
Utilities — 5.1% | | | | | | | | |
Gas Utilities — 2.1% | | | | | | | | |
National Fuel Gas Company | | | 52,145 | | | | 2,953,493 | |
11
CUTLER EQUITY FUND
SCHEDULE OF INVESTMENTS (Continued) | |
COMMON STOCKS — 96.5% (Continued) | | Shares | | | Value | |
Utilities — 5.1% (Continued) | | | | | | |
Multi-Utilities — 3.0% | | | | | | |
Dominion Resources, Inc. | | | 53,243 | | | $ | 4,077,881 | |
| | | | | | | | | |
Total Common Stocks (Cost $91,851,461) | | | | | | $ | 134,057,032 | |
| |
MONEY MARKET FUNDS — 3.5% | | Shares | | | Value | |
Invesco STIT Government & Agency Portfolio – Institutional Class, 0.43% (a) (Cost $4,926,364) | | | 4,926,364 | | | $ | 4,926,364 | |
| | | | | | | | | |
Total Investments at Value — 100.0% (Cost $96,777,825) | | | | | | $ | 138,983,396 | |
| | | | | | | | | |
Other Assets in Excess of Liabilities — 0.0% (b) | | | | | | | 21,625 | |
| | | | | | | | | |
Net Assets — 100.0% | | | | | | $ | 139,005,021 | |
(a) | The rate shown is the 7-day effective yield as of December 31, 2016. |
(b) | Percentage rounds to less than 0.1%. |
See accompanying notes to financial statements. |
12
CUTLER FIXED INCOME FUND
SCHEDULE OF INVESTMENTS
December 31, 2016 (Unaudited) | |
U.S. TREASURY OBLIGATIONS — 14.3% | Coupon | Maturity | | Par Value | | | Value | |
U.S. Treasury Notes | 1.625% | 02/15/26 | | $ | 1,300,000 | | | $ | 1,214,687 | |
U.S. Treasury Notes | 1.625% | 05/15/26 | | | 900,000 | | | | 839,250 | |
U.S. Treasury Bonds | 2.500% | 02/15/46 | | | 250,000 | | | | 222,148 | |
U.S. Treasury Bonds, Stripped Principal Payment | 2.500%(a) | 11/15/44 | | | 600,000 | | | | 249,712 | |
| | | | | | |
Total U.S. Treasury Obligations (Cost $2,740,143) | | | $ | 2,525,797 | |
| |
U.S. GOVERNMENT AGENCY OBLIGATIONS — 15.2% | Coupon | Maturity | | Par Value | | | Value | |
Federal Farm Credit Bank — 4.6% | | | | | | | | |
Federal Farm Credit Bank | 2.750% | 06/26/23 | | $ | 500,000 | | | $ | 510,275 | |
Federal Farm Credit Bank | 2.370% | 05/01/25 | | | 300,000 | | | | 294,272 | |
| | | | | | | | | | 804,547 | |
Federal Home Loan Bank — 7.5% | | | | | | | | | | |
Federal Home Loan Bank | 1.250% | 11/08/21 | | | 1,000,000 | | | | 980,121 | |
Federal Home Loan Bank | 2.125% | 03/10/23 | | | 350,000 | | | | 346,119 | |
| | | | | | | | | | 1,326,240 | |
Private Export Funding Corporation — 2.2% | | | | | | | | | | |
Private Export Funding Corporation | 4.300% | 12/15/21 | | | 350,000 | | | | 385,188 | |
| | | | | | | | | | | |
U.S. Department of Housing and Urban Development — 0.9% | | | | | | | | | | |
U.S. Department of Housing and Urban Development | 4.130% | 08/01/25 | | | 150,000 | | | | 160,386 | |
| | | | | | |
Total U.S. Government Agency Obligations (Cost $2,668,897) | | | $ | 2,676,361 | |
| |
MORTGAGE-BACKED SECURITIES — 64.0% | Coupon | Maturity | | Par Value | | | Value | |
Commercial — 11.3% | | | | | | | | |
Banc of America Commercial Mortgage Trust, IO, Series 2004-4 | 0.028%(b) | 07/01/42 | | $ | 1,650,181 | | | $ | 567 | |
Bear Stearns Commercial Mortgage Securities Trust, Series 2005-T20 | 5.290%(b) | 10/12/42 | | | 200,000 | | | | 180,487 | |
Credit Suisse First Boston Mortgage Securities Corporation, IO, Series 2004-C1, 144A | 0.878%(b) | 01/15/37 | | | 4,151,327 | | | | 102,108 | |
13
CUTLER FIXED INCOME FUND
SCHEDULE OF INVESTMENTS (Continued) | |
MORTGAGE-BACKED SECURITIES — 64.0% (Continued) | Coupon | Maturity | | Par Value | | | Value | |
Commercial — 11.3% (Continued) | | | | | | | | |
FREMF Mortgage Trust, IO, Series 2011-K15 | 0.092%(b) | 08/01/44 | | $ | 115,169,210 | | | $ | 413,354 | |
GMAC Commercial Mortgage Securities, Inc. Trust, IO,
Series 1997-C1 | 1.514%(b) | 07/15/29 | | | 7,887,234 | | | | 195,148 | |
JP Morgan Chase Commercial Mortgage Securties Trust,
Series 2006-LDP8 | 5.549%(b) | 05/15/45 | | | 500,000 | | | | 500,721 | |
Merrill Lynch Mortgage Trust, IO, Series 2008-C1, 144A | 0.347%(b) | 02/12/51 | | | 111,745,920 | | | | 217,837 | |
Morgan Stanley Capital I Trust, IO, Series 1998-HF2 | 1.023%(b) | 11/01/30 | | | 1,106,974 | | | | 10,253 | |
Wachovia Bank Commercial Mortgage Trust, IO, Series 2005-C21 (c) | 0.049%(b) | 10/01/44 | | | 385,591,245 | | | | 369,396 | |
| | | | | | | | | | 1,989,871 | |
Federal Home Loan Mortgage Corporation — 2.6% | | | | | | | | | | |
FHLMC, IO, Series K717 | 0.508%(b) | 09/01/21 | | | 19,755,554 | | | | 402,170 | |
FHLMC, Pool #J13584 | 3.500% | 11/01/25 | | | 36,404 | | | | 38,219 | |
FHLMC, Series 1963 | 7.500% | 01/01/27 | | | 19,708 | | | | 22,322 | |
| | | | | | | | | | 462,711 | |
Federal National Mortgage Association — 39.9% | | | | | | | | | | |
FANNIEMAE-ACES, IO,
Series 2012-M14 | 4.182%(b) | 02/25/17 | | | 1,707,311 | | | | 4,880 | |
FANNIEMAE-ACES, IO,
Series 2013-M4 (c) | 3.921%(b) | 02/25/18 | | | 7,200,046 | | | | 214,547 | |
FANNIEMAE-ACES, IO,
Series 2013-M13 | 0.168%(b) | 05/01/18 | | | 130,821,930 | | | | 78,402 | |
FANNIEMAE-ACES, IO,
Series 2014-M8 | 4.324%(b) | 05/25/18 | | | 6,969,897 | | | | 48,998 | |
FANNIEMAE-ACES, IO,
Series 2015-M3 (c) | 4.260%(b) | 06/25/18 | | | 7,865,932 | | | | 192,778 | |
FANNIEMAE-ACES, IO,
Series 2006-M1 | 5.385%(b) | 06/01/19 | | | 11,205 | | | | 11,321 | |
FANNIEMAE-ACES, IO,
Series 2009-M1 | 0.608%(b) | 07/25/19 | | | 16,027,875 | | | | 234,186 | |
FANNIEMAE-ACES, IO,
Series 2010-M1 | 0.399%(b) | 09/25/19 | | | 10,638,460 | | | | 123,082 | |
FANNIEMAE-ACES, IO,
Series 2010-M3 (c) | 0.308%(b) | 03/25/20 | | | 21,801,243 | | | | 342,563 | |
FANNIEMAE-ACES, IO,
Series 2010-M4 (c) | 0.742%(b) | 06/25/20 | | | 14,325,840 | | | | 365,753 | |
14
CUTLER FIXED INCOME FUND
SCHEDULE OF INVESTMENTS (Continued) | |
MORTGAGE-BACKED SECURITIES — 64.0% (Continued) | Coupon | Maturity | | Par Value | | | Value | |
Federal National Mortgage Association — 39.9% (Continued) | | | | | | | | |
FANNIEMAE-ACES, IO,
Series 2010-M5 | 0.878%(b) | 07/25/20 | | $ | 11,137,477 | | | $ | 329,939 | |
FANNIEMAE-ACES, IO,
Series 2011-M9 (c) | 0.084%(b) | 01/25/21 | | | 38,875,799 | | | | 184,077 | |
FANNIEMAE-ACES, IO,
Series 2011-M2 (c) | 0.020%(b) | 04/25/21 | | | 27,987,747 | | | | 326,225 | |
FANNIEMAE-ACES, IO,
Series 2011-M1 | 0.018%(b) | 06/25/21 | | | 41,314,038 | | | | 328,492 | |
FANNIEMAE-ACES, IO,
Series 2012-M1 (c) | 0.066%(b) | 10/25/21 | | | 85,474,941 | | | | 524,047 | |
FANNIEMAE-ACES, IO,
Series 2013-M5 | 2.292%(b) | 01/01/22 | | | 6,377,749 | | | | 459,036 | |
FANNIEMAE-ACES, IO,
Series 2012-M2 (c) | 0.736%(b) | 02/25/22 | | | 15,720,708 | | | | 529,961 | |
FANNIEMAE-ACES, IO,
Series 2012-M4 | 0.626%(b) | 04/25/22 | | | 13,032,023 | | | | 352,812 | |
FANNIEMAE-ACES, IO,
Series 2015-M4 (c) | 0.566%(b) | 07/25/22 | | | 14,839,304 | | | | 363,993 | |
FANNIEMAE-ACES, IO,
Series 2012-M14 | 0.495%(b) | 09/25/22 | | | 3,457,783 | | | | 76,200 | |
FANNIEMAE-ACES, IO,
Series 2014-M3 (c) | 0.103%(b) | 01/25/24 | | | 36,717,367 | | | | 279,236 | |
FANNIEMAE-ACES, IO,
Series 2014-M9 (c) | 0.147%(b) | 07/25/24 | | | 28,998,445 | | | | 402,962 | |
FANNIEMAE-ACES, IO,
Series 2014-M13 (c) | 0.131%(b) | 08/25/24 | | | 12,865,477 | | | | 178,303 | |
FANNIEMAE-ACES, IO,
Series 2015-M1 | 0.553%(b) | 09/25/24 | | | 30,028,147 | | | | 1,050,904 | |
FNMA, Series 2003-3 | 5.000% | 02/01/18 | | | 3,344 | | | | 3,391 | |
FNMA, Pool #899237 | 5.000% | 03/01/22 | | | 5,936 | | | | 6,075 | |
FNMA, Series 2002-93 | 6.500% | 03/01/32 | | | 35,046 | | | | 38,680 | |
| | | | | | | | | | 7,050,843 | |
Government National Mortgage Association — 10.2% | | | | | | | | | | |
GNMA, Pool #577742 | 5.500% | 09/01/17 | | | 555 | | | | 599 | |
GNMA, IO, Series 2011-121 | 5.392%(b) | 03/16/43 | | | 1,261,561 | | | | 201,411 | |
GNMA, IO, Series 2014-9 | 0.921%(b) | 02/16/48 | | | 8,312,353 | | | | 408,442 | |
GNMA, IO, Series 2010-100 | 0.261%(b) | 07/16/50 | | | 8,257,319 | | | | 172,477 | |
GNMA, IO, Series 2012-4 | 0.584%(b) | 05/16/52 | | | 2,776,455 | | | | 59,154 | |
GNMA, IO, Series 2012-114 | 0.832%(b) | 01/16/53 | | | 3,821,831 | | | | 225,945 | |
GNMA, IO, Series 2012-125 (c) | 0.493%(b) | 02/16/53 | | | 15,271,084 | | | | 565,507 | |
15
CUTLER FIXED INCOME FUND
SCHEDULE OF INVESTMENTS (Continued) | |
MORTGAGE-BACKED SECURITIES — 64.0% (Continued) | Coupon | Maturity | | Par Value | | | Value | |
Government National Mortgage Association — 10.2% | | | | | | | | |
GNMA, IO, Series 2012-107 | 0.567%(b) | 12/16/53 | | $ | 4,083,231 | | | $ | 160,213 | |
| | | | | 1,793,748 | |
| | | | | | |
Total Mortgage-Backed Securities (Cost $13,427,817) | | | $ | 11,297,173 | |
| |
CORPORATE BONDS — 1.6% | Coupon | Maturity | | Par Value | | | Value | |
Financials — 1.6% | | | | | | | | |
Finial Holdings, Inc. (Cost $287,481) | 7.125% | 10/15/23 | | $ | 250,000 | | | $ | 289,583 | |
| |
MONEY MARKET FUNDS — 2.9% | | Shares | | | Value | |
Invesco STIT Government & Agency Portfolio – Institutional Class, 0.43% (d) (Cost $514,870) | | | 514,870 | | | $ | 514,870 | |
| | | | | | | | | |
Total Investments at Value — 98.0% (Cost $19,639,208) | | | | | | $ | 17,303,784 | |
| | | | | | | | | |
Other Assets in Excess of Liabilities — 2.0% | | | | | | | 359,212 | |
| | | | | | | | | |
Net Assets — 100.0% | | | | | | $ | 17,662,996 | |
IO - Interest only strip. Par value shown is the notional value, not a true par value (Note 6).
144A - This is a restricted security that was sold in a transaction exempt under Rule 144A of the Securities Act of 1933. This security may be sold in transactions exempt from registration, normally to qualified institutional buyers. The total value of such securities is $319,945 as of December 31, 2016.
(a) | Rate shown is the annualized yield at the time of purchase, not a coupon rate. |
(b) | Variable rate security. The rate shown is the effective interest rate as of December 31, 2016. |
(c) | Fair value priced (Note 2). Fair valued securities totaled $4,839,348 at December 31, 2016, representing 27.4% of net assets. |
(d) | The rate shown is the 7-day effective yield as of December 31, 2016. |
See accompanying notes to financial statements. |
16
CUTLER EMERGING MARKETS FUND
SCHEDULE OF INVESTMENTS
December 31, 2016 (Unaudited) | |
COMMON STOCKS — 83.9% | | Shares | | | Value | |
Brazil — 5.2% | | | | | | |
Ambev S.A. - ADR | | | 29,510 | | | $ | 144,894 | |
Embraer S.A. - ADR | | | 5,845 | | | | 112,516 | |
Itau Unibanco Holding S.A. - ADR | | | 19,270 | | | | 198,096 | |
| | | | | | | | 455,506 | |
Chile — 3.6% | | | | | | | | |
Empresa Nacional de Telecomunicaciones S.A. (a) | | | 17,614 | | | | 186,835 | |
Viña Concha Y Toro S.A. | | | 79,500 | | | | 127,542 | |
| | | | | | | | 314,377 | |
China — 5.2% | | | �� | | | | | |
Huaneng Power International, Inc. - ADR | | | 3,931 | | | | 102,363 | |
PetroChina Company Ltd. - ADR | | | 2,076 | | | | 153,001 | |
Sinopec Shanghi Petrochemical Company Ltd. - ADR | | | 3,704 | | | | 200,498 | |
| | | | | | | | 455,862 | |
Colombia — 2.0% | | | | | | | | |
Grupo de Inversiones Suramericana S.A. | | | 13,500 | | | | 171,814 | |
| | | | | | | | | |
Hong Kong — 12.2% | | | | | | | | |
China Overseas Land & Investment Ltd. (b) | | | 49,000 | | | | 128,927 | |
China Overseas Property Holdings Ltd. (b) | | | 15,666 | | | | 2,675 | |
China Resources Beer Holdings Company Ltd. (a) (b) | | | 104,000 | | | | 206,046 | |
China Resources Land Ltd. (b) | | | 68,000 | | | | 152,163 | |
CITIC Ltd. (b) | | | 107,000 | | | | 152,385 | |
COSCO SHIPPING PORTS Ltd. (b) | | | 12,000 | | | | 12,026 | |
Lenovo Group Ltd. - ADR | | | 8,206 | | | | 98,480 | |
Shanghi Industrial Holdings Ltd. (b) | | | 69,000 | | | | 186,031 | |
Tingyi (Cayman Islands) Holding Corporation (b) | | | 110,000 | | | | 133,357 | |
| | | | | | | | 1,072,090 | |
India — 6.1% | | | | | | | | |
Dr. Reddy's Laboratories Ltd. - ADR | | | 2,651 | | | | 120,037 | |
HDFC Bank Ltd. - ADR | | | 1,970 | | | | 119,540 | |
ICICI Bank Ltd. - ADR | | | 21,160 | | | | 158,488 | |
Infosys Ltd. - ADR | | | 9,128 | | | | 135,368 | |
| | | | | | | | 533,433 | |
Indonesia — 2.2% | | | | | | | | |
Telekomunikasi Indonesia Persero Tbk PT - ADR | | | 6,514 | | | | 189,948 | |
| | | | | | | | | |
Korea (Republic of) — 13.0% | | | | | | | | |
AMOREPACIFIC Group (a) (b) | | | 710 | | | | 78,093 | |
Dongbu Insurance Company Ltd. (a) (b) | | | 2,159 | | | | 111,861 | |
Korea Gas Corporation (a) (b) | | | 3,880 | | | | 155,833 | |
KT Corporation - ADR | | | 11,956 | | | | 168,460 | |
LG Corporation (a) (b) | | | 2,775 | | | | 137,879 | |
17
CUTLER EMERGING MARKETS FUND
SCHEDULE OF INVESTMENTS (Continued) | |
COMMON STOCKS — 83.9% (Continued) | | Shares | | | Value | |
Korea (Republic of) — 13.0% (Continued) | | | | | | |
POSCO - ADR | | | 2,401 | | | $ | 126,172 | |
Samsung Electronics Company Ltd. (b) | | | 188 | | | | 280,016 | |
Samsung Fire & Marine Insurance Company Ltd. (a) (b) | | | 370 | | | | 82,275 | |
| | | | | | | | 1,140,589 | |
Malaysia — 5.3% | | | | | | | | |
CIMB Group Holdings Berhad (b) | | | 158,023 | | | | 158,426 | |
Genting Berhad (b) | | | 84,200 | | | | 149,904 | |
Malayan Banking Berhad (b) | | | 84,633 | | | | 154,476 | |
| | | | | | | | 462,806 | |
Mexico — 3.5% | | | | | | | | |
America Móvil S.A.B. de C.V. - Series L - ADR | | | 13,023 | | | | 163,699 | |
Coca-Cola Femsa S.A.B. de C.V. - Series L | | | 22,700 | | | | 143,898 | |
| | | | | | | | 307,597 | |
Philippines — 1.7% | | | | | | | | |
Universal Robina Corporation (b) | | | 45,370 | | | | 149,425 | |
| | | | | | | | | |
Russian Federation — 2.1% | | | | | | | | |
Surgutneftegas OJSC - ADR | | | 36,500 | | | | 187,245 | |
| | | | | | | | | |
South Africa — 7.4% | | | | | | | | |
Liberty Holdings Ltd. (b) | | | 16,865 | | | | 135,347 | |
Naspers Ltd. - N Shares - ADR | | | 11,670 | | | | 170,615 | |
Sasol Ltd. - ADR | | | 3,802 | | | | 108,699 | |
Shoprite Holdings Ltd. (b) | | | 10,000 | | | | 124,969 | |
Shoprite Holdings Ltd. - ADR | | | 8,803 | | | | 109,537 | |
| | | | | | | | 649,167 | |
Taiwan Province of China — 10.4% | | | | | | | | |
Cheng Shin Rubber Industry Company Ltd. (b) | | | 54,000 | | | | 100,633 | |
Compal Electronics, Inc. (b) | | | 208,000 | | | | 117,955 | |
CTCI Corporation | | | 132,000 | | | | 198,023 | |
Delta Electronics, Inc. (b) | | | 39,100 | | | | 190,835 | |
Giant Manufacturing Company Ltd. (b) | | | 18,000 | | | | 101,197 | |
President Chain Store Corporation (b) | | | 29,000 | | | | 205,805 | |
| | | | | | | | 914,448 | |
Thailand — 2.2% | | | | | | | | |
Charoen Pokphand Foods plc (b) | | | 229,500 | | | | 188,377 | |
| | | | | | | | | |
United States — 1.8% | | | | | | | | |
Southern Copper Corporation | | | 4,890 | | | | 156,187 | |
| | | | | | | | | |
Total Common Stocks (Cost $7,431,130) | | | | | | $ | 7,348,871 | |
18
CUTLER EMERGING MARKETS FUND
SCHEDULE OF INVESTMENTS (Continued) | |
EXCHANGE-TRADED NOTES — 2.3% | | Shares | | | Value | |
iPath MSCI India Index ETN (a) (Cost $209,244) | | | 3,185 | | | $ | 199,381 | |
| |
EXCHANGE-TRADED FUNDS — 9.3% | | Shares | | | Value | |
Global X MSCI Argentina ETF | | | 5,650 | | | $ | 130,296 | |
iShares Currency Hedged MSCI Eurozone ETF | | | 6,738 | | | | 179,231 | |
iShares MSCI Malaysia ETF | | | 3,225 | | | | 90,526 | |
iShares MSCI Taiwan Capped ETF | | | 4,429 | | | | 130,080 | |
VanEck Vectors Poland ETF | | | 9,326 | | | | 125,061 | |
VanEck Vectors Vietnam ETF | | | 12,400 | | | | 161,696 | |
Total Exchange-Traded Funds (Cost $847,371) | | | | | | $ | 816,890 | |
| |
MONEY MARKET FUNDS — 4.4% | | Shares | | | Value | |
Invesco STIT Government & Agency Portfolio – Institutional Class, 0.43% (c) (Cost $383,566) | | | 383,566 | | | $ | 383,566 | |
| | | | | | | | | |
Total Investments at Value — 99.9% (Cost $8,871,311) | | | | | | $ | 8,748,708 | |
| | | | | | | | | |
Other Assets in Excess of Liabilities — 0.1% | | | | | | | 13,448 | |
| | | | | | | | | |
Net Assets — 100.0% | | | | | | $ | 8,762,156 | |
ADR - American Depositary Receipt. |
(a) | Non-income producing security. |
(b) | Fair value priced (Note 2). Fair valued securities totaled $3,596,916 at December 31, 2016, representing 41.1% of net assets. |
(c) | The rate shown is the 7-day effective yield as of December 31, 2016. |
See accompanying notes to financial statements. |
19
CUTLER EMERGING MARKETS FUND
SUMMARY OF COMMON STOCKS
BY SECTOR AND INDUSTRY
December 31, 2016 (Unaudited) |
Sector/Industry | % of Net Assets |
Consumer Discretionary — 6.0% | |
Auto Components | 1.2% |
Hotels, Restaurants & Leisure | 1.7% |
Leisure Products | 1.2% |
Media | 1.9% |
Consumer Staples — 18.4% | |
Beverages | 4.7% |
Food & Staples Retailing | 7.4% |
Food Products | 5.4% |
Personal Products | 0.9% |
Energy — 5.1% | |
Oil, Gas & Consumable Fuels | 5.1% |
Financials — 16.2% | |
Banks | 10.5% |
Diversified Financial Services | 2.0% |
Insurance | 3.7% |
Health Care — 1.4% | |
Pharmaceuticals | 1.4% |
Industrials — 9.2% | |
Aerospace & Defense | 1.3% |
Construction & Engineering | 2.3% |
Industrial Conglomerates | 5.5% |
Transportation Infrastructure | 0.1% |
Information Technology — 9.4% | |
Electronic Equipment, Instruments & Components | 2.2% |
IT Services | 1.5% |
Technology Hardware, Storage & Peripherals | 5.7% |
Materials — 5.5% | |
Chemicals | 2.3% |
Metals & Mining | 3.2% |
Real Estate — 1.7% | |
Real Estate Management & Development | 1.7% |
Telecommunication Services — 8.1% | |
Diversified Telecommunication Services | 4.1% |
Wireless Telecommunication Services | 4.0% |
Utilities — 2.9% | |
Gas Utilities | 1.8% |
Independent Power & Renewable Electricity Producers | 1.1% |
| | 83.9% |
See accompanying notes to financial statements. |
20
THE CUTLER TRUST
STATEMENTS OF ASSETS AND LIABILITIES
December 31, 2016 (Unaudited) | |
| | Cutler
Equity Fund | | | Cutler Fixed
Income Fund | | | Cutler Emerging Markets Fund | |
ASSETS | | | | | | | | | |
Investments in securities: | | | | | | | | | |
At acquisition cost | | $ | 96,777,825 | | | $ | 19,639,208 | | | $ | 8,871,311 | |
At value (Note 2) | | $ | 138,983,396 | | | $ | 17,303,784 | | | $ | 8,748,708 | |
Cash denominated in foreign currency (Cost $5,198) | | | — | | | | — | | | | 5,073 | |
Dividends and interest receivable | | | 201,863 | | | | 394,298 | | | | 20,872 | |
Receivable for capital shares sold | | | 1,685 | | | | 69 | | | | 621 | |
Receivable from Adviser (Note 3) | | | — | | | | — | | | | 3,251 | |
Other assets | | | 18,880 | | | | 7,972 | | | | 3,583 | |
Total assets | | | 139,205,824 | | | | 17,706,123 | | | | 8,782,108 | |
| | | | | | | | | | | | | |
LIABILITIES | | | | | | | | | | | | |
Payable for capital shares redeemed | | | 54,509 | | | | 17,366 | | | | 102 | |
Payable to Adviser (Note 3) | | | 88,548 | | | | 7,461 | | | | — | |
Payable to administrator (Note 3) | | | 17,800 | | | | 6,000 | | | | 6,500 | |
Other accrued expenses | | | 39,946 | | | | 12,300 | | | | 13,350 | |
Total liabilities | | | 200,803 | | | | 43,127 | | | | 19,952 | |
| | | | | | | | | | | | | |
NET ASSETS | | $ | 139,005,021 | | | $ | 17,662,996 | | | $ | 8,762,156 | |
| | | | | | | | | | | | | |
NET ASSETS CONSIST OF: | | | | | | | | | | | | |
Paid-in capital | | $ | 97,923,342 | | | $ | 20,315,468 | | | $ | 8,950,324 | |
Accumulated net investment income (loss) | | | (1,491 | ) | | | (44,256 | ) | | | 7,241 | |
Accumulated net realized losses from security transactions | | | (1,122,401 | ) | | | (272,792 | ) | | | (72,705 | ) |
Net unrealized appreciation (depreciation) on investments | | | 42,205,571 | | | | (2,335,424 | ) | | | (122,603 | ) |
Net unrealized depreciation on translation of assets and liabilities in foreign currencies | | | — | | | | — | | | | (101 | ) |
NET ASSETS | | $ | 139,005,021 | | | $ | 17,662,996 | | | $ | 8,762,156 | |
| | | | | | | | | | | | | |
Shares of beneficial interest outstanding (unlimited number of shares authorized, no par value) | | | 7,721,873 | | | | 2,029,350 | | | | 1,057,227 | |
| | | | | | | | | | | | | |
Net asset value, offering price and redemption price per share (Note 2) | | $ | 18.00 | | | $ | 8.70 | | | $ | 8.29 | |
See accompanying notes to financial statements. |
21
THE CUTLER TRUST
STATEMENTS OF OPERATIONS
For the Six Months Ended December 31, 2016 (Unaudited) | |
| | Cutler
Equity Fund | | | Cutler Fixed
Income Fund | | | Cutler Emerging Markets Fund | |
INVESTMENT INCOME | | | | | | | | | |
Dividend income | | $ | 1,825,229 | | | $ | 765 | | | $ | 130,533 | |
Interest income | | | — | | | | 537,940 | (a) | | | — | |
Foreign withholding taxes on dividends | | | — | | | | — | | | | (12,101 | ) |
Total investment income | | | 1,825,229 | | | | 538,705 | | | | 118,432 | |
| | | | | | | | | | | | | |
EXPENSES | | | | | | | | | | | | |
Investment advisory fees (Note 3) | | | 505,237 | | | | 45,044 | | | | 37,526 | |
Administration fees (Note 3) | | | 101,393 | | | | 36,000 | | | | 39,000 | |
Shareholder servicing fees (Note 3) | | | 87,788 | | | | — | | | | — | |
Professional fees | | | 18,397 | | | | 25,052 | | | | 15,089 | |
Registration and filing fees | | | 9,610 | | | | 7,402 | | | | 4,657 | |
Custody and bank service fees | | | 7,653 | | | | 2,822 | | | | 11,069 | |
Trustees’ fees and expenses (Note 3) | | | 15,658 | | | | 2,088 | | | | 1,003 | |
Pricing costs | | | 371 | | | | 7,165 | | | | 4,367 | |
Postage and supplies | | | 5,171 | | | | 1,887 | | | | 4,544 | |
Insurance expense | | | 9,297 | | | | 1,493 | | | | 759 | |
Printing of shareholder reports | | | 3,225 | | | | 1,992 | | | | 1,459 | |
Other expenses | | | 5,179 | | | | 4,075 | | | | 3,982 | |
Total expenses | | | 768,979 | | | | 135,020 | | | | 123,455 | |
Less fee reductions and expense reimbursements by the Adviser (Note 3) | | | — | | | | — | | | | (55,026 | ) |
Net expenses | | | 768,979 | | | | 135,020 | | | | 68,429 | |
| | | | | | | | | | | | | |
NET INVESTMENT INCOME | | | 1,056,250 | | | | 403,685 | | | | 50,003 | |
| | | | | | | | | | | | | |
REALIZED AND UNREALIZED GAINS (LOSSES) ON INVESTMENTS AND FOREIGN CURRENCY TRANSLATION | | | | | | | | | | | | |
Net realized gains (losses) from: | | | | | | | | | | | | |
Investment transactions | | | 923,028 | | | | (203,784 | ) | | | 128 | |
Foreign currency transactions | | | — | | | | — | | | | (1,235 | ) |
Net change in unrealized appreciation (depreciation) on: | | | | | | | | | | | | |
Investments | | | 6,968,625 | | | | (952,809 | ) | | | (110,538 | ) |
Foreign currency translation | | | — | | | | — | | | | (137 | ) |
NET REALIZED AND UNREALIZED GAINS (LOSSES) ON INVESTMENTS AND FOREIGN CURRENCY TRANSLATION | | | 7,891,653 | | | | (1,156,593 | ) | | | (111,782 | ) |
| | | | | | | | | | | | | |
NET INCREASE (DECREASE) IN NET ASSETS FROM OPERATIONS | | $ | 8,947,903 | | | $ | (752,908 | ) | | $ | (61,779 | ) |
(a) | Includes income received from prepayment penalties for IO securities (Note 6.) |
See accompanying notes to financial statements. |
22
CUTLER EQUITY FUND
STATEMENTS OF CHANGES IN NET ASSETS | |
| | Six Months
Ended
December 31,
2016
(Unaudited) | | | Year
Ended
June 30,
2016 | |
FROM OPERATIONS | | | | | | |
Net investment income | | $ | 1,056,250 | | | $ | 2,155,375 | |
Net realized gains from investment transactions | | | 923,028 | | | | 3,709,722 | |
Net change in unrealized appreciation (depreciation) on investments | | | 6,968,625 | | | | 3,239,050 | |
Net increase in net assets from operations | | | 8,947,903 | | | | 9,104,147 | |
| | | | | | | | | |
DISTRIBUTIONS TO SHAREHOLDERS | | | | | | | | |
From net investment income | | | (1,139,419 | ) | | | (2,076,985 | ) |
From net realized gains | | | (1,318,085 | ) | | | (5,633,681 | ) |
Decrease in net assets from distributions to shareholders | | | (2,457,504 | ) | | | (7,710,666 | ) |
| | | | | | | | | |
CAPITAL SHARE TRANSACTIONS | | | | | | | | |
Proceeds from shares sold | | | 6,754,490 | | | | 16,579,609 | |
Net asset value of shares issued in reinvestment of distributions to shareholders | | | 2,432,424 | | | | 7,635,321 | |
Payments for shares redeemed | | | (8,808,052 | ) | | | (16,212,052 | ) |
Net increase from capital share transactions | | | 378,862 | | | | 8,002,878 | |
| | | | | | | | | |
TOTAL INCREASE IN NET ASSETS | | | 6,869,261 | | | | 9,396,359 | |
| | | | | | | | | |
NET ASSETS | | | | | | | | |
Beginning of period | | | 132,135,760 | | | | 122,739,401 | |
End of period | | $ | 139,005,021 | | | $ | 132,135,760 | |
| | | | | | | | | |
ACCUMULATED (DISTRIBUTIONS IN EXCESS OF) NET INVESTMENT INCOME | | $ | (1,491 | ) | | $ | 81,678 | |
| | | | | | | | | |
CAPITAL SHARE ACTIVITY | | | | | | | | |
Shares sold | | | 386,243 | | | | 1,015,316 | |
Shares reinvested | | | 135,371 | | | | 472,948 | |
Shares redeemed | | | (504,499 | ) | | | (978,883 | ) |
Net increase in shares outstanding | | | 17,115 | | | | 509,381 | |
Shares outstanding at beginning of period | | | 7,704,758 | | | | 7,195,377 | |
Shares outstanding at end of period | | | 7,721,873 | | | | 7,704,758 | |
See accompanying notes to financial statements. |
23
CUTLER FIXED INCOME FUND
STATEMENTS OF CHANGES IN NET ASSETS | |
| | Six Months
Ended
December 31,
2016
(Unaudited) | | | Year
Ended
June 30,
2016 | |
FROM OPERATIONS | | | | | | |
Net investment income | | $ | 403,685 | | | $ | 1,452,071 | |
Net realized gains (losses) from investment transactions | | | (203,784 | ) | | | 222,816 | |
Net change in unrealized appreciation (depreciation) on investments | | | (952,809 | ) | | | (1,156,745 | ) |
Net increase (decrease) in net assets from operations | | | (752,908 | ) | | | 518,142 | |
| | | | | | | | | |
DISTRIBUTIONS TO SHAREHOLDERS | | | | | | | | |
From net investment income | | | (1,174,695 | ) | | | (1,372,984 | ) |
| | | | | | | | | |
CAPITAL SHARE TRANSACTIONS | | | | | | | | |
Proceeds from shares sold | | | 1,181,279 | | | | 2,761,155 | |
Net asset value of shares issued in reinvestment of distributions to shareholders | | | 1,157,824 | | | | 1,353,754 | |
Payments for shares redeemed | | | (1,037,354 | ) | | | (2,402,222 | ) |
Net increase from capital share transactions | | | 1,301,749 | | | | 1,712,687 | |
| | | | | | | | | |
TOTAL INCREASE (DECREASE) IN NET ASSETS | | | (625,854 | ) | | | 857,845 | |
| | | | | | | | | |
NET ASSETS | | | | | | | | |
Beginning of period | | | 18,288,850 | | | | 17,431,005 | |
End of period | | $ | 17,662,996 | | | $ | 18,288,850 | |
| | | | | | | | | |
ACCUMULATED (DISTRIBUTIONS IN EXCESS OF) NET INVESTMENT INCOME | | $ | (44,256 | ) | | $ | 726,754 | |
| | | | | | | | | |
CAPITAL SHARE ACTIVITY | | | | | | | | |
Shares sold | | | 126,158 | | | | 278,143 | |
Shares reinvested | | | 128,928 | | | | 138,586 | |
Shares redeemed | | | (112,497 | ) | | | (242,801 | ) |
Net increase in shares outstanding | | | 142,589 | | | | 173,928 | |
Shares outstanding at beginning of period | | | 1,886,761 | | | | 1,712,833 | |
Shares outstanding at end of period | | | 2,029,350 | | | | 1,886,761 | |
See accompanying notes to financial statements. |
24
CUTLER EMERGING MARKETS FUND
STATEMENTS OF CHANGES IN NET ASSETS | |
| | Six Months
Ended
December 31,
2016
(Unaudited) | | | Period
Ended
June 30,
2016 (a) | |
FROM OPERATIONS | | | | | | |
Net investment income | | $ | 50,003 | | | $ | 83,254 | |
Net realized gains (losses) from: | | | | | | | | |
Investment transactions | | | 128 | | | | (77,414 | ) |
Capital gain distributions from regulated investment companies | | | — | | | | 4,581 | |
Foreign currency transactions | | | (1,235 | ) | | | (14,522 | ) |
Net change in unrealized appreciation (depreciation) on: | | | | | | | | |
Investments | | | (110,538 | ) | | | (12,065 | ) |
Foreign currency translation | | | (137 | ) | | | 36 | |
Net decrease in net assets from operations | | | (61,779 | ) | | | (16,130 | ) |
| | | | | | | | | |
DISTRIBUTIONS TO SHAREHOLDERS | | | | | | | | |
From net investment income | | | (56,835 | ) | | | (53,424 | ) |
| | | | | | | | | |
CAPITAL SHARE TRANSACTIONS | | | | | | | | |
Proceeds from shares sold | | | 2,170,137 | | | | 8,462,679 | |
Net asset value of shares issued in reinvestment of distributions to shareholders | | | 56,835 | | | | 53,424 | |
Payments for shares redeemed | | | (1,474,649 | ) | | | (318,102 | ) |
Net increase from capital share transactions | | | 752,323 | | | | 8,198,001 | |
| | | | | | | | | |
TOTAL INCREASE IN NET ASSETS | | | 633,709 | | | | 8,128,447 | |
| | | | | | | | | |
NET ASSETS | | | | | | | | |
Beginning of period | | | 8,128,447 | | | | — | |
End of period | | $ | 8,762,156 | | | $ | 8,128,447 | |
| | | | | | | | | |
ACCUMULATED NET INVESTMENT INCOME | | $ | 7,241 | | | $ | 15,308 | |
| | | | | | | | | |
CAPITAL SHARE ACTIVITY | | | | | | | | |
Shares sold | | | 249,580 | | | | 1,003,439 | |
Shares reinvested | | | 6,832 | | | | 6,612 | |
Shares redeemed | | | (168,980 | ) | | | (40,256 | ) |
Net increase in shares outstanding | | | 87,432 | | | | 969,795 | |
Shares outstanding at beginning of period | | | 969,795 | | | | — | |
Shares outstanding at end of period | | | 1,057,227 | | | | 969,795 | |
(a) | Represents the period from commencement of operations (July 2, 2015) through June 30, 2016. |
See accompanying notes to financial statements. |
25
CUTLER EQUITY FUND
FINANCIAL HIGHLIGHTS | |
Per Share Data for a Share Outstanding Throughout Each Period | |
| | Six Months
Ended
Dec. 31,
2016 (Unaudited) | | Years Ended June 30, | |
| | 2016 | | | 2015 | | | 2014 | | | 2013 | | | 2012 | |
Net asset value at beginning of period | | $ | 17.15 | | $ | 17.06 | | $ | 17.33 | | $ | 14.94 | | $ | 12.70 | | $ | 12.18 | |
| | | | | | | | | | | | | | | | | | | | |
Income from investment operations: | | | | | | | | | | | | | | | | | | | |
Net investment income | | | 0.14 | | | 0.30 | | | 0.25 | | | 0.22 | | | 0.19 | | | 0.19 | |
Net realized and unrealized gains on investments | | | 1.03 | | | 0.88 | | | 0.02 | (a) | | 2.47 | | | 2.24 | | | 0.52 | |
Total from investment operations | | | 1.17 | | | 1.18 | | | 0.27 | | | 2.69 | | | 2.43 | | | 0.71 | |
| | | | | | | | | | | | | | | | | | | | |
Less distributions from: | | | | | | | | | | | | | | | | | | | |
Net investment income | | | (0.15 | ) | | (0.28 | ) | | (0.25 | ) | | (0.22 | ) | | (0.19 | ) | | (0.19 | ) |
Net realized gains | | | (0.17 | ) | | (0.81 | ) | | (0.29 | ) | | (0.08 | ) | | — | | | — | |
Total distributions | | | (0.32 | ) | | (1.09 | ) | | (0.54 | ) | | (0.30 | ) | | (0.19 | ) | | (0.19 | ) |
| | | | | | | | | | | | | | | | | | | | |
Net asset value at end of period | | $ | 18.00 | | $ | 17.15 | | $ | 17.06 | | $ | 17.33 | | $ | 14.94 | | $ | 12.70 | |
| | | | | | | | | | | | | | | | | | | | |
Total return (b) | | | 6.84 | %(c) | | 7.40 | % | | 1.49 | % | | 18.13 | % | | 19.26 | % | | 5.90 | % |
| | | | | | | | | | | | | | | | | | | | |
Net assets at end of period (000’s) | | $ | 139,005 | | $ | 132,136 | | $ | 122,739 | | $ | 122,230 | | $ | 101,184 | | $ | 49,416 | |
| | | | | | | | | | | | | | | | | | | | |
Ratios/supplementary data: | | | | | | | | | | | | | | | | | | | |
| | | | | | | | | | | | | | | | | | | | |
Ratio of net expenses to average net assets | | | 1.14 | %(d) | | 1.15 | %(e) | | 1.15 | % | | 1.15 | % | | 1.15 | % | | 1.27 | % |
| | | | | | | | | | | | | | | | | | | | |
Ratio of net investment income to average net assets | | | 1.57 | %(d) | | 1.79 | % | | 1.42 | % | | 1.37 | % | | 1.53 | % | | 1.57 | % |
| | | | | | | | | | | | | | | | | | | | |
Portfolio turnover rate | | | 2 | %(c) | | 11 | % | | 14 | % | | 8 | % | | 8 | %(f) | | 9 | % |
(a) | The amount of net gains on investments (both realized and unrealized) does not accord with the amounts reported in the Statement of Changes due to the timing of purchases and redemptions of Fund shares during the period. |
(b) | Total return is a measure of the change in value of an investment in the Fund over the period covered, which assumes any dividends or capital gains distributions are reinvested in shares of the Fund. Returns shown do not reflect the deduction of taxes a shareholder would pay on Fund distributions or the redemption of Fund shares. |
(c) | Not annualized. |
(d) | Annualized. |
(e) | Absent investment advisory fee reductions by the Adviser, the ratio of expenses to average net assets would have been 1.15% for the year ended June 30, 2016 (Note 3). |
(f) | Excludes the value of securities sold to realign the Fund’s portfolio following the merger with The Elite Growth & Income Fund (Note 1). |
See accompanying notes to financial statements. |
26
CUTLER FIXED INCOME FUND
FINANCIAL HIGHLIGHTS | |
Per Share Data for a Share Outstanding Throughout Each Period | |
| | Six Months
Ended
Dec. 31,
2016 (Unaudited) | | Year
Ended
June 30, 2016 | | Year
Ended
June 30, 2015 | | Year
Ended
June 30, 2014 | | Nine
Months
Ended
June 30,
2013(a) | |
Years Ended
September 30,
| |
| | 2012 | | | 2011 | |
Net asset value at beginning of period | $ | 9.69 | | $ | 10.18 | | $ | 10.01 | | $ | 9.98 | | $ | 10.40 | | $ | 10.27 | | $ | 10.79 | |
| | | | | | | | | | | | | | | | | | | | | | |
Income (loss) from investment operations: | | | | | | | | | | | | | | | | | | | | | |
Net investment income | | 0.20 | | | 0.79 | | | 0.49 | | | 0.05 | | | 0.05 | | | 0.21 | | | 0.28 | |
Net realized and unrealized gains (losses) on investments | | (0.58 | ) | | (0.50 | ) | | (0.12 | ) | | 0.17 | | | (0.27 | ) | | 0.31 | | | (0.09 | ) |
Total from investment operations | | (0.38 | ) | | 0.29 | | | 0.37 | | | 0.22 | | | (0.22 | ) | | 0.52 | | | 0.19 | |
| | | | | | | | | | | | | | | | | | | | | | |
Less distributions from: | | | | | | | | | | | | | | | | | | | | | |
Net investment income | | (0.61 | ) | | (0.78 | ) | | (0.20 | ) | | (0.14 | ) | | (0.20 | ) | | (0.39 | ) | | (0.46 | ) |
Net realized gains | | — | | | — | | | — | | | (0.05 | ) | | — | | | — | | | (0.25 | ) |
Total distributions | | (0.61 | ) | | (0.78 | ) | | (0.20 | ) | | (0.19 | ) | | (0.20 | ) | | (0.39 | ) | | (0.71 | ) |
| | | | | | | | | | | | | | | | | | | | | | |
Net asset value at end of period | $ | 8.70 | | $ | 9.69 | | $ | 10.18 | | $ | 10.01 | | $ | 9.98 | | $ | 10.40 | | $ | 10.27 | |
| | | | | | | | | | | | | | | | | | | | | | |
Total return (b) | | (4.08 | %)(c) | | 2.91 | % | | 3.65 | % | | 2.26 | % | | (2.16 | %)(c) | | 5.07 | % | | 1.87 | % |
| | | | | | | | | | | | | | | | | | | | | | |
Net assets at end of period (000’s) | $ | 17,663 | | $ | 18,289 | | $ | 17,431 | | $ | 14,941 | | $ | 16,262 | | $ | 19,693 | | $ | 21,242 | |
| | | | | | | | | | | | | | | | | | | | | | |
Ratios/supplementary data: | | | | | | | | | | | | | | | | | | | | | |
| | | | | | | | | | | | | | | | | | | | | | |
Ratio of expenses to average net assets | | 1.50 | %(d) | | 1.36 | % | | 1.41 | % | | 1.52 | % | | 1.54 | %(d) | | 1.52 | % | | 1.28 | % |
| | | | | | | | | | | | | | | | | | | | | | |
Ratio of net investment income to average net assets | | 4.48 | %(d)(e) | | 8.42 | %(e) | | 4.95 | %(e) | | 0.61 | % | | 0.95 | %(d) | | 2.03 | % | | 2.51 | % |
| | | | | | | | | | | | | | | | | | | | | | |
Portfolio turnover rate | | 3 | %(c) | | 71 | % | | 85 | % | | 55 | % | | 34 | %(c) | | 53 | % | | 83 | % |
(a) | Fund changed its fiscal year end to June 30. |
(b) | Total return is a measure of the change in value of an investment in the Fund over the period covered, which assumes any dividends or capital gains distributions are reinvested in shares of the Fund. Returns shown do not reflect the deduction of taxes a shareholder would pay on Fund distributions or the redemption of Fund shares. |
(c) | Not annualized. |
(d) | Annualized. |
(e) | Ratio includes income from prepayment penalties received for IO securities of 12.38%(d), 6.90% and 4.57% of average net assets for the periods ended December 31, 2016, June 30, 2016 and June 30, 2015, respectively (Note 6). |
See accompanying notes to financial statements. |
27
CUTLER EMERGING MARKETS FUND
FINANCIAL HIGHLIGHTS | |
Per Share Data for a Share Outstanding Throughout Each Period | |
| | | Six Months
Ended
Dec. 31,
2016 (Unaudited) | | | Period Ended
June 30, 2016 (a) | |
|
Net asset value at beginning of period | | $ | 8.38 | | | $ | 10.00 | |
| | | | | | | | | |
Income (loss) from investment operations: | | | | | | | | |
Net investment income | | | 0.05 | | | | 0.10 | |
Net realized and unrealized losses on investments | | | (0.09 | ) | | | (1.65 | ) |
Total from investment operations | | | (0.04 | ) | | | (1.55 | ) |
| | | | | | | | | |
Less distributions from: | | | | | | | | |
Net investment income | | | (0.05 | ) | | | (0.07 | ) |
| | | | | | | | | |
Net asset value at end of period | | $ | 8.29 | | | $ | 8.38 | |
| | | | | | | | | |
Total return (b) | | | (0.43 | %)(c) | | | (15.43 | %)(c) |
| | | | | | | | | |
Net assets at end of period (000’s) | | $ | 8,762 | | | $ | 8,128 | |
| | | | | | | | | |
Ratios/supplementary data: | | | | | | | | |
| | | | | | | | | |
Ratio of net expenses to average net assets (d) | | | 1.55 | %(e) | | | 1.55 | %(e) |
| | | | | | | | | |
Ratio of net investment income to average net assets | | | 1.13 | %(e) | | | 1.56 | %(e) |
| | | | | | | | | |
Portfolio turnover rate | | | 0 | %(c)(f) | | | 10 | %(c) |
(a) | Represents the period from the commencement of operations (July 2, 2015) through June 30, 2016. |
(b) | Total return is a measure of the change in value of an investment in the Fund over the period covered, which assumes any dividends or capital gains distributions are reinvested in shares of the Fund. Returns shown do not reflect the deduction of taxes a shareholder would pay on Fund distributions or the redemption of Fund shares. |
(c) | Not annualized. |
(d) | Absent investment advisory fee reductions and expense reimbursements by the Adviser, the ratio of expenses to average net assets would have been 2.80%(e) and 3.85%(e) for the periods ended December 31, 2016 and June 30, 2016, respectively (Note 3). |
(e) | Annualized. |
(f) | Amount rounds to less than 1%. |
See accompanying notes to financial statements. |
28
THE CUTLER TRUST
NOTES TO FINANCIAL STATEMENTS
December 31, 2016 (Unaudited)
1. Organization
Cutler Equity Fund, Cutler Fixed Income Fund and Cutler Emerging Markets Fund (individually, a “Fund” and collectively, the “Funds”) are each a diversified series of The Cutler Trust (the “Trust”). The Trust is a Delaware statutory trust that is registered as an open-end management investment company under the Investment Company Act of 1940 (the “1940 Act”). Under its Trust Instrument, the Trust is authorized to issue an unlimited number of Fund shares of beneficial interest without par value.
Cutler Equity Fund commenced operations on October 2, 1992. On September 28, 2012, Cutler Equity Fund consummated a tax-free merger with The Elite Growth & Income Fund, previously a series of The Elite Group of Mutual Funds. Pursuant to the terms of the agreement governing the merger, each share of The Elite Growth & Income Fund was converted into an equivalent dollar amount of shares of Cutler Equity Fund, based on the net asset value of Cutler Equity Fund and The Elite Growth & Income Fund as of September 27, 2012. The basis of the assets transferred from The Elite Growth & Income Fund reflected the historical basis of the assets as of the date of the tax-free merger. Cutler Equity Fund seeks current income and long-term capital appreciation.
The Elite Income Fund (the “Predecessor Fund”), a series of The Elite Group of Mutual Funds, was reorganized into Cutler Fixed Income Fund (the “Reorganization”) effective September 28, 2012, pursuant to an Agreement and Plan of Reorganization. The Reorganization was approved by the shareholders of the Predecessor Fund at a meeting held on September 27, 2012. The Predecessor Fund transferred all its assets to Cutler Fixed Income Fund in exchange for shares of Cutler Fixed Income Fund and the assumption by Cutler Fixed Income Fund of all the known liabilities of the Predecessor Fund. Cutler Fixed Income Fund did not have any significant assets or liabilities immediately prior to the consummation of the Reorganization. The Reorganization was treated as a tax-free reorganization for federal income tax purposes and, accordingly, the basis of the assets transferred reflected the historical basis of the assets as of the date of the Reorganization. Cutler Fixed Income Fund seeks to achieve high income over the long-term.
Cutler Emerging Markets Fund commenced operations on July 2, 2015. Cutler Emerging Markets Fund seeks current income and long-term capital appreciation.
2. Significant Accounting Policies
In October 2016, the Securities and Exchange Commission (the “SEC”) released its final rule on Investment Company Reporting Modernization (the “Rule”). The Rule, which introduces two new regulatory reporting forms for investment companies – Form N-PORT and Form N-CEN, also contains amendments to Regulation S-X which impact financial statement presentation, particularly the presentation of derivative investments. Although still evaluating the impact of the
29
THE CUTLER TRUST
NOTES TO FINANCIAL STATEMENTS (Continued)
Rule, management believes that many of the Regulation S-X amendments are consistent with the Funds’ current financial statement presentation and expects that the Funds will be able to comply with the Rule’s Regulation S-X amendments by the August 1, 2017 compliance date.
The following summarizes the significant accounting policies of the Funds. The policies are in conformity with accounting principles generally accepted in the United States of America (“GAAP”). As an investment company, as defined in Financial Accounting Standards Board (“FASB”) Accounting Standards Update 2013-08, the Funds follow accounting and reporting guidance under FASB Accounting Standards Codification Topic 946, “Financial Services – Investment Companies.”
Securities Valuation — Portfolio securities are valued as of the close of regular trading on the New York Stock Exchange (“NYSE”) (normally, 4:00 p.m., Eastern time) on each day the NYSE is open. Exchange traded securities are valued using the last reported sales price on the exchanges on which they are primarily traded. In the absence of a sale, such securities are valued at the mean of the last bid and asked price. Securities which are quoted by NASDAQ are valued at the NASDAQ Official Closing Price. Securities principally traded in non-U.S. markets that may close at different times than U.S. markets are typically fair valued by an independent pricing service and translated from the local currency into U.S. dollars using currency exchange rates supplied by an independent pricing service. Non-exchange traded securities for which over-the-counter quotations are available are generally valued at the closing bid price. Fixed income securities are generally valued using prices provided by an independent pricing service. The independent pricing service uses information with respect to transactions in bonds, quotations from bond dealers, market transactions in comparable securities, and various relationships between securities in determining the prices. Investments in shares of other open-end investment companies are valued at their net asset value as reported by such companies.
The Funds value securities at fair value pursuant to procedures adopted by the Trust’s Board of Trustees (the “Board”) if (1) market quotations are insufficient or not readily available or (2) the Funds’ investment adviser believes that the prices or values available are unreliable due to, among other things, the occurrence of events after the close of the securities markets on which the Funds’ securities primarily trade but before the time as of which the Funds calculate their net asset values. In instances where the investment adviser believes that the prices received from the independent pricing service are unreliable, proprietary valuation models may be used that consider benchmark yield curves, estimated default rates, coupon rates, anticipated timing of principal repayments and other unique security features to estimate the relevant cash flows, which are discounted to calculate the fair values. Fair valued securities will be classified as Level 2 or 3 within the fair value hierarchy (see below), depending on the inputs used.
The Board approves the independent pricing services used by the Funds.
30
THE CUTLER TRUST
NOTES TO FINANCIAL STATEMENTS (Continued)
GAAP establishes a single authoritative definition of fair value, sets out a framework for measuring fair value and requires disclosures about fair value measurements.
Various inputs are used in determining the value of each Fund’s investments. These inputs are summarized in the three broad levels listed below:
| | • | Level 1 – quoted unadjusted prices for identical instruments in active markets to which the Fund has access at the date of measurement. |
| | • | Level 2 – quoted prices for similar instruments in active markets; quoted prices for identical or similar instruments in markets that are not active; and model derived valuations in which all significant inputs and significant value drivers are observable. Level 2 inputs are those in markets for which there are few transactions, the prices are not current, little public information exists or instances where prices vary substantially over time or among brokered market makers. |
| | • | Level 3 – model derived valuations in which one or more significant inputs or significant value drivers are unobservable. Unobservable inputs are those inputs that reflect the Fund’s own assumptions that market participants would use to price the asset or liability based on the best available information. |
Fixed income securities, other than certain interest-only mortgage-backed securities held by Cutler Fixed Income Fund, are classified as Level 2 since the values for the fixed income securities are based on prices that utilize various “other significant observable inputs” including bid and ask quotations, prices of similar securities and interest rates, among other factors. Certain interest-only mortgage-backed securities held by Cutler Fixed Income Fund are classified as Level 3 since the values for these securities are based on prices derived from models that utilize one or more significant inputs that are unobservable, including an assumed constant prepayment rate, among other factors.
Securities of Cutler Emerging Markets Fund traded in foreign markets may be classified as Level 2 despite the availability of closing prices because such securities are typically fair valued by an independent pricing service approved by the Board. These foreign securities may be priced at their fair value because the value of the securities may be materially affected by events occurring before the Fund’s pricing time but after the close of the primary markets or exchanges on which such foreign securities are traded. These intervening events might be country-specific (e.g., natural disaster, economic or political developments, interest rate change); issuer-specific (e.g., earnings report, merger announcement); or U.S. markets-specific (such as a significant movement in the U.S. markets that is deemed to affect the value of foreign securities). The pricing service uses an automated system incorporating a model based on multiple parameters, including a security’s local closing price, relevant general and sector indices, currency fluctuations, trading in depositary receipts and futures, if applicable, and/or research valuations by its staff, in determining what it believes is the fair value of the securities.
31
THE CUTLER TRUST
NOTES TO FINANCIAL STATEMENTS (Continued)
The inputs or methodology used for valuing securities are not necessarily an indication of the risks associated with investing in those securities. The inputs used to measure fair value may fall into different levels of the fair value hierarchy. In such cases, for disclosure purposes, the level in the fair value hierarchy within which the fair value measurement falls in its entirety is determined based on the lowest level input that is significant to the fair value measurement.
The following is a summary of the inputs used to value each Fund’s investments as of December 31, 2016 by security type:
Cutler Equity Fund | | Level 1 | | | Level 2 | | | Level 3 | | | Total | |
Common Stocks | | $ | 134,057,032 | | | $ | — | | | $ | — | | | $ | 134,057,032 | |
Money Market Funds | | | 4,926,364 | | | | — | | | | — | | | | 4,926,364 | |
Total | | $ | 138,983,396 | | | $ | — | | | $ | — | | | $ | 138,983,396 | |
Cutler Fixed Income Fund | | Level 1 | | | Level 2 | | | Level 3 | | | Total | |
U.S. Treasury Obligations | | $ | — | | | $ | 2,525,797 | | | $ | — | | | $ | 2,525,797 | |
U.S. Government Agency Obligations | | | — | | | | 2,676,361 | | | | — | | | | 2,676,361 | |
Mortgage-Backed Securities | | | — | | | | 6,457,825 | | | | 4,839,348 | | | | 11,297,173 | |
Corporate Bonds | | | — | | | | 289,583 | | | | — | | | | 289,583 | |
Money Market Funds | | | 514,870 | | | | — | | | | — | | | | 514,870 | |
Total | | $ | 514,870 | | | $ | 11,949,566 | | | $ | 4,839,348 | | | $ | 17,303,784 | |
Cutler Emerging Markets Fund | | Level 1 | | | Level 2 | | | Level 3 | | | Total | |
Common Stocks | | $ | 3,751,955 | | | $ | 3,596,916 | | | $ | — | | | $ | 7,348,871 | |
Exchange-Traded Notes | | | 199,381 | | | | — | | | | — | | | | 199,381 | |
Exchange-Traded Funds | | | 816,890 | | | | — | | | | — | | | | 816,890 | |
Money Market Funds | | | 383,566 | | | | — | | | | — | | | | 383,566 | |
Total | | $ | 5,151,792 | | | $ | 3,596,916 | | | $ | — | | | $ | 8,748,708 | |
Refer to each Fund’s Schedule of Investments for a listing of the securities by security type and sector or industry type. It is the Funds’ policy to recognize transfers into and out of any Level at the end of the reporting period. As of December 31, 2016, Cutler Equity Fund and Cutler Emerging Markets Fund did not have any transfers into and out of any Level.
There were no Level 3 securities held by Cutler Equity Fund and Cutler Emerging Markets Fund as of December 31, 2016.
32
THE CUTLER TRUST
NOTES TO FINANCIAL STATEMENTS (Continued)
The following is a reconciliation of Level 3 investments of Cutler Fixed Income Fund for which significant unobservable inputs were used to determine fair value between June 30, 2016 and December 31, 2016.
| | Cutler Fixed Income Fund | |
Balance as of June 30, 2016 | | $ | 6,853,392 | |
Transfers into and/or out of Level 3 | | | (1,604,364 | ) |
Purchases | | | 1,190,231 | |
Amortization | | | (1,014,843 | ) |
Net change in unrealized appreciation (depreciation) | | | (585,066 | ) |
Balance as of December 31, 2016 | | $ | 4,839,348 | |
The total amount of unrealized depreciation on Level 3 instruments was $350,514 at December 31, 2016.
The following table summarizes the valuation techniques used and unobservable inputs developed by the Valuation Committee, which is overseen by the Board, to determine the fair value of the Level 3 investments.
| Fair
Value at
Dec. 31,
2016 | Valuation Technique | Unobservable Input | Range | Weighted Average of Unobservable Inputs |
Mortgage-Backed Securities | $4,839,348 | Comprehensive pricing model with emphasis on discounted cash flows | Constant prepayment rate | 1 - 90 | 22.92 |
There were no derivative instruments held by the Funds during the six months ended or as of December 31, 2016.
Share valuation — The net asset value per share of each Fund is calculated daily by dividing the total value of its assets, less liabilities, by the number of shares outstanding. The offering price and redemption price per share of each Fund is equal to its net asset value per share.
Common Expenses — Expenses of the Trust not attributable solely to one of the Funds are allocated among the Funds based on relative net assets of each Fund or the nature of the expense and the relative applicability to each Fund.
33
THE CUTLER TRUST
NOTES TO FINANCIAL STATEMENTS (Continued)
Estimates — The preparation of financial statements in conformity with GAAP requires management to make estimates and assumptions that affect the reported amounts of assets and liabilities and disclosures of contingent assets and liabilities at the date of the financial statements and the reported amounts of increases and decreases in net assets from operations during the reporting period. Actual results could differ from those estimates.
Security Transactions, Investment Income and Realized Gains and Losses — Security transactions are accounted for on trade date. Dividend income is recorded on the ex-dividend date. Interest income is recorded as earned. Discounts and premiums on fixed income securities are amortized using the effective interest method. Realized gains and losses on securities sold are determined on a specific identification basis. Withholding taxes on foreign dividends have been recorded in accordance with the Funds’ understanding of the applicable country’s tax rules and rates.
Distributions to Shareholders — Distributions to shareholders of net investment income, if any, are declared and paid quarterly to shareholders of Cutler Equity Fund and Cutler Income Fund and are declared and paid annually to shareholders of Cutler Emerging Markets Fund. Capital gain distributions, if any, are distributed to shareholders annually. Distributions are based on amounts calculated in accordance with applicable federal income tax regulations, which may differ from GAAP. These differences are due primarily to differing treatments of income and gains on various investment securities held by the Funds, timing differences and differing characterizations of distributions made by the Funds. Dividends and distributions are recorded on the ex-dividend date. The tax character of distributions paid by the Funds during the periods ended December 31, 2016 and June 30, 2016 was as follows:
| Period
Ended | | Ordinary Income | | | Long-Term Capital Gains | | | Total Distributions | |
Cutler Equity Fund | 12/31/2016 | | $ | 1,139,419 | | | $ | 1,318,085 | | | $ | 2,457,504 | |
| 6/30/2016 | | $ | 2,076,985 | | | $ | 5,633,681 | | | $ | 7,710,666 | |
| Period
Ended | | Ordinary Income | | | Long-Term Capital Gains | | | Total Distributions | |
Cutler Fixed Income Fund | 12/31/2016 | | $ | 1,174,695 | | | $ | — | | | $ | 1,174,695 | |
| 6/30/2016 | | $ | 1,372,984 | | | $ | — | | | $ | 1,372,984 | |
| Period
Ended | | Ordinary Income | | | Long-Term Capital Gains | | | Total Distributions | |
Cutler Emerging Markets Fund | 12/31/2016 | | $ | 56,835 | | | $ | — | | | $ | 56,835 | |
| 6/30/2016 | | $ | 53,424 | | | $ | — | | | $ | 53,424 | |
34
THE CUTLER TRUST
NOTES TO FINANCIAL STATEMENTS (Continued)
Federal income tax — Each Fund has qualified and intends to continue to qualify each year as a “regulated investment company” under Subchapter M of the Internal Revenue Code of 1986 (the “Code”). By so qualifying, the Funds will not be subject to federal income taxes to the extent that they distribute their net investment income and any net realized capital gains in accordance with the Code.
In order to avoid imposition of the excise tax applicable to regulated investment companies, it is also each Fund’s intention to declare as dividends in each calendar year at least 98% of its net investment income (earned during the calendar year) and 98.2% of its net realized capital gains (earned during the twelve months ended October 31) plus undistributed amounts from prior years.
The following information is computed on a tax basis for each item as of December 31, 2016:
| | Cutler Equity Fund | | | Cutler Fixed Income Fund | | | Cutler Emerging
Markets Fund | |
Tax cost of portfolio investments | | $ | 96,792,002 | | | $ | 19,701,608 | | | $ | 8,877,368 | |
Gross unrealized appreciation | | $ | 43,276,294 | | | $ | 474,187 | | | $ | 632,141 | |
Gross unrealized depreciation | | | (1,084,900 | ) | | | (2,872,011 | ) | | | (760,801 | ) |
Net unrealized appreciation (depreciation) on investments | | | 42,191,394 | | | | (2,397,824 | ) | | | (128,660 | ) |
Net unrealized depreciation of assets and liabilities in foreign currencies | | | — | | | | — | | | | (101 | ) |
Undistributed ordinary income | | | — | | | | 6,758 | | | | 7,241 | |
Accumulated capital and other gains and losses | | | (1,109,715 | ) | | | (261,406 | ) | | | (66,648 | ) |
Accumulated earnings (deficit) | | $ | 41,081,679 | | | $ | (2,652,472 | ) | | $ | (188,168 | ) |
The difference between the federal income tax cost of portfolio investments and the financial statement cost for each Fund is due to certain differences in the recognition of capital gains and losses under income tax regulations and GAAP. These “book/tax” differences are temporary in nature and are related to losses deferred due to wash sales for Cutler Equity Fund, amortization of bond premiums and discounts for Cutler Fixed Income Fund and losses deferred due to wash sales for Cutler Emerging Markets Fund.
As of June 30, 2016, Cutler Equity Fund had short-term capital loss carryforwards of $2,028,641 (with a maximum amount of $1,299,264 available in each year) which expire on June 30, 2018. As of June 30, 2016, Cutler Fixed Income Fund had short-term capital loss carryforwards, with no expiration date, of $52,418. As of June 30, 2016, Cutler Emerging Markets Fund had short-term capital loss carryforwards, with no expiration date, of $18,381. These capital loss carryforwards may be utilized in the current and future years to offset net realized capital gains, if any, prior to distributing such gains to shareholders.
35
THE CUTLER TRUST
NOTES TO FINANCIAL STATEMENTS (Continued)
The Funds recognize the tax benefits or expenses of uncertain tax positions only when the position is “more-likely-than-not” to be sustained assuming examination by tax authorities. Management has reviewed the tax positions taken on Federal income tax returns for the current and all open tax years (tax years ended June 30, 2013 through June 30, 2016 for Cutler Equity Fund and Cutler Fixed Income Fund and June 30, 2016 for Cutler Emerging Markets Fund) and has concluded that no provision for unrecognized tax benefits or expenses is required in these financial statements.
3. Transactions with Related Parties
Investment Adviser — Cutler Investment Counsel, LLC (the “Adviser”) is the investment adviser to the Funds. Pursuant to an Investment Advisory Agreement, Cutler Equity Fund, Cutler Fixed Income Fund and Cutler Emerging Markets Fund pay the Adviser a fee, which is accrued daily and paid monthly, at an annual rate of 0.75%, 0.50% and 0.85%, respectively, of average daily net assets.
The Adviser has entered into an Expense Limitation Agreement under which it has contractually agreed, until November 1, 2017, to reduce its advisory fees and to pay the ordinary operating expenses of Cutler Equity Fund and Cutler Emerging Markets Fund to the extent necessary to limit annual ordinary operating expenses to 1.15% and 1.55%, respectively, of average daily net assets. (Ordinary operating expenses exclude brokerage costs, taxes, interest, acquired fund fees and expenses and extraordinary expenses.) Any such fee reductions by the Adviser, or payments by the Adviser of expenses which are the Funds’ obligation, are subject to repayment by the Funds, provided that the repayment does not cause the ordinary operating expenses of Cutler Equity Fund and Cutler Emerging Markets Fund to exceed the annual expense limit of 1.15% and 1.55%, respectively, and provided further that the fees and expenses which are the subject of the repayment were incurred within three years of the repayment. During the six months ended December 31, 2016, the Adviser reduced its advisory fees and reimbursed expenses totaling $55,026 with respect to Cutler Emerging Markets Fund.
As of December 31, 2016, the Adviser may may seek recoupment of investment advisory fee reductions and expense reimbursements no later than the dates as stated below:
| | June 30,
2019 | | | December 31, 2019 | | | Total | |
Cutler Equity Fund | | $ | 4,100 | | | $ | — | | | $ | 4,100 | |
Cutler Emerging Markets Fund | | $ | 122,966 | | | $ | 55,026 | | | $ | 177,992 | |
Certain officers of the Trust are also officers of the Adviser.
Other Service Providers — Ultimus Fund Solutions, LLC (“Ultimus”) provides fund administration, fund accounting and transfer agency services to the Funds. Each Fund pays Ultimus fees in accordance with the agreements for such services. In addition, the Funds pay out-
36
THE CUTLER TRUST
NOTES TO FINANCIAL STATEMENTS (Continued)
of-pocket expenses including, but not limited to postage, supplies and costs of pricing the Funds’ portfolio securities. Certain officers of the Trust are also officers of Ultimus, or of Ultimus Fund Distributors, LLC (the “Distributor”), the principal underwriter of the Funds. The Distributor is a wholly-owned subsidiary of Ultimus.
Shareholder Service Plan — Each Fund may pay shareholder servicing fees not to exceed an annual rate of 0.25% of its average daily net assets. These fees may be paid to various financial institutions that provide shareholder and account maintenance services. During the six months ended December 31, 2016, Cutler Equity Fund, Cutler Fixed Income Fund and Cutler Emerging Markets Fund paid $87,788, $0 and $0, respectively, for such services.
Compensation of Trustees — Trustees and officers affiliated with the Adviser or Ultimus are not compensated by the Trust for their services. Each Trustee who is not an affiliated person of the Adviser or Ultimus receives from the Trust an annual retainer of $7,500, payable quarterly, plus a fee of $1,250 for attendance at each meeting of the Board, in addition to reimbursement of travel and other expenses incurred in attending the meetings.
4. Securities Transactions
During the six months ended December 31, 2016, cost of purchases and proceeds from sales and maturities of investment securities, other than short-term investments and U.S. government securities, totaled $2,740,643 and $2,906,109, respectively, for Cutler Equity Fund; $4,515,683 and $537,519, respectively, for Cutler Fixed Income Fund; and $840,196 and $2,258, respectively, for Cutler Emerging Markets Fund.
5. Contingencies and Commitments
The Funds indemnify the Trust’s officers and Trustees for certain liabilities that might arise from their performance of their duties to the Funds. Additionally, in the normal course of business the Funds enter into contracts that contain a variety of representations and warranties and which provide general indemnifications. The Funds’ maximum exposure under these arrangements is unknown, as this would involve future claims that may be made against the Funds that have not yet occurred. However, based on experience, the Funds expect the risk of loss to be remote.
6. Risks Associated with Mortgage-Backed Securities
Cutler Fixed Income Fund invests in mortgage-backed securities, which are subject to default risk and prepayment risk, especially when interest rates decline. Prepayment risk is the risk that the principal on mortgage-backed securities, other asset-backed securities or any fixed-income security with an embedded call option may be prepaid at any time, which could reduce yield and market value. This could reduce the effective maturity of a mortgage-backed security and cause the Fund to reinvest its assets at a lower prevailing interest rate. Mortgage-backed securities are also subject to extension risk, which is the risk that rising interest rates will increase the effective
37
THE CUTLER TRUST
NOTES TO FINANCIAL STATEMENTS (Continued)
maturity of mortgage-backed securities due to the deceleration of prepayments. Mortgage-backed securities may also be subject to risks unique to the housing industry, including mortgage lending practices, defaults, foreclosures and changes in real estate values. As of December 31, 2016, Cutler Fixed Income Fund had 64.0% of the value of its net assets invested in mortgage-backed securities.
Stripped Mortgage-Backed Securities (“SMBS”) are derivative multi-class mortgage-backed securities. SMBS are usually structured with two classes that receive different proportions of the interest and principal distributions on a pool of mortgage assets. An SMBS will have one class that will receive all of the interest (the interest-only or “IO” class), while the other class will receive the entire principal (the principal-only or “PO” class). IOs are more volatile and sensitive to the rate of prepayments than other types of mortgage-backed securities, and their value can fall dramatically in response to rapid or unexpected changes in the mortgage, interest rate or economic environment. As of December 31, 2016, 59.5% of Cutler Fixed Income Fund’s net assets were invested in IO classes of various SMBS. Payments received for IOs are included in interest income on the Statements of Operations. Because no principal will be received at the maturity of an IO, adjustments are made to the cost of the security on a monthly basis until maturity. These adjustments are included in interest income on the Statements of Operations. Additionally, any prepayment penalties received for an IO are included in interest income on the Statements of Operations. During the six months ended December 31, 2016, $1,115,463 of prepayment penalties on IOs were received by Cutler Fixed Income Fund.
7. Risks Associated with Emerging Markets
In seeking to meet its investment objective, under normal conditions, at least 80% of Cutler Emerging Markets Fund’s assets will be invested in a diversified portfolio of securities of issuers whose principal activities are in, or economically tied to, emerging markets countries selected in accordance with the Adviser’s long standing dividend focused investment philosophy. Accordingly, Cutler Emerging Markets Fund is subject to the following investment risks:
Foreign Investment Risk — Investments in foreign securities involve different risks than U.S. investments, including fluctuations in currency exchange rates, potentially unstable political and economic structures, less efficient trade settlement practices, reduced availability of public information, and lack of uniform financial reporting and regulatory practices similar to those that apply to U.S. issuers. Foreign stock markets may also be less liquid and more volatile than U.S. stock markets.
Emerging Markets Risk — The economies of emerging market countries may be more dependent on relatively few industries that may be highly vulnerable to local and global changes. The governments of emerging market countries may be less stable than the governments of more developed countries. Countries in the emerging markets generally have less developed securities markets or exchanges, and less developed legal and accounting systems, reduced availability of
38
THE CUTLER TRUST
NOTES TO FINANCIAL STATEMENTS (Continued)
public information, and lack of uniform financial reporting and regulatory practices, which in turn may adversely impact Cutler Emerging Markets Fund’s ability to calculate accurately the intrinsic value of the securities. Securities of emerging market companies may be less liquid and more volatile than securities in countries with more mature markets. The value of emerging market currencies may fluctuate more than the currencies of countries with more mature markets. Investments in emerging market countries may be subject to greater risks of government restrictions, including confiscatory taxation, expropriation or nationalization of a company’s assets, restrictions on foreign ownership of local companies and restrictions on withdrawing assets from the country. Investments in securities of issuers in emerging market countries may be considered speculative and higher risk.
Currency Risk — Because Cutler Emerging Markets Fund holds securities valued in foreign currencies and holds foreign currencies when it purchases and sells foreign securities, changes in exchange rates will impact the value of the Fund’s assets. Thus, investments in foreign securities involve currency risk, which is the risk that the values of the foreign securities and other assets denominated in foreign currencies will decrease due to adverse changes in the value of the U.S. dollar relative to the value of foreign currencies.
8. Subsequent Events
The Funds are required to recognize in the financial statements the effects of all subsequent events that provide additional evidence about conditions that existed as of the date of the Statements of Assets and Liabilities. For non-recognized subsequent events that must be disclosed to keep the financial statements from being misleading, the Funds are required to disclose the nature of the event as well as an estimate of its financial effect, or a statement that such an estimate cannot be made. Management has evaluated subsequent events through the issuance of these financial statements and has noted no such events.
39
THE CUTLER TRUST
ABOUT YOUR FUND’S EXPENSES (Unaudited)
We believe it is important for you to understand the impact of costs on your investment. All mutual funds have operating expenses. As a shareholder of the Funds, you incur ongoing costs, including management fees and other operating expenses. These ongoing costs, which are deducted from each Fund’s gross income, directly reduce the investment return of the Funds.
A mutual fund’s ongoing costs are expressed as a percentage of its average net assets. This figure is known as the expense ratio. The following examples are intended to help you understand the ongoing costs (in dollars) of investing in the Funds and to compare these costs with the ongoing costs of investing in other mutual funds. The examples below are based on an investment of $1,000 made at the beginning of the period shown and held for the entire period (July 1, 2016 through December 31, 2016).
The table below illustrates each Fund’s ongoing costs in two ways:
Actual fund return – This section helps you to estimate the actual expenses that you paid over the period. The “Ending Account Value” shown is derived from each Fund’s actual return, and the fourth column shows the dollar amount of operating expenses that would have been paid by an investor who started with $1,000 in the Funds. You may use the information here, together with the amount you invested, to estimate the expenses that you paid over the period.
To do so, simply divide your account value by $1,000 (for example, an $8,600 account value divided by $1,000 = 8.6), then multiply the result by the number given for the Funds under the heading “Expenses Paid During Period.”
Hypothetical 5% return – This section is intended to help you compare the Funds’ ongoing costs with those of other mutual funds. It assumes that each Fund had an annual return of 5% before expenses during the period shown, but that the expense ratio is unchanged. In this case, because the returns used are not the Funds’ actual returns, the results do not apply to your investment. The example is useful in making comparisons because the Securities and Exchange Commission (“SEC”) requires all mutual funds to calculate expenses based on a 5% return. You can assess each Fund’s ongoing costs by comparing this hypothetical example with the hypothetical examples that appear in shareholder reports of other funds.
Note that expenses shown in the table are meant to highlight and help you compare ongoing costs only. The Funds do not charge transaction fees, such as purchase or redemption fees, nor do they impose any sales loads.
The calculations assume no shares were bought or sold during the period. Your actual costs may have been higher or lower, depending on the amount of your investment and the timing of any purchases or redemptions.
40
THE CUTLER TRUST
ABOUT YOUR FUND’S EXPENSES (Unaudited) (Continued)
More information about the Funds’ expenses, including annual expense ratios for the past five fiscal years, can be found in this report. For additional information on operating expenses and other shareholder costs, please refer to each Fund’s prospectus.
| Beginning
Account Value
July 1,
2016 | Ending
Account Value
December 31,
2016 | Net
Expense
Ratio (a) | Expenses
Paid During Period (b) |
Cutler Equity Fund | | | | |
Based on Actual | $ 1,000.00 | $ 1,068.40 | 1.14% | $ 5.93 |
Based on Hypothetical 5% Return (before expenses) | $ 1,000.00 | $ 1,019.41 | 1.14% | $ 5.79 |
| |
Cutler Fixed Income Fund |
Based on Actual | $ 1,000.00 | $ 959.20 | 1.50% | $ 7.39 |
Based on Hypothetical 5% Return (before expenses) | $ 1,000.00 | $ 1,017.60 | 1.50% | $ 7.61 |
| |
Cutler Emerging Markets Fund |
Based on Actual | $ 1,000.00 | $ 995.70 | 1.55% | $ 7.78 |
Based on Hypothetical 5% Return (before expenses) | $ 1,000.00 | $ 1,017.34 | 1.55% | $ 7.86 |
(a) | Annualized, based on the Fund's most recent one-half year expenses. |
(b) | Expenses are equal to the Funds' annualized net expense ratio multiplied by the average account value over the period, multiplied by 184/366 (to reflect the one-half year period). |
41
THE CUTLER TRUST
ADDITIONAL INFORMATION (Unaudited)
Proxy Voting Information
A description of the policies and procedures that the Funds use to determine how to vote proxies relating to securities held in the Funds’ portfolios is available without charge, upon request, by calling 1-800-228-8537 or on the SEC’s website at http://www.sec.gov. Information regarding how the Funds voted proxies relating to portfolio securities during the most recent 12-month period ended June 30 is also available without charge upon request by calling 1-800-228-8537 or on the SEC’s website at http://www.sec.gov.
Form N-Q Information
The Trust files a complete listing of the Funds’ portfolio holdings with the SEC as of the end of the first and third quarters of each fiscal year on Form N-Q. The filings are available without charge, upon request, by calling 1-800-228-8537. Furthermore, you may obtain a copy of the filings on the SEC’s website at http://www.sec.gov. The Trust’s Forms N-Q may also be reviewed and copied at the SEC’s Public Reference Room in Washington, DC, and information on the operation of the Public Reference Room may be obtained by calling 1-800-SEC-0330.
42
Rev. August 2010
Privacy Notice
|
FACTS | WHAT DOES THE CUTLER TRUST DO WITH YOUR PERSONAL INFORMATION? |
| | | | |
Why? | Financial companies choose how they share your personal information. Federal law gives consumers the right to limit some but not all sharing. Federal law also requires us to tell you how we collect, share, and protect your personal information. Please read this notice carefully to understand what we do. |
| | | | |
What? | The types of personal information we collect and share depend on the product or service you have with us. This information can include: ■ Social Security number ■ Assets ■ Retirement Assets ■ Transaction History ■ Checking Account Information ■ Purchase History ■ Account Balances ■ Account Transactions ■ Wire Transfer Instructions When you are no longer our customer, we continue to share your information as described in this notice. |
| | | | |
How? | All financial companies need to share your personal information to run their everyday business. In the section below, we list the reasons financial companies can share their customers’ personal information; the reasons The Cutler Trust chooses to share; and whether you can limit this sharing. |
| | | | |
Reasons we can share your personal information | Does The Cutler Trust share? | Can you limit this sharing? |
For our everyday business purposes – Such as to process your transactions, maintain your account(s), respond to court orders and legal investigations, or report to credit bureaus | Yes | No |
For our marketing purposes – to offer our products and services to you | No | We don’t share |
For joint marketing with other financial companies | No | We don’t share |
For our affiliates’ everyday business purposes – information about your transactions and experiences | No | We don’t share |
For our affiliates’ everyday business purposes – information about your creditworthiness | No | We don’t share |
For nonaffiliates to market to you | No | We don’t share |
| | |
Questions? | Call 1-888-288-5374 |
43
Who we are |
Who is providing this notice? | The Cutler Trust Ultimus Fund Distributors, LLC (Distributor) Ultimus Fund Solutions, LLC (Administrator) |
What we do |
How does The Cutler Trust protect my personal information? | To protect your personal information from unauthorized access and use, we use security measures that comply with federal law. These measures include computer safeguards and secured files and buildings. Our service providers are held accountable for adhering to strict policies and procedures to prevent any misuse of your nonpublic personal information. |
How does The Cutler Trust collect my personal information? | We collect your personal information, for example, when you ■ Open an account ■ Provide account information ■ Give us your contact information ■ Make deposits or withdrawals from your account ■ Make a wire transfer ■ Tell us where to send the money ■ Tell us who receives the money ■ Show your government-issued ID ■ Show your driver’s license We also collect your personal information from other companies. |
Why can’t I limit all sharing? | Federal law gives you the right to limit only ■ Sharing for affiliates’ everyday business purposes – information about your creditworthiness ■ Affiliates from using your information to market to you ■ Sharing for nonaffiliates to market to you State laws and individual companies may give you additional rights to limit sharing. |
| | |
Definitions |
Affiliates | Companies related by common ownership or control. They can be financial and nonfinancial companies. ■ Cutler Investment Counsel, LLC, the investment adviser to The Cutler Trust, could be deemed to be an affiliate. |
Nonaffiliates | Companies not related by common ownership or control. They can be financial and nonfinancial companies ■ The Cutler Trust does not share with nonaffiliates so they can market to you. |
Joint marketing | A formal agreement between nonaffiliated financial companies that together market financial products or services to you. ■ The Cutler Trust does not jointly market. |
44
This page intentionally left blank.
CUTLER INVESTMENT COUNSEL, LLC
INVESTMENT ADVISER TO THE TRUST
525 Bigham Knoll
Jacksonville, OR 97530
(800)228-8537 ● (541)770-9000
Fax:(541)779-0006
info@cutler.com
Item 2. Code of Ethics.
Item 3. Audit Committee Financial Expert.
Item 4. Principal Accountant Fees and Services.
Item 5. Audit Committee of Listed Registrants.
Item 6. Schedule of Investments.
Item 7. Disclosure of Proxy Voting Policies and Procedures for Closed-End Management Investment Companies.
Item 8. Portfolio Managers of Closed-End Management Investment Companies.
Item 9. Purchases of Equity Securities by Closed-End Management Investment Company and Affiliated Purchasers.
Item 10. Submission of Matters to a Vote of Security Holders.
The registrant has not adopted procedures by which shareholders may recommend nominees to the registrant’s board of trustees.
Item 11. Controls and Procedures.
(a) Based on their evaluation of the registrant’s disclosure controls and procedures (as defined in Rule 30a-3(c) under the Investment Company Act of 1940) as of a date within 90 days of the filing date of this report, the registrant’s principal executive officer and principal financial officer have concluded that such disclosure controls and procedures are reasonably designed and are operating effectively to ensure that material information relating to the registrant, including its consolidated subsidiaries, is made known to them by others within those entities, particularly during the period in which this report is being prepared, and that the information required in filings on Form N-CSR is recorded, processed, summarized, and reported on a timely basis.
(b) There were no changes in the registrant’s internal control over financial reporting (as defined in Rule 30a-3(d) under the Investment Company Act of 1940) that occurred during the second fiscal quarter of the period covered by this report that have materially affected, or are reasonably likely to materially affect, the registrant’s internal control over financial reporting.
Item 12. Exhibits.
File the exhibits listed below as part of this Form. Letter or number the exhibits in the sequence indicated.
(a)(1) Any code of ethics, or amendment thereto, that is the subject of the disclosure required by Item 2, to the extent that the registrant intends to satisfy the Item 2 requirements through filing of an exhibit: Not required
(a)(2) A separate certification for each principal executive officer and principal financial officer of the registrant as required by Rule 30a-2(a) under the Act (17 CFR 270.30a-2(a)): Attached hereto
(a)(3) Any written solicitation to purchase securities under Rule 23c-1 under the Act (17 CFR 270.23c-1) sent or given during the period covered by the report by or on behalf of the registrant to 10 or more persons: Not applicable
(b) Certifications required by Rule 30a-2(b) under the Act (17 CFR 270.30a-2(b)): Attached hereto
Pursuant to the requirements of the Securities Exchange Act of 1934 and the Investment Company Act of 1940, the registrant has duly caused this report to be signed on its behalf by the undersigned, thereunto duly authorized.
Pursuant to the requirements of the Securities Exchange Act of 1934 and the Investment Company Act of 1940, this report has been signed below by the following persons on behalf of the registrant and in the capacities and on the dates indicated.