Washington, D.C. 20549
Erich M. Patten
Form N-CSR is to be used by management investment companies to file reports with the Commission not later than 10 days after the transmission to stockholders of any report that is required to be transmitted to stockholders under Rule 30e-1 under the Investment Company Act of 1940 (17 CFR 270.30e-1). The Commission may use the information provided on Form N-CSR in its regulatory, disclosure review, inspection, and policymaking roles.
A registrant is required to disclose the information specified by Form N-CSR, and the Commission will make this information public. A registrant is not required to respond to the collection of information contained in Form N-CSR unless the Form displays a currently valid Office of Management and Budget ("OMB") control number. Please direct comments concerning the accuracy of the information collection burden estimate and any suggestions for reducing the burden to Secretary, Securities and Exchange Commission, 450 Fifth Street, NW, Washington, DC 20549-0609. The OMB has reviewed this collection of information under the clearance requirements of 44 U.S.C. § 3507.
 | The Cutler Trust | |
ANNUAL REPORT
June 30, 2011
CUTLER EQUITY FUND TABLE OF CONTENTS |
| | Page |
Letter to Shareholders | 3 |
Management Discussion of Fund Performance | 4 |
Performance Information | 7 |
Portfolio Information | 8 |
Schedule of Investments | 9 |
Statement of Assets and Liabilities | 12 |
Statement of Operations | 13 |
Statements of Changes in Net Assets | 14 |
Financial Highlights | 15 |
Notes to Financial Statements | 16 |
Report of Independent Registered Public Accounting Firm | 21 |
About Your Fund’s Expenses | 22 |
Federal Tax Information | 23 |
Trustees and Officers of the Trust | 24 |
Additional Information | 26 |
Approval of Investment Advisory Agreement | 27 |
CUTLER EQUITY FUND LETTER TO SHAREHOLDERS |
To The Cutler Equity Fund Shareholders:
The enclosed information represents the Cutler Equity Fund annual report for the fiscal year ended June 30th, 2011.
Another year has passed since the 2008-2009 financial crisis, yet the memory of the most recent market crash has not faded for most investors. The bear market left many people wary of stocks’ volatility, and cash has been a desirable asset class. Investors who shied away from equities, however, missed a remarkable recovery in stock market prices. A year ago, we were happy to report equities were up over 65% (as measured by the S&P 500 Total Return Index) from the March 9, 2009 lows. Through June 30th of this year, the Fund has a 105% return from the 2009 market nadir. The S&P 500 added another 30% during these past 12 months.
Despite an overall lower risk profile, the Cutler Equity Fund outperformed the S&P 500 Total Return Index over the 12 months ended June 30, 2011, with a total return of 34.73% (versus a return of 30.69% for the S&P 500 Total Return Index). Net of fees and expenses, the Fund has outperformed its primary benchmark for four consecutive years, and five of the previous six years. We believe that this track record is a strong endorsement of Cutler Investment Counsel’s investment philosophy which focuses on dividend-based companies.
Moving forward, we believe the high quality portion of the equities markets will continue to perform well on a relative basis. Economic news has been mixed, creating an environment of tepid global growth. Companies with exposure to the economies of emerging countries have been able to capitalize on stronger growth, while domestic companies remain a lower-risk investment approach. This combination (of international growth with domestic corporate governance standards) leads investors toward large capitalization, dividend-paying, American companies; the type of holdings that comprise most of the Cutler Equity Fund.
We are proud to report the results of the current period end. However, we caution our shareholders to remain focused on our philosophy of conservative, income producing securities as a long term strategy for attractive investor returns.
Sincerely,
 |  |
Matthew C. Patten Chairman The Cutler Trust | Erich M. Patten Portfolio Manager Cutler Investment Counsel, LLC |
CUTLER EQUITY FUND MANAGEMENT DISCUSSION OF FUND PERFORMANCE |
1) How did the Fund perform last year?
The Fund outperformed its benchmark, the S&P 500 Total Return Index, by 4.04% during the past fiscal year. The Fund’s total return was 34.73%.
2) What were the most significant market factors affecting the Fund’s performance during the past year?
Market factors included:
1) Positive equity market trends
2) Strength of overseas economic growth
3) Benefits of streamlined corporate cost structures from the previous recession
4) Attractiveness of dividend paying securities
3) Why did the Fund outperform relative to the benchmark?
The strong performance was not isolated to the first or second half of the fiscal year, but was fairly well distributed during the fiscal year. During the first 6 months, the Fund outperformed the benchmark by 1.91%, followed by 1.61% outperformance in the subsequent 6 months.
The sector allocation bears much of the credit for outperformance, as the Fund was underweight Financials throughout the time period. In fact, only one bank was held in the portfolio on June 30, 2010 (Hudson City Bancorp), and this was sold during the fiscal year due to an impending dividend cut.
The portfolio maintains significant exposure to companies that have benefited from the current economic environment. Commodity prices, for example, have risen rapidly over the last year. Energy and Materials companies have direct exposure to this trend, while Industrial companies have an indirect benefit. The Fund has a relatively large position in these sectors, although Halliburton (an Energy holding) was sold during the fiscal year due to valuation and a scant dividend.
4) What strategies did you use to manage the Fund?
The Cutler Equity Income process focuses on dividends as the primary driver of investment returns. The strategy was not changed in the previous year, and the management of the Fund was consistent with previous years. Holdings in the portfolio maintain a 10-year record of consistent dividend payments, and hold at least $2 billion minimum capitalization. We seek relative value as compared to other companies in similar industries. The Fund has a value bias, but is benchmarked to the S&P 500 Total Return Index. The strategy is further detailed in the Fund prospectus.
5) What were the primary strategic factors that guided your management of the Fund?
Cutler Investment Counsel’s dividend criteria have been the primary strategy factor used in managing the Fund this past fiscal year. Portfolio managers continue to focus on companies with a strong dividend history and attractive current yields.
CUTLER EQUITY FUND MANAGEMENT DISCUSSION OF FUND PERFORMANCE (Continued) |
Similar to last year, turnover of the Fund remained low (15% during the fiscal year) as the portfolio managers have given the new holdings from the past several years time to incubate. Many of these holdings were added with the investment thesis that inflation would be a driver of equity valuations. While the rise in the Consumer Price Index has been modest, the rise in commodity prices has helped companies involved in the production of these materials. This can be evidenced by the five holdings listed in item 7, all of which are involved in the production or extraction of commodities/materials.
In recent months, the portfolio managers have been focused on reducing overall risk exposure in the portfolio. This is evidenced by purchases of defensive, lower volatility holdings such as Procter & Gamble and McDonald’s.
6) What were some of the key trends in each of the regions/significant industries the Fund invests in?
The Fund’s holdings remain 100% domiciled in the US, and the strategies employed do not have any additional regional bias.
In developed markets, economic growth has been anemic. The US has had a modest economic recovery, and unemployment remains above 9%. Europe has struggled with a sovereign debt crisis emanating from Greece. Japan experienced a devastating earthquake, which further harmed a fragile recovery.
Similar to the investment theme of the past several years, global growth has been driven by the emerging economies. The development of the middle class in the “BRIC” countries (Brazil, Russia, India, China) continues to drive a thirst for goods, and the underlying commodities that are used in production. US companies who have exposure to these inputs, or direct exposure to the BRIC consumers, have been beneficiaries of this trend.
7) Which securities helped the Fund’s performance?
1) Halliburton Co.
2) Caterpillar, Inc.
3) E.I. du Pont de Nemours and Co.
4) National Fuel Gas Co.
5) ConocoPhillips
8) Did any securities hurt the Fund’s performance?
1) Hudson City Bancorp., Inc.
2) The Procter & Gamble Co.
3) Merck & Co., Inc.
4) Nucor Corp.
5) Sysco Corp.
CUTLER EQUITY FUND MANAGEMENT DISCUSSION OF FUND PERFORMANCE (Continued) |
The views in this report were those of Cutler Investment Counsel, LLC as of June 30, 2011 and may not reflect its views on the date this report is first published or anytime thereafter. These views are intended to assist shareholders in understanding their investment in the Fund and do not constitute investment advice.
Before investing you should carefully consider the Fund’s investment objectives, risks, charges and expenses. This and other information is in the prospectus, a copy of which may be obtained by calling 1-800-228-8537. Please read the prospectus carefully before you invest. Past performance is not predictive of future performance. Investment results and principal value will fluctuate so that shares, when redeemed, may be worth more or less than their original cost. Current performance may be higher or lower than the performance data quoted. Performance data current to the most recent month-end, are available by calling 800-228-8537.
CUTLER EQUITY FUND PERFORMANCE INFORMATION June 30, 2011 (Unaudited) |
Comparison of the Change in Value of a $10,000 Investment in
Cutler Equity Fund and the S&P 500 Total Return Index
Average Annual Total Returns(a) (for periods ended June 30, 2011) |
| | | | |
| Cutler Equity Fund | 34.73% | 4.90% | 3.28% |
S&P 500 Total Return Index | 30.69% | 2.94% | 2.72% |
| (a) | Returns shown do not reflect the deduction of taxes a shareholder would pay on Fund distributions or the redemption of Fund shares. |
Cutler Equity Fund (the “Fund”) is managed pursuant to an equity income strategy. The investment adviser and Board of Trustees believe the S&P 500 Total Return Index is the most appropriate benchmark for the Fund due to its focus on large capitalization securities and broad index membership.
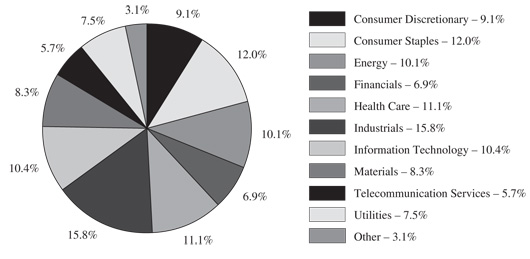
CUTLER EQUITY FUND PORTFOLIO INFORMATION June 30, 2011 (Unaudited) |
Sector Allocation (% of Net Assets)
CUTLER EQUITY FUND SCHEDULE OF INVESTMENTS June 30, 2011 | |
| | | | | |
| | | Consumer Discretionary — 9.1% | | | |
| | | Hotels, Restaurants & Leisure — 3.2% | | | |
| | 17,300 | | McDonald's Corp. | | $ | 1,458,736 | |
| | | | | | | | |
| | | | Multiline Retail — 3.3% | | | | |
| | 31,950 | | Nordstrom, Inc. | | | 1,499,733 | |
| | | | | | | | |
| | | | Specialty Retail — 2.6% | | | | |
| | 32,980 | | Home Depot, Inc. (The) | | | 1,194,536 | |
| | | | | | | | |
| | | | Consumer Staples — 12.0% | | | | |
| | | | Beverages — 2.8% | | | | |
| | 17,990 | | PepsiCo, Inc. | | | 1,267,036 | |
| | | | | | | | |
| | | | Food & Staples Retailing — 2.2% | | | | |
| | 31,850 | | Sysco Corp. | | | 993,083 | |
| | | | | | | | |
| | | | Food Products — 2.4% | | | | |
| | 35,875 | | Archer-Daniels-Midland Co. | | | 1,081,631 | |
| | | | | | | | |
| | | | Household Products — 4.6% | | | | |
| | 14,740 | | Kimberly-Clark Corp. | | | 981,094 | |
| | 17,575 | | Procter & Gamble Co. (The) | | | 1,117,243 | |
| | | | | | | 2,098,337 | |
| | | | Energy — 10.1% | | | | |
| | | | Oil, Gas & Consumable Fuels — 10.1% | | | | |
| | 17,800 | | Chevron Corp. | | | 1,830,552 | |
| | 19,150 | | ConocoPhillips | | | 1,439,888 | |
| | 16,155 | | Exxon Mobil Corp. | | | 1,314,694 | |
| | | | | | | 4,585,134 | |
| | | | Financials — 6.9% | | | | |
| | | | Consumer Finance — 3.8% | | | | |
| | 33,265 | | American Express Co. | | | 1,719,800 | |
| | | | | | | | |
| | | | Insurance — 3.1% | | | | |
| | 22,290 | | Chubb Corp. (The) | | | 1,395,577 | |
| | | | | | | | |
| | | | Health Care — 11.1% | | | | |
| | | | Health Care Equipment & Supplies — 2.8% | | | | |
| | 14,740 | | Becton, Dickinson and Co. | | | 1,270,146 | |
CUTLER EQUITY FUND SCHEDULE OF INVESTMENTS (Continued) | |
| | COMMON STOCKS — 96.9% (Continued) | | | |
| | | Health Care — 11.1% (Continued) | | | |
| | | Pharmaceuticals — 8.3% | | | |
| | 44,490 | | Bristol-Myers Squibb Co. | | $ | 1,288,430 | |
| | 18,650 | | Johnson & Johnson | | | 1,240,598 | |
| | 35,330 | | Merck & Co., Inc. | | | 1,246,796 | |
| | | | | | | 3,775,824 | |
| | | | Industrials — 15.8% | | | | |
| | | | Aerospace & Defense — 6.4% | | | | |
| | 20,920 | | Honeywell International, Inc. | | | 1,246,623 | |
| | 18,650 | | United Technologies Corp. | | | 1,650,711 | |
| | | | | | | 2,897,334 | |
| | | | Electrical Equipment — 2.8% | | | | |
| | 22,850 | | Emerson Electric Co. | | | 1,285,313 | |
| | | | | | | | |
| | | | Machinery — 3.1% | | | | |
| | 13,400 | | Caterpillar, Inc. | | | 1,426,564 | |
| | | | | | | | |
| | | | Road & Rail — 3.5% | | | | |
| | 15,180 | | Union Pacific Corp. | | | 1,584,792 | |
| | | | | | | | |
| | | | Information Technology — 10.4% | | | | |
| | | | IT Services — 4.2% | | | | |
| | 11,000 | | International Business Machines Corp. | | | 1,887,050 | |
| | | | | | | | |
| | | | Semiconductors & Semiconductor Equipment — 6.2% | | | | |
| | 60,000 | | Intel Corp. | | | 1,329,600 | |
| | 45,130 | | Texas Instruments, Inc. | | | 1,481,618 | |
| | | | | | | 2,811,218 | |
| | | | Materials — 8.3% | | | | |
| | | | Chemicals — 6.3% | | | | |
| | 32,720 | | E.I. du Pont de Nemours and Co. | | | 1,768,516 | |
| | 14,880 | | Monsanto Co. | | | 1,079,395 | |
| | | | | | | 2,847,911 | |
| | | | Metals & Mining — 2.0% | | | | |
| | 21,835 | | Nucor Corp. | | | 900,039 | |
| | | | | | | | |
| | | | Telecommunication Services — 5.7% | | | | |
| | | | Diversified Telecommunication Services — 5.7% | | | | |
| | 41,205 | | AT&T, Inc. | | | 1,294,249 | |
| | 35,205 | | Verizon Communications, Inc. | | | 1,310,682 | |
| | | | | | | 2,604,931 | |
CUTLER EQUITY FUND SCHEDULE OF INVESTMENTS (Continued) | |
| | COMMON STOCKS — 96.9% (Continued) | | | |
| | | Utilities — 7.5% | | | |
| | | Gas Utilities — 4.1% | | | |
| | 25,420 | | National Fuel Gas Co. | | $ | 1,850,576 | |
| | | | | | | | |
| | | | Multi-Utilities — 3.4% | | | | |
| | 28,810 | | Consolidated Edison, Inc. | | | 1,533,844 | |
| | | | | | | | |
| | | | Total Common Stocks (Cost $32,041,183) | | $ | 43,969,145 | |
| |
| | MONEY MARKET FUNDS — 3.0% | | | |
| | 1,382,680 | | Fidelity Institutional Money Market Portfolio - Select Class, 0.08% (a) (Cost $1,382,680) | | $ | 1,382,680 | |
| | | | | | | | |
| | | | Total Investments at Value — 99.9% (Cost $33,423,863) | | $ | 45,351,825 | |
| | | | | | | | |
| | | | Other Assets in Excess of Liabilities — 0.1% | | | 33,706 | |
| | | | | | | | |
| | | | Net Assets — 100.0% | | $ | 45,385,531 | |
| (a) | Variable rate security. The rate shown is the 7-day effective yield as of June 30, 2011. |
| |
| See accompanying notes to financial statements. |
CUTLER EQUITY FUND STATEMENT OF ASSETS AND LIABILITIES June 30, 2011 | |
| ASSETS | | | |
| Investments in securities: | | | |
At acquisition cost | | $ | 33,423,863 | |
At value (Note 2) | | $ | 45,351,825 | |
Dividends receivable | | | 85,619 | |
Other assets | | | 5,804 | |
Total assets | | | 45,443,248 | |
| | | | | |
| LIABILITIES | | | | |
Dividends payable | | | 596 | |
Payable for capital shares redeemed | | | 11 | |
Payable to Adviser (Note 3) | | | 27,110 | |
Payable to administrator (Note 3) | | | 6,000 | |
Other accrued expenses | | | 24,000 | |
Total liabilities | | | 57,717 | |
| | | | | |
NET ASSETS | | $ | 45,385,531 | |
| | | | | |
| NET ASSETS CONSIST OF: | | | | |
Paid-in capital | | $ | 40,241,686 | |
Accumulated undistributed net investment income | | | 1,766 | |
| Accumulated net realized losses from security transactions | | | (6,785,883 | ) |
Net unrealized appreciation on investments | | | 11,927,962 | |
NET ASSETS | | $ | 45,385,531 | |
| | | | | |
Shares of beneficial interest outstanding (unlimited number of shares authorized, no par value) | | | 3,727,551 | |
| | | | | |
| Net asset value, offering price and redemption price per share (Note 2) | | $ | 12.18 | |
| See accompanying notes to financial statements. |
CUTLER EQUITY FUND STATEMENT OF OPERATIONS For the Year Ended June 30, 2011 | |
| INVESTMENT INCOME | | | |
Dividend income | | $ | 1,157,944 | |
| | | | | |
| EXPENSES | | | | |
Investment advisory fees (Note 3) | | | 296,730 | |
Administration fees (Note 3) | | | 72,000 | |
Professional fees | | | 36,493 | |
Trustees’ fees and expenses | | | 32,436 | |
Insurance expense | | | 17,680 | |
Registration fees | | | 17,596 | |
Shareholder servicing fees (Note 3) | | | 16,619 | |
Custody and bank service fees | | | 15,071 | |
Printing of shareholder reports | | | 6,207 | |
Postage and supplies | | | 5,672 | |
Other expenses | | | 12,001 | |
Total expenses | | | 528,505 | |
| | | | | |
NET INVESTMENT INCOME | | | 629,439 | |
| | | | | |
| REALIZED AND UNREALIZED GAINS ON INVESTMENTS | | | | |
Net realized gains from investment transactions | | | 2,119,019 | |
| Net change in unrealized appreciation/depreciation on investments | | | 8,227,077 | |
| REALIZED AND UNREALIZED GAINS ON INVESTMENTS | | | 10,346,096 | |
| | | | | |
| NET INCREASE IN NET ASSETS FROM OPERATIONS | | $ | 10,975,535 | |
| See accompanying notes to financial statements. |
CUTLER EQUITY FUND STATEMENTS OF CHANGES IN NET ASSETS | |
| | | | | | |
| FROM OPERATIONS | | | | | | |
Net investment income | | $ | 629,439 | | | $ | 574,804 | |
| Net realized gains (losses) from investment transactions | | | 2,119,019 | | | | (237,993 | ) |
Net change in unrealized appreciation/ depreciation on investments | | | 8,227,077 | | | | 4,304,169 | |
Net increase in net assets from operations | | | 10,975,535 | | | | 4,640,980 | |
| | | | | | | | | |
| DISTRIBUTIONS TO SHAREHOLDERS | | | | | | | | |
From net investment income | | | (629,518 | ) | | | (583,288 | ) |
| | | | | | | | | |
| CAPITAL SHARE TRANSACTIONS | | | | | | | | |
Proceeds from shares sold | | | 8,839,037 | | | | 3,908,041 | |
Net asset value of shares issued in reinvestment of distributions to shareholders | | | 628,267 | | | | 574,993 | |
Payments for shares redeemed | | | (5,542,974 | ) | | | (5,015,169 | ) |
Net increase (decrease) from capital share transactions | | | 3,924,330 | | | | (532,135 | ) |
| | | | | | | | | |
TOTAL INCREASE IN NET ASSETS | | | 14,270,347 | | | | 3,525,557 | |
| | | | | | | | | |
| NET ASSETS | | | | | | | | |
Beginning of year | | | 31,115,184 | | | | 27,589,627 | |
End of year | | $ | 45,385,531 | | | $ | 31,115,184 | |
| | | | | | | | | |
ACCUMULATED UNDISTRIBUTED NET INVESTMENT INCOME | | $ | 1,766 | | | $ | 1,845 | |
| | | | | | | | | |
| CAPITAL SHARE ACTIVITY | | | | | | | | |
Shares sold | | | 785,698 | | | | 401,859 | |
Shares reinvested | | | 54,495 | | | | 60,214 | |
Shares redeemed | | | (503,238 | ) | | | (518,336 | ) |
Net increase (decrease) in shares outstanding | | | 336,955 | | | | (56,263 | ) |
Shares outstanding at beginning of year | | | 3,390,596 | | | | 3,446,859 | |
Shares outstanding at end of year | | | 3,727,551 | | | | 3,390,596 | |
| See accompanying notes to financial statements. |
CUTLER EQUITY FUND FINANCIAL HIGHLIGHTS | |
Per Share Data for a Share Outstanding Throughout Each Year | |
| | | | |
| | | | | | | | | | | | | | | |
| Net asset value at beginning of year | | $ | 9.18 | | | $ | 8.00 | | | $ | 10.80 | | | $ | 12.34 | | | $ | 10.46 | |
| | | | | | | | | | | | | | | | | | | | | |
| Income (loss) from investment operations: | | | | | | | | | | | | | | | | | | | | |
| Net investment income | | | 0.18 | | | | 0.17 | | | | 0.21 | | | | 0.18 | | | | 0.16 | |
Net realized and unrealized gains (losses) on investments | | | 3.00 | | | | 1.18 | | | | (2.80 | ) | | | (1.54 | ) | | | 1.88 | |
| Total from investment operations | | | 3.18 | | | | 1.35 | | | | (2.59 | ) | | | (1.36 | ) | | | 2.04 | |
| | | | | | | | | | | | | | | | | | | | | |
| Less distributions from: | | | | | | | | | | | | | | | | | | | | |
| Net investment income | | | (0.18 | ) | | | (0.17 | ) | | | (0.21 | ) | | | (0.18 | ) | | | (0.16 | ) |
| | | | | | | | | | | | | | | | | | | | | |
| Net asset value at end of year | | $ | 12.18 | | | $ | 9.18 | | | $ | 8.00 | | | $ | 10.80 | | | $ | 12.34 | |
| | | | | | | | | | | | | | | | | | | | | |
Total return (a) | | | 34.73% | | | | 16.82% | | | | (24.06% | ) | | | (11.13% | ) | | | 19.59% | |
| | | | | | | | | | | | | | | | | | | | | |
| Net assets at end of year (000’s) | | $ | 45,386 | | | $ | 31,115 | | | $ | 27,590 | | | $ | 34,549 | | | $ | 40,512 | |
| | | | | | | | | | | | | | | | | | | | | |
| Ratios/supplementary data: | | | | | | | | | | | | | | | | | | | | |
Ratio of net expenses to average net assets (b) | | | 1.33% | | | | 1.40% | | | | 1.40% | | | | 1.31% | | | | 1.30% | |
| | | | | | | | | | | | | | | | | | | | �� | |
Ratio of net investment income to average net assets | | | 1.59% | | | | 1.76% | | | | 2.45% | | | | 1.48% | | | | 1.36% | |
| | | | | | | | | | | | | | | | | | | | | |
| Portfolio turnover rate | | | 15% | | | | 13% | | | | 21% | | | | 13% | | | | 10% | |
| (a) | Total return is a measure of the change in value of an investment in the Fund over the period covered, which assumes any dividends or capital gains distributions are reinvested in shares of the Fund. Returns shown do not reflect the deduction of taxes a shareholder would pay on Fund distributions or the redemption of Fund shares. |
| (b) | Absent waivers by the Fund’s investment adviser, the ratio of total expenses to average net assets would have been 1.42% and 1.50% for the years ended June 30, 2010 and 2009, respectively (Note 3). |
| |
| See accompanying notes to financial statements. |
CUTLER EQUITY FUND NOTES TO FINANCIAL STATEMENTS June 30, 2011 |
Cutler Equity Fund (the “Fund”) is a diversified series of The Cutler Trust (the “Trust”). The Trust is a Delaware statutory trust that is registered as an open-end management investment company under the Investment Company Act of 1940. The Fund is the only series of the Trust. Under its Trust Instrument, the Trust is authorized to issue an unlimited number of Fund shares of beneficial interest without par value. The Fund commenced operations on October 2, 1992.
The Fund seeks current income and long-term capital appreciation.
| 2. | Significant Accounting Policies |
The following summarizes the significant accounting policies of the Fund. The policies are in conformity with accounting principles generally accepted in the United States of America (“GAAP”).
Securities Valuation — Portfolio securities are valued as of the close of business of the regular session of the principal exchange where the security is traded. Exchange traded securities for which market quotations are readily available are valued using the last reported sales price provided by independent pricing services as of the close of trading on the New York Stock Exchange (normally 4:00 p.m. Eastern time), on each Fund business day. In the absence of a sale, such securities are valued at the mean of the last bid and asked price. Securities which are quoted by NASDAQ are valued at the NASDAQ Official Closing Price. Non-exchange traded securities for which over-the-counter quotations are available are generally valued at the mean between the closing bid and asked prices. Money market instruments that mature in sixty days or less may be valued at amortized cost unless the Fund’s investment adviser believes another valuation is more appropriate.
The Fund values securities at fair value pursuant to procedures adopted by the Board of Trustees if (1) market quotations are insufficient or not readily available or (2) the Fund’s investment adviser believes that the prices or values available are unreliable due to, among other things, the occurrence of events after the close of the securities markets on which the Fund’s securities primarily trade but before the time as of which the Fund calculates its net asset value. Fair valued securities will be classified as Level 2 or 3 within the fair value hierarchy, depending on the inputs used.
GAAP establishes a single authoritative definition of fair value, sets out a framework for measuring fair value and requires additional disclosures about fair value measurements.
Various inputs are used in determining the value of the Fund’s investments. These inputs are summarized in the three broad levels listed below:
| | • | Level 1 – quoted prices in active markets for identical securities |
| | • | Level 2 – other significant observable inputs |
| | • | Level 3 – significant unobservable inputs |
CUTLER EQUITY FUND NOTES TO FINANCIAL STATEMENTS (Continued) |
The inputs or methodology used for valuing securities are not necessarily an indication of the risks associated with investing in those securities. The inputs used to measure fair value may fall into different levels of the fair value hierarchy. In such cases, for disclosure purposes, the level in the fair value hierarchy within which the fair value measurement falls in its entirety is determined based on the lowest level input that is significant to the fair value measurement.
The following is a summary of the inputs used to value the Fund’s investments as of June 30, 2011 by security type:
| | | | | | | | | | | | |
Common Stocks | | $ | 43,969,145 | | | $ | — | | | $ | — | | | $ | 43,969,145 | |
Money Market Funds | | | 1,382,680 | | | | — | | | | — | | | | 1,382,680 | |
Total | | $ | 45,351,825 | | | $ | — | | | $ | — | | | $ | 45,351,825 | |
See the Fund’s Schedule of Investments for a listing of the common stocks valued using Level 1 inputs by industry type. During the year ended June 30, 2011, the Fund did not have any significant transfers in and out of Level 1 or Level 2. There were no Level 2 or Level 3 securities or derivative instruments held in the Fund during the year ended or as of June 30, 2011.
Share Valuation — The net asset value per share of the Fund is calculated daily by dividing the total value of the Fund’s assets, less liabilities, by the number of shares outstanding. The offering price and redemption price per share of the Fund is equal to the net asset value per share.
Estimates — The preparation of financial statements in conformity with GAAP requires management to make estimates and assumptions that affect the reported amounts of assets and liabilities and disclosures of contingent assets and liabilities at the date of the financial statements and the reported amounts of income and expenses during the reporting period. Actual results could differ from those estimates.
Security Transactions, Investment Income and Realized Gains and Losses — Investment transactions are accounted for on trade date. Dividend income is recorded on the ex-dividend date. Interest income is recorded as earned. Gains and losses on securities sold are determined on a specific identification basis.
Distributions to Shareholders — Distributions to shareholders of net investment income, if any, are declared and paid quarterly. Capital gain distributions, if any, are distributed to shareholders annually. Distributions are based on amounts calculated in accordance with applicable federal income tax regulations, which may differ from GAAP. These differences are due primarily to differing treatments of income and gains on various investment securities held by the Fund, timing differences and differing characterizations of distributions made by the Fund. Dividends and distributions are recorded on the ex-dividend date. The tax character of distributions paid during the years ended June 30, 2011 and June 30, 2010 was ordinary income.
CUTLER EQUITY FUND NOTES TO FINANCIAL STATEMENTS (Continued) |
Federal Income Taxes — The Fund intends to comply with the special provisions of Subchapter M of the Internal Revenue Code applicable to regulated investment companies. As provided therein, in any fiscal year in which the Fund so qualifies and distributes at least 90% of its taxable net income, the Fund (but not the shareholders) will be relieved of federal income tax on income distributed. Accordingly, no provision for income taxes has been made.
In order to avoid imposition of the excise tax applicable to regulated investment companies, it is also the Fund’s intention to declare and pay as dividends in each calendar year at least 98% of its investment income (earned during the calendar year) and 98.2% of its net realized gains (earned during the twelve months ended October 31) plus undistributed amounts from prior years.
The following information is computed on a tax basis for each item as of June 30, 2011:
| Tax cost of portfolio investments | | $ | 33,443,562 | |
| Gross unrealized appreciation | | $ | 12,531,726 | |
| Gross unrealized depreciation | | | (623,463 | ) |
| Net unrealized appreciation | | | 11,908,263 | |
| Undistributed ordinary income | | | 2,362 | |
| Capital loss carryforwards | | | (6,766,184 | ) |
| Other temporary differences | | | (596 | ) |
| Accumulated earnings | | $ | 5,143,845 | |
The difference between the federal income tax cost of portfolio investments and the financial statement cost is due to certain timing differences in the recognition of capital gains or losses under income tax regulations and GAAP. These “book/tax” differences are temporary in nature and are due to losses deferred due to wash sales.
During the year ended June 30, 2011, the Fund utilized capital loss carryforwards of $2,086,201 to offset current year realized gains.
As of June 30, 2011, the Fund had capital loss carryforwards of $6,766,184, of which $2,687,016 expires June 30, 2012, $340,161 expires June 30, 2014 and $3,739,007 expires June 30, 2018. These capital loss carryforwards may be utilized in future years to offset net realized capital gains, if any, prior to distributing such gains to shareholders.
For the year ended June 30, 2011, the Fund reclassified accumulated net realized losses from security transactions of $3,661,524 against paid-in capital on the Statement of Assets and Liabilities due to the expiration of capital loss carryforwards. Such reclassification, the result of permanent differences between the financial statement and income tax reporting requirements, had no effect on the Fund’s net assets or net asset value per share.
The Fund recognizes the tax benefits or expenses of uncertain tax positions only when the position is “more-likely-than-not” to be sustained assuming examination by tax authorities. Management has reviewed the tax positions taken on Federal income tax returns for all open tax years (tax years ended June 30, 2007 through June 30, 2011) and has concluded that no provision for unrecognized tax benefits or expenses is required in these financial statements.
CUTLER EQUITY FUND NOTES TO FINANCIAL STATEMENTS (Continued) |
| 3. | Transactions with Affiliates |
Investment Adviser — Cutler Investment Counsel, LLC (the “Adviser”) is the investment adviser to the Fund. Pursuant to an Investment Advisory Agreement, the Fund pays the Adviser a fee, which is accrued daily and paid monthly, at an annual rate of 0.75% of the Fund’s average daily net assets.
Effective November 1, 2010, the Adviser entered into an expense limitation agreement that requires it to waive advisory fees to the extent necessary to limit the total operating expenses of the Fund to 1.40% of average daily net assets until November 1, 2011. Prior to November 1, 2010, the Adviser voluntarily undertook to limit the total operating expenses of the Fund to 1.40% of average daily net assets. No advisory fee waivers were required during the year ended June 30, 2011.
Certain officers of the Trust are also officers of the Adviser.
Administration and Other Services — Under the terms of a Mutual Fund Services Agreement between the Trust and Ultimus Fund Solutions, LLC (“Ultimus”), Ultimus provides administrative, pricing, accounting, dividend disbursing, shareholder servicing and transfer agent services for the Fund. For these services, Ultimus receives a monthly fee from the Fund at an annual rate of 0.15% of the Fund’s average daily net assets up to $500 million; 0.125% on the next $500 million of such assets; and 0.10% on such assets in excess of $1 billion, subject to a minimum monthly fee of $6,000. In addition, the Fund pays out-of-pocket expenses including, but not limited to, postage, supplies and costs of pricing the Fund’s portfolio securities.
Certain officers of the Trust are also officers of Ultimus, or of Ultimus Fund Distributors, LLC, the principal underwriter of the Fund’s shares and an affiliate of Ultimus.
Shareholder Service Plan — The Fund may pay shareholder servicing fees not to exceed an annual rate of 0.25% of the Fund’s average daily net assets. These fees may be paid to various financial institutions that provide shareholder and account maintenance services.
| 4. | Securities Transactions |
The cost of purchases and proceeds from sales of investment securities, other than short-term investments, amounted to $8,612,414 and $5,753,972, respectively, during the year ended June 30, 2011.
| 5. | Contingencies and Commitments |
The Fund indemnifies the Trust’s officers and Board of Trustees for certain liabilities that might arise from their performance of their duties to the Fund. Additionally, in the normal course of business the Fund enters into contracts that contain a variety of representations and warranties and which provide general indemnifications. The Fund’s maximum exposure under these arrangements is unknown, as this would involve future claims that may be made against the Fund that have not yet occurred. However, based on experience, the Fund expects the risk of loss to be remote.
CUTLER EQUITY FUND NOTES TO FINANCIAL STATEMENTS (Continued) |
| 6. | Recent Accounting Pronouncement |
In May 2011, the Financial Accounting Standards Board issued Accounting Standards Update (“ASU”) No. 2011-04 “Amendments to Achieve Common Fair Value Measurement and Disclosure Requirements in U.S. GAAP and IFRS.” ASU No. 2011-04 establishes common requirements for measuring fair value and for disclosing information about fair value measurements in accordance with GAAP and International Financial Reporting Standards. ASU No. 2011-04 is effective for interim and annual periods beginning after December 15, 2011 and is applied prospectively. Management is currently evaluating the impact ASU No. 2011-04 may have on financial statement disclosures.
The Fund is required to recognize in the financial statements the effects of all subsequent events that provide additional evidence about conditions that existed as of the date of the Statement of Assets and Liabilities. For non-recognized subsequent events that must be disclosed to keep the financial statements from being misleading, the Fund is required to disclose the nature of the event as well as an estimate of its financial effect, or a statement that such an estimate cannot be made. Management has evaluated subsequent events through the issuance of these financial statements and has noted no such events.
CUTLER EQUITY FUND REPORT OF INDEPENDENT REGISTERED PUBLIC ACCOUNTING FIRM |
To the Board of Trustees of
The Cutler Trust
and the Shareholders of the Cutler Equity Fund
We have audited the accompanying statement of assets and liabilities, including the schedule of investments, of the Cutler Equity Fund, a series of shares of beneficial interest of The Cutler Trust, as of June 30, 2011, and the related statement of operations for the year then ended, the statements of changes in net assets for each of the two years in the period then ended and the financial highlights for each of the four years in the period then ended. These financial statements and financial highlights are the responsibility of the Fund’s management. Our responsibility is to express an opinion on these financial statements and financial highlights based on our audits. The financial highlights for the year ended June 30, 2007 were audited by other auditors whose report dated August 21, 2007 expressed an unqualified opinion on such financial highlights.
We conducted our audits in accordance with the standards of the Public Company Accounting Oversight Board (United States). Those standards require that we plan and perform the audit to obtain reasonable assurance about whether the financial statements and financial highlights are free of material misstatement. An audit includes examining, on a test basis, evidence supporting the amounts and disclosures in the financial statements. Our procedures included confirmation of securities owned as of June 30, 2011 by correspondence with the custodian. An audit also includes assessing the accounting principles used and significant estimates made by management, as well as evaluating the overall financial statement presentation. We believe that our audits provide a reasonable basis for our opinion.
In our opinion, the financial statements and financial highlights referred to above present fairly, in all material respects, the financial position of the Cutler Equity Fund as of June 30, 2011, the results of its operations for the year then ended, the changes in its net assets for each of the two years in the period then ended and its financial highlights for each of the four years in the period then ended, in conformity with accounting principles generally accepted in the United States of America.
BBD, LLP
Philadelphia, Pennsylvania
August 22, 2011
CUTLER EQUITY FUND ABOUT YOUR FUND’S EXPENSES (Unaudited) |
We believe it is important for you to understand the impact of costs on your investment. As a shareholder of the Fund, you incur ongoing costs, including management fees and other Fund expenses. These ongoing costs, which are deducted from the Fund’s gross income, directly reduce the investment return of the Fund.
A mutual fund’s ongoing costs are expressed as a percentage of its average net assets. This figure is known as the expense ratio. The following examples are intended to help you understand the ongoing costs (in dollars) of investing in the Fund and to compare these costs with the ongoing costs of investing in other mutual funds. The examples below are based on an investment of $1,000 made at the beginning of the period shown (January 1, 2011) and held for the entire period (June 30, 2011).
The table below illustrates the Fund’s costs in two ways:
Actual Fund return – This section helps you to estimate the actual expenses that you paid over the period. The “Ending Account Value” shown is derived from the Fund’s actual return, and the third column shows the dollar amount of operating expenses that would have been paid by an investor who started with $1,000 in the Fund. You may use the information here, together with the amount you invested, to estimate the expenses that you paid over the period.
To do so, simply divide your account value by $1,000 (for example, an $8,600 account value divided by $1,000 = 8.6), then multiply the result by the number given for the Fund under the heading “Expenses Paid During Period.”
Hypothetical 5% return – This section is intended to help you compare the Fund’s ongoing costs with those of other mutual funds. It assumes that the Fund had an annual return of 5% before expenses during the period shown, but that the expense ratio is unchanged. In this case, because the return used is not the Fund’s actual return, the results do not apply to your investment. The example is useful in making comparisons because the Securities and Exchange Commission (the “SEC”) requires all mutual funds to calculate expenses based on a 5% return. You can assess the Fund’s ongoing costs by comparing this hypothetical example with the hypothetical examples that appear in shareholder reports of other funds.
Note that expenses shown in the table are meant to highlight and help you compare ongoing costs only. The Fund does not charge transaction fees, such as purchase or redemption fees, nor does it impose any sales loads.
The calculations assume no shares were bought or sold during the period. Your actual costs may have been higher or lower, depending on the amount of your investment and the timing of any purchases or redemptions.
CUTLER EQUITY FUND ABOUT YOUR FUND’S EXPENSES (Unaudited) (Continued) |
More information about the Fund’s expenses, including annual expense ratios over the past five years, can be found in this report. For additional information on operating expenses and other shareholder costs, please refer to the Fund’s prospectus.
| | Beginning Account Value January 1, 2011 | Ending Account Value June 30, 2011 | Expenses Paid During Period* |
| Based on Actual Fund Return | $1,000.00 | $1,076.30 | $6.59 |
| Based on Hypothetical 5% Return (before expenses) | $1,000.00 | $1,018.45 | $6.41 |
| * | Expenses are equal to the Fund’s annualized expense ratio of 1.28% for the period, multiplied by the average account value over the period, multiplied by 181/365 (to reflect the one-half year period). |
FEDERAL TAX INFORMATION (Unaudited)
For the fiscal year ended June 30, 2011, certain dividends paid by the Fund may be subject to a maximum tax rate of 15%, as provided by the Jobs and Growth Tax Relief Reconciliation Act of 2003. The Fund intends to designate up to a maximum amount of $629,518 as taxed at a maximum rate of 15%. For the fiscal year ended June 30, 2011, 100% of the dividends paid from ordinary income by the Fund qualified for the dividends received deduction for corporations. Complete information will be computed and reported in conjunction with your 2011 Form 1099-DIV.
CUTLER EQUITY FUND TRUSTEES AND OFFICERS OF THE TRUST (Unaudited) |
The Board of Trustees is responsible for managing the Trust’s business affairs and exercising all the Trust’s powers except those reserved for shareholders. The following tables give information about each Board member and the senior officers of the Fund. Each Trustee holds office until the person resigns, is removed, or replaced. Officers are elected for an annual term. Unless otherwise noted, the Trustees and officers have held their principal occupations for more than five years. The Fund’s Statement of Additional Information includes additional information about the Trustees and is available, without charge and upon request, by calling 1-888-CUTLER4.
Name, Date of Birth and Address | Position with the Trust | Length of Time Served | Principal Occupation(s) During Past 5 Years | Number of Portfolios in Fund Complex Overseen by Trustee | Other Directorships Held by Trustee |
| Interested Trustees |
Matthew C. Patten(a) Born: December 1975 525 Bigham Knoll Jacksonville, OR 97530 | Trustee/ Chairman/ Treasurer | Trustee Since 2006; Treasurer Since 2004 | President since 2004 and Investment Committee Member and Portfolio Manager since 2003 of Cutler Investment Counsel, LLC. | | |
| Independent Trustees |
John P. Cooney Born: January 1932 100 Greenway Circle Medford, OR 97504 | | | Retired since March 2007; U.S. Magistrate Judge until March 2007. | | |
Robert E. Clarke Born: May 1922 1200 Mira Mar Avenue Medford, OR 97504 | | | | | |
Dr. Mario Campagna Born: April 1927 1701 Lake Village Drive Medford, OR 97504 | | | | | |
| (a) | Matthew C. Patten is an “Interested Person,” as defined by the 1940 Act, because he is an affiliated person of the Adviser. |
CUTLER EQUITY FUND TRUSTEES AND OFFICERS OF THE TRUST (Unaudited) (Continued) |
Name, Date of Birth and Address | Position with the Trust | Length of Time Served | Principal Occupation(s) During Past 5 Years |
| Senior Officers |
Erich M. Patten Born: October 1977 525 Bigham Knoll Jacksonville, OR 97530 | | | Investment Committee Member, Portfolio Manager, and Corporate Secretary of Cutler Investment Counsel, LLC since 2003. |
Brooke C. Ashland Born: December 1951 525 Bigham Knoll Jacksonville, OR 97530 | Vice President/
Chief Compliance Officer | | Investment Committee Member and Chief Executive Officer of Cutler Investment Counsel, LLC since 2003. Chief Executive Officer and President of Trustee Investment Services, Inc. (a Trustee education firm) since 1991; President of Big Bear Timber, LLC (farming) since 1989. |
Carol S. Fischer Born: December 1955 525 Bigham Knoll Jacksonville, OR 97530 | Vice President/
Asst. Secretary/
Asst. Treasurer | | Member and Chief Operating Officer of Cutler Investment Counsel, LLC since 2003. |
Robert G. Dorsey Born: April 1957 225 Pictoria Drive Suite 450 Cincinnati, OH 45246 | | | Managing Director of Ultimus Fund Solutions, LLC and Ultimus Fund Distributors, LLC. |
Tina H. Bloom Born: August 1968 225 Pictoria Drive Suite 450 Cincinnati, OH 45246 | | | Director of Fund Administration of Ultimus Fund Solutions, LLC. |
CUTLER EQUITY FUND ADDITIONAL INFORMATION (Unaudited) |
A description of the policies and procedures that the Fund uses to determine how to vote proxies relating to securities held in the Fund’s portfolio is available without charge, upon request, by calling 1-800-228-8537 or on the SEC’s website at http://www.sec.gov. Information regarding how the Fund voted proxies relating to portfolio securities during the most recent 12-month period ended June 30 is also available without charge upon request by calling 1-800-228-8537 or on the SEC’s website at http://www.sec.gov.
The Trust files a complete listing of the Fund’s portfolio holdings with the SEC as of the first and third quarters of each fiscal year on Form N-Q. The filings are available without charge, upon request, by calling 1-800-228-8537. Furthermore, you may obtain a copy of the filings on the SEC’s website at http://www.sec.gov. The Trust’s Forms N-Q may also be reviewed and copied at the SEC’s Public Reference Room in Washington, DC, and information on the operation of the Public Reference Room may be obtained by calling 1-800-SEC-0330.
CUTLER EQUITY FUND APPROVAL OF INVESTMENT ADVISORY AGREEMENT
(Unaudited) |
The Board of Trustees, including the Independent Trustees voting separately, has reviewed and approved the continuance of the Fund’s Investment Advisory Agreement (the “Agreement”) with the Adviser for an additional one year period. Approval took place at an in-person meeting held on April 8, 2011, at which all of the Trustees were present. The Independent Trustees were advised by their counsel of their fiduciary obligations in approving the Agreement and the Trustees requested such information from the Adviser as they deemed reasonably necessary to evaluate the terms of the Agreement and whether the Agreement continues to be in the best interests of the Fund and its shareholders. The Trustees reviewed: (i) the nature, extent and quality of the services provided by the Adviser; (ii) the investment performance of the Fund and of comparable private accounts of the Adviser; (iii) the costs of the services provided and the profits realized by the Adviser from its relationship with the Fund; (iv) the extent to which economies of scale would be realized as the Fund grows; and (v) whether fee levels reflect these economies of scale for the benefit of the Fund’s shareholders.
The Trustees reviewed the background, qualifications, education and experience of the Adviser’s investment and operational personnel. Management provided detailed information on its professional personnel, including each person’s area of responsibility.
The Trustees also discussed and considered the quality of administrative and other services provided to the Fund, the Adviser’s and the Fund’s compliance programs, and the Adviser’s role in coordinating such services and programs. The Independent Trustees were advised by experienced independent counsel throughout the process. The Adviser provided the Board with information to assist the Trustees in analyzing the performance of the Fund over various periods ended December 31, 2010. The Fund’s returns were compared to the returns of S&P 500 Total Return Index, the Dow Jones Industrial Average and certain other indices, comparable private accounts managed by the Adviser, and domestic equity funds in the Morningstar database of similar size with similar investment styles. These analyses and comparisons showed that the Fund has performed competitively over both the short and long term. Based upon their review, the Trustees found that the Fund’s performance has been competitive with the returns of relevant securities indices and other similarly situated mutual funds.
In reviewing the advisory fee and total expense ratios of the Fund, the Trustees were provided with comparative expense and advisory fee information for other mutual funds, categorized both by fund size and by investment style. The Fund currently pays an investment advisory fee computed at the annual rate of 0.75% of the Fund’s average daily net assets. The Trustees took note of the fact that, although the Fund’s contractual advisory fee was slightly higher than the average advisory fee and equal to the median for the peer group, the Fund’s net expense ratio was lower than the peer group average. The Trustees also noted that the Advisor had voluntarily waived advisory fees during the most recently completed fiscal year in an amount that lowered the advisory fees paid by the Fund from 0.75% to 0.73% of average daily net assets. The Trustees further noted that, effective November 1, 2010, the Adviser contractually agreed to waive its advisory fees and pay Fund operating expenses to the extent necessary to limit annual fund operating expenses to 1.40% of the Fund’s average daily
CUTLER EQUITY FUND APPROVAL OF INVESTMENT ADVISORY AGREEMENT
(Unaudited) (Continued) |
net assets until November 1, 2011, although due to the Fund’s asset growth no fee waivers have been necessary to date.
The Trustees reviewed the Adviser’s current registration form (Form ADV) and its financial statement as well as an analysis prepared by the Adviser reflecting its revenues and expenses with respect to its services to the Fund for the year ended December 31, 2010. The Trustees noted that the Fund does not have any “soft dollar” arrangements with broker-dealers that would otherwise benefit the Adviser and considered any fall-out benefits to the Adviser from managing the Fund.
Prior to voting, the Independent Trustees reviewed the proposed continuance of the Agreement with counsel in executive session. In approving the Agreement, the Independent Trustees reached the following conclusions: (1) based on the performance and risk characteristics of the Fund and the effectiveness of the Fund in achieving its stated objective, the Adviser has provided high quality services; (2) the Adviser has the financial resources and personnel to continue to provide quality advisory services to the Fund; (3) the advisory fees paid by the Fund are reasonable and the total expenses of the Fund are reasonable; and (4) the continuation of the Agreement is in the best interests of the Fund and its shareholders. The Independent Trustees also reviewed and considered the profitability of the Adviser with regards to its management of the Fund, concluding that the Adviser’s profitability was not excessive given the quality and scope of services provided by the Adviser and the investment performance of the Fund. The Independent Trustees further determined that, based on the Fund’s current asset levels, it would not be relevant to consider the extent to which economies of scale would be realized as the Fund grows, and whether fee levels reflect these economies of scale. Following further discussion, it was the consensus of the Independent Trustees that it is not appropriate to introduce fee breakpoints at the present time. The Trustees noted, however, that if the Fund grows significantly in assets, it may become necessary for the Adviser to consider adding fee breakpoints to the Agreement.
No single factor was considered in isolation or to be determinative to the decision of the Trustees to approve continuance of the Agreement. Rather, the Trustees concluded, in light of a weighing and balancing of all factors considered, that it would be in the best interests of the Fund and its shareholders to renew the Agreement for an additional annual period.
This page intentionally left blank.
This page intentionally left blank.
This page intentionally left blank.
CUTLER INVESTMENT COUNSEL, LLC
Investment Management
INVESTMENT ADVISER TO THE TRUST
525 Bigham Knoll
Jacksonville, OR 97530
(800)228-8537 • (541)770-9000
Fax:(541)779-0006
info@cutler.com
As of the end of the period covered by this report, the registrant has adopted a code of ethics that applies to the registrant’s principal executive officer, principal financial officer, principal accounting officer or controller, or persons performing similar functions, regardless of whether these individuals are employed by the registrant or a third party. Pursuant to Item 12(a)(1), a copy of registrant’s code of ethics is filed as an exhibit to this Form N-CSR. During the period covered by this report, the code of ethics has not been amended, and the registrant has not granted any waivers, including implicit waivers, from the provisions of the code of ethics.
The registrant’s board of trustees has determined that the registrant does not have an audit committee financial expert serving on its audit committee. The audit committee determined that, although none of its members meet the technical definition of an audit committee financial expert, the collective experience of the members provides the registrant with adequate oversight for the registrant’s current level of financial complexity.
The registrant has not adopted procedures by which shareholders may recommend nominees to the registrant’s board of trustees.
(a) Based on their evaluation of the registrant’s disclosure controls and procedures (as defined in Rule 30a-3(c) under the Investment Company Act of 1940) as of a date within 90 days of the filing date of this report, the registrant’s principal executive officer and principal financial officer have concluded that such disclosure controls and procedures are reasonably designed and are operating effectively to ensure that material information relating to the registrant, including its consolidated subsidiaries, is made known to them by others within those entities, particularly during the period in which this report is being prepared, and that the information required in filings on Form N-CSR is recorded, processed, summarized, and reported on a timely basis.
(b) There were no changes in the registrant’s internal control over financial reporting (as defined in Rule 30a-3(d) under the Investment Company Act of 1940) that occurred during the second fiscal quarter of the period covered by this report that have materially affected, or are reasonably likely to materially affect, the registrant’s internal control over financial reporting.
File the exhibits listed below as part of this Form. Letter or number the exhibits in the sequence indicated.
(a)(1) Any code of ethics, or amendment thereto, that is the subject of the disclosure required by Item 2, to the extent that the registrant intends to satisfy the Item 2 requirements through filing of an exhibit: Attached hereto
(a)(2) A separate certification for each principal executive officer and principal financial officer of the registrant as required by Rule 30a-2(a) under the Act (17 CFR 270.30a-2(a)): Attached hereto
(a)(3) Any written solicitation to purchase securities under Rule 23c-1 under the Act (17 CFR 270.23c-1) sent or given during the period covered by the report by or on behalf of the registrant to 10 or more persons: Not applicable
(b) Certifications required by Rule 30a-2(b) under the Act (17 CFR 270.30a-2(b)): Attached hereto
Pursuant to the requirements of the Securities Exchange Act of 1934 and the Investment Company Act of 1940, the registrant has duly caused this report to be signed on its behalf by the undersigned, thereunto duly authorized.
Pursuant to the requirements of the Securities Exchange Act of 1934 and the Investment Company Act of 1940, this report has been signed below by the following persons on behalf of the registrant and in the capacities and on the dates indicated.