Washington, D.C. 20549
Erich M. Patten
Form N-CSR is to be used by management investment companies to file reports with the Commission not later than 10 days after the transmission to stockholders of any report that is required to be transmitted to stockholders under Rule 30e-1 under the Investment Company Act of 1940 (17 CFR 270.30e-1). The Commission may use the information provided on Form N-CSR in its regulatory, disclosure review, inspection, and policymaking roles.
A registrant is required to disclose the information specified by Form N-CSR, and the Commission will make this information public. A registrant is not required to respond to the collection of information contained in Form N-CSR unless the Form displays a currently valid Office of Management and Budget ("OMB") control number. Please direct comments concerning the accuracy of the information collection burden estimate and any suggestions for reducing the burden to Secretary, Securities and Exchange Commission, 450 Fifth Street, NW, Washington, DC 20549-0609. The OMB has reviewed this collection of information under the clearance requirements of 44 U.S.C. § 3507.
Item 1. Reports to Stockholders.
 | The Cutler Trust |
CUTLER EQUITY FUND
CUTLER FIXED INCOME FUND
ANNUAL REPORT
June 30, 2013
| | Page |
| Letter to Shareholders | 2 |
| Management Discussion of Fund Performance | 3 |
| Performance Information | 8 |
| Portfolio Information | 10 |
| Schedules of Investments | 11 |
| Statements of Assets and Liabilities | 18 |
| Statements of Operations | 19 |
| Statements of Changes in Net Assets | 20 |
| Financial Highlights | 22 |
| Notes to Financial Statements | 24 |
| Report of Independent Registered Public Accounting Firm | 32 |
| About Your Fund’s Expenses | 33 |
| Federal Tax Information | 34 |
| Trustees and Officers of the Trust | 35 |
| Additional Information | 37 |
| Approval of Investment Advisory Agreement | 38 |
To The Cutler Funds’ Shareholders:
This past year was quite eventful for The Cutler Trust. Not only did the Cutler Equity Fund achieve significant market gains this past year, the merger with the Elite Funds facilitated notable asset growth as well. This has resulted in a reduced expense ratio, a positive development for the Equity Fund shareholders. Additionally, The Cutler Trust welcomed the Cutler Fixed Income Fund. Shareholders who are interested in asset allocation between stocks and bonds can seamlessly take advantage of this new Fund. Please give us a call if you think this might be an appropriate option for you.
This Annual Report contains the audited financial statements of the Cutler Equity Fund and the Cutler Fixed Income Fund (the “Funds”) for the fiscal period ended June 30, 2013. (Elite Fund shareholders will note that their previous fiscal year ended September 30th.) You also will find in this document a report of the performance of both Funds, financial statements, as well as other pertinent information regarding The Cutler Trust.
The Cutler Equity Fund continues to be managed in Cutler’s dividend-based strategy. All of the holdings in the portfolio typically maintain a 10-year dividend history, an investment criteria that we believe reduces investor risk. Today, the stock market has achieved remarkable gains from the lows of the financial crisis. We continue to believe that a prudent approach to the equity markets errs on the side of caution. Similarly, our management of the Cutler Fixed Income Fund is biased toward a conservative approach. We believe that bonds are at an inflection point, with interest rates near historical lows. An actively managed bond portfolio can help to mitigate the risks associated with rising interest rates, and we are seeking to position the bond portfolio appropriately for this likelihood.
As always, Cutler welcomes your feedback or questions. As a shareholder of The Cutler Trust we thank you for your business. Should you wish to talk further about your investments, please do not hesitate to contact us.
Sincerely,
 |  |  |
| Matthew C. Patten | Erich M. Patten | Xavier J. Urpi |
| Chairman | Portfolio Manager | Director of Fixed Income |
| The Cutler Trust | Cutler Investment Counsel, LLC | Cutler Investment Counsel, LLC |
Before investing you should carefully consider the Cutler Funds’ investment objectives, risks, charges and expenses. This and other information is in the prospectus, a copy of which may be obtained by calling 1-800-228-8537. Please read the prospectus carefully before you invest.
The views in this report were those of the Cutler Trust’s investment adviser as of June 30, 2013 and may not reflect its views on the date this report is first published or anytime thereafter. These views are intended to assist shareholders in understanding their investment in the Cutler Funds and do not constitute investment advice.
CUTLER EQUITY FUND
MANAGEMENT DISCUSSION OF FUND PERFORMANCE
| 1) | How did the Equity Fund perform last year? |
The Equity Fund’s total return was 19.26% for the year ended June 30, 2013.
| 2) | What were the most significant market factors affecting the Equity Fund’s performance during the past year? |
Market factors included:
| 1) | Positive equity market trends |
| 2) | The Federal Reserve’s Quantitative Easing Policy |
| 3) | Continued earnings growth by domestic companies |
| 4) | Attractiveness of dividend paying securities |
| 3) | Why did the Equity Fund underperform relative to the benchmark? |
The S&P 500 Total Return Index returned 20.60% during the fiscal year ended June 30, 2013. The Equity Fund underperformed by 1.34%. Specific market factors contributing to underperformance include:
| | • | The lower risk profile of the Equity Fund (risk adjusted returns exceeded the S&P 500 Total Return Index) |
| | • | Outperformance by securities that do not meet Cutler’s investment criteria (such as certain Financials a la Bank of America) |
| | • | Interest rate sensitivity of dividend paying equities |
Sector allocation had the strongest contribution to the Equity Fund’s modest underperformance this year. An attribution of the portfolio’s returns shows that sector weightings had a negative impact versus the S&P 500 Total Return Index, while stock selection had a positive impact.
Finally, we note that this past fiscal year was the first since 2006-2007 where the S&P 500 Total Return Index’s return exceeded the Equity Fund’s performance.
| 4) | What strategies did you use to manage the Equity Fund? |
Cutler’s investment process focuses on dividends as the primary driver of investment returns. The strategy was not changed during the fiscal year, and the management of the Equity Fund was consistent with previous years. Holdings in the portfolio typically maintain a 10-year record of consistent dividend payments, and have a total market capitalization of at least $10 billion. We seek relative value as compared to other companies in similar industries. The Equity Fund has a value bias, but is benchmarked to the S&P 500 Total Return Index. The strategy is further detailed in the Equity Fund’s prospectus.
CUTLER EQUITY FUND
MANAGEMENT DISCUSSION OF FUND PERFORMANCE
| 5) | What were the primary strategic factors that guided your management of the Equity Fund? |
Cutler’s dividend criteria have been the primary strategic factor used in managing the Equity Fund this past year. The Equity Fund’s Portfolio Managers continue to focus on companies they believe have demonstrated a strong dividend history, provide attractive current yields, and potential for total return.
Turnover of the Equity Fund was higher than typical due to the influx of assets associated with the acquisition of the Elite Funds. Non-merger related turnover was below 10%, which is lower than our historical average. We attribute this low-turnover to the low-volatility environment for investors. Dividends have remained stable and are growing, and valuation opportunities are less prevalent than in recent years. We continue to reposition the portfolio into what we believe are more attractively valued securities as these opportunities arise.
| 6) | What were some of the key trends in each of the regions/significant industries the Equity Fund invests in? |
The Equity Fund holdings remain 100% domiciled in the U.S., and the strategies employed do not have any additional regional bias.
Domestic markets have been among the most attractive in the world, as investors seek the modest growth and safety of U.S. equities. Notably, emerging market equities have lagged the current market rally, due to uncertainty about China’s economic recovery and risks in their banking system. European equities may have stabilized, but have not recovered fully due to anemic economic growth in the Euro Zone. Japanese equities have had remarkable volatility in 2013, as the Japanese government has aggressively sought an inflationary monetary policy.
The Portfolio Managers have sought to reduce exposure within the portfolio to interest rate sensitive securities. For example, as a dividend-focused fund, there have been market environments in the past where Utilities comprised a significant portion of the portfolio. Today, the Equity Fund holds only one utility, National Fuel Gas Co., and this company has a diversified revenue stream that may cushion the stock from rising rates. In addition, the Equity Fund has increased exposure to the Information Technology sector, such as the recent addition of QUALCOMM. Information Technology has become more attractive to Cutler’s strategy recently, as the business model of many tech companies matures and dividends become more prevalent.
CUTLER EQUITY FUND
MANAGEMENT DISCUSSION OF FUND PERFORMANCE
| 7) | Which securities helped the Equity Fund’s performance? |
| b. | The Charles Schwab Corp. |
| d. | Honeywell International, Inc. |
| 8) | Did any securities hurt the Equity Fund’s performance? |
Note: Both Chubb and McDonald’s had positive total return, but had negative contributions due to the strong performance of their relative sectors.
CUTLER FIXED INCOME FUND
MANAGEMENT DISCUSSION OF FUND PERFORMANCE
| 1) | How did the Fixed Income Fund perform last year? |
The Fixed Income Fund was down 2.16% for the 9 months ended June 30, 2013.
| 2) | What were the most significant market factors affecting the Fixed Income Fund’s performance during the past year? |
Market factors included:
| 1) | The Federal Reserve’s low interest rate policy |
| 2) | The narrowing of yield spreads between Treasuries and all other riskier securities |
| 3) | Steepening of the yield curve, as medium to long term interest rates rose in anticipation of a reduction in long bond purchases by the Federal Reserve |
| 3) | Explain the Fixed Income Fund’s performance relative to the benchmark. |
The Fixed Income Fund was down 2.16% for the 9 months ended June 30, 2013. Its benchmark, the Barclays Intermediate U.S. Government/Credit Index (the “Index”), was down 1.11% during that same period. The underperformance during this time period can be attributed to the Fixed Income Fund’s higher duration versus the Index as well as its term structure, which was more bar-belled relative to the Index.
| 4) | What strategies did you use to manage the Fixed Income Fund? |
The Fixed Income Fund seeks to achieve high income over the long term and invests principally in a diversified portfolio of investment grade fixed income securities that are expected to generate a high level of current income. It normally invests in investment grade fixed income securities consisting primarily of obligations issued by the U.S. government, agencies of the U.S. government, and U.S. corporate debt securities.
| 5) | What were the primary strategic factors that guided your management of the Fixed Income Fund? |
The decision of the Federal Reserve to keep U.S. Treasury interest rates artificially low and the upcoming possible reduction in purchases of long treasuries by the Federal Reserve provided opportunities to reduce exposure in long-term corporate securities in favor of five to seven year U.S. Agencies.
CUTLER FIXED INCOME FUND
MANAGEMENT DISCUSSION OF FUND PERFORMANCE
| 6) | What were some of the key trends in each of the regions/significant industries the Fixed Income Fund invests in? |
The Fixed Income Fund focuses on securities issued in the U.S. Key trends included the increase in medium to long-term interest rates and steepening of the yield curve in anticipation of a reduction in long bond purchases by the Federal Reserve. Additionally, the narrowing of spreads between the U.S. Treasury sector and all other riskier sectors aided the Fixed Income Fund; however, we believe this trend has reached levels that are not sustainable. Thereby, the possibility of a reversal of this trend has increased.
| 7) | Which securities helped the Fixed Income Fund’s performance? |
Relative to the Index, the Fixed Income Fund’s exposure to shorter duration securities and corporate bonds helped the Fund’s performance.
| 8) | Did any securities hurt the Fixed Income Fund’s performance? |
Relative to the Index, the Fixed Income Fund’s exposure to securities with maturities greater than ten years hurt the Fund’s performance.
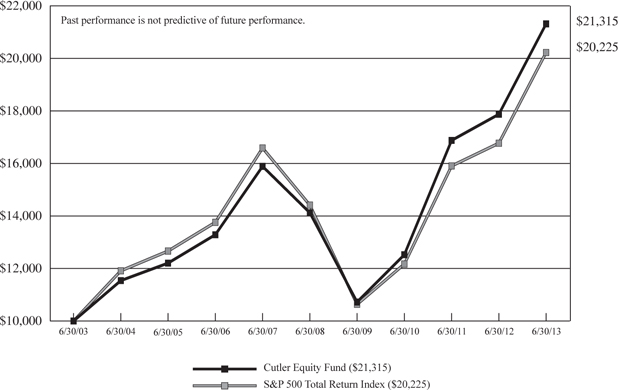
CUTLER EQUITY FUND
PERFORMANCE INFORMATION
June 30, 2013 (Unaudited)
Comparison of the Change in Value of a $10,000 Investment in
Cutler Equity Fund and the S&P 500 Total Return Index
Average Annual Total Returns(a) (for periods ended June 30, 2013) |
| | | | | |
| Cutler Equity Fund | 19.26% | 8.58% | 7.86% | |
| S&P 500 Total Return Index | 20.60% | 7.01% | 7.30% | |
| | | | | | |
| (a) | Returns shown do not reflect the deduction of taxes a shareholder would pay on Fund distributions or the redemption of Fund shares. | |
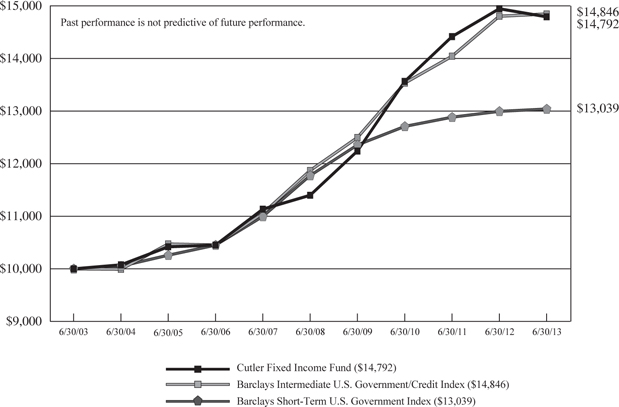
CUTLER FIXED INCOME FUND
PERFORMANCE INFORMATION
June 30, 2013 (Unaudited)
Comparison of the Change in Value of a $10,000 Investment in
Cutler Fixed Income Fund, Barclays Intermediate U.S. Government/Credit Index and
Barclays Short-Term U.S. Government Index
Average Annual Total Returns(a) (for periods ended June 30, 2013) |
| | | | | |
| Cutler Fixed Income Fund | -1.03% | 5.35% | 3.99% | |
| Barclays Intermediate U.S. Government/Credit Index | 0.28% | 4.57% | 4.03% | |
| Barclays Short-Term U.S. Government Index | 0.34% | 2.06% | 2.69% | |
| | | | | | |
| (a) | Returns shown do not reflect the deduction of taxes a shareholder would pay on Fund distributions or the redemption of Fund shares. | |
CUTLER EQUITY FUND
PORTFOLIO INFORMATION
June 30, 2013 (Unaudited)
Sector Allocation (% of Net Assets)
CUTLER FIXED INCOME FUND
PORTFOLIO INFORMATION
June 30, 2013 (Unaudited)
Sector Allocation (% of Net Assets)
CUTLER EQUITY FUND
SCHEDULE OF INVESTMENTS
| | | | | | |
| Consumer Discretionary — 12.7% | | | | | | |
| Hotels, Restaurants & Leisure — 2.8% | | | | | | |
| McDonald's Corporation | | | 28,405 | | | $ | 2,812,095 | |
| | | | | | | | | |
| Media — 3.1% | | | | | | | | |
| Walt Disney Company (The) | | | 48,992 | | | | 3,093,845 | |
| | | | | | | | | |
| Multiline Retail — 3.3% | | | | | | | | |
| Nordstrom, Inc. | | | 56,385 | | | | 3,379,717 | |
| | | | | | | | | |
| Specialty Retail — 3.5% | | | | | | | | |
| Home Depot, Inc. (The) | | | 46,200 | | | | 3,579,114 | |
| | | | | | | | | |
| Consumer Staples — 12.7% | | | | | | | | |
| Beverages — 2.9% | | | | | | | | |
| PepsiCo, Inc. | | | 35,495 | | | | 2,903,136 | |
| | | | | | | | | |
| Food & Staples Retailing — 2.0% | | | | | | | | |
| Sysco Corporation | | | 60,595 | | | | 2,069,925 | |
| | | | | | | | | |
| Food Products — 2.1% | | | | | | | | |
| Archer-Daniels-Midland Company | | | 62,135 | | | | 2,106,998 | |
| | | | | | | | | |
| Household Products — 5.7% | | | | | | | | |
| Kimberly-Clark Corporation | | | 30,490 | | | | 2,961,798 | |
| Procter & Gamble Company (The) | | | 36,130 | | | | 2,781,649 | |
| | | | | | | | 5,743,447 | |
| Energy — 9.0% | | | | | | | | |
| Oil, Gas & Consumable Fuels — 9.0% | | | | | | | | |
| Chevron Corporation | | | 29,820 | | | | 3,528,899 | |
| ConocoPhillips | | | 41,830 | | | | 2,530,715 | |
| Exxon Mobil Corporation | | | 33,881 | | | | 3,061,148 | |
| | | | | | | | 9,120,762 | |
| Financials — 13.0% | | | | | | | | |
| Capital Markets — 3.1% | | | | | | | | |
| Charles Schwab Corporation (The) | | | 145,095 | | | | 3,080,367 | |
| | | | | | | | | |
| Commercial Banks — 3.1% | | | | | | | | |
| M&T Bank Corporation | | | 28,340 | | | | 3,166,995 | |
| | | | | | | | | |
| Consumer Finance — 3.5% | | | | | | | | |
| American Express Company | | | 47,395 | | | | 3,543,250 | |
CUTLER EQUITY FUND
SCHEDULE OF INVESTMENTS (Continued)
COMMON STOCKS — 98.3% (Continued) | | | | | | |
| Financials — 13.0% (Continued) | | | | | | |
| Insurance — 3.3% | | | | | | |
| Chubb Corporation (The) | | | 39,670 | | | $ | 3,358,065 | |
| | | | | | | | | |
| Health Care — 11.7% | | | | | | | | |
| Health Care Equipment & Supplies — 2.7% | | | | | | | | |
| Becton, Dickinson & Company | | | 27,525 | | | | 2,720,296 | |
| | | | | | | | | |
| Pharmaceuticals — 9.0% | | | | | | | | |
| Bristol-Myers Squibb Company | | | 67,240 | | | | 3,004,956 | |
| Johnson & Johnson | | | 37,170 | | | | 3,191,416 | |
| Merck & Company, Inc. | | | 62,790 | | | | 2,916,595 | |
| | | | | | | | 9,112,967 | |
| Industrials — 10.4% | | | | | | | | |
| Aerospace & Defense — 5.8% | | | | | | | | |
| Honeywell International, Inc. | | | 36,540 | | | | 2,899,084 | |
| United Technologies Corporation | | | 32,010 | | | | 2,975,009 | |
| | | | | | | | 5,874,093 | |
| Electrical Equipment — 2.1% | | | | | | | | |
| Emerson Electric Company | | | 38,735 | | | | 2,112,607 | |
| | | | | | | | | |
| Machinery — 2.5% | | | | | | | | |
| Caterpillar, Inc. | | | 30,280 | | | | 2,497,797 | |
| | | | | | | | | |
| Information Technology — 13.7% | | | | | | | | |
| Communications Equipment — 2.0% | | | | | | | | |
| QUALCOMM, Inc. | | | 32,639 | | | | 1,993,590 | |
| | | | | | | | | |
| IT Services — 3.5% | | | | | | | | |
| International Business Machines Corporation | | | 18,565 | | | | 3,547,957 | |
| | | | | | | | | |
| Semiconductors & Semiconductor Equipment — 5.4% | | | | | | | | |
| Intel Corporation | | | 104,965 | | | | 2,542,253 | |
| Texas Instruments, Inc. | | | 83,900 | | | | 2,925,593 | |
| | | | | | | | 5,467,846 | |
| Software — 2.8% | | | | | | | | |
| Microsoft Corporation | | | 82,425 | | | | 2,846,135 | |
| | | | | | | | | |
| Materials — 6.7% | | | | | | | | |
| Chemicals — 5.1% | | | | | | | | |
| E.I. Du Pont de Nemours & Company | | | 56,905 | | | | 2,987,513 | |
| Monsanto Company | | | 21,715 | | | | 2,145,442 | |
| | | | | | | | 5,132,955 | |
CUTLER EQUITY FUND
SCHEDULE OF INVESTMENTS (Continued)
COMMON STOCKS — 98.3% (Continued) | | | | | | |
| Materials — 6.7% (Continued) | | | | | | |
| Metals & Mining — 1.6% | | | | | | |
| Newmont Mining Corporation | | | 54,074 | | | $ | 1,619,516 | |
| | | | | | | | | |
| Telecommunication Services — 5.4% | | | | | | | | |
| Diversified Telecommunication Services — 5.4% | | | | | | | | |
| AT&T, Inc. | | | 68,940 | | | | 2,440,476 | |
| Verizon Communications, Inc. | | | 60,960 | | | | 3,068,726 | |
| | | | | | | | 5,509,202 | |
| Utilities — 3.0% | | | | | | | | |
| Gas Utilities — 3.0% | | | | | | | | |
| National Fuel Gas Company | | | 52,145 | | | | 3,021,803 | |
| | | | | | | | | |
Total Common Stocks (Cost $75,067,999) | | | | | | $ | 99,414,480 | |
MONEY MARKET FUNDS — 1.4% | | | | | | |
Invesco STIT-STIC Prime Portfolio (The) - Institutional Class, 0.02% (a) (Cost $1,456,951) | | | 1,456,951 | | | $ | 1,456,951 | |
| | | | | | | | | |
Total Investments at Value — 99.7% (Cost $76,524,950) | | | | | | $ | 100,871,431 | |
| | | | | | | | | |
| Other Assets in Excess of Liabilities — 0.3% | | | | | | | 312,386 | |
| | | | | | | | | |
| Net Assets — 100.0% | | | | | | $ | 101,183,817 | |
| (a) | The rate shown is the 7-day effective yield as of June 30, 2013. |
| See accompanying notes to financial statements. |
CUTLER FIXED INCOME FUND
SCHEDULE OF INVESTMENTS
June 30, 2013
U.S. TREASURY OBLIGATIONS — 12.9% | | | | | | | | | |
| U.S. Treasury Notes | 09/30/16 | | | 1.000 | % | | $ | 1,125,000 | | | $ | 1,132,647 | |
| U.S. Treasury Bonds | 08/15/23 | | | 6.250 | % | | | 400,000 | | | | 536,750 | |
| U.S. Treasury Bonds | 02/15/26 | | | 6.000 | % | | | 320,000 | | | | 429,600 | |
Total U.S. Treasury Obligations (Cost $2,017,724) | | | $ | 2,098,997 | |
CUTLER FIXED INCOME FUND
SCHEDULE OF INVESTMENTS (Continued)
U.S. GOVERNMENT AGENCY OBLIGATIONS — 35.6% (Continued) | | | | | | | | | |
| Tennessee Valley Authority — 2.6% | | | | | | | | | | |
| Tennessee Valley Authority | 08/01/13 | | | 4.750 | % | | $ | 250,000 | | | $ | 250,904 | |
| Tennessee Valley Authority | 07/15/45 | | | 6.235 | % | | | 150,000 | | | | 176,112 | |
| | | | | | | | | | | | | 427,016 | |
| U.S. Department of Housing and Urban Development — 1.0% | | | | | | | | | | | | | |
| U.S. Department of Housing and Urban Development | 08/01/25 | | | 4.130 | % | | | 150,000 | | | | 162,339 | |
| | | | | | | | | | | | | | |
Total U.S. Government Agency Obligations (Cost $5,951,623) | | | $ | 5,786,982 | |
OTHER GOVERNMENT OBLIGATIONS — 5.3% | | | | | | | | | |
| Province of Manitoba | 04/28/14 | | | 1.375 | % | | $ | 200,000 | | | $ | 201,676 | |
| Province of Manitoba | 04/03/17 | | | 1.300 | % | | | 350,000 | | | | 351,750 | |
| Province of Nova Scotia | 07/21/15 | | | 2.375 | % | | | 300,000 | | | | 309,810 | |
Total Other Government Obligations (Cost $863,761) | | | $ | 863,236 | |
MORTGAGE-BACKED SECURITIES — 3.6% | | | | | | | | | |
| Federal Home Loan Mortgage Corporation — 1.0% | | | | | | | | | | |
| FHLMC, Series 2962-YE | 09/15/18 | | | 4.500 | % | | $ | 40,325 | | | $ | 40,519 | |
| FHLMC, Pool #J13584 | 11/01/25 | | | 3.500 | % | | | 79,584 | | | | 83,676 | |
| FHLMC, Series 1963-Z | 01/15/27 | | | 7.500 | % | | | 38,205 | | | | 44,273 | |
| | | | | | | | | | | | | 168,468 | |
| Federal National Mortgage Association — 2.5% | | | | | | | | | | | | | |
| FNMA, Series 2003-3-HJ | 02/25/18 | | | 5.000 | % | | | 34,351 | | | | 36,629 | |
| FNMA, Pool #899237 | 03/01/22 | | | 5.000 | % | | | 25,982 | | | | 27,686 | |
| FNMA, Series 2002-93-A1 | 03/25/32 | | | 6.500 | % | | | 67,937 | | | | 76,518 | |
| Multifamily REMIC Trust, Series 2006-M1-D | 06/25/19 | | | 5.385 | %(a) | | | 250,000 | | | | 272,643 | |
| | | | | | | | | | | | | 413,476 | |
| Government National Mortgage Association — 0.1% | | | | | | | | | | | | | |
| GNMA, Pool #577742 | 09/15/17 | | | 5.500 | % | | | 11,328 | | | | 12,048 | |
| | | | | | | | | | | | | | |
Total Mortgage-Backed Securities (Cost $576,624) | | | $ | 593,992 | |
CUTLER FIXED INCOME FUND
SCHEDULE OF INVESTMENTS (Continued)
ASSET-BACKED SECURITIES — 5.5% | | | | | | | | | |
| Ford Credit Auto Owner Trust, | | | | | | | | | | |
| Series 2009-E-A4 | 11/15/14 | | | 2.420 | % | | $ | 117,711 | | | $ | 118,235 | |
| Ford Credit Auto Owner Trust, | | | | | | | | | | | | | |
| Series 2012-A-A3 | 04/15/15 | | | 0.840 | % | | | 208,386 | | | | 208,727 | |
| FPL Recovery Funding, | | | | | | | | | | | | | |
| Series 2007-A-A2 | 08/01/15 | | | 5.044 | % | | | 32,002 | | | | 32,135 | |
| FPL Recovery Funding, | | | | | | | | | | | | | |
| Series 2007-A-A3 | 08/01/17 | | | 5.127 | % | | | 220,000 | | | | 231,796 | |
| Mercedes-Benz Auto Receivables Trust, | | | | | | | | | | | | | |
| Series 2011-1-A3 | 03/15/14 | | | 0.850 | % | | | 124,308 | | | | 124,453 | |
| RSB Bond Company, LLC, | | | | | | | | | | | | | |
| Series 2007-A-A2 | 04/01/16 | | | 5.720 | % | | | 163,108 | | | | 173,661 | |
Total Asset-Backed Securities (Cost $900,081) | | | $ | 889,007 | |
| | | | | | | | | |
| Consumer Discretionary — 5.9% | | | | | | | | | | |
| Fortune Brands, Inc. | 01/15/16 | | | 5.375 | % | | $ | 321,000 | | | $ | 350,845 | |
| Scripps Networks Interactive, Inc. | 12/15/16 | | | 2.700 | % | | | 300,000 | | | | 312,118 | |
| Starbucks Corporation | 08/15/17 | | | 6.250 | % | | | 250,000 | | | | 290,248 | |
| | | | | | | | | | | | | 953,211 | |
| Energy — 4.0% | | | | | | | | | | | | | |
| Anadarko Petroleum Corporation | 09/15/16 | | | 5.950 | % | | | 400,000 | | | | 448,669 | |
| Buckeye Partners, L.P. | 02/01/21 | | | 4.875 | % | | | 200,000 | | | | 204,787 | |
| | | | | | | | | | | | | 653,456 | |
| Financials — 13.5% | | | | | | | | | | | | | |
| Bank of America Corporation | 07/12/16 | | | 3.750 | % | | | 250,000 | | | | 262,071 | |
| Biomed Realty, L.P. | 04/15/16 | | | 3.850 | % | | | 200,000 | | | | 209,718 | |
| Citigroup, Inc. | 10/15/14 | | | 5.500 | % | | | 205,000 | | | | 215,616 | |
| Finial Holdings, Inc. | 10/15/23 | | | 7.125 | % | | | 250,000 | | | | 282,012 | |
| Ford Motor Credit Company, LLC | 05/15/15 | | | 2.750 | % | | | 200,000 | | | | 202,798 | |
| People's United Financial, Inc. | 12/06/22 | | | 3.650 | % | | | 500,000 | | | | 469,532 | |
| Senior Housing Properties Trust | 01/15/16 | | | 4.300 | % | | | 250,000 | | | | 259,119 | |
| Wells Fargo & Company | 10/28/15 | | | 0.475 | %(a) | | | 300,000 | | | | 298,627 | |
| | | | | | | | | | | | | 2,199,493 | |
| Industrials — 3.0% | | | | | | | | | | | | | |
| Domtar Corporation | 06/01/17 | | | 10.750 | % | | | 120,000 | | | | 151,021 | |
| Iron Mountain, Inc. | 08/15/21 | | | 8.375 | % | | | 150,000 | | | | 159,562 | |
| Valmont Industries, Inc. | 04/20/20 | | | 6.625 | % | | | 150,000 | | | | 171,035 | |
| | | | | | | | | | | | | 481,618 | |
CUTLER FIXED INCOME FUND
SCHEDULE OF INVESTMENTS (Continued)
CORPORATE BONDS — 31.8% (Continued) | | | | | | | | | |
| Information Technology — 1.4% | | | | | | | | | | |
| Oracle Corporation | 04/15/18 | | | 5.750 | % | | $ | 200,000 | | | $ | 232,726 | |
| | | | | | | | | | | | | | |
| Telecommunication Services — 3.1% | | | | | | | | | | | | | |
| Qwest Corporation | 10/01/14 | | | 7.500 | % | | | 175,000 | | | | 188,363 | |
| Rogers Communications, Inc. | 03/01/14 | | | 6.375 | % | | | 120,000 | | | | 124,481 | |
| Verizon Communications, Inc. | 11/01/16 | | | 2.000 | % | | | 185,000 | | | | 188,509 | |
| | | | | | | | | | | | | 501,353 | |
| Utilities — 0.9% | | | | | | | | | | | | | |
| AEP Texas Central Transmission Funding, LLC | 07/01/13 | | | 4.980 | % | | | 6,984 | | | | 6,986 | |
| Sempra Energy | 06/01/16 | | | 6.500 | % | | | 125,000 | | | | 143,337 | |
| | | | | | | | | | | | | 150,323 | |
| | | | | | | | | | | | | | |
Total Corporate Bonds (Cost $5,118,155) | | | $ | 5,172,180 | |
| | | | | | |
| Citigroup Capital XIII (Cost $208,800) | | | 8,000 | | | $ | 222,800 | |
MONEY MARKET FUNDS — 3.7% | | | | | | |
Invesco STIT-STIC Prime Portfolio (The) - Institutional Class, 0.02% (b) (Cost $594,741) | | | 594,741 | | | $ | 594,741 | |
| | | | | | | | | |
Total Investments at Value — 99.8% (Cost $16,231,509) | | | | | | $ | 16,221,935 | |
| | | | | | | | | |
| Other Assets in Excess of Liabilities — 0.2% | | | | | | | 39,983 | |
| | | | | | | | | |
| Net Assets — 100.0% | | | | | | $ | 16,261,918 | |
| (a) | Variable rate security. The rate shown is the effective interest rate as of June 30, 2013. |
| (b) | The rate shown is the 7-day effective yield as of June 30, 2013. |
| See accompanying notes to financial statements. |
THE CUTLER TRUST
STATEMENTS OF ASSETS AND LIABILITIES
| | | | | | |
| ASSETS | | | | | | |
| Investments in securities: | | | | | | |
| At acquisition cost | | $ | 76,524,950 | | | $ | 16,231,509 | |
| At value (Note 2) | | $ | 100,871,431 | | | $ | 16,221,935 | |
| Dividends and interest receivable | | | 88,730 | | | | 124,875 | |
| Receivable for investment securities sold | | | 233,009 | | | | — | |
| Receivable for capital shares sold | | | 117,366 | | | | 124 | |
| Other assets | | | 11,277 | | | | 7,210 | |
| Total assets | | | 101,321,813 | | | | 16,354,144 | |
| | | | | | | | | |
| LIABILITIES | | | | | | | | |
| Dividends payable | | | 8,633 | | | | 743 | |
| Payable for capital shares redeemed | | | 27,620 | | | | 62,029 | |
| Payable to Adviser (Note 3) | | | 62,681 | | | | 6,896 | |
| Payable to administrator (Note 3) | | | 12,500 | | | | 6,000 | |
| Other accrued expenses | | | 26,562 | | | | 16,558 | |
| Total liabilities | | | 137,996 | | | | 92,226 | |
| | | | | | | | | |
| NET ASSETS | | $ | 101,183,817 | | | $ | 16,261,918 | |
| | | | | | | | | |
| NET ASSETS CONSIST OF: | | | | | | | | |
| Paid-in capital | | $ | 82,243,360 | | | $ | 16,429,142 | |
| Undistributed (distributions in excess of) net investment income | | | 2,290 | | | | (230,861 | ) |
| Accumulated net realized gains (losses) from security transactions | | | (5,408,314 | ) | | | 73,211 | |
| Net unrealized appreciation (depreciation) on investments | | | 24,346,481 | | | | (9,574 | ) |
| NET ASSETS | | $ | 101,183,817 | | | $ | 16,261,918 | |
| | | | | | | | | |
Shares of beneficial interest outstanding
(unlimited number of shares authorized, no par value) | | | 6,771,502 | | | | 1,629,060 | |
| | | | | | | | | |
| Net asset value, offering price and redemption price per share (Note 2) | | $ | 14.94 | | | $ | 9.98 | |
See accompanying notes to financial statements.
| | | | | | | |
| | | | | Nine Months Ended June 30, 2013 (a) | | | Year Ended September 30, 2012 | |
| INVESTMENT INCOME | | | | | | | | | |
Dividend income (net of foreign tax withheld
of $0, $38 and $1,305, respectively) | | $ | 2,278,655 | | | $ | 15,135 | | | $ | 110,721 | |
| Interest | | | — | | | | 315,846 | | | | 624,919 | |
| Securities lending (Note 2) | | | — | | | | — | | | | 4,737 | |
| Total investment income | | | 2,278,655 | | | | 330,981 | | | | 740,377 | |
| | | | | | | | | | | | | |
| EXPENSES | | | | | | | | | | | | |
| Investment advisory fees (Note 3) | | | 633,980 | | | | 66,542 | | | | 145,526 | |
| Administration fees (Note 3) | | | 127,127 | | | | 54,000 | | | | — | |
| Professional fees | | | 44,327 | | | | 37,046 | | | | 20,654 | |
| Shareholder servicing fees (Note 3) | | | 51,297 | | | | 708 | | | | — | |
| Transfer agent fees | | | — | | | | — | | | | 49,535 | |
| Custody and bank service fees | | | 25,013 | | | | 5,127 | | | | 14,615 | |
| Trustees’ fees and expenses (Note 3) | | | 28,975 | | | | 5,049 | | | | 10,080 | |
| Fund accounting fees | | | — | | | | — | | | | 42,302 | |
| Registration and filing fees | | | 24,335 | | | | 11,251 | | | | 1,134 | |
| Insurance expense | | | 19,001 | | | | 1,546 | | | | 6,825 | |
| Compliance service fees | | | — | | | | — | | | | 18,898 | |
| Printing of shareholder reports | | | 5,806 | | | | 7,000 | | | | 2,629 | |
| Other expenses | | | 18,906 | | | | 16,523 | | | | 4,749 | |
| Total expenses | | | 978,767 | | | | 204,792 | | | | 316,947 | |
| | | | | | | | | | | | | |
| NET INVESTMENT INCOME | | | 1,299,888 | | | | 126,189 | | | | 423,430 | |
| | | | | | �� | | | | | | | |
REALIZED AND UNREALIZED GAINS
(LOSSES) ON INVESTMENTS | | | | | | | | | | | | |
| Net realized gains from investment transactions | | | 5,596,759 | | | | 415,303 | | | | 48,861 | |
Net change in unrealized appreciation/
depreciation on investments | | | 8,035,588 | | | | (912,631 | ) | | | 564,710 | |
NET REALIZED AND UNREALIZED
GAINS (LOSSES) ON INVESTMENTS | | | 13,632,347 | | | | (497,328 | ) | | | 613,571 | |
| | | | | | | | | | | | | |
NET INCREASE (DECREASE) IN NET
ASSETS FROM OPERATIONS | | $ | 14,932,235 | | | $ | (371,139 | ) | | $ | 1,037,001 | |
| (a) | Fund changed fiscal year end to June 30. |
| See accompanying notes to financial statements. |
CUTLER EQUITY FUND
STATEMENTS OF CHANGES IN NET ASSETS
| | | | | | |
| FROM OPERATIONS | | | | | | |
| Net investment income | | $ | 1,299,888 | | | $ | 720,242 | |
| Net realized gains from investment transactions | | | 5,596,759 | | | | 1,887,458 | |
Net change in unrealized appreciation/
depreciation on investments | | | 8,035,588 | | | | 283,247 | |
| Net increase in net assets from operations | | | 14,932,235 | | | | 2,890,947 | |
| | | | | | | | | |
| DISTRIBUTIONS TO SHAREHOLDERS | | | | | | | | |
| From net investment income | | | (1,299,568 | ) | | | (720,038 | ) |
| | | | | | | | | |
| CAPITAL SHARE TRANSACTIONS | | | | | | | | |
| Net assets received in conjunction with fund merger (Note 1) | | | 39,854,719 | | | | — | |
| Proceeds from shares sold | | | 14,366,370 | | | | 5,049,061 | |
Net asset value of shares issued in reinvestment
of distributions to shareholders | | | 1,275,355 | | | | 717,866 | |
| Payments for shares redeemed | | | (17,361,050 | ) | | | (3,907,611 | ) |
| Net increase from capital share transactions | | | 38,135,394 | | | | 1,859,316 | |
| | | | | | | | | |
| TOTAL INCREASE IN NET ASSETS | | | 51,768,061 | | | | 4,030,225 | |
| | | | | | | | | |
| NET ASSETS | | | | | | | | |
| Beginning of year | | | 49,415,756 | | | | 45,385,531 | |
| End of year | | $ | 101,183,817 | | | $ | 49,415,756 | |
| | | | | | | | | |
| UNDISTRIBUTED NET INVESTMENT INCOME | | $ | 2,290 | | | $ | 1,970 | |
| | | | | | | | | |
| CAPITAL SHARE ACTIVITY | | | | | | | | |
| Shares issued in conjunction with fund merger (Note 1) | | | 3,000,712 | | | | — | |
| Shares sold | | | 1,036,434 | | | | 424,545 | |
| Shares reinvested | | | 91,319 | | | | 59,331 | |
| Shares redeemed | | | (1,246,656 | ) | | | (321,734 | ) |
| Net increase in shares outstanding | | | 2,881,809 | | | | 162,142 | |
| Shares outstanding at beginning of year | | | 3,889,693 | | | | 3,727,551 | |
| Shares outstanding at end of year | | | 6,771,502 | | | | 3,889,693 | |
See accompanying notes to financial statements.
CUTLER FIXED INCOME FUND
STATEMENTS OF CHANGES IN NET ASSETS
| | Nine Months Ended June 30, 2013 (a) | | | Year Ended September 30, 2012 | | | Year Ended September 30, 2011 | |
| FROM OPERATIONS | | | | | | | | | |
| Net investment income | | $ | 126,189 | | | $ | 423,430 | | | $ | 546,592 | |
| Net realized gains from investment transactions | | | 415,303 | | | | 48,861 | | | | 605,901 | |
Net change in unrealized appreciation/
depreciation on investments | | | (912,631 | ) | | | 564,710 | | | | (727,573 | ) |
Net increase (decrease) in net assets
from operations | | | (371,139 | ) | | | 1,037,001 | | | | 424,920 | |
| | | | | | | | | | | | | |
| DISTRIBUTIONS TO SHAREHOLDERS | | | | | | | | | | | | |
| From net investment income | | | (337,075 | ) | | | (759,169 | ) | | | (920,496 | ) |
| From net realized gains | | | — | | | | — | | | | (500,999 | ) |
Decrease in net assets from
distributions to shareholders | | | (337,075 | ) | | | (759,169 | ) | | | (1,421,495 | ) |
| | | | | | | | | | | | | |
| CAPITAL SHARE TRANSACTIONS | | | | | | | | | | | | |
| Proceeds from shares sold | | | 3,732,372 | | | | 1,315,387 | | | | 4,077,055 | |
Net asset value of shares issued in
reinvestment of distributions to shareholders | | | 332,113 | | | | 748,299 | | | | 1,402,466 | |
| Payments for shares redeemed | | | (6,787,295 | ) | | | (3,890,718 | ) | | | (4,560,424 | ) |
Net increase (decrease) from
capital share transactions | | | (2,722,810 | ) | | | (1,827,032 | ) | | | 919,097 | |
| | | | | | | | | | | | | |
| TOTAL DECREASE IN NET ASSETS | | | (3,431,024 | ) | | | (1,549,200 | ) | | | (77,478 | ) |
| | | | | | | | | | | | | |
| NET ASSETS | | | | | | | | | | | | |
| Beginning of period | | | 19,692,942 | | | | 21,242,142 | | | | 21,319,620 | |
| End of period | | $ | 16,261,918 | | | $ | 19,692,942 | | | $ | 21,242,142 | |
| | | | | | | | | | | | | |
DISTRIBUTIONS IN EXCESS OF
NET INVESTMENT INCOME | | $ | (230,861 | ) | | $ | (187,551 | ) | | $ | (60,990 | ) |
| | | | | | | | | | | | | |
| CAPITAL SHARE ACTIVITY | | | | | | | | | | | | |
| Shares sold | | | 362,833 | | | | 125,933 | | | | 383,651 | |
| Shares reinvested | | | 32,493 | | | | 72,122 | | | | 135,025 | |
| Shares redeemed | | | (659,094 | ) | | | (372,758 | ) | | | (427,488 | ) |
| Net increase (decrease) in shares outstanding | | | (263,768 | ) | | | (174,703 | ) | | | 91,188 | |
| Shares outstanding at beginning of period | | | 1,892,828 | | | | 2,067,531 | | | | 1,976,343 | |
| Shares outstanding at end of period | | | 1,629,060 | | | | 1,892,828 | | | | 2,067,531 | |
| (a) | Fund changed fiscal year end to June 30. |
| See accompanying notes to financial statements. |
CUTLER EQUITY FUND
Per Share Data for a Share Outstanding Throughout Each Year
| | | | |
| | | | | | | | | | | | | | | |
| Net asset value at beginning of year | | $ | 12.70 | | | $ | 12.18 | | | $ | 9.18 | | | $ | 8.00 | | | $ | 10.80 | |
| | | | | | | | | | | | | | | | | | | | | |
| Income (loss) from investment operations: | | | | | | | | | | | | | | | | | | | | |
| Net investment income | | | 0.19 | | | | 0.19 | | | | 0.18 | | | | 0.17 | | | | 0.21 | |
Net realized and unrealized gains (losses) on investments | | | 2.24 | | | | 0.52 | | | | 3.00 | | | | 1.18 | | | | (2.80 | ) |
| Total from investment operations | | | 2.43 | | | | 0.71 | | | | 3.18 | | | | 1.35 | | | | (2.59 | ) |
| | | | | | | | | | | | | | | | | | | | | |
| Less distributions from: | | | | | | | | | | | | | | | | | | | | |
| Net investment income | | | (0.19 | ) | | | (0.19 | ) | | | (0.18 | ) | | | (0.17 | ) | | | (0.21 | ) |
| | | | | | | | | | | | | | | | | | | | | |
| Net asset value at end of year | | $ | 14.94 | | | $ | 12.70 | | | $ | 12.18 | | | $ | 9.18 | | | $ | 8.00 | |
| | | | | | | | | | | | | | | | | | | | | |
Total return (a) | | | 19.26% | | | | 5.90% | | | | 34.73% | | | | 16.82% | | | | (24.06% | ) |
| | | | | | | | | | | | | | | | | | | | | |
| Net assets at end of year (000’s) | | $ | 101,184 | | | $ | 49,416 | | | $ | 45,386 | | | $ | 31,115 | | | $ | 27,590 | |
| | | | | | | | | | | | | | | | | | | | | |
| Ratios/supplementary data: | | | | | | | | | | | | | | | | | | | | |
| | | | | | | | | | | | | | | | | | | | | |
Ratio of net expenses to average net assets (b) | | | 1.15% | | | | 1.27% | | | | 1.33% | | | | 1.40% | | | | 1.40% | |
| | | | | | | | | | | | | | | | | | | | | |
Ratio of net investment income to
average net assets | | | 1.53% | | | | 1.57% | | | | 1.59% | | | | 1.76% | | | | 2.45% | |
| | | | | | | | | | | | | | | | | | | | | |
| Portfolio turnover rate | | | 8% | (c) | | | 9% | | | | 15% | | | | 13% | | | | 21% | |
| (a) | Total return is a measure of the change in value of an investment in the Fund over the period covered, which assumes any dividends or capital gains distributions are reinvested in shares of the Fund. Returns shown do not reflect the deduction of taxes a shareholder would pay on Fund distributions or the redemption of Fund shares. |
| (b) | Absent voluntary fee waivers by the Fund’s investment adviser, the ratio of total expenses to average net assets would have been 1.42% and 1.50% for the years ended June 30, 2010 and 2009, respectively. |
| (c) | Excludes the value of securities sold from sales to realign the Fund’s portfolio following the merger with The Elite Growth & Income Fund (Note 1). |
| See accompanying notes to financial statements. |
CUTLER FIXED INCOME FUND
Per Share Data for a Share Outstanding Throughout Each Period
| | | Nine Months Ended June 30, | | | Years Ended September 30, | |
| | | 2013 (a) | | | | | | | | | | | | | | | | |
Net asset value at
beginning of period | | $ | 10.40 | | | $ | 10.27 | | | $ | 10.79 | | | $ | 10.33 | | | $ | 9.20 | | | $ | 9.73 | |
| | | | | | | | | | | | | | | | | | | | | | | | | |
Income (loss) from
investment operations: | | | | | | | | | | | | | | | | | | | | | | | | |
| Net investment income | | | 0.05 | | | | 0.21 | | | | 0.28 | | | | 0.33 | | | | 0.39 | | | | 0.42 | |
Net realized and unrealized
gains (losses) on
investments | | | (0.27 | ) | | | 0.31 | | | | (0.09 | ) | | | 0.55 | | | | 1.09 | | | | (0.50 | ) |
| Total from investment operations | | | (0.22 | ) | | | 0.52 | | | | 0.19 | | | | 0.88 | | | | 1.48 | | | | (0.08 | ) |
| | | | | | | | | | | | | | | | | | | | | | | | | |
| Less distributions from: | | | | | | | | | | | | | | | | | | | | | | | | |
| Net investment income | | | (0.20 | ) | | | (0.39 | ) | | | (0.46 | ) | | | (0.38 | ) | | | (0.35 | ) | | | (0.45 | ) |
| Net realized gains | | | — | | | | — | | | | (0.25 | ) | | | (0.04 | ) | | | — | | | | — | |
| Total distributions | | | (0.20 | ) | | | (0.39 | ) | | | (0.71 | ) | | | (0.42 | ) | | | (0.35 | ) | | | (0.45 | ) |
| | | | | | | | | | | | | | | | | | | | | | | | | |
| Net asset value at end of period | | $ | 9.98 | | | $ | 10.40 | | | $ | 10.27 | | | $ | 10.79 | | | $ | 10.33 | | | $ | 9.20 | |
| | | | | | | | | | | | | | | | | | | | | | | | | |
Total return (b) | | | (2.16% | )(c) | | | 5.07% | | | | 1.87% | | | | 8.74% | | | | 16.53% | | | | (0.90% | ) |
| | | | | | | | | | | | | | | | | | | | | | | | | |
| Net assets at end of period (000’s) | | $ | 16,262 | | | $ | 19,693 | | | $ | 21,242 | | | $ | 21,320 | | | $ | 17,199 | | | $ | 15,211 | |
| | | | | | | | | | | | | | | | | | | | | | | | | |
| Ratios/supplementary data: | | | | | | | | | | | | | | | | | | | | | | | | |
| | | | | | | | | | | | | | | | | | | | | | | | | |
Ratio of net expenses to
average net assets (d) | | | 1.54% | (e) | | | 1.52% | | | | 1.28% | | | | 1.33% | | | | 1.48% | | | | 1.05% | |
| | | | | | | | | | | | | | | | | | | | | | | | | |
Ratio of net investment income
to average net assets | | | 0.95% | (e) | | | 2.03% | | | | 2.51% | | | | 3.20% | | | | 4.11% | | | | 4.30% | |
| | | | | | | | | | | | | | | | | | | | | | | | | |
| Portfolio turnover rate | | | 34% | (c) | | | 53% | | | | 83% | | | | 75% | | | | 100% | | | | 106% | |
| (a) | Fund changed fiscal year end to June 30. |
| (b) | Total return is a measure of the change in value of an investment in the Fund over the period covered, which assumes any dividends or capital gains distributions are reinvested in shares of the Fund. Returns shown do not reflect the deduction of taxes a shareholder would pay on Fund distributions or the redemption of Fund shares. |
| (c) | Not annualized. |
| (d) | Absent voluntary fee waivers by the Fund’s investment adviser, the ratio of total expenses to average net assets would have been 1.56% and 1.24% for the years ended September 30, 2009 and 2008, respectively. |
| (e) | Annualized. |
| See accompanying notes to financial statements. |
THE CUTLER TRUST
NOTES TO FINANCIAL STATEMENTS
1. Organization
Cutler Equity Fund and Cutler Fixed Income Fund (formerly Cutler Income Fund) (the “Funds”) are each a diversified series of The Cutler Trust (the “Trust”). The Trust is a Delaware statutory trust that is registered as an open-end management investment company under the Investment Company Act of 1940 (the “1940 Act”). Under its Trust Instrument, the Trust is authorized to issue an unlimited number of Fund shares of beneficial interest without par value.
Cutler Equity Fund commenced operations on October 2, 1992. On September 28, 2012, Cutler Equity Fund consummated a tax-free merger with The Elite Growth & Income Fund, previously a series of The Elite Group of Mutual Funds. Pursuant to the terms of the agreement governing the merger, each share of The Elite Growth & Income Fund was converted into an equivalent dollar amount of shares of Cutler Equity Fund, based on the net asset value of Cutler Equity Fund and The Elite Growth & Income Fund as of September 27, 2012 ($13.28 and $15.66, respectively), resulting in a conversion ratio of 1.17897958 shares of Cutler Equity Fund for each share of The Elite Growth & Income Fund. Cutler Equity Fund issued 3,000,712 shares to shareholders of The Elite Growth & Income Fund. The basis of the assets transferred from The Elite Growth & Income Fund reflected the historical basis of the assets as of the date of the tax-free merger. Net assets of Cutler Equity Fund and The Elite Growth & Income Fund as of the merger date were $53,639,332 and $39,854,719, including unrealized appreciation on investments of $14,347,666 and $4,099,684, respectively. In addition, The Elite Growth & Income Fund’s net assets included accumulated realized capital losses of $6,906,206. Total net assets immediately after the merger were $93,494,051.
The Elite Income Fund (the “Predecessor Fund”), a series of The Elite Group of Mutual Funds, was reorganized into Cutler Fixed Income Fund (the “Reorganization”) effective September 28, 2012, pursuant to an Agreement and Plan of Reorganization dated August 27, 2012. The Reorganization was approved by the shareholders of the Predecessor Fund at a meeting held on September 27, 2012. The Predecessor Fund transferred all its assets to Cutler Fixed Income Fund in exchange for shares of Cutler Fixed Income Fund and the assumption by Cutler Fixed Income Fund of all the known liabilities of the Predecessor Fund. Cutler Fixed Income Fund did not have any significant assets or liabilities immediately prior to the consummation of the Reorganization. The Reorganization was treated as a tax-free reorganization for federal income tax purposes and, accordingly, the basis of the assets transferred reflect the historical basis of the assets as of the date of the Reorganization.
Cutler Equity Fund seeks current income and long-term capital appreciation.
Cutler Fixed Income Fund seeks to achieve high income over the long-term.
THE CUTLER TRUST
NOTES TO FINANCIAL STATEMENTS (Continued)
2. Significant Accounting Policies
The following summarizes the significant accounting policies of the Funds. The policies are in conformity with accounting principles generally accepted in the United States of America (“GAAP”).
Securities Valuation — Portfolio securities are valued as of the close of business of the regular session of the principal exchange where the security is traded. Exchange traded securities for which market quotations are readily available are valued using the last reported sales price provided by independent pricing services as of the close of trading on the New York Stock Exchange (“NYSE”) (normally 4:00 p.m. Eastern time), on each Fund business day. In the absence of a sale, such securities are valued at the mean of the last bid and asked price. Securities which are quoted by NASDAQ are valued at the NASDAQ Official Closing Price. Non-exchange traded securities for which over-the-counter quotations are available are generally valued at the closing bid price. Money market instruments that mature in sixty days or less may be valued at amortized cost unless the Funds’ investment adviser believes another valuation is more appropriate. Investments in shares of other open-end investment companies are valued at net asset value per share.
The Funds value securities at fair value pursuant to procedures adopted by the Board of Trustees if (1) market quotations are insufficient or not readily available or (2) the Funds’ investment adviser believes that the prices or values available are unreliable due to, among other things, the occurrence of events after the close of the securities markets on which the Funds’ securities primarily trade but before the time as of which the Funds calculate their net asset values. Fair valued securities will be classified as Level 2 or 3 within the fair value hierarchy (see below), depending on the inputs used.
GAAP establishes a single authoritative definition of fair value, sets out a framework for measuring fair value and requires additional disclosures about fair value measurements.
Various inputs are used in determining the value of each Fund’s investments. These inputs are summarized in the three broad levels listed below:
| | • | Level 1 – quoted prices in active markets for identical securities |
| | • | Level 2 – other significant observable inputs |
| | • | Level 3 – significant unobservable inputs |
For example, fixed income securities held by Cutler Fixed Income Fund are classified as Level 2 since the values for the fixed income securities are based on prices provided by an independent pricing service that utilizes various “other significant observable inputs” including bid and ask quotations, prices of similar securities and interest rates, among other factors.
THE CUTLER TRUST
NOTES TO FINANCIAL STATEMENTS (Continued)
The inputs or methodology used for valuing securities are not necessarily an indication of the risks associated with investing in those securities. The inputs used to measure fair value may fall into different levels of the fair value hierarchy. In such cases, for disclosure purposes, the level in the fair value hierarchy within which the fair value measurement falls in its entirety is determined based on the lowest level input that is significant to the fair value measurement.
The following is a summary of the inputs used to value each Fund’s investments as of June 30, 2013 by security type:
| | | | | | | | | | | | |
| Common Stocks | | $ | 99,414,480 | | | $ | — | | | $ | — | | | $ | 99,414,480 | |
| Money Market Funds | | | 1,456,951 | | | | — | | | | — | | | | 1,456,951 | |
| Total | | $ | 100,871,431 | | | $ | — | | | $ | — | | | $ | 100,871,431 | |
| | | | | | | | | | | | |
| U.S. Treasury Obligations | | $ | — | | | $ | 2,098,997 | | | $ | — | | | $ | 2,098,997 | |
| U.S. Government Agency Obligations | | | — | | | | 5,786,982 | | | | — | | | | 5,786,982 | |
| Other Government Obligations | | | — | | | | 863,236 | | | | — | | | | 863,236 | |
| Mortgage-Backed Securities | | | — | | | | 593,992 | | | | — | | | | 593,992 | |
| Asset-Backed Securities | | | — | | | | 889,007 | | | | — | | | | 889,007 | |
| Corporate Bonds | | | — | | | | 5,172,180 | | | | — | | | | 5,172,180 | |
| Preferred Stocks | | | 222,800 | | | | — | | | | — | | | | 222,800 | |
| Money Market Funds | | | 594,741 | | | | — | | | | — | | | | 594,741 | |
| Total | | $ | 817,541 | | | $ | 15,404,394 | | | $ | — | | | $ | 16,221,935 | |
Refer to each Fund’s Schedule of Investments for a listing of the securities valued by security type and sector or industry type. As of June 30, 2013, the Funds did not have any transfers in and out of any Level. There were no Level 3 securities or derivative instruments held by the Funds as of June 30, 2013. It is the Funds’ policy to recognize transfers into and out of any Level at the end of the reporting period.
Share valuation — The net asset value per share of each Fund is calculated daily by dividing the total value of its assets, less liabilities, by the number of shares outstanding. The offering price and redemption price per share of each Fund is equal to its net asset value per share.
THE CUTLER TRUST
NOTES TO FINANCIAL STATEMENTS (Continued)
Estimates — The preparation of financial statements in conformity with GAAP requires management to make estimates and assumptions that affect the reported amounts of assets and liabilities and disclosures of contingent assets and liabilities at the date of the financial statements and the reported amounts of income and expenses during the reporting period. Actual results could differ from those estimates.
Security Transactions, Investment Income and Realized Gains and Losses — Investment transactions are accounted for on trade date. Dividend income is recorded on the ex-dividend date. Interest income is recorded as earned. Discounts and premiums on fixed income securities are amortized using the effective interest method. Gains and losses on securities sold are determined on a specific identification basis.
Distributions to Shareholders — Distributions to shareholders of net investment income, if any, are paid quarterly. Capital gain distributions, if any, are distributed to shareholders annually. Distributions are based on amounts calculated in accordance with applicable federal income tax regulations, which may differ from GAAP. These differences are due primarily to differing treatments of income and gains on various investment securities held by the Funds, timing differences and differing characterizations of distributions made by the Funds. Dividends and distributions are recorded on the ex-dividend date. The tax character of distributions paid by Cutler Equity Fund during the years ended June 30, 2013 and June 30, 2012 was ordinary income. The tax character of distributions paid by Cutler Fixed Income Fund during the periods ended June 30, 2013, September 30, 2012 and September 30, 2011 was as follows:
| | | | | | | | | |
| 6/30/2013 | | $ | 337,075 | | | $ | — | | | $ | 337,075 | |
| 9/30/2012 | | $ | 759,169 | | | $ | — | | | $ | 759,169 | |
| 9/30/2011 | | $ | 1,164,984 | | | $ | 256,511 | | | $ | 1,421,495 | |
Securities Lending — Cutler Fixed Income Fund may lend portfolio securities to banks and member firms of the New York Stock Exchange that meet capital and other credit requirements or other criteria established by the Board of Trustees. These loans may not exceed 33 1/3% of the total assets of the Fund (including loan collateral). The Fund will not lend portfolio securities to its investment adviser or its affiliates unless it has applied for and received specific authority to do so from the Securities and Exchange Commission (the “SEC”). Loans of portfolio securities will be fully collateralized by cash, Government securities or letters of credit. Loans of portfolio securities must be secured by collateral at least equal to the market value of the securities loaned. If the market value of the loaned securities increases over the value of the collateral, the borrower must promptly put up additional collateral; if the market value declines, the borrower is entitled to a return of the excess collateral. Income from lending activity is determined by the amount of interest earned on collateral, less any amounts payable to the borrowers of the securities and
THE CUTLER TRUST
NOTES TO FINANCIAL STATEMENTS (Continued)
the lending agent. Lending securities involves certain risks, including the risk that the Fund may be delayed or prevented from recovering the collateral if the borrower fails to return the securities. Prior to September 28, 2012, cash collateral received in connection with securities lending was invested in an institutional money market vehicle sponsored by BNY Mellon, the Predecessor Fund’s securities lending agent. It is the Fund’s policy to obtain additional collateral from or return excess collateral to the borrower by the end of the next business day, following the valuation date of the securities loaned. Therefore, the value of the collateral held may be temporarily less than that required under the lending contract. As of June 30, 2013, the Fund had no securities on loan.
Federal income tax — It is each Fund’s policy to comply with the special provisions of Subchapter M of the Internal Revenue Code applicable to regulated investment companies. As provided therein, in any fiscal year in which a Fund so qualifies and distributes at least 90% of its taxable net income, the Fund (but not the shareholders) will be relieved of federal income tax on the income distributed. Accordingly, no provision for income taxes has been made.
In order to avoid imposition of the excise tax applicable to regulated investment companies, it is also each Fund’s intention to declare as dividends in each calendar year at least 98% of its net investment income (earned during the calendar year) and 98.2% of its net realized capital gains (earned during the twelve months ended October 31) plus undistributed amounts from prior years.
The following information is computed on a tax basis for each item as of June 30, 2013:
| | | | | | |
| Tax cost of portfolio investments | | $ | 76,544,649 | | | $ | 16,465,780 | |
| Gross unrealized appreciation | | $ | 25,291,835 | | | $ | 176,362 | |
| Gross unrealized depreciation | | | (965,053 | ) | | | (420,207 | ) |
| Net unrealized appreciation (depreciation) on investments | | | 24,326,782 | | | | (243,845 | ) |
| Undistributed ordinary income | | | 10,923 | | | | 4,153 | |
| Capital loss carryforwards | | | (5,926,433 | ) | | | — | |
| Undistributed long-term gains | | | 537,818 | | | | 73,211 | |
| Other temporary differences | | | (8,633 | ) | | | (743 | ) |
| Accumulated earnings (deficit) | | $ | 18,940,457 | | | $ | (167,224 | ) |
The difference between the federal income tax cost of portfolio investments and the financial statement cost for the Funds is due to certain differences in the recognition of capital gains and losses under income tax regulations and GAAP. These “book/tax” differences are temporary in nature and are related to amortization of bond premiums and discounts and losses deferred due to wash sales.
THE CUTLER TRUST
NOTES TO FINANCIAL STATEMENTS (Continued)
For the period ended June 30, 2013, Cutler Fixed Income Fund reclassified $168,032 of distributions in excess of net investment income against accumulated net realized losses from security transactions on the Statements of Assets and Liabilities. Additionally, the Fund reclassified $456 of net investment income against paid-in capital on the Statements of Assets and Liabilities. Such reclassifications, the result of permanent differences between financial statement and income tax reporting requirements, have no effect on the Fund’s net assets or net asset value per share.
During the period ended June 30, 2013, Cutler Equity Fund and Cutler Fixed Income Fund utilized $4,079,168 and $173,967, respectively, of short-term capital loss carryforwards to offset current year gains.
During the year ended June 30, 2013, Cutler Equity Fund assumed capital loss carryforwards of $6,906,206 from The Elite Growth & Income Fund of which $979,773 was utilized to offset current year gains. The remaining capital loss carryforwards of $5,926,433 consist of short-term losses of $4,635,458 (with a maximum amount of $1,299,264 available in each year) which expire on June 30, 2018 and short-term losses of $250,862 and long-term losses of $1,040,113 which have no expiration. These capital loss carryforwards may be utilized in future years to offset net realized capital gains, if any, prior to distributing such gains to shareholders.
Under the Regulated Investment Company Modernization Act of 2010 (the “Act”), newly recognized net capital losses may be carried forward indefinitely, and their character is retained as short-term and/or long-term losses. Under the law in effect prior to the Act, pre-enactment net capital losses were carried forward for eight years and treated as short-term losses. As a transition rule, the Act requires that post-enactment net capital losses be used before pre-enactment net capital losses. Therefore, there may be a greater likelihood that all or a portion of Cutler Equity Fund’s pre-enactment capital loss carryovers may expire without being utilized.
The Funds recognize the tax benefits or expenses of uncertain tax positions only when the position is “more-likely-than-not” to be sustained assuming examination by tax authorities. Management has reviewed the tax positions taken on Federal income tax returns for all open tax years (tax years ended June 30, 2010 through June 30, 2013 for Cutler Equity Fund and tax years ended September 30, 2010 through September 30, 2012 and June 30, 2013 for Cutler Fixed Income Fund) and has concluded that no provision for unrecognized tax benefits or expenses is required in these financial statements.
3. Transactions with Related Parties
Investment Adviser — Cutler Investment Counsel, LLC (the “Adviser”) is the investment adviser to the Funds. Pursuant to an Investment Advisory Agreement, Cutler Equity Fund and Cutler Fixed Income Fund pay the Adviser a fee, which is accrued daily and paid monthly, at an annual rate of 0.75% and 0.50%, respectively, of average daily net assets.
THE CUTLER TRUST
NOTES TO FINANCIAL STATEMENTS (Continued)
Prior to September 28, 2012, McCormick Capital Management, Inc. (the “Prior Adviser”) served as the investment adviser to the Predecessor Fund. The Prior Adviser received compensation for investment advisory services at an annual rate of 0.70% of average daily net assets of the Predecessor Fund up to $250 million, 0.625% of such assets from $250 million to $500 million and 0.500% of such assets over $500 million.
Effective November 1, 2012, the Adviser has entered into an Expense Limitation Agreement under which it has agreed to reduce its investment advisory fees from Cutler Equity Fund and to pay such Fund’s expenses until at least November 1, 2013 to the extent necessary to limit annual ordinary operating expenses to 1.15% of average daily net assets. Any such fee reductions by the Adviser, or payments by the Adviser of expenses which are Cutler Equity Fund’s obligation, are subject to repayment by the Fund, provided that the repayment does not cause the Fund’s ordinary operating expenses to exceed the annual expense limit of 1.15%, and provided further that the fees and expenses which are the subject of the repayment were incurred within three years of the repayment. No advisory fee reductions or expense reimbursements were required during the year ended June 30, 2013.
Certain officers of the Trust are also officers of the Adviser.
Administration and Other Services — Under the terms of a Mutual Fund Services Agreement between the Trust and Ultimus Fund Solutions, LLC (“Ultimus”), Ultimus provides administrative, pricing, accounting, dividend disbursing, shareholder servicing and transfer agent services for the Funds. For these services, Ultimus receives a monthly fee from each Fund at an annual rate of 0.15% of its average daily net assets up to $500 million; 0.125% of the next $500 million of such assets; and 0.10% of such assets in excess of $1 billion, subject to a minimum monthly fee of $6,000. In addition, each Fund pays out-of-pocket expenses including, but not limited to, postage, supplies and costs of pricing the Funds’ portfolio securities.
Certain officers of the Trust are also officers of Ultimus, or of Ultimus Fund Distributors, LLC, the principal underwriter of the Funds’ shares and an affiliate of Ultimus.
Shareholder Service Plan — Each Fund may pay shareholder servicing fees not to exceed an annual rate of 0.25% of its average daily net assets. These fees may be paid to various financial institutions that provide shareholder and account maintenance services. During the periods ended June 30, 2013, Cutler Equity Fund and Cutler Fixed Income Fund paid $51,297 and $708, respectively, for such services.
Compensation of Trustees — Trustees and officers affiliated with the Adviser or Ultimus are not compensated by the Trust for their services. Each Trustee who is not an affiliated person of the Adviser or Ultimus (“Independent Trustee”) receives from the Trust an annual retainer of $7,500, payable quarterly, plus a fee of $1,250 for attendance at each meeting of the Board of Trustees.
THE CUTLER TRUST
NOTES TO FINANCIAL STATEMENTS (Continued)
Prior to November 26, 2012, each Independent Trustee of the Trust was paid an annual retainer of $5,000, plus a fee of $1,250 for attendance at each meeting of the Board of Trustees. The Trustees also receive reimbursement of travel and other expenses incurred in attending meetings.
4. Securities Transactions
During the periods ended June 30, 2013, cost of purchases and proceeds from sales and maturities of investment securities, other than short-term investments and U.S. government securities, totaled $37,290,140 and $32,735,002, respectively, for Cutler Equity Fund and $813,118 and $7,380,623, respectively, for Cutler Fixed Income Fund.
5. Contingencies and Commitments
The Funds indemnify the Trust’s officers and Trustees for certain liabilities that might arise from their performance of their duties to the Funds. Additionally, in the normal course of business the Funds enter into contracts that contain a variety of representations and warranties and which provide general indemnifications. The Funds’ maximum exposure under these arrangements is unknown, as this would involve future claims that may be made against the Funds that have not yet occurred. However, based on experience, the Funds expect the risk of loss to be remote.
6. Subsequent Events
The Funds are required to recognize in the financial statements the effects of all subsequent events that provide additional evidence about conditions that existed as of the date of the Statements of Assets and Liabilities. For non-recognized subsequent events that must be disclosed to keep the financial statements from being misleading, the Funds are required to disclose the nature of the event as well as an estimate of its financial effect, or a statement that such an estimate cannot be made. Management has evaluated subsequent events through the issuance of these financial statements and has noted no such events.
THE CUTLER TRUST
REPORT OF INDEPENDENT REGISTERED PUBLIC
ACCOUNTING FIRM
To the Board of Trustees of The Cutler Trust
and the Shareholders of the Cutler Equity Fund and the Cutler Fixed Income Fund
We have audited the accompanying statement of assets and liabilities of the Cutler Equity Fund, a series of shares of beneficial interest of The Cutler Trust, including the schedule of investments, as of June 30, 2013 and the related statement of operations for the year then ended, the statements of changes in net assets for each of the two years in the period then ended, and the financial highlights for each of the five years in the period then ended. We have also audited the accompanying statement of assets and liabilities of the Cutler Fixed Income Fund, a series of shares of beneficial interest of The Cutler Trust, including the schedule of investments, as of June 30, 2013, the related statements of operations for the nine months then ended and for the year ended September 30, 2012, the statements of changes in net assets for the nine months ended June 30, 2013 and for each of the two years in the period ended September 30, 2012 and the financial highlights for the nine months ended June 30, 2013 and for each of the five years in the period ended September 30, 2012. These financial statements and financial highlights are the responsibility of the Funds’ management. Our responsibility is to express an opinion on these financial statements and financial highlights based on our audits.
We conducted our audits in accordance with the standards of the Public Company Accounting Oversight Board (United States). Those standards require that we plan and perform the audit to obtain reasonable assurance about whether the financial statements and financial highlights are free of material misstatement. An audit includes examining, on a test basis, evidence supporting the amounts and disclosures in the financial statements. Our procedures included confirmation of securities owned as of June 30, 2013 by correspondence with the custodian. An audit also includes assessing the accounting principles used and significant estimates made by management, as well as evaluating the overall financial statement presentation. We believe that our audits provide a reasonable basis for our opinion.
In our opinion, the financial statements and financial highlights referred to above present fairly, in all material respects, the financial position of the Cutler Equity Fund and the Cutler Fixed Income Fund, as of June 30, 2013, the results of their operations, the changes in their net assets and their financial highlights for the years or periods presented, in conformity with accounting principles generally accepted in the United States of America.
| |  |
| | BBD, LLP |
Philadelphia, Pennsylvania
August 26, 2013
THE CUTLER TRUST
ABOUT YOUR FUND’S EXPENSES (Unaudited)
We believe it is important for you to understand the impact of costs on your investment. All mutual funds have operating expenses. As a shareholder of the Funds, you incur ongoing costs, including management fees and other operating expenses. These ongoing costs, which are deducted from each Fund’s gross income, directly reduce the investment return of the Funds.
A mutual fund’s ongoing costs are expressed as a percentage of its average net assets. This figure is known as the expense ratio. The following examples are intended to help you understand the ongoing costs (in dollars) of investing in the Funds and to compare these costs with the ongoing costs of investing in other mutual funds. The examples below are based on an investment of $1,000 made at the beginning of the period shown and held for the entire period (January 1, 2013 through June 30, 2013).
The table below illustrates each Fund’s ongoing costs in two ways:
Actual fund return – This section helps you to estimate the actual expenses that you paid over the period. The “Ending Account Value” shown is derived from each Fund’s actual return, and the third column shows the dollar amount of operating expenses that would have been paid by an investor who started with $1,000 in the Funds. You may use the information here, together with the amount you invested, to estimate the expenses that you paid over the period.
To do so, simply divide your account value by $1,000 (for example, an $8,600 account value divided by $1,000 = 8.6), then multiply the result by the number given for the Funds under the heading “Expenses Paid During Period.”
Hypothetical 5% return – This section is intended to help you compare the Funds’ ongoing costs with those of other mutual funds. It assumes that each Fund had an annual return of 5% before expenses during the period shown, but that the expense ratio is unchanged. In this case, because the returns used are not the Funds’ actual returns, the results do not apply to your investment. The example is useful in making comparisons because the SEC requires all mutual funds to calculate expenses based on a 5% return. You can assess each Fund’s ongoing costs by comparing this hypothetical example with the hypothetical examples that appear in shareholder reports of other funds.
Note that expenses shown in the table are meant to highlight and help you compare ongoing costs only. The Funds do not charge transaction fees, such as purchase or redemption fees, nor do they impose any sales loads.
The calculations assume no shares were bought or sold during the period. Your actual costs may have been higher or lower, depending on the amount of your investment and the timing of any purchases or redemptions.
THE CUTLER TRUST
ABOUT YOUR FUND’S EXPENSES (Unaudited) (Continued)
More information about the Funds’ expenses, including annual expense ratios for the past five fiscal years, can be found in this report. For additional information on operating expenses and other shareholder costs, please refer to each Fund’s prospectus.
| Beginning Account Value January 1, 2013 | Ending Account Value June 30, 2013 | Expenses Paid During Period* |
| Based on Actual Fund Return | $1,000.00 | $1,153.90 | $6.03 |
| Based on Hypothetical 5% Return (before expenses) | $1,000.00 | $1,019.19 | $5.66 |
| * | Expenses are equal to Cutler Equity Fund’s annualized expense ratio of 1.13% for the period, multiplied by the average account value over the period, multiplied by 181/365 (to reflect the one-half year period). |
| Beginning Account Value January 1, 2013 | Ending Account Value June 30, 2013 | Expenses Paid During Period* |
| Based on Actual Fund Return | $1,000.00 | $978.00 | $8.19 |
| Based on Hypothetical 5% Return (before expenses) | $1,000.00 | $1,016.51 | $8.35 |
| * | Expenses are equal to Cutler Fixed Income Fund’s annualized expense ratio of 1.67% for the period, multiplied by the average account value over the period, multiplied by 181/365 (to reflect the one-half year period). |
FEDERAL TAX INFORMATION (Unaudited)
For the fiscal period ended June 30, 2013, certain dividends paid by the Funds may be subject to a maximum tax rate of 15%, as provided by the Jobs and Growth Tax Relief Reconciliation Act of 2003. Cutler Equity Fund and Cutler Fixed Income Fund intend to designate up to a maximum amount of $1,299,568 and $337,075, respectively, as taxed at a maximum rate of 15%. For the fiscal year ended June 30, 2013, 100% of the dividends paid from ordinary income by Cutler Equity Fund qualified for the dividends received deduction for corporations. Complete information will be computed and reported in conjunction with your 2013 Form 1099-DIV.
THE CUTLER TRUST
TRUSTEES AND OFFICERS OF THE TRUST (Unaudited)
The Board of Trustees is responsible for managing the Trust’s business affairs and exercising all the Trust’s powers except those reserved for shareholders. The following tables give information about each Board member and the senior officers of the Funds. Each Trustee holds office until the person resigns, is removed, or replaced. Officers are elected for an annual term. Unless otherwise noted, the Trustees and officers have held their principal occupations for more than five years. The Funds’ Statements of Additional Information includes additional information about the Trustees and is available, without charge and upon request, by calling 1-888-CUTLER4.
Name, Date of Birth and Address | Position with the Trust | Length of Time Served | Principal Occupation(s) During Past 5 Years | Number of Portfolios in Fund Complex Overseen by Trustee | Other Directorships Held by Trustee |
| Interested Trustees |
Matthew C. Patten (a) Born: December 1975 525 Bigham Knoll Jacksonville, OR 97530 | Trustee/ Chairman/ Treasurer | Trustee Since 2006; Treasurer Since 2004 | President, Investment Committee Member and Portfolio Manager of Cutler Investment Counsel, LLC. | | |
| Independent Trustees |
John P. Cooney Born: January 1932 525 Bigham Knoll Jacksonville, OR 97530 | | | | | |
Robert F. Turner Born: June 1946 525 Bigham Knoll Jacksonville, OR 97530 | | | Retired; Chairman from 2010 to 2012 and Executive Vice President and Chief Operation Officer from 1999 to 2010 of Jeld Wen (a manufacturing company). | | |
| (a) | Matthew C. Patten is an “Interested Person,” as defined by the 1940 Act, because he is an affiliated person of the Adviser. |
THE CUTLER TRUST
TRUSTEES AND OFFICERS OF THE TRUST (Unaudited)
Name, Date of Birth and Address | Position with the Trust | Length of Time Served | Principal Occupation(s) During Past 5 Years |
| Senior Officers |
Erich M. Patten Born: October 1977 525 Bigham Knoll Jacksonville, OR 97530 | | | Investment Committee Member, Portfolio Manager, and Chief Investment Officer of Cutler Investment Counsel, LLC currently; prior to 2011, Investment Committee Member, Portfolio Manager, and Corporate Secretary of Cutler Investment Counsel, LLC. |
Brooke C. Ashland Born: December 1951 525 Bigham Knoll Jacksonville, OR 97530 | Vice President/ Chief Compliance Officer | | Investment Committee Member and Chief Executive Officer of Cutler Investment Counsel, LLC; Chief Executive Officer and President of Trustee Investment Services, Inc. (a Trustee education firm); President of Big Bear Timber, LLC (farming). |
William C. Beggs Born: December 1982 525 Bigham Knoll Jacksonville, OR 97530 | Vice President Asst. Chief Compliance Officer | | Member of Cutler Investment Counsel, LLC since 2012 and Senior Analyst and Assistant Chief Compliance Officer of Cutler Investment Counsel, LLC since 2011; Securities Compliance Examiner for the U.S. Securities and Exchange Commission, from 2008 to 2011; Research Analyst for Ethanol Capital Management, LLC, during 2008; Performance Verification Specialist for Ashland Partners and Company, LLP (an independent public accounting firm), during 2006. |
Robert G. Dorsey Born: April 1957 225 Pictoria Drive Suite 450 Cincinnati, OH 45246 | | | Managing Director of Ultimus Fund Solutions, LLC and Ultimus Fund Distributors, LLC. |
Tina H. Bloom Born: August 1968 225 Pictoria Drive Suite 450 Cincinnati, OH 45246 | | | Director of Fund Administration of Ultimus Fund Solutions, LLC. |
THE CUTLER TRUST
ADDITIONAL INFORMATION (Unaudited)
A description of the policies and procedures that the Funds use to determine how to vote proxies relating to securities held in the Funds’ portfolios is available without charge, upon request, by calling 1-800-228-8537 or on the SEC’s website at http://www.sec.gov. Information regarding how the Funds voted proxies relating to portfolio securities during the most recent 12-month period ended June 30 is also available without charge upon request by calling 1-800-228-8537 or on the SEC’s website at http://www.sec.gov.
Form N-Q Information
The Trust files a complete listing of the Funds’ portfolio holdings with the SEC as of the end of the first and third quarters of each fiscal year on Form N-Q. The filings are available without charge, upon request, by calling 1-800-228-8537. Furthermore, you may obtain a copy of the filings on the SEC’s website at http://www.sec.gov. The Trust’s Forms N-Q may also be reviewed and copied at the SEC’s Public Reference Room in Washington, DC, and information on the operation of the Public Reference Room may be obtained by calling 1-800-SEC-0330.
THE CUTLER TRUST
APPROVAL OF INVESTMENT ADVISORY AGREEMENT
The Board of Trustees, including the Independent Trustees voting separately, has reviewed and approved the continuance of the Funds’ Investment Advisory Agreement (the “Agreement”) with the Adviser for an additional one year period. Approval took place at an in-person meeting held on April 10-11, 2013, at which all of the Trustees were present. The Independent Trustees were advised by their counsel of their fiduciary obligations in approving the Agreement and the Trustees requested such information from the Adviser as they deemed reasonably necessary to evaluate the terms of the Agreement and whether the Agreement continues to be in the best interests of each Fund and its shareholders. The Trustees reviewed: (i) the nature, extent and quality of the services provided by the Adviser; (ii) the investment performance of each Fund and of comparable private accounts of the Adviser; (iii) the costs of the services provided and the profits realized by the Adviser from its relationship with the Funds; (iv) the extent to which economies of scale would be realized as the Funds grow; and (v) whether fee levels reflect these economies of scale for the benefit of the Funds’ shareholders.
The Trustees reviewed the background, qualifications, education and experience of the Adviser’s investment and operational personnel. Management provided detailed information on its professional personnel, including each person’s area of responsibility. The Trustees also discussed and considered the quality of administrative and other services provided to the Funds, the Adviser’s and the Funds’ compliance programs, and the Adviser’s role in coordinating such services and programs. The Independent Trustees were advised by experienced independent counsel throughout the process.
The Adviser provided the Board with information to assist the Trustees in analyzing the performance of the Funds. Cutler Equity Fund’s returns over various periods ended December 31, 2012 were compared to the returns of S&P 500 Total Return Index and certain other relevant securities indices, comparable private accounts managed by the Adviser, and domestic equity funds in the Morningstar database of similar size with similar investment styles. These analyses and comparisons showed that Cutler Equity Fund has performed competitively over both the short and long term. Based upon their review, the Trustees found that Cutler Equity Fund’s performance has been competitive with the returns of relevant securities indices and other similarly situated mutual funds.
The Trustees reviewed the performance of Cutler Fixed Income Fund taking note of the fact that the Adviser has only been managing the Fund since September 28, 2012. The Trustees considered the Adviser’s historical performance in managing separately managed accounts using a similar investment strategy as Cutler Fixed Income Fund. The return of Cutler Fixed Income Fund was compared to the return of the Barclays Intermediate U.S. Government/Credit Index for the quarter ended December 31, 2012. The Trustees concluded that Cutler Fixed Income Fund’s performance has been reasonable.
In reviewing the advisory fee and total expense ratios of the Funds, the Trustees were provided with comparative expense and advisory fee information for other mutual funds, categorized both by fund size and by investment style. The Trustees noted Cutler Equity Fund currently pays an investment advisory fee computed at the annual rate of 0.75% of the Fund’s average daily net assets and Cutler
THE CUTLER TRUST
APPROVAL OF INVESTMENT ADVISORY AGREEMENT
Fixed Income Fund currently pays an investment advisory fee computed at the annual rate of 0.50% of the Fund’s average daily net assets. The Trustees took note of the fact that the contractual advisory fee of Cutler Equity Fund was slightly higher than that of the average and equal to the median advisory fee for the Fund’s peer group and that the Fund’s net expense ratio was lower than the peer group average. The Trustees also noted that the Adviser contractually agreed to waive its management fees and pay Fund operating expenses to the extent necessary to limit annual fund operating expenses to 1.15% of Cutler Equity Fund’s average daily net assets until November 1, 2013, although due to the Fund’s growth in assets no fee waivers have been necessary in the current fiscal year. The Trustees noted that while Cutler Fixed Income Fund’s contractual advisory fee and net expense ratio were higher than the average for funds categorized by Morningstar as U.S. intermediate bond funds, the Fund was significantly smaller in size than its peer group average and median.
The Trustees reviewed the Adviser’s current registration form (Form ADV) and its financial statement as well as an analysis prepared by the Adviser reflecting its revenues and expenses with respect to its services to Cutler Equity Fund for the years ended December 31, 2010, 2011 and 2012 and its projected revenues and expenses with respect to its services to Cutler Fixed Income Fund for its first year of operation as a series of the Trust. The Trustees noted that the Funds do not have any “soft dollar” arrangements with broker-dealers that would otherwise benefit the Adviser and considered any fall-out benefits to the Adviser from managing the Funds.
Prior to voting, the Independent Trustees reviewed the proposed continuance of the Agreement with counsel in executive session. In approving the Agreement, the Independent Trustees reached the following conclusions: (1) based on the performance and risk characteristics of the Funds and the effectiveness of each Fund in achieving its stated objective, the Adviser has provided high quality services; (2) the Adviser has the financial resources and personnel to continue to provide quality advisory services to the Funds; (3) the advisory fees paid by Cutler Equity Fund and Cutler Fixed Income Fund are reasonable and the total expenses of each Fund are reasonable; and (4) the continuance of the Agreement is in the best interests of each Fund and its shareholders. The Independent Trustees also reviewed and considered the profitability of the Adviser with regards to its management of the Funds, concluding that the Adviser’s profitability was not excessive given the quality and scope of services provided by the Adviser and the overall investment performance of the Funds. The Independent Trustees further determined that, based on the Funds’ current asset levels, it would not be relevant to consider the extent to which economies of scale would be realized as the Funds grow, and whether fee levels reflect these economies of scale. Following further discussion, it was the consensus of the Independent Trustees that it is not appropriate to introduce fee breakpoints at the present time. The Trustees noted, however, that if a Fund grows significantly in assets, it may become necessary for the Adviser to consider adding fee breakpoints to the Agreement.
THE CUTLER TRUST
APPROVAL OF INVESTMENT ADVISORY AGREEMENT
No single factor was considered in isolation or to be determinative to the decision of the Trustees to approve continuance of the Agreement. Rather, the Trustees concluded, in light of a weighing and balancing of all factors considered, that it would be in the best interests of the Funds and their shareholders to renew the Agreement for an additional annual period.
This page intentionally left blank.
CUTLER INVESTMENT COUNSEL, LLC
INVESTMENT ADVISER TO THE TRUST
525 Bigham Knoll
Jacksonville, OR 97530
(800)228-8537 • (541)770-9000
Fax:(541)779-0006
info@cutler.com
Item 2. Code of Ethics.
As of the end of the period covered by this report, the registrant has adopted a code of ethics that applies to the registrant’s principal executive officer, principal financial officer, principal accounting officer or controller, or persons performing similar functions, regardless of whether these individuals are employed by the registrant or a third party. Pursuant to Item 12(a)(1), a copy of registrant’s code of ethics is filed as an exhibit to this Form N-CSR. During the period covered by this report, the code of ethics has not been amended, and the registrant has not granted any waivers, including implicit waivers, from the provisions of the code of ethics.
Item 3. Audit Committee Financial Expert.
The registrant’s board of trustees has determined that the registrant does not have an audit committee financial expert serving on its audit committee. The audit committee determined that, although none of its members meet the technical definition of an audit committee financial expert, the collective experience of the members provides the registrant with adequate oversight for the registrant’s current level of financial complexity.
Item 4. Principal Accountant Fees and Services.
Item 5. Audit Committee of Listed Registrants.
Item 6. Schedule of Investments.
Item 8. Portfolio Managers of Closed-End Management Investment Companies.
Item 9. Purchases of Equity Securities by Closed-End Management Investment Company and Affiliated Purchasers.
Item 10. Submission of Matters to a Vote of Security Holders.
The registrant has not adopted procedures by which shareholders may recommend nominees to the registrant’s board of trustees.
Item 11. Controls and Procedures.
(a) Based on their evaluation of the registrant’s disclosure controls and procedures (as defined in Rule 30a-3(c) under the Investment Company Act of 1940) as of a date within 90 days of the filing date of this report, the registrant’s principal executive officer and principal financial officer have concluded that such disclosure controls and procedures are reasonably designed and are operating effectively to ensure that material information relating to the registrant, including its consolidated subsidiaries, is made known to them by others within those entities, particularly during the period in which this report is being prepared, and that the information required in filings on Form N-CSR is recorded, processed, summarized, and reported on a timely basis.
(b) There were no changes in the registrant’s internal control over financial reporting (as defined in Rule 30a-3(d) under the Investment Company Act of 1940) that occurred during the second fiscal quarter of the period covered by this report that have materially affected, or are reasonably likely to materially affect, the registrant’s internal control over financial reporting.
Item 12. Exhibits.
File the exhibits listed below as part of this Form. Letter or number the exhibits in the sequence indicated.
(a)(1) Any code of ethics, or amendment thereto, that is the subject of the disclosure required by Item 2, to the extent that the registrant intends to satisfy the Item 2 requirements through filing of an exhibit: Attached hereto
(a)(2) A separate certification for each principal executive officer and principal financial officer of the registrant as required by Rule 30a-2(a) under the Act (17 CFR 270.30a-2(a)): Attached hereto
(a)(3) Any written solicitation to purchase securities under Rule 23c-1 under the Act (17 CFR 270.23c-1) sent or given during the period covered by the report by or on behalf of the registrant to 10 or more persons: Not applicable
(b) Certifications required by Rule 30a-2(b) under the Act (17 CFR 270.30a-2(b)): Attached hereto