Erich M. Patten
Form N-CSR is to be used by management investment companies to file reports with the Commission not later than 10 days after the transmission to stockholders of any report that is required to be transmitted to stockholders under Rule 30e-1 under the Investment Company Act of 1940 (17 CFR 270.30e-1). The Commission may use the information provided on Form N-CSR in its regulatory, disclosure review, inspection, and policymaking roles.
A registrant is required to disclose the information specified by Form N-CSR, and the Commission will make this information public. A registrant is not required to respond to the collection of information contained in Form N-CSR unless the Form displays a currently valid Office of Management and Budget ("OMB") control number. Please direct comments concerning the accuracy of the information collection burden estimate and any suggestions for reducing the burden to the Secretary, Securities and Exchange Commission, 450 Fifth Street, NW, Washington, DC 20549-0609. The OMB has reviewed this collection of information under the clearance requirements of 44 U.S.C. § 3507.
Item 1. Reports to Stockholders.

| The Cutler Trust | |
CUTLER EQUITY FUND
CUTLER FIXED INCOME FUND
CUTLER EMERGING MARKETS FUND
ANNUAL REPORT
June 30, 2016
THE CUTLER TRUST
TABLE OF CONTENTS
| | Page |
Letter to Shareholders | 2 |
Management Discussion of Fund Performance | 4 |
Performance Information | 10 |
Portfolio Information | 13 |
Schedules of Investments | 16 |
Statements of Assets and Liabilities | 27 |
Statements of Operations | 28 |
Statements of Changes in Net Assets | 29 |
Financial Highlights | 32 |
Notes to Financial Statements | 35 |
Report of Independent Registered Public Accounting Firm | 47 |
About Your Fund’s Expenses | 48 |
Federal Tax Information | 49 |
Trustees and Officers of the Trust | 50 |
Additional Information | 52 |
Approval of Investment Advisory Agreement | 53 |
1
THE CUTLER TRUST
LETTER TO SHAREHOLDERS
To The Cutler Funds Shareholders:
The enclosure represents the annual report to shareholders for the Cutler Trust for the year ended June 30, 2016. This past fiscal year has been quite eventful, yet little seems to have changed. Investors, governments and companies continue searching for answers to the slow growth world in which we find ourselves today. Last year, we stated in this report, “As we see things from here, we do not anticipate dramatically higher rates going forward. Our Funds are positioned to benefit from a “mild” rate environment; we believe dividend stocks should hold relative value versus other income producing investments, and we view the Fixed Income Fund as well-positioned to benefit from a flattening yield curve. This mild-rate environment should allow further stimulus for a rising stock market, but at the onset of the end of ZIRP (Zero Interest Rate Policy), we are proceeding cautiously with our security selection.”
We feel similarly today.
Last year, the predominant investment theme was the strength of the U.S. Dollar. This is still the most frequently cited issue on company earnings calls, but the impact has lessened. A currency headwind makes it very challenging for companies with international exposure to grow earnings, and U.S. exports were increasingly under pricing pressure. The trend remains intact, but the impact is not as profound. Following the dollar, Brexit (the U.K. vote to exit the European Union) has recently been the most common theme that CEO’s have discussed. Brexit may have long-term repercussions on global trade, but the near-term impacts have been limited. In fact, Brexit has been primarily a positive for equities and fixed income thus far, as central banks have remained stimulative in deference to a future unknown impact.
This past year, the Cutler Trust added the Cutler Emerging Markets Fund to the fund family. This fund was established to take advantage of global macro-economic trends that Cutler feels will hold significant investment opportunities going forward. The growth of a global middle-class will create new businesses, entrepreneurs and success stories over the next century. As always, Cutler has approached this asset class with a bias toward income and dividend paying securities. In fact, for the vast majority of the portfolio, we look for a 15-year dividend history, providing further transparency and risk management to the management style.
2
THE CUTLER TRUST
LETTER TO SHAREHOLDERS (Continued)
As always, we welcome your questions or requests for a personal meeting. Thank you for your continued support.
Sincerely,

| 
|
Matthew C. Patten | Erich M. Patten |
Chairman | Chief Investment Officer |
The Cutler Trust | Cutler Investment Counsel, LLC |
| | |

| |
Xavier J. Urpi | |
Director of Fixed Income | |
Cutler Investment Counsel, LLC | |
Before investing you should carefully consider the Cutler Funds’ investment objectives, risks, charges and expenses. This and other information is in the prospectus, a copy of which may be obtained by calling 1-800-228-8537. Please read the prospectus carefully before you invest.
The views in this report were those of the Cutler Funds’ investment adviser as of June 30, 2016 and may not reflect its views on the date this report is first published or anytime thereafter. These views are intended to assist shareholders in understanding their investment in the Cutler Funds and do not constitute investment advice.
3
CUTLER EQUITY FUND
MANAGEMENT DISCUSSION OF FUND PERFORMANCE
1) | How did the Equity Fund perform last year? |
The Equity Fund returned 7.40% for the year ended June 30, 2016.
2) | What were the most significant market factors affecting the Fund’s performance during the past year? |
Market factors were similar to 2015, including:
| | 1) | The increase in the U.S. Dollar versus other foreign currencies |
| | 3) | Incrementally positive economic growth |
3) | Why did the Fund outperform relative to the Benchmark? |
The S&P 500 Total Return Index (the “S&P 500”) returned 3.99% for the year ended June 30, 2016. The Equity Fund performance was driven by both macro sector allocations and fundamental stock selection. The Equity Fund’s overweight in utilities stocks produced the greatest contribution to outperformance, while the health care positions had the largest stock specific impact on the total performance. Overall, this past year represented a more amenable investment environment for dividend stocks, as interest rates remained low and value outperformed growth.
4) | What strategies did you use to manage the Fund? |
Cutler’s investment process focuses on dividends as the primary driver of investment returns. The strategy was unchanged in the previous year, and the management of the Equity Fund was consistent with previous years. We look for holdings in the portfolio that maintain a 10-year record of consistent dividend payments and typically have a total market capitalization of at least $10 billion. We seek relative value as compared to other companies in similar industries. The Equity Fund has a value bias, but is benchmarked to the S&P 500. The strategy is further detailed in the Equity Fund’s prospectus.
5) | What were the primary strategic factors that guided your management of the Fund? |
Cutler’s dividend criteria have been the primary strategic factors used in managing the Equity Fund this past year. For example, Cutler looks for companies that have at least a 10-year history of maintaining or increasing dividends. We believe this criterion results in a portfolio of companies with stable earnings and sound business models. In addition, the Equity Fund’s Portfolio Managers continue to focus on companies they believe offer attractive current yields and the potential for total return. A lower risk profile than the market was also a primary strategy, as the Equity Fund maintained a below market “beta,” a measure of systematic risk, throughout the time period.
4
CUTLER EQUITY FUND
MANAGEMENT DISCUSSION OF FUND PERFORMANCE
(Continued)
Turnover of the Fund remained low this past year at just over 10%. We have remained patient with our current holdings in a sustained bull market, believing that we are well-positioned for volatility should the market direction shift.
6) | What were some of the key trends in each of the regions/significant industries in which the Fund invests? |
The Equity Fund’s holdings remain 100% domiciled in the U.S., and the strategies employed do not have any additional regional bias. In certain cases, holdings may have legal registration outside of the U.S., but are considered domestic due to the locality of their operations.
The U.S. markets continued the bull market that was born from the financial crisis, albeit the pace of returns slowed. Earnings growth has been driven substantially by share buybacks, as GDP growth has been below long-term trends for an economic recovery. Due to this lackluster growth, the Federal Reserve has remained accommodative, keeping rates near zero during the past year. The prospect of higher short-term rates has led to a U.S. dollar rally versus most currencies, which remains one of the most important economic trends. Oil has also been a significant trend, as the bear market continued for the first half of the fiscal year and then reversed course as 2016 progressed.
7) | Which securities helped the Fund’s performance against the Benchmark? |
| | a) | Chubb Corporation (The) |
| | b) | Becton, Dickinson & Company |
| | e) | Texas Instruments, Inc. |
8) | Did any securities hurt the Fund’s performance against the Benchmark? |
| | c) | National Fuel Gas Company |
| | d) | Walt Disney Company (The) |
* | Apple was not held in the Equity Fund but represents a large portion of S&P 500, the Equity Fund’s benchmark. The negative 26% return of Apple, contributed +0.72% performance to the Equity Fund versus the S&P 500 during the period. Amazon.com was also not held, but represents a large portion of the benchmark. The 61% return of Amazon.com contributed -0.75% performance to the Equity Fund versus the S&P 500 during the period. |
5
CUTLER FIXED INCOME FUND
MANAGEMENT DISCUSSION OF FUND PERFORMANCE
1) | How did the Fixed Income Fund perform last year? |
The Fixed Income Fund was up 2.91% for the year ended June 30, 2016.
2) | What were the most significant market factors affecting the Fixed Income Fund’s performance during the past year? |
Market factors included:
| | 1) | Global demand for yield |
| | 2) | Continued quantitative easing and rate reductions around the globe by central banks |
| | 3) | Slow to moderate global economic growth |
| | 4) | Fall of oil prices leading to low inflation expectations |
3) | Explain the Fixed Income Fund’s performance relative to the benchmark. |
The Barclays Intermediate U.S. Government/Credit Index (the “Index”) was up 4.33% for the year ended June 30, 2016. The under performance of the Fixed Income Fund during this time period can be attributed to a more conservative stance in the duration of the portfolio versus the Index in a period of time when interest rates continued to decline.
4) | What strategies did you use to manage the Fixed Income Fund? |
The Fixed Income Fund anticipated a flattening of the yield curve and tried to capitalize on this trend, brought about by demand by pension plans, insurance companies and international funds for high quality yields in the long-term sector of the U.S. fixed income market. This demand caused long-term interest rates to decline much more than short-term interest rates thereby causing a flattening term structure of interest rates.
Another strategy employed was investing in interest only stripped mortgage-backed (IO) securities. These securities provide interest should any refinancing occur and with interest rates falling refinancing increased. This niche sector of the market produced cash flows that exceeded Cutler’s expectation to the Fixed Income Fund; however, due to their short-duration, the Fund’s IOs did not perform as well as longer-dated securities.
5) | What were the primary strategic factors that guided your management of the Fixed Income Fund? |
Cutler, as a consequence of global central banks’ posturing on quantitative easing, felt that long-term interest rates would continue to fall not only world-wide, but here in the U.S.. In addition, these lower interest rates would financially motivate real-estate investors to refinance their multi-family homes prematurely in order to ‘lock-in’ lower rates and save costs in the long-term. This was the basis of our strategy to invest in IO securities that are backed by multi-family loans. These securities, in such a scenario, would provide a significant interest payment. We also believe
6
CUTLER FIXED INCOME FUND
MANAGEMENT DISCUSSION OF FUND PERFORMANCE
(Continued)
that the continued chatter by the Federal Reserve regarding increasing short-term rates may have pushed some of those loan holders that were on the fence to refinance. The combination of these two strategies was a positive factor, but the conservative nature of the portfolio detracted from that value versus the Index.
6) | What were some of the key trends in each of the regions/significant industries in which the Fixed Income Fund invests? |
The Fixed Income Fund is heavily weighted in the U.S. Government agency commercial mortgage-backed securities sector. This sector has had excellent performance over the last few years as the combination of lower interest rates and higher real estate values has elevated the value of the securities. However, the key this past year was not only those elements, but the securities which we focused on were mostly U.S. Government-backed thereby reducing the credit risk. This past year, with the drop in oil prices causing stress in not only the energy sector of the fixed income markets, U.S. Government-backed bonds performed very well compared to the credit sector.
The credit sector, after the debacle in the second half of 2015, in which oil prices tumbled causing a large price decline in bonds backed by oil and commodities, came roaring back in the first six months of 2016. Our strategy did not incorporate a tactical strategy to take advantage of the snap-back, as we position the Fund more conservatively than the Index.
The Fund also invests in U.S. Government agency securities in order to provide safety and liquidity. This sector performed well over the last fiscal year; however, it struggles to provide much yield due to its high quality and short-term structure. Additionally, this sector typically lags most other riskier credits during bull markets where interest rates decline along with yield spreads narrowing.
7) | Which securities helped the Fixed Income Fund’s performance? |
| | 1. | Wachovia Bank Commercial Mortgage Trust, IO, Series 2005-C21, 0.078%, 10/01/44 |
| | 2. | U.S. Treasury Bonds, Stripped Principal Payment, 2.500%, 11/15/44 |
| | 3. | FANNIEMAE-ACES, IO, Series 2015-M3, 4.524%, 06/25/18 |
8) | Did any securities hurt the Fixed Income Fund’s performance? |
| | 1. | FANNIEMAE-ACES, IO, Series 2011-M9, 0.094%, 01/25/21 |
| | 2. | Merrill Lynch Mortgage Trust, IO, Series 2008-C1, 144A, 0.477% Due 02/12/51 |
7
CUTLER EMERGING MARKETS FUND
MANAGEMENT DISCUSSION OF FUND PERFORMANCE
1) | How did the Emerging Markets Fund perform last year? |
From July 2, 2015 to June 30, 2016 the return of the Emerging Markets Fund was -15.43%. This negative performance was primarily in the first two months after inception, as the Emerging Markets Fund returned -6.80% and -9.44% in July and August, 2015, respectively.
2) | What were the most significant market factors affecting the Emerging Markets Fund’s performance during the past year? |
In August 2015, China devalued their currency, which roiled global markets. The Emerging Markets Fund was also impacted by global currency fluctuations and the supporting rally of commodity based economies.
3) | Explain the Emerging Markets Fund’s performance relative to the benchmark. |
The MSCI Emerging Markets Total Return Index had a return of -12.04% during the period. The largest impact was the performance of securities domiciled in Brazil, as that stock market had a significant rally during the period.
4) | What strategies did you use to manage the Emerging Markets Fund? |
Cutler utilizes a universe which we refer to as “The 15DU.” The 15DU consists of companies in the emerging markets index that have paid dividends for at least 14 of the last 15 years. The bulk of the portfolio is comprised of these securities. Additionally, Cutler will use ETFs to gain exposure to markets with less liquidity or as a way to provide trading liquidity for shareholder transactions.
5) | What were the primary strategic factors that guided your management of the Emerging Markets Fund? |
In combination with our economic outlook, Cutler considers geo-political risk when assessing our country weightings. In general, Cutler is biased against less stable political environments. Instead, we prefer to invest into faster growing economies with favorable demographic trends. Cutler believes that emerging markets investing should primarily be focused on consumer based investment themes, not commodities. When possible, we will look for 15DU securities that are exposed to a growing middle-class in countries and regions.
6) | What were some of the key trends in each of the regions/significant industries in which the Emerging Markets Fund invests? |
Emerging markets are diverse, yet global correlations exist that impact total portfolio performance. The most significant trend of the past year occurred in the second half of the fiscal year, which was a broad-based commodity rally off of February lows. This provided strength in many global
8
CUTLER EMERGING MARKETS FUND
MANAGEMENT DISCUSSION OF FUND PERFORMANCE
(Continued)
currencies, which was a tailwind for the Emerging Markets Fund. It also led to a strong rally in many commodity stocks, in which the Emerging Markets Fund has a general underweight position. Additional trends include a slow devaluation of the Chinese Yuan, broadly lower interest rates, mild global inflation, and buoyant real estate valuations.
7) | Which securities helped the Emerging Markets Fund’s performance? |
| | a. | Samsung Electronics Company Ltd. |
| | b. | Telekomunikasi Indonesia Persero Tbk PT - ADR |
| | c. | Sinopec Shanghai Petrochemical Company Ltd. - ADR |
| | d. | China Resources Beer Holdings Company Ltd. |
| | e. | President Chain Store Corporation |
8) | Did any securities hurt the Emerging Markets Fund’s performance? |
| | a. | iShares MSCI Taiwan ETF |
| | b. | iShares MSCI South Korea Capped ETF |
| | c. | iShares China Large-Cap ETF |
| | d. | Huaneng Power International, Inc. - ADR |
| | e. | America Movil S.A.B. de C.V. – Series L - ADR |
9
CUTLER EQUITY FUND
PERFORMANCE INFORMATION
June 30, 2016 (Unaudited)
Comparison of the Change in Value of a $10,000 Investment in
Cutler Equity Fund and S&P 500 Total Return Index

Average Annual Total Returns(a)
(for periods ended June 30, 2016) |
| | 1 Year | 5 Years | 10 Years | |
Cutler Equity Fund | 7.40% | 10.21% | 7.52% | |
S&P 500 Total Return Index(b) | 3.99% | 12.10% | 7.42% | |
| | | | | | |
(a) | Returns shown do not reflect the deduction of taxes a shareholder would pay on Fund distributions or the redemption of Fund shares. | |
(b) | The S&P 500 Total Return Index is a market capitalization weighted index that is widely used as a barometer of U.S. stock market performance. The index is unmanaged and shown for illustration purposes only. An investor cannot invest in an index and its returns are not indicative of the performance of any specific investment. | |
10
CUTLER FIXED INCOME FUND
PERFORMANCE INFORMATION
June 30, 2016 (Unaudited)
Comparison of the Change in Value of a $10,000 Investment in
Cutler Fixed Income Fund, Barclays Intermediate U.S. Government/Credit Index and
Barclays Short-Term U.S. Government Index
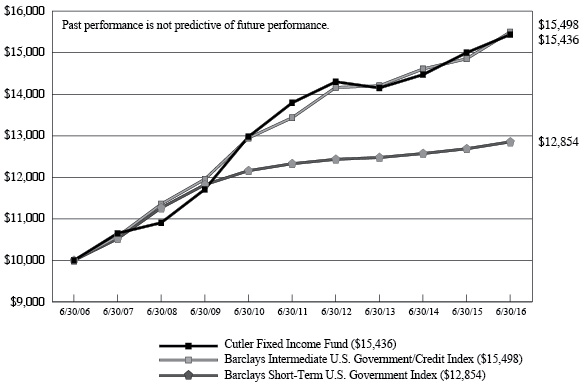
Average Annual Total Returns(a)
(for periods ended June 30, 2016) |
| | 1 Year | 5 Years | 10 Years | |
Cutler Fixed Income Fund | 2.91% | 2.28% | 4.44% | |
Barclays Intermediate U.S. Government/Credit Index(b) | 4.33% | 2.90% | 4.48% | |
Barclays Short-Term U.S. Government Index(b) | 1.31% | 0.84% | 2.54% | |
| | | | | | |
(a) | Returns shown do not reflect the deduction of taxes a shareholder would pay on Fund distributions or the redemption of Fund shares. | |
(b) | The Barclays Intermediate U.S. Government/Credit Index and the Barclays Short-Term U.S. Government Index cover intermediate and short-term, respectively, fixed income securities of the U.S government and publicly issued U.S. corporate and foreign debentures and secured notes that meet specified maturity, liquidity, and quality requirements. The indices are unmanaged and shown for illustration purposes only. An investor cannot invest in an index and its returns are not indicative of the performance or any specific investment. | |
11
CUTLER EMERGING MARKETS FUND
PERFORMANCE INFORMATION
June 30, 2016 (Unaudited)
Comparison of the Change in Value of a $10,000 Investment in
Cutler Emerging Markets Fund and MSCI Emerging Markets Index

Total Returns(a)
(for the period ended June 30, 2016) |
| | | | Since
Inception(b) | |
Cutler Emerging Markets Fund | | | (15.43%) | |
MSCI Emerging Markets Index(c) | | | (12.04%) | |
| | | | | | |
(a) | Returns shown do not reflect the deduction of taxes a shareholder would pay on Fund distributions or the redemption of Fund shares. | |
(b) | The Fund commenced operations on July 2, 2015. | |
(c) | The MSCI Emerging Markets Index captures large and mid cap representation across 23 emerging markets: Brazil, Chile, China, Colombia, Czech Republic, Egypt, Greece, Hungary, India, Indonesia, Korea, Malaysia, Mexico, Peru, Philippines, Poland, Russia, Qatar, South Africa, Taiwan, Thailand, Turkey and United Arab Emirates. The index is unmanaged and shown for illustration purposes only. An investor cannot invest in an index and its returns are not indicative of the performance of any specific investment. | |
12
CUTLER EQUITY FUND
PORTFOLIO INFORMATION
June 30, 2016 (Unaudited)
Sector Allocation (% of Net Assets)

13
CUTLER FIXED INCOME FUND
PORTFOLIO INFORMATION
June 30, 2016 (Unaudited)
Asset Allocation (% of Net Assets)

14
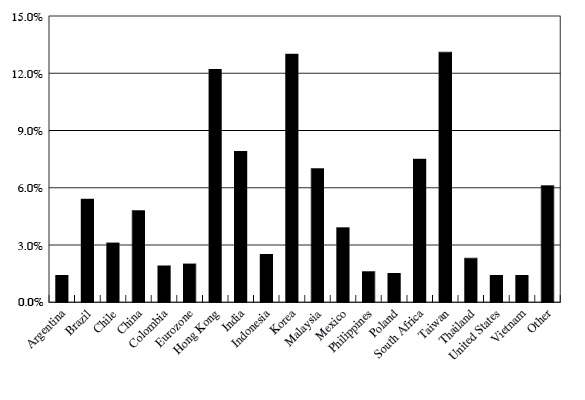
CUTLER EMERGING MARKETS FUND
PORTFOLIO INFORMATION
June 30, 2016 (Unaudited)
Country Allocation (% of Net Assets)
15
CUTLER EQUITY FUND
SCHEDULE OF INVESTMENTS
June 30, 2016 | |
COMMON STOCKS — 95.6% | | Shares | | | Value | |
Consumer Discretionary — 14.2% | | | | | | |
Hotels, Restaurants & Leisure — 3.6% | | | | | | |
McDonald's Corporation | | | 39,655 | | | $ | 4,772,083 | |
| | | | | | | | | |
Media — 3.6% | | | | | | | | |
Walt Disney Company (The) | | | 48,992 | | | | 4,792,397 | |
| | | | | | | | | |
Multi-line Retail — 3.1% | | | | | | | | |
Target Corporation | | | 57,650 | | | | 4,025,123 | |
| | | | | | | | | |
Specialty Retail — 3.9% | | | | | | | | |
Home Depot, Inc. (The) | | | 40,700 | | | | 5,196,983 | |
| | | | | | | | | |
Consumer Staples — 11.2% | | | | | | | | |
Beverages — 3.0% | | | | | | | | |
PepsiCo, Inc. | | | 37,995 | | | | 4,025,190 | |
| | | | | | | | | |
Food & Staples Retailing — 5.3% | | | | | | | | |
Sysco Corporation | | | 60,595 | | | | 3,074,590 | |
Wal-Mart Stores, Inc. | | | 53,677 | | | | 3,919,495 | |
| | | | | | | | 6,994,085 | |
Household Products — 2.9% | | | | | | | | |
Procter & Gamble Company (The) | | | 45,130 | | | | 3,821,157 | |
| | | | | | | | | |
Energy — 8.6% | | | | | | | | |
Energy Equipment & Services — 1.6% | | | | | | | | |
Schlumberger Ltd. | | | 27,000 | | | | 2,135,160 | |
| | | | | | | | | |
Oil, Gas & Consumable Fuels — 7.0% | | | | | | | | |
Chevron Corporation | | | 43,820 | | | | 4,593,650 | |
Exxon Mobil Corporation | | | 49,563 | | | | 4,646,036 | |
| | | | | | | | 9,239,686 | |
Financials — 9.6% | | | | | | | | |
Banks — 2.5% | | | | | | | | |
M&T Bank Corporation | | | 28,340 | | | | 3,350,638 | |
| | | | | | | | | |
Capital Markets — 4.9% | | | | | | | | |
BlackRock, Inc. | | | 11,484 | | | | 3,933,615 | |
Northern Trust Corporation | | | 39,000 | | | | 2,584,140 | |
| | | | | | | | 6,517,755 | |
16
CUTLER EQUITY FUND
SCHEDULE OF INVESTMENTS (Continued) | |
COMMON STOCKS — 95.6% (Continued) | | Shares | | | Value | |
Financials — 9.6% (Continued) | | | | | | |
Consumer Finance — 2.2% | | | | | | |
American Express Company | | | 47,395 | | | $ | 2,879,720 | |
| | | | | | | | | |
Health Care — 13.7% | | | | | | | | |
Health Care Equipment & Supplies — 3.6% | | | | | | | | |
Becton, Dickinson & Company | | | 27,525 | | | | 4,667,965 | |
| | | | | | | | | |
Pharmaceuticals — 10.1% | | | | | | | | |
Bristol-Myers Squibb Company | | | 71,490 | | | | 5,258,089 | |
Johnson & Johnson | | | 37,170 | | | | 4,508,721 | |
Merck & Company, Inc. | | | 62,790 | | | | 3,617,332 | |
| | | | | | | | 13,384,142 | |
Industrials — 11.1% | | | | | | | | |
Aerospace & Defense — 2.7% | | | | | | | | |
United Technologies Corporation | | | 34,510 | | | | 3,539,000 | |
| | | | | | | | | |
Air Freight & Logistics — 3.1% | | | | | | | | |
United Parcel Service, Inc. - Class B | | | 37,950 | | | | 4,087,974 | |
| | | | | | | | | |
Machinery — 5.3% | | | | | | | | |
Caterpillar, Inc. | | | 44,280 | | | | 3,356,867 | |
Deere & Company | | | 45,944 | | | | 3,723,302 | |
| | | | | | | | 7,080,169 | |
Information Technology — 11.9% | | | | | | | | |
Semiconductors & Semiconductor Equipment — 8.7% | | | | | | | | |
Intel Corporation | | | 107,465 | | | | 3,524,852 | |
QUALCOMM, Inc. | | | 56,924 | | | | 3,049,419 | |
Texas Instruments, Inc. | | | 78,900 | | | | 4,943,085 | |
| | | | | | | | 11,517,356 | |
Software — 3.2% | | | | | | | | |
Microsoft Corporation | | | 81,425 | | | | 4,166,517 | |
| | | | | | | | | |
Materials — 2.9% | | | | | | | | |
Chemicals — 2.9% | | | | | | | | |
E.I. du Pont de Nemours and Company | | | 58,405 | | | | 3,784,644 | |
| | | | | | | | | |
Telecommunication Services — 7.0% | | | | | | | | |
Diversified Telecommunication Services — 7.0% | | | | | | | | |
AT&T, Inc. | | | 109,403 | | | | 4,727,304 | |
Verizon Communications, Inc. | | | 80,786 | | | | 4,511,090 | |
| | | | | | | | 9,238,394 | |
17
CUTLER EQUITY FUND
SCHEDULE OF INVESTMENTS (Continued) | |
COMMON STOCKS — 95.6% (Continued) | | Shares | | | Value | |
Utilities — 5.4% | | | | | | |
Gas Utilities — 2.3% | | | | | | |
National Fuel Gas Company | | | 52,145 | | | $ | 2,966,008 | |
| | | | | | | | | |
Multi-utilities — 3.1% | | | | | | | | |
Dominion Resources, Inc. | | | 53,243 | | | | 4,149,227 | |
| | | | | | | | | |
Total Common Stocks (Cost $91,094,427) | | | | | | $ | 126,331,373 | |
| | |
MONEY MARKET FUNDS — 4.3% | | Shares | | | Value | |
Invesco STIT-STIC Prime Portfolio (The) - Institutional Class, 0.34% (a) (Cost $5,725,038) | | | 5,725,038 | | | $ | 5,725,038 | |
| | | | | | | | | |
Total Investments at Value — 99.9% (Cost $96,819,465) | | | | | | $ | 132,056,411 | |
| | | | | | | | | |
Other Assets in Excess of Liabilities — 0.1% | | | | | | | 79,349 | |
| | | | | | | | | |
Net Assets — 100.0% | | | | | | $ | 132,135,760 | |
(a) | The rate shown is the 7-day effective yield as of June 30, 2016. |
See accompanying notes to financial statements. |
18
CUTLER FIXED INCOME FUND
SCHEDULE OF INVESTMENTS
June 30, 2016 | |
U.S. TREASURY OBLIGATIONS — 7.2% | | Coupon | | Maturity | | Par Value | | | Value | |
U.S. Treasury Notes | | 2.125% | | 05/15/25 | | $ | 200,000 | | | $ | 211,258 | |
U.S. Treasury Notes | | 1.625% | | 02/15/26 | | | 800,000 | | | | 809,000 | |
U.S. Treasury Bonds, Stripped Principal Payment | | 2.500%(a) | | 11/15/44 | | | 600,000 | | | | 300,446 | |
Total U.S. Treasury Obligations (Cost $1,262,656) | | | $ | 1,320,704 | |
| | |
U.S. GOVERNMENT AGENCY OBLIGATIONS — 10.7% | | Coupon | | Maturity | | Par Value | | | Value | |
Federal Farm Credit Bank — 5.2% | | | | | | | | | | |
Federal Farm Credit Bank | | 2.750% | | 06/26/23 | | $ | 500,000 | | | $ | 540,082 | |
Federal Farm Credit Bank | | 2.370% | | 05/01/25 | | | 400,000 | | | | 417,008 | |
| | | | | | | | | | | | 957,090 | |
Federal Home Loan Bank — 2.0% | | | | | | | | | | | | |
Federal Home Loan Bank | | 2.125% | | 03/10/23 | | | 350,000 | | | | 364,200 | |
| | | | | | | | | | | | | |
Federal National Mortgage Association — 0.4% | | | | | | | | | | | | |
Federal National Mortgage Association | | 2.200% | | 10/25/22 | | | 64,000 | | | | 64,003 | |
| | | | | | | | | | | | | |
Private Export Funding Corporation — 2.2% | | | | | | | | | | | | |
Private Export Funding Corporation | | 4.300% | | 12/15/21 | | | 350,000 | | | | 400,153 | |
| | | | | | | | | | | | | |
U.S. Department of Housing and Urban Development — 0.9% | | | | | | | | | | | | |
U.S. Department of Housing and Urban Development | | 4.130% | | 08/01/25 | | | 150,000 | | | | 167,741 | |
| | | | | | |
Total U.S. Government Agency Obligations (Cost $1,843,006) | | | $ | 1,953,187 | |
| |
MORTGAGE-BACKED SECURITIES — 71.4% | | Coupon | | Maturity | | Par Value | | | Value | |
Commercial — 15.0% | | | | | | | | | | |
Banc of America Commercial Mortgage Trust, IO, Series 2004-4 | | 0.086%(b) | | 07/01/42 | | $ | 2,122,673 | | | $ | 1,303 | |
Bear Stearns Commercial Mortgage Securities Trust, Series 2005-T20 | | 5.296%(b) | | 10/12/42 | | | 200,000 | | | | 197,100 | |
19
CUTLER FIXED INCOME FUND
SCHEDULE OF INVESTMENTS (Continued) | |
MORTGAGE-BACKED
SECURITIES — 71.4% (Continued) | | Coupon | | Maturity | | Par Value | | | Value | |
Commercial — 15.0% (Continued) | | | | | | | | | | |
Credit Suisse First Boston Mortgage Securities Corporation, IO, Series 2004-C1, 144A | | 0.952%(b) | | 01/15/37 | | $ | 8,572,045 | | | $ | 147,665 | |
FREMF Mortgage Trust, IO, Series 2011-K15 (c) | | 0.100%(b) | | 08/01/44 | | | 115,980,806 | | | | 437,712 | |
GMAC Commercial Mortgage Securities, Inc., IO, Series 1997-C1 | | 1.670%(b) | | 07/15/29 | | | 8,908,676 | | | | 247,638 | |
JP Morgan Chase Commercial Mortgage Securities Trust, Series 2005-LDP2 | | 4.842%(b) | | 07/01/42 | | | 13,540 | | | | 13,534 | |
JP Morgan Chase Commercial Mortgage Securties Trust, Series 2006-LDP8 | | 5.549%(b) | | 05/15/45 | | | 500,000 | | | | 480,397 | |
LB Commercial Conduit Mortgage Trust, IO, Series 1999-C2 | | 1.303%(b) | | 10/15/32 | | | 2,177,171 | | | | 72 | |
Merrill Lynch Mortgage Trust, IO, Series 2008-C1, 144A (c) | | 0.477%(b) | | 02/12/51 | | | 118,390,217 | | | | 503,869 | |
Morgan Stanley Capital I Trust, IO, Series 1998-HF2 | | 1.022%(b) | | 11/01/30 | | | 1,192,850 | | | | 16,827 | |
Wachovia Bank Commercial Mortgage Trust, IO, Series 2005-C21 (c) | | 0.078%(b) | | 10/01/44 | | | 390,743,985 | | | | 702,558 | |
| | | | | | | | | | | | 2,748,675 | |
Federal Home Loan Mortgage Corporation — 2.9% | | | | | | | | | | | | |
FHLMC, IO, Series K717 | | 0.636%(b) | | 09/01/21 | | | 19,858,780 | | | | 461,832 | |
FHLMC, Pool #J13584 | | 3.500% | | 11/01/25 | | | 41,289 | | | | 44,105 | |
FHLMC, Series 1963 | | 7.500% | | 01/01/27 | | | 21,324 | | | | 24,607 | |
| | | | | | | | | | | | 530,544 | |
Federal National Mortgage Association — 44.9% | | | | | | | | | | | | |
FANNIEMAE-ACES, IO,
Series 2013-M1 | | 4.572%(b) | | 11/25/16 | | | 5,584,277 | | | | 22,701 | |
FANNIEMAE-ACES, IO,
Series 2012-M14 (c) | | 4.192%(b) | | 02/25/17 | | | 9,676,963 | | | | 141,177 | |
FANNIEMAE-ACES, IO,
Series 2013-M4 (c) | | 3.912%(b) | | 02/25/18 | | | 8,719,757 | | | | 384,602 | |
FANNIEMAE-ACES, IO,
Series 2013-M13 | | 0.000%(b) | | 05/01/18 | | | 151,155,296 | | | | 115,135 | |
FANNIEMAE-ACES, IO,
Series 2014-M8 | | 4.611%(b) | | 05/25/18 | | | 8,769,259 | | | | 251,027 | |
FANNIEMAE-ACES, IO,
Series 2015-M3 (c) | | 4.524%(b) | | 06/25/18 | | | 8,962,464 | | | | 426,784 | |
FANNIEMAE-ACES,
Series 2006-M1 | | 5.385%(b) | | 06/01/19 | | | 48,788 | | | | 49,833 | |
FANNIEMAE-ACES, IO,
Series 2009-M1 | | 0.623%(b) | | 07/25/19 | | | 18,093,645 | | | | 384,660 | |
20
CUTLER FIXED INCOME FUND
SCHEDULE OF INVESTMENTS (Continued) | |
MORTGAGE-BACKED
SECURITIES — 71.4% (Continued) | | Coupon | | Maturity | | Par Value | | | Value | |
Federal National Mortgage Association — 44.9% (Continued) | | | | | | | | | | |
FANNIEMAE-ACES, IO,
Series 2010-M1 | | 0.401%(b) | | 09/25/19 | | $ | 11,422,758 | | | $ | 171,804 | |
FANNIEMAE-ACES, IO,
Series 2010-M3 (c) | | 0.317%(b) | | 03/25/20 | | | 22,942,953 | | | | 455,831 | |
FANNIEMAE-ACES, IO,
Series 2010-M4 | | 0.735%(b) | | 06/25/20 | | | 15,359,234 | | | | 424,706 | |
FANNIEMAE-ACES, IO,
Series 2010-M5 (c) | | 0.894%(b) | | 07/25/20 | | | 12,436,808 | | | | 416,123 | |
FANNIEMAE-ACES, IO,
Series 2011-M9 (c) | | 0.094%(b) | | 01/25/21 | | | 40,537,924 | | | | 243,106 | |
FANNIEMAE-ACES, IO,
Series 2011-M2 (c) | | 0.065%(b) | | 04/25/21 | | | 30,084,734 | | | | 494,653 | |
FANNIEMAE-ACES, IO,
Series 2011-M1 (c) | | 0.021%(b) | | 06/25/21 | | | 42,489,968 | | | | 530,190 | |
FANNIEMAE-ACES, IO,
Series 2012-M1 (c) | | 0.070%(b) | | 10/25/21 | | | 88,212,656 | | | | 705,172 | |
FANNIEMAE-ACES, IO,
Series 2013-M5 | | 2.301%(b) | | 01/01/22 | | | 6,449,653 | | | | 564,644 | |
FANNIEMAE-ACES, IO,
Series 2012-M4 | | 0.630%(b) | | 04/25/22 | | | 13,146,355 | | | | 365,448 | |
FANNIEMAE-ACES, IO,
Series 2015-M4 (c) | | 0.572%(b) | | 07/25/22 | | | 15,166,640 | | | | 420,980 | |
FANNIEMAE-ACES, IO,
Series 2012-M14 | | 0.502%(b) | | 09/25/22 | | | 3,510,090 | | | | 86,177 | |
FANNIEMAE-ACES, IO,
Series 2014-M3 (c) | | 0.105%(b) | | 01/25/24 | | | 37,555,639 | | | | 339,465 | |
FANNIEMAE-ACES, IO,
Series 2015-M1 | | 0.555%(b) | | 09/25/24 | | | 30,154,506 | | | | 1,159,685 | |
FNMA, Series 2003-3 | | 5.000% | | 02/01/18 | | | 5,832 | | | | 5,937 | |
FNMA, Pool #899237 | | 5.000% | | 03/01/22 | | | 8,051 | | | | 8,389 | |
FNMA, Series 2002-93 | | 6.500% | | 03/01/32 | | | 42,908 | | | | 49,609 | |
| | | | | | | | | | | | 8,217,838 | |
Government National Mortgage Association — 8.6% | | | | | | | | | | | | |
GNMA, Pool #577742 | | 5.500% | | 09/01/17 | | | 1,212 | | | | 1,343 | |
GNMA, IO, Series 2011-121 | | 5.658%(b) | | 03/16/43 | | | 1,471,943 | | | | 290,280 | |
GNMA, IO, Series 2010-100 | | 0.185%(b) | | 07/16/50 | | | 11,140,550 | | | | 238,724 | |
GNMA, IO, Series 2012-4 | | 0.778%(b) | | 05/16/52 | | | 3,684,996 | | | | 120,158 | |
GNMA, IO, Series 2012-114 | | 0.901%(b) | | 01/16/53 | | | 3,959,111 | | | | 264,228 | |
GNMA, IO, Series 2012-125 (c) | | 0.502%(b) | | 02/16/53 | | | 15,845,949 | | | | 651,170 | |
| | | | | | | | | | | | 1,565,903 | |
| | | | | | |
Total Mortgage-Backed Securities (Cost $14,624,591) | | | $ | 13,062,960 | |
21
CUTLER FIXED INCOME FUND
SCHEDULE OF INVESTMENTS (Continued) | |
CORPORATE BONDS — 2.2% | | Coupon | | Maturity | | Par Value | | | Value | |
Financials — 1.6% | | | | | | | | | | |
Finial Holdings, Inc. | | 7.125% | | 10/15/23 | | $ | 250,000 | | | $ | 299,722 | |
| | | | | | | | | | | | | |
Industrials — 0.6% | | | | | | | | | | | | |
Kinross Gold Corporation | | 5.125% | | 09/01/21 | | | 100,000 | | | | 99,250 | |
| | | | | | |
Total Corporate Bonds (Cost $388,185) | | | $ | 398,972 | |
| | |
MONEY MARKET FUNDS — 6.3% | | Shares | | | Value | |
Invesco STIT-STIC Prime Portfolio (The) - Institutional Class, 0.34% (d) (Cost $1,147,202) | | | 1,147,202 | | | $ | 1,147,202 | |
| | | | | | | | | |
Total Investments at Value — 97.8% (Cost $19,265,640) | | | | | | $ | 17,883,025 | |
| | | | | | | | | |
Other Assets in Excess of Liabilities — 2.2% | | | | | | | 405,825 | |
| | | | | | | | | |
Net Assets — 100.0% | | | | | | $ | 18,288,850 | |
IO - Interest only strip. Par value shown is the notional value, not a true par value (Note 6). 144A - This is a restricted security that was sold in a transaction exempt under Rule 144A of the Securities Act of 1933. This security may be sold in transactions exempt from registration, normally to qualified institutional buyers. The total value of such securities is $651,534 at June 30, 2016. |
(a) | Rate shown is the annualized yield at the time of purchase, not a coupon rate. |
(b) | Variable rate security. The rate shown is the effective interest rate as of June 30, 2016. |
(c) | Fair value priced (Note 2). Fair valued securities totaled $6,853,392 at June 30, 2016, representing 37.5% of net assets. |
(d) | The rate shown is the 7-day effective yield as of June 30, 2016. |
See accompanying notes to financial statements. |
22
CUTLER EMERGING MARKETS FUND
SCHEDULE OF INVESTMENTS
June 30, 2016 | |
COMMON STOCKS — 82.3% | | Shares | | | Value | |
Brazil — 5.4% | | | | | | |
Ambev S.A. - ADR | | | 27,800 | | | $ | 164,298 | |
Embraer S.A. - ADR | | | 4,895 | | | | 106,319 | |
Itau Unibanco Holding S.A. - ADR | | | 17,519 | | | | 165,379 | |
| | | | | | | | 435,996 | |
Chile — 3.0% | | | | | | | | |
Empresa Nacional de Telecomunicaciones S.A. (a) | | | 13,080 | | | | 118,569 | |
Viña Concha y Toro S.A. | | | 79,500 | | | | 125,516 | |
| | | | | | | | 244,085 | |
China — 4.8% | | | | | | | | |
Huaneng Power International, Inc. - ADR | | | 3,931 | | | | 98,157 | |
PetroChina Company Ltd. - ADR | | | 1,776 | | | | 120,626 | |
Sinopec Shanghi Petrochemical Company Ltd. - ADR | | | 3,704 | | | | 169,902 | |
| | | | | | | | 388,685 | |
Colombia — 1.9% | | | | | | | | |
Grupo de Inversiones Suramericana | | | 12,000 | | | | 157,807 | |
| | | | | | | | | |
Hong Kong — 12.2% | | | | | | | | |
China Overseas Land & Investment Ltd. (b) | | | 49,000 | | | | 156,201 | |
China Overseas Property Holdings Ltd. (b) | | | 15,666 | | | | 2,331 | |
China Resources Beer Holdings Company Ltd. (b) | | | 70,000 | | | | 152,998 | |
China Resources Land Ltd. (b) | | | 64,000 | | | | 150,809 | |
CITIC Ltd. (b) | | | 107,000 | | | | 156,411 | |
COSCO Pacific Ltd. (b) | | | 12,000 | | | | 11,981 | |
Lenovo Group Ltd. - ADR | | | 8,206 | | | | 99,129 | |
Shanghi Industrial Holdings Ltd. (b) | | | 69,000 | | | | 156,861 | |
Tingyi (Cayman Islands) Holding Corporation (b) | | | 110,000 | | | | 104,449 | |
| | | | | | | | 991,170 | |
India — 5.5% | | | | | | | | |
Dr. Reddy's Laboratories Ltd. - ADR | | | 2,651 | | | | 135,811 | |
ICICI Bank Ltd. - ADR | | | 21,160 | | | | 151,929 | |
Infosys Ltd. - ADR | | | 9,128 | | | | 162,935 | |
| | | | | | | | 450,675 | |
Indonesia — 2.5% | | | | | | | | |
Telekomunikasi Indonesia Persero Tbk PT - ADR | | | 3,257 | | | | 200,175 | |
| | | | | | | | | |
Korea (Republic of) — 13.0% | | | | | | | | |
AMOREPACIFIC Group (b) | | | 710 | | | | 104,165 | |
Dongbu Insurance Company Ltd. (b) | | | 1,803 | | | | 108,500 | |
Korea Gas Corporation (b) | | | 3,880 | | | | 134,868 | |
KT Corporation - ADR | | | 11,956 | | | | 170,493 | |
LG Corporation (b) | | | 2,510 | | | | 139,556 | |
POSCO - ADR | | | 1,751 | | | | 77,920 | |
23
CUTLER EMERGING MARKETS FUND
SCHEDULE OF INVESTMENTS (Continued) | |
COMMON STOCKS — 82.3% (Continued) | | Shares | | | Value | |
Korea (Republic of) — 13.0% (Continued) | | | | | | |
Samsung Electronics Company Ltd. (b) | | | 188 | | | $ | 234,075 | |
Samsung Fire & Marine Insurance Company Ltd. (b) | | | 370 | | | | 84,963 | |
| | | | | | | | 1,054,540 | |
Malaysia — 5.7% | | | | | | | | |
CIMB Group Holdings Berhad (b) | | | 139,623 | | | | 153,468 | |
Genting Berhad (b) | | | 76,200 | | | | 156,846 | |
Malayan Banking Berhad (b) | | | 76,633 | | | | 156,649 | |
| | | | | | | | 466,963 | |
Mexico — 3.9% | | | | | | | | |
América Móvil S.A.B. de C.V. - Series L - ADR | | | 13,023 | | | | 159,662 | |
Coca-Cola Femsa S.A.B. de C.V. - Series L | | | 18,800 | | | | 155,652 | |
| | | | | | | | 315,314 | |
Philippines — 1.6% | | | | | | | | |
Universal Robina Corporation (b) | | | 30,070 | | | | 133,346 | |
| | | | | | | | | |
South Africa — 7.5% | | | | | | | | |
Liberty Holdings Ltd. (b) | | | 16,865 | | | | 137,560 | |
Naspers Ltd. - ADR | | | 10,670 | | | | 163,678 | |
Sasol Ltd. - ADR | | | 3,802 | | | | 103,110 | |
Shoprite Holdings Ltd. (b) | | | 9,250 | | | | 104,701 | |
Shoprite Holdings Ltd. - ADR | | | 8,803 | | | | 99,175 | |
| | | | | | | | 608,224 | |
Taiwan Province of China — 11.6% | | | | | | | | |
Cheng Shin Rubber Industry Company Ltd. (b) | | | 54,000 | | | | 113,887 | |
Compal Electronics, Inc. (b) | | | 178,000 | | | | 112,635 | |
CTCI Corporation (b) | | | 132,000 | | | | 193,181 | |
Delta Electronics, Inc. (a) (b) | | | 39,100 | | | | 190,835 | |
Giant Manufacturing Company Ltd. (b) | | | 17,000 | | | | 106,077 | |
President Chain Store Corporation (b) | | | 29,000 | | | | 226,650 | |
| | | | | | | | 943,265 | |
Thailand — 2.3% | | | | | | | | |
Charoen Pokphand Foods plc (b) | | | 229,500 | | | | 188,217 | |
| | | | | | | | | |
United States — 1.4% | | | | | | | | |
Southern Copper Corporation | | | 4,290 | | | | 115,744 | |
| | | | | | | | | |
Total Common Stocks (Cost $6,674,851) | | | | | | $ | 6,694,206 | |
24
CUTLER EMERGING MARKETS FUND
SCHEDULE OF INVESTMENTS (Continued) | |
EXCHANGE-TRADED FUNDS — 9.1% | | Shares | | | Value | |
Global X MSCI Argentina ETF | | | 5,200 | | | $ | 115,960 | |
iShares Currency Hedged MSCI Eurozone ETF | | | 6,738 | | | | 162,184 | |
iShares MSCI Malaysia ETF | | | 12,902 | | | | 106,958 | |
iShares MSCI Taiwan ETF | | | 8,858 | | | | 124,455 | |
VanEck Vectors Poland ETF | | | 9,326 | | | | 120,678 | |
VanEck Vectors Vietnam ETF | | | 7,700 | | | | 112,497 | |
Total Exchange-Traded Funds (Cost $772,048) | | | | | | $ | 742,732 | |
| |
EXCHANGE-TRADED NOTES — 2.4% | | Shares | | | Value | |
iPath MSCI India Index ETN (a) (Cost $199,934) | | | 3,035 | | | $ | 197,427 | |
| | |
RIGHTS — 0.1% | | Shares | | | Value | |
Empresa Nacional de Telecommunicaciones S.A. (a)(b) (Cost $2,846) | | | 3,584 | | | $ | 3,249 | |
| | |
MONEY MARKET FUNDS — 6.0% | | Shares | | | Value | |
Invesco STIT-STIC Prime Portfolio (The) - Institutional Class, 0.34% (c) (Cost $483,769) | | | 483,769 | | | $ | 483,769 | |
| | | | | | | | | |
Total Investments at Value — 99.9% (Cost $8,133,448) | | | | | | $ | 8,121,383 | |
| | | | | | | | | |
Other Assets in Excess of Liabilities — 0.1% | | | | | | | 7,064 | |
| | | | | | | | | |
Net Assets — 100.0% | | | | | | $ | 8,128,447 | |
ADR - American Depositary Receipt. |
(a) | Non-income producing security. |
(b) | Fair value priced (Note 2). Fair valued securities totaled $3,675,469 at June 30, 2016, representing 45.2% of net assets. |
(c) | The rate shown is the 7-day effective yield as of June 30, 2016. |
See accompanying notes to financial statements. |
25
CUTLER EMERGING MARKETS FUND
SUMMARY OF COMMON STOCKS
BY SECTOR AND INDUSTRY
June 30, 2016 | |
Sector/Industry | | % of Net Assets | |
Consumer Discretionary — 6.6% | | | |
Auto Components | | | 1.4 | % |
Hotels, Restaurants & Leisure | | | 1.9 | % |
Leisure Products | | | 1.3 | % |
Media | | | 2.0 | % |
Consumer Staples — 19.2% | | | | |
Beverages | | | 5.5 | % |
Food & Staples Retailing | | | 7.2 | % |
Food Products | | | 5.2 | % |
Personal Products | | | 1.3 | % |
Energy — 2.7% | | | | |
Oil, Gas & Consumable Fuels | | | 2.7 | % |
Financials – 17.5% | | | | |
Banks | | | 9.6 | % |
Diversified Financial Services | | | 1.9 | % |
Insurance | | | 4.1 | % |
Real Estate Management & Development | | | 1.9 | % |
Health Care — 1.7% | | | | |
Pharmaceuticals | | | 1.7 | % |
Industrials — 9.4% | | | | |
Aerospace & Defense | | | 1.3 | % |
Construction & Engineering | | | 2.4 | % |
Industrial Conglomerates | | | 5.6 | % |
Transportation Infrastructure | | | 0.1 | % |
Information Technology — 9.8% | | | | |
Electronic Equipment, Instruments & Components | | | 2.3 | % |
IT Services | | | 2.0 | % |
Technology Hardware, Storage & Peripherals | | | 5.5 | % |
Materials — 4.5% | | | | |
Chemicals | | | 2.1 | % |
Metals & Mining | | | 2.4 | % |
Telecommunication Services — 8.0% | | | | |
Diversified Telecommunication Services | | | 4.6 | % |
Wireless Telecommunication Services | | | 3.4 | % |
Utilities — 2.9% | | | | |
Gas Utilities | | | 1.7 | % |
Independent Power and Renewable Electricity Producers | | | 1.2 | % |
| | | | 82.3 | % |
See accompanying notes to financial statements. |
26
THE CUTLER TRUST
STATEMENTS OF ASSETS AND LIABILITIES
June 30, 2016 | |
| | Cutler
Equity Fund | | | Cutler Fixed
Income Fund | | | Cutler Emerging Markets Fund | |
ASSETS | | | | | | | | | |
Investments in securities: | | | | | | | | | |
At acquisition cost | | $ | 96,819,465 | | | $ | 19,265,640 | | | $ | 8,133,448 | |
At value (Note 2) | | $ | 132,056,411 | | | $ | 17,883,025 | | | $ | 8,121,383 | |
Cash denominated in foreign currency (Cost $8,769) | | | — | | | | — | | | | 8,776 | |
Dividends and interest receivable | | | 166,335 | | | | 460,663 | | | | 24,810 | |
Receivable for capital shares sold | | | 206,435 | | | | 754 | | | | 71 | |
Receivable from Adviser (Note 3) | | | — | | | | — | | | | 3,855 | |
Other assets | | | 5,639 | | | | 3,786 | | | | 3,584 | |
Total assets | | | 132,434,820 | | | | 18,348,228 | | | | 8,162,479 | |
| | | | | | | | | | | | | |
LIABILITIES | | | | | | | | | | | | |
Distributions payable | | | 7,139 | | | | 10,518 | | | | — | |
Payable for capital shares redeemed | | | 149,418 | | | | 15,460 | | | | 4,102 | |
Payable to Adviser (Note 3) | | | 90,558 | | | | 7,360 | | | | — | |
Payable to administrator (Note 3) | | | 16,000 | | | | 6,000 | | | | 6,500 | |
Other accrued expenses | | | 35,945 | | | | 20,040 | | | | 23,430 | |
Total liabilities | | | 299,060 | | | | 59,378 | | | | 34,032 | |
| | | | | | | | | | | | | |
NET ASSETS | | $ | 132,135,760 | | | $ | 18,288,850 | | | $ | 8,128,447 | |
| | | | | | | | | | | | | |
NET ASSETS CONSIST OF: | | | | | | | | | | | | |
Paid-in capital | | $ | 97,544,480 | | | $ | 19,013,719 | | | $ | 8,198,001 | |
Undistributed net investment income | | | 81,678 | | | | 726,754 | | | | 15,308 | |
Accumulated net realized losses from security transactions | | | (727,344 | ) | | | (69,008 | ) | | | (72,833 | ) |
Net unrealized appreciation (depreciation) on investments | | | 35,236,946 | | | | (1,382,615 | ) | | | (12,065 | ) |
Net unrealized appreciation on translation of assets and liabilities in foreign currencies | | | — | | | | — | | | | 36 | |
NET ASSETS | | $ | 132,135,760 | | | $ | 18,288,850 | | | $ | 8,128,447 | |
| | | | | | | | | | | | | |
Shares of beneficial interest outstanding (unlimited number of shares authorized, no par value) | | | 7,704,758 | | | | 1,886,761 | | | | 969,795 | |
| | | | | | | | | | | | | |
Net asset value, offering price and redemption price per share (Note 2) | | $ | 17.15 | | | $ | 9.69 | | | $ | 8.38 | |
See accompanying notes to financial statements. |
27
THE CUTLER TRUST
STATEMENTS OF OPERATIONS
For the Year Ended June 30, 2016 (a) | |
| | Cutler
Equity Fund | | | Cutler Fixed
Income Fund | | | Cutler Emerging Markets Fund | |
INVESTMENT INCOME | | | | | | | | | |
Dividend income | | $ | 3,538,206 | | | $ | 1,246 | | | $ | 175,131 | |
Interest income | | | — | | | | 1,685,944 | (b) | | | — | |
Foreign withholding taxes on dividends | | | — | | | | — | | | | (9,375 | ) |
Total investment income | | | 3,538,206 | | | | 1,687,190 | | | | 165,756 | |
| | | | | | | | | | | | | |
EXPENSES | | | | | | | | | | | | |
Investment advisory fees (Note 3) | | | 903,484 | | | | 86,289 | | | | 45,243 | |
Administration fees (Note 3) | | | 181,033 | | | | 72,000 | | | | 78,000 | |
Shareholder servicing fees (Note 3) | | | 136,941 | | | | — | | | | — | |
Professional fees | | | 52,674 | | | | 22,727 | | | | 21,354 | |
Custody and bank service fees | | | 14,611 | | | | 6,197 | | | | 25,673 | |
Registration and filing fees | | | 22,861 | | | | 14,117 | | | | 8,941 | |
Trustees’ fees and expenses (Note 3) | | | 32,790 | | | | 5,613 | | | | 2,290 | |
Pricing costs | | | 626 | | | | 11,235 | | | | 10,232 | |
Insurance expense | | | 16,252 | | | | 2,676 | | | | 664 | |
Printing of shareholder reports | | | 8,641 | | | | 4,392 | | | | 3,881 | |
Postage and supplies | | | 8,978 | | | | 3,656 | | | | 3,030 | |
Other expenses | | | 8,040 | | | | 6,217 | | | | 6,160 | |
Total expenses | | | 1,386,931 | | | | 235,119 | | | | 205,468 | |
Less fee reductions and expense reimbursements by the Adviser (Note 3) | | | (4,100 | ) | | | — | | | | (122,966 | ) |
Net expenses | | | 1,382,831 | | | | 235,119 | | | | 82,502 | |
| | | | | | | | | | | | | |
NET INVESTMENT INCOME | | | 2,155,375 | | | | 1,452,071 | | | | 83,254 | |
| | | | | | | | | | | | | |
REALIZED AND UNREALIZED GAINS (LOSSES) ON INVESTMENTS AND FOREIGN CURRENCY TRANSLATION | | | | | | | | | | | | |
Net realized gains (losses) from: | | | | | | | | | | | | |
Investment transactions | | | 3,709,722 | | | | 222,816 | | | | (77,414 | ) |
Capital gain distributions from regulated investment companies | | | — | | | | — | | | | 4,581 | |
Foreign currency transactions | | | — | | | | — | | | | (14,522 | ) |
Net change in unrealized appreciation (depreciation) on: | | | | | | | | | | | | |
Investments | | | 3,239,050 | | | | (1,156,745 | ) | | | (12,065 | ) |
Foreign currency translation | | | — | | | | — | | | | 36 | |
NET REALIZED AND UNREALIZED GAINS (LOSSES) ON INVESTMENTS AND FOREIGN CURRENCY TRANSLATION | | | 6,948,772 | | | | (933,929 | ) | | | (99,384 | ) |
| | | | | | | | | | | | | |
NET INCREASE (DECREASE) IN NET ASSETS FROM OPERATIONS | | $ | 9,104,147 | | | $ | 518,142 | | | $ | (16,130 | ) |
(a) | Except for Cutler Emerging Markets Fund, which represents the period from the commencement of operations (July 2, 2015) through June 30, 2016. |
(b) | Includes income received from prepayment penalties for IO securities (Note 6.) |
See accompanying notes to financial statements. |
28
CUTLER EQUITY FUND
STATEMENTS OF CHANGES IN NET ASSETS | |
| | Year
Ended
June 30,
2016 | | | Year
Ended
June 30,
2015 | |
FROM OPERATIONS | | | | | | |
Net investment income | | $ | 2,155,375 | | | $ | 1,765,921 | |
Net realized gains from investment transactions | | | 3,709,722 | | | | 6,862,815 | |
Net change in unrealized appreciation (depreciation) on investments | | | 3,239,050 | | | | (6,933,714 | ) |
Net increase in net assets from operations | | | 9,104,147 | | | | 1,695,022 | |
| | | | | | | | | |
DISTRIBUTIONS TO SHAREHOLDERS | | | | | | | | |
From net investment income | | | (2,076,985 | ) | | | (1,763,636 | ) |
From net realized gains | | | (5,633,681 | ) | | | (2,012,254 | ) |
Decrease in net assets from distributions to shareholders | | | (7,710,666 | ) | | | (3,775,890 | ) |
| | | | | | | | | |
CAPITAL SHARE TRANSACTIONS | | | | | | | | |
Proceeds from shares sold | | | 16,579,609 | | | | 15,931,481 | |
Net asset value of shares issued in reinvestment of distributions to shareholders | | | 7,635,321 | | | | 3,718,498 | |
Payments for shares redeemed | | | (16,212,052 | ) | | | (17,059,447 | ) |
Net increase from capital share transactions | | | 8,002,878 | | | | 2,590,532 | |
| | | | | | | | | |
TOTAL INCREASE IN NET ASSETS | | | 9,396,359 | | | | 509,664 | |
| | | | | | | | | |
NET ASSETS | | | | | | | | |
Beginning of year | | | 122,739,401 | | | | 122,229,737 | |
End of year | | $ | 132,135,760 | | | $ | 122,739,401 | |
| | | | | | | | | |
UNDISTRIBUTED NET INVESTMENT INCOME | | $ | 81,678 | | | $ | 3,288 | |
| | | | | | | | | |
CAPITAL SHARE ACTIVITY | | | | | | | | |
Shares sold | | | 1,015,316 | | | | 910,186 | |
Shares reinvested | | | 472,948 | | | | 212,456 | |
Shares redeemed | | | (978,883 | ) | | | (979,513 | ) |
Net increase in shares outstanding | | | 509,381 | | | | 143,129 | |
Shares outstanding at beginning of year | | | 7,195,377 | | | | 7,052,248 | |
Shares outstanding at end of year | | | 7,704,758 | | | | 7,195,377 | |
See accompanying notes to financial statements. |
29
CUTLER FIXED INCOME FUND
STATEMENTS OF CHANGES IN NET ASSETS | |
| | Year
Ended
June 30,
2016 | | | Year
Ended
June 30,
2015 | |
FROM OPERATIONS | | | | | | |
Net investment income | | $ | 1,452,071 | | | $ | 799,969 | |
Net realized gains from investment transactions | | | 222,816 | | | | 82,692 | |
Net change in unrealized appreciation (depreciation) on investments | | | (1,156,745 | ) | | | (315,043 | ) |
Net increase in net assets from operations | | | 518,142 | | | | 567,618 | |
| | | | | | | | | |
DISTRIBUTIONS TO SHAREHOLDERS | | | | | | | | |
From net investment income | | | (1,372,984 | ) | | | (316,510 | ) |
| | | | | | | | | |
CAPITAL SHARE TRANSACTIONS | | | | | | | | |
Proceeds from shares sold | | | 2,761,155 | | | | 4,231,423 | |
Net asset value of shares issued in reinvestment of distributions to shareholders | | | 1,353,754 | | | | 312,258 | |
Payments for shares redeemed | | | (2,402,222 | ) | | | (2,304,712 | ) |
Net increase from capital share transactions | | | 1,712,687 | | | | 2,238,969 | |
| | | | | | | | | |
TOTAL INCREASE IN NET ASSETS | | | 857,845 | | | | 2,490,077 | |
| | | | | | | | | |
NET ASSETS | | | | | | | | |
Beginning of year | | | 17,431,005 | | | | 14,940,928 | |
End of year | | $ | 18,288,850 | | | $ | 17,431,005 | |
| | | | | | | | | |
UNDISTRIBUTED NET INVESTMENT INCOME | | $ | 726,754 | | | $ | 458,277 | |
| | | | | | | | | |
CAPITAL SHARE ACTIVITY | | | | | | | | |
Shares sold | | | 278,143 | | | | 417,628 | |
Shares reinvested | | | 138,586 | | | | 30,536 | |
Shares redeemed | | | (242,801 | ) | | | (227,592 | ) |
Net increase in shares outstanding | | | 173,928 | | | | 220,572 | |
Shares outstanding at beginning of year | | | 1,712,833 | | | | 1,492,261 | |
Shares outstanding at end of year | | | 1,886,761 | | | | 1,712,833 | |
See accompanying notes to financial statements. |
30
CUTLER EMERGING MARKETS FUND
STATEMENT OF CHANGES IN NET ASSETS | |
| | Period
Ended
June 30,
2016 (a) | |
FROM OPERATIONS | | | |
Net investment income | | $ | 83,254 | |
Net realized losses from: | | | | |
Investment transactions | | | (77,414 | ) |
Capital gain distributions from regulated investment companies | | | 4,581 | |
Foreign currency transactions | | | (14,522 | ) |
Net change in unrealized appreciation (depreciation) on: | | | | |
Investments | | | (12,065 | ) |
Foreign currency translation | | | 36 | |
Net decrease in net assets from operations | | | (16,130 | ) |
| | | | | |
DISTRIBUTIONS TO SHAREHOLDERS | | | | |
From net investment income | | | (53,424 | ) |
| | | | | |
CAPITAL SHARE TRANSACTIONS | | | | |
Proceeds from shares sold | | | 8,462,679 | |
Net asset value of shares issued in reinvestment of distributions to shareholders | | | 53,424 | |
Payments for shares redeemed | | | (318,102 | ) |
Net increase from capital share transactions | | | 8,198,001 | |
| | | | | |
TOTAL INCREASE IN NET ASSETS | | | 8,128,447 | |
| | | | | |
NET ASSETS | | | | |
Beginning of period | | | — | |
End of period | | $ | 8,128,447 | |
| | | | | |
UNDISTRIBUTED NET INVESTMENT INCOME | | $ | 15,308 | |
| | | | | |
CAPITAL SHARE ACTIVITY | | | | |
Shares sold | | | 1,003,439 | |
Shares reinvested | | | 6,612 | |
Shares redeemed | | | (40,256 | ) |
Net increase in shares outstanding | | | 969,795 | |
Shares outstanding at beginning of period | | | — | |
Shares outstanding at end of period | | | 969,795 | |
(a) | Represents the period from commencement of operations (July 2, 2015) through June 30, 2016. |
See accompanying notes to financial statements. |
31
CUTLER EQUITY FUND
FINANCIAL HIGHLIGHTS | |
Per Share Data for a Share Outstanding Throughout Each Year | |
| | Years Ended June 30, | |
| | 2016 | | | 2015 | | | 2014 | | | 2013 | | | 2012 | |
Net asset value at beginning of year | | $ | 17.06 | | | $ | 17.33 | | | $ | 14.94 | | | $ | 12.70 | | | $ | 12.18 | |
| | | | | | | | | | | | | | | | | | | | | |
Income from investment operations: | | | | | | | | | | | | | | | | | | | | |
Net investment income | | | 0.30 | | | | 0.25 | | | | 0.22 | | | | 0.19 | | | | 0.19 | |
Net realized and unrealized gains on investments | | | 0.88 | | | | 0.02 | (a) | | | 2.47 | | | | 2.24 | | | | 0.52 | |
Total from investment operations | | | 1.18 | | | | 0.27 | | | | 2.69 | | | | 2.43 | | | | 0.71 | |
| | | | | | | | | | | | | | | | | | | | | |
Less distributions from: | | | | | | | | | | | | | | | | | | | | |
Net investment income | | | (0.28 | ) | | | (0.25 | ) | | | (0.22 | ) | | | (0.19 | ) | | | (0.19 | ) |
Net realized gains | | | (0.81 | ) | | | (0.29 | ) | | | (0.08 | ) | | | — | | | | — | |
Total distributions | | | (1.09 | ) | | | (0.54 | ) | | | (0.30 | ) | | | (0.19 | ) | | | (0.19 | ) |
| | | | | | | | | | | | | | | | | | | | | |
Net asset value at end of year | | $ | 17.15 | | | $ | 17.06 | | | $ | 17.33 | | | $ | 14.94 | | | $ | 12.70 | |
| | | | | | | | | | | | | | | | | | | | | |
Total return (b) | | | 7.40 | % | | | 1.49 | % | | | 18.13 | % | | | 19.26 | % | | | 5.90 | % |
| | | | | | | | | | | | | | | | | | | | | |
Net assets at end of year (000’s) | | $ | 132,136 | | | $ | 122,739 | | | $ | 122,230 | | | $ | 101,184 | | | $ | 49,416 | |
| | | | | | | | | | | | | | | | | | | | | |
Ratios/supplementary data: | | | | | | | | | | | | | | | | | | | | |
| | | | | | | | | | | | | | | | | | | | | |
Ratio of net expenses to average net assets | | | 1.15 | %(c) | | | 1.15 | % | | | 1.15 | % | | | 1.15 | % | | | 1.27 | % |
| | | | | | | | | | | | | | | | | | | | | |
Ratio of net investment income
to average net assets | | | 1.79 | % | | | 1.42 | % | | | 1.37 | % | | | 1.53 | % | | | 1.57 | % |
| | | | | | | | | | | | | | | | | | | | | |
Portfolio turnover rate | | | 11 | % | | | 14 | % | | | 8 | % | | | 8 | %(d) | | | 9 | % |
(a) | The amount of net gains on investments (both realized and unrealized) does not accord with the amounts reported in the Statement of Changes due to the timing of purchases and redemptions of Fund shares during the period. |
(b) | Total return is a measure of the change in value of an investment in the Fund over the period covered, which assumes any dividends or capital gains distributions are reinvested in shares of the Fund. Returns shown do not reflect the deduction of taxes a shareholder would pay on Fund distributions or the redemption of Fund shares. |
(c) | Absent investment advisory fee reductions by the Adviser, the ratio of expenses to average net assets would have been 1.15% for the year ended June 30, 2016 (Note 3). |
(d) | Excludes the value of securities sold to realign the Fund’s portfolio following the merger with The Elite Growth & Income Fund (Note 1). |
See accompanying notes to financial statements. |
32
CUTLER FIXED INCOME FUND
FINANCIAL HIGHLIGHTS | |
Per Share Data for a Share Outstanding Throughout Each Period | |
| | | Year
Ended
June 30, 2016 | | | Year
Ended
June 30, 2015 | | | Year
Ended
June 30, 2014 | | | Nine
Months
Ended
June 30,
2013(a) | | |
Years Ended
September 30,
| |
| | | 2012 | | | | 2011 | |
Net asset value at beginning of period | | $ | 10.18 | | | $ | 10.01 | | | $ | 9.98 | | | $ | 10.40 | | | $ | 10.27 | | | $ | 10.79 | |
| | | | | | | | | | | | | | | | | | | | | | | | | |
Income (loss) from investment operations: | | | | | | | | | | | | | | | | | | | | | | | | |
Net investment income | | | 0.79 | | | | 0.49 | | | | 0.05 | | | | 0.05 | | | | 0.21 | | | | 0.28 | |
Net realized and unrealized gains (losses) on investments | | | (0.50 | ) | | | (0.12 | ) | | | 0.17 | | | | (0.27 | ) | | | 0.31 | | | | (0.09 | ) |
Total from investment operations | | | 0.29 | | | | 0.37 | | | | 0.22 | | | | (0.22 | ) | | | 0.52 | | | | 0.19 | |
| | | | | | | | | | | | | | | | | | | | | | | | | |
Less distributions from: | | | | | | | | | | | | | | | | | | | | | | | | |
Net investment income | | | (0.78 | ) | | | (0.20 | ) | | | (0.14 | ) | | | (0.20 | ) | | | (0.39 | ) | | | (0.46 | ) |
Net realized gains | | | — | | | | — | | | | (0.05 | ) | | | — | | | | — | | | | (0.25 | ) |
Total distributions | | | (0.78 | ) | | | (0.20 | ) | | | (0.19 | ) | | | (0.20 | ) | | | (0.39 | ) | | | (0.71 | ) |
| | | | | | | | | | | | | | | | | | | | | | | | | |
Net asset value at end of period | | $ | 9.69 | | | $ | 10.18 | | | $ | 10.01 | | | $ | 9.98 | | | $ | 10.40 | | | $ | 10.27 | |
| | | | | | | | | | | | | | | | | | | | | | | | | |
Total return (b) | | | 2.91 | % | | | 3.65 | % | | | 2.26 | % | | | (2.16% | )(c) | | | 5.07 | % | | | 1.87 | % |
| | | | | | | | | | | | | | | | | | | | | | | | | |
Net assets at end of period (000’s) | | $ | 18,289 | | | $ | 17,431 | | | $ | 14,941 | | | $ | 16,262 | | | $ | 19,693 | | | $ | 21,242 | |
| | | | | | | | | | | | | | | | | | | | | | | | | |
Ratios/supplementary data: | | | | | | | | | | | | | | | | | | | | | | | | |
| | | | | | | | | | | | | | | | | | | | | | | | | |
Ratio of expenses to average net assets | | | 1.36 | % | | | 1.41 | % | | | 1.52 | % | | | 1.54 | %(d) | | | 1.52 | % | | | 1.28 | % |
| | | | | | | | | | | | | | | | | | | | | | | | | |
Ratio of net investment income to average net assets | | | 8.42 | %(e) | | | 4.95 | %(e) | | | 0.61 | % | | | 0.95 | %(d) | | | 2.03 | % | | | 2.51 | % |
| | | | | | | | | | | | | | | | | | | | | | | | | |
Portfolio turnover rate | | | 71 | % | | | 85 | % | | | 55 | % | | | 34 | %(c) | | | 53 | % | | | 83 | % |
(a) | Fund changed its fiscal year end to June 30. |
(b) | Total return is a measure of the change in value of an investment in the Fund over the period covered, which assumes any dividends or capital gains distributions are reinvested in shares of the Fund. Returns shown do not reflect the deduction of taxes a shareholder would pay on Fund distributions or the redemption of Fund shares. |
(e) | Ratio includes income from prepayment penalties received for IO securities of 6.90% and 4.57% of average net assets for the years ended June 30, 2016 and 2015, respectively (Note 6). |
See accompanying notes to financial statements. |
33
CUTLER EMERGING MARKETS FUND
FINANCIAL HIGHLIGHTS | |
Per Share Data for a Share Outstanding Throughout The Period | |
| | | Period Ended
June 30, 2016 (a) | |
|
Net asset value at beginning of period | | $ | 10.00 | |
| | | | | |
Income (loss) from investment operations: | | | | |
Net investment income | | | 0.10 | |
Net realized and unrealized losses on investments | | | (1.65 | ) |
Total from investment operations | | | (1.55 | ) |
| | | | | |
Less distributions from: | | | | |
Net investment income | | | (0.07 | ) |
| | | | | |
Net asset value at end of period | | $ | 8.38 | |
| | | | | |
Total return (b) | | | (15.43% | )(c) |
| | | | | |
Net assets at end of period (000’s) | | $ | 8,128 | |
| | | | | |
Ratios/supplementary data: | | | | |
| | | | | |
Ratio of net expenses to average net assets (d) | | | 1.55 | %(e) |
| | | | | |
Ratio of net investment income to average net assets | | | 1.56 | %(e) |
| | | | | |
Portfolio turnover rate | | | 10 | %(c) |
(a) | Represents the period from the commencement of operations (July 2, 2015) through June 30, 2016. |
(b) | Total return is a measure of the change in value of an investment in the Fund over the period covered, which assumes any dividends or capital gains distributions are reinvested in shares of the Fund. The return shown does not reflect the deduction of taxes a shareholder would pay on Fund distributions or the redemption of Fund shares. |
(d) | Absent investment advisory fee reductions and expense reimbursements by the Adviser, the ratio of expenses to average net assets would have been 3.85%(e) for the period ended June 30, 2016 (Note 3). |
See accompanying notes to financial statements. |
34
THE CUTLER TRUST
NOTES TO FINANCIAL STATEMENTS
June 30, 2016
1. Organization
Cutler Equity Fund, Cutler Fixed Income Fund and Cutler Emerging Markets Fund (individually, a “Fund” and collectively, the “Funds”) are each a diversified series of The Cutler Trust (the “Trust”). The Trust is a Delaware statutory trust that is registered as an open-end management investment company under the Investment Company Act of 1940 (the “1940 Act”). Under its Trust Instrument, the Trust is authorized to issue an unlimited number of Fund shares of beneficial interest without par value.
Cutler Equity Fund commenced operations on October 2, 1992. On September 28, 2012, Cutler Equity Fund consummated a tax-free merger with The Elite Growth & Income Fund, previously a series of The Elite Group of Mutual Funds. Pursuant to the terms of the agreement governing the merger, each share of The Elite Growth & Income Fund was converted into an equivalent dollar amount of shares of Cutler Equity Fund, based on the net asset value of Cutler Equity Fund and The Elite Growth & Income Fund as of September 27, 2012. The basis of the assets transferred from The Elite Growth & Income Fund reflected the historical basis of the assets as of the date of the tax-free merger. Cutler Equity Fund seeks current income and long-term capital appreciation.
The Elite Income Fund (the “Predecessor Fund”), a series of The Elite Group of Mutual Funds, was reorganized into Cutler Fixed Income Fund (the “Reorganization”) effective September 28, 2012, pursuant to an Agreement and Plan of Reorganization. The Reorganization was approved by the shareholders of the Predecessor Fund at a meeting held on September 27, 2012. The Predecessor Fund transferred all its assets to Cutler Fixed Income Fund in exchange for shares of Cutler Fixed Income Fund and the assumption by Cutler Fixed Income Fund of all the known liabilities of the Predecessor Fund. Cutler Fixed Income Fund did not have any significant assets or liabilities immediately prior to the consummation of the Reorganization. The Reorganization was treated as a tax-free reorganization for federal income tax purposes and, accordingly, the basis of the assets transferred reflected the historical basis of the assets as of the date of the Reorganization. Cutler Fixed Income Fund seeks to achieve high income over the long-term.
Cutler Emerging Markets Fund commenced operations on July 2, 2015. Cutler Emerging Markets Fund seeks current income and long-term capital appreciation.
2. Significant Accounting Policies
The following summarizes the significant accounting policies of the Funds. The policies are in conformity with accounting principles generally accepted in the United States of America (“GAAP”). As an investment company, as defined in Financial Accounting Standards Board (“FASB”) Accounting Standards Update 2013-08, the Funds follow accounting and reporting guidance under FASB Accounting Standards Codification Topic 946, “Financial Services – Investment Companies.”
35
THE CUTLER TRUST
NOTES TO FINANCIAL STATEMENTS (Continued)
Securities Valuation — Portfolio securities are valued as of the close of regular trading on the New York Stock Exchange (“NYSE”) (normally, 4:00 p.m., Eastern time) on each day the NYSE is open. Exchange traded securities are valued using the last reported sales price on the exchanges on which they are primarily traded. In the absence of a sale, such securities are valued at the mean of the last bid and asked price. Securities which are quoted by NASDAQ are valued at the NASDAQ Official Closing Price. Securities principally traded in non-U.S. markets that may close at different times than U.S. markets are typically fair valued by an independent pricing service and translated from the local currency into U.S. dollars using currency exchange rates supplied by an independent pricing service. Non-exchange traded securities for which over-the-counter quotations are available are generally valued at the closing bid price. Fixed income securities are generally valued using prices provided by an independent pricing service. The independent pricing service uses information with respect to transactions in bonds, quotations from bond dealers, market transactions in comparable securities, and various relationships between securities in determining the prices. Investments in shares of other open-end investment companies are valued at their net asset value as reported by such companies.
The Funds value securities at fair value pursuant to procedures adopted by the Trust’s Board of Trustees (the “Board”) if (1) market quotations are insufficient or not readily available or (2) the Funds’ investment adviser believes that the prices or values available are unreliable due to, among other things, the occurrence of events after the close of the securities markets on which the Funds’ securities primarily trade but before the time as of which the Funds calculate their net asset values. In instances where the investment adviser believes that the prices received from the independent pricing service are unreliable, proprietary valuation models may be used that consider benchmark yield curves, estimated default rates, coupon rates, anticipated timing of principal repayments and other unique security features to estimate the relevant cash flows, which are discounted to calculate the fair values. Fair valued securities will be classified as Level 2 or 3 within the fair value hierarchy (see below), depending on the inputs used.
The Board approves the independent pricing services used by the Funds.
GAAP establishes a single authoritative definition of fair value, sets out a framework for measuring fair value and requires disclosures about fair value measurements.
Various inputs are used in determining the value of each Fund’s investments. These inputs are summarized in the three broad levels listed below:
| | ● | Level 1 – quoted unadjusted prices for identical instruments in active markets to which the Fund has access at the date of measurement. |
| | ● | Level 2 – quoted prices for similar instruments in active markets; quoted prices for identical or similar instruments in markets that are not active; and model derived valuations in which all significant inputs and significant value drivers are observable. Level 2 inputs are those |
36
THE CUTLER TRUST
NOTES TO FINANCIAL STATEMENTS (Continued)
in markets for which there are few transactions, the prices are not current, little public information exists or instances where prices vary substantially over time or among brokered market makers.
| | ● | Level 3 – model derived valuations in which one or more significant inputs or significant value drivers are unobservable. Unobservable inputs are those inputs that reflect the Fund’s own assumptions that market participants would use to price the asset or liability based on the best available information. |
Fixed income securities other than certain interest-only mortgage-backed securities held by Cutler Fixed Income Fund are classified as Level 2 since the values for the fixed income securities are based on prices that utilize various “other significant observable inputs” including bid and ask quotations, prices of similar securities and interest rates, among other factors. Certain interest-only mortgage-backed securities held by Cutler Fixed Income Fund are classified as Level 3 since the values for these securities are based on prices derived from models that utilize one or more significant inputs that are unobservable, including an assumed constant prepayment rate, among other factors.
Securities of Cutler Emerging Markets Fund traded in foreign markets may be classified as Level 2 despite the availability of closing prices because such securities are typically fair valued by an independent pricing service approved by the Board. These foreign securities may be priced at their fair value because the value of the securities may be materially affected by events occurring before the Fund’s pricing time but after the close of the primary markets or exchanges on which such foreign securities are traded. These intervening events might be country-specific (e.g., natural disaster, economic or political developments, interest rate change); issuer-specific (e.g., earnings report, merger announcement); or U.S. markets-specific (such as a significant movement in the U.S. markets that is deemed to affect the value of foreign securities). The pricing service uses an automated system incorporating a model based on multiple parameters, including a security’s local closing price, relevant general and sector indices, currency fluctuations, trading in depositary receipts and futures, if applicable, and/or research valuations by its staff, in determining what it believes is the fair value of the securities.
The inputs or methodology used for valuing securities are not necessarily an indication of the risks associated with investing in those securities. The inputs used to measure fair value may fall into different levels of the fair value hierarchy. In such cases, for disclosure purposes, the level in the fair value hierarchy within which the fair value measurement falls in its entirety is determined based on the lowest level input that is significant to the fair value measurement.
37
THE CUTLER TRUST
NOTES TO FINANCIAL STATEMENTS (Continued)
The following is a summary of the inputs used to value each Fund’s investments as of June 30, 2016 by security type:
Cutler Equity Fund | | Level 1 | | | Level 2 | | | Level 3 | | | Total | |
Common Stocks | | $ | 126,331,373 | | | $ | — | | | $ | — | | | $ | 126,331,373 | |
Money Market Funds | | | 5,725,038 | | | | — | | | | — | | | | 5,725,038 | |
Total | | $ | 132,056,411 | | | $ | — | | | $ | — | | | $ | 132,056,411 | |
Cutler Fixed Income Fund | | Level 1 | | | Level 2 | | | Level 3 | | | Total | |
U.S. Treasury Obligations | | $ | — | | | $ | 1,320,704 | | | $ | — | | | $ | 1,320,704 | |
U.S. Government Agency Obligations | | | — | | | | 1,953,187 | | | | — | | | | 1,953,187 | |
Mortgage-Backed Securities | | | — | | | | 6,209,568 | | | | 6,853,392 | | | | 13,062,960 | |
Corporate Bonds | | | — | | | | 398,972 | | | | — | | | | 398,972 | |
Money Market Funds | | | 1,147,202 | | | | — | | | | — | | | | 1,147,202 | |
Total | | $ | 1,147,202 | | | $ | 9,882,431 | | | $ | 6,853,392 | | | $ | 17,883,025 | |
Cutler Emerging Markets Fund | | Level 1 | | | Level 2 | | | Level 3 | | | Total | |
Common Stocks | | $ | 3,021,986 | | | $ | 3,672,220 | | | $ | — | | | $ | 6,694,206 | |
Exchange-Traded Funds | | | 742,732 | | | | — | | | | — | | | | 742,732 | |
Exchange-Traded Notes | | | 197,427 | | | | — | | | | — | | | | 197,427 | |
Rights | | | — | | | | 3,249 | | | | — | | | | 3,249 | |
Money Market Funds | | | 483,769 | | | | — | | | | — | | | | 483,769 | |
Total | | $ | 4,445,914 | | | $ | 3,675,469 | | | $ | — | | | $ | 8,121,383 | |
Refer to each Fund’s Schedule of Investments for a listing of the securities by security type and sector or industry type. It is the Funds’ policy to recognize transfers into and out of any Level at the end of the reporting period. As of June 30, 2016, Cutler Equity Fund and Cutler Emerging Markets Fund did not have any transfers into and out of any Level.
There were no Level 3 securities held by Cutler Equity Fund and Cutler Emerging Markets Fund as of June 30, 2016.
38
THE CUTLER TRUST
NOTES TO FINANCIAL STATEMENTS (Continued)
The following is a reconciliation of Level 3 investments of Cutler Fixed Income Fund for which significant unobservable inputs were used to determine fair value between June 30, 2015 and June 30, 2016.
| | Cutler Fixed Income Fund | |
Balance as of June 30, 2015 | | $ | 3,670,488 | |
Transfers into and/or out of Level 3 | | | 672,330 | |
Purchases | | | 6,061,025 | |
Sales | | | (1,187,602 | ) |
Realized gains | | | 130,052 | |
Amortization of bond premium | | | (2,031,196 | ) |
Net change in unrealized appreciation (depreciation) | | | (461,705 | ) |
Balance as of June 30, 2016 | | $ | 6,853,392 | |
The total amount of unrealized depreciation on Level 3 instruments was $160,777 at June 30, 2016.
The following table summarizes the valuation techniques used and unobservable inputs developed by the Valuation Committee, which is overseen by the Board, to determine the fair value of the Level 3 investments.
| | Fair
Value at
June 30,
2016 | | Valuation Technique | Unobservable Input | | Range | | | Weighted Average of Unobservable Inputs | |
Mortgage-Backed Securities | | $ | 6,853,392 | | Comprehensive pricing model with emphasis on discounted cash flows | Constant prepayment rate | | | 0-100 | | | | 25.47 | |
There were no derivative instruments held by the Funds during the period ended or as of June 30, 2016.
Share valuation — The net asset value per share of each Fund is calculated daily by dividing the total value of its assets, less liabilities, by the number of shares outstanding. The offering price and redemption price per share of each Fund is equal to its net asset value per share.
Common Expenses — Expenses of the Trust not attributable solely to one of the Funds are allocated among the Funds based on relative net assets of each Fund or the nature of the expense and the relative applicability to each Fund.
39
THE CUTLER TRUST
NOTES TO FINANCIAL STATEMENTS (Continued)
Estimates — The preparation of financial statements in conformity with GAAP requires management to make estimates and assumptions that affect the reported amounts of assets and liabilities and disclosures of contingent assets and liabilities at the date of the financial statements and the reported amounts of increases and decreases in net assets from operations during the reporting period. Actual results could differ from those estimates.
Security Transactions, Investment Income and Realized Gains and Losses — Security transactions are accounted for on trade date. Dividend income is recorded on the ex-dividend date. Interest income is recorded as earned. Discounts and premiums on fixed income securities are amortized using the effective interest method. Realized gains and losses on securities sold are determined on a specific identification basis. Withholding taxes on foreign dividends have been recorded in accordance with the Funds’ understanding of the applicable country’s tax rules and rates.
Distributions to Shareholders — Distributions to shareholders of net investment income, if any, are declared and paid quarterly to shareholders of Cutler Equity Fund and Cutler Income Fund and are declared and paid annually to shareholders of Cutler Emerging Markets Fund. Capital gain distributions, if any, are distributed to shareholders annually. Distributions are based on amounts calculated in accordance with applicable federal income tax regulations, which may differ from GAAP. These differences are due primarily to differing treatments of income and gains on various investment securities held by the Funds, timing differences and differing characterizations of distributions made by the Funds. Dividends and distributions are recorded on the ex-dividend date. The tax character of distributions paid by the Funds during the years and period ended June 30, 2016 and June 30, 2015 was as follows:
| Year
Ended | | Ordinary Income | | | Long-Term Capital Gains | | | Total Distributions | |
Cutler Equity Fund | 6/30/2016 | | $ | 2,076,985 | | | $ | 5,633,681 | | | $ | 7,710,666 | |
| 6/30/2015 | | $ | 1,763,636 | | | $ | 2,012,254 | | | $ | 3,775,890 | |
| Year
Ended | | Ordinary Income | | | Long-Term Capital Gains | | | Total Distributions | |
Cutler Fixed Income Fund | 6/30/2016 | | $ | 1,372,984 | | | $ | — | | | $ | 1,372,984 | |
| 6/30/2015 | | $ | 316,510 | | | $ | — | | | $ | 316,510 | |
| Period
Ended | | Ordinary Income | | | Long-Term Capital Gains | | | Total Distributions | |
Cutler Emerging Markets Fund | 6/30/2016 | | $ | 53,424 | | | $ | — | | | $ | 53,424 | |
40
THE CUTLER TRUST
NOTES TO FINANCIAL STATEMENTS (Continued)
Federal income tax — Each Fund has qualified and intends to continue to qualify each year as a “regulated investment company” under Subchapter M of the Internal Revenue Code of 1986 (the “Code”). By so qualifying, the Funds will not be subject to federal income taxes to the extent that they distribute their net investment income and any net realized capital gains in accordance with the Code.
In order to avoid imposition of the excise tax applicable to regulated investment companies, it is also each Fund’s intention to declare as dividends in each calendar year at least 98% of its net investment income (earned during the calendar year) and 98.2% of its net realized capital gains (earned during the twelve months ended October 31) plus undistributed amounts from prior years.
The following information is computed on a tax basis for each item as of June 30, 2016:
| | Cutler Equity Fund | | | Cutler Fixed Income Fund | | | Cutler Emerging
Markets Fund | |
Tax cost of portfolio investments | | $ | 96,835,874 | | | $ | 19,325,220 | | | $ | 8,168,487 | |
Gross unrealized appreciation | | $ | 37,468,892 | | | $ | 1,016,722 | | | $ | 509,567 | |
Gross unrealized depreciation | | | (2,248,355 | ) | | | (2,458,917 | ) | | | (556,671 | ) |
Net unrealized appreciation (depreciation) on investments | | | 35,220,537 | | | | (1,442,195 | ) | | | (47,104 | ) |
Net unrealized appreciation of assets and liabilities in foreign currencies | | | — | | | | — | | | | 36 | |
Undistributed ordinary income | | | 88,817 | | | | 780,262 | | | | 44,291 | |
Undistributed long-term gains | | | 1,317,706 | | | | — | | | | — | |
Accumulated capital and other losses | | | (2,028,641 | ) | | | (52,418 | ) | | | (66,777 | ) |
Other temporary differences | | | (7,139 | ) | | | (10,518 | ) | | | — | |
Accumulated earnings (deficit) | | $ | 34,591,280 | | | $ | (724,869 | ) | | $ | (69,554 | ) |
The difference between the federal income tax cost of portfolio investments and the financial statement cost for each Fund is due to certain differences in the recognition of capital gains and losses under income tax regulations and GAAP. These “book/tax” differences are temporary in nature and are related to losses deferred due to wash sales for Cutler Equity Fund, amortization of bond premiums and discounts for Cutler Fixed Income Fund, losses deferred due to wash sales and holdings classified as passive foreign investment companies (PFICs) for Cutler Emerging Markets Fund.
For the year ended June 30, 2016, Cutler Fixed Income Fund reclassified $189,390 of distributions in excess of net investment income against accumulated net realized losses from security transactions on the Statements of Assets and Liabilities. For the period ended June 30, 2016, Cutler Emerging Markets Fund reclassified $14,522 of net realized losses on foreign
41
THE CUTLER TRUST
NOTES TO FINANCIAL STATEMENTS (Continued)
currency transactions against accumulated net investment income on the Statements of Assets and Liabilities. Such reclassifications, the result of permanent differences between financial statement and income tax reporting requirements, have no effect on each Fund’s net assets or net asset value per share.
During the year ended June 30, 2016, Cutler Equity Fund and Cutler Fixed Income Fund utilized $1,299,264 and $50,017, respectively, of capital loss carryforwards to offset current year gains.
As of June 30, 2016, Cutler Equity Fund had short-term capital loss carryforwards of $2,028,641 (with a maximum amount of $1,299,264 available in each year) which expire on June 30, 2018. As of June 30, 2016, Cutler Fixed Income Fund had short-term capital loss carryforwards, with no expiration date, of $52,418. As of June 30, 2016, Cutler Emerging Markets Fund had short-term capital loss carryforwards, with no expiration date, of $18,381. Net qualified late year losses include post-October capital losses, which are incurred after October 31, 2015 and within a Fund’s taxable year, and are deemed to arise on the first day of the Fund’s next taxable year. For the period ended June 30, 2016, Cutler Emerging Markets Fund intends to defer to July 1, 2016 for federal tax purposes qualified late year capital losses of $48,396. These capital loss carryforwards and late year losses may be utilized in future years to offset net realized capital gains, if any, prior to distributing such gains to shareholders.
The Funds recognize the tax benefits or expenses of uncertain tax positions only when the position is “more-likely-than-not” to be sustained assuming examination by tax authorities. Management has reviewed the tax positions taken on Federal income tax returns for all open tax years (tax years ended June 30, 2013 through June 30, 2016 for Cutler Equity Fund and Cutler Fixed Income Fund and June 30, 2016 for Cutler Emerging Markets Fund) and has concluded that no provision for unrecognized tax benefits or expenses is required in these financial statements.
3. Transactions with Related Parties
Investment Adviser — Cutler Investment Counsel, LLC (the “Adviser”) is the investment adviser to the Funds. Pursuant to an Investment Advisory Agreement, Cutler Equity Fund, Cutler Fixed Income Fund and Cutler Emerging Markets Fund pay the Adviser a fee, which is accrued daily and paid monthly, at an annual rate of 0.75%, 0.50% and 0.85%, respectively, of average daily net assets.
The Adviser has entered into an Expense Limitation Agreement under which it has contractually agreed, until November 1, 2016, to reduce its advisory fees and to pay the ordinary operating expenses of Cutler Equity Fund and Cutler Emerging Markets Fund to the extent necessary to limit annual ordinary operating expenses to 1.15% and 1.55%, respectively, of average daily net assets. (Ordinary operating expenses exclude brokerage costs, taxes, interest, acquired fund fees and expenses and extraordinary expenses.) Any such fee reductions by the Adviser, or payments by the Adviser of expenses which are the Funds’ obligation, are subject to repayment by the Funds, provided that the repayment does not cause the ordinary operating expenses of Cutler
42
THE CUTLER TRUST
NOTES TO FINANCIAL STATEMENTS (Continued)
Equity Fund and Cutler Emerging Markets Fund to exceed the annual expense limit of 1.15% and 1.55%, respectively, and provided further that the fees and expenses which are the subject of the repayment were incurred within three years of the repayment. During the period ended June 30, 2016, the Adviser reduced its advisory fees and/or reimbursed expenses in the amount of $4,100 and $122,966 with respect to Cutler Equity Fund and Cutler Emerging Markets Fund, respectively.
As of June 30, 2016, the amount of fee reductions and expense reimbursements available for recovery by the Adviser from Cutler Equity Fund and Cutler Emerging Markets Fund is $4,100 and $122,966, respectively. The Adviser may recover these amounts no later than June 30, 2019.
Certain officers of the Trust are also officers of the Adviser.
Other Service Providers — Ultimus Fund Solutions, LLC (“Ultimus”) provides fund administration, fund accounting and transfer agency services to the Funds. Each Fund pays Ultimus fees in accordance with the agreements for such services. In addition, the Funds pay out-of-pocket expenses including, but not limited to postage, supplies and costs of pricing the Funds’ portfolio securities. Certain officers of the Trust are also officers of Ultimus, or of Ultimus Fund Distributors, LLC (the “Distributor”), the principal underwriter of the Funds. The Distributor is a wholly-owned subsidiary of Ultimus.
Shareholder Service Plan — Each Fund may pay shareholder servicing fees not to exceed an annual rate of 0.25% of its average daily net assets. These fees may be paid to various financial institutions that provide shareholder and account maintenance services. During the year ended June 30, 2016, Cutler Equity Fund, Cutler Fixed Income Fund and Cutler Emerging Markets Fund paid $136,941, $0 and $0, respectively, for such services.
Compensation of Trustees — Trustees and officers affiliated with the Adviser or Ultimus are not compensated by the Trust for their services. Each Trustee who is not an affiliated person of the Adviser or Ultimus receives from the Trust an annual retainer of $7,500, payable quarterly, plus a fee of $1,250 for attendance at each meeting of the Board, in addition to reimbursement of travel and other expenses incurred in attending the meetings.
4. Securities Transactions
During the period ended June 30, 2016, cost of purchases and proceeds from sales and maturities of investment securities, other than short-term investments and U.S. government securities, totaled $14,278,165 and $13,204,534, respectively, for Cutler Equity Fund; $16,595,401 and $11,700,976, respectively, for Cutler Fixed Income Fund; and $8,295,421 and $568,272, respectively, for Cutler Emerging Markets Fund.
43
THE CUTLER TRUST
NOTES TO FINANCIAL STATEMENTS (Continued)
5. Contingencies and Commitments
The Funds indemnify the Trust’s officers and Trustees for certain liabilities that might arise from their performance of their duties to the Funds. Additionally, in the normal course of business the Funds enter into contracts that contain a variety of representations and warranties and which provide general indemnifications. The Funds’ maximum exposure under these arrangements is unknown, as this would involve future claims that may be made against the Funds that have not yet occurred. However, based on experience, the Funds expect the risk of loss to be remote.
6. Risks Associated with Mortgage-Backed Securities
Cutler Fixed Income Fund invests in mortgage-backed securities, which are subject to default risk and prepayment risk, especially when interest rates decline. Prepayment risk is the risk that the principal on mortgage-backed securities, other asset-backed securities or any fixed-income security with an embedded call option may be prepaid at any time, which could reduce yield and market value. This could reduce the effective maturity of a mortgage-backed security and cause the Fund to reinvest its assets at a lower prevailing interest rate. Mortgage-backed securities are also subject to extension risk, which is the risk that rising interest rates will increase the effective maturity of mortgage-backed securities due to the deceleration of prepayments. Mortgage-backed securities may also be subject to risks unique to the housing industry, including mortgage lending practices, defaults, foreclosures and changes in real estate values. As of June 30, 2016, Cutler Fixed Income Fund had 71.4% of the value of its net assets invested in mortgage-backed securities.
Stripped Mortgage-Backed Securities (“SMBS”) are derivative multi-class mortgage-backed securities. SMBS are usually structured with two classes that receive different proportions of the interest and principal distributions on a pool of mortgage assets. An SMBS will have one class that will receive all of the interest (the interest-only or “IO” class), while the other class will receive the entire principal (the principal-only or “PO” class). IOs are more volatile and sensitive to the rate of prepayments than other types of mortgage-backed securities, and their value can fall dramatically in response to rapid or unexpected changes in the mortgage, interest rate or economic environment. As of June 30, 2016, 66.6% of Cutler Fixed Income Fund’s net assets were invested in IO classes of various SMBS. Payments received for IOs are included in interest income on the Statements of Operations. Because no principal will be received at the maturity of an IO, adjustments are made to the cost of the security on a monthly basis until maturity. These adjustments are included in interest income on the Statements of Operations. Additionally, any prepayment penalties received for an IO are included in interest income on the Statements of Operations. During the year ended June 30, 2016, $1,189,322 of prepayment penalties on IOs were received by Cutler Fixed Income Fund.
44
THE CUTLER TRUST
NOTES TO FINANCIAL STATEMENTS (Continued)
7. Risks Associated with Emerging Markets
In seeking to meet its investment objective, under normal conditions, at least 80% of Cutler Emerging Markets Fund’s assets will be invested in a diversified portfolio of securities of issuers whose principal activities are in, or economically tied to, emerging markets countries selected in accordance with the Adviser’s long standing dividend focused investment philosophy. Accordingly, Cutler Emerging Markets Fund is subject to the following investment risks:
Foreign Investment Risk — Investments in foreign securities involve different risks than U.S. investments, including fluctuations in currency exchange rates, potentially unstable political and economic structures, less efficient trade settlement practices, reduced availability of public information, and lack of uniform financial reporting and regulatory practices similar to those that apply to U.S. issuers. Foreign stock markets may also be less liquid and more volatile than U.S. stock markets.
Emerging Markets Risk — The economies of emerging market countries may be more dependent on relatively few industries that may be highly vulnerable to local and global changes. The governments of emerging market countries may be less stable than the governments of more developed countries. Countries in the emerging markets generally have less developed securities markets or exchanges, and less developed legal and accounting systems, reduced availability of public information, and lack of uniform financial reporting and regulatory practices, which in turn may adversely impact the Emerging Markets Fund’s ability to calculate accurately the intrinsic value of the securities. Securities of emerging market companies may be less liquid and more volatile than securities in countries with more mature markets. The value of emerging market currencies may fluctuate more than the currencies of countries with more mature markets. Investments in emerging market countries may be subject to greater risks of government restrictions, including confiscatory taxation, expropriation or nationalization of a company’s assets, restrictions on foreign ownership of local companies and restrictions on withdrawing assets from the country. Investments in securities of issuers in emerging market countries may be considered speculative and higher risk.
Currency Risk — Because the Emerging Markets Fund holds securities valued in foreign currencies and holds foreign currencies when it purchases and sells foreign securities, changes in exchange rates will impact the value of the Fund’s assets. Thus, investments in foreign securities involve currency risk, which is the risk that the values of the foreign securities and other assets denominated in foreign currencies will decrease due to adverse changes in the value of the U.S. dollar relative to the value of foreign currencies.
45
THE CUTLER TRUST
NOTES TO FINANCIAL STATEMENTS (Continued)
8. Subsequent Events
The Funds are required to recognize in the financial statements the effects of all subsequent events that provide additional evidence about conditions that existed as of the date of the Statements of Assets and Liabilities. For non-recognized subsequent events that must be disclosed to keep the financial statements from being misleading, the Funds are required to disclose the nature of the event as well as an estimate of its financial effect, or a statement that such an estimate cannot be made. Management has evaluated subsequent events through the issuance of these financial statements and has noted no such events.
46
THE CUTLER TRUST
REPORT OF INDEPENDENT REGISTERED PUBLIC ACCOUNTING FIRM
To the Board of Trustees of The Cutler Trust
and the Shareholders of the Cutler Equity Fund,
the Cutler Fixed Income Fund and the Cutler Emerging Markets Fund
We have audited the accompanying statement of assets and liabilities of the Cutler Equity Fund, a series of shares of beneficial interest in The Cutler Trust, including the schedule of investments, as of June 30, 2016, and the related statements of operations for the year then ended, the statements of changes in net assets for each of the years in the two-year period then ended and the financial highlights for each of the years in the five-year period then ended. We have also audited the accompanying statement of assets and liabilities of the Cutler Fixed Income Fund, a series of shares of beneficial interest in The Cutler Trust, including the schedule of investments, as of June 30, 2016, and the related statement of operations for the year then ended, the statements of changes in net assets for each of the years in the two-year period then ended and the financial highlights for each of the three years in the period ended June 30, 2016, for the nine months ended June 30, 2013 and for each of the two years in the period ended September 30, 2012. We have also audited the accompanying statement of assets and liabilities of the Cutler Emerging Markets Fund, a series of shares of beneficial interest in The Cutler Trust, including the schedule of investments, as of June 30, 2016, and the related statements of operations, changes in net assets and financial highlights for the period from July 2, 2015 (commencement of operations) to June 30, 2016. These financial statements and financial highlights are the responsibility of the Funds’ management. Our responsibility is to express an opinion on these financial statements and financial highlights based on our audits.
We conducted our audits in accordance with the standards of the Public Company Accounting Oversight Board (United States). Those standards require that we plan and perform the audits to obtain reasonable assurance about whether the financial statements and financial highlights are free of material misstatement. An audit includes examining, on a test basis, evidence supporting the amounts and disclosures in the financial statements. Our procedures included confirmation of securities owned as of June 30, 2016 by correspondence with the custodian and brokers. An audit also includes assessing the accounting principles used and significant estimates made by management, as well as evaluating the overall financial statement presentation. We believe that our audits provide a reasonable basis for our opinion.
In our opinion, the financial statements and financial highlights referred to above present fairly, in all material respects, the financial position of the Cutler Equity Fund, the Cutler Fixed Income Fund, and the Cutler Emerging Markets Fund as of June 30, 2016, and the results of their operations for the year and period then ended, and the changes in their net assets and financial highlights for the years or periods presented, in conformity with accounting principles generally accepted in the United States of America.
As explained in Note 2, the financial statements of Cutler Fixed Income Fund include investments valued at $6,853,392 (37.5% of net assets), whose fair value have been estimated under procedures established by the Board of Trustees in the absence of readily ascertainable fair values. Our opinion is not modified with respect to this matter.
| | 
|
| | BBD, LLP |
Philadelphia, Pennsylvania
August 29, 2016
47
THE CUTLER TRUST
ABOUT YOUR FUND’S EXPENSES (Unaudited)
We believe it is important for you to understand the impact of costs on your investment. All mutual funds have operating expenses. As a shareholder of the Funds, you incur ongoing costs, including management fees and other operating expenses. These ongoing costs, which are deducted from each Fund’s gross income, directly reduce the investment return of the Funds.
A mutual fund’s ongoing costs are expressed as a percentage of its average net assets. This figure is known as the expense ratio. The following examples are intended to help you understand the ongoing costs (in dollars) of investing in the Funds and to compare these costs with the ongoing costs of investing in other mutual funds. The examples below are based on an investment of $1,000 made at the beginning of the period shown and held for the entire period (January 1, 2016 through June 30, 2016).
The table below illustrates each Fund’s ongoing costs in two ways:
Actual fund return – This section helps you to estimate the actual expenses that you paid over the period. The “Ending Account Value” shown is derived from each Fund’s actual return, and the fourth column shows the dollar amount of operating expenses that would have been paid by an investor who started with $1,000 in the Funds. You may use the information here, together with the amount you invested, to estimate the expenses that you paid over the period.
To do so, simply divide your account value by $1,000 (for example, an $8,600 account value divided by $1,000 = 8.6), then multiply the result by the number given for the Funds under the heading “Expenses Paid During Period.”
Hypothetical 5% return – This section is intended to help you compare the Funds’ ongoing costs with those of other mutual funds. It assumes that each Fund had an annual return of 5% before expenses during the period shown, but that the expense ratio is unchanged. In this case, because the returns used are not the Funds’ actual returns, the results do not apply to your investment. The example is useful in making comparisons because the Securities and Exchange Commission (“SEC”) requires all mutual funds to calculate expenses based on a 5% return. You can assess each Fund’s ongoing costs by comparing this hypothetical example with the hypothetical examples that appear in shareholder reports of other funds.
Note that expenses shown in the table are meant to highlight and help you compare ongoing costs only. The Funds do not charge transaction fees, such as purchase or redemption fees, nor do they impose any sales loads.
The calculations assume no shares were bought or sold during the period. Your actual costs may have been higher or lower, depending on the amount of your investment and the timing of any purchases or redemptions.
More information about the Funds’ expenses, including annual expense ratios for the past five fiscal years, can be found in this report. For additional information on operating expenses and other shareholder costs, please refer to each Fund’s prospectus.
48
THE CUTLER TRUST
ABOUT YOUR FUND’S EXPENSES (Unaudited) (Continued)
| Beginning
Account Value
January 1,
2016 | Ending
Account Value
June 30,
2016 | Net
Expense
Ratio (a) | Expenses
Paid During Period (b) |
Cutler Equity Fund | | | | |
Based on Actual Fund Return | $ 1,000.00 | $ 1,075.70 | 1.14% | $ 5.88 |
Based on Hypothetical 5% Return (before expenses) | $ 1,000.00 | $ 1,019.19 | 1.14% | $ 5.72 |
Cutler Fixed Income Fund |
Based on Actual Fund Return | $ 1,000.00 | $ 1,063.60 | 1.35% | $ 6.93 |
Based on Hypothetical 5% Return (before expenses) | $ 1,000.00 | $ 1,018.15 | 1.35% | $ 6.77 |
Cutler Emerging Markets Fund |
Based on Actual Fund Return | $ 1,000.00 | $ 1,037.10 | 1.55% | $ 7.85 |
Based on Hypothetical 5% Return (before expenses) | $ 1,000.00 | $ 1,017.16 | 1.55% | $ 7.77 |
(a) | Annualized, based on the Fund’s most recent one-half year expenses. |
(b) | Expenses are equal to the Fund’s annualized net expense ratio multiplied by the average account value over the period, multiplied by 182/366 (to reflect the one-half year period). |
FEDERAL TAX INFORMATION (Unaudited)
For the fiscal year ended June 30, 2016, certain dividends paid by the Funds may be subject to a maximum tax rate of 23.8%, as provided by the Jobs and Growth Tax Relief Reconciliation Act of 2003. Cutler Equity Fund, Cutler Fixed Income Fund and Cutler Emerging Markets Fund intend to designate up to a maximum amount of $2,076,985, $1,372,984 and $53,424, respectively, as taxed at a maximum rate of 23.8%. Additionally, Cutler Equity Fund intends to designate $5,633,681 as long-term capital gain distributions. For the fiscal year ended June 30, 2016, 100% of the dividends paid from ordinary income by Cutler Equity Fund qualified for the dividends received deduction for corporations. Complete information will be computed and reported in conjunction with your 2016 Form 1099-DIV.
49
THE CUTLER TRUST
TRUSTEES AND OFFICERS OF THE TRUST
(Unaudited)
The Board of Trustees is responsible for managing the Trust’s business affairs and exercising all the Trust’s powers except those reserved for shareholders. The following tables give information about each Board member and the senior officers of the Funds. Each Trustee holds office until the person resigns, is removed, or is replaced. Officers are elected for an annual term. Unless otherwise noted, the Trustees and officers have held their principal occupations for more than five years. The Funds’ Statement of Additional Information includes additional information about the Trustees and is available, without charge and upon request, by calling 1-888-CUTLER4.
Name,
Date of Birth
and Address | Position
with the
Trust | Length
of Time
Served | Principal Occupation(s)
During Past 5 Years | Number of Portfolios in Fund Complex Overseen by Trustee | Other
Directorships
Held by
Trustee |
Interested Trustees |
Matthew C. Patten (a)
Born: December 1975
525 Bigham Knoll
Jacksonville, OR 97530 | Chairman/Trustee/Treasurer | Trustee Since 2006; Treasurer Since 2004 | Chief Executive Officer, Investment Committee Member and Portfolio Manager of Cutler Investment Counsel, LLC. | 3 | None |
Independent Trustees |
John P. Cooney
Born: January 1932
525 Bigham Knoll
Jacksonville, OR 97530 | Lead Independent Trustee | Since 2007 | Retired. | 3 | None |
Robert F. Turner
Born: June 1946
525 Bigham Knoll
Jacksonville, OR 97530 | Trustee | Since 2012 | Retired; Chairman of Jeld-Wen, Inc. (a manufacturing company) from 2010 to 2012. | 3 | None |
Edward T. Alter
Born: July 1941
525 Bigham Knoll
Jacksonville, OR 97530 | Trustee | Since 2013 | Retired. | 3 | None |
(a) | Matthew C. Patten is an “Interested Person,” as defined by the 1940 Act, because he is an affiliated person of the Adviser. |
50
THE CUTLER TRUST
TRUSTEES AND OFFICERS OF THE TRUST
(Unaudited) (Continued)
Name,
Date of Birth
and Address | Position with
the Trust | Length of
Time Served | Principal Occupation(s)
During Past 5 Years |
Senior Officers |
Erich M. Patten
Born: October 1977
525 Bigham Knoll
Jacksonville, OR 97530 | President | Since 2004 | Investment Committee Member, Portfolio Manager, and Chief Investment Officer of Cutler Investment Counsel, LLC. |
Brooke C. Ashland
Born: December 1951
525 Bigham Knoll
Jacksonville, OR 97530 | Vice President/ Chief Compliance Officer | Since 2002 | Investment Committee Member and Chair of Cutler Investment Counsel, LLC; Chief Executive Officer and President of Trustee Investment Services, Inc. (a Trustee education firm); President of Big Bear Timber, LLC (farming). |
Tina H. Bloom
Born: August 1968
225 Pictoria Drive
Suite 450
Cincinnati, OH 45246 | Secretary | Since 2011 | Director of Fund Administration of Ultimus Fund Solutions, LLC. |
Robert G. Dorsey
Born: April 1957
225 Pictoria Drive
Suite 450
Cincinnati, OH 45246 | Vice President | Since 2005 | Managing Director of Ultimus Fund Solutions, LLC and Ultimus Fund Distributors, LLC. |
51
THE CUTLER TRUST
ADDITIONAL INFORMATION (Unaudited)
Proxy Voting Information
A description of the policies and procedures that the Funds use to determine how to vote proxies relating to securities held in the Funds’ portfolios is available without charge, upon request, by calling 1-800-228-8537 or on the SEC’s website at http://www.sec.gov. Information regarding how the Funds voted proxies relating to portfolio securities during the most recent 12-month period ended June 30 is also available without charge upon request by calling 1-800-228-8537 or on the SEC’s website at http://www.sec.gov.
Form N-Q Information
The Trust files a complete listing of the Funds’ portfolio holdings with the SEC as of the end of the first and third quarters of each fiscal year on Form N-Q. The filings are available without charge, upon request, by calling 1-800-228-8537. Furthermore, you may obtain a copy of the filings on the SEC’s website at http://www.sec.gov. The Trust’s Forms N-Q may also be reviewed and copied at the SEC’s Public Reference Room in Washington, DC, and information on the operation of the Public Reference Room may be obtained by calling 1-800-SEC-0330.
52
THE CUTLER TRUST
APPROVAL OF INVESTMENT ADVISORY AGREEMENT
(Unaudited)
The Board of Trustees, including the Independent Trustees voting separately, has reviewed and approved the continuance of the Funds’ Investment Advisory Agreement (the “Agreement”) with the Adviser for an additional one year period. Approval took place at an in-person meeting held on April 18-19, 2016, at which all of the Trustees were present. The Independent Trustees were advised by their counsel of their fiduciary obligations in approving the Agreement and the Trustees requested such information from the Adviser as they deemed reasonably necessary to evaluate the terms of the Agreement and whether the Agreement continues to be in the best interests of each Fund and its shareholders. The Trustees reviewed: (i) the nature, extent and quality of the services provided by the Adviser; (ii) the investment performance of each Fund and the Adviser; (iii) the costs of the services provided and the profits realized by the Adviser from its relationship with the Funds; (iv) the extent to which economies of scale would be realized as the Funds grow; (v) whether fee levels reflect these economies of scale for the benefit of Fund investors; (vi) whether and how the board relied on comparisons of services to be rendered to and fees to be paid by the Funds with the services provided by and the fees paid to other investment advisers or the services provided to and the fees paid by other clients of the Adviser; and (vii) any benefits derived or to be derived by the Adviser from the relationship with the investment company, such as soft dollar arrangements by which brokers provide research to the Funds or the Adviser in return for allocating brokerage.
The Trustees reviewed the background, qualifications, education and experience of the Adviser’s investment and operational personnel. Management provided detailed information on its professional personnel, including each person’s area of responsibility. The Trustees also discussed and considered the quality of administrative and other services provided to the Funds, the Adviser’s and the Funds’ compliance programs, and the Adviser’s role in coordinating such services and programs. The Independent Trustees were advised by experienced independent counsel throughout the process.
The Adviser provided the Board with information to assist the Trustees in analyzing the performance of the Funds. Cutler Equity Fund’s returns over various periods ended December 31, 2015 were compared to the returns of S&P 500 Total Return Index and certain other relevant securities indices, comparable private accounts managed by the Adviser, and domestic equity funds in the Morningstar database of similar size with similar investment styles. These analyses and comparisons showed that Cutler Equity Fund has performed competitively over both the short and long term. The Trustees also considered the consistency of the Adviser’s management of the Equity Fund in accordance with its investment objective, strategy and policies. Based upon their review, the Trustees found that Cutler Equity Fund’s performance has been reasonable and competitive in relation to the returns of relevant securities indices and other similarly situated mutual funds.
The Trustees reviewed the performance of Cutler Fixed Income Fund over various periods ended December 31, 2015 as compared to the returns of the Barclays Intermediate U.S. Government/Credit Index and certain other relevant securities indices and U.S. intermediate term bond funds in
53
THE CUTLER TRUST
APPROVAL OF INVESTMENT ADVISORY AGREEMENT
(Unaudited) (Continued)
the Morningstar database of similar size with similar investment styles. Based upon their review, the Trustees concluded that Cutler Fixed Income Fund’s performance has been reasonable and competitive in relation to the returns of relevant securities indices and other similarly situated mutual funds.
The Trustees reviewed the performance of Cutler Emerging Markets Fund over various periods ended December 31, 2015 as compared to the returns of MSCI Emerging Markets Index and certain other relevant securities indices and emerging markets funds in the Morningstar database of similar size with similar investment styles. Based upon their review, the Trustees found that Cutler Emerging Markets Fund’s performance has been reasonable and competitive in relation to the returns of relevant securities indices and other similarly situated mutual funds.
In reviewing the advisory fee and total expense ratios of the Funds, the Trustees were provided with comparative expense and advisory fee information for other mutual funds of similar size and with similar investment styles. The Trustees noted Cutler Equity Fund currently pays an investment advisory fee computed at the annual rate of 0.75% of the Fund’s average daily net assets, Cutler Fixed Income Fund currently pays an investment advisory fee computed at the annual rate of 0.50% of the Fund’s average daily net assets and Cutler Emerging Markets Fund currently pays an investment advisory fee computed at the annual rate of 0.85% of the Fund’s average daily net assets. The Trustees took note of the fact that the contractual advisory fee of Cutler Equity Fund was higher than the average and median advisory fee for the Fund’s peer group and that the Fund’s net expense ratio was higher than the peer group average and median. The Trustees also noted that the Adviser contractually agreed to waive its management fees and pay Fund operating expenses to the extent necessary to limit annual fund operating expenses to 1.15% of Cutler Equity Fund’s average daily net assets until November 1, 2016 and had waived $12,544 in fees during the fiscal period ended December 31, 2015. The Trustees noted that Cutler Fixed Income Fund’s contractual advisory fee and net expense ratio were higher than the average for funds in its peer group. The Trustees also noted that the Emerging Markets Fund’s contractual advisory fee was lower than the average and median advisory fee for funds categorized by Morningstar as emerging markets funds of similar size with similar investment styles and that the Fund’s net expense ratio was higher than the average and median for funds in this peer group. The Trustees also noted that the Adviser contractually agreed to waive its advisory fees and pay operating expenses of the Emerging Markets Fund to the extent necessary to limit annual fund operating expenses to 1.55% of the Fund’s average daily net assets until November 1, 2016 and had waived $66,676 in fees during the fiscal period ended December 31, 2015.
The Trustees reviewed the Adviser’s current registration form (Form ADV) and its financial statement as well as an analysis prepared by the Adviser reflecting its revenues and expenses with respect to its services to Cutler Equity Fund and Cutler Fixed Income Fund for the years ended December 31, 2013, 2014 and 2015 and with respect to its services to Cutler Emerging Markets Fund for the period ended December 31, 2015. The Trustees noted that the Funds do not have any “soft dollar” arrangements with broker-dealers that would otherwise benefit the Adviser and considered any fall-out
54
THE CUTLER TRUST
APPROVAL OF INVESTMENT ADVISORY AGREEMENT
(Unaudited) (Continued)
benefits to the Adviser from managing the Funds. The Trustees also reviewed the Adviser’s marketing and distribution efforts on behalf of the Funds, a copy of the Advisory Agreement, purchase and redemption information for each Fund, the annual Code of Ethics Report from the Adviser and the Adviser’s Disaster Recovery and Contingency Plan, brokerage practices and insurance coverages.
Prior to voting, the Independent Trustees reviewed the proposed continuance of the Agreement with counsel in executive session. In approving the Agreement, the Independent Trustees reached the following conclusions: (1) based on the performance and risk characteristics of the Funds and the effectiveness of the Funds in achieving their stated objectives, the Adviser has provided high quality services; (2) the Adviser has the financial resources and personnel to continue to provide quality advisory services to the Funds; (3) the advisory fees paid by and the total expenses of each Fund are reasonable; and (4) the continuance of the Agreement is in the best interests of each Fund and its shareholders. The Independent Trustees also reviewed and considered the profitability of the Adviser with regards to its management of the Funds, concluding that the Adviser’s profitability was not excessive given the quality and scope of services provided by the Adviser and the overall investment performance of the Funds. The Independent Trustees further determined that, based on the Funds’ current asset levels, it would not be relevant to consider the extent to which economies of scale would be realized as the Funds grow, and whether fee levels reflect these economies of scale. Following further discussion, it was the consensus of the Independent Trustees that it is not appropriate to introduce fee breakpoints at the present time. The Trustees noted, however, that if a Fund grows significantly in assets, it may become necessary for the Adviser to consider adding fee breakpoints to the Agreement.
No single factor was considered in isolation or considered to be determinative to the decision of the Trustees to approve continuance of the Agreement. Rather, the Trustees concluded, in light of a weighing and balancing of all factors considered, that it would be in the best interests of the Funds and their shareholders to renew the Agreement for an additional annual period.
55
This page intentionally left blank.
This page intentionally left blank.
CUTLER INVESTMENT COUNSEL, LLC
INVESTMENT ADVISER TO THE TRUST
525 Bigham Knoll
Jacksonville, OR 97530
(800)228-8537 ● (541)770-9000
Fax:(541)779-0006
info@cutler.com
Item 2. Code of Ethics.
As of the end of the period covered by this report, the registrant has adopted a code of ethics that applies to the registrant’s principal executive officer, principal financial officer, principal accounting officer or controller, or persons performing similar functions, regardless of whether these individuals are employed by the registrant or a third party. Pursuant to Item 12(a)(1), a copy of registrant’s code of ethics is filed as an exhibit to this Form N-CSR. During the period covered by this report, the code of ethics has not been amended, and the registrant has not granted any waivers, including implicit waivers, from the provisions of the code of ethics.
Item 3. Audit Committee Financial Expert.
The registrant’s board of trustees has determined that the registrant has an audit committee financial expert serving on its audit committee. The name of the audit committee financial expert is Edward T. Alter. Mr. Alter is “independent” for purposes of this item.
Item 4. Principal Accountant Fees and Services.
No non-audit fees were billed by the registrant’s principal accountant in either of the last two fiscal years for services rendered to the registrant’s investment adviser (not including any sub-adviser whose role is primarily portfolio management and is subcontracted with or overseen by another investment adviser), and any entity controlling, controlled by, or under common control with the Adviser that provides ongoing services to the Trust.
Item 5. Audit Committee of Listed Registrants.
Item 6. Schedule of Investments.
Item 7. Disclosure of Proxy Voting Policies and Procedures for Closed-End Management Investment Companies.
Item 8. Portfolio Managers of Closed-End Management Investment Companies.
Item 9. Purchases of Equity Securities by Closed-End Management Investment Company and Affiliated Purchasers.
Item 10. Submission of Matters to a Vote of Security Holders.
The registrant has not adopted procedures by which shareholders may recommend nominees to the registrant’s board of trustees.
Item 11. Controls and Procedures.
(a) Based on their evaluation of the registrant’s disclosure controls and procedures (as defined in Rule 30a-3(c) under the Investment Company Act of 1940) as of a date within 90 days of the filing date of this report, the registrant’s principal executive officer and principal financial officer have concluded that such disclosure controls and procedures are reasonably designed and are operating effectively to ensure that material information relating to the registrant, including its consolidated subsidiaries, is made known to them by others within those entities, particularly during the period in which this report is being prepared, and that the information required in filings on Form N-CSR is recorded, processed, summarized, and reported on a timely basis.
(b) There were no changes in the registrant’s internal control over financial reporting (as defined in Rule 30a-3(d) under the Investment Company Act of 1940) that occurred during the second fiscal quarter of the period covered by this report that have materially affected, or are reasonably likely to materially affect, the registrant’s internal control over financial reporting.
Item 12. Exhibits.
File the exhibits listed below as part of this Form. Letter or number the exhibits in the sequence indicated.
(a)(1) Any code of ethics, or amendment thereto, that is the subject of the disclosure required by Item 2, to the extent that the registrant intends to satisfy the Item 2 requirements through filing of an exhibit: Attached hereto
(a)(2) A separate certification for each principal executive officer and principal financial officer of the registrant as required by Rule 30a-2(a) under the Act (17 CFR 270.30a-2(a)): Attached hereto
(a)(3) Any written solicitation to purchase securities under Rule 23c-1 under the Act (17 CFR 270.23c-1) sent or given during the period covered by the report by or on behalf of the registrant to 10 or more persons: Not applicable
(b) Certifications required by Rule 30a-2(b) under the Act (17 CFR 270.30a-2(b)): Attached hereto