| OMB APPROVAL |
OMB Number: 3235-0570
Expires: August 31, 2020
Estimated average burden hours per response: 20.6
|
UNITED STATES
SECURITIES AND EXCHANGE COMMISSION
Washington, D.C. 20549
FORM N-CSR
CERTIFIED SHAREHOLDER REPORT OF REGISTERED
MANAGEMENT INVESTMENT COMPANIES
| Investment Company Act file number | 811-07242 | |
| The Cutler Trust |
| (Exact name of registrant as specified in charter) |
| 525 Bigham Knoll Jacksonville, Oregon | 97530 |
| (Address of principal executive offices) | (Zip code) |
Matthew C. Patten
| Cutler Investment Counsel, LLC 525 Bigham Knoll Jacksonville, Oregon 97530 |
| (Name and address of agent for service) |
| Registrant's telephone number, including area code: | (541) 770-9000 | |
| Date of fiscal year end: | June 30 | |
| | | |
| Date of reporting period: | June 30, 2018 | |
Form N-CSR is to be used by management investment companies to file reports with the Commission not later than 10 days after the transmission to stockholders of any report that is required to be transmitted to stockholders under Rule 30e-1 under the Investment Company Act of 1940 (17 CFR 270.30e-1). The Commission may use the information provided on Form N-CSR in its regulatory, disclosure review, inspection, and policymaking roles.
A registrant is required to disclose the information specified by Form N-CSR, and the Commission will make this information public. A registrant is not required to respond to the collection of information contained in Form N-CSR unless the Form displays a currently valid Office of Management and Budget ("OMB") control number. Please direct comments concerning the accuracy of the information collection burden estimate and any suggestions for reducing the burden to the Secretary, Securities and Exchange Commission, 450 Fifth Street, NW, Washington, DC 20549-0609. The OMB has reviewed this collection of information under the clearance requirements of 44 U.S.C. § 3507.
Item 1. Reports to Stockholders.

| The Cutler Trust |
CUTLER EQUITY FUND
CUTLER FIXED INCOME FUND
CUTLER EMERGING MARKETS FUND
ANNUAL REPORT
June 30, 2018
THE CUTLER TRUST
TABLE OF CONTENTS
| | Page |
Letter to Shareholders | 2 |
Management Discussion of Fund Performance | 3 |
Performance Information | 9 |
Portfolio Information | 12 |
Schedules of Investments | 15 |
Statements of Assets and Liabilities | 27 |
Statements of Operations | 28 |
Statements of Changes in Net Assets | 29 |
Financial Highlights | 32 |
Notes to Financial Statements | 35 |
Report of Independent Registered Public Accounting Firm | 47 |
About Your Fund’s Expenses | 48 |
Federal Tax Information | 50 |
Trustees and Officers of the Trust | 51 |
Additional Information | 53 |
Approval of Investment Advisory Agreement | 54 |
1
THE CUTLER TRUST
LETTER TO SHAREHOLDERS
To The Cutler Funds Shareholders:
The enclosure represents the annual report to shareholders for the Cutler Trust for the fiscal year ended June 30, 2018. Should you have questions about any of the Cutler Funds after reading this report, we invite you to reach out and discuss your investments at your convenience.
This fiscal year can be conveniently separated into two-distinct halves. The first half was the continuation of an unprecedented bull market that began in 2009. Stocks rallied relentlessly throughout 2017, peaking in January of 2018. While the second half of the fiscal year was not a “bear market,” both Domestic Large Cap and Emerging Markets stocks experienced a correction of over 10% from the market peak. This is not surprising, given the normal ebb and flow of equities and the strength of the preceding rally.
While there may be continued market volatility, Cutler believes that equities are fairly valued today. Corporate earnings growth has been phenomenal, which we believe will ultimately guide equities higher. Investors, as always, need to remain focused on the long-term value of their portfolio holdings, and not the mid-cycle gyrations that often get the headlines.
For fixed income investors, this past year had slightly negative results. The Federal Reserve has continued to raise rates, and we have seen long-rates rise mildly. Rising rates represent a headwind for returns from bond portfolios. Cutler continues to navigate this trend with an eye toward income generation within our fixed income portfolio. We believe that inflation expectations remain anchored, providing some opportunities for investors to selectively extend maturities. Bonds remain the best “safe haven” investment for diversifying equity investor risks.
Thank you for your continued trust in Cutler.
Sincerely,

| 
|
Matthew C. Patten | Erich M. Patten |
Chairman | Chief Investment Officer |
The Cutler Trust | Cutler Investment Counsel, LLC |
Before investing you should carefully consider the Cutler Funds’ investment objectives, risks, charges and expenses. This and other information is in the prospectus, a copy of which may be obtained by calling 1-800-228-8537. Please read the prospectus carefully before you invest.
The views in this report were those of the Cutler Funds’ investment adviser as of June 30, 2018 and may not reflect its views on the date this report is first published or anytime thereafter. These views are intended to assist shareholders in understanding their investment in the Cutler Funds and do not constitute investment advice.
2
CUTLER EQUITY FUND
MANAGEMENT DISCUSSION OF FUND PERFORMANCE
1) | How did the Equity Fund perform last year? |
The Cutler Equity Fund has a net return of 10.63% for the fiscal year ended June 30, 2018.
2) | What were the most significant market factors affecting the Fund’s performance during the past year? |
Market factors included:
| | 1) | Continued low interest rate environment |
| | 2) | Strong performance of growth stocks |
3) | Why did the Fund underperform relative to the benchmark? |
The market continues to favor growth stocks versus value stocks, and Cutler’s investment strategy is biased toward value. The S&P 500 TR had a return of 14.37% (net) during the fiscal year. Cutler outperformed the Russell 1000 Value TR, which returned 6.77% (net) during the year. The Russell 1000 Value represents an appropriate benchmark for the Fund during times of extreme market bi-furcation.
4) | What strategies did you use to manage the Fund? |
Cutler’s investment process focuses on dividends as the primary driver of investment returns. The strategy was unchanged in the previous year, and the management of the Equity Fund was consistent with previous years. We look for holdings in the portfolio that maintain a 10-year record of consistent dividend payments and typically have a total market capitalization of at least $10 billion. We seek relative value as compared to other companies in similar industries. The strategy is further detailed in the Equity Fund’s prospectus.
5) | What were the primary strategic factors that guided your management of the Fund? |
Cutler’s dividend criteria have been the primary strategic factors used in managing the Equity Fund this past year. For example, Cutler looks for companies that have at least a 10-year history of maintaining or increasing dividend. We believe this criterion results in a portfolio of companies with stable earnings and sound business models. In addition, the Equity Fund’s portfolio managers continue to focus on companies they believe offer attractive current yields and the potential for total return.
Portfolio turnover of the Fund remained low this past year at 10%. We have remained patient with our current holdings in a sustained bull market but are monitoring market developments closely that may necessitate a change in positioning.
3
CUTLER EQUITY FUND
MANAGEMENT DISCUSSION OF FUND PERFORMANCE
(Continued)
6) | What were some of the key trends in each of the regions/significant industries in which the Fund invests? |
The Equity Fund’s holdings remain 100% domiciled in the U.S., and the strategies employed do not have any additional regional bias. In certain cases, holdings may have legal registration outside of the U.S. but are considered domestic due to the locality of their operations.
The U.S. markets continued the bull market that was born from the financial crisis. As has been the trend, growth stocks had a very strong 12 months, with large cap growth being a notable asset class for investment.
Tax reform had a significant impact on corporate earnings as of January 1, 2018. Much of the late 2017 rally can be attributed to anticipated earnings growth through this change in corporate cost structure.
7) | Which securities helped the Fund’s performance? |
8) | Did any securities hurt the Fund’s performance? |
4
CUTLER FIXED INCOME FUND
MANAGEMENT DISCUSSION OF FUND PERFORMANCE
1) | How did the Fixed Income Fund perform last year? |
The Fixed Income Fund returned -0.59% for the fiscal year ended June 30, 2018.
2) | What were the most significant market factors affecting the Fixed Income Fund’s performance during the past year? |
Market factors included:
| | 2) | Fed funds rate increase by the Federal Reserve Board |
| | 3) | Continued compression of credit spreads |
3) | Explain the Fixed Income Fund’s performance relative to the benchmark. |
The Bloomberg Barclays Intermediate U.S. Government/Credit Index was down -0.58% during the fiscal year, materially performing in line with the Fund’s net return of -0.59%.
4) | What strategies did you use to manage the Fixed Income Fund? |
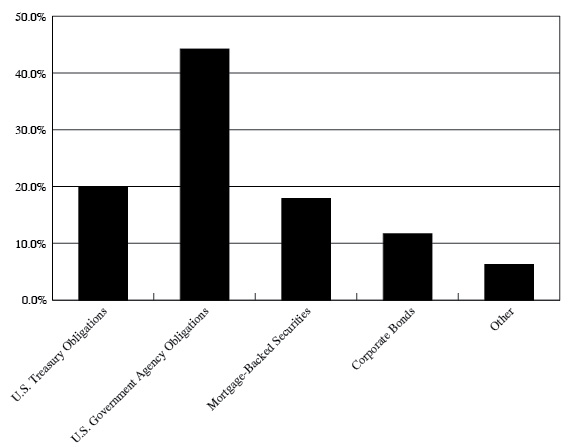
The Fixed Income Fund has been significantly underweight Corporates, with Agency holdings comprising the bulk of the market overweight at 44% of the total portfolio. This past year, we systematically reduced the CMBS exposure within the portfolio, which as of June 30th represents 17.9% of the portfolio. The CMBS proceeds were primarily allocated into select investment-grade corporate holdings, as well as the portfolio cash overweight.
The portfolio managers continue to recognize that spreads are very tight and want to manage the sector weighting with this bias in mind. Therefore, Agency and Treasury overweights are likely to continue, although the degree of the overweight may be subject to change.
5) | What were the primary strategic factors that guided your management of the Fixed Income Fund? |
Cutler continues to anticipate the Fed will raise rates, albeit the strength of rate rises should abate as the yield curve continues to flatten. The yield curve has been flattening since the end of 2013, not unusual when the Fed is in the midst of a tightening cycle and short-term rates are driven higher. As measured by the spread between the 2-year and 30-year U.S. Treasury, the yield curve was just 46 basis points at the end of the fiscal year, which is about 112 basis points flatter than where it stood twelve months earlier. This flattening has many investors concerned that the curve may eventually invert portending economic conditions more reflective of a recession.
5
CUTLER FIXED INCOME FUND
MANAGEMENT DISCUSSION OF FUND PERFORMANCE
(Continued)
Barring a change in economic conditions we expect to see the upward trend in short to medium term rates. This could flatten the curve even more unless something is to impact the long end, i.e., increased inflation expectations. This trend leaves the yield curve on the brink of an inversion. While not all inversions precede recessions, all recessions have had inverted yield curves precede them.
With this backdrop, our bias is to remain in quality and overweight the short-end of the curve. While this outlook is bullish for long-term Treasuries, we do not feel the risk vs. reward is attractive at the long end of the curve.
6) | What were some of the key trends in each of the regions/significant industries in which the Fixed Income Fund invests? |
The Fixed Income Fund is 100% domestic and does not invest into securities domiciled outside the U.S. While the Fund increased corporate holdings during the period, specific industry fundamentals do not have a meaningful role in the total positioning of the Fund. Instead, with a corporate underweight, the Fund’s positioning is largely influenced by the underlying economic fundamental. In this sense, the Fund is likely to underperform the benchmark during “risk on” economic environments, as lower quality credit positions continue to tighten vs. government bonds. The strong growth of the U.S. economy continues to support the corporate sector, as well as lower quality credit, which is a headwind for our preferred positioning. However, these sectors are also more susceptible to volatility or economic recession and investing at these levels must be done selectively.
7) | Which securities helped the Fixed Income Fund’s performance? |
| | a) | FNA 2013-M4 X1 3.912% 3/1/18 |
| | b) | FNA 2010-M3 X 0.464% 3/25/20 |
| | c) | FNMA Remic Trust 2015-M1 0.563% 9/25/24 |
8) | Did any securities hurt the Fixed Income Fund’s performance? |
| | a) | Bear Stearns CMBS 2005-Top 20 6.024% 10/12/42 |
| | b) | Federal Farm Credit 2.24% Due 7/6/27 |
| | c) | Federal Home Loan Banks 2.57% Due 10/6/31 |
6
CUTLER EMERGING MARKETS FUND
MANAGEMENT DISCUSSION OF FUND PERFORMANCE
1) | How did the Emerging Markets Fund perform last year? |
The Emerging Markets Fund returned 2.95% for the fiscal year ended June 30, 2018.
2) | What were the most significant market factors affecting the Emerging Markets Fund’s performance during the past year? |
The U.S. Federal Reserve has contributed to a dollar strengthening rally, which has a negative contribution to securities in foreign currency. In addition, market dynamics globally have mimicked the U.S.’ outperformance of growth and technology versus value.
3) | Explain the Emerging Markets Fund’s performance relative to the benchmark. |
The MSCI Emerging Markets Index returned 8.20% during the period. Given the large number of securities globally, we anticipate the portfolio will not closely track the index returns. However, the primary contributing factor to performance versus the benchmark is the underweight of Technology, with the Fund holding about 12% less in this strongly performing sector.
4) | What strategies did you use to manage the Emerging Markets Fund? |
Cutler utilizes a universe which we refer to as “The 15DU.” The 15DU consists of companies in the emerging markets index that have paid dividends for at least 14 of the last 15 years. The bulk of the portfolio is comprised of these securities. Additionally, Cutler uses ETFs to gain exposure to markets with less liquidity or as a way to provide trading liquidity for shareholder transactions. Further details on strategies are outlined in the Fund Prospectus.
5) | What were the primary strategic factors that guided your management of the Emerging Markets Fund? |
In combination with our economic outlook, Cutler considers geo-political risk when assessing our country weightings. In general, Cutler is biased against less stable political environments. Instead, we prefer to invest into faster growing economies with favorable demographic trends. Cutler believes that emerging markets investing should primarily be focused on consumer-based investment themes, not commodities. When possible, but not exclusively, we will look for 15DU securities that are exposed to a growing middle-class in countries and regions.
6) | What were some of the key trends in each of the regions/significant industries in which the Emerging Markets Fund invests? |
Emerging markets are diverse, yet global correlations exist that impact total portfolio performance. The most significant trend of the past year impacting Emerging Markets has been the strengthening U.S. dollar, which became especially prescient after the market peaked in
7
CUTLER EMERGING MARKETS FUND
MANAGEMENT DISCUSSION OF FUND PERFORMANCE
(Continued)
January. The strengthening dollar also impacts global commodity trends, which impact many emerging market economies that may be more dependent on commodity production for economic growth.
While the global economy continues to grow, 2018 has experience increased tensions, particularly with regards to trade. Emerging economies are particularly susceptible to trade impacts, as their dependency on developed countries is evident.
7) | Which securities helped the Emerging Markets Fund’s performance? |
| | b) | Tingyi (Cayman Islands) Holdings |
8) | Did any securities hurt the Emerging Markets Fund’s performance? |
| | c) | Coca-Cola Femsa S.A.B. de C.V. |
8
CUTLER EQUITY FUND
PERFORMANCE INFORMATION
June 30, 2018 (Unaudited)
Comparison of the Change in Value of a $10,000 Investment in
Cutler Equity Fund and S&P 500 Total Return Index

Average Annual Total Returns
(for periods ended June 30, 2018) |
| | 1 Year | 5 Years | 10 Years | |
Cutler Equity Fund(a) | 10.63% | 9.39% | 8.99% | |
S&P 500 Total Return Index(b) | 14.37% | 13.42% | 10.17% | |
| | | | | | |
(a) | Returns shown do not reflect the deduction of taxes a shareholder would pay on Fund distributions or the redemption of Fund shares. | |
(b) | The S&P 500 Total Return Index is a market capitalization weighted index that is widely used as a barometer of U.S. stock market performance. The index is unmanaged and shown for illustration purposes only. An investor cannot invest in an index and its returns are not indicative of the performance of any specific investment. | |
9
CUTLER FIXED INCOME FUND
PERFORMANCE INFORMATION
June 30, 2018 (Unaudited)
Comparison of the Change in Value of a $10,000 Investment in
Cutler Fixed Income Fund, Bloomberg Barclays Intermediate U.S. Government/Credit Index
and Bloomberg Barclays Short-Term U.S. Government Index
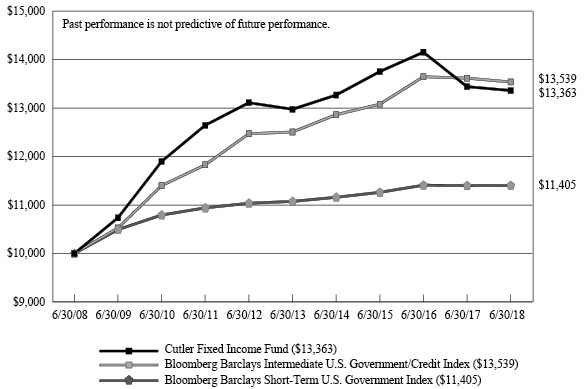
Average Annual Total Returns
(for periods ended June 30, 2018) |
| | 1 Year | 5 Years | 10 Years | |
Cutler Fixed Income Fund(a) | (0.59%) | 0.59% | 2.94% | |
Bloomberg Barclays Intermediate U.S. Government/Credit Index(b) | (0.58%) | 1.60% | 3.08% | |
Bloomberg Barclays Short-Term U.S. Government Index(b) | 0.03% | 0.59% | 1.32% | |
| | | | | | |
(a) | Returns shown do not reflect the deduction of taxes a shareholder would pay on Fund distributions or the redemption of Fund shares. | |
(b) | The Bloomberg Barclays Intermediate U.S. Government/Credit Index and the Bloomberg Barclays Short-Term U.S. Government Index cover intermediate and short-term, respectively, fixed income securities of the U.S government and publicly-issued U.S. corporate and foreign debentures and secured notes that meet specified maturity, liquidity, and quality requirements. The indices are unmanaged and shown for illustration purposes only. An investor cannot invest in an index and its returns are not indicative of the performance or any specific investment. | |
10
CUTLER EMERGING MARKETS FUND
PERFORMANCE INFORMATION
June 30, 2018 (Unaudited)
Comparison of the Change in Value of a $10,000 Investment in
Cutler Emerging Markets Fund and MSCI Emerging Markets Index
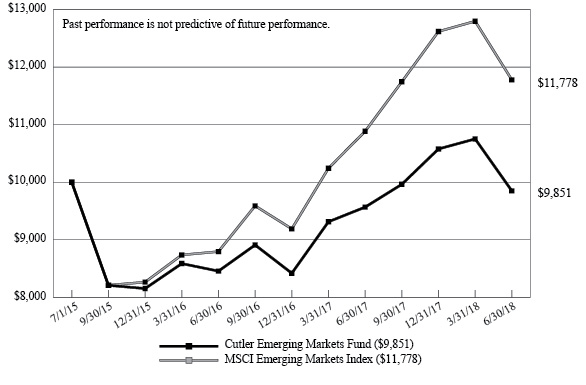
Average Annual Total Returns
(for periods ended June 30, 2018) |
| | | 1 Year | Since
Inception(b) | |
Cutler Emerging Markets Fund(a) | | 2.95% | (0.50%) | |
MSCI Emerging Markets Index(c) | | 8.20% | 5.61% | |
| | | | | | |
(a) | Returns shown do not reflect the deduction of taxes a shareholder would pay on Fund distributions or the redemption of Fund shares. | |
(b) | The Fund commenced operations on July 1, 2015. | |
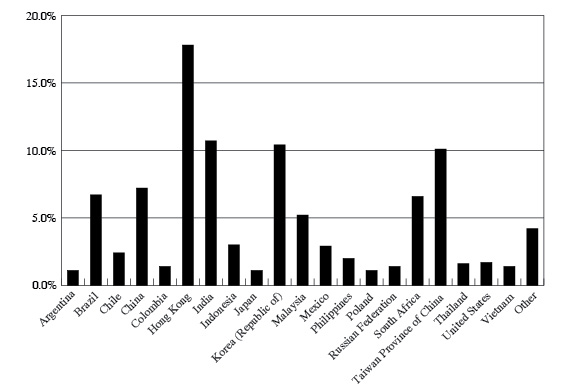
(c) | The MSCI Emerging Markets Index captures large and mid cap representation across 24 emerging markets: Brazil, Chile, China, Colombia, Czech Republic, Egypt, Greece, Hungary, India, Indonesia, Korea, Malaysia, Mexico, Pakistan, Peru, Philippines, Poland, Russia, Qatar, South Africa, Taiwan, Thailand, Turkey and United Arab Emirates. The index is unmanaged and shown for illustration purposes only. An investor cannot invest in an index and its returns are not indicative of the performance of any specific investment. | |
11
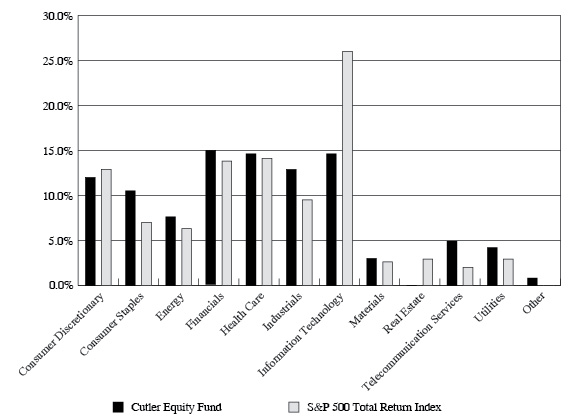
CUTLER EQUITY FUND
PORTFOLIO INFORMATION
June 30, 2018 (Unaudited)
Sector Allocation (% of Net Assets)
12
CUTLER FIXED INCOME FUND
PORTFOLIO INFORMATION
June 30, 2018 (Unaudited)
Asset Allocation (% of Net Assets)
13
CUTLER EMERGING MARKETS FUND
PORTFOLIO INFORMATION
June 30, 2018 (Unaudited)
Country Allocation (% of Net Assets)
14
CUTLER EQUITY FUND
SCHEDULE OF INVESTMENTS
June 30, 2018 |
| COMMON STOCKS — 99.2% | | Shares | | | Value | |
| Consumer Discretionary — 12.0% | | | | | | |
| Hotels, Restaurants & Leisure — 4.1% | | | | | | |
| McDonald's Corporation | | | 39,655 | | | $ | 6,213,542 | |
| | | | | | | | | |
| Media — 3.4% | | | | | | | | |
| Walt Disney Company (The) | | | 48,992 | | | | 5,134,852 | |
| | | | | | | | | |
| Specialty Retail — 4.5% | | | | | | | | |
| Home Depot, Inc. (The) | | | 34,575 | | | | 6,745,582 | |
| | | | | | | | | |
| Consumer Staples — 10.5% | | | | | | | | |
| Beverages — 2.8% | | | | | | | | |
| PepsiCo, Inc. | | | 37,995 | | | | 4,136,516 | |
| | | | | | | | | |
| Food & Staples Retailing — 5.4% | | | | | | | | |
| Kroger Company (The) | | | 122,971 | | | | 3,498,525 | |
| Walmart, Inc. | | | 53,677 | | | | 4,597,435 | |
| | | | | | | | 8,095,960 | |
| Household Products — 2.3% | | | | | | | | |
| Procter & Gamble Company (The) | | | 45,130 | | | | 3,522,848 | |
| | | | | | | | | |
| Energy — 7.6% | | | | | | | | |
| Energy Equipment & Services — 1.2% | | | | | | | | |
| Schlumberger Ltd. | | | 27,000 | | | | 1,809,810 | |
| | | | | | | | | |
| Oil, Gas & Consumable Fuels — 6.4% | | | | | | | | |
| Chevron Corporation | | | 43,820 | | | | 5,540,163 | |
| Exxon Mobil Corporation | | | 49,563 | | | | 4,100,347 | |
| | | | | | | | 9,640,510 | |
| Financials — 14.9% | | | | | | | | |
| Banks — 3.2% | | | | | | | | |
| M&T Bank Corporation | | | 28,340 | | | | 4,822,051 | |
| | | | | | | | | |
| Capital Markets — 7.1% | | | | | | | | |
| BlackRock, Inc. | | | 13,284 | | | | 6,629,247 | |
| Northern Trust Corporation | | | 39,000 | | | | 4,012,710 | |
| | | | | | | | 10,641,957 | |
| Insurance — 4.6% | | | | | | | | |
| Marsh & McLennan Companies, Inc. | | | 44,000 | | | | 3,606,680 | |
| Prudential Financial, Inc. | | | 35,500 | | | | 3,319,605 | |
| | | | | | | | 6,926,285 | |
15
CUTLER EQUITY FUND
SCHEDULE OF INVESTMENTS (Continued) |
| COMMON STOCKS — 99.2% (Continued) | | Shares | | | Value | |
| Health Care — 14.6% | | | | | | |
| Health Care Equipment & Supplies — 6.7% | | | | | | |
| Becton, Dickinson and Company | | | 27,525 | | | $ | 6,593,889 | |
| Medtronic plc | | | 41,000 | | | | 3,510,010 | |
| | | | | | | | 10,103,899 | |
| Pharmaceuticals — 7.9% | | | | | | | | |
| Bristol-Myers Squibb Company | | | 71,490 | | | | 3,956,256 | |
| Johnson & Johnson | | | 34,670 | | | | 4,206,858 | |
| Merck & Company, Inc. | | | 62,790 | | | | 3,811,353 | |
| | | | | | | | 11,974,467 | |
| Industrials — 12.9% | | | | | | | | |
| Aerospace & Defense — 2.7% | | | | | | | | |
| United Technologies Corporation | | | 32,010 | | | | 4,002,210 | |
| | | | | | | | | |
| Machinery — 8.2% | | | | | | | | |
| Caterpillar, Inc. | | | 44,280 | | | | 6,007,468 | |
| Deere & Company | | | 45,944 | | | | 6,422,971 | |
| | | | | | | | 12,430,439 | |
| Road & Rail — 2.0% | | | | | | | | |
| Union Pacific Corporation | | | 21,000 | | | | 2,975,280 | |
| | | | | | | | | |
| Information Technology — 14.6% | | | | | | | | |
| Semiconductors & Semiconductor Equipment — 9.8% | | | | | | | | |
| Intel Corporation | | | 104,965 | | | | 5,217,810 | |
| QUALCOMM, Inc. | | | 64,464 | | | | 3,617,720 | |
| Texas Instruments, Inc. | | | 53,365 | | | | 5,883,491 | |
| | | | | | | | 14,719,021 | |
| Software — 4.8% | | | | | | | | |
| Microsoft Corporation | | | 73,425 | | | | 7,240,439 | |
| | | | | | | | | |
| Materials — 3.0% | | | | | | | | |
| Chemicals — 3.0% | | | | | | | | |
| DowDuPont, Inc. | | | 69,875 | | | | 4,606,160 | |
| | | | | | | | | |
| Telecommunication Services — 4.9% | | | | | | | | |
| Diversified Telecommunication Services — 4.9% | | | | | | | | |
| AT&T, Inc. | | | 109,403 | | | | 3,512,930 | |
| Verizon Communications, Inc. | | | 75,786 | | | | 3,812,794 | |
| | | | | | | | 7,325,724 | |
16
CUTLER EQUITY FUND
SCHEDULE OF INVESTMENTS (Continued) |
| COMMON STOCKS — 99.2% (Continued) | | Shares | | | Value | |
| Utilities — 4.2% | | | | | | |
| Gas Utilities — 1.8% | | | | | | |
| National Fuel Gas Company | | | 52,145 | | | $ | 2,761,599 | |
| | | | | | | | | |
| Multi-Utilities — 2.4% | | | | | | | | |
| Dominion Energy, Inc. | | | 53,243 | | | | 3,630,108 | |
| | | | | | | | | |
Total Common Stocks (Cost $96,789,579) | | | | | | $ | 149,459,259 | |
| |
| MONEY MARKET FUNDS — 0.9% | | Shares | | | Value | |
Invesco STIT Government & Agency Portfolio - Institutional Class, 1.80% (a) (Cost $1,351,153) | | | 1,351,153 | | | $ | 1,351,153 | |
| | | | | | | | | |
Total Investments at Value — 100.1% (Cost $98,140,732) | | | | | | $ | 150,810,412 | |
| | | | | | | | | |
| Liabilities in Excess of Other Assets — (0.1%) | | | | | | | (213,082 | ) |
| | | | | | | | | |
| Net Assets — 100.0% | | | | | | $ | 150,597,330 | |
(a) | The rate shown is the 7-day effective yield as of June 30, 2018. |
See accompanying notes to financial statements. |
17
CUTLER FIXED INCOME FUND
SCHEDULE OF INVESTMENTS
June 30, 2018 |
| U.S. TREASURY OBLIGATIONS — 19.9% | | Coupon | | | Maturity | | | Par Value | | | Value | |
| U.S. Treasury Notes | | | 1.750 | % | | | 11/30/19 | | | $ | 250,000 | | | $ | 247,481 | |
| U.S. Treasury Notes | | | 1.875 | % | | | 12/15/20 | | | | 250,000 | | | | 245,801 | |
| U.S. Treasury Notes | | | 2.375 | % | | | 03/15/21 | | | | 250,000 | | | | 248,486 | |
| U.S. Treasury Notes | | | 1.625 | % | | | 02/15/26 | | | | 700,000 | | | | 642,195 | |
| U.S. Treasury Notes | | | 1.625 | % | | | 05/15/26 | | | | 650,000 | | | | 594,572 | |
| U.S. Treasury Notes | | | 2.000 | % | | | 11/15/26 | | | | 500,000 | | | | 468,574 | |
Total U.S. Treasury Obligations (Cost $2,540,315) | | | | | | | | | | | | | | $ | 2,447,109 | |
| |
| U.S. GOVERNMENT AGENCY OBLIGATIONS — 44.2% | | Coupon | | | Maturity | | | Par Value | | | Value | |
| Federal Farm Credit Bank — 20.0% | | | | | | | | | | | | | | | | |
| Federal Farm Credit Bank | | | 2.750 | % | | | 06/26/23 | | | $ | 500,000 | | | $ | 497,668 | |
| Federal Farm Credit Bank | | | 2.040 | % | | | 02/10/25 | | | | 100,000 | | | | 93,023 | |
| Federal Farm Credit Bank | | | 2.370 | % | | | 05/01/25 | | | | 300,000 | | | | 287,889 | |
| Federal Farm Credit Bank | | | 2.360 | % | | | 06/16/25 | | | | 310,000 | | | | 292,992 | |
| Federal Farm Credit Bank | | | 2.240 | % | | | 07/06/27 | | | | 1,150,000 | | | | 1,057,371 | |
| Federal Farm Credit Bank | | | 2.500 | % | | | 07/12/27 | | | | 250,000 | | | | 233,162 | |
| | | | | | | | | | | | | | | | 2,462,105 | |
| Federal Home Loan Bank — 18.8% | | | | | | | | | | | | | | | | |
| Federal Home Loan Bank | | | 1.500 | % | | | 03/29/22 | | | | 250,000 | | | | 244,156 | |
| Federal Home Loan Bank | | | 1.500 | % | | | 10/27/22 | | | | 500,000 | | | | 489,498 | |
| Federal Home Loan Bank | | | 2.125 | % | | | 03/10/23 | | | | 350,000 | | | | 339,823 | |
| Federal Home Loan Bank | | | 1.500 | % | | | 07/27/28 | | | | 1,000,000 | | | | 931,665 | |
| Federal Home Loan Bank | | | 2.570 | % | | | 10/06/31 | | | | 345,000 | | | | 310,828 | |
| | | | | | | | | | | | | | | | 2,315,970 | |
| Federal Home Loan Mortgage Corporation — 1.2% | | | | | | | | | | | | | | | | |
| Federal Home Loan Mortgage Corporation | | | 1.500 | % | | | 10/27/23 | | | | 150,000 | | | | 144,173 | |
| | | | | | | | | | | | | | | | | |
| Private Export Funding Corporation — 3.0% | | | | | | | | | | | | | | | | |
| Private Export Funding Corporation | | | 4.300 | % | | | 12/15/21 | | | | 350,000 | | | | 365,941 | |
| | | | | | | | | | | | | | | | | |
| U.S. Department of Housing and Urban Development — 1.2% | | | | | | | | | | | | | | |
| U.S. Department of Housing and Urban Development | | | 4.130 | % | | | 08/01/25 | | | | 150,000 | | | | 154,616 | |
Total U.S. Government Agency Obligations (Cost $5,626,751) | | | | | | | | | | | | | $ | 5,442,805 | |
18
CUTLER FIXED INCOME FUND
SCHEDULE OF INVESTMENTS (Continued) |
| MORTGAGE-BACKED SECURITIES — 17.9% | | Coupon | | | Maturity | | | Par Value | | | Value | |
| Commercial — 1.5% | | | | | | | | | | | | |
| Banc of America Commercial Mortgage Trust, IO, Series 2004-4 | | | 0.062 | %(a) | | | 07/01/42 | | | $ | 1,567,909 | | | $ | 227 | |
| Bear Stearns Commercial Mortgage Securities Trust, Series 2005-T20 | | | 6.024 | %(a) | | | 10/12/42 | | | | 200,000 | | | | 44,086 | |
| Credit Suisse First Boston Mortgage Securities, IO, Series 2004-C1, 144A | | | 0.842 | %(a) | | | 01/15/37 | | | | 3,740,588 | | | | 69,037 | |
| GMAC Commercial Mortgage Securities, Inc. Trust, IO, Series 1997-C1 | | | 1.526 | %(a) | | | 07/15/29 | | | | 3,895,841 | | | | 66,820 | |
| Morgan Stanley Capital I Trust, IO, Series 1998-HF2 | | | 1.069 | %(a) | | | 11/01/30 | | | | 379,666 | | | | 19 | |
| Wachovia Bank Commercial Mortgage Trust, IO, Series 2005-C21 | | | 0.000 | %(a) | | | 10/01/44 | | | | 123,409,088 | | | | 5,418 | |
| | | | | | | | | | | | | | | | 185,607 | |
| Federal Home Loan Mortgage Corporation — 0.3% | | | | | | | | | | | | | | | | |
| FHLMC, Pool #J13584 | | | 3.500 | % | | | 11/01/25 | | | | 24,619 | | | | 24,928 | |
| FHLMC, Series 1963 | | | 7.500 | % | | | 01/01/27 | | | | 14,360 | | | | 15,989 | |
| | | | | | | | | | | | | | | | 40,917 | |
| Federal National Mortgage Association — 10.8% | | | | | | | | | | | | | | | | |
| FANNIEMAE-ACES, IO, Series 2012-M4 | | | 0.564 | %(a) | | | 04/25/22 | | | | 10,198,814 | | | | 175,545 | |
| FANNIEMAE-ACES, IO, Series 2015-M4 | | | 0.487 | %(a) | | | 07/25/22 | | | | 13,573,006 | | | | 218,520 | |
| FANNIEMAE-ACES, IO, Series 2014-M13 | | | 0.124 | %(a) | | | 08/25/24 | | | | 12,098,075 | | | | 89,890 | |
| FANNIEMAE-ACES, IO, Series 2015-M1 | | | 0.546 | %(a) | | | 09/25/24 | | | | 28,810,721 | | | | 826,165 | |
| FNMA, Pool #899237 | | | 5.000 | % | | | 03/01/22 | | | | 2,835 | | | | 2,941 | |
| FNMA, Series 2002-93 | | | 6.500 | % | | | 03/01/32 | | | | 16,961 | | | | 18,072 | |
| | | | | | | | | | | | | | | | 1,331,133 | |
| Government National Mortgage Association — 5.3% | | | | | | | | | | | | | | | | |
| GNMA, IO, Series 2011-121 (-1*1MO LIBOR + 610) | | | 4.099 | %(a) | | | 03/16/43 | | | | 989,751 | | | | 119,569 | |
| GNMA, IO, Series 2012-4 | | | 0.199 | %(a) | | | 05/16/52 | | | | 2,400,773 | | | | 31,844 | |
| GNMA, IO, Series 2013-35 | | | 0.483 | %(a) | | | 01/16/53 | | | | 9,743,077 | | | | 312,904 | |
| GNMA, IO, Series 2012-114 | | | 0.803 | %(a) | | | 01/16/53 | | | | 3,554,712 | | | | 190,106 | |
| | | | | | | | | | | | | | | | 654,423 | |
| | | | | | | | | | | | | | | | | |
Total Mortgage-Backed Securities (Cost $2,731,186) | | | | | | | | | | | | | | $ | 2,212,080 | |
19
CUTLER FIXED INCOME FUND
SCHEDULE OF INVESTMENTS (Continued) |
| CORPORATE BONDS — 11.7% | | Coupon | | | Maturity | | | Par Value | | | Value | |
| Consumer Discretionary — 1.2% | | | | | | | | | | | | | | | | |
| NVR, Inc. | | | 3.950 | % | | | 09/15/22 | | | $ | 150,000 | | | $ | 150,969 | |
| | | | | | | | | | | | | | | | | |
| Consumer Staples — 1.2% | | | | | | | | | | | | | | | | |
| Dollar Tree, Inc. | | | 4.000 | % | | | 05/15/25 | | | | 150,000 | | | | 146,595 | |
| | | | | | | | | | | | | | | | | |
| Financials — 4.5% | | | | | | | | | | | | | | | | |
| Citigroup, Inc. | | | 2.700 | % | | | 10/27/22 | | | | 150,000 | | | | 144,048 | |
| Finial Holdings, Inc. | | | 7.125 | % | | | 10/15/23 | | | | 250,000 | | | | 282,758 | |
| First American Financial Advisors, Inc. | | | 4.300 | % | | | 02/01/23 | | | | 125,000 | | | | 124,625 | |
| | | | | | | | | | | | | | | | 551,431 | |
| Health Care — 1.3% | | | | | | | | | | | | | | | | |
| S&P Global, Inc. | | | 4.400 | % | | | 02/15/26 | | | | 150,000 | | | | 153,795 | |
| | | | | | | | | | | | | | | | | |
| Industrials — 2.4% | | | | | | | | | | | | | | | | |
| Mosaic Company | | | 3.250 | % | | | 11/15/22 | | | | 150,000 | | | | 145,710 | |
| Mueller Industries, Inc. | | | 6.000 | % | | | 03/01/27 | | | | 150,000 | | | | 147,000 | |
| | | | | | | | | | | | | | | | 292,710 | |
| Information Technology — 1.1% | | | | | | | | | | | | | | | | |
| Cigna Corporation | | | 3.250 | % | | | 04/15/25 | | | | 150,000 | | | | 141,046 | |
| | | | | | | | | | | | | | | | | |
Total Corporate Bonds (Cost $1,471,559) | | | | | | | | | | | | | | $ | 1,436,546 | |
20
CUTLER FIXED INCOME FUND
SCHEDULE OF INVESTMENTS (Continued) |
| MONEY MARKET FUNDS — 5.8% | | Shares | | | Value | |
Invesco STIT Government & Agency Portfolio - Institutional Class, 1.80% (b) (Cost $708,416) | | | 708,416 | | | $ | 708,416 | |
| | | | | | | | | |
Total Investments at Value — 99.5% (Cost $13,078,227) | | | | | | $ | 12,246,956 | |
| | | | | | | | | |
| Other Assets in Excess of Liabilities — 0.5% | | | | | | | 67,535 | |
| | | | | | | | | |
| Net Assets — 100.0% | | | | | | $ | 12,314,491 | |
IO – Interest only strip. Par value shown is the notional value, not a true par value (Note 7). |
144A – Security was purchased in a transaction exempt from registration in compliance with Rule 144A of the Securities Act of 1933. This security may be resold in transactions exempt from registration, normally to qualified institutional buyers. The total value of such securities is $69,037 as of June 30, 2018, representing 0.6% of net assets. |
LIBOR – London Interbank Offered Rate. |
(a) | Variable rate security. Interest rate resets periodically. The rate shown is the effective interest rate as of June 30, 2018. For securities based on a published reference rate and spread, the reference rate and spread (in basis points) are indicated parenthetically. Certain variable rate securities are not based on a published reference rate and spread but are determined by the issuer or agent and are based on current market conditions. These securities, therefore, do not indicate a reference rate and spread. |
(b) | The rate shown is the 7-day effective yield as of June 30, 2018. |
See accompanying notes to financial statements. |
21
CUTLER EMERGING MARKETS FUND
SCHEDULE OF INVESTMENTS
June 30, 2018 |
| COMMON STOCKS — 72.5% | | Shares | | | Value | |
| Brazil — 3.6% | | | | | | |
| Ambev S.A. - ADR | | | 32,010 | | | $ | 148,206 | |
| Banco Bradesco S.A. - ADR | | | 17,319 | | | | 118,808 | |
| Telefonica Brasil S.A. - ADR | | | 8,850 | | | | 105,049 | |
| TIM Participacoes S.A. - ADR | | | 7,700 | | | | 129,822 | |
| | | | | | | | 501,885 | |
| Chile — 2.3% | | | | | | | | |
| Empresa Nacional de Telecomunicaciones S.A. | | | 17,614 | | | | 161,760 | |
| Viña Concha y Toro S.A. | | | 79,500 | | | | 163,661 | |
| | | | | | | | 325,421 | |
| China — 4.9% | | | | | | | | |
| China Petroleum & Chemical Corporation - ADR | | | 1,600 | | | | 143,744 | |
| PetroChina Company Ltd. - ADR | | | 4,176 | | | | 318,504 | |
| Sinopec Shanghai Petrochemical Company Ltd. - ADR | | | 3,704 | | | | 222,166 | |
| | | | | | | | 684,414 | |
| Colombia — 1.4% | | | | | | | | |
| Grupo de Inversiones Suramericana S.A. | | | 14,983 | | | | 193,181 | |
| | | | | | | | | |
| Hong Kong — 17.8% | | | | | | | | |
Beijing Enterprises Holdings Ltd. (a) | | | 41,000 | | | | 199,067 | |
China Overseas Land & Investment Ltd. (a) | | | 59,000 | | | | 193,649 | |
China Overseas Property Holdings Ltd. (a) | | | 15,666 | | | | 5,166 | |
China Resources Beer Holdings Company Ltd. (a) | | | 104,000 | | | | 503,613 | |
China Resources Land Ltd. (a) | | | 68,000 | | | | 228,415 | |
CITIC Ltd. (a) | | | 107,000 | | | | 150,521 | |
COSCO SHIPPING Ports Ltd. (a) | | | 12,250 | | | | 10,189 | |
Hengan International Group Company Ltd. (a) | | | 39,000 | | | | 374,080 | |
| Lenovo Group Ltd. - ADR | | | 8,206 | | | | 88,748 | |
Shanghai Industrial Holdings Ltd. (a) | | | 69,000 | | | | 160,307 | |
Sino Biopharmaceutical Ltd. (a) | | | 148,500 | | | | 226,789 | |
| Tingyi (Cayman Islands) Holding Corporation | | | 148,000 | | | | 343,325 | |
| | | | | | | | 2,483,869 | |
| Indonesia — 3.1% | | | | | | | | |
Indofood Sukses Makmur Tbk. (a) | | | 277,700 | | | | 129,397 | |
Semen Indonesia Persero Tbk. (a) | | | 263,100 | | | | 131,358 | |
| Telekomunikasi Indonesia Persero Tbk. - ADR | | | 6,514 | | | | 169,429 | |
| | | | | | | | 430,184 | |
22
CUTLER EMERGING MARKETS FUND
SCHEDULE OF INVESTMENTS (Continued) |
| COMMON STOCKS — 72.5% (Continued) | | Shares | | | Value | |
| Korea (Republic of) — 10.5% | | | | | | |
AmorePacific Group (a) | | | 710 | | | $ | 78,756 | |
Dongbu Insurance Company Ltd. (a) | | | 2,159 | | | | 114,412 | |
Korea Gas Corporation (a)(b) | | | 3,880 | | | | 223,171 | |
| KT Corporation - ADR | | | 11,956 | | | | 158,776 | |
LG Corporation (a) | | | 3,275 | | | | 211,866 | |
| POSCO - ADR | | | 2,676 | | | | 198,345 | |
Samsung Electronics Company Ltd. (a) | | | 9,400 | | | | 394,020 | |
Samsung Fire & Marine Insurance Company Ltd. (a) | | | 370 | | | | 87,725 | |
| | | | | | | | 1,467,071 | |
| Malaysia — 5.3% | | | | | | | | |
CIMB Group Holdings Berhad (a) | | | 227,693 | | | | 307,212 | |
Genting Berhad (a) | | | 84,200 | | | | 175,298 | |
Malayan Banking Berhad (a) | | | 115,860 | | | | 258,236 | |
| | | | | | | | 740,746 | |
| Mexico — 2.9% | | | | | | | | |
| América Móvil S.A.B. de C.V. - Series L - ADR | | | 15,817 | | | | 263,511 | |
| Coca-Cola Femsa S.A.B. de C.V. - Series L | | | 23,837 | | | | 134,427 | |
| | | | | | | | 397,938 | |
| Philippines — 2.0% | | | | | | | | |
Aboitiz Equity Ventures, Inc. (a) | | | 87,350 | | | | 89,311 | |
Robinsons Land Corporation (a) | | | 228,364 | | | | 79,612 | |
Universal Robina Corporation (a) | | | 45,370 | | | | 102,692 | |
| | | | | | | | 271,615 | |
| South Africa — 6.6% | | | | | | | | |
| Liberty Holdings Ltd. | | | 16,865 | | | | 143,015 | |
| Naspers Ltd. - Class N - ADR | | | 6,285 | | | | 315,004 | |
| Sasol Ltd. - ADR | | | 4,502 | | | | 164,503 | |
Shoprite Holdings Ltd. (a) | | | 10,000 | | | | 160,293 | |
| Shoprite Holdings Ltd. - ADR | | | 8,803 | | | | 140,892 | |
| | | | | | | | 923,707 | |
| Taiwan Province of China — 8.9% | | | | | | | | |
Cheng Shin Rubber Industry Company Ltd. (a) | | | 54,000 | | | | 81,279 | |
Compal Electronics, Inc. (a) | | | 238,000 | | | | 149,850 | |
CTCI Corporation (a) | | | 156,000 | | | | 249,726 | |
Delta Electronics, Inc. (a) | | | 39,100 | | | | 140,247 | |
Giant Manufacturing Company Ltd. (a) | | | 21,000 | | | | 88,779 | |
President Chain Store Corporation (a) | | | 29,000 | | | | 328,843 | |
| Taiwan Semiconductor Manufacturing Company Ltd. - ADR | | | 5,575 | | | | 203,822 | |
| | | | | | | | 1,242,546 | |
23
CUTLER EMERGING MARKETS FUND
SCHEDULE OF INVESTMENTS (Continued) |
| COMMON STOCKS — 72.5% (Continued) | | Shares | | | Value | |
| Thailand — 1.6% | | | | | | |
Charoen Pokphand Foods plc (a) | | | 309,000 | | | $ | 226,451 | |
| | | | | | | | | |
| United States — 1.6% | | | | | | | | |
| Southern Copper Corporation | | | 4,890 | | | | 229,194 | |
| | | | | | | | | |
Total Common Stocks (Cost $8,819,721) | | | | | | $ | 10,118,222 | |
| |
| PREFERRED STOCKS — 4.5% | | Shares | | | Value | |
| Brazil — 3.1% | | | | | | |
Companhia Brasileira de Distribuição - ADR (c) | | | 7,000 | | | $ | 139,860 | |
Companhia Paranaense de Energia-Copel - ADR (c) | | | 15,000 | | | | 83,700 | |
Itau Unibanco Holding S.A. - ADR (c) | | | 19,270 | | | | 200,023 | |
| | | | | | | | 423,583 | |
Colombia — 0.0% (d) | | | | | | | | |
Grupo de Inversiones Suramericana S.A. (c) | | | 183 | | | | 2,215 | |
| | | | | | | | | |
| Russian Federation — 1.4% | | | | | | | | |
Surgutneftegaz OJSC - ADR (c) | | | 39,980 | | | | 197,101 | |
| | | | | | | | | |
Total Preferred Stocks (Cost $618,461) | | | | | | $ | 622,899 | |
| |
| EXCHANGE-TRADED FUNDS — 18.8% | | Shares | | | Value | |
| Columbia India Consumer ETF | | | 11,000 | | | $ | 504,240 | |
| Global X MSCI Argentina ETF | | | 5,650 | | | | 152,381 | |
| iShares China Large-Cap ETF | | | 7,500 | | | | 322,275 | |
| iShares MSCI India ETF | | | 26,800 | | | | 892,172 | |
| iShares MSCI Japan ETF | | | 2,750 | | | | 159,252 | |
| iShares MSCI Taiwan ETF | | | 4,429 | | | | 159,444 | |
| VanEck Vectors India Small-Cap Index ETF | | | 1,890 | | | | 91,986 | |
| VanEck Vectors Poland ETF | | | 9,326 | | | | 148,344 | |
| VanEck Vectors Vietnam ETF | | | 12,400 | | | | 198,028 | |
Total Exchange-Traded Funds (Cost $2,478,651) | | | | | | $ | 2,628,122 | |
24
CUTLER EMERGING MARKETS FUND
SCHEDULE OF INVESTMENTS (Continued) |
| MONEY MARKET FUNDS — 3.7% | | Shares | | | Value | |
Invesco STIT Government & Agency Portfolio - Institutional Class, 1.80% (e) (Cost $516,877) | | | 516,877 | | | $ | 516,877 | |
| | | | | | | | | |
Total Investments at Value — 99.5% (Cost $12,433,710) | | | | | | $ | 13,886,120 | |
| | | | | | | | | |
| Other Assets in Excess of Liabilities — 0.5% | | | | | | | 67,254 | |
| | | | | | | | | |
| Net Assets — 100.0% | | | | | | $ | 13,953,374 | |
ADR - American Depositary Receipt. |
(a) | Level 2 security (Note 2) |
(b) | Non-income producing security. |
(c) | Security has a perpetual maturity date. |
(d) | Percentage rounds to less than 0.1%. |
(e) | The rate shown is the 7-day effective yield as of June 30, 2018. |
See accompanying notes to financial statements. |
25
CUTLER EMERGING MARKETS FUND
SUMMARY OF COMMON STOCKS & PREFERRED STOCKS
BY SECTOR AND INDUSTRY
June 30, 2018 |
Sector/Industry | % of Net Assets |
Consumer Discretionary — 4.7% | |
Auto Components | 0.6% |
Hotels, Restaurants & Leisure | 1.2% |
Leisure Products | 0.6% |
Media | 2.3% |
Consumer Staples — 21.3% | |
Beverages | 3.2% |
Food & Staples Retailing | 9.1% |
Food Products | 5.8% |
Personal Products | 3.2% |
Energy — 5.9% | |
Oil, Gas & Consumable Fuels | 5.9% |
Financials — 10.3% | |
Banks | 6.4% |
Diversified Financial Services | 1.4% |
Insurance | 2.5% |
Health Care — 1.6% | |
Pharmaceuticals | 1.6% |
Industrials — 7.7% | |
Construction & Engineering | 1.8% |
Industrial Conglomerates | 5.8% |
Transportation Infrastructure | 0.1% |
Information Technology — 7.0% | |
Electronic Equipment, Instruments & Components | 1.0% |
Semiconductors & Semiconductor Equipment | 1.5% |
Technology Hardware, Storage & Peripherals | 4.5% |
Materials — 5.6% | |
Chemicals | 1.6% |
Construction Materials | 0.9% |
Metals & Mining | 3.1% |
Real Estate — 3.6% | |
Real Estate Management & Development | 3.6% |
Telecommunication Services — 7.1% | |
Diversified Telecommunication Services | 3.1% |
Wireless Telecommunication Services | 4.0% |
Utilities — 2.2% | |
Electric Utilities | 0.6% |
Gas Utilities | 1.6% |
| | 77.0% |
See accompanying notes to financial statements. |
26
THE CUTLER TRUST
STATEMENTS OF ASSETS AND LIABILITIES
June 30, 2018 |
| | | Cutler
Equity Fund | | | Cutler Fixed
Income Fund | | | Cutler
Emerging
Markets Fund | |
| ASSETS | | | | | | | | | |
| Investments in securities: | | | | | | | | | | | | |
| At cost | | $ | 98,140,732 | | | $ | 13,078,227 | | | $ | 12,433,710 | |
| At value (Note 2) | | $ | 150,810,412 | | | $ | 12,246,956 | | | $ | 13,886,120 | |
| Cash | | | — | | | | — | | | | 30 | |
| Cash denominated in foreign currency (Cost $25,548) | | | — | | | | — | | | | 25,361 | |
| Receivable for capital shares sold | | | 88,700 | | | | 712 | | | | 1,371 | |
| Dividends and interest receivable | | | 114,529 | | | | 103,994 | | | | 73,212 | |
| Other assets | | | 8,725 | | | | 5,564 | | | | 4,203 | |
| Total assets | | | 151,022,366 | | | | 12,357,226 | | | | 13,990,297 | |
| | | | | | | | | | | | | |
| LIABILITIES | | | | | | | | | | | | |
| Distributions payable | | | 5,745 | | | | — | | | | — | |
| Payable for capital shares redeemed | | | 278,194 | | | | 7,536 | | | | 102 | |
| Payable to Adviser (Note 3) | | | 82,307 | | | | 4,846 | | | | 4,829 | |
| Payable to administrator (Note 3) | | | 19,000 | | | | 6,000 | | | | 6,500 | |
| Other accrued expenses | | | 39,790 | | | | 24,353 | | | | 25,492 | |
| Total liabilities | | | 425,036 | | | | 42,735 | | | | 36,923 | |
| | | | | | | | | | | | | |
| NET ASSETS | | $ | 150,597,330 | | | $ | 12,314,491 | | | $ | 13,953,374 | |
| | | | | | | | | | | | | |
| NET ASSETS CONSIST OF: | | | | | | | | | | | | |
| Paid-in capital | | $ | 95,492,374 | | | $ | 15,315,822 | | | $ | 12,687,192 | |
| Undistributed net investment income (loss) | | | 34,512 | | | | (140,288 | ) | | | 21,783 | |
| Accumulated net realized gains (losses) from investment transactions | | | 2,400,764 | | | | (2,029,772 | ) | | | (207,683 | ) |
| Net unrealized appreciation (depreciation) on investments | | | 52,669,680 | | | | (831,271 | ) | | | 1,452,410 | |
| Net unrealized depreciation on translation of assets and liabilities in foreign currencies | | | — | | | | — | | | | (328 | ) |
| NET ASSETS | | $ | 150,597,330 | | | $ | 12,314,491 | | | $ | 13,953,374 | |
| | | | | | | | | | | | | |
| Shares of beneficial interest outstanding (unlimited number of shares authorized, no par value) | | 7,597,991 | | | | 1,451,947 | | | | 1,449,871 | |
| | | | | | | | | | | | | |
| Net asset value, offering price and redemption price per share (Note 2) | | $ | 19.82 | | | $ | 8.48 | | | $ | 9.62 | |
See accompanying notes to financial statements. |
27
THE CUTLER TRUST
STATEMENTS OF OPERATIONS
For the Year Ended June 30, 2018 |
| | | Cutler
Equity Fund | | | Cutler Fixed
Income Fund | | | Cutler
Emerging
Markets Fund | |
| INVESTMENT INCOME | | | | | | | | | |
| Dividend income | | $ | 3,898,241 | | | $ | 10,563 | | | $ | 380,953 | |
| Interest income | | | — | | | | 73,705 | (a) | | | — | |
| Foreign withholding taxes on dividends | | | — | | | | — | | | | (46,021 | ) |
| Total investment income | | | 3,898,241 | | | | 84,268 | | | | 334,932 | |
| | | | | | | | | | | | | |
| EXPENSES | | | | | | | | | | | | |
| Investment advisory fees (Note 3) | | | 1,140,322 | | | | 69,126 | | | | 122,276 | |
| Administration fees (Note 3) | | | 228,184 | | | | 72,000 | | | | 78,000 | |
| Shareholder servicing fees (Note 4) | | | 223,947 | | | | 16 | | | | — | |
| Professional fees | | | 50,470 | | | | 28,181 | | | | 23,789 | |
| Registration and filing fees | | | 22,084 | | | | 14,564 | | | | 9,470 | |
| Custody and bank service fees | | | 16,036 | | | | 5,316 | | | | 22,125 | |
| Trustees’ fees and expenses (Note 3) | | | 32,791 | | | | 4,289 | | | | 4,142 | |
| Pricing costs | | | 1,127 | | | | 15,673 | | | | 14,806 | |
| Postage and supplies | | | 11,045 | | | | 3,973 | | | | 8,044 | |
| Insurance expense | | | 16,594 | | | | 2,189 | | | | 1,908 | |
| Printing of shareholder reports | | | 6,552 | | | | 3,882 | | | | 3,253 | |
| Other expenses | | | 11,497 | | | | 9,146 | | | | 9,561 | |
| Total expenses | | | 1,760,649 | | | | 228,355 | | | | 297,374 | |
| Less fee reductions by the Adviser (Note 3) | | | (12,154 | ) | | | — | | | | (74,399 | ) |
| Fees voluntarily waived by the Adviser (Note 3) | | | — | | | | (240 | ) | | | — | |
| Net expenses | | | 1,748,495 | | | | 228,115 | | | | 222,975 | |
| | | | | | | | | | | | | |
| NET INVESTMENT INCOME (LOSS) | | | 2,149,746 | | | | (143,847 | ) | | | 111,957 | |
| | | | | | | | | | | | | |
| REALIZED AND UNREALIZED GAINS (LOSSES) ON INVESTMENTS AND FOREIGN CURRENCIES | | | | | | | | | | | | |
| Net realized gains (losses) from: | | | | | | | | | | | | |
| Investment transactions | | | 3,144,331 | | | | (1,056,814 | ) | | | (57,515 | ) |
| Foreign currency transactions | | | — | | | | — | | | | (1,155 | ) |
| Net change in unrealized appreciation (depreciation) on: | | | | | | | | | | | | |
| Investments | | | 9,752,282 | | | | 1,111,041 | | | | 302,541 | |
| Foreign currency translation | | | — | | | | — | | | | (197 | ) |
| NET REALIZED AND UNREALIZED GAINS ON INVESTMENTS AND FOREIGN CURRENCIES | | | 12,896,613 | | | | 54,227 | | | | 243,674 | |
| | | | | | | | | | | | | |
| NET INCREASE (DECREASE) IN NET ASSETS FROM OPERATIONS | | $ | 15,046,359 | | | $ | (89,620 | ) | | $ | 355,631 | |
(a) | Includes income received from prepayment penalties for IO securities (Note 7). |
See accompanying notes to financial statements. |
28
CUTLER EQUITY FUND
STATEMENTS OF CHANGES IN NET ASSETS |
| | | Year
Ended
June 30,
2018 | | | Year
Ended
June 30,
2017 | |
| FROM OPERATIONS | | | | | | |
| Net investment income | | $ | 2,149,746 | | | $ | 2,116,103 | |
| Net realized gains from investment transactions | | | 3,144,331 | | | | 3,216,953 | |
| Net change in unrealized appreciation (depreciation) on investments | | | 9,752,282 | | | | 7,680,452 | |
| Net increase in net assets from operations | | | 15,046,359 | | | | 13,013,508 | |
| | | | | | | | | |
| DISTRIBUTIONS TO SHAREHOLDERS | | | | | | | | |
| From net investment income | | | (2,123,002 | ) | | | (2,190,013 | ) |
| From net realized gains | | | (1,915,091 | ) | | | (1,318,085 | ) |
| Decrease in net assets from distributions to shareholders | | | (4,038,093 | ) | | | (3,508,098 | ) |
| | | | | | | | | |
| CAPITAL SHARE TRANSACTIONS | | | | | | | | |
| Proceeds from shares sold | | | 13,365,712 | | | | 14,631,254 | |
| Net asset value of shares issued in reinvestment of distributions to shareholders | | | 4,010,459 | | | | 3,470,999 | |
| Payments for shares redeemed | | | (19,372,054 | ) | | | (18,158,476 | ) |
| Net decrease from capital share transactions | | | (1,995,883 | ) | | | (56,223 | ) |
| | | | | | | | | |
| TOTAL INCREASE IN NET ASSETS | | | 9,012,383 | | | | 9,449,187 | |
| | | | | | | | | |
| NET ASSETS | | | | | | | | |
| Beginning of year | | | 141,584,947 | | | | 132,135,760 | |
| End of year | | $ | 150,597,330 | | | $ | 141,584,947 | |
| | | | | | | | | |
| UNDISTRIBUTED NET INVESTMENT INCOME | | $ | 34,512 | | | $ | 7,768 | |
| | | | | | | | | |
| CAPITAL SHARE ACTIVITY | | | | | | | | |
| Shares sold | | | 670,098 | | | | 819,672 | |
| Shares reinvested | | | 199,637 | | | | 192,278 | |
| Shares redeemed | | | (972,289 | ) | | | (1,016,163 | ) |
| Net decrease in shares outstanding | | | (102,554 | ) | | | (4,213 | ) |
| Shares outstanding at beginning of year | | | 7,700,545 | | | | 7,704,758 | |
| Shares outstanding at end of year | | | 7,597,991 | | | | 7,700,545 | |
See accompanying notes to financial statements. |
29
CUTLER FIXED INCOME FUND
STATEMENTS OF CHANGES IN NET ASSETS |
| | | Year
Ended
June 30,
2018 | | | Year
Ended
June 30,
2017 | |
| FROM OPERATIONS | | | | | | |
| Net investment income (loss) | | $ | (143,847 | ) | | $ | 506,502 | |
| Net realized losses from investment transactions | | | (1,056,814 | ) | | | (876,752 | ) |
| Net change in unrealized appreciation (depreciation) on investments | | | 1,111,041 | | | | (559,697 | ) |
| Net decrease in net assets from operations | | | (89,620 | ) | | | (929,947 | ) |
| | | | | | | | | |
| DISTRIBUTIONS TO SHAREHOLDERS | | | | | | | | |
| From net investment income | | | — | | | | (1,341,500 | ) |
| | | | | | | | | |
| CAPITAL SHARE TRANSACTIONS | | | | | | | | |
| Proceeds from shares sold | | | 820,313 | | | | 1,722,438 | |
| Net asset value of shares issued in reinvestment of distributions to shareholders | | | — | | | | 1,322,778 | |
| Payments for shares redeemed | | | (3,486,876 | ) | | | (3,991,945 | ) |
| Net decrease from capital share transactions | | | (2,666,563 | ) | | | (946,729 | ) |
| | | | | | | | | |
| TOTAL DECREASE IN NET ASSETS | | | (2,756,183 | ) | | | (3,218,176 | ) |
| | | | | | | | | |
| NET ASSETS | | | | | | | | |
| Beginning of year | | | 15,070,674 | | | | 18,288,850 | |
| End of year | | $ | 12,314,491 | | | $ | 15,070,674 | |
| | | | | | | | | |
| ACCUMULATED NET INVESTMENT LOSS | | $ | (140,288 | ) | | $ | (58,036 | ) |
| | | | | | | | | |
| CAPITAL SHARE ACTIVITY | | | | | | | | |
| Shares sold | | | 95,575 | | | | 189,121 | |
| Shares reinvested | | | — | | | | 148,472 | |
| Shares redeemed | | | (409,663 | ) | | | (458,319 | ) |
| Net decrease in shares outstanding | | | (314,088 | ) | | | (120,726 | ) |
| Shares outstanding at beginning of year | | | 1,766,035 | | | | 1,886,761 | |
| Shares outstanding at end of year | | | 1,451,947 | | | | 1,766,035 | |
See accompanying notes to financial statements. |
30
CUTLER EMERGING MARKETS FUND
STATEMENTS OF CHANGES IN NET ASSETS |
| | | Year
Ended
June 30,
2018 | | | Year
Ended
June 30,
2017 | |
| FROM OPERATIONS | | | | | | |
| Net investment income | | $ | 111,957 | | | $ | 69,892 | |
| Net realized losses from: | | | | | | | | |
| Investment transactions | | | (57,515 | ) | | | (77,335 | ) |
| Foreign currency transactions | | | (1,155 | ) | | | (1,786 | ) |
| Net change in unrealized appreciation (depreciation) on: | | | | | | | | |
| Investments | | | 302,541 | | | | 1,161,934 | |
| Foreign currency translation | | | (197 | ) | | | (167 | ) |
| Net increase in net assets from operations | | | 355,631 | | | | 1,152,538 | |
| | | | | | | | | |
| DISTRIBUTIONS TO SHAREHOLDERS | | | | | | | | |
| From net investment income | | | (116,500 | ) | | | (56,835 | ) |
| | | | | | | | | |
| CAPITAL SHARE TRANSACTIONS | | | | | | | | |
| Proceeds from shares sold | | | 3,604,397 | | | | 4,612,140 | |
| Net asset value of shares issued in reinvestment of distributions to shareholders | | | 116,500 | | | | 56,835 | |
| Payments for shares redeemed | | | (2,118,397 | ) | | | (1,781,382 | ) |
| Net increase from capital share transactions | | | 1,602,500 | | | | 2,887,593 | |
| | | | | | | | | |
| TOTAL INCREASE IN NET ASSETS | | | 1,841,631 | | | | 3,983,296 | |
| | | | | | | | | |
| NET ASSETS | | | | | | | | |
| Beginning of year | | | 12,111,743 | | | | 8,128,447 | |
| End of year | | $ | 13,953,374 | | | $ | 12,111,743 | |
| | | | | | | | | |
| UNDISTRIBUTED NET INVESTMENT INCOME | | $ | 21,783 | | | $ | 27,481 | |
| | | | | | | | | |
| CAPITAL SHARE ACTIVITY | | | | | | | | |
| Shares sold | | | 355,893 | | | | 511,702 | |
| Shares reinvested | | | 11,708 | | | | 6,831 | |
| Shares redeemed | | | (203,910 | ) | | | (202,148 | ) |
| Net increase in shares outstanding | | | 163,691 | | | | 316,385 | |
| Shares outstanding at beginning of year | | | 1,286,180 | | | | 969,795 | |
| Shares outstanding at end of year | | | 1,449,871 | | | | 1,286,180 | |
See accompanying notes to financial statements. |
31
CUTLER EQUITY FUND
FINANCIAL HIGHLIGHTS |
| Per Share Data for a Share Outstanding Throughout Each Year |
| | | Years Ended June 30, | |
| | | 2018 | | | 2017 | | | 2016 | | | 2015 | | | 2014 | |
| Net asset value at beginning of year | | $ | 18.39 | | | $ | 17.15 | | | $ | 17.06 | | | $ | 17.33 | | | $ | 14.94 | |
| | | | | | | | | | | | | | | | | | | | | |
| Income from investment operations: | | | | | | | | | | | | | | | | | | | | |
| Net investment income | | | 0.28 | | | | 0.28 | | | | 0.30 | | | | 0.25 | | | | 0.22 | |
| Net realized and unrealized gains on investments | | | 1.68 | | | | 1.42 | | | | 0.88 | | | | 0.02 | | | | 2.47 | |
| Total from investment operations | | | 1.96 | | | | 1.70 | | | | 1.18 | | | | 0.27 | | | | 2.69 | |
| | | | | | | | | | | | | | | | | | | | | |
| Less distributions from: | | | | | | | | | | | | | | | | | | | | |
| Net investment income | | | (0.28 | ) | | | (0.29 | ) | | | (0.28 | ) | | | (0.25 | ) | | | (0.22 | ) |
| Net realized gains | | | (0.25 | ) | | | (0.17 | ) | | | (0.81 | ) | | | (0.29 | ) | | | (0.08 | ) |
| Total distributions | | | (0.53 | ) | | | (0.46 | ) | | | (1.09 | ) | | | (0.54 | ) | | | (0.30 | ) |
| | | | | | | | | | | | | | | | | | | | | |
| Net asset value at end of year | | $ | 19.82 | | | $ | 18.39 | | | $ | 17.15 | | | $ | 17.06 | | | $ | 17.33 | |
| | | | | | | | | | | | | | | | | | | | | |
Total return (a) | | | 10.63 | % | | | 9.97 | % | | | 7.40 | % | | | 1.49 | % | | | 18.13 | % |
| | | | | | | | | | | | | | | | | | | | | |
| Net assets at end of year (000’s) | | $ | 150,597 | | | $ | 141,585 | | | $ | 132,136 | | | $ | 122,739 | | | $ | 122,230 | |
| | | | | | | | | | | | | | | | | | | | | |
| Ratios/supplementary data: | | | | | | | | | | | | | | | | | | | | |
| | | | | | | | | | | | | | | | | | | | | |
| Ratio of net expenses to average net assets | | | 1.15 | %(b) | | | 1.14 | % | | | 1.15 | % | | | 1.15 | % | | | 1.15 | % |
| | | | | | | | | | | | | | | | | | | | | |
| Ratio of net investment income to average net assets | | | 1.41 | % | | | 1.54 | % | | | 1.79 | % | | | 1.42 | % | | | 1.37 | % |
| | | | | | | | | | | | | | | | | | | | | |
| Portfolio turnover rate | | | 10 | % | | | 5 | % | | | 11 | % | | | 14 | % | | | 8 | % |
(a) | Total return is a measure of the change in value of an investment in the Fund over the period covered, which assumes any dividends or capital gains distributions are reinvested in shares of the Fund. Returns shown do not reflect the deduction of taxes a shareholder would pay on Fund distributions or the redemption of Fund shares. |
(b) | Absent advisory fee reductions, the ratio of expenses to net assets would have been 1.16% (Note 3). |
See accompanying notes to financial statements. |
32
CUTLER FIXED INCOME FUND
FINANCIAL HIGHLIGHTS |
| Per Share Data for a Share Outstanding Throughout Each Year |
| | | Years Ended June 30, | |
| | | 2018 | | | 2017 | | | 2016 | | | 2015 | | | 2014 | |
| Net asset value at beginning of year | | $ | 8.53 | | | $ | 9.69 | | | $ | 10.18 | | | $ | 10.01 | | | $ | 9.98 | |
| | | | | | | | | | | | | | | | | | | | | |
| Income (loss) from investment operations: | | | | | | | | | | | | | | | | | | | | |
| Net investment income (loss) | | | (0.11 | ) | | | 0.25 | | | | 0.79 | | | | 0.49 | | | | 0.05 | |
| Net realized and unrealized gains (losses) on investments | | | 0.06 | (a) | | | (0.72 | ) | | | (0.50 | ) | | | (0.12 | ) | | | 0.17 | |
| Total from investment operations | | | (0.05 | ) | | | (0.47 | ) | | | 0.29 | | | | 0.37 | | | | 0.22 | |
| | | | | | | | | | | | | | | | | | | | | |
| Less distributions from: | | | | | | | | | | | | | | | | | | | | |
| Net investment income | | | — | | | | (0.69 | ) | | | (0.78 | ) | | | (0.20 | ) | | | (0.14 | ) |
| Net realized gains | | | — | | | | — | | | | — | | | | — | | | | (0.05 | ) |
| Total distributions | | | — | | | | (0.69 | ) | | | (0.78 | ) | | | (0.20 | ) | | | (0.19 | ) |
| | | | | | | | | | | | | | | | | | | | | |
| Net asset value at end of year | | $ | 8.48 | | | $ | 8.53 | | | $ | 9.69 | | | $ | 10.18 | | | $ | 10.01 | |
| | | | | | | | | | | | | | | | | | | | | |
Total return(b) | | | (0.59 | %) | | | (5.02 | %) | | | 2.91 | % | | | 3.65 | % | | | 2.26 | % |
| | | | | | | | | | | | | | | | | | | | | |
| Net assets at end of year (000’s) | | $ | 12,314 | | | $ | 15,071 | | | $ | 18,289 | | | $ | 17,431 | | | $ | 14,941 | |
| | | | | | | | | | | | | | | | | | | | | |
| Ratios/supplementary data: | | | | | | | | | | | | | | | | | | | | |
| | | | | | | | | | | | | | | | | | | | | |
| Ratio of net expenses to average net assets | | | 1.65 | %(c) | | | 1.46 | % | | | 1.36 | % | | | 1.41 | % | | | 1.52 | % |
| | | | | | | | | | | | | | | | | | | | | |
| Ratio of net investment income (loss) to average net assets | | | (1.04 | %)(d) | | | 2.91 | %(d) | | | 8.42 | %(d) | | | 4.95 | %(d) | | | 0.61 | % |
| | | | | | | | | | | | | | | | | | | | | |
| Portfolio turnover rate | | | 36 | % | | | 24 | % | | | 71 | % | | | 85 | % | | | 55 | % |
(a) | Realized and unrealized gains per share in this caption are balancing amounts necessary to reconcile the change in net asset value per share for the period, and may not reconcile with the aggregate gains (losses) in the Fund’s Statement of Operations due to share transactions for the period. |
(b) | Total return is a measure of the change in value of an investment in the Fund over the period covered, which assumes any dividends or capital gains distributions are reinvested in shares of the Fund. Returns shown do not reflect the deduction of taxes a shareholder would pay on Fund distributions or the redemption of Fund shares. |
(c) | Ratio was determined after voluntary advisory fee waivers by the Adviser. If such fee waivers had not occurred, the ratio would have been 1.65% (Note 3). |
(d) | Ratio includes income from prepayment penalties received for IO securities of 3.75%, 11.29%, 6.90% and 4.57% of average daily net assets for the years ended June 30, 2018, 2017, 2016 and 2015, respectively (Note 7). |
See accompanying notes to financial statements. |
33
CUTLER EMERGING MARKETS FUND
FINANCIAL HIGHLIGHTS |
| Per Share Data for a Share Outstanding Throughout Each Period |
| | | Year
Ended
June 30,
2018 | | | Year
Ended
June 30,
2017 | | | Period
Ended
June 30,
2016(a) | |
| Net asset value at beginning of period | | $ | 9.42 | | | $ | 8.38 | | | $ | 10.00 | |
| | | | | | | | | | | | | |
| Income (loss) from investment operations: | | | | | | | | | | | | |
| Net investment income | | | 0.07 | | | | 0.06 | | | | 0.10 | |
| Net realized and unrealized gains (losses) on investments | | | 0.21 | | | | 1.03 | | | | (1.65 | ) |
| Total from investment operations | | | 0.28 | | | | 1.09 | | | | (1.55 | ) |
| | | | | | | | | | | | | |
| Less distributions from: | | | | | | | | | | | | |
| Net investment income | | | (0.08 | ) | | | (0.05 | ) | | | (0.07 | ) |
| | | | | | | | | | | | | |
| Net asset value at end of period | | $ | 9.62 | | | $ | 9.42 | | | $ | 8.38 | |
| | | | | | | | | | | | | |
Total return (b) | | | 2.95 | % | | | 13.14 | % | | | (15.43 | %)(c) |
| | | | | | | | | | | | | |
| Net assets at end of period (000’s) | | $ | 13,953 | | | $ | 12,112 | | | $ | 8,128 | |
| | | | | | | | | | | | | |
| Ratios/supplementary data: | | | | | | | | | | | | |
| | | | | | | | | | | | | |
| Ratio of total expenses to average net assets | | | 2.07 | % | | | 2.60 | % | | | 3.85 | %(e) |
| | | | | | | | | | | | | |
Ratio of net expenses to average net assets (d) | | | 1.55 | % | | | 1.56 | %(f) | | | 1.55 | %(e) |
| | | | | | | | | | | | | |
Ratio of net investment income to average net assets (d) | | | 0.78 | % | | | 0.72 | % | | | 1.56 | %(e) |
| | | | | | | | | | | | | |
| Portfolio turnover rate | | | 2 | % | | | 15 | % | | | 10 | %(c) |
(a) | Represents the period from the commencement of operations (July 2, 2015) through June 30, 2016. |
(b) | Total return is a measure of the change in value of an investment in the Fund over the period covered, which assumes any dividends or capital gains distributions are reinvested in shares of the Fund. Returns shown do not reflect the deduction of taxes a shareholder would pay on Fund distributions or the redemption of Fund shares. |
(c) | Not annualized. |
(d) | Ratio was determined after advisory fee reductions and expense reimbursements (Note 3). |
(e) | Annualized. |
(f) | Includes federal excise taxes of 0.01% of average net assets with respect to the year ended June 30, 2017. |
See accompanying notes to financial statements. |
34
THE CUTLER TRUST
NOTES TO FINANCIAL STATEMENTS
June 30, 2018
1. Organization
Cutler Equity Fund, Cutler Fixed Income Fund and Cutler Emerging Markets Fund (individually, a “Fund” and collectively, the “Funds”) are each a diversified series of The Cutler Trust (the “Trust”). The Trust is a Delaware statutory trust that is registered as an open-end management investment company under the Investment Company Act of 1940, as amended (the “1940 Act”). Under its Trust Instrument, the Trust is authorized to issue an unlimited number of Fund shares of beneficial interest without par value.
Cutler Equity Fund seeks current income and long-term capital appreciation.
Cutler Fixed Income Fund seeks to achieve high income over the long-term.
Cutler Emerging Markets Fund seeks current income and long-term capital appreciation.
2. Significant Accounting Policies
The following summarizes the significant accounting policies of the Funds. The policies are in conformity with accounting principles generally accepted in the United States of America (“GAAP”). Each Fund follows accounting and reporting guidance under Financial Accounting Standards Board (“FASB”) Accounting Standards Codification Topic 946, “Financial Services – Investment Companies.”
New Accounting Pronouncement — In March, 2017, FASB issued Accounting Standards Update No. 2017-08 - Receivables – Nonrefundable Fees and Other Costs (Subtopic 310-20): Premium Amortization on Purchased Callable Debt Securities (the “ASU”). The ASU shortens the amortization period for certain callable debt securities, held at a premium, to be amortized to the earliest call date. The ASU does not require an accounting change for securities held at a discount, which continue to be amortized to maturity. The ASU is effective for fiscal years and interim periods within those fiscal years beginning after December 15, 2018. Management is currently evaluating the impact, if any, of applying the ASU.
Securities Valuation — Portfolio securities are valued as of the close of regular trading on the New York Stock Exchange (“NYSE”) (normally, 4:00 p.m., Eastern time) on each day the NYSE is open. Exchange traded securities are valued using the last reported sales price on the exchanges on which they are primarily traded. When using the last sales price and when the market is considered to be active, the security will be classified within Level 1 of the fair value hierarchy (see below). In the absence of a sale, such securities are valued at the mean of the last bid and asked price. Securities which are quoted by NASDAQ are valued at the NASDAQ Official Closing Price. Securities principally traded in non-U.S. markets that may close at different times than U.S. markets are typically fair valued by an independent pricing service and translated from the local currency into U.S. dollars using currency exchange rates supplied by an independent pricing quotation service. Non-exchange traded securities for which over-the-counter quotations
35
THE CUTLER TRUST
NOTES TO FINANCIAL STATEMENTS (Continued)
are available are generally valued at the closing bid price. Fixed income securities are generally valued using prices provided by an independent pricing service. The independent pricing service uses information with respect to transactions in bonds, quotations from bond dealers, market transactions in comparable securities, and various relationships between securities in determining the prices. Investments in shares of other open-end investment companies are valued at their net asset value (“NAV”) as reported by such companies.
The Funds value securities at fair value pursuant to procedures adopted by the Trust’s Board of Trustees (the “Board”) if (1) market quotations are insufficient or not readily available or (2) the Funds’ investment adviser believes that the prices or values available are unreliable due to, among other things, the occurrence of events after the close of the securities markets on which the Funds’ securities primarily trade but before the time as of which the Funds calculate their NAVs. In instances where the investment adviser believes that the prices received from the independent pricing service are unreliable, proprietary valuation models may be used that consider benchmark yield curves, estimated default rates, coupon rates, anticipated timing of principal repayments and other unique security features to estimate the relevant cash flows, which are discounted to calculate the fair values. Fair valued securities will be classified as Level 2 or 3 within the fair value hierarchy, depending on the inputs used.
The Board approves the independent pricing services used by the Funds.
GAAP establishes a single authoritative definition of fair value, sets out a framework for measuring fair value and requires disclosures about fair value measurements.
Various inputs are used in determining the value of each Fund’s investments. These inputs are summarized in the three broad levels listed below:
| | ● | Level 1 – quoted unadjusted prices for identical instruments in active markets to which the Fund has access at the date of measurement. |
| | ● | Level 2 – quoted prices for similar instruments in active markets; quoted prices for identical or similar instruments in markets that are not active; and model derived valuations in which all significant inputs and significant value drivers are observable. Level 2 inputs are those in markets for which there are few transactions, the prices are not current, little public information exists or instances where prices vary substantially over time or among brokered market makers. |
| | ● | Level 3 – model derived valuations in which one or more significant inputs or significant value drivers are unobservable. Unobservable inputs are those inputs that reflect the Fund’s own assumptions that market participants would use to price the asset or liability based on the best available information. |
36
THE CUTLER TRUST
NOTES TO FINANCIAL STATEMENTS (Continued)
Fixed income securities held by Cutler Fixed Income Fund are classified as Level 2 because the values for the fixed income securities are based on prices that utilize various “other significant observable inputs” including bid and ask quotations, prices of similar securities and interest rates, among other factors.
Securities of Cutler Emerging Markets Fund traded in foreign markets may be classified as Level 2 despite the availability of closing prices because such securities are typically fair valued by an independent pricing service approved by the Board. These foreign securities may be priced at their fair value because the value of the securities may be materially affected by events occurring before the Fund’s pricing time but after the close of the primary markets or exchanges on which such foreign securities are traded. These intervening events might be country-specific (e.g., natural disaster, economic or political developments, interest rate change); issuer-specific (e.g., earnings report, merger announcement); or U.S. markets-specific (such as a significant movement in the U.S. markets that is deemed to affect the value of foreign securities). The pricing service uses an automated system incorporating a model based on multiple parameters, including a security’s local closing price, relevant general and sector indices, currency fluctuations, trading in depositary receipts and futures, if applicable, and/or research valuations by its staff, in determining what it believes is the fair value of the securities.
The inputs or methodology used for valuing securities are not necessarily an indication of the risks associated with investing in those securities. The inputs used to measure fair value may fall into different levels of the fair value hierarchy. In such cases, for disclosure purposes, the level in the fair value hierarchy within which the fair value measurement falls in its entirety is determined based on the lowest level input that is significant to the fair value measurement.
The following is a summary of the inputs used to value each Fund’s investments as of June 30, 2018 by security type:
| Cutler Equity Fund | | Level 1 | | | Level 2 | | | Level 3 | | | Total | |
| Common Stocks | | $ | 149,459,259 | | | $ | — | | | $ | — | | | $ | 149,459,259 | |
| Money Market Funds | | | 1,351,153 | | | | — | | | | — | | | | 1,351,153 | |
| Total | | $ | 150,810,412 | | | $ | — | | | $ | — | | | $ | 150,810,412 | |
37
THE CUTLER TRUST
NOTES TO FINANCIAL STATEMENTS (Continued)
| Cutler Fixed Income Fund | | Level 1 | | | Level 2 | | | Level 3 | | | Total | |
| U.S. Treasury Obligations | | $ | — | | | $ | 2,447,109 | | | $ | — | | | $ | 2,447,109 | |
| U.S. Government Agency Obligations | | | — | | | | 5,442,805 | | | | — | | | | 5,442,805 | |
| Mortgage-Backed Securities | | | — | | | | 2,212,080 | | | | — | | | | 2,212,080 | |
| Corporate Bonds | | | — | | | | 1,436,546 | | | | — | | | | 1,436,546 | |
| Money Market Funds | | | 708,416 | | | | — | | | | — | | | | 708,416 | |
| Total | | $ | 708,416 | | | $ | 11,538,540 | | | $ | — | | | $ | 12,246,956 | |
| Cutler Emerging Markets Fund | | Level 1 | | | Level 2 | | | Level 3 | | | Total | |
| Common Stocks | | $ | 4,257,892 | | | $ | 5,860,330 | | | $ | — | | | $ | 10,118,222 | |
| Preferred Stocks | | | 622,899 | | | | — | | | | — | | | | 622,899 | |
| Exchange-Traded Funds | | | 2,628,122 | | | | — | | | | — | | | | 2,628,122 | |
| Money Market Funds | | | 516,877 | | | | — | | | | — | | | | 516,877 | |
| Total | | $ | 8,025,790 | | | $ | 5,860,330 | | | $ | — | | | $ | 13,886,120 | |
Refer to each Fund’s Schedule of Investments for a listing of the securities by security type and sector or industry type. It is the Funds’ policy to recognize transfers into or out of any Level at the end of the reporting period. As of June 30, 2018, Cutler Equity Fund and Cutler Emerging Markets Fund did not have any transfers into or out of any Level. There were no Level 3 securities held by the Funds as of June 30, 2018.
The following is a reconciliation of Level 3 investments of Cutler Fixed Income Fund for which significant unobservable inputs were used to determine fair value between June 30, 2017 and June 30, 2018:
| | | Cutler Fixed
Income Fund | |
| Balance as of June 30, 2017 | | $ | 574,169 | |
| Transfers out of Level 3* | | | (5,418 | ) |
| Sales | | | (442,797 | ) |
| Realized losses | | | (159,479 | ) |
| Amortization | | | (113,533 | ) |
| Net change in unrealized appreciation (depreciation) | | | 147,058 | |
| Balance as of June 30, 2018 | | $ | — | |
* | Transfers out of Level 3 occurred due to the availability of a vendor price during the year. |
38
THE CUTLER TRUST
NOTES TO FINANCIAL STATEMENTS (Continued)
There were no derivative instruments held by the Funds during the year ended or as of June 30, 2018.
Share valuation — The NAV per share of each Fund is calculated daily by dividing the total value of its assets, less liabilities, by the number of shares outstanding. The offering price and redemption price per share of each Fund is equal to its NAV per share.
Common Expenses — Expenses of the Trust not attributable solely to one of the Funds are allocated among the Funds based on relative net assets of each Fund or the nature of the expense and the relative applicability to each Fund.
Estimates — The preparation of financial statements in conformity with GAAP requires management to make estimates and assumptions that affect the reported amounts of assets and liabilities and disclosures of contingent assets and liabilities at the date of the financial statements and the reported amounts of increases and decreases in net assets from operations during the reporting period. Actual results could differ from those estimates.
Investment Transactions, Investment Income and Realized Gains and Losses — Investment transactions are accounted for on trade date. Dividend income is recorded on the ex-dividend date. Interest income is recorded as earned and prepayment fee income, if any, is recorded upon receipt of such income, as that is when information surrounding these transactions become known. Discounts and premiums on fixed income securities are amortized using the effective interest method over the estimated lives of the securities. Realized gains and losses on investments sold are determined on a specific identification basis. Withholding taxes on foreign dividends and foreign capital gains taxes, when applicable, have been recorded in accordance with the Trust’s understanding of the applicable country’s tax rules and rates.
Foreign Currency Translation — Assets and securities denominated in or expected to settle in foreign currencies are translated into U.S. dollars based on exchange rates on the following basis:
| | A. | The values of investment securities and other assets and liabilities are translated as of the close of the NYSE each day. |
| | B. | Purchases and sales of investment securities and income and expenses are translated at the rate of exchange prevailing as of 4:00 p.m. on the respective date of such transactions. |
| | C. | The Funds do not isolate that portion of the results of operations caused by fluctuations in foreign exchange rates on investments from those caused by changes in market prices of securities held. Such fluctuations are included with the net realized and unrealized gains or losses on investments. |
Reported net realized foreign exchange gains or losses arise from: (1) purchases and sales of foreign currencies; (2) currency gains or losses realized between the trade and settlement dates on securities transactions; and (3) the difference between the amounts of dividends, interest and
39
THE CUTLER TRUST
NOTES TO FINANCIAL STATEMENTS (Continued)
foreign withholding taxes recorded on the Fund’s books and the U.S. dollar equivalent of the amounts actually received or paid. Reported net unrealized foreign exchange gains and losses arise from changes in the value of assets and liabilities, excluding changes in foreign exchange rates on investments as discussed in the Note 2. C. above, that result from changes in exchange rates.
Distributions to Shareholders — Dividends from net investment income, if any, are declared and paid quarterly to shareholders of Cutler Equity Fund and Cutler Fixed Income Fund and are declared and paid annually to shareholders of Cutler Emerging Markets Fund. Capital gain distributions, if any, are distributed to shareholders annually. Distributions are based on amounts calculated in accordance with applicable federal income tax regulations, which may differ from GAAP. These differences are due primarily to differing treatments of income and gains on various investment securities held by the Funds, timing differences and differing characterizations of distributions made by the Funds. Dividends and distributions are recorded on the ex-dividend date. The tax character of distributions paid by the Funds during the years ended June 30, 2018 and 2017 was as follows:
| | | Year
Ended | | | Ordinary
Income | | | Long-Term
Capital Gains | | | Total
Distributions | |
Cutler Equity Fund | | | 6/30/2018 | | | $ | 2,123,374 | | | $ | 1,915,091 | | | $ | 4,038,465 | |
| | | | | 6/30/2017 | | | $ | 2,191,035 | | | $ | 1,318,085 | | | $ | 3,509,120 | |
| | | Year
Ended | | | Ordinary
Income | | | Long-Term
Capital Gains | | | Total
Distributions | |
| Cutler Fixed Income Fund | | | 6/30/2018 | | | $ | — | | | $ | — | | | $ | — | |
| | | | 6/30/2017 | | | $ | 1,352,018 | | | $ | — | | | $ | 1,352,018 | |
| | | Year
Ended | | | Ordinary
Income | | | Long-Term
Capital Gains | | | Total
Distributions | |
| Cutler Emerging Markets Fund | | | 6/30/2018 | | | $ | 157,460 | | | $ | — | | | $ | 157,460 | |
| | | | 6/30/2017 | | | $ | 80,337 | | | $ | — | | | $ | 80,337 | |
Federal income tax — Each Fund has qualified and intends to continue to qualify each year as a “regulated investment company” under Subchapter M of the Internal Revenue Code of 1986, as amended (the “Code”). By so qualifying, the Funds will not be subject to federal income taxes to the extent that they distribute their net investment income and any net realized capital gains in accordance with the Code.
40
THE CUTLER TRUST
NOTES TO FINANCIAL STATEMENTS (Continued)
In order to avoid imposition of the excise tax applicable to regulated investment companies, it is also each Fund’s intention to declare as dividends in each calendar year at least 98% of its net investment income (earned during the calendar year) and 98.2% of its net realized capital gains (earned during the twelve months ended October 31) plus undistributed amounts from prior years.
The following information is computed on a tax basis for each item as of June 30, 2018:
| | | Cutler Equity
Fund | | | Cutler Fixed
Income Fund | | | Cutler
Emerging
Markets Fund | |
| Tax cost of portfolio investments and foreign currencies | | $ | 98,154,908 | | | $ | 13,147,265 | | | $ | 12,474,733 | |
| Gross unrealized appreciation | | $ | 55,465,037 | | | $ | 82,642 | | | $ | 2,208,398 | |
| Gross unrealized depreciation | | | (2,809,533 | ) | | | (982,951 | ) | | | (797,011 | ) |
| Net unrealized appreciation (depreciation) on investments and foreign currencies | | | 52,655,504 | | | | (900,309 | ) | | | 1,411,387 | |
| Undistributed ordinary income | | | 40,257 | | | | — | | | | 56,423 | |
| Undistributed long-term gains | | | 2,414,940 | | | | — | | | | — | |
| Other temporary differences | | | (5,745 | ) | | | — | | | | — | |
| Accumulated capital and other losses | | | — | | | | (2,101,022 | ) | | | (201,628 | ) |
| Accumulated earnings (deficit) | | $ | 55,104,956 | | | $ | (3,001,331 | ) | | $ | 1,266,182 | |
The difference between the federal income tax cost of portfolio investments and the financial statement cost for each Fund is due to certain differences in the recognition of capital gains and losses under income tax regulations and GAAP. These “book/tax” differences are temporary in nature and are related to losses deferred due to wash sales for Cutler Equity Fund, losses deferred due to wash sales and amortization of bond premiums and discounts for Cutler Fixed Income Fund and losses deferred due to wash sales and holdings classified as passive foreign investment companies (PFICs) for Cutler Emerging Markets Fund.
For the year ended June 30, 2018, the Funds made the following reclassifications on the Statements of Assets and Liabilities:
| | | Cutler Equity
Fund | | | Cutler Fixed
Income Fund | | | Cutler
Emerging
Markets Fund | |
| Paid-in capital | | $ | — | | | $ | (41,851 | ) | | $ | — | |
| Undistributed net investment income (loss) | | | — | | | | 61,595 | | | | (1,155 | ) |
| Accumulated net realized gains (losses) from investment transactions | | | — | | | | (19,744 | ) | | | 1,155 | |
41
THE CUTLER TRUST
NOTES TO FINANCIAL STATEMENTS (Continued)
Such reclassifications, the result of permanent differences between financial statement and income tax reporting requirements, have no effect on each Fund’s net assets or NAV per share.
During the year ended June 30, 2018, Cutler Equity Fund utilized $729,377 of capital loss carryforwards to offset current year gains.
As of June 30, 2018, Cutler Fixed Income Fund had short-term and long-term capital loss carryforwards, with no expiration date, of $296,359 and $1,674,814, respectively. As of June 30, 2018, Cutler Emerging Markets Fund had short-term and long-term capital loss carryforwards, with no expiration date, of $103,849 and $97,779, respectively. These capital loss carryforwards may be utilized in future years to offset net realized capital gains, if any, prior to distributing such gains to shareholders.
Late year ordinary losses (incurred after December 31, 2017 and within the taxable year) are deemed to arise on the first day of a Fund’s next taxable year. For the year ended June 30, 2018, Cutler Fixed Income Fund intends to defer until July 1, 2018 for federal income tax purposes late ordinary losses in the amounts of $129,849.
The Funds recognize the tax benefits or expenses of uncertain tax positions only when the position is “more-likely-than-not” to be sustained assuming examination by tax authorities. Management has reviewed the tax positions taken on Federal income tax returns for all open tax years (tax years ended June 30, 2015 through June 30, 2018) and has concluded that no provision for unrecognized tax benefits or expenses is required in these financial statements.
3. Transactions with Related Parties
Investment Adviser — Cutler Investment Counsel, LLC (the “Adviser”) is the investment adviser to the Funds. Pursuant to Investment Advisory Agreements, Cutler Equity Fund, Cutler Fixed Income Fund and Cutler Emerging Markets Fund pay the Adviser a fee, which is accrued daily and paid monthly, at an annual rate of 0.75%, 0.50% and 0.85%, respectively, of average daily net assets.
The Adviser has entered into an Expense Limitation Agreement under which it has contractually agreed, until October 31, 2019, to reduce its advisory fees and to pay the ordinary operating expenses of Cutler Equity Fund and Cutler Emerging Markets Fund to the extent necessary to limit annual ordinary operating expenses to 1.15% and 1.55%, respectively, of average daily net assets. (Ordinary operating expenses exclude brokerage costs, taxes, interest, acquired fund fees and expenses and extraordinary expenses.) Any such fee reductions by the Adviser, or payments by the Adviser of expenses which are the Funds’ obligation, are subject to repayment by the Funds, provided that the repayment does not cause the ordinary operating expenses of Cutler Equity Fund and Cutler Emerging Markets Fund to exceed the annual expense limit of 1.15% and 1.55%, respectively, and provided further that the fees and expenses which are the subject of the repayment were incurred within three years of the repayment. During the year ended June 30,
42
THE CUTLER TRUST
NOTES TO FINANCIAL STATEMENTS (Continued)
2018, the Adviser reduced its advisory fees by $12,154 and $74,399 for Cutler Equity Fund and Cutler Emerging Markets Fund, respectively. During the year ended June 30, 2018, the Adviser voluntarily waived $240 of its investment advisory fees from Cutler Fixed Income Fund. This amount is not subject to recapture in future periods.
As of June 30, 2018, the Adviser may seek repayment of investment advisory fee reductions and expense reimbursements no later than the dates as stated below:
| | | June 30,
2019 | | | June 30,
2020 | | | June 30,
2021 | | | Total | |
| Cutler Equity Fund | | $ | — | | | $ | — | | | $ | 12,154 | | | $ | 12,154 | |
| Cutler Emerging Markets Fund | | | 122,966 | | | | 100,955 | | | | 74,399 | | | | 298,320 | |
Certain officers of the Trust are also officers of the Adviser.
Other Service Providers — Ultimus Fund Solutions, LLC (“Ultimus”) provides administration, fund accounting and transfer agency services to the Funds. Each Fund pays Ultimus fees in accordance with the agreements for such services. In addition, the Funds pay out of-pocket expenses including, but not limited to, postage, supplies and costs of pricing the Funds’ portfolio securities. Certain officers of the Trust are also officers of Ultimus, or of Ultimus Fund Distributors, LLC (the “Distributor”), the principal underwriter of the Funds. The Distributor is a wholly-owned subsidiary of Ultimus.
Compensation of Trustees — Trustees and officers affiliated with the Adviser or Ultimus are not compensated by the Trust for their services. Each Trustee who is not an affiliated person of the Adviser or Ultimus receives from the Trust an annual retainer of $7,500, payable quarterly, plus a fee of $1,875 for attendance at each meeting of the Board, in addition to reimbursement of travel and other expenses incurred in attending the meetings.
4. Shareholder Service Plan
Each Fund may pay shareholder servicing fees not to exceed an annual rate of 0.25% of its average daily net assets. These fees may be paid to various financial institutions that provide shareholder and account maintenance services. During the year ended June 30, 2018, Cutler Equity Fund, Cutler Fixed Income Fund and Cutler Emerging Markets Fund paid $223,947, $16 and $0, respectively, for such services.
5. Securities Transactions
During the year ended June 30, 2018, cost of purchases and proceeds from sales and maturities of investment securities, other than short-term investments and U.S. government securities, totaled $14,396,795 and $15,811,255, respectively, for Cutler Equity Fund; $1,349,644 and $666,961,
43
THE CUTLER TRUST
NOTES TO FINANCIAL STATEMENTS (Continued)
respectively, for Cutler Fixed Income Fund; and $1,849,787 and $250,906, respectively, for Cutler Emerging Markets Fund. During the year ended June 30, 2018, cost of purchases and proceeds from sales and maturities of U.S. government securities totaled $3,244,782 and $4,978,537, respectively, for Cutler Fixed Income Fund.
6. Contingencies and Commitments
The Funds indemnify the Trust’s officers and Trustees for certain liabilities that might arise from their performance of their duties to the Funds. Additionally, in the normal course of business the Funds enter into contracts that contain a variety of representations and warranties and which provide general indemnifications. The Funds’ maximum exposure under these arrangements is unknown, as this would involve future claims that may be made against the Funds that have not yet occurred. However, based on experience, the Trust expects the risk of loss to be remote.
7. Risks Associated with Mortgage-Backed Securities
Cutler Fixed Income Fund invests in mortgage-backed securities, which are subject to default risk and prepayment risk, especially when interest rates decline. Prepayment risk is the risk that the principal on mortgage-backed securities may be prepaid at any time, which could reduce yield and market value. This could reduce the effective maturity of a mortgage-backed security and cause the Fund to reinvest its assets at a lower prevailing interest rate. Mortgage-backed securities are also subject to extension risk, which is the risk that rising interest rates will increase the effective maturity of mortgage-backed securities due to the deceleration of prepayments. Mortgage-backed securities may also be subject to risks unique to the housing industry, including mortgage lending practices, defaults, foreclosures and changes in real estate values.
Stripped Mortgage-Backed Securities (“SMBS”) are derivative multi-class mortgage-backed securities. SMBS are usually structured with two classes that receive different proportions of the interest and principal distributions on a pool of mortgage assets. An SMBS will have one class that will receive all of the interest (the interest-only or “IO” class), while the other class will receive the entire principal (the principal-only or “PO” class). IOs are more volatile and sensitive to the rate of prepayments than other types of mortgage-backed securities, and their value can fall dramatically in response to rapid or unexpected changes in the mortgage, interest rate or economic environment. As of June 30, 2018, 17.1% of the value of Cutler Fixed Income Fund’s net assets were invested in IO classes of various SMBS. Payments received from IOs are included in interest income on the Fund’s Statement of Operations. Because no principal will be received at the maturity of an IO, adjustments are made to the cost of the security on a monthly basis until maturity. These adjustments are included in interest income on the Fund’s Statement of Operations. Additionally, any prepayment penalties received from an IO are included in interest income on the Fund’s Statement of Operations. During the year ended June 30, 2018, $517,551 of prepayment penalties on IOs was received by Cutler Fixed Income Fund.
44
THE CUTLER TRUST
NOTES TO FINANCIAL STATEMENTS (Continued)
8. Risks Associated with Emerging Markets
In seeking to meet its investment objective, under normal conditions, at least 80% of Cutler Emerging Markets Fund’s assets will be invested in a diversified portfolio of securities of issuers whose principal activities are in, or economically tied to, emerging markets countries selected in accordance with the Adviser’s long standing dividend focused investment philosophy. Accordingly, Cutler Emerging Markets Fund is subject to the following investment risks:
Foreign Investment Risk — Investments in foreign securities involve different risks than U.S. investments, including fluctuations in currency exchange rates, potentially unstable political and economic structures, less efficient trade settlement practices, reduced availability of public information, and lack of uniform financial reporting and regulatory practices similar to those that apply to U.S. issuers. Foreign stock markets may also be less liquid and more volatile than U.S. stock markets.
Emerging Markets Risk — The economies of emerging market countries may be more dependent on relatively few industries that may be highly vulnerable to local and global changes. The governments of emerging market countries may be less stable than the governments of more developed countries. Countries in the emerging markets generally have less developed securities markets or exchanges, and less developed legal and accounting systems, reduced availability of public information, and lack of uniform financial reporting and regulatory practices, which in turn may adversely impact Cutler Emerging Markets Fund’s ability to calculate accurately the intrinsic value of the securities. Securities of emerging market companies may be less liquid and more volatile than securities in countries with more mature markets. The value of emerging market currencies may fluctuate more than the currencies of countries with more mature markets. Investments in emerging market countries may be subject to greater risks of government restrictions, including confiscatory taxation, expropriation or nationalization of a company’s assets, restrictions on foreign ownership of local companies and restrictions on withdrawing assets from the country. Investments in securities of issuers in emerging market countries may be considered speculative and higher risk.
Currency Risk — Because Cutler Emerging Markets Fund holds securities valued in foreign currencies and holds foreign currencies when it purchases and sells foreign securities, changes in exchange rates will impact the value of the Fund’s assets. Thus, investments in foreign securities involve currency risk, which is the risk that the values of the foreign securities and other assets denominated in foreign currencies will decrease due to adverse changes in the value of the U.S. dollar relative to the value of foreign currencies.
9. Subsequent Events
The Funds are required to recognize in the financial statements the effects of all subsequent events that provide additional evidence about conditions that existed as of the date of the Statements of Assets and Liabilities. For non-recognized subsequent events that must be disclosed to keep the
45
THE CUTLER TRUST
NOTES TO FINANCIAL STATEMENTS (Continued)
financial statements from being misleading, the Funds are required to disclose the nature of the event as well as an estimate of its financial effect, or a statement that such an estimate cannot be made. Management has evaluated subsequent events through the issuance of these financial statements and has noted no such events.
46
THE CUTLER TRUST
REPORT OF INDEPENDENT REGISTERED PUBLIC ACCOUNTING FIRM
To the Shareholders and Board of Trustees of
The Cutler Trust
Opinion on the Financial Statements
We have audited the accompanying statements of assets and liabilities, including the schedules of investments, of The Cutler Trust, comprising Cutler Equity Fund, Cutler Fixed Income Fund, and Cutler Emerging Markets Fund (the “Funds”), as of June 30, 2018, and the related statements of operations for the year then ended, the statements of changes in net assets, including the related notes, and the financial highlights for each of the two years in the period then ended (collectively referred to as the “financial statements”). In our opinion, the financial statements present fairly, in all material respects, the financial position of each of the Funds as of June 30, 2018, the results of their operations for the year then ended, the changes in their net assets and the financial highlights for each of the two years in the period then ended, in conformity with accounting principles generally accepted in the United States of America.
The Funds’ financial highlights for the periods ended June 30, 2016 and prior, were audited by other auditors whose report dated August 29, 2016, expressed an unqualified opinion on those financial highlights.
Basis for Opinion
These financial statements are the responsibility of the Funds’ management. Our responsibility is to express an opinion on the Funds’ financial statements based on our audits. We are a public accounting firm registered with the Public Company Accounting Oversight Board (United States) (“PCAOB”) and are required to be independent with respect to the Funds in accordance with the U.S. federal securities laws and the applicable rules and regulations of the Securities and Exchange Commission and the PCAOB.
We conducted our audits in accordance with the standards of the PCAOB. Those standards require that we plan and perform the audit to obtain reasonable assurance about whether the financial statements are free of material misstatement, whether due to error or fraud.
Our audits include performing procedures to assess the risks of material misstatement of the financial statements, whether due to error or fraud, and performing procedures that respond to those risks. Such procedures include examining, on a test basis, evidence regarding the amounts and disclosures in the financial statements and confirmation of securities owned as of June 30, 2018, by correspondence with the custodian. Our audits also included evaluating the accounting principles used and significant estimates made by management, as well as evaluating the overall presentation of the financial statements. We believe that our audits provide a reasonable basis for our opinion.
We have served as the Funds’ auditor since 2017.
COHEN & COMPANY, LTD.
Cleveland, Ohio
August 29, 2018
47
THE CUTLER TRUST
ABOUT YOUR FUND’S EXPENSES (Unaudited)
We believe it is important for you to understand the impact of costs on your investment. All mutual funds have operating expenses. As a shareholder of the Funds, you incur ongoing costs, including management fees and other operating expenses. These ongoing costs, which are deducted from each Fund’s gross income, directly reduce the investment return of the Funds.
A mutual fund’s ongoing costs are expressed as a percentage of its average net assets. This figure is known as the expense ratio. The following examples are intended to help you understand the ongoing costs (in dollars) of investing in the Funds and to compare these costs with the ongoing costs of investing in other mutual funds. The examples below are based on an investment of $1,000 made at the beginning of the period shown and held for the entire period (January 1, 2018 through June 30, 2018).
The table below illustrates each Fund’s ongoing costs in two ways:
Actual fund return – This section helps you to estimate the actual expenses that you paid over the period. The “Ending Account Value” shown is derived from each Fund’s actual return, and the fourth column shows the dollar amount of operating expenses that would have been paid by an investor who started with $1,000 in the Funds. You may use the information here, together with the amount you invested, to estimate the expenses that you paid over the period.
To do so, simply divide your account value by $1,000 (for example, an $8,600 account value divided by $1,000 = 8.6), then multiply the result by the number given for the Funds under the heading “Expenses Paid During Period.”
Hypothetical 5% return – This section is intended to help you compare the Funds’ ongoing costs with those of other mutual funds. It assumes that each Fund had an annual return of 5% before expenses during the period shown, but that the expense ratio is unchanged. In this case, because the returns used are not the Funds’ actual returns, the results do not apply to your investment. The example is useful in making comparisons because the U.S. Securities and Exchange Commission (the “SEC”) requires all mutual funds to calculate expenses based on a 5% return. You can assess each Fund’s ongoing costs by comparing this hypothetical example with the hypothetical examples that appear in shareholder reports of other funds.
Note that expenses shown in the table are meant to highlight and help you compare ongoing costs only. The Funds do not charge transaction fees, such as purchase or redemption fees, nor do they impose any sales loads.
The calculations assume no shares were bought or sold during the period. Your actual costs may have been higher or lower, depending on the amount of your investment and the timing of any purchases or redemptions.
48
THE CUTLER TRUST
ABOUT YOUR FUND’S EXPENSES (Unaudited) (Continued)
More information about the Funds’ expenses, including annual expense ratios for the past five fiscal years, can be found in this report. For additional information on operating expenses and other shareholder costs, please refer to each Fund’s prospectus.
| Beginning
Account Value
January 1,
2018 | Ending
Account Value
June 30,
2018 | Net
Expense
Ratio (a) | Expenses
Paid During
Period (b) |
Cutler Equity Fund | | | | |
Based on Actual | $ 1,000.00 | $ 966.40 | 1.15% | $ 5.61 |
Based on Hypothetical 5% Return (before expenses) | $ 1,000.00 | $ 1,019.09 | 1.15% | $ 5.76 |
Cutler Fixed Income Fund | | | | |
Based on Actual | $ 1,000.00 | $ 988.30 | 1.69% | $ 8.33 |
Based on Hypothetical 5% Return (before expenses) | $ 1,000.00 | $ 1,016.41 | 1.69% | $ 8.45 |
Cutler Emerging Markets Fund | | | | |
Based on Actual | $ 1,000.00 | $ 931.30 | 1.55% | $ 7.42 |
Based on Hypothetical 5% Return (before expenses) | $ 1,000.00 | $ 1,017.11 | 1.55% | $ 7.75 |
(a) | Annualized, based on the Fund's most recent one-half year expenses. |
(b) | Expenses are equal to each Fund’s annualized net expense ratio multiplied by the average account value over the period, multiplied by 181/365 (to reflect the one-half year period). |
49
THE CUTLER TRUST
FEDERAL TAX INFORMATION (Unaudited)
For the fiscal year ended June 30, 2018, Cutler Equity Fund designated $1,915,091 as a long-term capital gain distribution subject to a maximum tax rate of 20%.
Qualified Dividend Income – For the fiscal year ended June 30, 2018, Cutler Equity Fund and Cutler Emerging Markets Fund have designated 100% and 67.53%, respectively, of ordinary income distributions, or up to the maximum amount of such dividends allowable pursuant to the Internal Revenue Code, as qualified dividend income eligible for the reduced tax rate of 15%.
Dividends Received Deduction – Corporate shareholders are generally entitled to take the dividends received deduction on the portion of a Fund’s dividends that qualify under tax law. For the fiscal year ended June 30, 2018, 100% and 5.45% of ordinary income dividends paid by Cutler Equity Fund and Cutler Emerging Markets Fund, respectively, qualify for the corporate dividends received deduction.
Cutler Emerging Markets Fund intends to elect to pass through to shareholders the income tax credit for taxes paid to foreign countries. The Fund’s foreign source income per share was $0.222 and the foreign tax expense per share was $0.028. The pass-through of the foreign tax credit will only affect those persons who are shareholders on the dividend record date in December 2018. These shareholders will receive more detailed information with their 2018 Form 1099-DIV.
50
THE CUTLER TRUST
TRUSTEES AND OFFICERS OF THE TRUST
(Unaudited)
The Board of Trustees is responsible for managing the Trust’s business affairs and exercising all the Trust’s powers except those reserved for shareholders. The following tables give information about each Board member and the senior officers of the Trust. Each Trustee holds office until the person resigns, is removed, or is replaced. Officers are elected for an annual term. Unless otherwise noted, the Trustees and officers have held their principal occupations for more than five years. The Funds’ Statement of Additional Information includes additional information about the Trustees and is available, without charge and upon request, by calling 1-888-CUTLER4.
Name,
Date of Birth
and Address | Position
with the
Trust | Length
of Time
Served | Principal Occupation(s)
During Past 5 Years | Number of Portfolios in Fund Complex
Overseen by Trustee | Other
Directorships
Held by
Trustee |
Interested Trustees |
Matthew C. Patten (a)
Born: December 1975
525 Bigham Knoll
Jacksonville, OR 97530 | Chairman/Trustee/Treasurer | Trustee Since 2006; Treasurer Since 2004 | Chief Executive Officer and Portfolio Manager of Cutler Investment Counsel, LLC. | 3 | None |
Independent Trustees |
John P. Cooney
Born: January 1932
525 Bigham Knoll
Jacksonville, OR 97530 | Lead Independent Trustee | Since 2007 | Retired. | 3 | None |
Robert F. Turner
Born: June 1946
525 Bigham Knoll
Jacksonville, OR 97530 | Trustee | Since 2012 | Retired. | 3 | None |
Edward T. Alter, CPA
Born: July 1941
525 Bigham Knoll
Jacksonville, OR 97530 | Trustee | Since 2013 | Retired. | 3 | None |
(a) | Matthew C. Patten is an “Interested Person,” as defined by the 1940 Act, because he is an affiliated person of the Adviser. |
51
THE CUTLER TRUST
TRUSTEES AND OFFICERS OF THE TRUST
(Unaudited) (Continued)
Name,
Date of Birth
and Address | Position with the Trust | Length of Time Served | Principal Occupation(s)
During Past 5 Years |
Senior Officers |
Erich M. Patten
Born: October 1977
525 Bigham Knoll
Jacksonville, OR 97530 | President | Since 2004 | Portfolio Manager, Corporate Secretary and Chief Investment Officer of Cutler Investment Counsel, LLC. |
Brooke C. Ashland
Born: December 1951
525 Bigham Knoll
Jacksonville, OR 97530 | Vice President/ Chief Compliance Officer | Since 2002 | Chief Compliance Officer and Chair of Cutler Investment Counsel, LLC; Chief Executive Officer and President of Trustee Investment Services, Inc. (a Trustee education firm); President of Big Bear Timber, LLC (farming). |
Linda Hoard
Born: October 1947
225 Pictoria Drive
Suite 450
Cincinnati, OH 45246 | Secretary | Since 2018 | Associate Director, Ultimus Fund Solutions (since 2018); Independent Regulatory Consultant (2017); Managing Director and Sr. Managing Counsel, BNY Mellon (2002-2016). |
Robert G. Dorsey
Born: April 1957
225 Pictoria Drive
Suite 450
Cincinnati, OH 45246 | Vice President | Since 2005 | Managing Director and Co-Chief Executive Officer of Ultimus Fund Solutions, LLC and its subsidiaries. |
52
THE CUTLER TRUST
ADDITIONAL INFORMATION (Unaudited)
Proxy Voting Information
A description of the policies and procedures that the Funds use to determine how to vote proxies relating to securities held in the Funds’ portfolios is available without charge, upon request, by calling 1-800-228-8537 or on the SEC’s website at http://www.sec.gov. Information regarding how the Funds voted proxies relating to portfolio securities during the most recent 12-month period ended June 30 is also available without charge upon request by calling 1-800-228-8537 or on the SEC’s website at http://www.sec.gov.
Form N-Q Information
The Trust files a complete listing of the Funds’ portfolio holdings with the SEC as of the end of the first and third quarters of each fiscal year on Form N-Q. The filings are available without charge, upon request, by calling 1-800-228-8537. Furthermore, you may obtain a copy of the filings on the SEC’s website at http://www.sec.gov. The Trust’s Forms N-Q may also be reviewed and copied at the SEC’s Public Reference Room in Washington, DC, and information on the operation of the Public Reference Room may be obtained by calling 1-800-SEC-0330.
53
THE CUTLER TRUST
APPROVAL OF INVESTMENT ADVISORY AGREEMENT
(Unaudited)
At a meeting of the Board of Trustees (the “Board”) of The Cutler Trust (the “Trust”) held on April 24 and 25, 2018, the Trustees, including the Independent Trustees voting separately, reviewed and approved the continuance of the Investment Advisory Agreement (the “Agreement”) with Cutler Investment Counsel, LLC (the “Adviser”) on behalf of the Cutler Equity Fund, Cutler Fixed Income Fund and Cutler Emerging Markets Fund (the “Funds”) for an additional one year period. Approval of the Agreement took place at an in-person meeting, at which all of the Trustees were present. The Independent Trustees were advised by their counsel of their fiduciary obligations in approving the Agreement, which included a review of applicable case law, recent SEC pronouncements and the legal framework set forth in Gartenberg v. Merrill Lynch Asset Management. In connection with the approval, the Trustees requested such information from the Adviser as they deemed reasonably necessary to evaluate the terms of the Agreement and to determine whether the Agreement continues to be in the best interests of each Fund and its shareholders. The Trustees’ review included, but was not limited to: (1) the nature, extent and quality of the services provided by the Adviser; (2) the investment performance of each Fund and the Adviser; (3) the costs of the services provided and profits realized by the Adviser and its affiliates from their relationship with the Funds; (4) the extent to which economies of scale would be realized as the Funds grow; (5) whether fee levels reflect these economies of scale for the benefit of Fund investors; (6) whether and how the Board relied on comparisons of services to be rendered to and fees to be paid by the Funds with the services provided by and the fees paid to other investment advisers or the services provided to and the fees paid by other clients of the Adviser; and (7) any benefits derived or to be derived by the Adviser from their relationship with the Funds, such as soft dollar arrangements by which brokers provide research to the Funds or the Adviser in return for allocating brokerage.
The Adviser provided the Board members with information to assist them in their deliberations, which included responses and supporting materials pursuant to the request for information in connection with the annual approval of the continuation of the Agreement between the Trust and the Adviser in accordance with Section 15(c) of the Investment Company Act of 1940, as amended (the “1940 Act”). The Board also noted its ongoing review of various materials provided by the Adviser on a quarterly basis. The Independent Trustees, in consultation with their counsel, concluded that the materials presented by the Adviser were sufficient to make an informed decision about the approval of the renewal of the Agreement.
Nature, Extent and Quality of the Services Provided by the Adviser. The Independent Trustees reviewed the background, qualifications, education and experience of the Adviser’s investment and operational personnel, each person’s area of responsibility and the percentage of time committed to Fund activities. The Independent Trustees discussed the services provided by the Adviser to the Funds which includes: (1) investing each Fund’s assets consistent with the Fund’s investment objective and investment policies; (2) determining the portfolio securities to be purchased, sold or otherwise disposed of and the timing of such transactions; (3) overseeing the voting of all proxies with respect to each Fund’s portfolio securities; (4) maintaining the required books and records for transactions that the Adviser
54
THE CUTLER TRUST
APPROVAL OF INVESTMENT ADVISORY AGREEMENT
(Unaudited) (Continued)
effects on behalf of the Funds; and (5) selecting broker-dealers to execute orders on behalf of the Funds. The Independent Trustees also discussed and considered the quality of administrative and other services provided by the Adviser to the Funds, the Adviser’s and the Funds’ compliance programs, and the Adviser’s role in coordinating such services and programs. The Independent Trustees also noted the Adviser’s distribution and marketing services provided to the Funds, as well as the investment in additional personnel resources to promote growth in the Funds. The Trustees concluded that they are satisfied with the nature, extent and quality of services that the Adviser provides to the Funds under the Agreement.
Investment Performance of Each Fund and the Adviser. The Adviser reviewed with the Board information prepared to assist the Trustees in analyzing the short-term and long-term performance of each Fund, including information which compared the performance of each Fund to the performance of various benchmarks and a peer group of funds of similar size with similar investment styles as categorized by Morningstar, and in the case of the Cutler Equity Fund, to comparable private accounts managed by the Adviser. The Independent Trustees took note of the fact that the Morningstar peer group comparisons presented were filtered by total net assets so that the Funds were compared to other similarly sized funds, and they discussed the appropriateness of this comparison.
The Trustees noted that the Cutler Equity Fund outperformed the average and median return for funds that have assets under $500 million categorized by Morningstar as large cap value (the “Equity Fund Peer Group”) for the one-, three-, and ten-year periods ended March 31, 2018, and underperformed the average and median return of the Equity Fund Peer Group for the five-year period ended March 31, 2018. The Trustees also took note that the Cutler Equity Fund underperformed the S&P 500 Index, its benchmark index, for the years ended December 31, 2015 and 2017, and outperformed its benchmark index for the year ended December 31, 2016. The Trustees considered the consistency of the Adviser’s management of the Equity Fund in accordance with its investment objective, strategy and policies.
The Trustees noted that the Cutler Fixed Income Fund underperformed the average and median return for funds that have assets between $10 and $25 million categorized by Morningstar as U.S. intermediate term bond funds (the “Fixed Income Fund Peer Group”) for the one-, three-, five-, and ten-year periods ended March 31, 2018. The Independent Trustees took note of the fact that the Cutler Fixed Income Fund underperformed the Bloomberg Barclays Intermediate U.S. Government/Credit Index, its benchmark index, for the years ended December 31, 2015 and 2017, but generally performed in line with the index for the year ended December 31, 2016. The Board also took into consideration changes that the Adviser had made to the Fund’s investment portfolio.
The Trustees noted that the Cutler Emerging Markets Fund underperformed the average and median return for funds with assets under $25 million categorized by Morningstar as emerging markets funds (the “Emerging Markets Fund Peer Group”) for the one-year period ended March 31, 2018. The Independent Trustees took note of the fact that the Cutler Emerging Markets Fund underperformed the
55
THE CUTLER TRUST
APPROVAL OF INVESTMENT ADVISORY AGREEMENT
(Unaudited) (Continued)
MSCI Emerging Markets Index, its benchmark, for the one-year period ended December 31, 2016, and 2017. It was noted that limited performance history was available for the Cutler Emerging Markets Fund as it commenced operations on July 2, 2015.
Following further review and discussion of the information provided, the Independent Trustees concluded that each Fund’s overall performance has been satisfactory and competitive in relation to the returns of relevant securities indices and other similarly situated mutual funds.
Costs of the Services Provided and Profits Realized by the Adviser. The Independent Trustees reviewed and considered the profitability of the Adviser with regard to its management of the Funds. The Trustees noted that the Cutler Equity Fund currently pays an investment advisory fee computed at the annual rate of 0.75% of the Fund’s average daily net assets, that the Cutler Fixed Income Fund currently pays an investment advisory fee computed at the annual rate of 0.50% of the Fund’s average daily net assets, and that the Cutler Emerging Markets Fund currently pays an investment advisory fee computed at the annual rate of 0.85% of the Fund’s average daily net assets. It was also noted that the Adviser contractually agreed to waive its advisory fees and pay operating expenses of the Cutler Equity Fund and the Cutler Emerging Markets Fund to the extent necessary to limit annual fund operating expenses to 1.15% and 1.55%, respectively, of each Fund’s average daily net assets until November 1, 2018. It was reported that with respect to the Cutler Equity Fund, the Adviser did not waive any fees for the six-month fiscal period ended December 31, 2017 and the fiscal years ended June 30, 2017, 2016 and 2015, and further, that all previously waived fees of the Cutler Equity Fund had been recouped. It was reported that with respect to the Cutler Emerging Markets Fund, the Adviser waived $42,937 in fees and received $15,126 in fees during the fiscal period ended December 31, 2017, and that the Adviser was entitled to recoup previously waived fees of the Cutler Emerging Markets Fund in the amounts of $100,955 and $122,966 for the fiscal periods ended June 30, 2017 and 2016, respectively.
In reviewing the advisory fees and total expense ratios of the Funds, the Trustees were provided with comparative expense and advisory fee information of other mutual funds of similar size and with similar investment styles. The Trustees reviewed and discussed the comparative information, which included average and median total expense ratios and advisory fees for the each Fund’s Morningstar Fund Peer Group. The Adviser also provided a comparison of fees paid by clients of the Adviser other than the Funds to the advisory fees paid by the Cutler Equity Fund and discussed the services provided to the Adviser’s other clients.
The Independent Trustees took note of the fact that the Cutler Equity Fund’s contractual advisory fee was higher than the average and median advisory fee for the Equity Fund Peer Group, that the Fund’s net expense ratio was higher than the Equity Fund Peer Group average and median, and that the Fund’s gross expense ratio was higher than the median and lower than the average of the Equity Fund Peer Group. The Independent Trustees took note of the fact that the Cutler Fixed Income Fund’s contractual advisory fee was higher than the average and median advisory fee for the Fixed Income Fund Peer Group, that the Fund’s net expense ratio was higher than the Fixed Income Fund Peer Group
56
THE CUTLER TRUST
APPROVAL OF INVESTMENT ADVISORY AGREEMENT
(Unaudited) (Continued)
average and median, and that the Fund’s gross expense ratio was higher than the median and lower than the average of the Fixed Income Fund Peer Group. The Independent Trustees noted that the Cutler Emerging Markets Fund’s contractual advisory fee was lower than the average and median advisory fee for the Emerging Markets Fund Peer Group, that the Fund’s net expense ratio was higher than the Emerging Markets Fund Peer Group average and median, and that the Fund’s gross expense ratio was lower than the Emerging Markets Fund Peer Group average and median.
The Independent Trustees reviewed the Adviser’s balance sheet as of December 31, 2017. They also reviewed an analysis prepared by the Adviser reflecting its revenues and expenses with respect to its services to the Funds, and discussed with the Adviser calculations of the Adviser’s estimated and total profits and profit margin, including the manner in which expenses were allocated. The Adviser reviewed with the Board the portfolio managers’ compensation structure, as well as the equity ownership structure of the Adviser.
The Independent Trustees concluded that the Adviser’s profitability was reasonable given the quality and scope of services provided by the Adviser and the overall investment performance of the Funds. After a full discussion and review of the information provided, it was the consensus of the Independent Trustees that the advisory fees payable under the Agreement are fair and reasonable when considered in light of all relevant factors, including the services provided by the Adviser to the Funds and their shareholders.
Economies of Scale. The Independent Trustees further determined that, based on current asset levels, the extent to which economies of scale would be realized as the Funds grow, and whether fee levels reflect these economies of scale was not relevant to their consideration whether to renew the Agreement with the Adviser. After further discussion, it was the consensus of the Independent Trustees that it is not appropriate to introduce fee breakpoints at the present time.
Other Benefits. The Independent Trustees considered the Adviser’s brokerage practices and trade execution. They also discussed the Adviser’s marketing and distribution efforts on behalf of the Funds. The Board noted the expansion of personnel to contribute to the Adviser’s direct marketing efforts to established clients and monitor the Funds’ intermediary relationships. The Trustees also considered the fee arrangements and payments made by the Trust under the Shareholder Servicing Plan and by the Adviser through revenue sharing payments.
The Independent Trustees considered that the Funds do not have any soft dollar arrangements with broker-dealers that would otherwise benefit the Adviser. The Independent Trustees considered other benefits the Adviser may receive from managing the Funds and determined that the Adviser will not receive additional material financial benefits from services rendered to the Funds.
The Independent Trustees were advised by their counsel throughout the process. Prior to voting, the Independent Trustees discussed their deliberations of the proposed continuance of the Agreement with counsel in executive session. It was reported that no single factor was considered in isolation or
57
THE CUTLER TRUST
APPROVAL OF INVESTMENT ADVISORY AGREEMENT
(Unaudited) (Continued)
considered to be determinative to the decision of the Independent Trustees to approve the continuance of the Agreement. Rather, the Independent Trustees concluded, in light of a weighing and balancing of all factors considered that it would be in the best interests of the Funds and their shareholders to renew the Agreement for an additional annual period.
In approving the Agreement, the Independent Trustees reached the following conclusions: (1) based on the performance and risk characteristics of the Funds and the effectiveness of the Funds in achieving their stated objectives, the Adviser has provided quality advisory services; (2) the Adviser has the financial resources and personnel to continue to provide quality advisory services to the Trust; (3) the advisory fees paid by and the total expenses of each Fund are reasonable; and (4) the continuance of the Agreement is in the best interests of each Fund and its shareholders.
58
This page intentionally left blank.
This page intentionally left blank.
This page intentionally left blank.
CUTLER INVESTMENT COUNSEL, LLC
INVESTMENT ADVISER TO THE TRUST
525 Bigham Knoll
Jacksonville, OR 97530
(800)228-8537 ● (541)770-9000
Fax:(541)779-0006
info@cutler.com
As of the end of the period covered by this report, the registrant has adopted a code of ethics that applies to the registrant’s principal executive officer, principal financial officer, principal accounting officer or controller, or persons performing similar functions, regardless of whether these individuals are employed by the registrant or a third party. Pursuant to Item 12(a)(1), a copy of registrant’s code of ethics is filed as an exhibit to this Form N-CSR. During the period covered by this report, the code of ethics has not been amended, and the registrant has not granted any waivers, including implicit waivers, from the provisions of the code of ethics.
| Item 3. | Audit Committee Financial Expert. |
The registrant’s board of trustees has determined that the registrant has an audit committee financial expert serving on its audit committee. The name of the audit committee financial expert is Edward T. Alter. Mr. Alter is “independent” for purposes of this item.
| Item 4. | Principal Accountant Fees and Services. |
| (a) | Audit Fees. The aggregate fees billed for professional services rendered by the principal accountant for the audit of the registrant’s annual financial statements or for services that are normally provided by the principal accountant in connection with statutory and regulatory filings or engagements were $48,000 and $48,000 with respect to the registrant’s fiscal years ended June 30, 2018 and June 30, 2017, respectively. |
| (b) | Audit-Related Fees. No fees were billed in either of the last two fiscal years for assurance and related services by the principal accountant that are reasonably related to the performance of the audit of the registrant’s financial statements and are not reported under paragraph (a) of this Item. |
| (c) | Tax Fees. The aggregate fees billed for professional services rendered by the principal accountant for tax compliance, tax advice and tax planning were $9,500 and $9,500 with respect to the fiscal years ended June 30, 2018 and June 30, 2017, respectively. The services comprising these fees are related to the preparation of the Funds’ federal income and excise tax returns. |
| (d) | All Other Fees. No fees were billed in either of the last two fiscal years for products and services provided by the principal accountant, other than the services reported in paragraphs (a) through (c) of this Item. |
| (e)(1) | The audit committee has not adopted pre-approval policies and procedures described in paragraph (c)(7) of Rule 2-01 of Regulation S-X. |
| (e)(2) | None of the services described in paragraph (b) through (d) of this Item were approved by the audit committee pursuant to paragraph (c)(7)(i)(C) of Rule 2-01 of Regulation S-X. |
| (f) | Less than 50% of hours expended on the principal accountant’s engagement to audit the registrant’s financial statements for the most recent fiscal year were attributed to work performed by persons other than the principal accountant’s full-time, permanent employees. |
| (g) | No non-audit fees were billed by the registrant’s principal accountant in either of the last two fiscal years for services rendered to the registrant’s investment adviser (not including any sub-adviser whose role is primarily portfolio management and is subcontracted with or overseen by another investment adviser), and any entity controlling, controlled by, or under common control with the Adviser that provides ongoing services to the Trust. |
| (h) | The principal accountant has not provided any non-audit services to the registrant’s investment adviser (not including any sub-adviser whose role is primarily portfolio management and is subcontracted with or overseen by another investment adviser), and any entity controlling, controlled by, or under common control with the investment adviser that provides ongoing services to the registrant. |
| Item 5. | Audit Committee of Listed Registrants. |
Not applicable
| Item 6. | Schedule of Investments. |
| (a) | Not applicable [schedule filed with Item 1] |
| Item 7. | Disclosure of Proxy Voting Policies and Procedures for Closed-End Management Investment Companies. |
Not applicable
| Item 8. | Portfolio Managers of Closed-End Management Investment Companies. |
Not applicable
| Item 9. | Purchases of Equity Securities by Closed-End Management Investment Company and Affiliated Purchasers. |
Not applicable
| Item 10. | Submission of Matters to a Vote of Security Holders. |
The registrant has not adopted procedures by which shareholders may recommend nominees to the registrant’s board of trustees.
| Item 11. | Controls and Procedures. |
(a) Based on their evaluation of the registrant’s disclosure controls and procedures (as defined in Rule 30a-3(c) under the Investment Company Act of 1940) as of a date within 90 days of the filing date of this report, the registrant’s principal executive officer and principal financial officer have concluded that such disclosure controls and procedures are reasonably designed and are operating effectively to ensure that material information relating to the registrant, including its consolidated subsidiaries, is made known to them by others within those entities, particularly during the period in which this report is being prepared, and that the information required in filings on Form N-CSR is recorded, processed, summarized, and reported on a timely basis.
(b) There were no changes in the registrant’s internal control over financial reporting (as defined in Rule 30a-3(d) under the Investment Company Act of 1940) that occurred during the second fiscal quarter of the period covered by this report that have materially affected, or are reasonably likely to materially affect, the registrant’s internal control over financial reporting.
| Item12. | Disclosure of Securities Lending Activities for Closed-End Management Investment Companies. |
Not applicable.
File the exhibits listed below as part of this Form. Letter or number the exhibits in the sequence indicated.
(a)(1) Any code of ethics, or amendment thereto, that is the subject of the disclosure required by Item 2, to the extent that the registrant intends to satisfy the Item 2 requirements through filing of an exhibit: Attached hereto
(a)(2) A separate certification for each principal executive officer and principal financial officer of the registrant as required by Rule 30a-2(a) under the Act (17 CFR 270.30a-2(a)): Attached hereto
(a)(3) Any written solicitation to purchase securities under Rule 23c-1 under the Act (17 CFR 270.23c-1) sent or given during the period covered by the report by or on behalf of the registrant to 10 or more persons: Not applicable
(a)(4) Change in the registrant’s independent public accountants: Not applicable.
(b) Certifications required by Rule 30a-2(b) under the Act (17 CFR 270.30a-2(b)): Attached hereto
Exhibit 99.CODE ETH | Code of Ethics |
| Exhibit 99.CERT | Certifications required by Rule 30a-2(a) under the Act |
Exhibit 99.906CERT | Certifications required by Rule 30a-2(b) under the Act |
Pursuant to the requirements of the Securities Exchange Act of 1934 and the Investment Company Act of 1940, the registrant has duly caused this report to be signed on its behalf by the undersigned, thereunto duly authorized.
| (Registrant) | The Cutler Trust | | |
| | | | |
| By (Signature and Title)* | /s/ Erich M. Patten | |
| | | Erich M. Patten, President | |
| | | | |
| Date | September 5, 2018 | | |
Pursuant to the requirements of the Securities Exchange Act of 1934 and the Investment Company Act of 1940, this report has been signed below by the following persons on behalf of the registrant and in the capacities and on the dates indicated.
| By (Signature and Title)* | /s/ Erich M. Patten | |
| | | Erich M. Patten, President | |
| | | | |
| Date | September 5, 2018 | | |
| | | | |
| By (Signature and Title)* | /s/ Matthew C. Patten | |
| | | Matthew C. Patten, Treasurer | |
| | | | |
| Date | September 5, 2018 | | |
| * | Print the name and title of each signing officer under his or her signature. |