UNITED STATES
SECURITIES AND EXCHANGE COMMISSION
Washington, D.C. 20549
FORM N-CSR
CERTIFIED SHAREHOLDER REPORT OF
REGISTERED MANAGEMENT INVESTMENT COMPANIES
Investment Company Act file number 811-7278
Nuveen Arizona Premium Income Municipal Fund, Inc.
(Exact name of registrant as specified in charter)
Nuveen Investments
333 West Wacker Drive
Chicago, IL 60606
(Address of principal executive offices) (Zip code)
Kevin J. McCarthy
Nuveen Investments
333 West Wacker Drive
Chicago, IL 60606
(Name and address of agent for service)
Registrant's telephone number, including area code: (312) 917-7700
Date of fiscal year end: July 31
Date of reporting period: July 31, 2010
Form N-CSR is to be used by management investment companies to file reports with the Commission not later than 10 days after the transmission to stockholders of any report that is required to be transmitted to stockholders under Rule 30e-1 under the Investment Company Act of 1940 (17 CFR 270.30e-1). The Commission may use the information provided on Form N-CSR in its regulatory, disclosure review, inspection, and policymaking roles.
A registrant is required to disclose the information specified by Form N-CSR, and the Commission will make this information public. A registrant is not required to respond to the collection of information contained in Form N-CSR unless the Form displays a currently valid Office of Management and Budget ("OMB") control number. Please direct comments concerning the accuracy of the information collection burden estimate and any suggestions for reducing the burden to Secretary, Securities and Exchange Commission, 450 Fifth Street, NW, Washington, DC 20549-0609. The OMB has reviewed this collection of information under the clearance requirements of 44 U.S.C. ss. 3507.
ITEM 1. REPORTS TO STOCKHOLDERS.
Nuveen Investments Announces Strategic Combination with FAF Advisors
On July 29, 2010, Nuveen Investments, Inc. announced that U.S. Bancorp will receive a 9.5% stake in Nuveen Investments and cash consideration in exchange for the long-term asset business of U.S. Bancorp’s FAF Advisors (FAF). Nuveen Investments is the parent of Nuveen Asset Management (NAM), the investment adviser for the Funds included in this report.
FAF Advisors, which currently manages about $25 billion of long-term assets and serves as the advisor of the First American Funds, will be combined with NAM, which currently manages about $75 billion in municipal fixed income assets. Upon completion of the transaction, Nuveen Investments, which currently manages about $150 billion of assets across several high-quality affiliates, will manage a combined total of about $175 billion in institutional and retail assets.
This combination will not affect the investment objectives, strategies or policies of the Funds in this report. Over time, Nuveen Investments expects that the combination will provide even more ways to meet the needs of investors who work with financial advisors and consultants by enhancing the multi-boutique model of Nuveen Investments, which also includes highly respected investment teams at NWQ Investment Management, Santa Barbara Asset Management, Symphony Asset Management, Tradewinds Global Investors, Winslow Capital and Nuveen HydePark.
The transaction is expected to close late in 2010, subject to customary conditions.
Chairman’s
Letter to Shareholders
Dear Shareholder,
Recent months have revealed the fragility and disparity of the global economic recovery. In the U.S., the rate of economic growth has slowed as various stimulus programs have started to wind down, exposing weakness in the underlying economy. In contrast, many emerging market countries are experiencing a return to comparatively high rates of growth. Confidence in global financial markets has been undermined by concerns about high sovereign debt levels in Europe and the U.S. Until these countries can begin credible programs to reduce their budgetary deficits, market unease and hesitation will remain. On a more positive note, even though the countries now enjoying the strongest recovery depend on exports to countries with trade deficits, these importing countries have resisted the temptation to damage world trade by erecting trade barriers.
The U.S. economy is subject to unusually high levels of uncertainty as it struggles to recover from a devastating financial crisis. Unemployment remains stubbornly high, due to what appears to be both cyclical and structural forces. Federal Reserve policy makers are considering novel approaches to provide support to the economy, and administration policy makers are debating additional stimulus measures. However, the high levels of debt owed both by U.S. consumers and the U.S. government limit their ability to engineer a stronger economic recovery.
The U.S. financial markets reflect the crosscurrents now impacting the U.S. economy. Today’s historically low interest rates reflect the Fed’s easy monetary policy and the demand for U.S. government debt by U.S. and overseas investors looking for a safe haven for investment. Despite a continued corporate earnings recovery, equity markets continue to reflect concern about the possibility of a “double dip” recession. Encouragingly, financial institutions are rebuilding their balance sheets and the financial reform legislation enacted this summer has the potential to address many of the most significant contributors to the financial crisis, although many details still have to be worked out.
In this difficult environment, your Nuveen investment team continues to seek sustainable investment opportunities and, at the same time, remains alert for potential risks that may result from a recovery still facing many headwinds. As your representative, the Nuveen Fund Board monitors the activities of each investment team to assure that all maintain their investment disciplines. As always, I encourage you to contact your financial consultant if you have any questions about your investment in a Nuveen Fund.
On behalf of the other members of your Fund Board, we look forward to continuing to earn your trust in the months and years ahead.
Sincerely,
Robert P. Bremner
Chairman of the Board
September 22, 2010
Nuveen Investments 1
Portfolio Managers’ Comments
Nuveen Arizona Premium Income Municipal Fund, Inc. (NAZ)
Nuveen Arizona Dividend Advantage Municipal Fund (NFZ)
Nuveen Arizona Dividend Advantage Municipal Fund 2 (NKR)
Nuveen Arizona Dividend Advantage Municipal Fund 3 (NXE)
Nuveen Texas Quality Income Municipal Fund (NTX)
Portfolio managers Scott Romans and Daniel Close review economic and municipal market conditions at the national and state levels, key investment strategies, and the twelve-month performance of these five Nuveen Funds. Scott, who has been with Nuveen since 2000, has managed the Arizona Funds since 2003. Dan, who joined Nuveen in 2000, assumed portfolio management responsibility for NTX in 2007.
What factors affected the U.S. economic and municipal market environments during the twelve-month reporting period ended July 31, 2010?
During this period, there continued to be considerable stress on the economy and both the Federal Reserve (Fed) and the federal government took actions intended to improve the overall economic environment. For its part, the Fed continued to hold the benchmark fed funds rate in a target range of zero to 0.25%. At its June 2010 meeting, the central bank renewed its pledge to keep the fed funds rate “exceptionally low” for an “extended period.” The federal government focused on implementing a $787 billion economic stimulus package intended to provide job creation, tax relief, fiscal assistance to state and local governments and expansion of unemployment benefits.
These and other measures taken by the Fed and the government to ease the economic recession helped to produce some signs of improvement. Over the four calendar quarters comprising most of this period, the U.S. economy, as measured by the U.S. gross domestic product (GDP), grew at annualized rates of 1.6%, 5.0%, 3.7% and 1.6%, respectively. This marked the first time since 2007 that the economy managed to string together four consecutive positive quarters. Housing also provided something of a bright spot, as the S&P/Case-Shiller Home Price Index of average residential prices gained 3.6% for the twelve months ended June 2010 (the most recent data available at the time this report was produced). This moved average home prices across the United States to levels similar to where they were in the autumn of 2003.
Inflation continued to be relatively tame, as the Consumer Price Index (CPI) rose 1.2% year-over-year as of July 2010. The labor markets remained weak, with the national unemployment rate at 9.5% as of July 2010. This compares with the 26-year high of 10.1% in October 2009 and a rate of 9.4% in July 2009.
Certain statements in this report are forward-looking statements. Discussions of specific investments are for illustration only and are not intended as recommendations of individual investments. The forward-looking statements and other views expressed herein are those of the portfolio managers as of the date of this report. Actual future results or occurrences may differ significantly from those anticipated in any forward-looking statements, and the views expressed herein are subject to change at any time, due to numerous market and other factors. The Funds disclaim any obligation to update publicly or revise any forward-looking statements or views expressed herein.
Municipal market conditions began to show general signs of improvement throughout most of the period, as strong cash flows into municipal bond funds combined with tighter supply of new tax-exempt issuance to create favorable supply and demand conditions. The reduced issuance of tax-exempt municipal debt was due in part to the introduction of the Build America Bond program in 2009. Build America Bonds are a new class of taxable municipal debt, created as part of the February 2009 economic stimulus package. These bonds currently offer municipal issuers a federal subsidy equal to 35% of the bond’s interest payments, often times providing issuers with a lower cost alternative to traditional tax-exempt debt. During the twelve months ended July 31, 2010, taxable Build America Bonds issuance totaled $102.8 billion, accounting for over 24% of new bon ds issued in the municipal market.
Over the twelve months ended July 31, 2010, municipal bond issuance nationwide—both tax-exempt and taxable—totaled $420.8 billion, an increase of 20% compared with the twelve-month period ended July 31, 2009. However, if taxable Build America Bond issuance were removed from the equation, the supply of tax-exempt bonds alone fell more than 4%. Demand for tax-exempt securities generally remained strong during this period, bolstered in part by the prospect of higher tax rates in the future. Combined with the lower supply of tax-exempt bonds, this drove prices on municipal bonds higher.
How were the economic and market environments in Arizona and Texas during this period?
Like the national economy, Arizona recently took small steps toward economic improvement. Growth in the education and health services sector continued to provide some stability on the jobs front, and the professional and business services, leisure and hospitality and financial services sectors all saw fewer job losses than they did in the previous twelve months. However, Arizona’s overall employment picture remained weak, as the state’s unemployment rate for July 2010 reached 9.6%, the highest in 27 years, up from 9.4% in July 2009. The construction sector continued to be the hardest hit, losing more than 50% of its jobs since the recession began in 2007. For fiscal 2011, the $8.5 billion Arizona state budget closed an estimated $3 billion budget gap through spending cuts, federal stimulus funding, and a voter-approved one-cent sales ta x increase effective through May 2013. In November 2010, Arizona voters will decide two additional proposals that would redirect money from two voter-established funds (land conservation and early childhood programs) to the state’s general fund. As of July 31, 2010, Moody’s listed Arizona’s issuer credit rating at Aa2 with a stable outlook, while Standard & Poor’s (S&P) rated the state at AA- with a negative outlook. For the twelve months ended July 31, 2010, municipal issuance (both taxable and tax-free) in Arizona totaled $5.3 billion, down almost 38% from the previous twelve months.
In Texas, the economic recovery appeared to be proceeding at a somewhat faster pace than in the nation as a whole, as a strong rebound in the state’s exports—chiefly, crude energy products, petrochemicals and electronics—provided major support over the period. Although demand from Europe was projected to taper off, the market for these products was expected to remain strong in Asia, Latin America and domestically. In
Nuveen Investments 3
recent months, the education and health services, government, leisure and hospitality and professional and business services sectors of the Texas market have all posted job gains, although construction and information services continued to suffer losses. While unemployment in Texas rose from 7.9% in July 2009 to 8.2% in July 2010, its highest level since 1987, the state’s jobless rate remained below the national average of 9.5%. The strength of the Texas job market was reflected in the stability of the state’s housing market, which also benefited from the fact that Texas did not participate in subprime lending to the extent of many other states. As Texas headed into fiscal 2011, the state was facing a shortfall of approximately $18 billion in its $182 billion fiscal 2010-2011 biennium budget. As of July 31, 2010, Moody’s and S& ;P rated Texas general obligation (GO) debt at Aaa and AA+, respectively; both rating agencies maintained stable outlooks for the state. For the twelve months ended July 31, 2010, municipal issuance (both taxable and tax-free) in Texas totaled $34.1 billion, an increase of 12% over the previous twelve months. Texas continued to rank as the third largest state issuer behind California and New York.
What key strategies were used to manage the Arizona and Texas Funds during this reporting period?
As previously mentioned, the supply of tax-exempt bonds nationally tightened during this period, due in part to the introduction of taxable Build America Bonds in April 2009. This program also impacted the availability of tax-exempt bonds in both Texas and Arizona, which ranked 6th and 19th, respectively, among the 50 states by dollar amount of bonds issued under the Build America Bond program during the first half of 2010. For the twelve months ended July 2010, Build America Bonds accounted for approximately 23% of municipal supply in Texas and 24% in Arizona, where overall issuance was already down significantly. Since interest payments from Build America Bonds represent taxable income, we do not view these bonds as good investment opportunities for these Funds.
Despite the constrained issuance of tax-exempt municipal bonds, we continued to find attractive value opportunities, taking a bottom-up approach to discovering undervalued sectors and individual credits with the potential to perform well over the long term. In the Arizona Funds, we found value in several areas of the market, including health care, utilities and community facilities district (CFD) bonds associated with land development projects, also known as “dirt deals,” which we purchased in both the primary and secondary markets. In general, we focused on bonds at the lower end of the quality spectrum, which we believed offered value relative to historical credit spreads, particularly during the earlier part of the period. We also purchased higher quality bonds when necessary to keep the Funds fully invested.
In NTX, our purchases during the second half of this period included single A rated health care and public power bonds, an insured higher education issue (with a single-A underlying rating), and a BBB rated, zero coupon toll road credit. Earlier in the period, NTX also purchased several GO credits and toll road, electric utility and tax incremental financing (TIF) district bonds.
Some of this investment activity resulted from opportunities created by the provisions of the Build America Bond program. For example, tax-exempt supply was more plentiful in the health care and higher education sectors because, as 501(c)(3) (nonprofit) organizations, hospitals and private universities generally do not qualify for the Build America Bond program and must continue to issue bonds in the tax-exempt municipal market. Bonds with proceeds earmarked for refundings, working capital and private activities also are not covered by the Build America Bond program and this resulted in attractive opportunities in various other sectors of the market.
The impact of the Build America Bond program was also evident in the area of longer-term issuance, as municipal issuers sought to take full advantage of the attractive financing terms offered by these bonds. Approximately 70% of Build America Bonds were issued with maturities of at least 30 years. Even though this significantly reduced the availability of tax-exempt credits with longer maturities, we continued to find good opportunities to purchase attractive longer-term bonds for these Funds. For example, nearly all of the bonds purchased in NTX during the second half of the period offered longer maturities. These bonds helped us to maintain NTX’s duration and also rewarded investors as the yield curve remained relatively steep.
Cash for new purchases during this period was generated primarily by the proceeds from called and maturing bonds, which we worked to redeploy to keep the Funds fully invested. In NTX, we also sold a couple of pre-refunded bonds with very short maturities. On the whole, however, selling was relatively limited during this period, as the bonds in our portfolios generally offered higher yields than those available in the current marketplace.
As of July 31, 2010, all five of these Funds continued to use inverse floating rate securities.1 We employ inverse floaters as a form of leverage for a variety of reasons, including duration management, income enhancement and total return enhancement.
| 1 | An inverse floating rate security, also known as an inverse floater, is a financial instru- ment designed to pay long-term tax-exempt interest at a rate that varies inversely with a short-term tax-exempt interest rate index. For the Nuveen Funds, the index typically used is the Securities Industry and Financial Markets (SIFM) Municipal Swap Index (previously referred to as the Bond Market Association Index or BMA). Inverse floaters, including those inverse floating rate securi- ties in which the Funds invested during this reporting period, are further defined within the Notes to Financial Statements and Glossary of Terms Used in this Report sections of this report. |
Nuveen Investments 5
How did the Funds perform?
Individual results for the Nuveen Arizona and Texas Funds, as well as relevant index and peer group information, are presented in the accompanying table.
Average Annual Total Returns on Common Share Net Asset Value For periods ended 7/31/10
| | | | | | | | | | |
| Arizona Funds | | 1-Year | | | 5-Year | | | 10-Year | |
| NAZ | | | 13.94 | % | | | 4.11 | % | | | 5.44 | % |
| NFZ | | | 17.93 | % | | | 3.71 | % | | | 5.65 | % |
| NKR | | | 14.75 | % | | | 4.36 | % | | | 6.04 | % |
| NXE | | | 16.66 | % | | | 4.42 | % | | | 5.10 | % |
| | | | | | | | | | | | | |
Standard & Poor’s (S&P) Arizona Municipal Bond Index2 | | | 9.47 | % | | | 4.74 | % | | | 5.51 | % |
| | | | | | | | | | | | | |
Standard & Poor’s (S&P) National Municipal Bond Index3 | | | 9.88 | % | | | 4.51 | % | | | 5.58 | % |
| | | | | | | | | | | | | |
Lipper Other States Municipal Debt Funds Average4 | | | 14.58 | % | | | 4.31 | % | | | 6.27 | % |
| | | | | | | | | | | | | |
| Texas Fund | | | | | | | | | | | | |
| NTX | | | 14.71 | % | | | 4.89 | % | | | 6.50 | % |
| | | | | | | | | | | | | |
Standard & Poor’s (S&P) Texas Municipal Bond Index2 | | | 10.20 | % | | | 4.89 | % | | | 5.81 | % |
| | | | | | | | | | | | | |
Standard & Poor’s (S&P) National Municipal Bond Index3 | | | 9.88 | % | | | 4.51 | % | | | 5.58 | % |
| | | | | | | | | | | | | |
Lipper Other States Municipal Debt Funds Average4 | | | 14.58 | % | | | 4.31 | % | | | 6.27 | % |
For the twelve months ended July 31, 2010, the total returns on common share net asset value (NAV) for all of the Arizona and Texas Funds exceeded the returns for their respective state’s Standard & Poor’s (S&P) Municipal Bond Index as well as that of the S&P National Municipal Bond Index. For the same period, NFZ, NKR, NXE and NTX outperformed the average return for the Lipper Other States Municipal Debt Funds Average, while NAZ lagged this Lipper average.
Key management factors that influenced the Funds’ returns during this period included duration and yield curve positioning, credit exposure and sector allocation. In addition, the use of structural leverage was an important positive factor during this period. The impact of structural leverage is discussed in more detail on page eight.
During this period, bonds with longer maturities generally outperformed those with shorter maturities, with bonds at the longest end of the yield curve posting the strongest returns. The outperformance of longer term bonds was due in part to the decline in interest rates, particularly at the longer end of the curve. The scarcity of tax-exempt bonds with longer maturities also drove up the prices of these bonds. Overall, yield curve positioning and duration proved positive for the performance of NAZ, NXE and NTX, with NFZ having the longest duration among these Funds. All four of these Funds were underweighted in the shortest part of the yield curve that produced the weakest returns. However, yield curve positioning and duration were a net negative for NKR, which had the shortest duration among these Funds. In particular, the performance of this Fun d was restrained by its overweighting in the underperforming short intermediate part of the curve.
Credit exposure also played an important role in performance in these funds. The demand for municipal bonds increased during this period driven by a variety of factors,
Past performance is not predictive of future results. Current performance may be higher or lower than the data shown. Returns do not reflect the deduction of taxes that shareholders may have to pay on Fund distributions or upon the sale of Fund shares.
For additional information, see the individual Performance Overview for your Fund in this report.
| 2 | The Standard & Poor's (S&P) Municipal Bond Indexes for Arizona and Texas are unleveraged, market value-weighted indexes designed to measure the performance of the tax-exempt, investment-grade Arizona and Texas municipal bond markets, respectively. These indexes do not reflect any initial or ongoing expenses and are not available for direct investment. |
| | |
| 3 | The Standard & Poor's (S&P) National Municipal Bond Index is an unleveraged, market value-weighted index designed to measure the performance of the tax-exempt, investment-grade U.S. municipal bond market. These indexes do not reflect any or ongoing expenses and are not available for direct investment. |
| | |
| 4 | The Lipper Other States Municipal Debt Funds Average is calculated using the returns of all closed-end funds in this category for each period as follows: 1-year, 46 funds; 5-year, 46 funds; and 10-year, 20 funds. Lipper returns account for the effects of management fees and assume reinvestment of dividends, but do not reflect any applicable sales charges. The Lipper average is not available for direct investment. |
6 Nuveen Investments
including concerns about potential tax increases, the need to rebalance portfolio allocations and a growing appetite for additional risk. At the same time, the supply of new tax-exempt municipal paper declined, due largely to the Build America Bond program. As investors bid up municipal bond prices, bonds rated BBB or below and non-rated bonds generally outperformed those rated AAA. In this environment, the performance of all of these Funds benefited from their overexposure to lower quality credits. Because NAZ cannot invest in sub-investment grade securities (those rated BB and lower by at least one Nationally Recognized Statical Rating Organization (NRSRO) or those non-rated), which performed well, the contribution from credit exposure was smaller in this Fund.
Holdings that generally contributed to the Funds’ returns during this period included industrial development revenue (IDR) and health care bonds, both of which exceeded the overall municipal market return by substantial margins. NTX, in particular, benefited from its overweight in IDR credits. Revenue bonds as a whole performed well, with transportation, special tax and leasing among the other sectors that outperformed the general municipal market. Zero coupon bonds also were among the strongest performers.
In contrast, pre-refunded bonds, which are often backed by U.S. Treasury securities, performed relatively poorly during this period. The underperformance of these bonds can be attributed primarily to their shorter effective maturities and higher credit quality. As of July 31, 2010, NKR, NXE and NTX held the heaviest weightings of pre-refunded bonds, while NFZ had the smallest holding of these bonds. Among the revenue sectors, resource recovery trailed the overall municipal market by the widest margin and electric utilities and water and sewer also turned in weaker performances. In addition, many general obligation and other tax-supported bonds failed to keep pace with the market for the twelve months.
One sector that generally performed in line with the market but that outperformed dramatically for the Arizona Funds was the “other revenue” sector. In Arizona, the other revenue sector is focused largely on CFD or land development bonds, also known as “dirt deals.” This area of the market had been hit hard in the states most affected by the housing crisis, including California, Florida and Arizona. In California, which is a relatively high wealth state with higher taxes and a more developed market for this type of credit, we saw dirt deal bonds begin to rally, while the Arizona market for these bonds continued to lag. This occurred despite the fact that, because of Arizona’s smaller, less developed market for dirt deals, Arizona-issued bonds of this type generally have stronger fundamental credit quality and security features. During this twelve-month reporting period, however, as investors sought higher yields, these Arizona bonds became very attractive to buyers and performed exceptionally well. The performances of NFZ, NKR and NXE were boosted by their significant exposure to Arizona dirt deals, especially to non-rated CFD bonds that were judged to be in the sub-investment grade credit quality category by Nuveen Asset Management. In NKR, as mentioned previously, this contribution was offset to some degree by the Fund’s shorter duration. Also as noted above, NAZ’s participation in the Arizona dirt deal rally was limited by its inability to invest in sub-investment grade bonds.
IMPACT OF THE FUNDS’ LEVERAGE STRATEGIES ON PERFORMANCE
One important factor impacting the returns of these Funds relative to the comparative indexes was the Funds’ use of financial leverage. The Funds use leverage because their managers believe that, over time, leveraging provides opportunities for additional income and total return for common shareholders. However, use of leverage also can
Nuveen Investments 7
expose common shareholders to additional volatility. For example, as the prices of securities held by a Fund decline, the negative impact of these valuation changes on common share net asset value and common shareholder total return is magnified by the use of leverage. Conversely, leverage may enhance common share returns during periods when the prices of securities held by a Fund generally are rising.
Leverage made a positive contribution to the performance of all these Funds over this reporting period.
RECENT DEVELOPMENTS REGARDING THE FUNDS’ LEVERAGED CAPITAL STRUCTURE
Shortly after their inceptions, each of the Funds issued auction rate preferred shares (ARPS) to create financial leverage. As noted in past shareholder reports, the ARPS issued by many closed-end funds, including these Funds, have been hampered by a lack of liquidity since February 2008. Since that time, more ARPS have been submitted for sale in each of their regularly scheduled auctions than there have been offers to buy. In fact, offers to buy have been almost completely non-existent since late February 2008. This means that these auctions have “failed to clear,” and that many, or all, of the ARPS shareholders who wanted to sell their shares in these auctions were unable to do so. This lack of liquidity in ARPS did not lower the credit quality of these shares, and ARPS shareholders unable to sell their shares continued to receive dis tributions at the “maximum rate” applicable to failed auctions, as calculated in accordance with the pre-established terms of the ARPS. In the recent market, with short-term rates at multi-generational lows, those maximum rates also have been low.
One continuing implication for common shareholders from the auction failures is that each Fund’s cost of leverage likely has been incrementally higher at times than it otherwise might have been had the auctions continued to be successful. As a result, each Fund’s common share earnings likely have been incrementally lower at times than they otherwise might have been.
As noted in past shareholder reports, the Nuveen funds’ Board of Directors/Trustees authorized several methods to refinance a portion of the Nuveen funds’ outstanding ARPS. Some funds have utilized tender option bonds (TOBs), also known as inverse floating rate securities, for leverage purposes. The amount of TOBs that a fund may use varies according to the composition of each fund’s portfolio. Some funds have a greater ability to use TOBs than others. Some funds have issued Variable Rate Demand Preferred (VRDP) Shares, a floating rate form of preferred stock. Some funds have issued MuniFund Term Preferred (MTP) Shares, a fixed rate form of preferred stock with a mandatory redemption period of five years.
While all these efforts have reduced the total amount of outstanding ARPS issued by the Nuveen funds, the funds cannot provide any assurance on when the remaining outstanding ARPS might be redeemed.
In April and May 2010, 30 Nuveen leveraged closed-end funds, including NXE, received a demand letter from a law firm on behalf of purported holders of common shares of each such fund, alleging that Nuveen and the funds’ officers and Board of Directors/ Trustees breached their fiduciary duties related to the redemption at par of the funds’ ARPS. In response, the Board established an ad hoc Demand Committee consisting of certain of its disinterested and independent Board members to investigate the claims. The Demand Committee retained independent counsel to assist it in conducting an extensive investigation. Based upon its investigation, the Demand Committee found
8 Nuveen Investments
that it was not in the best interests of each fund or its shareholders to take the actions suggested in the demand letters, and recommended that the full Board reject the demands made in the demand letters. After reviewing the findings and recommendation of the Demand Committee, the full Board of each fund unanimously adopted the Demand Committee’s recommendation.
Subsequently, twenty of the funds that received demand letters (not including NXE) were named as nominal defendants in a putative shareholder derivative action complaint captioned Safier and Smith v. Nuveen Asset Management, et al. that was filed in the Circuit Court of Cook County, Illinois, Chancery Division (the “Cook County Chancery Court”) on July 27, 2010. Three additional funds (not including NXE) were named as nominal defendants in a similar complaint captioned Curbow v. Nuveen Asset Management, et al. filed in the Cook County Chancery Court on August 12, 2010, and three additional funds (including NXE) were named as nominal defendants in a similar complaint captioned Beidler v. Nuveen Asset Management, et al. filed in the Cook County Chancery Court on September 21, 2010 (collectively, the “Complaints”). The Complain ts, filed on behalf of purported holders of each fund’s common shares, also name Nuveen Asset Management as a defendant, together with current and former Officers and Trustees of each of the funds (together with the nominal defendants, collectively, the “Defendants”). The Complaints contain the same basic allegations contained in the demand letters. The suits seek a declaration that the Defendants have breached their fiduciary duties, an order directing the Defendants not to redeem any ARPS at their liquidation value using fund assets, indeterminate monetary damages in favor of the funds and an award of plaintiffs’ costs and disbursements in pursuing the action. Nuveen Asset Management believes that the Complaints are without merit, and intends to defend vigorously against these charges.
As of July 31, 2010, the amounts of ARPS redeemed by the Funds are as shown in the accompanying table.
| | | Auction Rate | | | % of Original | |
| | | Preferred Shares | | | Auction Rate | |
| Fund | | Redeemed | | | Preferred Share | |
| NAZ | | $ | 2,125,000 | | | | 7.1 | % |
| NFZ | | $ | 1,400,000 | | | | 11.7 | % |
| NKR | | $ | 1,875,000 | | | | 10.1 | % |
| NXE | | $ | 3,600,000 | | | | 16.4 | % |
| NTX | | $ | 3,950,000 | | | | 5.7 | % |
During the twelve-month reporting period, NFZ, NKR and NXE filed with the Securities and Exchange Commission (SEC) a registration statement seeking to register MTP. These registration statements, declared effective by the SEC, enable the Funds to issue to the public shares of MTP to refinance all or a portion of their ARPS. The issuance of MTP by NFZ, NKR and NXE is subject to market conditions. There is no assurance that these MTP shares will be issued.
As of July 31, 2010, 83 out of the 84 Nuveen closed-end municipal funds that had issued ARPS have redeemed, at par, all or a portion of these shares. These redemptions bring the total amount of Nuveen’s municipal closed-end funds’ ARPS redemptions to approximately $4.4 billion of the approximately $11 billion outstanding.
For up-to-date information, please visit the Nuveen CEF Auction Rate Preferred Resource Center at: http://www.nuveen.com/arps.
Nuveen Investments 9
Common Share Dividend and
Share Price Information
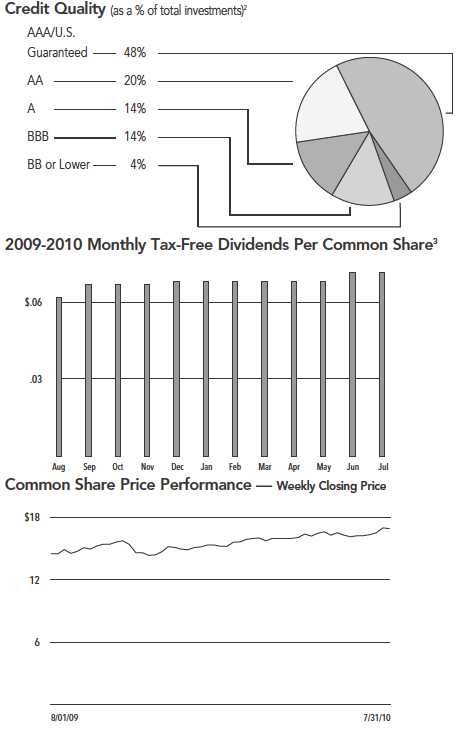
During the twelve-month reporting period ended July 31, 2010, NFZ and NKR each had four monthly dividend increases and NAZ, NXE and NTX each had three monthly dividend increases.
Due to normal portfolio activity, common shareholders of NTX received a long-term capital gains distribution of $0.0118 per share and a short-term capital gains distribution of $0.0002 per share at the end of December 2009.
All of the Funds in this report seek to pay stable dividends at rates that reflect each Fund’s past results and projected future performance. During certain periods, each Fund may pay dividends at a rate that may be more or less than the amount of net investment income actually earned by the Fund during the period. If a Fund has cumulatively earned more than it has paid in dividends, it holds the excess in reserve as undistributed net investment income (UNII) as part of the Fund’s NAV. Conversely, if a Fund has cumulatively paid dividends in excess of its earnings, the excess constitutes negative UNII that is likewise reflected in the Fund's NAV. Each Fund will, over time, pay all of its net investment income as dividends to shareholders. As of July 31, 2010, all five of the Funds in this report had positive UNII balances for both ta x and financial reporting purposes.
COMMON SHARE REPURCHASES AND SHARE PRICE INFORMATION
As of July 31, 2010, and since the inception of the Funds’ repurchase program, NFZ, NKR and NXE have cumulatively repurchased their outstanding common shares as shown in the accompanying table. Since the inception of the Funds’ repurchase program, NAZ and NTX have not repurchased any of their outstanding common shares.
| | | | | | | |
| | | Common Shares | | | % of Outstanding | |
| Fund | | Repurchased | | | Common Shares | |
| NFZ | | | 2,500 | | | | 0.2 | % |
| NKR | | | 800 | | | | 0.0 | % |
| NXE | | | 1,600 | | | | 0.1 | % |
During the twelve-month reporting period, NFZ, NKR and NXE did not repurchase any of their outstanding common shares.
As of July 31, 2010, the Funds’ common share prices were trading at (+) premiums or (-) discounts to their common share NAVs as shown in the accompanying table.
| | | | | | | |
| | | 7/31/10 | | | Twelve-Month Average | |
| Fund | | (+)Premium/(-)Discount | | | (+)Premium/(-)Discount | |
| NAZ | | | -4.65 | % | | | -4.09 | % |
| NFZ | | | -0.07 | % | | | -6.83 | % |
| NKR | | | -4.98 | % | | | -6.68 | % |
| NXE | | | -6.94 | % | | | -7.43 | % |
| NTX | | | +12.72 | % | | | +6.50 | % |
Nuveen Investments 11
| | |
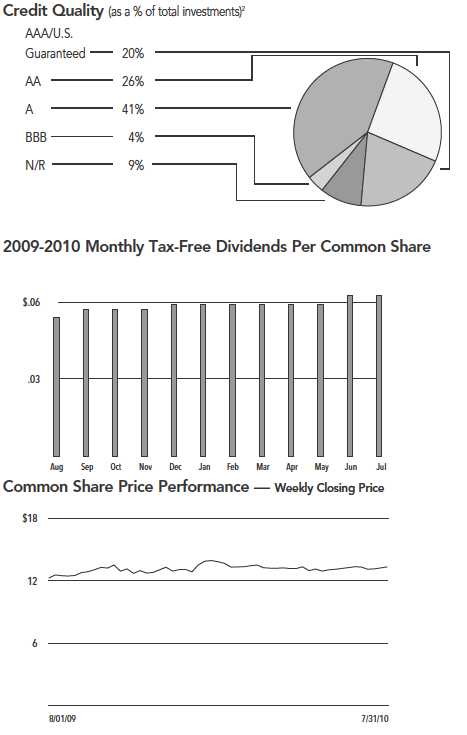
| NAZ | Nuveen Arizona |
| Performance | Premium Income |
| OVERVIEW | Municipal Fund, Inc. |
| | |
| | as of July 31, 2010 |
| | | | | | | |
| Fund Snapshot | | | | | | |
| Common Share Price | | | | | $ | 13.34 | |
| Common Share Net Asset Value | | | | | $ | 13.99 | |
| Premium/(Discount) to NAV | | | | | | -4.65 | % |
| Market Yield | | | | | | 5.62 | % |
Taxable-Equivalent Yield1 | | | | | | 8.18 | % |
| Net Assets Applicable to Common Shares ($000) | | | $ | 62,549 | |
| Average Effective Maturity on Securities (Years) | | | | 17.83 | |
| Leverage-Adjusted Duration | | | | | | 7.86 | |
| | | | | | | | |
| Average Annual Total Return | | | | | | | |
| (Inception 11/19/92) | | | | | | | |
| | | On Share Price | | | On NAV | |
| 1-Year | | | 14.47 | % | | | 13.94 | % |
| 5-Year | | | 2.37 | % | | | 4.11 | % |
| 10-Year | | | 4.48 | % | | | 5.44 | % |
| | | | | | | �� | | |
| Portfolio Composition | | | | | | | | |
| (as a % of total investments) | | | | | | | | |
| Tax Obligation/Limited | | | | | | | 23.9 | % |
| Utilities | | | | | | | 16.8 | % |
| Health Care | | | | | | | 15.5 | % |
| Water and Sewer | | | | | | | 14.7 | % |
| Education and Civic Organizations | | | | | | | 9.6 | % |
| U.S. Guaranteed | | | | | | | 7.7 | % |
| Tax Obligation/General | | | | | | | 7.7 | % |
| Other | | | | | | | 4.1 | % |
[Missing Graphic Reference]
| |
| Refer to the Glossary of Terms Used in this Report for further definition of the terms used within this Fund’s Performance |
| Overview page. |
| |
| 1 Taxable-Equivalent Yield represents the yield that must be earned on a fully taxable investment in order to equal the yield |
| of the Fund on an after-tax basis. It is based on a combined federal and state income tax rate of 31.3%. When comparing |
| this Fund to investments that generate qualified dividend income, the Taxable-Equivalent Yield is lower. |
| |
| 2 Ratings shown are the highest of Standard & Poor’s Group, Moody’s Investor Service, Inc. or Fitch, Inc. AAA includes |
| bonds with an implied AAA rating since they are backed by U.S. Government or agency securities. AAA, AA, A and BBB |
| ratings are investment grade; BB, B, CCC, CC, C and D ratings are below-investment grade. Holdings designated N/R are |
| not rated by any of these national rating agencies. |
| | |
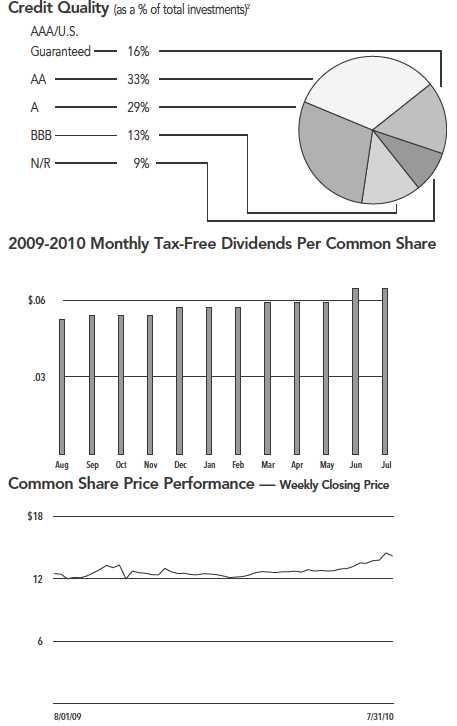
| NFZ | Nuveen Arizona |
| Performance | Dividend Advantage |
| OVERVIEW | Municipal Fund |
| | as of July 31, 2010 |
| | | | | | | |
| Fund Snapshot | | | | | | |
| Common Share Price | | | | | $ | 14.19 | |
| Common Share | | | | | | | |
| Net Asset Value | | | | | $ | 14.20 | |
| Premium/(Discount) to NAV | | | | | | -0.07 | % |
| Market Yield | | | | | | 5.45 | % |
Taxable-Equivalent Yield1 | | | | | | 7.93 | % |
| Net Assets Applicable to Common Shares ($000) | | | $ | 21,984 | |
| Average Effective Maturity on Securities (Years) | | | | 15.57 | |
| Leverage-Adjusted Duration | | | | | | 8.74 | |
| | | | | | | | |
| Average Annual Total Return | | | | | | | |
| (Inception 1/30/01) | | | | | | | |
| | | On Share Price | | | On NAV | |
| 1-Year | | | 23.34 | % | | | 17.93 | % |
| 5-Year | | | 2.88 | % | | | 3.71 | % |
| Since | | | | | | | | |
| Inception | | | 5.08 | % | | | 5.65 | % |
| | | | | | | | | |
| Portfolio Composition | | | | | | | | |
| (as a % of total investments) | | | | | | | | |
| Tax Obligation/Limited | | | | | | | 32.2 | % |
| Utilities | | | | | | | 21.4 | % |
| Health Care | | | | | | | 12.4 | % |
| Water and Sewer | | | | | | | 9.5 | % |
| Tax Obligation/General | | | | | | | 8.0 | % |
| Education and Civic Organizations | | | | | | | 7.2 | % |
| U.S. Guaranteed | | | | | | | 4.8 | % |
| Other | | | | | | | 4.5 | % |
| |
| Refer to the Glossary of Terms Used in this Report for further definition of the terms used within this Fund’s Performance |
| Overview page. |
| 1 Taxable-Equivalent Yield represents the yield that must be earned on a fully taxable investment in order to equal the yield |
| of the Fund on an after-tax basis. It is based on a combined federal and state income tax rate of 31.3%. When comparing |
| this Fund to investments that generate qualified dividend income, the Taxable-Equivalent Yield is lower. |
| 2 Ratings shown are the highest of Standard & Poor’s Group, Moody’s Investor Service, Inc. or Fitch, Inc. AAA includes |
| bonds with an implied AAA rating since they are backed by U.S. Government or agency securities. AAA, AA, A and BBB |
| ratings are investment grade; BB, B, CCC, CC, C and D ratings are below-investment grade. Holdings designated N/R are |
| not rated by any of these national rating agencies. |
Nuveen Investments 13
| | |
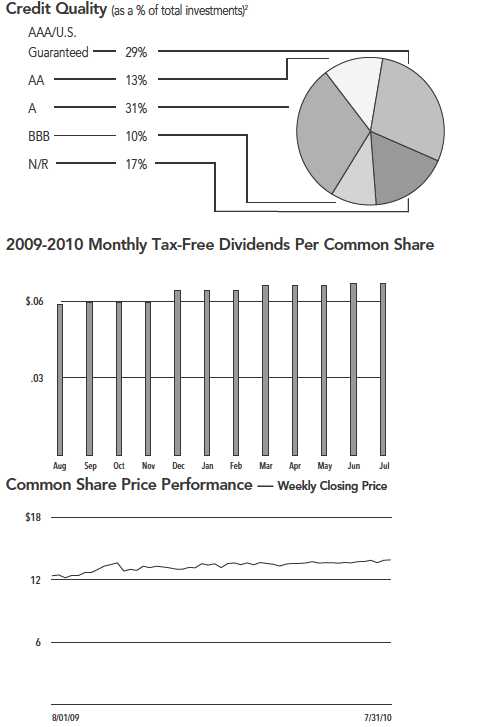
| NKR | Nuveen Arizona |
| Performance | Dividend Advantage |
| OVERVIEW | Municipal Fund 2 |
| | |
| as of July 31, 2010 |
| | | | | | | |
| Fund Snapshot | | | | | | |
| Common Share Price | | | | | $ | 13.92 | |
| Common Share | | | | | | | |
| Net Asset Value | | | | | $ | 14.65 | |
| Premium/(Discount) to NAV | | | | | | -4.98 | % |
| Market Yield | | | | | | 5.78 | % |
Taxable-Equivalent Yield1 | | | | | | 8.41 | % |
| Net Assets Applicable to Common Shares ($000) | | | $ | 35,733 | |
| Average Effective Maturity on Securities (Years) | | | | 14.18 | |
| Leverage-Adjusted Duration | | | | | | 6.49 | |
| | | | | | | | |
| Average Annual Total Return | | | | | | | |
| (Inception 3/25/02) | | | | | | | |
| | | On Share Price | | | On NAV | |
| 1-Year | | | 17.65 | % | | | 14.75 | % |
| 5-Year | | | 2.67 | % | | | 4.36 | % |
| Since Inception | | | 4.94 | % | | | 6.04 | % |
| | | | | | | | | |
| Portfolio Composition | | | | | | | | |
| (as a % of total investments) | | | | | | | | |
| Tax Obligation/Limited | | | | | | | 31.5 | % |
| Health Care | | | | | | | 16.9 | % |
| Tax Obligation/General | | | | | | | 13.9 | % |
| U.S. Guaranteed | | | | | | | 12.0 | % |
| Water and Sewer | | | | | | | 8.7 | % |
| Education and Civic Organizations | | | | | | | 6.0 | % |
| Utilities | | | | | | | 4.2 | % |
| Other | | | | | | | 6.8 | % |
| |
| Refer to the Glossary of Terms Used in this Report for further definition of the terms used within this Fund’s Performance |
| Overview page. |
| 1 Taxable-Equivalent Yield represents the yield that must be earned on a fully taxable investment in order to equal the yield |
| of the Fund on an after-tax basis. It is based on a combined federal and state income tax rate of 31.3%. When comparing |
| this Fund to investments that generate qualified dividend income, the Taxable-Equivalent Yield is lower. |
| 2 Ratings shown are the highest of Standard & Poor’s Group, Moody’s Investor Service, Inc. or Fitch, Inc. AAA includes |
| bonds with an implied AAA rating since they are backed by U.S. Government or agency securities. AAA, AA, A and BBB |
| ratings are investment grade; BB, B, CCC, CC, C and D ratings are below-investment grade. Holdings designated N/R are |
| not rated by any of these national rating agencies. |
| | |
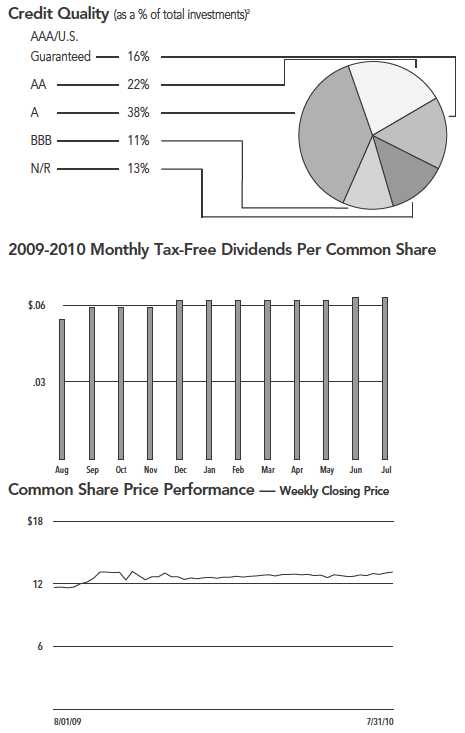
| NXE | Nuveen Arizona |
| Performance | Dividend Advantage |
| OVERVIEW | Municipal Fund 3 |
| | as of July 31, 2010 |
| | | | | | | |
| Fund Snapshot | | | | | | |
| Common Share Price | | | | | $ | 13.14 | |
| Common Share | | | | | | | |
| Net Asset Value | | | | | $ | 14.12 | |
| Premium/(Discount) to NAV | | | | | | -6.94 | % |
| Market Yield | | | | | | 5.75 | % |
Taxable-Equivalent Yield1 | | | | | | 8.37 | % |
| Net Assets Applicable to Common Shares ($000) | | | $ | 43,280 | |
| Average Effective Maturity on Securities (Years) | | | | 16.01 | |
| Leverage-Adjusted Duration | | | | | | 7.20 | |
| | | | | | | | |
| Average Annual Total Return | | | | | | | |
| (Inception 9/25/02) | | | | | | | |
| | | On Share Price | | | On NAV | |
| 1-Year | | | 18.58 | % | | | 16.66 | % |
| 5-Year | | | 3.43 | % | | | 4.42 | % |
| Since | | | | | | | | |
| Inception | | | 3.78 | % | | | 5.10 | % |
| | | | | | | | | |
| Portfolio Composition | | | | | | | | |
| (as a % of total investments) | | | | | | | | |
| Tax Obligation/Limited | | | | | | | 22.7 | % |
| Health Care | | | | | | | 20.9 | % |
| Education and Civic Organizations | | | | | | | 11.9 | % |
| U.S. Guaranteed | | | | | | | 10.2 | % |
| Water and Sewer | | | | | | | 10.0 | % |
| Transportation | | | | | | | 9.7 | % |
| Utilities | | | | | | | 9.6 | % |
| Other | | | | | | | 5.0 | % |
| |
| Refer to the Glossary of Terms Used in this Report for further definition of the terms used within this Fund’s Performance |
| Overview page. |
| 1 Taxable-Equivalent Yield represents the yield that must be earned on a fully taxable investment in order to equal the yield |
| of the Fund on an after-tax basis. It is based on a combined federal and state income tax rate of 31.3%. When comparing |
| this Fund to investments that generate qualified dividend income, the Taxable-Equivalent Yield is lower. |
| 2 Ratings shown are the highest of Standard & Poor’s Group, Moody’s Investor Service, Inc. or Fitch, Inc. AAA includes |
| bonds with an implied AAA rating since they are backed by U.S. Government or agency securities. AAA, AA, A and BBB |
| ratings are investment grade; BB, B, CCC, CC, C and D ratings are below-investment grade. Holdings designated N/R are |
| not rated by any of these national rating agencies. |
Nuveen Investments 15
| NTX | Nuveen Texas |
| Performance | Quality Income |
| OVERVIEW | Municipal Fund |
| | |
| as of July 31, 2010 |
| | | | | | | |
| Fund Snapshot | | | | | | |
| Common Share Price | | | | | $ | 16.92 | |
| Common Share Net Asset Value | | | | | $ | 15.01 | |
| Premium/(Discount) to NAV | | | | | | 12.72 | % |
| Market Yield | | | | | | 5.07 | % |
Taxable-Equivalent Yield1 | | | | | | 7.04 | % |
| Net Assets Applicable to Common Shares ($000) | | | $ | 143,080 | |
| Average Effective Maturity on Securities (Years) | | | | 15.92 | |
| Leverage-Adjusted Duration | | | | | | 6.98 | |
| | | | | | | | |
| Average Annual Total Return | | | | | | | |
| (Inception 10/17/91) | | | | | | | |
| | | On Share Price | | | On NAV | |
| 1-Year | | | 20.92 | % | | | 14.71 | % |
| 5-Year | | | 6.65 | % | | | 4.89 | % |
| 10-Year | | | 9.03 | % | | | 6.50 | % |
| | | | | | | | | |
| Portfolio Composition | | | | | | | | |
| (as a % of total investments) | | | | | | | | |
| Tax Obligation/General | | | | | | | 30.9 | % |
| Education and Civic Organizations | | | | | | | 10.9 | % |
| U.S. Guaranteed | | | | | | | 10.4 | % |
| Health Care | | | | | | | 8.8 | % |
| Utilities | | | | | | | 8.7 | % |
| Water and Sewer | | | | | | | 7.9 | % |
| Transportation | | | | | | | 7.0 | % |
| Tax Obligation/Limited | | | | | | | 6.3 | % |
| Other | | | | | | | 9.1 | % |
| |
| Refer to the Glossary of Terms Used in this Report for further definition of the terms used within this Fund’s Performance |
| Overview page. |
| 1 Taxable-Equivalent Yield represents the yield that must be earned on a fully taxable investment in order to equal the yield |
| of the Fund on an after-tax basis. It is based on a federal income tax rate of 28%. When comparing this Fund to invest- |
| ments that generate qualified dividend income, the Taxable-Equivalent Yield is lower. |
| 2 Ratings shown are the highest of Standard & Poor’s Group, Moody’s Investor Service, Inc. or Fitch, Inc. AAA includes |
| bonds with an implied AAA rating since they are backed by U.S. Government or agency securities. AAA, AA, A and BBB |
| ratings are investment grade; BB, B, CCC, CC, C and D ratings are below-investment grade. Holdings designated N/R are |
| not rated by any of these national rating agencies. |
| 3 The Fund paid shareholders capital gains and net ordinary income distributions in December 2009 of $0.0120 per share. |
| | | | | | | |
| NAZ | Shareholder Meeting Report | |
| NFZ | | | | | | |
| NKR | The annual meeting of shareholders was held in the offices of Nuveen Investments on November 30, |
| | 2009; at this meeting the shareholders were asked to vote on the election of Board Members, the |
| | elimination of Fundamental Investment Policies and the approval of new Fundamental Investment |
| | Policies. The meeting for all funds was subsequently adjourned to January 12, 2010; the meeting for |
| | NAZ and NKR was additionally adjourned to March 23, 2010. The meeting for NKR was additionally |
| | adjourned to March 30, 2010. | | | | |
| | | NAZ | | | NFZ | | | NKR | |
| | | Common and | | | | | | Common and | | | | | | Common and | | | | |
| | | Preferred | | | Preferred | | | Preferred | | | Preferred | | | Preferred | | | Preferred | |
| | | shares voting | | | shares voting | | | shares voting | | | shares voting | | | shares voting | | | shares voting | |
| | | together | | | together | | | together | | | together | | | together | | | together | |
| | | as a class | | | as a class | | | as a class | | | as a class | | | as a class | | | as a class | |
| To approve the elimination of the Fund’s fundamental | | | | | | | | | | | | | | | | |
| policy relating to investments in municipal | | | | | | | | | | | | | | | | | | |
| securities and below investment grade securities. | | | | | | | | | | | | | | | | |
| For | | | 2,280,789 | | | | 873 | | | | 771,037 | | | | 256 | | | | 1,200,028 | | | | 319 | |
| Against | | | 233,433 | | | | 139 | | | | 47,643 | | | | 7 | | | | 75,228 | | | | 91 | |
| Abstain | | | 93,611 | | | | 17 | | | | 38,273 | | | | — | | | | 55,084 | | | | 7 | |
| Broker Non-Votes | | | 566,661 | | | | — | | | | 196,335 | | | | — | | | | 379,788 | | | | 117 | |
| Total | | | 3,174,494 | | | | 1,029 | | | | 1,053,288 | | | | 263 | | | | 1,710,128 | | | | 534 | |
| To approve the new fundamental policy relating | | | | | | | | | | | | | | | | | | | | | |
| to investments in municipal securities for the Fund. | | | | | | | | | | | | | | | | | | | | | |
| For | | | 2,390,577 | | | | 873 | | | | 782,112 | | | | 256 | | | | 1,206,462 | | | | 319 | |
| Against | | | 140,959 | | | | 139 | | | | 42,868 | | | | 7 | | | | 72,814 | | | | 91 | |
| Abstain | | | 76,297 | | | | 17 | | | | 31,973 | | | | — | | | | 51,064 | | | | 7 | |
| Broker Non-Votes | | | 566,661 | | | | — | | | | 196,335 | | | | — | | | | 379,788 | | | | 117 | |
| Total | | | 3,174,494 | | | | 1,029 | | | | 1,053,288 | | | | 263 | | | | 1,710,128 | | | | 534 | |
| To approve the elimination of the fundamental | | | | | | | | | | | | | | | | | | | | | |
| policy prohibiting investment in other | | | | | | | | | | | | | | | | | | | | | | | | |
| investment companies. | | | | | | | | | | | | | | | | | | | | | | | | |
| For | | | 2,381,154 | | | | 873 | | | | — | | | | — | | | | — | | | | — | |
| Against | | | 141,502 | | | | 139 | | | | — | | | | — | | | | — | | | | — | |
| Abstain | | | 85,177 | | | | 17 | | | | — | | | | — | | | | — | | | | — | |
| Broker Non-Votes | | | 566,661 | | | | — | | | | — | | | | — | | | | — | | | | — | |
| Total | | | 3,174,494 | | | | 1,029 | | | | — | | | | — | | | | — | | | | — | |
| To approve the elimination of the fundamental | | | | | | | | | | | | | | | | | | | | | |
| policy relating to derivatives and short sales. | | | | | | | | | | | | | | | | | | | | | | | | |
| For | | | 2,267,770 | | | | 873 | | | | — | | | | — | | | | — | | | | — | |
| Against | | | 257,385 | | | | 139 | | | | — | | | | — | | | | — | | | | — | |
| Abstain | | | 82,678 | | | | 17 | | | | — | | | | — | | | | — | | | | — | |
| Broker Non-Votes | | | 566,661 | | | | — | | | | — | | | | — | | | | — | | | | — | |
| Total | | | 3,174,494 | | | | 1,029 | | | | — | | | | — | | | | — | | | | — | |
| To approve the elimination of the fundamental | | | | | | | | | | | | | | | | | | | | | |
| policy relating to commodities. | | | | | | | | | | | | | | | | | | | | | | | | |
| For | | | 2,259,516 | | | | 873 | | | | — | | | | — | | | | — | | | | — | |
| Against | | | 267,358 | | | | 139 | | | | — | | | | — | | | | — | | | | — | |
| Abstain | | | 80,959 | | | | 17 | | | | — | | | | — | | | | — | | | | — | |
| Broker Non-Votes | | | 566,661 | | | | — | | | | — | | | | — | | | | — | | | | — | |
| Total | | | 3,174,494 | | | | 1,029 | | | | — | | | | — | | | | — | | | | — | |
| To approve the new fundamental policy relating | | | | | | | | | | | | | | | | | | | | | |
| to commodities. | | | | | | | | | | | | | | | | | | | | | | | | |
| For | | | 2,260,959 | | | | 873 | | | | — | | | | — | | | | — | | | | — | |
| Against | | | 260,594 | | | | 139 | | | | — | | | | — | | | | — | | | | — | |
| Abstain | | | 86,280 | | | | 17 | | | | — | | | | — | | | | — | | | | — | |
| Broker Non-Votes | | | 566,661 | | | | — | | | | — | | | | — | | | | — | | | | — | |
| Total | | | 3,174,494 | | | | 1,029 | | | | — | | | | — | | | | — | | | | — | |
Nuveen Investments 17
| | | | | | | | |
| NAZ | Shareholder Meeting Report (continued) | | | |
| NFZ | | | | | | | |
| NKR | | | | | | | |
| | | NAZ | | | NFZ | | | NKR | |
| | | Common and | | | | | | Common and | | | | | | Common and | | | | |
| | | Preferred | | | Preferred | | | Preferred | | | Preferred | | | Preferred | | | Preferred | |
| | | shares voting | | | shares voting | | | shares voting | | | shares voting | | | shares voting | | | shares voting | |
| | | together | | | together | | | together | | | together | | | together | | | together | |
| | | as a class | | | as a class | | | as a class | | | as a class | | | as a class | | | as a class | |
| Approval of the Board Members was reached | | | | | | | | | | | | | | | | |
| as follows: | | | | | | | | | | | | | | | | | | |
| John P. Amboian | | | | | | | | | | | | | | | | | | |
| For | | | 2,929,434 | | | | — | | | | — | | | | — | | | | — | | | | — | |
| Withhold | | | 244,566 | | | | — | | | | — | | | | — | | | | — | | | | — | |
| Total | | | 3,174,000 | | | | — | | | | — | | | | — | | | | — | | | | — | |
| Robert P. Bremner | | | | | | | | | | | | | | | | | | | | | | | | |
| For | | | 2,918,583 | | | | — | | | | 1,004,873 | | | | — | | | | 1,604,900 | | | | — | |
| Withhold | | | 255,417 | | | | — | | | | 48,415 | | | | — | | | | 105,101 | | | | — | |
| Total | | | 3,174,000 | | | | — | | | | 1,053,288 | | | | — | | | | 1,710,001 | | | | — | |
| Jack B. Evans | | | | | | | | | | | | | | | | | | | | | | | | |
| For | | | 2,917,233 | | | | — | | | | 1,004,873 | | | | — | | | | 1,604,900 | | | | — | |
| Withhold | | | 256,767 | | | | — | | | | 48,415 | | | | — | | | | 105,101 | | | | — | |
| Total | | | 3,174,000 | | | | — | | | | 1,053,288 | | | | — | | | | 1,710,001 | | | | — | |
| William C. Hunter | | | | | | | | | | | | | | | | | | | | | | | | |
| For | | | — | | | | 362 | | | | — | | | | 219 | | | | — | | | | 216 | |
| Withhold | | | — | | | | 173 | | | | — | | | | 44 | | | | — | | | | 190 | |
| Total | | | — | | | | 535 | | | | — | | | | 263 | | | | — | | | | 406 | |
| David J. Kundert | | | | | | | | | | | | | | | | | | | | | | | | |
| For | | | 2,929,084 | | | | — | | | | — | | | | — | | | | — | | | | — | |
| Withhold | | | 244,916 | | | | — | | | | — | | | | — | | | | — | | | | — | |
| Total | | | 3,174,000 | | | | — | | | | — | | | | — | | | | — | | | | — | |
| William J. Schneider | | | | | | | | | | | | | | | | | | | | | | | | |
| For | | | — | | | | 362 | | | | — | | | | 219 | | | | — | | | | 216 | |
| Withhold | | | — | | | | 173 | | | | — | | | | 44 | | | | — | | | | 190 | |
| Total | | | — | | | | 535 | | | | — | | | | 263 | | | | — | | | | 406 | |
| Judith M. Stockdale | | | | | | | | | | | | | | | | | | | | | | | | |
| For | | | 2,926,384 | | | | — | | | | — | | | | — | | | | — | | | | — | |
| Withhold | | | 247,616 | | | | — | | | | — | | | | — | | | | — | | | | — | |
| Total | | | 3,174,000 | | | | — | | | | — | | | | — | | | | — | | | | — | |
| Carole E. Stone | | | | | | | | | | | | | | | | | | | | | | | | |
| For | | | 2,928,084 | | | | — | | | | — | | | | — | | | | — | | | | — | |
| Withhold | | | 245,916 | | | | — | | | | — | | | | — | | | | — | | | | — | |
| Total | | | 3,174,000 | | | | — | | | | — | | | | — | | | | — | | | | — | |
| Terence J. Toth | | | | | | | | | | | | | | | | | | | | | | | | |
| For | | | 2,927,384 | | | | — | | | | — | | | | — | | | | — | | | | — | |
| Withhold | | | 246,616 | | | | — | | | | — | | | | — | | | | — | | | | — | |
| Total | | | 3,174,000 | | | | — | | | | — | | | | — | | | | — | | | | — | |
| | | NXE | | | NTX | |
| | | Common and | | | | | | Common and | | | | |
| | | Preferred | | | Preferred | | | Preferred | | | Preferred | |
| | | shares voting | | | shares voting | | | shares voting | | | shares voting | |
| | | together | | | together | | | together | | | together | |
| | | as a class | | | as a class | | | as a class | | | as a class | |
| To approve the elimination of the Fund’s fundamental | | | | | | | | | | | | |
| policy relating to investments in municipal | | | | | | | | | | | | |
| securities and below investment grade securities. | | | | | | | | | | | | |
| For | | | 1,604,588 | | | | 547 | | | | 4,575,435 | | | | 1,768 | |
| Against | | | 73,702 | | | | 24 | | | | 377,271 | | | | 28 | |
| Abstain | | | 39,454 | | | | — | | | | 129,374 | | | | 2 | |
| Broker Non-Votes | | | 469,959 | | | | — | | | | 1,499,903 | | | | — | |
| Total | | | 2,187,703 | | | | 571 | | | | 6,581,983 | | | | 1,798 | |
| To approve the new fundamental policy relating | | | | | | | | | | | | | | | | |
| to investments in municipal securities for the Fund. | | | | | | | | | | | | | | | | |
| For | | | 1,609,489 | | | | 547 | | | | 4,613,150 | | | | 1,735 | |
| Against | | | 63,670 | | | | 24 | | | | 336,083 | | | | 61 | |
| Abstain | | | 44,585 | | | | — | | | | 132,847 | | | | 2 | |
| Broker Non-Votes | | | 469,959 | | | | — | | | | 1,499,903 | | | | — | |
| Total | | | 2,187,703 | | | | 571 | | | | 6,581,983 | | | | 1,798 | |
| To approve the elimination of the fundamental | | | | | | | | | | | | | | | | |
| policy prohibiting investment in other | | | | | | | | | | | | | | | | |
| investment companies. | | | | | | | | | | | | | | | | |
| For | | | — | | | | — | | | | 4,544,203 | | | | 1,735 | |
| Against | | | — | | | | — | | | | 395,405 | | | | 63 | |
| Abstain | | | — | | | | — | | | | 142,472 | | | | — | |
| Broker Non-Votes | | | — | | | | — | | | | 1,499,903 | | | | — | |
| Total | | | — | | | | — | | | | 6,581,983 | | | | 1,798 | |
| To approve the elimination of the fundamental | | | | | | | | | | | | | | | | |
| policy relating to derivatives and short sales. | | | | | | | | | | | | | | | | |
| For | | | — | | | | — | | | | 4,548,122 | | | | 1,737 | |
| Against | | | — | | | | — | | | | 392,713 | | | | 61 | |
| Abstain | | | — | | | | — | | | | 141,245 | | | | — | |
| Broker Non-Votes | | | — | | | | — | | | | 1,499,903 | | | | — | |
| Total | | | — | | | | — | | | | 6,581,983 | | | | 1,798 | |
| To approve the elimination of the fundamental | | | | | | | | | | | | | | | | |
| policy relating to commodities. | | | | | | | | | | | | | | | | |
| For | | | — | | | | — | | | | 4,554,664 | | | | 1,735 | |
| Against | | | — | | | | — | | | | 391,793 | | | | 63 | |
| Abstain | | | — | | | | — | | | | 135,623 | | | | — | |
| Broker Non-Votes | | | — | | | | — | | | | 1,499,903 | | | | — | |
| Total | | | — | | | | — | | | | 6,581,983 | | | | 1,798 | |
| To approve the new fundamental policy relating | | | | | | | | | | | | | | | | |
| to commodities. | | | | | | | | | | | | | | | | |
| For | | | — | | | | — | | | | 4,492,126 | | | | 1,735 | |
| Against | | | — | | | | — | | | | 457,240 | | | | 61 | |
| Abstain | | | — | | | | — | | | | 132,714 | | | | 2 | |
| Broker Non-Votes | | | — | | | | — | | | | 1,499,903 | | | | — | |
| Total | | | — | | | | — | | | | 6,581,983 | | | | 1,798 | |
Nuveen Investments 19
| | | |
| | Shareholder Meeting Report (continued) | |
| NXE | | |
| NTX | | |
| | | NXE | | | NTX | |
| | | Common and | | | | | | Common and | | | | |
| | | Preferred | | | Preferred | | | Preferred | | | Preferred | |
| | | shares voting | | | shares voting | | | shares voting | | | shares voting | |
| | | together | | | together | | | together | | | together | |
| | | as a class | | | as a class | | | as a class | | | as a class | |
| Approval of the Board Members was reached as follows: | | | | | | | | | | |
| John P. Amboian | | | | | | | | | | | | |
| For | | | — | | | | — | | | | — | | | | — | |
| Withhold | | | — | | | | — | | | | — | | | | — | |
| Total | | | — | | | | — | | | | — | | | | — | |
| Robert P. Bremner | | | | | | | | | | | | | | | | |
| For | | | 2,113,145 | | | | — | | | | 6,340,269 | | | | — | |
| Withhold | | | 74,558 | | | | — | | | | 241,714 | | | | — | |
| Total | | | 2,187,703 | | | | — | | | | 6,581,983 | | | | — | |
| Jack B. Evans | | | | | | | | | | | | | | | | |
| For | | | 2,115,870 | | | | — | | | | 6,346,942 | | | | — | |
| Withhold | | | 71,833 | | | | — | | | | 235,041 | | | | — | |
| Total | | | 2,187,703 | | | | — | | | | 6,581,983 | | | | — | |
| William C. Hunter | | | | | | | | | | | | | | | | |
| For | | | — | | | | 476 | | | | — | | | | 1,569 | |
| Withhold | | | — | | | | 95 | | | | — | | | | 229 | |
| Total | | | — | | | | 571 | | | | — | | | | 1,798 | |
| David J. Kundert | | | | | | | | | | | | | | | | |
| For | | | — | | | | — | | | | — | | | | — | |
| Withhold | | | — | | | | — | | | | — | | | | — | |
| Total | | | — | | | | — | | | | — | | | | — | |
| William J. Schneider | | | | | | | | | | | | | | | | |
| For | | | — | | | | 476 | | | | — | | | | 1,569 | |
| Withhold | | | — | | | | 95 | | | | — | | | | 229 | |
| Total | | | — | | | | 571 | | | | — | | | | 1,798 | |
| Judith M. Stockdale | | | | | | | | | | | | | | | | |
| For | | | — | | | | — | | | | — | | | | — | |
| Withhold | | | — | | | | — | | | | — | | | | — | |
| Total | | | — | | | | — | | | | — | | | | — | |
| Carole E. Stone | | | | | | | | | | | | | | | | |
| For | | | — | | | | — | | | | — | | | | — | |
| Withhold | | | — | | | | — | | | | — | | | | — | |
| Total | | | — | | | | — | | | | — | | | | — | |
| Terence J. Toth | | | | | | | | | | | | | | | | |
| For | | | — | | | | — | | | | — | | | | — | |
| Withhold | | | — | | | | — | | | | — | | | | — | |
| Total | | | — | | | | — | | | | — | | | | — | |
Report of Independent
Registered Public Accounting Firm
The Board of Directors/Trustees and Shareholders
Nuveen Arizona Premium Income Municipal Fund, Inc.
Nuveen Arizona Dividend Advantage Municipal Fund
Nuveen Arizona Dividend Advantage Municipal Fund 2
Nuveen Arizona Dividend Advantage Municipal Fund 3
Nuveen Texas Quality Income Municipal Fund
We have audited the accompanying statements of assets and liabilities, including the portfolios of investments, of Nuveen Arizona Premium Income Municipal Fund, Inc., Nuveen Arizona Dividend Advantage Municipal Fund, Nuveen Arizona Dividend Advantage Municipal Fund 2, Nuveen Arizona Dividend Advantage Municipal Fund 3 and Nuveen Texas Quality Income Municipal Fund (the “Funds”), as of July 31, 2010, and the related statements of operations for the year then ended, the statements of changes in net assets for each of the two years in the period then ended, and the financial highlights for each of the five years in the period then ended. These financial statements and financial highlights are the responsibility of the Funds’ management. Our responsibility is to express an opinion on these financial statements and financial highlights based on our audits.
We conducted our audits in accordance with the standards of the Public Company Accounting Oversight Board (United States). Those standards require that we plan and perform the audit to obtain reasonable assurance about whether the financial statements and financial highlights are free of material misstatement. We were not engaged to perform an audit of the Funds’ internal control over financial reporting. Our audits included consideration of internal control over financial reporting as a basis for designing audit procedures that are appropriate in the circumstances, but not for the purpose of expressing an opinion on the effectiveness of the Funds’ internal control over financial reporting. Accordingly, we express no such opinion. An audit also includes examining, on a test basis, evidence supporting the amounts and disclosures in the f inancial statements and financial highlights, assessing the accounting principles used and significant estimates made by management and evaluating the overall financial statement presentation. Our procedures included confirmation of securities owned as of July 31, 2010, by correspondence with the custodian and brokers or by other appropriate auditing procedures where replies from brokers were not received. We believe that our audits provide a reasonable basis for our opinion.
In our opinion, the financial statements and financial highlights referred to above present fairly, in all material respects, the financial positions of Nuveen Arizona Premium Income Municipal Fund, Inc., Nuveen Arizona Dividend Advantage Municipal Fund, Nuveen Arizona Dividend Advantage Municipal Fund 2, Nuveen Arizona Dividend Advantage Municipal Fund 3 and Nuveen Texas Quality Income Municipal Fund at July 31, 2010, the results of their operations for the year then ended, the changes in their net assets for each of the two years in the period then ended, and the financial highlights for each of the five years in the period then ended in conformity with U.S. generally accepted accounting principles.
Chicago, Illinois
September 27, 2010
Nuveen Investments 21
| | | | | |
| | Nuveen Arizona Premium Income Municipal Fund, Inc. | | |
| NAZ | Portfolio of Investments | | |
| | | July 31, 2010 |
| Principal | | | Optional Call | | |
| Amount (000) | | Description (1) | Provisions (2) | Ratings (3) | Value |
| | | Consumer Staples – 1.2% (0.8% of Total Investments) | | | |
| $ 765 | | Puerto Rico, The Children’s Trust Fund, Tobacco Settlement Asset-Backed Refunding Bonds, | 5/12 at 100.00 | BBB | $ 730,613 |
| | | Series 2002, 5.375%, 5/15/33 | | | |
| | | Education and Civic Organizations – 13.5% (9.6% of Total Investments) | | | |
| 2,500 | | Arizona Higher Education Loan Authority, Student Loan Revenue Bonds, Series 2007B, Auction | 9/10 at 100.00 | A | 2,055,600 |
| | | Rate Securities, 0.585%, 11/01/41 (Alternative Minimum Tax) (4) | | | |
| 1,000 | | Arizona State University, System Revenue Bonds, Series 2002, 5.000%, 7/01/25 – FGIC Insured | 7/12 at 100.00 | AA | 1,056,590 |
| | | Arizona State University, System Revenue Bonds, Series 2005: | | | |
| 1,455 | | 5.000%, 7/01/20 – AMBAC Insured | 7/15 at 100.00 | Aa3 | 1,527,634 |
| 750 | | 5.000%, 7/01/21 – AMBAC Insured | 7/15 at 100.00 | Aa3 | 782,490 |
| 1,600 | | Glendale Industrial Development Authority, Arizona, Revenue Bonds, Midwestern University, | 5/20 at 100.00 | A– | 1,607,824 |
| | | Series 2010, 5.125%, 5/15/40 | | | |
| 1,500 | | Tempe Industrial Development Authority, Arizona, Lease Revenue Bonds, Arizona State University | 7/13 at 100.00 | N/R | 1,410,300 |
| | | Foundation Project, Series 2003, 5.000%, 7/01/34 – AMBAC Insured | | | |
| 8,805 | | Total Education and Civic Organizations | | | 8,440,438 |
| | | Health Care – 21.8% (15.5% of Total Investments) | | | |
| 1,430 | | Arizona Health Facilities Authority, Hospital Revenue Bonds, Banner Health Systems, Series | 1/17 at 100.00 | A+ | 1,456,655 |
| | | 2007A, 5.000%, 1/01/25 | | | |
| 885 | | Arizona Health Facilities Authority, Hospital Revenue Bonds, Banner Health Systems, Series | 1/17 at 100.00 | A+ | 573,834 |
| | | 2007B, 1.167%, 1/01/37 | | | |
| 3,470 | | Arizona Health Facilities Authority, Hospital Revenue Bonds, Banner Health Systems, Series | 1/18 at 100.00 | A+ | 3,552,551 |
| | | 2008D, 5.500%, 1/01/38 | | | |
| 675 | | Glendale Industrial Development Authority, Arizona, Revenue Bonds, John C. Lincoln Health | 12/15 at 100.00 | BBB | 619,488 |
| | | Network, Series 2005B, 5.000%, 12/01/37 | | | |
| 1,110 | | Glendale Industrial Development Authority, Arizona, Revenue Bonds, John C. Lincoln Health | 12/17 at 100.00 | BBB | 1,001,775 |
| | | Network, Series 2007, 5.000%, 12/01/42 | | | |
| 2,150 | | Maricopa County Industrial Development Authority, Arizona, Health Facility Revenue Bonds, | 7/14 at 100.00 | A | 2,227,379 |
| | | Catholic Healthcare West, Series 2004A, 5.375%, 7/01/23 | | | |
| 2,800 | | Maricopa County Industrial Development Authority, Arizona, Health Facility Revenue Bonds, | 7/17 at 100.00 | A | 2,843,680 |
| | | Catholic Healthcare West, Series 2007A, 5.250%, 7/01/32 | | | |
| 515 | | Puerto Rico Industrial, Tourist, Educational, Medical and Environmental Control Facilities | 11/10 at 101.00 | Aa1 | 526,953 |
| | | Financing Authority, Hospital Revenue Bonds, Hospital de la Concepcion, Series 2000A, | | | |
| | | 6.375%, 11/15/15 | | | |
| 950 | | Winslow Industrial Development Authority, Arizona, Hospital Revenue Bonds, Winslow Memorial | 12/10 at 100.00 | N/R | 852,017 |
| | | Hospital, Series 1998, 5.500%, 6/01/22 | | | |
| 13,985 | | Total Health Care | | | 13,654,332 |
| | | Housing/Single Family – 4.6% (3.3% of Total Investments) | | | |
| 795 | | Phoenix and Pima County Industrial Development Authority, Arizona, Single Family Mortgage | 7/17 at 103.00 | Aaa | 822,332 |
| | | Revenue Bonds, Series 2007-4, 5.800%, 12/01/39 (Alternative Minimum Tax) | | | |
| 2,010 | | Tucson and Pima County Industrial Development Authority, Arizona, Joint Single Family Mortgage | 6/17 at 101.00 | Aaa | 2,052,130 |
| | | Revenue Bonds, Series 2007B, 5.350%, 6/01/47 (Alternative Minimum Tax) | | | |
| 2,805 | | Total Housing/Single Family | | | 2,874,462 |
| | | | | | |
| Principal | | | Optional Call | | |
| Amount (000) | | Description (1) | Provisions (2) | Ratings (3) | Value |
| | | Tax Obligation/General – 10.8% (7.7% of Total Investments) | | | |
| $ 1,265 | | Gila County Unified School District 10 Payson, Arizona, School Improvement Bonds, Project | 7/18 at 100.00 | Aa3 | $ 1,390,083 |
| | | 2006, Series 2008B, 5.750%, 7/01/28 | | | |
| 1,200 | | Maricopa County Unified School District 95 Queen Creek, Arizona, General Obligation Bonds, | 7/18 at 100.00 | Aa3 | 1,257,060 |
| | | Series 2008, 5.000%, 7/01/27 – AGM Insured | | | |
| 3,530 | | Pinal County Unified School District 1, Florence, Arizona, General Obligation Bonds, Series | 7/18 at 100.00 | A | 3,761,497 |
| | | 2008C, 5.250%, 7/01/28 | | | |
| 330 | | Puerto Rico, General Obligation and Public Improvement Bonds, Series 2001A, 5.375%, 7/01/28 | 7/11 at 100.00 | A3 | 331,142 |
| 6,325 | | Total Tax Obligation/General | | | 6,739,782 |
| | | Tax Obligation/Limited – 33.7% (23.9% of Total Investments) | | | |
| 355 | | Estrella Mountain Ranch Community Facilities District, Goodyear, Arizona, Special Assessment | 7/12 at 100.00 | N/R | 362,384 |
| | | Lien Bonds, Series 2001A, 7.875%, 7/01/25 | | | |
| 3,000 | | Glendale Western Loop 101 Public Facilities Corporation, Arizona, Third Lien Excise Tax | 1/14 at 100.00 | AA | 3,153,870 |
| | | Revenue Bonds, Series 2008B, 6.250%, 7/01/38 | | | |
| 1,280 | | Greater Arizona Development Authority, Infrastructure Revenue Bonds, Series 2006-1, 5.000%, | 8/16 at 100.00 | AA– | 1,347,149 |
| | | 8/01/22 – NPFG Insured | | | |
| 740 | | Greater Arizona Development Authority, Infrastructure Revenue Bonds, Series 2006A, 5.000%, | 8/16 at 100.00 | AA– | 786,161 |
| | | 8/01/23 – NPFG Insured | | | |
| 575 | | Marana Municipal Property Corporation, Arizona, Revenue Bonds, Series 2003, 5.000%, 7/01/28 – | 7/13 at 100.00 | AA | 590,997 |
| | | AMBAC Insured | | | |
| 1,511 | | Marana, Arizona, Tangerine Farms Road Improvement District Revenue Bonds, Series 2006, | 7/16 at 100.00 | A2 | 1,441,811 |
| | | 4.600%, 1/01/26 | | | |
| 3,400 | | Maricopa County Stadium District, Arizona, Revenue Refunding Bonds, Series 2002, 5.375%, | 6/12 at 100.00 | N/R | 3,595,840 |
| | | 6/01/18 – AMBAC Insured | | | |
| 3,400 | | Mesa, Arizona, Street and Highway User Tax Revenue Bonds, Series 2005, 5.000%, 7/01/24 – | 7/15 at 100.00 | AAA | 3,631,710 |
| | | AGM Insured | | | |
| 1,140 | | Pinetop Fire District of Navajo County, Arizona, Certificates of Participation, Series 2008, | 6/16 at 102.00 | A3 | 1,156,564 |
| | | 7.750%, 6/15/29 | | | |
| 1,200 | | Prescott Valley Municipal Property Corporation, Arizona, Municipal Facilities Revenue Bonds, | 1/13 at 100.00 | AA– | 1,225,428 |
| | | Series 2003, 5.000%, 1/01/27 – FGIC Insured | | | |
| 265 | | Puerto Rico Public Buildings Authority, Guaranteed Government Facilities Revenue Refunding | 7/12 at 100.00 | A3 | 265,779 |
| | | Bonds, Series 2002D, 5.125%, 7/01/24 | | | |
| 1,610 | | San Luis Civic Improvement Corporation, Arizona, Municipal Facilities Excise Tax Revenue | 7/15 at 100.00 | A+ | 1,657,286 |
| | | Bonds, Series 2005, 5.000%, 7/01/25 – SYNCORA GTY Insured | | | |
| 1,000 | | Scottsdale Municipal Property Corporation, Arizona, Excise Tax Revenue Bonds, Refunding Series | No Opt. Call | AAA | 1,178,670 |
| | | 2006, 5.000%, 7/01/24 | | | |
| 645 | | Vistancia Community Facilities District, Arizona, Restricted General Obligation Bonds, Series | 7/15 at 100.00 | A1 | 683,100 |
| | | 2005, 5.750%, 7/15/24 | | | |
| 20,121 | | Total Tax Obligation/Limited | | | 21,076,749 |
| | | U.S. Guaranteed – 10.8% (7.7% of Total Investments) (5) | | | |
| 1,000 | | Arizona Health Facilities Authority, Hospital System Revenue Bonds, John C. Lincoln Health | 12/10 at 102.00 | BBB (5) | 1,041,490 |
| | | Network, Series 2000, 7.000%, 12/01/25 (Pre-refunded 12/01/10) | | | |
| 1,250 | | Glendale Industrial Development Authority, Arizona, Revenue Bonds, Midwestern University, | 5/11 at 101.00 | AAA | 1,317,688 |
| | | Series 2001A, 5.875%, 5/15/31 (Pre-refunded 5/15/11) | | | |
| 1,250 | | Maricopa County Industrial Development Authority, Arizona, Hospital Revenue Refunding Bonds, | No Opt. Call | A (5) | 1,525,850 |
| | | Samaritan Health Services, Series 1990A, 7.000%, 12/01/16 – MBIA Insured (ETM) | | | |
Nuveen Investments 23
NAZ
Nuveen Arizona Premium Income Municipal Fund, Inc. (continued)
Portfolio of Investments July 31, 2010
| | | | | | | |
| Principal | | | Optional Call | | | |
| Amount (000) | | Description (1) | Provisions (2) | Ratings (3) | | Value |
| | | U.S. Guaranteed (5) (continued) | | | | |
| $ 385 | | Maricopa County, Arizona, Hospital Revenue Bonds, Sun Health Corporation, Series 2005, 5.000%, | 4/15 at 100.00 | N/R (5) | $ | 449,615 |
| | | 4/01/16 (Pre-refunded 4/01/15) | | | | |
| 735 | | Puerto Rico Public Buildings Authority, Guaranteed Government Facilities Revenue Refunding | 7/12 at 100.00 | Baa3 (5) | | 798,151 |
| | | Bonds, Series 2002D, 5.125%, 7/01/24 (Pre-refunded 7/01/12) | | | | |
| 1,500 | | Scottsdale Industrial Development Authority, Arizona, Hospital Revenue Bonds, Scottsdale | 12/11 at 101.00 | N/R (5) | | 1,624,665 |
| | | Healthcare, Series 2001, 5.800%, 12/01/31 (Pre-refunded 12/01/11) | | | | |
| 6,120 | | Total U.S. Guaranteed | | | | 6,757,459 |
| | | Utilities – 23.6% (16.8% of Total Investments) | | | | |
| 1,000 | | Arizona Power Authority, Special Obligation Power Resource Revenue Refunding Crossover Bonds, | No Opt. Call | AA | | 1,182,010 |
| | | Hoover Project, Series 2001, 5.250%, 10/01/15 | | | | |
| 1,340 | | Pima County Industrial Development Authority, Arizona, Revenue Bonds, Tucson Electric Power | 1/15 at 100.00 | BBB– | | 1,371,034 |
| | | Company, Refunding Series 2008, 5.750%, 9/01/29 | | | | |
| 2,170 | | Puerto Rico Electric Power Authority, Power Revenue Bonds, Series 2005RR, 5.000%, 7/01/27 – | 7/15 at 100.00 | A3 | | 2,190,159 |
| | | SYNCORA GTY Insured | | | | |
| 530 | | Salt River Project Agricultural Improvement and Power District, Arizona, Electric System | 1/13 at 100.00 | Aa1 | | 567,360 |
| | | Revenue Bonds, Series 2002B, 5.000%, 1/01/22 | | | | |
| 715 | | Salt River Project Agricultural Improvement and Power District, Arizona, Electric System | 1/18 at 100.00 | Aa1 | | 856,684 |
| | | Revenue Bonds, Tender Option Bond Trust 09-9W, 17.172%, 1/01/38 (IF) | | | | |
| 1,000 | | Salt River Project Agricultural Improvement and Power District, Arizona, Electric System | 1/12 at 101.00 | Aa1 | | 1,029,930 |
| | | Revenue Refunding Bonds, Series 2002A, 5.125%, 1/01/27 | | | | |
| | | Salt Verde Financial Corporation, Arizona, Senior Gas Revenue Bonds, Citigroup Energy Inc | | | | |
| | | Prepay Contract Obligations, Series 2007: | | | | |
| 4,500 | | 5.500%, 12/01/29 | No Opt. Call | A | | 4,459,995 |
| 3,500 | | 5.000%, 12/01/37 | No Opt. Call | A | | 3,120,320 |
| 14,755 | | Total Utilities | | | | 14,777,492 |
| | | Water and Sewer – 20.7% (14.7% of Total Investments) | | | | |
| 1,005 | | Cottonwood, Arizona, Senior Lien Water System Revenue Bonds, Municipal Property Corporation, | 7/14 at 100.00 | A | | 1,006,729 |
| | | Series 2004, 5.000%, 7/01/24 – SYNCORA GTY Insured | | | | |
| 3,500 | | Glendale, Arizona, Water and Sewer Revenue Bonds, Subordinate Lien, Series 2003, 5.000%, | 7/13 at 100.00 | AA | | 3,663,730 |
| | | 7/01/28 – AMBAC Insured | | | | |
| 1,425 | | Goodyear, Arizona, Water and Sewer Revenue Obligations, Series 2010, 5.625%, 7/01/39 | 7/20 at 100.00 | A2 | | 1,432,994 |
| 600 | | Oro Valley Municipal Property Corporation, Arizona, Senior Lien Water Revenue Bonds, Series | 7/13 at 100.00 | AA– | | 620,874 |
| | | 2003, 5.000%, 7/01/23 – NPFG Insured | | | | |
| 1,000 | | Phoenix Civic Improvement Corporation, Arizona, Junior Lien Wastewater System Revenue Bonds, | 7/14 at 100.00 | AA+ | | 1,055,210 |
| | | Series 2004, 5.000%, 7/01/24 – NPFG Insured | | | | |
| 1,500 | | Phoenix Civic Improvement Corporation, Arizona, Junior Lien Water System Revenue Bonds, Series | 7/12 at 100.00 | AAA | | 1,549,125 |
| | | 2002, 5.000%, 7/01/26 – FGIC Insured | | | | |
| 1,250 | | Phoenix Civic Improvement Corporation, Arizona, Junior Lien Water System Revenue Refunding | No Opt. Call | AAA | | 1,531,275 |
| | | Bonds, Series 2001, 5.500%, 7/01/21 – FGIC Insured | | | | |
| | | | | | | |
| Principal | | | Optional Call | | | |
| Amount (000) | | Description (1) | Provisions (2) | Ratings (3) | Value | |
| | | Water and Sewer (continued) | | | | |
| | | Surprise Municipal Property Corporation, Arizona, Wastewater System Revenue Bonds, Series 2007: | | | | |
| $ 600 | | 4.700%, 4/01/22 | 4/14 at 100.00 | N/R | $ 604,386 | |
| 695 | | 4.900%, 4/01/32 | 4/17 at 100.00 | N/R | 646,016 | |
| 905 | | Yuma County Industrial Development Authority, Arizona, Exempt Revenue Bonds, Far West Water & | 12/17 at 100.00 | N/R | 841,478 | |
| | | Sewer Inc. Refunding, Series 2007A, 6.375%, 12/01/37 (Alternative Minimum Tax) | | | | |
| 12,480 | | Total Water and Sewer | | | 12,951,817 | |
| $ 86,161 | | Total Investments (cost $83,508,446) – 140.7% | | | 88,003,144 | |
| | | Other Assets Less Liabilities – 3.9% | | | 2,420,402 | |
| | | Auction Rate Preferred Shares, at Liquidation Value – (44.6)% (6) | | | (27,875,000 | ) |
| | | Net Assets Applicable to Common Shares – 100% | | | $ 62,548,546 | |
| | |
| (1) | All percentages shown in the Portfolio of Investments are based on net assets applicable to Common shares unless otherwise noted. |
| (2) | Optional Call Provisions (not covered by the report of independent registered public accounting firm): Dates (month and year) and prices of the earliest |
| | optional call or redemption. There may be other call provisions at varying prices at later dates. Certain mortgage-backed securities may be subject to periodic |
| | principal paydowns. |
| (3) | Ratings (not covered by the report of independent registered public accounting firm): Using the highest of Standard & Poor’s Group (“Standard & Poor’s”), |
| | Moody’s Investor Service, Inc. (“Moody’s”) or Fitch, Inc. (“Fitch”) rating. Ratings below BBB by Standard & Poor’s, Baa by Moody’s or BBB by Fitch are |
| | considered to be below investment grade. |
| (4) | Investment valued at fair value using methods determined in good faith by, or at the discretion of, the Board of Directors. For fair value measurement |
| | disclosure purposes, investment categorized as Level 3. See Notes to Financial Statements, Footnote 1 – General Information and Significant Accounting |
| | Policies, Investment Valuation for more information. |
| (5) | Backed by an escrow or trust containing sufficient U.S. Government or U.S. Government agency securities, which ensure the timely payment of principal |
| | and interest. Such investments are normally considered to be equivalent to AAA rated securities. |
| (6) | Auction Rate Preferred shares, at Liquidation Value as a percentage of Total Investments is 31.7%. |
| N/R | Not rated. |
| (ETM) | Escrowed to maturity. |
| (IF) | Inverse floating rate investment. |
See accompanying notes to financial statements.
Nuveen Investments 25
| | | | | | |
| | | Nuveen Arizona Dividend Advantage Municipal Fund | | |
| NFZ | | Portfolio of Investments | | |
| | | | July 31, 2010 |
| Principal | | | Optional Call | | |
| Amount (000) | | Description (1) | Provisions (2) | Ratings (3) | Value |
| | | Education and Civic Organizations – 10.5% (7.2% of Total Investments) | | | |
| $ 280 | | Arizona Higher Education Loan Authority, Student Loan Revenue Bonds, Series 2007B, Auction | 9/10 at 100.00 | A | $ 230,227 |
| | | Rate Securities, 0.585%, 11/01/41 (Alternative Minimum Tax) (4) | | | |
| 500 | | Glendale Industrial Development Authority, Arizona, Revenue Bonds, Midwestern University, | 5/20 at 100.00 | A– | 502,445 |
| | | Series 2010, 5.125%, 5/15/40 | | | |
| 1,000 | | Puerto Rico Industrial, Tourist, Educational, Medical and Environmental Control Facilities | 8/10 at 100.50 | BBB– | 975,400 |
| | | Financing Authority, Higher Education Revenue Bonds, Ana G. Mendez University System, | | | |
| | | Series 1999, 5.375%, 2/01/29 | | | |
| 300 | | Puerto Rico Industrial, Tourist, Educational, Medical and Environmental Control Facilities | 9/11 at 100.00 | BBB | 301,713 |
| | | Financing Authority, Higher Education Revenue Bonds, University of the Sacred Heart, Series | | | |
| | | 2001, 5.250%, 9/01/21 | | | |
| 305 | | Tucson Industrial Development Authority, Arizona, Charter School Revenue Bonds, Arizona | 9/14 at 100.00 | BBB– | 288,323 |
| | | Agribusiness and Equine Center Charter School, Series 2004A, 6.125%, 9/01/34 | | | |
| 2,385 | | Total Education and Civic Organizations | | | 2,298,108 |
| | | Health Care – 18.0% (12.4% of Total Investments) | | | |
| 565 | | Arizona Health Facilities Authority, Hospital Revenue Bonds, Banner Health Systems, Series | 1/17 at 100.00 | A+ | 575,532 |
| | | 2007A, 5.000%, 1/01/25 | | | |
| 325 | | Arizona Health Facilities Authority, Hospital Revenue Bonds, Banner Health Systems, Series | 1/17 at 100.00 | A+ | 210,730 |
| | | 2007B, 1.167%, 1/01/37 | | | |
| 720 | | Arizona Health Facilities Authority, Hospital Revenue Bonds, Banner Health Systems, Series | 1/18 at 100.00 | A+ | 737,129 |
| | | 2008D, 5.500%, 1/01/38 | | | |
| 10 | | California Health Facilities Financing Authority, Health Facility Revenue Bonds, Adventist | 3/13 at 100.00 | A | 10,002 |
| | | Health System/West, Series 2003A, 5.000%, 3/01/28 | | | |
| 250 | | Glendale Industrial Development Authority, Arizona, Revenue Bonds, John C. Lincoln Health | 12/15 at 100.00 | BBB | 229,440 |
| | | Network, Series 2005B, 5.000%, 12/01/37 | | | |
| 415 | | Glendale Industrial Development Authority, Arizona, Revenue Bonds, John C. Lincoln Health | 12/17 at 100.00 | BBB | 374,538 |
| | | Network, Series 2007, 5.000%, 12/01/42 | | | |
| 750 | | Maricopa County Industrial Development Authority, Arizona, Health Facility Revenue Bonds, | 7/14 at 100.00 | A | 776,993 |
| | | Catholic Healthcare West, Series 2004A, 5.375%, 7/01/23 | | | |
| 1,025 | | Maricopa County Industrial Development Authority, Arizona, Health Facility Revenue Bonds, | 7/17 at 100.00 | A | 1,040,990 |
| | | Catholic Healthcare West, Series 2007A, 5.250%, 7/01/32 | | | |
| 4,060 | | Total Health Care | | | 3,955,354 |
| | | Housing/Multifamily – 3.3% (2.2% of Total Investments) | | | |
| 1,000 | | Maricopa County Industrial Development Authority, Arizona, Multifamily Housing Revenue Bonds, | 8/10 at 101.00 | Baa1 | 724,150 |
| | | Whispering Palms Apartments, Series 1999A, 5.900%, 7/01/29 – NPFG Insured | | | |
| | | Housing/Single Family – 3.3% (2.3% of Total Investments) | | | |
| 720 | | Tucson and Pima County Industrial Development Authority, Arizona, Joint Single Family Mortgage | 6/17 at 101.00 | Aaa | 735,091 |
| | | Revenue Bonds, Series 2007B, 5.350%, 6/01/47 (Alternative Minimum Tax) | | | |
| | | Tax Obligation/General – 11.7% (8.0% of Total Investments) | | | |
| 1,000 | | Maricopa County Unified School District 11, Peoria, Arizona, General Obligation Bonds, Second | 7/15 at 100.00 | Aa2 | 1,105,900 |
| | | Series 2005, 5.000%, 7/01/20 – FGIC Insured | | | |
| 1,340 | | Yuma & La Paz Counties Community College District, Arizona, General Obligation Bonds, Series | 7/16 at 100.00 | Aa2 | 1,458,912 |
| | | 2006, 5.000%, 7/01/21 – NPFG Insured | | | |
| 2,340 | | Total Tax Obligation/General | | | 2,564,812 |
| | | Tax Obligation/Limited – 46.8% (32.2% of Total Investments) | | | |
| 1,220 | | Arizona Tourism and Sports Authority, Tax Revenue Bonds, Multipurpose Stadium Facility | 7/13 at 100.00 | A1 | 1,209,020 |
| | | Project, Series 2003A, 5.000%, 7/01/31 – NPFG Insured | | | |
| 88 | | Centerra Community Facilities District, Goodyear, Arizona, General Obligation Bonds, Series | 7/15 at 100.00 | N/R | 72,340 |
| | | 2005, 5.500%, 7/15/29 | | | |
| 207 | | Estrella Mountain Ranch Community Facilities District, Arizona, Special Assessment Bonds, | 1/17 at 100.00 | N/R | 160,547 |
| | �� | Montecito Assessment District, Series 2007, 5.700%, 7/01/27 | | | |
| | | | | | |
| Principal | | | Optional Call | | |
| Amount (000) | | Description (1) | Provisions (2) | Ratings (3) | Value |
| | | Tax Obligation/Limited (continued) | | | |
| $ 138 | | Estrella Mountain Ranch Community Facilities District, Goodyear, Arizona, Special Assessment | 7/12 at 100.00 | N/R | $ 140,870 |
| | | Lien Bonds, Series 2001A, 7.875%, 7/01/25 | | | |
| 1,000 | | Greater Arizona Development Authority, Infrastructure Revenue Bonds, Series 2006-1, 5.000%, | 8/16 at 100.00 | AA– | 1,052,460 |
| | | 8/01/22 – NPFG Insured | | | |
| 275 | | Greater Arizona Development Authority, Infrastructure Revenue Bonds, Series 2006A, 5.000%, | 8/16 at 100.00 | AA– | 292,155 |
| | | 8/01/23 – NPFG Insured | | | |
| 1,180 | | Marana Municipal Property Corporation, Arizona, Revenue Bonds, Series 2003, 5.000%, 7/01/23 – | 7/13 at 100.00 | AA | 1,246,587 |
| | | AMBAC Insured | | | |
| 528 | | Marana, Arizona, Tangerine Farms Road Improvement District Revenue Bonds, Series 2006, | 7/16 at 100.00 | A2 | 503,823 |
| | | 4.600%, 1/01/26 | | | |
| 150 | | Marley Park Community Facilities District, City of Surprise, Arizona, Limited Tax General | 7/17 at 100.00 | N/R | 130,886 |
| | | Obligation Bonds, Series 2007, 6.100%, 7/15/32 | | | |
| 255 | | Merrill Ranch Community Facilities District 1, Florence, Arizona, General Obligation Bonds, | 7/18 at 100.00 | N/R | 256,293 |
| | | Series 2008A, 7.400%, 7/15/33 | | | |
| 330 | | Palm Valley Community Facility District 3, Goodyear, Arizona, General Obligation Bonds, Series | 7/16 at 100.00 | N/R | 261,779 |
| | | 2006, 5.300%, 7/15/31 | | | |
| 225 | | Palm Valley Community Facility District 3, Goodyear, Arizona, Limited Tax General Obligation | 7/17 at 100.00 | N/R | 188,980 |
| | | Bonds, Series 2007, 5.800%, 7/15/32 | | | |
| 100 | | Parkway Community Facilities District 1, Prescott Valley, Arizona, General Obligation Bonds, | 7/16 at 100.00 | N/R | 79,862 |
| | | Series 2006, 5.350%, 7/15/31 | | | |
| 900 | | Phoenix Industrial Development Authority, Arizona, Government Bonds, Capitol Mall LLC II, | 3/12 at 100.00 | A1 | 949,014 |
| | | Series 2001, 5.250%, 9/15/16 – AMBAC Insured | | | |
| 680 | | Pinal County Industrial Development Authority, Arizona, Correctional Facilities Contract | No Opt. Call | BBB– | 665,244 |
| | | Revenue Bonds, Florence West Prison LLC, Series 2002A, 5.000%, 10/01/18 – ACA Insured | | | |
| 600 | | San Luis Civic Improvement Corporation, Arizona, Municipal Facilities Excise Tax Revenue | 7/15 at 100.00 | A+ | 617,622 |
| | | Bonds, Series 2005, 5.000%, 7/01/25 – SYNCORA GTY Insured | | | |
| 1,000 | | Scottsdale Municipal Property Corporation, Arizona, Excise Tax Revenue Bonds, Refunding Series | No Opt. Call | AAA | 1,178,670 |
| | | 2006, 5.000%, 7/01/24 | | | |
| 350 | | Tartesso West Community Facility District, Buckeye, Arizona, Limited Tax General Obligation | 7/17 at 100.00 | N/R | 297,780 |
| | | Bonds, Series 2007, 5.900%, 7/15/32 | | | |
| 500 | | Vistancia Community Facilities District, Arizona, Restricted General Obligation Bonds, Series | 7/15 at 100.00 | A1 | 529,535 |
| | | 2005, 5.750%, 7/15/24 | | | |
| 341 | | Watson Road Community Facilities District, Arizona, Special Assessment Revenue Bonds, Series | 7/16 at 100.00 | N/R | 281,802 |
| | | 2005, 6.000%, 7/01/30 | | | |
| 225 | | Westpark Community Facilities District, Buckeye, Arizona, General Obligation Tax Increment | 7/16 at 100.00 | N/R | 177,282 |
| | | Bonds Series 2006, 5.250%, 7/15/31 | | | |
| 10,292 | | Total Tax Obligation/Limited | | | 10,292,551 |
| | | U.S. Guaranteed – 7.0% (4.8% of Total Investments) (5) | | | |
| 240 | | Maricopa County Union High School District 210 Phoenix, Arizona, General Obligation Bonds, | 7/16 at 100.00 | AA (5) | 288,689 |
| | | Series 2006C, 5.000%, 7/01/24 (Pre-refunded 7/01/16) – MBIA Insured | | | |
| 140 | | Maricopa County, Arizona, Hospital Revenue Bonds, Sun Health Corporation, Series 2005, 5.000%, | 4/15 at 100.00 | N/R (5) | 163,496 |
| | | 4/01/16 (Pre-refunded 4/01/15) | | | |
| 1,000 | | Scottsdale Industrial Development Authority, Arizona, Hospital Revenue Bonds, Scottsdale | 12/11 at 101.00 | N/R (5) | 1,083,110 |
| | | Healthcare, Series 2001, 5.800%, 12/01/31 (Pre-refunded 12/01/11) | | | |
| 1,380 | | Total U.S. Guaranteed | | | 1,535,295 |
| | | Utilities – 31.1% (21.4% of Total Investments) | | | |
| 1,500 | | Arizona Power Authority, Special Obligation Power Resource Revenue Refunding Crossover Bonds, | No Opt. Call | AA | 1,789,245 |
| | | Hoover Project, Series 2001, 5.250%, 10/01/17 | | | |
| 1,000 | | Mesa, Arizona, Utility System Revenue Refunding Bonds, Series 2002, 5.250%, 7/01/17 – | No Opt. Call | Aa2 | 1,176,850 |
| | | FGIC Insured | | | |
| 665 | | Pima County Industrial Development Authority, Arizona, Revenue Bonds, Tucson Electric Power | 1/15 at 100.00 | BBB– | 680,401 |
| | | Company, Refunding Series 2008, 5.750%, 9/01/29 | | | |
Nuveen Investments 27
NFZ
Nuveen Arizona Dividend Advantage Municipal Fund (continued)
Portfolio of Investments July 31, 2010
| | | | | | |
| Principal | | | Optional Call | | |
| Amount (000) | | Description (1) | Provisions (2) | Ratings (3) | Value |
| | | Utilities (continued) | | | |
| $ 1,000 | | Puerto Rico Electric Power Authority, Power Revenue Bonds, Series 2005RR, 5.000%, 7/01/26 – | 7/15 at 100.00 | A3 | $ 1,013,220 |
| | | SYNCORA GTY Insured | | | |
| 200 | | Salt River Project Agricultural Improvement and Power District, Arizona, Electric System | 1/13 at 100.00 | Aa1 | 214,098 |
| | | Revenue Bonds, Series 2002B, 5.000%, 1/01/22 | | | |
| 560 | | Salt River Project Agricultural Improvement and Power District, Arizona, Electric System | 1/18 at 100.00 | Aa1 | 670,970 |
| | | Revenue Bonds, Tender Option Bond Trust 09-9W, 17.172%, 1/01/38 (IF) | | | |
| 235 | | Salt River Project Agricultural Improvement and Power District, Arizona, Electric System | 7/10 at 100.00 | Aa1 | 235,848 |
| | | Revenue Refunding Bonds, Series 1997A, 5.000%, 1/01/20 | | | |
| 1,000 | | Salt River Project Agricultural Improvement and Power District, Arizona, Electric System | 1/12 at 101.00 | Aa1 | 1,064,150 |
| | | Revenue Refunding Bonds, Series 2002A, 5.250%, 1/01/18 | | | |
| 6,160 | | Total Utilities | | | 6,844,782 |
| | | Water and Sewer – 13.8% (9.5% of Total Investments) | | | |
| 475 | | Goodyear, Arizona, Water and Sewer Revenue Obligations, Series 2010, 5.625%, 7/01/39 | 7/20 at 100.00 | A2 | 477,665 |
| 225 | | Oro Valley Municipal Property Corporation, Arizona, Senior Lien Water Revenue Bonds, Series | 7/13 at 100.00 | AA– | 232,828 |
| | | 2003, 5.000%, 7/01/23 – NPFG Insured | | | |
| 1,500 | | Phoenix Civic Improvement Corporation, Arizona, Junior Lien Water System Revenue Bonds, Series | 7/12 at 100.00 | AAA | 1,549,125 |
| | | 2002, 5.000%, 7/01/26 – FGIC Insured | | | |
| | | Surprise Municipal Property Corporation, Arizona, Wastewater System Revenue Bonds, Series 2007: | | | |
| 225 | | 4.700%, 4/01/22 | 4/14 at 100.00 | N/R | 226,644 |
| 260 | | 4.900%, 4/01/32 | 4/17 at 100.00 | N/R | 241,674 |
| 325 | | Yuma County Industrial Development Authority, Arizona, Exempt Revenue Bonds, Far West Water & | 12/17 at 100.00 | N/R | 302,187 |
| | | Sewer Inc. Refunding, Series 2007A, 6.375%, 12/01/37 (Alternative Minimum Tax) | | | |
| 3,010 | | Total Water and Sewer | | | 3,030,123 |
| $ 31,347 | | Total Investments (cost $31,425,432) – 145.5% | | | 31,980,266 |
| | | Other Assets Less Liabilities – 2.7% | | | 604,129 |
| | | Auction Rate Preferred Shares, at Liquidation Value – (48.2)% (6) | | | (10,600,000) |
| | | Net Assets Applicable to Common Shares – 100% | | | $ 21,984,395 |
| | |
| (1) | All percentages shown in the Portfolio of Investments are based on net assets applicable to Common shares unless otherwise noted. |
| (2) | Optional Call Provisions (not covered by the report of independent registered public accounting firm): Dates (month and year) and prices of the earliest |
| | optional call or redemption. There may be other call provisions at varying prices at later dates. Certain mortgage-backed securities may be subject to periodic |
| | principal paydowns. |
| (3) | Ratings (not covered by the report of independent registered public accounting firm): Using the highest of Standard & Poor’s Group (“Standard & Poor’s”), |
| | Moody’s Investor Service, Inc. (“Moody’s”) or Fitch, Inc. (“Fitch”) rating. Ratings below BBB by Standard & Poor’s, Baa by Moody’s or BBB by Fitch are |
| | considered to be below investment grade. |
| (4) | Investment valued at fair value using methods determined in good faith by, or at the discretion of, the Board of Trustees. For fair value measurement disclo- |
| | sure purposes, investment categorized as Level 3. See Notes to Financial Statements, Footnote 1 – General Information and Significant Accounting Policies, |
| | Investment Valuation for more information. |
| (5) | Backed by an escrow or trust containing sufficient U.S. Government or U.S. Government agency securities, which ensure the timely payment of principal |
| | and interest. Such investments are normally considered to be equivalent to AAA rated securities. |
| (6) | Auction Rate Preferred shares, at Liquidation Value as a percentage of Total Investments is 33.1%. |
| N/R | Not rated. |
| (IF) | Inverse floating rate investment. |
See accompanying notes to financial statements.
| | | | | | |
| | | Nuveen Arizona Dividend Advantage Municipal Fund 2 | |
| NKR | | Portfolio of Investments | | |
| | | | July 31, 2010 |
| Principal | | | Optional Call | | |
| Amount (000) | | Description (1) | Provisions (2) | Ratings (3) | Value |
| | | Education and Civic Organizations – 8.6% (6.0% of Total Investments) | | | |
| $ 1,130 | | Arizona Higher Education Loan Authority, Student Loan Revenue Bonds, Series 2007B, Auction | 9/10 at 100.00 | A | $ 929,131 |
| | | Rate Securities, 0.585%, 11/01/41 (Alternative Minimum Tax) (4) | | | |
| 775 | | Glendale Industrial Development Authority, Arizona, Revenue Bonds, Midwestern University, | 5/20 at 100.00 | A– | 778,790 |
| | | Series 2010, 5.125%, 5/15/40 | | | |
| 485 | | Pima County Industrial Development Authority, Arizona, Charter School Revenue Bonds, Noah | 12/14 at 100.00 | BBB– | 469,107 |
| | | Webster Basic Schools Inc., Series 2004, 6.000%, 12/15/24 | | | |
| 320 | | Puerto Rico Industrial, Tourist, Educational, Medical and Environmental Control Facilities | 8/10 at 100.50 | BBB– | 320,854 |
| | | Financing Authority, Higher Education Revenue Bonds, Ana G. Mendez University System, | | | |
| | | Series 1999, 5.375%, 2/01/19 | | | |
| 480 | | Tucson Industrial Development Authority, Arizona, Charter School Revenue Bonds, Arizona | 9/14 at 100.00 | BBB– | 453,754 |
| | | Agribusiness and Equine Center Charter School, Series 2004A, 6.125%, 9/01/34 | | | |
| | | University of Arizona, Certificates of Participation, Series 2002A: | | | |
| 65 | | 5.500%, 6/01/18 – AMBAC Insured | 6/12 at 100.00 | AA– | 69,566 |
| 40 | | 5.125%, 6/01/22 – AMBAC Insured | 6/12 at 100.00 | AA– | 41,860 |
| 3,295 | | Total Education and Civic Organizations | | | 3,063,062 |
| | | Health Care – 24.0% (16.9% of Total Investments) | | | |
| 845 | | Arizona Health Facilities Authority, Hospital Revenue Bonds, Banner Health Systems, Series | 1/17 at 100.00 | A+ | 860,751 |
| | | 2007A, 5.000%, 1/01/25 | | | |
| 520 | | Arizona Health Facilities Authority, Hospital Revenue Bonds, Banner Health Systems, Series | 1/17 at 100.00 | A+ | 337,168 |
| | | 2007B, 1.167%, 1/01/37 | | | |
| 1,150 | | Arizona Health Facilities Authority, Hospital Revenue Bonds, Banner Health Systems, Series | 1/18 at 100.00 | A+ | 1,177,359 |
| | | 2008D, 5.500%, 1/01/38 | | | |
| 600 | | Arizona Health Facilities Authority, Revenue Bonds, Blood Systems Inc., Series 2004, | 4/14 at 100.00 | A | 617,574 |
| | | 5.000%, 4/01/20 | | | |
| 400 | | Glendale Industrial Development Authority, Arizona, Revenue Bonds, John C. Lincoln Health | 12/15 at 100.00 | BBB | 367,104 |
| | | Network, Series 2005B, 5.000%, 12/01/37 | | | |
| 655 | | Glendale Industrial Development Authority, Arizona, Revenue Bonds, John C. Lincoln Health | 12/17 at 100.00 | BBB | 591,138 |
| | | Network, Series 2007, 5.000%, 12/01/42 | | | |
| 1,375 | | Maricopa County Industrial Development Authority, Arizona, Health Facility Revenue Bonds, | 7/14 at 100.00 | A | 1,424,486 |
| | | Catholic Healthcare West, Series 2004A, 5.375%, 7/01/23 | | | |
| 1,650 | | Maricopa County Industrial Development Authority, Arizona, Health Facility Revenue Bonds, | 7/17 at 100.00 | A | 1,675,740 |
| | | Catholic Healthcare West, Series 2007A, 5.250%, 7/01/32 | | | |
| 500 | | Maricopa County Industrial Development Authority, Arizona, Hospital Revenue Bonds, Mayo Clinic | 11/10 at 100.00 | Aa2 | 500,195 |
| | | Hospital, Series 1998, 5.250%, 11/15/37 | | | |
| 1,000 | | Yavapai County Industrial Development Authority, Arizona, Hospital Revenue Bonds, Yavapai | 8/13 at 100.00 | Baa2 | 1,009,820 |
| | | Regional Medical Center, Series 2003A, 6.000%, 8/01/33 | | | |
| 8,695 | | Total Health Care | | | 8,561,335 |
| | | Housing/Multifamily – 2.1% (1.5% of Total Investments) | | | |
| 705 | | Maricopa County Industrial Development Authority, Arizona, GNMA Collateralized Multifamily | 10/11 at 105.00 | AAA | 746,102 |
| | | Housing Revenue Refunding Bonds, Pine Ridge, Cambridge Court, Cove on 44th and Fountain | | | |
| | | Place Apartments, Series 2001A-1, 6.000%, 10/20/31 | | | |
| | | Housing/Single Family – 3.4% (2.4% of Total Investments) | | | |
| 1,185 | | Tucson and Pima County Industrial Development Authority, Arizona, Joint Single Family Mortgage | 6/17 at 101.00 | Aaa | 1,209,838 |
| | | Revenue Bonds, Series 2007B, 5.350%, 6/01/47 (Alternative Minimum Tax) | | | |
Nuveen Investments 29
NKR
Nuveen Arizona Dividend Advantage Municipal Fund 2 (continued)
Portfolio of Investments July 31, 2010
| | | | | | |
| Principal | | | Optional Call | | |
| Amount (000) | | Description (1) | Provisions (2) | Ratings (3) | Value |
| | | Tax Obligation/General – 19.6% (13.9% of Total Investments) | | | |
| $ 1,000 | | Maricopa County School District 6, Arizona, General Obligation Refunding Bonds, Washington | No Opt. Call | AAA | $ 1,186,890 |
| | | Elementary School, Series 2002A, 5.375%, 7/01/16 – AGM Insured | | | |
| 1,165 | | Maricopa County Unified School District 69, Paradise Valley, Arizona, General Obligation | No Opt. Call | Aa2 | 1,342,208 |
| | | Refunding Bonds, Series 2002A, 5.250%, 7/01/14 – FGIC Insured | | | |
| 1,405 | | Mesa, Arizona, General Obligation Bonds, Series 2002, 5.375%, 7/01/15 – FGIC Insured | No Opt. Call | AA | 1,639,073 |
| | | Phoenix, Arizona, Various Purpose General Obligation Bonds, Series 2002B: | | | |
| 1,700 | | 5.000%, 7/01/22 | 7/12 at 100.00 | AAA | 1,810,143 |
| 500 | | 5.000%, 7/01/27 | 7/12 at 100.00 | AAA | 513,745 |
| 510 | | Scottsdale, Arizona, General Obligation Bonds, Series 2002, 5.000%, 7/01/24 | 7/11 at 100.00 | AAA | 518,588 |
| 6,280 | | Total Tax Obligation/General | | | 7,010,647 |
| | | Tax Obligation/Limited – 44.6% (31.5% of Total Investments) | | | |
| | | Arizona State, Certificates of Participation, Series 2002A: | | | |
| 750 | | 5.000%, 11/01/17 – NPFG Insured | 5/12 at 100.00 | A+ | 776,430 |
| 1,000 | | 5.000%, 11/01/18 – NPFG Insured | 5/12 at 100.00 | A+ | 1,030,760 |
| 500 | | 5.000%, 11/01/20 – NPFG Insured | 5/12 at 100.00 | A+ | 511,675 |
| 124 | | Centerra Community Facilities District, Goodyear, Arizona, General Obligation Bonds, Series | 7/15 at 100.00 | N/R | 101,933 |
| | | 2005, 5.500%, 7/15/29 | | | |
| 340 | | Estrella Mountain Ranch Community Facilities District, Arizona, Special Assessment Bonds, | 1/17 at 100.00 | N/R | 251,529 |
| | | Montecito Assessment District, Series 2007, 5.800%, 7/01/32 | | | |
| 218 | | Estrella Mountain Ranch Community Facilities District, Goodyear, Arizona, Special Assessment | 7/12 at 100.00 | N/R | 222,534 |
| | | Lien Bonds, Series 2001A, 7.875%, 7/01/25 | | | |
| 884 | | Marana, Arizona, Tangerine Farms Road Improvement District Revenue Bonds, Series 2006, | 7/16 at 100.00 | A2 | 843,522 |
| | | 4.600%, 1/01/26 | | | |
| | | Maricopa County Stadium District, Arizona, Revenue Refunding Bonds, Series 2002: | | | |
| 840 | | 5.375%, 6/01/18 – AMBAC Insured | 6/12 at 100.00 | N/R | 888,384 |
| 2,645 | | 5.375%, 6/01/19 – AMBAC Insured | 6/12 at 100.00 | N/R | 2,797,352 |
| 240 | | Marley Park Community Facilities District, City of Surprise, Arizona, Limited Tax General | 7/17 at 100.00 | N/R | 209,417 |
| | | Obligation Bonds, Series 2007, 6.100%, 7/15/32 | | | |
| 415 | | Merrill Ranch Community Facilities District 1, Florence, Arizona, General Obligation Bonds, | 7/18 at 100.00 | N/R | 417,104 |
| | | Series 2008A, 7.400%, 7/15/33 | | | |
| 530 | | Palm Valley Community Facility District 3, Goodyear, Arizona, General Obligation Bonds, Series | 7/16 at 100.00 | N/R | 420,433 |
| | | 2006, 5.300%, 7/15/31 | | | |
| 350 | | Palm Valley Community Facility District 3, Goodyear, Arizona, Limited Tax General Obligation | 7/17 at 100.00 | N/R | 293,969 |
| | | Bonds, Series 2007, 5.800%, 7/15/32 | | | |
| 140 | | Parkway Community Facilities District 1, Prescott Valley, Arizona, General Obligation Bonds, | 7/16 at 100.00 | N/R | 111,807 |
| | | Series 2006, 5.350%, 7/15/31 | | | |
| 1,500 | | Phoenix Industrial Development Authority, Arizona, Government Bonds, Capitol Mall LLC II, | 3/12 at 100.00 | A1 | 1,581,690 |
| | | Series 2001, 5.250%, 9/15/16 – AMBAC Insured | | | |
| 1,070 | | Pinal County Industrial Development Authority, Arizona, Correctional Facilities Contract | No Opt. Call | BBB– | 1,046,781 |
| | | Revenue Bonds, Florence West Prison LLC, Series 2002A, 5.000%, 10/01/18 – ACA Insured | | | |
| 270 | | Puerto Rico Public Buildings Authority, Guaranteed Government Facilities Revenue Refunding | 7/12 at 100.00 | A3 | 270,794 |
| | | Bonds, Series 2002D, 5.125%, 7/01/24 | | | |
| 960 | | San Luis Civic Improvement Corporation, Arizona, Municipal Facilities Excise Tax Revenue | 7/15 at 100.00 | A+ | 988,195 |
| | | Bonds, Series 2005, 5.000%, 7/01/25 – SYNCORA GTY Insured | | | |
| 1,000 | | Scottsdale Municipal Property Corporation, Arizona, Excise Tax Revenue Bonds, Refunding Series | No Opt. Call | AAA | 1,178,670 |
| | | 2006, 5.000%, 7/01/24 | | | |
| 555 | | Tartesso West Community Facility District, Buckeye, Arizona, Limited Tax General Obligation | 7/17 at 100.00 | N/R | 472,194 |
| | | Bonds, Series 2007, 5.900%, 7/15/32 | | | |
| 750 | | Vistancia Community Facilities District, Arizona, Restricted General Obligation Bonds, Series | 7/15 at 100.00 | A1 | 794,303 |
| | | 2005, 5.750%, 7/15/24 | | | |
| | | | | | |
| Principal | | | Optional Call | | |
| Amount (000) | | Description (1) | Provisions (2) | Ratings (3) | Value |
| | | Tax Obligation/Limited (continued) | | | |
| $ 538 | | Watson Road Community Facilities District, Arizona, Special Assessment Revenue Bonds, Series | 7/16 at 100.00 | N/R | $ 444,603 |
| | | 2005, 6.000%, 7/01/30 | | | |
| 350 | | Westpark Community Facilities District, Buckeye, Arizona, General Obligation Tax Increment | 7/16 at 100.00 | N/R | 275,772 |
| | | Bonds Series 2006, 5.250%, 7/15/31 | | | |
| 15,969 | | Total Tax Obligation/Limited | | | 15,929,851 |
| | | Transportation – 4.1% (2.9% of Total Investments) | | | |
| 470 | | Phoenix Civic Improvement Corporation, Arizona, Senior Lien Airport Revenue Bonds, Series | 1/11 at 100.00 | AAA | 471,415 |
| | | 1998A, 5.000%, 7/01/25 – AGM Insured | | | |
| 1,000 | | Phoenix, Arizona, Civic Improvement Corporation, Senior Lien Airport Revenue Bonds, Series | 7/12 at 100.00 | AA– | 1,008,120 |
| | | 2002B, 5.250%, 7/01/27 – FGIC Insured (Alternative Minimum Tax) | | | |
| 1,470 | | Total Transportation | | | 1,479,535 |
| | | U.S. Guaranteed – 17.0% (12.0% of Total Investments) (5) | | | |
| 735 | | Arizona Health Facilities Authority, Hospital System Revenue Bonds, Phoenix Children’s | 2/12 at 101.00 | N/R (5) | 809,529 |
| | | Hospital, Series 2002A, 6.250%, 2/15/21 (Pre-refunded 2/15/12) | | | |
| 715 | | Arizona State University, System Revenue Bonds, Series 2002, 5.750%, 7/01/27 (Pre-refunded | 7/12 at 100.00 | AAA | 789,160 |
| | | 7/01/12) – FGIC Insured | | | |
| 100 | | Maricopa County Unified School District 89, Dysart, Arizona, General Obligation Bonds, Series | 7/14 at 100.00 | AAA | 117,369 |
| | | 2004B, 5.250%, 7/01/20 (Pre-refunded 7/01/14) – AGM Insured | | | |
| 375 | | Maricopa County Union High School District 210 Phoenix, Arizona, General Obligation Bonds, | 7/16 at 100.00 | AA (5) | 451,076 |
| | | Series 2006C, 5.000%, 7/01/24 (Pre-refunded 7/01/16) – MBIA Insured | | | |
| 225 | | Maricopa County, Arizona, Hospital Revenue Bonds, Sun Health Corporation, Series 2005, 5.000%, | 4/15 at 100.00 | N/R (5) | 262,762 |
| | | 4/01/16 (Pre-refunded 4/01/15) | | | |
| 730 | | Puerto Rico Public Buildings Authority, Guaranteed Government Facilities Revenue Refunding | 7/12 at 100.00 | Baa3 (5) | 792,722 |
| | | Bonds, Series 2002D, 5.125%, 7/01/24 (Pre-refunded 7/01/12) | | | |
| 1,000 | | Scottsdale Industrial Development Authority, Arizona, Hospital Revenue Bonds, Scottsdale | 12/11 at 101.00 | N/R (5) | 1,083,110 |
| | | Healthcare, Series 2001, 5.800%, 12/01/31 (Pre-refunded 12/01/11) | | | |
| 490 | | Scottsdale, Arizona, General Obligation Bonds, Series 2002, 5.000%, 7/01/24 | 7/11 at 100.00 | AAA | 511,663 |
| | | (Pre-refunded 7/01/11) | | | |
| | | University of Arizona, Certificates of Participation, Series 2002A: | | | |
| 685 | | 5.500%, 6/01/18 (Pre-refunded 6/01/12) – AMBAC Insured | 6/12 at 100.00 | AA– (5) | 747,678 |
| 460 | | 5.125%, 6/01/22 (Pre-refunded 6/01/12) – AMBAC Insured | 6/12 at 100.00 | Aa3 (5) | 498,939 |
| 5,515 | | Total U.S. Guaranteed | | | 6,064,008 |
| | | Utilities – 5.9% (4.2% of Total Investments) | | | |
| 665 | | Pima County Industrial Development Authority, Arizona, Revenue Bonds, Tucson Electric Power | 1/15 at 100.00 | BBB– | 680,401 |
| | | Company, Refunding Series 2008, 5.750%, 9/01/29 | | | |
| 450 | | Salt River Project Agricultural Improvement and Power District, Arizona, Electric System | 1/18 at 100.00 | Aa1 | 539,172 |
| | | Revenue Bonds, Tender Option Bond Trust 09-9W, 17.172%, 1/01/38 (IF) | | | |
| 1,000 | | Salt Verde Financial Corporation, Arizona, Senior Gas Revenue Bonds, Citigroup Energy Inc | No Opt. Call | A | 891,520 |
| | | Prepay Contract Obligations, Series 2007, 5.000%, 12/01/37 | | | |
| 2,115 | | Total Utilities | | | 2,111,093 |
| | | Water and Sewer – 12.3% (8.7% of Total Investments) | | | |
| 500 | | Maricopa County Industrial Development Authority, Arizona, Water System Improvement Revenue | 12/10 at 100.00 | N/R | 500,050 |
| | | Bonds, Chaparral City Water Company, Series 1997A, 5.400%, 12/01/22 – AMBAC Insured | | | |
| | | (Alternative Minimum Tax) | | | |
| 360 | | Oro Valley Municipal Property Corporation, Arizona, Senior Lien Water Revenue Bonds, Series | 7/13 at 100.00 | AA– | 372,524 |
| | | 2003, 5.000%, 7/01/23 – NPFG Insured | | | |
| 1,000 | | Phoenix Civic Improvement Corporation, Arizona, Junior Lien Water System Revenue Refunding | No Opt. Call | AAA | 1,221,410 |
| | | Bonds, Series 2001, 5.500%, 7/01/22 – FGIC Insured | | | |
Nuveen Investments 31
NKR
Nuveen Arizona Dividend Advantage Municipal Fund 2 (continued)
Portfolio of Investments July 31, 2010
| | | | | | | |
| Principal | | | Optional Call | | | |
| Amount (000) | | Description (1) | Provisions (2) | Ratings (3) | Value | |
| | | Water and Sewer (continued) | | | | |
| | | Surprise Municipal Property Corporation, Arizona, Wastewater System Revenue Bonds, Series 2007: | | | | |
| $ 350 | | 4.700%, 4/01/22 | 4/14 at 100.00 | N/R | $ 352,559 | |
| 410 | | 4.900%, 4/01/32 | 4/17 at 100.00 | N/R | 381,102 | |
| 1,000 | | Tucson, Arizona, Water System Revenue Refunding Bonds, Series 2002, 5.500%, 7/01/18 – | 7/12 at 102.00 | Aa2 | 1,097,039 | |
| | | FGIC Insured | | | | |
| 525 | | Yuma County Industrial Development Authority, Arizona, Exempt Revenue Bonds, Far West Water & | 12/17 at 100.00 | N/R | 488,149 | |
| | | Sewer Inc. Refunding, Series 2007A, 6.375%, 12/01/37 (Alternative Minimum Tax) | | | | |
| 4,145 | | Total Water and Sewer | | | 4,412,833 | |
| $ 49,374 | | Total Investments (cost $49,228,018) – 141.6% | | | 50,588,304 | |
| | | Other Assets Less Liabilities – 4.9% | | | 1,769,958 | |
| | | Auction Rate Preferred Shares, at Liquidation Value – (46.5)% (6) | | | (16,625,000 | ) |
| | | Net Assets Applicable to Common Shares – 100% | | | $ 35,733,262 | |
| | |
| (1) | All percentages shown in the Portfolio of Investments are based on net assets applicable to Common shares unless otherwise noted. |
| (2) | Optional Call Provisions (not covered by the report of independent registered public accounting firm): Dates (month and year) and prices of the earliest |
| | optional call or redemption. There may be other call provisions at varying prices at later dates. Certain mortgage-backed securities may be subject to periodic |
| | principal paydowns. |
| (3) | Ratings (not covered by the report of independent registered public accounting firm): Using the highest of Standard & Poor’s Group (“Standard & Poor’s”), |
| | Moody’s Investor Service, Inc. (“Moody’s”) or Fitch, Inc. (“Fitch”) rating. Ratings below BBB by Standard & Poor’s, Baa by Moody’s or BBB by Fitch are |
| | considered to be below investment grade. |
| (4) | Investment valued at fair value using methods determined in good faith by, or at the discretion of, the Board of Trustees. For fair value measurement disclo- |
| | sure purposes, investment categorized as Level 3. See Notes to Financial Statements, Footnote 1 – General Information and Significant Accounting Policies, |
| | Investment Valuation for more information. |
| (5) | Backed by an escrow or trust containing sufficient U.S. Government or U.S. Government agency securities, which ensure the timely payment of principal |
| | and interest. Such investments are normally considered to be equivalent to AAA rated securities. |
| (6) | Auction Rate Preferred shares, at Liquidation Value as a percentage of Total Investments is 32.9%. |
| N/R | Not rated. |
| (IF) | Inverse floating rate investment. |
See accompanying notes to financial statements.
| | | | | | |
| | | Nuveen Arizona Dividend Advantage Municipal Fund 3 | |
| NXE | | Portfolio of Investments | | |
| | | | July 31, 2010 |
| Principal | | | Optional Call | | |
| Amount (000) | | Description (1) | Provisions (2) | Ratings (3) | Value |
| | | Consumer Staples – 1.1% (0.8% of Total Investments) | | | |
| $ 485 | | Puerto Rico, The Children’s Trust Fund, Tobacco Settlement Asset-Backed Refunding Bonds, | 5/12 at 100.00 | BBB | $ 463,199 |
| | | Series 2002, 5.375%, 5/15/33 | | | |
| | | Education and Civic Organizations – 16.6% (11.9% of Total Investments) | | | |
| 690 | | Arizona Higher Education Loan Authority, Student Loan Revenue Bonds, Series 2007B, Auction | 9/10 at 100.00 | A | 567,346 |
| | | Rate Securities, 0.585%, 11/01/41 (Alternative Minimum Tax) (4) | | | |
| 1,250 | | Arizona State University, System Revenue Bonds, Series 2005, 5.000%, 7/01/20 – AMBAC Insured | 7/15 at 100.00 | Aa3 | 1,312,400 |
| 1,130 | | Energy Management Services LLC, Arizona State University, Energy Conservation Revenue Bonds, | 7/12 at 100.00 | AA | 1,209,089 |
| | | Main Campus Project, Series 2002, 5.250%, 7/01/18 – NPFG Insured | | | |
| 900 | | Glendale Industrial Development Authority, Arizona, Revenue Bonds, Midwestern University, | 5/20 at 100.00 | A– | 904,401 |
| | | Series 2010, 5.125%, 5/15/40 | | | |
| 560 | | Pima County Industrial Development Authority, Arizona, Charter School Revenue Bonds, Noah | 12/14 at 100.00 | BBB– | 541,649 |
| | | Webster Basic Schools Inc., Series 2004, 6.000%, 12/15/24 | | | |
| 565 | | Tucson Industrial Development Authority, Arizona, Charter School Revenue Bonds, Arizona | 9/14 at 100.00 | BBB– | 534,106 |
| | | Agribusiness and Equine Center Charter School, Series 2004A, 6.125%, 9/01/34 | | | |
| 2,000 | | University of Arizona, Certificates of Participation, Series 2002B, 5.125%, 6/01/20 – | 6/12 at 100.00 | AA– | 2,126,980 |
| | | AMBAC Insured | | | |
| 7,095 | | Total Education and Civic Organizations | | | 7,195,971 |
| | | Health Care – 29.1% (20.9% of Total Investments) | | | |
| 1,015 | | Arizona Health Facilities Authority, Hospital Revenue Bonds, Banner Health Systems, Series | 1/17 at 100.00 | A+ | 1,033,920 |
| | | 2007A, 5.000%, 1/01/25 | | | |
| 620 | | Arizona Health Facilities Authority, Hospital Revenue Bonds, Banner Health Systems, Series | 1/17 at 100.00 | A+ | 402,008 |
| | | 2007B, 1.167%, 1/01/37 | | | |
| 2,390 | | Arizona Health Facilities Authority, Hospital Revenue Bonds, Banner Health Systems, Series | 1/18 at 100.00 | A+ | 2,446,858 |
| | | 2008D, 5.500%, 1/01/38 | | | |
| 625 | | Arizona Health Facilities Authority, Revenue Bonds, Blood Systems Inc., Series 2004, | 4/14 at 100.00 | A | 643,306 |
| | | 5.000%, 4/01/20 | | | |
| 475 | | Glendale Industrial Development Authority, Arizona, Revenue Bonds, John C. Lincoln Health | 12/15 at 100.00 | BBB | 435,936 |
| | | Network, Series 2005B, 5.000%, 12/01/37 | | | |
| 785 | | Glendale Industrial Development Authority, Arizona, Revenue Bonds, John C. Lincoln Health | 12/17 at 100.00 | BBB | 708,463 |
| | | Network, Series 2007, 5.000%, 12/01/42 | | | |
| 1,825 | | Maricopa County Industrial Development Authority, Arizona, Health Facility Revenue Bonds, | 7/14 at 100.00 | A | 1,890,682 |
| | | Catholic Healthcare West, Series 2004A, 5.375%, 7/01/23 | | | |
| 1,985 | | Maricopa County Industrial Development Authority, Arizona, Health Facility Revenue Bonds, | 7/17 at 100.00 | A | 2,015,966 |
| | | Catholic Healthcare West, Series 2007A, 5.250%, 7/01/32 | | | |
| 2,000 | | Maricopa County Industrial Development Authority, Arizona, Hospital Revenue Bonds, Mayo Clinic | 11/10 at 100.00 | Aa2 | 2,000,780 |
| | | Hospital, Series 1998, 5.250%, 11/15/37 | | | |
| 1,000 | | Yavapai County Industrial Development Authority, Arizona, Hospital Revenue Bonds, Yavapai | 8/13 at 100.00 | Baa2 | 1,009,820 |
| | | Regional Medical Center, Series 2003A, 6.000%, 8/01/33 | | | |
| 12,720 | | Total Health Care | | | 12,587,739 |
| | | Housing/Single Family – 3.3% (2.4% of Total Investments) | | | |
| 1,420 | | Tucson and Pima County Industrial Development Authority, Arizona, Joint Single Family Mortgage | 6/17 at 101.00 | Aaa | 1,449,763 |
| | | Revenue Bonds, Series 2007B, 5.350%, 6/01/47 (Alternative Minimum Tax) | | | |
Nuveen Investments 33
NXE
Nuveen Arizona Dividend Advantage Municipal Fund 3 (continued)
Portfolio of Investments July 31, 2010
| | | | | | |
| Principal | | | Optional Call | | |
| Amount (000) | | Description (1) | Provisions (2) | Ratings (3) | Value |
| | | Tax Obligation/General – 2.5% (1.8% of Total Investments) | | | |
| $ 1,000 | | Pinal County Unified School District 1, Florence, Arizona, General Obligation Bonds, Series | 7/18 at 100.00 | A | $ 1,065,580 |
| | | 2008C, 5.250%, 7/01/28 | | | |
| | | Tax Obligation/Limited – 31.6% (22.7% of Total Investments) | | | |
| 142 | | Centerra Community Facilities District, Goodyear, Arizona, General Obligation Bonds, Series | 7/15 at 100.00 | N/R | 116,730 |
| | | 2005, 5.500%, 7/15/29 | | | |
| 2,250 | | DC Ranch Community Facilities District, Scottsdale, Arizona, General Obligation Bonds, Series | 7/13 at 100.00 | A1 | 2,224,620 |
| | | 2002, 5.000%, 7/15/27 – AMBAC Insured | | | |
| | | Estrella Mountain Ranch Community Facilities District, Arizona, Special Assessment Bonds, | | | |
| | | Montecito Assessment District, Series 2007: | | | |
| 250 | | 5.700%, 7/01/27 | 1/17 at 100.00 | N/R | 193,898 |
| 155 | | 5.800%, 7/01/32 | 1/17 at 100.00 | N/R | 114,667 |
| 257 | | Estrella Mountain Ranch Community Facilities District, Goodyear, Arizona, Special Assessment | 7/12 at 100.00 | N/R | 262,346 |
| | | Lien Bonds, Series 2001A, 7.875%, 7/01/25 | | | |
| 525 | | Greater Arizona Development Authority, Infrastructure Revenue Bonds, Series 2006A, 5.000%, | 8/16 at 100.00 | AA– | 557,750 |
| | | 8/01/23 – NPFG Insured | | | |
| 1,033 | | Marana, Arizona, Tangerine Farms Road Improvement District Revenue Bonds, Series 2006, | 7/16 at 100.00 | A2 | 985,699 |
| | | 4.600%, 1/01/26 | | | |
| 290 | | Marley Park Community Facilities District, City of Surprise, Arizona, Limited Tax General | 7/17 at 100.00 | N/R | 253,045 |
| | | Obligation Bonds, Series 2007, 6.100%, 7/15/32 | | | |
| 490 | | Merrill Ranch Community Facilities District 1, Florence, Arizona, General Obligation Bonds, | 7/18 at 100.00 | N/R | 492,484 |
| | | Series 2008A, 7.400%, 7/15/33 | | | |
| 2,175 | | Mohave County, Arizona, Certificates of Participation, Series 2004, 5.250%, 7/01/19 – | 7/14 at 100.00 | N/R | 2,334,645 |
| | | AMBAC Insured | | | |
| 640 | | Palm Valley Community Facility District 3, Goodyear, Arizona, General Obligation Bonds, Series | 7/16 at 100.00 | N/R | 507,693 |
| | | 2006, 5.300%, 7/15/31 | | | |
| 425 | | Palm Valley Community Facility District 3, Goodyear, Arizona, Limited Tax General Obligation | 7/17 at 100.00 | N/R | 356,962 |
| | | Bonds, Series 2007, 5.800%, 7/15/32 | | | |
| 160 | | Parkway Community Facilities District 1, Prescott Valley, Arizona, General Obligation Bonds, | 7/16 at 100.00 | N/R | 127,779 |
| | | Series 2006, 5.350%, 7/15/31 | | | |
| 1,250 | | Pinal County Industrial Development Authority, Arizona, Correctional Facilities Contract | No Opt. Call | BBB– | 1,222,875 |
| | | Revenue Bonds, Florence West Prison LLC, Series 2002A, 5.000%, 10/01/18 – ACA Insured | | | |
| 1,130 | | San Luis Civic Improvement Corporation, Arizona, Municipal Facilities Excise Tax Revenue | 7/15 at 100.00 | A+ | 1,163,188 |
| | | Bonds, Series 2005, 5.000%, 7/01/25 – SYNCORA GTY Insured | | | |
| 665 | | Tartesso West Community Facility District, Buckeye, Arizona, Limited Tax General Obligation | 7/17 at 100.00 | N/R | 565,782 |
| | | Bonds, Series 2007, 5.900%, 7/15/32 | | | |
| 1,250 | | Vistancia Community Facilities District, Arizona, Restricted General Obligation Bonds, Series | 7/15 at 100.00 | A1 | 1,323,838 |
| | | 2005, 5.750%, 7/15/24 | | | |
| 639 | | Watson Road Community Facilities District, Arizona, Special Assessment Revenue Bonds, Series | 7/16 at 100.00 | N/R | 528,070 |
| | | 2005, 6.000%, 7/01/30 | | | |
| 425 | | Westpark Community Facilities District, Buckeye, Arizona, General Obligation Tax Increment | 7/16 at 100.00 | N/R | 334,866 |
| | | Bonds Series 2006, 5.250%, 7/15/31 | | | |
| 14,151 | | Total Tax Obligation/Limited | | | 13,666,937 |
| | | | | | |
| Principal | | | Optional Call | | |
| Amount (000) | | Description (1) | Provisions (2) | Ratings (3) | Value |
| | | Transportation – 13.5% (9.7% of Total Investments) | | | |
| | | Phoenix, Arizona, Civic Improvement Corporation, Senior Lien Airport Revenue Bonds, | | | |
| | | Series 2002B: | | | |
| $ 1,000 | | 5.750%, 7/01/16 – FGIC Insured (Alternative Minimum Tax) | 7/12 at 100.00 | AA– | $ 1,050,610 |
| 2,300 | | 5.250%, 7/01/21 – FGIC Insured (Alternative Minimum Tax) | 7/12 at 100.00 | AA– | 2,347,633 |
| 2,450 | | Tucson Airport Authority Inc., Arizona, Revenue Refunding Bonds, Series 2001B, 5.000%, | 6/11 at 100.00 | A1 | 2,464,088 |
| | | 6/01/20 – AMBAC Insured (Alternative Minimum Tax) | | | |
| 5,750 | | Total Transportation | | | 5,862,331 |
| | | U.S. Guaranteed – 14.3% (10.2% of Total Investments) (5) | | | |
| 600 | | Arizona Health Facilities Authority, Hospital System Revenue Bonds, John C. Lincoln Health | 12/10 at 102.00 | BBB (5) | 624,654 |
| | | Network, Series 2000, 6.875%, 12/01/20 (Pre-refunded 12/01/10) | | | |
| 1,575 | | Maricopa County Union High School District 210, Phoenix, Arizona, General Obligation Bonds, | 7/14 at 100.00 | AAA | 1,833,379 |
| | | Series 2004A, 5.000%, 7/01/20 (Pre-refunded 7/01/14) – AGM Insured | | | |
| 270 | | Maricopa County, Arizona, Hospital Revenue Bonds, Sun Health Corporation, Series 2005, 5.000%, | 4/15 at 100.00 | N/R (5) | 315,314 |
| | | 4/01/16 (Pre-refunded 4/01/15) | | | |
| 250 | | Scottsdale Industrial Development Authority, Arizona, Hospital Revenue Bonds, Scottsdale | 12/11 at 101.00 | N/R (5) | 270,778 |
| | | Healthcare, Series 2001, 5.800%, 12/01/31 (Pre-refunded 12/01/11) | | | |
| 2,770 | | Tempe, Arizona, Excise Tax Revenue Refunding Bonds, Series 2003, 5.000%, 7/01/22 | 7/13 at 100.00 | AAA | 3,126,915 |
| | | (Pre-refunded 7/01/13) | | | |
| 5,465 | | Total U.S. Guaranteed | | | 6,171,040 |
| | | Utilities – 13.4% (9.6% of Total Investments) | | | |
| 1,250 | | Maricopa County Pollution Control Corporation, Arizona, Revenue Bonds, Arizona Public Service | 11/12 at 100.00 | Baa2 | 1,190,213 |
| | | Company – Palo Verde Project, Series 2002A, 5.050%, 5/01/29 – AMBAC Insured | | | |
| 665 | | Pima County Industrial Development Authority, Arizona, Revenue Bonds, Tucson Electric Power | 1/15 at 100.00 | BBB– | 680,401 |
| | | Company, Refunding Series 2008, 5.750%, 9/01/29 | | | |
| 1,660 | | Puerto Rico Electric Power Authority, Power Revenue Bonds, Series 2005RR, 5.000%, 7/01/26 – | 7/15 at 100.00 | A3 | 1,681,945 |
| | | SYNCORA GTY Insured | | | |
| 270 | | Salt River Project Agricultural Improvement and Power District, Arizona, Electric System | 1/13 at 100.00 | Aa1 | 289,032 |
| | | Revenue Bonds, Series 2002B, 5.000%, 1/01/22 | | | |
| 775 | | Salt River Project Agricultural Improvement and Power District, Arizona, Electric System | 1/18 at 100.00 | Aa1 | 928,574 |
| | | Revenue Bonds, Tender Option Bond Trust 09-9W, 17.172%, 1/01/38 (IF) | | | |
| 1,165 | | Salt Verde Financial Corporation, Arizona, Senior Gas Revenue Bonds, Citigroup Energy Inc | No Opt. Call | A | 1,038,621 |
| | | Prepay Contract Obligations, Series 2007, 5.000%, 12/01/37 | | | |
| 5,785 | | Total Utilities | | | 5,808,786 |
| | | Water and Sewer – 13.9% (10.0% of Total Investments) | | | |
| 955 | | Goodyear, Arizona, Water and Sewer Revenue Obligations, Series 2010, 5.625%, 7/01/39 | 7/20 at 100.00 | A2 | 960,358 |
| 405 | | Oro Valley Municipal Property Corporation, Arizona, Senior Lien Water Revenue Bonds, Series | 7/13 at 100.00 | AA– | 419,090 |
| | | 2003, 5.000%, 7/01/23 – NPFG Insured | | | |
| 1,000 | | Phoenix Civic Improvement Corporation, Arizona, Junior Lien Wastewater System Revenue | 7/11 at 100.00 | AA+ | 1,034,379 |
| | | Refunding Bonds, Series 2001, 5.125%, 7/01/21 – FGIC Insured | | | |
Nuveen Investments 35
NXE
Nuveen Arizona Dividend Advantage Municipal Fund 3 (continued)
Portfolio of Investments July 31, 2010
| | | | | | | |
| Principal | | | Optional Call | | | |
| Amount (000) | | Description (1) | Provisions (2) | Ratings (3) | Value | |
| | | Water and Sewer (continued) | | | | |
| $ 2,000 | | Phoenix Civic Improvement Corporation, Arizona, Junior Lien Water System Revenue Bonds, Series | 7/12 at 100.00 | AAA | $ 2,134,299 | |
| | | 2002, 5.000%, 7/01/18 – FGIC Insured | | | | |
| | | Surprise Municipal Property Corporation, Arizona, Wastewater System Revenue Bonds, Series 2007: | | | | |
| 425 | | 4.700%, 4/01/22 | 4/14 at 100.00 | N/R | 428,106 | |
| 490 | | 4.900%, 4/01/32 | 4/17 at 100.00 | N/R | 455,464 | |
| 615 | | Yuma County Industrial Development Authority, Arizona, Exempt Revenue Bonds, Far West Water & | 12/17 at 100.00 | N/R | 571,832 | |
| | | Sewer Inc. Refunding, Series 2007A, 6.375%, 12/01/37 (Alternative Minimum Tax) | | | | |
| 5,890 | | Total Water and Sewer | | | 6,003,528 | |
| $ 59,761 | | Total Investments (cost $59,477,262) – 139.3% | | | 60,274,874 | |
| | | Other Assets Less Liabilities – 3.2% | | | 1,405,358 | |
| | | Auction Rate Preferred Shares, at Liquidation Value – (42.5)% (6) | | | (18,400,000 | ) |
| | | Net Assets Applicable to Common Shares – 100% | | | $ 43,280,232 | |
| | |
| (1) | All percentages shown in the Portfolio of Investments are based on net assets applicable to Common shares unless otherwise noted. |
| (2) | Optional Call Provisions (not covered by the report of independent registered public accounting firm): Dates (month and year) and prices of the earliest |
| | optional call or redemption. There may be other call provisions at varying prices at later dates. Certain mortgage-backed securities may be subject to periodic |
| | principal paydowns. |
| (3) | Ratings (not covered by the report of independent registered public accounting firm): Using the highest of Standard & Poor’s Group (“Standard & Poor’s”), |
| | Moody’s Investor Service, Inc. (“Moody’s”) or Fitch, Inc. (“Fitch”) rating. Ratings below BBB by Standard & Poor’s, Baa by Moody’s or BBB by Fitch are |
| | considered to be below investment grade. |
| (4) | Investment valued at fair value using methods determined in good faith by, or at the discretion of, the Board of Trustees. For fair value measurement disclo- |
| | sure purposes, investment categorized as Level 3. See Notes to Financial Statements, Footnote 1 – General Information and Significant Accounting Policies, |
| | Investment Valuation for more information. |
| (5) | Backed by an escrow or trust containing sufficient U.S. Government or U.S. Government agency securities, which ensure the timely payment of principal |
| | and interest. Such investments are normally considered to be equivalent to AAA rated securities. |
| (6) | Auction Rate Preferred shares, at Liquidation Value as a percentage of Total Investments is 30.5%. |
| N/R | Not rated. |
| (IF) | Inverse floating rate investment. |
See accompanying notes to financial statements.
| | | | | | |
| | | Nuveen Texas Quality Income Municipal Fund | | |
| NTX | | Portfolio of Investments | | |
| | | | July 31, 2010 |
| Principal | | | Optional Call | | |
| Amount (000) | | Description (1) | Provisions (2) | Ratings (3) | Value |
| | | Consumer Staples – 1.5% (1.0% of Total Investments) | | | |
| $ 2,280 | | Puerto Rico, The Children’s Trust Fund, Tobacco Settlement Asset-Backed Refunding Bonds, | 5/12 at 100.00 | BBB | $ 2,177,514 |
| | | Series 2002, 5.375%, 5/15/33 | | | |
| | | Education and Civic Organizations – 15.9% (10.9% of Total Investments) | | | |
| 2,000 | | Laredo Community College District, Wells County, Texas, Combined Fee Revenue Bonds, Series | 8/20 at 100.00 | AAA | 2,081,320 |
| | | 2010, 5.250%, 8/01/35 – AGM Insured | | | |
| | | Red River Education Finance Corporation, Texas, Revenue Bonds, Hockaday School, Series 2005: | | | |
| 1,170 | | 5.000%, 5/15/27 | 5/15 at 100.00 | AA | 1,217,385 |
| 1,230 | | 5.000%, 5/15/28 | 5/15 at 100.00 | AA | 1,274,391 |
| 1,290 | | 5.000%, 5/15/29 | 5/15 at 100.00 | AA | 1,332,596 |
| | | Texas Public Finance Authority, Revenue Bonds, Texas Southern University Financing System, | | | |
| | | Series 2003: | | | |
| 1,710 | | 5.000%, 5/01/18 – FGIC Insured | 5/13 at 100.00 | Ba1 | 1,635,683 |
| 1,795 | | 5.000%, 5/01/19 – FGIC Insured | 5/13 at 100.00 | Ba1 | 1,696,185 |
| 1,885 | | 5.000%, 5/01/20 – FGIC Insured | 5/13 at 100.00 | Ba1 | 1,764,360 |
| 1,665 | | Texas State University System, Financing Revenue Bonds, Series 2004, 5.000%, 3/15/24 – | 9/14 at 100.00 | AAA | 1,772,010 |
| | | AGM Insured | | | |
| 2,000 | | Texas State University System, Financing Revenue Refunding Bonds, Series 2002, 5.000%, | 3/12 at 100.00 | AAA | 2,117,240 |
| | | 3/15/20 – AGM Insured | | | |
| 2,330 | | Universal City Education Facilities Corporation, Texas, Revenue Bonds, Wayland Baptist | 3/11 at 102.00 | A– | 2,378,394 |
| | | University Project, Series 2001, 5.625%, 3/01/26 | | | |
| 5,000 | | University of North Texas, Financing System Revenue Bonds, Series 2001, 5.000%, 4/15/24 – | 4/12 at 100.00 | AAA | 5,399,400 |
| | | AGM Insured | | | |
| 22,075 | | Total Education and Civic Organizations | | | 22,668,964 |
| | | Energy – 2.0% (1.4% of Total Investments) | | | |
| 3,000 | | Gulf Coast Waste Disposal Authority, Texas, Waste Disposal Revenue Bonds, Valero Energy | 10/10 at 100.00 | BBB | 2,843,100 |
| | | Corporation Project, Series 1998, 5.600%, 4/01/32 (Alternative Minimum Tax) | | | |
| | | Health Care – 12.8% (8.8% of Total Investments) | | | |
| | | Brazoria County Health Facilities Development Corporation, Texas, Revenue Bonds, Brazosport | | | |
| | | Memorial Hospital, Series 2004: | | | |
| 1,745 | | 5.250%, 7/01/20 – RAAI Insured | 7/14 at 100.00 | BBB– | 1,692,458 |
| 1,835 | | 5.250%, 7/01/21 – RAAI Insured | 7/14 at 100.00 | BBB– | 1,755,526 |
| 1,270 | | Midland County Hospital District, Texas, Hospital Revenue Bonds, Series 1992, 0.000%, 6/01/11 | No Opt. Call | BBB– | 1,224,521 |
| 2,000 | | North Central Texas Health Facilities Development Corporation, Hospital Revenue Bonds, Baylor | 5/11 at 100.00 | Aa2 | 2,007,620 |
| | | Healthcare System, Series 2001A, 5.125%, 5/15/29 | | | |
| 105 | | Richardson Hospital Authority, Texas, Hospital Revenue Refunding and Improvement Bonds, | 12/10 at 100.00 | Baa2 | 98,869 |
| | | Baylor/Richardson Medical Center, Series 1998, 5.625%, 12/01/28 | | | |
| | | Richardson Hospital Authority, Texas, Revenue Bonds, Richardson Regional Medical Center, | | | |
| | | Series 2004: | | | |
| 2,000 | | 5.875%, 12/01/24 | 12/13 at 100.00 | Baa2 | 1,981,680 |
| 1,000 | | 6.000%, 12/01/34 | 12/13 at 100.00 | Baa2 | 968,840 |
| 2,500 | | Tarrant County Cultural & Educational Facilities Financing Corporation, Texas, Revenue Bonds, | 11/17 at 100.00 | AA– | 2,499,825 |
| | | Texas Health Resources, Series 2007B, 5.000%, 11/15/42 | | | |
| 1,250 | | Tarrant County Cultural Education Facilities Finance Corporation, Texas, Hospital Revenue | 8/20 at 100.00 | A1 | 1,250,938 |
| | | Bonds, Scott & White HealthCare Project, Series 2010, 5.250%, 8/15/40 | | | |
| 2,000 | | Tarrant County Cultural Education Facilities Finance Corporation, Texas, Revenue Refunding | 1/19 at 100.00 | AAA | 2,199,680 |
| | | Bonds, Christus Health, Series 2008, 6.500%, 7/01/37 – AGC Insured | | | |
Nuveen Investments 37
NTX
Nuveen Texas Quality Income Municipal Fund (continued)
Portfolio of Investments July 31, 2010
| | | | | | |
| Principal | | | Optional Call | | |
| Amount (000) | | Description (1) | Provisions (2) | Ratings (3) | Value |
| | | Health Care (continued) | | | |
| $ 700 | | Tyler Health Facilities Development Corporation, Texas, Hospital Revenue Bonds, Mother Frances | 7/17 at 100.00 | Baa1 | $ 615,503 |
| | | Hospital Regional Healthcare Center, Series 2007B, 5.000%, 7/01/37 | | | |
| 2,250 | | Tyler Health Facilities Development Corporation, Texas, Hospital Revenue Bonds, Mother Frances | 7/17 at 100.00 | Baa1 | 2,018,003 |
| | | Hospital Regional Healthcare Center, Series 2007, 5.000%, 7/01/33 | | | |
| 18,655 | | Total Health Care | | | 18,313,463 |
| | | Housing/Multifamily – 1.7% (1.2% of Total Investments) | | | |
| | | Bexar County Housing Finance Corporation, Texas, Insured Multifamily Housing Revenue Bonds, | | | |
| | | Waters at Northern Hills Apartments Project, Series 2001A: | | | |
| 2,000 | | 6.000%, 8/01/31 – NPFG Insured | 8/11 at 102.00 | Baa1 | 1,816,260 |
| 750 | | 6.050%, 8/01/36 – NPFG Insured | 8/11 at 102.00 | Baa1 | 670,958 |
| 2,750 | | Total Housing/Multifamily | | | 2,487,218 |
| | | Housing/Single Family – 2.8% (1.9% of Total Investments) | | | |
| 1,418 | | El Paso Housing Finance Corporation, Texas, GNMA Collateralized Single Family Mortgage Revenue | 4/11 at 106.75 | AAA | 1,511,916 |
| | | Bonds, Series 2001A-3, 6.180%, 4/01/33 | | | |
| 5 | | Galveston Property Finance Authority Inc., Texas, Single Family Mortgage Revenue Bonds, Series | 9/10 at 100.00 | Caa1 | 4,924 |
| | | 1991A, 8.500%, 9/01/11 | | | |
| 2,440 | | Texas Department of Housing and Community Affairs, Single Family Mortgage Bonds, Series 2002B, | 3/12 at 100.00 | AAA | 2,460,838 |
| | | 5.550%, 9/01/33 – NPFG Insured (Alternative Minimum Tax) | | | |
| 3,863 | | Total Housing/Single Family | | | 3,977,678 |
| | | Long-Term Care – 1.0% (0.7% of Total Investments) | | | |
| | | Bexar County, Texas, Health Facilities Development Corporation Revenue Bonds, Army Retirement | | | |
| | | Residence, Series 2007: | | | |
| 1,000 | | 5.000%, 7/01/27 | 7/17 at 100.00 | BBB | 912,430 |
| 600 | | 5.000%, 7/01/37 | 7/17 at 100.00 | BBB | 521,052 |
| 1,600 | | Total Long-Term Care | | | 1,433,482 |
| | | Materials – 4.2% (2.9% of Total Investments) | | | |
| 3,000 | | Cass County Industrial Development Corporation, Texas, Environmental Improvement Revenue | 9/10 at 101.00 | BBB | 3,032,520 |
| | | Bonds, International Paper Company, Series 2000A, 6.600%, 3/15/24 (Alternative Minimum Tax) | | | |
| 3,000 | | Guadalupe-Blanco River Authority, Texas, Sewage and Solid Waste Disposal Facility Bonds, E.I. | 10/10 at 100.00 | A | 3,002,700 |
| | | DuPont de Nemours and Company Project, Series 1996, 6.400%, 4/01/26 (Alternative Minimum Tax) | | | |
| 6,000 | | Total Materials | | | 6,035,220 |
| | | Tax Obligation/General – 45.1% (30.9% of Total Investments) | | | |
| 1,260 | | Bexar County, Texas, Combined Tax and Revenue Certificates of Obligation, Series 2004, | 6/14 at 100.00 | Aaa | 1,366,634 |
| | | 5.000%, 6/15/19 | | | |
| 2,000 | | Borger Independent School District, Hutchison County, Texas, General Obligation Bonds, Series | 2/16 at 100.00 | AAA | 2,087,880 |
| | | 2006, 5.000%, 2/15/36 | | | |
| 400 | | Calallen Independent School District, Nueces County, Texas, General Obligation Bonds, School | 2/18 at 100.00 | AAA | 419,308 |
| | | Building Series 2008, 5.000%, 2/15/38 | | | |
| 1,190 | | Canutillo Independent School District, El Paso County, Texas, General Obligation Bonds, Series | 8/15 at 100.00 | AAA | 1,331,170 |
| | | 2006A, 5.000%, 8/15/22 | | | |
| 325 | | Copperas Cove, Texas, Certificates of Obligation, Series 2003, 5.000%, 8/15/23 – MBIA Insured | 8/12 at 100.00 | AA– | 343,554 |
| 2,305 | | Corpus Christi, Texas, Combination Tax and Municipal Hotel Occupancy Tax Revenue Certificates | 9/12 at 100.00 | AAA | 2,482,116 |
| | | of Obligation, Series 2002, 5.500%, 9/01/21 – AGM Insured | | | |
| 2,595 | | Denton County, Texas, Permanent Improvement General Obligation Bonds, Series 2005, | 7/12 at 100.00 | AAA | 2,821,959 |
| | | 5.000%, 7/15/25 | | | |
| 1,750 | | El Paso County, Texas, Certificates of Obligation, Series 2001, 5.000%, 2/15/21 – AGM Insured | No Opt. Call | AAA | 2,049,775 |
| | | | | | |
| Principal | | | Optional Call | | |
| Amount (000) | | Description (1) | Provisions (2) | Ratings (3) | Value |
| | | Tax Obligation/General (continued) | | | |
| | | Fort Bend County Municipal Utility District 25, Texas, General Obligation Bonds, Series 2005: | | | |
| $ 1,330 | | 5.000%, 10/01/26 – FGIC Insured | 10/12 at 100.00 | A | $ 1,343,247 |
| 1,320 | | 5.000%, 10/01/27 – FGIC Insured | 10/12 at 100.00 | A | 1,330,428 |
| 3,615 | | Frisco, Texas, General Obligation Bonds, Series 2006, 5.000%, 2/15/26 – FGIC Insured | 2/16 at 100.00 | Aa1 | 3,852,180 |
| 8,500 | | Grand Prairie Independent School District, Dallas County, Texas, General Obligation Bonds, | 8/18 at 22.64 | AA– | 1,233,265 |
| | | Capital Appreciation Refunding Series 2009, 0.000%, 8/15/39 | | | |
| | | Houston Community College System, Texas, Limited Tax General Obligation Bonds, Series 2003: | | | |
| 2,500 | | 5.000%, 2/15/20 – AMBAC Insured | 2/13 at 100.00 | AA+ | 2,707,675 |
| 2,235 | | 5.000%, 2/15/21 – AMBAC Insured | 2/13 at 100.00 | AA+ | 2,420,661 |
| 5,000 | | Houston, Texas, General Obligation Bonds, Series 2005E, 5.000%, 3/01/23 – AMBAC Insured | 3/15 at 100.00 | AA | 5,408,000 |
| 100 | | Judson Independent School District, Bexar County, Texas, General Obligation Refunding Bonds, | 2/11 at 100.00 | Aaa | 102,157 |
| | | Series 2002, 5.250%, 2/01/21 | | | |
| 4,900 | | Leander Independent School District, Williamson and Travis Counties, Texas, General Obligation | 8/14 at 17.78 | AAA | 704,963 |
| | | Bonds, Series 2006, 0.000%, 8/15/45 | | | |
| 1,000 | | Leander Independent School District, Williamson and Travis Counties, Texas, General Obligation | 8/17 at 33.01 | AAA | 231,990 |
| | | Bonds, Series 2008, 0.000%, 8/15/36 | | | |
| 5,220 | | Leander Independent School District, Williamson and Travis Counties, Texas, Unlimited Tax | 8/10 at 49.80 | AAA | 2,603,893 |
| | | School Building and Refunding Bonds, Series 2000, 0.000%, 8/15/21 | | | |
| 365 | | Lone Star College System, Harris and Montgomery Counties, Texas, General Obligation Bonds, | 8/19 at 100.00 | AAA | 389,747 |
| | | Series 2009, 5.000%, 8/15/34 | | | |
| 1,000 | | Mansfield Independent School District, Tarrant County, Texas, General Obligation Bonds, Series | 2/14 at 100.00 | AAA | 1,114,380 |
| | | 2004, 5.000%, 2/15/20 | | | |
| 1,010 | | Mercedes Independent School District, Hidalgo County, Texas, General Obligation Bonds, Series | 8/15 at 100.00 | AAA | 1,097,587 |
| | | 2005, 5.000%, 8/15/23 | | | |
| 5,515 | | Midlothian Independent School District, Ellis County, Texas, General Obligation Bonds, Series | 2/15 at 100.00 | Aaa | 5,724,460 |
| | | 2005, 5.000%, 2/15/34 | | | |
| 1,500 | | Montgomery County, Texas, General Obligation Bonds, Refunding Series 2008B, 5.250%, 3/01/32 | 3/19 at 100.00 | AA | 1,614,735 |
| 100 | | Northside Independent School District, Bexar County, Texas, Unlimited Tax School Building and | 8/10 at 100.00 | AAA | 100,414 |
| | | Refunding Bonds, Series 2000, 5.875%, 8/15/25�� | | | |
| 2,000 | | Plano Independent School District, Collin County, Texas, General Obligation Bonds, Series | 2/18 at 100.00 | Aaa | 2,156,620 |
| | | 2008, 5.250%, 2/15/34 | | | |
| | | Roma Independent School District, Texas, General Obligation Bonds, Series 2005: | | | |
| 1,110 | | 5.000%, 8/15/22 | 8/15 at 100.00 | AAA | 1,241,679 |
| 1,165 | | 5.000%, 8/15/23 – AGM Insured | 8/15 at 100.00 | AAA | 1,294,210 |
| 1,250 | | Southside Independent School District, Bexar County, Texas, General Obligation Bonds, Series | 8/14 at 100.00 | Aaa | 1,382,588 |
| | | 2004A, 5.000%, 8/15/22 | | | |
| 1,140 | | Sunnyvale School District, Texas, General Obligation Bonds, Series 2004, 5.250%, 2/15/25 | 2/14 at 100.00 | AAA | 1,247,035 |
| 5,000 | | Texas State, General Obligation Bonds, Transportation Commission Mobility Fund, Series 2006A, | 4/17 at 100.00 | Aaa | 5,267,450 |
| | | 5.000%, 4/01/33 (UB) | | | |
| 1,000 | | Texas State, General Obligation Bonds, Transportation Commission Mobility Fund, Series 2008, | 4/18 at 100.00 | Aaa | 1,074,660 |
| | | 5.000%, 4/01/30 (UB) | | | |
| 1,110 | | Texas State, General Obligation Bonds, Water Utility, Series 2001, 5.250%, 8/01/23 | 8/11 at 100.00 | Aaa | 1,152,247 |
| 3,025 | | Victoria Independent School District, Victoria County, Texas, General Obligation Bonds, Series | 2/17 at 100.00 | AAA | 3,212,762 |
| | | 2007, 5.000%, 2/15/32 | | | |
| | | West Texas Independent School District, McLennan and Hill Counties, General Obligation | | | |
| | | Refunding Bonds, Series 1998: | | | |
| 1,000 | | 0.000%, 8/15/22 | 8/13 at 61.20 | AAA | 545,140 |
| 1,000 | | 0.000%, 8/15/24 | 8/13 at 54.88 | AAA | 485,250 |
Nuveen Investments 39
NTX
Nuveen Texas Quality Income Municipal Fund (continued)
Portfolio of Investments July 31, 2010
| | | | | | |
| Principal | | | Optional Call | | |
| Amount (000) | | Description (1) | Provisions (2) | Ratings (3) | Value |
| | | Tax Obligation/General (continued) | | | |
| | | White Settlement Independent School District, Tarrant County, Texas, General Obligation Bonds, | | | |
| | | Series 2006: | | | |
| $ 1,500 | | 0.000%, 8/15/43 | 8/15 at 23.11 | AAA | $ 266,970 |
| 1,500 | | 0.000%, 8/15/44 | 8/15 at 21.88 | AAA | 252,435 |
| 425 | | 0.000%, 8/15/45 | 8/15 at 20.76 | AAA | 67,805 |
| 79,260 | | Total Tax Obligation/General | | | 64,529,029 |
| | | Tax Obligation/Limited – 9.1% (6.3% of Total Investments) | | | |
| 7,940 | | Dallas Area Rapid Transit, Texas, Sales Tax Revenue Bonds, Senior Lien Refunding Series 2007, | 12/16 at 100.00 | AAA | 8,218,218 |
| | | 5.000%, 12/01/36 – AMBAC Insured | | | |
| | | Harris County-Houston Sports Authority, Texas, Junior Lien Revenue Bonds, Series 2001H: | | | |
| 1,720 | | 0.000%, 11/15/34 – NPFG Insured | 11/31 at 83.17 | A | 307,089 |
| 930 | | 0.000%, 11/15/36 – NPFG Insured | 11/31 at 73.51 | A | 144,085 |
| 3,265 | | 0.000%, 11/15/38 – NPFG Insured | 11/31 at 64.91 | A | 438,947 |
| | | Harris County-Houston Sports Authority, Texas, Senior Lien Revenue Bonds, Series 2001G: | | | |
| 2,250 | | 5.250%, 11/15/22 – NPFG Insured | 11/11 at 100.00 | A | 2,262,510 |
| 2,475 | | 0.000%, 11/15/41 – NPFG Insured | 11/31 at 53.78 | A | 267,350 |
| 1,470 | | Houston, Texas, Hotel Occupancy Tax and Special Revenue Bonds, Convention and Entertainment | No Opt. Call | A2 | 386,581 |
| | | Project, Series 2001B, 0.000%, 9/01/32 – AMBAC Insured | | | |
| 1,000 | | Uptown Development Authority, Houston, Texas, Tax Increment Revenue Bonds, Infrastructure | 9/19 at 100.00 | BBB+ | 1,015,670 |
| | | Improvement Facilities, Series 2009, 5.500%, 9/01/29 | | | |
| 21,050 | | Total Tax Obligation/Limited | | | 13,040,450 |
| | | Transportation – 10.2% (7.0% of Total Investments) | | | |
| 1,000 | | Austin, Texas, Airport System Prior Lien Revenue Bonds, Series 2003, 5.250%, 11/15/16 – | 11/13 at 100.00 | A | 1,072,710 |
| | | NPFG Insured | | | |
| | | Central Texas Regional Mobility Authority, Senior Lien Revenue Bonds, Series 2010: | | | |
| 2,945 | | 0.000%, 1/01/36 | No Opt. Call | BBB– | 517,378 |
| 2,205 | | 0.000%, 1/01/37 | No Opt. Call | BBB– | 359,900 |
| 2,000 | | 0.000%, 1/01/38 | No Opt. Call | BBB– | 303,200 |
| 3,260 | | Central Texas Regional Mobility Authority, Travis and Williamson Counties, Toll Road Revenue | 1/15 at 100.00 | A | 3,301,076 |
| | | Bonds, Series 2005, 5.000%, 1/01/22 – FGIC Insured | | | |
| 2,600 | | Dallas-Ft. Worth International Airport Facility Improvement Corporation, Texas, Revenue Bonds, | 11/10 at 100.50 | CCC+ | 2,092,012 |
| | | American Airlines Inc., Series 1999, 6.375%, 5/01/35 (Alternative Minimum Tax) | | | |
| 2,000 | | Houston, Texas, Subordinate Lien Airport System Revenue Bonds, Series 2000A, 5.625%, 7/01/30 – | 1/11 at 100.00 | AAA | 2,000,680 |
| | | AGM Insured (Alternative Minimum Tax) | | | |
| 2,500 | | North Texas Thruway Authority, First Tier System Revenue Refunding Bonds, Capital Appreciation | No Opt. Call | AAA | 602,050 |
| | | Series 2008, 0.000%, 1/01/36 – AGC Insured | | | |
| 395 | | North Texas Thruway Authority, First Tier System Revenue Refunding Bonds, Series 2008A, | 1/18 at 100.00 | A2 | 412,040 |
| | | 5.750%, 1/01/40 | | | |
| | | North Texas Thruway Authority, First Tier System Revenue Refunding Bonds, Series 2008B: | | | |
| 325 | | 5.750%, 1/01/40 | 1/18 at 100.00 | A2 | 339,021 |
| 225 | | 5.750%, 1/01/40 – NPFG Insured | 1/18 at 100.00 | A | 234,707 |
| 950 | | North Texas Thruway Authority, Second Tier System Revenue Refunding Bonds, Series 2008, | 1/18 at 100.00 | A3 | 996,370 |
| | | 5.750%, 1/01/38 | | | |
| | | North Texas Tollway Authority, System Revenue Bonds, First Tier Series 2009A: | | | |
| 100 | | 6.100%, 1/01/28 | 1/19 at 100.00 | A2 | 110,259 |
| 2,000 | | 6.250%, 1/01/39 | 1/19 at 100.00 | A2 | 2,186,520 |
| 22,505 | | Total Transportation | | | 14,527,923 |
| | | | | | |
| Principal | | | Optional Call | | |
| Amount (000) | | Description (1) | Provisions (2) | Ratings (3) | Value |
| | | U.S. Guaranteed – 15.2% (10.4% of Total Investments) (4) | | | |
| $ 295 | | Coppell Independent School District, Dallas County, Texas, Unlimited Tax School Building and | No Opt. Call | AAA | $ 279,330 |
| | | Refunding Bonds, Series 1992, 0.000%, 8/15/14 – MBIA Insured (ETM) | | | |
| 950 | | Copperas Cove, Texas, Certificates of Obligation, Series 2003, 5.000%, 8/15/23 (Pre-refunded | 8/12 at 100.00 | A (4) | 1,038,996 |
| | | 8/15/12) – MBIA Insured | | | |
| | | Gregg County Health Facilities Development Corporation, Texas, Hospital Revenue Bonds, Good | | | |
| | | Shepherd Medical Center Project, Series 2000: | | | |
| 2,000 | | 6.875%, 10/01/20 (Pre-refunded 10/01/10) – RAAI Insured | 10/10 at 101.00 | N/R (4) | 2,041,980 |
| 3,250 | | 6.375%, 10/01/25 (Pre-refunded 10/01/10) – RAAI Insured | 10/10 at 101.00 | N/R (4) | 3,315,520 |
| 500 | | Harris County Health Facilities Development Corporation, Texas, Revenue Bonds, St. Luke’s | 8/11 at 100.00 | AAA | 527,535 |
| | | Episcopal Hospital, Series 2001A, 5.500%, 2/15/21 (Pre-refunded 8/15/11) | | | |
| 1,000 | | North Central Texas Health Facilities Development Corporation, Hospital Revenue Bonds, | No Opt. Call | Aaa | 1,221,780 |
| | | Presbyterian Healthcare System, Series 1996B, 5.750%, 6/01/26 – NPFG Insured (ETM) | | | |
| 2,500 | | Retama Development Corporation, Texas, Special Facilities Revenue Bonds, Retama Park | 12/17 at 100.00 | AAA | 3,525,025 |
| | | Racetrack, Series 1993, 8.750%, 12/15/18 (Pre-refunded 12/15/17) | | | |
| 1,750 | | San Antonio, Texas, Electric and Gas System Revenue Refunding Bonds, Series 2002, 5.375%, | 2/12 at 100.00 | AAA | 1,881,198 |
| | | 2/01/20 (Pre-refunded 2/01/12) | | | |
| 1,440 | | South Texas Community College District, General Obligation Bonds, Series 2002, 5.500%, 8/15/17 | 8/12 at 100.00 | Aa2 (4) | 1,588,277 |
| | | (Pre-refunded 8/15/12) – AMBAC Insured | | | |
| 3,500 | | Tarrant County Health Facilities Development Corporation, Texas, Hospital Revenue Bonds, | 11/10 at 101.00 | N/R (4) | 3,598,735 |
| | | Adventist Health System – Sunbelt Obligated Group, Series 2000, 6.625%, 11/15/20 | | | |
| | | (Pre-refunded 11/15/10) | | | |
| 1,500 | | Texas, General Obligation Refunding Bonds, Public Finance Authority, Series 2002, 5.000%, | 10/12 at 100.00 | Aaa | 1,648,035 |
| | | 10/01/18 (Pre-refunded 10/01/12) | | | |
| 1,000 | | Tyler Health Facilities Development Corporation, Texas, Hospital Revenue Bonds, Mother Frances | 7/12 at 100.00 | Baa1 (4) | 1,096,930 |
| | | Hospital Regional Healthcare Center, Series 2001, 6.000%, 7/01/31 (Pre-refunded 7/01/12) | | | |
| 19,685 | | Total U.S. Guaranteed | | | 21,763,341 |
| | | Utilities – 12.7% (8.7% of Total Investments) | | | |
| 2,560 | | Brazos River Authority, Texas, Pollution Control Revenue Refunding Bonds, TXU Electric | 4/13 at 101.00 | Caa3 | 1,368,986 |
| | | Company, Series 1999C, 7.700%, 3/01/32 (Alternative Minimum Tax) | | | |
| 2,400 | | Brazos River Authority, Texas, Revenue Bonds, Reliant Energy Inc., Series 1999A, | 10/10 at 100.50 | BBB– | 2,409,288 |
| | | 5.375%, 4/01/19 | | | |
| 5,000 | | Brownsville, Texas, Utility System Priority Revenue Bonds, Series 2005A, 5.000%, 9/01/27 – | 9/15 at 100.00 | Aa3 | 5,189,400 |
| | | AMBAC Insured | | | |
| 2,000 | | Bryan, Brazos County, Texas, Electric System Revenue Bonds, Series 2009, 5.000%, 7/01/34 | 7/17 at 100.00 | A+ | 2,039,160 |
| 2,000 | | Harris County Health Facilities Development Corporation, Texas, Thermal Utility Revenue Bonds, | 8/10 at 100.00 | Aa3 | 2,005,160 |
| | | TECO Project, Series 2000, 5.750%, 2/15/15 – AMBAC Insured (Alternative Minimum Tax) | | | |
| 2,000 | | Lower Colorado River Authority, Texas, Revenue Bonds, Series 2008, 5.750%, 5/15/37 | 5/15 at 100.00 | A1 | 2,106,080 |
| 1,000 | | Matagorda County Navigation District 1, Texas, Revenue Bonds, Reliant Energy Inc., Series | 11/10 at 100.50 | BBB– | 1,000,140 |
| | | 1999B, 5.950%, 5/01/30 (Alternative Minimum Tax) | | | |
| 1,000 | | Matagorda County Navigation District Number One, Texas, Pollution Control Revenue Refunding | 7/19 at 102.00 | BBB | 1,094,070 |
| | | Bonds, Central Power and Light Company Project, Series 2009A, 6.300%, 11/01/29 | | | |
| 1,000 | | Texas Municipal Power Agency, Revenue Bonds, Transmission Refunding Series 2010, 5.000%, | 9/20 at 100.00 | A+ | 1,010,620 |
| | | 9/01/40 (WI/DD, Settling 8/30/10) | | | |
| 18,960 | | Total Utilities | | | 18,222,904 |
Nuveen Investments 41
NTX
Nuveen Texas Quality Income Municipal Fund (continued)
Portfolio of Investments July 31, 2010
| | | | | | | |
| Principal | | | Optional Call | | | |
| Amount (000) | | Description (1) | Provisions (2) | Ratings (3) | Value | |
| | | Water and Sewer – 11.6% (7.9% of Total Investments) | | | | |
| | | Coastal Water Authority, Texas, Contract Revenue Bonds, Houston Water Projects, Series 2004: | | | | |
| $ 1,005 | | 5.000%, 12/15/20 – FGIC Insured | 12/14 at 100.00 | A | $ 1,066,375 | |
| 1,030 | | 5.000%, 12/15/21 – FGIC Insured | 12/14 at 100.00 | A | 1,086,443 | |
| 1,000 | | El Paso, Texas, Water and Sewer Revenue Bonds, Refunding Series 2008C, 5.375%, 3/01/29 | 3/18 at 100.00 | AA | 1,088,489 | |
| 3,000 | | Houston, Texas, First Lien Combined Utility System Revenue Bonds, Series 2004A, 5.250%, | 5/14 at 100.00 | AA | 3,287,549 | |
| | | 5/15/23 – FGIC Insured | | | | |
| 3,500 | | Houston, Texas, Junior Lien Water and Sewerage System Revenue Refunding Bonds, Series 2001A, | 12/11 at 100.00 | AAA | 3,708,669 | |
| | | 5.500%, 12/01/17 – AGM Insured | | | | |
| | | Irving, Texas, Subordinate Lien Waterworks and Sewerage Revenue Bonds, Series 2004: | | | | |
| 1,680 | | 5.000%, 8/15/22 – AMBAC Insured | 8/14 at 100.00 | Aa1 | 1,816,213 | |
| 1,760 | | 5.000%, 8/15/23 – AMBAC Insured | 8/14 at 100.00 | Aa1 | 1,889,482 | |
| 1,260 | | Rowlett, Rockwall and Dallas Counties, Texas, Waterworks and Sewerage System Revenue Bonds, | 3/14 at 100.00 | AA– | 1,323,969 | |
| | | Series 2004A, 5.000%, 3/01/22 – NPFG Insured | | | | |
| 1,300 | | Texas Water Development Board, Senior Lien State Revolving Fund Revenue Bonds, Series 1999A, | 1/11 at 100.00 | AAA | 1,305,602 | |
| | | 5.500%, 7/15/21 | | | | |
| 15,535 | | Total Water and Sewer | | | 16,572,791 | |
| $ 237,218 | | Total Investments (cost $201,879,097) – 145.8% | | | 208,593,077 | |
| | | Floating Rate Obligations – (2.8)% | | | (3,960,000 | ) |
| | | Other Assets Less Liabilities – 2.5% | | | 3,496,817 | |
| | | Auction Rate Preferred Shares, at Liquidation Value – (45.5)% (5) | | | (65,050,000 | ) |
| | | Net Assets Applicable to Common Shares – 100% | | | $ 143,079,894 | |
| | |
| (1) | All percentages shown in the Portfolio of Investments are based on net assets applicable to Common shares unless otherwise noted. |
| (2) | Optional Call Provisions (not covered by the report of independent registered public accounting firm): Dates (month and year) and prices of the earliest |
| | optional call or redemption. There may be other call provisions at varying prices at later dates. Certain mortgage-backed securities may be subject to periodic |
| | principal paydowns. |
| (3) | Ratings (not covered by the report of independent registered public accounting firm): Using the highest of Standard & Poor’s Group (“Standard & Poor’s”), |
| | Moody’s Investor Service, Inc. (“Moody’s”) or Fitch, Inc. (“Fitch”) rating. Ratings below BBB by Standard & Poor’s, Baa by Moody’s or BBB by Fitch are |
| | considered to be below investment grade. |
| (4) | Backed by an escrow or trust containing sufficient U.S. Government or U.S. Government agency securities, which ensure the timely payment of principal |
| | and interest. Such investments are normally considered to be equivalent to AAA rated securities. |
| (5) | Auction Rate Preferred shares, at Liquidation Value as a percentage of Total Investments is 31.2%. |
| N/R | Not rated. |
| WI/DD | Purchased on a when-issued or delayed delivery basis. |
| (ETM) | Escrowed to maturity. |
| (UB) | Underlying bond of an inverse floating rate trust reflected as a financing transaction. See Notes to Financial Statements, Footnote 1 – Inverse Floating Rate |
| | Securities for more information. |
See accompanying notes to financial statements.
| | | | | | |
| Statement of | | | | | |
| Assets & Liabilities | | | |
| | | | July 31, 2010 |
| | | Arizona | | | Arizona | | | Arizona | | | Arizona | | | Texas | |
| | | Premium | | | Dividend | | | Dividend | | | Dividend | | | Quality | |
| | | Income | | | Advantage | | | Advantage 2 | | | Advantage 3 | | | Income | |
| | | (NAZ) | | | (NFZ) | | | (NKR) | | | (NXE) | | | (NTX) | |
| Assets | | | | | | | | | | | | | | | |
| Investments, at value (cost $83,508,446, $31,425,432, | | | | | | | | | | | | | | | |
| $49,228,018, $59,477,262 and $201,879,097, respectively) | | $ | 88,003,144 | | | $ | 31,980,266 | | | $ | 50,588,304 | | | $ | 60,274,874 | | | $ | 208,593,077 | |
| Cash | | | 2,113,293 | | | | 459,732 | | | | 1,552,243 | | | | 1,231,287 | | | | 1,463,040 | |
| Receivables: | | | | | | | | | | | | | | | | | | | | |
| Interest | | | 590,159 | | | | 265,069 | | | | 411,268 | | | | 418,964 | | | | 3,074,789 | |
| Investments sold | | | 55,000 | | | | — | | | | — | | | | — | | | | 1,046,665 | |
| Other assets | | | 19,484 | | | | 16,053 | | | | 19,932 | | | | 16,135 | | | | 45,237 | |
| Total assets | | | 90,781,080 | | | | 32,721,120 | | | | 52,571,747 | | | | 61,941,260 | | | | 214,222,808 | |
| Liabilities | | | | | | | | | | | | | | | | | | | | |
| Floating rate obligations | | | — | | | | — | | | | — | | | | — | | | | 3,960,000 | |
| Payables: | | | | | | | | | | | | | | | | | | | | |
| Investments purchased | | | — | | | | — | | | | — | | | | — | | | | 1,331,909 | |
| Auction Rate Preferred share dividends | | | 628 | | | | 496 | | | | 584 | | | | 1,288 | | | | 2,147 | |
| Common share dividends | | | 262,204 | | | | 97,479 | | | | 159,261 | | | | 190,926 | | | | 603,100 | |
| Accrued expenses: | | | | | | | | | | | | | | | | | | | | |
| Management fees | | | 49,713 | | | | 16,120 | | | | 24,300 | | | | 30,025 | | | | 112,949 | |
| Other | | | 44,989 | | | | 22,630 | | | | 29,340 | | | | 38,789 | | | | 82,809 | |
| Total liabilities | | | 357,534 | | | | 136,725 | | | | 213,485 | | | | 261,028 | | | | 6,092,914 | |
| Auction Rate Preferred shares, at liquidation value | | | 27,875,000 | | | | 10,600,000 | | | | 16,625,000 | | | | 18,400,000 | | | | 65,050,000 | |
| Net assets applicable to Common shares | | $ | 62,548,546 | | | $ | 21,984,395 | | | $ | 35,733,262 | | | $ | 43,280,232 | | | $ | 143,079,894 | |
| Common shares outstanding | | | 4,469,952 | | | | 1,548,020 | | | | 2,439,551 | | | | 3,066,030 | | | | 9,529,884 | |
| Net asset value per Common share outstanding (net assets | | | | | | | | | | | | | | | | | | | | |
| applicable to Common shares, divided by Common | | | | | | | | | | | | | | | | | | | | |
| shares outstanding) | | $ | 13.99 | | | $ | 14.20 | | | $ | 14.65 | | | $ | 14.12 | | | $ | 15.01 | |
| Net assets applicable to Common shares consist of: | | | | | | | | | | | | | | | | | | | | |
| Common shares, $.01 par value per share | | $ | 44,700 | | | $ | 15,480 | | | $ | 24,396 | | | $ | 30,660 | | | $ | 95,299 | |
| Paid-in surplus | | | 62,166,864 | | | | 21,910,016 | | | | 34,577,972 | | | | 43,233,092 | | | | 135,135,057 | |
| Undistributed (Over-distribution of) net investment income | | | 961,516 | | | | 278,947 | | | | 427,638 | | | | 487,582 | | | | 2,042,050 | |
| Accumulated net realized gain (loss) | | | (5,119,232 | ) | | | (774,882 | ) | | | (657,030 | ) | | | (1,268,714 | ) | | | (906,492 | ) |
| Net unrealized appreciation (depreciation) | | | 4,494,698 | | | | 554,834 | | | | 1,360,286 | | | | 797,612 | | | | 6,713,980 | |
| Net assets applicable to Common shares | | $ | 62,548,546 | | | $ | 21,984,395 | | | $ | 35,733,262 | | | $ | 43,280,232 | | | $ | 143,079,894 | |
| Authorized shares: | | | | | | | | | | | | | | | | | | | | |
| Common | | | 200,000,000 | | | Unlimited | | | Unlimited | | | Unlimited | | | Unlimited | |
| Auction Rate Preferred | | | 1,000,000 | | | Unlimited | | | Unlimited | | | Unlimited | | | Unlimited | |
See accompanying notes to financial statements.
Nuveen Investments 43
| | | | | | |
| Statement of | | | | | |
| Operations | | | | |
| | | | Year Ended July 31, 2010 | |
| | | Arizona | | | Arizona | | | Arizona | | | Arizona | | | Texas | |
| | | Premium | | | Dividend | | | Dividend | | | Dividend | | | Quality | |
| | | Income | | | Advantage | | | Advantage 2 | | | Advantage 3 | | | Income | |
| | | (NAZ) | | | (NFZ) | | | (NKR) | | | (NXE) | | | (NTX) | |
| Investment Income | | $ | 4,507,457 | | | $ | 1,579,349 | | | $ | 2,571,398 | | | $ | 3,099,881 | | | $ | 10,596,403 | |
| Expenses | | | | | | | | | | | | | | | | | | | | |
| Management fees | | | 582,148 | | | | 202,746 | | | | 336,597 | | | | 399,605 | | | | 1,318,389 | |
| Auction Rate Preferred shares – auction fees | | | 41,811 | | | | 15,899 | | | | 24,937 | | | | 27,601 | | | | 97,575 | |
| Auction Rate Preferred shares – dividend disbursing agent fees | | | 10,000 | | | | 10,000 | | | | 10,000 | | | | 10,000 | | | | 20,000 | |
| Shareholders’ servicing agent fees and expenses | | | 3,352 | | | | 536 | | | | 482 | | | | 390 | | | | 9,051 | |
| Interest expense on floating rate obligations | | | — | | | | — | | | | — | | | | — | | | | 20,183 | |
| Custodian’s fees and expenses | | | 20,920 | | | | 11,611 | | | | 15,505 | | | | 16,322 | | | | 42,365 | |
| Directors’/Trustees’ fees and expenses | | | 2,548 | | | | 908 | | | | 1,469 | | | | 1,909 | | | | 5,852 | |
| Professional fees | | | 18,717 | | | | 11,034 | | | | 12,841 | | | | 13,604 | | | | 41,748 | |
| Shareholders’ reports – printing and mailing expenses | | | 27,656 | | | | 14,043 | | | | 18,775 | | | | 21,141 | | | | 52,459 | |
| Stock exchange listing fees | | | 9,145 | | | | 217 | | | | 342 | | | | 430 | | | | 9,177 | |
| Investor relations expense | | | 7,114 | | | | 2,533 | | | | 4,103 | | | | 4,752 | | | | 14,710 | |
| Other expenses | | | 18,336 | | | | 15,284 | | | | 16,644 | | | | 15,704 | | | | 22,882 | |
| Total expenses before custodian fee credit and | | | | | | | | | | | | | | | | | | | | |
| expense reimbursement | | | 741,747 | | | | 284,811 | | | | 441,695 | | | | 511,458 | | | | 1,654,391 | |
| Custodian fee credit | | | (310 | ) | | | (281 | ) | | | (403 | ) | | | (304 | ) | | | (569 | ) |
| Expense reimbursement | | | — | | | | (23,792 | ) | | | (69,610 | ) | | | (57,404 | ) | | | — | |
| Net expenses | | | 741,437 | | | | 260,738 | | | | 371,682 | | | | 453,750 | | | | 1,653,822 | |
| Net investment income | | | 3,766,020 | | | | 1,318,611 | | | | 2,199,716 | | | | 2,646,131 | | | | 8,942,581 | |
| Realized and Unrealized Gain (Loss) | | | | | | | | | | | | | | | | | | | | |
| Net realized gain (loss) from investments | | | 211,410 | | | | 3,081 | | | | 15,295 | | | | 103,076 | | | | 197,927 | |
| Change in net unrealized appreciation (depreciation) | | | | | | | | | | | | | | | | | | | | |
| of investments | | | 4,067,325 | | | | 2,172,884 | | | | 2,615,288 | | | | 3,715,857 | | | | 10,122,568 | |
| Net realized and unrealized gain (loss) | | | 4,278,735 | | | | 2,175,965 | | | | 2,630,583 | | | | 3,818,933 | | | | 10,320,495 | |
| Distributions to Auction Rate Preferred Shareholders | | | | | | | | | | | | | | | | | | | | |
| From net investment income | | | (115,298 | ) | | | (44,516 | ) | | | (69,894 | ) | | | (76,983 | ) | | | (257,907 | ) |
| From accumulated net realized gains | | | — | | | | — | | | | — | | | | — | | | | (19,921 | ) |
| Decrease in net assets applicable to Common shares | | | | | | | | | | | | | | | | | | | | |
| from distributions to Auction Rate Preferred shareholders | | | (115,298 | ) | | | (44,516 | ) | | | (69,894 | ) | | | (76,983 | ) | | | (277,828 | ) |
| Net increase (decrease) in net assets applicable to | | | | | | | | | | | | | | | | | | | | |
| Common shares from operations | | $ | 7,929,457 | | | $ | 3,450,060 | | | $ | 4,760,405 | | | $ | 6,388,081 | | | $ | 18,985,248 | |
See accompanying notes to financial statements.
| | | | | | | | | | | | | | | | | | | |
| Statement of | | | | | | | | | | | | | | | | |
| Changes in Net Assets | | | | | | | |
| | | Arizona | | | Arizona | | | Arizona | |
| | | Premium Income (NAZ) | | | Dividend Advantage (NFZ) | | | Dividend Advantage 2 (NKR) | |
| | | Year | | | Year | | | Year | | | Year | | | Year | | | Year | |
| | | Ended | | | Ended | | | Ended | | | Ended | | | Ended | | | Ended | |
| | | 7/31/10 | | | 7/31/09 | | | 7/31/10 | | | 7/31/09 | | | 7/31/10 | | | 7/31/09 | |
| Operations | | | | | | | | | | | | | | | | | | |
| Net investment income | | $ | 3,766,020 | | | $ | 3,812,672 | | | $ | 1,318,611 | | | $ | 1,299,942 | | | $ | 2,199,716 | | | $ | 2,259,065 | |
| Net realized gain (loss) from: | | | | | | | | | | | | | | | | | | | | | | | | |
| Investments | | | 211,410 | | | | (2,710,445 | ) | | | 3,081 | | | | (429,021 | ) | | | 15,295 | | | | (349,393 | ) |
| Futures contracts | | | — | | | | — | | | | — | | | | — | | | | — | | | | — | |
| Change in net unrealized appreciation | | | | | | | | | | | | | | | | | | | | | | | | |
| (depreciation) of: | | | | | | | | | | | | | | | | | | | | | | | | |
| Investments | | | 4,067,325 | | | | 1,955,974 | | | | 2,172,884 | | | | (604,752 | ) | | | 2,615,288 | | | | (337,136 | ) |
| Futures contracts | | | — | | | | — | | | | — | | | | — | | | | — | | | | — | |
| Distributions to Auction Rate | | | | | | | | | | | | | | | | | | | | | | | | |
| Preferred Shareholders: | | | | | | | | | | | | | | | | | | | | | | | | |
| From net investment income | | | (115,298 | ) | | | (565,487 | ) | | | (44,516 | ) | | | (220,718 | ) | | | (69,894 | ) | | | (349,919 | ) |
| From accumulated net realized gains | | | — | | | | — | | | | — | | | | — | | | | — | | | | — | |
| Net increase (decrease) in net assets | | | | | | | | | | | | | | | | | | | | | | | | |
| applicable to Common shares | | | | | | | | | | | | | | | | | | | | | | | | |
| from operations | | | 7,929,457 | | | | 2,492,714 | | | | 3,450,060 | | | | 45,451 | | | | 4,760,405 | | | | 1,222,617 | |
| Distributions to Common Shareholders | | | | | | | | | | | | | | | | | | | | | | | | |
| From net investment income | | | (3,146,573 | ) | | | (2,846,851 | ) | | | (1,070,455 | ) | | | (976,248 | ) | | | (1,856,497 | ) | | | (1,712,859 | ) |
| From accumulated net realized gains | | | — | | | | — | | | | — | | | | — | | | | — | | | | — | |
| Decrease in net assets applicable to | | | | | | | | | | | | | | | | | | | | | | | | |
| Common shares from distributions | | | | | | | | | | | | | | | | | | | | | | | | |
| to Common shareholders | | | (3,146,573 | ) | | | (2,846,851 | ) | | | (1,070,455 | ) | | | (976,248 | ) | | | (1,856,497 | ) | | | (1,712,859 | ) |
| Capital Share Transactions | | | | | | | | | | | | | | | | | | | | | | | | |
| Common shares: | | | | | | | | | | | | | | | | | | | | | | | | |
| Net proceeds from shares issued to | | | | | | | | | | | | | | | | | | | | | | | | |
| shareholders due to reinvestment | | | | | | | | | | | | | | | | | | | | | | | | |
| of distributions | | | 10,931 | | | | 12,298 | | | | — | | | | 7,371 | | | | — | | | | 16,440 | |
| Repurchased and retired | | | — | | | | — | | | | — | | | | (24,038 | ) | | | — | | | | (8,296 | ) |
| Net increase in net assets | | | | | | | | | | | | | | | | | | | | | | | | |
| applicable to Common shares | | | | | | | | | | | | | | | | | | | | | | | | |
| from capital share transactions | | | 10,931 | | | | 12,298 | | | | — | | | | (16,667 | ) | | | — | | | | 8,144 | |
| Net increase (decrease) in net assets | | | | | | | | | | | | | | | | | | | | | | | | |
| applicable to Common shares | | | 4,793,815 | | | | (341,839 | ) | | | 2,379,605 | | | | (947,464 | ) | | | 2,903,908 | | | | (482,098 | ) |
| Net assets applicable to Common | | | | | | | | | | | | | | | | | | | | | | | | |
| shares at the beginning of year | | | 57,754,731 | | | | 58,096,570 | | | | 19,604,790 | | | | 20,552,254 | | | | 32,829,354 | | | | 33,311,452 | |
| Net assets applicable to Common | | | | | | | | | | | | | | | | | | | | | | | | |
| shares at the end of year | | $ | 62,548,546 | | | $ | 57,754,731 | | | $ | 21,984,395 | | | $ | 19,604,790 | | | $ | 35,733,262 | | | $ | 32,829,354 | |
| Undistributed (Over-distribution of) | | | | | | | | | | | | | | | | | | | | | | | | |
| net investment income | | | | | | | | | | | | | | | | | | | | | | | | |
| at the end of year | | $ | 961,516 | | | $ | 492,363 | | | $ | 278,947 | | | $ | 75,318 | | | $ | 427,638 | | | $ | 154,645 | |
See accompanying notes to financial statements.
Nuveen Investments 45
| | | | | | | | | | | | | |
| Statement of | | | | | | | | | | | | |
Changes in Net Assets (continued) | | | | | | | | | | | | |
| | | Arizona | | | Texas | |
| | | Dividend Advantage 3 (NXE) | | | Quality Income (NTX) | |
| | | Year | | | Year | | | Year | | | Year | |
| | | Ended | | | Ended | | | Ended | | | Ended | |
| | | 7/31/10 | | | 7/31/09 | | | 7/31/10 | | | 7/31/09 | |
| Operations | | | | | | | | | | | | |
| Net investment income | | $ | 2,646,131 | | | $ | 2,685,306 | | | $ | 8,942,581 | | | $ | 8,942,930 | |
| Net realized gain (loss) from: | | | | | | | | | | | | | | | | |
| Investments | | | 103,076 | | | | (323,361 | ) | | | 197,927 | | | | (260,097 | ) |
| Futures contracts | | | — | | | | — | | | | — | | | | 279,232 | |
| Change in net unrealized appreciation | | | | | | | | | | | | | | | | |
| (depreciation) of: | | | | | | | | | | | | | | | | |
| Investments | | | 3,715,857 | | | | (880,027 | ) | | | 10,122,568 | | | | (1,592,328 | ) |
| Futures contracts | | | — | | | | — | | | | — | | | | (80,805 | ) |
| Distributions to Auction Rate | | | | | | | | | | | | | | | | |
| Preferred Shareholders: | | | | | | | | | | | | | | | | |
| From net investment income | | | (76,983 | ) | | | (412,423 | ) | | | (257,907 | ) | | | (1,209,638 | ) |
| From accumulated net realized gains | | | — | | | | — | | | | (19,921 | ) | | | (148,005 | ) |
| Net increase (decrease) in net assets | | | | | | | | | | | | | | | | |
| applicable to Common shares | | | | | | | | | | | | | | | | |
| from operations | | | 6,388,081 | | | | 1,069,495 | | | | 18,985,248 | | | | 5,931,289 | |
| Distributions to Common Shareholders | | | | | | | | | | | | | | | | |
| From net investment income | | | (2,236,669 | ) | | | (2,005,865 | ) | | | (7,745,753 | ) | | | (6,752,824 | ) |
| From accumulated net realized gains | | | — | | | | — | | | | (114,136 | ) | | | (446,272 | ) |
| Decrease in net assets applicable to | | | | | | | | | | | | | | | | |
| Common shares from distributions | | | | | | | | | | | | | | | | |
| to Common shareholders | | | (2,236,669 | ) | | | (2,005,865 | ) | | | (7,859,889 | ) | | | (7,199,096 | ) |
| Capital Share Transactions | | | | | | | | | | | | | | | | |
| Common shares: | | | | | | | | | | | | | | | | |
| Net proceeds from shares issued to | | | | | | | | | | | | | | | | |
| shareholders due to reinvestment | | | | | | | | | | | | | | | | |
| of distributions | | | — | | | | — | | | | 441,175 | | | | 67,966 | |
| Repurchased and retired | | | — | | | | (15,380 | ) | | | — | | | | — | |
| Net increase in net assets | | | | | | | | | | | | | | | | |
| applicable to Common shares | | | | | | | | | | | | | | | | |
| from capital share transactions | | | — | | | | (15,380 | ) | | | 441,175 | | | | 67,966 | |
| Net increase (decrease) in net assets | | | | | | | | | | | | | | | | |
| applicable to Common shares | | | 4,151,412 | | | | (951,750 | ) | | | 11,566,534 | | | | (1,199,841 | ) |
| Net assets applicable to Common | | | | | | | | | | | | | | | | |
| shares at the beginning of year | | | 39,128,820 | | | | 40,080,570 | | | | 131,513,360 | | | | 132,713,201 | |
| Net assets applicable to Common | | | | | | | | | | | | | | | | |
| shares at the end of year | | $ | 43,280,232 | | | $ | 39,128,820 | | | $ | 143,079,894 | | | $ | 131,513,360 | |
| Undistributed (Over-distribution of) | | | | | | | | | | | | | | | | |
| net investment income | | | | | | | | | | | | | | | | |
| at the end of year | | $ | 487,582 | | | $ | 157,033 | | | $ | 2,042,050 | | | $ | 1,103,875 | |
See accompanying notes to financial statements.
Notes to
Financial Statements
1. General Information and Significant Accounting Policies
The funds covered in this report and their corresponding Common share stock exchange symbols are Nuveen Arizona Premium Income Municipal Fund, Inc. (NAZ), Nuveen Arizona Dividend Advantage Municipal Fund (NFZ), Nuveen Arizona Dividend Advantage Municipal Fund 2 (NKR), Nuveen Arizona Dividend Advantage Municipal Fund 3 (NXE) and Nuveen Texas Quality Income Municipal Fund (NTX) (collectively, the “Funds”). Common shares of Arizona Premium Income (NAZ) and Texas Quality Income (NTX) are traded on the New York Stock Exchange (“NYSE”) while Common shares of Arizona Dividend Advantage (NFZ), Arizona Dividend Advantage 2 (NKR) and Arizona Dividend Advantage 3 (NXE) are traded on the NYSE Amex. The Funds are registered under the Investment Company Act of 1940, as amended, as closed-end management investment companies.
Each Fund seeks to provide current income exempt from both regular federal and designated state income taxes by investing primarily in a portfolio of municipal obligations issued by state and local government authorities within a single state or certain U.S. territories.
In June 2009, the Financial Accounting Standards Board (“FASB”) established the FASB Accounting Standards Codification™ (the “Codification”) as the single source of authoritative accounting principles recognized by the FASB in the preparation of financial statements in conformity with generally accepted accounting principles (“GAAP”). The Codification supersedes existing non-grandfathered, non-SEC accounting and reporting standards. The Codification did not change GAAP but rather organized it into a hierarchy where all guidance within the Codification carries an equal level of authority. The Codification became effective for financial statements issued for interim and annual periods ending after September 15, 2009. The Codification did not have a material effect on the Funds’ financial statements.
The following is a summary of significant accounting policies followed by the Funds in the preparation of their financial statements in accordance with U.S. generally accepted accounting principles (“U.S. GAAP”).
Investment Valuation
Prices of fixed-income securities and derivative instruments are provided by a pricing service approved by the Funds’ Board of Directors/Trustees. Fixed-income securities are valued by a pricing service that values portfolio securities at the mean between the quoted bid and ask prices or the yield equivalent when quotations are readily available. These securities are generally classified as Level 2. Securities for which quotations are not readily available (which is usually the case for municipal securities) are valued at fair value as determined by the pricing service using methods that may include consideration of the following: yields or prices of investments of comparable quality, type of issue, coupon, maturity and rating, market quotes or indications of value from security dealers, evaluations of anticipated cash flows or collateral, ge neral market conditions and other information and analysis, including the obligor’s credit characteristics considered relevant. The pricing service may employ electronic data processing techniques and/or a matrix system to determine valuations. These securities are generally classified as Level 2.
Futures contracts are valued using the closing settlement price or, in the absence of such a price, at the mean of the bid and ask prices and are generally classified as Level 1.
Temporary investments in securities that have variable rate and demand features qualifying them as short-term investments are valued at amortized cost, which approximates market value. These securities are generally classified as Level 1.
Certain securities may not be able to be priced by the pre-established pricing methods as described above. Such securities may be valued by the Funds’ Board of Directors/Trustees or its designee at fair value. These securities generally include, but are not limited to, restricted securities (securities which may not be publicly sold without registration under the Securities Act) for which a pricing service is unable to provide a market price; securities whose trading has been formally suspended; fixed-income securities that have gone into default and for which there is no current market quotation; a security whose market price is not available from a pre-established pricing source; a security with respect to which an event has occurred that is likely to materially affect the value of the security after the market has closed but before the cal culation of a Fund’s net asset value (as may be the case in non-U.S. markets on which the security is primarily traded) or make it difficult or impossible to obtain a reliable market quotation; and a security whose price, as provided by the pricing service, is not deemed to reflect the security’s fair value. As a general principle, the fair value of an issue of securities would appear to be the amount that the owner might reasonably expect to receive for them in a current sale. A variety of factors may be considered in determining the fair value of these securities, which may include consideration of the following: yields or prices of investments of comparable quality, type of issue, coupon, maturity and rating, market quotes or indications of value from security dealers, evaluations of anticipated cash flows or collateral, general market conditions and other information and analysis, including the obligor’s credit characteristics considered relevant. These
Nuveen Investments 47
Notes to
Financial Statements (continued)
securities are generally classified as Level 2 or Level 3 depending on the priority of the significant inputs. Regardless of the method employed to value a particular security, all valuations are subject to review by the Funds’ Board of Directors/Trustees or its designee.
Refer to Footnote 2 – Fair Value Measurements for further details on the leveling of securities held by the Funds as of the end of the reporting period.
Investment Transactions
Investment transactions are recorded on a trade date basis. Realized gains and losses from transactions are determined on the specific identification method. Investments purchased on a when-issued/delayed delivery basis may have extended settlement periods. Any investments so purchased are subject to market fluctuation during this period. The Funds have instructed the custodian to segregate assets with a current value at least equal to the amount of the when-issued/delayed delivery purchase commitments. At July 31, 2010, Texas Quality Income (NTX) had outstanding when-issued/delayed delivery purchase commitments of $1,010,190. There were no such outstanding purchase commitments in any of the other Funds.
Investment Income
Interest income, which includes the amortization of premiums and accretion of discounts for financial reporting purposes, is recorded on an accrual basis. Investment income also includes paydown gains and losses, if any.
Income Taxes
Each Fund is a separate taxpayer for federal income tax purposes. Each Fund intends to distribute substantially all of its net investment income and net capital gains to shareholders and to otherwise comply with the requirements of Subchapter M of the Internal Revenue Code applicable to regulated investment companies. Therefore, no federal income tax provision is required. Furthermore, each Fund intends to satisfy conditions that will enable interest from municipal securities, which is exempt from regular federal and designated state income taxes, to retain such tax-exempt status when distributed to shareholders of the Funds. Net realized capital gains and ordinary income distributions paid by the Funds are subject to federal taxation.
For all open tax years and all major taxing jurisdictions, management of the Funds has concluded that there are no significant uncertain tax positions that would require recognition in the financial statements. Open tax years are those that are open for examination by taxing authorities (i.e., generally the last four tax year ends and the interim tax period since then). Furthermore, management of the Funds is also not aware of any tax positions for which it is reasonably possible that the total amounts of unrecognized tax benefits will significantly change in the next twelve months.
Dividends and Distributions to Common Shareholders
Dividends from tax-exempt net investment income are declared monthly. Net realized capital gains and/or market discount from investment transactions, if any, are distributed to shareholders at least annually. Furthermore, capital gains are distributed only to the extent they exceed available capital loss carryforwards.
Distributions to Common shareholders of tax-exempt net investment income, net realized capital gains and/or market discount, if any, are recorded on the ex-dividend date. The amount and timing of distributions are determined in accordance with federal income tax regulations, which may differ from U.S. GAAP.
Auction Rate Preferred Shares
The Funds have issued and outstanding Auction Rate Preferred shares (“ARPS”), $25,000 stated value per share, which approximates market value, as a means of effecting financial leverage. Each Fund’s ARPS are issued in one or more Series. The dividend rate paid by the Funds on each Series is determined every seven days, pursuant to a dutch auction process overseen by the auction agent, and is payable at the end of each rate period.
As of July 31, 2010, the number of ARPS outstanding, by Series and in total, for each Fund is as follows:
| | | | | | | | | | | | | | | | |
| | | Arizona | | | Arizona | | | Arizona | | | Arizona | | | Texas | |
| | | Premium | | | Dividend | | | Dividend | | | Dividend | | | Quality | |
| | | Income | | | Advantage | | | Advantage 2 | | | Advantage 3 | | | Income | |
| | | (NAZ) | | | (NFZ) | | | (NKR) | | | (NXE) | | | (NTX) | |
| Number of shares: | | | | | | | | | | | | | | | |
| Series M | | | — | | | | — | | | | — | | | | 736 | | | | 716 | |
| Series T | | | — | | | | 424 | | | | — | | | | — | | | | — | |
| Series W | | | — | | | | — | | | | 665 | | | | — | | | | — | |
| Series TH | | | 1,115 | | | | — | | | | — | | | | — | | | | 1,886 | |
| Total | | | 1,115 | | | | 424 | | | | 665 | | | | 736 | | | | 2,602 | |
Beginning in February 2008, more shares for sale were submitted in the regularly scheduled auctions for the ARPS issued by the Funds than there were offers to buy. This meant that these auctions “failed to clear,’’ and that many ARPS shareholders who wanted to sell their shares in these auctions were unable to do so. ARPS shareholders unable to sell their shares received distributions at the “maximum rate’’ applicable to failed auctions as
calculated in accordance with the pre-established terms of the ARPS. As of July 31, 2010, the aggregate amount of outstanding ARPS redeemed by each Fund is as follows:
| | | | | | |
| | Arizona | Arizona | Arizona | Arizona | Texas |
| | Premium | Dividend | Dividend | Dividend | Quality |
| | Income | Advantage | Advantage 2 | Advantage 3 | Income |
| | (NAZ) | (NFZ) | (NKR) | (NXE) | (NTX) |
| ARPS redeemed, at liquidation value | $2,125,000 | $1,400,000 | $1,875,000 | $3,600,000 | $3,950,000 |
Inverse Floating Rate Securities
Each Fund is authorized to invest in inverse floating rate securities. An inverse floating rate security is created by depositing a municipal bond, typically with a fixed interest rate, into a special purpose trust created by a broker-dealer. In turn, this trust (a) issues floating rate certificates, in face amounts equal to some fraction of the deposited bond’s par amount or market value, that typically pay short-term tax-exempt interest rates to third parties, and (b) issues to a long-term investor (such as one of the Funds) an inverse floating rate certificate (sometimes referred to as an “inverse floater”) that represents all remaining or residual interest in the trust. The income received by the inverse floater holder varies inversely with the short-term rate paid to the floating rate certificates’ holders, and in mo st circumstances the inverse floater holder bears substantially all of the underlying bond’s downside investment risk and also benefits disproportionately from any potential appreciation of the underlying bond’s value. The price of an inverse floating rate security will be more volatile than that of the underlying bond because the interest rate is dependent on not only the fixed coupon rate of the underlying bond but also on the short-term interest paid on the floating rate certificates, and because the inverse floating rate security essentially bears the risk of loss of the greater face value of the underlying bond.
A Fund may purchase an inverse floating rate security in a secondary market transaction without first owning the underlying bond (referred to as an “externally-deposited inverse floater”), or instead by first selling a fixed-rate bond to a broker-dealer for deposit into the special purpose trust and receiving in turn the residual interest in the trust (referred to as a “self-deposited inverse floater”). The inverse floater held by a Fund gives the Fund the right (a) to cause the holders of the floating rate certificates to tender their notes at par, and (b) to have the broker transfer the fixed-rate bond held by the trust to the Fund, thereby collapsing the trust. An investment in an externally-deposited inverse floater is identified in the Portfolio of Investments as “(IF) – Inverse floating rate investment.R 21; An investment in a self-deposited inverse floater is accounted for as a financing transaction. In such instances, a fixed-rate bond deposited into a special purpose trust is identified in the Portfolio of Investments as “(UB) – Underlying bond of an inverse floating rate trust reflected as a financing transaction,” with the Fund accounting for the short-term floating rate certificates issued by the trust as “Floating rate obligations” on the Statement of Assets and Liabilities. In addition, the Fund reflects in “Investment Income” the entire earnings of the underlying bond and recognizes the related interest paid to the holders of the short-term floating rate certificates as “Interest expense on floating rate obligations” on the Statement of Operations.
During the fiscal year ended July 31, 2010, each Fund invested in externally-deposited inverse floaters and/or self-deposited inverse floaters.
Each Fund may also enter into shortfall and forbearance agreements (sometimes referred to as a “recourse trust” or “credit recovery swap”) (such agreements referred to herein as “Recourse Trusts”) with a broker-dealer by which a Fund agrees to reimburse the broker-dealer, in certain circumstances, for the difference between the liquidation value of the fixed-rate bond held by the trust and the liquidation value of the floating rate certificates issued by the trust plus any shortfalls in interest cash flows. Under these agreements, a Fund’s potential exposure to losses related to or on inverse floaters may increase beyond the value of a Fund’s inverse floater investments as a Fund may potentially be liable to fulfill all amounts owed to holders of the floating rate certificates. At period end, any such shortfall is recognized as “Unrealized depreciation on Recourse Trusts” on the Statement of Assets and Liabilities.
| At July 31, 2010, the Funds were not invested in externally-deposited Recourse Trusts. | | | | |
| | Arizona | Arizona | Arizona | Arizona | Texas |
| | Premium | Dividend | Dividend | Dividend | Quality |
| | Income | Advantage | Advantage 2 | Advantage 3 | Income |
| | (NAZ) | (NFZ) | (NKR) | (NXE) | (NTX) |
| Maximum exposure to Recourse Trusts | $ — | $ — | $ — | $ — | $ — |
The average floating rate obligations outstanding and average annual interest rate and fees related to self-deposited inverse floaters during the fiscal year ended July 31, 2010, were as follows:
| | | Texas | |
| | | Quality | |
| | | Income | |
| | | (NTX) | |
| Average floating rate obligations outstanding | | $ | 3,960,000 | |
| Average annual interest rate and fees | | | 0.51 | % |
Nuveen Investments 49
Notes to
Financial Statements (continued)
Futures Contracts
Each Fund is subject to interest rate risk in the normal course of pursuing its investment objectives and is authorized to invest in futures contracts in an attempt to manage such risk. Upon entering into a futures contract, a Fund is required to deposit with the broker an amount of cash or liquid securities equal to a specified percentage of the contract amount. This is known as the “initial margin.” Cash held by the broker to cover initial margin requirements on open futures contracts, if any, is recognized as “Deposits with brokers for open futures contracts” on the Statement of Assets and Liabilities. Subsequent payments (“variation margin”) are made or received by a Fund each day, depending on the daily fluctuation of the value of the contract. Variation margin is recognized as a receivable or payable for “Variation margin on futures contracts” on the Statement of Assets and Liabilities, when applicable.
During the period the futures contract is open, changes in the value of the contract are recorded as an unrealized gain or loss by “marking-to-market” on a daily basis to reflect the changes in market value of the contract and is recognized as “Change in net unrealized appreciation (depreciation) of futures contracts” on the Statement of Operations. When the contract is closed or expired, a Fund records a realized gain or loss equal to the difference between the value of the contract on the closing date and value of the contract when originally entered into and is recognized as “Net realized gain (loss) from futures contracts” on the Statement of Operations.
Risks of investments in futures contracts include the possible adverse movement of the securities or indices underlying the contracts, the possibility that there may not be a liquid secondary market for the contracts and/or that a change in the value of the contract may not correlate with a change in the value of the underlying securities or indices. The Funds did not invest in futures contracts during the fiscal year ended July 31, 2010.
Market and Counterparty Credit Risk
In the normal course of business each Fund may invest in financial instruments and enter into financial transactions where risk of potential loss exists due to changes in the market (market risk) or failure of the other party to the transaction to perform (counterparty credit risk). The potential loss could exceed the value of the financial assets recorded on the financial statements. Financial assets, which potentially expose each Fund to counterparty credit risk, consist principally of cash due from counterparties on forward, option and swap transactions, when applicable. The extent of each Fund’s exposure to counterparty credit risk in respect to these financial assets approximates their carrying value as recorded on the Statement of Assets and Liabilities. Futures contracts, when applicable, expose a Fund to minimal counterparty credit risk as they are exchange traded and the exchange’s clearinghouse, which is counterparty to all exchange traded futures, guarantees the futures contracts against default.
Each Fund helps manage counterparty credit risk by entering into agreements only with counterparties Nuveen Asset Management (the “Adviser”), a wholly-owned subsidiary of Nuveen Investments, Inc. (“Nuveen”), believes have the financial resources to honor their obligations and by having the Adviser monitor the financial stability of the counterparties. Additionally, counterparties may be required to pledge collateral daily (based on the daily valuation of the financial asset) on behalf of each Fund with a value approximately equal to the amount of any unrealized gain above a pre-determined threshold. Reciprocally, when each Fund has an unrealized loss, the Funds have instructed the custodian to pledge assets of the Funds as collateral with a value approximately equal to the amount of the unrealized loss above a pre-determined threshold. Collateral pledges are monitored and subsequently adjusted if and when the valuations fluctuate, either up or down, by at least the predetermined threshold amount.
Zero Coupon Securities
Each Fund is authorized to invest in zero coupon securities. A zero coupon security does not pay a regular interest coupon to its holders during the life of the security. Tax-exempt income to the holder of the security comes from accretion of the difference between the original purchase price of the security at issuance and the par value of the security at maturity and is effectively paid at maturity. The market prices of zero coupon securities generally are more volatile than the market prices of securities that pay interest periodically.
Custodian Fee Credit
Each Fund has an arrangement with the custodian bank whereby certain custodian fees and expenses are reduced by net credits earned on each Fund’s cash on deposit with the bank. Such deposit arrangements are an alternative to overnight investments. Credits for cash balances may be offset by charges for any days on which a Fund overdraws its account at the custodian bank.
Indemnifications
Under the Funds’ organizational documents, their officers and directors/trustees are indemnified against certain liabilities arising out of the performance of their duties to the Funds. In addition, in the normal course of business, the Funds enter into contracts that provide general indemnifications to other parties. The Funds’ maximum exposure under these arrangements is unknown as this would involve future claims that may be made against the Funds that have not yet occurred. However, the Funds have not had prior claims or losses pursuant to these contracts and expect the risk of loss to be remote.
Use of Estimates
The preparation of financial statements in conformity with U.S. GAAP requires management to make estimates and assumptions that affect the reported amounts of assets and liabilities at the date of the financial statements and the reported amounts of increases and decreases in net assets applicable to Common shares from operations during the reporting period. Actual results may differ from those estimates.
2. Fair Value Measurements
In determining the value of each Fund’s investments, various inputs are used. These inputs are summarized in the three broad levels listed below:
Level 1 – Quoted prices in active markets for identical securities.
Level 2 – Other significant observable inputs (including quoted prices for similar securities, interest rates, prepayment speeds, credit risk, etc.).
Level 3 – Significant unobservable inputs (including management’s assumptions in determining the fair value of investments).
The inputs or methodologies used for valuing securities are not an indication of the risk associated with investing in those securities. The following is a summary of each Fund’s fair value measurements as of July 31, 2010:
| Arizona Premium Income (NAZ) | | Level 1 | | | Level 2 | | | Level 3 | | | Total | |
| Investments: | | | | | | | | | | | | |
| Municipal Bonds | | $ | — | | | $ | 85,947,544 | | | $ | 2,055,600 | | | $ | 88,003,144 | |
| Arizona Dividend Advantage (NFZ) | | Level 1 | | | Level 2 | | | Level 3 | | | Total | |
| Investments: | | | | | | | | | | | | | | | | |
| Municipal Bonds | | $ | — | | | $ | 31,750,039 | | | $ | 230,227 | | | $ | 31,980,266 | |
| Arizona Dividend Advantage 2 (NKR) | | Level 1 | | | Level 2 | | | Level 3 | | | Total | |
| Investments: | | | | | | | | | | | | | | | | |
| Municipal Bonds | | $ | — | | | $ | 49,659,173 | | | $ | 929,131 | | | $ | 50,588,304 | |
| Arizona Dividend Advantage 3 (NXE) | | Level 1 | | | Level 2 | | | Level 3 | | | Total | |
| Investments: | | | | | | | | | | | | | | | | |
| Municipal Bonds | | $ | — | | | $ | 59,707,528 | | | $ | 567,346 | | | $ | 60,274,874 | |
| Texas Quality Income (NTX) | | Level 1 | | | Level 2 | | | Level 3 | | | Total | |
| Investments: | | | | | | | | | | | | | | | | |
| Municipal Bonds | | $ | — | | | $ | 208,593,077 | | | $ | — | | | $ | 208,593,077 | |
The following is a reconciliation of each Fund’s Level 3 investments held at the beginning and end of the measurement period:
| | | Arizona | | | Arizona | | | Arizona | | | Arizona | | | Texas | |
| | | Premium | | | Dividend | | | Dividend | | | Dividend | | | Quality | |
| | | Income | | | Advantage | | | Advantage 2 | | | Advantage 3 | | | Income | |
| | | (NAZ) | | | (NFZ) | | | (NKR) | | | (NXE) | | | (NTX) | |
| | | Level 3 | | | Level 3 | | | Level 3 | | | Level 3 | | | Level 3 | |
| | | Municipal | | | Municipal | | | Municipal | | | Municipal | | | Municipal | |
| | | Bonds | | | Bonds | | | Bonds | | | Bonds | | | Bonds | |
| Balance at the beginning of year | | $ | 1,978,300 | | | $ | 221,570 | | | $ | 894,192 | | | $ | 546,011 | | | $ | 950,615 | |
| Gains (losses): | | | | | | | | | | | | | | | | | | | | |
| Net realized gains (losses) | | | — | | | | — | | | | — | | | | — | | | | 180 | |
| Net change in unrealized appreciation (depreciation) | | | 77,300 | | | | 8,657 | | | | 34,939 | | | | 21,335 | | | | 49,205 | |
| Net purchases at cost (sales at proceeds) | | | — | | | | — | | | | — | | | | — | | | | (1,000,000 | ) |
| Net discounts (premiums) | | | — | | | | — | | | | — | | | | — | | | | — | |
| Net transfers in to (out of) at end of period fair value | | | — | | | | — | | | | — | | | | — | | | | — | |
| Balance at the end of year | | $ | 2,055,600 | | | $ | 230,227 | | | $ | 929,131 | | | $ | 567,346 | | | $ | — | |
“Change in net unrealized appreciation (depreciation) of investments” presented on the Statement of Operations includes net appreciation (depreciation) related to securities classified as Level 3 at year end as follows:
| | | Arizona | | | Arizona | | | Arizona | | | Arizona | |
| | | Premium | | | Dividend | | | Dividend | | | Dividend | |
| | | Income | | | Advantage | | | Advantage 2 | | | Advantage 3 | |
| | | (NAZ) | | | (NFZ) | | | (NKR) | | | (NXE) | |
| Level 3 net appreciation (depreciation) | | $ | 77,300 | | | $ | 8,657 | | | $ | 34,939 | | | $ | 21,335 | |
Notes to
Financial Statements (continued)
3. Derivative Instruments and Hedging Activities
The Funds record derivative instruments at fair value with changes in fair value recognized on the Statement of Operations, when applicable. Even though the Funds’ investments in derivatives may represent economic hedges, they are not considered to be hedge transactions for financial reporting purposes. The Funds did not invest in derivative instruments during the fiscal year ended July 31, 2010.
4. Fund Shares
Common Shares
Transactions in Common shares were as follows:
| | | | | | | | | | | | | | | | | | | |
| | | Arizona Premium | | | Arizona Dividend | | | Arizona Dividend | |
| | | Income (NAZ) | | | Advantage (NFZ) | | | Advantage 2 (NKR) | |
| | | Year | | | Year | | | Year | | | Year | | | Year | | | Year | |
| | | Ended | | | Ended | | | Ended | | | Ended | | | Ended | | | Ended | |
| | | 7/31/10 | | | 7/31/09 | | | 7/31/10 | | | 7/31/09 | | | 7/31/10 | | | 7/31/09 | |
| Common shares: | | | | | | | | | | | | | | | | | | |
| Issued to shareholders due to | | | | | | | | | | | | | | | | | | |
| reinvestment of distributions | | | 798 | | | | 944 | | | | — | | | | 581 | | | | — | | | | 1,193 | |
| Repurchased and retired | | | — | | | | — | | | | — | | | | (2,500 | ) | | | — | | | | (800 | ) |
| Weighted average Common share: | | | | | | | | | | | | | | | | | | | | | | | | |
| Price per share repurchased and retired | | | — | | | | — | | | | — | | | $ | 9.60 | | | | — | | | $ | 10.35 | |
| Discount per share repurchased and retired | | | — | | | | — | | | | — | | | | 19.20 | % | | | — | | | | 17.60 | % |
| | | | | | | | | | | | | | | |
| | | | | | | | | | | Arizona Dividend | | | Texas Quality | |
| | | | | | | | | | | Advantage 3 (NXE) | | | Income (NTX) | |
| | | | | | | | | | | Year | | | Year | | | Year | | | Year | |
| | | | | | | | | | | Ended | | | Ended | | | Ended | | | Ended | |
| | | | | | | | | | | 7/31/10 | | | 7/31/09 | | | 7/31/10 | | | 7/31/09 | |
| Common shares: | | | | | | | | | | | | | | | | | | | | | | | | |
| Issued to shareholders due to | | | | | | | | | | | | | | | | | | | | | | | | |
| reinvestment of distributions | | | | | | | | | | | — | | | | — | | | | 29,688 | | | | 5,052 | |
| Repurchased and retired | | | | | | | | | | | — | | | | (1,600 | ) | | | — | | | | — | |
| Weighted average Common share: | | | | | | | | | | | | | | | | | | | | | | | | |
| Price per share repurchased and retired | | | | | | | | | | | — | | | $ | 9.59 | | | | — | | | | — | |
| Discount per share repurchased and retired | | | | | | | | | | | — | | | | 18.61 | % | | | — | | | | — | |
Auction Rate Preferred Shares
Transactions in ARPS were as follows:
| | | | | | | | | | | | |
| | Arizona Premium Income (NAZ) | Arizona Dividend Advantage (NFZ) |
| | Year | Year | Year | Year |
| | Ended | Ended | Ended | Ended |
| | 7/31/10 | 7/31/09 | 7/31/10 | 7/31/09 |
| | Shares | | Amount | Shares | Amount | Shares | | Amount | Shares | Amount |
| ARPS redeemed: | | | | | | | | | | |
| Series T | — | | $ — | — | $ — | — | | $ — | 56 | $1,400,000 |
| Series TH | — | | — | 85 | 2,125,000 | — | | — | — | — |
| Total | — | | $ — | 85 | $2,125,000 | — | | $ — | 56 | $1,400,000 |
| | Arizona Dividend Advantage 2 (NKR) | Arizona Dividend Advantage 3 (NXE) |
| | Year | Year | Year | Year |
| | Ended | Ended | Ended | Ended |
| | 7/31/10 | 7/31/09 | 7/31/10 | 7/31/09 |
| | Shares | | Amount | Shares | Amount | Shares | | Amount | Shares | Amount |
| ARPS redeemed: | | | | | | | | | | |
| Series M | — | | $ — | — | $ — | — | | $ — | 144 | $3,600,000 |
| Series W | — | | — | 75 | 1,875,000 | — | | — | — | — |
| Total | — | | $ — | 75 | $1,875,000 | — | | $ — | 144 | $3,600,000 |
| | | | | | | | | | | | | |
| | | Texas Quality | |
| | | Income (NTX) | |
| | | Year | | | Year | |
| | | Ended | | | Ended | |
| | | 7/31/10 | | | 7/31/09 | |
| | | Shares | | | Amount | | | Shares | | | Amount | |
| ARPS redeemed: | | | | | | | | | | | | |
| Series M | | — | | | | $ | — | | | 44 | | | | $ | 1,100,000 | |
| Series TH | | — | | | | | — | | | 114 | | | | | 2,850,000 | |
| Total | | — | | | | $ | — | | | 158 | | | | $ | 3,950,000 | |
5. Investment Transactions
Purchases and sales (including maturities but excluding short-term investments) during the fiscal year ended July 31, 2010, were as follows:
| | | | | | | | | | | | | | | | |
| | | Arizona | | | Arizona | | | Arizona | | | Arizona | | | Texas | |
| | | Premium | | | Dividend | | | Dividend | | | Dividend | | | Quality | |
| | | Income | | | Advantage | | | Advantage 2 | | | Advantage 3 | | | Income | |
| | | (NAZ) | | | (NFZ) | | | (NKR) | | | (NXE) | | | (NTX) | |
| Purchases | | $ | 6,733,065 | | | $ | 2,890,432 | | | $ | 2,809,996 | | | $ | 2,935,127 | | | $ | 14,387,590 | |
| Sales and maturities | | | 7,788,316 | | | | 958,770 | | | | 2,004,345 | | | | 2,870,118 | | | | 11,560,150 | |
6. Income Tax Information
The following information is presented on an income tax basis. Differences between amounts for financial statement and federal income tax purposes are primarily due to timing differences in recognizing taxable market discount, timing differences in recognizing certain gains and losses on investment transactions and the treatment of investments in inverse floating rate securities reflected as financing transactions, if any. To the extent that differences arise that are permanent in nature, such amounts are reclassified within the capital accounts as detailed below. Temporary differences do not require reclassification. Temporary and permanent differences do not impact the net asset values of the Funds.
At July 31, 2010, the cost and unrealized appreciation (depreciation) of investments, as determined on a federal income tax basis, were as follows:
| | | | | | | | | | | | | | | | |
| | | Arizona | | | Arizona | | | Arizona | | | Arizona | | | Texas | |
| | | Premium | | | Dividend | | | Dividend | | | Dividend | | | Quality | |
| | | Income | | | Advantage | | | Advantage 2 | | | Advantage 3 | | | Income | |
| | | (NAZ) | | | (NFZ) | | | (NKR) | | | (NXE) | | | (NTX) | |
| Cost of investments | | $ | 85,702,926 | | | $ | 31,409,851 | | | $ | 49,209,102 | | | $ | 59,455,322 | | | $ | 198,810,417 | |
| Gross unrealized: | | | | | | | | | | | | | | | | | | | | |
| Appreciation | | $ | 5,456,904 | | | $ | 1,433,280 | | | $ | 2,414,652 | | | $ | 2,044,210 | | | $ | 10,078,209 | |
| Depreciation | | | (3,156,686 | ) | | | (862,865 | ) | | | (1,035,450 | ) | | | (1,224,658 | ) | | | (4,255,687 | ) |
| Net unrealized appreciation (depreciation) of investments | | $ | 2,300,218 | | | $ | 570,415 | | | $ | 1,379,202 | | | $ | 819,552 | | | $ | 5,822,522 | |
Nuveen Investments 53
Notes to
Financial Statements (continued)
Permanent differences, primarily due to federal taxes paid, taxable market discount and distribution character reclassifications, resulted in reclassifications among the Funds’ components of Common share net assets at July 31, 2010, the Funds’ tax year end, as follows:
| | | | | | | | | | | | | | | | |
| | | Arizona | | | Arizona | | | Arizona | | | Arizona | | | Texas | |
| | | Premium | | | Dividend | | | Dividend | | | Dividend | | | Quality | |
| | | Income | | | Advantage | | | Advantage 2 | | | Advantage 3 | | | Income | |
| | | (NAZ) | | | (NFZ) | | | (NKR) | | | (NXE) | | | (NTX) | |
| Paid-in-surplus | | $ | — | | | $ | 9 | | | $ | — | | | $ | — | | | $ | 2,818 | |
| Undistributed (Over-distribution of) net investment income | | | (34,996 | ) | | | (11 | ) | | | (332 | ) | | | (1,930 | ) | | | (746 | ) |
| Accumulated net realized gain (loss) | | | 34,996 | | | | 2 | | | | 332 | | | | 1,930 | | | | (2,072 | ) |
The tax components of undistributed net tax-exempt income, net ordinary income and net long-term capital gains at July 31, 2010, the Funds’ tax year end, were as follows:
| | | | | | | | | | | | | | | | |
| | | Arizona | | | Arizona | | | Arizona | | | Arizona | | | Texas | |
| | | Premium | | | Dividend | | | Dividend | | | Dividend | | | Quality | |
| | | Income | | | Advantage | | | Advantage 2 | | | Advantage 3 | | | Income | |
| | | (NAZ) | | | (NFZ) | | | (NKR) | | | (NXE) | | | (NTX) | |
| Undistributed net tax-exempt income * | | $ | 1,160,094 | | | $ | 363,711 | | | $ | 572,754 | | | $ | 660,087 | | | $ | 2,646,053 | |
| Undistributed net ordinary income ** | | | — | | | | — | | | | — | | | | — | | | | — | |
| Undistributed net long-term capital gains | | | — | | | | — | | | | — | | | | — | | | | 64,495 | |
| * | Undistributed net tax-exempt income (on a tax basis) has not been reduced for the dividend declared on July 1, 2010, paid on August 2, 2010. |
| ** | Net ordinary income consists of taxable market discount income and net short-term capital gains, if any. |
The tax character of distributions paid during the Funds’ tax years ended July 31, 2010 and July 31, 2009, was designated for purposes of the dividends paid deduction as follows:
| | | | | | | | | | | | | | | | |
| | | Arizona | | | Arizona | | | Arizona | | | Arizona | | | Texas | |
| | | Premium | | | Dividend | | | Dividend | | | Dividend | | | Quality | |
| | | Income | | | Advantage | | | Advantage 2 | | | Advantage 3 | | | Income | |
| 2010 | | (NAZ) | | | (NFZ) | | | (NKR) | | | (NXE) | | | (NTX) | |
| Distributions from net tax-exempt income*** | | $ | 3,223,648 | | | $ | 1,096,403 | | | $ | 1,905,599 | | | $ | 2,287,520 | | | $ | 7,910,812 | |
| Distributions from net ordinary income** | | | — | | | | — | | | | — | | | | — | | | | — | |
| Distributions from net long-term capital gains**** | | | — | | | | — | | | | — | | | | — | | | | 134,057 | |
| | | | | | | | | | | | | | | | |
| | | Arizona | | | Arizona | | | Arizona | | | Arizona | | | Texas | |
| | | Premium | | | Dividend | | | Dividend | | | Dividend | | | Quality | |
| | | Income | | | Advantage | | | Advantage 2 | | | Advantage 3 | | | Income | |
| 2009 | | (NAZ) | | | (NFZ) | | | (NKR) | | | (NXE) | | | (NTX) | |
| Distributions from net tax-exempt income | | $ | 3,419,031 | | | $ | 1,198,865 | | | $ | 2,063,963 | | | $ | 2,423,629 | | | $ | 7,900,976 | |
| Distributions from net ordinary income** | | | — | | | | — | | | | — | | | | — | | | | 378,151 | |
| Distributions from net long-term capital gains | | | — | | | | — | | | | — | | | | — | | | | 268,060 | |
| ** | Net ordinary income consists of taxable market discount income and net short-term capital gains, if any. |
| *** | The Funds hereby designate these amounts paid during the fiscal year ended July 31, 2010, as Exempt Interest Dividends. |
| **** | The Funds designate as a long term capital gain dividend, pursuant to the Internal Revenue Code Section 852(b)(3), the amount necessary to reduce earnings and profits of the Funds related to net capital gain to zero for the tax year ended July 31, 2010. |
At July 31, 2010, the Funds’ tax year end, the following Funds had unused capital loss carryforwards available for federal income tax purposes to be applied against future capital gains, if any. If not applied, the carryforwards will expire as follows:
| | | | | | | | | | | | | |
| | | Arizona | | | Arizona | | | Arizona | | | Arizona | |
| | | Premium | | | Dividend | | | Dividend | | | Dividend | |
| | | Income | | | Advantage | | | Advantage 2 | | | Advantage 3 | |
| | | (NAZ) | | | (NFZ) | | | (NKR) | | | (NXE) | |
| Expiration: | | | | | | | | | | | | |
| July 31, 2011 | | $ | 359,724 | | | $ | — | | | $ | — | | | $ | — | |
| July 31, 2012 | | | 1,553,627 | | | | — | | | | — | | | | 158,487 | |
| July 31, 2013 | | | — | | | | — | | | | — | | | | 160,902 | |
| July 31, 2014 | | | — | | | | — | | | | — | | | | 218,127 | |
| July 31, 2016 | | | 562,384 | | | | 246,571 | | | | 212,903 | | | | 363,937 | |
| July 31, 2017 | | | 323,876 | | | | 210,308 | | | | 220,271 | | | | 258,905 | |
| July 31, 2018 | | | 43,720 | | | | 318,004 | | | | 223,857 | | | | 108,356 | |
| Total | | $ | 2,843,331 | | | $ | 774,883 | | | $ | 657,031 | | | $ | 1,268,714 | |
7. Management Fees and Other Transactions with Affiliates
Each Fund’s management fee is separated into two components – a fund-level fee, based only on the amount of assets within each individual Fund, and a complex-level fee, based on the aggregate amount of all fund assets managed by the Adviser. This pricing structure enables each Fund’s shareholders to benefit from growth in the assets within their respective Fund as well as from growth in the amount of complex-wide assets managed by the Adviser.
The annual fund-level fee for each Fund, payable monthly, is calculated according to the following schedule:
| | |
| | Arizona Premium Income (NAZ) |
| | Texas Quality Income (NTX) |
| Average Daily Net Assets* | Fund-Level Fee Rate |
| For the first $125 million | .4500% |
| For the next $125 million | .4375 |
| For the next $250 million | .4250 |
| For the next $500 million | .4125 |
| For the next $1 billion | .4000 |
| For the next $3 billion | .3875 |
| For net assets over $5 billion | .3750 |
| | |
| | Arizona Dividend Advantage (NFZ) |
| | Arizona Dividend Advantage 2 (NKR) |
| | Arizona Dividend Advantage 3 (NXE) |
| Average Daily Net Assets* | Fund-Level Fee Rate |
| For the first $125 million | .4500% |
| For the next $125 million | .4375 |
| For the next $250 million | .4250 |
| For the next $500 million | .4125 |
| For the next $1 billion | .4000 |
| For net assets over $2 billion | .3750 |
Nuveen Investments 55
Notes to
Financial Statements (continued)
The annual complex-level fee for each Fund, payable monthly, is calculated according to the following schedule:
| Complex-Level Managed Asset Breakpoint Level* | Effective Rate at Breakpoint Level |
| $55 billion | .2000% |
| $56 billion | .1996 |
| $57 billion | .1989 |
| $60 billion | .1961 |
| $63 billion | .1931 |
| $66 billion | .1900 |
| $71 billion | .1851 |
| $76 billion | .1806 |
| $80 billion | .1773 |
| $91 billion | .1691 |
| $125 billion | .1599 |
| $200 billion | .1505 |
| $250 billion | .1469 |
| $300 billion | .1445 |
| * | The complex-level fee is calculated based upon the aggregate daily managed assets of all Nuveen funds, with such daily managed assets defined separately for each fund in its management agreement, but excluding assets attributable to investments in other Nuveen funds. For the complex-level and fund-level fees, daily net assets and managed assets include closed-end fund assets managed by the Adviser that are attributable to financial leverage. For these purposes, financial leverage includes the funds’ use of preferred stock and borrowings and certain investments in the residual interest certificates (also called inverse floating rate securities) in tender option bond (TOB) trusts, including the portion of assets held by a TOB trust that has been effectively financed by the trust’s issuance of floating rate securities, subject to an agreem ent by the Adviser to limit the amount of such assets for determining managed assets in certain circumstances. As of July 31, 2010, the complex-level fee rate was 1844%. |
The management fee compensates the Adviser for overall investment advisory and administrative services and general office facilities. The Funds pay no compensation directly to those of its directors/trustees who are affiliated with the Adviser or to its officers, all of whom receive remuneration for their services to the Funds from the Adviser or its affiliates. The Board of Directors/Trustees has adopted a deferred compensation plan for independent directors/trustees that enables directors/trustees to elect to defer receipt of all or a portion of the annual compensation they are entitled to receive from certain Nuveen advised funds. Under the plan, deferred amounts are treated as though equal dollar amounts had been invested in shares of select Nuveen advised funds.
For the first ten years of Arizona Dividend Advantage’s (NFZ) operations, the Adviser has agreed to reimburse the Fund, as a percentage of average daily net assets, for fees and expenses in the amounts and for the time periods set forth below:
| Year Ending | | Year Ending | |
| January 31, | | January 31, | |
| 2001* | .30% | 2007 | .25% |
| 2002 | .30 | 2008 | .20 |
| 2003 | .30 | 2009 | .15 |
| 2004 | .30 | 2010 | .10 |
| 2005 | .30 | 2011 | .05 |
| 2006 | .30 | | |
* From the commencement of operations.
The Adviser has not agreed to reimburse Arizona Dividend Advantage (NFZ) for any portion of its fees and expenses beyond January 31, 2011.
For the first ten years of Arizona Dividend Advantage 2’s (NKR) operations, the Adviser has agreed to reimburse the Fund, as a percentage of average daily net assets, for fees and expenses in the amounts and for the time periods set forth below:
| | | | |
| Year Ending | | Year Ending | |
| March 31, | | March 31, | |
| 2002* | .30% | 2008 | .25% |
| 2003 | .30 | 2009 | .20 |
| 2004 | .30 | 2010 | .15 |
| 2005 | .30 | 2011 | .10 |
| 2006 | .30 | 2012 | .05 |
| 2007 | .30 | | |
* From the commencement of operations.
The Adviser has not agreed to reimburse Arizona Dividend Advantage 2 (NKR) for any portion of its fees and expenses beyond March 31, 2012.
For the first eight years of Arizona Dividend Advantage 3’s (NXE) operations, the Adviser has agreed to reimburse the Fund, as a percentage of average daily net assets, for fees and expenses in the amounts and for the time periods set forth below:
| | | | |
| Year Ending | | Year Ending | |
| September 30, | | September 30, | |
| 2002* | .32% | 2007 | .32% |
| 2003 | .32 | 2008 | .24 |
| 2004 | .32 | 2009 | .16 |
| 2005 | .32 | 2010 | .08 |
| 2006 | .32 | | |
* From the commencement of operations.
The Adviser has not agreed to reimburse Arizona Dividend Advantage 3 (NXE) for any portion of its fees and expenses beyond September 30, 2010.
8. New Accounting Pronouncements
Fair Value Measurements
On January 21, 2010, FASB issued changes to the authoritative guidance under U.S. GAAP for fair value measurements. The objective of which is to provide guidance on how investment assets and liabilities are to be valued and disclosed. Specifically, the amendment requires reporting entities disclose Level 3 activity for purchases, sales, issuances and settlements in the Level 3 roll-forward on a gross basis rather than as one net number. The effective date of the amendment is for interim and annual periods beginning after December 15, 2010. At this time, management is evaluating the implications of this guidance and the impact it will have to the financial statement amounts and footnote disclosures, if any.
9. Subsequent Events
Other Matters
On September 21, 2010, lawsuits pursuing claims made in the demand letter alleging that Arizona Dividend Advantage 3’s (NXE) Board of Trustees breached their fiduciary duties related to the redemption at par of its ARPS had been filed on behalf of shareholders of Arizona Dividend Advantage 3 (NXE), against the Adviser, the Nuveen holding company, the majority owner of the holding company, the lone interested trustee, and current and former officers of Arizona Dividend Advantage 3 (NXE). Nuveen and the other named defendants believe these lawsuits to be without merit, and all named parties intend to defend themselves vigorously. Arizona Dividend Advantage 3 (NXE) believes that these lawsuits will not have a material effect on it or on the Adviser’s ability to serve as investment adviser to it.
Nuveen Investments 57
Financial
Highlights
Selected data for a Common share outstanding throughout each period:
| | Investment Operations | |
| | | | | | | | | Distributions | | Distributions | | | |
| | | | | | | | | from Net | | from | | | |
| | | | | | | | | Investment | | Capital | | | |
| | Beginning | | | | | | | Income to | | Gains to | | |
| | Common | | | | Net | | | Auction Rate | | Auction Rate | | | |
| | Share | | Net | | Realized/ | | | Preferred | | Preferred | | | |
| | Net Asset | | Investment | | Unrealized | | | Share- | | Share- | | | |
| | Value | | Income | | Gain (Loss) | | | holders(a) | | holders(a) | | Total | |
Arizona Premium Income (NAZ) | | | | | | | | | | | | |
| Year Ended 7/31: | | | | | | | | | | | | | |
| 2010 | $ | 12.92 | | $ | .84 | | $ | .96 | | | $ | (.03 | ) | $ | — | | $ | 1.77 | |
| 2009 | | 13.00 | | | .85 | | | (.16 | ) | | | (.13 | ) | | — | | | .56 | |
| 2008 | | 14.00 | | | .88 | | | (1.05 | ) | | | (.22 | ) | | — | | | (.39 | ) |
| 2007 | | 14.10 | | | .83 | | | (.10 | ) | | | (.22 | ) | | — | | | .51 | |
| 2006 | | 14.53 | | | .83 | | | (.39 | ) | | | (.18 | ) | | — | | | .26 | |
Arizona Dividend Advantage (NFZ) | | | | | | | | | | | | | | | | | |
| Year Ended 7/31: | | | | | | | | | | | | | | | | | | | |
| 2010 | | 12.66 | | | .85 | | | 1.41 | | | | (.03 | ) | | — | | | 2.23 | |
| 2009 | | 13.26 | | | .84 | | | (.67 | ) | | | (.14 | ) | | — | | | .03 | |
| 2008 | | 14.48 | | | .91 | | | (1.23 | ) | | | (.25 | ) | | — | * | | (.57 | ) |
| 2007 | | 14.77 | | | .91 | | | (.17 | ) | | | (.24 | ) | | (.02 | ) | | .48 | |
| 2006 | | 15.37 | | | .93 | | | (.40 | ) | | | (.20 | ) | | (.01 | ) | | .32 | |
| | Less Distributions | | | | | | | |
| | | | | | | | | Discount | | | | | | | |
| | | | | | | | | from | | | | | | | |
| | Net | | | | | | | Common | | | Ending | | | | |
| | Investment | | Capital | | | | | Shares | | | | | | | |
| | Income to | | Gains to | | | | | Repur- | | | | | | | |
| | Common | | Common | | | | | chased | | | Net | | | Ending | |
| | Share- | | Share- | | | | | and | | | Asset | | | Market | |
| | holders | | holders | | Total | | | Retired | | | Value | | | Value | |
Arizona Premium Income (NAZ) | | | | | | | | | | | | | | | |
| Year Ended 7/31: | | | | | | | | | | | | | | | |
| 2010 | $ | (.70 | ) | $ | — | | $ | (.70 | ) | | $ | — | | | $ | 13.99 | | | $ | 13.34 | |
| 2009 | | (.64 | ) | | — | | | (.64 | ) | | | — | | | | 12.92 | | | | 12.29 | |
| 2008 | | (.61 | ) | | — | | | (.61 | ) | | | — | | | | 13.00 | | | | 13.35 | |
| 2007 | | (.61 | ) | | — | | | (.61 | ) | | | — | | | | 14.00 | | | | 13.07 | |
| 2006 | | (.69 | ) | | — | | | (.69 | ) | | | — | | | | 14.10 | | | | 13.69 | |
Arizona Dividend Advantage (NFZ) | | | | | | | | | | | | | | | | | | | | | |
| Year Ended 7/31: | | | | | | | | | | | | | | | | | | | | | |
| 2010 | | (.69 | ) | | — | | | (.69 | ) | | | — | | | | 14.20 | | | | 14.19 | |
| 2009 | | (.63 | ) | | — | | | (.63 | ) | | | — | * | | | 12.66 | | | | 12.14 | |
| 2008 | | (.64 | ) | | (.01 | ) | | (.65 | ) | | | — | | | | 13.26 | | | | 13.70 | |
| 2007 | | (.71 | ) | | (.06 | ) | | (.77 | ) | | | — | | | | 14.48 | | | | 13.35 | |
| 2006 | | (.84 | ) | | (.08 | ) | | (.92 | ) | | | — | | | | 14.77 | | | | 15.90 | |
| | | | | | | | | | |
| | | Auction Rate Preferred Shares at End of Period | |
| | | Aggregate | | | | | | | |
| | | Amount | | | Liquidation | | | Asset | |
| | | Outstanding | | | Value | | | Coverage | |
| | | | (000 | ) | | Per Share | | | Per Share | |
| Arizona Premium Income (NAZ) | | | | | | | |
| Year Ended 7/31: | | | | | | | | | | |
| 2010 | | $ | 27,875 | | | $ | 25,000 | | | $ | 81,097 | |
| 2009 | | | 27,875 | | | | 25,000 | | | | 76,798 | |
| 2008 | | | 30,000 | | | | 25,000 | | | | 73,414 | |
| 2007 | | | 30,000 | | | | 25,000 | | | | 77,111 | |
| 2006 | | | 30,000 | | | | 25,000 | | | | 77,520 | |
| Arizona Dividend Advantage (NFZ) | | | | | | | | | |
| Year Ended 7/31: | | | | | | | | | | | | |
| 2010 | | | 10,600 | | | | 25,000 | | | | 76,850 | |
| 2009 | | | 10,600 | | | | 25,000 | | | | 71,238 | |
| 2008 | | | 12,000 | | | | 25,000 | | | | 67,817 | |
| 2007 | | | 12,000 | | | | 25,000 | | | | 71,748 | |
| 2006 | | | 12,000 | | | | 25,000 | | | | 72,628 | |
| | | | | | | | | | | | | | | | | | | | | | | | | | | | | |
| | | | | | | Ratios/Supplemental Data |
| | | | | | | | | | Ratios to Average Net Assets | | | Ratios to Average Net Assets | | | | |
| | | | | | | | | | Applicable to Common Shares | | | Applicable to Common Shares | | | | |
| Total Returns | | | | | | Before Reimbursement(c) | | | After Reimbursement(c)(d) | | | | |
| | | | Based | | | Ending | | | | | | | | | | | | | | | | | | | | | | |
| | | | on | | | Net | | | | | | | | | | | | | | | | | | | | | | |
| Based | | | Common | | | Assets | | | | | | | | | | | | | | | | | | | | | | |
| on | | | Share Net | | | Applicable | | | Expenses | | | Expenses | | | Net | | | Expenses | | | Expenses | | | Net | | | Portfolio | |
| Market | | | Asset | | | to Common | | | Including | | | Excluding | | | Investment | | | Including | | | Excluding | | | Investment | | | Turnover | |
Value(b) | | | Value(b) | | | Shares (000) | | | Interest(e) | | | Interest | | | Income | | | Interest(e) | | | Interest | | | Income | | | Rate | |
| | 14.47 | % | | | 13.94 | % | | $ | 62,549 | | | | 1.21 | % | | | 1.21 | % | | | 6.13 | % | | | N/A | | | | N/A | | | | N/A | | | | 8 | % |
| | (2.61 | ) | | | 4.73 | | | | 57,755 | | | | 1.33 | | | | 1.33 | | | | 7.01 | | | | N/A | | | | N/A | | | | N/A | | | | 25 | |
| | 7.10 | | | | (2.87 | ) | | | 58,097 | | | | 1.40 | | | | 1.26 | | | | 6.42 | | | | N/A | | | | N/A | | | | N/A | | | | 21 | |
| | (.22 | ) | | | 3.62 | | | | 62,534 | | | | 1.32 | | | | 1.24 | | | | 5.81 | | | | N/A | | | | N/A | | | | N/A | | | | 13 | |
| | (5.62 | ) | | | 1.84 | | | | 63,024 | | | | 1.21 | | | | 1.21 | | | | 5.83 | | | | N/A | | | | N/A | | | | N/A | | | | 22 | |
| | 23.34 | | | | 17.93 | | | | 21,984 | | | | 1.35 | | | | 1.35 | | | | 6.12 | | | | 1.23 | % | | | 1.23 | % | | | 6.23 | % | | | 3 | |
| | (6.12 | ) | | | .58 | | | | 19,605 | | | | 1.51 | | | | 1.51 | | | | 6.70 | | | | 1.30 | | | | 1.30 | | | | 6.91 | | | | 6 | |
| | 7.72 | | | | (4.09 | ) | | | 20,552 | | | | 1.58 | | | | 1.44 | | | | 6.14 | | | | 1.31 | | | | 1.16 | | | | 6.42 | | | | 10 | |
| | (11.63 | ) | | | 3.24 | | | | 22,439 | | | | 1.48 | | | | 1.38 | | | | 5.74 | | | | 1.14 | | | | 1.04 | | | | 6.08 | | | | 19 | |
| | 4.54 | | | | 2.14 | | | | 22,862 | | | | 1.36 | | | | 1.36 | | | | 5.79 | | | | .94 | | | | .94 | | | | 6.21 | | | | 24 | |
| | |
| (a) | The amounts shown are based on Common share equivalents. |
| (b) | Total Return Based on Market Value is the combination of changes in the market price per share and the effect of reinvested dividend income and reinvested capital gains |
| | distributions, if any, at the average price paid per share at the time of reinvestment. The last dividend declared in the period, which is typically paid on the first business day |
| | of the following month, is assumed to be reinvested at the ending market price. The actual reinvestment for the last dividend declared in the period may take place over |
| | several days, and in some instances may not be based on the market price, so the actual reinvestment price may be different from the price used in the calculation. Total |
| | returns are not annualized. |
| | Total Return Based on Common Share Net Asset Value is the combination of changes in Common share net asset value, reinvested dividend income at net asset value and |
| | reinvested capital gains distributions at net asset value, if any. The last dividend declared in the period, which is typically paid on the first business day of the following |
| | month, is assumed to be reinvested at the ending net asset value. The actual reinvest price for the last dividend declared in the period may often be based on the Fund’s |
| | market price (and not its net asset value), and therefore may be different from the price used in the calculation. Total returns are not annualized. |
| (c) | Ratios do not reflect the effect of dividend payments to Auction Rate Preferred shareholders; Net Investment Income ratios reflect income earned and expenses incurred on |
| | assets attributable to Auction Rate Preferred shares. |
| (d) | After expense reimbursement from the Adviser, where applicable. Ratios do not reflect the effect of custodian fee credits earned on the Fund’s net cash on deposit with the |
| | custodian bank, where applicable. |
| (e) | The expense ratios reflect, among other things, the interest expense deemed to have been paid by the Fund on the floating rate certificates issued by the special purpose |
| | trusts for the self-deposited inverse floaters held by the Fund, where applicable, as described in Footnote 1 – General Information and Significant Accounting Policies, |
| | Inverse Floating Rate Securities. |
| * | Rounds to less than $.01 per share. |
| N/A | Fund does not have a contractual reimbursement agreement with the Adviser. |
See accompanying notes to financial statements.
Nuveen Investments 59
Financial
Highlights (continued)
Selected data for a Common share outstanding throughout each period:
| | | | | | | | | | | | | | | | | | | | | |
| | | | | | | | | Investment Operations | | | |
| | | | | | | | | | | | Distributions | | | Distributions | | | | | | |
| | | | | | | | | | | | from Net | | | from | | | | | | |
| | | | | | | | | | | | Investment | | | Capital | | | | | | |
| | | Beginning | | | | | | | | | Income to | | | Gains to | | | | |
| | | Common | | | | | | Net | | | Auction Rate | | | Auction Rate | | | | | | |
| | | Share | | | Net | | | Realized/ | | | Preferred | | | Preferred | | | | | | |
| | | Net Asset | | | Investment | | | Unrealized | | | Share- | | | Share- | | | | | | |
| | | Value | | | Income | | | Gain (Loss) | | | holders(a) | | | holders(a) | | | Total | | | |
| Arizona Dividend Advantage 2 (NKR) | | | | | | | | | | | | | | | |
| Year Ended 7/31: | | | | | | | | | | | | | | | | | | | | |
| 2010 | | $ | 13.46 | | | $ | .90 | | | $ | 1.08 | | | $ | (.03 | ) | | $ | — | | | $ | 1.95 | | | |
| 2009 | | | 13.66 | | | | .93 | | | | (.29 | ) | | | (.14 | ) | | | — | | | | .50 | | | |
| 2008 | | | 14.76 | | | | .96 | | | | (1.03 | ) | | | (.24 | ) | | | (.02 | ) | | | (.33 | ) | | |
| 2007 | | | 15.00 | | | | .97 | | | | (.18 | ) | | | (.24 | ) | | | (.01 | ) | | | .54 | | | |
| 2006 | | | 15.56 | | | | .96 | | | | (.37 | ) | | | (.20 | ) | | | (.01 | ) | | | .38 | | | |
| Arizona Dividend Advantage 3 (NXE) | | | | | | | | | | | | | | | | | | | |
| Year Ended 7/31: | | | | | | | | | | | | | | | | | | | | | | | | | | |
| 2010 | | | 12.76 | | | | .86 | | | | 1.26 | | | | (.03 | ) | | | — | | | | 2.09 | | | |
| 2009 | | | 13.07 | | | | .88 | | | | (.41 | ) | | | (.13 | ) | | | — | | | | .34 | | | |
| 2008 | | | 14.20 | | | | .91 | | | | (1.15 | ) | | | (.24 | ) | | | — | | | | (.48 | ) | | |
| 2007 | | | 14.32 | | | | .90 | | | | (.10 | ) | | | (.25 | ) | | | — | | | | .55 | | | |
| 2006 | | | 14.62 | | | | .88 | | | | (.26 | ) | | | (.19 | ) | | | — | | | | .43 | | | |
| | | | | | | | | | | | | | | | | | | |
| | | Less Distributions | | | | | | | |
| | | | | | | | | | | | Discount | | | | | | | |
| | | | | | | | | | | | from | | | | | | | |
| | | Net | | | | | | | | | Common | | | | | | | |
| | | Investment | | | Capital | | | | | | Shares | | | Ending | | | | |
| | | Income to | | | Gains to | | | | | | Repur- | | | Common | | | | |
| | | Common | | | Common | | | | | | chased | | | Share | | | Ending | |
| | | Share- | | | Share- | | | | | | and | | | Net Asset | | | Market | |
| | | holders | | | holders | | | Total | | | Retired | | | Value | | | Value | |
| Arizona Dividend Advantage 2 (NKR) | | | | | | | | | | | | | | | | | |
| Year Ended 7/31: | | | | | | | | | | | | | | | | | | |
| 2010 | | $ | (.76 | ) | | $ | — | | | $ | (.76 | ) | | $ | — | | | $ | 14.65 | | | $ | 13.92 | |
| 2009 | | | (.70 | ) | | | — | | | | (.70 | ) | | | — | * | | | 13.46 | | | | 12.52 | |
| 2008 | | | (.71 | ) | | | (.06 | ) | | | (.77 | ) | | | — | | | | 13.66 | | | | 14.00 | |
| 2007 | | | (.74 | ) | | | (.04 | ) | | | (.78 | ) | | | — | | | | 14.76 | | | | 15.27 | |
| 2006 | | | (.83 | ) | | | (.11 | ) | | | (.94 | ) | | | — | | | | 15.00 | | | | 15.37 | |
| Arizona Dividend Advantage 3 (NXE) | | | | | | | | | | | | | | | | | | | | | | | |
| Year Ended 7/31: | | | | | | | | | | | | | | | | | | | | | | | | |
| 2010 | | | (.73 | ) | | | — | | | | (.73 | ) | | | — | | | | 14.12 | | | | 13.14 | |
| 2009 | | | (.65 | ) | | | — | | | | (.65 | ) | | | — | * | | | 12.76 | | | | 11.73 | |
| 2008 | | | (.65 | ) | | | — | | | | (.65 | ) | | | — | | | | 13.07 | | | | 13.30 | |
| 2007 | | | (.67 | ) | | | — | | | | (.67 | ) | | | — | | | | 14.20 | | | | 13.44 | |
| 2006 | | | (.73 | ) | | | — | | | | (.73 | ) | | | — | | | | 14.32 | | | | 13.52 | |
| | | | | | | | | | |
| | | Auction Rate Preferred Shares at End of Period | |
| | | Aggregate | | | | | | | |
| | | Amount | | | Liquidation | | | Asset | |
| | | Outstanding | | | Value | | | Coverage | |
| | | | (000 | ) | | Per Share | | | Per Share | |
| Arizona Dividend Advantage 2 (NKR) | | | | | | | |
| Year Ended 7/31: | | | | | | | | | | |
| 2010 | | $ | 16,625 | | | $ | 25,000 | | | $ | 78,734 | |
| 2009 | | | 16,625 | | | | 25,000 | | | | 74,367 | |
| 2008 | | | 18,500 | | | | 25,000 | | | | 70,015 | |
| 2007 | | | 18,500 | | | | 25,000 | | | | 73,616 | |
| 2006 | | | 18,500 | | | | 25,000 | | | | 74,277 | |
| Arizona Dividend Advantage 3 (NXE) | | | | | | | | | |
| Year Ended 7/31: | | | | | | | | | | | | |
| 2010 | | | 18,400 | | | | 25,000 | | | | 83,805 | |
| 2009 | | | 18,400 | | | | 25,000 | | | | 78,164 | |
| 2008 | | | 22,000 | | | | 25,000 | | | | 70,546 | |
| 2007 | | | 22,000 | | | | 25,000 | | | | 74,490 | |
| 2006 | | | 22,000 | | | | 25,000 | | | | 74,902 | |
| | | | | | | | | | | | | | | | | | | | | | | | | | | | | |
| | | | | | | Ratios/Supplemental Data | |
| | | | | | | | Ratios to Average Net Assets | | | Ratios to Average Net Assets | | | | |
| | | | | | | | | | Applicable to Common Shares | | | Applicable to Common Shares | | | | |
| Total Returns | | | | | | Before Reimbursement(c) | | After Reimbursement(c)(d) | | | | |
| | | | Based | | | Ending | | | | | | | | | | | | | | | | | | | | | | |
| | | | on | | | Net | | | | | | | | | | | | | | | | | | | | | | |
| Based | | | Common | | | Assets | | | | | | | | | | | | | | | | | | | | | | |
| on | | | Share Net | | | Applicable | | | Expenses | | | Expenses | | | Net | | | Expenses | | | Expenses | | | Net | | | Portfolio | |
| Market | | | Asset | | | to Common | | | Including | | | Excluding | | | Investment | | | Including | | | Excluding | | | Investment | | | Turnover | |
Value(b) | | | Value(b) | | | Shares (000) | | | Interest(e) | | | Interest | | | Income | | | Interest(e) | | | Interest | | | Income | | | Rate | |
| | 17.65 | % | | | 14.75 | % | | $ | 35,733 | | | | 1.27 | % | | | 1.27 | % | | | 6.11 | % | | | 1.07 | % | | | 1.07 | % | | | 6.31 | % | | | 4 | % |
| | (4.99 | ) | | | 4.09 | | | | 32,829 | | | | 1.40 | | | | 1.40 | | | | 6.93 | | | | 1.11 | | | | 1.11 | | | | 7.22 | | | | 5 | |
| | (3.16 | ) | | | (2.38 | ) | | | 33,311 | | | | 1.49 | | | | 1.34 | | | | 6.32 | | | | 1.13 | | | | .98 | | | | 6.68 | | | | 15 | |
| | 4.52 | | | | 3.59 | | | | 35,976 | | | | 1.39 | | | | 1.29 | | | | 5.92 | | | | .96 | | | | .86 | | | | 6.35 | | | | 14 | |
| | .82 | | | | 2.49 | | | | 36,465 | | | | 1.28 | | | | 1.28 | | | | 5.88 | | | | .83 | | | | .83 | | | | 6.33 | | | | 11 | |
| | 18.58 | | | | 16.66 | | | | 43,280 | | | | 1.22 | | | | 1.22 | | | | 6.15 | | | | 1.08 | | | | 1.08 | | | | 6.29 | | | | 5 | |
| | (6.18 | ) | | | 3.08 | | | | 39,129 | | | | 1.37 | | | | 1.37 | | | | 6.97 | | | | 1.09 | | | | 1.09 | | | | 7.25 | | | | 9 | |
| | 3.96 | | | | (3.48 | ) | | | 40,081 | | | | 1.46 | | | | 1.30 | | | | 6.17 | | | | 1.08 | | | | .92 | | | | 6.55 | | | | 16 | |
| | 4.21 | | | | 3.81 | | | | 43,552 | | | | 1.36 | | | | 1.26 | | | | 5.69 | | | | .88 | | | | .78 | | | | 6.16 | | | | 15 | |
| | (1.80 | ) | | | 3.03 | | | | 43,913 | | | | 1.26 | | | | 1.26 | | | | 5.63 | | | | .79 | | | | .79 | | | | 6.11 | | | | 12 | |
| | |
| (a) | The amounts shown are based on Common share equivalents. |
| (b) | Total Return Based on Market Value is the combination of changes in the market price per share and the effect of reinvested dividend income and reinvested capital gains |
| | distributions, if any, at the average price paid per share at the time of reinvestment. The last dividend declared in the period, which is typically paid on the first business |
| | day of the following month, is assumed to be reinvested at the ending market price. The actual reinvestment for the last dividend declared in the period may take place |
| | over several days, and in some instances may not be based on the market price, so the actual reinvestment price may be different from the price used in the calculation. |
| | Total returns are not annualized. |
| | Total Return Based on Common Share Net Asset Value is the combination of changes in Common share net asset value, reinvested dividend income at net asset value and |
| | reinvested capital gains distributions at net asset value, if any. The last dividend declared in the period, which is typically paid on the first business day of the following |
| | month, is assumed to be reinvested at the ending net asset value. The actual reinvest price for the last dividend declared in the period may often be based on the Fund’s |
| | market price (and not its net asset value), and therefore may be different from the price used in the calculation. Total returns are not annualized. |
| (c) | Ratios do not reflect the effect of dividend payments to Auction Rate Preferred shareholders; Net Investment Income ratios reflect income earned and expenses incurred |
| | on assets attributable to Auction Rate Preferred shares. |
| (d) | After expense reimbursement from the Adviser, where applicable. Ratios do not reflect the effect of custodian fee credits earned on the Fund’s net cash on deposit with |
| | the custodian bank, where applicable. |
| (e) | The expense ratios reflect, among other things, the interest expense deemed to have been paid by the Fund on the floating rate certificates issued by the special purpose |
| | trusts for the self-deposited inverse floaters held by the Fund, where applicable, as described in Footnote 1 – General Information and Significant Accounting Policies, |
| | Inverse Floating Rate Securities. |
| * | Rounds to less than $.01 per share. |
See accompanying notes to financial statements.
Nuveen Investments 61
Financial
Highlights (continued)
Selected data for a Common share outstanding throughout each period:
| | | | | | | | | | | | | | | | | | | |
| | | | | | Investment Operations | |
| | | | | | | | | | | | Distributions | | | Distributions | | | | |
| | | | | | | | | | | | from Net | | | from | | | | |
| | | | | | | | | | | | Investment | | | Capital | | | | |
| | | Beginning | | | | | | | | | Income to | | | Gains to | | | |
| | | Common | | | | | | Net | | | Auction Rate | | | Auction Rate | | | | |
| | | Share | | | Net | | | Realized/ | | | Preferred | | | Preferred | | | | |
| | | Net Asset | | | Investment | | | Unrealized | | | Share- | | | Share- | | | | |
| | | Value | | | Income | | | Gain (Loss) | | | holders(a) | | | holders(a) | | | Total | |
| Texas Quality Income (NTX) | | | | | | | | | | | | | | | | |
| Year Ended 7/31: | | | | | | | | | | | | | | | | | | |
| 2010 | | $ | 13.84 | | | $ | .94 | | | $ | 1.08 | | | $ | (.03 | ) | | $ | — | * | | $ | 1.99 | |
| 2009 | | | 13.98 | | | | .94 | | | | (.17 | ) | | | (.13 | ) | | | (.02 | ) | | | .62 | |
| 2008 | | | 14.87 | | | | .94 | | | | (.83 | ) | | | (.23 | ) | | | (.02 | ) | | | (.14 | ) |
| 2007 | | | 15.06 | | | | .95 | | | | (.11 | ) | | | (.25 | ) | | | (.01 | ) | | | .58 | |
| 2006 | | | 15.46 | | | | .96 | | | | (.32 | ) | | | (.22 | ) | | | — | | | | .42 | |
| | | | | | | | | | | | | | | | | | |
| | Less Distributions | | | | | | | |
| | | | | | | | | | | Discount | | | | | | | |
| | | | | | | | | | | from | | | | | | | |
| | Net | | | | | | | | | Common | | | | | | | |
| | Investment | | | Capital | | | | | | Shares | | | Ending | | | | |
| | Income to | | | Gains to | | | | | | Repur- | | | Common | | | | |
| | Common | | | Common | | | | | | chased | | | Share | | | Ending | |
| | Share- | | | Share- | | | | | | and | | | Net Asset | | | Market | |
| | holders | | | holders | | | Total | | | Retired | | | Value | | | Value | |
| Texas Quality Income (NTX) | | | | | | | | | | | | | | | | | |
| Year Ended 7/31: | | | | | | | | | | | | | | | | | |
| 2010 | $ | (.81 | ) | | $ | (.01 | ) | | $ | (.82 | ) | | $ | — | | | $ | 15.01 | | | $ | 16.92 | |
| 2009 | | (.71 | ) | | | (.05 | ) | | | (.76 | ) | | | — | | | | 13.84 | | | | 14.78 | |
| 2008 | | (.69 | ) | | | (.06 | ) | | | (.75 | ) | | | — | | | | 13.98 | | | | 12.46 | |
| 2007 | | (.73 | ) | | | (.04 | ) | | | (.77 | ) | | | — | | | | 14.87 | | | | 13.89 | |
| 2006 | | (.82 | ) | | | — | | | | (.82 | ) | | | — | | | | 15.06 | | | | 14.71 | |
| | | | | | | | | | |
| | | Auction Rate Preferred Shares at End of Period | |
| | | Aggregate | | | | | | | |
| | | Amount | | | Liquidation | | | Asset | |
| | | Outstanding | | | Value | | | Coverage | |
| | | | (000 | ) | | Per Share | | | Per Share | |
| Texas Quality Income (NTX) | | | | | | | |
| Year Ended 7/31: | | | | | | | | | | |
| 2010 | | $ | 65,050 | | | $ | 25,000 | | | $ | 79,988 | |
| 2009 | | | 65,050 | | | | 25,000 | | | | 75,543 | |
| 2008 | | | 69,000 | | | | 25,000 | | | | 73,084 | |
| 2007 | | | 69,000 | | | | 25,000 | | | | 76,173 | |
| 2006 | | | 69,000 | | | | 25,000 | | | | 76,815 | |
| | | | | | | | | | | | | | | | | | | | |
| | | | | | | | | | Ratios/Supplemental Data | | | | |
| | | | | | | | | | Ratios to Average Net Assets | | | | |
| Total Returns | | | | Applicable to Common Shares(c)(d) | | | | |
| | | | Based | | | Ending | | | | | | | | | | | | | |
| | | | on | | | Net | | | | | | | | | | | | | |
| Based | | | Common | | | Assets | | | | | | | | | | | | | |
| on | | | Share Net | | | Applicable | | | Expenses | | | Expenses | | | Net | | | Portfolio | |
| Market | | | Asset | | | to Common | | | Including | | | Excluding | | | Investment | | | Turnover | |
Value(b) | | | Value(b) | | | Shares (000) | | | Interest(e) | | | Interest | | | Income | | | Rate | |
| | 20.92 | % | | | 14.71 | % | | $ | 143,080 | | | | 1.19 | % | | | 1.17 | % | | | 6.42 | % | | | 6 | % |
| | 25.98 | | | | 4.80 | | | | 131,513 | | | | 1.27 | | | | 1.26 | | | | 7.06 | | | | 10 | |
| | (5.16 | ) | | | (1.04 | ) | | | 132,713 | | | | 1.26 | | | | 1.21 | | | | 6.46 | | | | 8 | |
| | (.52 | ) | | | 3.82 | | | | 141,238 | | | | 1.24 | | | | 1.18 | | | | 6.24 | | | | 9 | |
| | (4.03 | ) | | | 2.77 | | | | 143,009 | | | | 1.19 | | | | 1.19 | | | | 6.31 | | | | 13 | |
| | |
| (a) | The amounts shown are based on Common share equivalents. |
| (b) | Total Return Based on Market Value is the combination of changes in the market price per share and the effect of reinvested dividend income and reinvested capital gains |
| | distributions, if any, at the average price paid per share at the time of reinvestment. The last dividend declared in the period, which is typically paid on the first business day |
| | of the following month, is assumed to be reinvested at the ending market price. The actual reinvestment for the last dividend declared in the period may take place over |
| | several days, and in some instances may not be based on the market price, so the actual reinvestment price may be different from the price used in the calculation. Total |
| | returns are not annualized. |
| | Total Return Based on Common Share Net Asset Value is the combination of changes in Common share net asset value, reinvested dividend income at net asset value and |
| | reinvested capital gains distributions at net asset value, if any. The last dividend declared in the period, which is typically paid on the first business day of the following |
| | month, is assumed to be reinvested at the ending net asset value. The actual reinvest price for the last dividend declared in the period may often be based on the Fund’s |
| | market price (and not its net asset value), and therefore may be different from the price used in the calculation. Total returns are not annualized. |
| (c) | Ratios do not reflect the effect of dividend payments to Auction Rate Preferred shareholders; Net Investment Income ratios reflect income earned and expenses incurred on |
| | assets attributable to Auction Rate Preferred shares. |
| (d) | Ratios do not reflect the effect of custodian fee credits earned on the Fund’s net cash on deposit with the custodian bank, where applicable. |
| (e) | The expense ratios reflect, among other things, the interest expense deemed to have been paid by the Fund on the floating rate certificates issued by the special purpose |
| | trusts for the self-deposited inverse floaters held by the Fund, where applicable, as described in Footnote 1 – General Information and Significant Accounting Policies, |
| | Inverse Floating Rate Securities. |
| * | Rounds to less than $.01 per share. |
See accompanying notes to financial statements.
Nuveen Investments 63
Board Members & Officers (Unaudited)
The management of the Funds, including general supervision of the duties performed for the Funds by the Adviser, is the responsibility of the Board Members of the Funds. The number of board members of the Fund is currently set at nine. None of the board members who are not “interested” persons of the Funds (referred to herein as “independent board members”) has ever been a director or employee of, or consultant to, Nuveen or its affiliates. The names and business addresses of the board members and officers of the Funds, their principal occupations and other affiliations during the past five years, the number of portfolios each oversees and other directorships they hold are set forth below.
| | | | | |
| Name, | Position(s) Held | Year First | Principal | Number |
| Birthdate | with the Funds | Elected or | Occupation(s) | of Portfolios |
| & Address | | Appointed | Including other | in Fund Complex |
| | | and Term(1) | Directorships | Overseen by |
| | | | During Past 5 Years | Board Member |
| Independent Board Members: | | | |
| | | | |
■ ROBERT P. BREMNER(2) | | | Private Investor and Management Consultant; Treasurer and Director, | |
| 8/22/40 | Chairman of | | Humanities Council of Washington, D.C. | |
| 333 W. Wacker Drive | the Board | 1996 | | 200 |
| Chicago, IL 60606 | and Board Member | | | |
| | | | | |
■ JACK B. EVANS | | | President, The Hall-Perrine Foundation, a private philanthropic | |
| 10/22/48 | | | corporation (since 1996); Director and Chairman, United Fire | |
| 333 W. Wacker Drive | Board Member | 1999 | Group, a publicly held company; President Pro Tem of the Board of | 200 |
| Chicago, IL 60606 | | | Regents for the State of Iowa University System; Director, Gazette | |
| | | | Companies; Life Trustee of Coe College and the Iowa College Foundation; | |
| | | | formerly, Director, Alliant Energy; formerly, Director, Federal | |
| | | | Reserve Bank of Chicago; formerly, President and Chief Operating | |
| | | | Officer, SCI Financial Group, Inc., a regional financial services firm. | |
■ WILLIAM C. HUNTER | | | Dean, Tippie College of Business, University of Iowa (since | |
| 3/6/48 | | | 2006); Director (since 2004) of Xerox Corporation; Director | |
| 333 W. Wacker Drive | Board Member | 2004 | (since 2005), Beta Gamma Sigma International Honor Society; | 200 |
| Chicago, IL 60606 | | | formerly, Dean and Distinguished Professor of Finance, School of | |
| | | | Business at the University of Connecticut (2003-2006); previously, | |
| | | | Senior Vice President and Director of Research at the Federal | |
| | | | Reserve Bank of Chicago (1995-2003); Director, SS&C | |
| | | | Technologies, Inc. (May 2005-October 2005); formerly, Director | |
| | | | (1997-2007), Credit Research Center at Georgetown University. | |
■ DAVID J. KUNDERT(2) | | | Director, Northwestern Mutual Wealth Management | |
| 10/28/42 | | | Company; retired (since 2004) as Chairman, JPMorgan | |
| 333 W. Wacker Drive | Board Member | 2005 | Fleming Asset Management, President and CEO, Banc One | 200 |
| Chicago, IL 60606 | | | Investment Advisors Corporation, and President, One Group | |
| | | | Mutual Funds; prior thereto, Executive Vice President, Banc One | |
| | | | Corporation and Chairman and CEO, Banc One Investment | |
| | | | Management Group; Member, Board of Regents, Luther College; | |
| | | | member of the Wisconsin Bar Association; member of Board of | |
| | | | Directors, Friends of Boerner Botanical Gardens; member of Board | |
| | | | of Directors and chair of Investment Committee, Greater | |
| | | | Milwaukee Foundation. | |
■ WILLIAM J. SCHNEIDER(2) | | Chairman of Miller-Valentine Partners Ltd., a real estate investment | |
| 9/24/44 | | | company; formerly, Senior Partner and Chief Operating Officer | |
| 333 W. Wacker Drive | Board Member | 1997 | (retired, 2004) of Miller-Valentine Group; member, University of | 200 |
| Chicago, IL 60606 | | | Dayton Business School Advisory Council;member, Mid-America | |
| | | | Health System board; formerly, member and chair, Dayton Philharmonic | |
| | | | Orchestra Association; formerly, member, Business Advisory Council, | |
| | | | Cleveland Federal Reserve Bank. | |
| | | | | |
| Name, | Position(s) Held | Year First | Principal | Number |
| Birthdate | with the Funds | Elected or | Occupation(s) | of Portfolios |
| & Address | | Appointed | Including other | in Fund Complex |
| | | and Term(1) | Directorships | Overseen by |
| | | | During Past 5 Years | Board Member |
| Independent Board Members: | | | |
| | | | |
■ JUDITH M. STOCKDALE | | | Executive Director, Gaylord and Dorothy Donnelley | |
| 12/29/47 | | | Foundation (since 1994); prior thereto, Executive Director, | |
| 333 W. Wacker Drive | Board Member | 1997 | Great Lakes Protection Fund (1990-1994). | 200 |
| Chicago, IL 60606 | | | | |
| | | | | |
■ CAROLE E. STONE(2) | | | Director, Chicago Board Options Exchange (since 2006); Director, | |
| 6/28/47 | | | C2 Options Exchange, Incorporated (since 2009); Commissioner, | |
| 333 W. Wacker Drive | Board Member | 2007 | New York State Commission on Public Authority Reform (since | 200 |
| Chicago, IL 60606 | | | 2005); formerly, Chair, New York Racing Association Oversight | |
| | | | Board (2005-2007). | |
■ TERENCE J. TOTH(2) | | | | |
| 9/29/59 | | | Director, Legal & General Investment Management America, Inc. | |
| 333 W. Wacker Drive | Board Member | 2008 | (since 2008); Managing Partner, Promus Capital (since 2008); | 200 |
| Chicago, IL 60606 | | | formerly, CEO and President, Northern Trust Global Investments | |
| | | | (2004-2007); Executive Vice President, Quantitative Management | |
| | | | & Securities Lending (2000-2004); prior thereto, various positions | |
| | | | with Northern Trust Company (since 1994); member: Goodman | |
| | | | Theatre Board (since 2004), Chicago Fellowship Boards (since | |
| | | | 2005), University of Illinois Leadership Council Board (since 2007) | |
| | | | and Catalyst Schools of Chicago Board (since 2008); formerly, | |
| | | | member: Northern Trust Mutual Funds Board (2005-2007), | |
| | | | Northern Trust Global Investments Board (2004-2007), Northern | |
| | | | Trust Japan Board (2004-2007), Northern Trust Securities Inc. | |
| | | | Board (2003-2007) and Northern Trust Hong Kong Board | |
| | | | (1997-2004). | |
| Interested Board Member: | | | |
■ JOHN P. AMBOIAN(3) | | | Chief Executive Officer (since July 2007), Director (since 1999) | |
| 6/14/61 | | | and Chairman (since 2007) of Nuveen Investments, Inc.; Chief | |
| 333 W. Wacker Drive | Board Member | 2008 | Executive Officer (since 2007) of Nuveen Asset Management, | 200 |
| Chicago, IL 60606 | | | Nuveen Investments Advisors, Inc.; President (since 2005) of | |
| | | | Nuveen Commodities Asset Management, LLC. | |
Nuveen Investments 65
Board Members & Officers (Unaudited) (continued)
| | | | | |
| Name, | Position(s) Held | Year First | Principal | Number |
| Birthdate | with the Funds | Elected or | Occupation(s) | of Portfolios |
| and Address | | Appointed(4) | During Past 5 Years | in Fund Complex |
| | | | | Overseen |
| | | | | by Officer |
| Officers of the Funds: | | | | |
■ GIFFORD R. ZIMMERMAN | | Managing Director (since 2002), Assistant Secretary and | |
| 9/9/56 | Chief | | Associate General Counsel of Nuveen Investments, LLC; | |
| 333 W. Wacker Drive | Administrative | 1988 | Managing Director, Associate General Counsel and Assistant | 200 |
| Chicago, IL 60606 | Officer | | Secretary, of Nuveen Asset Management (since 2002) and of | |
| | | | Symphony Asset Management LLC, (since 2003); Vice President and | |
| | | | Assistant Secretary of NWQ Investment Management Company, LLC. | |
| | | | (since 2002), Nuveen Investments Advisers Inc. (since 2002), | |
| | | | Tradewinds Global Investors, LLC, and Santa Barbara Asset | |
| | | | Management, LLC (since 2006), Nuveen HydePark Group LLC and | |
| | | | Nuveen Investment Solutions, Inc. (since 2007); Managing Director | |
| | | | (since 2004) and Assistant Secretary (since 1994) of Nuveen | |
| | | | Investments, Inc.; Managing Director (since 2005) of Nuveen | |
| | | | Commodities Asset Management, LLC; Chartered Financial Analyst. | |
| | | | | |
■ WILLIAM ADAMS IV | | | Executive Vice President of Nuveen Investments, Inc.; Executive | |
| 6/9/55 | | | Vice President, U.S. Structured Products of Nuveen Investments, | |
| 333 W. Wacker Drive | Vice President | 2007 | LLC, (since 1999), ; Executive Vice President (since 2005) of Nuveen | 125 |
| Chicago, IL 60606 | | | Commodities Asset Management, LLC. | |
| | | | | |
■ CEDRIC H. ANTOSIEWICZ | | Managing Director, (since 2004), previously, Vice President | |
| 1/11/62 | | | (1993-2004) of Nuveen Investments, LLC. | |
| 333 W. Wacker Drive | Vice President | 2007 | | 125 |
| Chicago, IL 60606 | | | | |
| | | | | |
■ NIZIDA ARRIAGA | | | Senior Vice President of Nuveen Investments, LLC (since 2010); | |
| 6/1/68 | | | formerly, Vice President (2007-2010); previously, Portfolio Manager, | |
| 333 W. Wacker Drive | Vice President | 2009 | Allstate Investments, LLC (1996-2006); Chartered Financial Analyst. | 200 |
| Chicago, IL 60606 | | | | |
| | | | | |
■ MICHAEL T. ATKINSON | | | Vice President (since 2002) of Nuveen Investments, LLC.; | |
| 2/3/66 | Vice President | | Vice President of Nuveen Asset Management (since 2005). | |
| 333 W. Wacker Drive | and Assistant | 2000 | | 200 |
| Chicago, IL 60606 | Secretary | | | |
| | | | | |
■ MARGO L. COOK | | | Executive Vice President (since Oct 2008) of Nuveen | |
| 4/11/64 | | | Investments, Inc.; previously, Head of Institutional Asset | |
| 333 W. Wacker Drive | Vice President | 2009 | Management (2007-2008) of Bear Stearns Asset Management; | 200 |
| Chicago, IL 60606 | | | Head of Institutional Asset Mgt (1986-2007) of Bank of NY | |
| | | | Mellon; Chartered Financial Analyst. | |
■ LORNA C. FERGUSON | | | Managing Director (since 2004) of Nuveen Investments, LLC and | |
| 10/24/45 | | | Managing Director (since 2005) of Nuveen Asset Management. | |
| 333 W. Wacker Drive | Vice President | 1998 | | 200 |
| Chicago, IL 60606 | | | | |
| | | | | |
■ STEPHEN D. FOY | | | Senior Vice President (since 2010), formerly, Vice President (1993- | |
| 5/31/54 | Vice President | | 2010) and Funds Controller (since 1998) of Nuveen Investments, | |
| 333 W. Wacker Drive | and Controller | 1998 | LLC; Senior Vice President (since 2010), formerly, Vice President | 200 |
| Chicago, IL 60606 | | | (2005-2010) of Nuveen Asset Management; Certified Public Accountant. | |
| | | | | |
■ SCOTT S. GRACE | | | Managing Director, Corporate Finance & Development, Treasurer | |
| 8/20/70 | Vice President | | (since 2009) of Nuveen Investments, LLC; Managing Director and | |
| 333 W. Wacker Drive | and Treasurer | 2009 | Treasurer of Nuveen Asset Management (since 2009); formerly, Treasurer | 200 |
| Chicago, IL 60606 | | | (2006-2009), Senior Vice President (2008-2009), previously, Vice�� | |
| | | | President (2006-2008) of Janus Capital Group, Inc.; formerly, Senior | |
| | | | Associate in Morgan Stanley’s Global Financial Services Group (2000- | |
| | | | 2003); Chartered Accountant Designation. | |
| | | | | |
| Name, | Position(s) Held | Year First | Principal | Number |
| Birthdate | with the Funds | Elected or | Occupation(s) | of Portfolios |
| and Address | | Appointed(4) | During Past 5 Years | in Fund Complex |
| | | | | Overseen |
| | | | | by Officer |
| Officers of the Funds: | | | | |
■ WILLIAM T. HUFFMAN | | | Chief Operating Officer, Municipal Fixed Income (since 2008) | |
| 5/7/69 | | | of Nuveen Asset Management; previously, Chairman, President | |
| 333 W. Wacker Drive | Vice President | 2009 | and Chief Executive Officer (2002 – 2007) of Northern Trust | 136 |
| Chicago, IL 60606 | | | Global Advisors, Inc. and Chief Executive Officer (2007) of | |
| | | | Northern Trust Global Investments Limited; Certified Public | |
| | | | Accountant. | |
■ WALTER M. KELLY | | | Senior Vice President (since 2008), Vice President (2006-2008) | |
| 2/24/70 | Chief Compliance | | formerly, Assistant Vice President and Assistant General Counsel | |
| 333 W. Wacker Drive | Officer and | 2003 | (2003-2006) of Nuveen Investments, LLC; Senior Vice President | 200 |
| Chicago, IL 60606 | Vice President | | (since 2008), formerly, Vice President (2006-2008) and Assistant | |
| | | | Secretary (since 2008) of Nuveen Asset Management. | |
■ DAVID J. LAMB | | | Senior Vice President (since 2009), formerly, Vice President | |
| 3/22/63 | | | (2000-2009) of Nuveen Investments, LLC; Senior Vice President | |
| 333 W. Wacker Drive | Vice President | 2000 | (since 2010), formerly, Vice President (2005-2010) of Nuveen Asset | 200 |
| Chicago, IL 60606 | | | Management; Certified Public Accountant. | |
| | | | | |
■ TINA M. LAZAR | | | Senior Vice President (since 2009), formerly, Vice President of Nuveen | |
| 8/27/61 | | | Investments, LLC (1999-2009); Senior Vice President (since 2010), | |
| 333 W. Wacker Drive | Vice President | 2002 | formerly, Vice President (2005-2010) of Nuveen Asset Management. | 200 |
| Chicago, IL 60606 | | | | |
| | | | | |
■ LARRY W. MARTIN | | | Senior Vice President (since 2010), formerly, Vice President (1993- | |
| 7/27/51 | Vice President | | 2010), Assistant Secretary and Assistant General Counsel of Nuveen | |
| 333 W. Wacker Drive | and Assistant | 1988 | Investments, LLC; Vice President (since 2005) and Assistant Secretary | 200 |
| Chicago, IL 60606 | Secretary | | of Nuveen Investments, Inc.; Vice President (since 2005) and | |
| | | | Assistant Secretary (since 1997) of Nuveen Asset Management; Vice | |
| | | | President and Assistant Secretary of Nuveen Investments Advisers | |
| | | | Inc. (since 2002); NWQ Investment Management Company, LLC | |
| | | | (since 2002), Symphony Asset Management LLC (since 2003), | |
| | | | Tradewinds Global Investors, LLC, Santa Barbara Asset Management | |
| | | | LLC (since 2006) and of Nuveen HydePark Group, LLC and Nuveen | |
| | | | Investment Solutions, Inc. (since 2007). | |
■ KEVIN J. MCCARTHY | | | Managing Director (since 2008), formerly, Vice President | |
| 3/26/66 | Vice President | | (2007-2008), Nuveen Investments, LLC; Managing Director | |
| 333 W. Wacker Drive | and Secretary | 2007 | (since 2008), formerly, Vice President, and Assistant Secretary, | 200 |
| Chicago, IL 60606 | | | Nuveen Asset Management, and Nuveen Investments Holdings, Inc.; | |
| | | | Vice President (since 2007) and Assistant Secretary, Nuveen | |
| | | | Investment Advisers Inc., NWQ Investment Management Company, | |
| | | | LLC, Tradewinds Global Investors LLC, NWQ Holdings, LLC, | |
| | | | Symphony Asset Management LLC, Santa Barbara Asset | |
| | | | Management LLC, Nuveen HydePark Group, LLC and Nuveen | |
| | | | Investment Solutions, Inc. (since 2007); prior thereto, Partner, Bell, | |
| | | | Boyd & Lloyd LLP (1997-2007). | |
| | | | |
■ MICHELLE A. MCCARTHY | | Managing Director, Director of Risk Management (since May, 2010), | |
| 7/6/65 | | | Nuveen Investments, LLC; formerly, Chief Risk Officer (2009- 2010) of | |
| 333 West Wacker Drive | Vice President | 2010 | Russell Investment Group; formerly, SVP (2003-2009), Chief Market & | 200 |
| Chicago, IL 60606 | | | Operational Risk Officer (2006-2009), Washington Mutual Bank. | |
| | | | | |
■ JOHN V. MILLER | | | Chief Investment Officer and Managing Director (since 2007), | |
| 4/10/67 | | | formerly, Vice President (2002-2007) of Nuveen Asset | |
| 333 W. Wacker Drive | Vice President | 2007 | Management and Managing Director (since 2007), formerly | 136 |
| Chicago, IL 60606 | | | Vice President (2002-2007) Nuveen Investments, LLC; | |
| | | | Chartered Financial Analyst. | |
Nuveen Investments 67
Board Members & Officers (Unaudited) (continued)
| | | | | |
| Name, | Position(s) Held | Year First | Principal | Number |
| Birthdate | with the Funds | Elected or | Occupation(s) | of Portfolios |
| and Address | | Appointed(4) | During Past 5 Years | in Fund Complex |
| | | | | Overseen |
| | | | | by Officer |
| Officers of the Funds: | | | | |
■ GREGORY T. MINO | | | Senior Vice President (since 2010) of Nuveen Investments, LLC, | |
| 1/4/71 | | | formerly, Vice President (2008-2010); previously, Director (2004- | |
| 333 W. Wacker Drive | | 2009 | 2007) and Executive Director (2007-2008) of UBS Global Asset | 200 |
| Chicago, IL 60606 | | | Management; previously, Vice President (2000-2003) and Director | |
| | | | (2003-2004) of Merrill Lynch Investment Managers; Chartered | |
| | | | Financial Analyst. | |
| | | | | |
■ CHRISTOPHER M. ROHRBACHER | | Vice President, Nuveen Investments, LLC (since 2008); Vice | |
| 8/1/71 | Vice President | | President and Assistant Secretary, Nuveen Asset Management | |
| 333 W. Wacker Drive | and Assistant | 2008 | (since 2008); prior thereto, Associate, Skadden, Arps, Slate, | 200 |
| Chicago, IL 60606 | Secretary | | Meagher & Flom LLP (2002-2008). | |
| | | | | |
■ JAMES F. RUANE | | | Vice President, Nuveen Investments, LLC (since 2007); prior | |
| 7/3/62 | Vice President | | thereto, Partner, Deloitte & Touche USA LLP (2005-2007), | |
| 333 W. Wacker Drive | and Assistant | 2007 | formerly, senior tax manager (2002-2005); Certified Public | 200 |
| Chicago, IL 60606 | Secretary | | Accountant. | |
| | | | | |
■ MARK L. WINGET | | | Vice President, Nuveen Investments, LLC (since 2008); Vice | |
| 12/21/68 | Vice President | | President and Assistant Secretary, Nuveen Asset Management | |
| 333 W. Wacker Drive | and Assistant | 2008 | (since 2008); prior thereto, Counsel, Vedder Price P.C. | 200 |
| Chicago, IL 60606 | Secretary | | (1997-2007). | |
| (1) | Board Members serve three year terms, except for two board members who are elected by the holders of Preferred Shares. The Board of Trustees is divided into three classes, Class I, Class II, and Class III, with each being elected to serve until the third succeeding annual shareholders’ meeting subsequent to its election or thereafter in each case when its respective successors are duly elected or appointed, except two board members are elected by the holders of Preferred Shares to serve until the next annual shareholders’ meeting subsequent to its election or thereafter in each case when its respective successors are duly elected or appointed. The first year elected or appointed represents the year in which the board member was first elected or appointed to any fund in the Nuveen Complex. |
| (2) | Also serves as a trustee of the Nuveen Diversified Commodity Fund, a Nuveen-sponsored commodity pool that has filed a registration statement on Form S-1 with the SEC for a proposed initial public offering. The S-1 has not been declared effective, and the commodity pool has not commenced operations. |
| (3) | Mr. Amboian is an interested trustee because of his position with Nuveen Investments, Inc. and certain of its subsidiaries, which are affiliates of the Nuveen Funds. |
| (4) | Officers serve one year terms through August of each year. The year first elected or appointed represents the year in which the Officer was first elected or appointed to any fund in the |
| | Nuveen Complex. |
Annual Investment Management
Agreement Approval Process (Unaudited)
The Investment Company Act of 1940, as amended (the “1940 Act”), provides, in substance, that each investment advisory agreement between a fund and its investment adviser will continue in effect from year to year only if its continuance is approved at least annually by the fund’s board members, including by a vote of a majority of the board members who are not parties to the advisory agreement or “interested persons” of any parties (the “Independent Board Members”), cast in person at a meeting called for the purpose of considering such approval. In connection with such approvals, the fund’s board members must request and evaluate, and the investment adviser is required to furnish, such information as may be reasonably nece ssary to evaluate the terms of the advisory agreement. Accordingly, at a meeting held on May 25-26, 2010 (the “May Meeting”), the Boards of Trustees or Directors (as the case may be) (each a “Board” and each Trustee or Director, a “Board Member”) of the Funds, including a majority of the Independent Board Members, considered and approved the continuation of the advisory agreements (each an “Advisory Agreement”) between each Fund and Nuveen Asset Management (“NAM”) for an additional one-year period. In preparation for their considerations at the May Meeting, the Board also held a separate meeting on April 21-22, 2010 (the “April Meeting”). Accordingly, the factors considered and determinations made regarding the renewals by the Independent Bo ard Members include those made at the April Meeting.
In addition, in evaluating the Advisory Agreements, the Independent Board Members reviewed a broad range of information relating to the Funds and NAM, including absolute and comparative performance, fee and expense information for the Funds (as described in more detail below), the profitability of Nuveen for its advisory activities (which includes its wholly owned subsidiaries), and other information regarding the organization, personnel, and services provided by NAM. The Independent Board Members also met quarterly as well as at other times as the need arose during the year and took into account the information provided at such meetings and the knowledge gained therefrom. Prior to approving the renewal of the Advisory Agreements, the Independent Board Members reviewed the foregoing information with their independent legal counsel and with manageme nt, reviewed materials from independent legal counsel describing applicable law and their duties in reviewing advisory contracts, and met with independent legal counsel in private sessions without management present. The Independent Board Members considered the legal advice provided by independent legal counsel and relied upon their knowledge of NAM, its services and the Funds resulting from their meetings and other interactions throughout the year and their own business judgment in determining the factors to be considered in evaluating the Advisory Agreements. Each Board Member may have accorded different weight to the various factors in reaching his or her conclusions with respect to a Fund’s Advisory Agreement. The Independent Board Members did not identify any single factor as
Nuveen Investments 69
Annual Investment Management Agreement
Approval Process (Unaudited) (continued)
all-important or controlling. The Independent Board Members’ considerations were instead based on a comprehensive consideration of all the information presented. The principal factors considered by the Board and its conclusions are described below.
A. Nature, Extent and Quality of Services
In considering renewal of the Advisory Agreements, the Independent Board Members considered the nature, extent and quality of NAM’s services, including advisory services and administrative services. The Independent Board Members reviewed materials outlining, among other things, NAM’s organization and business; the types of services that NAM or its affiliates provide and are expected to provide to the Funds; the performance record of the applicable Fund (as described in further detail below); and any initiatives Nuveen had taken for the applicable fund product line, including continued activities to refinance auction rate preferred securities, manage leverage during periods of market turbulence and implement an enhanced leverage management process, modify investment mandates in light of market conditions and seek shareholder approval as necessary, maintain the fund share repurchase program and maintain shareholder communications to keep shareholders apprised of Nuveen’s efforts in refinancing preferred shares. In addition to the foregoing, the Independent Board Members also noted the additional services that NAM or its affiliates provide to closed-end funds, including, in particular, Nuveen’s continued commitment to supporting the secondary market for the common shares of its closed-end funds through a variety of programs designed to raise investor and analyst awareness and understanding of closed-end funds. These efforts include maintaining an investor relations program to provide timely information and education to financial advisers and investors; providing marketing for the closed-end funds; maintaining and enhancing a closed-end fund website; participating in conferences and having direct communications with analysts and financial advisors.
As part of their review, the Independent Board Members also evaluated the background, experience and track record of NAM’s investment personnel. In this regard, the Independent Board Members considered any changes in the personnel, and the impact on the level of services provided to the Funds, if any. The Independent Board Members also reviewed information regarding portfolio manager compensation arrangements to evaluate NAM’s ability to attract and retain high quality investment personnel, preserve stability, and reward performance but not provide an incentive for taking undue risks.
In addition to advisory services, the Independent Board Members considered the quality of administrative services provided by NAM and its affiliates including product management, fund administration, oversight of service providers, shareholder services, administration of Board relations, regulatory and portfolio compliance and legal support. Given the importance of compliance, the Independent Board Members also considered NAM’s compliance program, including the report of the chief compliance officer regarding the Funds’ compliance policies and procedures.
Based on their review, the Independent Board Members found that, overall, the nature, extent and quality of services provided (and expected to be provided) to the respective Funds under the Advisory Agreements were satisfactory.
B. The Investment Performance of the Funds and NAM
The Board considered the performance results of each Fund over various time periods. The Board reviewed, among other things, each Fund’s historic investment performance as well as information comparing the Fund’s performance information with that of other funds (the “Performance Peer Group”) based on data provided by an independent provider of mutual fund data and with recognized and/or customized benchmarks. In this regard, the Board reviewed each Fund’s total return information compared to its Performance Peer Group for the quarter, one-, three- and five-year periods ending December 31, 2009 and for the same periods ending March 31, 2010. In addition, the Board reviewed each Fund’s total return information compared to recognized and/or customized benchmarks for the quarte r, one- and three-year periods ending December 31, 2009 and for the same periods ending March 31, 2010. Moreover, the Board reviewed the peer ranking of the Nuveen municipal funds advised by NAM in the aggregate. The Independent Board Members also reviewed historic premium and discount levels. This information supplemented the Fund performance information provided to the Board at each of its quarterly meetings.
In reviewing peer comparison information, the Independent Board Members recognized that the Performance Peer Group of certain funds may not adequately represent the objectives and strategies of the funds, thereby limiting the usefulness of comparing a fund’s performance with that of its Performance Peer Group. In this regard, the Independent Board Members considered that the Performance Peer Groups of certain funds (including the Funds) were classified as having significant differences from such funds based on considerations such as special fund objectives, potential investable universe and the composition of the peer set (e.g., the number and size of competing funds and number of competing managers).
Based on their review, the Independent Board Members determined that each Fund’s investment performance over time had been satisfactory. The Independent Board Members noted that although each Fund underperformed the performance of its respective benchmark in the three-year period, it outperformed the performance of such benchmark in the one-year period.
C. Fees, Expenses and Profitability
1. Fees and Expenses
The Board evaluated the management fees and expenses of each Fund reviewing, among other things, such Fund’s gross management fees, net management fees and net expense ratios in absolute terms as well as compared to the fee and expenses of a comparable universe of funds based on data provided by an independent fund data provider (the “Peer Universe”) and in certain cases, to a more focused subset of funds in the Peer Universe (the “Peer Group”) and any expense limitations.
The Independent Board Members further reviewed the methodology regarding the construction of the applicable Peer Universe and/or Peer Group. In reviewing the comparisons of fee and expense information, the Independent Board Members took into account that in certain instances various factors such as: the asset level of a fund relative to peers; the limited size and particular composition of the Peer Universe or Peer Group; the investment objectives of the peers; expense anomalies; changes in
Nuveen Investments 71
Annual Investment Management Agreement
Approval Process (Unaudited) (continued)
the funds comprising the Peer Universe or Peer Group from year to year; levels of reimbursement; the timing of information used; the differences in the type and use of leverage; and differences in the states reflected in the Peer Universe or Peer Group may impact the comparative data, thereby limiting the ability to make a meaningful comparison with peers.
In reviewing the fee schedule for a Fund, the Independent Board Members also considered the fund-level and complex-wide breakpoint schedules (described in further detail below) and any fee waivers and reimbursements provided by Nuveen (applicable, in particular, for certain closed-end funds launched since 1999). The Independent Board Members noted that the Nuveen Arizona Dividend Advantage Municipal Fund 2 and Nuveen Arizona Dividend Advantage Municipal Fund 3 had net management fees and/or net expense ratios below, at or near (within 5 basis points or less) the peer averages of their Peer Group or Peer Universe. In addition, they noted, regarding the Nuveen Arizona Dividend Advantage Municipal Fund (with respect to its Peer Group), that although the net management fees of such Fund were above the peer average and the available peer set was limited , its net expense ratio was below or near the peer average. Finally, the Independent Board Members recognized that the Nuveen Arizona Premium Income Municipal Fund, Inc. and Nuveen Texas Quality Income Municipal Fund each had net advisory fees above the peer average but net expense ratios below, at or near the peer expense ratio average.
Based on their review of the fee and expense information provided, the Independent Board Members determined that each Fund’s management fees were reasonable in light of the nature, extent and quality of services provided to the Fund.
2. Comparisons with the Fees of Other Clients
The Independent Board Members further reviewed information regarding the nature of services and fee rates offered by NAM to other clients, including municipal separately managed accounts and passively managed municipal bond exchange traded funds (ETFs) that are sub-advised by NAM. In evaluating the comparisons of fees, the Independent Board Members noted that the fee rates charged to the Funds and other clients vary, among other things, because of the different services involved and the additional regulatory and compliance requirements associated with registered investment companies, such as the Funds. Accordingly, the Independent Board Members considered the differences in the product types, including, but not limited to, the services provided, the structure and operations, product distribution and costs thereof, portfolio investment policies, investor profiles, account sizes and regulatory requirements. The Independent Board Members noted, in particular, that the range of services provided to the Funds (as discussed above) is much more extensive than that provided to separately managed accounts. Given the inherent differences in the products, particularly the extensive services provided to the Funds, the Independent Board Members believe such facts justify the different levels of fees.
3. Profitability of Nuveen
In conjunction with its review of fees, the Independent Board Members also considered the profitability of Nuveen for its advisory activities (which incorporated Nuveen’s wholly-owned affiliated sub-advisers) and its financial condition. The Independent Board Members reviewed the revenues and expenses of Nuveen’s
advisory activities for the last two years, the allocation methodology used in preparing the profitability data and an analysis of the key drivers behind the changes in revenues and expenses that impacted profitability in 2009. The Independent Board Members noted this information supplemented the profitability information requested and received during the year to help keep them apprised of developments affecting profitability (such as changes in fee waivers and expense reimbursement commitments). In this regard, the Independent Board Members noted that they had also appointed an Independent Board Member as a point person to review and keep them apprised of changes to the profitability analysis and/or methodologies during the year. The Independent Board Members also considered Nuveen’s revenues for advisory activities, expenses, and profit mar gin compared to that of various unaffiliated management firms with similar amounts of assets under management and relatively comparable asset composition prepared by Nuveen.
In reviewing profitability, the Independent Board Members recognized the subjective nature of determining profitability which may be affected by numerous factors including the allocation of expenses. Further, the Independent Board Members recognized the difficulties in making comparisons as the profitability of other advisers generally is not publicly available and the profitability information that is available for certain advisers or management firms may not be representative of the industry and may be affected by, among other things, the adviser’s particular business mix, capital costs, types of funds managed and expense allocations. Notwithstanding the foregoing, the Independent Board Members reviewed Nuveen’s methodology and assumptions for allocating expenses across product lines to determine profitability. In reviewing profitabil ity, the Independent Board Members recognized Nuveen’s investment in its fund business. Based on their review, the Independent Board Members concluded that Nuveen’s level of profitability for its advisory activities was reasonable in light of the services provided.
In evaluating the reasonableness of the compensation, the Independent Board Members also considered other amounts paid to NAM by the Funds as well as any indirect benefits (such as soft dollar arrangements, if any) NAM and its affiliates receive, or are expected to receive, that are directly attributable to the management of the Funds, if any. See Section E below for additional information on indirect benefits NAM may receive as a result of its relationship with the Funds. Based on their review of the overall fee arrangements of each Fund, the Independent Board Members determined that the advisory fees and expenses of the respective Fund were reasonable.
D. Economies of Scale and Whether Fee Levels Reflect These Economies of Scale
With respect to economies of scale, the Independent Board Members have recognized the potential benefits resulting from the costs of a fund being spread over a larger asset base, although economies of scale are difficult to measure and predict with precision, particularly on a fund-by-fund basis. One method to help ensure the shareholders share in these benefits is to include breakpoints in the advisory fee schedule. Generally, management fees for funds in the Nuveen complex are comprised of a fund-level component and a
Nuveen Investments 73
Annual Investment Management Agreement
Approval Process (Unaudited) (continued)
complex-level component, subject to certain exceptions. Accordingly, the Independent Board Members reviewed and considered the applicable fund-level breakpoints in the advisory fee schedules that reduce advisory fees as asset levels increase. Further, the Independent Board Members noted that although closed-end funds may from time-to-time make additional share offerings, the growth of their assets will occur primarily through the appreciation of such funds’ investment portfolio.
In addition to fund-level advisory fee breakpoints, the Board also considered the Funds’ complex-wide fee arrangement. Pursuant to the complex-wide fee arrangement, the fees of the funds in the Nuveen complex are generally reduced as the assets in the fund complex reach certain levels. The complex-wide fee arrangement seeks to provide the benefits of economies of scale to fund shareholders when total fund complex assets increase, even if assets of a particular fund are unchanged or have decreased. The approach reflects the notion that some of Nuveen’s costs are attributable to services provided to all its funds in the complex and therefore all funds benefit if these costs are spread over a larger asset base.
Based on their review, the Independent Board Members concluded that the breakpoint schedules and complex-wide fee arrangement were acceptable and reflect economies of scale to be shared with shareholders when assets under management increase.
E. Indirect Benefits
In evaluating fees, the Independent Board Members received and considered information regarding potential “fall out” or ancillary benefits NAM or its affiliates may receive as a result of its relationship with each Fund. In this regard, the Independent Board Members considered any revenues received by affiliates of NAM for serving as agent at Nuveen’s trading desk and as co-manager in initial public offerings of new closed-end funds.
In addition to the above, the Independent Board Members considered whether NAM received any benefits from soft dollar arrangements whereby a portion of the commissions paid by a Fund for brokerage may be used to acquire research that may be useful to NAM in managing the assets of the Funds and other clients. The Independent Board Members noted that NAM does not currently have any soft dollar arrangements; however, to the extent certain bona fide agency transactions that occur on markets that traditionally trade on a principal basis and riskless principal transactions are considered as generating “commissions,” NAM intends to comply with the applicable safe harbor provisions.
Based on their review, the Independent Board Members concluded that any indirect benefits received by NAM as a result of its relationship with the Funds were reasonable and within acceptable parameters.
F. Other Considerations
The Independent Board Members did not identify any single factor discussed previously as all-important or controlling. The Board Members, including the Independent Board Members, unanimously concluded that the terms of the Advisory Agreements are fair and reasonable, that NAM’s fees are reasonable in light of the services provided to each Fund and that the Advisory Agreements be renewed.
Reinvest Automatically,
Easily and Conveniently
Nuveen makes reinvesting easy. A phone call is all it takes to set up your reinvestment account.
Nuveen Closed-End Funds Automatic Reinvestment Plan
Your Nuveen Closed-End Fund allows you to conveniently reinvest dividends and/or capital gains distributions in additional Fund shares.
By choosing to reinvest, you’ll be able to invest money regularly and automatically, and watch your investment grow through the power of tax-free compounding. Just like dividends or distributions in cash, there may be times when income or capital gains taxes may be payable on dividends or distributions that are reinvested.
It is important to note that an automatic reinvestment plan does not ensure a profit, nor does it protect you against loss in a declining market.
Easy and convenient
To make recordkeeping easy and convenient, each month you’ll receive a statement showing your total dividends and distributions, the date of investment, the shares acquired and the price per share, and the total number of shares you own.
How shares are purchased
The shares you acquire by reinvesting will either be purchased on the open market or newly issued by the Fund. If the shares are trading at or above net asset value at the time of valuation, the Fund will issue new shares at the greater of the net asset value or 95% of the then-current market price. If the shares are trading at less than net asset value, shares for your account will be purchased on the open market. If the Plan Agent begins purchasing Fund shares on the open market while shares are trading below net asset value, but the Fund’s shares subsequently trade at or above their net asset value before the Plan Agent is able to complete its purchases, the Plan Agent may cease open-market purchases and may invest the uninvested portion of the distribution in newly-issued Fund shares at a price equal to the greater of the shares’ ne t asset value or 95% of the shares’ market value on the last business day immediately prior to the purchase date. Dividends and distributions received to purchase shares in the open market will normally be invested shortly after the dividend payment date. No interest will be paid on dividends and distributions awaiting reinvestment. Because the market price of the shares may increase before purchases are completed, the average purchase price
Nuveen Investments 75
Reinvest Automatically,
Easily and Conveniently (continued)
per share may exceed the market price at the time of valuation, resulting in the acquisition of fewer shares than if the dividend or distribution had been paid in shares issued by the Fund. A pro rata portion of any applicable brokerage commissions on open market purchases will be paid by Plan participants. These commissions usually will be lower than those charged on individual transactions.
Flexible
You may change your distribution option or withdraw from the Plan at any time, should your needs or situation change.
You can reinvest whether your shares are registered in your name, or in the name of a brokerage firm, bank, or other nominee. Ask your investment advisor if his or her firm will participate on your behalf. Participants whose shares are registered in the name of one firm may not be able to transfer the shares to another firm and continue to participate in the Plan.
The Fund reserves the right to amend or terminate the Plan at any time. Although the Fund reserves the right to amend the Plan to include a service charge payable by the participants, there is no direct service charge to participants in the Plan at this time.
Call today to start reinvesting dividends and/or distributions
For more information on the Nuveen Automatic Reinvestment Plan or to enroll in or withdraw from the Plan, speak with your financial advisor or call us at (800) 257-8787.
Glossary of Terms
Used in this Report
| |
■ Auction Rate Bond: An auction rate bond is a security whose interest payments are |
| adjusted periodically through an auction process, which process typically also serves |
| as a means for buying and selling the bond. Auctions that fail to attract enough buyers |
| for all the shares offered for sale are deemed to have “failed,” with current holders |
| receiving a formula-based interest rate until the next scheduled auction. |
| |
■ Average Annual Total Return: This is a commonly used method to express an |
| investment’s performance over a particular, usually multi-year time period. It |
| expresses the return that would have been necessary each year to equal the invest- |
| ment’s actual cumulative performance (including change in NAV or market price |
| and reinvested dividends and capital gains distributions, if any) over the time period |
| being considered. |
| |
■ Average Effective Maturity: The average of the number of years to maturity of the |
| bonds in a Fund’s portfolio, computed by weighting each bond’s time to maturity (the |
| date the security comes due) by the market value of the security. This figure does not |
| account for the likelihood of prepayments or the exercise of call provisions unless an |
| escrow account has been established to redeem the bond before maturity. The |
| market value weighting for an investment in an inverse floating rate security is the |
| value of the portfolio’s residual interest in the inverse floating rate trust, and does not |
| include the value of the floating rate securities issued by the trust. |
| |
■ Inverse Floaters: Inverse floating rate securities, also known as inverse floaters, are |
| created by depositing a municipal bond, typically with a fixed interest rate, into a |
| special purpose trust created by a broker-dealer. This trust, in turn, (a) issues floating |
| rate certificates typically paying short-term tax-exempt interest rates to third parties in |
| amounts equal to some fraction of the deposited bond’s par amount or market value, |
| and (b) issues an inverse floating rate certificate (sometimes referred to as an “inverse |
| floater”) to an investor (such as a Fund) interested in gaining investment exposure to a |
| long-term municipal bond. The income received by the holder of the inverse floater |
| varies inversely with the short-term rate paid to the floating rate certificates’ holders, |
| and in most circumstances the holder of the inverse floater bears substantially all of |
| the underlying bond’s downside investment risk. The holder of the inverse floater typi- |
| cally also benefits disproportionately from any potential appreciation of the underlying |
| bond’s value. Hence, an inverse floater essentially represents an investment in the |
| underlying bond on a leveraged basis. |
Nuveen Investments 77
Glossary of Terms
Used in this Report (continued)
| |
■ Leverage-Adjusted Duration: Duration is a measure of the expected period |
| over which a bond’s principal and interest will be paid, and consequently is a measure |
| of the sensitivity of a bond’s or bond Fund’s value to changes when market interest |
| rates change. Generally, the longer a bond’s or Fund’s duration, the more the price of |
| the bond or Fund will change as interest rates change. Leverage-adjusted duration |
| takes into account the leveraging process for a Fund and therefore is longer than the |
| duration of the Fund’s portfolio of bonds. |
| |
■Market Yield (also known as Dividend Yield or Current Yield): An investment’s |
| current annualized dividend divided by its current market price. |
| |
■Net Asset Value (NAV): A Fund’s NAV per common share is calculated by subtracting |
| the liabilities of the Fund (including any Preferred shares issued in order to leverage |
| the Fund) from its total assets and then dividing the remainder by the number of |
| common shares outstanding. Fund NAVs are calculated at the end of each |
| business day. |
| |
■Pre-refunding: Pre-refunding, also known as advanced refundings or refinancings, |
| is a procedure used by state and local governments to refinance municipal bonds |
| to lower interest expenses. The issuer sells new bonds with a lower yield and uses |
| the proceeds to buy U.S. Treasury securities, the interest from which is used to make |
| payments on the higher-yielding bonds. Because of this collateral, pre-refunding |
| generally raises a bond’s credit rating and thus its value. |
| |
■Taxable-Equivalent Yield: The yield necessary from a fully taxable investment to equal, |
| on an after-tax basis, the yield of a municipal bond investment. |
| |
■Zero Coupon Bond: A zero coupon bond does not pay a regular interest coupon to its |
| holders during the life of the bond. Tax-exempt income to the holder of the bond |
| comes from accretion of the difference between the original purchase price of the |
| bond at issuance and the par value of the bond at maturity and is effectively paid at |
| maturity. The market prices of zero coupon bonds generally are more volatile than the |
| market prices of bonds that pay interest periodically. |
Notes
Nuveen Investments 79
Notes
Other Useful Information
Board of
Directors/Trustees
John P. Amboian
Robert P. Bremner
Jack B. Evans
William C. Hunter
David J. Kundert
William J. Schneider
Judith M. Stockdale
Carole E. Stone
Terence J. Toth
Fund Manager
Nuveen Asset Management
333 West Wacker Drive
Chicago, IL 60606
Custodian
State Street Bank & Trust
Company Boston, MA
Transfer Agent and
Shareholder Services
State Street Bank & Trust Company
Nuveen Funds
P.O. Box 43071
Providence, RI 02940-3071
(800) 257-8787
Legal Counsel
Chapman and Cutler LLP
Chicago, IL
Independent Registered
Public Accounting Firm
Ernst & Young LLP
Chicago, IL
Quarterly Portfolio of Investments and Proxy Voting Information
You may obtain (i) each Fund’s quarterly portfolio of investments, (ii) information regarding how the Funds voted proxies relating to portfolio securities held during the most recent twelve-month period ended June 30, and (iii) a description of the policies and procedures that the Funds used to determine how to vote proxies relating to portfolio securities without charge, upon request, by calling Nuveen Investments toll-free at (800) 257-8787 or on Nuveen’s website at www.nuveen.com.
You may also obtain this and other Fund information directly from the Securities and Exchange Commission (“SEC”). The SEC may charge a copying fee for this information. Visit the SEC on-line at http://www.sec.gov or in person at the SEC’s Public Reference Room in Washington, D.C. Call the SEC at (202) 942-8090 for room hours and operation. You may also request Fund information by sending an e-mail request to publicinfo@sec.gov or by writing to the SEC’s Public References Section at 100 F Street NE, Washington, D.C. 20549.
CEO Certification Disclosure
Each Fund’s Chief Executive Officer has submitted to the New York Stock Exchange (“NYSE”) the annual CEO certification as required by Section 303A.12(a) of the NYSE Listed Company Manual.
Each Fund has filed with the SEC the certification of its Chief Executive Officer and Chief Financial Officer required by Section 302 of the Sarbanes-Oxley Act.
Common and Preferred Share Information
Each Fund intends to repurchase and/or redeem shares of its own common and/or preferred stock in the future at such times and in such amounts as is deemed advisable. During the period covered by this report, the Funds repurchased and/or redeemed shares of their common and/or preferred stock as shown in the accompanying table.
| | | |
| | Common Shares | Preferred Shares |
| Fund | Repurchased | Redeemed |
| NAZ | — | — |
| NFZ | — | — |
| NKR | — | — |
| NXE | — | — |
| NTX | — | — |
Any future repurchases and/or redemptions will be reported to shareholders in the next annual or semi-annual report.
Nuveen Investments 81
Serving Investors for Generations
Since 1898, financial advisors and their clients have relied on Nuveen Investments to provide dependable investment solutions through continued adherence to proven, long-term investing principles. Today, we offer a range of high quality equity and fixed-income solutions designed to be integral components of a well-diversified core portfolio.
Focused on meeting investor needs.
Nuveen Investments is a global investment management firm that seeks to help secure the long-term goals of institutions and high net worth investors as well as the consultants and financial advisors who serve them. We market our growing range of specialized investment solutions under the high-quality brands of HydePark, NWQ, Nuveen, Santa Barbara, Symphony, Tradewinds and Winslow Capital. In total, Nuveen Investments managed approximately $150 billion of assets on June 30, 2010.
Find out how we can help you.
To learn more about the products and services of Nuveen Investments may be able to help you meet your financial goals, talk to your financial advisor, or call us at (800) 257-8787. Please read the information provided carefully before you invest. Investors should consider the investment objective and policies, risk considerations, charges and expenses of any investment carefully. Where applicable, be sure to obtain a prospectus, which contains this and other relevant information. To obtain a prospectus, please contact your securities representative or Nuveen Investments, 333 W. Wacker Dr., Chicago, IL 60606. Please read the prospectus carefully before you invest or send money.
Learn more about Nuveen Funds at: www.nuveen.com/cef
Nuveen makes things e-simple.
It only takes a minute to sign up for e-Reports. Once enrolled, you’ll receive an e-mail as soon as your Nuveen Investments Fund information is ready. No more waiting for delivery by regular mail. Just click on the link within the e-mail to see the report and save it on your computer if you wish.
Free e-Reports right to your e-mail!
www.investordelivery.com
If you receive your Nuveen Fund dividends and statements from your financial advisor or brokerage account.
OR
www.nuveen.com/accountaccess
If you receive your Nuveen Fund dividends and statements directly from Nuveen.
Distributed by
Nuveen Investments, LLC
333 West Wacker Drive
Chicago, IL 60606
www.nuveen.com
EAN-A-0710D
ITEM 2. CODE OF ETHICS.
As of the end of the period covered by this report, the registrant has adopted a code of ethics that applies to the registrant's principal executive officer, principal financial officer, principal accounting officer or controller, or persons performing similar functions. There were no amendments to or waivers from the Code during the period covered by this report. The registrant has posted the code of ethics on its website at www.nuveen.com/CEF/Info/Shareholder. (To view the code, click on Fund Governance and then click on Code of Conduct.)
ITEM 3. AUDIT COMMITTEE FINANCIAL EXPERT.
The registrant's Board of Directors or Trustees ("Board") determined that the registrant has at least one "audit committee financial expert" (as defined in Item 3 of Form N-CSR) serving on its Audit Committee. The registrant's audit committee financial expert is Jack B. Evans, who is "independent" for purposes of Item 3 of Form N-CSR.
Mr. Evans was formerly President and Chief Operating Officer of SCI Financial Group, Inc., a full service registered broker-dealer and registered investment adviser ("SCI"). As part of his role as President and Chief Operating Officer, Mr. Evans actively supervised the Chief Financial Officer (the "CFO") and actively supervised the CFO's preparation of financial statements and other filings with various regulatory authorities. In such capacity, Mr. Evans was actively involved in the preparation of SCI's financial statements and the resolution of issues raised in connection therewith. Mr. Evans has also served on the audit committee of various reporting companies. At such companies, Mr. Evans was involved in the oversight of audits, audit plans, and the preparation of financial statements. Mr. Evans also formerly chaired the audit committe e of the Federal Reserve Bank of Chicago.
ITEM 4. PRINCIPAL ACCOUNTANT FEES AND SERVICES.
Nuveen Arizona Premium Income Municipal Fund, Inc.
The following tables show the amount of fees that Ernst & Young LLP, the Fund's auditor, billed to the Fund during the Fund's last two full fiscal years. For engagements with Ernst & Young LLP the Audit Committee approved in advance all audit services and non-audit services that Ernst & Young LLP provided to the Fund, except for those non-audit services that were subject to the pre-approval exception under Rule 2-01 of Regulation S-X (the "pre-approval exception"). The pre-approval exception for services provided directly to the Fund waives the pre-approval requirement for services other than audit, review or attest services if: (A) the aggregate amount of all such services provided constitutes no more than 5% of the total amount of revenues paid by the Fund to its accountant during the fiscal year in which the services are pr ovided; (B) the Fund did not recognize the services as non-audit services at the time of the engagement; and (C) the services are promptly brought to the Audit Committee's attention, and the Committee (or its delegate) approves the services before the audit is completed.
The Audit Committee has delegated certain pre-approval responsibilities to its Chairman (or, in his absence, any other member of the Audit Committee).
SERVICES THAT THE FUND'S AUDITOR BILLED TO THE FUND
| | | Audit Fees Billed | | | Audit-Related Fees | | | Tax Fees | | | All Other Fees | |
| Fiscal Year Ended | | to Fund 1 | | | Billed to Fund 2 | | | Billed to Fund 3 | | | Billed to Fund 4 | |
| July 31, 2010 | | $ | 10,252 | | | $ | 0 | | | $ | 0 | | | $ | 3,400 | |
| | | | | | | | | | | | | | | | | |
| Percentage approved | | | 0 | % | | | 0 | % | | | 0 | % | | | 0 | % |
| pursuant to | | | | | | | | | | | | | | | | |
| pre-approval | | | | | | | | | | | | | | | | |
| exception | | | | | | | | | | | | | | | | |
| | | | | | | | | | | | | | | | | |
| July 31, 2009 | | $ | 10,109 | | | $ | 0 | | | $ | 0 | | | $ | 3,400 | |
| | | | | | | | | | | | | | | | | |
| Percentage approved | | | 0 | % | | | 0 | % | | | 0 | % | | | 0 | % |
| pursuant to | | | | | | | | | | | | | | | | |
| pre-approval | | | | | | | | | | | | | | | | |
| exception | | | | | | | | | | | | | | | | |
| | | | | | | | | | | | | | | | | |
1 "Audit Fees" are the aggregate fees billed for professional services for the audit of the Fund's annual financial statements and services | |
| provided in connection with statutory and regulatory filings or engagements. | | | | | | | | | |
| | | | | | | | | | | | | | | | | |
2 "Audit Related Fees" are the aggregate fees billed for assurance and related services reasonably related to the performance of the | |
| audit or review of financial statements and are not reported under "Audit Fees". | | | | | | | | | |
| | | | | | | | | | | | | | | | | |
3 "Tax Fees" are the aggregate fees billed for professional services for tax advice, tax compliance, and tax planning. | | | | | |
| | | | | | | | | | | | | | | | | |
4 "All Other Fees" are the aggregate fees billed for products and services for agreed upon procedures engagements performed for leveraged funds. | |
SERVICES THAT THE FUND'S AUDITOR BILLED TO THE ADVISER AND AFFILIATED FUND SERVICE PROVIDERS
The following tables show the amount of fees billed by Ernst & Young LLP to Nuveen Asset Management ("NAM" or the "Adviser"), and any entity controlling, controlled by or under common control with NAM that provides ongoing services to the Fund ("Affiliated Fund Service Provider"), for engagements directly related to the Fund's operations and financial reporting, during the Fund's last two full fiscal years.
The tables also show the percentage of fees subject to the pre-approval exception. The pre-approval exception for services provided to the Adviser and any Affiliated Fund Service Provider (other than audit, review or attest services) waives the pre-approval requirement if: (A) the aggregate amount of all such services provided constitutes no more than 5% of the total amount of revenues paid to Ernst & Young LLP by the Fund, the Adviser and Affiliated Fund Service Providers during the fiscal year in which the services are provided that would have to be pre-approved by the Audit Committee; (B) the Fund did not recognize the services as non-audit services at the time of the engagement; and (C) the services are promptly brought to the Audit Committee's attention, and the Committee (or its delegate) approves the services before the Fund's audit is completed.
| Fiscal Year Ended | | Audit-Related Fees | | | Tax Fees Billed to | | | All Other Fees | |
| | | Billed to Adviser and | | | Adviser and | | | Billed to Adviser | |
| | | Affiliated Fund | | | Affiliated Fund | | | and Affiliated Fund | |
| | | Service Providers | | | Service Providers | | | Service Providers | |
| July 31, 2010 | | $ | 0 | | | $ | 0 | | | $ | 0 | |
| | | | | | | | | | | | | |
| Percentage approved | | | 0 | % | | | 0 | % | | | 0 | % |
| pursuant to | | | | | | | | | | | | |
| pre-approval | | | | | | | | | | | | |
| exception | | | | | | | | | | | | |
| | | | | | | | | | | | | |
| July 31, 2009 | | $ | 0 | | | $ | 0 | | | $ | 0 | |
| | | | | | | | | | | | | |
| Percentage approved | | | 0 | % | | | 0 | % | | | 0 | % |
| pursuant to | | | | | | | | | | | | |
| pre-approval | | | | | | | | | | | | |
| exception | | | | | | | | | | | | |
NON-AUDIT SERVICES
The following table shows the amount of fees that Ernst & Young LLP billed during the Fund's last two full fiscal years for non-audit services. The Audit Committee is required to pre-approve non-audit services that Ernst & Young LLP provides to the Adviser and any Affiliated Fund Services Provider, if the engagement related directly to the Fund's operations and financial reporting (except for those subject to the pre-approval exception described above). The Audit Committee requested and received information from Ernst & Young LLP about any non-audit services that Ernst & Young LLP rendered during the Fund's last fiscal year to the Adviser and any Affiliated Fund Service Provider. The Committee considered this information in evaluating Ernst & Young LLP's independence.
| Fiscal Year Ended | | | | | Total Non-Audit Fees | | | | | | | |
| | | | | | billed to Adviser and | | | | | | | |
| | | | | | Affiliated Fund Service | | | Total Non-Audit Fees | | | | |
| | | | | | Providers (engagements | | | billed to Adviser and | | | | |
| | | | | | related directly to the | | | Affiliated Fund Service | | | | |
| | | Total Non-Audit Fees | | | operations and financial | | | Providers (all | | | | |
| | | Billed to Fund | | | reporting of the Fund) | | | other engagements) | | | Total | |
| July 31, 2010 | | $ | 3,400 | | | $ | 0 | | | $ | 0 | | | $ | 3,400 | |
| July 31, 2009 | | $ | 3,400 | | | $ | 0 | | | $ | 0 | | | $ | 3,400 | |
| | | | | | | | | | | | | | | | | |
| "Non-Audit Fees billed to Fund" for both fiscal year ends represent "Tax Fees" and "All Other Fees" billed to Fund in their respective | |
| amounts from the previous table. | | | | | | | | | | | | | | | | |
Audit Committee Pre-Approval Policies and Procedures. Generally, the Audit Committee must approve (i) all non-audit services to be performed for the Fund by the Fund's independent accountants and (ii) all audit and non-audit services to be performed by the Fund's independent accountants for the Affiliated Fund Service Providers with respect to operations and financial reporting of the Fund. Regarding tax and research projects conducted by the independent accountants for the Fund and Affiliated Fund Service Providers (with respect to operations and financial reports of the Fund) such engagements will be (i) pre-approved by the Audit Committee if they are expected to be for amounts greater than $10,000; (ii) reported to the Audit Committee chairman for his verbal approval prior to engagement if they are expected to be for amounts under $10,000 but greater than $5,000; and (iii) reported to the Audit Committee at the next Audit Co mmittee meeting if they are expected to be for an amount under $5,000.
ITEM 5. AUDIT COMMITTEE OF LISTED REGISTRANTS.
The registrant's Board has a separately designated Audit Committee established in accordance with Section 3(a)(58)(A) of the Securities Exchange Act of 1934, as amended (15 U.S.C. 78c(a)(58)(A)). The members of the audit committee are Robert P. Bremner, Jack B. Evans, Terence J. Toth, William J. Schneider and David J. Kundert.
ITEM 6. SCHEDULE OF INVESTMENTS.
a) See Portfolio of Investments in Item 1.
b) Not applicable.
ITEM 7. DISCLOSURE OF PROXY VOTING POLICIES AND PROCEDURES FOR CLOSED-END MANAGEMENT INVESTMENT COMPANIES.
The registrant invests its assets primarily in municipal bonds and cash management securities. On rare occasions the registrant may acquire, directly or through a special purpose vehicle, equity securities of a municipal bond issuer whose bonds the registrant already owns when such bonds have deteriorated or are expected shortly to deteriorate significantly in credit quality. The purpose of acquiring equity securities generally will be to acquire control of the municipal bond issuer and to seek to prevent the credit deterioration or facilitate the liquidation or other workout of the distressed issuer's credit problem. In the course of exercising control of a distressed municipal issuer, NAM may pursue the registrant's interests in a variety of ways, which may entail negotiating and executing consents, agreements and other arrangements, an d otherwise influencing the management of the issuer. NAM does not consider such activities proxy voting for purposes of Rule 206(4)-6 under the 1940 Act, but nevertheless provides reports to the registrant's Board on its control activities on a quarterly basis.
In the rare event that a municipal issuer were to issue a proxy or that the registrant were to receive a proxy issued by a cash management security, NAM would either engage an independent third party to determine how the proxy should be voted or vote the proxy with the consent, or based on the instructions, of the registrant's Board or its representative. A member of NAM's legal department would oversee the administration of the voting, and ensure that records were maintained in accordance with Rule 206(4)-6, reports were filed with the SEC on Form N-PX, and the results provided to the registrant's Board and made available to shareholders as required by applicable rules.
ITEM 8. PORTFOLIO MANAGERS OF CLOSED-END MANAGEMENT INVESTMENT COMPANIES.
The Portfolio Manager
The following individual has primary responsibility for the day-to-day implementation of the registrant’s investment strategies:
| Name | Fund |
| Scott R. Romans | Nuveen Arizona Premium Income Municipal Fund, Inc. |
Other Accounts Managed. In addition to managing the registrant, the portfolio manager is also primarily responsible for the day-to-day portfolio management of the following accounts:
| Portfolio Manager | Type of Account Managed | Number of Accounts | Assets* |
| Scott R. Romans | Registered Investment Company | 29 | $5.697 billion |
| | Other Pooled Investment Vehicles | 0 | $0 |
| | Other Accounts | 2 | $.526 million |
| * | Assets are as of July 31, 2010. None of the assets in these accounts are subject to an advisory fee based on performance. |
Compensation. Each portfolio manager’s compensation consists of three basic elements—base salary, cash bonus and long-term incentive compensation. The compensation strategy is to annually compare overall compensation to the market in order to create a compensation structure that is competitive and consistent with similar financial services companies. As discussed below, several factors are considered in determining each portfolio manager’s total compensation. In any year these factors may include, among others, the effectiveness of the investment strategies recommended by the portfolio manager’s investment team, the investment performance of the accounts managed by the portfolio mana ger, and the overall performance of Nuveen Investments, Inc. (the parent company of NAM). Although investment performance is a factor in determining the portfolio manager’s compensation, it is not necessarily a decisive factor. The portfolio manager’s performance is evaluated in part by comparing manager’s performance against a specified investment benchmark. This fund-specific benchmark is a customized subset (limited to bonds in each Fund’s specific state and with certain maturity parameters) of the S&P/Investortools Municipal Bond index, an index comprised of bonds held by managed municipal bond fund customers of Standard & Poor’s Securities Pricing, Inc. that are priced daily and whose fund holdings aggregate at least $2 million. As of August 31, 2010, the S&P/Investortools Municipal Bond index was comprised of 55,826 securities with an aggregate current market value of $1,217 billion.
Base salary. Each portfolio manager is paid a base salary that is set at a level determined by NAM in accordance with its overall compensation strategy discussed above. NAM is not under any current contractual obligation to increase a portfolio manager’s base salary.
Cash bonus. Each portfolio manager is also eligible to receive an annual cash bonus. The level of this bonus is based upon evaluations and determinations made by each portfolio manager’s supervisors, along with reviews submitted by his peers. These reviews and evaluations often take into account a number of factors, including the effectiveness of the investment strategies recommended to the NAM’s investment team, the performance of the accounts for which he serves as portfolio manager relative to any benchmarks established for those accounts, his effectiveness in communicating investment performance to stockholders and their representatives, and his contribution to the NAM’s investment pro cess and to the execution of investment strategies. The cash bonus component is also impacted by the overall performance of Nuveen Investments, Inc. in achieving its business objectives.
Long-term incentive compensation. In connection with the acquisition of Nuveen Investments, Inc., by a group of investors lead by Madison Dearborn Partners in November 2007, certain employees, including portfolio managers, received profit interests in Nuveen’s parent. These profit interests entitle the holders to participate in the appreciation in the value of Nuveen beyond the issue date and vest over five to seven years, or earlier in the case of a liquidity event. In addition, in July 2009, Nuveen Investments created and funded a trust, as part of a newly-established incentive program, which purchased shares of certain Nuveen Mutual Funds and awarded suc h shares, subject to vesting, to certain employees, including portfolio managers.
Material Conflicts of Interest. Each portfolio manager’s simultaneous management of the registrant and the other accounts noted above may present actual or apparent conflicts of interest with respect to the allocation and aggregation of securities orders placed on behalf of the Registrant and the other account. NAM, however, believes that such potential conflicts are mitigated by the fact that the NAM has adopted several policies that address potential conflicts of interest, including best execution and trade allocation policies that are designed to ensure (1) that portfolio management is seeking the best price for portfolio securities under the circumstances, (2) fair and equitable allocation of inve stment opportunities among accounts over time and (3) compliance with applicable regulatory requirements. All accounts are to be treated in a non-preferential manner, such that allocations are not based upon account performance, fee structure or preference of the portfolio manager. In addition, NAM has adopted a Code of Conduct that sets forth policies regarding conflicts of interest.
Beneficial Ownership of Securities. As of July 31, 2010 the portfolio manager beneficially owned the following dollar range of equity securities issued by the Registrant and other Nuveen Funds managed by NAM’s municipal investment team.
| Name of Portfolio Manager | Fund | Dollar range of equity securities beneficially owned in Fund | | Dollar range of equity securities beneficially owned in the remainder of Nuveen funds managed by NAM's municipal investment team |
| Scott R. Romans | Nuveen Arizona Premium Income Municipal Fund, Inc. | $0 | | $0 |
PORTFOLIO MANAGER BIO:
Scott R. Romans, PhD joined Nuveen Investments in 2000 as a senior analyst covering higher education, charter schools and private secondary schools. In 2003, he was assigned management responsibility for several closed- and open-ended municipal bond funds most of which are state funds covering California and other western states. He has been Senior Vice President since 2010, formerly, Vice President (2004-2010) of NAM. Currently, he manages investments for 30 Nuveen-sponsored investment companies.
ITEM 9. PURCHASES OF EQUITY SECURITIES BY CLOSED-END MANAGEMENT INVESTMENT COMPANY AND AFFILIATED PURCHASERS.
Not applicable.
ITEM 10. SUBMISSION OF MATTERS TO A VOTE OF SECURITY HOLDERS.
There have been no material changes to the procedures by which shareholders may recommend nominees to the registrant's Board implemented after the registrant last provided disclosure in response to this item.
ITEM 11. CONTROLS AND PROCEDURES.
| (a) | The registrant's principal executive and principal financial officers, or persons performing similar functions, have concluded that the registrant's disclosure controls and procedures (as defined in Rule 30a-3(c) under the Investment Company Act of 1940, as amended (the "1940 Act") (17 CFR 270.30a-3(c))) are effective, as of a date within 90 days of the filing date of this report that includes the disclosure required by this paragraph, based on their evaluation of the controls and procedures required by Rule 30a-3(b) under the 1940 Act (17 CFR 270.30a-3(b)) and Rules 13a-15(b) or 15d-15(b) under the Securities Exchange Act of 1934, as amended (the "Exchange Act") (17 CFR 240.13a-15(b) or 240.15d-15(b)). |
| (b) | There were no changes in the registrant's internal control over financial reporting (as defined in Rule 30a-3(d) under the 1940 Act (17 CFR 270.30a-3(d)) that occurred during the second fiscal quarter of the period covered by this report that has materially affected, or is reasonably likely to materially affect, the registrant's internal control over financial reporting. |
ITEM 12. EXHIBITS.
File the exhibits listed below as part of this Form. Letter or number the exhibits in the sequence indicated.
| (a)(1) | Any code of ethics, or amendment thereto, that is the subject of the disclosure required by Item 2, to the extent that the registrant intends to satisfy the Item 2 requirements through filing of an exhibit: Not applicable because the code is posted on registrant's website at www.nuveen.com/CEF/Info/ Shareholder and there were no amendments during the period covered by this report. (To view the code, click on Fund Governance and then Code of Conduct.) |
| (a)(2) | A separate certification for each principal executive officer and principal financial officer of the registrant as required by Rule 30a-2(a) under the 1940 Act (17 CFR 270.30a-2(a)) in the exact form set forth below: Ex-99.CERT Attached hereto. |
| (a)(3) | Any written solicitation to purchase securities under Rule 23c-1 under the 1940 Act (17 CFR 270.23c-1) sent or given during the period covered by the report by or on behalf of the registrant to 10 or more persons. Not applicable. |
| (b) | If the report is filed under Section 13(a) or 15(d) of the Exchange Act, provide the certifications required by Rule 30a-2(b) under the 1940 Act (17 CFR 270.30a-2(b)); Rule 13a-14(b) or Rule 15d-14(b) under the Exchange Act (17 CFR 240.13a-14(b) or 240.15d-14(b)), and Section 1350 of Chapter 63 of Title 18 of the United States Code (18 U.S.C. 1350) as an exhibit. A certification furnished pursuant to this paragraph will not be deemed "filed" for purposes of Section 18 of the Exchange Act (15 U.S.C. 78r), or otherwise subject to the liability of that section. Such certification will not be deemed to be incorporated by reference into any filing under the Securities Act of 1933 or the Exchange Act, except to the extent that the registrant specifically incorporates it by reference. Ex-99.906 CERT attached hereto. |
SIGNATURES
Pursuant to the requirements of the Securities Exchange Act of 1934 and the Investment Company Act of 1940, the registrant has duly caused this report to be signed on its behalf by the undersigned, thereunto duly authorized.
(Registrant) Nuveen Arizona Premium Income Municipal Fund, Inc.
By (Signature and Title) /s/ Kevin J. McCarthy
Kevin J. McCarthy
Vice President and Secretary
Date: October 7, 2010
Pursuant to the requirements of the Securities Exchange Act of 1934 and the Investment Company Act of 1940, this report has been signed below by the following persons on behalf of the registrant and in the capacities and on the dates indicated.
By (Signature and Title) /s/ Gifford R. Zimmerman
Gifford R. Zimmerman
Chief Administrative Officer
(principal executive officer)
Date: October 7, 2010
By (Signature and Title) /s/ Stephen D. Foy
Stephen D. Foy
Vice President and Controller
(principal financial officer)
Date: October 7, 2010