UNITED STATES
SECURITIES AND EXCHANGE COMMISSION
Washington, D.C. 20549
FORM N-CSR
CERTIFIED SHAREHOLDER REPORT OF
REGISTERED MANAGEMENT INVESTMENT COMPANIES
Investment Company Act file number 811-7278
Nuveen Arizona Premium Income Municipal Fund, Inc.
(Exact name of registrant as specified in charter)
Nuveen Investments
333 West Wacker Drive
Chicago, IL 60606
(Address of principal executive offices) (Zip code)
Kevin J. McCarthy
Nuveen Investments
333 West Wacker Drive
Chicago, IL 60606
(Name and address of agent for service)
Registrant's telephone number, including area code: (312) 917-7700
Date of fiscal year end: February 29
Date of reporting period: February 29, 2012
Form N-CSR is to be used by management investment companies to file reports with the Commission not later than 10 days after the transmission to stockholders of any report that is required to be transmitted to stockholders under Rule 30e-1 under the Investment Company Act of 1940 (17 CFR 270.30e-1). The Commission may use the information provided on Form N-CSR in its regulatory, disclosure review, inspection, and policymaking roles.
A registrant is required to disclose the information specified by Form N-CSR, and the Commission will make this information public. A registrant is not required to respond to the collection of information contained in Form N-CSR unless the Form displays a currently valid Office of Management and Budget (“OMB”) control number. Please direct comments concerning the accuracy of the information collection burden estimate and any suggestions for reducing the burden to Secretary, Securities and Exchange Commission, 450 Fifth Street, NW, Washington, DC 20549-0609. The OMB has reviewed this collection of information under the clearance requirements of 44 U.S.C. ss. 3507.
ITEM 1. REPORTS TO STOCKHOLDERS.
LIFE IS COMPLEX.
Nuveen makes things e-simple.
It only takes a minute to sign up for e-Reports. Once enrolled, you’ll receive an e-mail as soon as your Nuveen Fund information is ready. No more waiting for delivery by regular mail. Just click on the link within the e-mail to see the report and save it on your computer if you wish.
Free e-Reports right to your e-mail!
www.investordelivery.com
If you receive your Nuveen Fund distributions and statements from your financial advisor or brokerage account.
OR
www.nuveen.com/accountaccess
If you receive your Nuveen Fund distributions and statements directly from Nuveen.
Table of Contents
| | |
| Chairman’s Letter to Shareholders | 4 |
| Portfolio Managers’ Comments | 5 |
| Fund Leverage and Other Information | 12 |
| Common Share Dividend and Price Information | 14 |
| Performance Overviews | 16 |
| Shareholder Meeting Report | 21 |
| Report of Independent Registered Public Accounting Firm | 23 |
| Portfolios of Investments | 24 |
| Statement of Assets and Liabilities | 47 |
| Statement of Operations | 48 |
| Statement of Changes in Net Assets | 49 |
| Statement of Cash Flows | 52 |
| Financial Highlights | 54 |
| Notes to Financial Statements | 63 |
| Board Member & Officers | 76 |
| Reinvest Automatically, Easily and Conveniently | 81 |
| Glossary of Terms Used in this Report | 83 |
| Additional Fund Information | 87 |
Chairman’s
Letter to Shareholders
Dear Shareholders,
In recent months the positive atmosphere in financial markets has reflected efforts by central banks in the US and Europe to provide liquidity to the financial system and keep interest rates low. At the same time, future economic growth in these countries still faces serious headwinds in the form of high energy prices, uncertainties about potential political leadership changes and increasing pressure to reduce government spending regardless of its impact on the economy. Together with the continuing political tensions in the Middle East, investors have many reasons to remain cautious.
Though progress has been painfully slow, officials in Europe have taken important steps to address critical issues. The European Central Bank has provided vital liquidity to the banking system. Similarly, officials in the Euro area finally agreed to an enhanced “firewall” of funding to deal with financial crises in member countries. These steps, in addition to the completion of another round of financing for Greece, have eased credit conditions across the Continent. Several very significant challenges remain with the potential to derail the recent progress but European leaders have demonstrated political will and persistence in dealing with their problems.
In the US, strong corporate earnings and continued progress on job creation have contributed to a rebound in the equity market and many of the major stock market indexes are approaching their levels before the financial crisis. The Fed’s commitment to an extended period of low interest rates is promoting economic growth, which remains moderate but steady and raises concerns about the future course of long term rates once the program ends. Pre-election maneuvering has added to the highly partisan atmosphere in the Congress. The end of the Bush-era tax cuts and implementation of the spending restrictions of the Budget Control act of 2011, both scheduled to take place at year-end loom closer with little progress being made to deal with them.
During the last year investors have experienced a sharp decline and a strong recovery in the equity markets. Experienced investment teams keep their eye on a longer time horizon and use their practiced investment disciplines to negotiate through market peaks and valleys to achieve long term goals for investors. Monitoring this process is an important consideration for the Fund Board as it oversees your Nuveen funds on your behalf.
As always, I encourage you to contact your financial consultant if you have any questions about your investment in a Nuveen Fund. On behalf of the other members of your Fund Board, we look forward to continuing to earn your trust in the months and years ahead.
Sincerely,
Robert P. Bremner
Chairman of the Board
April 20, 2012
Portfolio Managers’ Comments
Nuveen Arizona Premium Income Municipal Fund, Inc. (NAZ)
Nuveen Arizona Dividend Advantage Municipal Fund (NFZ)
Nuveen Arizona Dividend Advantage Municipal Fund 2 (NKR)
Nuveen Arizona Dividend Advantage Municipal Fund 3 (NXE)
Nuveen Texas Quality Income Municipal Fund (NTX)
Portfolio managers Michael Hamilton and Daniel Close review economic and municipal market conditions at the national and state levels, key investment strategies, and the twelve-month performance of these five Nuveen Funds. Michael, who has 23 years of investment experience, assumed portfolio management responsibility for the Arizona Funds in January 2011. An eleven-year veteran of Nuveen, Dan has managed NTX since 2007.
What factors affected the U.S. economic and municipal market environments during the twelve-month reporting period ended February 29, 2012?
During this period, the U.S. economy’s progress toward recovery from recession remained modest. The Federal Reserve (Fed) maintained its efforts to improve the overall economic environment by continuing to hold the benchmark fed funds rate at the record low level of zero to 0.25% that it had established in December 2008. At its March 2012 meeting (shortly after the end of this reporting period), the central bank reaffirmed its opinion that economic conditions would likely warrant keeping this rate at “exceptionally low levels” at least through late 2014. The Fed also stated that it would continue its program to extend the average maturity of its holdings of U.S. Treasury securities by purchasing $400 billion of these securities with maturities of six to thirty years and selling an equal amount of U.S. Treasury securities with maturities of three years or less. The goals of this program, which the Fed expects to complete by the end of June 2012, are to lower longer-term interest rates, support a stronger economic recovery, and help ensure that inflation remains at levels consistent with the Fed’s mandates of maximum employment and price stability.
In the fourth quarter of 2011, the U.S. economy, as measured by the U.S. gross domestic product (GDP), grew at an annualized rate of 3.0%, the best growth number since the end of second quarter 2010 and the tenth consecutive quarter of positive growth. The Consumer Price Index (CPI) rose 2.9% year-over-year as of February 2012, while the core CPI (which excludes food and energy) increased 2.2% during the same period, edging above the Fed’s unofficial objective of 2.0% or lower for this inflation measure. Labor market conditions have shown some signs of improvement, as national unemployment stood at 8.3% in February 2012, the lowest level in three years, down from 9.0% in February 2011. The housing market continued to be the major weak spot in the economy. For the twelve months ended January 2012 (most recent data available at the time this report was prepared), the average home price in the Standard & Poor’s (S&P)/Case-Shiller Index of 20 major metropolitan areas lost 3.8%, as housing prices hit their lowest levels since early 2003. In addition, the U.S. economic picture continued to be clouded by concerns about the European debt crisis and efforts to reduce the federal deficit.
Certain statements in this report are forward-looking statements. Discussions of specific investments are for illustration only and are not intended as recommendations of individual investments. The forward-looking statements and other views expressed herein are those of the portfolio managers as of the date of this report. Actual future results or occurrences may differ significantly from those anticipated in any forward-looking statements, and the views expressed herein are subject to change at any time, due to numerous market and other factors. The Funds disclaim any obligation to update publicly or revise any forward-looking statements or views expressed herein.
Ratings shown are the highest rating given by one of the following national rating agencies: Standard & Poor’s Group, Moody’s Investors Service, Inc. or Fitch, Inc. Credit ratings are subject to change. AAA, AA, A and BBB are investment grade ratings; BB, B, CCC, CC, C and D are below investment grade ratings. Certain bonds backed by U.S. Government or agency securities are regarded as having an implied rating equal to the rating of such securities. Holdings designated N/R are not rated by a national rating agency.
Municipal bond prices generally rallied over this period. Historically light issuance of new tax-exempt bonds served as a key driver of performance, as tight supply and strong demand combined to create favorable market conditions for municipal bonds. Concurrent with rising prices, yields declined across most maturities. The depressed level of municipal bond issuance was due in part to the continued impact of the taxable Build America Bonds (BAB) program. Even though the BAB program expired at the end of 2010, issuers had made extensive use of its favorable terms to issue almost $190 billion in taxable BAB bonds during 2009 and 2010, representing approximately 25% of all municipal issuance during that period. Some borrowers accelerated issuance in order to take advantage of the program before its termination, fulfilling their capital program borrowing needs well into 2011 and 2012. This reduced the need for many borrowers to come to market with new tax-exempt issues during this period. The low level of municipal issuance during this period also reflected the current political distaste for additional borrowing by state and local governments and the prevalent atmosphere of municipal budget austerity.
Over the twelve months ended February 29, 2012, municipal bond issuance nationwide totaled $307.4 billion, a decrease of 24% compared with issuance during the twelvemonth period ended February 28, 2011. During this period, demand for municipal bonds remained very strong, especially from individual investors.
How were the economic and market environments in Arizona and Texas during this period?
Arizona’s economy was hard hit by the recent recession, as the housing decline and a major slowdown in the state’s construction industry had repercussions throughout housing-related sectors, including manufacturing and finance. However, the pace of economic recovery has now picked up in Arizona, driven by labor market growth in education, health care, tourism and manufacturing. The state’s financial sector has also made marginal, but important gains in employment. As of February 2012, the unemployment rate in Arizona dropped to 8.7%, the lowest level in three years, down from 9.7% in February 2011. After three years of steep housing and construction market declines, Arizona has made some progress in working through its excess inventory of housing, although a significant number of foreclosure filings remained. According to the S&P/Case-Shiller Index, housing prices in Phoenix rose 1.3% over the twelve months ended January 2012 (most recent data available at the time this report was prepared). Phoenix was one of only three metropolitan areas (along with Detroit and Denver) to post an increase for this period, compared with an average decrease of 3.8% nationwide. For fiscal 2012, Arizona enacted an $8.3 billion general fund budget that closed an estimated $1.5 billion budget gap through spending cuts targeted at Medicaid and education-related funding, including K-12, community colleges and state universities. The state received approval from the federal government for a Medicaid waiver, which has allowed the state to contain program costs. The proposed
general fund budget for fiscal 2013 totaled $8.9 billion, an increase of 7%. At the end of fiscal 2013, the temporary one-cent sales tax, which was enacted in 2011, will expire, necessitating the location of additional revenue sources to avoid a potential budget gap for fiscal 2014. In February 2012, Moody’s affirmed its issuer credit rating of Aa3 for Arizona and changed its outlook to stable from negative, citing improved “overall liquidity and stabilization of the state’s budget position.” S&P affirmed its issuer rating of AA- and also changed its outlook to stable from negative in December 2011, citing “Arizona’s improving fiscal outlook.” For the twelve months ended February 29, 2012, municipal issuance in Arizona totaled $4.6 billion, down 20% from the previous twelve months.
Economic recovery has proceeded at a moderate pace in Texas, ahead of the national average rate of growth. Another active year for the oil and natural gas industry, a relatively healthy housing market and robust export performance have enabled Texas to maintain a stronger growth path. Nine of the state’s eleven major industries added jobs in 2011, with the fastest growth rates in the mining (oil and natural gas) and logging sectors. Unemployment in Texas remained lower than the national average throughout the recession and continued this positive trend in recent months. As of February 2012, the state’s unemployment rate was 7.1%, its best reading since April 2009, down from 8.0% in February 2011. This compares with the national unemployment rate of 8.3% in February 2012. The performance of the Texas job market played a role in keeping mortgage delinquency and default rates for the state well below the national average. Texas also benefited from the fact that there was no price boom or bust in the state’s housing market. According to the S&P/Case-Shiller Index, housing prices in Dallas posted a year-over-year decline of 1.2% as of January 2012 (most recent data available at the time this report was prepared), below the average decline of 3.8% nationwide. As Texas headed into fiscal 2011, the state faced a shortfall of approximately $4.3 billion, which was closed through the use of $3.1 billion of the state’s rainy day fund and $1.2 billion in spending reductions. The enacted fiscal 2012-2013 biennial budget cut the state’s all funds budget by 6% and reduced general fund spending by 2%, or $1.7 billion compared with fiscal 2010-2011. In December 2011, general revenues were forecast at $82.7 billion for the fiscal 2012-2013 biennium, an increase of 8.2% over the 2010-2011 budget cycle. As of February 2012, Moody’s and S&P rated Texas general obligation (GO) debt at Aaa and AA+, respectively, with stable outlooks. For the twelve months ended February 29, 2012, municipal issuance in Texas totaled $25.2 billion, a decrease of 30% from the previous twelve months. Texas continued to rank as the third largest state issuer behind New York and California.
What key strategies were used to manage the Arizona and Texas Funds during this reporting period?
As previously discussed, municipal bond prices generally rallied nationally during this period, as the supply of tax-exempt bonds remained tight and yields continued to be relatively low. In this environment, we continued to take a bottom-up approach to discovering sectors that appeared undervalued as well as individual credits that had the potential to perform well over the long term and helped us keep our Funds fully invested.
During this period, the Arizona Funds added to their positions in charter schools and health care. Because municipal issuance in Arizona continued to be lower than historical averages, we also looked for additional ways to put cash to work, purchasing some territorial bonds that are exempt from federal, state and local taxes. NTX took advantage of attractive opportunities to add to its holdings across a diverse array of sectors, including gas prepayment credits, water and sewer, airports and higher education, as well as state appropriation and dedicated tax bonds.
Our focus in the Arizona Funds generally was on purchasing bonds with longer maturities, while NTX emphasized intermediate and longer maturities. These purchases helped to keep the Funds’ durations within their targeted objectives, duration and yield curve positioning. The purchase of longer bonds also enabled us to take advantage of more attractive yields at the longer end of the municipal yield curve. From a quality perspective, NTX emphasized mid-grade to higher-rated credits, while our strategy in the Arizona Funds was to purchase lower-rated credits when we believed that they offered greater value relative to higher-rated bonds. In NTX, the majority of our purchases were made in the primary market, based on our belief that it offered more attractive structures during this period. Later in the period, as the municipal market rally continued, we began to position NTX slightly more defensively by purchasing bonds with more defensive structures in terms of coupons and call provisions.
Cash for new purchases was generated primarily by the proceeds from called and maturing bonds. An elevated number of bond calls, especially in NTX, during this period provided a meaningful source of liquidity, which drove much of our activity as we worked to redeploy the proceeds to keep the Funds fully invested. In addition, all of the Funds sold some short-dated, pre-refunded holdings when we needed additional cash to take advantage of attractive purchase opportunities.
As of February 29, 2012, all five of these Funds continued to use inverse floating rate securities. We employ inverse floaters for a variety of reasons, including duration management, income enhancement and total return enhancement.
How did the Funds perform during the twelve-month period ended February 29, 2012?
Individual results for the Nuveen Arizona and Texas Funds, as well as relevant index and peer group information, are presented in the accompanying table.
Average Annual Total Returns on Common Share Net Asset Value
For periods ended 2/29/12
| | 1-Year | | 5-Year | | 10-Year |
| Arizona Funds | | | | | |
| NAZ | 18.08% | | 5.59% | | 5.84% |
| NFZ | 19.56% | | 5.15% | | 6.12% |
| NKR | 16.91% | | 5.60% | | N/A |
| NXE | 17.30% | | 5.63% | | N/A |
| | | | | | |
| Standard & Poor’s (S&P) Arizona Municipal Bond Index* | 12.33% | | 5.39% | | 5.35% |
| Standard & Poor’s (S&P) National Municipal Bond Index* | 12.87% | | 5.19% | | 5.36% |
| Lipper Other States Municipal Debt Funds Classification Average* | 18.83% | | 5.61% | �� | 6.28% |
| Texas Fund | | | | | |
| NTX | 16.23% | | 5.86% | | 6.20% |
| | | | | | |
| Standard & Poor’s (S&P) Texas Municipal Bond Index* | 12.13% | | 5.45% | | 5.57% |
| Standard & Poor’s (S&P) National Municipal Bond Index* | 12.87% | | 5.19% | | 5.36% |
| Lipper Other States Municipal Debt Funds Classification Average* | 18.83% | | 5.61% | | 6.28% |
For the twelve months ended February 29, 2012, the total return on common share net asset value (NAV) for all five of the Funds in this report exceeded the returns for their respective state’s Standard & Poor’s (S&P) Municipal Bond Index as well as that of the S&P National Municipal Bond Index. For the same period, NFZ outperformed the average return for the Lipper Other States Municipal Debt Funds Classification Average, while the remaining four Funds trailed this Lipper average. Shareholders of the Arizona and Texas Funds should note that the performance of the Lipper other States classification represents the overall average returns for funds from ten different states with a wide variety of municipal market conditions, which may make direct comparisons less meaningful.
Key management factors that influenced the Funds’ returns during this period included duration and yield curve positioning, credit exposure and sector allocation. NFZ also benefited from strong individual security selection. In addition, the use of regulatory leverage was an important positive factor affecting the Funds’ performance. Leverage is discussed in more detail later in this report.
During this period, municipal bonds with longer maturities generally outperformed those with shorter maturities. Overall, credits at the longest end of the municipal yield curve posted the strongest returns, while bonds at the shortest end produced the weakest results. The Funds’ duration and yield curve positionings were important determinants of performance during this period and for NTX, credit rating was also an
| | Past performance is not predictive of future results. Current performance may be higher or lower than the data shown. Returns do not reflect the deduction of taxes that shareholders may have to pay on Fund distributions or upon the sale of Fund shares. |
| | |
| | For additional information, see the Performance Overview page for your Fund in this report. |
| | |
| * | Refer to Glossary of Terms Used in this Report for definitions. |
important determinant for performance. On the whole, NFZ was the most advantageously positioned in terms of duration and yield curve exposure. The Arizona Funds benefited from their weightings in the outperforming longer part of the yield curve while all Funds benefited from their underweightings in the shorter segments of the curve that underperformed. During this period, we worked to extend the duration of NKR, which had started the period with the shortest duration among the Arizona Funds. While we were successful in our duration extension efforts, NKR benefited less from the market environment of this period than the three Arizona Funds that had entered the period with longer durations. As a result, NKR’s return lagged that of the other Arizona Funds.
Credit exposure also played a role in performance during these twelve months, as lower-rated bonds, especially those rated BBB, generally outperformed higher-quality bonds rated AAA and AA. This outperformance was due in part to the greater demand for lower-rated bonds as investors looked for investments offering higher yields. Overall, the Arizona Funds benefited from being underweighted in bonds rated AAA and AA, which underperformed, while a strong weighting in BBB bonds helped NTX’s performance.
Holdings that generally made positive contributions to the Funds’ returns during this period included zero coupon bonds and health care, industrial development revenue (IDR), transportation and dedicated tax credits. Lease-backed and education bonds also outpaced the general municipal market for the period, while water and sewer credits just edged past the municipal market average. All of the Arizona Funds were overweighted in health care, while NTX’s performance was boosted by a heavy weighting in long-dated zero coupon bonds.
In contrast, pre-refunded bonds, which are often backed by U.S. Treasury securities, were the poorest performing market segment during this period. The underperformance of these bonds can be attributed primarily to their shorter effective maturities and higher credit quality. NAZ, NXE and NTX were overweighted in pre-refunded bonds, with NTX having heaviest weighting, which negatively impacted the performance of these three Funds. The public power, housing and resource recovery sectors also lagged the performance of the general municipal market for this period.
In addition, NTX held two credits—Dallas-Ft. Worth International Airport Facility Improvement Corporation for American Airlines and Brazos River Authority for TXU Electric Company—that meaningfully detracted from the Fund’s performance for this period. Due to competitive pressures, rising costs, reduced demand and mounting losses, American Airlines declared bankruptcy at the end of November 2011, and we sold our holdings in this credit at a loss in early December 2011. The Brazos/TXU bond price deteriorated in tandem with the decline in natural gas prices. As of February 29, 2012, we continued to hold this credit, based on its current valuation. At the same time, the Arizona Funds continued to monitor funding issues involving the Arizona Sports and Tourism Authority (AZSTA) and the potential impact on local municipalities. After funding derived from taxes on hotels and rental cars declined sharply during the recent recession, AZSTA has been unable to pay for improvements in spring training facilities
that were made to attract and keep major league baseball teams. The responsibility for covering these costs could now fall to the cities where the stadiums are located. NFZ held a position in insured bonds issued by the AZSTA, which posted a negative return for this reporting period, and all of the Funds hold credits issued by cities, specifically Glendale, that could be impacted by this situation.
APPROVED FUND REORGANIZATIONS
On April 18, 2012, the Funds’ Board of Directors/Trustees approved a series of reorganizations for all the Arizona Funds included in this report. The reorganizations are intended to create a single larger state Fund, which would potentially offer shareholders the following benefits:
| ● | Lower Fund expense ratios (excluding the effects of leverage), as fixed costs are spread over a larger asset base; |
| ● | Enhanced secondary market trading, as larger Funds potentially make it easier for investors to buy and sell Fund shares; |
| ● | Lower per share trading costs through reduced bid/ask spreads due to a larger common share float; and |
| ● | Increased Fund flexibility in managing the structure and cost of leverage over time. |
The approved reorganizations are as follows:
| Acquired Funds | | Symbol | | Acquiring Fund | | Symbol |
● Nuveen Arizona Dividend | | NFZ | | | | |
| Advantage Municipal Fund | | | | | | |
● Nuveen Arizona Dividend | | NKR | | Nuveen Arizona Premium | | NAZ |
| Advantage Municipal Fund 2 | | | | Income Municipal Fund, Inc. | | |
● Nuveen Arizona Dividend | | NXE | | | | |
| Advantage Municipal Fund 3 | | | | | | |
If shareholders approve the reorganizations, and upon the closing of the reorganizations, the Acquired Funds will transfer substantially all of their assets to the Acquiring Fund in exchange for common and preferred shares of the Acquiring Fund, and the assumption by the Acquiring Fund of the liabilities of the Acquired Funds. The Acquired Funds will then be liquidated, dissolved and terminated in accordance with their Declaration of Trust.
Fund Leverage and
Other Information
IMPACT OF THE FUNDS’ LEVERAGE STRATEGIES ON PERFORMANCE
One important factor impacting the return of the Funds relative to their benchmarks was the Funds’ use of leverage. The Funds use leverage because their managers believe that, over time, leveraging provides opportunities for additional income and total return for common shareholders. However, use of leverage also can expose common shareholders to additional volatility. For example, as the prices of securities held by a Fund decline, the negative impact of these valuation changes on common share net asset value and common shareholder total return is magnified by the use of leverage. Conversely, leverage may enhance common share returns during periods when the prices of securities held by a Fund generally are rising. Leverage had a positive impact on the performance of the Funds over this reporting period.
THE FUNDS’ REGULATORY LEVERAGE
As of February 29, 2012, each of the Funds has redeemed all of their outstanding auction rate preferred shares (ARPS) at liquidation value.
As of February 29, 2012, the Funds have issued and outstanding MuniFund Term Preferred (MTP) Shares and Variable Rate MuniFund Term Preferred (VMTP) Shares as shown in the accompanying tables.
MTP Shares
| | | | | | | | | | | | | | |
| Fund | | Series | | MTP Shares Issued at Liquidation Value | | Annual Interest Rate | | NYSE Ticker | |
| NFZ | | | 2015 | | | $11,100,000 | | | 2.05% | | | NFZ PrC | |
| NKR | | | 2015 | | | $18,725,000 | | | 2.05% | | | NKR PrC | |
| NXE | | | 2016 | | | $20,846,000 | | | 2.90% | | | NXE PrC | |
| NTX | | | 2015 | | | $70,920,000 | | | 2.30% | | | NTX PrC | |
| Fund | | Series | | VMTP Shares Issued at Liquidation Value |
| NAZ | | | 2014 | | $ | 28,000,000 |
(Refer to Notes to Financial Statements, Footnote 1 – General Information and Significant Accounting Policies and Footnote 4 – Fund Shares for further details on MTP and VMTP Shares.)
As of October 5, 2011, all 84 of the Nuveen closed-end municipal funds that had issued ARPS, approximately $11.0 billion, have redeemed at liquidation value all of these shares. For up-to-date information, please visit the Nuveen CEF Auction Rate Preferred Resource Center at: http://www.nuveen.com/arps.
UPDATE ON LITIGATION REGARDING THE FUNDS’ REDEMPTION OF AUCTION RATE PREFERRED SHARES
During 2011, certain funds (including NXE) were named in a consolidated complaint as nominal defendants in a putative shareholder derivative action captioned Martin Safier, et al. v. Nuveen Asset Management, et al. that was filed in the Circuit Court of Cook County, Illinois, Chancery Division (the “Cook County Chancery Court”) on February 18, 2011 (the “Complaint”). The Complaint, filed on behalf of purported holders of each fund’s common shares, also named Nuveen Fund Advisors, Inc. as a defendant, together with current and former Officers and interested Directors/Trustees of each of the funds (together with the nominal defendants, collectively, the “Defendants”). The Complaint contained allegations regarding breaches of fiduciary duties in connection with the redemption of auction rate preferred shares issued by the funds. The Defendants filed a motion to dismiss the suit and on December 16, 2011, the court granted that motion dismissing the Complaint. The plaintiffs failed to file an appeal of the court’s decision within the required time period, resulting in the final disposition of the suit.
RISK CONSIDERATIONS
Fund shares are not guaranteed or endorsed by any bank or other insured depository institution, and are not federally insured by the Federal Deposit Insurance Corporation. Past performance is no guarantee of future results. Fund common shares are subject to a variety of risks, including:
Investment and Market Risk. An investment in common shares is subject to investment risk, including the possible loss of the entire principal amount that you invest. Your investment in common shares represents an indirect investment in the municipal securities owned by the Fund, which generally trade in the over-the-counter markets. Your common shares at any point in time may be worth less than your original investment, even after taking into account the reinvestment of Fund dividends and distributions.
Price Risk. Shares of closed-end investment companies like these Funds frequently trade at a discount to their NAV. Your common shares at any point in time may be worth less than your original investment, even after taking into account the reinvestment of Fund dividends and distributions.
Leverage Risk. Each Fund’s use of leverage creates the possibility of higher volatility for the Fund’s per share NAV, market price, distributions and returns. There is no assurance that a Fund’s leveraging strategy will be successful.
Tax Risk. The tax treatment of Fund distributions may be affected by new IRS interpretations of the Internal Revenue Code and future changes in tax laws and regulations.
Issuer Credit Risk. This is the risk that a security in a Fund’s portfolio will fail to make dividend or interest payments when due.
Interest Rate Risk. Fixed-income securities such as bonds, preferred, convertible and other debt securities will decline in value if market interest rates rise.
Reinvestment Risk. If market interest rates decline, income earned from a Fund’s portfolio may be reinvested at rates below that of the original bond that generated the income.
Call Risk or Prepayment Risk. Issuers may exercise their option to prepay principal earlier than scheduled, forcing a Fund to reinvest in lower-yielding securities.
Inverse Floater Risk. The Funds invest in inverse floaters. Due to their leveraged nature, these investments can greatly increase a Fund’s exposure to interest rate risk and credit risk. In addition, investments in inverse floaters involve the risk that the Fund could lose more than its original principal investment.
Common Share Dividend
and Price Information
DIVIDEND INFORMATION
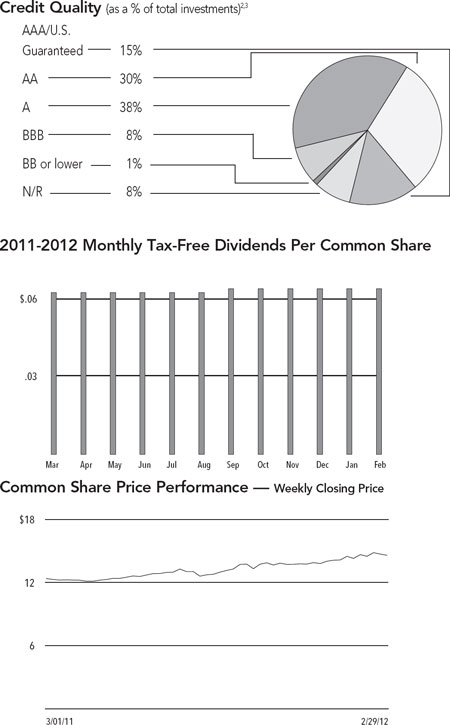
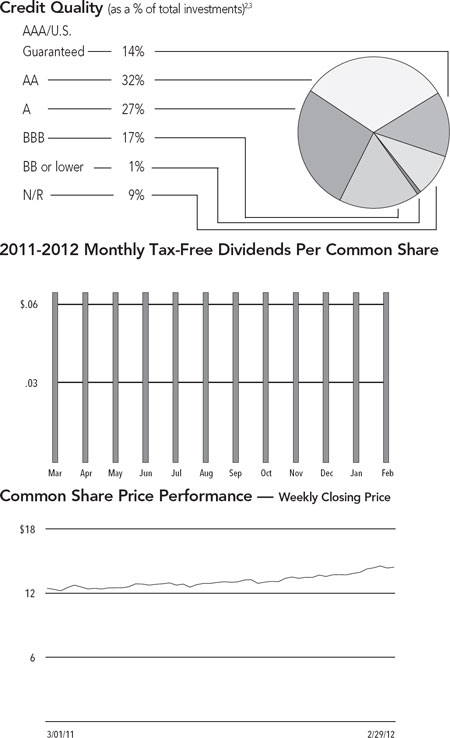
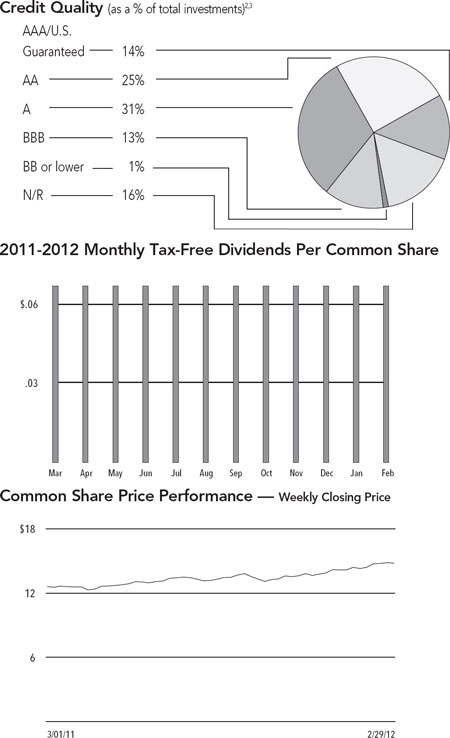
During the twelve-month reporting period ended February 29, 2012, NAZ had one monthly dividend increase, while the dividends of NFZ, NKR, NXE and NTX remained stable throughout the reporting period.
Due to normal portfolio activity, common shareholders of NTX received a long-term capital gains distribution of $0.0259 per share in December 2011.
All of the Funds in this report seek to pay stable dividends at rates that reflect each Fund’s past results and projected future performance. During certain periods, each Fund may pay dividends at a rate that may be more or less than the amount of net investment income actually earned by the Fund during the period. If a Fund has cumulatively earned more than it has paid in dividends, it holds the excess in reserve as undistributed net investment income (UNII) as part of the Fund’s NAV. Conversely, if a Fund has cumulatively paid dividends in excess of its earnings, the excess constitutes negative UNII that is likewise reflected in the Fund’s NAV. Each Fund will, over time, pay all of its net investment income as dividends to shareholders. As of February 29, 2012, all five of the Funds in this report had positive UNII balances for both tax and financial reporting purposes.
SHARE REPURCHASES AND PRICE INFORMATION
As of February 29, 2012, and since the inception of the Funds’ repurchase programs, the Funds have cumulatively repurchased and retired their outstanding common shares as shown in the accompanying table. Since the inception of the Funds’ repurchase programs, NAZ and NTX have not repurchased any of their outstanding common shares.
| | | | | | | | |
| Fund | | Common Shares Repurchased and Retired | | % of Outstanding Common Shares |
| NFZ | | | 2,500 | | | 0.2 | % |
| NKR | | | 800 | | | 0.0 | %* |
| NXE | | | 1,600 | | | 0.1 | % |
| | | | | | | | |
| * | Rounds to less than 0.1%. |
During the twelve-month reporting period, the Funds did not repurchase any of their outstanding common shares.
As of February 29, 2012, the Funds’ common share prices were trading at (+) premiums or (-) discounts to their common share NAVs as shown in the accompanying table.
| | | | | | | | |
| | | 2/29/12 | | Twelve-Month Average | |
| Fund | | (+)Premium/(-)Discount | | (+)Premium/(-)Discount | |
| NAZ | | | (-)1.42% | | | (-)4.70% | |
| NFZ | | | (-)4.58% | | | (-)7.08% | |
| NKR | | | (-)3.96% | | | (-)7.55% | |
| NXE | | | (-)4.61% | | | (-)8.71% | |
| NTX | | | (+)5.50% | | | (+)6.72% | |
| NAZ | | Nuveen Arizona |
| Performance | | Premium Income |
| OVERVIEW | | Municipal Fund, Inc. |
| | | as of February 29, 2012 |
| Fund Snapshot | | | | |
| Common Share Price | | $ | 14.61 | |
| Common Share Net Asset Value (NAV) | | $ | 14.82 | |
| Premium/(Discount) to NAV | | | -1.42 | % |
| Market Yield | | | 5.26 | % |
Taxable-Equivalent Yield1 | | | 7.66 | % |
| Net Assets Applicable to Common Shares ($000) | | $ | 66,268 | |
| Leverage | | | | |
| Regulatory Leverage | | | 29.70 | % |
| Effective Leverage | | | 31.27 | % |
| Average Annual Total Returns | | | | | | |
| (Inception 11/19/92) | | | | | | |
| | | | On Share Price | | On NAV |
| 1-Year | | | 25.48% | | 18.08 | % |
| 5-Year | | | 6.37% | | 5.59 | % |
| 10-Year | | | 4.33% | | 5.84 | % |
Portfolio Composition3 | | | | |
| (as a % of total investments) | | | | |
| Tax Obligation/Limited | | | 26.9 | % |
| Utilities | | | 17.8 | % |
| Health Care | | | 15.5 | % |
| Education and Civic Organizations | | | 12.1 | % |
| U.S. Guaranteed | | | 10.0 | % |
| Water and Sewer | | | 8.7 | % |
| Tax Obligation/General | | | 8.2 | % |
| Consumer Staples | | | 0.8 | % |
| | Refer to the Glossary of Terms Used in this Report for further definition of the terms used within this Fund’s Performance Overview page. |
| 1 | Taxable-Equivalent Yield represents the yield that must be earned on a fully taxable investment in order to equal the yield of the Fund on an after-tax basis. It is based on a combined federal and state income tax rate of 31.3%. When comparing this Fund to investments that generate qualified dividend income, the Taxable-Equivalent Yield is lower. |
| 2 | Ratings shown are the highest rating given by one of the following national rating agencies: Standard & Poor’s Group, Moody’s Investors Service, Inc. or Fitch, Inc. Credit ratings are subject to change. AAA, AA, A, and BBB are investment grade ratings; BB, B, CCC, CC, C and D are below-investment grade ratings. Certain bonds backed by U.S. Government or agency securities are regarded as having an implied rating equal to the rating of such securities. Holdings designated N/R are not rated by a national rating agency. |
| 3 | Holdings are subject to change. |
| NFZ | | Nuveen Arizona |
| Performance | | Dividend Advantage |
| OVERVIEW | | Municipal Fund |
| | | as of February 29, 2012 |
| Fund Snapshot | | | | |
| Common Share Price | | $ | 14.39 | |
| Common Share Net Asset Value (NAV) | | $ | 15.08 | |
| Premium/(Discount) to NAV | | | -4.58 | % |
| Market Yield | | | 5.38 | % |
Taxable-Equivalent Yield1 | | | 7.83 | % |
| Net Assets Applicable to Common Shares ($000) | | $ | 23,349 | |
| Leverage | | | | |
| Regulatory Leverage | | | 32.22 | % |
| Effective Leverage | | | 35.37 | % |
| Average Annual Total Returns | | | | | | |
| (Inception 1/30/01) | | | | | | |
| | | | On Share Price | | On NAV |
| 1-Year | | | 25.66% | | 19.56 | % |
| 5-Year | | | 4.79% | | 5.15 | % |
| 10-Year | | | 5.35% | | 6.12 | % |
Portfolio Composition3 | | | | |
| (as a % of total investments) | | | | |
| Tax Obligation/Limited | | | 31.0 | % |
| Utilities | | | 19.6 | % |
| Health Care | | | 14.8 | % |
| Tax Obligation/General | | | 12.9 | % |
| Education and Civic Organizations | | | 10.0 | % |
| U.S. Guaranteed | | | 5.3 | % |
| Other | | | 6.4 | % |
| | Refer to the Glossary of Terms Used in this Report for further definition of the terms used within this Fund’s Performance Overview page. |
| 1 | Taxable-Equivalent Yield represents the yield that must be earned on a fully taxable investment in order to equal the yield of the Fund on an after-tax basis. It is based on a combined federal and state income tax rate of 31.3%. When comparing this Fund to investments that generate qualified dividend income, the Taxable-Equivalent Yield is lower. |
| 2 | Ratings shown are the highest rating given by one of the following national rating agencies: Standard & Poor’s Group, Moody’s Investors Service, Inc. or Fitch, Inc. Credit ratings are subject to change. AAA, AA, A, and BBB are investment grade ratings; BB, B, CCC, CC, C and D are below-investment grade ratings. Certain bonds backed by U.S. Government or agency securities are regarded as having an implied rating equal to the rating of such securities. Holdings designated N/R are not rated by a national rating agency. |
| 3 | Holdings are subject to change. |
| NKR | | Nuveen Arizona |
| Performance | | Dividend Advantage |
| OVERVIEW | | Municipal Fund 2 |
| | | as of February 29, 2012 |
| Fund Snapshot | | | | |
| Common Share Price | | $ | 14.78 | |
| Common Share Net Asset Value (NAV) | | $ | 15.39 | |
| Premium/(Discount) to NAV | | | -3.96 | % |
| Market Yield | | | 5.44 | % |
Taxable-Equivalent Yield1 | | | 7.92 | % |
| Net Assets Applicable to Common Shares ($000) | | $ | 37,546 | |
| Leverage | | | | |
| Regulatory Leverage | | | 33.28 | % |
| Effective Leverage | | | 34.84 | % |
| Average Annual Total Returns | | | | | | |
| (Inception 3/25/02) | | | | | | |
| | | | On Share Price | | On NAV |
| 1-Year | | | 23.88% | | 16.91 | % |
| 5-Year | | | 5.16% | | 5.60 | % |
| Since Inception | | | 5.77% | | 6.51 | % |
Portfolio Composition3 | | | | |
| (as a % of total investments) | | | | |
| Tax Obligation/Limited | | | 33.3 | % |
| Health Care | | | 20.6 | % |
| Tax Obligation/General | | | 20.0 | % |
| Education and Civic Organizations | | | 9.1 | % |
| Water and Sewer | | | 6.9 | % |
| Utilities | | | 6.4 | % |
| Other | | | 3.7 | % |
| | Refer to the Glossary of Terms Used in this Report for further definition of the terms used within this Fund’s Performance Overview page. |
| 1 | Taxable-Equivalent Yield represents the yield that must be earned on a fully taxable investment in order to equal the yield of the Fund on an after-tax basis. It is based on a combined federal and state income tax rate of 31.3%. When comparing this Fund to investments that generate qualified dividend income, the Taxable-Equivalent Yield is lower. |
| 2 | Ratings shown are the highest rating given by one of the following national rating agencies: Standard & Poor’s Group, Moody’s Investors Service, Inc. or Fitch, Inc. Credit ratings are subject to change. AAA, AA, A, and BBB are investment grade ratings; BB, B, CCC, CC, C and D are below-investment grade ratings. Certain bonds backed by U.S. Government or agency securities are regarded as having an implied rating equal to the rating of such securities. Holdings designated N/R are not rated by a national rating agency. |
| 3 | Holdings are subject to change. |
| NXE | | Nuveen Arizona |
| Performance | | Dividend Advantage |
| OVERVIEW | | Municipal Fund 3 |
| | | as of February 29, 2012 |
| Fund Snapshot | | | | |
| Common Share Price | | $ | 14.28 | |
| Common Share Net Asset Value (NAV) | | $ | 14.97 | |
| Premium/(Discount) to NAV | | | -4.61 | % |
| Market Yield | | | 5.29 | % |
Taxable-Equivalent Yield1 | | | 7.70 | % |
| Net Assets Applicable to Common Shares ($000) | | $ | 45,904 | |
| Leverage | | | | |
| Regulatory Leverage | | | 31.23 | % |
| Effective Leverage | | | 33.54 | % |
| | | | | | | |
| Average Annual Total Returns | | | | | | |
| (Inception 9/25/02) | | | | | | |
| | | | On Share Price | | On NAV |
| 1-Year | | | 23.63% | | 17.30 | % |
| 5-Year | | | 5.77% | | 5.63 | % |
| Since Inception | | | 5.07% | | 5.82 | % |
| | | | | |
Portfolio Composition3 | | | | |
| (as a % of total investments) | | | | |
| Tax Obligation/Limited | | | 29.9 | % |
| Health Care | | | 19.6 | % |
| Education and Civic Organizations | | | 12.8 | % |
| Utilities | | | 11.8 | % |
| Tax Obligation/General | | | 7.5 | % |
| U.S. Guaranteed | | | 7.0 | % |
| Water and Sewer | | | 6.7 | % |
| Other | | | 4.7 | % |
| | Refer to the Glossary of Terms Used in this Report for further definition of the terms used within this Fund’s Performance Overview page. |
| 1 | Taxable-Equivalent Yield represents the yield that must be earned on a fully taxable investment in order to equal the yield of the Fund on an after-tax basis. It is based on a combined federal and state income tax rate of 31.3%. When comparing this Fund to investments that generate qualified dividend income, the Taxable-Equivalent Yield is lower. |
| 2 | Ratings shown are the highest rating given by one of the following national rating agencies: Standard & Poor’s Group, Moody’s Investors Service, Inc. or Fitch, Inc. Credit ratings are subject to change. AAA, AA, A, and BBB are investment grade ratings; BB, B, CCC, CC, C and D are below-investment grade ratings. Certain bonds backed by U.S. Government or agency securities are regarded as having an implied rating equal to the rating of such securities. Holdings designated N/R are not rated by a national rating agency. |
| 3 | Holdings are subject to change. |
| NTX | | Nuveen Texas |
| Performance | | Quality Income |
| OVERVIEW | | Municipal Fund |
| | | as of February 29, 2012 |
| Fund Snapshot | | | | |
| Common Share Price | | $ | 16.31 | |
| Common Share Net Asset Value (NAV) | | $ | 15.46 | |
| Premium/(Discount) to NAV | | | 5.50 | % |
| Market Yield | | | 5.26 | % |
Taxable-Equivalent Yield1 | | | 7.31 | % |
| Net Assets Applicable to Common Shares ($000) | | $ | 148,222 | |
| Leverage | | | | |
| Regulatory Leverage | | | 32.36 | % |
| Effective Leverage | | | 33.56 | % |
| Average Annual Total Returns | | | | | | |
| (Inception 10/17/91) | | | | | | |
| | | | On Share Price | | On NAV |
| 1-Year | | | 13.81% | | 16.23 | % |
| 5-Year | | | 8.05% | | 5.86 | % |
| 10-Year | | | 6.81% | | 6.20 | % |
Portfolio Composition4 | | | | |
| (as a % of total investments) | | | | |
| Tax Obligation/General | | | 25.5 | % |
| U.S. Guaranteed | | | 10.6 | % |
| Utilities | | | 10.4 | % |
| Water and Sewer | | | 10.3 | % |
| Tax Obligation/Limited | | | 10.2 | % |
| Health Care | | | 9.8 | % |
| Transportation | | | 8.1 | % |
| Education and Civic Organizations | | | 7.8 | % |
| Other | | | 7.3 | % |
| | Refer to the Glossary of Terms Used in this Report for further definition of the terms used within this Fund’s Performance Overview page. |
| 1 | Taxable-Equivalent Yield represents the yield that must be earned on a fully taxable investment in order to equal the yield of the Fund on an after-tax basis. It is based on a federal income tax rate of 28%. When comparing this Fund to investments that generate qualified dividend income, the Taxable-Equivalent Yield is lower. |
| 2 | Ratings shown are the highest rating given by one of the following national rating agencies: Standard & Poor’s Group, Moody’s Investors Service, Inc. or Fitch, Inc. Credit ratings are subject to change. AAA, AA, A, and BBB are investment grade ratings; BB, B, CCC, CC, C and D are below-investment grade ratings. Certain bonds backed by U.S. Government or agency securities are regarded as having an implied rating equal to the rating of such securities. Holdings designated N/R are not rated by a national rating agency. |
| 3 | The Fund paid shareholders a capital gains distribution in December 2011 of $0.0259 per share. |
| 4 | Holdings are subject to change. |
| 5 | Rounds to less than 1%. |
| NAZ | | Shareholder Meeting Report |
| NFZ | | |
| NKR | | The annual meeting of shareholders was held in the offices of Nuveen Investments on November 15, 2011; at this meeting the shareholders were asked to vote on the election of Board Members, the elimination of Fundamental Investment Policies and the approval of new Fundamental Investment Policies. The meeting was subsequently adjourned to December 16, 2011. The meeting for NFZ, NKR and NXE was additionally adjourned to January 31, 2012. |
| | | NAZ | | NFZ | | NKR | |
| | | Common and Preferred shares voting together as a class | | Preferred shares voting together as a class | | Common and Preferred shares voting together as a class | | Preferred shares voting together as a class | | Common and Preferred shares voting together as a class | | Preferred shares voting together as a class | |
| To approve the elimination of the fundamental policies relating to the Fund's ability to make loans. | | | | | | | | | | | | | | | | | | | |
| For | | | 2,113,498 | | | 280 | | | 1,162,602 | | | 394,600 | | | 1,946,180 | | | 661,900 | |
| Against | | | 257,710 | | | — | | | 180,784 | | | 123,900 | | | 200,805 | | | 93,978 | |
| Abstain | | | 144,826 | | | — | | | 46,123 | | | 1,000 | | | 72,985 | | | 22,000 | |
| Broker Non-Votes | | | 500,208 | | | — | | | 215,808 | | | 22,999 | | | 372,045 | | | 103,287 | |
| Total | | | 3,016,242 | | | 280 | | | 1,605,317 | | | 542,499 | | | 2,592,015 | | | 881,165 | |
| | | | | | | | | | | | | | | | | | | | |
| To approve the new fundamental policy relating to the Fund's ability to make loans. | | | | | | | | | | | | | | | | | | | |
| For | | | 2,088,038 | | | 280 | | | 1,165,252 | | | 394,600 | | | 1,940,518 | | | 661,900 | |
| Against | | | 272,029 | | | — | | | 182,534 | | | 123,900 | | | 204,777 | | | 93,978 | |
| Abstain | | | 155,968 | | | — | | | 41,723 | | | 1,000 | | | 74,675 | | | 22,000 | |
| Broker Non-Votes | | | 500,207 | | | — | | | 215,808 | | | 22,999 | | | 372,045 | | | 103,287 | |
| Total | | | 3,016,242 | | | 280 | | | 1,605,317 | | | 542,499 | | | 2,592,015 | | | 881,165 | |
| Approval of the Board Members was reached as follows: | | | | | | | | | | | | | | | | | | | |
| John P. Amboian | | | | | | | | | | | | | | | | | | | |
| For | | | 2,935,327 | | | — | | | 1,469,695 | | | — | | | 2,426,700 | | | — | |
| Withhold | | | 80,915 | | | — | | | 128,072 | | | — | | | 145,051 | | | — | |
| Total | | | 3,016,242 | | | — | | | 1,597,767 | | | — | | | 2,571,751 | | | — | |
| Robert P. Bremner | | | | | | | | | | | | | | | | | | | |
| For | | | 2,932,327 | | | — | | | — | | | — | | | — | | | — | |
| Withhold | | | 83,915 | | | — | | | — | | | — | | | — | | | — | |
| Total | | | 3,016,242 | | | — | | | — | | | — | | | — | | | — | |
| Jack B. Evans | | | | | | | | | | | | | | | | | | | |
| For | | | 2,935,009 | | | — | | | — | | | — | | | — | | | — | |
| Withhold | | | 81,233 | | | — | | | — | | | — | | | — | | | — | |
| Total | | | 3,016,242 | | | — | | | — | | | — | | | — | | | — | |
| William C. Hunter | | | | | | | | | | | | | | | | | | | |
| For | | | — | | | 280 | | | — | | | 518,650 | | | — | | | 912,687 | |
| Withhold | | | — | | | — | | | — | | | 58,600 | | | — | | | 51,478 | |
| Total | | | — | | | 280 | | | — | | | 577,250 | | | — | | | 964,165 | |
| David J. Kundert | | | | | | | | | | | | | | | | | | | |
| For | | | 2,934,327 | | | — | | | 1,470,236 | | | — | | | 2,433,450 | | | — | |
| Withhold | | | 81,915 | | | — | | | 127,531 | | | — | | | 138,301 | | | — | |
| Total | | | 3,016,242 | | | — | | | 1,597,767 | | | — | | | 2,571,751 | | | — | |
| William J. Schneider | | | | | | | | | | | | | | | | | | | |
| For | | | — | | | 280 | | | — | | | 518,650 | | | — | | | 912,687 | |
| Withhold | | | — | | | — | | | — | | | 58,600 | | | — | | | 51,478 | |
| Total | | | — | | | 280 | | | — | | | 577,250 | | | — | | | 964,165 | |
| Judith M. Stockdale | | | | | | | | | | | | | | | | | | | |
| For | | | 2,930,229 | | | — | | | — | | | — | | | — | | | — | |
| Withhold | | | 86,013 | | | — | | | — | | | — | | | — | | | — | |
| Total | | | 3,016,242 | | | — | | | — | | | — | | | — | | | — | |
| Carole E. Stone | | | | | | | | | | | | | | | | | | | |
| For | | | 2,931,001 | | | — | | | — | | | — | | | — | | | — | |
| Withhold | | | 85,241 | | | — | | | — | | | — | | | — | | | — | |
| Total | | | 3,016,242 | | | — | | | — | | | — | | | — | | | — | |
| Virginia L. Stringer | | | | | | | | | | | | | | | | | | | |
| For | | | 2,934,001 | | | — | | | — | | | — | | | — | | | — | |
| Withhold | | | 82,241 | | | — | | | — | | | — | | | — | | | — | |
| Total | | | 3,016,242 | | | — | | | — | | | — | | | — | | | — | |
| Terence J. Toth | | | | | | | | | | | | | | | | | | | |
| For | | | 2,935,327 | | | — | | | 1,470,779 | | | — | | | 2,433,450 | | | — | |
| Withhold | | | 80,915 | | | — | | | 126,988 | | | — | | | 138,301 | | | — | |
| Total | | | 3,016,242 | | | — | | | 1,597,767 | | | — | | | 2,571,751 | | | — | |
| | | Shareholder Meeting Report (continued) |
| NXE | | |
| NTX | | |
| | | NXE | | NTX | |
| | | Common and Preferred shares voting together as a class | | Preferred shares voting together as a class | | Common and Preferred shares voting together as a class | | Preferred shares voting together as a class | |
| To approve the elimination of the fundamental policies relating to the Fund's ability to make loans. | | | | | | | | | | | | | |
| For | | | 2,279,256 | | | 608,700 | | | 6,877,113 | | | 2,858,008 | |
| Against | | | 239,195 | | | 91,800 | | | 724,877 | | | 168,661 | |
| Abstain | | | 100,908 | | | 20,000 | | | 207,350 | | | 72,500 | |
| Broker Non-Votes | | | 494,557 | | | 202,749 | | | 2,227,525 | | | 827,437 | |
| Total | | | 3,113,916 | | | 923,249 | | | 10,036,865 | | | 3,926,606 | |
| To approve the new fundamental policy relating to the Fund's ability to make loans. | | | | | | | | | | | | | |
| For | | | 2,260,006 | | | 603,700 | | | 6,871,716 | | | 2,859,508 | |
| Against | | | 255,195 | | | 96,800 | | | 730,502 | | | 167,161 | |
| Abstain | | | 104,158 | | | 20,000 | | | 207,122 | | | 72,500 | |
| Broker Non-Votes | | | 494,557 | | | 202,749 | | | 2,227,525 | | | 827,437 | |
| Total | | | 3,113,916 | | | 923,249 | | | 10,036,865 | | | 3,926,606 | |
| Approval of the Board Members was reached as follows: | | | | | | | | | | | | | |
| John P. Amboian | | | | | | | | | | | | | |
| For | | | 3,077,871 | | | — | | | 9,790,124 | | | — | |
| Withhold | | | 162,109 | | | — | | | 246,741 | | | — | |
| Total | | | 3,239,980 | | | — | | | 10,036,865 | | | — | |
| Robert P. Bremner | | | | | | | | | | | | | |
| For | | | — | | | — | | | — | | | — | |
| Withhold | | | — | | | — | | | — | | | — | |
| Total | | | — | | | — | | | — | | | — | |
| Jack B. Evans | | | | | | | | | | | | | |
| For | | | — | | | — | | | — | | | — | |
| Withhold | | | — | | | — | | | — | | | — | |
| Total | | | — | | | — | | | — | | | — | |
| William C. Hunter | | | | | | | | | | | | | |
| For | | | — | | | 1,066,631 | | | — | | | 3,867,682 | |
| Withhold | | | — | | | 32,418 | | | — | | | 58,924 | |
| Total | | | — | | | 1,099,049 | | | — | | | 3,926,606 | |
| David J. Kundert | | | | | | | | | | | | | |
| For | | | 3,077,871 | | | — | | | 9,800,132 | | | — | |
| Withhold | | | 162,109 | | | — | | | 236,733 | | | — | |
| Total | | | 3,239,980 | | | — | | | 10,036,865 | | | — | |
| William J. Schneider | | | | | | | | | | | | | |
| For | | | — | | | 1,066,631 | | | — | | | 3,867,682 | |
| Withhold | | | — | | | 32,418 | | | — | | | 58,924 | |
| Total | | | — | | | 1,099,049 | | | — | | | 3,926,606 | |
| Judith M. Stockdale | | | | | | | | | | | | | |
| For | | | — | | | — | | | — | | | — | |
| Withhold | | | — | | | — | | | — | | | — | |
| Total | | | — | | | — | | | — | | | — | |
| Carole E. Stone | | | | | | | | | | | | | |
| For | | | — | | | — | | | — | | | — | |
| Withhold | | | — | | | — | | | — | | | — | |
| Total | | | — | | | — | | | — | | | — | |
| Virginia L. Stringer | | | | | | | | | | | | | |
| For | | | — | | | — | | | — | | | — | |
| Withhold | | | — | | | — | | | — | | | — | |
| Total | | | — | | | — | | | — | | | — | |
| Terence J. Toth | | | | | | | | | | | | | |
| For | | | 3,077,871 | | | — | | | 9,798,646 | | | — | |
| Withhold | | | 162,109 | | | — | | | 238,219 | | | — | |
| Total | | | 3,239,980 | | | — | | | 10,036,865 | | | — | |
Report of Independent
Registered Public Accounting Firm
The Board of Directors/Trustees and Shareholders
Nuveen Arizona Premium Income Municipal Fund, Inc.
Nuveen Arizona Dividend Advantage Municipal Fund
Nuveen Arizona Dividend Advantage Municipal Fund 2
Nuveen Arizona Dividend Advantage Municipal Fund 3
Nuveen Texas Quality Income Municipal Fund
We have audited the accompanying statements of assets and liabilities, including the portfolios of investments, of Nuveen Arizona Premium Income Municipal Fund, Inc., Nuveen Arizona Dividend Advantage Municipal Fund, Nuveen Arizona Dividend Advantage Municipal Fund 2, Nuveen Arizona Dividend Advantage Municipal Fund 3, and Nuveen Texas Quality Income Municipal Fund (the “Funds”) as of February 29, 2012, and the related statements of operations and cash flows for the year then ended and the statements of changes in net assets and the financial highlights for each of the periods indicated therein. These financial statements and financial highlights are the responsibility of the Funds’ management. Our responsibility is to express an opinion on these financial statements and financial highlights based on our audits.
We conducted our audits in accordance with the standards of the Public Company Accounting Oversight Board (United States). Those standards require that we plan and perform the audits to obtain reasonable assurance about whether the financial statements and financial highlights are free of material misstatement. We were not engaged to perform an audit of the Funds’ internal control over financial reporting. Our audits included consideration of internal control over financial reporting as a basis for designing audit procedures that are appropriate in the circumstances, but not for the purpose of expressing an opinion on the effectiveness of the Funds’ internal control over financial reporting. Accordingly, we express no such opinion. An audit also includes examining, on a test basis, evidence supporting the amounts and disclosures in the financial statements and financial highlights, assessing the accounting principles used and significant estimates made by management, and evaluating the overall financial statement presentation. Our procedures included confirmation of securities owned as of February 29, 2012, by correspondence with the custodian and brokers or by other appropriate auditing procedures where replies from brokers were not received. We believe that our audits provide a reasonable basis for our opinion.
In our opinion, the financial statements and financial highlights referred to above present fairly, in all material respects, the financial positions of Nuveen Arizona Premium Income Municipal Fund, Inc., Nuveen Arizona Dividend Advantage Municipal Fund, Nuveen Arizona Dividend Advantage Municipal Fund 2, Nuveen Arizona Dividend Advantage Municipal Fund 3, and Nuveen Texas Quality Income Municipal Fund at February 29, 2012, and the results of their operations and their cash flows for the year then ended and the changes in their net assets and the financial highlights for each of the periods indicated therein, in conformity with U.S. generally accepted accounting principles.
Chicago, Illinois
April 25, 2012
| | | Nuveen Arizona Premium Income Municipal Fund, Inc. |
| NAZ | | Portfolio of Investments |
| | | February 29, 2012 |
| | Principal | | | Optional Call | | | | | |
| | Amount (000) | | Description (1) | Provisions (2) | Ratings (3) | | | Value | |
| | | | Consumer Staples – 1.1% (0.8% of Total Investments) | | | | | | |
| $ | 745 | | Puerto Rico, The Children’s Trust Fund, Tobacco Settlement Asset-Backed Refunding Bonds, Series 2002, 5.375%, 5/15/33 | 5/12 at 100.00 | BBB | | $ | 737,036 | |
| | | | Education and Civic Organizations – 17.1% (12.1% of Total Investments) | | | | | | |
| | 2,500 | | Arizona Higher Education Loan Authority, Student Loan Revenue Bonds, Series 2007B, Auction Rate Securities, 0.543%, 11/01/41 (Alternative Minimum Tax) (4) | 9/12 at 100.00 | A | | | 1,959,607 | |
| | 1,000 | | Arizona State University, System Revenue Bonds, Series 2002, 5.000%, 7/01/25 – FGIC Insured | 7/12 at 100.00 | AA | | | 1,013,880 | |
| | | | Arizona State University, System Revenue Bonds, Series 2005: | | | | | | |
| | 1,455 | | 5.000%, 7/01/20 – AMBAC Insured | 7/15 at 100.00 | Aa3 | | | 1,566,424 | |
| | 750 | | 5.000%, 7/01/21 – AMBAC Insured | 7/15 at 100.00 | Aa3 | | | 803,205 | |
| | 755 | | Glendale Industrial Development Authority, Arizona, Revenue Bonds, Midwestern University, Refunding Series 2007, 5.000%, 5/15/31 | 5/22 at 100.00 | A– | | | 819,386 | |
| | 1,600 | | Glendale Industrial Development Authority, Arizona, Revenue Bonds, Midwestern University, Refunding Series 2010, 5.125%, 5/15/40 | 5/20 at 100.00 | A– | | | 1,672,944 | |
| | 280 | | Phoenix IDA, Arizona, Education Revenue Bonds, Painted Rock Academy Project, Series 2012A, 7.500%, 7/01/42 | 7/20 at 100.00 | N/R | | | 281,159 | |
| | 220 | | Phoenix Industrial Development Authority, Arizona, Education Revenue Bonds, Great Hearts Academies – Veritas Project, Series 2012, 6.300%, 7/01/42 | 7/21 at 100.00 | N/R | | | 222,233 | |
| | 280 | | Pima County Industrial Development Authority, Arizona, Education Revenue Bonds, Carden Traditional Schools Project, Series 2012, 7.500%, 1/01/42 | 1/22 at 100.00 | BBB– | | | 278,799 | |
| | | | Pima County Industrial Development Authority, Arizona, Education Revenue Bonds, Paradise Education Center Project, Series 2010: | | | | | | |
| | 170 | | 6.000%, 6/01/40 | 6/19 at 100.00 | BBB– | | | 154,977 | |
| | 200 | | 6.100%, 6/01/45 | 6/19 at 100.00 | BBB– | | | 182,344 | |
| | 1,500 | | Tempe Industrial Development Authority, Arizona, Lease Revenue Bonds, Arizona State University Foundation Project, Series 2003, 5.000%, 7/01/34 – AMBAC Insured | 7/13 at 100.00 | N/R | | | 1,507,515 | |
| | 825 | | Yavapai County Industrial Development Authority, Arizona, Charter School Revenue Bonds, Arizona Agribusiness and Equine Center Charter School, Series 2011, 7.875%, 3/01/42 | 3/21 at 100.00 | BB+ | | | 887,618 | |
| | 11,535 | | Total Education and Civic Organizations | | | | | 11,350,091 | |
| | | | Health Care – 21.8% (15.5% of Total Investments) | | | | | | |
| | 1,430 | | Arizona Health Facilities Authority, Hospital Revenue Bonds, Banner Health Systems, Series 2007A, 5.000%, 1/01/25 | 1/17 at 100.00 | AA– | | | 1,600,099 | |
| | 885 | | Arizona Health Facilities Authority, Hospital Revenue Bonds, Banner Health Systems, Series 2007B, 1.059%, 1/02/37 | 1/17 at 100.00 | AA– | | | 624,368 | |
| | 3,470 | | Arizona Health Facilities Authority, Hospital Revenue Bonds, Banner Health Systems, Series 2008D, 5.500%, 1/01/38 | 1/18 at 100.00 | AA– | | | 3,733,789 | |
| | 675 | | Glendale Industrial Development Authority, Arizona, Revenue Bonds, John C. Lincoln Health Network, Series 2005B, 5.000%, 12/01/37 | 12/15 at 100.00 | BBB | | | 665,807 | |
| | 1,110 | | Glendale Industrial Development Authority, Arizona, Revenue Bonds, John C. Lincoln Health Network, Series 2007, 5.000%, 12/01/42 | 12/17 at 100.00 | BBB | | | 1,095,315 | |
| | 2,150 | | Maricopa County Industrial Development Authority, Arizona, Health Facility Revenue Bonds, Catholic Healthcare West, Series 2004A, 5.375%, 7/01/23 | 7/14 at 100.00 | A | | | 2,285,214 | |
| | 2,900 | | Maricopa County Industrial Development Authority, Arizona, Health Facility Revenue Bonds, Catholic Healthcare West, Series 2007A, 5.250%, 7/01/32 | 7/17 at 100.00 | A | | | 3,047,639 | |
| | 425 | | Puerto Rico Industrial, Tourist, Educational, Medical and Environmental Control Facilities Financing Authority, Hospital Revenue Bonds, Hospital de la Concepcion, Series 2000A, 6.375%, 11/15/15 | 5/12 at 100.00 | AA+ | | | 426,768 | |
| | | | Show Low Industrial Development Authority, Arizona, Hospital Revenue Bonds, Navapache Regional Medical Center, Series 2005: | | | | | | |
| | 525 | | 5.000%, 12/01/25 – RAAI Insured | 12/15 at 100.00 | BBB+ | | | 531,573 | |
| | 435 | | 5.000%, 12/01/30 – RAAI Insured | 12/15 at 100.00 | BBB+ | | | 436,222 | |
| | 14,005 | | Total Health Care | | | | | 14,446,794 | |
| | Principal | | | Optional Call | | | | | |
| | Amount (000) | | Description (1) | Provisions (2) | Ratings (3) | | | Value | |
| | | | Tax Obligation/General – 11.5% (8.2% of Total Investments) | | | | | | |
| $ | 1,265 | | Gila County Unified School District 10 Payson, Arizona, School Improvement Bonds, Project 2006, Series 2008B, 5.750%, 7/01/28 | 7/18 at 100.00 | Aa3 | | $ | 1,438,963 | |
| | 1,200 | | Maricopa County Unified School District 95 Queen Creek, Arizona, General Obligation Bonds, Series 2008, 5.000%, 7/01/27 – AGM Insured | 7/18 at 100.00 | Aa3 | | | 1,319,016 | |
| | 515 | | Pima County Continental Elementary School District 39, Arizona, General Obligation Bonds, Series 2011A, 2.000%, 7/01/30 – AGM Insured | 7/21 at 100.00 | AA– | | | 625,133 | |
| | 3,530 | | Pinal County Unified School District 1, Florence, Arizona, General Obligation Bonds, Series 2008C, 5.250%, 7/01/28 | 7/18 at 100.00 | A | | | 3,915,335 | |
| | 330 | | Puerto Rico, General Obligation and Public Improvement Bonds, Series 2002A, 5.375%, 7/01/28 | 7/12 at 100.00 | Baa1 | | | 330,277 | |
| | 6,840 | | Total Tax Obligation/General | | | | | 7,628,724 | |
| | | | Tax Obligation/Limited – 38.0% (26.9% of Total Investments) | | | | | | |
| | 321 | | Estrella Mountain Ranch Community Facilities District, Goodyear, Arizona, Special Assessment Lien Bonds, Series 2001A, 7.875%, 7/01/25 | 7/12 at 100.00 | N/R | | | 323,096 | |
| | 3,000 | | Glendale Western Loop 101 Public Facilities Corporation, Arizona, Third Lien Excise Tax Revenue Bonds, Series 2008B, 6.250%, 7/01/38 | 1/14 at 100.00 | AA | | | 3,158,130 | |
| | 1,280 | | Greater Arizona Development Authority, Infrastructure Revenue Bonds, Series 2006-1, 5.000%, 8/01/22 – NPFG Insured | 8/16 at 100.00 | AA– | | | 1,375,040 | |
| | 740 | | Greater Arizona Development Authority, Infrastructure Revenue Bonds, Series 2006A, 5.000%, 8/01/23 – NPFG Insured | 8/16 at 100.00 | AA– | | | 791,667 | |
| | 1,110 | | Marana Municipal Property Corporation, Arizona, Municipal Facilities Revenue Bonds, Series 2008B, 5.125%, 7/01/28 | 7/12 at 100.00 | AA | | | 1,115,950 | |
| | 575 | | Marana Municipal Property Corporation, Arizona, Revenue Bonds, Series 2003, 5.000%, 7/01/28 – AMBAC Insured | 7/13 at 100.00 | AA | | | 589,461 | |
| | 1,350 | | Marana, Arizona, Tangerine Farms Road Improvement District Revenue Bonds, Series 2006, 4.600%, 1/01/26 | 7/16 at 100.00 | A2 | | | 1,400,261 | |
| | 3,400 | | Maricopa County Stadium District, Arizona, Revenue Refunding Bonds, Series 2002, 5.375%, 6/01/18 – AMBAC Insured | 6/12 at 100.00 | N/R | | | 3,263,320 | |
| | 3,400 | | Mesa, Arizona, Street and Highway User Tax Revenue Bonds, Series 2005, 5.000%, 7/01/24 – AGM Insured | 7/15 at 100.00 | AA | | | 3,633,376 | |
| | 170 | | Phoenix Mesa Gateway Airport Authority, Arizona, Special Facility Revenue Bonds, Mesa Project, Series 2012, 5.000%, 7/01/38 (Alternative Minimum Tax) | 7/22 at 100.00 | AA+ | | | 172,251 | |
| | 1,140 | | Pinetop Fire District of Navajo County, Arizona, Certificates of Participation, Series 2008, 7.750%, 6/15/29 | 6/16 at 102.00 | A3 | | | 1,217,862 | |
| | 265 | | Puerto Rico Public Buildings Authority, Guaranteed Government Facilities Revenue Refunding Bonds, Series 2002D, 5.125%, 7/01/24 | 7/12 at 100.00 | Baa1 | | | 265,851 | |
| | 1,700 | | Puerto Rico Sales Tax Financing Corporation, Sales Tax Revenue Bonds, First Subordinate Series 2010C, 0.000%, 8/01/38 | No Opt. Call | A+ | | | 390,524 | |
| | 1,525 | | Puerto Rico Sales Tax Financing Corporation, Sales Tax Revenue Bonds, Series 2010A, 0.000%, 8/01/33 | No Opt. Call | A+ | | | 495,518 | |
| | 1,610 | | San Luis Civic Improvement Corporation, Arizona, Municipal Facilities Excise Tax Revenue Bonds, Series 2005, 5.000%, 7/01/25 – SYNCORA GTY Insured | 7/15 at 100.00 | A+ | | | 1,703,364 | |
| | 1,000 | | Scottsdale Municipal Property Corporation, Arizona, Excise Tax Revenue Bonds, Refunding Series 2006, 5.000%, 7/01/24 | No Opt. Call | AAA | | | 1,276,220 | |
| | 2,000 | | Scottsdale Municipal Property Corporation, Arizona, Excise Tax Revenue Bonds, Water & Sewer Improvements Project, Series 2010, 5.000%, 7/01/36 | No Opt. Call | AAA | | | 2,234,420 | |
| | | Nuveen Arizona Premium Income Municipal Fund, Inc. (continued) |
| NAZ | | Portfolio of Investments |
| | | February 29, 2012 |
| | Principal | | | Optional Call | | | | | |
| | Amount (000) | | Description (1) | Provisions (2) | Ratings (3) | | | Value | |
| | | | Tax Obligation/Limited (continued) | | | | | | |
| $ | 1,000 | | Virgin Islands Public Finance Authority, Matching Fund Loan Notes Revenue Bonds, Senior Lien Series 2010A, 5.000%, 10/01/29 | 10/20 at 100.00 | BBB | | $ | 1,054,570 | |
| | 645 | | Vistancia Community Facilities District, Arizona, Restricted General Obligation Bonds, Series 2005, 5.750%, 7/15/24 | 7/15 at 100.00 | A1 | | | 692,846 | |
| | 26,231 | | Total Tax Obligation/Limited | | | | | 25,153,727 | |
| | | | U.S. Guaranteed – 14.1% (10.0% of Total Investments) (5) | | | | | | |
| | 3,500 | | Glendale, Arizona, Water and Sewer Revenue Bonds, Subordinate Lien, Series 2003, 5.000%, 7/01/28 (Pre-refunded 7/01/13) – AMBAC Insured | 7/13 at 100.00 | AA (5) | | | 3,720,850 | |
| | 1,250 | | Maricopa County Industrial Development Authority, Arizona, Hospital Revenue Refunding Bonds, Samaritan Health Services, Series 1990A, 7.000%, 12/01/16 – NPFG Insured (ETM) | No Opt. Call | N/R (5) | | | 1,483,638 | |
| | 385 | | Maricopa County, Arizona, Hospital Revenue Bonds, Sun Health Corporation, Series 2005, 5.000%, 4/01/16 (Pre-refunded 4/01/15) | 4/15 at 100.00 | N/R (5) | | | 436,956 | |
| | 1,500 | | Phoenix Civic Improvement Corporation, Arizona, Junior Lien Water System Revenue Bonds, Series 2002, 5.000%, 7/01/26 (Pre-refunded 7/01/12) – FGIC Insured | 7/12 at 100.00 | AAA | | | 1,524,510 | |
| | 1,200 | | Prescott Valley Municipal Property Corporation, Arizona, Municipal Facilities Revenue Bonds, Series 2003, 5.000%, 1/01/27 (Pre-refunded 1/01/13) – FGIC Insured | 1/13 at 100.00 | AA– (5) | | | 1,247,988 | |
| | 365 | | Puerto Rico Public Buildings Authority, Guaranteed Government Facilities Revenue Refunding Bonds, Series 2002D, 5.125%, 7/01/24 (Pre-refunded 7/01/12) | 7/12 at 100.00 | Baa1 (5) | | | 371,092 | |
| | 530 | | Salt River Project Agricultural Improvement and Power District, Arizona, Electric System Revenue Bonds, Series 2002B, 5.000%, 1/01/22 (Pre-refunded 1/01/13) | 1/13 at 100.00 | Aa1 (5) | | | 551,380 | |
| | 8,730 | | Total U.S. Guaranteed | | | | | 9,336,414 | |
| | | | Utilities – 25.0% (17.8% of Total Investments) | | | | | | |
| | 1,000 | | Arizona Power Authority, Special Obligation Power Resource Revenue Refunding Crossover Bonds, Hoover Project, Series 2001, 5.250%, 10/01/15 | No Opt. Call | AA | | | 1,160,010 | |
| | 1,600 | | Maricopa County Pollution Control Corporation, Arizona, Pollution Control Revenue Refunding Bonds, Southern California Edison Company, Series 2000A, 5.000%, 6/01/35 | 6/20 at 100.00 | A1 | | | 1,740,192 | |
| | 1,340 | | Pima County Industrial Development Authority, Arizona, Revenue Bonds, Tucson Electric Power Company, Refunding Series 2008, 5.750%, 9/01/29 | 1/15 at 100.00 | BBB– | | | 1,401,345 | |
| | 650 | | Pinal County Electrical District 3, Arizona, Electric System Revenue Bonds, Refunding Series 2011, 5.250%, 7/01/36 | 7/21 at 100.00 | A | | | 701,981 | |
| | 2,170 | | Puerto Rico Electric Power Authority, Power Revenue Bonds, Series 2005RR, 5.000%, 7/01/27 – SYNCORA GTY Insured | 7/15 at 100.00 | A3 | | | 2,287,397 | |
| | 715 | | Salt River Project Agricultural Improvement and Power District, Arizona, Electric System Revenue Bonds, Tender Option Bond Trust 09-9W, 17.970%, 1/01/38 (IF) (6) | 1/18 at 100.00 | Aa1 | | | 973,544 | |
| | | | Salt Verde Financial Corporation, Arizona, Senior Gas Revenue Bonds, Citigroup Energy Inc Prepay Contract Obligations, Series 2007: | | | | | | |
| | 4,500 | | 5.500%, 12/01/29 | No Opt. Call | A– | | | 4,824,131 | |
| | 3,500 | | 5.000%, 12/01/37 | No Opt. Call | A– | | | 3,504,970 | |
| | 15,475 | | Total Utilities | | | | | 16,593,570 | |
| | | | Water and Sewer – 12.2% (8.7% of Total Investments) | | | | | | |
| | 1,005 | | Cottonwood, Arizona, Senior Lien Water System Revenue Bonds, Municipal Property Corporation, Series 2004, 5.000%, 7/01/24 – SYNCORA GTY Insured | 7/14 at 100.00 | A | | | 1,031,924 | |
| | 1,425 | | Goodyear, Arizona, Water and Sewer Revenue Obligations, Series 2010, 5.625%, 7/01/39 | 7/20 at 100.00 | A+ | | | 1,541,009 | |
| | 500 | | Oro Valley Municipal Property Corporation, Arizona, Senior Lien Water Revenue Bonds, Series 2003, 5.000%, 7/01/23 – NPFG Insured | 7/13 at 100.00 | AA– | | | 518,460 | |
| | 1,000 | | Phoenix Civic Improvement Corporation, Arizona, Junior Lien Wastewater System Revenue Bonds, Series 2004, 5.000%, 7/01/24 – NPFG Insured | 7/14 at 100.00 | AA+ | | | 1,087,730 | |
| | Principal | | | Optional Call | | | | | |
| | Amount (000) | | Description (1) | Provisions (2) | Ratings (3) | | | Value | |
| | | | Water and Sewer (continued) | | | | | | |
| $ | 1,250 | | Phoenix Civic Improvement Corporation, Arizona, Junior Lien Water System Revenue Refunding Bonds, Series 2001, 5.500%, 7/01/21 – FGIC Insured | No Opt. Call | AAA | | $ | 1,612,350 | |
| | | | Surprise Municipal Property Corporation, Arizona, Wastewater System Revenue Bonds, Series 2007: | | | | | | |
| | 600 | | 4.700%, 4/01/22 | 4/14 at 100.00 | N/R | | | 612,336 | |
| | 810 | | 4.900%, 4/01/32 | 4/17 at 100.00 | N/R | | | 820,255 | |
| | 905 | | Yuma County Industrial Development Authority, Arizona, Exempt Revenue Bonds, Far West Water & Sewer Inc. Refunding, Series 2007A, 6.375%, 12/01/37 (Alternative Minimum Tax) | 12/17 at 100.00 | N/R | | | 863,062 | |
| | 7,495 | | Total Water and Sewer | | | | | 8,087,126 | |
| $ | 91,056 | | Total Investments (cost $85,604,367) – 140.8% | | | | | 93,333,482 | |
| | | | Variable MuniFund Term Preferred Shares, at Liquidation Value – (42.3)% (7) | | | | | (28,000,000 | ) |
| | | | Other Assets Less Liabilities – 1.5% | | | | | 934,542 | |
| | | | Net Assets Applicable to Common Shares – 100% | | | | $ | 66,268,024 | |
| (1) | | All percentages shown in the Portfolio of Investments are based on net assets applicable to Common shares unless otherwise noted. |
| (2) | | Optional Call Provisions (not covered by the report of independent registered public accounting firm): Dates (month and year) and prices of the earliest optional call or redemption. There may be other call provisions at varying prices at later dates. Certain mortgage-backed securities may be subject to periodic principal paydowns. |
| (3) | | Ratings (not covered by the report of independent registered public accounting firm): Using the highest of Standard & Poor’s Group (“Standard & Poor’s”), Moody’s Investors Service, Inc. (“Moody’s”) or Fitch, Inc. (“Fitch”) rating. Ratings below BBB by Standard & Poor’s, Baa by Moody’s or BBB by Fitch are considered to be below investment grade. Holdings designated N/R are not rated by any of these national rating agencies. |
| (4) | | Investment valued at fair value using methods determined in good faith by, or at the discretion of, the Board of Directors. For fair value measurement disclosure purposes, investment categorized as Level 3. See Notes to Financial Statements, Footnote 1 – General Information and Significant Accounting Policies, Investment Valuation for more information. |
| (5) | | Backed by an escrow or trust containing sufficient U.S. Government or U.S. Government agency securities, which ensure the timely payment of principal and interest. Certain bonds backed by U.S. Government or agency securities are regarded as having an implied rating equal to the rating of such securities. |
| (6) | | Investment, or portion of investment, has been pledged to collateralize the net payment obligations for investments in inverse floating rate transactions. |
| (7) | | Variable MuniFund Term Preferred Shares, at Liquidation Value as a percentage of Total Investments is 30.0%. |
| N/R | | Not rated. |
| (ETM) | | Escrowed to maturity. |
| (IF) | | Inverse floating rate investment. |
See accompanying notes to financial statements.
| | | Nuveen Arizona Dividend Advantage Municipal Fund |
| NFZ | | Portfolio of Investments |
| | | February 29, 2012 |
| | Principal | | | Optional Call | | | | | |
| | Amount (000) | | Description (1) | Provisions (2) | Ratings (3) | | | Value | |
| | | | Education and Civic Organizations – 14.5% (10.0% of Total Investments) | | | | | | |
| $ | 280 | | Arizona Higher Education Loan Authority, Student Loan Revenue Bonds, Series 2007B, Auction Rate Securities, 0.543%, 11/01/41 (Alternative Minimum Tax) (4) | 9/12 at 100.00 | A | | $ | 219,476 | |
| | 275 | | Glendale Industrial Development Authority, Arizona, Revenue Bonds, Midwestern University, Refunding Series 2007, 5.000%, 5/15/31 | 5/22 at 100.00 | A– | | | 298,452 | |
| | 500 | | Glendale Industrial Development Authority, Arizona, Revenue Bonds, Midwestern University, Refunding Series 2010, 5.125%, 5/15/40 | 5/20 at 100.00 | A– | | | 522,795 | |
| | 100 | | Phoenix IDA, Arizona, Education Revenue Bonds, Painted Rock Academy Project, Series 2012A, 7.500%, 7/01/42 | 7/20 at 100.00 | N/R | | | 100,414 | |
| | 80 | | Phoenix Industrial Development Authority, Arizona, Education Revenue Bonds, Great Hearts Academies – Veritas Project, Series 2012, 6.300%, 7/01/42 | 7/21 at 100.00 | N/R | | | 80,812 | |
| | 100 | | Pima County Industrial Development Authority, Arizona, Education Revenue Bonds, Carden Traditional Schools Project, Series 2012, 7.500%, 1/01/42 | 1/22 at 100.00 | BBB– | | | 99,571 | |
| | 130 | | Pima County Industrial Development Authority, Arizona, Education Revenue Bonds, Paradise Education Center Project, Series 2010, 6.000%, 6/01/40 | 6/19 at 100.00 | BBB– | | | 118,512 | |
| | 165 | | Pima County Industrial Development Authority, Arizona, Educational Revenue Bonds, Paradise Education Center Charter School, Series 2006, 6.000%, 6/01/36 | 6/16 at 100.00 | BBB– | | | 151,226 | |
| | 220 | | Pima County Industrial Development Authority, Arizona, Educational Revenue Bonds, Valley Academy Charter School Project, Series 2008, 6.500%, 7/01/38 | 7/18 at 100.00 | Baa3 | | | 218,603 | |
| | 1,000 | | Puerto Rico Industrial, Tourist, Educational, Medical and Environmental Control Facilities Financing Authority, Higher Education Revenue Bonds, Ana G. Mendez University System, Series 1999, 5.375%, 2/01/29 | 8/12 at 100.00 | BBB– | | | 987,380 | |
| | 300 | | Puerto Rico Industrial, Tourist, Educational, Medical and Environmental Control Facilities Financing Authority, Higher Education Revenue Bonds, University of the Sacred Heart, Series 2001, 5.250%, 9/01/21 | 9/12 at 100.00 | BBB | | | 300,417 | |
| | 305 | | Tucson Industrial Development Authority, Arizona, Charter School Revenue Bonds, Arizona Agribusiness and Equine Center Charter School, Series 2004A, 6.125%, 9/01/34 | 9/14 at 100.00 | BB+ | | | 277,538 | |
| | 3,455 | | Total Education and Civic Organizations | | | | | 3,375,196 | |
| | | | Health Care – 21.5% (14.8% of Total Investments) | | | | | | |
| | 565 | | Arizona Health Facilities Authority, Hospital Revenue Bonds, Banner Health Systems, Series 2007A, 5.000%, 1/01/25 | 1/17 at 100.00 | AA– | | | 632,207 | |
| | 325 | | Arizona Health Facilities Authority, Hospital Revenue Bonds, Banner Health Systems, Series 2007B, 1.059%, 1/02/37 | 1/17 at 100.00 | AA– | | | 229,288 | |
| | 720 | | Arizona Health Facilities Authority, Hospital Revenue Bonds, Banner Health Systems, Series 2008D, 5.500%, 1/01/38 | 1/18 at 100.00 | AA– | | | 774,734 | |
| | 10 | | California Health Facilities Financing Authority, Health Facility Revenue Bonds, Adventist Health System/West, Series 2003A, 5.000%, 3/01/28 | 3/13 at 100.00 | A | | | 10,101 | |
| | 250 | | Glendale Industrial Development Authority, Arizona, Revenue Bonds, John C. Lincoln Health Network, Series 2005B, 5.000%, 12/01/37 | 12/15 at 100.00 | BBB | | | 246,595 | |
| | 415 | | Glendale Industrial Development Authority, Arizona, Revenue Bonds, John C. Lincoln Health Network, Series 2007, 5.000%, 12/01/42 | 12/17 at 100.00 | BBB | | | 409,510 | |
| | 750 | | Maricopa County Industrial Development Authority, Arizona, Health Facility Revenue Bonds, Catholic Healthcare West, Series 2004A, 5.375%, 7/01/23 | 7/14 at 100.00 | A | | | 797,168 | |
| | 1,025 | | Maricopa County Industrial Development Authority, Arizona, Health Facility Revenue Bonds, Catholic Healthcare West, Series 2007A, 5.250%, 7/01/32 | 7/17 at 100.00 | A | | | 1,077,183 | |
| | | | Show Low Industrial Development Authority, Arizona, Hospital Revenue Bonds, Navapache Regional Medical Center, Series 2005: | | | | | | |
| | 200 | | 5.000%, 12/01/25 – RAAI Insured | 12/15 at 100.00 | BBB+ | | | 202,504 | |
| | 150 | | 5.000%, 12/01/30 – RAAI Insured | 12/15 at 100.00 | BBB+ | | | 150,422 | |
| | Principal | | | Optional Call | | | | | |
| | Amount (000) | | Description (1) | Provisions (2) | Ratings (3) | | | Value | |
| | | | Health Care (continued) | | | | | | |
| $ | 450 | | University Medical Center Corporation, Tucson, Arizona, Hospital Revenue Bonds, Series 2011, 6.000%, 7/01/39 | 7/21 at 100.00 | BBB+ | | $ | 499,343 | |
| | 4,860 | | Total Health Care | | | | | 5,029,055 | |
| | | | Housing/Multifamily – 3.7% (2.5% of Total Investments) | | | | | | |
| | 1,000 | | Maricopa County Industrial Development Authority, Arizona, Multifamily Housing Revenue Bonds, Whispering Palms Apartments, Series 1999A, 5.900%, 7/01/29 – NPFG Insured | 4/12 at 100.00 | Baa2 | | | 853,820 | |
| | | | Tax Obligation/General – 18.7% (12.9% of Total Investments) | | | | | | |
| | 1,000 | | Maricopa County Unified School District 11, Peoria, Arizona, General Obligation Bonds, Second Series 2005, 5.000%, 7/01/20 – FGIC Insured | 7/15 at 100.00 | Aa2 | | | 1,132,250 | |
| | 180 | | Pima County Continental Elementary School District 39, Arizona, General Obligation Bonds, Series 2011A, 2.000%, 7/01/30 – AGM Insured | 7/21 at 100.00 | AA– | | | 218,493 | |
| | 1,310 | | Scottsdale, Arizona, General Obligation Bonds, Preserve Acquisition Series 1999, 5.000%, 7/01/32 | 7/21 at 100.00 | AAA | | | 1,537,703 | |
| | 1,340 | | Yuma & La Paz Counties Community College District, Arizona, General Obligation Bonds, Series 2006, 5.000%, 7/01/21 – NPFG Insured | 7/16 at 100.00 | Aa2 | | | 1,477,470 | |
| | 3,830 | | Total Tax Obligation/General | | | | | 4,365,916 | |
| | | | Tax Obligation/Limited – 44.9% (31.0% of Total Investments) | | | | | | |
| | 1,220 | | Arizona Tourism and Sports Authority, Tax Revenue Bonds, Multipurpose Stadium Facility Project, Series 2003A, 5.000%, 7/01/31 – NPFG Insured | 7/13 at 100.00 | A1 | | | 1,230,455 | |
| | 85 | | Centerra Community Facilities District, Goodyear, Arizona, General Obligation Bonds, Series 2005, 5.500%, 7/15/29 | 7/15 at 100.00 | N/R | | | 76,138 | |
| | 204 | | Estrella Mountain Ranch Community Facilities District, Arizona, Special Assessment Bonds, Montecito Assessment District, Series 2007, 5.700%, 7/01/27 | 1/17 at 100.00 | N/R | | | 192,246 | |
| | 125 | | Estrella Mountain Ranch Community Facilities District, Goodyear, Arizona, Special Assessment Lien Bonds, Series 2001A, 7.875%, 7/01/25 | 7/12 at 100.00 | N/R | | | 125,816 | |
| | 1,000 | | Greater Arizona Development Authority, Infrastructure Revenue Bonds, Series 2006-1, 5.000%, 8/01/22 – NPFG Insured | 8/16 at 100.00 | AA– | | | 1,074,250 | |
| | 275 | | Greater Arizona Development Authority, Infrastructure Revenue Bonds, Series 2006A, 5.000%, 8/01/23 – NPFG Insured | 8/16 at 100.00 | AA– | | | 294,201 | |
| | 1,180 | | Marana Municipal Property Corporation, Arizona, Revenue Bonds, Series 2003, 5.000%, 7/01/23 – AMBAC Insured | 7/13 at 100.00 | AA | | | 1,237,018 | |
| | 471 | | Marana, Arizona, Tangerine Farms Road Improvement District Revenue Bonds, Series 2006, 4.600%, 1/01/26 | 7/16 at 100.00 | A2 | | | 488,535 | |
| | 150 | | Marley Park Community Facilities District, City of Surprise, Arizona, Limited Tax General Obligation Bonds, Series 2008 (Bank Qualified), 6.100%, 7/15/32 | 7/17 at 100.00 | N/R | | | 141,489 | |
| | 255 | | Merrill Ranch Community Facilities District 1, Florence, Arizona, General Obligation Bonds, Series 2008A, 7.400%, 7/15/33 | 7/18 at 100.00 | N/R | | | 272,774 | |
| | 330 | | Palm Valley Community Facility District 3, Goodyear, Arizona, General Obligation Bonds, Series 2006, 5.300%, 7/15/31 | 7/16 at 100.00 | N/R | | | 285,061 | |
| | 225 | | Palm Valley Community Facility District 3, Goodyear, Arizona, Limited Tax General Obligation Bonds, Series 2007, 5.800%, 7/15/32 | 7/17 at 100.00 | N/R | | | 204,737 | |
| | 100 | | Parkway Community Facilities District 1, Prescott Valley, Arizona, General Obligation Bonds, Series 2006, 5.350%, 7/15/31 | 7/16 at 100.00 | N/R | | | 86,926 | |
| | 725 | | Phoenix Industrial Development Authority, Arizona, Government Bonds, Capitol Mall LLC II, Series 2001, 5.250%, 9/15/16 – AMBAC Insured | 3/12 at 100.00 | A1 | | | 727,414 | |
| | | Nuveen Arizona Dividend Advantage Municipal Fund (continued) |
| NFZ | | Portfolio of Investments |
| | | February 29, 2012 |
| | Principal | | | Optional Call | | | | | |
| | Amount (000) | | Description (1) | Provisions (2) | Ratings (3) | | | Value | |
| | | | Tax Obligation/Limited (continued) | | | | | | |
| $ | 100 | | Phoenix Mesa Gateway Airport Authority, Arizona, Special Facility Revenue Bonds, Mesa Project, Series 2012, 5.000%, 7/01/38 (Alternative Minimum Tax) | 7/22 at 100.00 | AA+ | | $ | 101,324 | |
| | 680 | | Pinal County Industrial Development Authority, Arizona, Correctional Facilities Contract Revenue Bonds, Florence West Prison LLC, Series 2002A, 5.000%, 10/01/18 – ACA Insured | No Opt. Call | BBB– | | | 684,094 | |
| | 600 | | San Luis Civic Improvement Corporation, Arizona, Municipal Facilities Excise Tax Revenue Bonds, Series 2005, 5.000%, 7/01/25 – SYNCORA GTY Insured | 7/15 at 100.00 | A+ | | | 634,794 | |
| | 1,000 | | Scottsdale Municipal Property Corporation, Arizona, Excise Tax Revenue Bonds, Refunding Series 2006, 5.000%, 7/01/24 | No Opt. Call | AAA | | | 1,276,219 | |
| | 350 | | Tartesso West Community Facility District, Buckeye, Arizona, Limited Tax General Obligation Bonds, Series 2007, 5.900%, 7/15/32 | 7/17 at 100.00 | N/R | | | 322,364 | |
| | 500 | | Vistancia Community Facilities District, Arizona, Restricted General Obligation Bonds, Series 2005, 5.750%, 7/15/24 | 7/15 at 100.00 | A1 | | | 537,090 | |
| | 339 | | Watson Road Community Facilities District, Arizona, Special Assessment Revenue Bonds, Series 2005, 6.000%, 7/01/30 | 7/16 at 100.00 | N/R | | | 306,510 | |
| | 225 | | Westpark Community Facilities District, Buckeye, Arizona, General Obligation Tax Increment Bonds Series 2006, 5.250%, 7/15/31 | 7/16 at 100.00 | N/R | | | 193,133 | |
| | 10,139 | | Total Tax Obligation/Limited | | | | | 10,492,588 | |
| | | | U.S. Guaranteed – 7.8% (5.3% of Total Investments) (5) | | | | | | |
| | 240 | | Maricopa County Union High School District 210 Phoenix, Arizona, General Obligation Bonds, Series 2006C, 5.000%, 7/01/24 (Pre-refunded 7/01/16) – NPFG Insured | 7/16 at 100.00 | AA (5) | | | 283,970 | |
| | 1,500 | | Phoenix Civic Improvement Corporation, Arizona, Junior Lien Water System Revenue Bonds, Series 2002, 5.000%, 7/01/26 (Pre-refunded 7/01/12) – FGIC Insured | 7/12 at 100.00 | AAA | | | 1,524,509 | |
| | 1,740 | | Total U.S. Guaranteed | | | | | 1,808,479 | |
| | | | Utilities – 28.4% (19.6% of Total Investments) | | | | | | |
| | 1,500 | | Arizona Power Authority, Special Obligation Power Resource Revenue Refunding Crossover Bonds, Hoover Project, Series 2001, 5.250%, 10/01/17 | No Opt. Call | AA | | | 1,840,168 | |
| | 600 | | Maricopa County Pollution Control Corporation, Arizona, Pollution Control Revenue Refunding Bonds, Southern California Edison Company, Series 2000A, 5.000%, 6/01/35 | 6/20 at 100.00 | A1 | | | 652,572 | |
| | 1,000 | | Mesa, Arizona, Utility System Revenue Refunding Bonds, Series 2002, 5.250%, 7/01/17 – FGIC Insured | No Opt. Call | Aa2 | | | 1,204,220 | |
| | 665 | | Pima County Industrial Development Authority, Arizona, Revenue Bonds, Tucson Electric Power Company, Refunding Series 2008, 5.750%, 9/01/29 | 1/15 at 100.00 | BBB– | | | 695,444 | |
| | 400 | | Pinal County Electrical District 3, Arizona, Electric System Revenue Bonds, Refunding Series 2011, 5.250%, 7/01/36 | 7/21 at 100.00 | A | | | 431,988 | |
| | 1,000 | | Puerto Rico Electric Power Authority, Power Revenue Bonds, Series 2005RR, 5.000%, 7/01/26 – SYNCORA GTY Insured | 7/15 at 100.00 | A3 | | | 1,054,100 | |
| | 560 | | Salt River Project Agricultural Improvement and Power District, Arizona, Electric System Revenue Bonds, Tender Option Bond Trust 09-9W, 17.970%, 1/01/38 (IF) (6) | 1/18 at 100.00 | Aa1 | | | 762,496 | |
| | 5,725 | | Total Utilities | | | | | 6,640,988 | |
| | | | Water and Sewer – 5.6% (3.9% of Total Investments) | | | | | | |
| | 475 | | Goodyear, Arizona, Water and Sewer Revenue Obligations, Series 2010, 5.625%, 7/01/39 | 7/20 at 100.00 | A+ | | | 513,670 | |
| | | | Surprise Municipal Property Corporation, Arizona, Wastewater System Revenue Bonds, Series 2007: | | | | | | |
| | 225 | | 4.700%, 4/01/22 | 4/14 at 100.00 | N/R | | | 229,626 | |
| | 260 | | 4.900%, 4/01/32 | 4/17 at 100.00 | N/R | | | 263,292 | |
| | Principal | | | Optional Call | | | | | |
| | Amount (000) | | Description (1) | Provisions (2) | Ratings (3) | | | Value | |
| | | | Water and Sewer (continued) | | | | | | |
| $ | 325 | | Yuma County Industrial Development Authority, Arizona, Exempt Revenue Bonds, Far West Water & Sewer Inc. Refunding, Series 2007A, 6.375%, 12/01/37 (Alternative Minimum Tax) | 12/17 at 100.00 | N/R | | $ | 309,940 | |
| | 1,285 | | Total Water and Sewer | | | | | 1,316,528 | |
| $ | 32,034 | | Total Investments (cost $31,868,925) – 145.1% | | | | | 33,882,570 | |
| | | | MuniFund Term Preferred Shares, at Liquidation Value – (47.5)% (7) | | | | | (11,100,000 | ) |
| | | | Other Assets Less Liabilities – 2.4% | | | | | 566,463 | |
| | | | Net Assets Applicable to Common Shares – 100% | | | | $ | 23,349,033 | |
| (1) | | All percentages shown in the Portfolio of Investments are based on net assets applicable to Common shares unless otherwise noted. |
| (2) | | Optional Call Provisions (not covered by the report of independent registered public accounting firm): Dates (month and year) and prices of the earliest optional call or redemption. There may be other call provisions at varying prices at later dates. Certain mortgage-backed securities may be subject to periodic principal paydowns. |
| (3) | | Ratings (not covered by the report of independent registered public accounting firm): Using the highest of Standard & Poor’s Group (“Standard & Poor’s”), Moody’s Investors Service, Inc. (“Moody’s”) or Fitch, Inc. (“Fitch”) rating. Ratings below BBB by Standard & Poor’s, Baa by Moody’s or BBB by Fitch are considered to be below investment grade. Holdings designated N/R are not rated by any of these national rating agencies. |
| (4) | | Investment valued at fair value using methods determined in good faith by, or at the discretion of, the Board of Trustees. For fair value measurement disclosure purposes, investment categorized as Level 3. See Notes to Financial Statements, Footnote 1 – General Information and Significant Accounting Policies, Investment Valuation for more information. |
| (5) | | Backed by an escrow or trust containing sufficient U.S. Government or U.S. Government agency securities, which ensure the timely payment of principal and interest. Certain bonds backed by U.S. Government or agency securities are regarded as having an implied rating equal to the rating of such securities. |
| (6) | | Investment, or portion of investment, has been pledged to collateralize the net payment obligations for investments in inverse floating rate transactions. |
| (7) | | MuniFund Term Preferred Shares, at Liquidation Value as a percentage of Total Investments is 32.8%. |
| N/R | | Not rated. |
| (IF) | | Inverse floating rate investment. |
See accompanying notes to financial statements.
| | | Nuveen Arizona Dividend Advantage Municipal Fund 2 |
| NKR | | Portfolio of Investments |
| | | February 29, 2012 |
| | Principal | | | Optional Call | | | | | |
| | Amount (000) | | Description (1) | Provisions (2) | Ratings (3) | | | Value | |
| | | | Education and Civic Organizations – 13.4% (9.1% of Total Investments) | | | | | | |
| $ | 1,130 | | Arizona Higher Education Loan Authority, Student Loan Revenue Bonds, Series 2007B, Auction Rate Securities, 0.543%, 11/01/41 (Alternative Minimum Tax) (4) | 9/12 at 100.00 | A | | $ | 885,742 | |
| | 450 | | Glendale Industrial Development Authority, Arizona, Revenue Bonds, Midwestern University, Refunding Series 2007, 5.000%, 5/15/31 | 5/22 at 100.00 | A– | | | 488,376 | |
| | 775 | | Glendale Industrial Development Authority, Arizona, Revenue Bonds, Midwestern University, Refunding Series 2010, 5.125%, 5/15/40 | 5/20 at 100.00 | A– | | | 810,332 | |
| | 360 | | Northern Arizona University, System Revenue Bonds, Series 2012, 5.000%, 6/01/41 | 6/21 at 100.00 | A+ | | | 385,726 | |
| | 165 | | Phoenix IDA, Arizona, Education Revenue Bonds, Painted Rock Academy Project, Series 2012A, 7.500%, 7/01/42 | 7/20 at 100.00 | N/R | | | 165,683 | |
| | 130 | | Phoenix Industrial Development Authority, Arizona, Education Revenue Bonds, Great Hearts Academies – Veritas Project, Series 2012, 6.300%, 7/01/42 | 7/21 at 100.00 | N/R | | | 131,320 | |
| | 485 | | Pima County Industrial Development Authority, Arizona, Charter School Revenue Bonds, Noah Webster Basic Schools Inc., Series 2004, 6.000%, 12/15/24 | 12/14 at 100.00 | BBB– | | | 486,183 | |
| | 165 | | Pima County Industrial Development Authority, Arizona, Education Revenue Bonds, Carden Traditional Schools Project, Series 2012, 7.500%, 1/01/42 | 1/22 at 100.00 | BBB– | | | 164,292 | |
| | 210 | | Pima County Industrial Development Authority, Arizona, Education Revenue Bonds, Paradise Education Center Project, Series 2010, 6.000%, 6/01/40 | 6/19 at 100.00 | BBB– | | | 191,442 | |
| | 175 | | Pima County Industrial Development Authority, Arizona, Educational Revenue Bonds, Paradise Education Center Charter School, Series 2006, 6.000%, 6/01/36 | 6/16 at 100.00 | BBB– | | | 160,391 | |
| | 365 | | Pima County Industrial Development Authority, Arizona, Educational Revenue Bonds, Valley Academy Charter School Project, Series 2008, 6.500%, 7/01/38 | 7/18 at 100.00 | Baa3 | | | 362,682 | |
| | 260 | | Puerto Rico Industrial, Tourist, Educational, Medical and Environmental Control Facilities Financing Authority, Higher Education Revenue Bonds, Ana G. Mendez University System, Series 1999, 5.375%, 2/01/19 | 8/12 at 100.00 | BBB– | | | 260,164 | |
| | 480 | | Tucson Industrial Development Authority, Arizona, Charter School Revenue Bonds, Arizona Agribusiness and Equine Center Charter School, Series 2004A, 6.125%, 9/01/34 | 9/14 at 100.00 | BB+ | | | 436,781 | |
| | | | University of Arizona, Certificates of Participation, Series 2002A: | | | | | | |
| | 65 | | 5.500%, 6/01/18 – AMBAC Insured | 6/12 at 100.00 | AA– | | | 65,736 | |
| | 40 | | 5.125%, 6/01/22 – AMBAC Insured | 6/12 at 100.00 | AA– | | | 40,374 | |
| | 5,255 | | Total Education and Civic Organizations | | | | | 5,035,224 | |
| | | | Health Care – 30.3% (20.6% of Total Investments) | | | | | | |
| | 845 | | Arizona Health Facilities Authority, Hospital Revenue Bonds, Banner Health Systems, Series 2007A, 5.000%, 1/01/25 | 1/17 at 100.00 | AA– | | | 945,513 | |
| | 520 | | Arizona Health Facilities Authority, Hospital Revenue Bonds, Banner Health Systems, Series 2007B, 1.059%, 1/02/37 | 1/17 at 100.00 | AA– | | | 366,860 | |
| | 1,150 | | Arizona Health Facilities Authority, Hospital Revenue Bonds, Banner Health Systems, Series 2008D, 5.500%, 1/01/38 | 1/18 at 100.00 | AA– | | | 1,237,423 | |
| | 600 | | Arizona Health Facilities Authority, Revenue Bonds, Blood Systems Inc., Series 2004, 5.000%, 4/01/20 | 4/14 at 100.00 | A | | | 633,222 | |
| | 400 | | Glendale Industrial Development Authority, Arizona, Revenue Bonds, John C. Lincoln Health Network, Series 2005B, 5.000%, 12/01/37 | 12/15 at 100.00 | BBB | | | 394,552 | |
| | 655 | | Glendale Industrial Development Authority, Arizona, Revenue Bonds, John C. Lincoln Health Network, Series 2007, 5.000%, 12/01/42 | 12/17 at 100.00 | BBB | | | 646,334 | |
| | 1,375 | | Maricopa County Industrial Development Authority, Arizona, Health Facility Revenue Bonds, Catholic Healthcare West, Series 2004A, 5.375%, 7/01/23 | 7/14 at 100.00 | A | | | 1,461,474 | |
| | Principal | | | Optional Call | | | | | |
| | Amount (000) | | Description (1) | Provisions (2) | Ratings (3) | | | Value | |
| | | | Health Care (continued) | | | | | | |
| $ | 1,650 | | Maricopa County Industrial Development Authority, Arizona, Health Facility Revenue Bonds, Catholic Healthcare West, Series 2007A, 5.250%, 7/01/32 | 7/17 at 100.00 | A | | $ | 1,734,002 | |
| | 1,120 | | Scottsdale Industrial Development Authority, Arizona, Hospital Revenue Bonds, Scottsdale Healthcare, Series 2006C. Re-offering, 5.000%, 9/01/35 – AGC Insured | 9/20 at 100.00 | AA– | | | 1,206,352 | |
| | | | Show Low Industrial Development Authority, Arizona, Hospital Revenue Bonds, Navapache Regional Medical Center, Series 2005: | | | | | | |
| | 315 | | 5.000%, 12/01/25 – RAAI Insured | 12/15 at 100.00 | BBB+ | | | 318,944 | |
| | 260 | | 5.000%, 12/01/30 – RAAI Insured | 12/15 at 100.00 | BBB+ | | | 260,731 | |
| | 1,050 | | University Medical Center Corporation, Tucson, Arizona, Hospital Revenue Bonds, Series 2011, 6.000%, 7/01/39 | 7/21 at 100.00 | BBB+ | | | 1,165,133 | |
| | 1,000 | | Yavapai County Industrial Development Authority, Arizona, Hospital Revenue Bonds, Yavapai Regional Medical Center, Series 2003A, 6.000%, 8/01/33 | 8/13 at 100.00 | Baa2 | | | 1,016,880 | |
| | 10,940 | | Total Health Care | | | | | 11,387,420 | |
| | | | Tax Obligation/General – 29.6% (20.0% of Total Investments) | | | | | | |
| | 1,000 | | Maricopa County Elementary School District 83 Cartwright, Arizona, General Obligation Bonds, School Improvement, Project 2010, Series 2011A, 5.375%, 7/01/30 – AGM Insured | 7/21 at 100.00 | AA– | | | 1,123,210 | |
| | 1,000 | | Maricopa County School District 6, Arizona, General Obligation Refunding Bonds, Washington Elementary School, Series 2002A, 5.375%, 7/01/16 – AGM Insured | No Opt. Call | Aa2 | | | 1,193,050 | |
| | 775 | | Maricopa County School District 79 Litchfield Elementary, Arizona, General Obligation Bonds, Series 2011, 5.000%, 7/01/23 | 7/21 at 100.00 | Aa2 | | | 942,299 | |
| | 1,165 | | Maricopa County Unified School District 69, Paradise Valley, Arizona, General Obligation Refunding Bonds, Series 2002A, 5.250%, 7/01/14 – FGIC Insured | No Opt. Call | Aa2 | | | 1,286,160 | |
| | 1,405 | | Mesa, Arizona, General Obligation Bonds, Series 2002, 5.375%, 7/01/15 – FGIC Insured | No Opt. Call | AA | | | 1,621,131 | |
| | | | Phoenix, Arizona, Various Purpose General Obligation Bonds, Series 2002B: | | | | | | |
| | 985 | | 5.000%, 7/01/22 | 7/12 at 100.00 | AAA | | | 999,716 | |
| | 290 | | 5.000%, 7/01/27 | 7/12 at 100.00 | AAA | | | 294,237 | |
| | 310 | | Pima County Continental Elementary School District 39, Arizona, General Obligation Bonds, Series 2011A, 2.000%, 7/01/30 – AGM Insured | 7/21 at 100.00 | AA– | | | 376,294 | |
| | 500 | | Pima County Unified School District 08 Flowing Wells, Arizona, General Obligation Bonds, Series 2011B, 5.375%, 7/01/29 | 7/21 at 100.00 | A+ | | | 562,865 | |
| | 1,000 | | Pima County Unified School District 6, Marana, Arizona, General Obligation Bonds, School Improvement Project 2010 Series 2011A, 5.000%, 7/01/25 | 7/21 at 100.00 | A+ | | | 1,118,150 | |
| | 1,360 | | Scottsdale, Arizona, General Obligation Bonds, Preserve Acquisition Series 1999, 5.000%, 7/01/33 | 7/21 at 100.00 | AAA | | | 1,585,474 | |
| | 9,790 | | Total Tax Obligation/General | | | | | 11,102,586 | |
| | | | Tax Obligation/Limited – 49.2% (33.3% of Total Investments) | | | | | | |
| | | | Arizona State, Certificates of Participation, Series 2002A: | | | | | | |
| | 750 | | 5.000%, 11/01/17 – NPFG Insured | 5/12 at 100.00 | A+ | | | 753,285 | |
| | 1,000 | | 5.000%, 11/01/18 – NPFG Insured | 5/12 at 100.00 | A+ | | | 1,004,040 | |
| | 120 | | Centerra Community Facilities District, Goodyear, Arizona, General Obligation Bonds, Series 2005, 5.500%, 7/15/29 | 7/15 at 100.00 | N/R | | | 107,489 | |
| | 334 | | Estrella Mountain Ranch Community Facilities District, Arizona, Special Assessment Bonds, Montecito Assessment District, Series 2007, 5.800%, 7/01/32 | 1/17 at 100.00 | N/R | | | 303,940 | |
| | 197 | | Estrella Mountain Ranch Community Facilities District, Goodyear, Arizona, Special Assessment Lien Bonds, Series 2001A, 7.875%, 7/01/25 | 7/12 at 100.00 | N/R | | | 198,286 | |
| | | Nuveen Arizona Dividend Advantage Municipal Fund 2 (continued) |
| NKR | | Portfolio of Investments |
| | | February 29, 2012 |
| | Principal | | | Optional Call | | | | | |
| | Amount (000) | | Description (1) | Provisions (2) | Ratings (3) | | | Value | |
| | | | Tax Obligation/Limited (continued) | | | | | | |
| $ | 980 | | Marana Municipal Property Corporation, Arizona, Municipal Facilities Revenue Bonds, Series 2008B, 5.125%, 7/01/28 | 7/12 at 100.00 | AA | | $ | 985,253 | |
| | 789 | | Marana, Arizona, Tangerine Farms Road Improvement District Revenue Bonds, Series 2006, 4.600%, 1/01/26 | 7/16 at 100.00 | A2 | | | 818,374 | |
| | | | Maricopa County Stadium District, Arizona, Revenue Refunding Bonds, Series 2002: | | | | | | |
| | 840 | | 5.375%, 6/01/18 – AMBAC Insured | 6/12 at 100.00 | N/R | | | 806,232 | |
| | 2,645 | | 5.375%, 6/01/19 – AMBAC Insured | 6/12 at 100.00 | N/R | | | 2,562,525 | |
| | 240 | | Marley Park Community Facilities District, City of Surprise, Arizona, Limited Tax General Obligation Bonds, Series 2008 (Bank Qualified), 6.100%, 7/15/32 | 7/17 at 100.00 | N/R | | | 226,382 | |
| | 415 | | Merrill Ranch Community Facilities District 1, Florence, Arizona, General Obligation Bonds, Series 2008A, 7.400%, 7/15/33 | 7/18 at 100.00 | N/R | | | 443,926 | |
| | 530 | | Palm Valley Community Facility District 3, Goodyear, Arizona, General Obligation Bonds, Series 2006, 5.300%, 7/15/31 | 7/16 at 100.00 | N/R | | | 457,825 | |
| | 350 | | Palm Valley Community Facility District 3, Goodyear, Arizona, Limited Tax General Obligation Bonds, Series 2007, 5.800%, 7/15/32 | 7/17 at 100.00 | N/R | | | 318,479 | |
| | 140 | | Parkway Community Facilities District 1, Prescott Valley, Arizona, General Obligation Bonds, Series 2006, 5.350%, 7/15/31 | 7/16 at 100.00 | N/R | | | 121,696 | |
| | 1,000 | | Phoenix Industrial Development Authority, Arizona, Government Bonds, Capitol Mall LLC II, Series 2001, 5.250%, 9/15/16 – AMBAC Insured | 3/12 at 100.00 | A1 | | | 1,003,330 | |
| | 140 | | Phoenix Mesa Gateway Airport Authority, Arizona, Special Facility Revenue Bonds, Mesa Project, Series 2012, 5.000%, 7/01/38 (Alternative Minimum Tax) | 7/22 at 100.00 | AA+ | | | 141,854 | |
| | 1,070 | | Pinal County Industrial Development Authority, Arizona, Correctional Facilities Contract Revenue Bonds, Florence West Prison LLC, Series 2002A, 5.000%, 10/01/18 – ACA Insured | No Opt. Call | BBB– | | | 1,076,441 | |
| | 270 | | Puerto Rico Public Buildings Authority, Guaranteed Government Facilities Revenue Refunding Bonds, Series 2002D, 5.125%, 7/01/24 | 7/12 at 100.00 | Baa1 | | | 270,867 | |
| | 250 | | Puerto Rico Sales Tax Financing Corporation, Sales Tax Revenue Bonds, First Subordinate Series 2010A, 5.375%, 8/01/39 | 2/20 at 100.00 | A+ | | | 270,578 | |
| | 3,055 | | Puerto Rico Sales Tax Financing Corporation, Sales Tax Revenue Bonds, Series 2010A, 0.000%, 8/01/33 | No Opt. Call | A+ | | | 992,661 | |
| | 960 | | San Luis Civic Improvement Corporation, Arizona, Municipal Facilities Excise Tax Revenue Bonds, Series 2005, 5.000%, 7/01/25 – SYNCORA GTY Insured | 7/15 at 100.00 | A+ | | | 1,015,670 | |
| | 1,000 | | Scottsdale Municipal Property Corporation, Arizona, Excise Tax Revenue Bonds, Refunding Series 2006, 5.000%, 7/01/24 | No Opt. Call | AAA | | | 1,276,220 | |
| | 1,000 | | Scottsdale Municipal Property Corporation, Arizona, Excise Tax Revenue Bonds, Water & Sewer Improvements Project, Series 2010, 5.000%, 7/01/36 | No Opt. Call | AAA | | | 1,117,210 | |
| | 555 | | Tartesso West Community Facility District, Buckeye, Arizona, Limited Tax General Obligation Bonds, Series 2007, 5.900%, 7/15/32 | 7/17 at 100.00 | N/R | | | 511,177 | |
| | 750 | | Vistancia Community Facilities District, Arizona, Restricted General Obligation Bonds, Series 2005, 5.750%, 7/15/24 | 7/15 at 100.00 | A1 | | | 805,635 | |
| | 636 | | Watson Road Community Facilities District, Arizona, Special Assessment Revenue Bonds, Series 2005, 6.000%, 7/01/30 | 7/16 at 100.00 | N/R | | | 575,046 | |
| | 350 | | Westpark Community Facilities District, Buckeye, Arizona, General Obligation Tax Increment Bonds Series 2006, 5.250%, 7/15/31 | 7/16 at 100.00 | N/R | | | 300,430 | |
| | 20,366 | | Total Tax Obligation/Limited | | | | | 18,464,851 | |
| | Principal | | | Optional Call | | | | | |
| | Amount (000) | | Description (1) | Provisions (2) | Ratings (3) | | | Value | |
| | | | Transportation – 2.7% (1.8% of Total Investments) | | | | | | |
| $ | 1,000 | | Phoenix Civic Improvement Corporation, Arizona, Senior Lien Airport Revenue Bonds, Series 2002B, 5.250%, 7/01/27 – FGIC Insured (Alternative Minimum Tax) | 7/12 at 100.00 | AA– | | $ | 1,004,950 | |
| | | | U.S. Guaranteed – 2.8% (1.9% of Total Investments) (5) | | | | | | |
| | 100 | | Maricopa County Unified School District 89, Dysart, Arizona, General Obligation Bonds, Series 2004B, 5.250%, 7/01/20 (Pre-refunded 7/01/14) – AGM Insured | 7/14 at 100.00 | AA– (5) | | | 111,515 | |
| | 375 | | Maricopa County Union High School District 210 Phoenix, Arizona, General Obligation Bonds, Series 2006C, 5.000%, 7/01/24 (Pre-refunded 7/01/16) – NPFG Insured | 7/16 at 100.00 | AA (5) | | | 443,704 | |
| | 500 | | Puerto Rico Public Buildings Authority, Guaranteed Government Facilities Revenue Refunding Bonds, Series 2002D, 5.125%, 7/01/24 (Pre-refunded 7/01/12) | 7/12 at 100.00 | Baa1 (5) | | | 508,345 | |
| | 975 | | Total U.S. Guaranteed | | | | | 1,063,564 | |
| | | | Utilities – 9.5% (6.4% of Total Investments) | | | | | | |
| | 900 | | Maricopa County Pollution Control Corporation, Arizona, Pollution Control Revenue Refunding Bonds, Southern California Edison Company, Series 2000A, 5.000%, 6/01/35 | 6/20 at 100.00 | A1 | | | 978,858 | |
| | 665 | | Pima County Industrial Development Authority, Arizona, Revenue Bonds, Tucson Electric Power Company, Refunding Series 2008, 5.750%, 9/01/29 | 1/15 at 100.00 | BBB– | | | 695,444 | |
| | 250 | | Pinal County Electrical District 3, Arizona, Electric System Revenue Bonds, Refunding Series 2011, 5.250%, 7/01/36 | 7/21 at 100.00 | A | | | 269,993 | |
| | 450 | | Salt River Project Agricultural Improvement and Power District, Arizona, Electric System Revenue Bonds, Tender Option Bond Trust 09-9W, 17.970%, 1/01/38 (IF) (6) | 1/18 at 100.00 | Aa1 | | | 612,720 | |
| | 1,000 | | Salt Verde Financial Corporation, Arizona, Senior Gas Revenue Bonds, Citigroup Energy Inc Prepay Contract Obligations, Series 2007, 5.000%, 12/01/37 | No Opt. Call | A– | | | 1,001,420 | |
| | 3,265 | | Total Utilities | | | | | 3,558,435 | |
| | | | Water and Sewer – 10.2% (6.9% of Total Investments) | | | | | | |
| | 500 | | City of Goodyear, Arizona Subordinate Lien Water and Sewer Revenue Obligations, Series 2011, 5.500%, 7/01/41 | 7/21 at 100.00 | AA– | | | 559,800 | |
| | 490 | | Maricopa County Industrial Development Authority, Arizona, Water System Improvement Revenue Bonds, Chaparral City Water Company, Series 1997A, 5.400%, 12/01/22 – AMBAC Insured (Alternative Minimum Tax) | 6/12 at 100.00 | N/R | | | 490,539 | |
| | 210 | | Oro Valley Municipal Property Corporation, Arizona, Senior Lien Water Revenue Bonds, Series 2003, 5.000%, 7/01/23 – NPFG Insured | 7/13 at 100.00 | AA– | | | 217,753 | |
| | 1,000 | | Phoenix Civic Improvement Corporation, Arizona, Junior Lien Water System Revenue Refunding Bonds, Series 2001, 5.500%, 7/01/22 – FGIC Insured | No Opt. Call | AAA | | | 1,298,810 | |
| | | Nuveen Arizona Dividend Advantage Municipal Fund 2 (continued) |
| NKR | | Portfolio of Investments |
| | | February 29, 2012 |
| | Principal | | | Optional Call | | | | | |
| | Amount (000) | | Description (1) | Provisions (2) | Ratings (3) | | | Value | |
| | | | Water and Sewer (continued) | | | | | | |
| | | | Surprise Municipal Property Corporation, Arizona, Wastewater System Revenue Bonds, Series 2007: | | | | | | |
| $ | 350 | | 4.700%, 4/01/22 | 4/14 at 100.00 | N/R | | $ | 357,196 | |
| | 410 | | 4.900%, 4/01/32 | 4/17 at 100.00 | N/R | | | 415,191 | |
| | 525 | | Yuma County Industrial Development Authority, Arizona, Exempt Revenue Bonds, Far West Water & Sewer Inc. Refunding, Series 2007A, 6.375%, 12/01/37 (Alternative Minimum Tax) | 12/17 at 100.00 | N/R | | | 500,672 | |
| | 3,485 | | Total Water and Sewer | | | | | 3,839,961 | |
| $ | 55,076 | | Total Investments (cost $52,377,523) – 147.7% | | | | | 55,456,991 | |
| | | | MuniFund Term Preferred Shares, at Liquidation Value – (49.9)% (7) | | | | | (18,725,000 | ) |
| | | | Other Assets Less Liabilities – 2.2% | | | | | 814,488 | |
| | | | Net Assets Applicable to Common Shares – 100% | | | | $ | 37,546,479 | |
| (1) | | All percentages shown in the Portfolio of Investments are based on net assets applicable to Common shares unless otherwise noted. |
| (2) | | Optional Call Provisions (not covered by the report of independent registered public accounting firm): Dates (month and year) and prices of the earliest optional call or redemption. There may be other call provisions at varying prices at later dates. Certain mortgage-backed securities may be subject to periodic principal paydowns. |
| (3) | | Ratings (not covered by the report of independent registered public accounting firm): Using the highest of Standard & Poor’s Group (“Standard & Poor’s”), Moody’s Investors Service, Inc. (“Moody’s”) or Fitch, Inc. (“Fitch”) rating. Ratings below BBB by Standard & Poor’s, Baa by Moody’s or BBB by Fitch are considered to be below investment grade. Holdings designated N/R are not rated by any of these national rating agencies. |
| (4) | | Investment valued at fair value using methods determined in good faith by, or at the discretion of, the Board of Trustees. For fair value measurement disclosure purposes, investment categorized as Level 3. See Notes to Financial Statements, Footnote 1 – General Information and Significant Accounting Policies, Investment Valuation for more information. |
| (5) | | Backed by an escrow or trust containing sufficient U.S. Government or U.S. Government agency securities, which ensure the timely payment of principal and interest. Certain bonds backed by U.S. Government or agency securities are regarded as having an implied rating equal to the rating of such securities. |
| (6) | | Investment, or portion of investment, has been pledged to collateralize the net payment obligations for investments in inverse floating rate transactions. |
| (7) | | MuniFund Term Preferred Shares, at Liquidation Value as a percentage of Total Investments is 33.8%. |
| N/R | | Not rated. |
| (IF) | | Inverse floating rate investment. |
See accompanying notes to financial statements.
| | | Nuveen Arizona Dividend Advantage Municipal Fund 3 |
| NXE | | Portfolio of Investments |
| | | February 29, 2012 |
| | Principal | | | Optional Call | | | | | |
| | Amount (000) | | Description (1) | Provisions (2) | Ratings (3) | | | Value | |
| | | | Consumer Staples – 1.0% (0.7% of Total Investments) | | | | | | |
| $ | 470 | | Puerto Rico, The Children’s Trust Fund, Tobacco Settlement Asset-Backed Refunding Bonds, Series 2002, 5.375%, 5/15/33 | 5/12 at 100.00 | BBB | | $ | 464,976 | |
| | | | Education and Civic Organizations – 18.4% (12.8% of Total Investments) | | | | | | |
| | 690 | | Arizona Higher Education Loan Authority, Student Loan Revenue Bonds, Series 2007B, Auction Rate Securities, 0.543%, 11/01/41 (Alternative Minimum Tax) (4) | 9/12 at 100.00 | A | | | 540,851 | |
| | 1,250 | | Arizona State University, System Revenue Bonds, Series 2005, 5.000%, 7/01/20 – AMBAC Insured | 7/15 at 100.00 | Aa3 | | | 1,345,725 | |
| | 520 | | Glendale Industrial Development Authority, Arizona, Revenue Bonds, Midwestern University, Refunding Series 2007, 5.000%, 5/15/31 | 5/22 at 100.00 | A– | | | 564,346 | |
| | 900 | | Glendale Industrial Development Authority, Arizona, Revenue Bonds, Midwestern University, Refunding Series 2010, 5.125%, 5/15/40 | 5/20 at 100.00 | A– | | | 941,031 | |
| | 430 | | Northern Arizona University, System Revenue Bonds, Series 2012, 5.000%, 6/01/41 | 6/21 at 100.00 | A+ | | | 460,728 | |
| | 200 | | Phoenix IDA, Arizona, Education Revenue Bonds, Painted Rock Academy Project, Series 2012A, 7.500%, 7/01/42 | 7/20 at 100.00 | N/R | | | 200,828 | |
| | 155 | | Phoenix Industrial Development Authority, Arizona, Education Revenue Bonds, Great Hearts Academies – Veritas Project, Series 2012, 6.300%, 7/01/42 | 7/21 at 100.00 | N/R | | | 156,573 | |
| | 560 | | Pima County Industrial Development Authority, Arizona, Charter School Revenue Bonds, Noah Webster Basic Schools Inc., Series 2004, 6.000%, 12/15/24 | 12/14 at 100.00 | BBB– | | | 561,366 | |
| | 200 | | Pima County Industrial Development Authority, Arizona, Education Revenue Bonds, Carden Traditional Schools Project, Series 2012, 7.500%, 1/01/42 | 1/22 at 100.00 | BBB– | | | 199,142 | |
| | 235 | | Pima County Industrial Development Authority, Arizona, Education Revenue Bonds, Paradise Education Center Project, Series 2010, 6.000%, 6/01/40 | 6/19 at 100.00 | BBB– | | | 214,233 | |
| | 315 | | Pima County Industrial Development Authority, Arizona, Educational Revenue Bonds, Paradise Education Center Charter School, Series 2006, 6.000%, 6/01/36 | 6/16 at 100.00 | BBB– | | | 288,704 | |
| | 415 | | Pima County Industrial Development Authority, Arizona, Educational Revenue Bonds, Valley Academy Charter School Project, Series 2008, 6.500%, 7/01/38 | 7/18 at 100.00 | Baa3 | | | 412,365 | |
| | 565 | | Tucson Industrial Development Authority, Arizona, Charter School Revenue Bonds, Arizona Agribusiness and Equine Center Charter School, Series 2004A, 6.125%, 9/01/34 | 9/14 at 100.00 | BB+ | | | 514,127 | |
| | 2,000 | | University of Arizona, Certificates of Participation, Series 2002B, 5.125%, 6/01/20 – AMBAC Insured | 6/12 at 100.00 | AA– | | | 2,020,840 | |
| | 8,435 | | Total Education and Civic Organizations | | | | | 8,420,859 | |
| | | | Health Care – 28.1% (19.6% of Total Investments) | | | | | | |
| | 1,015 | | Arizona Health Facilities Authority, Hospital Revenue Bonds, Banner Health Systems, Series 2007A, 5.000%, 1/01/25 | 1/17 at 100.00 | AA– | | | 1,135,734 | |
| | 620 | | Arizona Health Facilities Authority, Hospital Revenue Bonds, Banner Health Systems, Series 2007B, 1.059%, 1/02/37 | 1/17 at 100.00 | AA– | | | 437,410 | |
| | 2,390 | | Arizona Health Facilities Authority, Hospital Revenue Bonds, Banner Health Systems, Series 2008D, 5.500%, 1/01/38 | 1/18 at 100.00 | AA– | | | 2,571,685 | |
| | 625 | | Arizona Health Facilities Authority, Revenue Bonds, Blood Systems Inc., Series 2004, 5.000%, 4/01/20 | 4/14 at 100.00 | A | | | 659,606 | |
| | 475 | | Glendale Industrial Development Authority, Arizona, Revenue Bonds, John C. Lincoln Health Network, Series 2005B, 5.000%, 12/01/37 | 12/15 at 100.00 | BBB | | | 468,531 | |
| | 785 | | Glendale Industrial Development Authority, Arizona, Revenue Bonds, John C. Lincoln Health Network, Series 2007, 5.000%, 12/01/42 | 12/17 at 100.00 | BBB | | | 774,614 | |
| | 1,825 | | Maricopa County Industrial Development Authority, Arizona, Health Facility Revenue Bonds, Catholic Healthcare West, Series 2004A, 5.375%, 7/01/23 | 7/14 at 100.00 | A | | | 1,939,774 | |
| | 1,985 | | Maricopa County Industrial Development Authority, Arizona, Health Facility Revenue Bonds, Catholic Healthcare West, Series 2007A, 5.250%, 7/01/32 | 7/17 at 100.00 | A | | | 2,086,056 | |
| | | Nuveen Arizona Dividend Advantage Municipal Fund 3 (continued) |
| NXE | | Portfolio of Investments |
| | | February 29, 2012 |
| | Principal | | | Optional Call | | | | | |
| | Amount (000) | | Description (1) | Provisions (2) | Ratings (3) | | | Value | |
| | | | Health Care (continued) | | | | | | |
| | | | Show Low Industrial Development Authority, Arizona, Hospital Revenue Bonds, Navapache Regional Medical Center, Series 2005: | | | | | | |
| $ | 375 | | 5.000%, 12/01/25 – RAAI Insured | 12/15 at 100.00 | BBB+ | | $ | 379,695 | |
| | 315 | | 5.000%, 12/01/30 – RAAI Insured | 12/15 at 100.00 | BBB+ | | | 315,885 | |
| | 1,000 | | University Medical Center Corporation, Tucson, Arizona, Hospital Revenue Bonds, Series 2011, 6.000%, 7/01/39 | 7/21 at 100.00 | BBB+ | | | 1,109,650 | |
| | 1,000 | | Yavapai County Industrial Development Authority, Arizona, Hospital Revenue Bonds, Yavapai Regional Medical Center, Series 2003A, 6.000%, 8/01/33 | 8/13 at 100.00 | Baa2 | | | 1,016,880 | |
| | 12,410 | | Total Health Care | | | | | 12,895,520 | |
| | | | Tax Obligation/General – 10.7% (7.5% of Total Investments) | | | | | | |
| | 365 | | Pima County Continental Elementary School District 39, Arizona, General Obligation Bonds, Series 2011A, 2.000%, 7/01/30 – AGM Insured | 7/21 at 100.00 | AA– | | | 443,055 | |
| | 500 | | Pima County Unified School District 08 Flowing Wells, Arizona, General Obligation Bonds, Series 2011B, 5.375%, 7/01/29 | 7/21 at 100.00 | A+ | | | 562,865 | |
| | 750 | | Pima County Unified School District 6, Marana, Arizona, General Obligation Bonds, School Improvement Project 2010 Series 2011A, 5.000%, 7/01/25 | 7/21 at 100.00 | A+ | | | 838,613 | |
| | 1,000 | | Pinal County Unified School District 1, Florence, Arizona, General Obligation Bonds, Series 2008C, 5.250%, 7/01/28 | 7/18 at 100.00 | A | | | 1,109,160 | |
| | 1,705 | | Scottsdale, Arizona, General Obligation Bonds, Preserve Acquisition Series 1999, 5.000%, 7/01/34 | 7/21 at 100.00 | AAA | | | 1,974,100 | |
| | 4,320 | | Total Tax Obligation/General | | | | | 4,927,793 | |
| | | | Tax Obligation/Limited – 42.8% (29.9% of Total Investments) | | | | | | |
| | 1,000 | | Arizona State Transportation Board, Highway Revenue Bonds, Subordinate Refunding Series 2011A, 5.000%, 7/01/36 | 7/21 at 100.00 | AA+ | | | 1,119,840 | |
| | 138 | | Centerra Community Facilities District, Goodyear, Arizona, General Obligation Bonds, Series 2005, 5.500%, 7/15/29 | 7/15 at 100.00 | N/R | | | 123,612 | |
| | 2,000 | | DC Ranch Community Facilities District, Scottsdale, Arizona, General Obligation Bonds, Series 2002, 5.000%, 7/15/27 – AMBAC Insured | 7/13 at 100.00 | A1 | | | 2,036,940 | |
| | | | Estrella Mountain Ranch Community Facilities District, Arizona, Special Assessment Bonds, Montecito Assessment District, Series 2007: | | | | | | |
| | 246 | | 5.700%, 7/01/27 | 1/17 at 100.00 | N/R | | | 231,825 | |
| | 153 | | 5.800%, 7/01/32 | 1/17 at 100.00 | N/R | | | 139,230 | |
| | 232 | | Estrella Mountain Ranch Community Facilities District, Goodyear, Arizona, Special Assessment Lien Bonds, Series 2001A, 7.875%, 7/01/25 | 7/12 at 100.00 | N/R | | | 233,515 | |
| | 510 | | Government of Guam, Business Privilege Tax Bonds, Series 2011A, 5.000%, 1/01/31 | 1/22 at 100.00 | A | | | 565,345 | |
| | 525 | | Greater Arizona Development Authority, Infrastructure Revenue Bonds, Series 2006A, 5.000%, 8/01/23 – NPFG Insured | 8/16 at 100.00 | AA– | | | 561,656 | |
| | 923 | | Marana, Arizona, Tangerine Farms Road Improvement District Revenue Bonds, Series 2006, 4.600%, 1/01/26 | 7/16 at 100.00 | A2 | | | 957,363 | |
| | 290 | | Marley Park Community Facilities District, City of Surprise, Arizona, Limited Tax General Obligation Bonds, Series 2008 (Bank Qualified), 6.100%, 7/15/32 | 7/17 at 100.00 | N/R | | | 273,545 | |
| | 490 | | Merrill Ranch Community Facilities District 1, Florence, Arizona, General Obligation Bonds, Series 2008A, 7.400%, 7/15/33 | 7/18 at 100.00 | N/R | | | 524,153 | |
| | 2,175 | | Mohave County, Arizona, Certificates of Participation, Series 2004, 5.250%, 7/01/19 – AMBAC Insured | 7/14 at 100.00 | N/R | | | 2,275,355 | |
| | 300 | | Page, Arizona, Pledged Revenue Bonds, Refunding Series 2011, 5.000%, 7/01/26 | 7/21 at 100.00 | AA– | | | 342,891 | |
| | 640 | | Palm Valley Community Facility District 3, Goodyear, Arizona, General Obligation Bonds, Series 2006, 5.300%, 7/15/31 | 7/16 at 100.00 | N/R | | | 552,845 | |
| | 425 | | Palm Valley Community Facility District 3, Goodyear, Arizona, Limited Tax General Obligation Bonds, Series 2007, 5.800%, 7/15/32 | 7/17 at 100.00 | N/R | | | 386,725 | |
| | Principal | | | Optional Call | | | | | |
| | Amount (000) | | Description (1) | Provisions (2) | Ratings (3) | | | Value | |
| | | | Tax Obligation/Limited (continued) | | | | | | |
| $ | 160 | | Parkway Community Facilities District 1, Prescott Valley, Arizona, General Obligation Bonds, Series 2006, 5.350%, 7/15/31 | 7/16 at 100.00 | N/R | | $ | 139,082 | |
| | 170 | | Phoenix Mesa Gateway Airport Authority, Arizona, Special Facility Revenue Bonds, Mesa Project, Series 2012, 5.000%, 7/01/38 (Alternative Minimum Tax) | 7/22 at 100.00 | AA+ | | | 172,251 | |
| | 1,250 | | Pinal County Industrial Development Authority, Arizona, Correctional Facilities Contract Revenue Bonds, Florence West Prison LLC, Series 2002A, 5.000%, 10/01/18 – ACA Insured | No Opt. Call | BBB– | | | 1,257,525 | |
| | 250 | | Puerto Rico Sales Tax Financing Corporation, Sales Tax Revenue Bonds, First Subordinate Series 2010A, 5.375%, 8/01/39 | 2/20 at 100.00 | A+ | | | 270,578 | |
| | 1,650 | | Puerto Rico Sales Tax Financing Corporation, Sales Tax Revenue Bonds, First Subordinate Series 2010C, 0.000%, 8/01/38 | No Opt. Call | A+ | | | 379,038 | |
| | 1,130 | | San Luis Civic Improvement Corporation, Arizona, Municipal Facilities Excise Tax Revenue Bonds, Series 2005, 5.000%, 7/01/25 – SYNCORA GTY Insured | 7/15 at 100.00 | A+ | | | 1,195,529 | |
| | 2,000 | | Scottsdale Municipal Property Corporation, Arizona, Excise Tax Revenue Bonds, Water & Sewer Improvements Project, Series 2010, 5.000%, 7/01/36 | No Opt. Call | AAA | | | 2,234,420 | |
| | 665 | | Tartesso West Community Facility District, Buckeye, Arizona, Limited Tax General Obligation Bonds, Series 2007, 5.900%, 7/15/32 | 7/17 at 100.00 | N/R | | | 612,492 | |
| | 750 | | Virgin Islands Public Finance Authority, Matching Fund Loan Notes Revenue Bonds, Senior Lien Series 2010A, 5.000%, 10/01/29 | 10/20 at 100.00 | BBB | | | 790,928 | |
| | 1,250 | | Vistancia Community Facilities District, Arizona, Restricted General Obligation Bonds, Series 2005, 5.750%, 7/15/24 | 7/15 at 100.00 | A1 | | | 1,342,725 | |
| | 637 | | Watson Road Community Facilities District, Arizona, Special Assessment Revenue Bonds, Series 2005, 6.000%, 7/01/30 | 7/16 at 100.00 | N/R | | | 575,950 | |
| | 425 | | Westpark Community Facilities District, Buckeye, Arizona, General Obligation Tax Increment Bonds Series 2006, 5.250%, 7/15/31 | 7/16 at 100.00 | N/R | | | 364,807 | |
| | 20,384 | | Total Tax Obligation/Limited | | | | | 19,660,165 | |
| | | | Transportation – 5.7% (4.0% of Total Investments) | | | | | | |
| | | | Phoenix Civic Improvement Corporation, Arizona, Senior Lien Airport Revenue Bonds, Series 2002B: | | | | | | |
| | 300 | | 5.750%, 7/01/16 – FGIC Insured (Alternative Minimum Tax) | 7/12 at 100.00 | AA– | | | 304,275 | |
| | 2,300 | | 5.250%, 7/01/21 – FGIC Insured (Alternative Minimum Tax) | 7/12 at 100.00 | AA– | | | 2,317,365 | |
| | 2,600 | | Total Transportation | | | | | 2,621,640 | |
| | | | U.S. Guaranteed – 10.1% (7.0% of Total Investments) (5) | | | | | | |
| | 1,130 | | Energy Management Services LLC, Arizona State University, Energy Conservation Revenue Bonds, Main Campus Project, Series 2002, 5.250%, 7/01/18 (Pre-refunded 7/01/12) – NPFG Insured | 7/12 at 100.00 | AA– (5) | | | 1,149,300 | |
| | 1,575 | | Maricopa County Union High School District 210, Phoenix, Arizona, General Obligation Bonds, Series 2004A, 5.000%, 7/01/20 (Pre-refunded 7/01/14) – AGM Insured | 7/14 at 100.00 | AA (5) | | | 1,743,289 | |
| | 270 | | Maricopa County, Arizona, Hospital Revenue Bonds, Sun Health Corporation, Series 2005, 5.000%, 4/01/16 (Pre-refunded 4/01/15) | 4/15 at 100.00 | N/R (5) | | | 306,437 | |
| | 1,400 | | Phoenix Civic Improvement Corporation, Arizona, Junior Lien Water System Revenue Bonds, Series 2002, 5.000%, 7/01/18 (Pre-refunded 7/01/12) – FGIC Insured | 7/12 at 100.00 | AAA | | | 1,422,876 | |
| | 4,375 | | Total U.S. Guaranteed | | | | | 4,621,902 | |
| | | | Utilities – 16.9% (11.8% of Total Investments) | | | | | | |
| | 1,200 | | Maricopa County Pollution Control Corporation, Arizona, Pollution Control Revenue Refunding Bonds, Southern California Edison Company, Series 2000A, 5.000%, 6/01/35 | 6/20 at 100.00 | A1 | | | 1,305,144 | |
| | 1,250 | | Maricopa County Pollution Control Corporation, Arizona, Revenue Bonds, Arizona Public Service Company – Palo Verde Project, Series 2002A, 5.050%, 5/01/29 – AMBAC Insured | 11/12 at 100.00 | BBB | | | 1,259,088 | |
| | 665 | | Pima County Industrial Development Authority, Arizona, Revenue Bonds, Tucson Electric Power Company, Refunding Series 2008, 5.750%, 9/01/29 | 1/15 at 100.00 | BBB– | | | 695,444 | |
| | 500 | | Pinal County Electrical District 3, Arizona, Electric System Revenue Bonds, Refunding Series 2011, 5.250%, 7/01/36 | 7/21 at 100.00 | A | | | 539,985 | |
| | | Nuveen Arizona Dividend Advantage Municipal Fund 3 (continued) |
| NXE | | Portfolio of Investments |
| | | February 29, 2012 |
| | Principal | | | Optional Call | | | | | |
| | Amount (000) | | Description (1) | Provisions (2) | Ratings (3) | | | Value | |
| | | | Utilities (continued) | | | | | | |
| $ | 1,660 | | Puerto Rico Electric Power Authority, Power Revenue Bonds, Series 2005RR, 5.000%, 7/01/26 – SYNCORA GTY Insured | 7/15 at 100.00 | A3 | | $ | 1,749,806 | |
| | 775 | | Salt River Project Agricultural Improvement and Power District, Arizona, Electric System Revenue Bonds, Tender Option Bond Trust 09-9W, 17.970%, 1/01/38 (IF) (6) | 1/18 at 100.00 | Aa1 | | | 1,055,240 | |
| | 1,165 | | Salt Verde Financial Corporation, Arizona, Senior Gas Revenue Bonds, Citigroup Energy Inc Prepay Contract Obligations, Series 2007, 5.000%, 12/01/37 | No Opt. Call | A– | | | 1,166,654 | |
| | 7,215 | | Total Utilities | | | | | 7,771,361 | |
| | | | Water and Sewer – 9.5% (6.7% of Total Investments) | | | | | | |
| | 500 | | Glendale, Arizona, Water and Sewer Revenue Bonds, Refunding Series 2012, 5.000%, 7/01/28 | 7/22 at 100.00 | AA | | | 585,155 | |
| | 955 | | Goodyear, Arizona, Water and Sewer Revenue Obligations, Series 2010, 5.625%, 7/01/39 | 7/20 at 100.00 | A+ | | | 1,032,747 | |
| | 405 | | Oro Valley Municipal Property Corporation, Arizona, Senior Lien Water Revenue Bonds, Series 2003, 5.000%, 7/01/23 – NPFG Insured | 7/13 at 100.00 | AA– | | | 419,953 | |
| | 750 | | Puerto Rico Aqueduct and Sewerage Authority, Revenue Bonds, Senior Lien Series 2008A, 6.000%, 7/01/38 | 7/18 at 100.00 | Baa2 | | | 809,033 | |
| | | | Surprise Municipal Property Corporation, Arizona, Wastewater System Revenue Bonds, Series 2007: | | | | | | |
| | 425 | | 4.700%, 4/01/22 | 4/14 at 100.00 | N/R | | | 433,738 | |
| | 490 | | 4.900%, 4/01/32 | 4/17 at 100.00 | N/R | | | 496,203 | |
| | 615 | | Yuma County Industrial Development Authority, Arizona, Exempt Revenue Bonds, Far West Water & Sewer Inc. Refunding, Series 2007A, 6.375%, 12/01/37 (Alternative Minimum Tax) | 12/17 at 100.00 | N/R | | | 586,501 | |
| | 4,140 | | Total Water and Sewer | | | | | 4,363,330 | |
| $ | 64,349 | | Total Investments (cost $62,398,752) – 143.2% | | | | | 65,747,546 | |
| | | | MuniFund Term Preferred Shares, at Liquidation Value – (45.4)% (7) | | | | | (20,846,000 | ) |
| | | | Other Assets Less Liabilities – 2.2% | | | | | 1,002,480 | |
| | | | Net Assets Applicable to Common Shares – 100% | | | | $ | 45,904,026 | |
| (1) | | All percentages shown in the Portfolio of Investments are based on net assets applicable to Common shares unless otherwise noted. |
| (2) | | Optional Call Provisions (not covered by the report of independent registered public accounting firm): Dates (month and year) and prices of the earliest optional call or redemption. There may be other call provisions at varying prices at later dates. Certain mortgage-backed securities may be subject to periodic principal paydowns. |
| (3) | | Ratings (not covered by the report of independent registered public accounting firm): Using the highest of Standard & Poor’s Group (“Standard & Poor’s”), Moody’s Investors Service, Inc. (“Moody’s”) or Fitch, Inc. (“Fitch”) rating. Ratings below BBB by Standard & Poor’s, Baa by Moody’s or BBB by Fitch are considered to be below investment grade. Holdings designated N/R are not rated by any of these national rating agencies. |
| (4) | | Investment valued at fair value using methods determined in good faith by, or at the discretion of, the Board of Trustees. For fair value measurement disclosure purposes, investment categorized as Level 3. See Notes to Financial Statements, Footnote 1 – General Information and Significant Accounting Policies, Investment Valuation for more information. |
| (5) | | Backed by an escrow or trust containing sufficient U.S. Government or U.S. Government agency securities, which ensure the timely payment of principal and interest. Certain bonds backed by U.S. Government or agency securities are regarded as having an implied rating equal to the rating of such securities. |
| (6) | | Investment, or portion of investment, has been pledged to collateralize the net payment obligations for investments in inverse floating rate transactions. |
| (7) | | MuniFund Term Preferred Shares, at Liquidation Value as a percentage of Total Investments is 31.7%. |
| N/R | | Not rated. |
| (IF) | | Inverse floating rate investment. |
See accompanying notes to financial statements.
| | | Nuveen Texas Quality Income Municipal Fund |
| NTX | | Portfolio of Investments |
| | | February 29, 2012 |
| | Principal | | | Optional Call | | | | | |
| | Amount (000) | | Description (1) | Provisions (2) | Ratings (3) | | | Value | |
| | | | Consumer Staples – 1.5% (1.0% of Total Investments) | | | | | | |
| $ | 2,225 | | Puerto Rico, The Children’s Trust Fund, Tobacco Settlement Asset-Backed Refunding Bonds, Series 2002, 5.375%, 5/15/33 | 5/12 at 100.00 | BBB | | $ | 2,201,215 | |
| | | | Education and Civic Organizations – 11.5% (7.8% of Total Investments) | | | | | | |
| | 2,000 | | Board of Regents, University of Texas System, Financing System Revenue Bonds, Refunding Series 2012B, 5.000%, 8/15/22 (WI/DD, Settling 3/21/12) | No Opt. Call | AAA | | | 2,566,640 | |
| | 1,000 | | Hale Center Education Facilities Corporation, Texas, Revenue Bonds, Wayland Baptist University Project, Improvement and Refunding Series 2010, 5.000%, 3/01/35 | 3/21 at 100.00 | A– | | | 1,061,400 | |
| | 2,000 | | Laredo Community College District, Webb County, Texas, Combined Fee Revenue Bonds, Series 2010, 5.250%, 8/01/35 – AGM Insured | 8/20 at 100.00 | AA– | | | 2,209,560 | |
| | | | Red River Education Finance Corporation, Texas, Revenue Bonds, Hockaday School, Series 2005: | | | | | | |
| | 1,170 | | 5.000%, 5/15/27 | 5/15 at 100.00 | AA | | | 1,249,256 | |
| | 1,230 | | 5.000%, 5/15/28 | 5/15 at 100.00 | AA | | | 1,309,962 | |
| | 1,290 | | 5.000%, 5/15/29 | 5/15 at 100.00 | AA | | | 1,370,599 | |
| | | | Texas Public Finance Authority, Revenue Bonds, Texas Southern University Financing System, Series 2003: | | | | | | |
| | 1,710 | | 5.000%, 5/01/18 – FGIC Insured | 5/13 at 100.00 | Baa1 | | | 1,723,629 | |
| | 1,795 | | 5.000%, 5/01/19 – FGIC Insured | 5/13 at 100.00 | Baa1 | | | 1,806,255 | |
| | 1,885 | | 5.000%, 5/01/20 – FGIC Insured | 5/13 at 100.00 | Baa1 | | | 1,894,029 | |
| | 1,665 | | Texas State University System, Financing Revenue Bonds, Series 2004, 5.000%, 3/15/24 – AGM Insured | 9/14 at 100.00 | Aa2 | | | 1,825,939 | |
| | 15,745 | | Total Education and Civic Organizations | | | | | 17,017,269 | |
| | | | Energy – 2.0% (1.4% of Total Investments) | | | | | | |
| | 3,000 | | Gulf Coast Waste Disposal Authority, Texas, Waste Disposal Revenue Bonds, Valero Energy Corporation Project, Series 1998, 5.600%, 4/01/32 (Alternative Minimum Tax) | 4/12 at 100.00 | BBB | | | 3,000,810 | |
| | | | Health Care – 14.4% (9.8% of Total Investments) | | | | | | |
| | | | Brazoria County Health Facilities Development Corporation, Texas, Revenue Bonds, Brazosport Memorial Hospital, Series 2004: | | | | | | |
| | 1,745 | | 5.250%, 7/01/20 – RAAI Insured | 7/14 at 100.00 | BBB– | | | 1,775,572 | |
| | 1,835 | | 5.250%, 7/01/21 – RAAI Insured | 7/14 at 100.00 | BBB– | | | 1,859,828 | |
| | 1,350 | | Harrison County Health Facilities Development Corporation, Texas, Hospital Revenue Bonds, Good Shepherd Health System, Refunding Series 2010, 5.250%, 7/01/28 | 7/20 at 100.00 | BBB+ | | | 1,373,153 | |
| | 2,000 | | North Central Texas Health Facilities Development Corporation, Texas, Revenue Bonds, Children’s Medical Center Dallas Project, Series 2009, 5.750%, 8/15/39 | 8/19 at 100.00 | Aa3 | | | 2,228,600 | |
| | | | Richardson Hospital Authority, Texas, Revenue Bonds, Richardson Regional Medical Center, Series 2004: | | | | | | |
| | 2,000 | | 5.875%, 12/01/24 | 12/13 at 100.00 | A | | | 2,073,920 | |
| | 1,000 | | 6.000%, 12/01/34 | 12/13 at 100.00 | A | | | 1,031,360 | |
| | 2,500 | | Tarrant County Cultural & Educational Facilities Financing Corporation, Texas, Revenue Bonds, Texas Health Resources, Series 2007B, 5.000%, 11/15/42 | 11/17 at 100.00 | AA– | | | 2,642,725 | |
| | 1,250 | | Tarrant County Cultural Education Facilities Finance Corporation, Texas, Hospital Revenue Bonds, Scott & White HealthCare Project, Series 2010, 5.250%, 8/15/40 | 8/20 at 100.00 | A1 | | | 1,321,200 | |
| | 2,000 | | Tarrant County Cultural Education Facilities Finance Corporation, Texas, Revenue Refunding Bonds, Christus Health, Series 2008, 6.500%, 7/01/37 – AGC Insured | 1/19 at 100.00 | AA– | | | 2,304,840 | |
| | 1,720 | | Tyler Health Facilities Development Corporation, Texas, Hospital Revenue Bonds, East Texas | 11/17 at 100.00 | Baa2 | | | 1,733,657 | |
| | | | Medical Center Regional Healthcare System, Series 2007A, 5.375%, 11/01/37 | | | | | | |
| | 700 | | Tyler Health Facilities Development Corporation, Texas, Hospital Revenue Bonds, Mother Frances Hospital Regional Healthcare Center, Series 2007B, 5.000%, 7/01/37 | 7/17 at 100.00 | Baa1 | | | 704,676 | |
| | 2,250 | | Tyler Health Facilities Development Corporation, Texas, Hospital Revenue Bonds, Mother Frances Hospital Regional Healthcare Center, Series 2007, 5.000%, 7/01/33 | 7/17 at 100.00 | Baa1 | | | 2,282,985 | |
| | 20,350 | | Total Health Care | | | | | 21,332,516 | |
| | | Nuveen Texas Quality Income Municipal Fund (continued) |
| NTX | | Portfolio of Investments |
| | | February 29, 2012 |
| | Principal | | | Optional Call | | | | | |
| | Amount (000) | | Description (1) | Provisions (2) | Ratings (3) | | | Value | |
| | | | Housing/Multifamily – 1.7% (1.2% of Total Investments) | | | | | | |
| | | | Bexar County Housing Finance Corporation, Texas, Insured Multifamily Housing Revenue Bonds, Waters at Northern Hills Apartments Project, Series 2001A: | | | | | | |
| $ | 2,000 | | 6.000%, 8/01/31 – NPFG Insured | 8/12 at 101.00 | Baa2 | | $ | 1,851,060 | |
| | 750 | | 6.050%, 8/01/36 – NPFG Insured | 8/12 at 101.00 | Baa2 | | | 684,218 | |
| | 2,750 | | Total Housing/Multifamily | | | | | 2,535,278 | |
| | | | Housing/Single Family – 2.4% (1.6% of Total Investments) | | | | | | |
| | 1,217 | | El Paso Housing Finance Corporation, Texas, GNMA Collateralized Single Family Mortgage Revenue Bonds, Series 2001A-3, 6.180%, 4/01/33 | 4/12 at 105.75 | AA+ | | | 1,269,433 | |
| | 2,325 | | Texas Department of Housing and Community Affairs, Single Family Mortgage Bonds, Series 2002B, 5.550%, 9/01/33 – NPFG Insured (Alternative Minimum Tax) | 5/12 at 100.00 | AA+ | | | 2,326,837 | |
| | 3,542 | | Total Housing/Single Family | | | | | 3,596,270 | |
| | | | Long-Term Care – 1.1% (0.7% of Total Investments) | | | | | | |
| | | | Bexar County, Texas, Health Facilities Development Corporation Revenue Bonds, Army Retirement Residence, Series 2007: | | | | | | |
| | 1,000 | | 5.000%, 7/01/27 | 7/17 at 100.00 | BBB | | | 1,026,540 | |
| | 600 | | 5.000%, 7/01/37 | 7/17 at 100.00 | BBB | | | 596,970 | |
| | 1,600 | | Total Long-Term Care | | | | | 1,623,510 | |
| | | | Materials – 2.0% (1.4% of Total Investments) | | | | | | |
| | 3,000 | | Cass County Industrial Development Corporation, Texas, Environmental Improvement Revenue Bonds, International Paper Company, Series 2000A, 6.600%, 3/15/24 (Alternative Minimum Tax) | 3/12 at 100.00 | BBB | | | 3,008,250 | |
| | | | Tax Obligation/General – 37.6% (25.5% of Total Investments) | | | | | | |
| | 650 | | Bexar County, Texas, General Obligation Bonds, Series 2004, 5.000%, 6/15/19 | 6/14 at 100.00 | Aaa | | | 710,190 | |
| | 2,000 | | Borger Independent School District, Hutchison County, Texas, General Obligation Bonds, Series 2006, 5.000%, 2/15/36 | 2/16 at 100.00 | AAA | | | 2,210,100 | |
| | 400 | | Calallen Independent School District, Nueces County, Texas, General Obligation Bonds, School Building Series 2008, 5.000%, 2/15/38 | 2/18 at 100.00 | AAA | | | 433,704 | |
| | 1,190 | | Canutillo Independent School District, El Paso County, Texas, General Obligation Bonds, Series 2006A, 5.000%, 8/15/22 | 8/15 at 100.00 | AAA | | | 1,350,436 | |
| | 325 | | Copperas Cove, Texas, Certificates of Obligation, Series 2003, 5.000%, | 8/12 at 100.00 | AA– | | | 330,704 | |
| | | | 8/15/23 – NPFG Insured | | | | | | |
| | 2,305 | | Corpus Christi, Texas, Combination Tax and Municipal Hotel Occupancy Tax Revenue Certificates of Obligation, Series 2002, 5.500%, 9/01/21 – AGM Insured | 9/12 at 100.00 | Aa2 | | | 2,362,717 | |
| | 1,750 | | El Paso County, Texas, Certificates of Obligation, Series 2001, 5.000%, | No Opt. Call | AA | | | 2,159,833 | |
| | | | 2/15/21 – AGM Insured | | | | | | |
| | | | Fort Bend County Municipal Utility District 25, Texas, General Obligation Bonds, Series 2005: | | | | | | |
| | 1,330 | | 5.000%, 10/01/26 – FGIC Insured | 10/12 at 100.00 | A– | | | 1,342,090 | |
| | 1,320 | | 5.000%, 10/01/27 – FGIC Insured | 10/12 at 100.00 | A– | | | 1,331,339 | |
| | 3,615 | | Frisco, Texas, General Obligation Bonds, Series 2006, 5.000%, 2/15/26 – FGIC Insured | 2/16 at 100.00 | Aa1 | | | 4,033,147 | |
| | 8,500 | | Grand Prairie Independent School District, Dallas County, Texas, General Obligation Bonds, Capital Appreciation Refunding Series 2009, 0.000%, 8/15/39 | 8/18 at 22.64 | AA | | | 1,489,795 | |
| | 5,000 | | Houston, Texas, General Obligation Bonds, Series 2005E, 5.000%, 3/01/23 – AMBAC Insured | 3/15 at 100.00 | AA | | | 5,592,600 | |
| | 100 | | Judson Independent School District, Bexar County, Texas, General Obligation Refunding Bonds, Series 2002, 5.250%, 2/01/21 | 5/12 at 100.00 | Aaa | | | 100,397 | |
| | 4,900 | | Leander Independent School District, Williamson and Travis Counties, Texas, General Obligation Bonds, Series 2006, 0.000%, 8/15/45 | 8/14 at 17.78 | AAA | | | 797,965 | |
| | 1,000 | | Leander Independent School District, Williamson and Travis Counties, Texas, General Obligation Bonds, Series 2008, 0.000%, 8/15/36 | 8/17 at 33.01 | AAA | | | 262,400 | |
| | 365 | | Lone Star College System, Harris and Montgomery Counties, Texas, General Obligation Bonds, Series 2009, 5.000%, 8/15/34 | 8/19 at 100.00 | AAA | | | 419,918 | |
| | Principal | | | Optional Call | | | | | |
| | Amount (000) | | Description (1) | Provisions (2) | Ratings (3) | | | Value | |
| | | | Tax Obligation/General (continued) | | | | | | |
| $ | 1,750 | | Martin County Hospital District, Texas, Combination Limited Tax and Revenue Bonds, Series 2011A, 7.250%, 4/01/36 | 4/21 at 100.00 | N/R | | $ | 1,919,400 | |
| | 1,010 | | Mercedes Independent School District, Hidalgo County, Texas, General Obligation Bonds, Series 2005, 5.000%, 8/15/23 | 8/15 at 100.00 | AAA | | | 1,146,168 | |
| | 5,515 | | Midlothian Independent School District, Ellis County, Texas, General Obligation Bonds, Series 2005, 5.000%, 2/15/34 | 2/15 at 100.00 | Aaa | | | 5,809,997 | |
| | 1,500 | | Montgomery County, Texas, General Obligation Bonds, Refunding Series 2008B, 5.250%, 3/01/32 | 3/19 at 100.00 | Aa1 | | | 1,731,795 | |
| | 2,000 | | Plano Independent School District, Collin County, Texas, General Obligation Bonds, Series 2008A, 5.250%, 2/15/34 | 2/18 at 100.00 | Aaa | | | 2,234,100 | |
| | 1,425 | | Port of Houston Authority, Harris County, Texas, General Obligation Bonds, Series 2010E, 0.000%, 10/01/35 | No Opt. Call | AAA | | | 548,967 | |
| | | | Roma Independent School District, Texas, General Obligation Bonds, Series 2005: | | | | | | |
| | 1,110 | | 5.000%, 8/15/22 | 8/15 at 100.00 | AAA | | | 1,255,599 | |
| | 1,165 | | 5.000%, 8/15/23 – AGM Insured | 8/15 at 100.00 | AAA | | | 1,319,945 | |
| | 1,250 | | Southside Independent School District, Bexar County, Texas, General Obligation Bonds, Series 2004A, 5.000%, 8/15/22 | 8/14 at 100.00 | Aaa | | | 1,372,150 | |
| | 1,140 | | Sunnyvale School District, Texas, General Obligation Bonds, Series 2004, 5.250%, 2/15/25 | 2/14 at 100.00 | AAA | | | 1,232,340 | |
| | 5,000 | | Texas State, General Obligation Bonds, Transportation Commission Mobility Fund, Series 2006A, 5.000%, 4/01/33 (UB) | 4/17 at 100.00 | Aaa | | | 5,769,900 | |
| | 1,000 | | Texas State, General Obligation Bonds, Transportation Commission Mobility Fund, Series 2008, 5.000%, 4/01/30 (UB) | 4/18 at 100.00 | Aaa | | | 1,160,340 | |
| | 1,110 | | Texas State, General Obligation Bonds, Water Utility, Series 2001, 5.250%, 8/01/23 | 5/12 at 100.00 | Aaa | | | 1,114,462 | |
| | 3,025 | | Victoria Independent School District, Victoria County, Texas, General Obligation Bonds, Series 2007, 5.000%, 2/15/32 | 2/17 at 100.00 | AAA | | | 3,394,534 | |
| | | | West Texas Independent School District, McLennan and Hill Counties, General Obligation Refunding Bonds, Series 1998: | | | | | | |
| | 45 | | 0.000%, 8/15/22 | 8/13 at 61.20 | AAA | | | 27,078 | |
| | 45 | | 0.000%, 8/15/24 | 8/13 at 54.88 | AAA | | | 24,227 | |
| | | | White Settlement Independent School District, Tarrant County, Texas, General Obligation Bonds, Series 2006: | | | | | | |
| | 1,500 | | 0.000%, 8/15/43 | 8/15 at 23.12 | AAA | | | 299,490 | |
| | 1,500 | | 0.000%, 8/15/44 | 8/15 at 21.88 | AAA | | | 283,050 | |
| | 425 | | 0.000%, 8/15/45 | 8/15 at 20.76 | AAA | | | 76,011 | |
| | 66,265 | | Total Tax Obligation/General | | | | | 55,646,888 | |
| | | | Tax Obligation/Limited – 15.1% (10.2% of Total Investments) | | | | | | |
| | 1,000 | | Bexar County, Texas, Venue Project Revenue Bonds, Refunding Series 2010, 5.250%, 8/15/38 – AGM Insured | 8/19 at 100.00 | AA– | | | 1,087,660 | |
| | 7,940 | | Dallas Area Rapid Transit, Texas, Sales Tax Revenue Bonds, Senior Lien Refunding Series 2007, 5.000%, 12/01/36 – AMBAC Insured | 12/16 at 100.00 | AA+ | | | 8,502,073 | |
| | 1,390 | | Harris County Metropolitan Transit Authority, Texas, Sales and Use Tax Revenue Bonds, Series 2011A, 5.000%, 11/01/41 | 11/21 at 100.00 | AA | | | 1,555,521 | |
| | | | Harris County-Houston Sports Authority, Texas, Revenue Bonds, Junior Lien Series 2001H: | | | | | | |
| | 1,720 | | 0.000%, 11/15/34 – NPFG Insured | 11/31 at 83.17 | BBB | | | 391,885 | |
| | 930 | | 0.000%, 11/15/36 – NPFG Insured | 11/31 at 73.51 | BBB | | | 183,796 | |
| | 3,265 | | 0.000%, 11/15/38 – NPFG Insured | 11/31 at 64.91 | BBB | | | 558,642 | |
| | | | Harris County-Houston Sports Authority, Texas, Revenue Bonds, Senior Lien Series 2001G: | | | | | | |
| | 2,250 | | 5.250%, 11/15/22 – NPFG Insured | 5/12 at 100.00 | BBB | | | 2,249,798 | |
| | 3,275 | | 0.000%, 11/15/41 – NPFG Insured | 11/31 at 53.78 | BBB | | | 486,796 | |
| | 1,470 | | Houston, Texas, Hotel Occupancy Tax and Special Revenue Bonds, Convention and Entertainment Project, Series 2001B, 0.000%, 9/01/32 – AMBAC Insured | No Opt. Call | A2 | | | 503,387 | |
| | | Nuveen Texas Quality Income Municipal Fund (continued) |
| NTX | | Portfolio of Investments |
| | | February 29, 2012 |
| | Principal | | | Optional Call | | | | | |
| | Amount (000) | | Description (1) | Provisions (2) | Ratings (3) | | | Value | |
| | | | Tax Obligation/Limited (continued) | | | | | | |
| $ | 3,000 | | North Texas Tollway Authority, Special Projects System Revenue Bonds, Current Interest Series 2011D, 5.000%, 9/01/31 | 9/21 at 100.00 | AA | | $ | 3,411,900 | |
| | 2,000 | | North Texas Tollway Authority, Special Projects System Revenue Bonds, Series 2011A, 5.500%, 9/01/41 | 9/21 at 100.00 | AA | | | 2,306,220 | |
| | 1,000 | | Uptown Development Authority, Houston, Texas, Tax Increment Revenue Bonds, Infrastructure Improvement Facilities, Series 2009, 5.500%, 9/01/29 | 9/19 at 100.00 | BBB | | | 1,081,610 | |
| | 29,240 | | Total Tax Obligation/Limited | | | | | 22,319,288 | |
| | | | Transportation – 11.9% (8.1% of Total Investments) | | | | | | |
| | 1,000 | | Austin, Texas, Airport System Prior Lien Revenue Bonds, Series 2003, 5.250%, 11/15/16 – NPFG Insured | 11/13 at 100.00 | A | | | 1,066,340 | |
| | | | Central Texas Regional Mobility Authority, Senior Lien Revenue Bonds, Series 2010: | | | | | | |
| | 2,945 | | 0.000%, 1/01/36 | No Opt. Call | BBB– | | | 739,431 | |
| | 2,205 | | 0.000%, 1/01/37 | No Opt. Call | BBB– | | | 519,939 | |
| | 2,000 | | 0.000%, 1/01/38 | No Opt. Call | BBB– | | | 442,720 | |
| | 3,260 | | Central Texas Regional Mobility Authority, Travis and Williamson Counties, Toll Road Revenue Bonds, Series 2005, 5.000%, 1/01/22 – FGIC Insured | 1/15 at 100.00 | BBB | | | 3,303,651 | |
| | 1,000 | | Dallas-Ft. Worth International Airport, Texas, Joint Revenue Bonds, Refunding Series 2010A, 5.000%, 11/01/42 | 11/20 at 100.00 | A+ | | | 1,075,270 | |
| | 1,165 | | Dallas-Ft. Worth International Airport, Texas, Joint Revenue Bonds, Refunding Series 2012B, 5.000%, 11/01/35 (WI/DD, Settling 3/01/12) | 11/20 at 100.00 | A+ | | | 1,271,458 | |
| | 500 | | Houston, Texas, Subordinate Lien Airport System Revenue Bonds, Series 2000A, 5.625%, 7/01/30 – AGM Insured (Alternative Minimum Tax) | 7/12 at 100.00 | AA– | | | 500,605 | |
| | 3,000 | | Love Field Airport Modernization Corporation, Texas, Special Facilities Revenue Bonds, Southwest Airlines Company, Series 2010, 5.250%, 11/01/40 | 11/20 at 100.00 | BBB– | | | 3,114,030 | |
| | 395 | | North Texas Tollway Authority, First Tier System Revenue Refunding Bonds, Series 2008A, 5.750%, 1/01/40 | 1/18 at 100.00 | A2 | | | 429,476 | |
| | | | North Texas Tollway Authority, First Tier System Revenue Refunding Bonds, Series 2008B: | | | | | | |
| | 325 | | 5.750%, 1/01/40 | 1/18 at 100.00 | A2 | | | 353,366 | |
| | 225 | | 5.750%, 1/01/40 – NPFG Insured | 1/18 at 100.00 | A2 | | | 244,638 | |
| | 2,500 | | North Texas Tollway Authority, First Tier System Revenue Refunding Bonds, Series 2008D, 0.000%, 1/01/36 – AGC Insured | No Opt. Call | AA– | | | 746,475 | |
| | 950 | | North Texas Tollway Authority, Second Tier System Revenue Refunding Bonds, Series 2008F, 5.750%, 1/01/38 | 1/18 at 100.00 | A3 | | | 1,024,727 | |
| | | | North Texas Tollway Authority, System Revenue Bonds, First Tier Series 2009A: | | | | | | |
| | 100 | | 6.100%, 1/01/28 | 1/19 at 100.00 | A2 | | | 116,778 | |
| | 2,000 | | 6.250%, 1/01/39 | 1/19 at 100.00 | A2 | | | 2,259,780 | |
| | 1,250 | | Texas Turnpike Authority, Central Texas Turnpike System Revenue Bonds, First Tier Series 2002A, 0.000%, 8/15/29 – AMBAC Insured | 8/12 at 37.09 | BBB+ | | | 446,225 | |
| | 24,820 | | Total Transportation | | | | | 17,654,909 | |
| | | | U.S. Guaranteed – 15.6% (10.6% of Total Investments) (4) | | | | | | |
| | 610 | | Bexar County, Texas, General Obligation Bonds, Series 2004, 5.000%, 6/15/19 (Pre-refunded 6/15/14) | 6/14 at 100.00 | Aaa | | | 675,343 | |
| | 295 | | Coppell Independent School District, Dallas County, Texas, Unlimited Tax School Building and Refunding Bonds, Series 1992, 0.000%, 8/15/14 – NPFG Insured (ETM) | No Opt. Call | Aa3 (4) | | | 291,540 | |
| | 950 | | Copperas Cove, Texas, Certificates of Obligation, Series 2003, 5.000%, 8/15/23 (Pre-refunded 8/15/12) – NPFG Insured | 8/12 at 100.00 | A3 (4) | | | 971,299 | |
| | 1,095 | | Denton County, Texas, Permanent Improvement General Obligation Bonds, Series 2005, 5.000%, 7/15/25 (Pre-refunded 7/15/12) | 7/12 at 100.00 | AAA | | | 1,115,137 | |
| | | | Houston Community College System, Texas, Limited Tax General Obligation Bonds, Series 2003: | | | | | | |
| | 2,500 | | 5.000%, 2/15/20 (Pre-refunded 2/15/13) – AMBAC Insured | 2/13 at 100.00 | AA+ (4) | | | 2,612,050 | |
| | 2,235 | | 5.000%, 2/15/21 (Pre-refunded 2/15/13) – AMBAC Insured | 2/13 at 100.00 | AA+ (4) | | | 2,335,173 | |
| | Principal | | | Optional Call | | | | | |
| | Amount (000) | | Description (1) | Provisions (2) | Ratings (3) | | | Value | |
| | | | U.S. Guaranteed (4) (continued) | | | | | | |
| $ | 1,000 | | Mansfield Independent School District, Tarrant County, Texas, General Obligation Bonds, Series 2004, 5.000%, 2/15/20 (Pre-refunded 2/15/14) | 2/14 at 100.00 | AAA | | $ | 1,086,990 | |
| | 1,000 | | North Central Texas Health Facilities Development Corporation, Hospital Revenue Bonds, Presbyterian Healthcare System, Series 1996B, 5.750%, 6/01/26 – NPFG Insured (ETM) | No Opt. Call | Aaa | | | 1,279,800 | |
| | 2,500 | | Retama Development Corporation, Texas, Special Facilities Revenue Bonds, Retama Park Racetrack, Series 1993, 8.750%, 12/15/18 (Pre-refunded 12/15/17) | 12/17 at 100.00 | Aaa | | | 3,587,550 | |
| | 1,440 | | South Texas Community College District, Hidalgo and Starr Counties, Texas, General Obligation Bonds, Series 2002, 5.500%, 8/15/17 (Pre-refunded 8/15/12) – AMBAC Insured | 8/12 at 100.00 | Aa2 (4) | | | 1,475,597 | |
| | 1,500 | | Texas, General Obligation Refunding Bonds, Public Finance Authority, Series 2002, 5.000%, 10/01/18 (Pre-refunded 10/01/12) | 10/12 at 100.00 | Aaa | | | 1,542,855 | |
| | 1,000 | | Tyler Health Facilities Development Corporation, Texas, Hospital Revenue Bonds, Mother Frances Hospital Regional Healthcare Center, Series 2001, 6.000%, 7/01/31 (Pre-refunded 7/01/12) | 7/12 at 100.00 | Baa1 (4) | | | 1,019,860 | |
| | 4,000 | | University of North Texas, Financing System Revenue Bonds, Series 2001, 5.000%, 4/15/24 (Pre-refunded 4/15/12) – AGM Insured | 4/12 at 100.00 | Aa2 (4) | | | 4,024,960 | |
| | | | West Texas Independent School District, McLennan and Hill Counties, General Obligation Refunding Bonds, Series 1998: | | | | | | |
| | 955 | | 0.000%, 8/15/22 (Pre-refunded 8/15/13) | 8/13 at 61.21 | N/R (4) | | | 581,509 | |
| | 955 | | 0.000%, 8/15/24 (Pre-refunded 8/15/13) | 8/13 at 54.88 | N/R (4) | | | 521,411 | |
| | 22,035 | | Total U.S. Guaranteed | | | | | 23,121,074 | |
| | | | Utilities – 15.4% (10.4% of Total Investments) | | | | | | |
| | 2,560 | | Brazos River Authority, Texas, Pollution Control Revenue Refunding Bonds, TXU Electric Company, Series 1999C, 7.700%, 3/01/32 (Alternative Minimum Tax) | 4/13 at 101.00 | Ca | | | 384,819 | |
| | 5,000 | | Brownsville, Texas, Utility System Priority Revenue Bonds, Series 2005A, 5.000%, 9/01/27 – AMBAC Insured | 9/15 at 100.00 | A+ | | | 5,276,150 | |
| | 2,000 | | Bryan, Brazos County, Texas, Electric System Revenue Bonds, Series 2009, 5.000%, 7/01/34 | 7/17 at 100.00 | A+ | | | 2,135,300 | |
| | 3,000 | | Lower Colorado River Authority, Texas, Refunding Revenue Bonds, Series 2010A, 5.000%, 5/15/40 | 5/20 at 100.00 | A1 | | | 3,239,640 | |
| | 2,000 | | Lower Colorado River Authority, Texas, Revenue Bonds, Series 2008, 5.750%, 5/15/37 | 5/15 at 100.00 | A1 | | | 2,157,900 | |
| | 1,500 | | Matagorda County Navigation District Number One, Texas, Pollution Control Revenue Refunding Bonds, Central Power and Light Company Project, Series 2009A, 6.300%, 11/01/29 | 7/19 at 102.00 | BBB | | | 1,725,360 | |
| | | | Texas Municipal Gas Acquisition and Supply Corporation I, Gas Supply Revenue Bonds, Senior Lien Series 2008D: | | | | | | |
| | 1,340 | | 5.625%, 12/15/17 | No Opt. Call | A– | | | 1,493,551 | |
| | 3,000 | | 6.250%, 12/15/26 | No Opt. Call | A– | | | 3,532,500 | |
| | 1,000 | | Texas Municipal Gas Acquisition and Supply Corporation I, Gas Supply Revenue Bonds, Series 2006A, 5.250%, 12/15/20 | No Opt. Call | A– | | | 1,085,400 | |
| | | | Texas Municipal Power Agency, Revenue Bonds, Transmission Refunding Series 2010: | | | | | | |
| | 640 | | 5.000%, 9/01/34 | 9/20 at 100.00 | A+ | | | 703,917 | |
| | 1,000 | | 5.000%, 9/01/40 | 9/20 at 100.00 | A+ | | | 1,089,930 | |
| | 23,040 | | Total Utilities | | | | | 22,824,467 | |
| | | | Water and Sewer – 15.2% (10.3% of Total Investments) | | | | | | |
| | 2,500 | | Bexar Metropolitan Water District, Texas, Waterworks System Revenue Bonds, Refunding Series 2010, 5.875%, 5/01/40 | 5/20 at 100.00 | A1 | | | 2,811,800 | |
| | 2,500 | | Canadian River Municipal Water Authority, Texas, Contract Revenue Bonds, Conjunctive Use Groundwater Supply Project, Subordinate Lien Series 2011, 5.000%, 2/15/31 | No Opt. Call | Aa3 | | | 2,815,975 | |
| | | | Coastal Water Authority, Texas, Contract Revenue Bonds, Houston Water Projects, Series 2004: | | | | | | |
| | 1,005 | | 5.000%, 12/15/20 – FGIC Insured | 12/14 at 100.00 | BBB | | | 1,066,496 | |
| | 1,030 | | 5.000%, 12/15/21 – FGIC Insured | 12/14 at 100.00 | BBB | | | 1,089,266 | |
| | 1,000 | | El Paso, Texas, Water and Sewer Revenue Bonds, Refunding Series 2008C, 5.375%, 3/01/29 | 3/18 at 100.00 | AA | | | 1,204,530 | |
| | 3,000 | | Houston, Texas, First Lien Combined Utility System Revenue Bonds, Series 2004A, 5.250%, 5/15/23 – FGIC Insured | 5/14 at 100.00 | AA | | | 3,286,620 | |
| | | Nuveen Texas Quality Income Municipal Fund (continued) |
| NTX | | Portfolio of Investments |
| | | February 29, 2012 |
| | Principal | | | Optional Call | | | | | |
| �� | Amount (000) | | Description (1) | Provisions (2) | Ratings (3) | | | Value | |
| | | | Water and Sewer (continued) | | | | | | |
| | | | Irving, Texas, Subordinate Lien Waterworks and Sewerage Revenue Bonds, Series 2004: | | | | | | |
| $ | 1,680 | | 5.000%, 8/15/22 – AMBAC Insured | 8/14 at 100.00 | Aa1 | | $ | 1,851,091 | |
| | 1,760 | | 5.000%, 8/15/23 – AMBAC Insured | 8/14 at 100.00 | Aa1 | | | 1,936,510 | |
| | 4,000 | | Laredo, Webb County, Texas, Waterworks and Sewer System Revenue Bonds, Series 2010, 5.250%, 3/01/40 | 3/20 at 100.00 | AA– | | | 4,378,320 | |
| | 710 | | North Fort Bend Water Authority, Texas, Water System Revenue Bonds, Series 2011, 5.000%, 12/15/36 – AGM Insured | 12/21 at 100.00 | AA– | | | 763,156 | |
| | 1,260 | | Rowlett, Rockwall and Dallas Counties, Texas, Waterworks and Sewerage System Revenue Bonds, Series 2004A, 5.000%, 3/01/22 – NPFG Insured | 3/14 at 100.00 | AA– | | | 1,322,858 | |
| | 20,445 | | Total Water and Sewer | | | | | 22,526,622 | |
| $ | 238,057 | | Total Investments (cost $204,367,183) – 147.4% | | | | | 218,408,366 | |
| | | | Floating Rate Obligations – (2.7)% | | | | | (3,960,000 | ) |
| | | | MuniFund Term Preferred Shares, at Liquidation Value – (47.8)% (5) | | | | | (70,920,000 | ) |
| | | | Other Assets Less Liabilities – 3.1% | | | | | 4,694,071 | |
| | | | Net Assets Applicable to Common Shares – 100% | | | | $ | 148,222,437 | |
| (1) | | All percentages shown in the Portfolio of Investments are based on net assets applicable to Common shares unless otherwise noted. |
| (2) | | Optional Call Provisions (not covered by the report of independent registered public accounting firm): Dates (month and year) and prices of the earliest optional call or redemption. There may be other call provisions at varying prices at later dates. Certain mortgage-backed securities may be subject to periodic principal paydowns. |
| (3) | | Ratings (not covered by the report of independent registered public accounting firm): Using the highest of Standard & Poor’s Group (“Standard & Poor’s”), Moody’s Investors Service, Inc. (“Moody’s”) or Fitch, Inc. (“Fitch”) rating. Ratings below BBB by Standard & Poor’s, Baa by Moody’s or BBB by Fitch are considered to be below investment grade. Holdings designated N/R are not rated by any of these national rating agencies. |
| (4) | | Backed by an escrow or trust containing sufficient U.S. Government or U.S. Government agency securities, which ensure the timely payment of principal and interest. Certain bonds backed by U.S. Government or agency securities are regarded as having an implied rating equal to the rating of such securities. |
| (5) | | MuniFund Term Preferred Shares, at Liquidation Value as a percentage of Total Investments is 32.5%. |
| N/R | | Not rated. |
| WI/DD | | Purchased on a when-issued or delayed delivery basis. |
| (ETM) | | Escrowed to maturity. |
| (UB) | | Underlying bond of an inverse floating rate trust reflected as a financing transaction. See Notes to Financial Statements, Footnote 1 – General Information |
| | | and Significant Accounting Policies, Inverse Floating Rate Securities for more information. |
See accompanying notes to financial statements.
| | | Statement of |
| | | Assets & Liabilities |
| February 29, 2012 |
| | | | Arizona Premium Income (NAZ | ) | | Arizona Dividend Advantage (NFZ | ) | | Arizona Dividend Advantage 2 (NKR | ) | | Arizona Dividend Advantage 3 (NXE | ) | | Texas Quality Income (NTX | ) |
| Assets | | | | | | | | | | | | | | | | |
| Investments, at value (cost $85,604,367, $31,868,925, $52,377,523, $62,398,752 and $204,367,183, respectively) | | $ | 93,333,482 | | $ | 33,882,570 | | $ | 55,456,991 | | $ | 65,747,546 | | $ | 218,408,366 | |
| Cash | | | — | | | 129,934 | | | — | | | — | | | 3,724,873 | |
| Receivables: | | | | | | | | | | | | | | | | |
| Interest | | | 942,556 | | | 348,822 | | | 577,920 | | | 653,780 | | | 2,703,705 | |
| Investments sold | | | 378,892 | | | — | | | 235,527 | | | 614,402 | | | 2,003,681 | |
| Deferred offering costs | | | 80,290 | | | 358,014 | | | 444,966 | | | 537,711 | | | 1,059,128 | |
| Other assets | | | 2,498 | | | 1,390 | | | 1,625 | | | 1,875 | | | 5,426 | |
| Total assets | | | 94,737,718 | | | 34,720,730 | | | 56,717,029 | | | 67,555,314 | | | 227,905,179 | |
| Liabilities | | | | | | | | | | | | | | | | |
| Cash overdraft | | | 81,874 | | | — | | | 85,698 | | | 364,407 | | | — | |
| Floating rate obligations | | | — | | | — | | | — | | | — | | | 3,960,000 | |
| Payables: | | | | | | | | | | | | | | | | |
| Common share dividends | | | 271,212 | | | 97,099 | | | 159,339 | | | 192,877 | | | 615,979 | |
| Interest | | | 26,355 | | | 19,596 | | | 33,058 | | | 52,053 | | | 140,447 | |
| Investments purchased | | | — | | | — | | | — | | | — | | | 3,814,155 | |
| Offering costs | | | — | | | 104,407 | | | 103,482 | | | 124,050 | | | 39,399 | |
| MuniFund Term Preferred (MTP) Shares, at liquidation value | | | — | | | 11,100,000 | | | 18,725,000 | | | 20,846,000 | | | 70,920,000 | |
| Variable Rate MuniFund Term Preferred (VMTP) Shares, at liquidation value | | | 28,000,000 | | | — | | | — | | | — | | | — | |
| Accrued expenses: | | | | | | | | | | | | | | | | |
| Management fees | | | 47,561 | | | 17,010 | | | 26,160 | | | 34,091 | | | 109,101 | |
| Other | | | 42,692 | | | 33,585 | | | 37,813 | | | 37,810 | | | 83,661 | |
| Total liabilities | | | 28,469,694 | | | 11,371,697 | | | 19,170,550 | | | 21,651,288 | | | 79,682,742 | |
| Net assets applicable to Common shares | | $ | 66,268,024 | | $ | 23,349,033 | | $ | 37,546,479 | | $ | 45,904,026 | | $ | 148,222,437 | |
| Common shares outstanding | | | 4,470,695 | | | 1,548,312 | | | 2,439,551 | | | 3,066,030 | | | 9,587,454 | |
| Net asset value per Common share outstanding (net assets applicable to Common shares, divided by Common shares outstanding) | | $ | 14.82 | | $ | 15.08 | | $ | 15.39 | | $ | 14.97 | | $ | 15.46 | |
| Net assets applicable to Common shares consist of: | | | | | | | | | | | | | | | | |
| Common shares, $.01 par value per share | | $ | 44,707 | | $ | 15,483 | | $ | 24,396 | | $ | 30,660 | | $ | 95,875 | |
| Paid-in surplus | | | 60,424,984 | | | 21,781,768 | | | 34,412,701 | | | 43,099,258 | | | 135,653,870 | |
| Undistributed (Over-distribution of) net investment income | | | 1,275,099 | | | 189,068 | | | 322,384 | | | 365,460 | | | 1,125,225 | |
| Accumulated net realized gain (loss) | | | (3,205,881 | ) | | (650,931 | ) | | (292,470 | ) | | (940,146 | ) | | (2,693,716 | ) |
| Net unrealized appreciation (depreciation) | | | 7,729,115 | | | 2,013,645 | | | 3,079,468 | | | 3,348,794 | | | 14,041,183 | |
| Net assets applicable to Common shares | | $ | 66,268,024 | | $ | 23,349,033 | | $ | 37,546,479 | | $ | 45,904,026 | | $ | 148,222,437 | |
| Authorized shares: | | | | | | | | | | | | | | | | |
| Common | | | 200,000,000 | | | Unlimited | | | Unlimited | | | Unlimited | | | Unlimited | |
| Auction Rate Preferred Shares (ARPS) | | | 1,000,000 | | | Unlimited | | | Unlimited | | | Unlimited | | | Unlimited | |
| MTP | | | — | | | Unlimited | | | Unlimited | | | Unlimited | | | Unlimited | |
| VMTP | | | Unlimited | | | — | | | — | | | — | | | — | |
See accompanying notes to financial statements.
| | | Statement of |
| | | Operations |
| Year ended February 29, 2012 |
| | | | Arizona Premium Income (NAZ) | | | Arizona Dividend Advantage (NFZ) | | Arizona Dividend Advantage 2 (NKR) | | Arizona Dividend Advantage 3 (NXE) | | | Texas Quality Income (NTX) | |
| Investment Income | | $ | 4,511,716 | | $ | 1,653,581 | | $ | 2,723,693 | | $ | 3,255,413 | | $ | 10,672,272 | |
| Expenses | | | | | | | | | | | | | | | | |
| Management fees | | | 578,976 | | | 206,669 | | | 347,914 | | | 416,852 | | | 1,342,612 | |
| Auction fees | | | 12,656 | | | — | | | — | | | — | | | — | |
| Dividend disbursing agent fees | | | 10,000 | | | — | | | — | | | 6,712 | | | — | |
| Shareholders’ servicing agent fees and expenses | | | 13,884 | | | 26,156 | | | 16,587 | | | 17,970 | | | 26,179 | |
| Interest expense and amortization of offering costs | | | 216,746 | | | 324,879 | | | 505,731 | | | 711,161 | | | 1,927,837 | |
| Custodian’s fees and expenses | | | 19,791 | | | 10,838 | | | 16,015 | | | 16,180 | | | 41,878 | |
| Directors’/Trustees’ fees and expenses | | | 2,714 | | | 1,130 | | | 1,750 | | | 2,025 | | | 6,370 | |
| Professional fees | | | 34,387 | | | 28,378 | | | 28,111 | | | 26,695 | | | 25,658 | |
| Shareholders’ reports – printing and mailing expenses | | | 17,121 | | | 12,996 | | | 23,361 | | | 18,540 | | | 43,715 | |
| Stock exchange listing fees | | | 8,906 | | | 203 | | | 19,810 | | | 13,831 | | | 28,028 | |
| Investor relations expense | | | 6,854 | | | 2,925 | | | 4,667 | | | 5,413 | | | 16,890 | |
| Other expenses | | | 24,814 | | | 31,207 | | | 20,807 | | | 8,400 | | | 32,131 | |
| Total expenses before custodian fee | | | | | | | | | | | | | | | | |
| credit and expense reimbursement | | | 946,849 | | | 645,381 | | | 984,753 | | | 1,243,779 | | | 3,491,298 | |
| Custodian fee credit | | | (830 | ) | | (202 | ) | | (322 | ) | | (605 | ) | | (1,039 | ) |
| Expense reimbursement | | | — | | | — | | | (30,001 | ) | | — | | | — | |
| Net expenses | | | 946,019 | | | 645,179 | | | 954,430 | | | 1,243,174 | | | 3,490,259 | |
| Net investment income (loss) | | | 3,565,697 | | | 1,008,402 | | | 1,769,263 | | | 2,012,239 | | | 7,182,013 | |
| Realized and Unrealized Gain (Loss) | | | | | | | | | | | | | | | | |
| Net realized gain (loss) from investments | | | 109,602 | | | 53,319 | | | 307,097 | | | 136,252 | | | (1,681,044 | ) |
| Change in net unrealized appreciation (depreciation) of investments | | | 6,768,696 | | | 2,855,887 | | | 3,579,761 | | | 4,821,432 | | | 15,782,348 | |
| Net realized and unrealized gain (loss) | | | 6,878,298 | | | 2,909,206 | | | 3,886,858 | | | 4,957,684 | | | 14,101,304 | |
| Distributions to Auction Rate | | | | | | | | | | | | | | | | |
| Preferred Shareholders | | | | | | | | | | | | | | | | |
| From net investment income | | | (38,807 | ) | | — | | | — | | | (4,515 | ) | | — | |
| Decrease in net assets applicable to | | | | | | | | | | | | | | | | |
| Common shares from distributions to | | | | | | | | | | | | | | | | |
| Auction Rate Preferred shareholders | | | (38,807 | ) | | — | | | — | | | (4,515 | ) | | — | |
| Net increase (decrease) in net assets applicable to Common shares from operations | | $ | 10,405,188 | | $ | 3,917,608 | | $ | 5,656,121 | | $ | 6,965,408 | | $ | 21,283,317 | |
See accompanying notes to financial statements.
| | | Statement of |
| | | Changes in Net Assets |
| | | Arizona Premium Income (NAZ) | | Arizona Dividend Advantage (NFZ) | |
| | | | Year Ended 2/29/12 | | | Seven Months Ended 2/28/11 | | | Year Ended 7/31/10 | | | Year Ended 2/29/12 | | | Seven Months Ended 2/28/11 | | | Year Ended 7/31/10 | |
| Operations | | | | | | | | | | | | | | | | | | | |
| Net investment income (loss) | | $ | 3,565,697 | | $ | 2,184,168 | | $ | 3,766,020 | | $ | 1,008,402 | | $ | 679,295 | | $ | 1,318,611 | |
| Net realized gain (loss) from investments | | | 109,602 | | | 70,746 | | | 211,410 | | | 53,319 | | | 70,054 | | | 3,081 | |
| Change in net unrealized appreciation (depreciation) of investments | | | 6,768,696 | | | (3,534,279 | ) | | 4,067,325 | | | 2,855,887 | | | (1,397,076 | ) | | 2,172,884 | |
| Distributions to Auction Rate | | | | | | | | | | | | | | | | | | | |
| Preferred Shareholders: | | | | | | | | | | | | | | | | | | | |
| From net investment income | | | (38,807 | ) | | (67,929 | ) | | (115,298 | ) | | — | | | (12,050 | ) | | (44,516 | ) |
| From accumulated net realized gains | | | — | | | — | | | — | | | — | | | — | | | — | |
| Net increase (decrease) in net assets applicable to Common shares from operations | | | 10,405,188 | | | (1,347,294 | ) | | 7,929,457 | | | 3,917,608 | | | (659,777 | ) | | 3,450,060 | |
| Distributions to Common Shareholders | | | | | | | | | | | | | | | | | | | |
| From net investment income | | | (3,393,258 | ) | | (1,955,790 | ) | | (3,146,573 | ) | | (1,198,393 | ) | | (699,030 | ) | | (1,070,455 | ) |
| From accumulated net realized gains | | | — | | | — | | | — | | | — | | | — | | | — | |
Decrease in net assets applicable to Common shares from distributions to Common shareholders | | | (3,393,258 | ) | | (1,955,790 | ) | | (3,146,573 | ) | | (1,198,393 | ) | | (699,030 | ) | | (1,070,455 | ) |
| Capital Share Transactions | | | | | | | | | | | | | | | | | | | |
| Net proceeds from Common shares issued to shareholders due to reinvestment of distributions | | | — | | | 10,632 | | | 10,931 | | | — | | | 4,230 | | | — | |
| Net increase (decrease) in net assets applicable to Common shares from capital share transactions | | | — | | | 10,632 | | | 10,931 | | | — | | | 4,230 | | | — | |
| Net increase (decrease) in net assets applicable to Common shares | | | 7,011,930 | | | (3,292,452 | ) | | 4,793,815 | | | 2,719,215 | | | (1,354,577 | ) | | 2,379,605 | |
| Net assets applicable to Common shares at the beginning of period | | | 59,256,094 | | | 62,548,546 | | | 57,754,731 | | | 20,629,818 | | | 21,984,395 | | | 19,604,790 | |
| Net assets applicable to Common shares at the end of period | | $ | 66,268,024 | | $ | 59,256,094 | | $ | 62,548,546 | | $ | 23,349,033 | | $ | 20,629,818 | | $ | 21,984,395 | |
| Undistributed (Over-distribution of) net investment income at the end of period | | $ | 1,275,099 | | $ | 1,121,954 | | $ | 961,516 | | $ | 189,068 | | $ | 282,359 | | $ | 278,947 | |
See accompanying notes to financial statements.
| | | Statement of |
| | | Changes in Net Assets (continued) |
| | | Arizona Dividend Advantage 2 (NKR) | | Arizona Dividend Advantage 3 (NXE) | |
| | | | Year Ended 2/29/12 | | Seven Months Ended 2/28/11 | | | Year Ended 7/31/10 | | | Year Ended 2/29/12 | | Seven Months Ended 2/28/11 | | | Year Ended 7/31/10 | |
| Operations | | | | | | | | | | | | | | | | | | | |
| Net investment income (loss) | | $ | 1,769,263 | | $ | 1,087,152 | | $ | 2,199,716 | | $ | 2,012,239 | | $ | 1,453,852 | | $ | 2,646,131 | |
| Net realized gain (loss) from investments | | | 307,097 | | | 55,036 | | | 15,295 | | | 136,252 | | | 190,001 | | | 103,076 | |
| Change in net unrealized appreciation (depreciation) of investments | | | 3,579,761 | | | (1,860,579 | ) | | 2,615,288 | | | 4,821,432 | | | (2,270,250 | ) | | 3,715,857 | |
| Distributions to Auction Rate | | | | | | | | | | | | | | | | | | | |
| Preferred Shareholders: | | | | | | | | | | | | | | | | | | | |
| From net investment income | | | — | | | (18,967 | ) | | (69,894 | ) | | (4,515 | ) | | (45,179 | ) | | (76,983 | ) |
| From accumulated net realized gains | | | — | | | — | | | — | | | — | | | — | | | — | |
| Net increase (decrease) in net assets applicable to Common shares from operations | | | 5,656,121 | | | (737,358 | ) | | 4,760,405 | | | 6,965,408 | | | (671,576 | ) | | 6,388,081 | |
| Distributions to Common Shareholders | | | | | | | | | | | | | | | | | | | |
| From net investment income | | | (1,961,397 | ) | | (1,144,149 | ) | | (1,856,497 | ) | | (2,317,919 | ) | | (1,352,119 | ) | | (2,236,669 | ) |
| From accumulated net realized gains | | | — | | | — | | | — | | | — | | | — | | | — | |
Decrease in net assets applicable to Common shares from distributions to Common shareholders | | | (1,961,397 | ) | | (1,144,149 | ) | | (1,856,497 | ) | | (2,317,919 | ) | | (1,352,119 | ) | | (2,236,669 | ) |
| Capital Share Transactions | | | | | | | | | | | | | | | | | | | |
| Net proceeds from Common shares issued to shareholders due to reinvestment of distributions | | | — | | | — | | | — | | | — | | | — | | | — | |
| Net increase (decrease) in net assets applicable to Common shares from capital share transactions | | | — | | | — | | | — | | | — | | | — | | | — | |
| Net increase (decrease) in net assets applicable to Common shares | | | 3,694,724 | | | (1,881,507 | ) | | 2,903,908 | | | 4,647,489 | | | (2,023,695 | ) | | 4,151,412 | |
| Net assets applicable to Common shares at the beginning of period | | | 33,851,755 | | | 35,733,262 | | | 32,829,354 | | | 41,256,537 | | | 43,280,232 | | | 39,128,820 | |
| Net assets applicable to Common shares at the end of period | | $ | 37,546,479 | | $ | 33,851,755 | | $ | 35,733,262 | | $ | 45,904,026 | | $ | 41,256,537 | | $ | 43,280,232 | |
| Undistributed (Over-distribution of) net investment income at the end of period | | $ | 322,384 | | $ | 395,361 | | $ | 427,638 | | $ | 365,460 | | $ | 544,489 | | $ | 487,582 | |
See accompanying notes to financial statements.
| | | Texas Quality Income (NTX) | |
| | | | Year Ended 2/29/12 | | Seven Months Ended 2/28/11 | | | Year Ended 7/31/10 | |
| Operations | | | | | | | | | | |
| Net investment income (loss) | | $ | 7,182,013 | | $ | 4,618,090 | | $ | 8,942,581 | |
| Net realized gain (loss) from investments | | | (1,681,044 | ) | | 213,495 | | | 197,927 | |
| Change in net unrealized appreciation (depreciation) of investments | | | 15,782,348 | | | (8,455,145 | ) | | 10,122,568 | |
| Distributions to Auction Rate | | | | | | | | | | |
| Preferred Shareholders: | | | | | | | | | | |
| From net investment income | | | — | | | (85,730 | ) | | (257,907 | ) |
| From accumulated net realized gains | | | — | | | — | | | (19,921 | ) |
| Net increase (decrease) in net assets applicable to Common shares from operations | | | 21,283,317 | | | (3,709,290 | ) | | 18,985,248 | |
| Distributions to Common Shareholders | | | | | | | | | | |
| From net investment income | | | (8,211,637 | ) | | (4,775,546 | ) | | (7,745,753 | ) |
| From accumulated net realized gains | | | (248,069 | ) | | (63,947 | ) | | (114,136 | ) |
| Decrease in net assets applicable to Common shares from distributions to Common shareholders | | | (8,459,706 | ) | | (4,839,493 | ) | | (7,859,889 | ) |
| Capital Share Transactions | | | | | | | | | | |
| Net proceeds from Common shares issued to shareholders due to reinvestment of distributions | | | 548,918 | | | 318,797 | | | 441,175 | |
| Net increase (decrease) in net assets applicable to Common shares from capital share transactions | | | 548,918 | | | 318,797 | | | 441,175 | |
| Net increase (decrease) in net assets applicable to Common shares | | | 13,372,529 | | | (8,229,986 | ) | | 11,566,534 | |
| Net assets applicable to Common shares at the beginning of period | | | 134,849,908 | | | 143,079,894 | | | 131,513,360 | |
| Net assets applicable to Common shares at the end of period | | $ | 148,222,437 | | $ | 134,849,908 | | $ | 143,079,894 | |
| Undistributed (Over-distribution of) net investment income at the end of period | | $ | 1,125,225 | | $ | 1,891,219 | | $ | 2,042,050 | |
See accompanying notes to financial statements.
| | | Statement of |
| | | Cash Flows |
| Year ended February 29, 2012 |
| | | | Arizona Premium Income (NAZ) | | | Arizona Dividend Advantage (NFZ) | | Arizona Dividend Advantage 2 (NKR) | |
| Cash Flows from Operating Activities: | | | | | | | | | | |
| Net Increase (Decrease) In Net Assets Applicable to Common Shares from Operations | | $ | 10,405,188 | | $ | 3,917,608 | | $ | 5,656,121 | |
| Adjustments to reconcile the net increase (decrease) in net assets applicable to Common shares from operations to net cash provided by (used in) operating activities: | | | | | | | | | | |
| Purchases of investments | | | (7,003,987 | ) | | (2,557,441 | ) | | (8,471,522 | ) |
| Proceeds from sales and maturities of investments | | | 6,120,847 | | | 2,445,295 | | | 8,633,476 | |
| Amortization (Accretion) of premiums and discounts, net | | | 68,321 | | | 58,948 | | | 40,578 | |
| (Increase) Decrease in: | | | | | | | | | | |
| Receivable for interest | | | (40,383 | ) | | (9,049 | ) | | 15,461 | |
| Receivable for investments sold | | | (348,892 | ) | | — | | | 2,284,809 | |
| Other assets | | | 7,710 | | | 2,748 | | | 4,744 | |
| Increase (Decrease) in: | | | | | | | | | | |
| Payable for Auction Rate Preferred Share dividends | | | (966 | ) | | — | | | — | |
| Payable for interest | | | 26,355 | | | 634 | | | 1,070 | |
| Payable for investments purchased | | | — | | | — | | | (3,027,216 | ) |
| Accrued management fees | | | 4,805 | | | 1,840 | | | 4,358 | |
| Accrued other expenses | | | 6,598 | | | 22,527 | | | 20,378 | |
| Net realized (gain) loss from investments | | | (109,602 | ) | | (53,319 | ) | | (307,097 | ) |
| Change in net unrealized (appreciation) depreciation of investments | | | (6,768,696 | ) | | (2,855,887 | ) | | (3,579,761 | ) |
| Taxes paid on undistributed capital gains | | | — | | | — | | | — | |
| Net cash provided by (used in) operating activities | | | 2,367,298 | | | 973,904 | | | 1,275,399 | |
| Cash Flows from Financing Activities: | | | | | | | | | | |
| (Increase) Decrease in: | | | | | | | | | | |
| Cash equivalents | | | — | | | — | | | — | |
| Deferred offering costs | | | (80,290 | ) | | 96,700 | | | 120,806 | |
| Increase (Decrease) in: | | | | | | | | | | |
| Cash overdraft balance | | | 81,874 | | | — | | | 85,698 | |
| Payable for offering costs | | | — | | | (73,626 | ) | | (106,742 | ) |
| ARPS noticed for redemption, at liquidation value | | | — | | | — | | | — | |
| MTP Shares, at liquidation value | | | — | | | — | | | — | |
| VMTP Shares, at liquidation value | | | 28,000,000 | | | — | | | — | |
| ARPS, at liquidation value | | | (27,875,000 | ) | | — | | | — | |
| Cash distributions paid to Common shareholders | | | (3,384,107 | ) | | (1,198,384 | ) | | (1,961,368 | ) |
| Net cash provided by (used in) financing activities | | | (3,257,523 | ) | | (1,175,310 | ) | | (1,861,606 | ) |
| Net Increase (Decrease) in Cash | | | (890,225 | ) | | (201,406 | ) | | (586,207 | ) |
| Cash at the beginning of period | | | 890,225 | | | 331,340 | | | 586,207 | |
| Cash at the End of Period | | $ | — | | $ | 129,934 | | $ | — | |
| | | | | | | | | | | |
Supplemental Disclosure of Cash Flow Information
Non-cash financing activities not included herein consist of reinvestments of Common share distributions as follows:
| | | | Arizona Premium Income (NAZ) | | | Arizona Dividend Advantage (NFZ) | | Arizona Dividend Advantage 2 (NKR) | |
| | | $ | — | | $ | — | | $ | — | |
Cash paid for interest (excluding amortization of offering costs) was as follows:
| | | | Arizona Premium Income (NAZ) | | | Arizona Dividend Advantage (NFZ) | | Arizona Dividend Advantage 2 (NKR) | |
| | | $ | 170,681 | | $ | 227,545 | | $ | 383,854 | |
See accompanying notes to financial statements.
| | | | Arizona Dividend Advantage 3 (NXE) | | | Texas Quality Income (NTX) | |
| | | | | | | | |
| Cash Flows from Operating Activities: | | | | | | | |
| Net Increase (Decrease) In Net Assets Applicable to Common Shares from Operations | | $ | 6,965,408 | | $ | 21,283,317 | |
| Adjustments to reconcile the net increase (decrease) in net assets applicable to Common shares from operations to net cash provided by (used in) operating activities: | | | | | | | |
| Purchases of investments | | | (11,041,834 | ) | | (18,705,962 | ) |
| Proceeds from sales and maturities of investments | | | 8,985,143 | | | 19,424,077 | |
| Amortization (Accretion) of premiums and discounts, net | | | 71,240 | | | (45,757 | ) |
| (Increase) Decrease in: | | | | | | | |
| Receivable for interest | | | (17,424 | ) | | (28,455 | ) |
| Receivable for investments sold | | | (614,402 | ) | | 418,870 | |
| Other assets | | | 18,580 | | | 17,701 | |
| Increase (Decrease) in: | | | | | | | |
| Payable for Auction Rate Preferred Share dividends | | | (1,682 | ) | | — | |
| Payable for interest | | | 50,519 | | | 4,517 | |
| Payable for investments purchased | | | — | | | 2,089,075 | |
| Accrued management fees | | | 4,419 | | | 9,385 | |
| Accrued other expenses | | | 4,057 | | | 26,184 | |
| Net realized (gain) loss from investments | | | (136,252 | ) | | 1,681,044 | |
| Change in net unrealized (appreciation) depreciation of investments | | | (4,821,432 | ) | | (15,782,348 | ) |
| Taxes paid on undistributed capital gains | | | — | | | (19,157 | ) |
| Net cash provided by (used in) operating activities | | | (533,660 | ) | | 10,372,491 | |
| Cash Flows from Financing Activities: | | | | | | | |
| (Increase) Decrease in: | | | | | | | |
| Cash equivalents | | | 18,409,700 | | | — | |
| Deferred offering costs | | | 107,713 | | | 276,588 | |
| Increase (Decrease) in: | | | | | | | |
| Cash overdraft balance | | | 364,407 | | | — | |
| Payable for offering costs | | | (235,950 | ) | | (164,056 | ) |
| ARPS noticed for redemption, at liquidation value | | | (18,400,000 | ) | | — | |
| MTP Shares, at liquidation value | | | 1,800,000 | | | — | |
| VMTP Shares, at liquidation value | | | — | | | — | |
| ARPS, at liquidation value | | | — | | | — | |
| Cash distributions paid to Common shareholders | | | (2,317,078 | ) | | (7,902,454 | ) |
| Net cash provided by (used in) financing activities | | | (271,208 | ) | | (7,789,922 | ) |
| Net Increase (Decrease) in Cash | | | (804,868 | ) | | 2,582,569 | |
| Cash at the beginning of period | | | 804,868 | | | 1,142,304 | |
| Cash at the End of Period | | $ | — | | $ | 3,724,873 | |
Supplemental Disclosure of Cash Flow Information
Non-cash financing activities not included herein consist of reinvestments of Common share distributions as follows:
| | | | | | | | |
| | | | Arizona Dividend Advantage 3 (NXE) | | | Texas Quality Income (NTX) | |
| | | $ | — | | $ | 548,918 | |
Cash paid for interest (excluding amortization of offering costs) was as follows:
| | | | Arizona Dividend Advantage 3 (NXE) | | | Texas Quality Income (NTX) | |
| | | $ | 557,895 | | $ | 1,646,731 | |
See accompanying notes to financial statements.
| | | Financial |
| | | Highlights |
| | | |
| | Selected data for a Common share outstanding throughout each period: |
| | | | | | | Investment Operations | | Less Distributions | | | | | | | |
| | | | Beginning Common Share Net Asset Value | | | Net Investment Income (Loss) | | | Net Realized/ Unrealized Gain (Loss) | | | Distributions from Net Investment Income to Auction Rate Preferred Share- holders | (a) | | Distributions from Capital Gains to Auction Rate Preferred Share- holders | (a) | | Total | | | Net Investment Income to Common Share- holders | | | Capital Gains to Common Share- holders | | | Total | | | Discount from Common Shares Repur- chased and Retired | | | Ending Common Share Net Asset Value | | | Ending Market Value | |
| Arizona Premium Income (NAZ) | |
| Year Ended 2/28–2/29: | |
| 2012 | | $ | 13.25 | | $ | .80 | | $ | 1.54 | | $ | (.01 | ) | $ | — | | $ | 2.33 | | $ | (.76 | ) | $ | — | | $ | (.76 | ) | $ | — | | $ | 14.82 | | $ | 14.61 | |
| 2011(f) | | | 13.99 | | | .49 | | | (.77 | ) | | (.02 | ) | | — | | | (.30 | ) | | (.44 | ) | | — | | | (.44 | ) | | — | | | 13.25 | | | 12.32 | |
| Year Ended 7/31: | |
| 2010 | | | 12.92 | | | .84 | | | .96 | | | (.03 | ) | | — | | | 1.77 | | | (.70 | ) | | — | | | (.70 | ) | | — | | | 13.99 | | | 13.34 | |
| 2009 | | | 13.00 | | | .85 | | | (.16 | ) | | (.13 | ) | | — | | | .56 | | | (.64 | ) | | — | | | (.64 | ) | | — | | | 12.92 | | | 12.29 | |
| 2008 | | | 14.00 | | | .88 | | | (1.05 | ) | | (.22 | ) | | — | | | (.39 | ) | | (.61 | ) | | — | | | (.61 | ) | | — | | | 13.00 | | | 13.35 | |
| 2007 | | | 14.10 | | | .83 | | | (.10 | ) | | (.22 | ) | | — | | | .51 | | | (.61 | ) | | — | | | (.61 | ) | | — | | | 14.00 | | | 13.07 | |
| | |
| Arizona Dividend Advantage (NFZ) | |
| Year Ended 2/28–2/29: | |
| 2012 | | | 13.32 | | | .65 | | | 1.88 | | | — | | | — | | | 2.53 | | | (.77 | ) | | — | | | (.77 | ) | | — | | | 15.08 | | | 14.39 | |
| 2011(f) | | | 14.20 | | | .44 | | | (.86 | ) | | (.01 | ) | | — | | | (.43 | ) | | (.45 | ) | | — | | | (.45 | ) | | — | | | 13.32 | | | 12.14 | |
| Year Ended 7/31: | |
| 2010 | | | 12.66 | | | .85 | | | 1.41 | | | (.03 | ) | | — | | | 2.23 | | | (.69 | ) | | — | | | (.69 | ) | | — | | | 14.20 | | | 14.19 | |
| 2009 | | | 13.26 | | | .84 | | | (.67 | ) | | (.14 | ) | | — | | | .03 | | | (.63 | ) | | — | | | (.63 | ) | | — | * | | 12.66 | | | 12.14 | |
| 2008 | | | 14.48 | | | .91 | | | (1.23 | ) | | (.25 | ) | | — | * | | (.57 | ) | | (.64 | ) | | (.01 | ) | | (.65 | ) | | — | | | 13.26 | | | 13.70 | |
| 2007 | | | 14.77 | | | .91 | | | (.17 | ) | | (.24 | ) | | (.02 | ) | | .48 | | | (.71 | ) | | (.06 | ) | | (.77 | ) | | — | | | 14.48 | | | 13.35 | |
| (a) | The amounts shown are based on Common share equivalents. |
| (b) | Total Return Based on Market Value is the combination of changes in the market price per share and the effect of reinvested dividend income and reinvested capital gains distributions, if any, at the average price paid per share at the time of reinvestment. The last dividend declared in the period, which is typically paid on the first business day of the following month, is assumed to be reinvested at the ending market price. The actual reinvestment for the last dividend declared in the period may take place over several days, and in some instances may not be based on the market price, so the actual reinvestment price may be different from the price used in the calculation. Total returns are not annualized. |
| | Total Return Based on Common Share Net Asset Value is the combination of changes in Common share net asset value, reinvested dividend income at net asset value and reinvested capital gains distributions at net asset value, if any. The last dividend declared in the period, which is typically paid on the first business day of the following month, is assumed to be reinvested at the ending net asset value. The actual reinvest price for the last dividend declared in the period may often be based on the Fund’s market price (and not its net asset value), and therefore may be different from the price used in the calculation. Total returns are not annualized. |
| | | | | | | Ratios/Supplemental Data | |
| Total Returns | | | | | Ratios to Average Net Assets Applicable to Common Shares Before Reimbursement(c) | | Ratios to Average Net Assets Applicable to Common Shares After Reimbursement(c)(d) | | | | |
Based on Market Value | (b) | | Based on Common Share Net Asset Value | (b) | | Ending Net Assets Applicable to Common Shares (000) | | | Expenses | (e) | | Net Investment Income (Loss) | | | Expenses | (e) | | Net Investment Income (Loss) | | | Portfolio Turnover Rate | |
| | | | | | | | | | | | | | | | | | | | | | | |
| 25.48 | % | | 18.08 | % | $ | 66,268 | | | 1.52 | % | | 5.73 | % | | N/A | | | N/A | | | 7 | % |
| (4.55 | ) | | (2.23 | ) | | 59,256 | | | 1.19 | ** | | 6.11 | ** | | N/A | | | N/A | | | 5 | |
| | | | | | | | | | | | | | | | | | | | | | | |
| 14.47 | | | 13.94 | | | 62,549 | | | 1.21 | | | 6.13 | | | N/A | | | N/A | | | 8 | |
| (2.61 | ) | | 4.73 | | | 57,755 | | | 1.33 | | | 7.01 | | | N/A | | | N/A | | | 25 | |
| 7.10 | | | (2.87 | ) | | 58,097 | | | 1.40 | | | 6.42 | | | N/A | | | N/A | | | 21 | |
| (.22) | | | 3.62 | | | 62,534 | | | 1.32 | | | 5.81 | | | N/A | | | N/A | | | 13 | |
| | | | | | | | | | | | | | | | | | | | | | | |
| | | | | | | | | | | | | | | | | | | | | | | |
| 25.66 | | | 19.56 | | | 23,349 | | | 2.95 | | | 4.62 | | | N/A | | | N/A | | | 8 | |
| (11.47 | ) | | (3.10 | ) | | 20,630 | | | 2.29 | ** | | 5.37 | ** | | 2.23 | %** | | 5.43 | %** | | 5 | |
| 23.34 | | | 17.93 | | | 21,984 | | | 1.35 | | | 6.12 | | | 1.23 | | | 6.23 | | | 3 | |
| (6.12 | ) | | .58 | | | 19,605 | | | 1.51 | | | 6.70 | | | 1.30 | | | 6.91 | | | 6 | |
| 7.72 | | | (4.09 | ) | | 20,552 | | | 1.58 | | | 6.14 | | | 1.31 | | | 6.42 | | | 10 | |
| (11.63 | ) | | 3.24 | | | 22,439 | | | 1.48 | | | 5.74 | | | 1.14 | | | 6.08 | | | 19 | |
| (c) | Ratios do not reflect the effect of dividend payments to Auction Rate Preferred shareholders, where applicable; Net Investment Income (Loss) ratios reflect income earned and expenses incurred on assets attributable to ARPS, MTP Shares and/or VMTP Shares, where applicable. |
| (d) | Ratios do not reflect the effect of custodian fee credits earned on the Fund’s net cash on deposit with the custodian bank, where applicable. As of January 31, 2011, the Adviser is no longer reimbursing Arizona Dividend Advantage (NFZ) for any fees and expenses. |
| (e) | The expense ratios reflect, among other things, all interest expense and other costs related to MTP Shares, VMTP Shares and/or the interest expense deemed to have been paid by the Fund on the floating rate certificates issued by the special purpose trusts for the self-deposited inverse floaters held by the Fund, where applicable, each as described in Footnote 1 – General Information and Significant Accounting Policies, MuniFund Term Preferred Shares, Variable Rate MuniFund Term Preferred Shares and Inverse Floating Rate Securities, respectively, as follows: |
| Arizona Premium Income (NAZ) | | | | |
| Year Ended 2/28–2/29: | | | | |
| 2012 | | | .35 | % |
| 2011(f) | | | — | |
| Year Ended 7/31: | | | | |
| 2010 | | | — | |
| 2009 | | | — | |
| 2008 | | | .14 | |
| 2007 | | | .08 | |
| | | | | |
| Arizona Dividend Advantage (NFZ) | | | | |
| Year Ended 2/28–2/29: | | | | |
| 2012 | | | 1.49 | % |
| 2011(f) | | | .96 | ** |
| Year Ended 7/31: | | | | |
| 2010 | | | — | |
| 2009 | | | — | |
| 2008 | | | .14 | |
| 2007 | | | .10 | |
| (f) | For the seven months ended February 28, 2011. |
| * | Rounds to less than $.01 per share. |
| ** | Annualized. |
| N/A | The Fund did not have, or no longer has, a contractual reimbursement agreement with the Adviser. |
See accompanying notes to financial statements.
| | | Financial |
| | | Highlights (continued) |
| | | |
| | Selected data for a Common share outstanding throughout each period: |
| | | | | | Investment Operations | | Less Distributions | | | | | | | |
| | | | Beginning Common Share Net Asset Value | | | Net Investment Income (Loss) | | | Net Realized/ Unrealized Gain (Loss) | | | Distributions from Net Investment Income to Auction Rate Preferred Share- holders | (a) | | Distributions from Capital Gains to Auction Rate Preferred Share- holders | (a) | | Total | | | Net Investment Income to Common Share- holders | | | Capital Gains to Common Share- holders | | | Total | | | Discount from Common Shares Repur- chased and Retired | | | Ending Common Share Net Asset Value | | | Ending Market Value | |
| Arizona Dividend Advantage 2 (NKR) | |
| Year Ended 2/28–2/29: | |
| 2012 | | $ | 13.88 | | $ | .72 | | $ | 1.59 | | $ | — | | $ | — | | $ | 2.31 | | $ | (.80 | ) | $ | — | | $ | (.80 | ) | $ | — | | $ | 15.39 | | $ | 14.78 | |
| 2011(f) | | | 14.65 | | | .45 | | | (.74 | ) | | (.01 | ) | | — | | | (.30 | ) | | (.47 | ) | | — | | | (.47 | ) | | — | | | 13.88 | | | 12.66 | |
| Year Ended 7/31: | |
| 2010 | | | 13.46 | | | .90 | | | 1.08 | | | (.03 | ) | | — | | | 1.95 | | | (.76 | ) | | — | | | (.76 | ) | | — | | | 14.65 | | | 13.92 | |
| 2009 | | | 13.66 | | | .93 | | | (.29 | ) | | (.14 | ) | | — | | | .50 | | | (.70 | ) | | — | | | (.70 | ) | | — | * | | 13.46 | | | 12.52 | |
| 2008 | | | 14.76 | | | .96 | | | (1.03 | ) | | (.24 | ) | | (.02 | ) | | (.33 | ) | | (.71 | ) | | (.06 | ) | | (.77 | ) | | — | | | 13.66 | | | 14.00 | |
| 2007 | | | 15.00 | | | .97 | | | (.18 | ) | | (.24 | ) | | (.01 | ) | | .54 | | | (.74 | ) | | (.04 | ) | | (.78 | ) | | — | | | 14.76 | | | 15.27 | |
| Arizona Dividend Advantage 3 (NXE) | |
| Year Ended 2/28–2/29: | |
| 2012 | | | 13.46 | | | .66 | | | 1.61 | | | — | * | | — | | | 2.27 | | | (.76 | ) | | — | | | (.76 | ) | | — | | | 14.97 | | | 14.28 | |
| 2011(f) | | | 14.12 | | | .47 | | | (.68 | ) | | (.01 | ) | | — | | | (.22 | ) | | (.44 | ) | | — | | | (.44 | ) | | — | | | 13.46 | | | 12.24 | |
| Year Ended 7/31: | |
| 2010 | | | 12.76 | | | .86 | | | 1.26 | | | (.03 | ) | | — | | | 2.09 | | | (.73 | ) | | — | | | (.73 | ) | | — | | | 14.12 | | | 13.14 | |
| 2009 | | | 13.07 | | | .88 | | | (.41 | ) | | (.13 | ) | | — | | | .34 | | | (.65 | ) | | — | | | (.65 | ) | | — | * | | 12.76 | | | 11.73 | |
| 2008 | | | 14.20 | | | .91 | | | (1.15 | ) | | (.24 | ) | | — | | | (.48 | ) | | (.65 | ) | | — | | | (.65 | ) | | — | | | 13.07 | | | 13.30 | |
| 2007 | | | 14.32 | | | .90 | | | (.10 | ) | | (.25 | ) | | — | | | .55 | | | (.67 | ) | | — | | | (.67 | ) | | — | | | 14.20 | | | 13.44 | |
| (a) | The amounts shown are based on Common share equivalents. |
| (b) | Total Return Based on Market Value is the combination of changes in the market price per share and the effect of reinvested dividend income and reinvested capital gains distributions, if any, at the average price paid per share at the time of reinvestment. The last dividend declared in the period, which is typically paid on the first business day of the following month, is assumed to be reinvested at the ending market price. The actual reinvestment for the last dividend declared in the period may take place over several days, and in some instances may not be based on the market price, so the actual reinvestment price may be different from the price used in the calculation. Total returns are not annualized. |
| | Total Return Based on Common Share Net Asset Value is the combination of changes in Common share net asset value, reinvested dividend income at net asset value and reinvested capital gains distributions at net asset value, if any. The last dividend declared in the period, which is typically paid on the first business day of the following month, is assumed to be reinvested at the ending net asset value. The actual reinvest price for the last dividend declared in the period may often be based on the Fund’s market price (and not its net asset value), and therefore may be different from the price used in the calculation. Total returns are not annualized. |
| | | | | | | | | | Ratios/Supplemental Data | |
| Total Returns | | | | | | Ratios to Average Net Assets Applicable to Common Shares Before Reimbursement(c) | | Ratios to Average Net Assets Applicable to Common Shares After Reimbursement(c)(d) | | | | |
Based on Market Value | (b) | | Based on Common Share Net Asset Value | (b) | | | Ending Net Assets Applicable to Common Shares (000) | | | Expenses | (e) | | Net Investment Income (Loss) | | | Expenses | (e) | | Net Investment Income (Loss) | | | Portfolio Turnover Rate | |
| | | | | | | | | | | | | | | | | | | | | | | | |
| 23.88 | % | | 16.91 | % | | $ | 37,546 | | | 2.78 | % | | 4.92 | % | | 2.70 | % | | 5.00 | % | | 16 | % |
| (5.84 | ) | | (1.90 | ) | | | 33,852 | | | 2.22 | ** | | 5.18 | ** | | 2.06 | ** | | 5.34 | ** | | 7 | |
| | | | | | | | | | | | | | | | | | | | | | | | |
| 17.65 | | | 14.75 | | | | 35,733 | | | 1.27 | | | 6.11 | | | 1.07 | | | 6.31 | | | 4 | |
| (4.99 | ) | | 4.09 | | | | 32,829 | | | 1.40 | | | 6.93 | | | 1.11 | | | 7.22 | | | 5 | |
| (3.16 | ) | | (2.38 | ) | | | 33,311 | | | 1.49 | | | 6.32 | | | 1.13 | | | 6.68 | | | 15 | |
| 4.52 | | | 3.59 | | | | 35,976 | | | 1.39 | | | 5.92 | | | .96 | | | 6.35 | | | 14 | |
| | | | | | | | | | | | | | | | | | | | | | | | |
| | | | | | | | | | | | | | | | | | | | | | | | |
| 23.63 | | | 17.30 | | | | 45,904 | | | 2.87 | | | 4.64 | | | N/A | | | N/A | | | 14 | |
| (3.63 | ) | | (1.60 | ) | | | 41,257 | | | 1.46 | ** | | 5.85 | ** | | 1.43 | ** | | 5.88 | ** | | 6 | |
| | | | | | | | | | | | | | | | | | | | | | | | |
| 18.58 | | | 16.66 | | | | 43,280 | | | 1.22 | | | 6.15 | | | 1.08 | | | 6.29 | | | 5 | |
| (6.18 | ) | | 3.08 | | | | 39,129 | | | 1.37 | | | 6.97 | | | 1.09 | | | 7.25 | | | 9 | |
| 3.96 | | | (3.48 | ) | | | 40,081 | | | 1.46 | | | 6.17 | | | 1.08 | | | 6.55 | | | 16 | |
| 4.21 | | | 3.81 | | | | 43,552 | | | 1.36 | | | 5.69 | | | .88 | | | 6.16 | | | 15 | |
| (c) | Ratios do not reflect the effect of dividend payments to Auction Rate Preferred shareholders, where applicable; Net Investment Income (Loss) ratios reflect income earned and expenses incurred on assets attributable to ARPS and/or MTP Shares, where applicable. |
| (d) | After expense reimbursement from the Adviser, where applicable. Ratios do not reflect the effect of custodian fee credits earned on the Fund’s net cash on deposit with the custodian bank, where applicable. As of September 30, 2010, the Adviser is no longer reimbursing Arizona Dividend Advantage 3 (NXE) for any fees and expenses. |
| (e) | The expense ratios reflect, among other things, all interest expense and other costs related to MTP Shares and/or the interest expense deemed to have been paid by the Fund on the floating rate certificates issued by the special purpose trusts for the self-deposited inverse floaters held by the Fund, where applicable, both as described in Footnote 1 – General Information and Significant Accounting Policies, MuniFund Term Preferred Shares and Inverse Floating Rate Securities, respectively, as follows: |
| | | | | |
| Arizona Dividend Advantage 2 (NKR) | | | | |
| Year Ended 2/28–2/29: | | | | |
| 2012 | | | 1.43 | % |
| 2011(f) | | | .91 | ** |
| Year Ended 7/31: | | | | |
| 2010 | | | — | |
| 2009 | | | — | |
| 2008 | | | .15 | |
| 2007 | | | .10 | |
| | | | | |
| Arizona Dividend Advantage 3 (NXE) | | | | |
| Year Ended 2/28–2/29: | | | | |
| 2012 | | | 1.71 | |
| 2011(f) | | | .01 | ** |
| Year Ended 7/31: | | | | |
| 2010 | | | — | |
| 2009 | | | — | |
| 2008 | | | .16 | |
| 2007 | | | .10 | |
| (f) | For the seven months ended February 28, 2011. |
| * | Rounds to less than $.01 per share. |
| ** | Annualized. |
| N/A | The Fund did not have, or no longer has, a contractual reimbursement agreement with the Adviser. |
See accompanying notes to financial statements.
| | | Financial |
| | | Highlights (continued) |
| | | |
| | Selected data for a Common share outstanding throughout each period: |
| | | | | | Investment Operations | | Less Distributions | | | | | | |
| | | | Beginning Common Share Net Asset Value | | | Net Investment Income (Loss) | | | Net Realized/ Unrealized Gain (Loss) | | | Distributions from Net Investment Income to Auction Rate Preferred Share- holders | (a) | | Distributions from Capital Gains to Auction Rate Preferred Share- holders | (a) | | Total | | | Net Investment Income to Common Share- holders | | | Capital Gains to Common Share- holders | | | Total | | | Discount from Common Shares Repur- chased and Retired | | | Ending Common Share Net Asset Value | | | Ending Market Value | |
| Texas Quality Income (NTX) | |
| Year Ended 2/28–2/29: | |
| 2012 | | $ | 14.12 | | $ | .75 | | $ | 1.48 | | $ | — | | $ | — | | $ | 2.23 | | $ | (.86 | ) | $ | (.03 | ) | $ | (.89 | ) | $ | — | | $ | 15.46 | | $ | 16.31 | |
| 2011(f) | | | 15.01 | | | .48 | | | (.85 | ) | | (.01 | ) | | — | | | (.38 | ) | | (.50 | ) | | (.01 | )* | | (.51 | ) | | — | | | 14.12 | | | 15.19 | |
| Year Ended 7/31: | |
| 2010 | | | 13.84 | | | .94 | | | 1.08 | | | (.03 | ) | | — | * | | 1.99 | | | (.81 | ) | | (.01 | ) | | (.82 | ) | | — | | | 15.01 | | | 16.92 | |
| 2009 | | | 13.98 | | | .94 | | | (.17 | ) | | (.13 | ) | | (.02 | ) | | .62 | | | (.71 | ) | | (.05 | ) | | (.76 | ) | | — | | | 13.84 | | | 14.78 | |
| 2008 | | | 14.87 | | | .94 | | | (.83 | ) | | (.23 | ) | | (.02 | ) | | (.14 | ) | | (.69 | ) | | (.06 | ) | | (.75 | ) | | — | | | 13.98 | | | 12.46 | |
| 2007 | | | 15.06 | | | .95 | | | (.11 | ) | | (.25 | ) | | (.01 | ) | | .58 | | | (.73 | ) | | (.04 | ) | | (.77 | ) | | — | | | 14.87 | | | 13.89 | |
| (a) | The amounts shown are based on Common share equivalents. |
| (b) | Total Return Based on Market Value is the combination of changes in the market price per share and the effect of reinvested dividend income and reinvested capital gains distributions, if any, at the average price paid per share at the time of reinvestment. The last dividend declared in the period, which is typically paid on the first business day of the following month, is assumed to be reinvested at the ending market price. The actual reinvestment for the last dividend declared in the period may take place over several days, and in some instances may not be based on the market price, so the actual reinvestment price may be different from the price used in the calculation. Total returns are not annualized. |
| | Total Return Based on Common Share Net Asset Value is the combination of changes in Common share net asset value, reinvested dividend income at net asset value and reinvested capital gains distributions at net asset value, if any. The last dividend declared in the period, which is typically paid on the first business day of the following month, is assumed to be reinvested at the ending net asset value. The actual reinvest price for the last dividend declared in the period may often be based on the Fund’s market price (and not its net asset value), and therefore may be different from the price used in the calculation. Total returns are not annualized. |
| | | | | | | | | | | | | | | | | | |
| | | | | | | | Ratios/Supplemental Data | |
| | Total Returns | | | | | | Ratios to Average Net Assets Applicable to Common Shares(c)(d) | | | | |
| | Based on Market Value | (b) | | Based on Common Share Net Asset Value | (b) | | Ending Net Assets Applicable to Common Shares (000) | | | Expenses | (e) | | Net Investment Income (Loss) | | | Portfolio Turnover Rate | |
| | | | | | | | | | | | | | | | | | |
| | | | | | | | | | | | | | | | | | |
| | 13.81 | % | | 16.23 | % | $ | 148,222 | | | 2.48 | % | | 5.10 | % | | 9 | % |
| | (7.15 | ) | | (2.61 | ) | | 134,850 | | | 1.92 | ** | | 5.69 | ** | | 10 | |
| | | | | | | | | | | | | | | | | | |
| | 20.92 | | | 14.71 | | | 143,080 | | | 1.19 | | | 6.42 | | | 6 | |
| | 25.98 | | | 4.80 | | | 131,513 | | | 1.27 | | | 7.06 | | | 10 | |
| | (5.16 | ) | | (1.04 | ) | | 132,713 | | | 1.26 | | | 6.46 | | | 8 | |
| | (.52 | ) | | 3.82 | | | 141,238 | | | 1.24 | | | 6.24 | | | 9 | |
| (c) | Ratios do not reflect the effect of dividend payments to Auction Rate Preferred shareholders, where applicable; Net Investment Income (Loss) ratios reflect income earned and expenses incurred on assets attributable to ARPS and/or MTP Shares, where applicable. |
| (d) | Ratios do not reflect the effect of custodian fee credits earned on the Fund’s net cash on deposit with the custodian bank, where applicable. |
| (e) | The expense ratios reflect, among other things, all interest expense and other costs related to MTP Shares and/or the interest expense deemed to have been paid by the Fund on the floating rate certificates issued by the special purpose trusts for the self-deposited inverse floaters held by the Fund, where applicable, both as described in Footnote 1 – General Information and Significant Accounting Policies, MuniFund Term Preferred Shares and Inverse Floating Rate Securities, respectively, as follows: |
| Texas Quality Income (NTX) | | | | |
| Year Ended 2/28–2/29: | | | | |
| 2012 | | | 1.37 | % |
| 2011(f) | | | .80 | ** |
| Year Ended 7/31: | | | | |
| 2010 | | | .02 | |
| 2009 | | | .01 | |
| 2008 | | | .05 | |
| 2007 | | | .06 | |
| (f) | For the seven months ended February 28, 2011. |
| * | Rounds to less than $.01 per share. |
| ** | Annualized. |
| See accompanying notes to financial statements. |
| | | Financial |
| | | Highlights (continued) |
| | | ARPS at the End of Period | | MTP Shares at the End of Period (g) | | VMTP Shares at the End of Period | |
| | | | Aggregate Amount Outstanding (000) | | | Liquidation Value Per Share | | | Asset Coverage Per Share | | | Aggregate Amount Outstanding (000) | | | Liquidation Value Per Share | | | Asset Coverage Per Share | | | Aggregate Amount Outstanding (000) | | | Liquidation Value Per Share | | | Asset Coverage Per Share | |
| Arizona Premium Income (NAZ) | |
| Year Ended 2/28–2/29: | |
| 2012 | | $ | — | | $ | — | | $ | — | | $ | — | | $ | — | | $ | — | | $ | 28,000 | | $ | 100,000 | | $ | 336,672 | |
| 2011(f) | | | 27,875 | | | 25,000 | | | 78,144 | | | — | | | — | | | — | | | — | | | — | | | — | |
| Year Ended 7/31: | |
| 2010 | | | 27,875 | | | 25,000 | | | 81,097 | | | — | | | — | | | — | | | — | | | — | | | — | |
| 2009 | | | 27,875 | | | 25,000 | | | 76,798 | | | — | | | — | | | — | | | — | | | — | | | — | |
| 2008 | | | 30,000 | | | 25,000 | | | 73,414 | | | — | | | — | | | — | | | — | | | — | | | — | |
| 2007 | | | 30,000 | | | 25,000 | | | 77,111 | | | — | | | — | | | — | | | — | | | — | | | — | |
| Arizona Dividend Advantage (NFZ) | |
| Year Ended 2/28–2/29: | |
| 2012 | | | — | | | — | | | — | | | 11,100 | | | 10.00 | | | 31.04 | | | — | | | — | | | — | |
| 2011(f) | | | — | | | — | | | — | | | 11,100 | | | 10.00 | | | 28.59 | | | — | | | — | | | — | |
| Year Ended 7/31: | |
| 2010 | | | 10,600 | | | 25,000 | | | 76,850 | | | — | | | — | | | — | | | — | | | — | | | — | |
| 2009 | | | 10,600 | | | 25,000 | | | 71,238 | | | — | | | — | | | — | | | — | | | — | | | — | |
| 2008 | | | 12,000 | | | 25,000 | | | 67,817 | | | — | | | — | | | — | | | — | | | — | | | — | |
| 2007 | | | 12,000 | | | 25,000 | | | 71,748 | | | — | | | — | | | — | | | — | | | — | | | — | |
| (f) | For the seven months ended February 28, 2011. |
| (g) | The Ending and Average Market Value Per Share for each Series of the Fund’s MTP Shares were as follows: |
| | | | Series | | | Ending Market Value Per Share | | | Average Market Value Per Share | |
| Arizona Dividend Advantage (NFZ) | | | | | | | | | | |
| Year Ended 2/28–2/29: | | | | | | | | | | |
| 2012 | | | 2015 | | $ | 10.08 | | $ | 9.93 | |
| 2011(f) | | | 2015 | | | 9.63 | | | 9.83 | ^ |
| Year Ended 7/31: | | | | | | | | | | |
| 2010 | | | — | | | — | | | — | |
| 2009 | | | — | | | — | | | — | |
| 2008 | | | — | | | — | | | — | |
| 2007 | | | — | | | — | | | — | |
| ^ | For the period October 18, 2010 (first issuance date of shares) through February 28, 2011. |
| | | ARPS at the End of Period | | MTP Shares at the End of Period (g) | | ARPS and MTP Shares at the End of Period | |
| | | | Aggregate Amount Outstanding (000) | | | Liquidation Value Per Share | | | Asset Coverage Per Share | | | Aggregate Amount Outstanding (000) | | | Liquidation Value Per Share | | | Asset Coverage Per Share | | | Asset Coverage Per $1 Liquidation Preference | |
| Arizona Dividend Advantage 2 (NKR) | | | | | | | | | | | | |
| Year Ended 2/28–2/29: | | | | | | | | | | | | | | | | |
| 2012 | | $ | — | | $ | — | | $ | — | | $ | 18,725 | | $ | 10.00 | | $ | 30.05 | | $ | — | |
| 2011(f) | | | — | | | — | | | — | | | 18,725 | | | 10.00 | | | 28.08 | | | — | |
| Year Ended 7/31: | |
| 2010 | | | 16,625 | | | 25,000 | | | 78,734 | | | — | | | — | | | — | | | — | |
| 2009 | | | 16,625 | | | 25,000 | | | 74,367 | | | — | | | — | | | — | | | — | |
| 2008 | | | 18,500 | | | 25,000 | | | 70,015 | | | — | | | — | | | — | | | — | |
| 2007 | | | 18,500 | | | 25,000 | | | 73,616 | | | — | | | — | | | — | | | — | |
| | |
| Arizona Dividend Advantage 3 (NXE) | |
| Year Ended 2/28–2/29: | |
| 2012 | | | — | | | — | | | — | | | 20,846 | | | 10.00 | | | 32.02 | | | — | |
| 2011(f) | | | 18,400 | | | 25,000 | | | 52,544 | | | 19,046 | | | 10.00 | | | 21.02 | | | 2.10 | |
| Year Ended 7/31: | |
| 2010 | | | 18,400 | | | 25,000 | | | 83,805 | | | — | | | — | | | — | | | — | |
| 2009 | | | 18,400 | | | 25,000 | | | 78,164 | | | — | | | — | | | — | | | — | |
| 2008 | | | 22,000 | | | 25,000 | | | 70,546 | | | — | | | — | | | — | | | — | |
| 2007 | | | 22,000 | | | 25,000 | | | 74,490 | | | — | | | — | | | — | | | — | |
| (f) | For the seven months ended February 28, 2011. |
| (g) | The Ending and Average Market Value Per Share for each Series of the Fund’s MTP Shares were as follows: |
| | | | Series | | | Ending Market Value Per Share | | | Average Market Value Per Share | |
| Arizona Dividend Advantage 2 (NKR) | | | | | | | | | | |
| Year Ended 2/28–2/29: | | | | | | | | | | |
| 2012 | | | 2015 | | $ | 10.05 | | $ | 9.89 | |
| 2011(f) | | | 2015 | | | 9.58 | | | 9.71 | ^ |
| Year Ended 7/31: | | | | | | | | | | |
| 2010 | | | — | | | — | | | — | |
| 2009 | | | — | | | — | | | — | |
| 2008 | | | — | | | — | | | — | |
| 2007 | | | — | | | — | | | — | |
| Arizona Dividend Advantage 3 (NXE) | | | | | | | | | | |
| Year Ended 2/28–2/29: | | | | | | | | | | |
| 2012 | | | 2016 | | | 10.17 | | | 10.11 | |
| 2011(f) | | | 2016 | | | 9.97 | | | 9.96 | ^^ |
| Year Ended 7/31: | | | | | | | | | | |
| 2010 | | | — | | | — | | | — | |
| 2009 | | | — | | | — | | | — | |
| 2008 | | | — | | | — | | | — | |
| 2007 | | | — | | | — | | | — | |
| ^ | For the period October 18, 2010 (first issuance date of shares) through February 28, 2011. |
| ^^ | As of February 28, 2011 (first issuance date of shares). |
See accompanying notes to financial statements.
| | | Financial |
| | | Highlights (continued) |
| | | ARPS at the End of Period | | MTP Shares at the End of Period (g) | |
| | | | Aggregate Amount Outstanding (000) | | Liquidation Value Per Share | | Asset Coverage Per Share | | | Aggregate Amount Outstanding (000) | | Liquidation Value Per Share | | Asset Coverage Per Share | |
| Texas Quality Income (NTX) | |
| Year Ended 2/28–2/29: | | | | | | | | | | | | | | | | | | | |
| 2012 | | $ | — | | $ | — | | $ | — | | $ | 70,920 | | $ | 10.00 | | $ | 30.90 | |
| 2011(f) | | | — | | | — | | | — | | | 70,920 | | | 10.00 | | | 29.01 | |
| Year Ended 7/31: | | | | | | | | | | | | | | | | | | | |
| 2010 | | | 65,050 | | | 25,000 | | | 79,988 | | | — | | | — | | | — | |
| 2009 | | | 65,050 | | | 25,000 | | | 75,543 | | | — | | | — | | | — | |
| 2008 | | | 69,000 | | | 25,000 | | | 73,084 | | | — | | | — | | | — | |
| 2007 | | | 69,000 | | | 25,000 | | | 76,173 | | | — | | | — | | | — | |
| (f) | For the seven months ended February 28, 2011. |
| (g) | The Ending and Average Market Value Per Share for each Series of the Fund’s MTP Shares were as follows: |
| | | | Series | | | Ending Market Value Per Share | | | Average Market Value Per Share | |
| Texas Quality Income (NTX) | | | | | | | | | | |
| Year Ended 2/28–2/29: | | | | | | | | | | |
| 2012 | | | 2015 | | $ | 10.05 | | $ | 9.97 | |
| 2011(f) | | | 2015 | | | 9.85 | | | 9.86 | ^ |
| Year Ended 7/31: | | | | | | | | | | |
| 2010 | | | — | | | — | | | — | |
| 2009 | | | — | | | — | | | — | |
| 2008 | | | — | | | — | | | — | |
| 2007 | | | — | | | — | | | — | |
| ^ | For the period November 2, 2010 (first issuance date of shares) through February 28, 2011. |
See accompanying notes to financial statements.
| | | Notes to |
| | | Financial Statements |
1. General Information and Significant Accounting Policies
General Information
The funds covered in this report and their corresponding Common share stock exchange symbols are Nuveen Arizona Premium Income Municipal Fund, Inc. (NAZ), Nuveen Arizona Dividend Advantage Municipal Fund (NFZ), Nuveen Arizona Dividend Advantage Municipal Fund 2 (NKR), Nuveen Arizona Dividend Advantage Municipal Fund 3 (NXE) and Nuveen Texas Quality Income Municipal Fund (NTX) (each a “Fund” and collectively, the “Funds”). Common shares of Arizona Premium Income (NAZ) and Texas Quality Income (NTX) are traded on the New York Stock Exchange (“NYSE”) while Common shares of Arizona Dividend Advantage (NFZ), Arizona Dividend Advantage 2 (NKR) and Arizona Dividend Advantage 3 (NXE) are traded on the NYSE Amex. The Funds are registered under the Investment Company Act of 1940, as amended, as closed-end registered investment companies.
Each Fund seeks to provide current income exempt from both regular federal and designated state income taxes by investing primarily in a portfolio of municipal obligations issued by state and local government authorities within a single state or certain U.S. territories.
Significant Accounting Policies
The following is a summary of significant accounting policies followed by the Funds in the preparation of their financial statements in accordance with U.S. generally accepted accounting principles (“U.S. GAAP”).
Investment Valuation
Prices of municipal bonds are provided by a pricing service approved by the Funds’ Board of Directors/Trustees. These securities are generally classified as Level 2 for fair value measurement purposes. When price quotes are not readily available (which is usually the case for municipal bonds) the pricing service establishes a security’s fair value using methods that may include consideration of the following: yields or prices of investments of comparable quality, type of issue, coupon, maturity and rating, market quotes or indications of value from security dealers, evaluations of anticipated cash flows or collateral, general market conditions and other information and analysis, including the obligor’s credit characteristics considered relevant. In pricing certain securities, particularly less liquid and lower quality securities, the pricing service may consider information about a security, its issuer, or market activity, provided by Nuveen Fund Advisors, Inc. (the “Adviser”), a wholly-owned subsidiary of Nuveen Investments, Inc. (“Nuveen”). These securities are generally classified as Level 2 or Level 3 depending on the priority of the significant inputs.
Certain securities may not be able to be priced by the pre-established pricing methods as described above. Such securities may be valued by the Funds’ Board of Directors/Trustees or its designee at fair value. These securities generally include, but are not limited to, restricted securities (securities which may not be publicly sold without registration under the Securities Act of 1933, as amended) for which a pricing service is unable to provide a market price; securities whose trading has been formally suspended; debt securities that have gone into default and for which there is no current market quotation; a security whose market price is not available from a pre-established pricing source; a security with respect to which an event has occurred that is likely to materially affect the value of the security after the market has closed but before the calculation of a Fund’s net asset value (as may be the case in non-U.S. markets on which the security is primarily traded) or make it difficult or impossible to obtain a reliable market quotation; and a security whose price, as provided by the pricing service, is not deemed to reflect the security’s fair value. As a general principle, the fair value of a security would appear to be the amount that the owner might reasonably expect to receive for it in a current sale. A variety of factors may be considered in determining the fair value of such securities, which may include consideration of the following: yields or prices of investments of comparable quality, type of issue, coupon, maturity and rating, market quotes or indications of value from security dealers, evaluations of anticipated cash flows or collateral, general market conditions and other information and analysis, including the obligor’s credit characteristics considered relevant. These securities are generally classified as Level 2 or Level 3 depending on the priority of the significant inputs. Regardless of the method employed to value a particular security, all valuations are subject to review by the Funds’ Board of Directors/Trustees or its designee.
Refer to Footnote 2 – Fair Value Measurements for further details on the leveling of securities held by the Funds as of the end of the reporting period.
Investment Transactions
Investment transactions are recorded on a trade date basis. Realized gains and losses from transactions are determined on the specific identification method, which is the same basis used for federal income tax purposes. Investments purchased on a when-issued/delayed delivery basis may have extended settlement periods. Any investments so purchased are subject to market fluctuation during this period. The Funds have instructed the custodian to segregate assets with a current value at least equal to the amount of the when-issued/delayed delivery purchase commitments. At
| | | Notes to |
| | | Financial Statements (continued) |
February 29, 2012, Texas Quality Income (NTX) had outstanding when issued/delayed delivery purchase commitments of $3,814,155. There were no such outstanding purchase commitments in any of the other Funds.
Investment Income
Interest income, which reflects the amortization of premiums and includes accretion of discounts for financial reporting purposes, is recorded on an accrual basis. Investment income also reflects paydown gains and losses, if any.
Income Taxes
Each Fund is a separate taxpayer for federal income tax purposes. Each Fund intends to distribute substantially all of its net investment income and net capital gains to shareholders and to otherwise comply with the requirements of Subchapter M of the Internal Revenue Code applicable to regulated investment companies (“RICs”). Therefore, no federal income tax provision is required. Furthermore, each Fund intends to satisfy conditions that will enable interest from municipal securities, which is exempt from regular federal and designated state income taxes, to retain such tax-exempt status when distributed to shareholders of the Funds. Net realized capital gains and ordinary income distributions paid by the Funds are subject to federal taxation.
For all open tax years and all major taxing jurisdictions, management of the Funds has concluded that there are no significant uncertain tax positions that would require recognition in the financial statements. Open tax years are those that are open for examination by taxing authorities (i.e., generally the last four tax year ends and the interim tax period since then). Furthermore, management of the Funds is also not aware of any tax positions for which it is reasonably possible that the total amounts of unrecognized tax benefits will significantly change in the next twelve months.
Dividends and Distributions to Common Shareholders
Dividends from net investment income are declared monthly. Net realized capital gains and/or market discount from investment transactions, if any, are distributed to shareholders at least annually. Furthermore, capital gains are distributed only to the extent they exceed available capital loss carryforwards.
Distributions to Common shareholders of net investment income, net realized capital gains and/or market discount, if any, are recorded on the ex-dividend date. The amount and timing of distributions are determined in accordance with federal income tax regulations, which may differ from U.S. GAAP.
Auction Rate Preferred Shares
Each Fund is authorized to issue Auction Rate Preferred Shares (“ARPS”). As of February 28, 2011, each Fund, with the exception of Arizona Premium Income (NAZ), had redeemed all of their outstanding ARPS at liquidation value. During the fiscal year ended February 29, 2012, Arizona Premium Income (NAZ) had issued and outstanding ARPS, $25,000 stated value per share, which approximates market value, as a means of effecting financial leverage. The Fund’s ARPS were issued in one Series. The dividend rate paid by the Fund was determined every seven days, pursuant to a dutch auction process overseen by the auction agent, and was payable at the end of the rate period.
Beginning in February 2008, more shares for sale were submitted in the regularly scheduled auctions for the ARPS issued by the Funds than there were offers to buy. This meant that these auctions “failed to clear,’’ and that many Auction Rate Preferred shareholders who wanted to sell their shares in these auctions were unable to do so. Auction Rate Preferred shareholders unable to sell their shares received distributions at the “maximum rate’’ applicable to failed auctions as calculated in accordance with the pre-established terms of the ARPS. As of February 29, 2012, Arizona Premium Income (NAZ) redeemed all of its outstanding ARPS, at liquidation value, as follows:
| | | Arizona Premium Income (NAZ | ) |
| ARPS redeemed, at liquidation value | | $ | 30,000,000 | |
During the seven months ended February 28, 2011, lawsuits pursuing claims made in a demand letter alleging that Arizona Dividend Advantage 3’s (NXE) Board of Trustees breached its fiduciary duties related to the redemption at par of the Fund’s ARPS had been filed on behalf of shareholders of the Fund, against the Adviser, the Nuveen holding company, the majority owner of the holding company, the lone interested trustee, and current and former officers of the Fund. Nuveen and other named defendants filed a motion to dismiss the lawsuits and on December 16, 2011, the court granted that motion dismissing the lawsuits. The plaintiffs failed to file an appeal of the court’s decision within the required time period, resulting in the final disposition of the suit.
MuniFund Term Preferred Shares
The following Funds have issued and outstanding MuniFund Term Preferred (“MTP”) Shares, with a $10 stated (“par”) value per share. Proceeds from the issuance of MTP Shares, net of offering expenses, were used to redeem all, or a portion of, each Fund’s outstanding ARPS. Each Fund’s MTP Shares are issued in one Series. Dividends on MTP shares, which are recognized as interest expense for financial reporting purposes, are paid monthly
at a fixed annual rate, subject to adjustments in certain circumstances. The MTP Shares trade on the NYSE. As of February 29, 2012, the number of MTP Shares outstanding, annual interest rate and NYSE “ticker” symbol for each Fund’s series of MTP Shares are as follows:
| | | Arizona Dividend Advantage (NFZ) | | Arizona Dividend Advantage 2 (NKR) | |
| | | Shares Outstanding | | Annual Interest Rate | | NYSE Ticker | | Shares Outstanding | | Annual Interest Rate | | NYSE Ticker | |
| Series 2015 | | | 1,110,000 | | | 2.05 | % | | NFZ Pr C | | | 1,872,500 | | | 2.05 | % | | NKR Pr C | |
| | | Arizona Dividend Advantage 3 (NXE) | |
| | | Shares Outstanding | | Annual Interest Rate | | NYSE Ticker | |
| Series 2016 | | | 2,084,600 | | | 2.90 | % | | NXE Pr C | |
| | | Texas Quality Income (NTX) | |
| | | Shares Outstanding | | Annual Interest Rate | | NYSE Ticker | |
| Series 2015 | | | 7,092,000 | | | 2.30 | % | | NTX Pr C | |
Each Fund is obligated to redeem its MTP Shares by the date as specified in its offering document (“Term Redemption Date”), unless earlier redeemed or repurchased by the Fund. MTP Shares are subject to optional and mandatory redemption in certain circumstances. MTP Shares will be subject to redemption at the option of each Fund (“Optional Redemption Date”), subject to a payment of premium for one year following the Optional Redemption Date (“Premium Expiration Date”), and at par thereafter. MTP Shares also will be subject to redemption, at the option of each Fund, at par in the event of certain changes in the credit rating of the MTP Shares. Each Fund may be obligated to redeem certain of the MTP Shares if the Fund fails to maintain certain asset coverage and leverage ratio requirements and such failures are not cured by the applicable cure date. The redemption price per share is equal to the sum of the liquidation value per share plus any accumulated but unpaid dividends. The Term Redemption Date, Optional Redemption Date and Premium Expiration Date for each Fund’s series of MTP Shares are as follows.
| | | Arizona Dividend Advantage (NFZ) Series 2015 | | Arizona Dividend Advantage 2 (NKR) Series 2015 | | Arizona Dividend Advantage 3 (NXE) Series 2016 | | Texas Quality Income (NTX) Series 2015 | |
| Term Redemption Date | | | November 1, 2015 | | | November 1, 2015 | | | March 1, 2016 | | | December 1, 2015 | |
| Optional Redemption Date | | | November 1, 2011 | | | November 1, 2011 | | | March 1, 2012 | | | December 1, 2011 | |
| Premium Expiration Date | | | October 31, 2012 | | | October 31, 2012 | | | February 28, 2013 | | | November 30, 2012 | |
The average liquidation value of all MTP Shares outstanding for each Fund during the fiscal year ended February 29, 2012, was as follows:
| | | Arizona Dividend Advantage (NFZ) | | Arizona Dividend Advantage 2 (NKR) | | Arizona Dividend Advantage 3 (NXE) | | Texas Quality Income (NTX) | |
| Average liquidation value of MTP Shares outstanding | | $ | 11,100,000 | | $ | 18,725,000 | | $ | 20,806,614 | | $ | 70,920,000 | |
For financial reporting purposes only, the liquidation value of MTP Shares is recorded as a liability on the Statement of Assets and Liabilities. Unpaid dividends on MTP Shares are recognized as a component of “Interest payable” on the Statement of Assets and Liabilities. Dividends paid on MTP Shares are recognized as a component of “Interest expense and amortization of offering costs” on the Statement of Operations.
Variable Rate MuniFund Term Preferred Shares
Arizona Premium Income (NAZ) has issued and outstanding Variable Rate MuniFund Term Preferred (“VMTP”) Shares, with a $100,000 liquidation value per share. The Fund issued its VMTP Shares in a privately negotiated offering during July 2011. Proceeds from the issuance of VMTP Shares, net of offering expenses, were used to redeem the Fund’s outstanding ARPS. The Fund’s VMTP Shares were offered to qualified institutional buyers pursuant to Rule 144A under the Securities Act of 1933. As of February 29, 2012, the number of VMTP Shares outstanding, at liquidation value, for the Fund are as follows:
| | | Arizona Premium Income (NAZ) | |
| Series 2014 | | $ | 28,000,000 | |
| | | Notes to |
| | | Financial Statements (continued) |
The Fund is obligated to redeem its VMTP Shares by the date as specified in its offering document (“Term Redemption Date”), unless earlier redeemed or repurchased by the Fund. VMTP Shares are subject to optional and mandatory redemption in certain circumstances. The VMTP Shares are subject to redemption at the option of each Fund (“Optional Redemption Date”), subject to payment of premium for one year following the Optional Redemption Date (“Premium Expiration Date”), and at par thereafter. The Fund may be obligated to redeem certain of the VMTP Shares if the Fund fails to maintain certain asset coverage and leverage ratio requirements and such failures are not cured by the applicable cure date. The redemption price per share is equal to the sum of the liquidation value per share plus any accumulated but unpaid dividends. The Term Redemption Date, Optional Redemption Date and Premium Expiration Date for the Fund’s VMTP Shares are as follows:
| | | Arizona Premium Income (NAZ) | |
| Term Redemption Date | | | August 1, 2014 | |
| Optional Redemption Date | | | August 1, 2012 | |
| Premium Expiration Date | | | July 31, 2012 | |
The average liquidation value of VMTP Shares outstanding and annualized dividend rate of VMTP Shares for the Fund during the fiscal year ended February 29, 2012, were as follows:
| | | Arizona Premium Income (NAZ) | * |
| Average liquidation value of VMTP Shares outstanding | | $ | 28,000,000 | |
| Annualized dividend rate | | | 1.19 | % |
* For the period July 28, 2011 (issuance date of shares) through February 29, 2012.
Dividends on VMTP shares (which are treated as interest payments for financial reporting purposes) are set weekly.
For financial reporting purposes only, the liquidation value of VMTP Shares is recognized as a liability on the Statement of Assets and Liabilities. Unpaid dividends on VMTP Shares are recognized as a component of “Interest payable” on the Statement of Assets and Liabilities, when applicable. Dividends paid on VMTP Shares are recognized as a component of “Interest expense and amortization of offering costs” on the Statement of Operations.
Inverse Floating Rate Securities
Each Fund is authorized to invest in inverse floating rate securities. An inverse floating rate security is created by depositing a municipal bond, typically with a fixed interest rate, into a special purpose trust created by a broker-dealer. In turn, this trust (a) issues floating rate certificates, in face amounts equal to some fraction of the deposited bond’s par amount or market value, that typically pay short-term tax-exempt interest rates to third parties, and (b) issues to a long-term investor (such as one of the Funds) an inverse floating rate certificate (sometimes referred to as an “inverse floater”) that represents all remaining or residual interest in the trust. The income received by the inverse floater holder varies inversely with the short-term rate paid to the floating rate certificates’ holders, and in most circumstances the inverse floater holder bears substantially all of the underlying bond’s downside investment risk and also benefits disproportionately from any potential appreciation of the underlying bond’s value. The price of an inverse floating rate security will be more volatile than that of the underlying bond because the interest rate is dependent on not only the fixed coupon rate of the underlying bond but also on the short-term interest paid on the floating rate certificates, and because the inverse floating rate security essentially bears the risk of loss of the greater face value of the underlying bond.
A Fund may purchase an inverse floating rate security in a secondary market transaction without first owning the underlying bond (referred to as an “externally-deposited inverse floater”), or instead by first selling a fixed-rate bond to a broker-dealer for deposit into the special purpose trust and receiving in turn the residual interest in the trust (referred to as a “self-deposited inverse floater”). The inverse floater held by a Fund gives the Fund the right (a) to cause the holders of the floating rate certificates to tender their notes at par, and (b) to have the broker transfer the fixed-rate bond held by the trust to the Fund, thereby collapsing the trust. An investment in an externally-deposited inverse floater is identified in the Portfolio of Investments as “(IF) – Inverse floating rate investment.” An investment in a self-deposited inverse floater is accounted for as a financing transaction. In such instances, a fixed-rate bond deposited into a special purpose trust is identified in the Portfolio of Investments as “(UB) – Underlying bond of an inverse floating rate trust reflected as a financing transaction,” with the Fund accounting for the short-term floating rate certificates issued by the trust as “Floating rate obligations” on the Statement of Assets and Liabilities. In addition, the Fund reflects in “Investment Income” the entire earnings of the underlying bond and related interest paid to the holders of the short-term floating rate certificates as a component of “Interest expense and amortization of offering costs” on the Statement of Operations.
During the fiscal year ended February 29, 2012, each Fund invested in externally-deposited inverse floaters and/or self-deposited inverse floaters.
Each Fund may also enter into shortfall and forbearance agreements (sometimes referred to as a “recourse trust” or “credit recovery swap”) (such agreements referred to herein as “Recourse Trusts”) with a broker-dealer by which a Fund agrees to reimburse the broker-dealer, in certain
circumstances, for the difference between the liquidation value of the fixed-rate bond held by the trust and the liquidation value of the floating rate certificates issued by the trust plus any shortfalls in interest cash flows. Under these agreements, a Fund’s potential exposure to losses related to or on inverse floaters may increase beyond the value of a Fund’s inverse floater investments as a Fund may potentially be liable to fulfill all amounts owed to holders of the floating rate certificates. At period end, any such shortfall is recognized as “Unrealized depreciation on Recourse Trusts” on the Statement of Assets and Liabilities.
At February 29, 2012, each Fund’s maximum exposure to externally-deposited Recourse Trusts was as follows:
| | | Arizona Premium Income (NAZ) | | Arizona Dividend Advantage (NFZ) | | Arizona Dividend Advantage 2 (NKR) | | Arizona Dividend Advantage 3 (NXE) | | Texas Quality Income (NTX) | |
| Maximum exposure to Recourse Trusts | | $ | 2,145,000 | | $ | 1,680,000 | | $ | 1,350,000 | | $ | 2,325,000 | | $ | — | |
The average floating rate obligations outstanding and average annual interest rate and fees related to self-deposited inverse floaters during the fiscal year ended February 29, 2012, were as follows:
| | | Texas Quality Income (NTX) | |
| Average floating rate obligations outstanding | | $ | 3,960,000 | |
| Average annual interest rate and fees | | | 0.39 | % |
Derivative Financial Instruments
Each Fund is authorized to invest in certain derivative instruments, including foreign currency forwards, futures, options and swap contracts. Although the Funds are authorized to invest in such derivative instruments, and may do so in the future, they did not make any such investments during the fiscal year ended February 29, 2012.
Market and Counterparty Credit Risk
In the normal course of business each Fund may invest in financial instruments and enter into financial transactions where risk of potential loss exists due to changes in the market (market risk) or failure of the other party to the transaction to perform (counterparty credit risk). The potential loss could exceed the value of the financial assets recorded on the financial statements. Financial assets, which potentially expose each Fund to counterparty credit risk, consist principally of cash due from counterparties on forward, option and swap transactions, when applicable. The extent of each Fund’s exposure to counterparty credit risk in respect to these financial assets approximates their carrying value as recorded on the Statement of Assets and Liabilities. Futures contracts, when applicable, expose a Fund to minimal counterparty credit risk as they are exchange traded and the exchange’s clearinghouse, which is counterparty to all exchange traded futures, guarantees the futures contracts against default.
Each Fund helps manage counterparty credit risk by entering into agreements only with counterparties the Adviser believes have the financial resources to honor their obligations and by having the Adviser monitor the financial stability of the counterparties. Additionally, counterparties may be required to pledge collateral daily (based on the daily valuation of the financial asset) on behalf of each Fund with a value approximately equal to the amount of any unrealized gain above a pre-determined threshold. Reciprocally, when each Fund has an unrealized loss, the Funds have instructed the custodian to pledge assets of the Funds as collateral with a value approximately equal to the amount of the unrealized loss above a pre-determined threshold. Collateral pledges are monitored and subsequently adjusted if and when the valuations fluctuate, either up or down, by at least the pre-determined threshold amount.
Zero Coupon Securities
Each Fund is authorized to invest in zero coupon securities. A zero coupon security does not pay a regular interest coupon to its holders during the life of the security. Tax-exempt income to the holder of the security comes from accretion of the difference between the original purchase price of the security at issuance and the par value of the security at maturity and is effectively paid at maturity. The market prices of zero coupon securities generally are more volatile than the market prices of securities that pay interest periodically.
Offering Costs
Costs incurred by the Funds in connection with their offerings of MTP Shares or VMTP Shares were recorded as a deferred charge, which will be amortized over the life of the shares. Each Fund’s amortized deferred charges are recognized as a component of “Interest expense and amortization of offering costs” on the Statement of Operations. Each Fund’s total offering costs incurred were as follows:
| | | Arizona Dividend Advantage (NFZ) | | Arizona Dividend Advantage 2 (NKR) | | Arizona Dividend Advantage 3 (NXE) | | Texas Quality Income (NTX) | |
| MTP Shares offering costs | | $ | 491,500 | | $ | 588,375 | | $ | 672,690 | | $ | 1,366,300 | |
| | | Notes to |
| | | Financial Statements (continued) |
| | | Arizona Premium Income (NAZ) | |
| VMTP Shares offering costs | | $ | 100,000 | |
Custodian Fee Credit
Each Fund has an arrangement with the custodian bank whereby certain custodian fees and expenses are reduced by net credits earned on each Fund’s cash on deposit with the bank. Such deposit arrangements are an alternative to overnight investments. Credits for cash balances may be offset by charges for any days on which a Fund overdraws its account at the custodian bank.
Indemnifications
Under the Funds’ organizational documents, their officers and directors/trustees are indemnified against certain liabilities arising out of the performance of their duties to the Funds. In addition, in the normal course of business, the Funds enter into contracts that provide general indemnifications to other parties. The Funds’ maximum exposure under these arrangements is unknown as this would involve future claims that may be made against the Funds that have not yet occurred. However, the Funds have not had prior claims or losses pursuant to these contracts and expect the risk of loss to be remote.
Use of Estimates
The preparation of financial statements in conformity with U.S. GAAP requires management to make estimates and assumptions that affect the reported amounts of assets and liabilities at the date of the financial statements and the reported amounts of increases and decreases in net assets applicable to Common shares from operations during the reporting period. Actual results may differ from those estimates.
2. Fair Value Measurements
Fair value is defined as the price that the Funds would receive upon selling an investment or transferring a liability in an orderly transaction to an independent buyer in the principal or most advantageous market for the investment. A three-tier hierarchy is used to maximize the use of observable market data and minimize the use of unobservable inputs and to establish classification of fair value measurements for disclosure purposes. Observable inputs reflect the assumptions market participants would use in pricing the asset or liability. Observable inputs are based on market data obtained from sources independent of the reporting entity. Unobservable inputs reflect the reporting entity’s own assumptions about the assumptions market participants would use in pricing the asset or liability. Unobservable inputs are based on the best information available in the circumstances.
The three-tier hierarchy of inputs is summarized in the three broad levels listed below:
| | Level 1 – | Quoted prices in active markets for identical securities. |
| | Level 2 – | Other significant observable inputs (including quoted prices for similar securities, interest rates, prepayment speeds, credit risk, etc.). |
| | Level 3 – | Significant unobservable inputs (including management’s assumptions in determining the fair value of investments). |
The inputs or methodologies used for valuing securities are not an indication of the risk associated with investing in those securities. The following is a summary of each Fund’s fair value measurements as of February 29, 2012:
| | | | | | | | | | | | | | |
| Arizona Premium Income (NAZ) | | | Level 1 | | | Level 2 | | | Level 3 | | | Total | |
| | | | | | | | | | | | | | |
| Investments: | | | | | | | | | | | | | |
| Municipal Bonds | | $ | — | | $ | 91,373,875 | | $ | 1,959,607 | | $ | 93,333,482 | |
| | | | | | | | | | | | | | |
| Arizona Dividend Advantage (NFZ) | | | Level 1 | | | Level 2 | | | Level 3 | | | Total | |
| | | | | | | | | | | | | | |
| Investments: | | | | | | | | | | | | | |
| Municipal Bonds | | $ | — | | $ | 33,663,094 | | $ | 219,476 | | $ | 33,882,570 | |
| | | | | | | | | | | | | | |
| Arizona Dividend Advantage 2 (NKR) | | | Level 1 | | | Level 2 | | | Level 3 | | | Total | |
| | | | | | | | | | | | | | |
| Investments: | | | | | | | | | | | | | |
| Municipal Bonds | | $ | — | | $ | 54,571,249 | | $ | 885,742 | | $ | 55,456,991 | |
| | | | | | | | | | | | | | |
| Arizona Dividend Advantage 3 (NXE) | | | Level 1 | | | Level 2 | | | Level 3 | | | Total | |
| | | | | | | | | | | | | | |
| Investments: | | | | | | | | | | | | | |
| Municipal Bonds | | $ | — | | $ | 65,206,695 | | $ | 540,851 | | $ | 65,747,546 | |
| | | | | | | | | | | | | | |
| Texas Quality Income (NTX) | | | Level 1 | | | Level 2 | | | Level 3 | | | Total | |
| | | | | | | | | | | | | | |
| Investments: | | | | | | | | | | | | | |
| Municipal Bonds | | $ | — | | $ | 218,408,366 | | $ | — | | $ | 218,408,366 | |
The following is a reconciliation of each Fund’s Level 3 investments held at the beginning and end of the measurement period:
| | | Arizona Premium Income (NAZ) Level 3 Municipal Bonds | | Arizona Dividend Advantage (NFZ) Level 3 Municipal Bonds | | Arizona Dividend Advantage 2 (NKR) Level 3 Municipal Bonds | | Arizona Dividend Advantage 3 (NXE) Level 3 Municipal Bonds | |
| Balance at the beginning of year | | $ | 1,867,750 | | $ | 209,188 | | $ | 844,223 | | $ | 515,499 | |
| Gains (losses): | | | | | | | | | | | | | |
| Net realized gains (losses) | | | — | | | — | | | — | | | — | |
| Net change in unrealized appreciation (depreciation) | | | 91,857 | | | 10,288 | | | 41,519 | | | 25,352 | |
| Purchases at cost | | | — | | | — | | | — | | | — | |
| Sales at proceeds | | | — | | | — | | | — | | | — | |
| Net discounts (premiums) | | | — | | | — | | | — | | | — | |
| Transfers in to | | | — | | | — | | | — | | | — | |
| Transfers out of | | | — | | | — | | | — | | | — | |
| Balance at the end of year | | $ | 1,959,607 | | $ | 219,476 | | $ | 885,742 | | $ | 540,851 | |
| Change in net unrealized appreciation (depreciation) during the period of | | | | | | | | | | | | | |
| Level 3 securities held as of February 29, 2012 | | $ | 91,857 | | $ | 10,288 | | $ | 41,519 | | $ | 25,352 | |
During the fiscal year ended February 29, 2012, the Funds recognized no significant transfers to or from Level 1, Level 2 or Level 3.
3. Derivative Instruments and Hedging Activities
The Funds record derivative instruments at fair value, with changes in fair value recognized on the Statement of Operations, when applicable. Even though the Funds’ investments in derivatives may represent economic hedges, they are not considered to be hedge transactions for financial reporting purposes. The Funds did not invest in derivative instruments during the fiscal year ended February 29, 2012.
4. Fund Shares
Common Shares
Transactions in Common shares were as follows:
| | | Arizona Premium Income (NAZ) | | Arizona Dividend Advantage (NFZ) | |
| | | Year Ended 2/29/12 | | Seven Months Ended 2/28/11 | | Year Ended 7/31/10 | | Year Ended 2/29/12 | | Seven Months Ended 2/28/11 | | Year Ended 7/31/10 | |
| Common shares issued to shareholders due to reinvestment of distributions | | | — | | | 743 | | | 798 | | | — | | | 292 | | | — | |
| | | Arizona Dividend Advantage 2 (NKR) | | Arizona Dividend Advantage 3 (NXE) | |
| | | Year Ended 2/29/12 | | Seven Months Ended 2/28/11 | | Year Ended 7/31/10 | | Year Ended 2/29/12 | | Seven Months Ended 2/28/11 | | Year Ended 7/31/10 | |
| Common shares issued to shareholders due to reinvestment of distributions | | | — | | | — | | | — | | | — | | | — | | | — | |
| | | Texas Quality Income (NTX) | |
| | | Year Ended 2/29/12 | | Seven Months Ended 2/28/11 | | Year Ended 7/31/10 | |
| Common shares issued to shareholders due to reinvestment of distributions | | | 36,629 | | | 20,941 | | | 29,688 | |
| | | Notes to |
| | | Financial Statements (continued) |
Preferred Shares
Transactions in ARPS were as follows:
| | | Arizona Premium Income (NAZ) | |
| | | Year Ended 2/29/12 | | Seven Months Ended 2/28/11 | | Year Ended 7/31/10 | |
| | | Shares | | Amount | | Shares | | Amount | | Shares | | Amount | |
| ARPS redeemed and/or noticed for redemption: | | | | | | | | | | | | | | | | | | | |
| Series TH | | | 1,115 | | $ | 27,875,000 | | | — | | $ | — | | | — | | $ | — | |
| | | Arizona Dividend Advantage (NFZ) | |
| | | Year Ended 2/29/12 | | Seven Months Ended 2/28/11 | | Year Ended 7/31/10 | |
| | | Shares | | Amount | | Shares | | Amount | | Shares | | Amount | |
| ARPS redeemed and/or noticed for redemption: | | | | | | | | | | | | | | | | | | | |
| Series T | | | N/A | | | N/A | | | 424 | | $ | 10,600,000 | | | — | | $ | — | |
| | | Arizona Dividend Advantage 2 (NKR) | |
| | | Year Ended 2/29/12 | | Seven Months Ended 2/28/11 | | Year Ended 7/31/10 | |
| | | Shares | | Amount | | Shares | | Amount | | Shares | | Amount | |
| ARPS redeemed and/or noticed for redemption: | | | | | | | | | | | | | | | | | | | |
| Series W | | | N/A | | | N/A | | | 665 | | $ | 16,625,000 | | | — | | $ | — | |
| | | Arizona Dividend Advantage 3 (NXE) | |
| | | Year Ended 2/29/12 | | Seven Months Ended 2/28/11 | | Year Ended 7/31/10 | |
| | | Shares | | Amount | | Shares | | Amount | | Shares | | Amount | |
| ARPS redeemed and/or noticed for redemption: | | | | | | | | | | | | | | | | | | | |
| Series M | | | N/A | | | N/A | | | 736 | | $ | 18,400,000 | | | — | | $ | — | |
| | | Texas Quality Income (NTX) | |
| | | Year Ended 2/29/12 | | Seven Months Ended 2/28/11 | | Year Ended 7/31/10 | |
| | | Shares | | Amount | | Shares | | Amount | | Shares | | Amount | |
| ARPS redeemed and/or noticed for redemption: | | | | | | | | | | | | | | | | | | | |
| Series M | | | N/A | | | N/A | | | 716 | | $ | 17,900,000 | | | — | | $ | — | |
| Series TH | | | N/A | | | N/A | | | 1,886 | | | 47,150,000 | | | — | | | — | |
| Total | | | N/A | | | N/A | | | 2,602 | | $ | 65,050,000 | | | — | | $ | — | |
N/A – As of February 28, 2011, the Fund redeemed all of its outstanding ARPS at liquidation value.
Transactions in MTP shares were as follows:
| | | Arizona Dividend Advantage (NFZ) | |
| | | Year Ended 2/29/12 | | Seven Months Ended 2/28/11 | | Year Ended 7/31/10 | |
| | | Shares | | Amount | | Shares | | Amount | | Shares | | Amount | |
| MTP Shares issued: | | | | | | | | | | | | | | | | | | | |
| Series 2015 | | | — | | $ | — | | | 1,110,000 | | $ | 11,100,000 | | | — | | $ | — | |
| | | Arizona Dividend Advantage 2 (NKR) | |
| | | Year Ended 2/29/12 | | Seven Months Ended 2/28/11 | | Year Ended 7/31/10 | |
| | | Shares | | Amount | | Shares | | Amount | | Shares | | Amount | |
| MTP Shares issued: | | | | | | | | | | | | | | | | | | | |
| Series 2015 | | | — | | $ | — | | | 1,872,500 | | $ | 18,725,000 | | | — | | $ | — | |
| | | Arizona Dividend Advantage 3 (NXE) | |
| | | Year Ended 2/29/12 | | Seven Months Ended 2/28/11 | | Year Ended 7/31/10 | |
| | | Shares | | Amount | | Shares | | Amount | | Shares | | Amount | |
| MTP Shares issued: | | | | | | | | | | | | | | | | | | | |
| Series 2016 | | | 180,000 | | $ | 1,800,000 | | | 1,904,600 | | $ | 19,046,000 | | | — | | $ | — | |
| | | Texas Quality Income (NTX) | |
| | | Year Ended 2/29/12 | | Seven Months Ended 2/28/11 | | Year Ended 7/31/10 | |
| | | Shares | | Amount | | Shares | | Amount | | Shares | | Amount | |
| MTP Shares issued: | | | | | | | | | | | | | | | | | | | |
| Series 2015 | | | — | | $ | — | | | 7,092,000 | | $ | 70,920,000 | | | — | | $ | — | |
Transactions in VMTP Shares were as follows:
| | | Arizona Premium Income (NAZ) | |
| | | Year Ended 2/29/12 | | Seven Months Ended 2/28/11 | | Year Ended 7/31/10 | |
| | | Shares | | Amount | | Shares | | Amount | | Shares | | Amount | |
| VMTP Shares issued: | | | | | | | | | | | | | | | | | | | |
| Series 2014 | | | 280 | | $ | 28,000,000 | | | — | | $ | — | | | — | | $ | — | |
5. Investment Transactions
Purchases and sales (including maturities but excluding short-term investments, where applicable) during the fiscal year ended February 29, 2012, were as follows:
| | | Arizona Premium Income (NAZ) | | Arizona Dividend Advantage (NFZ) | | Arizona Dividend Advantage 2 (NKR) | | Arizona Dividend Advantage 3 (NXE) | | Texas Quality Income (NTX) | |
| Purchases | | $ | 7,003,987 | | $ | 2,557,441 | | $ | 8,471,522 | | $ | 11,041,834 | | $ | 18,705,962 | |
| Sales and maturities | | | 6,120,847 | | | 2,445,295 | | | 8,633,476 | | | 8,985,143 | | | 19,424,077 | |
6. Income Tax Information
The following information is presented on an income tax basis. Differences between amounts for financial statement and federal income tax purposes are primarily due to timing differences in recognizing taxable market discount, timing differences in recognizing certain gains and losses on investment transactions and the treatment of investments in inverse floating rate securities reflected as financing transactions, if any. To the extent that differences arise that are permanent in nature, such amounts are reclassified within the capital accounts as detailed below. Temporary differences do not require reclassification. Temporary and permanent differences do not impact the net asset values of the Funds.
| | | Notes to |
| | | Financial Statements (continued) |
At February 29, 2012, the cost and unrealized appreciation (depreciation) of investments, as determined on a federal income tax basis, were as follows:
| | | Arizona Premium Income (NAZ) | | Arizona Dividend Advantage (NFZ) | | Arizona Dividend Advantage 2 (NKR) | | Arizona Dividend Advantage 3 (NXE) | | Texas Quality Income (NTX) | |
| Cost of investments | | $ | 87,702,220 | | $ | 31,840,650 | | $ | 52,337,032 | | $ | 62,352,626 | | $ | 201,265,145 | |
| Gross unrealized: | | | | | | | | | | | | | | | | |
| Appreciation | | $ | 8,620,645 | | $ | 2,485,115 | | $ | 3,857,685 | | $ | 3,996,291 | | $ | 16,687,326 | |
| Depreciation | | | (2,989,383 | ) | | (443,195 | ) | | (737,726 | ) | | (601,371 | ) | | (3,504,112 | ) |
| Net unrealized appreciation (depreciation) of investments | | $ | 5,631,262 | | $ | 2,041,920 | | $ | 3,119,959 | | $ | 3,394,920 | | $ | 13,183,214 | |
Permanent differences, primarily due to expiration of capital loss carryforwards, federal taxes paid, taxable market discount, nondeductible offering costs and distribution character reclassifications, resulted in reclassifications among the Funds’ components of Common share net assets at February 29, 2012, the Funds’ tax year end, as follows:
| | | Arizona Premium Income (NAZ) | | Arizona Dividend Advantage (NFZ) | | Arizona Dividend Advantage 2 (NKR) | | Arizona Dividend Advantage 3 (NXE) | | Texas Quality Income (NTX) | |
| Paid-in surplus | | $ | (1,463,538 | ) | $ | (96,700 | ) | $ | (120,807 | ) | $ | (133,481 | ) | $ | (256,188 | ) |
| Undistributed (Over-distribution of) net investment income | | | 19,513 | | | 96,700 | | | 119,157 | | | 131,166 | | | 263,630 | |
| Accumulated net realized gain (loss) | | | 1,444,025 | | | — | | | 1,650 | | | 2,315 | | | (7,442 | ) |
The tax components of undistributed net tax-exempt income, net ordinary income and net long-term capital gains at February 29, 2012, the Funds’ tax year end, were as follows:
| | | Arizona Premium Income (NAZ) | | Arizona Dividend Advantage (NFZ) | | Arizona Dividend Advantage 2 (NKR) | | Arizona Dividend Advantage 3 (NXE) | | Texas Quality Income (NTX) | |
| Undistributed net tax-exempt income * | | $ | 1,409,529 | | $ | 279,569 | | $ | 478,398 | | $ | 564,544 | | $ | 1,813,987 | |
| Undistributed net ordinary income ** | | | — | | | 686 | | | — | | | — | | | 24,171 | |
| Undistributed net long-term capital gains | | | — | | | — | | | — | | | — | | | — | |
| * | Undistributed net tax-exempt income (on a tax basis) has not been reduced for the dividend declared on February 1, 2012, paid on March 1, 2012. |
| ** | Net ordinary income consists of taxable market discount income and net short-term capital gains, if any. |
The tax character of distributions paid during the Funds’ tax year ended February 29, 2012, seven months ended February 28, 2011, and the tax year ended July 31, 2010, was designated for purposes of the dividends paid deduction as follows:
| Year ended February 29, 2012 | | Arizona Premium Income (NAZ) | | Arizona Dividend Advantage (NFZ) | | Arizona Dividend Advantage 2 (NKR) | | Arizona Dividend Advantage 3 (NXE) | | Texas Quality Income (NTX) | |
| Distributions from net tax-exempt income*** | | $ | 3,597,007 | | $ | 1,425,938 | | $ | 2,345,251 | | $ | 2,882,011 | | $ | 9,840,206 | |
| Distributions from net ordinary income** | | | — | | | — | | | — | | | — | | | 351 | |
| Distributions from net long-term capital gains**** | | | — | | | — | | | — | | | — | | | 247,718 | |
| Seven months ended February 28, 2011 | | Arizona Premium Income (NAZ) | | Arizona Dividend Advantage (NFZ) | | Arizona Dividend Advantage 2 (NKR) | | Arizona Dividend Advantage 3 (NXE) | | Texas Quality Income (NTX) | |
| Distributions from net tax-exempt income | | $ | 2,023,334 | | $ | 776,662 | | $ | 1,271,647 | | $ | 1,396,904 | | $ | 5,262,746 | |
| Distributions from net ordinary income** | | | — | | | — | | | — | | | — | | | 3 | |
| Distributions from net long-term capital gains | | | — | | | — | | | — | | | — | | | 64,372 | |
| Year ended July 31, 2010 | | Arizona Premium Income (NAZ) | | Arizona Dividend Advantage (NFZ) | | Arizona Dividend Advantage 2 (NKR) | | Arizona Dividend Advantage 3 (NXE) | | Texas Quality Income (NTX) | |
| Distributions from net tax-exempt income | | $ | 3,223,648 | | $ | 1,096,403 | | $ | 1,905,599 | | $ | 2,287,520 | | $ | 7,910,812 | |
| Distributions from net ordinary income** | | | — | | | — | | | — | | | — | | | — | |
| Distributions from net long-term capital gains | | | — | | | — | | | — | | | — | | | 134,057 | |
| ** | Net ordinary income consists of taxable market discount income and net short-term capital gains, if any. |
| *** | The Funds hereby designate these amounts paid during the fiscal year ended February 29, 2012, as Exempt Interest Dividends. |
| **** | The Funds designate as long term capital gain dividend, pursuant to the Internal Revenue Code Section 852(b)(3), the amount necessary to reduce earnings and profits of the Funds related to net capital gain to zero for the tax year ended February 29, 2012. |
At February 29, 2012, the Funds’ tax year end, the following Funds had unused capital loss carryforwards available for federal income tax purposes to be applied against future capital gains, if any. If not applied, the carryforwards will expire as follows:
| | | Arizona Premium Income (NAZ) | | Arizona Dividend Advantage (NFZ) | | Arizona Dividend Advantage 2 (NKR) | | Arizona Dividend Advantage 3 (NXE) | |
| Expiration: | | | | | | | | | | | | | |
| February 28, 2014 | | $ | — | | $ | — | | $ | — | | $ | 208,948 | |
| February 29, 2016 | | | 562,384 | | | 122,620 | | | — | | | 363,937 | |
| February 28, 2017 | | | 323,876 | | | 210,308 | | | 68,614 | | | 258,905 | |
| February 28, 2018 | | | 43,720 | | | 318,004 | | | 223,857 | | | 108,356 | |
| Total | | $ | 929,980 | | $ | 650,932 | | $ | 292,471 | | $ | 940,146 | |
During the Funds’ tax year ended February 29, 2012, the following Funds utilized capital loss carryforwards as follows:
| | | Arizona Premium Income (NAZ) | | Arizona Dividend Advantage (NFZ) | | Arizona Dividend Advantage 2 (NKR) | | Arizona Dividend Advantage 3 (NXE) | |
| Utilized capital loss carryforwards | | $ | 109,799 | | $ | 53,319 | | $ | 308,747 | | $ | 138,567 | |
At February 29, 2012, the Funds’ tax year end, $1,443,828 of Arizona Premium Income’s (NAZ) capital loss carryforward expired.
On December 22, 2010, the Regulated Investment Company Modernization Act of 2010 (the “Act”) was enacted, which changed various technical rules governing the tax treatment of RICs. The changes are generally effective for taxable years beginning after the date of enactment. One of the more prominent changes addresses capital loss carryforwards. Under the Act, each Fund will be permitted to carry forward capital losses incurred in taxable years beginning after the date of enactment for an unlimited period. However, any losses incurred during those future taxable years will be required to be utilized prior to the losses incurred in pre-enactment taxable years, which carry an expiration date. As a result of this ordering rule, pre-enactment capital loss carryforwards may be more likely to expire unused. Additionally, post-enactment capital loss carryforwards will retain their character as either short-term or long-term capital losses rather than being considered all short-term as permitted under previous regulation.
The Act also contains several provisions aimed at preserving the character of distributions made by a fiscal year RIC during the portion of its taxable year ending after October 31 or December 31, reducing the circumstances under which a RIC might be required to file amended Forms 1099 to restate previously reported distributions.
During the Funds’ tax year ended February 29, 2012, there were no post-enactment capital losses generated.
The Funds have elected to defer losses incurred from November 1, 2011 through February 29, 2012, the Funds’ tax year end, in accordance with federal income tax rules. These losses are treated as having arisen on the first day of the following fiscal year. The following Fund has elected to defer losses as follows:
| | | Texas Quality Income (NTX) | |
| Post-October capital losses | | $ | 1,722,730 | |
| Late-year ordinary losses | | | — | |
| | | Notes to |
| | | Financial Statements (continued) |
7. Management Fees and Other Transactions with Affiliates
Each Fund’s management fee consists of two components – a fund-level fee, based only on the amount of assets within the Fund, and a complex-level fee, based on the aggregate amount of all eligible fund assets managed by the Adviser. This pricing structure enables Fund shareholders to benefit from growth in the assets within their Fund as well as from growth in the amount of complex-wide assets managed by the Adviser.
The annual fund-level fee for each Fund, payable monthly, is calculated according to the following schedule:
| Average Daily Managed Assets* | Arizona Premium Income (NAZ) Texas Quality Income (NTX) Fund-Level Fee Rate |
| For the first $125 million | | | .4500 | % |
| For the next $125 million | | | .4375 | |
| For the next $250 million | | | .4250 | |
| For the next $500 million | | | .4125 | |
| For the next $1 billion | | | .4000 | |
| For the next $3 billion | | | .3875 | |
| For managed assets over $5 billion | | | .3750 | |
| Average Daily Managed Assets* | Arizona Dividend Advantage (NFZ) Arizona Dividend Advantage 2 (NKR) Arizona Dividend Advantage 3 (NXE) Fund-Level Fee Rate |
| For the first $125 million | | | .4500 | % |
| For the next $125 million | | | .4375 | |
| For the next $250 million | | | .4250 | |
| For the next $500 million | | | .4125 | |
| For the next $1 billion | | | .4000 | |
| For managed assets over $2 billion | | | .3750 | |
The annual complex-level fee for each Fund, payable monthly, is calculated according to the following schedule:
| Complex-Level Managed Asset Breakpoint Level* | Effective Rate at Breakpoint Level |
| $55 billion | | | .2000 | % |
| $56 billion | | | .1996 | |
| $57 billion | | | .1989 | |
| $60 billion | | | .1961 | |
| $63 billion | | | .1931 | |
| $66 billion | | | .1900 | |
| $71 billion | | | .1851 | |
| $76 billion | | | .1806 | |
| $80 billion | | | .1773 | |
| $91 billion | | | .1691 | |
| $125 billion | | | .1599 | |
| $200 billion | | | .1505 | |
| $250 billion | | | .1469 | |
| $300 billion | | | .1445 | |
| * | For the fund-level and complex-level fees, managed assets include closed-end fund assets managed by the Adviser that are attributable to financial leverage. For these purposes, financial leverage includes the funds’ use of preferred stock and borrowings and certain investments in the residual interest certificates (also called inverse floating rate securities) in tender option bond (TOB) trusts, including the portion of assets held by a TOB trust that has been effectively financed by the trust’s issuance of floating rate securities, subject to an agreement by the Adviser as to certain funds to limit the amount of such assets for determining managed assets in certain circumstances. The complex-level fee is calculated based upon the aggregate daily managed assets of all Nuveen Funds that constitute “eligible assets.” Eligible assets do not include assets attributable to investments in other Nuveen Funds and assets in excess of $2 billion added to the Nuveen Fund complex in connection with the Adviser’s assumption of the management of the former First American Funds effective January 1, 2011. As of February 29, 2012, the complex-level fee rate for these Funds was .1724%. |
The management fee compensates the Adviser for overall investment advisory and administrative services and general office facilities. The Adviser is responsible for each Fund’s overall strategy and asset allocation decisions. The Adviser has entered into sub-advisory agreements with Nuveen Asset Management, LLC (the “Sub-Adviser”), a wholly-owned subsidiary of the Adviser, under which the Sub-Adviser manages the investment portfolios of the Funds. The Sub-Adviser is compensated for its services to the Funds from the management fees paid to the Adviser.
The Funds pay no compensation directly to those of its directors/trustees who are affiliated with the Adviser or to its officers, all of whom receive remuneration for their services to the Funds from the Adviser or its affiliates. The Board of Directors/Trustees has adopted a deferred compensation plan for independent directors/trustees that enables directors/trustees to elect to defer receipt of all or a portion of the annual compensation they are entitled to receive from certain Nuveen-advised funds. Under the plan, deferred amounts are treated as though equal dollar amounts had been invested in shares of select Nuveen-advised funds.
For the first ten years of Arizona Dividend Advantage 2’s (NKR) operations, the Adviser has agreed to reimburse the Fund, as a percentage of average daily managed assets, for fees and expenses in the amounts and for the time periods set forth below:
| Year Ending March 31, | | Year Ending March 31, | |
| 2002* | .30 | % | 2008 | .25 | % |
| 2003 | .30 | | 2009 | .20 | |
| 2004 | .30 | | 2010 | .15 | |
| 2005 | .30 | | 2011 | .10 | |
| 2006 | .30 | | 2012 | .05 | |
| 2007 | .30 | | | | |
* From the commencement of operations.
The Adviser has not agreed to reimburse Arizona Dividend Advantage 2 (NKR) for any portion of its fees and expenses beyond March 31, 2012.
8. New Accounting Pronouncement
Fair Value Measurements and Disclosures
On May 12, 2011, the Financial Accounting Standards Board (“FASB”) issued Accounting Standards Update (“ASU”) No. 2011-04 (“ASU No. 2011-04”) modifying Topic 820, Fair Value Measurements and Disclosures. At the same time, the International Accounting Standards Board (“IASB”) issued International Financial Reporting Standard (“IFRS”) 13, Fair Value Measurement. The objective of the FASB and IASB is convergence of their guidance on fair value measurements and disclosures. Specifically, ASU No. 2011-04 requires reporting entities to disclose i) the amounts of any transfers between Level 1 and Level 2 and the reasons for the transfers and ii) for Level 3 fair value measurements, a) quantitative information about significant unobservable inputs used, b) a description of the valuation processes used by the reporting entity and c) a narrative description of the sensitivity of the fair value measurement to changes in unobservable inputs if a change in those inputs might result in a significantly higher or lower fair value measurement. The effective date of ASU No. 2011-04 is for interim and annual periods beginning after December 15, 2011. At this time, management is evaluating the implications of this guidance and the impact it will have to the financial statement amounts and footnote disclosures, if any.
9. Subsequent Event
Approved Fund Reorganizations
On April 18, 2012, the Funds’ Board of Directors/Trustees approved a series of reorganizations for all the Arizona Funds included in this report. The reorganizations are intended to create a single larger state Fund, which would potentially offer shareholders the following benefits:
| ● | Lower Fund expense ratios (excluding the effects of leverage), as fixed costs are spread over a larger asset base; |
| ● | Enhanced secondary market trading, as larger Funds potentially make it easier for investors to buy and sell Fund shares; |
| ● | Lower per share trading costs through reduced bid/ask spreads due to a larger common share float; and |
| ● | Increased Fund flexibility in managing the structure and cost of leverage over time. |
The approved reorganizations are as follows:
| Acquired Funds | | Acquiring Fund | |
● Arizona Dividend Advantage (NFZ) | | ● Arizona Premium Income (NAZ) | |
● Arizona Dividend Advantage 2 (NKR) | | | |
● Arizona Dividend Advantage 3 (NXE) | | | |
If shareholders approve the reorganizations, and upon the closing of the reorganizations, the Acquired Funds will transfer substantially all of their assets to the Acquiring Fund in exchange for common and preferred shares of the Acquiring Fund, and the assumption by the Acquiring Fund of the liabilities of the Acquired Funds. The Acquired Funds will then be liquidated, dissolved and terminated in accordance with their Declaration of Trust.
Board Members & Officers (Unaudited)
| | | |
| | | The management of the Funds, including general supervision of the duties performed for the Funds by the Adviser, is the responsibility of the board members of the Funds. The number of board members of the Funds is currently set at ten. None of the board members who are not “interested” persons of the Funds (referred to herein as “independent board members”) has ever been a director or employee of, or consultant to, Nuveen or its affiliates. The names and business addresses of the board members and officers of the Funds, their principal occupations and other affiliations during the past five years, the number of portfolios each oversees and other directorships they hold are set forth below. |
| | Name, Birthdate & Address | | Position(s) Held with the Funds | | Year First Elected or Appointed and Term(1) | | Principal Occupation (s) including other Directorships During Past 5 Years | | Number of Portfolios in Fund Complex Overseen by Board Member |
| | | | | | | | | | |
| Independent Board Members: | | | | | | | | |
| | | | | | | | | | |
| ■ | ROBERT P. BREMNER 8/22/40 333 W. Wacker Drive Chicago, IL 60606 | | Chairman of the Board and Board Member | | 1996 Class III | | Private Investor and Management Consultant; Treasurer and Director, Humanities Council of Washington, D.C.; Board Member, Independent Directors Council affiliated with the Investment Company Institute. | | 235 |
| | | | | | | | | | |
| ■ | JACK B. EVANS 10/22/48 333 W. Wacker Drive Chicago, IL 60606 | | Board Member | | 1999 Class III | | President, The Hall-Perrine Foundation, a private philanthropic corporation (since 1996); Director and Chairman, United Fire Group, a publicly held company; member of the Board of Regents for the State of Iowa University System; Director, Source Media Group; Life Trustee of Coe College and the Iowa College Foundation; formerly, Director, Alliant Energy; formerly, Director, Federal Reserve Bank of Chicago; formerly, President and Chief Operating Officer, SCI Financial Group, Inc., a regional financial services firm. | | 235 |
| | | | | | | | | | |
| ■ | WILLIAM C. HUNTER 3/6/48 333 W. Wacker Drive Chicago, IL 60606 | | Board Member | | 2004 Class I | | Dean, Tippie College of Business, University of Iowa (since 2006); Director (since 2004) of Xerox Corporation; Director (since 2005), Beta Gamma Sigma International Honor Society; Director of Wellmark, Inc. (since 2009); formerly, Dean and Distinguished Professor of Finance, School of Business at the University of Connecticut (2003-2006); previously, Senior Vice President and Director of Research at the Federal Reserve Bank of Chicago (1995-2003); formerly, Director (1997-2007), Credit Research Center at Georgetown University. | | 235 |
| | | | | | | | | | |
| ■ | DAVID J. KUNDERT 10/28/42 333 W. Wacker Drive Chicago, IL 60606 | | Board Member | | 2005 Class II | | Director, Northwestern Mutual Wealth Management Company; retired (since 2004) as Chairman, JPMorgan Fleming Asset Management, President and CEO, Banc One Investment Advisors Corporation, and President, One Group Mutual Funds; prior thereto, Executive Vice President, Banc One Corporation and Chairman and CEO, Banc One Investment Management Group; Member, Board of Regents, Luther College; member of the Wisconsin Bar Association; member of Board of Directors, Friends of Boerner Botanical Gardens; member of Board of Directors and Chair of Investment Committee, Greater Milwaukee Foundation. | | 235 |
| | | | | | | | | | |
| ■ | WILLIAM J. SCHNEIDER 9/24/44 333 W. Wacker Drive Chicago, IL 60606 | | Board Member | | 1996 Class III | | Chairman of Miller-Valentine Partners Ltd., a real estate investment company; formerly, Senior Partner and Chief Operating Officer (retired 2004) of Miller-Valentine Group; member, University of Dayton Business School Advisory Council; member, Mid-America Health System Board; formerly, member and chair, Dayton Philharmonic Orchestra Association; formerly, member, Business Advisory Council, Cleveland Federal Reserve Bank. | | 235 |
| | | | | | | | | | |
| | Name, Birthdate & Address | | Position(s) Held with the Funds | | Year First Elected or Appointed and Term(1) | | Principal Occupation(s) Including other Directorships During Past 5 Years | | Number of Portfolios in Fund Complex Overseen by Board Member |
| | | | | | | | | | |
| Independent Board Members: | | | | | | | | |
| | | | | | | | | | |
| ■ | JUDITH M. STOCKDALE | | | | | | Executive Director, Gaylord and Dorothy Donnelley Foundation (since 1994); prior thereto, Executive Director, Great Lakes Protection Fund (1990-1994). | | |
| | 12/29/47 333 W. Wacker Drive Chicago, IL 60606 | | Board Member | | 1997 Class I | | | 235 |
| ■ | CAROLE E. STONE | | | | | | Director, Chicago Board Options Exchange (since 2006); Director, C2 Options Exchange, Incorporated (since 2009); formerly, Commissioner, New York State Commission on Public Authority Reform (2005-2010); formerly, Chair, New York Racing Association Oversight Board (2005-2007). | | |
| | 6/28/47 333 W. Wacker Drive Chicago, IL 60606 | | Board Member | | 2007 Class I | | | 235 |
| | | | | | | | | |
| | | | | | | | | | |
| ■ | VIRGINIA L. STRINGER | | | | | | Board Member, Mutual Fund Directors Forum; Member, Governing Board, Investment Company Institute’s Independent Directors Council; governance consultant and non-profit board member; former Owner and President, Strategic Management Resources, Inc. a management consulting firm; previously, held several executive positions in general management, marketing and human resources at IBM and The Pillsbury Company; Independent Director, First American Fund Complex (1987-2010) and Chair (1997-2010). | | |
| | 8/16/44 333 W. Wacker Drive Chicago, IL 60606 | | Board Member | | 2011 | | | 235 |
| | | | | | | | | |
| | | | | | | | | |
| | | | | | | | | |
| | | | | | | | | |
| | | | | | | | | |
| | | | | | | | | | |
| ■ | TERENCE J. TOTH | | | | | | Director, Legal & General Investment Management America, Inc. (since 2008); Managing Partner, Promus Capital (since 2008); formerly, CEO and President, Northern Trust Global Investments (2004-2007); Executive Vice President, Quantitative Management & Securities Lending (2000-2004); prior thereto, various positions with Northern Trust Company (since 1994); member: Goodman Theatre Board (since 2004), Chicago Fellowship Board (since 2005) and Catalyst Schools of Chicago Board (since 2008); formerly, member: Northern Trust Mutual Funds Board (2005-2007), Northern Trust Global Investments Board (2004-2007), Northern Trust Japan Board (2004-2007), Northern Trust Securities Inc. Board (2003-2007) and Northern Trust Hong Kong Board (1997-2004). | | |
| | 9/29/59 333 W. Wacker Drive Chicago, IL 60606 | | Board Member | | 2008 Class II | | | 235 |
| | | | | | | | | |
| | | | | | | | | |
| | | | | | | | | |
| | | | | | | | | |
| | | | | | | | | |
| | | | | | | | | |
| | | | | | | | | |
| Interested Board Member: | | | | | | | | |
| | | | | | | | | | |
| ■ | JOHN P. AMBOIAN(2) 6/14/61 333 W. Wacker Drive Chicago, IL 60606 | | Board Member | | 2008 Class II | | Chief Executive Officer and Chairman (since 2007) and Director (since 1999) of Nuveen Investments, Inc., formerly, President (1999-2007); Chief Executive Officer (since 2007) of Nuveen Investments Advisers, Inc.; Director (since 1998) formerly, Chief Executive Officer (2007-2010) of Nuveen Fund Advisors, Inc. | | 235 |
Board Members & Officers (Unaudited) (continued)
| | Name, Birthdate and Address | | Position(s) Held with the Funds | | Year First Elected or Appointed(3) | | Principal Occupation(s) During Past 5 Years | | Number of Portfolios in Fund Complex Overseen by Officer |
| | | | | | | | | | |
| Officers of the Funds: | | | | | | | | |
| | | | | | | | | | |
| GIFFORD R. ZIMMERMAN | | | | | | | | |
| | 9/9/56 333 W. Wacker Drive Chicago, IL 60606 | | Chief Administrative Officer | | 1988 | | Managing Director (since 2002), Assistant Secretary and Associate General Counsel of Nuveen Securities, LLC; Managing Director(since 2004) and Assistant Secretary (since 1994) of Nuveen Investments, Inc.; Managing Director (since 2002), Assistant Secretary (since 1997) and Co-General Counsel (since 2011) of Nuveen Fund Advisors, Inc.; Managing Director, Assistant Secretary and Associate General Counsel of Nuveen Asset Management, LLC (since 2011); Managing Director, Associate General Counsel and Assistant Secretary, of Symphony Asset Management LLC (since 2003); Vice President and Assistant Secretary of NWQ Investment Management Company, LLC (since 2002), Nuveen Investments Advisers Inc. (since 2002), Santa Barbara Asset Management, LLC (since 2006), and of Winslow Capital Management Inc. (since 2010) Chief Administrative Officer and Chief Compliance Officer (since 2010) of Nuveen Commodities Asset Management, LLC; Chartered Financial Analyst. | | 235 |
| | | | | | | | | | |
| WILLIAM ADAMS IV | | | | | | | | |
| | 6/9/55333 W. Wacker Drive Chicago, IL 60606 | | Vice President | | 2007 | | Senior Executive Vice President, Global Structured Products (since 2010),formerly, Executive Vice President (1999-2010) of Nuveen Securities, LLC; Co-President of Nuveen Fund Advisors, Inc. (since 2011); formerly, Managing Director (2010-2011) of Nuveen Commodities Asset Management, LLC. | | 133 |
| | | | | | | | | | |
| CEDRIC H. ANTOSIEWICZ | | | | | | | | |
| | 1/11/62 333 W. Wacker Drive Chicago, IL 60606 | | Vice President | | 2007 | | Managing Director of Nuveen Securities, LLC. | | 133 |
| | | | | | | | | | |
| MARGO L. COOK | | | | | | | | |
| | 4/11/64 333 W. Wacker Drive Chicago, IL 60606 | | Vice President | | 2009 | | Executive Vice President (since 2008) of Nuveen Investments, Inc.and of Nuveen Fund Advisors, Inc. (since 2011); Managing Director-Investment Services of Nuveen Commodities Asset Management, LLC (since August 2011), previously, Head of Institutional Asset Management (2007-2008) of Bear Stearns Asset Management; Head of Institutional Asset Management (1986-2007) of Bank of NY Mellon; Chartered Financial Analyst. | | 235 |
| | | | | | | | | | |
| LORNA C. FERGUSON | | | | | | | | |
| | 10/24/45 333 W. Wacker Drive Chicago, IL 60606 | | Vice President | | 1998 | | Managing Director (since 2005) of Nuveen Fund Advisors, Inc. and Nuveen Securities, LLC (since 2004). | | 235 |
| | | | | | | | | | |
| STEPHEN D. FOY | | | | | | | | |
| | 5/31/54 333 W. Wacker Drive Chicago, IL 60606 | | Vice President and Controller | | 1998 | | Senior Vice President (since 2010), formerly, Vice President (2005-2010) and Funds Controller of Nuveen Securities, LLC; Vice President of Nuveen Fund Advisors, Inc.; Chief Financial Officer of Nuveen Commodities Asset Management, LLC; (since 2010) Certified Public Accountant. | | 235 |
| | Name, Birthdate and Address | | Position(s) Held with the Funds | | Year First Elected or Appointed(3) | | Principal Occupation(s) During Past 5 Years | | Number of Portfolios in Fund Complex Overseen by Officer |
| | | | | | | | | | |
| Officers of the Funds: | | | | | | | | |
| | | | | | | | | | |
| SCOTT S. GRACE | | | | | | | | |
| | 8/20/70 333 W. Wacker Drive Chicago, IL 60606 | | Vice President and Treasurer | | 2009 | | Managing Director, Corporate Finance & Development, Treasurer (since 2009) of Nuveen Securities, LLC; Managing Director and Treasurer (since 2009) of Nuveen Fund Advisors, Inc., Nuveen Investment Solutions, Inc., Nuveen Investments Advisers, Inc., Nuveen Investments Holdings Inc. and (since 2011) Nuveen Asset Management, LLC; Vice President and Treasurer of NWQ Investment Management Company, LLC, Tradewinds Global Investors, LLC, Symphony Asset Management LLC and Winslow Capital Management, Inc.; Vice President of Santa Barbara Asset Management, LLC; formerly, Treasurer (2006-2009), Senior Vice President (2008-2009), previously, Vice President (2006-2008) of Janus Capital Group, Inc.; formerly, Senior Associate in Morgan Stanley’s Global Financial Services Group (2000-2003); Chartered Accountant Designation. | | 235 |
| | | | | | | | | | |
| WALTER M. KELLY | | | | | | | | |
| | 2/24/70 333 W. Wacker Drive Chicago, IL 60606 | | Chief Compliance Officer and Vice President | | 2003 | | Senior Vice President (since 2008) and Assistant Secretary (since 2003) of Nuveen Fund Advisors, Inc. | | 235 |
| | | | | | | | | | |
| TINA M. LAZAR | | | | | | | | |
| | 8/27/61 333 W. Wacker Drive Chicago, IL 60606 | | Vice President | | 2002 | | Senior Vice President (since 2010), formerly, Vice President (2005-2010)of Nuveen Fund Advisors, Inc. | | 235 |
| | | | | | | | | | |
| KEVIN J. MCCARTHY | | | | | | | | |
| | 3/26/66 333 W. Wacker Drive Chicago, IL 60606 | | Vice President and Secretary | | 2007 | | Managing Director (since 2008), formerly, Vice President (2007-2008),Nuveen Securities, LLC; Managing Director (since 2008), Assistant Secretary (since 2007) and Co-General Counsel (since 2011) of Nuveen Fund Advisors, Inc.; Managing Director, Assistant Secretary and Associate General Counsel (since 2011) of Nuveen Asset Management, LLC; Managing Director (since 2008), and Assistant Secretary, Nuveen Investment Holdings, Inc.; Vice President (since 2007) and Assistant Secretary of Nuveen Investments Advisers Inc., NWQ Investment Management Company, LLC, NWQ Holdings, LLC, Symphony Asset Management LLC, Santa Barbara Asset Management, LLC, and of Winslow Capital Management, Inc. (since 2010); Vice President and Secretary (since 2010) of Nuveen Commodities Asset Management, LLC; prior thereto, Partner, Bell, Boyd & Lloyd LLP (1997-2007). | | 235 |
Board Members & Officers (Unaudited) (continued)
| | Name, Birthdate and Address | | Position(s) Held with the Funds | | Year First Elected or Appointed(3) | | Principal Occupation(s) During Past 5 Years | | Number of Portfolios in Fund Complex Overseen by Officer |
| | | | | | | | | | |
| Officers of the Funds: | | | | | | | | |
| | | | | | | | | | |
| KATHLEEN L. PRUDHOMME | | | | | | | | |
| | 3/30/53 901 Marquette Avenue Minneapolis, MN 55402 | | Vice President and Assistant Secretary | | 2011 | | Managing Director, Assistant Secretary and Co-General Counsel (since 2011) of Nuveen Fund Advisors, Inc.; Managing Director, Assistant Secretary and Associate General Counsel (since 2011) of Nuveen Asset Management, LLC; Managing Director and Assistant Secretary (since 2011) of Nuveen Securities, LLC; formerly, Deputy General Counsel, FAF Advisors, Inc. (2004-2010). | | 235 |
| (1) | For Arizona Dividend Advantage (NFZ), Arizona Dividend Advantage 2 (NKR), Arizona Dividend Advantage 3 (NXE) and Texas Quality Income (NTX), the Board of Trustees is divided into three classes, Class I, Class II, and Class III, with each being elected to serve until the third succeeding annual shareholders’ meeting subsequent to its election or thereafter in each case when its respective successors are duly elected or appointed, except two board members are elected by the holders of Preferred Shares to serve until the next annual shareholders’ meeting subsequent to its election or thereafter in each case when its respective successors are duly elected or appointed. For Arizona Premium Income (NAZ) the Board Members serve a one year term to serve until the next annual meeting or until their successors shall have been duly elected and qualified. The year first elected or appointed represents the year in which the board member was first elected or appointed to any fund in the Nuveen Complex. |
| (2) | Mr. Amboian is an interested trustee because of his position with Nuveen Investments, Inc. and certain of its subsidiaries, which are affiliates of the Nuveen Funds. |
| (3) | Officers serve one year terms through August of each year. The year first elected or appointed represents the year in which the Officer was first elected or appointed to any fund in the Nuveen Complex. |
Reinvest Automatically,
Easily and Conveniently
Nuveen makes reinvesting easy. A phone call is all it takes to set up your reinvestment account.
Nuveen Closed-End Funds Automatic Reinvestment Plan
Your Nuveen Closed-End Fund allows you to conveniently reinvest distributions in additional Fund shares.
By choosing to reinvest, you’ll be able to invest money regularly and automatically, and watch your investment grow through the power of compounding. Just like distributions in cash, there may be times when income or capital gains taxes may be payable on distributions that are reinvested.
It is important to note that an automatic reinvestment plan does not ensure a profit, nor does it protect you against loss in a declining market.
Easy and convenient
To make recordkeeping easy and convenient, each month you’ll receive a statement showing your total distributions, the date of investment, the shares acquired and the price per share, and the total number of shares you own.
How shares are purchased
The shares you acquire by reinvesting will either be purchased on the open market or newly issued by the Fund. If the shares are trading at or above net asset value at the time of valuation, the Fund will issue new shares at the greater of the net asset value or 95% of the then-current market price. If the shares are trading at less than net asset value, shares for your account will be purchased on the open market. If the Plan Agent begins purchasing Fund shares on the open market while shares are trading below net asset value, but the Fund’s shares subsequently trade at or above their net asset value before the Plan Agent is able to complete its purchases, the Plan Agent may cease open-market purchases and may invest the uninvested portion of the distribution in newly-issued Fund shares at a price equal to the greater of the shares’ net asset value or 95% of the shares’ market value on the last business day immediately prior to the purchase date. Distributions received to purchase shares in the open market will normally be invested shortly after the distribution payment date. No interest will be paid on distributions awaiting reinvestment. Because the market price of the shares may increase before purchases are completed, the average purchase price per share may
Reinvest Automatically,
Easily and Conveniently (continued)
exceed the market price at the time of valuation, resulting in the acquisition of fewer shares than if the distribution had been paid in shares issued by the Fund. A pro rata portion of any applicable brokerage commissions on open market purchases will be paid by Plan participants. These commissions usually will be lower than those charged on individual transactions.
Flexible
You may change your distribution option or withdraw from the Plan at any time, should your needs or situation change.
You can reinvest whether your shares are registered in your name, or in the name of a brokerage firm, bank, or other nominee. Ask your investment advisor if his or her firm will participate on your behalf. Participants whose shares are registered in the name of one firm may not be able to transfer the shares to another firm and continue to participate in the Plan.
The Fund reserves the right to amend or terminate the Plan at any time. Although the Fund reserves the right to amend the Plan to include a service charge payable by the participants, there is no direct service charge to participants in the Plan at this time.
Call today to start reinvesting distributions
For more information on the Nuveen Automatic Reinvestment Plan or to enroll in or withdraw from the Plan, speak with your financial advisor or call us at (800) 257-8787.
Glossary of Terms
Used in this Report
| Auction Rate Bond: An auction rate bond is a security whose interest payments are adjusted periodically through an auction process, which process typically also serves as a means for buying and selling the bond. Auctions that fail to attract enough buyers for all the shares offered for sale are deemed to have “failed,” with current holders receiving a formula-based interest rate until the next scheduled auction. |
| | |
| Average Annual Total Return: This is a commonly used method to express an investment’s performance over a particular, usually multi-year time period. It expresses the return that would have been necessary each year to equal the investment’s actual cumulative performance (including change in NAV or market price and reinvested dividends and capital gains distributions, if any) over the time period being considered. |
| | |
| Average Effective Maturity: The market-value-weighted average of the effective maturity dates of the individual securities including cash. In the case of a bond that has been advance-refunded to a call date, the effective maturity is the date on which the bond is scheduled to be redeemed using the proceeds of an escrow account. In most other cases the effective maturity is the stated maturity date of the security. |
| | |
| Effective Leverage: Effective leverage is a Fund’s effective economic leverage, and includes both regulatory leverage (see below) and the leverage effects of certain derivative investments in the Fund’s portfolio. Currently, the leverage effects of Tender Option Bond (TOB) inverse floater holdings are included in effective leverage values, in addition to any regulatory leverage. |
| | |
| Inverse Floating Rate Securities: Inverse floating rate securities, also known as inverse floaters or tender option bonds (TOBs), are created by depositing a municipal bond, typically with a fixed interest rate, into a special purpose trust created by a broker-dealer. This trust, in turn, (a) issues floating rate certificates typically paying short-term tax-exempt interest rates to third parties in amounts equal to some fraction of the deposited bond’s par amount or market value, and (b) issues an inverse floating rate certificate (sometimes referred to as an “inverse floater”) to an investor (such as a Fund) interested in gaining investment exposure to a long-term municipal bond. The income received by the holder of the inverse floater varies inversely with the short-term rate paid to the floating rate certificates’ holders, and in most circumstances the holder of the inverse floater bears substantially all of the underlying bond’s downside investment risk. The holder of the inverse floater typically also benefits disproportionately from any potential appreciation of the underlying bond’s value. Hence, an inverse floater essentially represents an investment in the underlying bond on a leveraged basis. |
Glossary of Terms
Used in this Report (continued)
| Leverage: Using borrowed money to invest in securities or other assets, seeking to increase the return of an investment or portfolio. |
| | |
| Leverage-Adjusted Duration: Duration is a measure of the expected period over which a bond’s principal and interest will be paid, and consequently is a measure of the sensitivity of a bond’s or bond Fund’s value to changes when market interest rates change. Generally, the longer a bond’s or Fund’s duration, the more the price of the bond or Fund will change as interest rates change. Leverage-adjusted duration takes into account the leveraging process for a Fund and therefore is longer than the duration of the Fund’s portfolio of bonds. |
| | |
| Lipper Other States Municipal Debt Funds Classification Average: Calculated using the returns of all closed-end funds in this category for each period as follows: 1-year, 46 funds; 5-year, 46 funds; and 10-year, 27 funds. Lipper returns account for the effects of management fees and assume reinvestment of distributions, but do not reflect any applicable sales charges. The Lipper average is not available for direct investment. |
| | |
| Market Yield (also known as Dividend Yield or Current Yield): An investment’s current annualized dividend divided by its current market price. |
| | |
| Net Asset Value (NAV): The net market value of all securities held in a portfolio. |
| | |
| Net Asset Value (NAV) Per Share: The market value of one share of a mutual fund or closed-end fund. For a Fund, the NAV is calculated daily by taking the Fund’s total assets (securities, cash, and accrued earnings), subtracting the Fund’s liabilities, and dividing by the number of shares outstanding. |
| | |
| Pre-Refunding: Pre-Refunding, also known as advanced refundings or refinancings, is a procedure used by state and local governments to refinance municipal bonds to lower interest expenses. The issuer sells new bonds with a lower yield and uses the proceeds to buy U.S. Treasury securities, the interest from which is used to make payments on the higher-yielding bonds. Because of this collateral, pre-refunding generally raises a bond’s credit rating and thus its value. |
| | |
| Regulatory Leverage: Regulatory leverage consists of preferred shares issued by or borrowings of a Fund. Both of these are part of a Fund’s capital structure. Regulatory leverage is sometimes referred to as “‘40 Act Leverage” and is subject to asset coverage limits set in the Investment Company Act of 1940. |
| | |
| Standard & Poor’s (S&P) Arizona and Texas Municipal Bond Indexes: Are unleveraged, market value-weighted indexes designed to measure the performance of the tax-exempt, investment-grade municipal bond markets in Arizona and Texas, respectively. Index returns assume reinvestment of distributions, but do not reflect any applicable sales charges or management fees. It is not possible to invest directly in an index. |
| | |
| Standard & Poor’s (S&P) National Municipal Bond Index: An unleveraged, market value-weighted index designed to measure the performance of the tax-exempt, investment-grade U.S. municipal bond market. Index returns assume reinvestment of distributions, but do not reflect any applicable sales charges or management fees. It is not possible to invest directly in an index. |
| Taxable-Equivalent Yield: The yield necessary from a fully taxable investment to equal, on an after-tax basis, the yield of a municipal bond investment. |
| | |
| Zero Coupon Bond: A zero coupon bond does not pay a regular interest coupon to its holders during the life of the bond. Tax-exempt income to the holder of the bond comes from accretion of the difference between the original purchase price of the bond at issuance and the par value of the bond at maturity and is effectively paid at maturity. The market prices of zero coupon bonds generally are more volatile than the market prices of bonds that pay interest periodically. |
Notes
Additional Fund Information
Board of
Directors/Trustees
John P. Amboian
Robert P. Bremner
Jack B. Evans
William C. Hunter
David J. Kundert
William J. Schneider
Judith M. Stockdale
Carole E. Stone
Virginia L. Stringer
Terence J. Toth
Fund Manager
Nuveen Fund Advisors, Inc.
333 West Wacker Drive
Chicago, IL 60606
Custodian
State Street Bank
& Trust Company
Boston, MA
Transfer Agent and
Shareholder Services
State Street Bank &
Trust Company
Nuveen Funds
P.O. Box 43071
Providence, RI 02940-3071
(800) 257-8787
Legal Counsel
Chapman and Cutler LLP
Chicago, IL
Independent Registered
Public Accounting Firm
Ernst & Young LLP
Chicago, IL
Quarterly Portfolio of Investments and Proxy Voting Information
You may obtain (i) each Fund’s quarterly portfolio of investments, (ii) information regarding how each Fund voted proxies relating to portfolio securities held during the most recent twelve-month period ended June 30, and (iii) a description of the policies and procedures that each Fund used to determine how to vote proxies relating to portfolio securities without charge, upon request, by calling Nuveen Investments toll-free at (800) 257-8787 or on Nuveen’s website at www.nuveen.com.
You may also obtain this and other Fund information directly from the Securities and Exchange Commission (SEC). The SEC may charge a copying fee for this information. Visit the SEC on-line at http://www.sec.gov or in person at the SEC’s Public Reference Room in Washington, D.C. Call the SEC at (202) 942-8090 for room hours and operation. You may also request Fund information by sending an e-mail request to publicinfo@sec.gov or by writing to the SEC’s Public References Section at 100 F Street NE, Washington, D.C. 20549.
CEO Certification Disclosure
Each Fund’s Chief Executive Officer (CEO) has submitted to the New York Stock Exchange (NYSE) the annual CEO certification as required by Section 303A.12(a) of the NYSE Listed Company Manual.
Each Fund has filed with the SEC the certification of its Chief Executive Officer and Chief Financial Officer required by Section 302 of the Sarbanes-Oxley Act.
Common and Preferred Share Information
Each Fund intends to repurchase and/or redeem shares of its own common and/or auction rate preferred stock in the future at such times and in such amounts as is deemed advisable. During the period covered by this report, the Funds repurchased and/or redeemed shares of their common and/or auction rate preferred stock as shown in the accompanying table.
| Fund | | Common Shares Repurchased | | Preferred Shares Redeemed | |
| NAZ | | | — | | | 1,115 | |
| NFZ | | | — | | | — | |
| NKR | | | — | | | — | |
| NXE | | | — | | | — | |
| NTX | | | — | | | — | |
Any future repurchases will be reported to shareholders in the next annual or semi- annual report.
Nuveen Investments:
Serving Investors for Generations
Since 1898, financial advisors and their clients have relied on Nuveen Investments to provide dependable investment solutions through continued adherence to proven, long-term investing principles. Today, we offer a range of high quality equity and fixed-income solutions designed to be integral components of a well-diversified core portfolio.
Focused on meeting investor needs.
Nuveen Investments provides high-quality investment services designed to help secure the long-term goals of institutional and individual investors as well as the consultants and financial advisors who serve them. Nuveen Investments markets a wide range of specialized investment solutions which provide investors access to capabilities of its high-quality boutique investment affiliates-Nuveen Asset Management, Symphony Asset Management, NWQ Investment Management Company, Santa Barbara Asset Management, Tradewinds Global Investors, Winslow Capital Management and Gresham Investment Management. In total, Nuveen Investments managed $220 billion as of December 31, 2011.
Find out how we can help you.
To learn more about how the products and services of Nuveen Investments may be able to help you meet your financial goals, talk to your financial advisor, or call us at (800) 257-8787. Please read the information provided carefully before you invest. Investors should consider the investment objective and policies, risk considerations, charges and expenses of any investment carefully. Where applicable, be sure to obtain a prospectus, which contains this and other relevant information. To obtain a prospectus, please contact your securities representative or Nuveen Investments, 333 W. Wacker Dr., Chicago, IL 60606. Please read the prospectus carefully before you invest or send money.
Learn more about Nuveen Funds at: www.nuveen.com/cef
Distributed by
Nuveen Securities, LLC
333 West Wacker Drive
Chicago, IL 60606
www.nuveen.com
EAN-D-0212D
ITEM 2. CODE OF ETHICS.
As of the end of the period covered by this report, the registrant has adopted a code of ethics that applies to the registrant's principal executive officer, principal financial officer, principal accounting officer or controller, or persons performing similar functions. There were no amendments to or waivers from the Code during the period covered by this report. The registrant has posted the code of ethics on its website at www.nuveen.com/CEF/Info/Shareholder. (To view the code, click on Fund Governance and then click on Code of Conduct.)
ITEM 3. AUDIT COMMITTEE FINANCIAL EXPERT.
The registrant's Board of Directors or Trustees (“Board”) determined that the registrant has at least one “audit committee financial expert” (as defined in Item 3 of Form N-CSR) serving on its Audit Committee. The registrant's audit committee financial expert is Carole E. Stone, who is “independent” for purposes of Item 3 of Form N-CSR.
Ms. Stone served for five years as Director of the New York State Division of the Budget. As part of her role as Director, Ms. Stone was actively involved in overseeing the development of the State's operating, local assistance and capital budgets, its financial plan and related documents; overseeing the development of the State's bond-related disclosure documents and certifying that they fairly presented the State's financial position; reviewing audits of various State and local agencies and programs; and coordinating the State's system of internal audit and control. Prior to serving as Director, Ms. Stone worked as a budget analyst/examiner with increasing levels of responsibility over a 30 year period, including approximately five years as Deputy Budget Director. Ms. Stone has also served as Chair of the New York State Racing Association Oversight Board, as Chair of the Public Authorities Control Board, as a Commissioner on the New York State Commission on Public Authority Reform and as a member of the Boards of Directors of several New York State public authorities. These positions have involved overseeing operations and finances of certain entities and assessing the adequacy of project/entity financing and financial reporting. Currently, Ms. Stone is on the Board of Directors of CBOE Holdings, Inc., of the Chicago Board Options Exchange, and of C2 Options Exchange. Ms. Stone's position on the boards of these entities and as a member of both CBOE Holdings' Audit Committee and its Finance Committee has involved, among other things, the oversight of audits, audit plans and preparation of financial statements.
ITEM 4. PRINCIPAL ACCOUNTANT FEES AND SERVICES.
Nuveen Arizona Premium Income Municipal Fund, Inc.
The following tables show the amount of fees that Ernst & Young LLP, the Fund's auditor, billed to the Fund during the Fund's last two full fiscal years. For engagements with Ernst & Young LLP the Audit Committee approved in advance all audit services and non-audit services that Ernst & Young LLP provided to the Fund, except for those non-audit services that were subject to the pre-approval exception under Rule 2-01 of Regulation S-X (the “pre-approval exception”). The pre-approval exception for services provided directly to the Fund waives the pre-approval requirement for services other than audit, review or attest services if: (A) the aggregate amount of all such services provided constitutes no more than 5% of the total amount of revenues paid by the Fund to its accountant during the fiscal year in which the services are provided; (B) the Fund did not recognize the services as non-audit services at the time of the engagement; and (C) the services are promptly brought to the Audit Committee's attention, and the Committee (or its delegate) approves the services before the audit is completed.
The Audit Committee has delegated certain pre-approval responsibilities to its Chairman (or, in his absence, any other member of the Audit Committee).
SERVICES THAT THE FUND'S AUDITOR BILLED TO THE FUND
| | | Audit Fees Billed | | | Audit-Related Fees | | | Tax Fees | | | All Other Fees | |
| Fiscal Year Ended | | to Fund 1 | | | Billed to Fund 2 | | | Billed to Fund 3 | | | Billed to Fund 4 | |
| February 29, 2012 | | $ | 21,200 | | | $ | 7,750 | | | $ | 0 | | | $ | 1,700 | |
| | | | | | | | | | | | | | | | | |
| Percentage approved | | | 0 | % | | | 0 | % | | | 0 | % | | | 0 | % |
| pursuant to | | | | | | | | | | | | | | | | |
| pre-approval | | | | | | | | | | | | | | | | |
| exception | | | | | | | | | | | | | | | | |
| | | | | | | | | | | | | | | | | |
February 28, 2011 5 | | $ | 18,200 | | | $ | 0 | | | $ | 0 | | | $ | 1,700 | |
| | | | | | | | | | | | | | | | | |
| Percentage approved | | | 0 | % | | | 0 | % | | | 0 | % | | | 0 | % |
| pursuant to | | | | | | | | | | | | | | | | |
| pre-approval | | | | | | | | | | | | | | | | |
| exception | | | | | | | | | | | | | | | | |
1 "Audit Fees" are the aggregate fees billed for professional services for the audit of the Fund's annual financial statements and services | | | |
| provided in connection with statutory and regulatory filings or engagements. | | | |
| | | | | |
2 "Audit Related Fees" are the aggregate fees billed for assurance and related services reasonably related to the performance of the | | |
| audit or review of financial statements and are not reported under "Audit Fees". | | | |
| | | | | |
3 "Tax Fees" are the aggregate fees billed for professional services for tax advice, tax compliance, and tax planning. | | |
| | | | | |
4 "All Other Fees" are the aggregate fees billed for products and services for agreed upon procedures engagements performed for leveraged funds. | |
| | | | | |
5 Fund changed fiscal year from July to February starting in 2011. | | | |
SERVICES THAT THE FUND'S AUDITOR BILLED TO THE ADVISER AND AFFILIATED FUND SERVICE PROVIDERS
The following tables show the amount of fees billed by Ernst & Young LLP to Nuveen Fund Advisors, Inc. (formerly Nuveen Asset Management) (the “Adviser” or “NFA”), and any entity controlling, controlled by or under common control with the Adviser that provides ongoing services to the Fund (“Affiliated Fund Service Provider”), for engagements directly related to the Fund's operations and financial reporting, during the Fund's last two full fiscal years.
The tables also show the percentage of fees subject to the pre-approval exception. The pre-approval exception for services provided to the Adviser and any Affiliated Fund Service Provider (other than audit, review or attest services) waives the pre-approval requirement if: (A) the aggregate amount of all such services provided constitutes no more than 5% of the total amount of revenues paid to Ernst & Young LLP by the Fund, the Adviser and Affiliated Fund Service Providers during the fiscal year in which the services are provided that would have to be pre-approved by the Audit Committee; (B) the Fund did not recognize the services as non-audit services at the time of the engagement; and (C) the services are promptly brought to the Audit Committee's attention, and the Committee (or its delegate) approves the services before the Fund's audit is completed.
| Fiscal Year Ended | Audit-Related Fees | Tax Fees Billed to | All Other Fees |
| | Billed to Adviser and | Adviser and | Billed to Adviser |
| | Affiliated Fund | Affiliated Fund | and Affiliated Fund |
| | Service Providers | Service Providers | Service Providers |
| February 29, 2012 | $ 0 | $ 0 | $ 0 |
| | | | |
| Percentage approved | 0% | 0% | 0% |
| pursuant to | | | |
| pre-approval | | | |
| exception | | | |
February 28, 2011 1 | $ 0 | $ 0 | $ 0 |
| | | | |
| Percentage approved | 0% | 0% | 0% |
| pursuant to | | | |
| pre-approval | | | |
| exception | | | |
1 Fund changed fiscal year from July to February starting in 2011. | |
NON-AUDIT SERVICES
The following table shows the amount of fees that Ernst & Young LLP billed during the Fund's last two full fiscal years for non-audit services. The Audit Committee is required to pre-approve non-audit services that Ernst & Young LLP provides to the Adviser and any Affiliated Fund Services Provider, if the engagement related directly to the Fund's operations and financial reporting (except for those subject to the pre-approval exception described above). The Audit Committee requested and received information from Ernst & Young LLP about any non-audit services that Ernst & Young LLP rendered during the Fund's last fiscal year to the Adviser and any Affiliated Fund Service Provider. The Committee considered this information in evaluating Ernst & Young LLP's independence.
| Fiscal Year Ended | | Total Non-Audit Fees | | |
| | | billed to Adviser and | | |
| | | Affiliated Fund Service | Total Non-Audit Fees | |
| | | Providers (engagements | billed to Adviser and | |
| | | related directly to the | Affiliated Fund Service | |
| | Total Non-Audit Fees | operations and financial | Providers (all other | |
| | Billed to Fund | reporting of the Fund) | engagements) | Total |
| February 29, 2012 | $ 1,700 | $ 0 | $ 0 | $ 1,700 |
February 28, 2011 1 | $ 1,700 | $ 0 | $ 0 | $ 1,700 |
1 Fund changed fiscal year from July to February starting in 2011. | | |
| | | | |
| "Non-Audit Fees billed to Fund" for both fiscal year ends represent "Tax Fees" and "All Other Fees" billed to Fund in their respective |
| amounts from the previous table. | | | |
Audit Committee Pre-Approval Policies and Procedures. Generally, the Audit Committee must approve (i) all non-audit services to be performed for the Fund by the Fund's independent accountants and (ii) all audit and non-audit services to be performed by the Fund's independent accountants for the Affiliated Fund Service Providers with respect to operations and financial reporting of the Fund. Regarding tax and research projects conducted by the independent accountants for the Fund and Affiliated Fund Service Providers (with respect to operations and financial reports of the Fund) such engagements will be (i) pre-approved by the Audit Committee if they are expected to be for amounts greater than $10,000; (ii) reported to the Audit Committee chairman for his verbal approval prior to engagement if they are expected to be for amounts under $10,000 but greater than $5,000; and (iii) reported to the Audit Committee at the next Audit Committee meeting if they are expected to be for an amount under $5,000.
ITEM 5. AUDIT COMMITTEE OF LISTED REGISTRANTS.
The registrant's Board has a separately designated Audit Committee established in accordance with Section 3(a)(58)(A) of the Securities Exchange Act of 1934, as amended (15 U.S.C. 78c(a)(58)(A)). The members of the audit committee are Robert P. Bremner, Terence J. Toth, William J. Schneider, Carole E. Stone and David J. Kundert.
ITEM 6. SCHEDULE OF INVESTMENTS.
a) See Portfolio of Investments in Item 1.
b) Not applicable.
ITEM 7. DISCLOSURE OF PROXY VOTING POLICIES AND PROCEDURES FOR CLOSED-END MANAGEMENT INVESTMENT COMPANIES.
Nuveen Fund Advisors, Inc. (“Adviser”) is the registrant’s investment adviser. NFA is responsible for the on-going monitoring of the Fund’s investment portfolio, managing the Fund’s business affairs and providing certain clerical, bookkeeping and administrative services. The Adviser has engaged Nuveen Asset Management, LLC (“Sub-Adviser”) as Sub-Adviser to provide discretionary investment advisory services. As part of these services, the Adviser has delegated to the Sub-Adviser the full responsibility for proxy voting on securities held in the registrant’s portfolio and related duties in accordance with the Sub-Adviser's policy and procedures. The Adviser periodically monitors the Sub-Adviser's voting to ensure that it is carrying out its duties. The Sub-Adviser’s proxy voting policies and procedures are attached to this filing as an exhibit and incorporated herein by reference.
ITEM 8. PORTFOLIO MANAGERS OF CLOSED-END MANAGEMENT INVESTMENT COMPANIES.
Nuveen Fund Advisors, Inc. is the registrant's investment adviser (also referred to as the “Adviser”). The Adviser is responsible for the selection and on-going monitoring of the Fund’s investment portfolio, managing the Fund’s business affairs and providing certain clerical, bookkeeping and administrative services. The Adviser has engaged Nuveen Asset Management, LLC (“NAM” or “Sub-Adviser”) as Sub-Adviser to provide discretionary investment advisory services. The following section provides information on the portfolio manager at the Sub-Adviser:
The Portfolio Manager
The following individual has primary responsibility for the day-to-day implementation of the registrant’s investment strategies:
| Name | Fund |
| Michael Hamilton | Nuveen Arizona Premium Income Municipal Fund, Inc. |
Other Accounts Managed. In addition to managing the registrant, the portfolio manager is also primarily responsible for the day-to-day portfolio management of the following accounts:
| Portfolio Manager | Type of Account Managed | Number of Accounts | Assets* |
| Michael Hamilton | Registered Investment Company | 15 | $ 1.374 billion |
| | Other Pooled Investment Vehicles | 0 | $0 |
| | Other Accounts | 4 | $ 153.8 million |
| * | Assets are as of February 29, 2012. None of the assets in these accounts are subject to an advisory fee based on performance. |
POTENTIAL MATERIAL CONFLICTS OF INTEREST
Actual or apparent conflicts of interest may arise when a portfolio manager has day-to-day management responsibilities with respect to more than one account. More specifically, portfolio managers who manage multiple accounts are presented a number of potential conflicts, including, among others, those discussed below.
The management of multiple accounts may result in a portfolio manager devoting unequal time and attention to the management of each account. NAM seeks to manage such competing interests for the time and attention of portfolio managers by having portfolio managers focus on a particular investment discipline. Most accounts managed by a portfolio manager in a particular investment strategy are managed using the same investment models.
If a portfolio manager identifies a limited investment opportunity which may be suitable for more than one account, an account may not be able to take full advantage of that opportunity due to an allocation of filled purchase or sale orders across all eligible accounts. To deal with these situations, NAM has adopted procedures for allocating limited opportunities across multiple accounts.
With respect to many of its clients’ accounts, NAM determines which broker to use to execute transaction orders, consistent with its duty to seek best execution of the transaction. However, with respect to certain other accounts, NAM may be limited by the client with respect to the selection of brokers or may be instructed to direct trades through a particular broker. In these cases, NAM may place separate, non-simultaneous, transactions for a Fund and other accounts which may temporarily affect the market price of the security or the execution of the transaction, or both, to the detriment of the Fund or the other accounts.
Some clients are subject to different regulations. As a consequence of this difference in regulatory requirements, some clients may not be permitted to engage in all the investment techniques or transactions or to engage in these transactions to the same extent as the other accounts managed by the portfolio manager. Finally, the appearance of a conflict of interest may arise where NAM has an incentive, such as a performance-based management fee, which relates to the management of some accounts, with respect to which a portfolio manager has day-to-day management responsibilities.
NAM has adopted certain compliance procedures which are designed to address these types of conflicts common among investment managers. However, there is no guarantee that such procedures will detect each and every situation in which a conflict arises.
| Item 8(a)(3). | FUND MANAGER COMPENSATION |
Portfolio manager compensation consists primarily of base pay, an annual cash bonus and long term incentive payments.
Base pay. Base pay is determined based upon an analysis of the portfolio manager’s general performance, experience, and market levels of base pay for such position.
Annual cash bonus. The Fund’s portfolio managers are eligible for an annual cash bonus based on investment performance, qualitative evaluation and financial performance of NAM.
A portion of each portfolio manager’s annual cash bonus is based on the Fund’s investment performance, generally measured over the past one- and three or five-year periods unless the portfolio manager’s tenure is shorter. Investment performance for the Fund generally is determined by evaluating the Fund’s performance relative to its benchmark(s) and/or Lipper industry peer group.
A portion of the cash bonus is based on a qualitative evaluation made by each portfolio manager’s supervisor taking into consideration a number of factors, including the portfolio manager’s team collaboration, expense management, support of personnel responsible for asset growth, and his or her compliance with NAM’s policies and procedures.
The final factor influencing a portfolio manager’s cash bonus is the financial performance of NAM based on its operating earnings.
Long-term incentive compensation. Certain key employees of Nuveen Investments and its affiliates, including certain portfolio managers, have received equity interests in the parent company of Nuveen Investments. In addition, certain key employees of NAM, including certain portfolio managers, have received profits interests in NAM which entitle their holders to participate in the firm’s growth over time.
There are generally no differences between the methods used to determine compensation with respect to the Fund and the Other Accounts shown in the table above.
Beneficial Ownership of Securities. As of February 29, 2012 the portfolio manager beneficially owned the following dollar range of equity securities issued by the Registrant and other Nuveen Funds managed by NAM’s municipal investment team.
| Name of Portfolio Manager | Fund | Dollar range of equity securities beneficially owned in Fund | Dollar range of equity securities beneficially owned in the remainder of Nuveen funds managed by NAM’s municipal investment team |
| Michael Hamilton | Nuveen Arizona Premium Income Municipal Fund, Inc. | $0 | $0 |
PORTFOLIO MANAGER BIO:
Michael Hamilton began working in the financial industry when he joined FAF Advisors in 1989, as a fixed-income fund manager and trader. Michael became a portfolio manager in 1992. He received a B.A. from Albertson’s College of Idaho and an M.B.A. from Western Washington University. Michael is a member of the Portland Society of Financial Analysts. Currently, he manages investments for 16 Nuveen-sponsored investment companies.
ITEM 9. PURCHASES OF EQUITY SECURITIES BY CLOSED-END MANAGEMENT INVESTMENT COMPANY AND AFFILIATED PURCHASERS.
Not applicable.
ITEM 10. SUBMISSION OF MATTERS TO A VOTE OF SECURITY HOLDERS.
There have been no material changes to the procedures by which shareholders may recommend nominees to the registrant's Board implemented after the registrant last provided disclosure in response to this item.
ITEM 11. CONTROLS AND PROCEDURES.
| (a) | The registrant's principal executive and principal financial officers, or persons performing similar functions, have concluded that the registrant's disclosure controls and procedures (as defined in Rule 30a-3(c) under the Investment Company Act of 1940, as amended (the “1940 Act”) (17 CFR 270.30a-3(c))) are effective, as of a date within 90 days of the filing date of this report that includes the disclosure required by this paragraph, based on their evaluation of the controls and procedures required by Rule 30a-3(b) under the 1940 Act (17 CFR 270.30a-3(b)) and Rules 13a-15(b) or 15d-15(b) under the Securities Exchange Act of 1934, as amended (the “Exchange Act”) (17 CFR 240.13a-15(b) or 240.15d-15(b)). |
| (b) | There were no changes in the registrant's internal control over financial reporting (as defined in Rule 30a-3(d) under the 1940 Act (17 CFR 270.30a-3(d)) that occurred during the second fiscal quarter of the period covered by this report that has materially affected, or is reasonably likely to materially affect, the registrant's internal control over financial reporting. |
ITEM 12. EXHIBITS.
File the exhibits listed below as part of this Form. Letter or number the exhibits in the sequence indicated.
| (a)(1) | Any code of ethics, or amendment thereto, that is the subject of the disclosure required by Item 2, to the extent that the registrant intends to satisfy the Item 2 requirements through filing of an exhibit: Not applicable because the code is posted on registrant's website at www.nuveen.com/CEF/Info/ Shareholder and there were no amendments during the period covered by this report. (To view the code, click on Fund Governance and then Code of Conduct.) |
| (a)(2) | A separate certification for each principal executive officer and principal financial officer of the registrant as required by Rule 30a-2(a) under the 1940 Act (17 CFR 270.30a-2(a)) in the exact form set forth below: Ex-99.CERT Attached hereto. |
| (a)(3) | Any written solicitation to purchase securities under Rule 23c-1 under the 1940 Act (17 CFR 270.23c-1) sent or given during the period covered by the report by or on behalf of the registrant to 10 or more persons. Not applicable. |
| (b) | If the report is filed under Section 13(a) or 15(d) of the Exchange Act, provide the certifications required by Rule 30a-2(b) under the 1940 Act (17 CFR 270.30a-2(b)); Rule 13a-14(b) or Rule 15d-14(b) under the Exchange Act (17 CFR 240.13a-14(b) or 240.15d-14(b)), and Section 1350 of Chapter 63 of Title 18 of the United States Code (18 U.S.C. 1350) as an exhibit. A certification furnished pursuant to this paragraph will not be deemed “filed” for purposes of Section 18 of the Exchange Act (15 U.S.C. 78r), or otherwise subject to the liability of that section. Such certification will not be deemed to be incorporated by reference into any filing under the Securities Act of 1933 or the Exchange Act, except to the extent that the registrant specifically incorporates it by reference. Ex-99.906 CERT attached hereto. |
SIGNATURES
Pursuant to the requirements of the Securities Exchange Act of 1934 and the Investment Company Act of 1940, the registrant has duly caused this report to be signed on its behalf by the undersigned, thereunto duly authorized.
(Registrant) Nuveen Arizona Premium Income Municipal Fund, Inc.
By (Signature and Title) /s/ Kevin J. McCarthy
Kevin J. McCarthy
Vice President and Secretary
Date: April 25, 2012
Pursuant to the requirements of the Securities Exchange Act of 1934 and the Investment Company Act of 1940, this report has been signed below by the following persons on behalf of the registrant and in the capacities and on the dates indicated.
By (Signature and Title) /s/ Gifford R. Zimmerman
Gifford R. Zimmerman
Chief Administrative Officer
(principal executive officer)
Date: April 25, 2012
By (Signature and Title) /s/ Stephen D. Foy
Stephen D. Foy
Vice President and Controller
(principal financial officer)
Date: April 25, 2012