Washington, D.C. 20549
Nuveen Arizona Premium Income Municipal Fund, Inc.
Kevin J. McCarthy
Form N-CSR is to be used by management investment companies to file reports with the Commission not later than 10 days after the transmission to stockholders of any report that is required to be transmitted to stockholders under Rule 30e-1 under the Investment Company Act of 1940 (17 CFR 270.30e-1). The Commission may use the information provided on Form N-CSR in its regulatory, disclosure review, inspection, and policymaking roles.
A registrant is required to disclose the information specified by Form N-CSR, and the Commission will make this information public. A registrant is not required to respond to the collection of information contained in Form N-CSR unless the Form displays a currently valid Office of Management and Budget ("OMB") control number. Please direct comments concerning the accuracy of the information collection burden estimate and any suggestions for reducing the burden to Secretary, Securities and Exchange Commission, 450 Fifth Street, NW, Washington, DC 20549-0609. The OMB has reviewed this collection of information under the clearance requirements of 44 U.S.C. ss. 3507.
ITEM 1. REPORTS TO STOCKHOLDERS.
LIFE IS COMPLEX.
Nuveen makes things e-simple.
It only takes a minute to sign up for e-Reports. Once enrolled, you’ll receive an e-mail as soon as your Nuveen Fund information is ready. No more waiting for delivery by regular mail. Just click on the link within the e-mail to see the report and save it on your computer if you wish.
Free e-Reports right to your e-mail!
www.investordelivery.com
If you receive your Nuveen Fund distributions and statements from your financial advisor or brokerage account.
OR
www.nuveen.com/accountaccess
If you receive your Nuveen Fund distributions and statements directly from Nuveen.
Table of Contents
| Chairman’s Letter to Shareholders | 4 |
| | |
| Portfolio Managers’ Comments | 5 |
| | |
| Fund Leverage and Other Information | 10 |
| | |
| Common Share Dividend and Price Information | 12 |
| | |
| Performance Overviews | 14 |
| | |
| Shareholder Meeting Report | 19 |
| | |
| Portfolios of Investments | 20 |
| | |
| Statement of Assets and Liabilities | 42 |
| | |
| Statement of Operations | 43 |
| | |
| Statement of Changes in Net Assets | 44 |
| | |
| Statement of Cash Flows | 46 |
| | |
| Financial Highlights | 48 |
| | |
| Notes to Financial Statements | 57 |
| | |
| Annual Investment Management Agreement Approval Process | 70 |
| | |
| Reinvest Automatically, Easily and Conveniently | 80 |
| | |
| Glossary of Terms Used in this Report | 82 |
| | |
| Additional Fund Information | 87 |
Chairman’s
Letter to Shareholders
Dear Shareholders,
Investors have many reasons to remain cautious. The challenges in the Euro area are casting a shadow over global economies and financial markets. The political support for addressing fiscal issues is eroding as the economic and social impacts become more visible. At the same time, member nations appear unwilling to provide adequate financial support or to surrender sufficient sovereignty to strengthen the banks or unify the Euro area financial system. The gains made in reducing deficits, and the hard-won progress on winning popular acceptance of the need for economic austerity, are at risk. To their credit, European political leaders press on to find compromise solutions, but there is increasing concern that time will begin to run out.
In the U.S., strong corporate earnings have enabled the equity markets to withstand much of the downward pressures coming from weakening job creation, slower economic growth and political uncertainty. The Fed remains committed to low interest rates and announced on September 13, 2012 (after the close of this reporting period) another program of quantitative easing (QE3) to continue until mid-2015. Pre-election maneuvering has added to the already highly partisan atmosphere in Congress. The end of the Bush-era tax cuts and implementation of the spending restrictions of the Budget Control Act of 2011, both scheduled to take place at year-end, loom closer.
During the last year, U.S. based investors have experienced a sharp decline and a strong recovery in the equity markets. The experienced investment teams at Nuveen keep their eye on a longer time horizon and use their practiced investment disciplines to negotiate through market peaks and valleys to achieve long-term goals for investors. Experienced professionals pursue investments that will weather short-term volatility and at the same time, seek opportunities that are created by markets that overreact to negative developments. Monitoring this process is an important consideration for the Fund Board as it oversees your Nuveen Fund on your behalf.
As always, I encourage you to contact your financial consultant if you have any questions about your investment in a Nuveen Fund. On behalf of the other members of your Fund Board, we look forward to continuing to earn your trust in the months and years ahead.
Sincerely,
Robert P. Bremner
Chairman of the Board
October 22, 2012
Portfolio Managers’ Comments
Nuveen Arizona Premium Income Municipal Fund, Inc. (NAZ)
Nuveen Arizona Dividend Advantage Municipal Fund (NFZ)
Nuveen Arizona Dividend Advantage Municipal Fund 2 (NKR)
Nuveen Arizona Dividend Advantage Municipal Fund 3 (NXE)
Nuveen Texas Quality Income Municipal Fund (NTX)
Portfolio managers Michael Hamilton and Daniel Close discuss key investment strategies and the six-month performance of the Nuveen Arizona and Texas Funds. Michael assumed portfolio management responsibility for the Arizona Funds in January 2011 and Dan has managed NTX since 2007.
What key strategies were used to manage the Arizona and Texas Funds during the six-month reporting period ended August 31, 2012?
During this reporting period, municipal bond prices generally rallied, as strong demand and tight supply combined to create favorable market conditions for municipal bonds. Although the availability of tax-exempt supply improved over that of the same six-month period a year earlier, the pattern of new issuance remained light compared with long-term historical trends. This supply/demand dynamic served as a key driver of performance. Concurrent with rising prices, yields continued to decline across most maturities, especially at the longer end of the municipal yield curve, and the yield curve flattened. During this period, we saw an increasing number of borrowers come to market seeking to take advantage of the low rate environment, with approximately 60% of new municipal paper issued by borrowers that were calling existing debt and refinancing at lower rates.
In this environment, we continued to take a bottom-up approach to discovering sectors that appeared undervalued as well as individual credits that had the potential to perform well over the long term and helped us keep the Funds fully invested. During this period, NTX found value in several areas of the market, including health care, local general obligation (GO) bonds, airports, toll roads, public power and dedicated tax credits. In the Arizona Funds, we focused on managing cashflows from bond calls and maturing bonds and minimizing their impact by anticipating current and future inflows and closely monitoring opportunities for reinvestment. Our buying activity during this period included finding purchase opportunities in the secondary market, adding to the Funds’ holdings of existing bonds, and purchasing territorial paper issued by Puerto Rico and the Virgin Islands. These territorial bonds benefited the Funds through higher yields, added diversification, and triple exemption (i.e., exemption from federal, state, and local taxes).
Certain statements in this report are forward-looking statements. Discussions of specific investments are for illustration only and are not intended as recommendations of individual investments. The forward-looking statements and other views expressed herein are those of the portfolio managers as of the date of this report. Actual future results or occurrences may differ significantly from those anticipated in any forward-looking statements, and the views expressed herein are subject to change at any time, due to numerous market and other factors. The Funds disclaim any obligation to update publicly or revise any forward-looking statements or views expressed herein.
Ratings shown are the highest rating given by one of the following national rating agencies: Standard & Poor’s Group, Moody’s Investors Service, Inc. or Fitch, Inc. Credit ratings are subject to change. AAA, AA, A and BBB are investment grade ratings; BB, B, CCC, CC, C and D are below investment grade ratings. Certain bonds backed by U.S. Government or agency securities are regarded as having an implied rating equal to the rating of such securities. Holdings designated N/R are not rated by these national rating agencies.
In general during this period, we focused on bonds with longer maturities. This enabled us to take advantage of attractive yields at the longer end of the municipal yield curve and also provided some protection for the Funds’ duration and yield curve positioning. We also purchased lower rated bonds when we found attractive opportunities, as we believed these bonds continued to offer relative value.
Cash for new purchases during this period was generated primarily by the proceeds from a meaningful number of bond calls resulting from the increase in refinancings. During this period, we worked to redeploy these proceeds to keep the Funds as fully invested as possible. Overall, selling was minimal because the bonds in our portfolios generally offered higher yields than those available in the current marketplace. The Arizona Funds sold a few pre-refunded bonds and credits with short call dates as part of our cashflow management program, while NTX had no sales activity during this period.
As of August 31, 2012, all of these Funds continued to use inverse floating rate securities. We employ inverse floaters for a variety of reasons, including duration management, income enhancement and total return enhancement.
How did the Funds perform?
Individual results for these Nuveen Arizona and Texas Funds, as well as relevant index and peer group information, are presented in the accompanying table.
| Average Annual Total Returns on Common Share Net Asset Value* | |
| For periods ended 8/31/12 | |
| | | | | | | | | | | | | | |
| | | | 6-Month | | 1-Year | | 5-Year | | 10-Year |
| Arizona Funds | | | | | | | | | | | | | |
| NAZ | | | 5.29 | % | | 14.80 | % | | 7.40 | % | | 6.03 | % |
| NFZ | | | 5.14 | % | | 14.72 | % | | 7.14 | % | | 5.95 | % |
| NKR | | | 4.82 | % | | 13.89 | % | | 7.26 | % | | 6.15 | % |
| NXE | | | 4.32 | % | | 13.02 | % | | 7.27 | % | | N/A |
| | | | | | | | | | | | | | |
| S&P Arizona Municipal Bond Index** | | | 3.39 | % | | 9.41 | % | | 6.12 | % | | 5.29 | % |
| S&P Municipal Bond Index** | | | 3.24 | % | | 9.35 | % | | 6.00 | % | | 5.28 | % |
| Lipper Other States Municipal Debt Funds Classification Average** | | | 4.63 | % | | 14.84 | % | | 7.25 | % | | 6.24 | % |
| Texas Fund | | | | | | | | | | | | | |
| NTX | | | 4.90 | % | | 12.85 | % | | 7.38 | % | | 6.28 | % |
| | | | | | | | | | | | | | |
| S&P Texas Municipal Bond Index** | | | 3.49 | % | | 9.06 | % | | 6.26 | % | | 5.54 | % |
| S&P Municipal Bond Index** | | | 3.24 | % | | 9.35 | % | | 6.00 | % | | 5.28 | % |
| Lipper Other States Municipal Debt Funds Classification Average** | | | 4.63 | % | | 14.84 | % | | 7.25 | % | | 6.24 | % |
| | Past performance is not predictive of future results. Current performance may be higher or lower than the data shown. Returns do not reflect the deduction of taxes that shareholders may have to pay on Fund distributions or upon the sale of Fund shares. |
| | |
| | For additional information, see the Performance Overview for your Fund in this report. |
| | |
| * | Six-month returns are cumulative; all other returns are annualized. |
| | |
| ** | Refer to Glossary of Terms Used in this Report for definitions. Indexes and Lipper averages are not available for direct investment. |
For the six months ended August 31, 2012, the cumulative returns on common share net asset value (NAV) for all four Arizona Funds exceeded the return for the S&P Arizona Municipal Bond Index and NTX outperformed the S&P Texas Municipal Bond Index. All five of the Funds also outperformed the S&P Municipal Bond Index. For this same period, NAZ, NFZ, NKR and NTX exceeded the average return for the Lipper Other States Municipal Debt Funds Classification Average, while NXE trailed the Lipper average.
Key management factors that influenced the Funds’ returns during this period included duration and yield curve positioning, credit exposure and sector allocation. The use of regulatory leverage also was an important positive factor affecting the Funds’ performance. Leverage is discussed in more detail later in this report.
In an environment of declining rates and flattening yield curve, municipal bonds with longer maturities generally outperformed those with shorter maturities during this period. Overall, credits at the longest end of the municipal yield curve posted the strongest returns, while bonds at the shortest end produced the weakest results. For the period, duration and yield curve positioning was a positive contributor to the performance of all of these Funds, which had heavier exposures to the outperforming longer segments of the yield curve and correspondingly smaller weightings in the shorter parts of the curve that produced weaker returns. The performance of NXE, which had the shortest duration among the Arizona Funds, was marginally impacted by its shorter positioning. In addition, NTX benefited from its holdings of zero coupon bonds, which generally outperformed the market during this period due to their longer durations.
Credit exposure was another important factor in the Funds’ performance during these six months, as lower quality bonds generally outperformed higher quality bonds. This outperformance was due in part to the greater demand for lower-rated bonds as investors looked for investment vehicles offering higher yields. As investors became more comfortable taking on additional investment risk, credit spreads, or the difference in yield spreads between U.S. Treasury securities and comparable investments such as municipal bonds, narrowed through a variety of rating categories. As a result of this spread compression, the Funds benefited from their heavier exposure to lower rated credits and their underweightings in bonds rated AAA and AA.
During this period, revenue bonds as a whole outperformed the general municipal market. Holdings that generally made positive contributions to the Funds’ returns included health care (together with hospitals), education, housing and transportation credits. All of the Arizona Funds benefited from good weightings in the health care sector. This was especially true in NAZ, where the Fund’s health care holdings had a
better call structure than those of the other Arizona Funds and thus a longer duration, which contributed to performance during this period.
In contrast, pre-refunded bonds, which are typically backed by U.S. Treasury securities, were the poorest performing market segment during this period. The underperformance of these bonds can be attributed primarily to their shorter effective maturities and higher credit quality. Among these five Funds, NKR had the smallest allocation of pre-refunded bonds, while an overweighting in these bonds detracted from the performance of NTX. Although holdings of previously pre-refunded bonds were generally detrimental to performance during this period, NFZ benefited from having bonds pre-refunded during this period, as bonds that had been trading at a discount were called at par. General obligation (GO) bonds and utilities credits also lagged the performance of the general municipal market for this period. While all of the Arizona Funds were overweight in GO and other tax supported bonds, NAZ had the smallest allocation of these bonds, which lessened the impact of these holdings.
APPROVED FUND REORGANIZATIONS
On April 18, 2012, the Funds’ Board of Directors/Trustees approved a series of reorganizations for all the Arizona Funds included in this report. The reorganizations are intended to create a single larger state Fund, which would potentially offer shareholders the following benefits:
| • | | Lower Fund expense ratios (excluding the effects of leverage), as fixed costs are spread over a larger asset base; |
| | | |
| • | | Enhanced secondary market trading, as larger Funds potentially make it easier for investors to buy and sell Fund shares; |
| | | |
| • | | Lower per share trading costs through reduced bid/ask spreads due to a larger common share float; and |
| | | |
| • | | Increased Fund flexibility in managing the structure and cost of leverage over time. |
The approved reorganizations are as follows:
| Acquired Funds | | Symbol | | Acquiring Fund | | Symbol |
| • | Nuveen Arizona Dividend | | NFZ | | | | |
| | Advantage Municipal Fund | | | | | | |
| • | Nuveen Arizona Dividend | | NKR | | Nuveen Arizona Premium | | NAZ |
| | Advantage Municipal Fund 2 | | | | Income Municipal Fund, Inc. | | |
| • | Nuveen Arizona Dividend | | NXE | | | | |
| | Advantage Municipal Fund 3 | | | | | | |
If shareholders approve the reorganizations, and upon the closing of the reorganizations, the Acquired Funds will transfer their assets to the Acquiring Fund in exchange for common and preferred shares of the Acquiring Fund, and the assumption by the Acquiring Fund of the liabilities of the Acquired Funds. The Acquired Funds will then be liquidated, dissolved and terminated in accordance with their Declaration of Trust.
In addition, shareholders of the Acquired Funds will become shareholders of the Acquiring Fund. Holders of common shares will receive newly issued common shares of the Acquiring Fund, the aggregate net asset value of which will be equal to the aggregate net asset value of the common shares of the Acquired Funds held immediately prior to the reorganizations (including for this purpose fractional Acquiring Fund shares to which shareholders would be entitled). Fractional shares will be sold on the open market and shareholders will receive cash in lieu of such fractional shares. Holders of preferred shares of each Acquired Fund will receive on a one-for-one basis newly issued preferred shares of the Acquiring Fund, in exchange for preferred shares of the Acquired Funds held immediately prior to the reorganization.
Fund Leverage and
Other Information
IMPACT OF THE FUNDS’ LEVERAGE STRATEGIES ON PERFORMANCE
One important factor impacting the return of the Funds relative to their benchmarks was the Funds’ use of leverage. The Funds use leverage because their managers believe that, over time, leveraging provides opportunities for additional income and total return for common shareholders. However, use of leverage also can expose common shareholders to additional volatility. For example, as the prices of securities held by a Fund decline, the negative impact of these valuation changes on common share net asset value and common shareholder total return is magnified by the use of leverage. Conversely, leverage may enhance common share returns during periods when the prices of securities held by a Fund generally are rising. Leverage had a positive impact on the performance of the Funds over this reporting period.
THE FUNDS’ REGULATORY LEVERAGE
As of August 31, 2012, the Funds have issued and outstanding MuniFund Term Preferred (MTP) Shares and Variable Rate MuniFund Term Preferred (VMTP) Shares as shown in the accompanying tables.
MTP Shares
| | | | | | | | | | | | | | |
| | | | | MTP Shares Issued | | | Annual | | | NYSE | |
| Fund | | | Series | at Liquidation Value | | | Interest Rate | | | Ticker | |
| NFZ | | | 2015 | | $ | 11,100,000 | | | 2.05% | | | NFZ PrC | |
| NKR | | | 2015 | | $ | 18,725,000 | | | 2.05% | | | NKR PrC | |
| NXE | | | 2016 | | $ | 20,846,000 | | | 2.90% | | | NXE PrC | |
| NTX | | | 2015 | | $ | 70,920,000 | | | 2.30% | | | NTX PrC | |
VMTP Shares
| | | | | | | | |
| | | | | | VMTP Shares Issued | |
| Fund | | | Series | | at Liquidation Value | |
| NAZ | | | 2014 | | $ | 28,000,000 | |
(Refer to Notes to Financial Statements, Footnote 1 – General Information and Significant Accounting Policies for further details on MTP and VMTP Shares.)
RISK CONSIDERATIONS
Fund shares are not guaranteed or endorsed by any bank or other insured depository institution, and are not federally insured by the Federal Deposit Insurance Corporation. Past performance is no guarantee of future results. Fund common shares are subject to a variety of risks, including:
Investment and Market Risk. An investment in common shares is subject to investment risk, including the possible loss of the entire principal amount that you invest. Your investment in common shares represents an indirect investment in the municipal securities owned by the Fund, which generally trade in the over-the-counter markets. Your common shares at any point in time may be worth less than your original investment, even after taking into account the reinvestment of Fund dividends and distributions.
Price Risk. Shares of closed-end investment companies like these Funds frequently trade at a discount to their NAV. Your common shares at any point in time may be worth less than your original investment, even after taking into account the reinvestment of Fund dividends and distributions.
Leverage Risk. Each Fund’s use of leverage creates the possibility of higher volatility for the Fund’s per share NAV, market price, distributions and returns. There is no assurance that a Fund’s leveraging strategy will be successful.
Tax Risk. The tax treatment of Fund distributions may be affected by new IRS interpretations of the Internal Revenue Code and future changes in tax laws and regulations.
Issuer Credit Risk. This is the risk that a security in a Fund’s portfolio will fail to make dividend or interest payments when due.
Interest Rate Risk. Fixed-income securities such as bonds, preferred, convertible and other debt securities will decline in value if market interest rates rise.
Reinvestment Risk. If market interest rates decline, income earned from a Fund’s portfolio may be reinvested at rates below that of the original bond that generated the income.
Call Risk or Prepayment Risk. Issuers may exercise their option to prepay principal earlier than scheduled, forcing a Fund to reinvest in lower-yielding securities.
Inverse Floater Risk. The Funds invest in inverse floaters. Due to their leveraged nature, these investments can greatly increase a Fund’s exposure to interest rate risk and credit risk. In addition, investments in inverse floaters involve the risk that the Fund could lose more than its original principal investment.
Common Share Dividend
and Price Information
DIVIDEND INFORMATION
During the six-month reporting period ended August 31, 2012, NFZ, NXE and NTX each had one monthly dividend decrease, while the dividends of NAZ and NKR remained stable throughout the reporting period.
All of the Funds in this report seek to pay stable dividends at rates that reflect each Fund’s past results and projected future performance. During certain periods, each Fund may pay dividends at a rate that may be more or less than the amount of net investment income actually earned by the Fund during the period. If a Fund has cumulatively earned more than it has paid in dividends, it holds the excess in reserve as undistributed net investment income (UNII) as part of the Fund’s NAV. Conversely, if a Fund has cumulatively paid dividends in excess of its earnings, the excess constitutes negative UNII that is likewise reflected in the Fund’s NAV. Each Fund will, over time, pay all of its net investment income as dividends to shareholders. As of August 31, 2012, all five of the Funds in this report had positive UNII balances, based upon our best estimate, for tax purposes. NAZ, NKR and NTX had positive UNII balances, while NFZ and NXE had negative UNII balances for financial reporting purposes.
COMMON SHARE REPURCHASES AND PRICE INFORMATION
As of August 31, 2012, and since the inception of the Funds’ repurchase programs, the Funds have cumulatively repurchased and retired their outstanding common shares as shown in the accompanying table. Since the inception of the Funds’ repurchase programs, NAZ and NTX have not repurchased any of their outstanding common shares.
| | | | Common Shares | | | % of Outstanding |
| Fund | | | Repurchased and Retired | | | Common Shares |
| NFZ | | | 2,500 | | | 0.2% | |
| NKR | | | 800 | | | 0.0% | * |
| NXE | | | 1,600 | | | 0.1% | |
| * | Rounds to less than 0.1%. |
During the six-month reporting period, the Funds did not repurchase any of their outstanding common shares.
As of August 31, 2012, and during the current reporting period, the Funds’ common share prices were trading at (+) premiums and/or (-) discounts to their common share NAVs as shown in the accompanying table.
| | | | | | | | |
| | | | 8/31/12 | | | Six-Month Average |
| Fund | | | (+)Premium/(-)Discount | | | (+)Premium/(-)Discount |
| NAZ | | | (+)4.14% | | | (+)0.71 | % |
| NFZ | | | (-)2.07% | | | (-)3.98 | % |
| NKR | | | (+)0.38% | | | (-)2.42 | % |
| NXE | | | (-)2.17% | | | (-)4.33 | % |
| NTX | | | (+)7.97% | | | (+)6.68 | % |
| NAZ | | Nuveen Arizona |
| Performance | | Premium Income |
| | Municipal Fund, Inc. |
| | | as of August 31, 2012 |
| | | | | |
| Fund Snapshot | | | | |
| Common Share Price | | $ | 15.84 | |
| Common Share Net Asset Value (NAV) | | $ | 15.21 | |
| Premium/(Discount) to NAV | | | 4.14 | % |
| Market Yield | | | 4.85 | % |
Taxable-Equivalent Yield1 | | | 7.06 | % |
| Net Assets Applicable to Common Shares ($000) | | $ | 68,016 | |
| Leverage | | | | |
| Regulatory Leverage | | | 29.16 | % |
| Effective Leverage | | | 30.71 | % |
| Average Annual Total Returns | | | | | | | |
| (Inception 11/19/92) | | | | | | | |
| | | | On Share Price | | On NAV |
| 6-Month (Cumulative) | | | 11.22 | % | | 5.29 | % |
| 1-Year | | | 28.63 | % | | 14.80 | % |
| 5-Year | | | 10.01 | % | | 7.40 | % |
| 10-Year | | | 4.73 | % | | 6.03 | % |
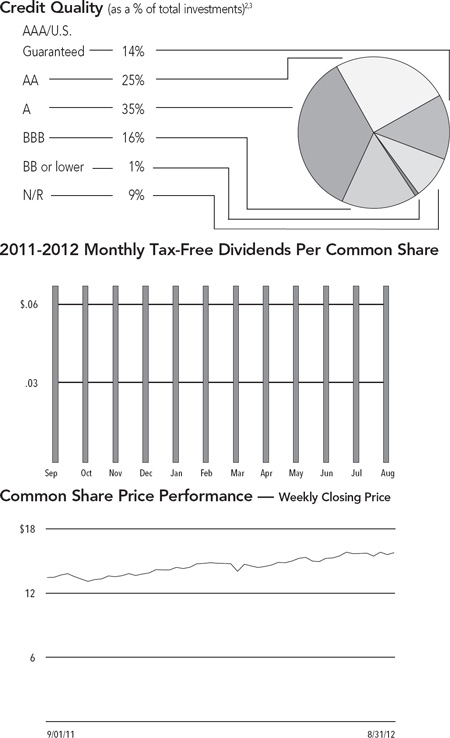
Portfolio Composition3 | | | | |
| (as a % of total investments) | | | | |
| Tax Obligation/Limited | | | 25.2 | % |
| Utilities | | | 18.7 | % |
| Health Care | | | 18.1 | % |
| Education and Civic Organizations | | | 13.0 | % |
| Tax Obligation/General | | | 8.3 | % |
| Water and Sewer | | | 7.9 | % |
| U.S. Guaranteed | | | 7.7 | % |
| Other | | | 1.1 | % |
| | Refer to the Glossary of Terms Used in this Report for further definition of the terms used within this Fund’s Performance Overview page. |
| 1 | Taxable-Equivalent Yield represents the yield that must be earned on a fully taxable investment in order to equal the yield of the Fund on an after-tax basis. It is based on a combined federal and state income tax rate of 31.3%. When comparing this Fund to investments that generate qualified dividend income, the Taxable-Equivalent Yield is lower. |
| 2 | Ratings shown are the highest rating given by one of the following national rating agencies: Standard & Poor’s Group, Moody’s Investors Service, Inc. or Fitch, Inc. Credit ratings are subject to change. AAA, AA, A, and BBB are investment grade ratings; BB, B, CCC, CC, C and D are below-investment grade ratings.Certain bonds backed by U.S. Government or agency securities are regarded as having an implied rating equal to the rating of such securities. Holdings designated N/R are not rated by these national rating agencies. |
| 3 | Holdings are subject to change. |
| NFZ | | Nuveen Arizona |
| Performance | | Dividend Advantage |
| | Municipal Fund |
| | | as of August 31, 2012 |
| | | | | |
| Fund Snapshot | | | | |
| Common Share Price | | $ | 15.15 | |
| Common Share Net Asset Value (NAV) | | $ | 15.47 | |
| Premium/(Discount) to NAV | | | -2.07 | % |
| Market Yield | | | 4.83 | % |
Taxable-Equivalent Yield1 | | | 7.03 | % |
| Net Assets Applicable to Common Shares ($000) | | $ | 23,947 | |
| Leverage | | | | |
| Regulatory Leverage | | | 31.67 | % |
| Effective Leverage | | | 34.80 | % |
| Average Annual Total Returns | | | | | | | |
| (Inception 1/30/01) | | | | | | | |
| | | | On Share Price | | On NAV |
| 6-Month (Cumulative) | | | 8.00 | % | | 5.14 | % |
| 1-Year | | | 22.86 | % | | 14.72 | % |
| 5-Year | | | 8.45 | % | | 7.14 | % |
| 10-Year | | | 5.70 | % | | 5.95 | % |
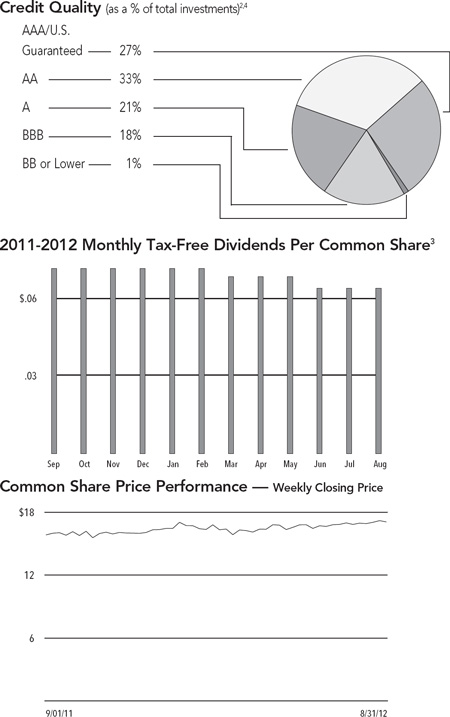
Portfolio Composition3 | | | | |
| (as a % of total investments) | | | | |
| Tax Obligation/Limited | | | 30.6 | % |
| Health Care | | | 17.4 | % |
| Utilities | | | 17.2 | % |
| Tax Obligation/General | | | 12.3 | % |
| U.S. Guaranteed | | | 9.3 | % |
| Education and Civic Organizations | | | 9.1 | % |
| Other | | | 4.1 | % |
| | Refer to the Glossary of Terms Used in this Report for further definition of the terms used within this Fund’s Performance Overview page. |
| 1 | Taxable-Equivalent Yield represents the yield that must be earned on a fully taxable investment in order to equal the yield of the Fund on an after-tax basis. It is based on a combined federal and state income tax rate of 31.3%. When comparing this Fund to investments that generate qualified dividend income, the Taxable-Equivalent Yield is lower. |
| 2 | Ratings shown are the highest rating given by one of the following national rating agencies: Standard & Poor’s Group, Moody’s Investors Service, Inc. or Fitch, Inc. Credit ratings are subject to change. AAA, AA, A, and BBB are investment grade ratings; BB, B, CCC, CC, C and D are below-investment grade ratings. Certain bonds backed by U.S. Government or agency securities are regarded as having an implied rating equal to the rating of such securities. Holdings designated N/R are not rated by these national rating agencies. |
| 3 | Holdings are subject to change. |
| NKR | | Nuveen Arizona |
| Performance | | Dividend Advantage |
| | Municipal Fund 2 |
| | | as of August 31, 2012 |
| | | | | |
| Fund Snapshot | | | | |
| Common Share Price | | $ | 15.78 | |
| Common Share Net Asset Value (NAV) | | $ | 15.72 | |
| Premium/(Discount) to NAV | | | 0.38 | % |
| Market Yield | | | 5.10 | % |
Taxable-Equivalent Yield1 | | | 7.42 | % |
| Net Assets Applicable to Common Shares ($000) | | $ | 38,359 | |
| Leverage | | | | |
| Regulatory Leverage | | | 32.80 | % |
| Effective Leverage | | | 34.35 | % |
| Average Annual Total Returns | | | | | | | |
| (Inception 3/25/02) | | | | | | | |
| | | | On Share Price | | On NAV |
| 6-Month (Cumulative) | | | 9.61 | % | | 4.82 | % |
| 1-Year | | | 24.87 | % | | 13.89 | % |
| 5-Year | | | 6.78 | % | | 7.26 | % |
| 10-Year | | | 6.36 | % | | 6.15 | % |
Portfolio Composition3 | | | | |
| (as a % of total investments) | | | | |
| Tax Obligation/Limited | | | 31.4 | % |
| Health Care | | | 22.7 | % |
| Tax Obligation/General | | | 18.0 | % |
| Education and Civic Organizations | | | 10.7 | % |
| Utilities | | | 7.5 | % |
| Water and Sewer | | | 6.6 | % |
| Other | | | 3.1 | % |
| | Refer to the Glossary of Terms Used in this Report for further definition of the terms used within this Fund’s Performance Overview page. |
| 1 | Taxable-Equivalent Yield represents the yield that must be earned on a fully taxable investment in order to equal the yield of the Fund on an after-tax basis. It is based on a combined federal and state income tax rate of 31.3%. When comparing this Fund to investments that generate qualified dividend income, the Taxable-Equivalent Yield is lower. |
| 2 | Ratings shown are the highest rating given by one of the following national rating agencies: Standard & Poor’s Group, Moody’s Investors Service, Inc. or Fitch, Inc. Credit ratings are subject to change. AAA, AA, A, and BBB are investment grade ratings; BB, B, CCC, CC, C and D are below-investment grade ratings. Certain bonds backed by U.S. Government or agency securities are regarded as having an implied rating equal to the rating of such securities. Holdings designated N/R are not rated by these national rating agencies. |
| 3 | Holdings are subject to change. |
| NXE | | Nuveen Arizona |
| Performance | | Dividend Advantage |
| | Municipal Fund 3 |
| | | as of August 31, 2012 |
| | | | | |
| Fund Snapshot | | | | |
| Common Share Price | | $ | 14.91 | |
| Common Share Net Asset Value (NAV) | | $ | 15.24 | |
| Premium/(Discount) to NAV | | | -2.17 | % |
| Market Yield | | | 4.83 | % |
Taxable-Equivalent Yield1 | | | 7.03 | % |
| Net Assets Applicable to Common Shares ($000) | | $ | 46,718 | |
| Leverage | | | | |
| Regulatory Leverage | | | 30.85 | % |
| Effective Leverage | | | 33.15 | % |
| Average Annual Total Returns | | | | | | | |
| (Inception 9/25/02) | | | | | | | |
| | | | On Share Price | | On NAV |
| 6-Month (Cumulative) | | | 7.10 | % | | 4.32 | % |
| 1-Year | | | 21.84 | % | | 13.02 | % |
| 5-Year | | | 8.18 | % | | 7.27 | % |
| Since Inception | | | 5.53 | % | | 5.97 | % |
Portfolio Composition3 | | | | |
| (as a % of total investments) | | | | |
| Tax Obligation/Limited | | | 31.7 | % |
| Health Care | | | 19.9 | % |
| Utilities | | | 13.0 | % |
| Education and Civic Organizations | | | 11.9 | % |
| Tax Obligation/General | | | 9.0 | % |
| Water and Sewer | | | 5.9 | % |
| Other | | | 8.6 | % |
| | Refer to the Glossary of Terms Used in this Report for further definition of the terms used within this Fund’s Performance Overview page. |
| 1 | Taxable-Equivalent Yield represents the yield that must be earned on a fully taxable investment in order to equal the yield of the Fund on an after-tax basis. It is based on a combined federal and state income tax rate of 31.3%. When comparing this Fund to investments that generate qualified dividend income, the Taxable-Equivalent Yield is lower. |
| 2 | Ratings shown are the highest rating given by one of the following national rating agencies: Standard & Poor’s Group, Moody’s Investors Service, Inc. or Fitch, Inc. Credit ratings are subject to change. AAA, AA, A, and BBB are investment grade ratings; BB, B, CCC, CC, C and D are below-investment grade ratings. Certain bonds backed by U.S. Government or agency securities are regarded as having an implied rating equal to the rating of such securities. Holdings designated N/R are not rated by these national rating agencies. |
| 3 | Holdings are subject to change. |
| NTX | | Nuveen Texas |
| Performance | | Quality Income |
| | Municipal Fund |
| | | as of August 31, 2012 |
| | | | | |
| Fund Snapshot | | | | |
| Common Share Price | | $ | 17.07 | |
| Common Share Net Asset Value (NAV) | | $ | 15.81 | |
| Premium/(Discount) to NAV | | | 7.97 | % |
| Market Yield | | | 4.50 | % |
Taxable-Equivalent Yield1 | | | 6.25 | % |
| Net Assets Applicable to Common Shares ($000) | | $ | 151,861 | |
| Leverage | | | | |
| Regulatory Leverage | | | 31.83 | % |
| Effective Leverage | | | 33.02 | % |
| Average Annual Total Returns | | | | | | | |
| (Inception 10/17/91) | | | | | | | |
| | | | On Share Price | | On NAV |
| 6-Month (Cumulative) | | | 7.28 | % | | 4.90 | % |
| 1-Year | | | 12.89 | % | | 12.85 | % |
| 5-Year | | | 10.44 | % | | 7.38 | % |
| 10-Year | | | 7.28 | % | | 6.28 | % |
Portfolio Composition4 | | | | |
| (as a % of total investments) | | | | |
| Tax Obligation/General | | | 23.1 | % |
| U.S. Guaranteed | | | 11.8 | % |
| Tax Obligation/Limited | | | 11.6 | % |
| Utilities | | | 10.8 | % |
| Transportation | | | 10.3 | % |
| Water and Sewer | | | 9.6 | % |
| Health Care | | | 9.1 | % |
| Education and Civic Organizations | | | 7.7 | % |
| Other | | | 6.0 | % |
| | Refer to the Glossary of Terms Used in this Report for further definition of the terms used within this Fund’s Performance Overview page. |
| 1 | Taxable-Equivalent Yield represents the yield that must be earned on a fully taxable investment in order to equal the yield of the Fund on an after-tax basis. It is based on a federal income tax rate of 28%. When comparing this Fund to investments that generate qualified dividend income, the Taxable-Equivalent Yield is lower. |
| 2 | Ratings shown are the highest rating given by one of the following national rating agencies: Standard & Poor’s Group, Moody’s Investors Service, Inc. or Fitch, Inc. Credit ratings are subject to change. AAA, AA, A, and BBB are investment grade ratings; BB, B, CCC, CC, C and D are below-investment grade ratings. Certain bonds backed by U.S. Government or agency securities are regarded as having an implied rating equal to the rating of such securities. Holdings designated N/R are not rated by these national rating agencies. |
| 3 | The Fund paid shareholders a capital gains distribution in December 2011 of $0.0259 per share. |
| 4 | Holdings are subject to change. |
| NFZ | | Shareholder Meeting Report |
| NKR | | |
| NXE | | The annual meeting of shareholders for NFZ, NKR and NXE was held in the offices of Nuveen Investments on November 15, 2011; at this meeting the shareholders were asked to vote on the election of Board Members, the elimination of Fundamental Investment Policies and the approval of new Fundamental Investment Policies. The meeting was subsequently adjourned to December 16, 2011. The meeting was additionally adjourned to January 31, 2012 and March 5, 2012. The meeting for NKR was subsequently adjourned to March 14, 2012. |
| | | | NFZ | | | NKR | | | NXE | |
| | | | Common and | | | | | | Common and | | | | | | Common and | | | | |
| | | | Preferred | | | Preferred | | | Preferred | | | Preferred | | | Preferred | | | Preferred | |
| | | | shares voting | | | shares voting | | | shares voting | | | shares voting | | | shares voting | | | shares voting | |
| | | | together | | | together | | | together | | | together | | | together | | | together | |
| | | | as a class | | | as a class | | | as a class | | | as a class | | | as a class | | | as a class | |
| To approve the elimination of the fundamental policies relating to the Fund’s ability to make loans. | | | | | | | | | | | | | | | | | | | |
| For | | | 1,186,605 | | | 417,800 | | | 2,006,923 | | | 737,175 | | | 2,407,059 | | | 736,200 | |
| Against | | | 191,784 | | | 134,900 | | | 233,141 | | | 111,478 | | | 239,195 | | | 91,800 | |
| Abstain | | | 46,123 | | | 1,000 | | | 77,985 | | | 27,000 | | | 100,908 | | | 20,000 | |
| Broker Non-Votes | | | 212,705 | | | 20,199 | | | 348,065 | | | 79,611 | | | 489,254 | | | 197,749 | |
| Total | | | 1,637,217 | | | 573,899 | | | 2,666,114 | | | 955,264 | | | 3,236,416 | | | 1,045,749 | |
| To approve the new fundamental policy relating to the Fund’s ability to make loans. | | | | | | | | | | | | | | | | | | | |
| For | | | 1,189,255 | | | 417,800 | | | 2,001,261 | | | 737,175 | | | 2,387,809 | | | 731,200 | |
| Against | | | 193,534 | | | 134,900 | | | 237,113 | | | 111,478 | | | 255,195 | | | 96,800 | |
| Abstain | | | 41,723 | | | 1,000 | | | 79,675 | | | 27,000 | | | 104,158 | | | 20,000 | |
| Broker Non-Votes | | | 212,705 | | | 20,199 | | | 348,065 | | | 79,611 | | | 489,254 | | | 197,749 | |
| Total | | | 1,637,217 | | | 573,899 | | | 2,666,114 | | | 955,264 | | | 3,236,416 | | | 1,045,749 | |
| | | Nuveen Arizona Premium Income Municipal Fund, Inc. |
| NAZ | | Portfolio of Investments |
| | | August 31, 2012 (Unaudited) |
| | Principal | | | Optional Call | | | | |
| | Amount (000) | | Description (1) | Provisions (2) | Ratings (3) | | Value | |
| | | | Consumer Staples – 1.1% (0.8% of Total Investments) | | | | | |
| $ | 730 | | Puerto Rico, The Children’s Trust Fund, Tobacco Settlement Asset-Backed Refunding Bonds, Series 2002, 5.375%, 5/15/33 | 11/12 at 100.00 | BBB+ | $ | 729,985 | |
| | | | Education and Civic Organizations – 18.2% (13.0% of Total Investments) | | | | | |
| | 2,500 | | Arizona Higher Education Loan Authority, Student Loan Revenue Bonds, Series 2007B, Auction Rate Securities, 0.525%, 11/01/41 (Alternative Minimum Tax) (4) | 10/12 at 100.00 | A | | 1,951,904 | |
| | | | Arizona State University, System Revenue Bonds, Series 2005: | | | | | |
| | 1,455 | | 5.000%, 7/01/20 – AMBAC Insured | 7/15 at 100.00 | Aa3 | | 1,613,930 | |
| | 750 | | 5.000%, 7/01/21 – AMBAC Insured | 7/15 at 100.00 | Aa3 | | 831,923 | |
| | 755 | | Glendale Industrial Development Authority, Arizona, Revenue Bonds, Midwestern University, Refunding Series 2007, 5.000%, 5/15/31 | 5/22 at 100.00 | A– | | 833,407 | |
| | 1,600 | | Glendale Industrial Development Authority, Arizona, Revenue Bonds, Midwestern University, Refunding Series 2010, 5.125%, 5/15/40 | 5/20 at 100.00 | A+ | | 1,705,696 | |
| | 280 | | Phoenix Industrial Development Authority, Arizona, Education Facility Revenue Bonds, Brighter Choice Foundation Charter Middle Schools Project, Series 2012, 7.500%, 7/01/42 | 7/22 at 100.00 | BB+ | | 291,813 | |
| | 220 | | Phoenix Industrial Development Authority, Arizona, Education Revenue Bonds, Great Hearts Academies – Veritas Project, Series 2012, 6.300%, 7/01/42 | 7/21 at 100.00 | BBB | | 235,275 | |
| | 280 | | Phoenix Industrial Development Authority, Arizona, Education Revenue Bonds, Painted Rock Academy Charter School Project, Series 2012A, 7.500%, 7/01/42 | 7/20 at 100.00 | N/R | | 293,443 | |
| | 1,400 | | Phoenix Industrial Development Authority, Arizona, Lease Revenue Bonds, Rowan University Project, Series 2012, 5.000%, 6/01/42 – AGM Insured | 6/22 at 100.00 | A+ | | 1,510,264 | |
| | 280 | | Pima County Industrial Development Authority, Arizona, Education Revenue Bonds, Carden Traditional Schools Project, Series 2012, 7.500%, 1/01/42 | 1/22 at 100.00 | BBB– | | 300,748 | |
| | | | Pima County Industrial Development Authority, Arizona, Education Revenue Bonds, Paradise Education Center Project, Series 2010: | | | | | |
| | 170 | | 6.000%, 6/01/40 | 6/19 at 100.00 | BBB– | | 173,378 | |
| | 200 | | 6.100%, 6/01/45 | 6/19 at 100.00 | BBB– | | 204,298 | |
| | 1,500 | | Tempe Industrial Development Authority, Arizona, Lease Revenue Bonds, Arizona State University Foundation Project, Series 2003, 5.000%, 7/01/34 – AMBAC Insured | 7/13 at 100.00 | N/R | | 1,510,185 | |
| | 825 | | Yavapai County Industrial Development Authority, Arizona, Charter School Revenue Bonds, Arizona Agribusiness and Equine Center Charter School, Series 2011, 7.875%, 3/01/42 | 3/21 at 100.00 | BB+ | | 931,112 | |
| | 12,215 | | Total Education and Civic Organizations | | | | 12,387,376 | |
| | | | Health Care – 25.3% (18.1% of Total Investments) | | | | | |
| | 1,430 | | Arizona Health Facilities Authority, Hospital Revenue Bonds, Banner Health Systems, Series 2007A, 5.000%, 1/01/25 | 1/17 at 100.00 | AA– | | 1,629,843 | |
| | 885 | | Arizona Health Facilities Authority, Hospital Revenue Bonds, Banner Health Systems, Series 2007B, 1.120%, 1/02/37 | 1/17 at 100.00 | AA– | | 669,237 | |
| | 3,470 | | Arizona Health Facilities Authority, Hospital Revenue Bonds, Banner Health Systems, Series 2008D, 5.500%, 1/01/38 | 1/18 at 100.00 | AA– | | 3,859,194 | |
| | 2,300 | | Arizona Health Facilities Authority, Hospital System Revenue Bonds, Phoenix Children’s Hospital, Refunding Series 2012, 5.000%, 2/01/42 (WI/DD, Settling 9/06/12) | 2/22 at 100.00 | BBB+ | | 2,420,773 | |
| | 675 | | Glendale Industrial Development Authority, Arizona, Revenue Bonds, John C. Lincoln Health Network, Series 2005B, 5.000%, 12/01/37 | 12/15 at 100.00 | BBB+ | | 689,661 | |
| | 1,110 | | Glendale Industrial Development Authority, Arizona, Revenue Bonds, John C. Lincoln Health Network, Series 2007, 5.000%, 12/01/42 | 12/17 at 100.00 | BBB+ | | 1,143,733 | |
| | 2,150 | | Maricopa County Industrial Development Authority, Arizona, Health Facility Revenue Bonds, Catholic Healthcare West, Series 2004A, 5.375%, 7/01/23 | 7/14 at 100.00 | A+ | | 2,261,800 | |
| | 2,900 | | Maricopa County Industrial Development Authority, Arizona, Health Facility Revenue Bonds, Catholic Healthcare West, Series 2007A, 5.250%, 7/01/32 | 7/17 at 100.00 | A+ | | 3,141,831 | |
| | Principal | | | Optional Call | | | | |
| | Amount (000) | | Description (1) | Provisions (2) | Ratings (3) | | Value | |
| | | | Health Care (continued) | | | | | |
| $ | 425 | | Puerto Rico Industrial, Tourist, Educational, Medical and Environmental Control Facilities Financing Authority, Hospital Revenue Bonds, Hospital de la Concepcion, Series 2000A, 6.375%, 11/15/15 | 11/12 at 100.00 | AA+ | $ | 427,057 | |
| | | | Show Low Industrial Development Authority, Arizona, Hospital Revenue Bonds, Navapache Regional Medical Center, Series 2005: | | | | | |
| | 525 | | 5.000%, 12/01/25 – RAAI Insured | 12/15 at 100.00 | BBB+ | | 541,448 | |
| | 435 | | 5.000%, 12/01/30 – RAAI Insured | 12/15 at 100.00 | BBB+ | | 445,375 | |
| | 16,305 | | Total Health Care | | | | 17,229,952 | |
| | | | Long-Term Care – 0.5% (0.3% of Total Investments) | | | | | |
| | 295 | | Tempe Industrial Development Authority, Arizona, Revenue Bonds, Friendship Village of Tempe Project, Refunding Series 2012A, 6.000%, 12/01/32 | 12/21 at 100.00 | N/R | | 317,287 | |
| | | | Tax Obligation/General – 11.6% (8.3% of Total Investments) | | | | | |
| | 420 | | El Mirage, Arizona, General Obligation Bonds Series 2012, 5.000%, 7/01/42 – AGM Insured | 7/22 at 100.00 | AA– | | 467,023 | |
| | 1,265 | | Gila County Unified School District 10 Payson, Arizona, School Improvement Bonds, Project 2006, Series 2008B, 5.750%, 7/01/28 | 7/18 at 100.00 | Aa3 | | 1,473,004 | |
| | 1,200 | | Maricopa County Unified School District 95 Queen Creek, Arizona, General Obligation Bonds, Series 2008, 5.000%, 7/01/27 – AGM Insured | 7/18 at 100.00 | Aa3 | | 1,332,600 | |
| | 515 | | Pima County Continental Elementary School District 39, Arizona, General Obligation Bonds, Series 2011A, 6.000%, 7/01/30 – AGM Insured | 7/21 at 100.00 | AA– | | 646,675 | |
| | 3,530 | | Pinal County Unified School District 1, Florence, Arizona, General Obligation Bonds, Series 2008C, 5.250%, 7/01/28 | 7/18 at 100.00 | A | | 3,957,023 | |
| | 6,930 | | Total Tax Obligation/General | | | | 7,876,325 | |
| | | | Tax Obligation/Limited – 35.1% (25.2% of Total Investments) | | | | | |
| | 990 | | Arizona Sports and Tourism Authority, Senior Revenue Refunding Bonds, Multipurpose Stadium Facility Project, Series 2012A, 5.000%, 7/01/36 | 7/22 at 100.00 | A1 | | 1,093,089 | |
| | 275 | | Buckeye, Arizona, Festival Ranch Community Facilities District District General Obligation Bonds, Series 2012, 5.000%, 7/15/31 | 7/22 at 100.00 | BBB | | 285,959 | |
| | 300 | | Estrella Mountain Ranch Community Facilities District, Goodyear, Arizona, Special Assessment Lien Bonds, Series 2001A, 7.875%, 7/01/25 | 1/13 at 100.00 | N/R | | 300,570 | |
| | 3,000 | | Glendale Western Loop 101 Public Facilities Corporation, Arizona, Third Lien Excise Tax Revenue Bonds, Series 2008B, 6.250%, 7/01/38 | 1/14 at 100.00 | AA | | 3,186,720 | |
| | 1,280 | | Greater Arizona Development Authority, Infrastructure Revenue Bonds, Series 2006-1, 5.000%, 8/01/22 – NPFG Insured | 8/16 at 100.00 | AA– | | 1,455,744 | |
| | 740 | | Greater Arizona Development Authority, Infrastructure Revenue Bonds, Series 2006A, 5.000%, 8/01/23 – NPFG Insured | 8/16 at 100.00 | A1 | | 824,523 | |
| | 1,095 | | Marana Municipal Property Corporation, Arizona, Municipal Facilities Revenue Bonds, Series 2008B, 5.125%, 7/01/28 | 1/13 at 100.00 | AA | | 1,109,060 | |
| | 575 | | Marana Municipal Property Corporation, Arizona, Revenue Bonds, Series 2003, 5.000%, 7/01/28 – AMBAC Insured | 7/13 at 100.00 | AA | | 585,396 | |
| | 1,342 | | Marana, Arizona, Tangerine Farms Road Improvement District Revenue Bonds, Series 2006, 4.600%, 1/01/26 | 7/16 at 100.00 | A2 | | 1,389,936 | |
| | 3,400 | | Mesa, Arizona, Street and Highway User Tax Revenue Bonds, Series 2005, 5.000%, 7/01/24 – AGM Insured | 7/15 at 100.00 | AA | | 3,632,934 | |
| | 170 | | Phoenix Mesa Gateway Airport Authority, Arizona, Special Facility Revenue Bonds, Mesa Project, Series 2012, 5.000%, 7/01/38 (Alternative Minimum Tax) | 7/22 at 100.00 | AA+ | | 178,825 | |
| | 1,140 | | Pinetop Fire District of Navajo County, Arizona, Certificates of Participation, Series 2008, 7.750%, 6/15/29 | 6/16 at 102.00 | A3 | | 1,223,300 | |
| | 135 | | Puerto Rico Public Buildings Authority, Guaranteed Government Facilities Revenue Refunding Bonds, Series 2002D, 5.125%, 7/01/24 | 1/13 at 100.00 | Baa1 | | 135,211 | |
| | | Nuveen Arizona Premium Income Municipal Fund, Inc. (continued) |
| NAZ | | Portfolio of Investments |
| | | August 31, 2012 (Unaudited) |
| | Principal | | | Optional Call | | | | |
| | Amount (000) | | Description (1) | Provisions (2) | Ratings (3) | | Value | |
| | | | Tax Obligation/Limited (continued) | | | | | |
| $ | 1,525 | | Puerto Rico Sales Tax Financing Corporation, Sales Tax Revenue Bonds, First Subordinate Series 2010A, 0.000%, 8/01/33 | No Opt. Call | A+ | $ | 492,529 | |
| | 1,700 | | Puerto Rico Sales Tax Financing Corporation, Sales Tax Revenue Bonds, First Subordinate Series 2010C, 0.000%, 8/01/38 | No Opt. Call | A+ | | 391,680 | |
| | 1,610 | | San Luis Civic Improvement Corporation, Arizona, Municipal Facilities Excise Tax Revenue Bonds, Series 2005, 5.000%, 7/01/25 – SYNCORA GTY Insured | 7/15 at 100.00 | A+ | | 1,701,496 | |
| | 1,000 | | Scottsdale Municipal Property Corporation, Arizona, Excise Tax Revenue Bonds, Refunding Series 2006, 5.000%, 7/01/24 | No Opt. Call | AAA | | 1,284,870 | |
| | 2,000 | | Scottsdale Municipal Property Corporation, Arizona, Excise Tax Revenue Bonds, Water & Sewer Improvements Project, Series 2010, 5.000%, 7/01/36 | 7/20 at 100.00 | AAA | | 2,272,080 | |
| | 500 | | Tempe, Arizona, Transit Excise Tax Revenue Obligation Bonds, Refunding Series 2012, 5.000%, 7/01/37 (WI/DD, Settling 9/12/12) | 7/22 at 100.00 | AAA | | 573,805 | |
| | 1,000 | | Virgin Islands Public Finance Authority, Matching Fund Loan Notes Revenue Bonds, Senior Lien Series 2010A, 5.000%, 10/01/29 | 10/20 at 100.00 | BBB+ | | 1,092,640 | |
| | 645 | | Vistancia Community Facilities District, Peoria, Arizona, General Obligation Bonds, Series 2005, 5.750%, 7/15/24 | 7/15 at 100.00 | A1 | | 687,119 | |
| | 24,422 | | Total Tax Obligation/Limited | | | | 23,897,486 | |
| | | | U.S. Guaranteed – 10.7% (7.7% of Total Investments) (5) | | | | | |
| | 3,500 | | Glendale, Arizona, Water and Sewer Revenue Bonds, Subordinate Lien, Series 2003, 5.000%, 7/01/28 (Pre-refunded 7/01/13) – AMBAC Insured | 7/13 at 100.00 | AA (5) | | 3,638,739 | |
| | 1,250 | | Maricopa County Industrial Development Authority, Arizona, Hospital Revenue Refunding Bonds, Samaritan Health Services, Series 1990A, 7.000%, | No Opt. Call | N/R (5) | | 1,461,750 | |
| | | | 12/01/16 – NPFG Insured (ETM) | | | | | |
| | 385 | | Maricopa County, Arizona, Hospital Revenue Bonds, Sun Health Corporation, Series 2005, 5.000%, 4/01/16 (Pre-refunded 4/01/15) | 4/15 at 100.00 | N/R (5) | | 430,680 | |
| | 500 | | Oro Valley Municipal Property Corporation, Arizona, Senior Lien Water Revenue Bonds, Series 2003, 5.000%, 7/01/23 (Pre-refunded 7/01/13) – NPFG Insured | 7/13 at 100.00 | AA (5) | | 519,820 | |
| | 1,200 | | Prescott Valley Municipal Property Corporation, Arizona, Municipal Facilities Revenue Bonds, Series 2003, 5.000%, 1/01/27 (Pre-refunded 1/01/13) – FGIC Insured | 1/13 at 100.00 | AA– (5) | | 1,219,164 | |
| | 6,835 | | Total U.S. Guaranteed | | | | 7,270,153 | |
| | | | Utilities – 26.1% (18.7% of Total Investments) | | | | | |
| | 470 | | Apache County Industrial Development Authority, Arizona, Pollution Control Revenue Bonds, Tucson Electric Power Company, Series 20102A, 4.500%, 3/01/30 | 3/22 at 100.00 | BBB– | | 488,838 | |
| | 1,000 | | Arizona Power Authority, Special Obligation Power Resource Revenue Refunding Crossover Bonds, Hoover Project, Series 2001, 5.250%, 10/01/15 | No Opt. Call | AA | | 1,141,020 | |
| | 1,600 | | Maricopa County Pollution Control Corporation, Arizona, Pollution Control Revenue Refunding Bonds, Southern California Edison Company, Series 2000A, 5.000%, 6/01/35 | 6/20 at 100.00 | A1 | | 1,775,920 | |
| | 1,340 | | Pima County Industrial Development Authority, Arizona, Revenue Bonds, Tucson Electric Power Company, Refunding Series 2008, 5.750%, 9/01/29 | 1/15 at 100.00 | BBB– | | 1,431,509 | |
| | 650 | | Pinal County Electrical District 3, Arizona, Electric System Revenue Bonds, Refunding Series 2011, 5.250%, 7/01/36 | 7/21 at 100.00 | A | | 730,243 | |
| | 2,170 | | Puerto Rico Electric Power Authority, Power Revenue Bonds, Series 2005RR, 5.000%, 7/01/27 – SYNCORA GTY Insured | 7/15 at 100.00 | BBB+ | | 2,324,504 | |
| | 715 | | Salt River Project Agricultural Improvement and Power District, Arizona, Electric System Revenue Bonds, Tender Option Bond Trust 09-9W, 17.940%, 1/01/38 (IF) (6) | 1/18 at 100.00 | Aa1 | | 1,025,339 | |
| | | | Salt Verde Financial Corporation, Arizona, Senior Gas Revenue Bonds, Citigroup Energy Inc Prepay Contract Obligations, Series 2007: | | | | | |
| | 4,500 | | 5.500%, 12/01/29 | No Opt. Call | A– | | 5,071,228 | |
| | 3,500 | | 5.000%, 12/01/37 | No Opt. Call | A– | | 3,739,994 | |
| | 15,945 | | Total Utilities | | | | 17,728,595 | |
| | Principal | | | Optional Call | | | | |
| | Amount (000) | | Description (1) | Provisions (2) | Ratings (3) | | Value | |
| | | | Water and Sewer – 11.0% (7.9% of Total Investments) | | | | | |
| $ | 1,005 | | Cottonwood, Arizona, Senior Lien Water System Revenue Bonds, Municipal Property Corporation, Series 2004, 5.000%, 7/01/24 – SYNCORA GTY Insured | 7/14 at 100.00 | A | $ | 1,030,869 | |
| | 1,425 | | Goodyear, Arizona, Water and Sewer Revenue Obligations, Series 2010, 5.625%, 7/01/39 | 7/20 at 100.00 | A+ | | 1,583,873 | |
| | 1,000 | | Phoenix Civic Improvement Corporation, Arizona, Junior Lien Wastewater System Revenue Bonds, Series 2004, 5.000%, 7/01/24 – NPFG Insured | 7/14 at 100.00 | AA+ | | 1,072,190 | |
| | 1,250 | | Phoenix Civic Improvement Corporation, Arizona, Junior Lien Water System Revenue Refunding Bonds, Series 2001, 5.500%, 7/01/21 – FGIC Insured | No Opt. Call | AAA | | 1,610,788 | |
| | | | Surprise Municipal Property Corporation, Arizona, Wastewater System Revenue Bonds, Series 2007: | | | | | |
| | 600 | | 4.700%, 4/01/22 | 4/14 at 100.00 | A– | | 610,476 | |
| | 810 | | 4.900%, 4/01/32 | 4/17 at 100.00 | A– | | 830,777 | |
| | 905 | | Yuma County Industrial Development Authority, Arizona, Exempt Revenue Bonds, Far West Water & Sewer Inc. Refunding, Series 2007A, 6.375%, 12/01/37 (Alternative Minimum Tax) | 12/17 at 100.00 | N/R | | 778,210 | |
| | 6,995 | | Total Water and Sewer | | | | 7,517,183 | |
| $ | 90,672 | | Total Investments (cost $85,508,780) – 139.6% | | | | 94,954,342 | |
| | | | Variable MuniFund Term Preferred Shares, at Liquidation Value – (41.2)% (7) | | | | (28,000,000 | ) |
| | | | Other Assets Less Liabilities – 1.6% | | | | 1,061,995 | |
| | | | Net Assets Applicable to Common Shares – 100% | | | $ | 68,016,337 | |
| (1) | | All percentages shown in the Portfolio of Investments are based on net assets applicable to Common shares unless otherwise noted. |
| (2) | | Optional Call Provisions: Dates (month and year) and prices of the earliest optional call or redemption. There may be other call provisions at varying prices at later dates. Certain mortgage-backed securities may be subject to periodic principal paydowns. |
| (3) | | Ratings: Using the highest of Standard & Poor’s Group (“Standard & Poor’s”), Moody’s Investors Service, Inc. (“Moody’s”) or Fitch, Inc. (“Fitch”) rating. Ratings below BBB by Standard & Poor’s, Baa by Moody’s or BBB by Fitch are considered to be below investment grade. Holdings designated N/R are not rated by any of these national rating agencies. |
| (4) | | Investment valued at fair value using methods determined in good faith by, or at the discretion of, the Board of Directors. For fair value measurement disclosure purposes, investment categorized as Level 3. See Notes to Financial Statements, Footnote 1 – General Information and Significant Accounting Policies, Investment Valuation for more information. |
| (5) | | Backed by an escrow or trust containing sufficient U.S. Government or U.S. Government agency securities, which ensure the timely payment of principal and interest. Certain bonds backed by U.S. Government or agency securities are regarded as having an implied rating equal to the rating of such securities. |
| (6) | | Investment, or portion of investment, has been pledged to collateralize the net payment obligations for investments in inverse floating rate transactions. |
| (7) | | Variable MuniFund Term Preferred Shares, at Liquidation Value as a percentage of Total Investments is 29.5%. |
| N/R | | Not rated. |
| WI/DD | | Investment, or portion of investment, purchased on a when-issued or delayed delivery basis. |
| (ETM) | | Escrowed to maturity. |
| (IF) | | Inverse floating rate investment. |
See accompanying notes to financial statements.
| | | Nuveen Arizona Dividend Advantage Municipal Fund |
| NFZ | | Portfolio of Investments |
| | | August 31, 2012 (Unaudited) |
| | Principal | | | Optional Call | | | | |
| | Amount (000) | | Description (1) | Provisions (2) | Ratings (3) | | Value | |
| | | | Education and Civic Organizations – 13.1% (9.1% of Total Investments) | | | | | |
| $ | 280 | | Arizona Higher Education Loan Authority, Student Loan Revenue Bonds, Series 2007B, Auction Rate Securities, 0.525%, 11/01/41 (Alternative Minimum Tax) (4) | 10/12 at 100.00 | A | $ | 218,613 | |
| | 275 | | Glendale Industrial Development Authority, Arizona, Revenue Bonds, Midwestern University, Refunding Series 2007, 5.000%, 5/15/31 | 5/22 at 100.00 | A– | | 303,559 | |
| | 500 | | Glendale Industrial Development Authority, Arizona, Revenue Bonds, Midwestern University, Refunding Series 2010, 5.125%, 5/15/40 | 5/20 at 100.00 | A+ | | 533,030 | |
| | 105 | | Phoenix Industrial Development Authority, Arizona, Education Facility Revenue Bonds, Brighter Choice Foundation Charter Middle Schools Project, Series 2012, 7.500%, 7/01/42 | 7/22 at 100.00 | BB+ | | 109,430 | |
| | 80 | | Phoenix Industrial Development Authority, Arizona, Education Revenue Bonds, Great Hearts Academies – Veritas Project, Series 2012, 6.300%, 7/01/42 | 7/21 at 100.00 | BBB | | 85,554 | |
| | 100 | | Phoenix Industrial Development Authority, Arizona, Education Revenue Bonds, Painted Rock Academy Charter School Project, Series 2012A, 7.500%, 7/01/42 | 7/20 at 100.00 | N/R | | 104,801 | |
| | 500 | | Phoenix Industrial Development Authority, Arizona, Lease Revenue Bonds, Rowan University Project, Series 2012, 5.000%, 6/01/42 – AGM Insured | 6/22 at 100.00 | A+ | | 539,380 | |
| | 100 | | Pima County Industrial Development Authority, Arizona, Education Revenue Bonds, Carden Traditional Schools Project, Series 2012, 7.500%, 1/01/42 | 1/22 at 100.00 | BBB– | | 107,410 | |
| | 130 | | Pima County Industrial Development Authority, Arizona, Education Revenue Bonds, Paradise Education Center Project, Series 2010, 6.000%, 6/01/40 | 6/19 at 100.00 | BBB– | | 132,583 | |
| | 165 | | Pima County Industrial Development Authority, Arizona, Educational Revenue Bonds, Paradise Education Center Charter School, Series 2006, 6.000%, 6/01/36 | 6/16 at 100.00 | BBB– | | 166,688 | |
| | 220 | | Pima County Industrial Development Authority, Arizona, Educational Revenue Bonds, Valley Academy Charter School Project, Series 2008, 6.500%, 7/01/38 | 7/18 at 100.00 | Baa3 | | 233,759 | |
| | 300 | | Puerto Rico Industrial, Tourist, Educational, Medical and Environmental Control Facilities Financing Authority, Higher Education Revenue Bonds, University of the Sacred Heart, Series 2001, 5.250%, 9/01/21 | 3/13 at 100.00 | BBB | | 300,438 | |
| | 305 | | Tucson Industrial Development Authority, Arizona, Charter School Revenue Bonds, Arizona Agribusiness and Equine Center Charter School, Series 2004A, 6.125%, 9/01/34 | 9/14 at 100.00 | BB+ | | 301,194 | |
| | 3,060 | | Total Education and Civic Organizations | | | | 3,136,439 | |
| | | | Health Care – 25.1% (17.4% of Total Investments) | | | | | |
| | 565 | | Arizona Health Facilities Authority, Hospital Revenue Bonds, Banner Health Systems, Series 2007A, 5.000%, 1/01/25 | 1/17 at 100.00 | AA– | | 643,959 | |
| | 325 | | Arizona Health Facilities Authority, Hospital Revenue Bonds, Banner Health Systems, Series 2007B, 1.120%, 1/02/37 | 1/17 at 100.00 | AA– | | 245,765 | |
| | 720 | | Arizona Health Facilities Authority, Hospital Revenue Bonds, Banner Health Systems, Series 2008D, 5.500%, 1/01/38 | 1/18 at 100.00 | AA– | | 800,755 | |
| | 800 | | Arizona Health Facilities Authority, Hospital System Revenue Bonds, Phoenix Children’s Hospital, Refunding Series 2012, 5.000%, 2/01/42 (WI/DD, Settling 9/06/12) | 2/22 at 100.00 | BBB+ | | 842,008 | |
| | 10 | | California Health Facilities Financing Authority, Health Facility Revenue Bonds, Adventist Health System/West, Series 2003A, 5.000%, 3/01/28 | 3/13 at 100.00 | A | | 10,062 | |
| | 250 | | Glendale Industrial Development Authority, Arizona, Revenue Bonds, John C. Lincoln Health Network, Series 2005B, 5.000%, 12/01/37 | 12/15 at 100.00 | BBB+ | | 255,430 | |
| | 415 | | Glendale Industrial Development Authority, Arizona, Revenue Bonds, John C. Lincoln Health Network, Series 2007, 5.000%, 12/01/42 | 12/17 at 100.00 | BBB+ | | 427,612 | |
| | 750 | | Maricopa County Industrial Development Authority, Arizona, Health Facility Revenue Bonds, Catholic Healthcare West, Series 2004A, 5.375%, 7/01/23 | 7/14 at 100.00 | A+ | | 789,000 | |
| | 1,025 | | Maricopa County Industrial Development Authority, Arizona, Health Facility Revenue Bonds, Catholic Healthcare West, Series 2007A, 5.250%, 7/01/32 | 7/17 at 100.00 | A+ | | 1,110,475 | |
| | Principal | | | Optional Call | | | | |
| | Amount (000) | | Description (1) | Provisions (2) | Ratings (3) | | Value | |
| | | | Health Care (continued) | | | | | |
| | | | Show Low Industrial Development Authority, Arizona, Hospital Revenue Bonds, Navapache Regional Medical Center, Series 2005: | | | | | |
| $ | 200 | | 5.000%, 12/01/25 – RAAI Insured | 12/15 at 100.00 | BBB+ | $ | 206,266 | |
| | 150 | | 5.000%, 12/01/30 – RAAI Insured | 12/15 at 100.00 | BBB+ | | 153,578 | |
| | 450 | | University Medical Center Corporation, Tucson, Arizona, Hospital Revenue Bonds, Series 2011, 6.000%, 7/01/39 | 7/21 at 100.00 | BBB+ | | 520,196 | |
| | 5,660 | | Total Health Care | | | | 6,005,106 | |
| | | | Long-Term Care – 0.5% (0.3% of Total Investments) | | | | | |
| | 105 | | Tempe Industrial Development Authority, Arizona, Revenue Bonds, Friendship Village of Tempe Project, Refunding Series 2012A, 6.000%, 12/01/32 | 12/21 at 100.00 | N/R | | 112,933 | |
| | | | Tax Obligation/General – 17.8% (12.3% of Total Investments) | | | | | |
| | 860 | | El Mirage, Arizona, General Obligation Bonds Series 2012, 5.000%, 7/01/42 – AGM Insured | 7/22 at 100.00 | AA– | | 956,286 | |
| | 180 | | Pima County Continental Elementary School District 39, Arizona, General Obligation Bonds, Series 2011A, 6.000%, 7/01/30 – AGM Insured | 7/21 at 100.00 | AA– | | 226,022 | |
| | 1,310 | | Scottsdale, Arizona, General Obligation Bonds, Preserve Acquisition Series 1999, 5.000%, 7/01/32 | 7/21 at 100.00 | AAA | | 1,564,087 | |
| | 1,340 | | Yuma & La Paz Counties Community College District, Arizona, General Obligation Bonds, Series 2006, 5.000%, 7/01/21 – NPFG Insured | 7/16 at 100.00 | Aa2 | | 1,504,564 | |
| | 3,690 | | Total Tax Obligation/General | | | | 4,250,959 | |
| | | | Tax Obligation/Limited – 44.2% (30.6% of Total Investments) | | | | | |
| | 660 | | Arizona Sports and Tourism Authority, Senior Revenue Refunding Bonds, Multipurpose Stadium Facility Project, Series 2012A, 5.000%, 7/01/36 | 7/22 at 100.00 | A1 | | 728,726 | |
| | 440 | | Buckeye, Arizona, Festival Ranch Community Facilities District District General Obligation Bonds, Series 2012, 5.000%, 7/15/31 | 7/22 at 100.00 | BBB | | 457,534 | |
| | 82 | | Centerra Community Facilities District, Goodyear, Arizona, General Obligation Bonds, Series 2005, 5.500%, 7/15/29 | 7/15 at 100.00 | N/R | | 77,101 | |
| | 203 | | Estrella Mountain Ranch Community Facilities District, Arizona, Special Assessment Bonds, Montecito Assessment District, Series 2007, 5.700%, 7/01/27 | 1/17 at 100.00 | N/R | | 199,793 | |
| | 117 | | Estrella Mountain Ranch Community Facilities District, Goodyear, Arizona, Special Assessment Lien Bonds, Series 2001A, 7.875%, 7/01/25 | 1/13 at 100.00 | N/R | | 117,222 | |
| | 1,000 | | Greater Arizona Development Authority, Infrastructure Revenue Bonds, Series 2006-1, 5.000%, 8/01/22 – NPFG Insured | 8/16 at 100.00 | AA– | | 1,137,300 | |
| | 275 | | Greater Arizona Development Authority, Infrastructure Revenue Bonds, Series 2006A, 5.000%, 8/01/23 – NPFG Insured | 8/16 at 100.00 | A1 | | 306,411 | |
| | 1,180 | | Marana Municipal Property Corporation, Arizona, Revenue Bonds, Series 2003, 5.000%, 7/01/23 – AMBAC Insured | 7/13 at 100.00 | AA | | 1,220,261 | |
| | 468 | | Marana, Arizona, Tangerine Farms Road Improvement District Revenue Bonds, Series 2006, 4.600%, 1/01/26 | 7/16 at 100.00 | A2 | | 484,717 | |
| | 150 | | Marley Park Community Facilities District, City of Surprise, Arizona, Limited Tax General Obligation Bonds, Series 2008 (Bank Qualified), 6.100%, 7/15/32 | 7/17 at 100.00 | N/R | | 149,816 | |
| | 255 | | Merrill Ranch Community Facilities District 1, Florence, Arizona, General Obligation Bonds, Series 2008A, 7.400%, 7/15/33 | 7/18 at 100.00 | N/R | | 278,024 | |
| | 330 | | Palm Valley Community Facility District 3, Goodyear, Arizona, General Obligation Bonds, Series 2006, 5.300%, 7/15/31 | 7/16 at 100.00 | N/R | | 301,656 | |
| | 225 | | Palm Valley Community Facility District 3, Goodyear, Arizona, Limited Tax General Obligation Bonds, Series 2007, 5.800%, 7/15/32 | 7/17 at 100.00 | N/R | | 217,017 | |
| | 100 | | Parkway Community Facilities District 1, Prescott Valley, Arizona, General Obligation Bonds, Series 2006, 5.350%, 7/15/31 | 7/16 at 100.00 | N/R | | 91,968 | |
| | | Nuveen Arizona Dividend Advantage Municipal Fund (continued) |
| NFZ | | Portfolio of Investments |
August 31, 2012 (Unaudited)
| | Principal | | | Optional Call | | | | |
| | Amount (000) | | Description (1) | Provisions (2) | Ratings (3) | | Value | |
| | | | Tax Obligation/Limited (continued) | | | | | |
| $ | 725 | | Phoenix Industrial Development Authority, Arizona, Government Bonds, Capitol Mall LLC II, Series 2001, 5.250%, 9/15/16 – AMBAC Insured | 9/12 at 100.00 | A1 | $ | 727,414 | |
| | 100 | | Phoenix Mesa Gateway Airport Authority, Arizona, Special Facility Revenue Bonds, Mesa Project, Series 2012, 5.000%, 7/01/38 (Alternative Minimum Tax) | 7/22 at 100.00 | AA+ | | 105,191 | |
| | 680 | | Pinal County Industrial Development Authority, Arizona, Correctional Facilities Contract Revenue Bonds, Florence West Prison LLC, Series 2002A, 5.000%, 10/01/18 – ACA Insured | 10/12 at 100.00 | BBB– | | 680,660 | |
| | 600 | | San Luis Civic Improvement Corporation, Arizona, Municipal Facilities Excise Tax Revenue Bonds, Series 2005, 5.000%, 7/01/25 – SYNCORA GTY Insured | 7/15 at 100.00 | A+ | | 634,098 | |
| | 1,000 | | Scottsdale Municipal Property Corporation, Arizona, Excise Tax Revenue Bonds, Refunding Series 2006, 5.000%, 7/01/24 | No Opt. Call | AAA | | 1,284,869 | |
| | 350 | | Tartesso West Community Facility District, Buckeye, Arizona, Limited Tax General Obligation Bonds, Series 2007, 5.900%, 7/15/32 | 7/17 at 100.00 | N/R | | 337,680 | |
| | 500 | | Vistancia Community Facilities District, Peoria, Arizona, General Obligation Bonds, Series 2005, 5.750%, 7/15/24 | 7/15 at 100.00 | A1 | | 532,650 | |
| | 337 | | Watson Road Community Facilities District, Arizona, Special Assessment Revenue Bonds, Series 2005, 6.000%, 7/01/30 | 7/16 at 100.00 | N/R | | 320,005 | |
| | 225 | | Westpark Community Facilities District, Buckeye, Arizona, General Obligation Tax Increment Bonds Series 2006, 5.250%, 7/15/31 | 7/16 at 100.00 | N/R | | 204,422 | |
| | 10,002 | | Total Tax Obligation/Limited | | | | 10,594,535 | |
| | | | U.S. Guaranteed – 13.4% (9.3% of Total Investments) (5) | | | | | |
| | 1,000 | | Arizona Tourism and Sports Authority, Tax Revenue Bonds, Multipurpose Stadium Facility Project, Series 2003A, 5.000%, 7/01/31 (Pre-refunded 7/01/13) – NPFG Insured | 7/13 at 100.00 | A1 (5) | | 1,039,640 | |
| | 1,000 | | Maricopa County Unified School District 11, Peoria, Arizona, General Obligation Bonds, Second Series 2005, 5.000%, 7/01/20 (Pre-refunded 7/01/15) – FGIC Insured | 7/15 at 100.00 | Aa2 (5) | | 1,131,130 | |
| | 240 | | Maricopa County Union High School District 210 Phoenix, Arizona, General Obligation Bonds Series 2006C, 5.000%, 7/01/24 (Pre-refunded 7/01/16) – NPFG Insured, | 7/16 at 100.00 | AA (5) | | 281,705 | |
| | 630 | | Mesa, Arizona, Utility System Revenue Refunding Bonds, Series 2002, 5.250%, 7/01/17 – FGIC Insured (ETM) | No Opt. Call | Aa2 (5) | | 764,820 | |
| | 2,870 | | Total U.S. Guaranteed | | | | 3,217,295 | |
| | | | Utilities – 24.9% (17.2% of Total Investments) | | | | | |
| | 1,500 | | Arizona Power Authority, Special Obligation Power Resource Revenue Refunding Crossover Bonds, Hoover Project, Series 2001, 5.250%, 10/01/17 | No Opt. Call | AA | | 1,820,744 | |
| | 600 | | Maricopa County Pollution Control Corporation, Arizona, Pollution Control Revenue Refunding Bonds, Southern California Edison Company, Series 2000A, 5.000%, 6/01/35 | 6/20 at 100.00 | A1 | | 665,970 | |
| | 370 | | Mesa, Arizona, Utility System Revenue Refunding Bonds, Series 2002, 5.250%, 7/01/17 – FGIC Insured | No Opt. Call | Aa2 | | 442,946 | |
| | 665 | | Pima County Industrial Development Authority, Arizona, Revenue Bonds, Tucson Electric Power Company, Refunding Series 2008, 5.750%, 9/01/29 | 1/15 at 100.00 | BBB– | | 710,413 | |
| | 400 | | Pinal County Electrical District 3, Arizona, Electric System Revenue Bonds, Refunding Series 2011, 5.250%, 7/01/36 | 7/21 at 100.00 | A | | 449,380 | |
| | 1,000 | | Puerto Rico Electric Power Authority, Power Revenue Bonds, Series 2005RR, 5.000%, 7/01/26 – SYNCORA GTY Insured | 7/15 at 100.00 | BBB+ | | 1,071,200 | |
| | 560 | | Salt River Project Agricultural Improvement and Power District, Arizona, Electric System Revenue Bonds, Tender Option Bond Trust 09-9W, 17.940%, 1/01/38 (IF) (6) | 1/18 at 100.00 | Aa1 | | 803,062 | |
| | 5,095 | | Total Utilities | | | | 5,963,715 | |
| | Principal | | | Optional Call | | | | |
| | Amount (000) | | Description (1) | Provisions (2) | Ratings (3) | | Value | |
| | | | Water and Sewer – 5.4% (3.8% of Total Investments) | | | | | |
| $ | 475 | | Goodyear, Arizona, Water and Sewer Revenue Obligations, Series 2010, 5.625%, 7/01/39 | 7/20 at 100.00 | A+ | $ | 527,958 | |
| | | | Surprise Municipal Property Corporation, Arizona, Wastewater System Revenue Bonds, Series 2007: | | | | | |
| | 225 | | 4.700%, 4/01/22 | 4/14 at 100.00 | A– | | 228,929 | |
| | 260 | | 4.900%, 4/01/32 | 4/17 at 100.00 | A– | | 266,669 | |
| | 325 | | Yuma County Industrial Development Authority, Arizona, Exempt Revenue Bonds, Far West Water & Sewer Inc. Refunding, Series 2007A, 6.375%, 12/01/37 (Alternative Minimum Tax) | 12/17 at 100.00 | N/R | | 279,468 | |
| | 1,285 | | Total Water and Sewer | | | | 1,303,024 | |
| $ | 31,767 | | Total Investments (cost $31,816,208) – 144.4% | | | | 34,584,006 | |
| | | | MuniFund Term Preferred Shares, at Liquidation Value – (46.4)% (7) | | | | (11,100,000 | ) |
| | | | Other Assets Less Liabilities – 2.0% | | | | 463,409 | |
| | | | Net Assets Applicable to Common Shares – 100% | | | $ | 23,947,415 | |
| (1) | | All percentages shown in the Portfolio of Investments are based on net assets applicable to Common shares unless otherwise noted. |
| (2) | | Optional Call Provisions: Dates (month and year) and prices of the earliest optional call or redemption. There may be other call provisions at varying prices at later dates. Certain mortgage-backed securities may be subject to periodic principal paydowns. |
| (3) | | Ratings: Using the highest of Standard & Poor’s Group (“Standard & Poor’s”), Moody’s Investors Service, Inc. (“Moody’s”) or Fitch, Inc. (“Fitch”) rating. Ratings below BBB by Standard & Poor’s, Baa by Moody’s or BBB by Fitch are considered to be below investment grade. Holdings designated N/R are not rated by any of these national rating agencies. |
| (4) | | Investment valued at fair value using methods determined in good faith by, or at the discretion of, the Board of Trustees. For fair value measurement disclosure purposes, investment categorized as Level 3. See Notes to Financial Statements, Footnote 1 – General Information and Significant Accounting Policies, Investment Valuation for more information. |
| (5) | | Backed by an escrow or trust containing sufficient U.S. Government or U.S. Government agency securities, which ensure the timely payment of principal and interest. Certain bonds backed by U.S. Government or agency securities are regarded as having an implied rating equal to the rating of such securities. |
| (6) | | Investment, or portion of investment, has been pledged to collateralize the net payment obligations for investments in inverse floating rate transactions. |
| (7) | | MuniFund Term Preferred Shares, at Liquidation Value as a percentage of Total Investments is 32.1%. |
| N/R | | Not rated. |
| WI/DD | | Investment, or portion of investment, purchased on a when-issued or delayed delivery basis. |
| (ETM) | | Escrowed to maturity. |
| (IF) | | Inverse floating rate investment. |
See accompanying notes to financial statements.
| | | Nuveen Arizona Dividend Advantage Municipal Fund 2 |
| NKR | | Portfolio of Investments |
| | | August 31, 2012 (Unaudited) |
| | Principal | | | Optional Call | | | | |
| | Amount (000) | | Description (1) | Provisions (2) | Ratings (3) | | Value | |
| | | | Education and Civic Organizations – 15.3% (10.7% of Total Investments) | | | | | |
| $ | 1,130 | | Arizona Higher Education Loan Authority, Student Loan Revenue Bonds, Series 2007B, Auction Rate Securities, 0.525%, 11/01/41 (Alternative Minimum Tax) (4) | 10/12 at 100.00 | A | $ | 882,261 | |
| | 450 | | Glendale Industrial Development Authority, Arizona, Revenue Bonds, Midwestern University, Refunding Series 2007, 5.000%, 5/15/31 | 5/22 at 100.00 | A– | | 496,733 | |
| | 775 | | Glendale Industrial Development Authority, Arizona, Revenue Bonds, Midwestern University, Refunding Series 2010, 5.125%, 5/15/40 | 5/20 at 100.00 | A+ | | 826,197 | |
| | 360 | | Northern Arizona University, System Revenue Bonds, Series 2012, 5.000%, 6/01/41 | 6/21 at 100.00 | A+ | | 396,814 | |
| | 170 | | Phoenix Industrial Development Authority, Arizona, Education Facility Revenue Bonds, Brighter Choice Foundation Charter Middle Schools Project, Series 2012, 7.500%, 7/01/42 | 7/22 at 100.00 | BB+ | | 177,172 | |
| | 130 | | Phoenix Industrial Development Authority, Arizona, Education Revenue Bonds, Great Hearts Academies – Veritas Project, Series 2012, 6.300%, 7/01/42 | 7/21 at 100.00 | BBB | | 139,026 | |
| | 165 | | Phoenix Industrial Development Authority, Arizona, Education Revenue Bonds, Painted Rock Academy Charter School Project, Series 2012A, 7.500%, 7/01/42 | 7/20 at 100.00 | N/R | | 172,922 | |
| | 810 | | Phoenix Industrial Development Authority, Arizona, Lease Revenue Bonds, Rowan University Project, Series 2012, 5.000%, 6/01/42 – AGM Insured | 6/22 at 100.00 | A+ | | 873,796 | |
| | 485 | | Pima County Industrial Development Authority, Arizona, Charter School Revenue Bonds, Noah Webster Basic Schools Inc., Series 2004, 6.000%, 12/15/24 | 12/14 at 100.00 | BBB– | | 495,010 | |
| | 165 | | Pima County Industrial Development Authority, Arizona, Education Revenue Bonds, Carden Traditional Schools Project, Series 2012, 7.500%, 1/01/42 | 1/22 at 100.00 | BBB– | | 177,227 | |
| | 210 | | Pima County Industrial Development Authority, Arizona, Education Revenue Bonds, Paradise Education Center Project, Series 2010, 6.000%, 6/01/40 | 6/19 at 100.00 | BBB– | | 214,173 | |
| | 175 | | Pima County Industrial Development Authority, Arizona, Educational Revenue Bonds, Paradise Education Center Charter School, Series 2006, 6.000%, 6/01/36 | 6/16 at 100.00 | BBB– | | 176,790 | |
| | 365 | | Pima County Industrial Development Authority, Arizona, Educational Revenue Bonds, Valley Academy Charter School Project, Series 2008, 6.500%, 7/01/38 | 7/18 at 100.00 | Baa3 | | 387,827 | |
| | 480 | | Tucson Industrial Development Authority, Arizona, Charter School Revenue Bonds, Arizona Agribusiness and Equine Center Charter School, Series 2004A, 6.125%, 9/01/34 | 9/14 at 100.00 | BB+ | | 474,010 | |
| | 5,870 | | Total Education and Civic Organizations | | | | 5,889,958 | |
| | | | Health Care – 32.5% (22.7% of Total Investments) | | | | | |
| | 845 | | Arizona Health Facilities Authority, Hospital Revenue Bonds, Banner Health Systems, Series 2007A, 5.000%, 1/01/25 | 1/17 at 100.00 | AA– | | 963,089 | |
| | 520 | | Arizona Health Facilities Authority, Hospital Revenue Bonds, Banner Health Systems, Series 2007B, 1.120%, 1/02/37 | 1/17 at 100.00 | AA– | | 393,224 | |
| | 1,150 | | Arizona Health Facilities Authority, Hospital Revenue Bonds, Banner Health Systems, Series 2008D, 5.500%, 1/01/38 | 1/18 at 100.00 | AA– | | 1,278,984 | |
| | 750 | | Arizona Health Facilities Authority, Hospital System Revenue Bonds, Phoenix Children’s Hospital, Refunding Series 2012, 5.000%, 2/01/42 (WI/DD, Settling 9/06/12) | 2/22 at 100.00 | BBB+ | | 789,383 | |
| | 600 | | Arizona Health Facilities Authority, Revenue Bonds, Blood Systems Inc., Series 2004, 5.000%, 4/01/20 | 4/14 at 100.00 | A | | 625,752 | |
| | 400 | | Glendale Industrial Development Authority, Arizona, Revenue Bonds, John C. Lincoln Health Network, Series 2005B, 5.000%, 12/01/37 | 12/15 at 100.00 | BBB+ | | 408,688 | |
| | 655 | | Glendale Industrial Development Authority, Arizona, Revenue Bonds, John C. Lincoln Health Network, Series 2007, 5.000%, 12/01/42 | 12/17 at 100.00 | BBB+ | | 674,905 | |
| | 1,375 | | Maricopa County Industrial Development Authority, Arizona, Health Facility Revenue Bonds, Catholic Healthcare West, Series 2004A, 5.375%, 7/01/23 | 7/14 at 100.00 | A+ | | 1,446,499 | |
| | 1,650 | | Maricopa County Industrial Development Authority, Arizona, Health Facility Revenue Bonds, Catholic Healthcare West, Series 2007A, 5.250%, 7/01/32 | 7/17 at 100.00 | A+ | | 1,787,591 | |
| | 1,120 | | Scottsdale Industrial Development Authority, Arizona, Hospital Revenue Bonds, Scottsdale Healthcare, Series 2006C. Re-offering, 5.000%, 9/01/35 – AGC Insured | 9/20 at 100.00 | AA– | | 1,239,224 | |
| | Principal | | | Optional Call | | | | |
| | Amount (000) | | Description (1) | Provisions (2) | Ratings (3) | | Value | |
| | | | Health Care (continued) | | | | | |
| | | | Show Low Industrial Development Authority, Arizona, Hospital Revenue Bonds, Navapache Regional Medical Center, Series 2005: | | | | | |
| $ | 315 | | 5.000%, 12/01/25 – RAAI Insured | 12/15 at 100.00 | BBB+ | $ | 324,869 | |
| | 260 | | 5.000%, 12/01/30 – RAAI Insured | 12/15 at 100.00 | BBB+ | | 266,201 | |
| | 1,050 | | University Medical Center Corporation, Tucson, Arizona, Hospital Revenue Bonds, Series 2011, 6.000%, 7/01/39 | 7/21 at 100.00 | BBB+ | | 1,213,790 | |
| | 1,000 | | Yavapai County Industrial Development Authority, Arizona, Hospital Revenue Bonds, Yavapai Regional Medical Center, Series 2003A, 6.000%, 8/01/33 | 8/13 at 100.00 | BBB+ | | 1,041,440 | |
| | 11,690 | | Total Health Care | | | | 12,453,639 | |
| | | | Long-Term Care – 0.5% (0.3% of Total Investments) | | | | | |
| | 175 | | Tempe Industrial Development Authority, Arizona, Revenue Bonds, Friendship Village of Tempe Project, Refunding Series 2012A, 6.000%, 12/01/32 | 12/21 at 100.00 | N/R | | 188,221 | |
| | | | Tax Obligation/General – 25.7% (18.0% of Total Investments) | | | | | |
| | 1,000 | | Maricopa County Elementary School District 83 Cartwright, Arizona, General Obligation Bonds, School Improvement, Project 2010, Series 2011A, 5.375%, 7/01/30 – AGM Insured | 7/21 at 100.00 | AA– | | 1,149,970 | |
| | 1,000 | | Maricopa County School District 6, Arizona, General Obligation Refunding Bonds, Washington Elementary School, Series 2002A, 5.375%, 7/01/16 – AGM Insured | No Opt. Call | Aa2 | | 1,174,230 | |
| | 775 | | Maricopa County School District 79 Litchfield Elementary, Arizona, General Obligation Bonds, Series 2011, 5.000%, 7/01/23 | 7/21 at 100.00 | Aa2 | | 945,539 | |
| | 1,165 | | Maricopa County Unified School District 69, Paradise Valley, Arizona, General Obligation Refunding Bonds, Series 2002A, 5.250%, 7/01/14 – FGIC Insured | No Opt. Call | Aa2 | | 1,265,971 | |
| | 1,405 | | Mesa, Arizona, General Obligation Bonds, Series 2002, 5.375%, 7/01/15 – FGIC Insured | No Opt. Call | AA | | 1,589,152 | |
| | 310 | | Pima County Continental Elementary School District 39, Arizona, General Obligation Bonds, Series 2011A, 6.000%, 7/01/30 – AGM Insured | 7/21 at 100.00 | AA– | | 389,261 | |
| | 500 | | Pima County Unified School District 08 Flowing Wells, Arizona, General Obligation Bonds, Series 2011B, 5.375%, 7/01/29 | 7/21 at 100.00 | A+ | | 573,750 | |
| | 1,000 | | Pima County Unified School District 6, Marana, Arizona, General Obligation Bonds, School Improvement Project 2010 Series 2011A, 5.000%, 7/01/25 | 7/21 at 100.00 | A+ | | 1,142,890 | |
| | 1,360 | | Scottsdale, Arizona, General Obligation Bonds, Preserve Acquisition Series 1999, 5.000%, 7/01/33 | 7/21 at 100.00 | AAA | | 1,615,489 | |
| | 8,515 | | Total Tax Obligation/General | | | | 9,846,252 | |
| | | | Tax Obligation/Limited – 44.9% (31.4% of Total Investments) | | | | | |
| | | | Arizona State, Certificates of Participation, Series 2002A: | | | | | |
| | 750 | | 5.000%, 11/01/17 – NPFG Insured | 11/12 at 100.00 | A+ | | 752,835 | |
| | 1,000 | | 5.000%, 11/01/18 – NPFG Insured | 11/12 at 100.00 | A+ | | 1,003,740 | |
| | 370 | | Buckeye, Arizona, Festival Ranch Community Facilities District District General Obligation Bonds, Series 2012, 5.000%, 7/15/31 | 7/22 at 100.00 | BBB | | 384,745 | |
| | 116 | | Centerra Community Facilities District, Goodyear, Arizona, General Obligation Bonds, Series 2005, 5.500%, 7/15/29 | 7/15 at 100.00 | N/R | | 109,070 | |
| | 332 | | Estrella Mountain Ranch Community Facilities District, Arizona, Special Assessment Bonds, Montecito Assessment District, Series 2007, 5.800%, 7/01/32 | 1/17 at 100.00 | N/R | | 320,231 | |
| | 184 | | Estrella Mountain Ranch Community Facilities District, Goodyear, Arizona, Special Assessment Lien Bonds, Series 2001A, 7.875%, 7/01/25 | 1/13 at 100.00 | N/R | | 184,350 | |
| | 970 | | Marana Municipal Property Corporation, Arizona, Municipal Facilities Revenue Bonds, Series 2008B, 5.125%, 7/01/28 | 1/13 at 100.00 | AA | | 982,455 | |
| | 784 | | Marana, Arizona, Tangerine Farms Road Improvement District Revenue Bonds, Series 2006, 4.600%, 1/01/26 | 7/16 at 100.00 | A2 | | 812,004 | |
| | 240 | | Marley Park Community Facilities District, City of Surprise, Arizona, Limited Tax General Obligation Bonds, Series 2008 (Bank Qualified), 6.100%, 7/15/32 | 7/17 at 100.00 | N/R | | 239,705 | |
| | 415 | | Merrill Ranch Community Facilities District 1, Florence, Arizona, General Obligation Bonds, Series 2008A, 7.400%, 7/15/33 | 7/18 at 100.00 | N/R | | 452,470 | |
| | | Nuveen Arizona Dividend Advantage Municipal Fund 2 (continued) |
| NKR | | Portfolio of Investments |
August 31, 2012 (Unaudited)
| | Principal | | | Optional Call | | | | |
| | Amount (000) | | Description (1) | Provisions (2) | Ratings (3) | | Value | |
| | | | Tax Obligation/Limited (continued) | | | | | |
| $ | 530 | | Palm Valley Community Facility District 3, Goodyear, Arizona, General Obligation Bonds, Series 2006, 5.300%, 7/15/31 | 7/16 at 100.00 | N/R | $ | 484,478 | |
| | 350 | | Palm Valley Community Facility District 3, Goodyear, Arizona, Limited Tax General Obligation Bonds, Series 2007, 5.800%, 7/15/32 | 7/17 at 100.00 | N/R | | 337,582 | |
| | 140 | | Parkway Community Facilities District 1, Prescott Valley, Arizona, General Obligation Bonds, Series 2006, 5.350%, 7/15/31 | 7/16 at 100.00 | N/R | | 128,755 | |
| | 1,000 | | Phoenix Industrial Development Authority, Arizona, Government Bonds, Capitol Mall LLC II, Series 2001, 5.250%, 9/15/16 – AMBAC Insured | 9/12 at 100.00 | A1 | | 1,003,330 | |
| | 140 | | Phoenix Mesa Gateway Airport Authority, Arizona, Special Facility Revenue Bonds, Mesa Project, Series 2012, 5.000%, 7/01/38 (Alternative Minimum Tax) | 7/22 at 100.00 | AA+ | | 147,267 | |
| | 1,070 | | Pinal County Industrial Development Authority, Arizona, Correctional Facilities Contract Revenue Bonds, Florence West Prison LLC, Series 2002A, 5.000%, 10/01/18 – ACA Insured | 10/12 at 100.00 | BBB– | | 1,071,038 | |
| | 140 | | Puerto Rico Public Buildings Authority, Guaranteed Government Facilities Revenue Refunding Bonds, Series 2002D, 5.125%, 7/01/24 | 1/13 at 100.00 | Baa1 | | 140,218 | |
| | | | Puerto Rico Sales Tax Financing Corporation, Sales Tax Revenue Bonds, First Subordinate Series 2010A: | | | | | |
| | 3,055 | | 0.000%, 8/01/33 | No Opt. Call | A+ | | 986,673 | |
| | 250 | | 5.375%, 8/01/39 | 2/20 at 100.00 | A+ | | 267,640 | |
| | 960 | | San Luis Civic Improvement Corporation, Arizona, Municipal Facilities Excise Tax Revenue Bonds, Series 2005, 5.000%, 7/01/25 – SYNCORA GTY Insured | 7/15 at 100.00 | A+ | | 1,014,557 | |
| | 1,000 | | Scottsdale Municipal Property Corporation, Arizona, Excise Tax Revenue Bonds, Refunding Series 2006, 5.000%, 7/01/24 | No Opt. Call | AAA | | 1,284,870 | |
| | 1,000 | | Scottsdale Municipal Property Corporation, Arizona, Excise Tax Revenue Bonds, Water & Sewer Improvements Project, Series 2010, 5.000%, 7/01/36 | 7/20 at 100.00 | AAA | | 1,136,040 | |
| | 555 | | Tartesso West Community Facility District, Buckeye, Arizona, Limited Tax General Obligation Bonds, Series 2007, 5.900%, 7/15/32 | 7/17 at 100.00 | N/R | | 535,464 | |
| | 1,500 | | Tempe, Arizona, Transit Excise Tax Revenue Obligation Bonds, Refunding Series 2012, 5.000%, 7/01/37 (WI/DD, Settling 9/12/12) | 7/22 at 100.00 | AAA | | 1,721,414 | |
| | 750 | | Vistancia Community Facilities District, Peoria, Arizona, General Obligation Bonds, Series 2005, 5.750%, 7/15/24 | 7/15 at 100.00 | A1 | | 798,975 | |
| | 633 | | Watson Road Community Facilities District, Arizona, Special Assessment Revenue Bonds, Series 2005, 6.000%, 7/01/30 | 7/16 at 100.00 | N/R | | 601,078 | |
| | 350 | | Westpark Community Facilities District, Buckeye, Arizona, General Obligation Tax Increment Bonds Series 2006, 5.250%, 7/15/31 | 7/16 at 100.00 | N/R | | 317,989 | |
| | 18,584 | | Total Tax Obligation/Limited | | | | 17,218,973 | |
| | | | Transportation – 2.6% (1.8% of Total Investments) | | | | | |
| | 1,000 | | Phoenix Civic Improvement Corporation, Arizona, Senior Lien Airport Revenue Bonds, Series 2002B, 5.250%, 7/01/27 – FGIC Insured (Alternative Minimum Tax) | 1/13 at 100.00 | AA– | | 1,001,500 | |
| | | | U.S. Guaranteed – 1.4% (1.0% of Total Investments) (5) | | | | | |
| | 100 | | Maricopa County Unified School District 89, Dysart, Arizona, General Obligation Bonds, Series 2004B, 5.250%, 7/01/20 (Pre-refunded 7/01/14) – AGM Insured | 7/14 at 100.00 | AA– (5) | | 109,072 | |
| | 375 | | Maricopa County Union High School District 210 Phoenix, Arizona, General Obligation Bonds, Series 2006C, 5.000%, 7/01/24 (Pre-refunded 7/01/16) – NPFG Insured | 7/16 at 100.00 | AA (5) | | 440,164 | |
| | 475 | | Total U.S. Guaranteed | | | | 549,236 | |
| | | | Utilities – 10.7% (7.5% of Total Investments) | | | | | |
| | 400 | | Apache County Industrial Development Authority, Arizona, Pollution Control Revenue Bonds, Tucson Electric Power Company, Series 20102A, 4.500%, 3/01/30 | 3/22 at 100.00 | BBB– | | 416,032 | |
| | 900 | | Maricopa County Pollution Control Corporation, Arizona, Pollution Control Revenue Refunding Bonds, Southern California Edison Company, Series 2000A, 5.000%, 6/01/35 | 6/20 at 100.00 | A1 | | 998,955 | |
| | Principal | | | Optional Call | | | | |
| | Amount (000) | | Description (1) | Provisions (2) | Ratings (3) | | Value | |
| | | | Utilities (continued) | | | | | |
| $ | 665 | | Pima County Industrial Development Authority, Arizona, Revenue Bonds, Tucson Electric Power Company, Refunding Series 2008, 5.750%, 9/01/29 | 1/15 at 100.00 | BBB– | $ | 710,413 | |
| | 250 | | Pinal County Electrical District 3, Arizona, Electric System Revenue Bonds, Refunding Series 2011, 5.250%, 7/01/36 | 7/21 at 100.00 | A | | 280,863 | |
| | 450 | | Salt River Project Agricultural Improvement and Power District, Arizona, Electric System Revenue Bonds, Tender Option Bond Trust 09-9W, 17.940%, 1/01/38 (IF) (6) | 1/18 at 100.00 | Aa1 | | 645,318 | |
| | 1,000 | | Salt Verde Financial Corporation, Arizona, Senior Gas Revenue Bonds, Citigroup Energy Inc Prepay Contract Obligations, Series 2007, 5.000%, 12/01/37 | No Opt. Call | A– | | 1,068,570 | |
| | 3,665 | | Total Utilities | | | | 4,120,151 | |
| | | | Water and Sewer – 9.4% (6.6% of Total Investments) | | | | | |
| | 500 | | City of Goodyear, Arizona Subordinate Lien Water and Sewer Revenue Obligations, Series 2011, 5.500%, 7/01/41 | 7/21 at 100.00 | AA– | | 574,780 | |
| | 490 | | Maricopa County Industrial Development Authority, Arizona, Water System Improvement Revenue Bonds, Chaparral City Water Company, Series 1997A, 5.400%, 12/01/22 – AMBAC Insured (Alternative Minimum Tax) | 12/12 at 100.00 | N/R | | 490,549 | |
| | 1,000 | | Phoenix Civic Improvement Corporation, Arizona, Junior Lien Water System Revenue Refunding Bonds, Series 2001, 5.500%, 7/01/22 – FGIC Insured | No Opt. Call | AAA | | 1,302,690 | |
| | | | Surprise Municipal Property Corporation, Arizona, Wastewater System Revenue Bonds, Series 2007: | | | | | |
| | 350 | | 4.700%, 4/01/22 | 4/14 at 100.00 | A– | | 356,111 | |
| | 410 | | 4.900%, 4/01/32 | 4/17 at 100.00 | A– | | 420,517 | |
| | 525 | | Yuma County Industrial Development Authority, Arizona, Exempt Revenue Bonds, Far West Water & Sewer Inc. Refunding, Series 2007A, 6.375%, 12/01/37 (Alternative Minimum Tax) | 12/17 at 100.00 | N/R | | 451,448 | |
| | 3,275 | | Total Water and Sewer | | | | 3,596,095 | |
| $ | 53,249 | | Total Investments (cost $50,800,963) – 143.0% | | | | 54,864,025 | |
| | | | MuniFund Term Preferred Shares, at Liquidation Value – (48.8)% (7) | | | | (18,725,000 | ) |
| | | | Other Assets Less Liabilities – 5.8% | | | | 2,220,398 | |
| | | | Net Assets Applicable to Common Shares – 100% | | | $ | 38,359,423 | |
| (1) | | All percentages shown in the Portfolio of Investments are based on net assets applicable to Common shares unless otherwise noted. |
| (2) | | Optional Call Provisions: Dates (month and year) and prices of the earliest optional call or redemption. There may be other call provisions at varying prices at later dates. Certain mortgage-backed securities may be subject to periodic principal paydowns. |
| (3) | | Ratings: Using the highest of Standard & Poor’s Group (“Standard & Poor’s”), Moody’s Investors Service, Inc. (“Moody’s”) or Fitch, Inc. (“Fitch”) rating. Ratings below BBB by Standard & Poor’s, Baa by Moody’s or BBB by Fitch are considered to be below investment grade. Holdings designated N/R are not rated by any of these national rating agencies. |
| (4) | | Investment valued at fair value using methods determined in good faith by, or at the discretion of, the Board of Trustees. For fair value measurement disclosure purposes, investment categorized as Level 3. See Notes to Financial Statements, Footnote 1 – General Information and Significant Accounting Policies, Investment Valuation for more information. |
| (5) | | Backed by an escrow or trust containing sufficient U.S. Government or U.S. Government agency securities, which ensure the timely payment of principal and interest. Certain bonds backed by U.S. Government or agency securities are regarded as having an implied rating equal to the rating of such securities. |
| (6) | | Investment, or portion of investment, has been pledged to collateralize the net payment obligations for investments in inverse floating rate transactions. |
| (7) | | MuniFund Term Preferred Shares, at Liquidation Value as a percentage of Total Investments is 34.1%. |
| N/R | | Not rated. |
| WI/DD | | Investment, or portion of investment, purchased on a when-issued or delayed delivery basis. |
| (IF) | | Inverse floating rate investment. |
See accompanying notes to financial statements.
| | | Nuveen Arizona Dividend Advantage Municipal Fund 3 |
| NXE | | Portfolio of Investments |
| | | August 31, 2012 (Unaudited) |
| | Principal | | | Optional Call | | | | |
| | Amount (000) | | Description (1) | Provisions (2) | Ratings (3) | | Value | |
| | | | Consumer Staples – 1.0% (0.7% of Total Investments) | | | | | |
| $ | 460 | | Puerto Rico, The Children’s Trust Fund, Tobacco Settlement Asset-Backed Refunding Bonds, Series 2002, 5.375%, 5/15/33 | 11/12 at 100.00 | BBB+ | $ | 459,991 | |
| | | | Education and Civic Organizations – 16.9% (11.9% of Total Investments) | | | | | |
| | 690 | | Arizona Higher Education Loan Authority, Student Loan Revenue Bonds, Series 2007B, Auction Rate Securities, 0.525%, 11/01/41 (Alternative Minimum Tax) (4) | 10/12 at 100.00 | A | | 538,725 | |
| | 1,250 | | Arizona State University, System Revenue Bonds, Series 2005, 5.000%, | 7/15 at 100.00 | Aa3 | | 1,386,538 | |
| | | | 7/01/20 – AMBAC Insured | | | | | |
| | 520 | | Glendale Industrial Development Authority, Arizona, Revenue Bonds, Midwestern University, Refunding Series 2007, 5.000%, 5/15/31 | 5/22 at 100.00 | A– | | 574,002 | |
| | 900 | | Glendale Industrial Development Authority, Arizona, Revenue Bonds, Midwestern University, Refunding Series 2010, 5.125%, 5/15/40 | 5/20 at 100.00 | A+ | | 959,454 | |
| | 430 | | Northern Arizona University, System Revenue Bonds, Series 2012, 5.000%, 6/01/41 | 6/21 at 100.00 | A+ | | 473,972 | |
| | 200 | | Phoenix Industrial Development Authority, Arizona, Education Facility Revenue Bonds, Brighter Choice Foundation Charter Middle Schools Project, Series 2012, 7.500%, 7/01/42 | 7/22 at 100.00 | BB+ | | 208,438 | |
| | 155 | | Phoenix Industrial Development Authority, Arizona, Education Revenue Bonds, Great Hearts Academies – Veritas Project, Series 2012, 6.300%, 7/01/42 | 7/21 at 100.00 | BBB | | 165,762 | |
| | 200 | | Phoenix Industrial Development Authority, Arizona, Education Revenue Bonds, Painted Rock Academy Charter School Project, Series 2012A, 7.500%, 7/01/42 | 7/20 at 100.00 | N/R | | 209,602 | |
| | 965 | | Phoenix Industrial Development Authority, Arizona, Lease Revenue Bonds, Rowan University Project, Series 2012, 5.000%, 6/01/42 – AGM Insured | 6/22 at 100.00 | A+ | | 1,041,003 | |
| | 560 | | Pima County Industrial Development Authority, Arizona, Charter School Revenue Bonds, Noah Webster Basic Schools Inc., Series 2004, 6.000%, 12/15/24 | 12/14 at 100.00 | BBB– | | 571,558 | |
| | 200 | | Pima County Industrial Development Authority, Arizona, Education Revenue Bonds, Carden Traditional Schools Project, Series 2012, 7.500%, 1/01/42 | 1/22 at 100.00 | BBB– | | 214,820 | |
| | 235 | | Pima County Industrial Development Authority, Arizona, Education Revenue Bonds, Paradise Education Center Project, Series 2010, 6.000%, 6/01/40 | 6/19 at 100.00 | BBB– | | 239,669 | |
| | 315 | | Pima County Industrial Development Authority, Arizona, Educational Revenue Bonds, Paradise Education Center Charter School, Series 2006, 6.000%, 6/01/36 | 6/16 at 100.00 | BBB– | | 318,222 | |
| | 415 | | Pima County Industrial Development Authority, Arizona, Educational Revenue Bonds, Valley Academy Charter School Project, Series 2008, 6.500%, 7/01/38 | 7/18 at 100.00 | Baa3 | | 440,954 | |
| | 565 | | Tucson Industrial Development Authority, Arizona, Charter School Revenue Bonds, Arizona Agribusiness and Equine Center Charter School, Series 2004A, 6.125%, 9/01/34 | 9/14 at 100.00 | BB+ | | 557,949 | |
| | 7,600 | | Total Education and Civic Organizations | | | | 7,900,668 | |
| | | | Health Care – 28.3% (19.9% of Total Investments) | | | | | |
| | 1,015 | | Arizona Health Facilities Authority, Hospital Revenue Bonds, Banner Health Systems, Series 2007A, 5.000%, 1/01/25 | 1/17 at 100.00 | AA– | | 1,156,846 | |
| | 620 | | Arizona Health Facilities Authority, Hospital Revenue Bonds, Banner Health Systems, Series 2007B, 1.120%, 1/02/37 | 1/17 at 100.00 | AA– | | 468,844 | |
| | 2,390 | | Arizona Health Facilities Authority, Hospital Revenue Bonds, Banner Health Systems, Series 2008D, 5.500%, 1/01/38 | 1/18 at 100.00 | AA– | | 2,658,058 | |
| | 625 | | Arizona Health Facilities Authority, Revenue Bonds, Blood Systems Inc., Series 2004, 5.000%, 4/01/20 | 4/14 at 100.00 | A | | 651,825 | |
| | 475 | | Glendale Industrial Development Authority, Arizona, Revenue Bonds, John C. Lincoln Health Network, Series 2005B, 5.000%, 12/01/37 | 12/15 at 100.00 | BBB+ | | 485,317 | |
| | 785 | | Glendale Industrial Development Authority, Arizona, Revenue Bonds, John C. Lincoln Health Network, Series 2007, 5.000%, 12/01/42 | 12/17 at 100.00 | BBB+ | | 808,856 | |
| | 1,825 | | Maricopa County Industrial Development Authority, Arizona, Health Facility Revenue Bonds, Catholic Healthcare West, Series 2004A, 5.375%, 7/01/23 | 7/14 at 100.00 | A+ | | 1,919,900 | |
| | 1,985 | | Maricopa County Industrial Development Authority, Arizona, Health Facility Revenue Bonds, Catholic Healthcare West, Series 2007A, 5.250%, 7/01/32 | 7/17 at 100.00 | A+ | | 2,150,529 | |
| | Principal | | | Optional Call | | | | |
| | Amount (000) | | Description (1) | Provisions (2) | Ratings (3) | | Value | |
| | | | Health Care (continued) | | | | | |
| | | | Show Low Industrial Development Authority, Arizona, Hospital Revenue Bonds, Navapache Regional Medical Center, Series 2005: | | | | | |
| $ | 375 | | 5.000%, 12/01/25 – RAAI Insured | 12/15 at 100.00 | BBB+ | $ | 386,749 | |
| | 315 | | 5.000%, 12/01/30 – RAAI Insured | 12/15 at 100.00 | BBB+ | | 322,513 | |
| | 1,000 | | University Medical Center Corporation, Tucson, Arizona, Hospital Revenue Bonds, Series 2011, 6.000%, 7/01/39 | 7/21 at 100.00 | BBB+ | | 1,155,990 | |
| | 1,000 | | Yavapai County Industrial Development Authority, Arizona, Hospital Revenue Bonds, Yavapai Regional Medical Center, Series 2003A, 6.000%, 8/01/33 | 8/13 at 100.00 | BBB+ | | 1,041,440 | |
| | 12,410 | | Total Health Care | | | | 13,206,867 | |
| | | | Long-Term Care – 0.4% (0.3% of Total Investments) | | | | | |
| | 205 | | Tempe Industrial Development Authority, Arizona, Revenue Bonds, Friendship Village of Tempe Project, Refunding Series 2012A, 6.000%, 12/01/32 | 12/21 at 100.00 | N/R | | 220,488 | |
| | | | Tax Obligation/General – 12.8% (9.0% of Total Investments) | | | | | |
| | 860 | | El Mirage, Arizona, General Obligation Bonds Series 2012, 5.000%, 7/01/42 – AGM Insured | 7/22 at 100.00 | AA– | | 956,286 | |
| | 365 | | Pima County Continental Elementary School District 39, Arizona, General Obligation Bonds, Series 2011A, 6.000%, 7/01/30 – AGM Insured | 7/21 at 100.00 | AA– | | 458,323 | |
| | 500 | | Pima County Unified School District 08 Flowing Wells, Arizona, General Obligation Bonds, Series 2011B, 5.375%, 7/01/29 | 7/21 at 100.00 | A+ | | 573,750 | |
| | 750 | | Pima County Unified School District 6, Marana, Arizona, General Obligation Bonds, School Improvement Project 2010 Series 2011A, 5.000%, 7/01/25 | 7/21 at 100.00 | A+ | | 857,168 | |
| | 1,000 | | Pinal County Unified School District 1, Florence, Arizona, General Obligation Bonds, Series 2008C, 5.250%, 7/01/28 | 7/18 at 100.00 | A | | 1,120,970 | |
| | 1,705 | | Scottsdale, Arizona, General Obligation Bonds, Preserve Acquisition Series 1999, 5.000%, 7/01/34 | 7/21 at 100.00 | AAA | | 2,013,503 | |
| | 5,180 | | Total Tax Obligation/General | | | | 5,980,000 | |
| | | | Tax Obligation/Limited – 45.0% (31.7% of Total Investments) | | | | | |
| | 660 | | Arizona Sports and Tourism Authority, Senior Revenue Refunding Bonds, Multipurpose Stadium Facility Project, Series 2012A, 5.000%, 7/01/36 | 7/22 at 100.00 | A1 | | 728,726 | |
| | 1,000 | | Arizona State Transportation Board, Highway Revenue Bonds, Subordinate Refunding Series 2011A, 5.000%, 7/01/36 | 7/21 at 100.00 | AA+ | | 1,142,060 | |
| | 345 | | Buckeye, Arizona, Festival Ranch Community Facilities District District General Obligation Bonds, Series 2012, 5.000%, 7/15/27 | 7/22 at 100.00 | BBB | | 363,533 | |
| | 133 | | Centerra Community Facilities District, Goodyear, Arizona, General Obligation Bonds, Series 2005, 5.500%, 7/15/29 | 7/15 at 100.00 | N/R | | 125,055 | |
| | 2,000 | | DC Ranch Community Facilities District, Scottsdale, Arizona, General Obligation Bonds, Series 2002, 5.000%, 7/15/27 – AMBAC Insured | 7/13 at 100.00 | A1 | | 2,029,340 | |
| | | | Estrella Mountain Ranch Community Facilities District, Arizona, Special Assessment Bonds, Montecito Assessment District, Series 2007: | | | | | |
| | 245 | | 5.700%, 7/01/27 | 1/17 at 100.00 | N/R | | 241,129 | |
| | 152 | | 5.800%, 7/01/32 | 1/17 at 100.00 | N/R | | 146,612 | |
| | 217 | | Estrella Mountain Ranch Community Facilities District, Goodyear, Arizona, Special Assessment Lien Bonds, Series 2001A, 7.875%, 7/01/25 | 1/13 at 100.00 | N/R | | 217,412 | |
| | 510 | | Government of Guam, Business Privilege Tax Bonds, Series 2011A, 5.000%, 1/01/31 | 1/22 at 100.00 | A | | 579,794 | |
| | 525 | | Greater Arizona Development Authority, Infrastructure Revenue Bonds, Series 2006A, 5.000%, 8/01/23 – NPFG Insured | 8/16 at 100.00 | A1 | | 584,966 | |
| | 917 | | Marana, Arizona, Tangerine Farms Road Improvement District Revenue Bonds, Series 2006, 4.600%, 1/01/26 | 7/16 at 100.00 | A2 | | 949,755 | |
| | 290 | | Marley Park Community Facilities District, City of Surprise, Arizona, Limited Tax General Obligation Bonds, Series 2008 (Bank Qualified), 6.100%, 7/15/32 | 7/17 at 100.00 | N/R | | 289,643 | |
| | 490 | | Merrill Ranch Community Facilities District 1, Florence, Arizona, General Obligation Bonds, Series 2008A, 7.400%, 7/15/33 | 7/18 at 100.00 | N/R | | 534,242 | |
| | 2,175 | | Mohave County, Arizona, Certificates of Participation, Series 2004, 5.250%, 7/01/19 – AMBAC Insured | 7/14 at 100.00 | N/R | | 2,263,153 | |
| | | Nuveen Arizona Dividend Advantage Municipal Fund 3 (continued) |
| NXE | | Portfolio of Investments |
August 31, 2012 (Unaudited)
| | Principal | | | Optional Call | | | | |
| | Amount (000) | | Description (1) | Provisions (2) | Ratings (3) | | Value | |
| | | | Tax Obligation/Limited (continued) | | | | | |
| $ | 300 | | Page, Arizona, Pledged Revenue Bonds, Refunding Series 2011, 5.000%, 7/01/26 | 7/21 at 100.00 | AA– | $ | 349,026 | |
| | 640 | | Palm Valley Community Facility District 3, Goodyear, Arizona, General Obligation Bonds, Series 2006, 5.300%, 7/15/31 | 7/16 at 100.00 | N/R | | 585,030 | |
| | 425 | | Palm Valley Community Facility District 3, Goodyear, Arizona, Limited Tax General Obligation Bonds, Series 2007, 5.800%, 7/15/32 | 7/17 at 100.00 | N/R | | 409,921 | |
| | 160 | | Parkway Community Facilities District 1, Prescott Valley, Arizona, General Obligation Bonds, Series 2006, 5.350%, 7/15/31 | 7/16 at 100.00 | N/R | | 147,149 | |
| | 170 | | Phoenix Mesa Gateway Airport Authority, Arizona, Special Facility Revenue Bonds, Mesa Project, Series 2012, 5.000%, 7/01/38 (Alternative Minimum Tax) | 7/22 at 100.00 | AA+ | | 178,825 | |
| | 1,250 | | Pinal County Industrial Development Authority, Arizona, Correctional Facilities Contract Revenue Bonds, Florence West Prison LLC, Series 2002A, 5.000%, 10/01/18 – ACA Insured | 10/12 at 100.00 | BBB– | | 1,251,213 | |
| | 250 | | Puerto Rico Sales Tax Financing Corporation, Sales Tax Revenue Bonds, First Subordinate Series 2010A, 5.375%, 8/01/39 | 2/20 at 100.00 | A+ | | 267,640 | |
| | 1,650 | | Puerto Rico Sales Tax Financing Corporation, Sales Tax Revenue Bonds, First Subordinate Series 2010C, 0.000%, 8/01/38 | No Opt. Call | A+ | | 380,160 | |
| | 1,130 | | San Luis Civic Improvement Corporation, Arizona, Municipal Facilities Excise Tax Revenue Bonds, Series 2005, 5.000%, 7/01/25 – SYNCORA GTY Insured | 7/15 at 100.00 | A+ | | 1,194,218 | |
| | 2,000 | | Scottsdale Municipal Property Corporation, Arizona, Excise Tax Revenue Bonds, Water & Sewer Improvements Project, Series 2010, 5.000%, 7/01/36 | 7/20 at 100.00 | AAA | | 2,272,080 | |
| | 665 | | Tartesso West Community Facility District, Buckeye, Arizona, Limited Tax General Obligation Bonds, Series 2007, 5.900%, 7/15/32 | 7/17 at 100.00 | N/R | | 641,592 | |
| | 750 | | Virgin Islands Public Finance Authority, Matching Fund Loan Notes Revenue Bonds, Senior Lien Series 2010A, 5.000%, 10/01/29 | 10/20 at 100.00 | BBB+ | | 819,480 | |
| | 1,250 | | Vistancia Community Facilities District, Peoria, Arizona, General Obligation Bonds, Series 2005, 5.750%, 7/15/24 | 7/15 at 100.00 | A1 | | 1,331,625 | |
| | 634 | | Watson Road Community Facilities District, Arizona, Special Assessment Revenue Bonds, Series 2005, 6.000%, 7/01/30 | 7/16 at 100.00 | N/R | | 602,027 | |
| | 425 | | Westpark Community Facilities District, Buckeye, Arizona, General Obligation Tax Increment Bonds Series 2006, 5.250%, 7/15/31 | 7/16 at 100.00 | N/R | | 386,130 | |
| | 21,358 | | Total Tax Obligation/Limited | | | | 21,011,536 | |
| | | | Transportation – 5.6% (3.9% of Total Investments) | | | | | |
| | | | Phoenix Civic Improvement Corporation, Arizona, Senior Lien Airport Revenue Bonds, Series 2002B: | | | | | |
| | 300 | | 5.750%, 7/01/16 – FGIC Insured (Alternative Minimum Tax) | 1/13 at 100.00 | AA– | | 301,092 | |
| | 2,300 | | 5.250%, 7/01/21 – FGIC Insured (Alternative Minimum Tax) | 1/13 at 100.00 | AA– | | 2,304,738 | |
| | 2,600 | | Total Transportation | | | | 2,605,830 | |
| | | | U.S. Guaranteed – 5.2% (3.7% of Total Investments) (5) | | | | | |
| | 1,575 | | Maricopa County Union High School District 210, Phoenix, Arizona, General Obligation Bonds, Series 2004A, 5.000%, 7/01/20 (Pre-refunded 7/01/14) – AGM Insured | 7/14 at 100.00 | AA (5) | | 1,711,600 | |
| | 270 | | Maricopa County, Arizona, Hospital Revenue Bonds, Sun Health Corporation, Series 2005, 5.000%, 4/01/16 (Pre-refunded 4/01/15) | 4/15 at 100.00 | N/R (5) | | 302,036 | |
| | 405 | | Oro Valley Municipal Property Corporation, Arizona, Senior Lien Water Revenue Bonds, Series 2003, 5.000%, 7/01/23 (Pre-refunded 7/01/13) – NPFG Insured | 7/13 at 100.00 | AA (5) | | 421,054 | |
| | 2,250 | | Total U.S. Guaranteed | | | | 2,434,690 | |
| | | | Utilities – 18.5% (13.0% of Total Investments) | | | | | |
| | 625 | | Apache County Industrial Development Authority, Arizona, Pollution Control Revenue Bonds, Tucson Electric Power Company, Series 20102A, 4.500%, 3/01/30 | 3/22 at 100.00 | BBB– | | 650,050 | |
| | 1,200 | | Maricopa County Pollution Control Corporation, Arizona, Pollution Control Revenue Refunding Bonds, Southern California Edison Company, Series 2000A, 5.000%, 6/01/35 | 6/20 at 100.00 | A1 | | 1,331,940 | |
| | 1,250 | | Maricopa County Pollution Control Corporation, Arizona, Revenue Bonds, Arizona Public Service Company – Palo Verde Project, Series 2002A, 5.050%, | 11/12 at 100.00 | Baa1 | | 1,252,925 | |
| | | | 5/01/29 – AMBAC Insured | | | | | |
| | Principal | | | Optional Call | | | | |
| | Amount (000) | | Description (1) | Provisions (2) | Ratings (3) | | Value | |
| | | | Utilities (continued) | | | | | |
| $ | 665 | | Pima County Industrial Development Authority, Arizona, Revenue Bonds, Tucson Electric Power Company, Refunding Series 2008, 5.750%, 9/01/29 | 1/15 at 100.00 | BBB– | $ | 710,413 | |
| | 500 | | Pinal County Electrical District 3, Arizona, Electric System Revenue Bonds, Refunding Series 2011, 5.250%, 7/01/36 | 7/21 at 100.00 | A | | 561,725 | |
| | 1,660 | | Puerto Rico Electric Power Authority, Power Revenue Bonds, Series 2005RR, 5.000%, 7/01/26 – SYNCORA GTY Insured | 7/15 at 100.00 | BBB+ | | 1,778,192 | |
| | 775 | | Salt River Project Agricultural Improvement and Power District, Arizona, Electric System Revenue Bonds, Tender Option Bond Trust 09-9W, 17.940%, 1/01/38 (IF) (6) | 1/18 at 100.00 | Aa1 | | 1,111,381 | |
| | 1,165 | | Salt Verde Financial Corporation, Arizona, Senior Gas Revenue Bonds, Citigroup Energy Inc Prepay Contract Obligations, Series 2007, 5.000%, 12/01/37 | No Opt. Call | A– | | 1,244,884 | |
| | 7,840 | | Total Utilities | | | | 8,641,510 | |
| | | | Water and Sewer – 8.4% (5.9% of Total Investments) | | | | | |
| | 500 | | Glendale, Arizona, Water and Sewer Revenue Bonds, Refunding Series 2012, 5.000%, 7/01/28 | 7/22 at 100.00 | AA | | 593,255 | |
| | 955 | | Goodyear, Arizona, Water and Sewer Revenue Obligations, Series 2010, 5.625%, 7/01/39 | 7/20 at 100.00 | A+ | | 1,061,473 | |
| | 750 | | Puerto Rico Aqueduct and Sewerage Authority, Revenue Bonds, Senior Lien Series 2008A, 6.000%, 7/01/38 | 7/18 at 100.00 | Baa2 | | 799,380 | |
| | | | Surprise Municipal Property Corporation, Arizona, Wastewater System Revenue Bonds, Series 2007: | | | | | |
| | 425 | | 4.700%, 4/01/22 | 4/14 at 100.00 | A– | | 432,421 | |
| | 490 | | 4.900%, 4/01/32 | 4/17 at 100.00 | A– | | 502,569 | |
| | 615 | | Yuma County Industrial Development Authority, Arizona, Exempt Revenue Bonds, Far West Water & Sewer Inc. Refunding, Series 2007A, 6.375%, 12/01/37 (Alternative Minimum Tax) | 12/17 at 100.00 | N/R | | 528,839 | |
| | 3,735 | | Total Water and Sewer | | | | 3,917,937 | |
| $ | 63,638 | | Total Investments (cost $61,795,261) – 142.1% | | | | 66,379,517 | |
| | | | MuniFund Term Preferred Shares, at Liquidation Value – (44.6)% (7) | | | | (20,846,000 | ) |
| | | | Other Assets Less Liabilities – 2.5% | | | | 1,184,957 | |
| | | | Net Assets Applicable to Common Shares – 100% | | | $ | 46,718,474 | |
| (1) | | All percentages shown in the Portfolio of Investments are based on net assets applicable to Common shares unless otherwise noted. |
| (2) | | Optional Call Provisions: Dates (month and year) and prices of the earliest optional call or redemption. There may be other call provisions at varying prices at later dates. Certain mortgage-backed securities may be subject to periodic principal paydowns. |
| (3) | | Ratings: Using the highest of Standard & Poor’s Group (“Standard & Poor’s”), Moody’s Investors Service, Inc. (“Moody’s”) or Fitch, Inc. (“Fitch”) rating. Ratings below BBB by Standard & Poor’s, Baa by Moody’s or BBB by Fitch are considered to be below investment grade. Holdings designated N/R are not rated by any of these national rating agencies. |
| (4) | | Investment valued at fair value using methods determined in good faith by, or at the discretion of, the Board of Trustees. For fair value measurement disclosure purposes, investment categorized as Level 3. See Notes to Financial Statements, Footnote 1 – General Information and Significant Accounting Policies, Investment Valuation for more information. |
| (5) | | Backed by an escrow or trust containing sufficient U.S. Government or U.S. Government agency securities, which ensure the timely payment of principal and interest. Certain bonds backed by U.S. Government or agency securities are regarded as having an implied rating equal to the rating of such securities. |
| (6) | | Investment, or portion of investment, has been pledged to collateralize the net payment obligations for investments in inverse floating rate transactions. |
| (7) | | MuniFund Term Preferred Shares, at Liquidation Value as a percentage of Total Investments is 31.4%. |
| N/R | | Not rated. |
| (IF) | | Inverse floating rate investment. |
See accompanying notes to financial statements.
| | | Nuveen Texas Quality Income Municipal Fund |
| NTX | | Portfolio of Investments |
| | | August 31, 2012 (Unaudited) |
| | Principal | | | Optional Call | | | | |
| | Amount (000) | | Description (1) | Provisions (2) | Ratings (3) | | Value | |
| | | | Consumer Discretionary – 1.1% (0.7% of Total Investments) | | | | | |
| $ | 1,450 | | Austin Convention Enterprises Inc., Texas, Convention Center Hotel Revenue Bonds, First Tier Series 2006A, 5.250%, 1/01/18 – SYNCORA GTY Insured | 1/17 at 100.00 | BB+ | $ | 1,595,827 | |
| | | | Consumer Staples – 1.4% (1.0% of Total Investments) | | | | | |
| | 2,185 | | Puerto Rico, The Children’s Trust Fund, Tobacco Settlement Asset-Backed Refunding Bonds, Series 2002, 5.375%, 5/15/33 | 11/12 at 100.00 | BBB+ | | 2,184,956 | |
| | | | Education and Civic Organizations – 11.3% (7.7% of Total Investments) | | | | | |
| | 2,000 | | Board of Regents, University of Texas System, Financing System Revenue Bonds, Refunding Series 2012B, 5.000%, 8/15/22 | No Opt. Call | AAA | | 2,569,360 | |
| | 1,000 | | Hale Center Education Facilities Corporation, Texas, Revenue Bonds, Wayland Baptist University Project, Improvement and Refunding Series 2010, 5.000%, 3/01/35 | 3/21 at 100.00 | A– | | 1,085,340 | |
| | 2,000 | | Laredo Community College District, Webb County, Texas, Combined Fee Revenue Bonds, Series 2010, 5.250%, 8/01/35 – AGM Insured | 8/20 at 100.00 | AA– | | 2,263,020 | |
| | | | Red River Education Finance Corporation, Texas, Revenue Bonds, Hockaday School, Series 2005: | | | | | |
| | 1,170 | | 5.000%, 5/15/27 | 5/15 at 100.00 | AA | | 1,281,255 | |
| | 1,230 | | 5.000%, 5/15/28 | 5/15 at 100.00 | AA | | 1,335,460 | |
| | 1,290 | | 5.000%, 5/15/29 | 5/15 at 100.00 | AA | | 1,400,605 | |
| | | | Texas Public Finance Authority, Revenue Bonds, Texas Southern University Financing System, Series 2003: | | | | | |
| | 1,710 | | 5.000%, 5/01/18 – FGIC Insured | 5/13 at 100.00 | Baa1 | | 1,727,579 | |
| | 1,795 | | 5.000%, 5/01/19 – FGIC Insured | 5/13 at 100.00 | Baa1 | | 1,812,394 | |
| | 1,885 | | 5.000%, 5/01/20 – FGIC Insured | 5/13 at 100.00 | Baa1 | | 1,901,513 | |
| | 1,665 | | Texas State University System, Financing Revenue Bonds, Series 2004, 5.000%, 3/15/24 – AGM Insured | 9/14 at 100.00 | Aa2 | | 1,795,519 | |
| | 15,745 | | Total Education and Civic Organizations | | | | 17,172,045 | |
| | | | Health Care – 13.3% (9.1% of Total Investments) | | | | | |
| | 1,000 | | Harris County Cultural Education Facilities Finance Corporation, Texas, Medical Facilities Revenue Refunding Bonds, Baylor College of Medicine, Series 2012A, 5.000%, 11/15/26 (WI/DD, Settling 9/06/12) | 11/22 at 100.00 | A– | | 1,123,180 | |
| | 1,350 | | Harrison County Health Facilities Development Corporation, Texas, Hospital Revenue Bonds, Good Shepherd Health System, Refunding Series 2010, 5.250%, 7/01/28 | 7/20 at 100.00 | BBB+ | | 1,435,833 | |
| | 2,000 | | North Central Texas Health Facilities Development Corporation, Texas, Revenue Bonds, Children’s Medical Center Dallas Project, Series 2009, 5.750%, 8/15/39 | 8/19 at 100.00 | AA | | 2,288,260 | |
| | 885 | | North Central Texas Health Facilities Development Corporation, Texas, Revenue Bonds, Children’s Medical Center Dallas Project, Series 2012, 5.000%, 8/15/32 | 8/22 at 100.00 | AA | | 1,009,750 | |
| | | | Richardson Hospital Authority, Texas, Revenue Bonds, Richardson Regional Medical Center, Series 2004: | | | | | |
| | 2,000 | | 5.875%, 12/01/24 | 12/13 at 100.00 | A+ | | 2,058,300 | |
| | 1,000 | | 6.000%, 12/01/34 | 12/13 at 100.00 | A+ | | 1,027,960 | |
| | 1,250 | | Tarrant County Cultural Education Facilities Finance Corporation, Texas, Hospital Revenue Bonds, Scott & White HealthCare Project, Series 2010, 5.250%, 8/15/40 | 8/20 at 100.00 | AA– | | 1,371,163 | |
| | 2,500 | | Tarrant County Cultural Education Facilities Finance Corporation, Texas, Revenue Bonds, Texas Health Resources, Series 2007B, 5.000%, 11/15/42 | 11/17 at 100.00 | AA– | | 2,697,275 | |
| | 2,000 | | Tarrant County Cultural Education Facilities Finance Corporation, Texas, Revenue Refunding Bonds, Christus Health, Series 2008, 6.500%, 7/01/37 – AGC Insured | 1/19 at 100.00 | AA– | | 2,351,100 | |
| | 1,720 | | Tyler Health Facilities Development Corporation, Texas, Hospital Revenue Bonds, East Texas Medical Center Regional Healthcare System, Series 2007A, 5.375%, 11/01/37 | 11/17 at 100.00 | Baa2 | | 1,839,420 | |
| | 700 | | Tyler Health Facilities Development Corporation, Texas, Hospital Revenue Bonds, Mother Frances Hospital Regional Healthcare Center, Series 2007B, 5.000%, 7/01/37 | 7/17 at 100.00 | Baa1 | | 724,689 | |
| | 2,250 | | Tyler Health Facilities Development Corporation, Texas, Hospital Revenue Bonds, Mother Frances Hospital Regional Healthcare Center, Series 2007, 5.000%, 7/01/33 | 7/17 at 100.00 | Baa1 | | 2,340,360 | |
| | 18,655 | | Total Health Care | | | | 20,267,290 | |
| | Principal | | | Optional Call | | | | |
| | Amount (000) | | Description (1) | Provisions (2) | Ratings (3) | | Value | |
| | | | Housing/Multifamily – 1.8% (1.2% of Total Investments) | | | | | |
| | | | Bexar County Housing Finance Corporation, Texas, Insured Multifamily Housing Revenue Bonds, Waters at Northern Hills Apartments Project, Series 2001A: | | | | | |
| $ | 2,000 | | 6.000%, 8/01/31 – NPFG Insured | 2/13 at 101.00 | Baa2 | $ | 1,951,340 | |
| | 750 | | 6.050%, 8/01/36 – NPFG Insured | 2/13 at 101.00 | Baa2 | | 719,798 | |
| | 2,750 | | Total Housing/Multifamily | | | | 2,671,138 | |
| | | | Housing/Single Family – 1.5% (1.0% of Total Investments) | | | | | |
| | 2,250 | | Texas Department of Housing and Community Affairs, Single Family Mortgage Bonds, Series 2002B, 5.550%, 9/01/33 – NPFG Insured (Alternative Minimum Tax) | 9/12 at 100.00 | AA+ | | 2,252,745 | |
| | | | Long-Term Care – 1.0% (0.7% of Total Investments) | | | | | |
| | | | Bexar County, Texas, Health Facilities Development Corporation Revenue Bonds, Army Retirement Residence, Series 2007: | | | | | |
| | 955 | | 5.000%, 7/01/27 | 7/17 at 100.00 | BBB | | 978,398 | |
| | 600 | | 5.000%, 7/01/37 | 7/17 at 100.00 | BBB | | 607,794 | |
| | 1,555 | | Total Long-Term Care | | | | 1,586,192 | |
| | | | Materials – 2.0% (1.4% of Total Investments) | | | | | |
| | 3,000 | | Cass County Industrial Development Corporation, Texas, Environmental Improvement Revenue Bonds, International Paper Company, Series 2000A, 6.600%, 3/15/24 (Alternative Minimum Tax) | 9/12 at 100.00 | BBB | | 3,011,640 | |
| | | | Tax Obligation/General – 34.1% (23.1% of Total Investments) | | | | | |
| | 650 | | Bexar County, Texas, General Obligation Bonds, Series 2004, 5.000%, 6/15/19 | 6/14 at 100.00 | Aaa | | 698,978 | |
| | 2,000 | | Borger Independent School District, Hutchison County, Texas, General Obligation Bonds, Series 2006, 5.000%, 2/15/36 | 2/16 at 100.00 | AAA | | 2,234,780 | |
| | 400 | | Calallen Independent School District, Nueces County, Texas, General Obligation Bonds, School Building Series 2008, 5.000%, 2/15/38 | 2/18 at 100.00 | AAA | | 438,816 | |
| | 1,620 | | Cameron County, Texas, General Obligation Bonds, State Highway 550 Project, Series 2012, 5.000%, 2/15/32 – AGM Insured | 2/22 at 100.00 | AA– | | 1,855,564 | |
| | 1,190 | | Canutillo Independent School District, El Paso County, Texas, General Obligation Bonds, Series 2006A, 5.000%, 8/15/22 | 8/15 at 100.00 | AAA | | 1,332,717 | |
| | 1,500 | | College Station, Texas, Certificates of Obligation, Series 2012, 5.000%, 2/15/32 | 2/21 at 100.00 | AA | | 1,742,625 | |
| | 2,305 | | Corpus Christi, Texas, Combination Tax and Municipal Hotel Occupancy Tax Revenue Certificates of Obligation, Series 2002, 5.500%, 9/01/21 – AGM Insured | 9/12 at 100.00 | Aa2 | | 2,314,635 | |
| | 1,750 | | El Paso County, Texas, Certificates of Obligation, Series 2001, 5.000%, 2/15/21 – AGM Insured | No Opt. Call | AA | | 2,153,935 | |
| | | | Fort Bend County Municipal Utility District 25, Texas, General Obligation Bonds, Series 2005: | | | | | |
| | 960 | | 5.000%, 10/01/26 – FGIC Insured | 10/12 at 100.00 | A– | | 961,469 | |
| | 950 | | 5.000%, 10/01/27 – FGIC Insured | 10/12 at 100.00 | A– | | 951,387 | |
| | 3,615 | | Frisco, Texas, General Obligation Bonds, Series 2006, 5.000%, 2/15/26 – FGIC Insured | 2/16 at 100.00 | Aa1 | | 4,025,266 | |
| | 8,500 | | Grand Prairie Independent School District, Dallas County, Texas, General Obligation Bonds, Capital Appreciation Refunding Series 2009, 0.000%, 8/15/39 | 8/18 at 22.64 | AA | | 1,546,150 | |
| | 3,255 | | Hutto Independent School District, Williamson County, Texas, General Obligation Bonds, Refunding Series 2012A, 0.000%, 8/01/45 | 8/21 at 24.48 | A | | 491,733 | |
| | 4,900 | | Leander Independent School District, Williamson and Travis Counties, Texas, General Obligation Bonds, Series 2006, 0.000%, 8/15/45 | 8/14 at 17.78 | AAA | | 837,263 | |
| | 1,000 | | Leander Independent School District, Williamson and Travis Counties, Texas, General Obligation Bonds, Series 2008, 0.000%, 8/15/36 | 8/17 at 33.01 | AAA | | 288,330 | |
| | 365 | | Lone Star College System, Harris and Montgomery Counties, Texas, General Obligation Bonds, Series 2009, 5.000%, 8/15/34 | 8/19 at 100.00 | AAA | | 433,813 | |
| | 1,750 | | Martin County Hospital District, Texas, Combination Limited Tax and Revenue Bonds, Series 2011A, 7.250%, 4/01/36 | 4/21 at 100.00 | BBB | | 1,952,125 | |
| | 1,010 | | Mercedes Independent School District, Hidalgo County, Texas, General Obligation Bonds, Series 2005, 5.000%, 8/15/23 | 8/15 at 100.00 | AAA | | 1,131,129 | |
| | 5,515 | | Midlothian Independent School District, Ellis County, Texas, General Obligation Bonds, Series 2005, 5.000%, 2/15/34 | 2/15 at 100.00 | Aaa | | 5,989,068 | |
| | | Nuveen Texas Quality Income Municipal Fund (continued) |
| NTX | | Portfolio of Investments |
August 31, 2012 (Unaudited)
| | Principal | | | Optional Call | | | | |
| | Amount (000) | | Description (1) | Provisions (2) | Ratings (3) | | Value | |
| | | | Tax Obligation/General (continued) | | | | | |
| $ | 1,500 | | Montgomery County, Texas, General Obligation Bonds, Refunding Series 2008B, 5.250%, 3/01/32 | 3/19 at 100.00 | Aa1 | $ | 1,746,555 | |
| | 2,000 | | Plano Independent School District, Collin County, Texas, General Obligation Bonds, Series 2008A, 5.250%, 2/15/34 | 2/18 at 100.00 | Aaa | | 2,377,020 | |
| | 1,425 | | Port of Houston Authority, Harris County, Texas, General Obligation Bonds, Series 2010E, 0.000%, 10/01/35 | No Opt. Call | AAA | | 596,961 | |
| | | | Roma Independent School District, Texas, General Obligation Bonds, Series 2005: | | | | | |
| | 1,110 | | 5.000%, 8/15/22 | 8/15 at 100.00 | AAA | | 1,243,122 | |
| | 1,165 | | 5.000%, 8/15/23 – AGM Insured | 8/15 at 100.00 | AAA | | 1,304,718 | |
| | 1,250 | | Southside Independent School District, Bexar County, Texas, General Obligation Bonds, Series 2004A, 5.000%, 8/15/22 | 8/14 at 100.00 | Aaa | | 1,352,550 | |
| | 5,000 | | Texas State, General Obligation Bonds, Transportation Commission Mobility Fund, Series 2006A, 5.000%, 4/01/33 (UB) | 4/17 at 100.00 | AAA | | 5,737,100 | |
| | 1,000 | | Texas State, General Obligation Bonds, Transportation Commission Mobility Fund, Series 2008, 5.000%, 4/01/30 (UB) | 4/18 at 100.00 | AAA | | 1,161,050 | |
| | 650 | | Texas State, General Obligation Bonds, Water Utility, Series 2001, 5.250%, 8/01/23 | 11/12 at 100.00 | Aaa | | 650,000 | |
| | 3,025 | | Victoria Independent School District, Victoria County, Texas, General Obligation Bonds, Series 2007, 5.000%, 2/15/32 | 2/17 at 100.00 | AAA | | 3,473,880 | |
| | | | West Texas Independent School District, McLennan and Hill Counties, General Obligation Refunding Bonds, Series 1998: | | | | | |
| | 45 | | 0.000%, 8/15/22 | 8/13 at 61.20 | AAA | | 27,274 | |
| | 45 | | 0.000%, 8/15/24 | 8/13 at 54.88 | AAA | | 24,429 | |
| | | | White Settlement Independent School District, Tarrant County, Texas, General Obligation Bonds, Series 2006: | | | | | |
| | 1,500 | | 0.000%, 8/15/43 | 8/15 at 23.12 | AAA | | 308,535 | |
| | 1,500 | | 0.000%, 8/15/44 | 8/15 at 21.88 | AAA | | 291,750 | |
| | 425 | | 0.000%, 8/15/45 | 8/15 at 20.76 | AAA | | 78,387 | |
| | 64,875 | | Total Tax Obligation/General | | | | 51,753,114 | |
| | | | Tax Obligation/Limited – 17.1% (11.6% of Total Investments) | | | | | |
| | 1,000 | | Bexar County, Texas, Venue Project Revenue Bonds, Refunding Series 2010, 5.250%, 8/15/38 – AGM Insured | 8/19 at 100.00 | AA– | | 1,110,780 | |
| | 7,940 | | Dallas Area Rapid Transit, Texas, Sales Tax Revenue Bonds, Senior Lien Refunding Series 2007, 5.000%, 12/01/36 – AMBAC Insured | 12/16 at 100.00 | AA+ | | 9,040,880 | |
| | 1,390 | | Harris County Metropolitan Transit Authority, Texas, Sales and Use Tax Revenue Bonds, Series 2011A, 5.000%, 11/01/41 | 11/21 at 100.00 | AA | | 1,589,131 | |
| | | | Harris County-Houston Sports Authority, Texas, Revenue Bonds, Junior Lien Series 2001H: | | | | | |
| | 1,720 | | 0.000%, 11/15/34 – NPFG Insured | 11/31 at 83.17 | BBB | | 475,735 | |
| | 930 | | 0.000%, 11/15/36 – NPFG Insured | 11/31 at 73.51 | BBB | | 225,265 | |
| | 3,265 | | 0.000%, 11/15/38 – NPFG Insured | 11/31 at 64.91 | BBB | | 698,286 | |
| | 2,000 | | 0.000%, 11/15/39 – NPFG Insured | 11/31 at 60.98 | BBB | | 401,820 | |
| | | | Harris County-Houston Sports Authority, Texas, Revenue Bonds, Senior Lien Series 2001G: | | | | | |
| | 2,250 | | 5.250%, 11/15/22 – NPFG Insured | 11/12 at 100.00 | BBB | | 2,252,970 | |
| | 3,275 | | 0.000%, 11/15/41 – NPFG Insured | 11/31 at 53.78 | BBB | | 568,540 | |
| | 2,000 | | Houston, Texas, Hotel Occupancy Tax and Special Revenue Bonds, Convention and Entertainment Project, Refunding Series 2012, 5.000%, 9/01/33 | 9/13 at 100.00 | A2 | | 2,057,340 | |
| | 1,470 | | Houston, Texas, Hotel Occupancy Tax and Special Revenue Bonds, Convention and Entertainment Project, Series 2001B, 0.000%, 9/01/32 – AMBAC Insured | No Opt. Call | A2 | | 542,695 | |
| | 3,000 | | North Texas Tollway Authority, Special Projects System Revenue Bonds, Current Interest Series 2011D, 5.000%, 9/01/31 | 9/21 at 100.00 | AA | | 3,507,570 | |
| | 2,000 | | North Texas Tollway Authority, Special Projects System Revenue Bonds, Series 2011A, 5.500%, 9/01/41 | 9/21 at 100.00 | AA | | 2,378,780 | |
| | 1,000 | | Uptown Development Authority, Houston, Texas, Tax Increment Revenue Bonds, Infrastructure Improvement Facilities, Series 2009, 5.500%, 9/01/29 | 9/19 at 100.00 | BBB | | 1,096,550 | |
| | 33,240 | | Total Tax Obligation/Limited | | | | 25,946,342 | |
| | Principal | | | Optional Call | | | | |
| | Amount (000) | | Description (1) | Provisions (2) | Ratings (3) | | Value | |
| | | | Transportation – 15.2% (10.3% of Total Investments) | | | | | |
| $ | 1,000 | | Austin, Texas, Airport System Prior Lien Revenue Bonds, Series 2003, 5.250%, 11/15/16 – NPFG Insured | 11/13 at 100.00 | A | $ | 1,048,940 | |
| | | | Central Texas Regional Mobility Authority, Senior Lien Revenue Bonds, Series 2010: | | | | | |
| | 2,945 | | 0.000%, 1/01/36 | No Opt. Call | BBB– | | 824,335 | |
| | 2,205 | | 0.000%, 1/01/37 | No Opt. Call | BBB– | | 583,046 | |
| | 2,160 | | 0.000%, 1/01/38 | No Opt. Call | BBB– | | 539,438 | |
| | 1,000 | | 0.000%, 1/01/40 | No Opt. Call | BBB– | | 223,240 | |
| | 3,260 | | Central Texas Regional Mobility Authority, Travis and Williamson Counties, Toll Road Revenue Bonds, Series 2005, 5.000%, 1/01/22 – FGIC Insured | 1/15 at 100.00 | BBB | | 3,333,220 | |
| | 1,000 | | Dallas-Fort Worth International Airport, Texas, Joint Revenue Bonds, Refunding Series 2010A, 5.000%, 11/01/42 | 11/20 at 100.00 | A+ | | 1,109,080 | |
| | 1,165 | | Dallas-Fort Worth International Airport, Texas, Joint Revenue Bonds, Refunding Series 2012B, 5.000%, 11/01/35 | 11/20 at 100.00 | A+ | | 1,304,392 | |
| | 2,000 | | Houston, Texas, Subordinate Lien Airport System Revenue Refunding Bonds, Series Series 2012A, 5.000%, 7/01/31 (Alternative Minimum Tax) | 7/22 at 100.00 | A+ | | 2,239,720 | |
| | 3,000 | | Love Field Airport Modernization Corporation, Texas, Special Facilities Revenue Bonds, Southwest Airlines Company, Series 2010, 5.250%, 11/01/40 | 11/20 at 100.00 | BBB– | | 3,235,050 | |
| | 395 | | North Texas Tollway Authority, First Tier System Revenue Refunding Bonds, Series 2008A, 5.750%, 1/01/40 | 1/18 at 100.00 | A2 | | 443,494 | |
| | | | North Texas Tollway Authority, First Tier System Revenue Refunding Bonds, Series 2008B: | | | | | |
| | 325 | | 5.750%, 1/01/40 | 1/18 at 100.00 | A2 | | 364,900 | |
| | 225 | | 5.750%, 1/01/40 – NPFG Insured | 1/18 at 100.00 | A2 | | 252,623 | |
| | 2,500 | | North Texas Tollway Authority, First Tier System Revenue Refunding Bonds, Series 2008D, 0.000%, 1/01/36 – AGC Insured | No Opt. Call | AA– | | 840,425 | |
| | 950 | | North Texas Tollway Authority, Second Tier System Revenue Refunding Bonds, Series 2008F, 5.750%, 1/01/38 | 1/18 at 100.00 | A3 | | 1,042,701 | |
| | | | North Texas Tollway Authority, System Revenue Bonds, First Tier Series 2009A: | | | | | |
| | 100 | | 6.100%, 1/01/28 | 1/19 at 100.00 | A2 | | 118,547 | |
| | 2,000 | | 6.250%, 1/01/39 | 1/19 at 100.00 | A2 | | 2,303,140 | |
| | 2,500 | | San Antonio, Texas, Airport System Revenue Bonds, Refunding Series 2012, 5.000%, 7/01/27 Alternative Minimum Tax) | 7/22 at 100.00 | A+ | | 2,845,300 | |
| | 1,250 | | Texas Turnpike Authority, Central Texas Turnpike System Revenue Bonds, First Tier Series 2002A, 0.000%, 8/15/29 – AMBAC Insured | 11/12 at 37.62 | BBB+ | | 463,750 | |
| | 29,980 | | Total Transportation | | | | 23,115,341 | |
| | | | U.S. Guaranteed – 17.4% (11.8% of Total Investments) (4) | | | | | |
| | 610 | | Bexar County, Texas, General Obligation Bonds, Series 2004, 5.000%, 6/15/19 (Pre-refunded 6/15/14) | 6/14 at 100.00 | Aaa | | 661,210 | |
| | | | Brazoria County Health Facilities Development Corporation, Texas, Revenue Bonds, Brazosport Memorial Hospital, Series 2004: | | | | | |
| | 1,745 | | 5.250%, 7/01/20 (Pre-refunded 7/01/14) – RAAI Insured | 7/14 at 100.00 | BBB– (4) | | 1,900,270 | |
| | 1,835 | | 5.250%, 7/01/21 (Pre-refunded 7/01/14) – RAAI Insured | 7/14 at 100.00 | BBB– (4) | | 1,998,278 | |
| | 295 | | Coppell Independent School District, Dallas County, Texas, Unlimited Tax School Building and Refunding Bonds, Series 1992, 0.000%, 8/15/14 – NPFG Insured (ETM) | No Opt. Call | Aa3 (4) | | 292,180 | |
| | | | Houston Community College System, Texas, Limited Tax General Obligation Bonds, Series 2003: | | | | | |
| | 2,500 | | 5.000%, 2/15/20 (Pre-refunded 2/15/13) – AMBAC Insured | 2/13 at 100.00 | AA+ (4) | | 2,553,400 | |
| | 2,235 | | 5.000%, 2/15/21 (Pre-refunded 2/15/13) – AMBAC Insured | 2/13 at 100.00 | AA+ (4) | | 2,282,740 | |
| | 5,000 | | Houston, Texas, General Obligation Bonds, Series 2005E, 5.000%, 3/01/23 (Pre-refunded 3/01/15) – AMBAC Insured | 3/15 at 100.00 | AA (4) | | 5,570,899 | |
| | 40 | | Lower Colorado River Authority, Texas, Revenue Bonds, Series 2008, 5.750%, 5/15/37 (Pre-refunded 5/15/15) | 5/15 at 100.00 | A1 (4) | | 45,747 | |
| | 1,000 | | Mansfield Independent School District, Tarrant County, Texas, General Obligation Bonds, Series 2004, 5.000%, 2/15/20 (Pre-refunded 2/15/14) | 2/14 at 100.00 | AAA | | 1,065,070 | |
| | | Nuveen Texas Quality Income Municipal Fund (continued) |
| NTX | | Portfolio of Investments |
August 31, 2012 (Unaudited)
| | Principal | | | Optional Call | | | | |
| | Amount (000) | | Description (1) | Provisions (2) | Ratings (3) | | Value | |
| | | | U.S. Guaranteed (4) (continued) | | | | | |
| $ | 1,000 | | North Central Texas Health Facilities Development Corporation, Hospital Revenue Bonds, Presbyterian Healthcare System, Series 1996A, 5.750%, 6/01/26 – NPFG Insured (ETM) | No Opt. Call | Aaa | $ | 1,298,970 | |
| | 2,500 | | Retama Development Corporation, Texas, Special Facilities Revenue Bonds, Retama Park Racetrack, Series 1993, 8.750%, 12/15/18 (Pre-refunded 12/15/17) | 12/17 at 100.00 | Aaa | | 3,504,575 | |
| | 1,260 | | Rowlett, Rockwall and Dallas Counties, Texas, Waterworks and Sewerage System Revenue Bonds, Series 2004A, 5.000%, 3/01/22 (Pre-refunded | 3/14 at 100.00 | AA– (4) | | 1,348,742 | |
| | | | 3/01/14) – NPFG Insured | | | | | |
| | 1,140 | | Sunnyvale School District, Texas, General Obligation Bonds, Series 2004, 5.250%, 2/15/25 (Pre-refunded 2/15/14) | 2/14 at 100.00 | AAA | | 1,222,639 | |
| | 1,500 | | Texas, General Obligation Refunding Bonds, Public Finance Authority, Series 2002, 5.000%, 10/01/18 (Pre-refunded 10/01/12) | 10/12 at 100.00 | Aaa | | 1,506,045 | |
| | | | West Texas Independent School District, McLennan and Hill Counties, General Obligation Refunding Bonds, Series 1998: | | | | | |
| | 955 | | 0.000%, 8/15/22 (Pre-refunded 8/15/13) | 8/13 at 61.20 | Aaa | | 582,378 | |
| | 955 | | 0.000%, 8/15/24 (Pre-refunded 8/15/13) | 8/13 at 54.88 | Aaa | | 522,184 | |
| | 24,570 | | Total U.S. Guaranteed | | | | 26,355,327 | |
| | | | Utilities – 15.9% (10.8% of Total Investments) | | | | | |
| | 2,560 | | Brazos River Authority, Texas, Pollution Control Revenue Refunding Bonds, TXU Electric Company, Series 1999C, 7.700%, 3/01/32 (Alternative Minimum Tax) | 4/13 at 101.00 | Ca | | 355,610 | |
| | 5,000 | | Brownsville, Texas, Utility System Priority Revenue Bonds, Series 2005A, 5.000%, 9/01/27 – AMBAC Insured | 9/15 at 100.00 | A+ | | 5,284,099 | |
| | 2,000 | | Bryan, Brazos County, Texas, Electric System Revenue Bonds, Series 2009, 5.000%, 7/01/34 | 7/17 at 100.00 | A+ | | 2,161,340 | |
| | 3,000 | | Lower Colorado River Authority, Texas, Refunding Revenue Bonds, Series 2010A, 5.000%, 5/15/40 | 5/20 at 100.00 | A1 | | 3,323,910 | |
| | 1,960 | | Lower Colorado River Authority, Texas, Revenue Bonds, Series 2008, 5.750%, 5/15/37 | 5/15 at 100.00 | A1 | | 2,150,120 | |
| | 1,500 | | Matagorda County Navigation District Number One, Texas, Pollution Control Revenue Refunding Bonds, Central Power and Light Company Project, Series 2009A, 6.300%, 11/01/29 | 7/19 at 102.00 | BBB | | 1,743,960 | |
| | 1,000 | | Sam Rayburn Municipal Power Agency, Texas, Power Supply System Revenue Refunding Bonds, Series 2012, 5.000%, 10/01/20 (WI/DD, Settling 9/19/12) | No Opt. Call | BBB+ | | 1,186,510 | |
| | | | Texas Municipal Gas Acquisition and Supply Corporation I, Gas Supply Revenue Bonds, Senior Lien Series 2008D: | | | | | |
| | 1,340 | | 5.625%, 12/15/17 | No Opt. Call | A– | | 1,498,710 | |
| | 3,000 | | 6.250%, 12/15/26 | No Opt. Call | A– | | 3,570,870 | |
| | 1,000 | | Texas Municipal Gas Acquisition and Supply Corporation I, Gas Supply Revenue Bonds, Series 2006A, 5.250%, 12/15/20 | No Opt. Call | A– | | 1,085,010 | |
| | | | Texas Municipal Power Agency, Revenue Bonds, Transmission Refunding Series 2010: | | | | | |
| | 640 | | 5.000%, 9/01/34 | 9/20 at 100.00 | A+ | | 720,026 | |
| | 1,000 | | 5.000%, 9/01/40 | 9/20 at 100.00 | A+ | | 1,115,330 | |
| | 24,000 | | Total Utilities | | | | 24,195,495 | |
| | | | Water and Sewer – 14.2% (9.6% of Total Investments) | | | | | |
| | 2,500 | | Bexar Metropolitan Water District, Texas, Waterworks System Revenue Bonds, Refunding Series 2010, 5.875%, 5/01/40 | 5/20 at 100.00 | A1 | | 2,873,425 | |
| | 2,500 | | Canadian River Municipal Water Authority, Texas, Contract Revenue Bonds, Conjunctive Use Groundwater Supply Project, Subordinate Lien Series 2011, 5.000%, 2/15/31 | 2/21 at 100.00 | AA | | 2,875,975 | |
| | | | Coastal Water Authority, Texas, Contract Revenue Bonds, Houston Water Projects, Series 2004: | | | | | |
| | 1,005 | | 5.000%, 12/15/20 – FGIC Insured | 12/14 at 100.00 | AA | | 1,061,692 | |
| | 1,030 | | 5.000%, 12/15/21 – FGIC Insured | 12/14 at 100.00 | AA | | 1,084,096 | |
| | 1,000 | | El Paso, Texas, Water and Sewer Revenue Bonds, Refunding Series 2008C, 5.375%, 3/01/29 | 3/18 at 100.00 | AA+ | | 1,199,450 | |
| | 3,000 | | Houston, Texas, First Lien Combined Utility System Revenue Bonds, Series 2004A, 5.250%, 5/15/23 – FGIC Insured | 5/14 at 100.00 | AA | | 3,228,630 | |
| | Principal | | | Optional Call | | | | |
| | Amount (000) | | Description (1) | Provisions (2) | Ratings (3) | | Value | |
| | | | Water and Sewer (continued) | | | | | |
| | | | Irving, Texas, Subordinate Lien Waterworks and Sewerage Revenue Bonds, Series 2004: | | | | | |
| $ | 1,680 | | 5.000%, 8/15/22 – AMBAC Insured | 8/14 at 100.00 | Aa1 | $ | 1,824,010 | |
| | 1,760 | | 5.000%, 8/15/23 – AMBAC Insured | 8/14 at 100.00 | Aa1 | | 1,910,867 | |
| | 4,000 | | Laredo, Webb County, Texas, Waterworks and Sewer System Revenue Bonds, Series 2010, 5.250%, 3/01/40 | 3/20 at 100.00 | AA– | | 4,666,759 | |
| | 710 | | North Fort Bend Water Authority, Texas, Water System Revenue Bonds, Series 2011, 5.000%, 12/15/36 – AGM Insured | 12/21 at 100.00 | AA– | | 787,553 | |
| | 19,185 | | Total Water and Sewer | | | | 21,512,457 | |
| $ | 243,440 | | Total Investments (cost $205,814,680) – 147.3% | | | | 223,619,909 | |
| | | | Floating Rate Obligations – (2.6)% | | | | (3,960,000 | ) |
| | | | MuniFund Term Preferred Shares, at Liquidation Value – (46.7)% (5) | | | | (70,920,000 | ) |
| | | | Other Assets Less Liabilities – 2.0% | | | | 3,120,805 | |
| | | | Net Assets Applicable to Common Shares – 100% | | | $ | 151,860,714 | |
| (1) | | All percentages shown in the Portfolio of Investments are based on net assets applicable to Common shares unless otherwise noted. |
| (2) | | Optional Call Provisions: Dates (month and year) and prices of the earliest optional call or redemption. There may be other call provisions at varying prices at later dates. Certain mortgage-backed securities may be subject to periodic principal paydowns. |
| (3) | | Ratings: Using the highest of Standard & Poor’s Group (“Standard & Poor’s”), Moody’s Investors Service, Inc. (“Moody’s”) or Fitch, Inc. (“Fitch”) rating. Ratings below BBB by Standard & Poor’s, Baa by Moody’s or BBB by Fitch are considered to be below investment grade. Holdings designated N/R are not rated by any of these national rating agencies. |
| (4) | | Backed by an escrow or trust containing sufficient U.S. Government or U.S. Government agency securities, which ensure the timely payment of principal and interest. Certain bonds backed by U.S. Government or agency securities are regarded as having an implied rating equal to the rating of such securities. |
| (5) | | MuniFund Term Preferred Shares, at Liquidation Value as a percentage of Total Investments is 31.7%. |
| WI/DD | | Investment, or portion of investment, purchased on a when-issued or delayed delivery basis. |
| (ETM) | | Escrowed to maturity. |
| (UB) | | Underlying bond of an inverse floating rate trust reflected as a financing transaction. See Notes to Financial Statements, Footnote 1 – General Information and Significant Accounting Policies, Inverse Floating Rate Securities for more information. |
See accompanying notes to financial statements.
| | | Statement of |
| | | Assets & Liabilities |
| | | August 31, 2012 (Unaudited) |
| | | | Arizona Premium Income (NAZ | ) | | Arizona Dividend Advantage (NFZ | ) | | Arizona Dividend Advantage 2 (NKR | ) | | Arizona Dividend Advantage 3 (NXE | ) | | Texas Quality Income (NTX | ) |
| Assets | | | | | | | | | | | | | | | | |
| Investments, at value (cost $85,508,780, $31,816,208, $50,800,963, $61,795,261 and $205,814,680, respectively) | | $ | 94,954,342 | | $ | 34,584,006 | | $ | 54,864,025 | | $ | 66,379,517 | | $ | 223,619,909 | |
| Cash | | | — | | | 1,095,297 | | | 695,191 | | | 762,634 | | | 1,913,746 | |
| Receivables: | | | | | | | | | | | | | | | | |
| Interest | | | 920,579 | | | 346,244 | | | 542,444 | | | 657,971 | | | 2,587,915 | |
| Investments sold | | | 3,447,718 | | | — | | | 3,533,911 | | | — | | | 780,000 | |
| Deferred assets: | | | | | | | | | | | | | | | | |
| Offering costs | | | 124,631 | | | 308,890 | | | 383,912 | | | 470,037 | | | 949,889 | |
| Shelf offering costs | | | — | | | — | | | — | | | — | | | 125,000 | |
| Other assets | | | 6,053 | | | 1,890 | | | 7,422 | | | 7,696 | | | 14,164 | |
| Total assets | | | 99,453,323 | | | 36,336,327 | | | 60,026,905 | | | 68,277,855 | | | 229,990,623 | |
| Liabilities | | | | | | | | | | | | | | | | |
| Cash overdraft | | | 8,863 | | | — | | | — | | | — | | | — | |
| Floating rate obligations | | | — | | | — | | | — | | | — | | | 3,960,000 | |
| Payables: | | | | | | | | | | | | | | | | |
| Common share dividends | | | 271,311 | | | 92,135 | | | 159,435 | | | 182,316 | | | 554,791 | |
| Interest | | | 28,168 | | | 18,963 | | | 31,989 | | | 50,377 | | | 135,928 | |
| Investments purchased | | | 2,953,781 | | | 829,675 | | | 2,483,099 | | | — | | | 2,279,520 | |
| Offering costs | | | — | | | 128,412 | | | 103,038 | | | 127,933 | | | — | |
| MuniFund Term Preferred (MTP) Shares, at liquidation value | | | — | | | 11,100,000 | | | 18,725,000 | | | 20,846,000 | | | 70,920,000 | |
| Variable Rate MuniFund Term Preferred (VMTP) Shares, at liquidation value | | | 28,000,000 | | | — | | | — | | | — | | | — | |
| Accrued expenses: | | | | | | | | | | | | | | | | |
| Management fees | | | 51,594 | | | 18,508 | | | 30,778 | | | 36,906 | | | 118,117 | |
| Directors’/Trustees’ fees | | | 411 | | | 151 | | | 245 | | | 291 | | | 955 | |
| Shelf offering costs | | | — | | | — | | | — | | | — | | | 80,864 | |
| Other | | | 122,858 | | | 201,068 | | | 133,898 | | | 315,558 | | | 79,734 | |
| Total liabilities | | | 31,436,986 | | | 12,388,912 | | | 21,667,482 | | | 21,559,381 | | | 78,129,909 | |
| Net assets applicable to Common shares | | $ | 68,016,337 | | $ | 23,947,415 | | $ | 38,359,423 | | $ | 46,718,474 | | $ | 151,860,714 | |
| Common shares outstanding | | | 4,472,678 | | | 1,548,312 | | | 2,439,730 | | | 3,066,030 | | | 9,602,535 | |
| Net asset value per Common share outstanding (net assets applicable to Common shares, divided by Common shares outstanding) | | $ | 15.21 | | $ | 15.47 | | $ | 15.72 | | $ | 15.24 | | $ | 15.81 | |
| Net assets applicable to Common shares consist of: | | | | | | | | | | | | | | | | |
| Common shares, $.01 par value per share | | $ | 44,727 | | $ | 15,483 | | $ | 24,397 | | $ | 30,660 | | $ | 96,025 | |
| Paid-in surplus | | | 60,454,674 | | | 21,781,665 | | | 34,415,536 | | | 43,099,258 | | | 135,888,200 | |
| Undistributed (Over-distribution of) net investment income | | | 1,200,748 | | | (55,852 | ) | | 111,872 | | | (76,156 | ) | | 618,510 | |
| Accumulated net realized gain (loss) | | | (3,129,374 | ) | | (561,679 | ) | | (255,444 | ) | | (919,544 | ) | | (2,547,250 | ) |
| Net unrealized appreciation (depreciation) | | | 9,445,562 | | | 2,767,798 | | | 4,063,062 | | | 4,584,256 | | | 17,805,229 | |
| Net assets applicable to Common shares | | $ | 68,016,337 | | $ | 23,947,415 | | $ | 38,359,423 | | $ | 46,718,474 | | $ | 151,860,714 | |
| Authorized shares: | | | | | | | | | | | | | | | | |
| Common | | | 200,000,000 | | | Unlimited | | | Unlimited | | | Unlimited | | | Unlimited | |
| Preferred | | | 1,000,000 | | | Unlimited | | | Unlimited | | | Unlimited | | | Unlimited | |
| | | See accompanying notes to financial statements. |
| | | |
| 42 | | Nuveen Investments |
| | | Statement of |
| | | Operations |
| | | | Six Months ended August 31, 2012 |
| | | | (Unaudited) |
| | | | Arizona Premium Income (NAZ | ) | | Arizona Dividend Advantage (NFZ | ) | | Arizona Dividend Advantage 2 (NKR | ) | | Arizona Dividend Advantage 3 (NXE | ) | | Texas Quality Income (NTX | ) |
| Investment Income | | $ | 2,294,120 | | $ | 835,151 | | $ | 1,376,742 | | $ | 1,637,036 | | $ | 5,109,820 | |
| Expenses | | | | | | | | | | | | | | | | |
| Management fees | | | 304,127 | | | 108,930 | | | 181,304 | | | 217,553 | | | 696,696 | |
| Shareholders’ servicing agent fees and expenses | | | 9,939 | | | 2,094 | | | 8,766 | | | 8,717 | | | 12,651 | |
| Interest expense and amortization of offering costs | | | 189,812 | | | 162,264 | | | 251,912 | | | 368,269 | | | 961,531 | |
| Custodian’s fees and expenses | | | 10,085 | | | 6,418 | | | 8,285 | | | 9,245 | | | 22,075 | |
| Directors’/Trustees’ fees and expenses | | | 1,319 | | | 483 | | | 785 | | | 932 | | | 3,063 | |
| Professional fees | | | 15,955 | | | 14,517 | | | 15,039 | | | 16,444 | | | 19,013 | |
| Shareholders’ reports – printing and mailing expenses | | | 21,937 | | | 18,828 | | | 24,910 | | | 27,396 | | | 49,464 | |
| Stock exchange listing fees | | | 4,172 | | | 196 | | | 7,698 | | | 8,307 | | | 11,783 | |
| Investor relations expense | | | 4,432 | | | 1,855 | | | 2,958 | | | 3,359 | | | 11,225 | |
| Reorganization expense | | | 80,000 | | | 170,000 | | | 95,000 | | | 275,000 | | | — | |
| Other expenses | | | 9,778 | | | 11,715 | | | 12,442 | | | 12,404 | | | 16,290 | |
Total expenses before custodian fee credit and expense reimbursement | | | 651,556 | | | 497,300 | | | 609,099 | | | 947,626 | | | 1,803,791 | |
| Custodian fee credit | | | (174 | ) | | (168 | ) | | (125 | ) | | (339 | ) | | (1,816 | ) |
| Expense reimbursement | | | — | | | — | | | (2,431 | ) | | — | | | — | |
| Net expenses | | | 651,382 | | | 497,132 | | | 606,543 | | | 947,287 | | | 1,801,975 | |
| Net investment income (loss) | | | 1,642,738 | | | 338,019 | | | 770,199 | | | 689,749 | | | 3,307,845 | |
| Realized and Unrealized Gain (Loss) | | | | | | | | | | | | | | | | |
| Net realized gain (loss) from investments | | | 76,507 | | | 89,149 | | | 37,026 | | | 20,602 | | | 142,840 | |
| Change in net unrealized appreciation (depreciation) of investments | | | 1,716,447 | | | 754,153 | | | 983,594 | | | 1,235,462 | | | 3,764,046 | |
| Net realized and unrealized gain (loss) | | | 1,792,954 | | | 843,302 | | | 1,020,620 | | | 1,256,064 | | | 3,906,886 | |
| Net increase (decrease) in net assets applicable to Common shares from operations | | $ | 3,435,692 | | $ | 1,181,321 | | $ | 1,790,819 | | $ | 1,945,813 | | $ | 7,214,731 | |
See accompanying notes to financial statements. |
| Nuveen Investments | | 43 |
| | | Statement of |
| | | Changes in Net Assets (Unaudited) |
| | | Arizona Premium Income (NAZ) | | Arizona Dividend Advantage (NFZ) | | Arizona Dividend Advantage 2 (NKR) | |
| | | | Six Months Ended 8/31/12 | | | Year Ended 2/29/12 | | | Six Months Ended 8/31/12 | | | Year Ended 2/29/12 | | | Six Months Ended 8/31/12 | | | Year Ended 2/29/12 | |
| Operations | | | | | | | | | | | | | | | | | | | |
| Net investment income (loss) | | $ | 1,642,738 | | $ | 3,565,697 | | $ | 338,019 | | $ | 1,008,402 | | $ | 770,199 | | $ | 1,769,263 | |
| Net realized gain (loss) from investments | | | 76,507 | | | 109,602 | | | 89,149 | | | 53,319 | | | 37,026 | | | 307,097 | |
| Change in net unrealized appreciation (depreciation) of investments | | | 1,716,447 | | | 6,768,696 | | | 754,153 | | | 2,855,887 | | | 983,594 | | | 3,579,761 | |
Distributions to Auction Rate Preferred Shareholders from net investment income | | | — | | | (38,807 | ) | | — | | | — | | | — | | | — | |
| Net increase (decrease) in net assets applicable to Common shares from operations | | | 3,435,692 | | | 10,405,188 | | | 1,181,321 | | | 3,917,608 | | | 1,790,819 | | | 5,656,121 | |
| Distributions to Common Shareholders | | | | | | | | | | | | | | | | | | | |
| From net investment income | | | (1,717,089 | ) | | (3,393,258 | ) | | (582,939 | ) | | (1,198,393 | ) | | (980,711 | ) | | (1,961,397 | ) |
| From accumulated net realized gains | | | — | | | — | | | — | | | — | | | — | | | — | |
Decrease in net assets applicable to Common shares from distributions to Common shareholders | | | (1,717,089 | ) | | (3,393,258 | ) | | (582,939 | ) | | (1,198,393 | ) | | (980,711 | ) | | (1,961,397 | ) |
| Capital Share Transactions | | | | | | | | | | | | | | | | | | | |
| Net proceeds from Common shares issued to shareholders due to reinvestment of distributions | | | 29,710 | | | — | | | — | | | — | | | 2,836 | | | — | |
| Net increase (decrease) in net assets applicable to Common shares from capital share transactions | | | 29,710 | | | — | | | — | | | — | | | 2,836 | | | — | |
| Net increase (decrease) in net assets applicable to Common shares | | | 1,748,313 | | | 7,011,930 | | | 598,382 | | | 2,719,215 | | | 812,944 | | | 3,694,724 | |
| Net assets applicable to Common shares at the beginning of period | | | 66,268,024 | | | 59,256,094 | | | 23,349,033 | | | 20,629,818 | | | 37,546,479 | | | 33,851,755 | |
| Net assets applicable to Common shares at the end of period | | $ | 68,016,337 | | $ | 66,268,024 | | $ | 23,947,415 | | $ | 23,349,033 | | $ | 38,359,423 | | $ | 37,546,479 | |
| Undistributed (Over-distribution of) net investment income at the end of period | | $ | 1,200,748 | | $ | 1,275,099 | | $ | (55,852 | ) | $ | 189,068 | | $ | 111,872 | | $ | 322,384 | |
| | | See accompanying notes to financial statements. |
| | | |
| 44 | | Nuveen Investments |
| | | Arizona Dividend Advantage 3 (NXE) | | Texas Quality Income (NTX) | |
| | | | Six Months Ended 8/31/12 | | | Year Ended 2/29/12 | | | Six Months Ended 8/31/12 | | | Year Ended 2/29/12 | |
| Operations | | | | | | | | | | | | | |
| Net investment income (loss) | | $ | 689,749 | | $ | 2,012,239 | | $ | 3,307,845 | | $ | 7,182,013 | |
| Net realized gain (loss) from investments | | | 20,602 | | | 136,252 | | | 142,840 | | | (1,681,044 | ) |
| Change in net unrealized appreciation (depreciation) of investments | | | 1,235,462 | | | 4,821,432 | | | 3,764,046 | | | 15,782,348 | |
Distributions to Auction Rate Preferred Shareholders from net investment income | | | — | | | (4,515 | ) | | — | | | — | |
| Net increase (decrease) in net assets applicable to Common shares from operations | | | 1,945,813 | | | 6,965,408 | | | 7,214,731 | | | 21,283,317 | |
| Distributions to Common Shareholders | | | | | | | | | | | | | |
| From net investment income | | | (1,131,365 | ) | | (2,317,919 | ) | | (3,814,560 | ) | | (8,211,637 | ) |
| From accumulated net realized gains | | | — | | | — | | | — | | | (248,069 | ) |
Decrease in net assets applicable to Common shares from distributions to Common shareholders | | | (1,131,365 | ) | | (2,317,919 | ) | | (3,814,560 | ) | | (8,459,706 | ) |
| Capital Share Transactions | | | | | | | | | | | | | |
| Net proceeds from Common shares issued to shareholders due to reinvestment of distributions | | | — | | | — | | | 238,106 | | | 548,918 | |
| Net increase (decrease) in net assets applicable to Common shares from capital share transactions | | | — | | | — | | | 238,106 | | | 548,918 | |
| Net increase (decrease) in net assets applicable to Common shares | | | 814,448 | | | 4,647,489 | | | 3,638,277 | | | 13,372,529 | |
| Net assets applicable to Common shares at the beginning of period | | | 45,904,026 | | | 41,256,537 | | | 148,222,437 | | | 134,849,908 | |
| Net assets applicable to Common shares at the end of period | | $ | 46,718,474 | | $ | 45,904,026 | | $ | 151,860,714 | | $ | 148,222,437 | |
| Undistributed (Over-distribution of) net investment income at the end of period | | $ | (76,156 | ) | $ | 365,460 | | $ | 618,510 | | $ | 1,125,225 | |
| See accompanying notes to financial statements. |
| | | |
| Nuveen Investments | | 45 |
| | | Statement of |
| | | Cash Flows |
| | | Six Months ended August 31, 2012 (Unaudited) |
| | | | Arizona Premium Income (NAZ | ) | | Arizona Dividend Advantage (NFZ | ) | | Arizona Dividend Advantage 2 (NKR | ) |
| Cash Flows from Operating Activities: | | | | | | | | | | |
| Net Increase (Decrease) In Net Assets Applicable to Common Shares from Operations | | $ | 3,435,692 | | $ | 1,181,321 | | $ | 1,790,819 | |
| Adjustments to reconcile the net increase (decrease) in net assets applicable to Common shares from operations to net cash provided by (used in) operating activities: | | | | | | | | | | |
| Purchases of investments | | | (7,185,227 | ) | | (3,636,399 | ) | | (4,399,126 | ) |
| Proceeds from sales and maturities of investments | | | 7,347,973 | | | 3,753,677 | | | 6,019,950 | |
| Amortization (Accretion) of premiums and discounts, net | | | 9,348 | | | 24,691 | | | (7,238 | ) |
| (Increase) Decrease in: | | | | | | | | | | |
| Receivable for interest | | | 21,977 | | | 2,578 | | | 35,476 | |
| Receivable for investments sold | | | (3,068,826 | ) | | — | | | (3,298,384 | ) |
| Other assets | | | (3,555 | ) | | (500 | ) | | (5,797 | ) |
| Increase (Decrease) in: | | | | | | | | | | |
| Payable for interest | | | 1,813 | | | (633 | ) | | (1,069 | ) |
| Payable for investments purchased | | | 2,953,781 | | | 829,675 | | | 2,483,099 | |
| Accrued management fees | | | 4,033 | | | 1,498 | | | 4,618 | |
| Accrued Directors’/Trustees’ fees | | | (581 | ) | | (212 | ) | | (348 | ) |
| Accrued other expenses | | | 81,158 | | | 167,846 | | | 96,678 | |
| Net realized (gain) loss from investments | | | (76,507 | ) | | (89,149 | ) | | (37,026 | ) |
| Change in net unrealized (appreciation) depreciation of investments | | | (1,716,447 | ) | | (754,153 | ) | | (983,594 | ) |
| Taxes paid on undistributed capital gains | | | — | | | (103 | ) | | — | |
| Net cash provided by (used in) operating activities | | | 1,804,632 | | | 1,480,137 | | | 1,698,058 | |
| Cash Flows from Financing Activities: | | | | | | | | | | |
| (Increase) Decrease in: | | | | | | | | | | |
| Deferred offering costs | | | (44,341 | ) | | 49,124 | | | 61,054 | |
| Deferred shelf offering costs | | | — | | | — | | | — | |
| Increase (Decrease) in: | | | | | | | | | | |
| Cash overdraft balance | | | (73,011 | ) | | — | | | (85,698 | ) |
| Payable for offering costs | | | — | | | 24,005 | | | (444 | ) |
| Accrued shelf offering costs | | | — | | | — | | | — | |
| Cash distributions paid to Common shareholders | | | (1,687,280 | ) | | (587,903 | ) | | (977,779 | ) |
| Net cash provided by (used in) financing activities | | | (1,804,632 | ) | | (514,774 | ) | | (1,002,867 | ) |
| Net Increase (Decrease) in Cash | | | — | | | 965,363 | | | 695,191 | |
| Cash at the beginning of period | | | — | | | 129,934 | | | — | |
| Cash at the End of Period | | $ | — | | $ | 1,095,297 | | $ | 695,191 | |
| Supplemental Disclosure of Cash Flow Information | | | | | | | | | | |
| Non-cash financing activities not included herein consist of reinvestments of Common share distributions as follows: |
| | | | | | | | | | | |
| | | | Arizona | | | Arizona | | | Arizona | |
| | | | Premium | | | Dividend | | | Dividend | |
| | | | Income | | | Advantage | | | Advantage 2 | |
| | | | (NAZ | ) | | (NFZ | ) | | (NKR | ) |
| | | $ | 29,710 | | $ | — | | $ | 2,836 | |
| Cash paid for interest (excluding amortization of offering costs) was as follows: |
| | | | Arizona | | | Arizona | | | Arizona | |
| | | | Premium | | | Dividend | | | Dividend | |
| | | | Income | | | Advantage | | | Advantage 2 | |
| | | | (NAZ | ) | | (NFZ | ) | | (NKR | ) |
| | | $ | 170,938 | | $ | 113,772 | | $ | 191,928 | |
| See accompanying notes to financial statements. |
| | | | Arizona Dividend Advantage 3 (NXE | ) | | Texas Quality Income (NTX | ) |
| Cash Flows from Operating Activities: | | | | | | | |
| Net Increase (Decrease) In Net Assets Applicable to Common Shares from Operations | | $ | 1,945,813 | | $ | 7,214,731 | |
| Adjustments to reconcile the net increase (decrease) in net assets applicable to Common shares from operations to net cash provided by (used in) operating activities: | | | | | | | |
| Purchases of investments | | | (3,992,272 | ) | | (16,366,610 | ) |
| Proceeds from sales and maturities of investments | | | 4,593,776 | | | 15,032,759 | |
| Amortization (Accretion) of premiums and discounts, net | | | 22,589 | | | 32,820 | |
| (Increase) Decrease in: | | | | | | | |
| Receivable for interest | | | (4,191 | ) | | 115,790 | |
| Receivable for investments sold | | | 614,402 | | | 1,223,681 | |
| Other assets | | | (5,821 | ) | | (8,738 | ) |
| Increase (Decrease) in: | | | | | | | |
| Payable for interest | | | (1,676 | ) | | (4,519 | ) |
| Payable for investments purchased | | | — | | | (1,534,635 | ) |
| Accrued management fees | | | 2,815 | | | 9,016 | |
| Accrued Directors’/Trustees’ fees | | | (414 | ) | | (1,362 | ) |
| Accrued other expenses | | | 278,453 | | | (1,610 | ) |
| Net realized (gain) loss from investments | | | (20,602 | ) | | (142,840 | ) |
| Change in net unrealized (appreciation) depreciation of investments | | | (1,235,462 | ) | | (3,764,046 | ) |
| Taxes paid on undistributed capital gains | | | — | | | (3,626 | ) |
| Net cash provided by (used in) operating activities | | | 2,197,410 | | | 1,800,811 | |
| Cash Flows from Financing Activities: | | | | | | | |
| (Increase) Decrease in: | | | | | | | |
| Deferred offering costs | | | 67,674 | | | 109,239 | |
| Deferred shelf offering costs | | | — | | | (125,000 | ) |
| Increase (Decrease) in: | | | | | | | |
| Cash overdraft balance | | | (364,407 | ) | | — | |
| Payable for offering costs | | | 3,883 | | | (39,399 | ) |
| Accrued shelf offering costs | | | — | | | 80,864 | |
| Cash distributions paid to Common shareholders | | | (1,141,926 | ) | | (3,637,642 | ) |
| Net cash provided by (used in) financing activities | | | (1,434,776 | ) | | (3,611,938 | ) |
| Net Increase (Decrease) in Cash | | | 762,634 | | | (1,811,127 | ) |
| Cash at the beginning of period | | | — | | | 3,724,873 | |
| Cash at the End of Period | | $ | 762,634 | | $ | 1,913,746 | |
| Supplemental Disclosure of Cash Flow Information | | | | | | | |
| Non-cash financing activities not included herein consist of reinvestments of Common share distributions as follows: |
| |
| | | | Arizona | | | Texas | |
| | | | Dividend | | | Quality | |
| | | | Advantage 3 | | | Income | |
| | | | (NXE | ) | | (NTX | ) |
| | | $ | — | | $ | 238,106 | |
| |
| Cash paid for interest (excluding amortization of offering costs) was as follows: |
| |
| | | | Arizona | | | Texas | |
| | | | Dividend | | | Quality | |
| | | | Advantage 3 | | | Income | |
| | | | (NXE | ) | | (NTX | ) |
| | | $ | 302,271 | | $ | 823,822 | |
| See accompanying notes to financial statements. |
| | | |
| Nuveen Investments | | 47 |
| | | Financial |
| | | Highlights (Unaudited) |
| | | |
| | Selected data for a Common share outstanding throughout each period: |
| | | | | | Investment Operations | | Less Distributions | | | | | | | |
| | | Beginning Common Share Net Asset Value | | Net Investment Income (Loss) | | Net Realized/ Unrealized Gain (Loss) | | Distributions from Net Investment Income to Auction Rate Preferred Shareholders | (a) | Distributions from Capital Gains to Auction Rate Preferred Shareholders | (a) | Total | | Net Investment Income to Common Shareholders | | Capital Gains to Common Shareholders | | Total | | Discount from Common Shares Repurchased and Retired | | Ending Common Share Net Asset Value | | Ending Market Value | |
| Arizona Premium Income (NAZ) | |
| Year Ended 2/28–2/29: | |
| 2013(g) | | $ | 14.82 | | $ | .37 | | $ | .40 | | $ | — | | $ | — | | $ | .77 | | $ | (.38 | ) | $ | — | | $ | (.38 | ) | $ | — | | $ | 15.21 | | $ | 15.84 | |
| 2012 | | | 13.25 | | | .80 | | | 1.54 | | | (.01 | ) | | — | | | 2.33 | | | (.76 | ) | | — | | | (.76 | ) | | — | | | 14.82 | | | 14.61 | |
| 2011(f) | | | 13.99 | | | .49 | | | (.77 | ) | | (.02 | ) | | — | | | (.30 | ) | | (.44 | ) | | — | | | (.44 | ) | | — | | | 13.25 | | | 12.32 | |
| Year Ended 7/31: | | | | | | | | | | | | | | | | | | | | | | | | | | | | | | | | | | | | | |
| 2010 | | | 12.92 | | | .84 | | | .96 | | | (.03 | ) | | — | | | 1.77 | | | (.70 | ) | | — | | | (.70 | ) | | — | | | 13.99 | | | 13.34 | |
| 2009 | | | 13.00 | | | .85 | | | (.16 | ) | | (.13 | ) | | — | | | .56 | | | (.64 | ) | | — | | | (.64 | ) | | — | | | 12.92 | | | 12.29 | |
| 2008 | | | 14.00 | | | .88 | | | (1.05 | ) | | (.22 | ) | | — | | | (.39 | ) | | (.61 | ) | | — | | | (.61 | ) | | — | | | 13.00 | | | 13.35 | |
| 2007 | | | 14.10 | | | .83 | | | (.10 | ) | | (.22 | ) | | — | | | .51 | | | (.61 | ) | | — | | | (.61 | ) | | — | | | 14.00 | | | 13.07 | |
| Arizona Dividend Advantage (NFZ) | |
| Year Ended 2/28–2/29: | |
| 2013(g) | | | 15.08 | | | .22 | | | .55 | | | — | | | — | | | .77 | | | (.38 | ) | | — | | | (.38 | ) | | — | | | 15.47 | | | 15.15 | |
| 2012 | | | 13.32 | | | .65 | | | 1.88 | | | — | | | — | | | 2.53 | | | (.77 | ) | | — | | | (.77 | ) | | — | | | 15.08 | | | 14.39 | |
| 2011(f) | | | 14.20 | | | .44 | | | (.86 | ) | | (.01 | ) | | — | | | (.43 | ) | | (.45 | ) | | — | | | (.45 | ) | | — | | | 13.32 | | | 12.14 | |
| Year Ended 7/31: | | | | | | | | | | | | | | | | | | | | | | | | | | | | | | | | | | | | | |
| 2010 | | | 12.66 | | | .85 | | | 1.41 | | | (.03 | ) | | — | | | 2.23 | | | (.69 | ) | | — | | | (.69 | ) | | — | | | 14.20 | | | 14.19 | |
| 2009 | | | 13.26 | | | .84 | | | (.67 | ) | | (.14 | ) | | — | | | .03 | | | (.63 | ) | | — | | | (.63 | ) | | — | * | | 12.66 | | | 12.14 | |
| 2008 | | | 14.48 | | | .91 | | | (1.23 | ) | | (.25 | ) | | — | * | | (.57 | ) | | (.64 | ) | | (.01 | ) | | (.65 | ) | | — | | | 13.26 | | | 13.70 | |
| 2007 | | | 14.77 | | | .91 | | | (.17 | ) | | (.24 | ) | | (.02 | ) | | .48 | | | (.71 | ) | | (.06 | ) | | (.77 | ) | | — | | | 14.48 | | | 13.35 | |
| (a) | The amounts shown are based on Common share equivalents. |
| (b) | Total Return Based on Market Value is the combination of changes in the market price per share and the effect of reinvested dividend income and reinvested capital gains distributions, if any, at the average price paid per share at the time of reinvestment. The last dividend declared in the period, which is typically paid on the first business day of the following month, is assumed to be reinvested at the ending market price. The actual reinvestment for the last dividend declared in the period may take place over several days, and in some instances may not be based on the market price, so the actual reinvestment price may be different from the price used in the calculation. Total returns are not annualized. |
| | Total Return Based on Common Share Net Asset Value is the combination of changes in Common share net asset value, reinvested dividend income at net asset value and reinvested capital gains distributions at net asset value, if any. The last dividend declared in the period, which is typically paid on the first business day of the following month, is assumed to be reinvested at the ending net asset value. The actual reinvest price for the last dividend declared in the period may often be based on the Fund’s market price (and not its net asset value), and therefore may be different from the price used in the calculation. Total returns are not annualized. |
| | | | | Ratios/Supplemental Data | |
| | | Total Returns | | | | | Ratios to Average Net Assets Applicable to Common Shares Before Reimbursement(c) | | Ratios to Average Net Assets Applicable to Common Shares After Reimbursement(c)(d) | | | | |
| | | | | | | | | | | | | | | | | | |
| | | Based on Market Value | (b) | Based on Common Share Net Asset Value | (b) | Ending Net Assets Applicable to Common Shares (000) | | Expenses | (e) | Net Investment Income (Loss) | | Expenses | (e) | Net Investment Income (Loss) | | Portfolio Turnover Rate | |
| | | | | | | | | | | | | | | | | | | | | | | | | | |
| | | | 11.22 | % | | 5.29 | % | $ | 68,016 | | | 1.82 | %** | | 4.99 | %** | | N/A | | | N/A | | | 8 | % |
| | | | 25.48 | | | 18.08 | | | 66,268 | | | 1.52 | | | 5.73 | | | N/A | | | N/A | | | 7 | |
| | | | (4.55 | ) | | (2.23 | ) | | 59,256 | | | 1.19 | ** | | 6.11 | ** | | N/A | | | N/A | | | 5 | |
| | | | | | | | | | | | | | | | | | | | | | | | | | |
| | | | 14.47 | | | 13.94 | | | 62,549 | | | 1.21 | | | 6.13 | | | N/A | | | N/A | | | 8 | |
| | | | (2.61 | ) | | 4.73 | | | 57,755 | | | 1.33 | | | 7.01 | | | N/A | | | N/A | | | 25 | |
| | | | 7.10 | | | (2.87 | ) | | 58,097 | | | 1.40 | | | 6.42 | | | N/A | | | N/A | | | 21 | |
| | | | (.22 | ) | | 3.62 | | | 62,534 | | | 1.32 | | | 5.81 | | | N/A | | | N/A | | | 13 | |
| | | | | | | | | | | | | | | | | | | | | | | | | | |
| | | | | | | | | | | | | | | | | | | | | | | | | | |
| | | | 8.00 | | | 5.14 | | | 23,947 | | | 3.47 | ** | | 3.54 | ** | | N/A | | | N/A | | | 11 | |
| | | | 25.66 | | | 19.56 | | | 23,349 | | | 2.95 | | | 4.62 | | | N/A | | | N/A | | | 8 | |
| | | | (11.47 | ) | | (3.10 | ) | | 20,630 | | | 2.29 | ** | | 5.37 | ** | | 2.23 | %** | | 5.43 | %** | | 5 | |
| | | | | | | | | | | | | | | | | | | | | | | | | | |
| | | | 23.34 | | | 17.93 | | | 21,984 | | | 1.35 | | | 6.12 | | | 1.23 | | | 6.23 | | | 3 | |
| | | | (6.12 | ) | | .58 | | | 19,605 | | | 1.51 | | | 6.70 | | | 1.30 | | | 6.91 | | | 6 | |
| | | | 7.72 | | | (4.09 | ) | | 20,552 | | | 1.58 | | | 6.14 | | | 1.31 | | | 6.42 | | | 10 | |
| | | | (11.63 | ) | | 3.24 | | | 22,439 | | | 1.48 | | | 5.74 | | | 1.14 | | | 6.08 | | | 19 | |
| (c) | Ratios do not reflect the effect of dividend payments to Auction Rate Preferred shareholders, where applicable; Net Investment Income (Loss) ratios reflect income earned and expenses incurred on assets attributable to Auction Rate Preferred Shares (ARPS), MTP Shares and/or VMTP Shares, where applicable. |
| (d) | Ratios do not reflect the effect of custodian fee credits earned on the Fund’s net cash on deposit with the custodian bank, where applicable. As of January 31, 2011, the Adviser is no longer reimbursing Arizona Dividend Advantage (NFZ) for any fees and expenses. |
| (e) | The expense ratios reflect, among other things, all interest expense and other costs related to MTP Shares, VMTP Shares and/or the interest expense deemed to have been paid by the Fund on the floating rate certificates issued by the special purpose trusts for the self-deposited inverse floaters held by the Fund, where applicable, each as described in Footnote 1 –General Information and Significant Accounting Policies, MuniFund Term Preferred Shares, Variable Rate MuniFund Term Preferred Shares and Inverse Floating Rate Securities, respectively, as follows: |
| Arizona Premium Income (NAZ) | | | | |
| Year Ended 2/28–2/29: | | | | |
| 2013(g) | | | .56 | %** |
| 2012 | | | .35 | |
| 2011(f) | | | — | |
| Year Ended 7/31: | | | | |
| 2010 | | | — | |
| 2009 | | | — | |
| 2008 | | | .14 | |
| 2007 | | | .08 | |
| | | | | |
| Arizona Dividend Advantage (NFZ) | | | | |
| Year Ended 2/28–2/29: | | | | |
| 2013(g) | | | 1.36 | %** |
| 2012 | | | 1.49 | |
| 2011(f) | | | .96 | ** |
| Year Ended 7/31: | | | | |
| 2010 | | | — | |
| 2009 | | | — | |
| 2008 | | | .14 | |
| 2007 | | | .10 | |
| (f) | For the seven months ended February 28, 2011. |
| (g) | For the six months ended August 31, 2012. |
| * | Rounds to less than $.01 per share. |
| ** | Annualized. |
| N/A | The Fund did not have, or no longer has, a contractual reimbursement agreement with the Adviser. |
| See accompanying notes to financial statements. |
| | | |
| Nuveen Investments | | 49 |
| | | Financial |
| | | Highlights (Unaudited) (continued) |
| | | |
| | Selected data for a Common share outstanding throughout each period: |
| | | | | | Investment Operations | | Less Distributions | | | | | | | |
| | | Beginning Common Share Net Asset Value | | Net Investment Income (Loss) | | Net Realized/ Unrealized Gain (Loss) | | Distributions from Net Investment Income to Auction Rate Preferred Shareholders | (a) | Distributions from Capital Gains to Auction Rate Preferred Shareholders | (a) | Total | | Net Investment Income to Common Shareholders | | Capital Gains to Common Shareholders | | Total | | Discount from Common Shares Repurchased and Retired | | Ending Common Share Net Asset Value | | Ending Market Value | |
| Arizona Dividend Advantage 2 (NKR) | |
| Year Ended 2/28–2/29: | |
| 2013(g) | | $ | 15.39 | | $ | .32 | | $ | .41 | | $ | — | | $ | — | | $ | .73 | | $ | (.40 | ) | $ | — | | $ | (.40 | ) | $ | — | | $ | 15.72 | | $ | 15.78 | |
| 2012 | | | 13.88 | | | .72 | | | 1.59 | | | — | | | — | | | 2.31 | | | (.80 | ) | | — | | | (.80 | ) | | — | | | 15.39 | | | 14.78 | |
| 2011(f) | | | 14.65 | | | .45 | | | (.74 | ) | | (.01 | ) | | — | | | (.30 | ) | | (.47 | ) | | — | | | (.47 | ) | | — | | | 13.88 | | | 12.66 | |
| Year Ended 7/31: | | | | | | | | | | | | | | | | | | | | | | | | | | | | | | | | | | | | | |
| 2010 | | | 13.46 | | | .90 | | | 1.08 | | | (.03 | ) | | — | | | 1.95 | | | (.76 | ) | | — | | | (.76 | ) | | — | | | 14.65 | | | 13.92 | |
| 2009 | | | 13.66 | | | .93 | | | (.29 | ) | | (.14 | ) | | — | | | .50 | | | (.70 | ) | | — | | | (.70 | ) | | — | * | | 13.46 | | | 12.52 | |
| 2008 | | | 14.76 | | | .96 | | | (1.03 | ) | | (.24 | ) | | (.02 | ) | | (.33 | ) | | (.71 | ) | | (.06 | ) | | (.77 | ) | | — | | | 13.66 | | | 14.00 | |
| 2007 | | | 15.00 | | | .97 | | | (.18 | ) | | (.24 | ) | | (.01 | ) | | .54 | | | (.74 | ) | | (.04 | ) | | (.78 | ) | | — | | | 14.76 | | | 15.27 | |
| Arizona Dividend Advantage 3 (NXE) | |
| Year Ended 2/28–2/29: | |
| 2013(g) | | | 14.97 | | | .22 | | | .42 | | | — | | | — | | | .64 | | | (.37 | ) | | — | | | (.37 | ) | | — | | | 15.24 | | | 14.91 | |
| 2012 | | | 13.46 | | | .66 | | | 1.61 | | | — | * | | — | | | 2.27 | | | (.76 | ) | | — | | | (.76 | ) | | — | | | 14.97 | | | 14.28 | |
| 2011(f) | | | 14.12 | | | .47 | | | (.68 | ) | | (.01 | ) | | — | | | (.22 | ) | | (.44 | ) | | — | | | (.44 | ) | | — | | | 13.46 | | | 12.24 | |
| Year Ended 7/31: | | | | | | | | | | | | | | | | | | | | | | | | | | | | | | | | | | | | | |
| 2010 | | | 12.76 | | | .86 | | | 1.26 | | | (.03 | ) | | — | | | 2.09 | | | (.73 | ) | | — | | | (.73 | ) | | — | | | 14.12 | | | 13.14 | |
| 2009 | | | 13.07 | | | .88 | | | (.41 | ) | | (.13 | ) | | — | | | .34 | | | (.65 | ) | | — | | | (.65 | ) | | — | * | | 12.76 | | | 11.73 | |
| 2008 | | | 14.20 | | | .91 | | | (1.15 | ) | | (.24 | ) | | — | | | (.48 | ) | | (.65 | ) | | — | | | (.65 | ) | | — | | | 13.07 | | | 13.30 | |
| 2007 | | | 14.32 | | | .90 | | | (.10 | ) | | (.25 | ) | | — | | | .55 | | | (.67 | ) | | — | | | (.67 | ) | | — | | | 14.20 | | | 13.44 | |
| (a) | The amounts shown are based on Common share equivalents. |
| (b) | Total Return Based on Market Value is the combination of changes in the market price per share and the effect of reinvested dividend income and reinvested capital gains distributions, if any, at the average price paid per share at the time of reinvestment. The last dividend declared in the period, which is typically paid on the first business day of the following month, is assumed to be reinvested at the ending market price. The actual reinvestment for the last dividend declared in the period may take place over several days, and in some instances may not be based on the market price, so the actual reinvestment price may be different from the price used in the calculation. |
| | Total returns are not annualized. |
| | Total Return Based on Common Share Net Asset Value is the combination of changes in Common share net asset value, reinvested dividend income at net asset value and reinvested capital gains distributions at net asset value, if any. The last dividend declared in the period, which is typically paid on the first business day of the following month, is assumed to be reinvested at the ending net asset value. The actual reinvest price for the last dividend declared in the period may often be based on the Fund’s market price (and not its net asset value), and therefore may be different from the price used in the calculation. Total returns are not annualized. |
| | | | Ratios/Supplemental Data | |
| | Total Returns | | | | | Ratios to Average Net Assets Applicable to Common Shares Before Reimbursement(c) | | Ratios to Average Net Assets Applicable to Common Shares After Reimbursement(c)(d) | | | | |
| | | | | | | | | | | | | | | | | | | | | | | | |
| | Based on Market Value | (b) | | Based on Common Share Net Asset Value | (b) | | Ending Net Assets Applicable to Common Shares (000) | | | Expenses | (e) | | Net Investment Income (Loss) | | | Expenses | (e) | | Net Investment Income (Loss) | | | Portfolio Turnover Rate | |
| | | | | | | | | | | | | | | | | | | | | | | | |
| | | | | | | | | | | | | | | | | | | | | | | | |
| | 9.61 | % | | 4.82 | % | $ | 38,359 | | | 2.95 | %** | | 4.28 | %** | | 2.94 | %** | | 4.30 | %** | | 8 | % |
| | 23.88 | | | 16.91 | | | 37,546 | | | 2.78 | | | 4.92 | | | 2.70 | | | 5.00 | | | 16 | |
| | (5.84 | ) | | (1.90 | ) | | 33,852 | | | 2.22 | ** | | 5.18 | ** | | 2.06 | ** | | 5.34 | ** | | 7 | |
| | | | | | | | | | | | | | | | | | | | | | | | |
| | 17.65 | | | 14.75 | | | 35,733 | | | 1.27 | | | 6.11 | | | 1.07 | | | 6.31 | | | 4 | |
| | (4.99 | ) | | 4.09 | | | 32,829 | | | 1.40 | | | 6.93 | | | 1.11 | | | 7.22 | | | 5 | |
| | (3.16 | ) | | (2.38 | ) | | 33,311 | | | 1.49 | | | 6.32 | | | 1.13 | | | 6.68 | | | 15 | |
| | 4.52 | | | 3.59 | | | 35,976 | | | 1.39 | | | 5.92 | | | .96 | | | 6.35 | | | 14 | |
| | | | | | | | | | | | | | | | | | | | | | | | |
| | | | | | | | | | | | | | | | | | | | | | | | |
| | 7.10 | | | 4.32 | | | 46,718 | | | 3.48 | ** | | 3.55 | ** | | N/A | | | N/A | | | 6 | |
| | 23.63 | | | 17.30 | | | 45,904 | | | 2.87 | | | 4.64 | | | N/A | | | N/A | | | 14 | |
| | (3.63 | ) | | (1.60 | ) | | 41,257 | | | 1.46 | ** | | 5.85 | ** | | 1.43 | ** | | 5.88 | ** | | 6 | |
| | | | | | | | | | | | | | | | | | | | | | | | |
| | 18.58 | | | 16.66 | | | 43,280 | | | 1.22 | | | 6.15 | | | 1.08 | | | 6.29 | | | 5 | |
| | (6.18 | ) | | 3.08 | | | 39,129 | | | 1.37 | | | 6.97 | | | 1.09 | | | 7.25 | | | 9 | |
| | 3.96 | | | (3.48 | ) | | 40,081 | | | 1.46 | | | 6.17 | | | 1.08 | | | 6.55 | | | 16 | |
| | 4.21 | | | 3.81 | | | 43,552 | | | 1.36 | | | 5.69 | | | .88 | | | 6.16 | | | 15 | |
| (c) | Ratios do not reflect the effect of dividend payments to Auction Rate Preferred shareholders, where applicable; Net Investment Income (Loss) ratios reflect income earned and expenses incurred on assets attributable to ARPS and/or MTP Shares, where applicable. |
| (d) | After expense reimbursement from the Adviser, where applicable. Ratios do not reflect the effect of custodian fee credits earned on the Fund’s net cash on deposit with the custodian bank, where applicable. As of March 31, 2012, the Adviser is no longer reimbursing Arizona Dividend Advantage 2 (NKR) for any fees and expenses. As of September 30, 2010, the Adviser is no longer reimbursing Arizona Dividend Advantage 3 (NXE) for any fees and expenses. |
| (e) | The expense ratios reflect, among other things, all interest expense and other costs related to MTP Shares and/or the interest expense deemed to have been paid by the Fund on the floating rate certificates issued by the special purpose trusts for the self-deposited inverse floaters held by the Fund, where applicable, both as described in Footnote 1 – General Information and Significant Accounting Policies, MuniFund Term Preferred Shares and Inverse Floating Rate Securities, respectively, as follows: |
| Arizona Dividend Advantage 2 (NKR) | | | | |
| Year Ended 2/28–2/29: | | | | |
| 2013(g) | | | 1.32 | %** |
| 2012 | | | 1.43 | |
| 2011(f) | | | .91 | ** |
| Year Ended 7/31: | | | | |
| 2010 | | | — | |
| 2009 | | | — | |
| 2008 | | | .15 | |
| 2007 | | | .10 | |
Arizona Dividend Advantage 3 (NXE) | | | | |
| Year Ended 2/28–2/29: | | | | |
| 2013(g) | | | 1.58 | %** |
| 2012 | | | 1.71 | |
| 2011(f) | | | .01 | ** |
| Year Ended 7/31: | | | | |
| 2010 | | | — | |
| 2009 | | | — | |
| 2008 | | | .16 | |
| 2007 | | | .10 | |
| (f) | For the seven months ended February 28, 2011. |
| (g) | For the six months ended August 31, 2012. |
| * | Rounds to less than $.01 per share. |
| ** | Annualized. |
| N/A | The Fund no longer has a contractual reimbursement agreement with the Adviser. |
| See accompanying notes to financial statements. |
| | | |
| Nuveen Investments | | 51 |
| | | Financial |
| | | Highlights (Unaudited) (continued) |
| | | |
| | Selected data for a Common share outstanding throughout each period: |
| | | | | | Investment Operations | | Less Distributions | | | | | | | |
| | | Beginning Common Share Net Asset Value | | Net Investment Income (Loss) | | Net Realized/ Unrealized Gain (Loss) | | Distributions from Net Investment Income to Auction Rate Preferred Shareholders | (a) | Distributions from Capital Gains to Auction Rate Preferred Shareholders | (a) | Total | | Net Investment Income to Common Shareholders | | Capital Gains to Common Shareholders | | Total | | Discount from Common Shares Repurchased and Retired | | Ending Common Share Net Asset Value | | Ending Market Value | |
| Texas Quality Income (NTX) | |
| Year Ended 2/28–2/29: | |
| 2013(g) | | $ | 15.46 | | $ | .34 | | $ | .41 | | $ | — | | $ | — | | $ | .75 | | $ | (.40 | ) | $ | — | | $ | (.40 | ) | $ | — | | $ | 15.81 | | $ | 17.07 | |
| 2012 | | | 14.12 | | | .75 | | | 1.48 | | | — | | | — | | | 2.23 | | | (.86 | ) | | (.03 | ) | | (.89 | ) | | — | | | 15.46 | | | 16.31 | |
| 2011(f) | | | 15.01 | | | .48 | | | (.85 | ) | | (.01 | ) | | — | | | (.38 | ) | | (.50 | ) | | (.01 | ) | | (.51 | ) | | — | | | 14.12 | | | 15.19 | |
| Year Ended 7/31: | |
| 2010 | | | 13.84 | | | .94 | | | 1.08 | | | (.03 | ) | | — | * | | 1.99 | | | (.81 | ) | | (.01 | ) | | (.82 | ) | | — | | | 15.01 | | | 16.92 | |
| 2009 | | | 13.98 | | | .94 | | | (.17 | ) | | (.13 | ) | | (.02 | ) | | .62 | | | (.71 | ) | | (.05 | ) | | (.76 | ) | | — | | | 13.84 | | | 14.78 | |
| 2008 | | | 14.87 | | | .94 | | | (.83 | ) | | (.23 | ) | | (.02 | ) | | (.14 | ) | | (.69 | ) | | (.06 | ) | | (.75 | ) | | — | | | 13.98 | | | 12.46 | |
| 2007 | | | 15.06 | | | .95 | | | (.11 | ) | | (.25 | ) | | (.01 | ) | | .58 | | | (.73 | ) | | (.04 | ) | | (.77 | ) | | — | | | 14.87 | | | 13.89 | |
| (a) | The amounts shown are based on Common share equivalents. |
| (b) | Total Return Based on Market Value is the combination of changes in the market price per share and the effect of reinvested dividend income and reinvested capital gains distributions, if any, at the average price paid per share at the time of reinvestment. The last dividend declared in the period, which is typically paid on the first business day of the following month, is assumed to be reinvested at the ending market price. The actual reinvestment for the last dividend declared in the period may take place over several days, and in some instances may not be based on the market price, so the actual reinvestment price may be different from the price used in the calculation. Total returns are not annualized. |
| | Total Return Based on Common Share Net Asset Value is the combination of changes in Common share net asset value, reinvested dividend income at net asset value and reinvested capital gains distributions at net asset value, if any. The last dividend declared in the period, which is typically paid on the first business day of the following month, is assumed to be reinvested at the ending net asset value. The actual reinvest price for the last dividend declared in the period may often be based on the Fund’s market price (and not its net asset value), and therefore may be different from the price used in the calculation. Total returns are not annualized. |
| | | | | Ratios/Supplemental Data | |
| | Total Returns | | | | | | Ratios to Average Net Assets Applicable to Common Shares(c)(d) | | | | |
| | | | | | | | | | | | | | | | | | |
| | Based on Market Value | (b) | | Based on Common Share Net Asset Value | (b) | | Ending Net Assets Applicable to Common Shares (000) | | | Expenses | (e) | | Net Investment Income (Loss) | | | Portfolio Turnover Rate | |
| | | | | | | | | | | | | | | | | | |
| | | | | | | | | | | | | | | | | | |
| | 7.28 | % | | 4.90 | % | $ | 151,861 | | | 2.40 | %** | | 4.39 | %** | | 7 | % |
| | 13.81 | | | 16.23 | | | 148,222 | | | 2.48 | | | 5.10 | | | 9 | |
| | (7.15 | ) | | (2.61 | ) | | 134,850 | | | 1.92 | ** | | 5.69 | ** | | 10 | |
| | | | | | | | | | | | | | | | | | |
| | 20.92 | | | 14.71 | | | 143,080 | | | 1.19 | | | 6.42 | | | 6 | |
| | 25.98 | | | 4.80 | | | 131,513 | | | 1.27 | | | 7.06 | | | 10 | |
| | (5.16 | ) | | (1.04 | ) | | 132,713 | | | 1.26 | | | 6.46 | | | 8 | |
| | (.52 | ) | | 3.82 | | | 141,238 | | | 1.24 | | | 6.24 | | | 9 | |
| (c) | Ratios do not reflect the effect of dividend payments to Auction Rate Preferred shareholders, where applicable; Net Investment Income (Loss) ratios reflect income earned and expenses incurred on assets attributable to ARPS and/or MTP Shares, where applicable. |
| (d) | Ratios do not reflect the effect of custodian fee credits earned on the Fund’s net cash on deposit with the custodian bank, where applicable. |
| (e) | The expense ratios reflect, among other things, all interest expense and other costs related to MTP Shares and/or the interest expense deemed to have been paid by the Fund on the floating rate certificates issued by the special purpose trusts for the self-deposited inverse floaters held by the Fund, where applicable, both as described in Footnote 1 – General Information and Significant Accounting Policies, MuniFund Term Preferred Shares and Inverse Floating Rate Securities, respectively, as follows: |
| Texas Quality Income (NTX) | |
| Year Ended 2/28–2/29: | | | | |
| 2013(g) | | | 1.28 | %** |
| 2012 | | | 1.37 | |
| 2011(f) | | | .80 | ** |
| Year Ended 7/31: | | | | |
| 2010 | | | .02 | |
| 2009 | | | .01 | |
| 2008 | | | .05 | |
| 2007 | | | .06 | |
| (f) | For the seven months ended February 28, 2011. |
| (g) | For the six months ended August 31, 2012. |
| * | Rounds to less than $.01 per share. |
| ** | Annualized. |
| See accompanying notes to financial statements. |
| | | |
| Nuveen Investments | | 53 |
| | | Financial |
| | | Highlights (Unaudited) (continued) |
| | | ARPS at the End of Period | | MTP Shares at the End of Period (h) | | VMTP Shares at the End of Period | |
| | | Aggregate Amount Outstanding (000) | | Liquidation Value Per Share | | Asset Coverage Per Share | | Aggregate Amount Outstanding (000) | | Liquidation Value Per Share | | Asset Coverage Per Share | | Aggregate Amount Outstanding (000) | | Liquidation Value Per Share | | Asset Coverage Per Share | |
| Arizona Premium Income (NAZ) | |
| Year Ended 2/28–2/29: | |
| 2013(g) | | $ | — | | $ | — | | $ | — | | $ | — | | $ | — | | $ | — | | $ | 28,000 | | $ | 100,000 | | $ | 342,915 | |
| 2012 | | | — | | | — | | | — | | | — | | | — | | | — | | | 28,000 | | | 100,000 | | | 336,672 | |
| 2011(f) | | | 27,875 | | | 25,000 | | | 78,144 | | | — | | | — | | | — | | | — | | | — | | | — | |
| Year Ended 7/31: | |
| 2010 | | | 27,875 | | | 25,000 | | | 81,097 | | | — | | | — | | | — | | | — | | | — | | | — | |
| 2009 | | | 27,875 | | | 25,000 | | | 76,798 | | | — | | | — | | | — | | | — | | | — | | | — | |
| 2008 | | | 30,000 | | | 25,000 | | | 73,414 | | | — | | | — | | | — | | | — | | | — | | | — | |
| 2007 | | | 30,000 | | | 25,000 | | | 77,111 | | | — | | | — | | | — | | | — | | | — | | | — | |
| | |
| Arizona Dividend Advantage (NFZ) | |
| Year Ended 2/28–2/29: | |
| 2013(g) | | | — | | | — | | | — | | | 11,100 | | | 10.00 | | | 31.57 | | | — | | | — | | | — | |
| 2012 | | | — | | | — | | | — | | | 11,100 | | | 10.00 | | | 31.04 | | | — | | | — | | | — | |
| 2011(f) | | | — | | | — | | | — | | | 11,100 | | | 10.00 | | | 28.59 | | | — | | | — | | | — | |
| Year Ended 7/31: | |
| 2010 | | | 10,600 | | | 25,000 | | | 76,850 | | | — | | | — | | | — | | | — | | | — | | | — | |
| 2009 | | | 10,600 | | | 25,000 | | | 71,238 | | | — | | | — | | | — | | | — | | | — | | | — | |
| 2008 | | | 12,000 | | | 25,000 | | | 67,817 | | | — | | | — | | | — | | | — | | | — | | | — | |
| 2007 | | | 12,000 | | | 25,000 | | | 71,748 | | | — | | | — | | | — | | | — | | | — | | | — | |
| (f) | For the seven months ended February 28, 2011. |
| (g) | For the six months ended August 31, 2012. |
| (h) | The Ending and Average Market Value Per Share for each Series of the Fund’s MTP Shares were as follows: |
| | | | | | | | | | | |
| | | | | | | Ending | | | Average | |
| | | | | | | Market Value | | | Market Value | |
| | | | Series | | | Per Share | | | Per Share | |
| Arizona Dividend Advantage (NFZ) | | | | | | | | | | |
| Year Ended 2/28–2/29: | | | | | | | | | | |
| 2013(g) | | | 2015 | | $ | 10.05 | | $ | 10.05 | |
| 2012 | | | 2015 | | | 10.08 | | | 9.93 | |
| 2011(f) | | | 2015 | | | 9.63 | | | 9.83 | ^ |
| Year Ended 7/31: | | | | | | | | | | |
| 2010 | | | — | | | — | | | — | |
| 2009 | | | — | | | — | | | — | |
| 2008 | | | — | | | — | | | — | |
| 2007 | | | — | | | — | | | — | |
| ^ | For the period October 18, 2010 (first issuance date of shares) through February 28, 2011. |
| | | ARPS at the End of Period | | MTP Shares at the End of Period (h) | | ARPS and MTP Shares at the End of Period | |
| | | | Aggregate Amount Outstanding (000) | | | Liquidation Value Per Share | | | Asset Coverage Per Share | | | Aggregate Amount Outstanding (000) | | | Liquidation Value Per Share | | | Asset Coverage Per Share | | | Asset Coverage Per $1 Liquidation Preference | |
| Arizona Dividend Advantage 2 (NKR) | |
| Year Ended 2/28–2/29: | |
| 2013(g) | | $ | — | | $ | — | | $ | — | | $ | 18,725 | | $ | 10.00 | | $ | 30.49 | | $ | — | |
| 2012 | | | — | | | — | | | — | | | 18,725 | | | 10.00 | | | 30.05 | | | — | |
| 2011(f) | | | — | | | — | | | — | | | 18,725 | | | 10.00 | | | 28.08 | | | — | |
| Year Ended 7/31: | | | | | | | | | | | | | | | | | | | | | | |
| 2010 | | | 16,625 | | | 25,000 | | | 78,734 | | | — | | | — | | | — | | | — | |
| 2009 | | | 16,625 | | | 25,000 | | | 74,367 | | | — | | | — | | | — | | | — | |
| 2008 | | | 18,500 | | | 25,000 | | | 70,015 | | | — | | | — | | | — | | | — | |
| 2007 | | | 18,500 | | | 25,000 | | | 73,616 | | | — | | | — | | | — | | | — | |
| | |
| Arizona Dividend Advantage 3 (NXE) | |
| Year Ended 2/28–2/29: | |
| 2013(g) | | | — | | | — | | | — | | | 20,846 | | | 10.00 | | | 32.41 | | | — | |
| 2012 | | | — | | | — | | | — | | | 20,846 | | | 10.00 | | | 32.02 | | | — | |
| 2011(f) | | | 18,400 | | | 25,000 | | | 52,544 | | | 19,046 | | | 10.00 | | | 21.02 | | | 2.10 | |
| Year Ended 7/31: | | | | | | | | | | | | | | | | | | | | | | |
| 2010 | | | 18,400 | | | 25,000 | | | 83,805 | | | — | | | — | | | — | | | — | |
| 2009 | | | 18,400 | | | 25,000 | | | 78,164 | | | — | | | — | | | — | | | — | |
| 2008 | | | 22,000 | | | 25,000 | | | 70,546 | | | — | | | — | | | — | | | — | |
| 2007 | | | 22,000 | | | 25,000 | | | 74,490 | | | — | | | — | | | — | | | — | |
| (f) | For the seven months ended February 28, 2011. |
| (g) | For the six months ended August 31, 2012. |
| (h) | The Ending and Average Market Value Per Share for each Series of the Fund’s MTP Shares were as follows: |
| | | | | | | Ending | | | Average | |
| | | | | | | Market Value | | | Market Value | |
| | | | Series | | | Per Share | | | Per Share | |
| Arizona Dividend Advantage 2 (NKR) | | | | | | | | | | |
| Year Ended 2/28–2/29: | | | | | | | | | | |
| 2013(g) | | | 2015 | | $ | 10.07 | | $ | 10.05 | |
| 2012 | | | 2015 | | | 10.05 | | | 9.89 | |
| 2011(f) | | | 2015 | | | 9.58 | | | 9.71 | ^ |
| Year Ended 7/31: | | | | | | | | | | |
| 2010 | | | — | | | — | | | — | |
| 2009 | | | — | | | — | | | — | |
| 2008 | | | — | | | — | | | — | |
| 2007 | | | — | | | — | | | — | |
| | | | | | | | | | | |
| Arizona Dividend Advantage 3 (NXE) | | | | | | | | | | |
| Year Ended 2/28–2/29: | | | | | | | | | | |
| 2013(g) | | | 2016 | | | 10.21 | | | 10.17 | |
| 2012 | | | 2016 | | | 10.17 | | | 10.11 | |
| 2011(f) | | | 2016 | | | 9.97 | | | 9.96 | ^^ |
| Year Ended 7/31: | | | | | | | | | | |
| 2010 | | | — | | | — | | | — | |
| 2009 | | | — | | | — | | | — | |
| 2008 | | | — | | | — | | | — | |
| 2007 | | | — | | | — | | | — | |
| ^ | For the period October 18, 2010 (first issuance date of shares) through February 28, 2011. |
| ^^ | As of February 28, 2011 (first issuance date of shares). |
| See accompanying notes to financial statements. |
| | | |
| Nuveen Investments | | 55 |
| | | Financial |
| | | Highlights (Unaudited) (continued) |
| | | ARPS at the End of Period | | MTP Shares at the End of Period (h) | |
| | | Aggregate Amount Outstanding (000) | | Liquidation Value Per Share | | Asset Coverage Per Share | | Aggregate Amount Outstanding (000) | | Liquidation Value Per Share | | Asset Coverage Per Share | |
| Texas Quality Income (NTX) | | | | | | | | | | | | | | | | | | | |
| Year Ended 2/28–2/29: | | | | | | | | | | | | | | | | | | | |
| 2013(g) | | $ | — | | $ | — | | $ | — | | $ | 70,920 | | $ | 10.00 | | $ | 31.41 | |
| 2012 | | | — | | | — | | | — | | | 70,920 | | | 10.00 | | | 30.90 | |
| 2011(f) | | | — | | | — | | | — | | | 70,920 | | | 10.00 | | | 29.01 | |
| Year Ended 7/31: | | | | | | | | | | | | | | | | | | | |
| 2010 | | | 65,050 | | | 25,000 | | | 79,988 | | | — | | | — | | | — | |
| 2009 | | | 65,050 | | | 25,000 | | | 75,543 | | | — | | | — | | | — | |
| 2008 | | | 69,000 | | | 25,000 | | | 73,084 | | | — | | | — | | | — | |
| 2007 | | | 69,000 | | | 25,000 | | | 76,173 | | | — | | | — | | | — | |
| (f) | For the seven months ended February 28, 2011. |
| (g) | For the six months ended August 31, 2012. |
| (h) | The Ending and Average Market Value Per Share for each Series of the Fund’s MTP Shares were as follows: |
| | | | | | | Ending | | | Average | |
| | | | | | | Market Value | | | Market Value | |
| | | | Series | | | Per Share | | | Per Share | |
| Texas Quality Income (NTX) | | | | | | | | | | |
| Year Ended 2/28–2/29: | | | | | | | | | | |
| 2013(g) | | | 2015 | | $ | 10.09 | | $ | 10.07 | |
| 2012 | | | 2015 | | | 10.05 | | | 9.97 | |
| 2011(f) | | | 2015 | | | 9.85 | | | 9.86 | ^ |
| Year Ended 7/31: | | | | | | | | | | |
| 2010 | | | — | | | — | | | — | |
| 2009 | | | — | | | — | | | — | |
| 2008 | | | — | | | — | | | — | |
| 2007 | | | — | | | — | | | — | |
| ^ | For the period November 2, 2010 (first issuance date of shares) through February 28, 2011. |
| | | See accompanying notes to financial statements. |
| | | |
| 56 | | Nuveen Investments |
| | | Notes to |
| | | Financial Statements (Unaudited) |
1. General Information and Significant Accounting Policies
General Information
The funds covered in this report and their corresponding Common share stock exchange symbols are Nuveen Arizona Premium Income Municipal Fund, Inc. (NAZ), Nuveen Arizona Dividend Advantage Municipal Fund (NFZ), Nuveen Arizona Dividend Advantage Municipal Fund 2 (NKR), Nuveen Arizona Dividend Advantage Municipal Fund 3 (NXE) and Nuveen Texas Quality Income Municipal Fund (NTX) (each a “Fund” and collectively, the “Funds”). Common shares of Arizona Premium Income (NAZ) and Texas Quality Income (NTX) are traded on the New York Stock Exchange (“NYSE”) while Common shares of Arizona Dividend Advantage (NFZ), Arizona Dividend Advantage 2 (NKR) and Arizona Dividend Advantage 3 (NXE) are traded on the NYSE MKT (formerly known as NYSE Amex). The Funds are registered under the Investment Company Act of 1940, as amended, as closed-end registered investment companies.
Each Fund seeks to provide current income exempt from both regular federal and designated state income taxes by investing primarily in a portfolio of municipal obligations issued by state and local government authorities within a single state or certain U.S. territories.
Approved Fund Reorganizations
On April 18, 2012, the Funds’ Board of Directors/Trustees approved a series of reorganizations for all the Arizona Funds included in this report. The reorganizations are intended to create a single larger state Fund, which would potentially offer shareholders the following benefits:
| | • | Lower Fund expense ratios (excluding the effects of leverage), as fixed costs are spread over a larger asset base; |
| | | |
| | • | Enhanced secondary market trading, as larger Funds potentially make it easier for investors to buy and sell Fund shares; |
| | | |
| | • | Lower per share trading costs through reduced bid/ask spreads due to a larger common share float; and |
| | | |
| | • | Increased Fund flexibility in managing the structure and cost of leverage over time. |
The approved reorganizations are as follows:
| | Acquired Funds | | Acquiring Fund |
| | Arizona Dividend Advantage (NFZ) | | Arizona Premium Income (NAZ) |
| | Arizona Dividend Advantage 2 (NKR) | | |
| | Arizona Dividend Advantage 3 (NXE) | | |
If shareholders approve the reorganizations, and upon the closing of the reorganizations, the Acquired Funds will transfer all of their assets to the Acquiring Fund in exchange for common and preferred shares of the Acquiring Fund, and the assumption by the Acquiring Fund of the liabilities of the Acquired Funds. The Acquired Funds will then be liquidated, dissolved and terminated in accordance with their Declaration of Trust.
In addition, shareholders of the Acquired Funds will become shareholders of the Acquiring Fund. Holders of common shares will receive newly issued common shares of the Acquiring Fund, the aggregate net asset value of which will be equal to the aggregate net asset value of the common shares of the Acquired Funds held immediately prior to the reorganizations (including for this purpose fractional Acquiring Fund shares to which shareholders would be entitled). Fractional shares will be sold on the open market and shareholders will receive cash in lieu of such fractional shares. Holders of preferred shares of each Acquired Fund will receive on a one-for-one basis newly issued preferred shares of the Acquiring Fund, in exchange for preferred shares of the Acquired Funds held immediately prior to the reorganization.
In connection with the reorganizations, the Funds have accrued for certain associated costs and expenses. Such amounts are included as components of “Accrued other expenses” on the Statement of Assets and Liabilities and “Reorganization expense” on the Statement of Operations.
Significant Accounting Policies
The following is a summary of significant accounting policies followed by the Funds in the preparation of their financial statements in accordance with U.S. generally accepted accounting principles (“U.S. GAAP”).
| | | Notes to |
| | | Financial Statements (Unaudited) (continued) |
Investment Valuation
Prices of municipal bonds are provided by a pricing service approved by the Funds’ Board of Directors/Trustees. These securities are generally classified as Level 2 for fair value measurement purposes. The pricing service establishes a security’s fair value using methods that may include consideration of the following: yields or prices of investments of comparable quality, type of issue, coupon, maturity and rating, market quotes or indications of value from security dealers, evaluations of anticipated cash flows or collateral, general market conditions and other information and analysis, including the obligor’s credit characteristics considered relevant. In pricing certain securities, particularly less liquid and lower quality securities, the pricing service may consider information about a security, its issuer, or market activity, provided by Nuveen Fund Advisors, Inc. (the “Adviser”), a wholly-owned subsidiary of Nuveen Investments, Inc. (“Nuveen”). These securities are generally classified as Level 2 or Level 3 depending on the priority of the significant inputs.
Certain securities may not be able to be priced by the pre-established pricing methods as described above. Such securities may be valued by the Funds’ Board of Directors/Trustees or its designee at fair value. These securities generally include, but are not limited to, restricted securities (securities which may not be publicly sold without registration under the Securities Act of 1933, as amended) for which a pricing service is unable to provide a market price; securities whose trading has been formally suspended; debt securities that have gone into default and for which there is no current market quotation; a security whose market price is not available from a pre-established pricing source; a security with respect to which an event has occurred that is likely to materially affect the value of the security after the market has closed but before the calculation of a Fund’s net asset value (as may be the case in non-U.S. markets on which the security is primarily traded) or make it difficult or impossible to obtain a reliable market quotation; and a security whose price, as provided by the pricing service, is not deemed to reflect the security’s fair value. As a general principle, the fair value of a security would appear to be the amount that the owner might reasonably expect to receive for it in a current sale. A variety of factors may be considered in determining the fair value of such securities, which may include consideration of the following: yields or prices of investments of comparable quality, type of issue, coupon, maturity and rating, market quotes or indications of value from security dealers, evaluations of anticipated cash flows or collateral, general market conditions and other information and analysis, including the obligor’s credit characteristics considered relevant. These securities are generally classified as Level 2 or Level 3 depending on the priority of the significant inputs. Regardless of the method employed to value a particular security, all valuations are subject to review by the Funds’ Board of Directors/Trustees or its designee.
Refer to Footnote 2 – Fair Value Measurements for further details on the leveling of securities held by the Funds as of the end of the reporting period.
Investment Transactions
Investment transactions are recorded on a trade date basis. Realized gains and losses from transactions are determined on the specific identification method, which is the same basis used for federal income tax purposes. Investments purchased on a when-issued/delayed delivery basis may have extended settlement periods. Any investments so purchased are subject to market fluctuation during this period. The Funds have instructed the custodian to earmark securities in the Funds’ portfolios with a current value at least equal to the amount of the when-issued/delayed delivery purchase commitments. At August 31, 2012, Arizona Premium Income (NAZ), Arizona Dividend Advantage (NFZ), Arizona Dividend Advantage 2 (NKR) and Texas Quality Income (NTX) had outstanding when issued/delayed delivery purchase commitments of $2,953,781, $829,675, $2,483,099 and $2,279,520, respectively. There were no such outstanding purchase commitments in Arizona Dividend Advantage 3 (NXE).
Investment Income
Interest income, which reflects the amortization of premiums and includes accretion of discounts for financial reporting purposes, is recorded on an accrual basis. Investment income also reflects paydown gains and losses, if any.
Income Taxes
Each Fund is a separate taxpayer for federal income tax purposes. Each Fund intends to distribute substantially all of its net investment income and net capital gains to shareholders and to otherwise comply with the requirements of Subchapter M of the Internal Revenue Code applicable to regulated investment companies. Therefore, no federal income tax provision is required. Furthermore, each Fund intends to satisfy conditions that will enable interest from municipal securities, which is exempt from regular federal and designated state income taxes, to retain such tax-exempt status when distributed to shareholders of the Funds. Net realized capital gains and ordinary income distributions paid by the Funds are subject to federal taxation.
For all open tax years and all major taxing jurisdictions, management of the Funds has concluded that there are no significant uncertain tax positions that would require recognition in the financial statements. Open tax years are those that are open for examination by taxing authorities (i.e., generally the last four tax year ends and the interim tax period since then). Furthermore, management of the Funds is also not aware of any tax positions for which it is reasonably possible that the total amounts of unrecognized tax benefits will significantly change in the next twelve months.
Dividends and Distributions to Common Shareholders
Dividends from net investment income are declared monthly. Net realized capital gains and/or market discount from investment transactions, if any, are distributed to shareholders at least annually. Furthermore, capital gains are distributed only to the extent they exceed available capital loss carryforwards.
Distributions to Common shareholders of net investment income, net realized capital gains and/or market discount, if any, are recorded on the ex-dividend date. The amount and timing of distributions are determined in accordance with federal income tax regulations, which may differ from U.S. GAAP.
Auction Rate Preferred Shares
Each Fund is authorized to issue Auction Rate Preferred Shares (“ARPS”). As of February 29, 2012, the Funds redeemed all of their outstanding ARPS, at liquidation value.
MuniFund Term Preferred Shares
The following Funds have issued and outstanding MuniFund Term Preferred (“MTP”) Shares, with a $10 stated (“par”) value per share. Proceeds from the issuance of MTP Shares, net of offering expenses, were used to redeem all, or a portion of, each Fund’s outstanding ARPS. Each Fund’s MTP Shares are issued in one Series. Dividends on MTP shares, which are recognized as interest expense for financial reporting purposes, are paid monthly at a fixed annual rate, subject to adjustments in certain circumstances. The MTP Shares trade on the NYSE. As of August 31, 2012, the number of MTP Shares outstanding, annual interest rate and NYSE “ticker” symbol for each Fund’s series of MTP Shares are as follows:
| | | | | | | | | | | | | | | | | | | | |
| | | Arizona Dividend Advantage (NFZ) | | Arizona Dividend Advantage 2 (NKR) | |
| | | Shares Outstanding | | Annual Interest Rate | | NYSE Ticker | | Shares Outstanding | | Annual Interest Rate | | NYSE Ticker | |
| Series 2015 | | | 1,110,000 | | | 2.05 | % | | NFZ Pr C | | | 1,872,500 | | | 2.05 | % | | NKR Pr C | |
| | | Arizona Dividend Advantage 3 (NXE) | |
| | | Shares Outstanding | �� | Annual Interest Rate | | NYSE Ticker | |
| Series 2016 | | | 2,084,600 | | | 2.90 | % | | NXE Pr C | |
| | | Texas Quality Income (NTX) | |
| | | Shares Outstanding | | Annual Interest Rate | | NYSE Ticker | |
| Series 2015 | | | 7,092,000 | | | 2.30 | % | | NTX Pr C | |
Each Fund is obligated to redeem its MTP Shares by the date as specified in its offering document (“Term Redemption Date”), unless earlier redeemed or repurchased by the Fund. MTP Shares are subject to optional and mandatory redemption in certain circumstances. MTP Shares will be subject to redemption at the option of each Fund (“Optional Redemption Date”), subject to a payment of premium for one year following the Optional Redemption Date (“Premium Expiration Date”), and at par thereafter. MTP Shares also will be subject to redemption, at the option of each Fund, at par in the event of certain changes in the credit rating of the MTP Shares. Each Fund may be obligated to redeem certain of the MTP Shares if the Fund fails to maintain certain asset coverage and leverage ratio requirements and such failures are not cured by the applicable cure date. The redemption price per share is equal to the sum of the liquidation value per share plus any accumulated but unpaid dividends. The Term Redemption Date, Optional Redemption Date and Premium Expiration Date for each Fund’s series of MTP Shares are as follows.
| | | | | | | | | | | | | | |
| | | Arizona Dividend Advantage | | Arizona Dividend Advantage 2 | | Arizona Dividend Advantage 3 | | Texas Quality Income | |
| | | (NFZ | ) | (NKR | ) | (NXE | ) | (NTX | ) |
| | | Series 2015 | | Series 2015 | | Series 2016 | | Series 2015 | |
| Term Redemption Date | | | November 1, 2015 | | | November 1, 2015 | | | March 1, 2016 | | | December 1, 2015 | |
| Optional Redemption Date | | | November 1, 2011 | | | November 1, 2011 | | | March 1, 2012 | | | December 1, 2011 | |
| Premium Expiration Date | | | October 31, 2012 | | | October 31, 2012 | | | February 28, 2013 | | | November 30, 2012 | |
The average liquidation value of all MTP Shares outstanding for each Fund during the six months ended August 31, 2012, was as follows:
| | | | | | | | | | | | | | |
| | | Arizona Dividend Advantage | | Arizona Dividend Advantage 2 | | Arizona Dividend Advantage 3 | | Texas Quality Income | |
| | | | (NFZ | ) | | (NKR | ) | | (NXE | ) | | (NTX | ) |
| Average liquidation value of MTP Shares outstanding | | $ | 11,100,000 | | $ | 18,725,000 | | $ | 20,846,000 | | $ | 70,920,000 | |
| | | Notes to |
| | | Financial Statements (Unaudited) (continued) |
For financial reporting purposes only, the liquidation value of MTP Shares is recorded as a liability on the Statement of Assets and Liabilities. Unpaid dividends on MTP Shares are recognized as a component of “Interest payable” on the Statement of Assets and Liabilities. Dividends paid on MTP Shares are recognized as a component of “Interest expense and amortization of offering costs” on the Statement of Operations.
Variable Rate MuniFund Term Preferred Shares
Arizona Premium Income (NAZ) has issued and outstanding Variable Rate MuniFund Term Preferred (“VMTP”) Shares, with a $100,000 liquidation value per share. The Fund issued its VMTP Shares in a privately negotiated offering during July 2011. Proceeds from the issuance of VMTP Shares, net of offering expenses, were used to redeem the Fund’s outstanding ARPS. The Fund’s VMTP Shares were offered to qualified institutional buyers pursuant to Rule 144A under the Securities Act of 1933. As of August 31, 2012, the number of VMTP Shares outstanding, at liquidation value, for the Fund are as follows:
| | | | | |
| | | Arizona Premium Income | |
| | | | (NAZ | ) |
| Series 2014 | | $ | 28,000,000 | |
The Fund is obligated to redeem its VMTP Shares by the date as specified in its offering document (“Term Redemption Date”), unless earlier redeemed or repurchased by the Fund. VMTP Shares are subject to optional and mandatory redemption in certain circumstances. The VMTP Shares are subject to redemption at the option of each Fund (“Optional Redemption Date”), subject to payment of premium for one year following the Optional Redemption Date (“Premium Expiration Date”), and at par thereafter. The Fund may be obligated to redeem certain of the VMTP Shares if the Fund fails to maintain certain asset coverage and leverage ratio requirements and such failures are not cured by the applicable cure date. The redemption price per share is equal to the sum of the liquidation value per share plus any accumulated but unpaid dividends. The Term Redemption Date, Optional Redemption Date and Premium Expiration Date for the Fund’s VMTP Shares are as follows:
| | | | | |
| | | Arizona Premium Income | |
| | | | (NAZ | ) |
| Term Redemption Date | | | August 1, 2014 | |
| Optional Redemption Date | | | August 1, 2012 | |
| Premium Expiration Date | | | July 31, 2012 | |
The average liquidation value of VMTP Shares outstanding and annualized dividend rate of VMTP Shares for the Fund during the six months ended August 31, 2012, were as follows:
| | | | | |
| | | Arizona Premium Income | |
| | | | (NAZ | ) |
| Average liquidation value of VMTP Shares outstanding | | $ | 28,000,000 | |
| Annualized dividend rate | | | 1.22 | % |
Dividends on VMTP shares (which are treated as interest payments for financial reporting purposes) are set weekly.
For financial reporting purposes only, the liquidation value of VMTP Shares is recognized as a liability on the Statement of Assets and Liabilities. Unpaid dividends on VMTP Shares are recognized as a component of “Interest payable” on the Statement of Assets and Liabilities, when applicable. Dividends paid on VMTP Shares are recognized as a component of “Interest expense and amortization of offering costs” on the Statement of Operations.
Inverse Floating Rate Securities
Each Fund is authorized to invest in inverse floating rate securities. An inverse floating rate security is created by depositing a municipal bond, typically with a fixed interest rate, into a special purpose trust created by a broker-dealer. In turn, this trust (a) issues floating rate certificates, in face amounts equal to some fraction of the deposited bond’s par amount or market value, that typically pay short-term tax-exempt interest rates to third parties, and (b) issues to a long-term investor (such as one of the Funds) an inverse floating rate certificate (sometimes referred to as an “inverse floater”) that represents all remaining or residual interest in the trust. The income received by the inverse floater holder varies inversely with the short-term rate paid to the floating rate certificates’ holders, and in most circumstances the inverse floater holder bears substantially all of the underlying bond’s downside investment risk and also benefits disproportionately from any potential appreciation of the underlying bond’s value. The price of an inverse floating rate security will be more volatile than that of the underlying bond because the interest rate is dependent on not only the fixed coupon rate of the
underlying bond but also on the short-term interest paid on the floating rate certificates, and because the inverse floating rate security essentially bears the risk of loss of the greater face value of the underlying bond.
A Fund may purchase an inverse floating rate security in a secondary market transaction without first owning the underlying bond (referred to as an “externally-deposited inverse floater”), or instead by first selling a fixed-rate bond to a broker-dealer for deposit into the special purpose trust and receiving in turn the residual interest in the trust (referred to as a “self-deposited inverse floater”). The inverse floater held by a Fund gives the Fund the right (a) to cause the holders of the floating rate certificates to tender their notes at par, and (b) to have the broker transfer the fixed-rate bond held by the trust to the Fund, thereby collapsing the trust. An investment in an externally-deposited inverse floater is identified in the Portfolio of Investments as “(IF) – Inverse floating rate investment.” An investment in a self-deposited inverse floater is accounted for as a financing transaction. In such instances, a fixed-rate bond deposited into a special purpose trust is identified in the Portfolio of Investments as “(UB) – Underlying bond of an inverse floating rate trust reflected as a financing transaction,” with the Fund accounting for the short-term floating rate certificates issued by the trust as “Floating rate obligations” on the Statement of Assets and Liabilities. In addition, the Fund reflects in “Investment Income” the entire earnings of the underlying bond and related interest paid to the holders of the short-term floating rate certificates as a component of “Interest expense and amortization of offering costs” on the Statement of Operations.
During the six months ended August 31, 2012, each Fund invested in externally-deposited inverse floaters and/or self-deposited inverse floaters.
Each Fund may also enter into shortfall and forbearance agreements (sometimes referred to as a “recourse trust” or “credit recovery swap”) (such agreements referred to herein as “Recourse Trusts”) with a broker-dealer by which a Fund agrees to reimburse the broker-dealer, in certain circumstances, for the difference between the liquidation value of the fixed-rate bond held by the trust and the liquidation value of the floating rate certificates issued by the trust plus any shortfalls in interest cash flows. Under these agreements, a Fund’s potential exposure to losses related to or on inverse floaters may increase beyond the value of a Fund’s inverse floater investments as a Fund may potentially be liable to fulfill all amounts owed to holders of the floating rate certificates. At period end, any such shortfall is recognized as “Unrealized depreciation on Recourse Trusts” on the Statement of Assets and Liabilities.
At August 31, 2012, each Fund’s maximum exposure to externally-deposited Recourse Trusts was as follows:
| | | | | | | | | | | | | | | | | |
| | | Arizona Premium Income | | Arizona Dividend Advantage | | Arizona Dividend Advantage 2 | | Arizona Dividend Advantage 3 | | Texas Quality Income | |
| | | | (NAZ | ) | | (NFZ | ) | | (NKR | ) | | (NXE | ) | | (NTX | ) |
| Maximum exposure to Recourse Trusts | | $ | 2,145,000 | | $ | 1,680,000 | | $ | 1,350,000 | | $ | 2,325,000 | | $ | — | |
The average floating rate obligations outstanding and average annual interest rate and fees related to self-deposited inverse floaters during the six months ended August 31, 2012, were as follows:
| | | | | |
| | | Texas Quality Income | |
| | | | (NTX | ) |
| Average floating rate obligations outstanding | | $ | 3,960,000 | |
| Average annual interest rate and fees | | | 0.41 | % |
Derivative Financial Instruments
Each Fund is authorized to invest in certain derivative instruments, including foreign currency forwards, futures, options and swap contracts. Although the Funds are authorized to invest in such derivative instruments, and may do so in the future, they did not make any such investments during the six months ended August 31, 2012.
Market and Counterparty Credit Risk
In the normal course of business each Fund may invest in financial instruments and enter into financial transactions where risk of potential loss exists due to changes in the market (market risk) or failure of the other party to the transaction to perform (counterparty credit risk). The potential loss could exceed the value of the financial assets recorded on the financial statements. Financial assets, which potentially expose each Fund to counterparty credit risk, consist principally of cash due from counterparties on forward, option and swap transactions, when applicable. The extent of each Fund’s exposure to counterparty credit risk in respect to these financial assets approximates their carrying value as recorded on the Statement of Assets and Liabilities. Futures contracts, when applicable, expose a Fund to minimal counterparty credit risk as they are exchange traded and the exchange’s clearinghouse, which is counterparty to all exchange traded futures, guarantees the futures contracts against default.
Each Fund helps manage counterparty credit risk by entering into agreements only with counterparties the Adviser believes have the financial resources to honor their obligations and by having the Adviser monitor the financial stability of the counterparties. Additionally, counterparties may be required to
| | | Notes to |
| | | Financial Statements (Unaudited) (continued) |
pledge collateral daily (based on the daily valuation of the financial asset) on behalf of each Fund with a value approximately equal to the amount of any unrealized gain above a pre-determined threshold. Reciprocally, when each Fund has an unrealized loss, the Funds have instructed the custodian to pledge assets of the Funds as collateral with a value approximately equal to the amount of the unrealized loss above a pre-determined threshold. Collateral pledges are monitored and subsequently adjusted if and when the valuations fluctuate, either up or down, by at least the pre-determined threshold amount.
Zero Coupon Securities
Each Fund is authorized to invest in zero coupon securities. A zero coupon security does not pay a regular interest coupon to its holders during the life of the security. Income to the holder of the security comes from accretion of the difference between the original purchase price of the security at issuance and the par value of the security at maturity and is effectively paid at maturity. The market prices of zero coupon securities generally are more volatile than the market prices of securities that pay interest periodically.
Offering Costs
Costs incurred by the Funds in connection with their offerings of MTP Shares or VMTP Shares were recorded as a deferred charge, which will be amortized over the life of the shares. Each Fund’s amortized deferred charges are recognized as a component of “Interest expense and amortization of offering costs” on the Statement of Operations. Each Fund’s total offering costs incurred were as follows:
| | | | | | | | | | | | | | |
| | | Arizona Dividend Advantage | | Arizona Dividend Advantage 2 | | Arizona Dividend Advantage 3 | | Texas Quality Income | |
| | | | (NFZ | ) | | (NKR | ) | | (NXE | ) | | (NTX | ) |
| MTP Shares offering costs | | $ | 491,500 | | $ | 588,375 | | $ | 672,690 | | $ | 1,366,300 | |
| | | Arizona Premium Income | |
| | | | (NAZ | ) |
| VMTP Shares offering costs | | $ | 100,000 | |
Custodian Fee Credit
Each Fund has an arrangement with the custodian bank whereby certain custodian fees and expenses are reduced by net credits earned on each Fund’s cash on deposit with the bank. Such deposit arrangements are an alternative to overnight investments. Credits for cash balances may be offset by charges for any days on which a Fund overdraws its account at the custodian bank.
Indemnifications
Under the Funds’ organizational documents, their officers and directors/trustees are indemnified against certain liabilities arising out of the performance of their duties to the Funds. In addition, in the normal course of business, the Funds enter into contracts that provide general indemnifications to other parties. The Funds’ maximum exposure under these arrangements is unknown as this would involve future claims that may be made against the Funds that have not yet occurred. However, the Funds have not had prior claims or losses pursuant to these contracts and expect the risk of loss to be remote.
Use of Estimates
The preparation of financial statements in conformity with U.S. GAAP requires management to make estimates and assumptions that affect the reported amounts of assets and liabilities at the date of the financial statements and the reported amounts of increases and decreases in net assets applicable to Common shares from operations during the reporting period. Actual results may differ from those estimates.
2. Fair Value Measurements
Fair value is defined as the price that the Funds would receive upon selling an investment or transferring a liability in an orderly transaction to an independent buyer in the principal or most advantageous market for the investment. A three-tier hierarchy is used to maximize the use of observable market data and minimize the use of unobservable inputs and to establish classification of fair value measurements for disclosure purposes. Observable inputs reflect the assumptions market participants would use in pricing the asset or liability. Observable inputs are based on market data obtained from sources independent of the reporting entity. Unobservable inputs reflect the reporting entity’s own assumptions about the assumptions market participants would use in pricing the asset or liability. Unobservable inputs are based on the best information available in the circumstances. The following is a summary of the three-tiered hierarchy of valuation input levels.
| | Level 1 – | Inputs are unadjusted and prices are determined using quoted prices in active markets for identical securities. |
| | | |
| | Level 2 – | Prices are determined using other significant observable inputs (including quoted prices for similar securities, interest rates, prepayment speeds, credit risk, etc.). |
| | | |
| | Level 3 – | Prices are determined using significant unobservable inputs (including management’s assumptions in determining the fair value of investments). |
The inputs or methodologies used for valuing securities are not an indication of the risks associated with investing in those securities. The following is a summary of each Fund’s fair value measurements as of the end of the reporting period:
| | | | | | | | | | | | | | |
| Arizona Premium Income (NAZ) | | | Level 1 | | | Level 2 | | | Level 3 | | | Total | |
| | | | | | | | | | | | | | |
| Long-Term Investments: | | | | | | | | | | | | | |
| Municipal Bonds | | $ | — | | $ | 93,002,438 | | $ | 1,951,904 | | $ | 94,954,342 | |
| Arizona Dividend Advantage (NFZ) | | | Level 1 | | | Level 2 | | | Level 3 | | | Total | |
| | | | | | | | | | | | | | |
| Long-Term Investments: | | | | | | | | | | | | | |
| Municipal Bonds | | $ | — | | $ | 34,365,393 | | $ | 218,613 | | $ | 34,584,006 | |
| Arizona Dividend Advantage 2 (NKR) | | | Level 1 | | | Level 2 | | | Level 3 | | | Total | |
| | | | | | | | | | | | | | |
| Long-Term Investments: | | | | | | | | | | | | | |
| Municipal Bonds | | $ | — | | $ | 53,981,764 | | $ | 882,261 | | $ | 54,864,025 | |
| Arizona Dividend Advantage 3 (NXE) | | | Level 1 | | | Level 2 | | | Level 3 | | | Total | |
| | | | | | | | | | | | | | |
| Long-Term Investments: | | | | | | | | | | | | | |
| Municipal Bonds | | $ | — | | $ | 65,840,792 | | $ | 538,725 | | $ | 66,379,517 | |
| Texas Quality Income (NTX) | | | Level 1 | | | Level 2 | | | Level 3 | | | Total | |
| | | | | | | | | | | | | | |
| Long-Term Investments: | | | | | | | | | | | | | |
| Municipal Bonds | | $ | — | | $ | 223,619,909 | | $ | — | | $ | 223,619,909 | |
The following is a reconciliation of each Fund’s Level 3 investments held at the beginning and end of the measurement period:
| | | | | | | | | | | | | | |
| | | Arizona Premium Income | | Arizona Dividend Advantage | | Arizona Dividend Advantage 2 | | Arizona Dividend Advantage 3 | |
| | | (NAZ | ) | (NFZ | ) | (NKR | ) | (NXE | ) |
| | | Level 3 | | Level 3 | | Level 3 | | Level 3 | |
| | | Municipal | | Municipal | | Municipal | | Municipal | |
| | | Bonds | | Bonds | | Bonds | | Bonds | |
| Balance at the beginning of period | | $ | 1,959,607 | | $ | 219,476 | | $ | 885,742 | | $ | 540,851 | |
| Gains (losses): | | | | | | | | | | | | | |
| Net realized gains (losses) | | | — | | | — | | | — | | | — | |
| Net change in unrealized appreciation (depreciation) | | | (7,703 | ) | | (863 | ) | | (3,481 | ) | | (2,126 | ) |
| Purchases at cost | | | — | | | — | | | — | | | — | |
| Sales at proceeds | | | — | | | — | | | — | | | — | |
| Net discounts (premiums) | | | — | | | — | | | — | | | — | |
| Transfers in to | | | — | | | — | | | — | | | — | |
| Transfers out of | | | — | | | — | | | — | | | — | |
| Balance at the end of period | | $ | 1,951,904 | | $ | 218,613 | | $ | 882,261 | | $ | 538,725 | |
Change in net unrealized appreciation (depreciation) during the period of Level 3 securities held as of August 31, 2012 | | $ | (7,703 | ) | $ | (863 | ) | $ | (3,481 | ) | $ | (2,126 | ) |
| | | Notes to |
| | | Financial Statements (Unaudited) (continued) |
The valuation techniques and significant unobservable inputs used in recurring Level 3 fair value measurements of assets as of August 31, 2012, were as follows:
| | | | | | | | | | |
| | | Market Value | | Techniques | | Unobservable Inputs | | Range | |
| Arizona Premium Income (NAZ) | | | | | | | | | |
| Municipal Bonds | $ | 1,951,904 | | Discounted Cash Flow | | MMD Spread | | 0-6% | |
| | | | | | | AAA - Rated MMD | | | |
| | | | | | | Liquidity Discount | | 0-5% | |
| Arizona Dividend Advantage (NFZ) | | | | | | | | | |
| Municipal Bonds | $ | 218,613 | | Discounted Cash Flow | | MMD Spread | | 0-6% | |
| | | | | | | AAA - Rated MMD | | | |
| | | | | | | Liquidity Discount | | 0-5% | |
| Arizona Dividend Advantage 2 (NKR) | | | | | | | | | |
| Municipal Bonds | $ | 882,261 | | Discounted Cash Flow | | MMD Spread | | 0-6% | |
| | | | | | | AAA - Rated MMD | | | |
| | | | | | | Liquidity Discount | | 0-5% | |
| Arizona Dividend Advantage 3 (NXE) | | | | | | | | | |
| Municipal Bonds | $ | 538,725 | | Discounted Cash Flow | | MMD Spread | | 0-6% | |
| | | | | | | AAA - Rated MMD | | | |
| | | | | | | Liquidity Discount | | 0-5% | |
MMD - Municipal Market Data
The Nuveen funds’ Board of Directors/Trustees is responsible for the valuation process and has delegated the oversight of the daily valuation process to the Adviser’s Valuation Committee. The Valuation Committee, pursuant to the valuation policies and procedures adopted by the Board of Directors/Trustees, is responsible for making fair value determinations, evaluating the effectiveness of the funds’ pricing policies, and reporting to the Board of Directors/Trustees. The Valuation Committee is aided in its efforts by the Adviser’s dedicated Securities Valuation Team, which is responsible for administering the daily valuation process and applying fair value methodologies as approved by the Valuation Committee. When determining the reliability of independent pricing services for investments owned by the funds, the Valuation Committee, among other things, conducts due diligence reviews of the pricing services and monitors the quality of security prices received through various testing reports conducted by the Securities Valuation Team.
The Valuation Committee will consider pricing methodologies it deems relevant and appropriate when making fair value determinations. Examples of possible methodologies include, but are not limited to, multiple of earnings; discount from market of a similar freely traded security; discounted cash-flow analysis; book value or a multiple thereof; risk premium/yield analysis; yield to maturity; and/or fundamental investment analysis. The Valuation Committee will also consider factors it deems relevant and appropriate in light of the facts and circumstances. Examples of possible factors include, but are not limited to, the type of security; the issuer’s financial statements; the purchase price of the security; the discount from market value of unrestricted securities of the same class at the time of purchase; analysts’ research and observations from financial institutions; information regarding any transactions or offers with respect to the security; the existence of merger proposals or tender offers affecting the security; the price and extent of public trading in similar securities of the issuer or comparable companies; and the existence of a shelf registration for restricted securities.
For each portfolio security that has been fair valued pursuant to the policies adopted by the Board of Directors/Trustees, the fair value price is compared against the last available and next available market quotations. The Valuation Committee reviews the results of such testing and fair valuation occurrences are reported to the Board of Directors/Trustees.
3. Derivative Instruments and Hedging Activities
The Funds record derivative instruments at fair value, with changes in fair value recognized on the Statement of Operations, when applicable. Even though the Funds’ investments in derivatives may represent economic hedges, they are not considered to be hedge transactions for financial reporting purposes. The Funds did not invest in derivative instruments during the six months ended August 31, 2012.
4. Fund Shares
Common Shares
Transactions in Common shares were as follows:
| | | | | | | | | | | | | | |
| | | Arizona Premium Income (NAZ) | | Arizona Dividend Advantage 2 (NKR) | |
| | | Six Months Ended 8/31/12 | | Year Ended 2/29/12 | | Six Months Ended 8/31/12 | | Year Ended 2/29/12 | |
| Common shares issued to shareholders due to reinvestment of distributions | | | 1,983 | | | — | | | 179 | | | — | |
| | | Texas Quality Income (NTX) | |
| | | Six Months Ended 8/31/12 | | Year Ended 2/29/12 | |
| Common shares issued to shareholders due to reinvestment of distributions | | | 15,081 | | | 36,629 | |
Preferred Shares
Transactions in ARPS were as follows:
| | | | | | | | | | | | | | |
| | | Arizona Premium Income (NAZ) | |
| | | Six Months Ended 8/31/12 | | Year Ended 2/29/12 | |
| | | Shares | Amount | | Shares | Amount | |
| ARPS redeemed and/or noticed for redemption: | | | | | | | | | | | | | |
| Series TH | | | N/A | | | N/A | | | 1,115 | | $ | 27,875,000 | |
N/A – As of February 29, 2012, the Fund redeemed all of its outstanding ARPS at liquidation value.
Transactions in MTP shares were as follows:
| | | | | | | | | | | | | | |
| | | Arizona Dividend Advantage 3 (NXE) | |
| | | Six Months Ended 8/31/12 | | Year Ended 2/29/12 | |
| | | Shares | Amount | | Shares | Amount | |
| MTP Shares issued: | | | | | | | | | | | | | |
| Series 2016 | | | — | | $ | — | | | 180,000 | | $ | 1,800,000 | |
Transactions in VMTP Shares were as follows:
| | | | | | | | | | | | | | |
| | | Arizona Premium Income (NAZ) | |
| | | Six Months Ended 8/31/12 | | Year Ended 2/29/12 | |
| | | Shares | Amount | | Shares | Amount | |
| VMTP Shares issued: | | | | | | | | | | | | | |
| Series 2014 | | | — | | $ | — | | | 280 | | $ | 28,000,000 | |
| | | Notes to |
| | | Financial Statements (Unaudited) (continued) |
5. Investment Transactions
Purchases and sales (including maturities but excluding short-term investments, where applicable) during the six months ended August 31, 2012, were as follows:
| | | | | | | | | | | | | | | | | |
| | | Arizona Premium Income | | Arizona Dividend Advantage | | Arizona Dividend Advantage 2 | | Arizona Dividend Advantage 3 | | Texas Quality Income | |
| | | | (NAZ | ) | | (NFZ | ) | | (NKR | ) | | (NXE | ) | | (NTX | ) |
| Purchases | | $ | 7,185,227 | | $ | 3,636,399 | | $ | 4,399,126 | | $ | 3,992,272 | | $ | 16,366,610 | |
| Sales and maturities | | | 7,347,973 | | | 3,753,677 | | | 6,019,950 | | | 4,593,776 | | | 15,032,759 | |
6. Income Tax Information
The following information is presented on an income tax basis. Differences between amounts for financial statement and federal income tax purposes are primarily due to timing differences in recognizing taxable market discount, timing differences in recognizing certain gains and losses on investment transactions and the treatment of investments in inverse floating rate securities reflected as financing transactions, if any. To the extent that differences arise that are permanent in nature, such amounts are reclassified within the capital accounts as detailed below. Temporary differences do not require reclassification. Temporary and permanent differences do not impact the net asset values of the Funds.
At August 31, 2012, the cost and unrealized appreciation (depreciation) of investments, as determined on a federal income tax basis, were as follows:
| | | | | | | | | | | | | | | | | |
| | | Arizona Premium Income | | Arizona Dividend Advantage | | Arizona Dividend Advantage 2 | | Arizona Dividend Advantage 3 | | Texas Quality Income | |
| | | | (NAZ | ) | | (NFZ | ) | | (NKR | ) | | (NXE | ) | | (NTX | ) |
| Cost of investments | | $ | 87,571,596 | | $ | 31,790,742 | | $ | 50,750,924 | | $ | 61,738,625 | | $ | 202,692,729 | |
| Gross unrealized: | | | | | | | | | | | | | | | | |
| Appreciation | | $ | 10,295,951 | | $ | 2,992,358 | | $ | 4,599,685 | | $ | 5,065,605 | | $ | 20,276,618 | |
| Depreciation | | | (2,913,205 | ) | | (199,094 | ) | | (486,584 | ) | | (424,713 | ) | | (3,309,454 | ) |
| Net unrealized appreciation (depreciation) of investments | | $ | 7,382,746 | | $ | 2,793,264 | | $ | 4,113,101 | | $ | 4,640,892 | | $ | 16,967,164 | |
Permanent differences, primarily due to expiration of capital loss carryforwards, federal taxes paid, taxable market discount, nondeductible offering costs and distribution character reclassifications, resulted in reclassifications among the Funds’ components of Common share net assets at February 29, 2012, the Funds’ last tax year end, as follows:
| | | | | | | | | | | | | | | | | |
| | | Arizona Premium Income | | Arizona Dividend Advantage | | Arizona Dividend Advantage 2 | | Arizona Dividend Advantage 3 | | Texas Quality Income | |
| | | | (NAZ | ) | | (NFZ | ) | �� | (NKR | ) | | (NXE | ) | | (NTX | ) |
| Paid-in surplus | | $ | (1,463,538 | ) | $ | (96,700 | ) | $ | (120,807 | ) | $ | (133,481 | ) | $ | (256,188 | ) |
| Undistributed (Over-distribution of) net investment income | | | 19,513 | | | 96,700 | | | 119,157 | | | 131,166 | | | 263,630 | |
| Accumulated net realized gain (loss) | | | 1,444,025 | | | — | | | 1,650 | | | 2,315 | | | (7,442 | ) |
The tax components of undistributed net tax-exempt income, net ordinary income and net long-term capital gains at February 29, 2012, the Funds’ last tax year end, were as follows:
| | | | | | | | | | | | | | | | | |
| | | Arizona Premium Income | | Arizona Dividend Advantage | | Arizona Dividend Advantage 2 | | Arizona Dividend Advantage 3 | | Texas Quality Income | |
| | | | (NAZ | ) | | (NFZ | ) | | (NKR | ) | | (NXE | ) | | (NTX | ) |
| Undistributed net tax-exempt income * | | $ | 1,409,529 | | $ | 279,569 | | $ | 478,398 | | $ | 564,544 | | $ | 1,813,987 | |
| Undistributed net ordinary income ** | | | — | | | 686 | | | — | | | — | | | 24,171 | |
| Undistributed net long-term capital gains | | | — | | | — | | | — | | | — | | | — | |
| * | Undistributed net tax-exempt income (on a tax basis) has not been reduced for the dividend declared on February 1, 2012, paid on March 1, 2012. |
| ** | Net ordinary income consists of taxable market discount income and net short-term capital gains, if any. |
The tax character of distributions paid during the Funds’ last tax year ended February 29, 2012, was designated for purposes of the dividends paid deduction as follows:
| | | | | | | | | | | | | | | | | |
| | | Arizona Premium Income | | Arizona Dividend Advantage | | Arizona Dividend Advantage 2 | | Arizona Dividend Advantage 3 | | Texas Quality Income | |
| | | | (NAZ | ) | | (NFZ | ) | | (NKR | ) | | (NXE | ) | | (NTX | ) |
| Distributions from net tax-exempt income | | $ | 3,597,007 | | $ | 1,425,938 | | $ | 2,345,251 | | $ | 2,882,011 | | $ | 9,840,206 | |
| Distributions from net ordinary income** | | | — | | | — | | | — | | | — | | | 351 | |
| Distributions from net long-term capital gains | | | — | | | — | | | — | | | — | | | 247,718 | |
| ** | Net ordinary income consists of taxable market discount income and net short-term capital gains, if any. |
At February 29, 2012, the Funds’ last tax year end, the following Funds had unused capital loss carryforwards available for federal income tax purposes to be applied against future capital gains, if any. If not applied, the carryforwards will expire as follows:
| | | | | | | | | | | | | | |
| | | Arizona Premium Income | | Arizona Dividend Advantage | | Arizona Dividend Advantage 2 | | Arizona Dividend Advantage 3 | |
| | | | (NAZ | ) | | (NFZ | ) | | (NKR | ) | | (NXE | ) |
| Expiration: | | | | | | | | | | | | | |
| February 28, 2014 | | $ | — | | $ | — | | $ | — | | $ | 208,948 | |
| February 29, 2016 | | | 562,384 | | | 122,620 | | | — | | | 363,937 | |
| February 28, 2017 | | | 323,876 | | | 210,308 | | | 68,614 | | | 258,905 | |
| February 28, 2018 | | | 43,720 | | | 318,004 | | | 223,857 | | | 108,356 | |
| Total | | $ | 929,980 | | $ | 650,932 | | $ | 292,471 | | $ | 940,146 | |
During the Funds’ last tax year ended February 29, 2012, the following Funds utilized capital loss carryforwards as follows:
| | | | | | | | | | | | | | |
| | | Arizona Premium Income | | Arizona Dividend Advantage | | Arizona Dividend Advantage 2 | | Arizona Dividend Advantage 3 | |
| | | | (NAZ | ) | | (NFZ | ) | | (NKR | ) | | (NXE | ) |
| Utilized capital loss carryforwards | | $ | 109,799 | | $ | 53,319 | | $ | 308,747 | | $ | 138,567 | |
At February 29, 2012, the Funds’ last tax year end, $1,443,828 of Arizona Premium Income’s (NAZ) capital loss carryforward expired.
Under the Regulated Investment Company Modernization Act of 2010, capital losses incurred by the Fund after December 31, 2010 will not be subject to expiration. During the Funds’ last tax year ended February 29, 2012, there were no post-enactment capital losses generated.
The Funds have elected to defer losses incurred from November 1, 2011 through February 29, 2012, the Funds’ last tax year end, in accordance with federal income tax rules. These losses are treated as having arisen on the first day of the current fiscal year. The following Fund has elected to defer losses as follows:
| | | | | |
| | | | Texas | |
| | | | Quality | |
| | | | Income | |
| | | | (NTX | ) |
| Post-October capital losses | | $ | 1,722,730 | |
| Late-year ordinary losses | | | — | |
7. Management Fees and Other Transactions with Affiliates
Each Fund’s management fee consists of two components – a fund-level fee, based only on the amount of assets within the Fund, and a complex-level fee, based on the aggregate amount of all eligible fund assets managed by the Adviser. This pricing structure enables Fund shareholders to benefit from growth in the assets within their Fund as well as from growth in the amount of complex-wide assets managed by the Adviser.
| | | Notes to |
| | | Financial Statements (Unaudited) (continued) |
The annual fund-level fee for each Fund, payable monthly, is calculated according to the following schedule:
| | | | |
| | | | Arizona Premium Income (NAZ) |
| | | | Texas Quality Income (NTX) |
| Average Daily Managed Assets* | | | Fund-Level Fee Rate |
| For the first $125 million | | | .4500 | % |
| For the next $125 million | | | .4375 | |
| For the next $250 million | | | .4250 | |
| For the next $500 million | | | .4125 | |
| For the next $1 billion | | | .4000 | |
| For the next $3 billion | | | .3875 | |
| For managed assets over $5 billion | | | .3750 | |
| | | | | |
| | | | Arizona Dividend Advantage (NFZ) |
| | | | Arizona Dividend Advantage 2 (NKR) |
| | | | Arizona Dividend Advantage 3 (NXE) |
| Average Daily Managed Assets* | | | Fund-Level Fee Rate |
| For the first $125 million | | | .4500 | % |
| For the next $125 million | | | .4375 | |
| For the next $250 million | | | .4250 | |
| For the next $500 million | | | .4125 | |
| For the next $1 billion | | | .4000 | |
| For managed assets over $2 billion | | | .3750 | |
The annual complex-level fee for each Fund, payable monthly, is calculated according to the following schedule:
| | | | | |
| Complex-Level Managed Asset Breakpoint Level* | | | Effective Rate at Breakpoint Level |
| $55 billion | | | .2000 | % |
| $56 billion | | | .1996 | |
| $57 billion | | | .1989 | |
| $60 billion | | | .1961 | |
| $63 billion | | | .1931 | |
| $66 billion | | | .1900 | |
| $71 billion | | | .1851 | |
| $76 billion | | | .1806 | |
| $80 billion | | | .1773 | |
| $91 billion | | | .1691 | |
| $125 billion | | | .1599 | |
| $200 billion | | | .1505 | |
| $250 billion | | | .1469 | |
| $300 billion | | | .1445 | |
| * | For the fund-level and complex-level fees, managed assets include closed-end fund assets managed by the Adviser that are attributable to financial leverage. For these purposes, financial leverage includes the funds’ use of preferred stock and borrowings and certain investments in the residual interest certificates (also called inverse floating rate securities) in tender option bond (TOB) trusts, including the portion of assets held by a TOB trust that has been effectively financed by the trust’s issuance of floating rate securities, subject to an agreement by the Adviser as to certain funds to limit the amount of such assets for determining managed assets in certain circumstances. The complex-level fee is calculated based upon the aggregate daily managed assets of all Nuveen Funds that constitute “eligible assets.” Eligible assets do not include assets attributable to investments in other Nuveen Funds and assets in excess of $2 billion added to the Nuveen Fund complex in connection with the Adviser’s assumption of the management of the former First American Funds effective January 1, 2011. As of August 31, 2012, the complex-level fee rate for these Funds was .1702%. |
The management fee compensates the Adviser for overall investment advisory and administrative services and general office facilities. The Adviser is responsible for each Fund’s overall strategy and asset allocation decisions. The Adviser has entered into sub-advisory agreements with Nuveen Asset Management, LLC (the “Sub-Adviser”), a wholly-owned subsidiary of the Adviser, under which the Sub-Adviser manages the investment portfolios of the Funds. The Sub-Adviser is compensated for its services to the Funds from the management fees paid to the Adviser.
The Funds pay no compensation directly to those of its directors/trustees who are affiliated with the Adviser or to its officers, all of whom receive remuneration for their services to the Funds from the Adviser or its affiliates. The Board of Directors/Trustees has adopted a deferred compensation plan for independent directors/trustees that enables directors/trustees to elect to defer receipt of all or a portion of the annual compensation they are entitled to receive from certain Nuveen-advised funds. Under the plan, deferred amounts are treated as though equal dollar amounts had been invested in shares of select Nuveen-advised funds.
For the first ten years of Arizona Dividend Advantage 2’s (NKR) operations, the Adviser has agreed to reimburse the Fund, as a percentage of average daily managed assets, for fees and expenses in the amounts and for the time periods set forth below:
| | | | | |
| Year Ending | | Year Ending | | |
| March 31, | | March 31, | | |
| 2002* | .30% | 2008 | .25 | % |
| 2003 | .30 | 2009 | .20 | |
| 2004 | .30 | 2010 | .15 | |
| 2005 | .30 | 2011 | .10 | |
| 2006 | .30 | 2012 | .05 | |
| 2007 | .30 | | | |
| * | From the commencement of operations. |
The Adviser has not agreed to reimburse Arizona Dividend Advantage 2 (NKR) for any portion of its fees and expenses beyond March 31, 2012.
8. New Accounting Pronouncement
Financial Accounting Standards Board (“FASB”) Balance Sheet (Topic 210): Disclosures about Offsetting Assets and Liabilities
In December 2011, the FASB issued Accounting Standards Update (“ASU”) No. 2011-11 (“ASU No. 2011-11”) to enhance disclosures about financial instruments and derivative instruments that are subject to offsetting (“netting”) on the Statement of Assets and Liabilities. This information will enable users of the entity’s financial statements to evaluate the effect or potential effect of netting arrangements on the entity’s financial position. ASU No. 2011-11 is effective prospectively during interim or annual periods beginning on or after January 1, 2013. At this time, management is evaluating the implications of this guidance and the impact it will have to the financial statements amounts and footnote disclosures, if any.
Annual Investment Management
Agreement Approval Process (Unaudited)
The Board of Trustees or Directors (as the case may be) (each, a “Board” and each Trustee or Director, a “Board Member”) of the Funds, including the Board Members who are not parties to the Funds’ advisory or sub-advisory agreements or “interested persons” of any such parties (the “Independent Board Members”), is responsible for approving the advisory agreements (each, an “Investment Management Agreement”) between each Fund and Nuveen Fund Advisors, Inc. (the “Advisor”) and the sub-advisory agreements (each a “Sub-Advisory Agreement”) between the Advisor and Nuveen Asset Management, LLC (the “Sub-Advisor”) (the Investment Management Agreements and the Sub-Advisory Agreements are referred to collectively as the “Advisory Agreements”) and their periodic continuation. Pursuant to the Investment Company Act of 1940, as amended (the “1940 Act”), the Board is required to consider the continuation of the Advisory Agreements on an annual basis. Accordingly, at an in-person meeting held on May 21-23, 2012 (the “May Meeting”), the Board, including a majority of the Independent Board Members, considered and approved the continuation of the Advisory Agreements for the Funds for an additional one-year period.
In preparation for its considerations at the May Meeting, the Board requested and received extensive materials prepared in connection with the review of the Advisory Agreements. The materials provided a broad range of information regarding the Funds, the Advisor and the Sub-Advisor (the Advisor and the Sub-Advisor are collectively, the “Fund Advisers” and each, a “Fund Adviser”). As described in more detail below, the information provided included, among other things, a review of Fund performance, including Fund investment performance assessments against peer groups and appropriate benchmarks, a comparison of Fund fees and expenses relative to peers, a description and assessment of shareholder service levels for the Funds, a summary of the performance of certain service providers, a review of product initiatives and shareholder communications and an analysis of the Advisor’s profitability with comparisons to comparable peers in the managed fund business. As part of its annual review, the Board also held a separate meeting on April 18-19, 2012, to review the Funds’ investment performance and consider an analysis provided by the Advisor of the Sub-Advisor which generally evaluated the Sub-Advisor’s investment team, investment mandate, organizational structure and history, investment philosophy and process, performance of the applicable Fund, and significant changes to the foregoing. As a result of its review of the materials and discussions, the Board presented the Advisor with questions and the Advisor responded.
The materials and information prepared in connection with the annual review of the Advisory Agreements supplement the information and analysis provided to the Board during the year. In this regard, throughout the year, the Board, acting directly or through its committees, regularly reviews the performance and various services provided by the Advisor and the Sub-Advisor. The Board meets at least quarterly as well as at other times as the need arises. At its quarterly meetings, the Board reviews reports by the Advisor which include, among other things, Fund performance, a review of the investment teams and reports on compliance, regulatory matters and risk management. The Board also meets with key investment personnel managing the Fund portfolios during the year. In October 2011, the Board also created two new standing committees (the Open-end Fund Committee and the Closed-end Fund Committee) to assist the full Board in monitoring and gaining a deeper insight into the distinctive issues and business practices of open-end and closed-end funds.
In addition, the Board continues its program of seeking to have the Board Members or a subset thereof visit each sub-advisor to the Nuveen funds at least once over a multiple year rotation, meeting with key investment and business personnel. In this regard, the Board visited with the Sub-Advisor’s municipal team in Minneapolis in September 2011, and with the Sub-Advisor’s municipal team in Chicago in November 2011. Further, an ad hoc committee of the Board visited the then-current transfer agents of the Nuveen funds in 2011 and the audit committee of the Board visited the various pricing agents for the Nuveen funds in January 2012. The Board considers factors and information that are relevant to its annual consideration of the renewal of the Advisory Agreements at the meetings held throughout the year. Accordingly, the Board considers the information provided and knowledge gained at these meetings when performing its annual review of the Advisory Agreements. The Independent Board Members are assisted throughout the process by independent legal counsel who provided materials describing applicable law and the duties of directors or trustees in reviewing advisory contracts and met with the Independent Board Members in executive sessions without management present. In addition, it is important to recognize that the management arrangements for the Nuveen funds are the result of many years of review and discussion between the Independent Board Members and fund management and that the Board Members’ conclusions may be based, in part, on their consideration of fee arrangements and other factors developed in previous years.
The Board considered all factors it believed relevant with respect to each Fund, including among other factors: (a) the nature, extent and quality of the services provided by the Fund Advisers, (b) the investment performance of the Fund and Fund Advisers, (c) the advisory fees and costs of the services to be provided to the Fund and the profitability of the Fund Advisers, (d) the extent of any economies of scale, (e) any benefits derived by the Fund Advisers from the relationship with the Fund and (f) other factors. Each Board Member may have accorded different weight to the various factors in reaching his or her
Annual Investment Management Agreement
Approval Process (Unaudited) (continued)
conclusions with respect to a Fund’s Advisory Agreements. The Independent Board Members did not identify any single factor as all important or controlling. The Independent Board Members’ considerations were instead based on a comprehensive consideration of all the information presented. The principal factors considered by the Board and its conclusions are described below.
A. Nature, Extent and Quality of Services
In considering renewal of the Advisory Agreements, the Independent Board Members considered the nature, extent and quality of the Fund Adviser’s services, including advisory services and the resulting Fund performance and administrative services. The Independent Board Members further considered the overall reputation and capabilities of the Advisor and its affiliates, the commitment of the Advisor to provide high quality service to the Funds, their overall confidence in the Advisor’s integrity and the Advisor’s responsiveness to questions and concerns raised by them. The Independent Board Members reviewed materials outlining, among other things, the Fund Adviser’s organization and business; the types of services that the Fund Adviser or its affiliates provide to the Funds; the performance record of the applicable Fund (as described in further detail below); and any initiatives Nuveen had taken for the applicable fund product line.
In considering advisory services, the Board recognized that the Advisor provides various oversight, administrative, compliance and other services for the Funds and the Sub-Advisor generally provides the portfolio investment management services to the Funds. In reviewing the portfolio management services provided to each Fund, the Board reviewed the materials provided by the Nuveen Investment Services Oversight Team analyzing, among other things, the Sub-Advisor’s investment team and changes thereto, organization and history, assets under management, Fund objectives and mandate, the investment team’s philosophy and strategies in managing the Fund, developments affecting the Sub-Advisor or Fund and Fund performance. The Independent Board Members also reviewed portfolio manager compensation arrangements to evaluate each Fund Adviser’s ability to attract and retain high quality investment personnel, preserve stability, and reward performance but not provide an inappropriate incentive to take undue risks. In addition, the Board considered the Advisor’s execution of its oversight responsibilities over the Sub-Advisor. Given the importance of compliance, the Independent Board Members also considered Nuveen’s compliance program, including the report of the chief compliance officer regarding the Funds’ compliance policies and procedures; the resources dedicated to compliance; and the record of compliance with the policies and procedures.
In addition to advisory services, the Board considered the quality and extent of administrative and other non-investment advisory services the Advisor and its affiliates provide to the Funds, including product management, investment services (such as oversight of investment policies and procedures, risk management, and pricing), fund
administration, oversight of service providers, shareholder services and communications, administration of Board relations, regulatory and portfolio compliance, legal support, managing leverage and promoting an orderly secondary market for common shares. The Board further recognized Nuveen’s additional investments in personnel, including in compliance and risk management.
In reviewing the services provided, the Board also reviewed materials describing various notable initiatives and projects the Advisor performed in connection with the closed-end fund product line. These initiatives included completion of the refinancing of auction rate preferred securities; efforts to eliminate product overlap with fund mergers; elimination of the insurance mandate on several funds; ongoing services to manage leverage that has become increasingly complex; continued secondary market offerings, share repurchases and other support initiatives for certain funds; and continued communications efforts with shareholders, fund analysts and financial advisers. With respect to the latter, the Independent Board Members noted Nuveen’s continued commitment to supporting the secondary market for the common shares of its closed-end funds through a comprehensive secondary market communication program designed to raise investor and analyst awareness and understanding of closed-end funds. Nuveen’s support services included, among other things: continuing communications concerning the refinancing efforts related to auction rate preferred securities; supporting and promoting munifund term preferred shares (MTP) including by launching a microsite dedicated to MTP shares; sponsoring and participating in conferences; communicating with closed-end fund analysts covering the Nuveen funds throughout the year; providing marketing and product updates for the closed-end funds; and maintaining and enhancing a closed-end fund website.
Based on their review, the Independent Board Members found that, overall, the nature, extent and quality of services provided to the respective Funds under each applicable Advisory Agreement were satisfactory.
B. The Investment Performance of the Funds and Fund Advisers
The Board, including the Independent Board Members, reviewed and considered the performance history of each Fund over various time periods. The Board reviewed, among other things, each Fund’s historic investment performance as well as information comparing the Fund’s performance information with that of other funds (the “Performance Peer Group”) based on data compiled by Nuveen that was provided by an independent provider of mutual fund data and with recognized and/or customized benchmarks (i.e., benchmarks derived from multiple recognized benchmarks).
The Board reviewed reports, including a comprehensive analysis of the Funds’ performance and the applicable investment team. In this regard, the Board reviewed each Fund’s total return information compared to its Performance Peer Group for the quarter,
Annual Investment Management Agreement
Approval Process (Unaudited) (continued)
one-, three- and five-year periods ending December 31, 2011, as well as performance information reflecting the first quarter of 2012. In addition, the Board reviewed each Fund’s total return information compared to recognized and/or customized benchmarks for the quarter, one- and three-year periods ending December 31, 2011, as well as performance information reflecting the first quarter of 2012.
The Independent Board Members also reviewed historic premium and discount levels, including a summary of actions taken to address or discuss other developments affecting the secondary market discounts of various funds. This information supplemented the fund performance information provided to the Board at each of its quarterly meetings.
In reviewing performance comparison information, the Independent Board Members recognized that the usefulness of the comparisons of the performance of certain funds with the performance of their respective Performance Peer Group may be limited because the Performance Peer Group may not adequately represent the objectives and strategies of the applicable funds or may be limited in size or number. In this regard, the Independent Board Members noted that the Performance Peer Group of each Fund was classified as having significant differences from the respective Fund based on various considerations such as special fund objectives, potential investable universe and the composition of the peer set (e.g., the number and size of competing funds and number of competing managers). The Independent Board Members also noted that the investment experience of a particular shareholder in the Nuveen funds will vary depending on when such shareholder invests in the applicable fund, the class held (if multiple classes are offered in a fund) and the performance of the fund (or respective class) during that shareholder’s investment period. In addition, although the performance below reflects the performance results for the time periods ending as of the most recent calendar year end (unless otherwise indicated), the Board also recognized that selecting a different ending time period may derive different results. Furthermore, while the Board is cognizant of the relevant performance of a fund’s peer set and/or benchmark(s), the Board evaluated fund performance in light of the respective fund’s investment objectives, investment parameters and guidelines and recognized that the objectives, investment parameters and guidelines of peers and/or benchmarks may differ to some extent, thereby resulting in differences in performance results. Nevertheless, with respect to any Nuveen funds that the Board considers to have underperformed their peers and/or benchmarks from time to time, the Board monitors such funds closely and considers any steps necessary or appropriate to address such issues.
As noted above, each Fund had significant differences from its respective Performance Peer Group. Therefore, the Independent Board Members considered the Funds’ performance compared to their benchmarks. In this regard, the Independent Board Members noted that each Fund outperformed its respective benchmark in the one- and three-year periods.
Based on their review, the Independent Board Members determined that each Fund’s investment performance had been satisfactory.
| C. | Fees, Expenses and Profitability |
| | 1. Fees and Expenses The Board evaluated the management fees and expenses of each Fund reviewing, among other things, such Fund’s gross management fees, net management fees and net expense ratios in absolute terms as well as compared to the fee and expenses of a comparable universe of funds provided by an independent fund data provider (the “Peer Universe”) and any expense limitations. The Independent Board Members further reviewed the methodology regarding the construction of the applicable Peer Universe. In reviewing the comparisons of fee and expense information, the Independent Board Members took into account that in certain instances various factors such as: the limited size and particular composition of the Peer Universe (including the inclusion of other Nuveen funds in the peer set); expense anomalies; changes in the funds comprising the Peer Universe from year to year; levels of reimbursement or fee waivers; the timing of information used; the differences in the type and use of leverage; and differences in the states reflected in the Peer Universe may impact the comparative data, thereby limiting somewhat the ability to make a meaningful comparison with peers. In reviewing the fee schedule for a Fund, the Independent Board Members also considered the fund-level and complex-wide breakpoint schedules (described in further detail below) and any fee waivers and reimbursements provided by Nuveen (applicable, in particular, for certain closed-end funds launched since 1999). In reviewing fees and expenses (excluding leverage costs and leveraged assets), the Board considered the expenses and fees to be higher if they were over 10 basis points higher, slightly higher if they were approximately 6 to 10 basis points higher, in line if they were within approximately 5 basis points higher than the peer average and below if they were below the peer average of the Peer Universe. In reviewing the reports, the Board noted that the overwhelming majority of the Nuveen funds were at, close to or below their peer set average based on the net total expense ratio. The Independent Board Members noted that the Nuveen Arizona Dividend Advantage Municipal Fund 3 had a net expense ratio that was slightly higher than its peer average, but a net management fee below its peer average, while the other Funds each had net management fees and net expense ratios (including fee waivers and expense reimbursements) below or in line with their peer averages. Based on their review of the fee and expense information provided, the Independent Board Members determined that each Fund’s management fees were reasonable in light of the nature, extent and quality of services provided to the Fund. |
Annual Investment Management Agreement
Approval Process (Unaudited) (continued)
| | 2. Comparisons with the Fees of Other Clients The Independent Board Members further reviewed information regarding the nature of services and range of fees offered by the Advisor to other clients, including municipal separately managed accounts and passively managed exchange traded funds (ETFs) sub-advised by the Advisor. In evaluating the comparisons of fees, the Independent Board Members noted that the fee rates charged to the Funds and other clients vary, among other things, because of the different services involved and the additional regulatory and compliance requirements associated with registered investment companies, such as the Funds. Accordingly, the Independent Board Members considered the differences in the product types, including, but not limited to, the services provided, the structure and operations, product distribution and costs thereof, portfolio investment policies, investor profiles, account sizes and regulatory requirements. The Independent Board Members noted, in particular, that the range of services provided to the Funds (as discussed above) is much more extensive than that provided to separately managed accounts. Given the inherent differences in the various products, particularly the extensive services provided to the Funds, the Independent Board Members believe such facts justify the different levels of fees. In considering the fees of the Sub-Advisor, the Independent Board Members also considered the pricing schedule or fees that the Sub-Advisor charges for similar investment management services for other Nuveen funds, funds of other sponsors (if any), and other clients (such as retail and/or institutional managed accounts). 3. Profitability of Fund Advisers In conjunction with its review of fees, the Independent Board Members also considered the profitability of Nuveen for its advisory activities and its financial condition. The Independent Board Members reviewed the revenues and expenses of Nuveen’s advisory activities for the last two calendar years, the allocation methodology used in preparing the profitability data and an analysis of the key drivers behind the changes in revenues and expenses that impacted profitability in 2011. The Independent Board Members noted this information supplemented the profitability information requested and received during the year to help keep them apprised of developments affecting profitability (such as changes in fee waivers and expense reimbursement commitments). In this regard, the Independent Board Members noted that they have an Independent Board Member serve as a point person to review and keep them apprised of changes to the profitability analysis and/or methodologies during the year. The Independent Board Members also considered Nuveen’s revenues for advisory activities, expenses, and profit margin compared to that of various unaffiliated management firms with comparable assets under management (based on asset size and asset composition). |
| | In reviewing profitability, the Independent Board Members recognized the Advisor’s continued investment in its business to enhance its services, including capital improvements to investment technology, updated compliance systems, and additional personnel in compliance, risk management, and product development as well as its ability to allocate resources to various areas of the Advisor as the need arises. In addition, in evaluating profitability, the Independent Board Members also recognized the subjective nature of determining profitability which may be affected by numerous factors including the allocation of expenses. Further, the Independent Board Members recognized the difficulties in making comparisons as the profitability of other advisers generally is not publicly available and the profitability information that is available for certain advisers or management firms may not be representative of the industry and may be affected by, among other things, the adviser’s particular business mix, capital costs, types of funds managed and expense allocations. Notwithstanding the foregoing, the Independent Board Members reviewed Nuveen’s methodology and assumptions for allocating expenses across product lines to determine profitability. In reviewing profitability, the Independent Board Members recognized Nuveen’s investment in its fund business. Based on their review, the Independent Board Members concluded that the Advisor’s level of profitability for its advisory activities was reasonable in light of the services provided. With respect to sub-advisers affiliated with Nuveen, including the Sub-Advisor, the Independent Board Members reviewed the sub-adviser’s revenues, expenses and profitability margins (pre- and post-tax) for its advisory activities and the methodology used for allocating expenses among the internal sub-advisers. Based on their review, the Independent Board Members were satisfied that the Sub-Advisor’s level of profitability was reasonable in light of the services provided. In evaluating the reasonableness of the compensation, the Independent Board Members also considered other amounts paid to a Fund Adviser by the Funds as well as any indirect benefits (such as soft dollar arrangements, if any) the Fund Adviser and its affiliates receive, or are expected to receive, that are directly attributable to the management of the Funds, if any. See Section E below for additional information on indirect benefits a Fund Adviser may receive as a result of its relationship with the Funds. Based on their review of the overall fee arrangements of each Fund, the Independent Board Members determined that the advisory fees and expenses of the respective Fund were reasonable. |
| | |
| D. | Economies of Scale and Whether Fee Levels Reflect These Economies of Scale |
With respect to economies of scale, the Independent Board Members have recognized the potential benefits resulting from the costs of a fund being spread over a larger asset base, although economies of scale are difficult to measure and predict with precision,
Annual Investment Management Agreement
Approval Process (Unaudited) (continued)
particularly on a fund-by-fund basis. One method to help ensure the shareholders share in these benefits is to include breakpoints in the advisory fee schedule. Generally, management fees for funds in the Nuveen complex are comprised of a fund-level component and a complex-level component, subject to certain exceptions. Accordingly, the Independent Board Members reviewed and considered the applicable fund-level breakpoints in the advisory fee schedules that reduce advisory fees as asset levels increase. Further, the Independent Board Members noted that although closed-end funds may from time-to-time make additional share offerings, the growth of their assets will occur primarily through the appreciation of such funds’ investment portfolio.
In addition to fund-level advisory fee breakpoints, the Board also considered the Funds’ complex-wide fee arrangement. Pursuant to the complex-wide fee arrangement, the fees of the funds in the Nuveen complex are generally reduced as the assets in the fund complex reach certain levels. The complex-wide fee arrangement seeks to provide the benefits of economies of scale to fund shareholders when total fund complex assets increase, even if assets of a particular fund are unchanged or have decreased. The approach reflects the notion that some of Nuveen’s costs are attributable to services provided to all its funds in the complex and therefore all funds benefit if these costs are spread over a larger asset base. In addition, with the acquisition of the funds previously advised by FAF Advisors, Inc., the Board noted that a portion of such funds’ assets at the time of acquisition were deemed eligible to be included in the complex-wide fee calculation in order to deliver fee savings to shareholders in the combined complex and such funds were subject to differing complex-level fee rates.
Based on their review, the Independent Board Members concluded that the breakpoint schedules and complex-wide fee arrangement were acceptable and reflect economies of scale to be shared with shareholders when assets under management increase.
In evaluating fees, the Independent Board Members received and considered information regarding potential “fall out” or ancillary benefits the respective Fund Adviser or its affiliates may receive as a result of its relationship with each Fund. In this regard, the Independent Board Members considered any revenues received by affiliates of the Advisor for serving as co-manager in initial public offerings of new closed-end funds as well as revenues received in connection with secondary offerings.
In addition to the above, the Independent Board Members considered whether the Fund Advisers received any benefits from soft dollar arrangements whereby a portion of the commissions paid by a Fund for brokerage may be used to acquire research that may be useful to the Fund Adviser in managing the assets of the Funds and other clients. The Independent Board Members recognized that each Fund Adviser has the authority to pay a higher commission in return for brokerage and research services if it
determines in good faith that the commission paid is reasonable in relation to the value of the brokerage and research services provided and may benefit from such soft dollar arrangements. Similarly, the Board recognized that the research received pursuant to soft dollar arrangements by a Fund Adviser may also benefit a Fund and shareholders to the extent the research enhances the ability of the Fund Adviser to manage the Fund. The Independent Board Members noted that the Fund Advisers’ profitability may be somewhat lower if they did not receive the research services pursuant to the soft dollar arrangements and had to acquire such services directly.
Based on their review, the Independent Board Members concluded that any indirect benefits received by a Fund Adviser as a result of its relationship with the Funds were reasonable and within acceptable parameters.
The Independent Board Members did not identify any single factor discussed previously as all-important or controlling. The Board Members, including the Independent Board Members, unanimously concluded that the terms of each Advisory Agreement are fair and reasonable, that the respective Fund Adviser’s fees are reasonable in light of the services provided to each Fund and that the Advisory Agreements be renewed.
Reinvest Automatically,
Easily and Conveniently
Nuveen makes reinvesting easy. A phone call is all it takes to set up your reinvestment account.
Nuveen Closed-End Funds Automatic Reinvestment Plan
Your Nuveen Closed-End Fund allows you to conveniently reinvest distributions in additional Fund shares.
By choosing to reinvest, you’ll be able to invest money regularly and automatically, and watch your investment grow through the power of compounding. Just like distributions in cash, there may be times when income or capital gains taxes may be payable on distributions that are reinvested.
It is important to note that an automatic reinvestment plan does not ensure a profit, nor does it protect you against loss in a declining market.
Easy and convenient
To make recordkeeping easy and convenient, each month you’ll receive a statement showing your total distributions, the date of investment, the shares acquired and the price per share, and the total number of shares you own.
How shares are purchased
The shares you acquire by reinvesting will either be purchased on the open market or newly issued by the Fund. If the shares are trading at or above net asset value at the time of valuation, the Fund will issue new shares at the greater of the net asset value or 95% of the then-current market price. If the shares are trading at less than net asset value, shares for your account will be purchased on the open market. If the Plan Agent begins purchasing Fund shares on the open market while shares are trading below net asset value, but the Fund’s shares subsequently trade at or above their net asset value before the Plan Agent is able to complete its purchases, the Plan Agent may cease open-market purchases and may invest the uninvested portion of the distribution in newly-issued Fund shares at a price equal to the greater of the shares’ net asset value or 95% of the shares’ market value on the last business day immediately prior to the purchase date. Distributions received to purchase shares in the open market will normally be invested shortly after the distribution payment date. No interest will be paid on distributions awaiting reinvestment. Because the market price of the shares may increase before purchases are completed, the average purchase price per share may
exceed the market price at the time of valuation, resulting in the acquisition of fewer shares than if the distribution had been paid in shares issued by the Fund. A pro rata portion of any applicable brokerage commissions on open market purchases will be paid by Plan participants. These commissions usually will be lower than those charged on individual transactions.
Flexible
You may change your distribution option or withdraw from the Plan at any time, should your needs or situation change.
You can reinvest whether your shares are registered in your name, or in the name of a brokerage firm, bank, or other nominee. Ask your investment advisor if his or her firm will participate on your behalf. Participants whose shares are registered in the name of one firm may not be able to transfer the shares to another firm and continue to participate in the Plan.
The Fund reserves the right to amend or terminate the Plan at any time. Although the Fund reserves the right to amend the Plan to include a service charge payable by the participants, there is no direct service charge to participants in the Plan at this time.
Call today to start reinvesting distributions
For more information on the Nuveen Automatic Reinvestment Plan or to enroll in or withdraw from the Plan, speak with your financial advisor or call us at (800) 257-8787.
Glossary of Terms
Used in this Report
| ■ | Auction Rate Bond: An auction rate bond is a security whose interest payments are adjusted periodically through an auction process, which process typically also serves as a means for buying and selling the bond. Auctions that fail to attract enough buyers for all the shares offered for sale are deemed to have “failed,” with current holders receiving a formula-based interest rate until the next scheduled auction. |
| | |
| ■ | Average Annual Total Return: This is a commonly used method to express an investment’s performance over a particular, usually multi-year time period. It expresses the return that would have been necessary each year to equal the investment’s actual cumulative performance (including change in NAV or market price and reinvested dividends and capital gains distributions, if any) over the time period being considered. |
| | |
| ■ | Average Effective Maturity: The market-value-weighted average of the effective maturity dates of the individual securities including cash. In the case of a bond that has been advance-refunded to a call date, the effective maturity is the date on which the bond is scheduled to be redeemed using the proceeds of an escrow account. In most other cases the effective maturity is the stated maturity date of the security. |
| | |
| ■ | Effective Leverage: Effective leverage is a Fund’s effective economic leverage, and includes both regulatory leverage (see below) and the leverage effects of certain derivative investments in the Fund’s portfolio. Currently, the leverage effects of Tender Option Bond (TOB) inverse floater holdings are included in effective leverage values, in addition to any regulatory leverage. |
| | |
| ■ | Inverse Floating Rate Securities: Inverse floating rate securities, also known as inverse floaters or tender option bonds (TOBs), are created by depositing a municipal bond, typically with a fixed interest rate, into a special purpose trust created by a broker-dealer. This trust, in turn, (a) issues floating rate certificates typically paying short-term tax-exempt interest rates to third parties in amounts equal to some fraction of the deposited bond’s par amount or market value, and (b) issues an inverse floating rate certificate (sometimes referred to as an “inverse floater”) to an investor (such as a Fund) interested in gaining investment exposure to a long-term municipal bond. The income received by the holder of the inverse floater varies inversely with the short-term rate paid to the floating rate certificates’ holders, and in most circumstances the holder of the inverse floater bears substantially all of the underlying bond’s downside investment risk. The holder of the inverse floater typically also benefits disproportionately from any potential appreciation of the underlying bond’s value. Hence, an inverse floater essentially represents an investment in the underlying bond on a leveraged basis. |
| ■ | Leverage: Using borrowed money to invest in securities or other assets, seeking to increase the return of an investment or portfolio. |
| | |
| ■ | Leverage-Adjusted Duration: Duration is a measure of the expected period over which a bond’s principal and interest will be paid, and consequently is a measure of the sensitivity of a bond’s or bond Fund’s value to changes when market interest rates change. Generally, the longer a bond’s or Fund’s duration, the more the price of the bond or Fund will change as interest rates change. Leverage-adjusted duration takes into account the leveraging process for a Fund and therefore is longer than the duration of the Fund’s portfolio of bonds. |
| | |
| ■ | Lipper Other States Municipal Debt Funds Classification Average: Calculated using the returns of all closed-end funds in this category. Lipper returns account for the effects of management fees and assume reinvestment of distributions, but do not reflect any applicable sales charges. |
| | |
| ■ | Market Yield (also known as Dividend Yield or Current Yield): An investment’s current annualized dividend divided by its current market price. |
| | |
| ■ | Net Asset Value (NAV): The net market value of all securities held in a portfolio. |
| | |
| ■ | Net Asset Value (NAV) Per Share: The market value of one share of a mutual fund or closed-end fund. For a Fund, the NAV is calculated daily by taking the Fund’s total assets (securities, cash, and accrued earnings), subtracting the Fund’s liabilities, and dividing by the number of shares outstanding. |
| | |
| ■ | Pre-Refunding: Pre-Refunding, also known as advanced refundings or refinancings, is a procedure used by state and local governments to refinance municipal bonds to lower interest expenses. The issuer sells new bonds with a lower yield and uses the proceeds to buy U.S. Treasury securities, the interest from which is used to make payments on the higher-yielding bonds. Because of this collateral, pre-refunding generally raises a bond’s credit rating and thus its value. |
| | |
| ■ | Regulatory Leverage: Regulatory leverage consists of preferred shares issued by or borrowings of a Fund. Both of these are part of a Fund’s capital structure. Regulatory leverage is sometimes referred to as “’40 Act Leverage” and is subject to asset coverage limits set in the Investment Company Act of 1940. |
| | |
| ■ | S&P Arizona and Texas Municipal Bond Indexes: An unleveraged, market value-weighted indexes designed to measure the performance of the tax-exempt, investment-grade municipal bond markets in Arizona and Texas, respectively. Index returns assume reinvestment of distributions, but do not reflect any applicable sales charges or management fees. |
| | |
| ■ | S&P Municipal Bond Index: An unleveraged, market value-weighted index designed to measure the performance of the tax-exempt, investment-grade U.S. municipal bond market. Index returns assume reinvestment of distributions, but do not reflect any applicable sales charges or management fees. |
| | |
| ■ | Taxable-Equivalent Yield: The yield necessary from a fully taxable investment to equal, on an after-tax basis, the yield of a municipal bond investment. |
Glossary of Terms
Used in this Report (continued)
| ■ | Zero Coupon Bond: A zero coupon bond does not pay a regular interest coupon to its holders during the life of the bond. Income to the holder of the bond comes from accretion of the difference between the original purchase price of the bond at issuance and the par value of the bond at maturity and is effectively paid at maturity. The market prices of zero coupon bonds generally are more volatile than the market prices of bonds that pay interest periodically. |
Notes
Notes
Additional Fund Information
Board of
Directors/Trustees
John P. Amboian
Robert P. Bremner
Jack B. Evans
William C. Hunter
David J. Kundert
William J. Schneider
Judith M. Stockdale
Carole E. Stone
Virginia L. Stringer
Terence J. Toth
Fund Manager
Nuveen Fund Advisors, Inc.
333 West Wacker Drive
Chicago, IL 60606
Custodian
State Street Bank
& Trust Company
Boston, MA
Transfer Agent and
Shareholder Services
State Street Bank &
Trust Company
Nuveen Funds
P.O. Box 43071
Providence, RI 02940-3071
(800) 257-8787
Legal Counsel
Chapman and Cutler LLP
Chicago, IL
Independent Registered
Public Accounting Firm
Ernst & Young LLP
Chicago, IL
Quarterly Portfolio of Investments and Proxy Voting Information
You may obtain (i) each Fund’s quarterly portfolio of investments, (ii) information regarding how each Fund voted proxies relating to portfolio securities held during the most recent twelve-month period ended June 30, and (iii) a description of the policies and procedures that each Fund used to determine how to vote proxies relating to portfolio securities without charge, upon request, by calling Nuveen Investments toll-free at (800) 257-8787 or on Nuveen’s website at www.nuveen.com.
You may also obtain this and other Fund information directly from the Securities and Exchange Commission (SEC). The SEC may charge a copying fee for this information. Visit the SEC on-line at http://www.sec.gov or in person at the SEC’s Public Reference Room in Washington, D.C. Call the SEC at (202) 942-8090 for room hours and operation. You may also request Fund information by sending an e-mail request to publicinfo@sec.gov or by writing to the SEC’s Public References Section at 100 F Street NE, Washington, D.C. 20549.
CEO Certification Disclosure
Each Fund’s Chief Executive Officer (CEO) has submitted to the New York Stock Exchange (NYSE) the annual CEO certification as required by Section 303A.12(a) of the NYSE Listed Company Manual.
Each Fund has filed with the SEC the certification of its Chief Executive Officer and Chief Financial Officer required by Section 302 of the Sarbanes-Oxley Act.
Common Share Information
Each Fund intends to repurchase its own common stock in the future at such times and in such amounts as is deemed advisable. During the period covered by this report, the Funds repurchased shares of their common stock as shown in the accompanying table.
| | Common Shares |
| Fund | Repurchased |
| NAZ | — |
| NFZ | — |
| NKR | — |
| NXE | — |
| NTX | — |
Any future repurchases will be reported to shareholders in the next annual or semiannual report.
Nuveen Investments:
Serving Investors for Generations
Since 1898, financial advisors and their clients have relied on Nuveen Investments to provide dependable investment solutions through continued adherence to proven, long-term investing principles. Today, we offer a range of high quality equity and fixed-income solutions designed to be integral components of a well-diversified core portfolio.
Focused on meeting investor needs.
Nuveen Investments provides high-quality investment services designed to help secure the long-term goals of institutional and individual investors as well as the consultants and financial advisors who serve them. Nuveen Investments markets a wide range of specialized investment solutions which provide investors access to capabilities of its high-quality boutique investment affiliates—Nuveen Asset Management, Symphony Asset Management, NWQ Investment Management Company, Santa Barbara Asset Management, Tradewinds Global Investors, Winslow Capital Management and Gresham Investment Management. In total, Nuveen Investments managed $212 billion as of June 30, 2012.
Find out how we can help you.
To learn more about how the products and services of Nuveen Investments may be able to help you meet your financial goals, talk to your financial advisor, or call us at (800) 257-8787. Please read the information provided carefully before you invest. Investors should consider the investment objective and policies, risk considerations, charges and expenses of any investment carefully. Where applicable, be sure to obtain a prospectus, which contains this and other relevant information. To obtain a prospectus, please contact your securities representative or Nuveen Investments, 333 W. Wacker Dr., Chicago, IL 60606. Please read the prospectus carefully before you invest or send money.
Learn more about Nuveen Funds at: www.nuveen.com/cef
Distributed by
Nuveen Securities, LLC
333 West Wacker Drive
Chicago, IL 60606
www.nuveen.com/cef
ESA-D-0812D
ITEM 2. CODE OF ETHICS.
Not applicable to this filing.
ITEM 3. AUDIT COMMITTEE FINANCIAL EXPERT.
Not applicable to this filing.
ITEM 4. PRINCIPAL ACCOUNTANT FEES AND SERVICES.
Not applicable to this filing.
ITEM 5. AUDIT COMMITTEE OF LISTED REGISTRANTS.
Not applicable to this filing.
ITEM 6. SCHEDULE OF INVESTMENTS.
(a) See Portfolio of Investments in Item 1.
(b) Not applicable.
ITEM 7. DISCLOSURE OF PROXY VOTING POLICIES AND PROCEDURES FOR CLOSED-END MANAGEMENT INVESTMENT COMPANIES.
Not applicable to this filing.
ITEM 8. PORTFOLIO MANAGERS OF CLOSED-END MANAGEMENT INVESTMENT COMPANIES.
Not applicable to this filing.
ITEM 9. PURCHASES OF EQUITY SECURITIES BY CLOSED-END MANAGEMENT INVESTMENT COMPANY AND AFFILIATED PURCHASERS.
Not applicable.
ITEM 10. SUBMISSION OF MATTERS TO A VOTE OF SECURITY HOLDERS.
There have been no material changes to the procedures by which shareholders may recommend nominees to the registrant's Board implemented after the registrant last provided disclosure in response to this Item.
ITEM 11. CONTROLS AND PROCEDURES.
ITEM 12. EXHIBITS.
File the exhibits listed below as part of this Form.
Pursuant to the requirements of the Securities Exchange Act of 1934 and the Investment Company Act of 1940, the registrant has duly caused this report to be signed on its behalf by the undersigned, thereunto duly authorized.
Kevin J. McCarthy
Pursuant to the requirements of the Securities Exchange Act of 1934 and the Investment Company Act of 1940, this report has been signed below by the following persons on behalf of the registrant and in the capacities and on the dates indicated.
Gifford R. Zimmerman
Stephen D. Foy