UNITED STATES
SECURITIES AND EXCHANGE COMMISSION
Washington, D.C. 20549
FORM N-CSR
CERTIFIED SHAREHOLDER REPORT OF REGISTERED
MANAGEMENT INVESTMENT COMPANIES
Investment Company Act file number 811-07278
Nuveen Arizona Premium Income Municipal Fund
(Exact name of registrant as specified in charter)
Nuveen Investments
333 West Wacker Drive
Chicago, IL 60606
(Address of principal executive offices) (Zip code)
Kevin J. McCarthy
Nuveen Investments
333 West Wacker Drive
Chicago, IL 60606
(Name and address of agent for service)
Registrant's telephone number, including area code: (312) 917-7700
Date of fiscal year end: February 28
Date of reporting period: August 31, 2015
Form N-CSR is to be used by management investment companies to file reports with the Commission not later than 10 days after the transmission to stockholders of any report that is required to be transmitted to stockholders under Rule 30e-1 under the Investment Company Act of 1940 (17 CFR 270.30e-1). The Commission may use the information provided on Form N-CSR in its regulatory, disclosure review, inspection, and policymaking roles.
A registrant is required to disclose the information specified by Form N-CSR, and the Commission will make this information public. A registrant is not required to respond to the collection of information contained in Form N-CSR unless the Form displays a currently valid Office of Management and Budget ("OMB") control number. Please direct comments concerning the accuracy of the information collection burden estimate and any suggestions for reducing the burden to Secretary, Securities and Exchange Commission, 450 Fifth Street, NW, Washington, DC 20549-0609. The OMB has reviewed this collection of information under the clearance requirements of 44 U.S.C. ss. 3507.
ITEM 1. REPORTS TO STOCKHOLDERS.
Life is Complex
Nuveen makes things e-simple.
It only takes a minute to sign up for e-Reports. Once enrolled, you'll receive an e-mail as soon as your Nuveen Investments Fund information is ready—no more waiting for delivery by regular mail. Just click on the link within the e-mail to see the report and save it on your computer if you wish.
Free e-Reports right to your e-mail!
www.investordelivery.com
If you receive your Nuveen Fund dividends and statements from your financial advisor or brokerage account.
or
www.nuveen.com/accountaccess
If you receive your Nuveen Fund dividends and statements directly from Nuveen.
Table of Contents
| Chairman's Letter to Shareholders | 4 |
| | |
| Portfolio Managers' Comments | 5 |
| | |
| Fund Leverage | 8 |
| | |
| Common Share Information | 10 |
| | |
| Risk Considerations | 12 |
| | |
| Performance Overview and Holding Summaries | 13 |
| | |
| Portfolios of Investments | 17 |
| | |
| Statement of Assets and Liabilities | 46 |
| | |
| Statement of Operations | 47 |
| | |
| Statement of Changes in Net Assets | 48 |
| | |
| Statement of Cash Flows | 50 |
| | |
| Financial Highlights | 52 |
| | |
| Notes to Financial Statements | 58 |
| | |
| Additional Fund Information | 71 |
| | |
| Glossary of Terms Used in this Report | 72 |
| | |
| Reinvest Automatically, Easily and Conveniently | 74 |
| | |
| Annual Investment Management Agreement Approval Process | 75 |
Chairman's Letter to Shareholders
Dear Shareholders,
For better or for worse, the financial markets have spent the past year waiting for the U.S. Federal Reserve (Fed) to end its accommodative monetary policy. The policy has propped up stock and bond markets since the Great Recession, but the question remains: how will markets behave without its influence? This uncertainty has been a considerable source of volatility for stock and bond prices lately, despite the Fed carefully conveying its intention to raise rates slowly and only when the economy shows evidence of readiness.
There may be at least one rate hike before the end of 2015. After all, the U.S. has reached "full employment" by the Fed's standards and growth has resumed – albeit unevenly. But the picture remains somewhat uncertain. Inflation has remained stubbornly low, most recently weighed down by an unexpectedly sharp decline in commodity prices since mid-2014. With the Fed poised to tighten and foreign central banks easing, the U.S. dollar has surged against other currencies, which has weighed on corporate earnings and further contributed to commodity price weakness. U.S. consumers have benefited from an improved labor market and lower prices at the gas pump, but the overall pace of economic expansion has been lackluster.
Nevertheless, the global recovery continues to be led by the United States. Policy makers around the world are deploying their available tools to try to bolster Europe and Japan's fragile growth, and manage China's slowdown. Contagion fears ebb and flow with the headlines about Greece and China. Greece reluctantly agreed to a third bailout package from the European Union in July and China's central bank and government intervened aggressively to try to stem the sell-off in stock prices. But persistent structural problems in these economies will continue to garner market attention.
Wall Street is fond of saying "markets don't like uncertainty," and asset prices are likely to continue to churn in the current macro environment. In times like these, you can look to a professional investment manager with the experience and discipline to maintain the proper perspective on short-term events. And if the daily headlines do concern you, I encourage you to reach out to your financial advisor. Your financial advisor can help you evaluate your investment strategies in light of current events, your time horizon and risk tolerance. On behalf of the other members of the Nuveen Fund Board, we look forward to continuing to earn your trust in the months and years ahead.
Sincerely,
William J. Schneider
Chairman of the Board
October 26, 2015
Portfolio Managers' Comments
Nuveen Arizona Premium Income Municipal Fund (NAZ)
Nuveen Michigan Quality Income Municipal Fund (NUM)
Nuveen Ohio Quality Income Municipal Fund (NUO)
Nuveen Texas Quality Income Municipal Fund (NTX)
These Funds feature portfolio management by Nuveen Asset Management, LLC, an affiliate of Nuveen Investments, Inc. Portfolio managers Michael S. Hamilton and Daniel J. Close, CFA, review key investment strategies and the six-month performance of these four Nuveen Funds. Michael assumed portfolio management responsibility for NAZ in 2011, while Dan has managed NUM, NUO and NTX since 2007.
What key strategies were used to manage these Funds during the six-month reporting period ended August 31, 2015?
Despite the municipal bond market's considerable price gyrations during the six months, yields ended the reporting period nearly where they started. The U.S. Federal Reserve (Fed) kept the target fed funds rate near zero throughout this reporting period, anchoring rates on the short end of the yield curve and keeping the yield curve steep. In general, the four states' municipal bond markets outpaced the overall municipal market return for the reporting period. In this environment, we continued to take a bottom-up approach to discovering sectors that appeared undervalued as well as individual credits that had the potential to perform well over the long term.
Municipal supply nationally, as well as in Texas, improved during this six-month reporting period over that of the previous six months. However, for the same time period, Arizona and Ohio saw falling supply, while Michigan's issuance was relatively flat. That being said, all four states saw rising issuance throughout the extended twelve-month period versus the previous year's supply, which was consistent with the national trend. Much of this increase was attributable to refunding activity, as bond issuers, prompted by low interest rates, sought to lower debt service costs by retiring older bonds from the proceeds of lower cost new bond issues. While some of this activity continued to be current refundings (in which the refunded bond matures or is redeemed within 90 days and therefore has no net effect on supply), we saw an uptick in advance refundings (in which the refunded bond remains outstanding up to several more years). The increase in advance refundings contributed to greater supply in the marketplace, broadly speaking.
Much of our investment activity focus was on reinvesting the cash generated by current calls into bonds with intermediate and longer maturities that could help us maintain investment performance potential, as well as keep the Funds fully invested.
NAZ continued to focus on maintaining a bias toward longer and intermediate duration bonds while staying diversified, as well as actively seeking to minimize call risk. Purchases were mainly in the 20-to 30-year duration range and included some charter schools and newly issued bonds for Lake Havasu City Water Systems. In addition, as our purchases of longer-dated Arizona bonds brought NAZ nearer to its duration target, we bought Virgin Islands Gross Receipts credits. These territory bonds offered attractive yields with shorter durations than the Arizona bonds we bought, while maintaining tax exempt status in Arizona.
Certain statements in this report are forward-looking statements. Discussions of specific investments are for illustration only and are not intended as recommendations of individual investments. The forward-looking statements and other views expressed herein are those of the portfolio managers as of the date of this report. Actual future results or occurrences may differ significantly from those anticipated in any forward-looking statements, and the views expressed herein are subject to change at any time, due to numerous market and other factors. The Funds disclaim any obligation to update publicly or revise any forward-looking statements or views expressed herein.Ratings shown are the highest rating given by one of the following national rating agencies: Standard & Poor's (S&P), Moody's Investors Service, Inc. (Moody's) or Fitch, Inc. (Fitch). Credit ratings are subject to change. AAA, AA, A and BBB are investment grade ratings; BB, B, CCC, CC, C and D are below investment grade ratings. Certain bonds backed by U.S. Government or agency securities are regarded as having an implied rating equal to the rating of such securities. Holdings designated N/R are not rated by these national rating agencies.
Bond insurance guarantees only the payment of principal and interest on the bond when due, and not the value of the bonds themselves, which will fluctuate with the bond market and the financial success of the issuer and the insurer. Insurance relates specifically to the bonds in the portfolio and not to the share prices of a Fund. No representation is made as to the insurers' ability to meet their commitments.
Refer to the Glossary of Terms Used in this Report for further definition of the terms used within this section.
Portfolio Managers' Comments (continued)
NUM, NUO and NTX also continued to focus on buying a mix of intermediate and longer-term credits, seeking opportunities in both the new issue and secondary markets. In Michigan, trading was fairly active over this reporting period. We continued to try to diversify away from exposure to the City of Detroit and Wayne County, as well as reinvest call proceeds. We added a Holland Electrical Revenue credit, two dedicated tax bonds (Michigan State Transportation and Detroit Conventions, which despite its name is backed by various taxes levied at the state level), two local general obligation (GO) bonds, two health care issues and one state appropriation credit. Overall trading activity in the Ohio and Texas Funds was lighter by comparison. In April, NUO participated in a new, BBB rated bond issued for the Portsmouth Bypass project, a 16-mile highway in Southern Ohio. We also bought an Ohio turnpike credit, two dedicated tax bonds in Cleveland, a land-secured credit (known as a "dirt bond") and two higher education bonds. NTX continued to seek bonds to improve diversification, including a local school district, two electric utilities, a health care, an airport, a water and sewer, and two dedicated tax bonds.
Cash for new purchases was generated primarily by proceeds from called and matured bonds, which we worked to redeploy to keep the Funds fully invested and support their income streams. As previously mentioned, we saw heightened refunding activity during the reporting period, most notably in NAZ, NUM and NTX, which provided ample cash for purchases. In NAZ, we also sold a bond nearing its maturity to fund the purchase of more attractively valued issues. NUM continued to diversify its exposure away from the City of Detroit and Wayne County, Michigan, by reducing exposure in the Wayne Charter County Airport Hotel bonds. In the Ohio Fund, most of the selling during this reporting period occurred in April, to help fund the Portsmouth Bypass purchase.
In addition, we unwound a portfolio hedge in NUM, NUO and NTX that was managed with a credit default swap on the debt obligations of the U.S. territory of Puerto Rico. During the reporting period, these swaps had a negligible impact on performance.
As of August 31, 2015, all four of these Funds continued to use inverse floating rate securities. We employ inverse floaters for a variety of reasons, including duration management, income enhancement and total return enhancement.
How did the Funds perform for the six-month reporting period ended August 31, 2015?
The tables in each Fund's Performance Overview and Holding Summaries section of this report provide the Funds' total returns for the Funds for the six-month, one-year, five-year and ten-year periods ended August 31, 2015. Each Fund's returns on common share net asset value (NAV) are compared with the performance of corresponding market index and Lipper classification average.
For the six months ended August 31, 2015, the total returns on common share NAV for all four Funds underperformed the returns for their respective state's S&P Municipal Bond Index, and NAZ and NTX underperformed the national S&P Municipal Bond Index, while NUM and NUO outperformed the national index. For the same period, NAZ, NUO and NTX underperformed the average return for the Lipper Other States Municipal Debt Funds Classification, while NUM outperformed this Lipper average. Shareholders should note that the performance of the Lipper Other States classification represents the overall average of returns for funds from ten states with a wide variety of municipal market conditions, making direct comparisons less meaningful.
Key management factors that influenced the Funds' returns during this reporting period included duration and yield curve positioning, credit exposure, sector allocation and individual credit selection. The use of leverage also was an important factor affecting the Funds' performance. Leverage is discussed in more detail later in this report.
The municipal market's price volatility over this reporting period resulted in some differences in the impact of duration and yield curve positioning on the four Funds' performance. For NAZ, an underweight to bonds dated 2 to 3.99 years was detrimental, as this segment of the yield curve outperformed in the Arizona market. However, the relative loss was offset by a beneficial overweight to bonds with 10-to 11.99-year durations, a segment which performed well in Arizona. Overall, duration and yield curve positioning had a slightly positive effect on NAZ's results for this reporting period. NUM also saw a modest gain from its duration allocations, largely driven by an underweight in the shortest-dated (zero to two years) category, a group that underperformed in Michigan's municipal market. NUO benefited from both an overweight in 10-to 12-year bonds, the second best-performing duration category in Ohio, and an underweight in shorter-dated credits, which generally underperformed. However, for the Texas Fund, duration and yield curve positioning detracted somewhat from performance. NTX's underweight in 12-to 14-year durations was disadvantageous, as this segment led performance in the Texas market.
Similar to the duration categories, the performance of ratings categories didn't follow a consistent trend across the four States' municipal markets. In Arizona, two bonds were largely responsible for the overall negative impact of ratings allocations on NAZ's performance. The first was an Industrial Development Authority of the City of Phoenix bond issued for Brighter Choice Charter Schools for two charter schools, which was downgraded to a CCC rating when the school system's charter was not renewed and the schools shuttered in June 2015. The other loss was in A rated Salt Verde prepaid gas bonds maturing in 2037. Prepaid gas bonds allow municipalities to buy natural gas from a supplier at a set price for delivery over a predetermined period of time, usually 20 to 30 years. These types of bonds tend to be traded among institutional, rather than retail investors, but their non-callable, long duration structures were considered less attractive in the current market environment. Although A rated bonds generally performed well in the national municipal market, the Salt Verde holdings lagged because they fell out of favor with institutional investors. Ratings allocations detracted from NUM's performance as well, mainly due to an underweight in BBB rated bonds, a group which outperformed the Michigan market. The Ohio Fund was hurt by overweight allocations to AA and AAA rated paper, which trailed the Ohio market overall, and an underweight position in B rated credits, which were among the better-performing segments in the state. In contrast, NTX's ratings allocation contributed positively to performance. Specifically, NTX's overweight to below investment grade bonds was most helpful.
On a sector basis, the four Funds benefited modestly from their positioning. In the Arizona Fund, the tax-supported sector, especially NAZ's overweight in incremental tax bonds such as "dirt bonds", was bolstered by the improving real estate market. NAZ's performance was also aided by the pre-refunded sector. As discussed throughout this report, conditions have been favorable for refunding activity and the State of Arizona experienced a robust period of debt refinancings. For example, as part of Banner Health Systems' acquisition of the University of Arizona Health Network, the debt was refinanced and the bond price appreciated meaningfully during this reporting period. NAZ captured this gain, as well as the increase in credit quality, as the bond was escrowed in U.S. government bonds. NAZ's underweight to the utilities sector, a group which lagged the broader Arizona market, was also advantageous during this reporting period. However, NAZ's relative gain was somewhat dampened by the "other utilities" sector (entirely due to the position in Salt Verde prepaid gas bonds discussed earlier in this section) and the industrial development revenue/pollution control revenue (IDR/PCR) sector, driven by a holding in Yuma County Industrial Development Authority (IDA) Far West Water and Sewer bonds. The Yuma IDA bond has struggled amid the utility's difficulties implementing a rate increase on its customers.
For NUM, an underweight to the health care sector dampened results but the loss was more than offset by stronger performance from local Michigan GO bonds. NUO benefited from its overweight allocations to both the dedicated tax and health care sectors, as these sectors performed well during the reporting period. Positive contributions in the Texas Fund were led by its exposure to the health care sector. Individual credit selection also supported performance in NUM, NUO and NTX, mainly due to the Funds' tender option bonds.
An Update Involving Puerto Rico
As noted in the previous Shareholder Fund Report, we continue to monitor situations in the broader municipal market for any impact on the Funds' holdings and performance: the ongoing economic problems of Puerto Rico is one such case. Puerto Rico's continued economic weakening, escalating debt service obligations, and long-standing inability to deliver a balanced budget led to multiple downgrades on its debt over the past two years. Puerto Rico has warned investors since 2014 that the island's debt burden debt may be unsustainable and the Commonwealth has been exploring various strategies to deal with this burden, including Chapter 9 bankruptcy.
In terms of Puerto Rico holdings, shareholders should note that NUM, NUO and NTX had sold out of their exposures to Puerto Rico debt prior to this reporting period, while NAZ had an allocation of approximately 0.4% throughout the reporting period. The Puerto Rico credits offered higher yields, added diversification and triple exemption (i.e., exemption from most federal, state and local taxes). However, Puerto Rico's continued economic weakening, escalating debt service obligations, and long-standing inability to deliver a balanced budget led to multiple downgrades on its debt over the past two years. Puerto Rico general obligation debt currently is rated Caa2/CC/CC (below investment grade) by Moody's, S&P and Fitch, respectively, with negative outlooks.
The Nuveen complex's entire exposure to obligations of the government of Puerto Rico and other Puerto Rico issuers totaled 0.27% of assets under management as of August 31, 2015. As of August 31, 2015, Nuveen's limited exposure to Puerto Rico generally was invested in bonds that were insured, pre-refunded (and therefore backed by securities such as U.S. Treasuries), or tobacco settlement bonds. Overall, the small size of our exposures meant that our Puerto Rico holdings had a negligible impact on performance.
Fund Leverage
IMPACT OF THE FUNDS' LEVERAGE STRATEGY ON PERFORMANCE
One important factor impacting the returns of the Funds relative to their comparative benchmarks was the Funds' use of leverage through their issuance of preferred shares and/or investments in inverse floating rate securities, which represent leveraged investments in underlying bonds. The Funds use leverage because our research has shown that, over time, leveraging provides opportunities for additional income, particularly in the recent market environment where short-term market rates are at or near historical lows, meaning that the short-term rates the Fund has been paying on its leveraging instruments have been much lower than the interest the Fund has been earning on its portfolio of long-term bonds that it has bought with the proceeds of that leverage. However, use of leverage also can expose the Fund to additional price volatility. When a Fund uses leverage, the Fund will experience a greater increase in its net asset value if the municipal bonds acquired through the use of leverage increase in value, but it will also experience a correspondingly larger decline in its net asset value if the bonds acquired through leverage decline in value, which will make the Fund's net asset value more volatile, and its total return performance more variable over time. In addition, income in levered funds will typically decrease in comparison to unlevered funds when short-term interest rates increase and increase when short-term interest rates decrease. Leverage had a positive impact on the performance of the Funds over this reporting period.
As of August 31, 2015, the Funds' percentages of leverage are shown in the accompanying table.
| | NAZ | NUM | NUO | NTX |
| Effective Leverage* | 36.16% | 35.00% | 35.68% | 32.04% |
| Regulatory Leverage* | 31.80% | 32.97% | 32.41% | 31.84% |
| * | Effective leverage is a Fund's effective economic leverage, and includes both regulatory leverage and the leverage effects of certain derivative and other investments in a Fund's portfolio that increase the Fund's investment exposure. Currently, the leverage effects of Tender Option Bond (TOB) inverse floater holdings are included in effective leverage values, in addition to any regulatory leverage. Regulatory leverage consists of preferred shares issued or borrowings of a Fund. Both of these are part of a Fund's capital structure. Regulatory leverage is subject to asset coverage limits set forth in the Investment Company Act of 1940. |
THE FUNDS' REGULATORY LEVERAGE
As of August 31, 2015, the Funds have issued and outstanding Institutional MuniFund Term Preferred (iMTP) Shares, Variable Rate MuniFund Term Preferred (VMTP) Shares and/or Variable Rate Demand Preferred (VRDP) Shares as shown in the accompanying table.
| | | | iMTP Shares | | | VMTP Shares | | | VRDP Shares | |
| | | | | | | Shares Issued | | | | | | Shares Issued | | | | | | Shares Issued | |
| | | | Series | | | at Liquidation Value | | | Series | | | at Liquidation Value | | | Series | | | at Liquidation Value | |
| NAZ | | | — | | $ | — | | | 2016 | | $ | 79,000,000 | | | — | | $ | — | |
| NUM | | | — | | $ | — | | | 2016 | | $ | 159,000,000 | | | — | | $ | — | |
| NUO | | | — | | $ | — | | | — | | $ | — | | | 1 | | $ | 148,000,000 | |
| NTX | | | 2018 | | $ | 72,000,000 | | | — | | $ | — | | | — | | $ | — | |
During the current reporting period, NTX refinanced all of its outstanding MuniFund Term Preferred (MTP) Shares with the proceeds from newly issued iMTP Shares.
Refer to Notes to Financial Statements, Note 4 – Fund Shares, Preferred Shares for further details on iMTP, MTP, VMTP and VRDP Shares and each Funds' respective transactions.
Common Share Information
COMMON SHARE DISTRIBUTION INFORMATION
The following information regarding the Funds' distributions is current as of August 31, 2015. Each Fund's distribution levels may vary over time based on each Fund's investment activities and portfolio investment value changes.
During the current reporting period, each Fund's distributions to common shareholders were as shown in the accompanying table.
| | | Per Common Share Amounts | |
| Ex-Dividend Date | | | NAZ | | | NUM | | | NUO | | | NTX | |
| March 2015 | | $ | 0.0665 | | $ | 0.0675 | | $ | 0.0700 | | $ | 0.0545 | |
| April | | | 0.0665 | | | 0.0675 | | | 0.0700 | | | 0.0545 | |
| May | | | 0.0665 | | | 0.0675 | | | 0.0700 | | | 0.0545 | |
| June | | | 0.0665 | | | 0.0640 | | | 0.0700 | | | 0.0545 | |
| July | | | 0.0665 | | | 0.0640 | | | 0.0700 | | | 0.0545 | |
| August 2015 | | | 0.0665 | | | 0.0640 | | | 0.0700 | | | 0.0545 | |
| | | | | | | | | | | | | | |
| Market Yield* | | | 5.42% | | | 5.81% | | | 5.81% | | | 4.85% | |
| Taxable-Equivalent Yield* | | | 7.89% | | | 8.43% | | | 8.52% | | | 6.74% | |
| * | Market Yield is based on the Fund's current annualized monthly distribution divided by the Fund's current market price as of the end of the reporting period. Taxable-Equivalent Yield represents the yield that must be earned on a fully taxable investment in order to equal the yield of the Fund on an after-tax basis. It is based on a combined federal and state income tax rate of 31.3%, 31.1% and 31.8% for the Arizona, Michigan and Ohio Funds, respectively. The Texas Fund is based on a federal income tax rate of 28.0%. When comparing a Fund to investments that generate qualified dividend income, the Taxable-Equivalent Yield is lower. |
Each Fund in this report seeks to pay regular monthly dividends out of its net investment income at a rate that reflects its past and projected net income performance. To permit each Fund to maintain a more stable monthly dividend, the Fund may pay dividends at a rate that may be more or less than the amount of net income actually earned by the Fund during the period. If a Fund has cumulatively earned more than it has paid in dividends, it will hold the excess in reserve as undistributed net investment income (UNII) as part of the Fund's net asset value. Conversely, if a Fund has cumulatively paid in dividends more than it has earned, the excess will constitute a negative UNII that will likewise be reflected in the Fund's net asset value. Each Fund will, over time, pay all its net investment income as dividends to shareholders.
As of August 31, 2015, all of the Funds had positive UNII balances, based upon our best estimate, for tax purposes. NAZ, NUM and NUO had a positive UNII balance while NTX had a negative UNII balance for financial reporting purposes.
All monthly dividends paid by the Funds during the current reporting period, were paid from net investment income. If a portion of the Fund's monthly distributions was sourced from or comprised of elements other than net investment income, including capital gains and/or a return of capital, shareholders would have received a notice to that effect. For financial reporting purposes, the composition and per share amounts of each Fund's dividends for the reporting period are presented in this report's Statement of Changes in Net Assets and Financial Highlights, respectively. For income tax purposes, distribution information for each Fund as of its most recent tax year end is presented in Note 6 – Income Tax Information within the Notes to Financial Statements of this report.
COMMON SHARE REPURCHASES
During August 2015, the Funds' Board of Trustees reauthorized an open-market share repurchase program, allowing each Fund to repurchase an aggregate of up to approximately 10% of its outstanding shares.
As of August 31, 2015, and since the inception of the Funds' repurchase programs, the Funds have cumulatively repurchased and retired common shares as shown in the accompanying table.
| | NAZ | NUM | NUO | NTX |
| Common Shares Cumulatively Repurchased and Retired | — | 190,000 | — | — |
| Common Shares Authorized for Repurchase | 1,155,000 | 2,085,000 | 1,850,000 | 1,005,000 |
During the current reporting period, the following Fund repurchased and retired its common shares at a weighted average price per common share and a weighted average discount per common share as shown in the accompanying table.
| | | | NUM | |
| Common shares repurchased and retired | | | 5,000 | |
| Weighted average price per common share repurchased and retired | | $ | 13.11 | |
| Weighted average discount per common share repurchased and retired | | | 15.20 | % |
OTHER COMMON SHARE INFORMATION
As of August 31, 2015, and during the current reporting period, the Funds' common share prices were trading at a premium/ (discount) to their common share NAVs as shown in the accompanying table.
| | | | NAZ | | | NUM | | | NUO | | | NTX | |
| Common share NAV | | $ | 14.65 | | $ | 15.52 | | $ | 16.66 | | $ | 15.37 | |
| Common share price | | $ | 14.73 | | $ | 13.21 | | $ | 14.47 | | $ | 13.48 | |
| Premium/(Discount) to NAV | | | 0.55 | % | | (14.88 | )% | | (13.15 | )% | | (12.30 | )% |
| 6-month average premium/(discount) to NAV | | | (0.78 | )% | | (13.12 | )% | | (11.78 | )% | | (9.57 | )% |
Risk Considerations
Fund Shares are not guaranteed or endorsed by any bank or other insured depository institution, and are not federally insured by the Federal Deposit Insurance Corporation.
Nuveen Arizona Premium Income Municipal Fund (NAZ)
Nuveen Michigan Quality Income Municipal Fund (NUM)
Nuveen Ohio Quality Income Municipal Fund (NUO)
Nuveen Texas Quality Income Municipal Fund (NTX)
Investing in closed-end funds involves risk; principal loss is possible. There is no guarantee the Fund's investment objectives will be achieved. Closed-end fund shares may frequently trade at a discount or premium to their net asset value. Debt or fixed income securities such as those held by the Fund, are subject to market risk, credit risk, interest rate risk, derivatives risk, liquidity risk, and income risk. As interest rates rise, bond prices fall. Leverage increases return volatility and magnifies the Fund's potential return and its risks; there is no guarantee a fund's leverage strategy will be successful. State concentration makes the Fund more susceptible to local adverse economic, political, or regulatory changes affecting municipal bond issuers. These and other risk considerations such as inverse floater risk and tax risk are described in more detail on the Fund's web page at www.nuveen.com/NAZ, www.nuveen.com/NUM, www.nuveen.com/NUO, www.nuveen.com/NTX.
| NAZ | |
| | Nuveen Arizona Premium Income Municipal Fund |
| | Performance Overview and Holding Summaries as of August 31, 2015 |
Refer to the Glossary of Terms Used in this Report for further definition of the terms used within this section.
Average Annual Total Returns as of August 31, 2015
| | | | Cumulative | | Average Annual |
| | | | 6-Month | | 1-Year | | 5-Year | | 10-Year |
| NAZ at Common Share NAV | | | 0.20% | | 4.58% | | 5.84% | | 5.15% |
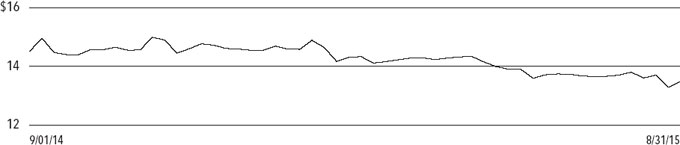
| NAZ at Common Share Price | | | 5.33% | | 13.53% | | 7.29% | | 4.98% |
| S&P Municipal Bond Arizona Index | | | 0.52% | | 2.65% | | 4.25% | | 4.65% |
| S&P Municipal Bond Index | | | 0.21% | | 2.38% | | 4.11% | | 4.44% |
| Lipper Other States Municipal Debt Funds Classification Average | | 0.45% | | 4.28% | | 5.57% | | 5.07% |
Past performance is not predictive of future results. Current performance may be higher or lower than the data shown. Returns do not reflect the deduction of taxes that shareholders may have to pay on Fund distributions or upon the sale of Fund shares. Returns at NAV are net of Fund expenses, and assume reinvestment of distributions. Comparative index and Lipper return information is provided for the Fund's shares at NAV only. Indexes and Lipper averages are not available for direct investment.
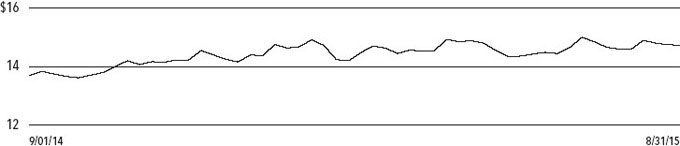
Common Share Price Performance — Weekly Closing Price
This data relates to the securities held in the Fund's portfolio of investments as of the end of the reporting period. It should not be construed as a measure of performance for the Fund itself. Holdings are subject to change.
Ratings shown are the highest rating given by one of the following national rating agencies: Standard & Poor's Group, Moody's Investors Service, Inc. or Fitch, Inc. Credit ratings are subject to change. AAA, AA, A and BBB are investment grade ratings; BB, B, CCC, CC, C and D are below-investment grade ratings. Certain bonds backed by U.S. Government or agency securities are regarded as having an implied rating equal to the rating of such securities. Holdings designated N/R are not rated by these national rating agencies.
| Fund Allocation | |
| (% of net assets) | |
| Long-Term Municipal Bonds | 146.8% |
| Other Assets Less Liabilities | 1.5% |
| Net Assets Plus Floating Rate Obligations & VMTP Shares, at Liquidation Value | 148.3% |
| Floating Rate Obligations | (1.6)% |
| VMTP Shares, at Liquidation Value | (46.7)% |
| Net Assets | 100% |
| Portfolio Composition | |
| (% of total investments) | |
| Tax Obligation/Limited | 26.0% |
| Education and Civic Organizations | 15.3% |
| Health Care | 14.8% |
| Utilities | 12.1% |
| U.S. Guaranteed | 11.2% |
| Tax Obligation/General | 10.0% |
| Water and Sewer | 7.7% |
| Other | 2.9% |
| Total | 100% |
| Credit Quality | |
| (% of total investment exposure) | |
| AAA/U.S. Guaranteed | 20.8% |
| AA | 39.6% |
| A | 25.5% |
| BBB | 5.8% |
| BB or Lower | 2.4% |
| N/R (not rated) | 5.9% |
| Total | 100% |
| NUM | |
| | Nuveen Michigan Quality Income Municipal Fund |
| | Performance Overview and Holding Summaries as of August 31, 2015 |
Refer to the Glossary of Terms Used in this Report for further definition of the terms used within this section.
Average Annual Total Returns as of August 31, 2015
| | | | Cumulative | | Average Annual |
| | | | 6-Month | | 1-Year | | 5-Year | | 10-Year |
| NUM at Common Share NAV | | | 0.75% | | 4.61% | | 5.79% | | 5.25% |
| NUM at Common Share Price | | | (1.80)% | | (0.42)% | | 4.18% | | 4.26% |
| S&P Municipal Bond Michigan Index | | | 0.77% | | 3.48% | | 4.67% | | 4.60% |
| S&P Municipal Bond Index | | | 0.21% | | 2.38% | | 4.11% | | 4.44% |
| Lipper Other States Municipal Debt Funds Classification Average | | | 0.45% | | 4.28% | | 5.57% | | 5.07% |
Past performance is not predictive of future results. Current performance may be higher or lower than the data shown. Returns do not reflect the deduction of taxes that shareholders may have to pay on Fund distributions or upon the sale of Fund shares. Returns at NAV are net of Fund expenses, and assume reinvestment of distributions. Comparative index and Lipper return information is provided for the Fund's shares at NAV only. Indexes and Lipper averages are not available for direct investment.
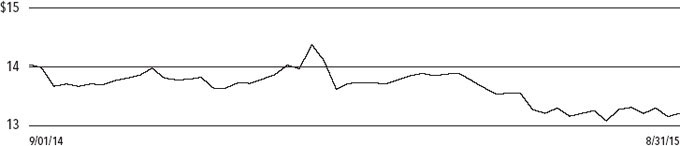
Common Share Price Performance — Weekly Closing Price
This data relates to the securities held in the Fund's portfolio of investments as of the end of the reporting period. It should not be construed as a measure of performance for the Fund itself. Holdings are subject to change.
Ratings shown are the highest rating given by one of the following national rating agencies: Standard & Poor's Group, Moody's Investors Service, Inc. or Fitch, Inc. Credit ratings are subject to change. AAA, AA, A and BBB are investment grade ratings; BB, B, CCC, CC, C and D are below-investment grade ratings. Certain bonds backed by U.S. Government or agency securities are regarded as having an implied rating equal to the rating of such securities. Holdings designated N/R are not rated by these national rating agencies.
| Fund Allocation | |
| (% of net assets) | |
| Long-Term Municipal Bonds | 148.3% |
| Other Assets Less Liabilities | 3.0% |
| Net Assets Plus Floating Rate Obligations & VMTP Shares, at Liquidation Value | 151.3% |
| Floating Rate Obligations | (2.1)% |
| VMTP Shares, at Liquidation Value | (49.2)% |
| Net Assets | 100% |
| Portfolio Composition | |
| (% of total investments) | |
| Tax Obligation/General | 24.9% |
| Health Care | 15.6% |
| Tax Obligation/Limited | 13.3% |
| Water and Sewer | 10.8% |
| Education and Civic Organizations | 10.2% |
| Utilities | 8.7% |
| U.S. Guaranteed | 7.3% |
| Other | 9.2% |
| Total | 100% |
| Credit Quality | |
| (% of total investment exposure) | |
| AAA/U.S. Guaranteed | 17.6% |
| AA | 63.3% |
| A | 13.8% |
| BBB | 1.2% |
| BB or Lower | 3.5% |
| N/R (not rated) | 0.6% |
| Total | 100% |
| NUO | |
| | Nuveen Ohio Quality Income Municipal Fund |
| | Performance Overview and Holding Summaries as of August 31, 2015 |
Refer to the Glossary of Terms Used in this Report for further definition of the terms used within this section.
Average Annual Total Returns as of August 31, 2015
| | | | Cumulative | | Average Annual |
| | | | 6-Month | | 1-Year | | 5-Year | | 10-Year |
| NUO at Common Share NAV | | | 0.43% | | 4.46% | | 5.73% | | 5.44% |
| NUO at Common Share Price | | | (3.34)% | | (2.85)% | | 3.40% | | 4.19% |
| S&P Municipal Bond Ohio Index | | | 0.71% | | 3.52% | | 4.81% | | 4.47% |
| S&P Municipal Bond Index | | | 0.21% | | 2.38% | | 4.11% | | 4.44% |
| Lipper Other States Municipal Debt Funds Classification Average | | | 0.45% | | 4.28% | | 5.57% | | 5.07% |
Past performance is not predictive of future results. Current performance may be higher or lower than the data shown. Returns do not reflect the deduction of taxes that shareholders may have to pay on Fund distributions or upon the sale of Fund shares. Returns at NAV are net of Fund expenses, and assume reinvestment of distributions. Comparative index and Lipper return information is provided for the Fund's shares at NAV only. Indexes and Lipper averages are not available for direct investment.
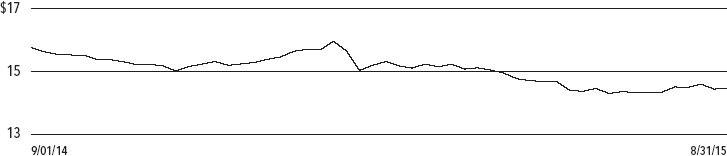
Common Share Price Performance — Weekly Closing Price
This data relates to the securities held in the Fund's portfolio of investments as of the end of the reporting period. It should not be construed as a measure of performance for the Fund itself. Holdings are subject to change.
Ratings shown are the highest rating given by one of the following national rating agencies: Standard & Poor's Group, Moody's Investors Service, Inc. or Fitch, Inc. Credit ratings are subject to change. AAA, AA, A and BBB are investment grade ratings; BB, B, CCC, CC, C and D are below-investment grade ratings. Certain bonds backed by U.S. Government or agency securities are regarded as having an implied rating equal to the rating of such securities. Holdings designated N/R are not rated by these national rating agencies.
| Fund Allocation | |
| (% of net assets) | |
| Long-Term Municipal Bonds | 146.4% |
| Other Assets Less Liabilities | 1.5% |
| Net Assets Plus VRDP Shares, at Liquidation Value | 147.9% |
| VRDP Shares, at Liquidation Value | (47.9)% |
| Net Assets | 100% |
| Portfolio Composition | |
| (% of total investments) | |
| Tax Obligation/Limited | 21.4% |
| Health Care | 21.2% |
| Tax Obligation/General | 15.2% |
| U.S. Guaranteed | 12.9% |
| Water and Sewer | 6.8% |
| Transportation | 6.3% |
| Education and Civic Organizations | 5.8% |
| Other | 10.4% |
| Total | 100% |
| Credit Quality | |
| (% of total investment exposure) | |
| AAA/U.S. Guaranteed | 23.1% |
| AA | 46.9% |
| A | 18.7% |
| BBB | 6.6% |
| BB or Lower | 4.2% |
| N/R (not rated) | 0.5% |
| Total | 100% |
| NTX | |
| | Nuveen Texas Quality Income Municipal Fund |
| | Performance Overview and Holding Summaries as of August 31, 2015 |
Refer to the Glossary of Terms Used in this Report for further definition of the terms used within this section.
Average Annual Total Returns as of August 31, 2015
| | | | Cumulative | | Average Annual |
| | | | 6-Month | | 1-Year | | 5-Year | | 10-Year |
| NTX at Common Share NAV | | | (0.13)% | | 3.36% | | 5.18% | | 5.14% |
| NTX at Common Share Price | | | (3.84)% | | (2.61)% | | 0.81% | | 3.88% |
| S&P Municipal Bond Texas Index | | | 0.48% | | 2.58% | | 4.33% | | 4.75% |
| S&P Municipal Bond Index | | | 0.21% | | 2.38% | | 4.11% | | 4.44% |
| Lipper Other States Municipal Debt Funds Classification Average | | | 0.45% | | 4.28% | | 5.57% | | 5.07% |
Past performance is not predictive of future results. Current performance may be higher or lower than the data shown. Returns do not reflect the deduction of taxes that shareholders may have to pay on Fund distributions or upon the sale of Fund shares. Returns at NAV are net of Fund expenses, and assume reinvestment of distributions. Comparative index and Lipper return information is provided for the Fund's shares at NAV only. Indexes and Lipper averages are not available for direct investment.
Common Share Price Performance — Weekly Closing Price
This data relates to the securities held in the Fund's portfolio of investments as of the end of the reporting period. It should not be construed as a measure of performance for the Fund itself. Holdings are subject to change.
Ratings shown are the highest rating given by one of the following national rating agencies: Standard & Poor's Group, Moody's Investors Service, Inc. or Fitch, Inc. Credit ratings are subject to change. AAA, AA, A and BBB are investment grade ratings; BB, B, CCC, CC, C and D are below-investment grade ratings. Certain bonds backed by U.S. Government or agency securities are regarded as having an implied rating equal to the rating of such securities. Holdings designated N/R are not rated by these national rating agencies.
| Fund Allocation | |
| (% of net assets) | |
| Long-Term Municipal Bonds | 143.6% |
| Other Assets Less Liabilities | 3.5% |
| Net Assets Plus Floating Rate Obligations & iMTP Shares, at Liquidation Value | 147.1% |
| Floating Rate Obligations | (0.4)% |
| iMTP Shares, at Liquidation Value | (46.7)% |
| Net Assets | 100% |
| Portfolio Composition | |
| (% of total investments) | |
| Tax Obligation/General | 19.5% |
| Utilities | 12.7% |
| Tax Obligation/Limited | 12.4% |
| Transportation | 12.3% |
| Water and Sewer | 11.7% |
| U.S. Guaranteed | 9.2% |
| Education and Civic Organizations | 8.8% |
| Health Care | 8.1% |
| Other | 5.3% |
| Total | 100% |
| Credit Quality | |
| (% of total investment exposure) | |
| AAA/U.S. Guaranteed | 23.9% |
| AA | 37.2% |
| A | 20.9% |
| BBB | 16.0% |
| BB or Lower | 1.6% |
| N/R (not rated) | 0.4% |
| Total | 100% |
| NAZ | | |
| | Nuveen Arizona Premium Income Municipal Fund | |
| | Portfolio of Investments | August 31, 2015 (Unaudited) |
| | Principal | | | Optional Call | | | | | | |
| | Amount (000) | | Description (1) | Provisions (2) | | Ratings (3) | | | Value | |
| | | | LONG-TERM INVESTMENTS – 146.8% (100.0% of Total Investments) | | | | | | | |
| | | | MUNICIPAL BONDS – 146.8% (100.0% of Total Investments) | | | | | | | |
| | | | Consumer Staples – 0.5% (0.4% of Total Investments) | | | | | | | |
| $ | 925 | | Puerto Rico, The Children's Trust Fund, Tobacco Settlement Asset-Backed Refunding Bonds, Series 2002, 5.375%, 5/15/33 | 11/15 at 100.00 | | BBB+ | | $ | 928,543 | |
| | | | Education and Civic Organizations – 22.4% (15.3% of Total Investments) | | | | | | | |
| | 1,500 | | Arizona Board of Regents, Arizona State University System Revenue Bonds, Refunding Green Series 2015A, 5.000%, 7/01/41 | 7/25 at 100.00 | | AA | | | 1,700,445 | |
| | 3,480 | | Arizona Board of Regents, Arizona State University System Revenue Bonds, Refunding Series 2013A, 5.000%, 7/01/43 | No Opt. Call | | AA | | | 3,859,355 | |
| | 2,815 | | Arizona Board of Regents, University of Arizona, SPEED Revenue Bonds, Stimulus Plan for Economic and Educational Development, Series 2014, 5.000%, 8/01/44 | 8/24 at 100.00 | | Aa3 | | | 3,135,938 | |
| | 2,240 | | Arizona Board of Regents, University of Arizona, System Revenue Bonds, Tender Option Bond Trust 2015-XF0053, 17.908%, 6/01/20 (IF) | No Opt. Call | | Aa2 | | | 3,211,152 | |
| | 1,400 | | Arizona Board of Regents, University of Arizona, SPEED Revenue Bonds, Stimulus Plan for Economic and Educational Development, Series 2013, 5.000%, 8/01/21 | No Opt. Call | | Aa3 | | | 1,646,708 | |
| | 2,000 | | Glendale Industrial Development Authority, Arizona, Revenue Bonds, Midwestern University, Refunding Series 2007, 5.000%, 5/15/31 | 5/22 at 100.00 | | A– | | | 2,200,400 | |
| | 3,775 | | Glendale Industrial Development Authority, Arizona, Revenue Bonds, Midwestern University, Refunding Series 2010, 5.125%, 5/15/40 | 5/20 at 100.00 | | A+ | | | 4,194,100 | |
| | | | Industrial Development Authority of Phoenix, Arizona, Education Facility Revenue Bonds, Legacy Traditional Schools Projects, Series 2015: | | | | | | | |
| | 315 | | 5.000%, 7/01/35 | No Opt. Call | | BB | | | 307,620 | |
| | 300 | | 5.000%, 7/01/45 | No Opt. Call | | BB | | | 284,841 | |
| | 1,875 | | Northern Arizona University, System Revenue Bonds, Refunding Series 2014, 5.000%, 6/01/40 | 6/24 at 100.00 | | A+ | | | 2,089,181 | |
| | 910 | | Northern Arizona University, System Revenue Bonds, Series 2012, 5.000%, 6/01/41 | 6/21 at 100.00 | | A+ | | | 984,429 | |
| | 900 | | Phoenix Industrial Development Authority, Arizona, Education Facility Revenue Bonds, Choice Academies Charter Schools Project, Series 2012, 5.625%, 9/01/42 | 9/22 at 100.00 | | BB+ | | | 944,253 | |
| | 750 | | Phoenix Industrial Development Authority, Arizona, Education Facility Revenue Bonds, fbo Brighter Choice Foundation Charter Middle Schools Project, Albany, New York, Series 2012, 7.500%, 7/01/42 | 7/22 at 100.00 | | C | | | 307,500 | |
| | 500 | | Phoenix Industrial Development Authority, Arizona, Education Facility Revenue Bonds, Legacy Traditional Schools Project, Series 2014A, 6.750%, 7/01/44 | 7/24 at 100.00 | | N/R | | | 559,360 | |
| | 585 | | Phoenix Industrial Development Authority, Arizona, Education Revenue Bonds, Great Hearts Academies – Veritas Project, Series 2012, 6.300%, 7/01/42 | 7/21 at 100.00 | | BB | | | 619,263 | |
| | 745 | | Phoenix Industrial Development Authority, Arizona, Education Revenue Bonds, Painted Rock Academy Charter School Project, Series 2012A, 7.500%, 7/01/42 | 7/20 at 100.00 | | N/R | | | 760,705 | |
| | 3,675 | | Phoenix Industrial Development Authority, Arizona, Lease Revenue Bonds, Rowan University Project, Series 2012, 5.000%, 6/01/42 – AGM Insured (UB) (4) | 6/22 at 100.00 | | A | | | 3,926,150 | |
| | 200 | | Pima County Industrial Development Authority, Arizona, Charter School Revenue Bonds, Desert Heights Charter School, Series 2014, 7.250%, 5/01/44 | 5/24 at 100.00 | | N/R | | | 207,836 | |
| | 745 | | Pima County Industrial Development Authority, Arizona, Education Revenue Bonds, Carden Traditional Schools Project, Series 2012, 7.500%, 1/01/42 | 1/22 at 100.00 | | B | | | 712,853 | |
| | 1,000 | | Pima County Industrial Development Authority, Arizona, Education Revenue Bonds, Horizon Community Learning Center Project, Series 2000, 5.250%, 6/01/35 | 12/15 at 100.00 | | BBB | | | 1,001,730 | |
| | 500 | | Pima County Industrial Development Authority, Arizona, Education Revenue Bonds, Noah Webster Schools – Mesa Project, Series 2015A, 5.000%, 12/15/34 | No Opt. Call | | BB+ | | | 493,265 | |
| NAZ | | |
| | Nuveen Arizona Premium Income Municipal Fund | |
| | Portfolio of Investments (continued) | August 31, 2015 (Unaudited) |
| | Principal | | | Optional Call | | | | | | |
| | Amount (000) | | Description (1) | Provisions (2) | | Ratings (3) | | | Value | |
| | | | Education and Civic Organizations (continued) | | | | | | | |
| | | | Pima County Industrial Development Authority, Arizona, Education Revenue Bonds, Paradise Education Center Project, Series 2010: | | | | | | | |
| $ | 745 | | 6.000%, 6/01/40 | 6/19 at 100.00 | | BB+ | | $ | 773,727 | |
| | 200 | | 6.100%, 6/01/45 | 6/19 at 100.00 | | BB+ | | | 208,044 | |
| | 655 | | Pima County Industrial Development Authority, Arizona, Educational Revenue Bonds, Paradise Education Center Charter School, Series 2006, 6.000%, 6/01/36 | 6/16 at 100.00 | | BB+ | | | 660,495 | |
| | 1,000 | | Pima County Industrial Development Authority, Arizona, Educational Revenue Bonds, Valley Academy Charter School Project, Series 2008, 6.500%, 7/01/38 | 7/18 at 100.00 | | Baa3 | | | 1,047,420 | |
| | 780 | | Student and Academic Services LLC, Arizona, Lease Revenue Bonds, Northern Arizona University Project, Series 2014, 5.000%, 6/01/39 – BAM Insured | 6/24 at 100.00 | | AA | | | 863,772 | |
| | 250 | | Sun Devil Energy LLC, Arizona, Revenue Refunding Bonds, Arizona State University Project, Series 2008, 5.000%, 7/01/22 | No Opt. Call | | AA– | | | 291,512 | |
| | 825 | | Yavapai County Industrial Development Authority, Arizona, Education Revenue Bonds, Arizona Agribusiness and Equine Center, Inc. Project, Series 2011, 7.875%, 3/01/42 | 3/21 at 100.00 | | BB+ | | | 959,879 | |
| | 34,665 | | Total Education and Civic Organizations | | | | | | 37,951,933 | |
| | | | Health Care – 21.7% (14.8% of Total Investments) | | | | | | | |
| | 3,500 | | Arizona Health Facilities Authority, Hospital Revenue Bonds, Banner Health Systems, Series 2007A, 5.000%, 1/01/25 | 1/17 at 100.00 | | AA– | | | 3,685,395 | |
| | 7,730 | | Arizona Health Facilities Authority, Hospital Revenue Bonds, Banner Health Systems, Series 2008D, 5.500%, 1/01/38 | 1/18 at 100.00 | | AA– | | | 8,283,081 | |
| | 1,200 | | Arizona Health Facilities Authority, Hospital Revenue Bonds, Banner Health Systems, Series 2014A, 5.000%, 1/01/44 | 1/24 at 100.00 | | AA– | | | 1,320,876 | |
| | 5,100 | | Arizona Health Facilities Authority, Hospital System Revenue Bonds, Phoenix Children's Hospital, Refunding Series 2012A, 5.000%, 2/01/42 | 2/22 at 100.00 | | BBB+ | | | 5,357,958 | |
| | | | Arizona Health Facilities Authority, Revenue Bonds, Scottsdale Lincoln Hospitals Project, Series 2014A: | | | | | | | |
| | 3,000 | | 5.000%, 12/01/39 | 12/24 at 100.00 | | A2 | | | 3,279,630 | |
| | 1,780 | | 5.000%, 12/01/42 | 12/24 at 100.00 | | A2 | | | 1,937,210 | |
| | 7,560 | | Maricopa County Industrial Development Authority, Arizona, Health Facility Revenue Bonds, Catholic Healthcare West, Series 2007A, 5.250%, 7/01/32 | 7/17 at 100.00 | | A | | | 7,911,994 | |
| | 120 | | Puerto Rico Industrial, Tourist, Educational, Medical and Environmental Control Facilities Financing Authority, Hospital Revenue Bonds, Hospital de la Concepcion, Series 2000A, 6.375%, 11/15/15 | No Opt. Call | | AA+ | | | 120,565 | |
| | 1,120 | | Scottsdale Industrial Development Authority, Arizona, Hospital Revenue Bonds, Scottsdale Healthcare, Series 2006C. Re-offering, 5.000%, 9/01/35 – AGC Insured | 9/20 at 100.00 | | AA | | | 1,234,766 | |
| | | | Yavapai County Industrial Development Authority, Arizona, Hospital Revenue Bonds, Yavapai Regional Medical Center, Series 2013A: | | | | | | | |
| | 210 | | 5.000%, 8/01/19 | No Opt. Call | | Baa1 | | | 228,919 | |
| | 1,000 | | 5.250%, 8/01/33 | 8/23 at 100.00 | | Baa1 | | | 1,098,660 | |
| | | | Yuma Industrial Development Authority, Arizona, Hospital Revenue Bonds, Yuma Regional Medical Center, Series 2014A: | | | | | | | |
| | 1,000 | | 5.000%, 8/01/22 | No Opt. Call | | A– | | | 1,146,310 | |
| | 1,000 | | 5.250%, 8/01/32 | 8/24 at 100.00 | | A– | | | 1,129,340 | |
| | 34,320 | | Total Health Care | | | | | | 36,734,704 | |
| | | | Long-Term Care – 0.8% (0.5% of Total Investments) | | | | | | | |
| | 550 | | Arizona Health Facilities Authority, Health Care Facilities Revenue Bonds, The Beatitudes Campus Project, Series 2006, 5.100%, 10/01/22 | 10/16 at 100.00 | | N/R | | | 553,503 | |
| | 780 | | Tempe Industrial Development Authority, Arizona, Revenue Bonds, Friendship Village of Tempe Project, Refunding Series 2012A, 6.000%, 12/01/32 | 12/21 at 100.00 | | N/R | | | 842,626 | |
| | 1,330 | | Total Long-Term Care | | | | | | 1,396,129 | |
| | Principal | | | Optional Call | | | | | | |
| | Amount (000) | | Description (1) | Provisions (2) | | Ratings (3) | | | Value | |
| | | | Tax Obligation/General – 14.6% (10.0% of Total Investments) | | | | | | | |
| $ | 2,500 | | Chandler, Arizona, General Obligation Bonds, Refunding Series 2014, 5.000%, 7/01/24 | No Opt. Call | | AAA | | $ | 3,088,525 | |
| | | | Dysart Unified School District Number 89, Maricopa County, Arizona, General Obligation Bonds, Refunding Series 2014: | | | | | | | |
| | 1,000 | | 5.000%, 7/01/26 | 7/24 at 100.00 | | AA– | | | 1,179,240 | |
| | 525 | | 5.000%, 7/01/27 | 7/24 at 100.00 | | AA– | | | 614,596 | |
| | 2,140 | | El Mirage, Arizona, General Obligation Bonds Series 2012, 5.000%, 7/01/42 – AGM Insured | 7/22 at 100.00 | | AA | | | 2,326,715 | |
| | 1,000 | | Maricopa County Elementary School District 83 Cartwright, Arizona, General Obligation Bonds, School Improvement, Project 2010, Series 2011A, 5.375%, 7/01/30 – AGM Insured | 7/21 at 100.00 | | AA | | | 1,123,910 | |
| | 1,020 | | Maricopa County School District 6, Arizona, General Obligation Refunding Bonds, Washington Elementary School, Series 2002A, 5.375%, 7/01/16 – AGM Insured | No Opt. Call | | AA | | | 1,062,697 | |
| | 775 | | Maricopa County School District 79 Litchfield Elementary, Arizona, General Obligation Bonds, Series 2011, 5.000%, 7/01/23 | 7/21 at 100.00 | | Aa2 | | | 905,890 | |
| | 1,370 | | Pima County Continental Elementary School District 39, Arizona, General Obligation Bonds, Series 2011A, 6.000%, 7/01/30 – AGM Insured | 7/21 at 100.00 | | AA | | | 1,635,698 | |
| | 2,895 | | Pima County Unified School District 12 Sunnyside, Arizona, General Obligation Bonds, School Improvement Project 2011, Series 2014D, 5.000%, 7/01/34 – AGM Insured | 7/24 at 100.00 | | AA | | | 3,262,231 | |
| | 1,750 | | Pima County Unified School District 6, Marana, Arizona, General Obligation Bonds, School Improvement Project 2010 Series 2011A, 5.000%, 7/01/25 | 7/21 at 100.00 | | A+ | | | 1,977,955 | |
| | 1,000 | | Pima County Unified School District 8 Flowing Wells, Arizona, General Obligation Bonds, Series 2011B, 5.375%, 7/01/29 | 7/21 at 100.00 | | A+ | | | 1,144,560 | |
| | | | Scottsdale, Arizona, General Obligation Bonds, Preserve Acquisition Series 1999: | | | | | | | |
| | 1,310 | | 5.000%, 7/01/32 | 7/21 at 100.00 | | AAA | | | 1,491,265 | |
| | 1,360 | | 5.000%, 7/01/33 | 7/21 at 100.00 | | AAA | | | 1,544,226 | |
| | 1,705 | | 5.000%, 7/01/34 | 7/21 at 100.00 | | AAA | | | 1,931,015 | |
| | | | Western Maricopa Education Center District 402, Maricopa County, Arizona, General Obligation Bonds, School Improvement Project 2012, Series 2014B: | | | | | | | |
| | 715 | | 4.500%, 7/01/33 | 7/24 at 100.00 | | AA– | | | 773,415 | |
| | 665 | | 4.500%, 7/01/34 | 7/24 at 100.00 | | AA– | | | 717,748 | |
| | 21,730 | | Total Tax Obligation/General | | | | | | 24,779,686 | |
| | | | Tax Obligation/Limited – 38.2% (26.0% of Total Investments) | | | | | | | |
| | 2,310 | | Arizona Sports and Tourism Authority, Tax Revenue Bonds, Multipurpose Stadium Facility Project, Refunding Senior Series 2012A, 5.000%, 7/01/36 | 7/22 at 100.00 | | A1 | | | 2,439,730 | |
| | | | Arizona State Transportation Board, Highway Revenue Bonds, Refunding Subordinate Series 2011A: | | | | | | | |
| | 1,275 | | 5.000%, 7/01/16 | No Opt. Call | | AA+ | | | 1,326,472 | |
| | 1,025 | | 5.000%, 7/01/36 | 7/21 at 100.00 | | AA+ | | | 1,149,066 | |
| | 1,000 | | Buckeye, Arizona, Excise Tax Revenue Obligations, Series 2015, 5.000%, 7/01/37 | 7/25 at 100.00 | | AA– | | | 1,123,840 | |
| | | | Buckeye, Arizona, Festival Ranch Community Facilities District General Obligation Bonds, Series 2012: | | | | | | | |
| | 345 | | 5.000%, 7/15/27 – BAM Insured | 7/22 at 100.00 | | AA | | | 378,531 | |
| | 1,085 | | 5.000%, 7/15/31 – BAM Insured | 7/22 at 100.00 | | AA | | | 1,171,908 | |
| | 586 | | Centerra Community Facilities District, Goodyear, Arizona, General Obligation Bonds, Series 2005, 5.500%, 7/15/29 | 11/15 at 100.00 | | N/R | | | 586,170 | |
| | 498 | | Eastmark Community Facilities District 1, Mesa, Arizona, Special Assessment Revenue Bonds, Assessment District 1, Series 2013, 5.250%, 7/01/38 | 7/23 at 100.00 | | N/R | | | 511,800 | |
| | | | Estrella Mountain Ranch Community Facilities District, Arizona, Special Assessment Bonds, Montecito Assessment District, Series 2007: | | | | | | | |
| | 426 | | 5.700%, 7/01/27 | 1/17 at 100.00 | | N/R | | | 432,509 | |
| | 458 | | 5.800%, 7/01/32 | 1/17 at 100.00 | | N/R | | | 463,427 | |
| | 612 | | Estrella Mountain Ranch Community Facilities District, Goodyear, Arizona, Special Assessment Lien Bonds, Series 2001A, 7.875%, 7/01/25 | 11/15 at 100.00 | | N/R | | | 613,732 | |
| | 1,500 | | Goodyear, Arizona, Community Facilities General District 1, Arizona, General Obligation Refunding Bonds, Series 2013, 5.000%, 7/15/23 | No Opt. Call | | A– | | | 1,698,990 | |
| NAZ | | |
| | Nuveen Arizona Premium Income Municipal Fund | |
| | Portfolio of Investments (continued) | August 31, 2015 (Unaudited) |
| | Principal | | | Optional Call | | | | | | |
| | Amount (000) | | Description (1) | Provisions (2) | | Ratings (3) | | | Value | |
| | | | Tax Obligation/Limited (continued) | | | | | | | |
| | | | Government of Guam, Business Privilege Tax Bonds, Series 2011A: | | | | | | | |
| $ | 510 | | 5.000%, 1/01/31 | 1/22 at 100.00 | | A | | $ | 558,552 | |
| | 200 | | 5.125%, 1/01/42 | 1/22 at 100.00 | | A | | | 215,716 | |
| | 1,500 | | Government of Guam, Business Privilege Tax Bonds, Series 2012B-1, 5.000%, 1/01/37 | 1/22 at 100.00 | | A | | | 1,629,420 | |
| | 1,550 | | Greater Arizona Development Authority, Infrastructure Revenue Bonds, Series 2006A, 5.000%, 8/01/23 – NPFG Insured | 8/16 at 100.00 | | AA– | | | 1,612,899 | |
| | 250 | | La Paz County, Arizona, Excise Tax Revenue Bonds, Judgement Series 2011A, 4.750%, 7/01/36 | 7/17 at 100.00 | | AA | | | 255,937 | |
| | 1,425 | | Marana, Arizona, Pledged Excise Tax Revenue Bonds, Refunding Series 2013, 5.000%, 7/01/33 | 7/23 at 100.00 | | AA | | | 1,597,225 | |
| | 2,854 | | Marana, Arizona, Tangerine Farms Road Improvement District Revenue Bonds, Series 2006, 4.600%, 1/01/26 | 7/16 at 100.00 | | A2 | | | 2,881,370 | |
| | 680 | | Marley Park Community Facilities District, City of Surprise, Arizona, Limited Tax General Obligation Bonds, Series 2008 (Bank Qualified), 6.100%, 7/15/32 | 7/17 at 100.00 | | N/R | | | 691,805 | |
| | 1,160 | | Merrill Ranch Community Facilities District 1, Florence, Arizona, General Obligation Bonds, Series 2008A, 7.400%, 7/15/33 | 7/18 at 100.00 | | BBB– | | | 1,256,640 | |
| | 300 | | Page, Arizona, Pledged Revenue Bonds, Refunding Series 2011, 5.000%, 7/01/26 | 7/21 at 100.00 | | AA– | | | 337,176 | |
| | 1,500 | | Palm Valley Community Facility District 3, Goodyear, Arizona, General Obligation Bonds, Series 2006, 5.300%, 7/15/31 | 7/16 at 100.00 | | N/R | | | 1,505,520 | |
| | 1,000 | | Palm Valley Community Facility District 3, Goodyear, Arizona, Limited Tax General Obligation Bonds, Series 2007, 5.800%, 7/15/32 | 7/17 at 100.00 | | N/R | | | 1,012,080 | |
| | 400 | | Parkway Community Facilities District 1, Prescott Valley, Arizona, General Obligation Bonds, Series 2006, 5.350%, 7/15/31 | 7/16 at 100.00 | | N/R | | | 400,964 | |
| | 1,010 | | Phoenix Civic Improvement Corporation, Arizona, Transit Excise Tax Revenue Refunding Bonds, Light Rail Project, Series 2013, 5.000%, 7/01/20 | No Opt. Call | | AA | | | 1,177,296 | |
| | 2,500 | | Phoenix Industrial Development Authority, Arizona, Education Facility Revenue Bonds, JMF-Higley 2012 LLC Project, Series 2012, 5.000%, 12/01/36 | No Opt. Call | | A | | | 2,703,225 | |
| | 580 | | Phoenix Mesa Gateway Airport Authority, Arizona, Special Facility Revenue Bonds, Mesa Project, Series 2012, 5.000%, 7/01/38 (Alternative Minimum Tax) | 7/22 at 100.00 | | AA+ | | | 624,405 | |
| | 2,095 | | Pinal County Industrial Development Authority, Arizona, Correctional Facilities Contract Revenue Bonds, Florence West Prison LLC, Series 2002A, 5.000%, 10/01/18 – ACA Insured | 11/15 at 100.00 | | BBB– | | | 2,097,933 | |
| | 1,000 | | Pinal County, Arizona, Pledged Revenue Obligations, Series 2014, 5.000%, 8/01/33 | 8/24 at 100.00 | | AA– | | | 1,138,650 | |
| | 1,140 | | Pinetop Fire District of Navajo County, Arizona, Certificates of Participation, Series 2008, 7.750%, 6/15/29 | 6/16 at 102.00 | | A3 | | | 1,177,620 | |
| | 1,000 | | Regional Public Transportation Authority, Arizona, Transportation Excise Tax Revenue Bonds, Maricopa County Public Transportation Fund Series 2014, 5.250%, 7/01/22 | No Opt. Call | | AA+ | | | 1,212,290 | |
| | 3,145 | | San Luis, Arizona, Pledged Excise Tax Revenue Bonds, Refunding Series 2014A: | | | | | | | |
| | 1,400 | | 5.000%, 7/01/34 – BAM Insured | 7/24 at 100.00 | | AA | | | 1,577,590 | |
| | 2,100 | | 5.000%, 7/01/38 – BAM Insured | 7/24 at 100.00 | | AA | | | 2,354,436 | |
| | 3,000 | | Scottsdale Municipal Property Corporation, Arizona, Excise Tax Revenue Bonds, Refunding Series 2006, 5.000%, 7/01/24 | No Opt. Call | | AAA | | | 3,657,480 | |
| | 5,000 | | Scottsdale Municipal Property Corporation, Arizona, Excise Tax Revenue Bonds, Water & Sewer Improvements Project, Series 2010, 5.000%, 7/01/36 | 7/20 at 100.00 | | AAA | | | 5,644,650 | |
| | 1,570 | | Tartesso West Community Facility District, Buckeye, Arizona, Limited Tax General Obligation Bonds, Series 2007, 5.900%, 7/15/32 | 7/17 at 100.00 | | N/R | | | 1,601,604 | |
| | 4,000 | | Tempe, Arizona, Transit Excise Tax Revenue Obligation Bonds, Refunding Series 2012, 5.000%, 7/01/37 | 7/22 at 100.00 | | AAA | | | 4,469,840 | |
| | 1,750 | | Virgin Islands Public Finance Authority, Gross Receipts Taxes Loan Note, Refunding Series 2012A, 4.000%, 10/01/22 – AGM Insured | No Opt. Call | | AA | | | 1,856,522 | |
| | 1,750 | | Virgin Islands Public Finance Authority, Matching Fund Loan Notes Revenue Bonds, Senior Lien Series 2010A, 5.000%, 10/01/29 | 10/20 at 100.00 | | BBB | | | 1,894,095 | |
| | | | Vistancia Community Facilities District, Peoria, Arizona, General Obligation Bonds, Series 2005, 5.750%, 7/15/24 | 7/15 at 100.00 | | A1 | | | 3,165,726 | |
| | Principal | | | Optional Call | | | | | | |
| | Amount (000) | | Description (1) | Provisions (2) | | Ratings (3) | | | Value | |
| | | | Tax Obligation/Limited (continued) | | | | | | | |
| $ | 1,499 | | Watson Road Community Facilities District, Arizona, Special Assessment Revenue Bonds, Series 2005, 6.000%, 7/01/30 | 7/16 at 100.00 | | N/R | | $ | 1,514,020 | |
| | 1,000 | | Westpark Community Facilities District, Buckeye, Arizona, General Obligation Tax Increment Bonds Series 2006, 5.250%, 7/15/31 | 7/16 at 100.00 | | N/R | | | 1,004,100 | |
| | 59,988 | | Total Tax Obligation/Limited | | | | | | 64,722,961 | |
| | | | Transportation – 3.0% (2.0% of Total Investments) | | | | | | | |
| | 180 | | Phoenix Civic Improvement Corporation, Arizona, Junior Lien Airport Revenue Bonds, Series 2010A, 5.000%, 7/01/40 | 7/20 at 100.00 | | A+ | | | 196,375 | |
| | | | Phoenix Civic Improvement Corporation, Arizona, Senior Lien Airport Revenue Bonds, Refunding Series 2013: | | | | | | | |
| | 1,785 | | 5.000%, 7/01/30 (Alternative Minimum Tax) | 7/23 at 100.00 | | AA– | | | 1,992,881 | |
| | 2,215 | | 5.000%, 7/01/32 (Alternative Minimum Tax) | 7/23 at 100.00 | | AA– | | | 2,450,410 | |
| | 395 | | Virgin Islands Port Authority, Marine Revenue Bonds, Refunding Series 2014B, 5.000%, 9/01/44 | 9/24 at 100.00 | | BBB+ | | | 423,993 | |
| | 4,575 | | Total Transportation | | | | | | 5,063,659 | |
| | | | U.S. Guaranteed – 16.5% (11.2% of Total Investments) (5) | | | | | | | |
| | 1,265 | | Gila County Unified School District 10 Payson, Arizona, School Improvement Bonds, Project 2006, Series 2008B, 5.750%, 7/01/28 (Pre-refunded 7/01/18) | 7/18 at 100.00 | | Aa3 (5) | | | 1,435,282 | |
| | 1,840 | | Glendale Industrial Development Authority, Arizona, Revenue Bonds, John C. Lincoln Health Network, Series 2005B, 5.000%, 12/01/37 (Pre-refunded 12/01/15) | 12/15 at 100.00 | | N/R (5) | | | 1,862,246 | |
| | 2,965 | | Glendale Industrial Development Authority, Arizona, Revenue Bonds, John C. Lincoln Health Network, Series 2007, 5.000%, 12/01/42 (Pre-refunded 12/01/17) | 12/17 at 100.00 | | N/R (5) | | | 3,247,327 | |
| | 2,280 | | Greater Arizona Development Authority, Infrastructure Revenue Bonds, Series 2006-1, 5.000%, 8/01/22 (Pre-refunded 8/01/16) – NPFG Insured | 8/16 at 100.00 | | AA– (5) | | | 2,375,920 | |
| | 730 | | Maricopa County Industrial Development Authority, Arizona, Hospital Revenue Refunding Bonds, Samaritan Health Services, Series 1990A, 7.000%, 12/01/16 – NPFG Insured (ETM) | No Opt. Call | | N/R (5) | | | 750,966 | |
| | 1,200 | | Maricopa County Unified School District 95 Queen Creek, Arizona, General Obligation Bonds, Series 2008, 5.000%, 7/01/27 (Pre-refunded 7/01/18) – AGM Insured | 7/18 at 100.00 | | Aa3 (5) | | | 1,336,428 | |
| | 665 | | Maricopa County Union High School District 210 Phoenix, Arizona, General Obligation Bonds, Series 2006C, 5.000%, 7/01/24 (Pre-refunded 7/01/16) – NPFG Insured | 7/16 at 100.00 | | AA (5) | | | 691,194 | |
| | 630 | | Mesa, Arizona, Utility System Revenue Refunding Bonds, Series 2002, 5.250%, 7/01/17 – FGIC Insured (ETM) | No Opt. Call | | Aa2 (5) | | | 683,386 | |
| | 4,530 | | Pinal County Unified School District 1, Florence, Arizona, General Obligation Bonds, Series 2008C, 5.250%, 7/01/28 (Pre-refunded 7/01/18) | 7/18 at 100.00 | | A (5) | | | 5,076,590 | |
| | | | Show Low Industrial Development Authority, Arizona, Hospital Revenue Bonds, Navapache Regional Medical Center, Series 2005: | | | | | | | |
| | 1,415 | | 5.000%, 12/01/25 (Pre-refunded 12/01/15) – RAAI Insured | 12/15 at 100.00 | | AA (5) | | | 1,432,291 | |
| | 1,160 | | 5.000%, 12/01/30 (Pre-refunded 12/01/15) – RAAI Insured | 12/15 at 100.00 | | AA (5) | | | 1,174,175 | |
| | 2,000 | | Salt River Project Agricultural Improvement and Power District, Arizona, Electric System Revenue Bonds, Series 2005A, 5.000%, 1/01/35 (Pre-refunded 1/01/16) | 1/16 at 100.00 | | Aa1 (5) | | | 2,032,540 | |
| | 2,585 | | University Medical Center Corporation, Tucson, Arizona, Hospital Revenue Bonds, Series 2011, 6.000%, 7/01/39 (Pre-refunded 7/01/21) | 7/21 at 100.00 | | N/R (5) | | | 3,203,073 | |
| | | | University Medical Center Corporation, Tucson, Arizona, Hospital Revenue Bonds, Series 2013: | | | | | | | |
| | 200 | | 5.000%, 7/01/19 (ETM) | No Opt. Call | | N/R (5) | | | 228,750 | |
| | 800 | | 5.000%, 7/01/20 (ETM) | No Opt. Call | | N/R (5) | | | 933,936 | |
| | 1,340 | | Yuma & La Paz Counties Community College District, Arizona, General Obligation Bonds, Series 2006, 5.000%, 7/01/21 (Pre-refunded 7/01/16) – NPFG Insured | 7/16 at 100.00 | | AA– (5) | | | 1,392,783 | |
| | 25,605 | | Total U.S. Guaranteed | | | | | | 27,856,887 | |
| NAZ | | |
| | Nuveen Arizona Premium Income Municipal Fund | |
| | Portfolio of Investments (continued) | August 31, 2015 (Unaudited) |
| | Principal | | | Optional Call | | | | | | |
| | Amount (000) | | Description (1) | Provisions (2) | | Ratings (3) | | | Value | |
| | | | Utilities – 17.8% (12.1% of Total Investments) | | | | | | | |
| $ | 1,495 | | Apache County Industrial Development Authority, Arizona, Pollution Control Revenue Bonds, Tucson Electric Power Company, Series 20102A, 4.500%, 3/01/30 | 3/22 at 100.00 | | A3 | | $ | 1,594,672 | |
| | | | Arizona Power Authority, Special Obligation Power Resource Revenue Refunding Crossover Bonds, Hoover Project, Series 2001: | | | | | | | |
| | 1,000 | | 5.250%, 10/01/15 | No Opt. Call | | AA | | | 1,004,290 | |
| | 1,500 | | 5.250%, 10/01/17 | No Opt. Call | | AA | | | 1,640,730 | |
| | 4,310 | | Maricopa County Pollution Control Corporation, Arizona, Pollution Control Revenue Refunding Bonds, Southern California Edison Company, Series 2000A, 5.000%, 6/01/35 | 6/20 at 100.00 | | Aa3 | | | 4,824,657 | |
| | 370 | | Mesa, Arizona, Utility System Revenue Refunding Bonds, Series 2002, 5.250%, 7/01/17 – FGIC Insured | No Opt. Call | | Aa2 | | | 401,176 | |
| | 1,800 | | Pinal County Electrical District 3, Arizona, Electric System Revenue Bonds, Refunding Series 2011, 5.250%, 7/01/36 | 7/21 at 100.00 | | A | | | 1,983,780 | |
| | 1,500 | | Salt River Project Agricultural Improvement and Power District, Arizona, Electric System Revenue Bonds, Refunding Series 2015A, 5.000%, 12/01/36 | 6/25 at 100.00 | | Aa1 | | | 1,742,280 | |
| | 2,500 | | Salt River Project Agricultural Improvement and Power District, Arizona, Electric System Revenue Bonds, Tender Option Bond Trust 09-9W, 17.610%, 1/01/38 (IF) (4) | 1/18 at 100.00 | | Aa1 | | | 3,265,900 | |
| | | | Salt Verde Financial Corporation, Arizona, Senior Gas Revenue Bonds, Citigroup Energy Inc Prepay Contract Obligations, Series 2007: | | | | | | | |
| | 4,500 | | 5.500%, 12/01/29 | No Opt. Call | | A– | | | 5,346,450 | |
| | 5,665 | | 5.000%, 12/01/37 | No Opt. Call | | A– | | | 6,152,247 | |
| | 2,370 | | Yuma County Industrial Development Authority, Arizona, Exempt Revenue Bonds, Far West Water & Sewer Inc. Refunding, Series 2007A, 6.375%, 12/01/37 (Alternative Minimum Tax) | 12/17 at 100.00 | | N/R | | | 2,116,694 | |
| | 27,010 | | Total Utilities | | | | | | 30,072,876 | |
| | | | Water and Sewer – 11.3% (7.7% of Total Investments) | | | | | | | |
| | 500 | | City of Goodyear, Arizona Subordinate Lien Water and Sewer Revenue Obligations, Series 2011, 5.500%, 7/01/41 | 7/21 at 100.00 | | AA | | | 577,320 | |
| | 500 | | Glendale, Arizona, Water and Sewer Revenue Bonds, Refunding Series 2012, 5.000%, 7/01/28 | 7/22 at 100.00 | | AA | | | 573,660 | |
| | 2,855 | | Goodyear, Arizona, Water and Sewer Revenue Obligations, Series 2010, 5.625%, 7/01/39 | 7/20 at 100.00 | | AA– | | | 3,338,837 | |
| | 500 | | Guam Waterworks Authority, Water and Wastewater System Revenue Bonds, Series 2013, 5.250%, 7/01/33 | 7/23 at 100.00 | | A– | | | 557,660 | |
| | 1,125 | | Lake Havasu City, Arizona, Wastewater System Revenue Bonds, Refunding Senior Lien Series 2015A, 5.000%, 7/01/36 (WI/DD, Settling 9/15/15) – AGM Insured | 7/25 at 100.00 | | AA | | | 1,268,314 | |
| | 1,135 | | Phoenix Civic Improvement Corporation, Arizona, Wastewater System Revenue Bonds, Refunding Junior Lien Series 2014, 5.000%, 7/01/29 | 7/24 at 100.00 | | AA+ | | | 1,325,294 | |
| | 2,000 | | Phoenix Civic Improvement Corporation, Arizona, Water System Revenue Bonds, Junior Lien Series 2014A, 5.000%, 7/01/39 | 7/24 at 100.00 | | AAA | | | 2,286,600 | |
| | | | Phoenix Civic Improvement Corporation, Arizona, Water System Revenue Bonds, Refunding Junior Lien Series 2001: | | | | | | | |
| | 1,250 | | 5.500%, 7/01/21 – FGIC Insured | No Opt. Call | | AAA | | | 1,514,675 | |
| | 1,040 | | 5.500%, 7/01/22 – FGIC Insured | No Opt. Call | | AAA | | | 1,277,359 | |
| | 1,500 | | Pima County, Arizona, Sewer System Revenue Obligations, Series 2012A, 5.000%, 7/01/26 | No Opt. Call | | AA– | | | 1,739,805 | |
| | 1,000 | | Pima County, Arizona, Sewer System Revenue Obligations, Series 2014, 5.000%, 7/01/22 | No Opt. Call | | AA– | | | 1,187,900 | |
| | Principal | | | Optional Call | | | | | | |
| | Amount (000) | | Description (1) | Provisions (2) | | Ratings (3) | | | Value | |
| | | | Water and Sewer (continued) | | | | | | | |
| | | | Surprise Municipal Property Corporation, Arizona, Wastewater System Revenue Bonds, Series 2007: | | | | | | | |
| $ | 870 | | 4.700%, 4/01/22 | 4/16 at 100.00 | | A | | $ | 873,149 | |
| | 1,970 | | 4.900%, 4/01/32 | 4/17 at 100.00 | | A | | | 2,003,234 | |
| | 500 | | Tucson, Arizona, Water System Revenue Bonds, Refunding Series 2013A, 5.000%, 7/01/23 | No Opt. Call | | AA | | | 600,425 | |
| | 16,745 | | Total Water and Sewer | | | | | | 19,124,232 | |
| $ | 226,893 | | Total Long-Term Investments (cost $231,423,059) | | | | | | 248,631,610 | |
| | | | Floating Rate Obligations – (1.6)% | | | | | | (2,755,000 | ) |
| | | | Variable Rate MuniFund Term Preferred Shares, at Liquidation Value – (46.7)% (6) | | | | | | (79,000,000 | ) |
| | | | Other Assets Less Liabilities – 1.5% | | | | | | 2,521,449 | |
| | | | Net Assets Applicable to Common Shares – 100% | | | | | $ | 169,398,059 | |
| (1) | All percentages shown in the Portfolio of Investments are based on net assets applicable to common shares unless otherwise noted. |
| (2) | Optional Call Provisions: Dates (month and year) and prices of the earliest optional call or redemption. There may be other call provisions at varying prices at later dates. Certain mortgage-backed securities may be subject to periodic principal paydowns. |
| (3) | Ratings: Using the highest of Standard & Poor's Group ("Standard & Poor's"), Moody's Investors Service, Inc. ("Moody's") or Fitch, Inc. ("Fitch") rating. Ratings below BBB by Standard & Poor's, Baa by Moody's or BBB by Fitch are considered to be below investment grade. Holdings designated N/R are not rated by any of these national rating agencies. |
| (4) | Investment, or portion of investment, has been pledged to collateralize the net payment obligations for investments in inverse floating rate transactions. |
| (5) | Backed by an escrow or trust containing sufficient U.S. Government or U.S. Government agency securities, which ensure the timely payment of principal and interest. Certain bonds backed by U.S. Government or agency securities are regarded as having an implied rating equal to the rating of such securities. |
| (6) | Variable Rate MuniFund Term Preferred Shares, at Liquidation Value as a percentage of Total Investments is 31.8%. |
| (ETM) | Escrowed to maturity. |
| (IF) | Inverse floating rate investment. |
| (UB) | Underlying bond of an inverse floating rate trust reflected as a financing transaction. See Notes to Financial Statements, Note 3 – Portfolio Securities and Investments in Derivatives, Inverse Floating Rate Securities for more information. |
| (WI/DD) | Investment, or portion of investment, purchased on a when-issued or delayed delivery basis. |
See accompanying notes to financial statements.
| NUM | | |
| | Nuveen Michigan Quality Income Municipal Fund | |
| | Portfolio of Investments | August 31, 2015 (Unaudited) |
| | Principal | | | Optional Call | | | | | | |
| | Amount (000) | | Description (1) | Provisions (2) | | Ratings (3) | | | Value | |
| | | | LONG-TERM INVESTMENTS – 148.3% (100.0% of Total Investments) | | | | | | | |
| | | | MUNICIPAL BONDS – 148.3% (100.0% of Total Investments) | | | | | | | |
| | | | Consumer Staples – 4.6% (3.1% of Total Investments) | | | | | | | |
| $ | 7,100 | | Michigan Tobacco Settlement Finance Authority, Tobacco Settlement Asset-Backed Revenue Bonds, Senior Lien Series 2007A, 6.000%, 6/01/34 | 6/17 at 100.00 | | B– | | $ | 6,218,677 | |
| | 8,650 | | Michigan Tobacco Settlement Finance Authority, Tobacco Settlement Asset-Backed Revenue Bonds, Series 2008A, 6.875%, 6/01/42 | 6/18 at 100.00 | | BB– | | | 8,483,920 | |
| | 15,750 | | Total Consumer Staples | | | | | | 14,702,597 | |
| | | | Education and Civic Organizations – 15.1% (10.2% of Total Investments) | | | | | | | |
| | 1,220 | | Central Michigan University Board of Trustees, General Revenue Bonds, Refunding Series 2014, 5.000%, 10/01/39 | 10/24 at 100.00 | | Aa3 | | | 1,374,452 | |
| | 1,000 | | Conner Creek Academy East, Michigan, Public School Revenue Bonds, Series 2007, 5.250%, 11/01/36 | 11/16 at 100.00 | | B+ | | | 724,670 | |
| | 1,255 | | Detroit Community High School, Michigan, Public School Academy Revenue Bonds, Series 2005, 5.750%, 11/01/30 | 11/15 at 100.00 | | B– | | | 901,253 | |
| | 500 | | Grand Valley State University, Michigan, General Revenue Bonds, Refunding Series 2014B, 5.000%, 12/01/28 | 12/24 at 100.00 | | A+ | | | 577,350 | |
| | 805 | | Michigan Finance Authority, Public School Academy Revenue Bonds, Detroit Service Learning Academy Project, Refunding Series 2011, 7.000%, 10/01/31 | 10/21 at 100.00 | | BB– | | | 842,626 | |
| | | | Michigan Higher Education Facilities Authority, Limited Obligation Revenue Refunding Bonds, Kettering University, Series 2001: | | | | | | | |
| | 1,685 | | 5.500%, 9/01/17 – AMBAC Insured | 3/16 at 100.00 | | N/R | | | 1,687,376 | |
| | 1,170 | | 5.000%, 9/01/26 – AMBAC Insured | 3/16 at 100.00 | | N/R | | | 1,170,199 | |
| | 240 | | Michigan Public Educational Facilities Authority, Charter School Revenue Bonds, American Montessori Academy, Series 2007, 6.500%, 12/01/37 | 12/17 at 100.00 | | N/R | | | 243,619 | |
| | 5,000 | | Michigan State University, General Revenue Bonds, Refunding Series 2010C, 5.000%, 2/15/40 | 2/20 at 100.00 | | AA+ | | | 5,570,000 | |
| | 7,790 | | Michigan State University, General Revenue Bonds, Series 2013A, 5.000%, 8/15/41 | 8/23 at 100.00 | | AA+ | | | 8,715,608 | |
| | 3,445 | | Michigan Technological University, General Revenue Bonds, Refunding Series 2012A, 5.000%, 10/01/34 | 10/21 at 100.00 | | A1 | | | 3,876,211 | |
| | 4,000 | | University of Michigan, General Revenue Bonds, Series 2014A, 5.000%, 4/01/44 | 4/24 at 100.00 | | AAA | | | 4,523,720 | |
| | 5,000 | | Wayne State University, Michigan, General Revenue Bonds, Refunding Series 2008, 5.000%, 11/15/35 – AGM Insured | No Opt. Call | | AA | | | 5,474,200 | |
| | 3,700 | | Wayne State University, Michigan, General Revenue Bonds, Series 2013A, 5.000%, 11/15/40 | 11/23 at 100.00 | | AA– | | | 4,101,043 | |
| | 525 | | Western Michigan University, General Revenue Bonds, Refunding Series 2011, 5.000%, 11/15/31 | 11/21 at 100.00 | | A1 | | | 576,229 | |
| | | | Western Michigan University, General Revenue Bonds, Refunding Series 2013: | | | | | | | |
| | 750 | | 5.250%, 11/15/33 – AGM Insured | 11/23 at 100.00 | | AA | | | 848,587 | |
| | 4,250 | | 5.000%, 11/15/39 – AGM Insured | 11/23 at 100.00 | | AA | | | 4,681,970 | |
| | | | Western Michigan University, General Revenue Bonds, Refunding Series 2015: | | | | | | | |
| | 1,500 | | 5.000%, 11/15/40 | 5/25 at 100.00 | | A1 | | | 1,660,290 | |
| | 1,135 | | 5.000%, 11/15/45 | 5/25 at 100.00 | | A1 | | | 1,249,476 | |
| | 44,970 | | Total Education and Civic Organizations | | | | | | 48,798,879 | |
| | | | Health Care – 23.1% (15.6% of Total Investments) | | | | | | | |
| | 4,000 | | Grand Traverse County Hospital Financial Authority, Michigan, Revenue Bonds, Munson Healthcare, Refunding Series 2011A, 5.000%, 7/01/29 | 7/21 at 100.00 | | AA– | | | 4,429,560 | |
| | 1,800 | | Jackson County Hospital Finance Authority, Michigan, Hospital Revenue Bonds, Allegiance Health, Refunding Series 2010A, 5.000%, 6/01/37 – AGM Insured | 6/20 at 100.00 | | AA | | | 1,964,016 | |
| | Principal | | | Optional Call | | | | | | |
| | Amount (000) | | Description (1) | Provisions (2) | | Ratings (3) | | | Value | |
| | | | Health Care (continued) | | | | | | | |
| | | | Kent Hospital Finance Authority, Michigan, Revenue Refunding Bonds, Spectrum Health System, Refunding Series 2011C: | | | | | | | |
| $ | 5,500 | | 5.000%, 1/15/31 | 1/22 at 100.00 | | AA | | $ | 6,046,425 | |
| | 2,000 | | 5.000%, 1/15/42 | 1/22 at 100.00 | | AA | | | 2,148,660 | |
| | 1,780 | | Michigan Finance Authority, Hospital Revenue Bonds, Beaumont Health Credit Group, Refunding Series 2015A, 5.000%, 8/01/32 | 8/24 at 100.00 | | A1 | | | 1,962,147 | |
| | 5,505 | | Michigan Finance Authority, Hospital Revenue Bonds, Crittenton Hospital Medical Center, Refunding Series 2012A, 5.000%, 6/01/39 | No Opt. Call | | BBB | | | 5,832,492 | |
| | 4,015 | | Michigan Finance Authority, Hospital Revenue Bonds, MidMichigan Health Credit Group, Refunding Series 2014, 5.000%, 6/01/39 | 6/24 at 100.00 | | A+ | | | 4,375,266 | |
| | 3,930 | | Michigan Finance Authority, Hospital Revenue Bonds, Oakwood Obligated Group, Refunding Series 2013, 5.000%, 8/15/31 | 8/23 at 100.00 | | A1 | | | 4,303,350 | |
| | 6,060 | | Michigan Finance Authority, Hospital Revenue Bonds, Sparrow Obligated Group, Refunding Series 2015, 5.000%, 11/15/45 | 5/25 at 100.00 | | A+ | | | 6,632,428 | |
| | 3,000 | | Michigan Finance Authority, Hospital Revenue Bonds, Sparrow Obligated Group, Series 2012, 5.000%, 11/15/42 | 11/22 at 100.00 | | A+ | | | 3,219,990 | |
| | | | Michigan Finance Authority, Revenue Bonds, Oakwood Obligated Group, Refunding Series 2012: | | | | | | | |
| | 1,000 | | 5.000%, 11/01/25 | 11/22 at 100.00 | | A1 | | | 1,133,350 | |
| | 1,000 | | 5.000%, 11/01/26 | No Opt. Call | | A1 | | | 1,126,570 | |
| | 3,750 | | 5.000%, 11/01/42 | 11/22 at 100.00 | | A1 | | | 3,975,450 | |
| | 9,650 | | Michigan Finance Authority, Revenue Bonds, Trinity Health Credit Group, Refunding Series 2011, 5.000%, 12/01/39 | 12/21 at 100.00 | | AA | | | 10,660,934 | |
| | | | Michigan State Hospital Finance Authority, Hospital Revenue Bonds, Henry Ford Health System, Refunding Series 2009: | | | | | | | |
| | 150 | | 5.000%, 11/15/20 | 11/19 at 100.00 | | A– | | | 168,110 | |
| | 7,300 | | 5.750%, 11/15/39 | 11/19 at 100.00 | | A– | | | 8,272,433 | |
| | 2,000 | | Michigan State Hospital Finance Authority, Hospital Revenue Refunding Bonds, Henry Ford Health System, Series 2006A, 5.250%, 11/15/46 | 11/16 at 100.00 | | A– | | | 2,069,100 | |
| | 1,000 | | Michigan State Hospital Finance Authority, Revenue Bonds, Trinity Health Care Group, Series 2009C, 5.000%, 12/01/48 | 6/22 at 100.00 | | AA | | | 1,074,040 | |
| | 4,880 | | Royal Oak Hospital Finance Authority, Michigan, Hospital Revenue Bonds, William Beaumont Hospital Obligated Group, Refunding Series 2014D, 5.000%, 9/01/39 | 3/24 at 100.00 | | A1 | | | 5,296,459 | |
| | 68,320 | | Total Health Care | | | | | | 74,690,780 | |
| | | | Housing/Multifamily – 4.4% (3.0% of Total Investments) | | | | | | | |
| | 2,675 | | Michigan Housing Development Authority, FNMA Limited Obligation Multifamily Housing Revenue Bonds, Parkview Place Apartments, Series 2002A, 5.550%, 12/01/34 (Alternative Minimum Tax) | 12/20 at 101.00 | | AA | | | 2,893,654 | |
| | 695 | | Michigan Housing Development Authority, Limited Obligation Revenue Bonds, Breton Village Green Project, Series 1993, 5.625%, 10/15/18 – AGM Insured | 10/15 at 100.00 | | AA | | | 701,672 | |
| | 810 | | Michigan Housing Development Authority, Limited Obligation Revenue Bonds, Walled Lake Villa Project, Series 1993, 6.000%, 4/15/18 – AGM Insured | 10/15 at 100.00 | | AA | | | 812,001 | |
| | | | Michigan Housing Development Authority, Multifamily Housing Revenue Bonds, Series 1988A: | | | | | | | |
| | 1,395 | | 3.375%, 11/01/16 (Alternative Minimum Tax) | 11/15 at 100.00 | | AA | | | 1,400,413 | |
| | 1,405 | | 3.875%, 11/01/17 (Alternative Minimum Tax) | 11/15 at 100.00 | | AA | | | 1,410,451 | |
| | 2,300 | | Michigan Housing Development Authority, Rental Housing Revenue Bonds, Series 2006D, 5.125%, 4/01/31 – AGM Insured (Alternative Minimum Tax) | 11/15 at 100.00 | | AA | | | 2,302,576 | |
| | 1,825 | | Michigan Housing Development Authority, Rental Housing Revenue Bonds, Series 2010A, 5.000%, 10/01/35 | 10/20 at 100.00 | | AA | | | 1,924,444 | |
| | 1,725 | | Michigan Housing Development Authority, Rental Housing Revenue Bonds, Series 2012A-2, 4.625%, 10/01/41 | 4/22 at 100.00 | | AA | | | 1,769,729 | |
| | 1,000 | | Michigan Housing Development Authority, Rental Housing Revenue Bonds, Series 2012D, 4.000%, 10/01/42 | No Opt. Call | | AA | | | 991,790 | |
| | 13,830 | | Total Housing/Multifamily | | | | | | 14,206,730 | |
| NUM | | |
| | Nuveen Michigan Quality Income Municipal Fund | |
| | Portfolio of Investments (continued) | August 31, 2015 (Unaudited) |
| | Principal | | | Optional Call | | | | | | |
| | Amount (000) | | Description (1) | Provisions (2) | | Ratings (3) | | | Value | |
| | | | Housing/Single Family – 0.9% (0.6% of Total Investments) | | | | | | | |
| $ | 2,495 | | Michigan Housing Development Authority, Single Family Homeownership Revenue Bonds, Series 2010C, 5.500%, 12/01/28 (Alternative Minimum Tax) | 6/20 at 100.00 | | AA+ | | $ | 2,635,294 | |
| | 380 | | Michigan Housing Development Authority, Single Family Homeownership Revenue Bonds, Series 2011A, 4.600%, 12/01/26 | 6/21 at 100.00 | | AA+ | | | 394,117 | |
| | 2,875 | | Total Housing/Single Family | | | | | | 3,029,411 | |
| | | | Tax Obligation/General – 36.9% (24.9% of Total Investments) | | | | | | | |
| | 2,310 | | Ann Arbor Public School District, Washtenaw County, Michigan, General Obligation Bonds, Refunding Series 2012, 5.000%, 5/01/29 | 5/22 at 100.00 | | Aa1 | | | 2,674,818 | |
| | 840 | | Ann Arbor Public School District, Washtenaw County, Michigan, General Obligation Bonds, School Building & Site Series 2015, 5.000%, 5/01/24 | No Opt. Call | | Aa2 | | | 1,004,875 | |
| | 2,200 | | Ann Arbor, Michigan, General Obligation Bonds, Court & Police Facilities Capital Improvement Series 2008, 5.000%, 5/01/38 | 5/18 at 100.00 | | AA+ | | | 2,387,066 | |
| | 100 | | Battle Creek School District, Calhoun County, Michigan, General Obligation Bonds, Series 2007, 5.000%, 5/01/37 – AGM Insured | 5/17 at 100.00 | | Aa1 | | | 105,517 | |
| | | | Byron Center Public Schools, Kent County, Michigan, General Obligation Bonds, Series 2012: | | | | | | | |
| | 1,000 | | 4.000%, 5/01/32 | 5/21 at 100.00 | | AA– | | | 1,025,980 | |
| | 500 | | 4.000%, 5/01/33 | 5/21 at 100.00 | | AA– | | | 512,040 | |
| | 1,135 | | Caledonia Community Schools, Kent, Allegan and Barry Counties, Michigan, General Obligation Bonds, School Building & Site Series 2014, 5.000%, 5/01/39 | 5/24 at 100.00 | | AA– | | | 1,247,910 | |
| | 7,740 | | Caledonia Community Schools, Kent, Allegan and Barry Counties, Michigan, General Obligation Bonds, Series 2007, 4.750%, 5/01/32 – NPFG Insured | 5/17 at 100.00 | | Aa1 | | | 8,126,149 | |
| | 875 | | Charlotte Public School District, Easton County, Michigan, General Obligation Bonds, Refunding Series 2012, 5.000%, 5/01/20 | No Opt. Call | | AA– | | | 999,775 | |
| | | | Comstock Park Public Schools, Kent County, Michigan, General Obligation Bonds, School Building & Site, Series 2011B: | | | | | | | |
| | 1,200 | | 5.500%, 5/01/36 | 5/21 at 100.00 | | AA– | | | 1,386,324 | |
| | 2,190 | | 5.500%, 5/01/41 | 5/21 at 100.00 | | AA– | | | 2,520,055 | |
| | | | Detroit-Wayne County Stadium Authority, Michigan, Wayne County Limited Tax General Obligation Bonds, Building Authority Stadium Refunding Series 2012: | | | | | | | |
| | 1,040 | | 5.000%, 10/01/19 – AGM Insured | No Opt. Call | | AA | | | 1,139,455 | |
| | 2,615 | | 5.000%, 10/01/20 – AGM Insured | No Opt. Call | | AA | | | 2,889,000 | |
| | 1,000 | | 5.000%, 10/01/21 – AGM Insured | No Opt. Call | | AA | | | 1,105,600 | |
| | 1,645 | | 5.000%, 10/01/22 – AGM Insured | No Opt. Call | | AA | | | 1,827,167 | |
| | 4,850 | | 5.000%, 10/01/26 – AGM Insured | 10/22 at 100.00 | | AA | | | 5,230,192 | |
| | | | Grand Rapids and Kent County Joint Building Authority, Michigan, Limited Tax General Obligation Bonds, Devos Place Project, Series 2001: | | | | | | | |
| | 8,900 | | 0.000%, 12/01/25 | No Opt. Call | | AAA | | | 6,704,726 | |
| | 3,000 | | 0.000%, 12/01/26 | No Opt. Call | | AAA | | | 2,169,750 | |
| | 100 | | 0.000%, 12/01/27 | No Opt. Call | | AAA | | | 69,926 | |
| | 5,305 | | 0.000%, 12/01/29 | No Opt. Call | | AAA | | | 3,415,041 | |
| | | | Grand Rapids, Michigan, General Obligation Bonds, Capital Improvement Series 2007: | | | | | | | |
| | 860 | | 5.000%, 9/01/24 – NPFG Insured | 9/17 at 100.00 | | AA | | | 928,095 | |
| | 2,000 | | 5.000%, 9/01/27 – NPFG Insured | 9/17 at 100.00 | | AA | | | 2,140,200 | |
| | 1,025 | | Kent County, Michigan, General Obligation Bonds, Limited Tax Series 2015, 5.000%, 1/01/34 | 1/25 at 100.00 | | AAA | | | 1,180,851 | |
| | 3,440 | | Kent County, Michigan, General Obligation Bonds, Refunding Limited Tax Series 2015, 5.000%, 1/01/31 | 1/25 at 100.00 | | AAA | | | 4,008,494 | |
| | | | Lake Saint Claire Clean Water Drain Drainage District, Macomb County, Michigan, General Obligation Bonds, Series 2013: | | | | | | | |
| | 1,000 | | 5.000%, 10/01/25 | 10/23 at 100.00 | | AA+ | | | 1,167,190 | |
| | 1,020 | | 5.000%, 10/01/26 | 10/23 at 100.00 | | AA+ | | | 1,179,100 | |
| | 2,505 | | Lincoln Consolidated School District, Washtenaw and Wayne Counties, Michigan, General Obligation Bonds, Series 2006, 5.000%, 5/01/25 – NPFG Insured | 5/16 at 100.00 | | Aa1 | | | 2,575,716 | |
| | Principal | | | Optional Call | | | | | | |
| | Amount (000) | | Description (1) | Provisions (2) | | Ratings (3) | | | Value | |
| | | | Tax Obligation/General (continued) | | | | | | | |
| $ | 2,160 | | Lowell Area Schools, Kent and Ionia Counties, Michigan, General Obligation Bonds, Series 2007, 5.000%, 5/01/37 – AGM Insured | 5/17 at 100.00 | | Aa1 | | $ | 2,277,698 | |
| | 1,925 | | Marshall Public Schools, Calhoun County, Michigan, General Obligation Bonds, Series 2007, 5.000%, 5/01/30 – SYNCORA GTY Insured | 5/17 at 100.00 | | AA– | | | 1,987,062 | |
| | 4,000 | | Michigan State, General Obligation Bonds, Environmental Program, Refunding Series 2011A, 5.000%, 12/01/22 | 12/21 at 100.00 | | Aa1 | | | 4,713,600 | |
| | 1,000 | | Michigan State, General Obligation Bonds, Environmental Program, Series 2009A, 5.500%, 11/01/25 | 5/19 at 100.00 | | Aa1 | | | 1,132,930 | |
| | 2,500 | | Montrose School District, Michigan, School Building and Site Bonds, Series 1997, 6.000%, 5/01/22 – NPFG Insured | No Opt. Call | | Aa2 | | | 2,906,700 | |
| | 2,945 | | Muskegon Community College District, Michigan, General Obligation Bonds, Community Facility Series 2013I, 5.000%, 5/01/38 – BAM Insured | 5/24 at 100.00 | | AA | | | 3,393,877 | |
| | | | Muskegon County, Michigan, General Obligation Wastewater Bonds, Management System 1, Refunding Series 2015: | | | | | | | |
| | 1,350 | | 5.000%, 11/01/33 | 11/25 at 100.00 | | AA | | | 1,523,151 | |
| | 1,730 | | 5.000%, 11/01/36 | 11/25 at 100.00 | | AA | | | 1,934,590 | |
| | 1,410 | | New Haven Community Schools, Macomb County, Michigan, General Obligation Bonds, Series 2006, 5.000%, 5/01/25 – AGM Insured | 5/16 at 100.00 | | Aa1 | | | 1,451,835 | |
| | 6,820 | | Oakland Intermediate School District, Oakland County, Michigan, General Obligation Bonds, Series 2007, 5.000%, 5/01/36 – AGM Insured | 5/17 at 100.00 | | Aaa | | | 7,209,013 | |
| | 5,785 | | Parchment School District, Kalamazoo County, Michigan, General Obligation Bonds, Series 2007, 4.750%, 5/01/36 – AGM Insured | 5/17 at 100.00 | | Aa1 | | | 6,057,011 | |
| | 750 | | Plainwell Community Schools, Allegan County, Michigan, General Obligation Bonds, School Building & Site, Series 2008, 5.000%, 5/01/28 – AGC Insured | 5/18 at 100.00 | | Aa1 | | | 816,390 | |
| | | | Port Huron, Michigan, General Obligation Bonds, Refunding & Capital Improvement Series 2011: | | | | | | | |
| | 1,585 | | 5.000%, 10/01/31 – AGM Insured | 10/21 at 100.00 | | AA | | | 1,719,630 | |
| | 640 | | 5.250%, 10/01/37 – AGM Insured | 10/21 at 100.00 | | AA | | | 698,310 | |
| | | | Port Huron, Michigan, General Obligation Bonds, Series 2011B: | | | | | | | |
| | 530 | | 5.000%, 10/01/31 – AGM Insured | 10/21 at 100.00 | | AA | | | 575,018 | |
| | 800 | | 5.250%, 10/01/40 – AGM Insured | 10/21 at 100.00 | | AA | | | 867,872 | |
| | 500 | | Rockford Public Schools, Kent County, Michigan, General Obligation Bonds, Refunding Series 2012, 5.000%, 5/01/19 | No Opt. Call | | AA– | | | 563,030 | |
| | 2,100 | | Rockford Public Schools, Kent County, Michigan, General Obligation Bonds, Series 2008, 5.000%, 5/01/33 – AGM Insured | 5/18 at 100.00 | | Aa1 | | | 2,267,139 | |
| | 625 | | Royal Oak City School District, Oakland County, Michigan, General Obligation Bonds, Refunding Series 2014, 5.000%, 5/01/20 | No Opt. Call | | Aa2 | | | 721,813 | |
| | 1,435 | | South Haven Public Schools, Van Buren County, Michigan, General Obligation Bonds, School Building & Site, Series 2014A, 5.000%, 5/01/41 – BAM Insured | 5/24 at 100.00 | | AA | | | 1,579,992 | |
| | 350 | | South Haven, Van Buren County, Michigan, General Obligation Bonds, Capital Improvement Series 2009, 5.125%, 12/01/33 – AGC Insured | 12/19 at 100.00 | | AA | | | 395,409 | |
| | 3,600 | | Trenton Public Schools District, Michigan, General Obligation Bonds, Series 2008, 5.000%, 5/01/34 – AGM Insured | 5/18 at 100.00 | | Aa1 | | | 3,886,524 | |
| | 550 | | Troy School District, Oakland County, Michigan, General Obligation Bonds, Refunding Series 2015, 5.000%, 5/01/26 | 5/25 at 100.00 | | AA | | | 650,996 | |
| | | | Van Dyke Public Schools, Macomb County, Michigan, General Obligation Bonds, School Building & Site, Series 2008: | | | | | | | |
| | 1,110 | | 5.000%, 5/01/31 – AGM Insured | 5/18 at 100.00 | | Aa1 | | | 1,200,554 | |
| | 2,150 | | 5.000%, 5/01/38 – AGM Insured | 5/18 at 100.00 | | Aa1 | | | 2,322,279 | |
| | 1,600 | | Walled Lake Consolidated School District, Oakland County, Michigan, General Obligation Bonds, School Building & Site Series 2014, 5.000%, 5/01/40 | 11/23 at 100.00 | | Aa1 | | | 1,776,320 | |
| | 1,500 | | Wayne Charter County, Michigan, Limited Tax General Obligation Airport Hotel Revenue Bonds, Detroit Metropolitan Wayne County Airport, Series 2001A, 5.500%, 12/01/18 – NPFG Insured | 11/15 at 100.00 | | AA– | | | 1,505,430 | |
| NUM | | |
| | Nuveen Michigan Quality Income Municipal Fund | |
| | Portfolio of Investments (continued) | August 31, 2015 (Unaudited) |
| | Principal | | | Optional Call | | | | | | |
| | Amount (000) | | Description (1) | Provisions (2) | | Ratings (3) | | | Value | |
| | | | Tax Obligation/General (continued) | | | | | | | |
| $ | 1,725 | | Williamston Community School District, Michigan, Unlimited Tax General Obligation QSBLF Bonds, Series 1996, 5.500%, 5/01/25 – NPFG Insured | No Opt. Call | | Aa2 | | $ | 1,977,126 | |
| | 1,475 | | Willow Run Community Schools, Washtenaw County, Michigan, General Obligation Bonds, Refunding Series 2011, 4.500%, 5/01/31 – AGM Insured | 5/21 at 100.00 | | AA | | | 1,579,917 | |
| | 115,045 | | Total Tax Obligation/General | | | | | | 119,412,228 | |
| | | | Tax Obligation/Limited – 19.7% (13.3% of Total Investments) | | | | | | | |
| | | | Grand Rapids Building Authority, Kent County, Michigan, General Obligation Bonds, Refunding Series 2011: | | | | | | | |
| | 560 | | 5.000%, 10/01/28 | 10/21 at 100.00 | | AA | | | 641,094 | |
| | 500 | | 5.000%, 10/01/30 | 10/21 at 100.00 | | AA | | | 570,855 | |
| | 500 | | 5.000%, 10/01/31 | 10/21 at 100.00 | | AA | | | 567,770 | |
| | 1,000 | | Grand Rapids Building Authority, Kent County, Michigan, Limited Tax General Obligation Bonds, Series 1998, 5.000%, 4/01/16 | No Opt. Call | | AA | | | 1,026,950 | |
| | | | Michigan Finance Authority, Local Government Loan Program Revenue Bonds, Detroit Regional Convention Facility Authority Local Project, Series 2014H-1: | | | | | | | |
| | 1,240 | | 5.000%, 10/01/20 | 10/19 at 100.00 | | AA– | | | 1,394,343 | |
| | 2,000 | | 5.000%, 10/01/24 | 10/23 at 100.00 | | AA– | | | 2,329,620 | |
| | 2,000 | | 5.000%, 10/01/25 | 10/24 at 100.00 | | AA– | | | 2,340,640 | |
| | 11,025 | | 5.000%, 10/01/39 | 10/24 at 100.00 | | AA– | | | 12,175,569 | |
| | 4,730 | | Michigan Finance Authority, Unemployment Obligation Assessment Revenue Bonds, Series 2012B, 5.000%, 7/01/22 | 7/16 at 100.00 | | AAA | | | 4,917,497 | |
| | | | Michigan State Building Authority, Revenue Bonds, Facilities Program, Series 2005II: | | | | | | | |
| | 1,600 | | 5.000%, 10/15/30 – AMBAC Insured | 10/15 at 100.00 | | Aa3 | | | 2,147,767 | |
| | 2,135 | | 5.000%, 10/15/33 – AMBAC Insured | 10/15 at 100.00 | | Aa3 | | | 1,609,568 | |
| | | | Michigan State Building Authority, Revenue Bonds, Refunding Series 2006IA: | | | | | | | |
| | 7,000 | | 0.000%, 10/15/27 – AGM Insured | 10/16 at 58.27 | | AA | | | 4,014,500 | |
| | 7,720 | | 0.000%, 10/15/28 – AGM Insured | 10/16 at 55.35 | | AA | | | 4,201,764 | |
| | 1,500 | | 0.000%, 10/15/30 – FGIC Insured | 10/16 at 50.02 | | AA– | | | 731,190 | |
| | 8,040 | | 5.000%, 10/15/36 – FGIC Insured | 10/16 at 100.00 | | AA– | | | 8,352,193 | |
| | 4,000 | | Michigan State Building Authority, Revenue Refunding Bonds, Facilities Program, Refunding Series 2015-I, 5.000%, 4/15/38 | 10/25 at 100.00 | | Aa2 | | | 4,478,600 | |
| | | | Michigan State Trunk Line Fund Bonds, Series 2011: | | | | | | | |
| | 1,100 | | 5.000%, 11/15/24 | 11/21 at 100.00 | | AA+ | | | 1,275,384 | |
| | 1,750 | | 5.000%, 11/15/29 | 11/21 at 100.00 | | AA+ | | | 2,041,900 | |
| | 1,605 | | 5.000%, 11/15/31 | 11/21 at 100.00 | | AA+ | | | 1,857,948 | |
| | 1,160 | | 4.000%, 11/15/32 | 11/21 at 100.00 | | AA+ | | | 1,205,843 | |
| | 1,970 | | 5.000%, 11/15/36 | 11/21 at 100.00 | | AA+ | | | 2,227,814 | |
| | | | Michigan State, Comprehensive Transportation Revenue Bonds, Refunding Series 2015: | | | | | | | |
| | 1,065 | | 5.000%, 11/15/19 | No Opt. Call | | AA+ | | | 1,228,818 | |
| | 1,950 | | 5.000%, 11/15/29 | 11/24 at 100.00 | | AA+ | | | 2,297,666 | |
| | 66,150 | | Total Tax Obligation/Limited | | | | | | 63,635,293 | |
| | | | Transportation – 3.8% (2.5% of Total Investments) | | | | | | | |
| | 4,500 | | Wayne County Airport Authority, Michigan, Revenue Bonds, Detroit Metropolitan Airport, Refunding Series 2011A, 5.000%, 12/01/21 (Alternative Minimum Tax) | No Opt. Call | | A | | | 5,180,265 | |
| | | | Wayne County Airport Authority, Michigan, Revenue Bonds, Detroit Metropolitan Wayne County Airport, Series 2012A: | | | | | | | |
| | 2,345 | | 5.000%, 12/01/23 | No Opt. Call | | A | | | 2,714,314 | |
| | 4,000 | | 5.000%, 12/01/42 – AGM Insured | 12/22 at 100.00 | | AA | | | 4,370,360 | |
| | 10,845 | | Total Transportation | | | | | | 12,264,939 | |
| | Principal | | | Optional Call | | | | | | |
| | Amount (000) | | Description (1) | Provisions (2) | | Ratings (3) | | | Value | |
| | | | U.S. Guaranteed – 10.9% (7.3% of Total Investments) (4) | | | | | | | |
| $ | 1,650 | | Holly Area School District, Oakland County, Michigan, General Obligation Bonds, Series 2006, 5.125%, 5/01/32 (Pre-refunded 5/01/16) – NPFG Insured | 5/16 at 100.00 | | Aa1 (4) | | $ | 1,703,971 | |
| | 3,185 | | Kalamazoo Public Schools, Michigan, General Obligation Bonds, Series 2006, 5.000%, 5/01/25 (Pre-refunded 5/01/16) – AGM Insured | 5/16 at 100.00 | | AA (4) | | | 3,286,538 | |
| | 230 | | Kent County, Michigan, Airport Revenue Bonds, Gerald R. Ford International Airport, Series 2007, 5.000%, 1/01/32 (Pre-refunded 1/01/17) | 1/17 at 100.00 | | AAA | | | 243,910 | |
| | 830 | | Michigan Municipal Bond Authority, Clean Water Revolving Fund Revenue Bonds, Series 2005, 5.000%, 10/01/19 (Pre-refunded 10/01/15) | 10/15 at 100.00 | | N/R (4) | | | 833,403 | |
| | 4,000 | | Michigan State Hospital Finance Authority, Hospital Revenue Bonds, MidMichigan Obligated Group, Series 2009A, 5.875%, 6/01/39 (Pre-refunded 6/01/19) – AGC Insured | 6/19 at 100.00 | | AA+ (4) | | | 4,702,680 | |
| | 3,415 | | Michigan State Hospital Finance Authority, Hospital Revenue Refunding Bonds, St. John's Health System, Series 1998A, 5.000%, 5/15/28 – AMBAC Insured (ETM) | 11/15 at 100.00 | | Aaa | | | 3,428,626 | |
| | | | Ottawa County, Michigan, Water Supply System, General Obligation Bonds, Series 2007: | | | | | | | |
| | 4,330 | | 5.000%, 8/01/26 (Pre-refunded 8/01/17) – NPFG Insured (UB) | 8/17 at 100.00 | | Aaa | | | 4,692,031 | |
| | 5,620 | | 5.000%, 8/01/30 (Pre-refunded 8/01/17) – NPFG Insured (UB) | 8/17 at 100.00 | | Aaa | | | 6,089,888 | |
| | 3,640 | | Royal Oak Hospital Finance Authority, Michigan, Hospital Revenue Bonds, William Beaumont Hospital Obligated Group, Refunding Series 2009W, 6.000%, 8/01/39 (Pre-refunded 8/01/19) | 8/19 at 100.00 | | A1 (4) | | | 4,315,948 | |
| | 1,500 | | Royal Oak Hospital Finance Authority, Michigan, Hospital Revenue Bonds, William Beaumont Hospital, Refunding Series 2009V, 8.250%, 9/01/39 (Pre-refunded 9/01/18) | 9/18 at 100.00 | | Aaa | | | 1,824,990 | |
| | 1,535 | | Thornapple Kellogg School District, Barry County, Michigan, General Obligation Bonds, Series 2007, 5.000%, 5/01/32 (Pre-refunded 5/01/17) – NPFG Insured | 5/17 at 100.00 | | Aa1 (4) | | | 1,648,483 | |
| | 2,275 | | Troy City School District, Oakland County, Michigan, General Obligation Bonds, Series 2006, 5.000%, 5/01/19 (Pre-refunded 5/01/16) – NPFG Insured | 5/16 at 100.00 | | Aa1 (4) | | | 2,347,527 | |
| | 32,210 | | Total U.S. Guaranteed | | | | | | 35,117,995 | |
| | | | Utilities – 12.9% (8.7% of Total Investments) | | | | | | | |
| | | | Holland, Michigan, Electric Utility System Revenue Bonds, Series 2014A: | | | | | | | |
| | 2,750 | | 5.000%, 7/01/33 | 7/21 at 100.00 | | AA | | | 3,104,998 | |
| | 6,020 | | 5.000%, 7/01/39 | No Opt. Call | | AA | | | 6,776,654 | |
| | | | Lansing Board of Water and Light, Michigan, Steam and Electric Utility System Revenue Bonds, Series 2008A: | | | | | | | |
| | 390 | | 5.000%, 7/01/28 | 7/18 at 100.00 | | AA– | | | 427,167 | |
| | 8,250 | | 5.000%, 7/01/32 | 7/18 at 100.00 | | AA– | | | 8,924,768 | |
| | | | Lansing Board of Water and Light, Michigan, Utility System Revenue Bonds, Tender Option Bond Trust 4700: | | | | | | | |
| | 1,700 | | 18.344%, 7/01/37 (IF) (5) | 7/21 at 100.00 | | AA– | | | 2,479,960 | |
| | 1,110 | | 18.344%, 7/01/37 (IF) (5) | 7/21 at 100.00 | | AA– | | | 1,619,268 | |
| | | | Michigan Public Power Agency, AFEC Project Revenue Bonds, Series 2012A: | | | | | | | |
| | 1,900 | | 5.000%, 1/01/27 | 1/22 at 100.00 | | A2 | | | 2,092,280 | |
| | 4,530 | | 5.000%, 1/01/43 | 1/22 at 100.00 | | A2 | | | 4,801,800 | |
| | | | Michigan Public Power Agency, Revenue Bonds, Combustion Turbine 1 Project, Refunding Series 2011: | | | | | | | |
| | 1,760 | | 5.000%, 1/01/24 – AGM Insured | 1/21 at 100.00 | | AA | | | 1,982,112 | |
| | 1,990 | | 5.000%, 1/01/25 – AGM Insured | 1/21 at 100.00 | | AA | | | 2,225,298 | |
| | 2,180 | | 5.000%, 1/01/26 – AGM Insured | 1/21 at 100.00 | | AA | | | 2,420,563 | |
| | 290 | | 5.000%, 1/01/27 – AGM Insured | 1/21 at 100.00 | | AA | | | 319,882 | |
| | 3,640 | | Michigan Strategic Fund, Limited Obligation Revenue Refunding Bonds, Detroit Edison Company, Series 1991BB, 7.000%, 5/01/21 – AMBAC Insured | No Opt. Call | | Aa3 | | | 4,591,933 | |
| | 36,510 | | Total Utilities | | | | | | 41,766,683 | |
| NUM | | |
| | Nuveen Michigan Quality Income Municipal Fund | |
| | Portfolio of Investments (continued) | August 31, 2015 (Unaudited) |
| | Principal | | | Optional Call | | | | | | |
| | Amount (000) | | Description (1) | Provisions (2) | | Ratings (3) | | | Value | |
| | | | Water and Sewer – 16.0% (10.8% of Total Investments) | | | | | | | |
| $ | 425 | | Detroit, Michigan, Sewage Disposal System Revenue Bonds, Second Lien Series 2006A, 5.500%, 7/01/36 – BHAC Insured | 7/18 at 100.00 | | AA+ | | $ | 463,798 | |
| | 10,100 | | Detroit, Michigan, Water Supply System Second Lien Revenue Bonds, Series 2006A, 5.000%, 7/01/34 – AGM Insured | 7/16 at 100.00 | | AA | | | 10,277,154 | |
| | 190 | | Detroit, Michigan, Water Supply System Second Lien Revenue Refunding Bonds, Series 2006C, 5.000%, 7/01/33 – AGM Insured | No Opt. Call | | AA | | | 193,333 | |
| | | | Grand Rapids, Michigan, Sanitary Sewer System Revenue Bonds, Improvement & Refunding Series 2014: | | | | | | | |
| | 1,000 | | 5.000%, 1/01/32 | 1/24 at 100.00 | | AA+ | | | 1,152,030 | |
| | 1,000 | | 5.000%, 1/01/33 | 1/24 at 100.00 | | AA+ | | | 1,148,050 | |
| | 1,000 | | 5.000%, 1/01/34 | 1/24 at 100.00 | | AA+ | | | 1,143,290 | |
| | 1,855 | | 5.000%, 1/01/44 | 1/24 at 100.00 | | AA+ | | | 2,085,910 | |
| | 1,190 | | Grand Rapids, Michigan, Sanitary Sewer System Revenue Bonds, Series 2008, 5.000%, 1/01/38 | 1/18 at 100.00 | | AA+ | | | 1,278,869 | |
| | 2,605 | | Grand Rapids, Michigan, Water Supply System Revenue Bonds, Series 2009, 5.100%, 1/01/39 – AGC Insured | 1/19 at 100.00 | | AA | | | 2,864,979 | |
| | | | Michigan Finance Authority, Local Government Loan Program Revenue Bonds, Detroit Water & Sewerage Department Water Supply System Local Project, Refunding Senior Loan Series 2014D-1: | | | | | | | |
| | 1,500 | | 5.000%, 7/01/35 – AGM Insured | 7/24 at 100.00 | | AA | | | 1,635,090 | |
| | 1,220 | | 5.000%, 7/01/37 – AGM Insured | 7/24 at 100.00 | | AA | | | 1,324,151 | |
| | | | Michigan Finance Authority, State Revolving Fund Revenue Bonds, Clean Water Series 2012: | | | | | | | |
| | 2,000 | | 5.000%, 10/01/31 | 10/22 at 100.00 | | AAA | | | 2,298,900 | |
| | 1,135 | | 5.000%, 10/01/32 | 10/22 at 100.00 | | AAA | | | 1,300,676 | |
| | | | Michigan Finance Authority, State Revolving Fund Revenue Bonds, Clean Water Subordinate Refunding Series 2013: | | | | | | | |
| | 1,955 | | 5.000%, 10/01/22 | No Opt. Call | | AAA | | | 2,353,409 | |
| | 3,200 | | 5.000%, 10/01/25 | 10/22 at 100.00 | | AAA | | | 3,792,160 | |
| | 2,000 | | Michigan Finance Authority, State Revolving Fund Revenue Bonds, Clean Water, Refunding Series 2012, 5.000%, 10/01/20 | No Opt. Call | | AAA | | | 2,352,580 | |
| | 580 | | Michigan Municipal Bond Authority, Clean Water Revolving Fund Revenue Bonds, Series 2004, 5.000%, 10/01/19 | 11/15 at 100.00 | | AAA | | | 582,355 | |
| | 170 | | Michigan Municipal Bond Authority, Clean Water Revolving Fund Revenue Bonds, Series 2005, 5.000%, 10/01/19 | 10/15 at 100.00 | | AAA | | | 170,690 | |
| | | | Michigan Municipal Bond Authority, Clean Water Revolving Fund Revenue Bonds, Series 2010: | | | | | | | |
| | 390 | | 5.000%, 10/01/26 | No Opt. Call | | AAA | | | 450,458 | |
| | 475 | | 5.000%, 10/01/30 | No Opt. Call | | AAA | | | 544,963 | |
| | 90 | | Michigan Municipal Bond Authority, Drinking Water Revolving Fund Revenue Bonds, Series 2004, 5.000%, 10/01/23 | 11/15 at 100.00 | | AAA | | | 90,363 | |
| | | | Michigan Municipal Bond Authority, Water Revolving Fund Revenue Bonds, Series 2007: | | | | | | | |
| | 500 | | 5.000%, 10/01/23 | 10/17 at 100.00 | | AAA | | | 543,940 | |
| | 2,000 | | 5.000%, 10/01/24 | 10/17 at 100.00 | | AAA | | | 2,175,760 | |
| | 8,245 | | North Kent Sewer Authority, Michigan, Sewer Revenue Bonds, Series 2006, 5.000%, 11/01/31 – NPFG Insured | 11/16 at 100.00 | | AA | | | 8,573,975 | |
| | | | Port Huron, Michigan, Water Supply System Revenue Bonds, Series 2011: | | | | | | | |
| | 500 | | 5.250%, 10/01/31 | 10/21 at 100.00 | | A | | | 542,990 | |
| | 1,500 | | 5.625%, 10/01/40 | 10/21 at 100.00 | | A | | | 1,677,600 | |
| | Principal | | | Optional Call | | | | | | |
| | Amount (000) | | Description (1) | Provisions (2) | | Ratings (3) | | | Value | |
| | | | Water and Sewer (continued) | | | | | | | |
| $ | 700 | | Saginaw, Michigan, Water Supply System Revenue Bonds, Series 2008, 5.250%, 7/01/22 – NPFG Insured | 7/18 at 100.00 | | AA– | | $ | 764,400 | |
| | 47,525 | | Total Water and Sewer | | | | | | 51,781,873 | |
| $ | 454,030 | | Total Long-Term Investments (cost $451,587,647) | | | | | | 479,407,408 | |
| | | | Floating Rate Obligations – (2.1)% | | | | | | (6,625,000 | ) |
| | | | Variable Rate MuniFund Term Preferred Shares, at Liquidation Value – (49.2)% (6) | | | | | | (159,000,000 | ) |
| | | | Other Assets Less Liabilities – 3.0% | | | | | | 9,463,121 | |
| | | | Net Assets Applicable to Common Shares – 100% | | | | | $ | 323,245,529 | |
| (1) | All percentages shown in the Portfolio of Investments are based on net assets applicable to common shares unless otherwise noted. |
| (2) | Optional Call Provisions: Dates (month and year) and prices of the earliest optional call or redemption. There may be other call provisions at varying prices at later dates. Certain mortgage-backed securities may be subject to periodic principal paydowns. |
| (3) | Ratings: Using the highest of Standard & Poor's Group ("Standard & Poor's"), Moody's Investors Service, Inc. ("Moody's") or Fitch, Inc. ("Fitch") rating. Ratings below BBB by Standard & Poor's, Baa by Moody's or BBB by Fitch are considered to be below investment grade. Holdings designated N/R are not rated by any of these national rating agencies. |
| (4) | Backed by an escrow or trust containing sufficient U.S. Government or U.S. Government agency securities, which ensure the timely payment of principal and interest. Certain bonds backed by U.S. Government or agency securities are regarded as having an implied rating equal to the rating of such securities. |
| (5) | Investment, or portion of investment, has been pledged to collateralize the net payment obligations for investments in inverse floating rate transactions. |
| (6) | Variable Rate MuniFund Term Preferred Shares, at Liquidation Value as a percentage of Total Investments is 33.2%. |
| (ETM) | Escrowed to maturity. |
| (IF) | Inverse floating rate investment. |
| (UB) | Underlying bond of an inverse floating rate trust reflected as a financing transaction. See Notes to Financial Statements, Note 3 – Portfolio Securities and Investments in Derivatives, Inverse Floating Rate Securities for more information. |
See accompanying notes to financial statements.
| NUO | | |
| | Nuveen Ohio Quality Income Municipal Fund | |
| | Portfolio of Investments | August 31, 2015 (Unaudited) |
| | Principal | | | Optional Call | | | | | | |
| | Amount (000) | | Description (1) | Provisions (2) | | Ratings (3) | | | Value | |
| | | | LONG-TERM INVESTMENTS – 146.4% (100.0% of Total Investments) | | | | | | | |
| | | | MUNICIPAL BONDS – 146.4% (100.0% of Total Investments) | | | | | | | |
| | | | Consumer Staples – 4.5% (3.1% of Total Investments) | | | | | | | |
| $ | 400 | | Buckeye Tobacco Settlement Financing Authority, Ohio, Tobacco Settlement Asset-Backed Revenue Bonds, Senior Lien, Series 2007A-1, 5.000%, 6/01/16 | No Opt. Call | | Aaa | | $ | 410,516 | |
| | | | Buckeye Tobacco Settlement Financing Authority, Ohio, Tobacco Settlement Asset-Backed Revenue Bonds, Senior Lien, Series 2007A-2: | | | | | | | |
| | 15,035 | | 5.125%, 6/01/24 | 6/17 at 100.00 | | B– | | | 12,579,935 | |
| | 1,085 | | 5.875%, 6/01/47 | 6/17 at 100.00 | | B | | | 874,879 | |
| | 16,520 | | Total Consumer Staples | | | | | | 13,865,330 | |
| | | | Education and Civic Organizations – 8.5% (5.8% of Total Investments) | | | | | | | |
| | 4,375 | | Miami University of Ohio, General Receipts Bonds, Refunding Series 2014, 5.000%, 9/01/33 | 9/24 at 100.00 | | AA | | | 5,027,181 | |
| | | | Miami University of Ohio, General Receipts Bonds, Series 2011: | | | | | | | |
| | 130 | | 5.000%, 9/01/33 | No Opt. Call | | AA | | | 149,072 | |
| | 1,960 | | 5.000%, 9/01/36 | 9/21 at 100.00 | | AA | | | 2,230,029 | |
| | | | Miami University of Ohio, General Receipts Bonds, Series 2012: | | | | | | | |
| | 480 | | 4.000%, 9/01/32 | 9/22 at 100.00 | | AA | | | 500,237 | |
| | 1,000 | | 4.000%, 9/01/33 | 9/22 at 100.00 | | AA | | | 1,038,990 | |
| | 370 | | Ohio Higher Education Facilities Commission, General Revenue Bonds, Kenyon College, Series 2006, 5.000%, 7/01/41 | 7/16 at 100.00 | | A+ | | | 380,490 | |
| | 2,280 | | Ohio Higher Educational Facilities Commission, General Revenue Bonds, University of Dayton, 2006 Project, Series 2006, 5.000%, 12/01/30 – AMBAC Insured | 12/16 at 100.00 | | A | | | 2,380,388 | |
| | | | Ohio Higher Educational Facilities Commission, Revenue Bonds, Denison University Project, Series 2012: | | | | | | | |
| | 120 | | 5.000%, 11/01/27 | 5/22 at 100.00 | | AA | | | 137,743 | |
| | 590 | | 5.000%, 11/01/32 | 5/22 at 100.00 | | AA | | | 665,355 | |
| | 5,000 | | Ohio Higher Educational Facilities Commission, Revenue Bonds, University of Dayton, Series 2013, 5.000%, 12/01/43 | 12/22 at 100.00 | | A | | | 5,496,500 | |
| | 2,500 | | Ohio Higher Educational Facility Commission, Revenue Bonds, Kenyon College, Series 2015, 5.000%, 7/01/41 | 7/25 at 100.00 | | A+ | | | 2,763,575 | |
| | 2,250 | | Ohio State Higher Education Facilities, Revenue Bonds, Case Western Reserve University, Series 2006, 5.000%, 12/01/44 – NPFG Insured | 12/16 at 100.00 | | AA– | | | 2,349,067 | |
| | 950 | | Ohio State, Higher Educational Facility Revenue Bonds, Otterbein College Project, Series 2008A, 5.500%, 12/01/28 | 12/18 at 100.00 | | A3 | | | 1,052,191 | |
| | 1,000 | | Ohio University at Athens, General Receipts Bonds, Series 2013, 5.000%, 12/01/39 | 12/22 at 100.00 | | Aa3 | | | 1,108,770 | |
| | 1,000 | | Tuscarawas County Economic Development and Finance Alliance, Ohio, Higher Education Facilities Revenue Bonds, Ashland University, Refunding & Improvement Series 2015, 6.000%, 3/01/45 | 3/25 at 100.00 | | N/R | | | 1,003,590 | |
| | 24,005 | | Total Education and Civic Organizations | | | | | | 26,283,178 | |
| | | | Health Care – 31.0% (21.2% of Total Investments) | | | | | | | |
| | 3,000 | | Akron, Bath and Copley Joint Township Hospital District, Ohio, Hospital Revenue Bonds, Children's Hospital Medical Center, Improvement Series 2013, 5.000%, 11/15/38 | 5/23 at 100.00 | | A1 | | | 3,235,230 | |
| | 1,950 | | Allen County, Ohio, Hospital Facilities Revenue Bonds, Catholic Healthcare Partners, Series 2010A, 5.250%, 6/01/38 | 6/20 at 100.00 | | AA– | | | 2,175,732 | |
| | 3,500 | | Butler County, Ohio, Hospital Facilities Revenue Bonds, UC Health, Series 2010, 5.500%, 11/01/40 | 11/20 at 100.00 | | A | | | 3,946,110 | |
| | 6,575 | | Butler County, Ohio, Hospital Facilities Revenue Bonds, Cincinnati Children's Medical Center Project, Series 2006K, 5.000%, 5/15/31 – FGIC Insured | 5/16 at 100.00 | | A3 | | | 6,705,777 | |
| | Principal | | | Optional Call | | | | | | |
| | Amount (000) | | Description (1) | Provisions (2) | | Ratings (3) | | | Value | |
| | | | Health Care (continued) | | | | | | | |
| $ | 2,400 | | Fairfield County, Ohio, Hospital Facilities Revenue Bonds, Fairfield Medical Center Project, Series 2013, 5.000%, 6/15/43 | 6/23 at 100.00 | | Baa2 | | $ | 2,540,184 | |
| | | | Franklin County, Ohio, Hospital Revenue Bonds, Nationwide Children's Hospital Project, Improvement Series 2009: | | | | | | | |
| | 250 | | 5.000%, 11/01/34 | 11/19 at 100.00 | | Aa2 | | | 276,143 | |
| | 2,615 | | 5.250%, 11/01/40 | 11/19 at 100.00 | | Aa2 | | | 2,910,940 | |
| | 2,470 | | Franklin County, Ohio, Hospital Revenue Bonds, Nationwide Children's Hospital Project, Series 2008A, 5.000%, 11/01/40 | 11/18 at 100.00 | | Aa2 | | | 2,657,572 | |
| | 250 | | Franklin County, Ohio, Hospital Revenue Bonds, OhioHealth Corporation, Series 2011A, 5.000%, 11/15/41 | 11/21 at 100.00 | | AA+ | | | 276,468 | |
| | 4,480 | | Franklin County, Ohio, Hospital Revenue Bonds, OhioHealth Corporation, Tender Option Bond Trust 11-21B, 9.364%, 11/15/41 (IF) (4) | 11/21 at 100.00 | | AA+ | | | 5,428,595 | |
| | 3,225 | | Hancock County, Ohio, Hospital Revenue Bonds, Blanchard Valley Regional Health Center, Series 2011A, 6.250%, 12/01/34 | 6/21 at 100.00 | | A2 | | | 3,773,669 | |
| | | | Lucas County, Ohio, Hospital Revenue Bonds, ProMedica Healthcare Obligated Group, Series 2008D: | | | | | | | |
| | 90 | | 5.000%, 11/15/38 | 11/18 at 100.00 | | AA | | | 97,088 | |
| | 40 | | 5.125%, 11/15/40 | 11/18 at 100.00 | | AA | | | 43,226 | |
| | 3,965 | | Lucas County, Ohio, Hospital Revenue Bonds, ProMedica Healthcare Obligated Group, Series 2011A, 6.000%, 11/15/41 | 11/21 at 100.00 | | AA | | | 4,752,885 | |
| | 1,500 | | Miami County, Ohio, Hospital Facilities Revenue Refunding Bonds, Upper Valley Medical Center Inc., Series 2006, 5.250%, 5/15/21 | 5/16 at 100.00 | | A | | | 1,542,630 | |
| | 820 | | Middleburg Heights, Ohio, Hospital Facilities Revenue Bonds, Southwest General Health Center Project, Refunding Series 2011, 5.250%, 8/01/41 | 8/21 at 100.00 | | A2 | | | 875,949 | |
| | | | Montgomery County, Ohio, Revenue Bonds, Catholic Health Initiatives, Series 2004A: | | | | | | | |
| | 3,700 | | 5.000%, 5/01/30 | 11/15 at 100.00 | | A+ | | | 3,710,767 | |
| | 2,500 | | 5.000%, 5/01/32 | 11/15 at 100.00 | | A+ | | | 2,504,725 | |
| | 6,105 | | Muskingum County, Ohio, Hospital Facilities Revenue Bonds, Genesis HealthCare System Obligated Group Project, Series 2013, 5.000%, 2/15/44 | 2/23 at 100.00 | | BB+ | | | 6,347,368 | |
| | 95 | | Ohio Higher Educational Facilities Commission, Revenue Bonds, University Hospitals Health System Inc., Series 2007A, 5.250%, 1/15/46 – BHAC Insured | 1/17 at 100.00 | | AA+ | | | 99,735 | |
| | | | Ohio State Higher Educational Facilities Commission, Hospital Revenue Bonds, Cleveland Clinic Health System Obligated Group, Series 2008A: | | | | | | | |
| | 3,000 | | 5.000%, 1/01/25 | 1/18 at 100.00 | | Aa2 | | | 3,229,050 | |
| | 240 | | 5.250%, 1/01/33 | 1/18 at 100.00 | | Aa2 | | | 259,980 | |
| | 1,100 | | Ohio State Higher Educational Facilities Commission, Hospital Revenue Bonds, Cleveland Clinic Health System Obligated Group, Series 2012A, 5.000%, 1/01/38 | 1/22 at 100.00 | | Aa2 | | | 1,223,310 | |
| | | | Ohio State Higher Educational Facilities Commission, Hospital Revenue Bonds, Summa Health System Project, Series 2010: | | | | | | | |
| | 1,500 | | 5.750%, 11/15/40 – AGM Insured | 5/20 at 100.00 | | AA | | | 1,698,705 | |
| | 1,520 | | 5.250%, 11/15/40 – AGM Insured | 5/20 at 100.00 | | AA | | | 1,678,810 | |
| | 8,050 | | Ohio State, Hospital Facility Revenue Bonds, Cleveland Clinic Health System Obligated Group, Refunding Series 2009A, 5.500%, 1/01/39 | 1/19 at 100.00 | | Aa2 | | | 9,095,775 | |
| | | | Ohio State, Hospital Facility Revenue Refunding Bonds, Cleveland Clinic Health System Obligated Group, Tender Option Bond Trust 2015-XF0105: | | | | | | | |
| | 5,350 | | 19.798%, 1/01/33 (IF) | 1/19 at 100.00 | | Aa2 | | | 8,130,074 | |
| | 875 | | 19.798%, 7/01/36 (IF) | 1/18 at 100.00 | | Aa2 | | | 1,181,285 | |
| | | | Ohio State, Hospital Revenue Bonds, University Hospitals Health System, Inc., Series 2013A: | | | | | | | |
| | 1,000 | | 5.000%, 1/15/28 | 1/23 at 100.00 | | A | | | 1,121,850 | |
| | 2,000 | | 5.000%, 1/15/29 | 1/23 at 100.00 | | A | | | 2,233,980 | |
| | | | Ross County, Ohio, Hospital Revenue Refunding Bonds, Adena Health System Series 2008: | | | | | | | |
| | 1,425 | | 5.750%, 12/01/28 | 12/18 at 100.00 | | A– | | | 1,596,584 | |
| | 1,385 | | 5.750%, 12/01/35 | 12/18 at 100.00 | | A– | | | 1,541,117 | |
| | 1,000 | | 5.750%, 12/01/35 – AGC Insured | 12/18 at 100.00 | | AA | | | 1,112,720 | |
| NUO | | |
| | Nuveen Ohio Quality Income Municipal Fund | |
| | Portfolio of Investments (continued) | August 31, 2015 (Unaudited) |
| | Principal | | | Optional Call | | | | | | |
| | Amount (000) | | Description (1) | Provisions (2) | | Ratings (3) | | | Value | |
| | | | Health Care (continued) | | | | | | | |
| | | | Wood County, Ohio, Hospital Facilities Refunding and Improvement Revenue Bonds, Wood County Hospital Project, Series 2012: | | | | | | | |
| $ | 2,635 | | 5.000%, 12/01/37 | No Opt. Call | | Baa2 | | $ | 2,724,616 | |
| | 4,920 | | 5.000%, 12/01/42 | No Opt. Call | | Baa2 | | | 5,068,879 | |
| | 85,530 | | Total Health Care | | | | | | 95,797,528 | |
| | | | Housing/Multifamily – 2.7% (1.8% of Total Investments) | | | | | | | |
| | 1,295 | | Clermont County, Ohio, GNMA Collateralized Mortgage Revenue Bonds, S.E.M. Villa II Project, Series 1994A, 5.950%, 2/20/30 | 2/16 at 100.00 | | N/R | | | 1,297,383 | |
| | 585 | | Franklin County, Ohio, GNMA Collateralized Multifamily Housing Mortgage Revenue Bonds, Agler Project, Series 2002A, 5.550%, 5/20/22 (Alternative Minimum Tax) | 11/15 at 100.00 | | Aaa | | | 586,199 | |
| | 1,600 | | Montgomery County, Ohio, GNMA Guaranteed Multifamily Housing Revenue Bonds, Canterbury Court Project, Series 2007, 5.500%, 10/20/42 (Alternative Minimum Tax) | 10/18 at 101.00 | | Aa1 | | | 1,685,056 | |
| | 1,175 | | Ohio Housing Finance Agency, FHA-Insured Multifamily Housing Mortgage Revenue Bonds, Madonna Homes, Series 2006M, 4.900%, 6/20/48 (Alternative Minimum Tax) | 6/16 at 102.00 | | A1 | | | 1,192,578 | |
| | 3,390 | | Summit County Port Authority, Ohio, Multifamily Housing Revenue Bonds, Callis Tower Apartments Project, Series 2007, 5.250%, 9/20/47 (Alternative Minimum Tax) | 9/17 at 102.00 | | Aa1 | | | 3,523,363 | |
| | 8,045 | | Total Housing/Multifamily | | | | | | 8,284,579 | |
| | | | Industrials – 2.3% (1.6% of Total Investments) | | | | | | | |
| | 2,055 | | Cleveland-Cuyahoga County Port Authority, Ohio, Common Bond Fund Revenue Bonds, Cleveland Christian Home Project, Series 2002C, 5.950%, 5/15/22 | 11/15 at 100.00 | | BBB+ | | | 2,062,192 | |
| | 625 | | Cleveland-Cuyahoga County Port Authority, Ohio, Development Revenue Bonds, Bond Fund Program – Columbia National Group Project, Series 2005D, 5.000%, 5/15/20 (Alternative Minimum Tax) | 11/15 at 100.00 | | BBB+ | | | 628,662 | |
| | 3,495 | | Toledo-Lucas County Port Authority, Ohio, Revenue Refunding Bonds, CSX Transportation Inc., Series 1992, 6.450%, 12/15/21 | No Opt. Call | | Baa1 | | | 4,342,922 | |
| | 1,600 | | Western Reserve Port Authority, Ohio, Solid Waste Facility Revenue Bonds, Central Waste Inc., Series 2007A, 6.350%, 7/01/27 (Alternative Minimum Tax) (5) | 7/17 at 102.00 | | N/R | | | 8,176 | |
| | 7,775 | | Total Industrials | | | | | | 7,041,952 | |
| | | | Long-Term Care – 1.1% (0.8% of Total Investments) | | | | | | | |
| | 895 | | Franklin County, Ohio, Healthcare Facilities Revenue Bonds, Ohio Presbyterian Retirement Services, Improvement Series 2010A, 5.625%, 7/01/26 | 7/21 at 100.00 | | BBB– | | | 962,984 | |
| | 2,220 | | Montgomery County, Ohio, Health Care and Multifamily Housing Revenue Bonds, Saint Leonard, Refunding & improvement Series 2010, 6.625%, 4/01/40 | 4/20 at 100.00 | | BBB– | | | 2,414,983 | |
| | 3,115 | | Total Long-Term Care | | | | | | 3,377,967 | |
| | | | Materials – 0.6% (0.4% of Total Investments) | | | | | | | |
| | 2,000 | | Toledo-Lucas County Port Authority, Ohio, Port Revenue Bonds, Cargill Inc., Series 2004B, 4.500%, 12/01/15 | No Opt. Call | | A | | | 2,018,300 | |
| | | | Tax Obligation/General – 22.3% (15.2% of Total Investments) | | | | | | | |
| | | | Central Ohio Solid Waste Authority, General Obligation Bonds, Refunding & Improvements, Series 2012: | | | | | | | |
| | 1,140 | | 5.000%, 12/01/26 | 6/22 at 100.00 | | Aaa | | | 1,317,943 | |
| | 2,545 | | 5.000%, 12/01/28 | 6/22 at 100.00 | | Aaa | | | 2,911,480 | |
| | 1,605 | | 5.000%, 12/01/29 | 6/22 at 100.00 | | Aaa | | | 1,829,202 | |
| | | | Cincinnati, Ohio, General Obligation Bonds, Various Purpose Series 2012A: | | | | | | | |
| | 1,960 | | 5.000%, 12/01/31 | 12/20 at 100.00 | | Aa2 | | | 2,230,186 | |
| | 875 | | 5.000%, 12/01/32 | 12/20 at 100.00 | | Aa2 | | | 995,619 | |
| | 2,000 | | Cleveland, Ohio, General Obligation Bonds, Series 2011, 5.000%, 12/01/29 | 12/19 at 100.00 | | AA | | | 2,249,160 | |
| | 1,140 | | Columbia Local School District, Lorain County, Ohio, General Obligation Bonds, School Facilities Improvement Series 2011, 5.000%, 11/01/39 – AGM Insured | 11/21 at 100.00 | | A2 | | | 1,278,350 | |
| | Principal | | | Optional Call | | | | | | |
| | Amount (000) | | Description (1) | Provisions (2) | | Ratings (3) | | | Value | |
| | | | Tax Obligation/General (continued) | | | | | | | |
| | | | Columbus City School District, Franklin County, Ohio, General Obligation Bonds, Series 2006: | | | | | | | |
| $ | 4,310 | | 0.000%, 12/01/27 – AGM Insured | No Opt. Call | | AA+ | | $ | 2,949,031 | |
| | 5,835 | | 0.000%, 12/01/28 – AGM Insured | No Opt. Call | | AA+ | | | 3,843,923 | |
| | 1,730 | | Franklin County, Ohio, General Obligation Bonds, Refunding Series 2014, 5.000%, 6/01/31 | 12/23 at 100.00 | | AAA | | | 2,026,626 | |
| | | | Gallia County Local School District, Gallia and Jackson Counties, Ohio, General Obligation Bonds, Refunding School Improvement Series 2014: | | | | | | | |
| | 1,260 | | 5.000%, 11/01/30 | 11/24 at 100.00 | | Aa2 | | | 1,454,053 | |
| | 1,540 | | 5.000%, 11/01/31 | 11/24 at 100.00 | | Aa2 | | | 1,769,214 | |
| | | | Greenville City School District, Drake County, Ohio, General Obligation Bonds, School Improvement Series 2013: | | | | | | | |
| | 555 | | 5.250%, 1/01/38 | 1/22 at 100.00 | | AA | | | 617,043 | |
| | 1,355 | | 5.250%, 1/01/41 | 1/22 at 100.00 | | AA | | | 1,501,570 | |
| | 1,355 | | Grove City, Ohio, General Obligation Bonds, Construction & Improvement Series 2009, 5.125%, 12/01/36 | 12/19 at 100.00 | | Aa1 | | | 1,530,201 | |
| | 6,580 | | Indian Lake Local School District, Logan and Auglaize Counties, Ohio, School Facilities Improvement and Refunding Bonds, Series 2007, 5.000%, 12/01/34 – NPFG Insured | 6/17 at 100.00 | | AA– | | | 6,962,364 | |
| | 2,160 | | Kenston Local School District, Geauga County, Ohio, General Obligation Bonds, Series 2011, 0.000%, 12/01/21 | No Opt. Call | | Aa1 | | | 1,903,241 | |
| | 2,620 | | Lucas County, Ohio, General Obligation Bonds, Various Purpose Series 2010, 5.000%, 10/01/40 | 10/18 at 100.00 | | AA | | | 2,867,223 | |
| | 4,500 | | Middletown City School District, Butler County, Ohio, General Obligation Bonds, Refunding Series 2007, 5.250%, 12/01/31 – AGM Insured | No Opt. Call | | A2 | | | 5,500,890 | |
| | 1,305 | | Monroe Local School District, Butler County, Ohio, General Obligation Bonds, Series 2006, 5.500%, 12/01/24 – AMBAC Insured | No Opt. Call | | Baa1 | | | 1,559,658 | |
| | 725 | | Napoleon City School District, Henry County, Ohio, General Obligation Bonds, Facilities Construction & Improvement Series 2012, 5.000%, 12/01/36 | 6/22 at 100.00 | | Aa3 | | | 798,080 | |
| | 2,500 | | New Albany Plain Local School District, Franklin County, Ohio, General Obligation Bonds, Refunding School Improvement Series 2013, 4.000%, 12/01/43 | 12/22 at 100.00 | | AA+ | | | 2,534,475 | |
| | 985 | | Newark City School District, Licking County, Ohio, General Obligation Bonds, Series 2005, 5.000%, 12/01/28 – NPFG Insured | 12/15 at 100.00 | | AA– | | | 996,170 | |
| | 2,300 | | Northmor Local School District, Morrow County, Ohio, General Obligation Bonds, School Facilities Construction & Improvement Series 2008, 5.000%, 11/01/36 | 11/18 at 100.00 | | Aa2 | | | 2,517,419 | |
| | 1,000 | | Ohio State, General Obligation Bonds, Highway Capital Improvement Series 2012Q, 5.000%, 5/01/28 | 5/22 at 100.00 | | AAA | | | 1,158,380 | |
| | 3,000 | | Ohio State, General Obligation Bonds, Highway Capital Improvement, Series 2014R, 5.000%, 5/01/29 | 5/24 at 100.00 | | AAA | | | 3,534,990 | |
| | 5,000 | | South Euclid, Ohio, General Obligation Bonds, Real Estate Acquisition and Urban Redevelopment, Series 2012, 5.000%, 6/01/42 | 6/22 at 100.00 | | Aa2 | | | 5,425,250 | |
| | 2,250 | | South-Western City School District, Franklin and Pickaway Counties, Ohio, General Obligation Bonds, School Facilities Construction & Improvement Series 2012, 5.000%, 12/01/36 | 6/22 at 100.00 | | AA | | | 2,517,188 | |
| | 1,500 | | Springboro Community City School District, Warren County, Ohio, General Obligation Bonds, Refunding Series 2007, 5.250%, 12/01/32 | No Opt. Call | | AA | | | 1,859,835 | |
| | 70 | | Strongsville, Ohio, Limited Tax General Obligation Various Purpose Improvement Bonds, Series 1996, 5.950%, 12/01/21 | 11/15 at 100.00 | | Aaa | | | 70,341 | |
| | 65,700 | | Total Tax Obligation/General | | | | | | 68,709,105 | |
| | | | Tax Obligation/Limited – 31.4% (21.4% of Total Investments) | | | | | | | |
| | | | Cleveland, Ohio, Income Tax Revenue Bonds, Bridges & Roadways Improvements, Subordinate Lien Series 2013A-2: | | | | | | | |
| | 1,315 | | 5.000%, 10/01/27 | 10/23 at 100.00 | | AA | | | 1,516,011 | |
| | 1,520 | | 5.000%, 10/01/30 | 10/23 at 100.00 | | AA | | | 1,725,063 | |
| | 1,600 | | 5.000%, 10/01/31 | 10/23 at 100.00 | | AA | | | 1,807,312 | |
| | 2,000 | | Cleveland, Ohio, Income Tax Revenue Bonds, Bridges & Roadways Improvements, Subordinate Lien Series 2015A-2, 5.000%, 10/01/37 | 10/23 at 100.00 | | AA | | | 2,239,460 | |
| NUO | Nuveen Ohio Quality Income Municipal Fund | |
| | Portfolio of Investments (continued) | August 31, 2015 (Unaudited) |
| | Principal | | | Optional Call | | | | | | |
| | Amount (000) | | Description (1) | Provisions (2) | | Ratings (3) | | | Value | |
| | | | Tax Obligation/Limited (continued) | | | | | | | |
| $ | 3,000 | | Cleveland, Ohio, Income Tax Revenue Bonds, Public Facilities Improvements, Series 2014A-1, 5.000%, 11/15/38 | 11/23 at 100.00 | | AA | | $ | 3,370,740 | |
| | 500 | | Columbus-Franklin County Finance Authority, Ohio, Development Revenue Bonds, Hubbard Avenue Parking Facility Project, Series 2012A, 5.000%, 12/01/36 | 12/19 at 100.00 | | BBB | | | 504,725 | |
| | 6,750 | | Cuyahoga County, Ohio, Economic Development Revenue Bonds, Medical Mart-Convention Center Project, Recovery Zone Facility Series 2010F, 5.000%, 12/01/27 | 12/20 at 100.00 | | Aa2 | | | 7,644,037 | |
| | | | Cuyahoga County, Ohio, Sales Tax Revenue Bonds, Various Purpose Series 2014: | | | | | | | |
| | 1,815 | | 5.000%, 12/01/32 | 12/24 at 100.00 | | AAA | | | 2,117,415 | |
| | 1,415 | | 5.000%, 12/01/33 | 12/24 at 100.00 | | AAA | | | 1,644,541 | |
| | 1,000 | | 5.000%, 12/01/34 | 12/24 at 100.00 | | AAA | | | 1,157,840 | |
| | 945 | | 5.000%, 12/01/35 | 12/24 at 100.00 | | AAA | | | 1,091,683 | |
| | 300 | | Delaware County District Library, Ohio, Library Fund Library Facilities Special Obligation Notes, Series 2009, 5.000%, 12/01/34 | 12/19 at 100.00 | | Aa2 | | | 326,385 | |
| | | | | | | | | | | |
| | 5,000 | | Franklin County Convention Facilities Authority, Ohio, Excise Tax and Lease Revenue Anticipation Bonds, Series 2005, 5.000%, 12/01/27 – AMBAC Insured | 12/15 at 100.00 | | Aaa | | | 5,056,700 | |
| | 10,350 | | Franklin County Convention Facilities Authority, Ohio, Tax and Lease Revenue Anticipation and Refunding Bonds, Columbus City & Franklin County Lessees, Series 2014, 5.000%, 12/01/35 | 12/24 at 100.00 | | Aaa | | | 11,706,989 | |
| | | | Greater Cleveland Regional Transit Authority, Ohio, Sales Tax Supported Capital Improvement Bonds, Refunding Series 2012: | | | | | | | |
| | 1,010 | | 5.250%, 12/01/27 | 12/21 at 100.00 | | AAA | | | 1,189,841 | |
| | 1,090 | | 5.250%, 12/01/28 | 12/21 at 100.00 | | AAA | | | 1,278,581 | |
| | 760 | | 5.250%, 12/01/30 | 12/21 at 100.00 | | AAA | | | 887,391 | |
| | 600 | | 5.000%, 12/01/31 | 12/21 at 100.00 | | AAA | | | 687,396 | |
| | 1,000 | | Greater Cleveland Regional Transit Authority, Ohio, Sales Tax Supported Capital Improvement Bonds, Refunding Series 2015, 5.000%, 12/01/34 | 12/25 at 100.00 | | AAA | | | 1,167,620 | |
| | 7,250 | | Hamilton County, Ohio, Sales Tax Bonds, Subordinate Lien, Series 2006A, 5.000%, 12/01/32 – AMBAC Insured | 12/16 at 100.00 | | A+ | | | 7,569,217 | |
| | 5,565 | | Hamilton County, Ohio, Sales Tax Bonds, Subordinate Series 2000B, 0.000%, 12/01/28 – AGM Insured | No Opt. Call | | AA | | | 3,484,413 | |
| | 5,000 | | Hamilton County, Ohio, Sales Tax Revenue Bonds, Refunding Series 2011A, 5.000%, 12/01/31 | 12/21 at 100.00 | | A+ | | | 5,529,800 | |
| | 1,750 | | Hudson City School District, Ohio, Certificates of Participation, Series 2012, 4.000%, 6/01/34 – NPFG Insured | 6/22 at 100.00 | | Aa3 | | | 1,786,487 | |
| | 20,700 | | JobsOhio Beverage System, Ohio, Statewide Liquor Profits Revenue Bonds, Senior Lien Series 2013A, 5.000%, 1/01/38 | 1/23 at 100.00 | | AA | | | 23,060,214 | |
| | 1,000 | | New Albany Community Authority, Ohio, Community Facilities Revenue Refunding Bonds, Series 2012C, 5.000%, 10/01/24 | 10/22 at 100.00 | | A1 | | | 1,138,540 | |
| | 2,000 | | Pinnacle Community Infrastructure Financing Authority, Grove City, Ohio, Community Facilities Bonds, Series 2015A, 4.250%, 12/01/36 – AGM Insured | No Opt. Call | | AA | | | 2,014,720 | |
| | | | Riversouth Authority, Ohio, Riversouth Area Redevelopment Bonds, Refunding Series 2012A: | | | | | | | |
| | 1,645 | | 5.000%, 12/01/23 | 12/22 at 100.00 | | AA+ | | | 1,929,980 | |
| | 1,200 | | 5.000%, 12/01/24 | 12/22 at 100.00 | | AA+ | | | 1,401,000 | |
| | | | Vermilion Local School District, East and Lorain Counties, Ohio, Certificates of Participation, Series 2012: | | | | | | | |
| | 765 | | 5.000%, 12/01/24 | No Opt. Call | | Aa3 | | | 859,485 | |
| | 805 | | 5.000%, 12/01/25 | 12/20 at 100.00 | | Aa3 | | | 896,698 | |
| | 89,650 | | Total Tax Obligation/Limited | | | | | | 96,790,284 | |
| | | | Transportation – 9.2% (6.3% of Total Investments) | | | | | | | |
| | | | Cleveland, Ohio, Airport System Revenue Bonds, Series 2012A: | | | | | | | |
| | 2,150 | | 5.000%, 1/01/30 | 1/22 at 100.00 | | A– | | | 2,340,597 | |
| | 1,500 | | 5.000%, 1/01/31 – AGM Insured | 1/22 at 100.00 | | AA | | | 1,650,900 | |
| | Principal | | | Optional Call | | | | | | |
| | Amount (000) | | Description (1) | Provisions (2) | | Ratings (3) | | | Value | |
| | | | Transportation (continued) | | | | | | | |
| | | | Ohio State Treasurer, Tax-Exempt Private Activity Bonds, Portsmouth Gateway Group, LLC – Borrower, Portsmouth Bypass Project, Series 2015: | | | | | | | |
| $ | 2,500 | | 5.000%, 12/31/35 – AGM Insured (Alternative Minimum Tax) | 6/25 at 100.00 | | AA | | $ | 2,718,425 | |
| | 3,000 | | 5.000%, 12/31/39 – AGM Insured (Alternative Minimum Tax) | 6/25 at 100.00 | | AA | | | 3,264,660 | |
| | 4,250 | | 5.000%, 6/30/53 (Alternative Minimum Tax) | 6/25 at 100.00 | | Baa2 | | | 4,454,978 | |
| | 3,550 | | Ohio Turnpike Commission, Revenue Refunding Bonds, Series 1998A, 5.500%, 2/15/18 – FGIC Insured | No Opt. Call | | AA | | | 3,954,913 | |
| | 2,050 | | Ohio Turnpike Commission, Turnpike Revenue Bonds, Infrastructure Project, Junior Lien Series 2013A-1, 5.250%, 2/15/39 | 2/23 at 100.00 | | A+ | | | 2,320,949 | |
| | | | Ohio Turnpike Commission, Turnpike Revenue Bonds, Infrastructure Projects, Junior Lien Series 2013A-2: | | | | | | | |
| | 5,000 | | 0.000%, 2/15/37 | No Opt. Call | | A+ | | | 1,955,000 | |
| | 11,260 | | 0.000%, 2/15/38 | No Opt. Call | | A+ | | | 4,204,822 | |
| | 5,000 | | 0.000%, 2/15/40 | No Opt. Call | | A+ | | | 1,690,000 | |
| | 40,260 | | Total Transportation | | | | | | 28,555,244 | |
| | | | U.S. Guaranteed – 19.0% (12.9% of Total Investments) (6) | | | | | | | |
| | 4,705 | | American Municipal Power Ohio Inc., Prairie State Energy Campus Project Revenue Bonds, Series 2008A, 5.250%, 2/15/43 (Pre-refunded 2/15/18) | 2/18 at 100.00 | | N/R (6) | | | 5,217,374 | |
| | 125 | | Barberton City School District, Summit County, Ohio, General Obligation Bonds, School Improvement Series 2008, 5.250%, 12/01/31 (Pre-refunded 6/01/18) | 6/18 at 100.00 | | AA (6) | | | 139,971 | |
| | | | Central Ohio Solid Waste Authority, General Obligation Bonds, Refunding & Improvements, Series 2012: | | | | | | | |
| | 110 | | 5.000%, 12/01/26 (Pre-refunded 6/01/22) | 6/22 at 100.00 | | N/R (6) | | | 132,420 | |
| | 245 | | 5.000%, 12/01/28 (Pre-refunded 6/01/22) | 6/22 at 100.00 | | N/R (6) | | | 294,936 | |
| | 160 | | 5.000%, 12/01/29 (Pre-refunded 6/01/22) | 6/22 at 100.00 | | N/R (6) | | | 192,611 | |
| | | | Cincinnati City School District, Ohio, Certificates of Participation, School Improvement Project, Series 2006: | | | | | | | |
| | 95 | | 5.000%, 12/15/32 (Pre-refunded 12/15/16) – AGM Insured | 12/16 at 100.00 | | AA (6) | | | 100,621 | |
| | 30 | | 5.000%, 12/15/32 (Pre-refunded 12/15/16) – AGM Insured | 12/16 at 100.00 | | AA (6) | | | 31,775 | |
| | | | Franklin County, Ohio, General Obligation Bonds, Various Purpose Series 2007: | | | | | | | |
| | 3,355 | | 5.000%, 12/01/27 (Pre-refunded 12/01/17) | 12/17 at 100.00 | | AAA | | | 3,677,617 | |
| | 1,840 | | 5.000%, 12/01/28 (Pre-refunded 12/01/17) | 12/17 at 100.00 | | AAA | | | 2,016,934 | |
| | 2,620 | | Green, Ohio, General Obligation Bonds, Series 2008, 5.500%, 12/01/32 (Pre-refunded 12/01/15) | 12/15 at 100.00 | | AA+ (6) | | | 2,654,951 | |
| | 12,750 | | Hamilton City School District, Ohio, General Obligation Bonds, Series 2007, 5.000%, 12/01/34 (Pre-refunded 6/01/17) – AGM Insured | 6/17 at 100.00 | | AA (6) | | | 13,733,917 | |
| | 1,850 | | Hilliard City School District, Franklin County, Ohio, General Obligation Bonds, School Construction, Series 2005, 5.000%, 12/01/26 (Pre-refunded 12/01/15) – NPFG Insured | 12/15 at 100.00 | | Aa1 (6) | | | 1,872,570 | |
| | 3,000 | | Hilliard City School District, Franklin County, Ohio, General Obligation Bonds, Series 2006A, 5.000%, 12/01/25 (Pre-refunded 12/01/16) – NPFG Insured | 12/16 at 100.00 | | Aa1 (6) | | | 3,172,980 | |
| | | | Lake County, Ohio, Hospital Facilities Revenue Bonds, Lake Hospital System, Inc., Refunding Series 2008C: | | | | | | | |
| | 1,565 | | 6.000%, 8/15/29 (Pre-refunded 8/15/18) | 8/18 at 100.00 | | NA (6) | | | 1,797,653 | |
| | 300 | | 6.000%, 8/15/29 (Pre-refunded 8/15/18) | 8/18 at 100.00 | | A3 (6) | | | 332,172 | |
| | | | Lakewood City School District, Cuyahoga County, Ohio, General Obligation Bonds, Series 2007: | | | | | | | |
| | 1,010 | | 5.000%, 12/01/25 (Pre-refunded 12/01/17) – FGIC Insured | 12/17 at 100.00 | | Aa2 (6) | | | 1,107,122 | |
| | 775 | | 5.000%, 12/01/30 (Pre-refunded 12/01/17) – FGIC Insured | 12/17 at 100.00 | | Aa2 (6) | | | 849,524 | |
| | 1,130 | | Marysville Exempted Village School District, Union County, Ohio, General Obligation Bonds, Series 2006, 5.000%, 12/01/25 (Pre-refunded 12/01/15) – AGM Insured | 12/15 at 100.00 | | AA (6) | | | 1,143,628 | |
| | 1,195 | | Marysville, Ohio, Wastewater Treatment System Revenue Bonds, Series 2006, 5.250%, 12/01/24 (Pre-refunded 12/01/16) – SYNCORA GTY Insured | 12/16 at 100.00 | | N/R (6) | | | 1,267,465 | |
| | 1,000 | | Mason City School District, Warren and Butler Counties, Ohio, General Obligation Bonds, School Improvement Series 2007, 5.000%, 12/01/31 (Pre-refunded 6/01/17) | 6/17 at 100.00 | | Aa1 (6) | | | 1,077,170 | |
| | 1,500 | | Milford Exempted Village School District, Ohio, General Obligation Bonds, Series 2008, 5.250%, 12/01/36 (Pre-refunded 12/01/18) | 12/18 at 100.00 | | Aa3 (6) | | | 1,706,070 | |
| NUO | Nuveen Ohio Quality Income Municipal Fund | |
| | Portfolio of Investments (continued) | August 31, 2015 (Unaudited) |
| | Principal | | | Optional Call | | | | | | |
| | Amount (000) | | Description (1) | Provisions (2) | | Ratings (3) | | | Value | |
| | | | U.S. Guaranteed (6) (continued) | | | | | | | |
| $ | 2,680 | | Newark City School District, Licking County, Ohio, General Obligation Bonds, Series 2005, 5.000%, 12/01/28 (Pre-refunded 12/01/15) – NPFG Insured | 12/15 at 100.00 | | AA– (6) | | $ | 2,712,750 | |
| | 500 | | Oak Hills Local School District, Hamilton County, Ohio, General Obligation Bonds, Refunding Series 2005, 5.000%, 12/01/24 (Pre-refunded 12/01/15) – AGM Insured | 12/15 at 100.00 | | AA (6) | | | 506,075 | |
| | 2,780 | | Ohio Higher Education Facilities Commission, General Revenue Bonds, Kenyon College, Series 2006, 5.000%, 7/01/41 (Pre-refunded 7/01/16) | 7/16 at 100.00 | | N/R (6) | | | 2,889,727 | |
| | 140 | | Ohio Higher Educational Facilities Commission, General Revenue Bonds, University of Dayton, 2006 Project, Series 2006, 5.000%, 12/01/30 (Pre-refunded 12/01/16) – AMBAC Insured | 12/16 at 100.00 | | A2 (6) | | | 148,072 | |
| | 3,000 | | Ohio State Higher Educational Facility Commission, Higher Education Facility Revenue Bonds, Xavier University 2008C, 5.750%, 5/01/28 (Pre-refunded 11/01/18) | 11/18 at 100.00 | | A– (6) | | | 3,450,270 | |
| | 1,220 | | Ohio Water Development Authority, Revenue Bonds, Drinking Water Assistance Fund, State Match, Series 2008, 5.000%, 6/01/28 (Pre-refunded 6/01/18) – AGM Insured | 6/18 at 100.00 | | AAA | | | 1,357,836 | |
| | 500 | | Olentangy Local School District, Delaware and Franklin Counties, Ohio, General Obligation Bonds, Series 2008, 5.000%, 12/01/36 (Pre-refunded 6/01/18) | 6/18 at 100.00 | | AA+ (6) | | | 556,490 | |
| | 2,300 | | Richland County, Ohio, Hospital Revenue Bonds, MidCentral Health System Group, Series 2006, 5.250%, 11/15/36 (Pre-refunded 11/15/16) | 11/16 at 100.00 | | N/R (6) | | | 2,434,872 | |
| | 700 | | Sylvania City School District, Lucas County, Ohio, General Obligation Bonds, School Improvement Series 1995, 5.250%, 12/01/36 (Pre-refunded 6/01/17) – AGC Insured | 6/17 at 100.00 | | AA (6) | | | 757,064 | |
| | | | Vandalia Butler City School District, Montgomery County, Ohio, General Obligation Bonds, School Improvement Series 2009: | | | | | | | |
| | 685 | | 5.125%, 12/01/37 (Pre-refunded 6/01/19) | 6/19 at 100.00 | | N/R (6) | | | 787,044 | |
| | 315 | | 5.125%, 12/01/37 (Pre-refunded 6/01/19) | 6/19 at 100.00 | | Aa3 (6) | | | 361,926 | |
| | 54,180 | | Total U.S. Guaranteed | | | | | | 58,481,607 | |
| | | | Utilities – 3.9% (2.7% of Total Investments) | | | | | | | |
| | | | American Municipal Power Ohio Inc., Prairie State Energy Campus Project Revenue Bonds, Series 2008A: | | | | | | | |
| | 50 | | 5.000%, 2/15/38 – AGC Insured | 2/18 at 100.00 | | AA | | | 53,719 | |
| | 295 | | 5.250%, 2/15/43 | 2/18 at 100.00 | | A1 | | | 318,258 | |
| | 1,500 | | American Municipal Power Ohio Inc., Prairie State Energy Campus Project Revenue Bonds, Series 2015A, 5.000%, 2/15/42 | 2/24 at 100.00 | | A1 | | | 1,654,200 | |
| | | | Cleveland, Ohio, Public Power System Revenue Bonds, Series 2008B: | | | | | | | |
| | 2,000 | | 0.000%, 11/15/28 – NPFG Insured | No Opt. Call | | AA– | | | 1,230,060 | |
| | 6,895 | | 0.000%, 11/15/32 – NPFG Insured | No Opt. Call | | AA– | | | 3,369,655 | |
| | 2,155 | | 0.000%, 11/15/34 – NPFG Insured | No Opt. Call | | AA– | | | 961,798 | |
| | 1,500 | | Ohio Air Quality Development Authority, Air Quality Revenue Refunding Bonds, Columbus Southern Power Company Project, Series 2009B, 5.800%, 12/01/38 | 12/19 at 100.00 | | Baa1 | | | 1,653,495 | |
| | 2,025 | | Ohio Air Quality Development Authority, Ohio, Revenue Bonds, Ohio Valley Electric Corporation Project, Series 2009E, 5.625%, 10/01/19 | No Opt. Call | | BBB– | | | 2,264,537 | |
| | 950 | | Ohio Municipal Electric Generation Agency, Beneficial Interest Certificates, Belleville Hydroelectric Project – Joint Venture 5, Series 2001, 0.000%, 2/15/29 – NPFG Insured | No Opt. Call | | AA– | | | 590,520 | |
| | 17,370 | | Total Utilities | | | | | | 12,096,242 | |
| | | | Water and Sewer – 9.9% (6.8% of Total Investments) | | | | | | | |
| | 8,150 | | Cincinnati, Ohio, Water System Revenue Bonds, Series 2012A, 5.000%, 12/01/37 | 12/21 at 100.00 | | AAA | | | 9,326,941 | |
| | 865 | | City of Marysville, Ohio, Water System Mortgage Revenue Bonds, Series 2007, 5.000%, 12/01/32 – AMBAC Insured | 12/17 at 100.00 | | A1 | | | 928,872 | |
| | | | Cleveland, Ohio, Water Revenue Bonds, Second Lien Series 2012A: | | | | | | | |
| | 2,500 | | 5.000%, 1/01/25 | 1/22 at 100.00 | | Aa2 | | | 2,922,925 | |
| | 1,975 | | 5.000%, 1/01/26 | 1/22 at 100.00 | | Aa2 | | | 2,298,940 | |
| | 2,035 | | Cleveland, Ohio, Water Revenue Bonds, Senior Lien Series 2012X, 5.000%, 1/01/42 | 1/22 at 100.00 | | Aa1 | | | 2,281,296 | |
| | 1,015 | | Cleveland, Ohio, Waterworks First Mortgage Revenue Refunding and Improvement Bonds, Series 1993G, 5.500%, 1/01/21 – NPFG Insured | No Opt. Call | | Aa1 | | | 1,132,375 | |
| | Principal | | | Optional Call | | | | | | |
| | Amount (000) | | Description (1) | Provisions (2) | | Ratings (3) | | | Value | |
| | | | Water and Sewer (continued) | | | | | | | |
| $ | 1,275 | | Hamilton County, Ohio, Sewer System Revenue Bonds, Metropolitan Sewer District of Greater Cincinnati, Refunding Series 2014A, 5.000%, 12/01/31 | 12/24 at 100.00 | | AA+ | | $ | 1,487,441 | |
| | 1,220 | | Hamilton, Ohio, Wastewater System Revenue Bonds, Series 2005, 5.250%, 10/01/22 – AGM Insured | 10/15 at 100.00 | | A1 | | | 1,225,100 | |
| | 2,025 | | Ironton, Ohio, Sewer System Improvement Revenue Bonds, Series 2011, 5.250%, 12/01/40 – AGM Insured | 12/20 at 100.00 | | A2 | | | 2,215,856 | |
| | 475 | | Marysville, Ohio, Wastewater Treatment System Revenue Bonds, Series 2006, 5.250%, 12/01/24 – SYNCORA GTY Insured | 12/16 at 100.00 | | A– | | | 502,830 | |
| | 225 | | Marysville, Ohio, Wastewater Treatment System Revenue Bonds, Series 2007, 5.000%, 12/01/37 – SYNCORA GTY Insured | 12/17 at 100.00 | | A– | | | 241,304 | |
| | 2,000 | | Northeast Ohio Regional Sewer District, Wastewater Improvement Revenue Bonds, Series 2013, 5.000%, 11/15/38 | 5/23 at 100.00 | | AA+ | | | 2,257,140 | |
| | | | Toledo, Ohio, Sewerage System Revenue Bonds, Refunding Series 2013: | | | | | | | |
| | 820 | | 5.000%, 11/15/25 | 11/23 at 100.00 | | Aa3 | | | 963,402 | |
| | 605 | | 5.000%, 11/15/26 | 11/23 at 100.00 | | Aa3 | | | 703,942 | |
| | 1,075 | | 5.000%, 11/15/27 | 11/23 at 100.00 | | Aa3 | | | 1,241,840 | |
| | 695 | | 5.000%, 11/15/28 | 11/23 at 100.00 | | Aa3 | | | 797,930 | |
| | 26,955 | | Total Water and Sewer | | | | | | 30,528,134 | |
| $ | 441,105 | | Total Long-Term Investments (cost $421,731,842) | | | | | | 451,829,450 | |
| | | | Variable Rate Demand Preferred Shares, at Liquidation Value – (47.9)% (7) | | | | | | (148,000,000 | ) |
| | | | Other Assets Less Liabilities – 1.5% | | | | | | 4,754,153 | |
| | | | Net Assets Applicable to Common Shares – 100% | | | | | $ | 308,583,603 | |
| (1) | All percentages shown in the Portfolio of Investments are based on net assets applicable to common shares unless otherwise noted. |
| (2) | Optional Call Provisions: Dates (month and year) and prices of the earliest optional call or redemption. There may be other call provisions at varying prices at later dates. Certain mortgage-backed securities may be subject to periodic principal paydowns. |
| (3) | Ratings: Using the highest of Standard & Poor's Group ("Standard & Poor's"), Moody's Investors Service, Inc. ("Moody's") or Fitch, Inc. ("Fitch") rating. Ratings below BBB by Standard & Poor's, Baa by Moody's or BBB by Fitch are considered to be below investment grade. Holdings designated N/R are not rated by any of these national rating agencies. |
| (4) | Investment, or portion of investment, has been pledged to collateralize the net payment obligations for investments in inverse floating rate transactions. |
| (5) | As of, or subsequent to, the end of the reporting period this security is non-income producing. Non-income producing, in the case of a fixed-income security, generally denotes that the issuer has (1) defaulted on the payment of principal or interest, (2) is under the protection of the Federal Bankruptcy Court or (3) the Fund's Adviser has concluded that the issue is not likely to meet its future interest payment obligations and has ceased accruing additional income on the Fund's records. |
| (6) | Backed by an escrow or trust containing sufficient U.S. Government or U.S. Government agency securities, which ensure the timely payment of principal and interest. Certain bonds backed by U.S. Government or agency securities are regarded as having an implied rating equal to the rating of such securities. |
| (7) | Variable Rate Demand Preferred Shares, at Liquidation Value as a percentage of Total Investments is 32.8%. |
| (IF) | Inverse floating rate investment. |
See accompanying notes to financial statements.
| NTX | | |
| | Nuveen Texas Quality Income Municipal Fund | |
| | Portfolio of Investments | August 31, 2015 (Unaudited) |
| | Principal | | | Optional Call | | | | | | |
| | Amount (000) | | Description (1) | Provisions (2) | | Ratings (3) | | | Value | |
| | | | LONG-TERM INVESTMENTS – 143.6% (100.0% of Total Investments) | | | | | | | |
| | | | MUNICIPAL BONDS – 143.6% (100.0% of Total Investments) | | | | | | | |
| | | | Consumer Discretionary – 3.1% (2.1% of Total Investments) | | | | | | | |
| | | | Austin Convention Enterprises Inc., Texas, Convention Center Hotel Revenue Bonds, First Tier Series 2006A: | | | | | | | |
| $ | 1,450 | | 5.250%, 1/01/18 – SYNCORA GTY Insured | 1/17 at 100.00 | | BBB– | | $ | 1,510,392 | |
| | 1,000 | | 5.000%, 1/01/34 – SYNCORA GTY Insured | 1/17 at 100.00 | | BBB– | | | 1,011,380 | |
| | 2,200 | | San Antonio Convention Center Hotel Finance Corporation, Texas, Contract Revenue Empowerment Zone Bonds, Series 2005A, 5.000%, 7/15/39 – AMBAC Insured (Alternative Minimum Tax) | 11/15 at 100.00 | | BBB | | | 2,206,182 | |
| | 4,650 | | Total Consumer Discretionary | | | | | | 4,727,954 | |
| | | | Education and Civic Organizations – 12.6% (8.8% of Total Investments) | | | | | | | |
| | 2,500 | | Board of Regents of the University of Texas, Permanent University Fund Bonds, Refunding Series 2015A, 5.000%, 7/01/28 | 7/24 at 100.00 | | AAA | | | 2,987,100 | |
| | 2,000 | | Board of Regents, University of Texas System, Financing System Revenue Bonds, Refunding Series 2012B, 5.000%, 8/15/22 | No Opt. Call | | AAA | | | 2,407,140 | |
| | | | Clifton Higher Education Finance Corporation, Texas, Education Revenue Bonds, Uplift Education Charter School, Series 2013A: | | | | | | | |
| | 2,000 | | 4.350%, 12/01/42 | 12/22 at 100.00 | | BBB– | | | 1,898,820 | |
| | 1,000 | | 4.400%, 12/01/47 | 12/22 at 100.00 | | BBB– | | | 937,760 | |
| | 1,000 | | Danbury Higher Education Authority, Texas, Charter School Revenue Bonds, John H. Wood Jr. Public Charter District, Inspire Academies, Series 2013A, 6.000%, 8/15/28 | 8/23 at 100.00 | | BBB– | | | 1,097,250 | |
| | 1,000 | | Hale Center Education Facilities Corporation, Texas, Revenue Bonds, Wayland Baptist University Project, Improvement and Refunding Series 2010, 5.000%, 3/01/35 | 3/21 at 100.00 | | A– | | | 1,067,240 | |
| | 1,000 | | Harris County Cultural Education Facilities Finance Corporation, Texas, Medical Facilities Revenue Refunding Bonds, Baylor College of Medicine, Series 2012A, 5.000%, 11/15/26 | 11/22 at 100.00 | | A– | | | 1,130,770 | |
| | 3,000 | | Harris County Cultural Education Facilities Finance Corporation, Texas, Revenue Refunding Bonds, Young Men's Christian Association of the Greater Houston Area, Series 2013A, 5.000%, 6/01/38 | 6/23 at 100.00 | | Baa3 | | | 3,179,580 | |
| | 2,000 | | Laredo Community College District, Webb County, Texas, Combined Fee Revenue Bonds, Series 2010, 5.250%, 8/01/35 – AGM Insured | 8/20 at 100.00 | | AA | | | 2,264,720 | |
| | 2,000 | | Lone Star College System, Harris, Montgomery and San Jacinto Counties, Texas, Revenue Financing System Bonds, Series 2013, 5.000%, 2/15/36 | 2/21 at 100.00 | | AA | | | 2,252,740 | |
| | 200 | | Newark Cultural Education Facilities Finance Corporation, Texas, Lease Revenue Bonds, A.W. Brown-Fellowship Leadership Academy, Series 2012A, 6.000%, 8/15/42 | 11/15 at 100.00 | | BBB– | | | 206,452 | |
| | 17,700 | | Total Education and Civic Organizations | | | | | | 19,429,572 | |
| | | | Energy – 1.3% (0.9% of Total Investments) | | | | | | | |
| | 2,000 | | Gulf Coast Industrial Development Authority, Texas, Solid Waste Disposal Revenue Bonds, Citgo Petroleum Corporation Project, Series 1995, 4.875%, 5/01/25 (Alternative Minimum Tax) | 10/22 at 100.00 | | BB | | | 2,087,760 | |
| | | | Health Care – 11.6% (8.1% of Total Investments) | | | | | | | |
| | 1,000 | | Harris County Cultural Education Facilities Finance Corporation, Texas, Hospital Revenue Bonds, Memorial Hermann Healthcare System, Refunding Series 2013A, 5.000%, 12/01/35 | 12/22 at 100.00 | | A+ | | | 1,094,930 | |
| | 1,000 | | Harris County Cultural Education Facilities Finance Corporation, Texas, Revenue Bonds, Houston Methodist Hospital System, Series 2015, 5.000%, 12/01/45 | 6/25 at 100.00 | | AA | | | 1,118,570 | |
| | 1,350 | | Harrison County Health Facilities Development Corporation, Texas, Hospital Revenue Bonds, Good Shepherd Health System, Refunding Series 2010, 5.250%, 7/01/28 | 7/20 at 100.00 | | BB– | | | 1,321,542 | |
| | 2,000 | | North Central Texas Health Facilities Development Corporation, Texas, Revenue Bonds, Children's Medical Center Dallas Project, Series 2009, 5.750%, 8/15/39 | 8/19 at 100.00 | | Aa2 | | | 2,252,980 | |
| | 885 | | North Central Texas Health Facilities Development Corporation, Texas, Revenue Bonds, Children's Medical Center Dallas Project, Series 2012, 5.000%, 8/15/32 | 8/22 at 100.00 | | Aa2 | | | 990,642 | |
| | Principal | | | Optional Call | | | | | | |
| | Amount (000) | | Description (1) | Provisions (2) | | Ratings (3) | | | Value | |
| | | | Health Care (continued) | | | | | | | |
| $ | 515 | | Tarrant County Cultural Education Facilities Finance Corporation, Texas, Hospital Revenue Bonds, Hendrick Medical Center, Series 2013, 5.125%, 9/01/33 | 9/23 at 100.00 | | A | | $ | 562,251 | |
| | 1,155 | | Tarrant County Cultural Education Facilities Finance Corporation, Texas, Hospital Revenue Bonds, Scott & White Healthcare Project, Series 2010, 5.250%, 8/15/40 | 8/20 at 100.00 | | AA– | | | 1,290,736 | |
| | 1,590 | | Tarrant County Cultural Education Facilities Finance Corporation, Texas, Revenue Bonds, Christus Health, Refunding Series 2008A, 6.500%, 7/01/37 – AGC Insured | 1/19 at 100.00 | | AA | | | 1,804,682 | |
| | 2,510 | | Tarrant County Cultural Education Facilities Finance Corporation, Texas, Revenue Bonds, Texas Health Resources, Series 2007B, 5.000%, 11/15/42 | 11/17 at 100.00 | | AA | | | 2,658,743 | |
| | 1,720 | | Tyler Health Facilities Development Corporation, Texas, Hospital Revenue Bonds, East Texas Medical Center Regional Healthcare System, Series 2007A, 5.375%, 11/01/37 | 11/17 at 100.00 | | Baa3 | | | 1,776,640 | |
| | 700 | | Tyler Health Facilities Development Corporation, Texas, Hospital Revenue Bonds, Mother Frances Hospital Regional Healthcare Center, Series 2007B, 5.000%, 7/01/37 | 7/17 at 100.00 | | Baa1 | | | 719,145 | |
| | 2,250 | | Tyler Health Facilities Development Corporation, Texas, Hospital Revenue Bonds, Mother Frances Hospital Regional Healthcare Center, Series 2007, 5.000%, 7/01/33 | 7/17 at 100.00 | | Baa1 | | | 2,315,182 | |
| | 16,675 | | Total Health Care | | | | | | 17,906,043 | |
| | | | Housing/Multifamily – 2.1% (1.5% of Total Investments) | | | | | | | |
| | 3,000 | | New Hope Cultural Education Facilities Finance Corporation, Texas, Student Housing Revenue Bonds, CHF-Collegiate Housing Foundation – College Station I LLC – Texas A&M University Project, Series 2014A, 5.000%, 4/01/46 – AGM Insured | 4/24 at 100.00 | | AA | | | 3,200,040 | |
| | | | Long-Term Care – 0.9% (0.8% of Total Investments) | | | | | | | |
| | | | Bexar County, Texas, Health Facilities Development Corporation Revenue Bonds, Army Retirement Residence, Series 2007: | | | | | | | |
| | 815 | | 5.000%, 7/01/27 | 7/17 at 100.00 | | BBB | | | 839,784 | |
| | 600 | | 5.000%, 7/01/37 | 7/17 at 100.00 | | BBB | | | 613,512 | |
| | 1,415 | | Total Long-Term Care | | | | | | 1,453,296 | |
| | | | Tax Obligation/General – 28.1% (19.5% of Total Investments) | | | | | | | |
| | 400 | | Calallen Independent School District, Nueces County, Texas, General Obligation Bonds, School Building Series 2008, 5.000%, 2/15/38 | 2/18 at 100.00 | | AAA | | | 433,060 | |
| | 1,620 | | Cameron County, Texas, General Obligation Bonds, State Highway 550 Project, Series 2012, 5.000%, 2/15/32 – AGM Insured | 2/22 at 100.00 | | AA | | | 1,786,844 | |
| | 1,500 | | College Station, Texas, Certificates of Obligation, Series 2012, 5.000%, 2/15/32 | 2/21 at 100.00 | | AA+ | | | 1,692,075 | |
| | 1,000 | | El Paso County Hospital District, Texas, General Obligation Bonds, Refunding Series 2013, 5.000%, 8/15/33 | 8/23 at 100.00 | | AA– | | | 1,082,060 | |
| | 1,750 | | El Paso County, Texas, Certificates of Obligation, Series 2001, 5.000%, 2/15/21 – AGM Insured | No Opt. Call | | AA | | | 2,062,060 | |
| | 8,500 | | Grand Prairie Independent School District, Dallas County, Texas, General Obligation Bonds, Capital Appreciation Refunding Series 2009, 0.000%, 8/15/39 | 8/18 at 22.64 | | AA | | | 1,821,890 | |
| | 3,255 | | Hutto Independent School District, Williamson County, Texas, General Obligation Bonds, Refunding Series 2012A, 0.000%, 8/01/45 | 8/21 at 100.00 | | A | | | 598,953 | |
| | 1,360 | | Jacksonville Independent School District, Cherokee County, Texas, General Obligation Bonds, School Building Series 2014, 5.000%, 2/15/39 | 2/24 at 100.00 | | Aaa | | | 1,532,570 | |
| | 2,675 | | Laredo Community College District, Webb County, Texas, General Obligation Bonds, Series 2014, 5.000%, 8/01/34 | 8/24 at 100.00 | | AA– | | | 3,028,154 | |
| | 40 | | Leander Independent School District, Williamson and Travis Counties, Texas, General Obligation Bonds, Series 2008, 0.000%, 8/15/36 | 8/17 at 33.01 | | AAA | | | 12,781 | |
| | 365 | | Lone Star College System, Harris and Montgomery Counties, Texas, General Obligation Bonds, Series 2009, 5.000%, 8/15/34 | 8/19 at 100.00 | | AAA | | | 408,033 | |
| | 1,350 | | Lubbock Independent School District, Lubbock County, Texas, General Obligation Bonds, School Building Series 2013A, 5.000%, 2/15/43 | No Opt. Call | | AAA | | | 1,510,029 | |
| | 1,750 | | Martin County Hospital District, Texas, Combination Limited Tax and Revenue Bonds, Series 2011A, 7.250%, 4/01/36 | 4/21 at 100.00 | | BBB | | | 1,939,210 | |
| NTX | Nuveen Texas Quality Income Municipal Fund | |
| | Portfolio of Investments (continued) | August 31, 2015 (Unaudited) |
| | Principal | | | Optional Call | | | | | | |
| | Amount (000) | | Description (1) | Provisions (2) | | Ratings (3) | | | Value | |
| | | | Tax Obligation/General (continued) | | | | | | | |
| | | | McCamey County Hospital District, Texas, General Obligation Bonds, Series 2013: | | | | | | | |
| $ | 1,000 | | 5.750%, 12/01/33 | 12/25 at 100.00 | | Baa2 | | $ | 1,100,370 | |
| | 1,000 | | 6.125%, 12/01/38 | 12/25 at 100.00 | | Baa2 | | | 1,104,060 | |
| | 1,500 | | Montgomery County, Texas, General Obligation Bonds, Refunding Series 2008B, 5.250%, 3/01/32 | 3/19 at 100.00 | | AA+ | | | 1,680,405 | |
| | 2,000 | | Plano Independent School District, Collin County, Texas, General Obligation Bonds, Series 2008A, 5.250%, 2/15/34 | 2/18 at 100.00 | | Aaa | | | 2,183,380 | |
| | 1,425 | | Port of Houston Authority, Harris County, Texas, General Obligation Bonds, Series 2010E, 0.000%, 10/01/35 | No Opt. Call | | AAA | | | 753,953 | |
| | 4,000 | | Prosper Independent School District, Collin County, Texas, General Obligation Bonds, Refunding Series 2015, 5.000%, 2/15/40 | 2/25 at 100.00 | | AAA | | | 4,544,920 | |
| | 205 | | Reagan Hospital District of Reagan County, Texas, Limited Tax Revenue Bonds, Series 2014A, 5.125%, 2/01/39 | 2/24 at 100.00 | | Baa2 | | | 213,522 | |
| | 2,000 | | Texas State, General Obligation Bonds, Transportation Commission Highway Improvement Series 2012A, 5.000%, 4/01/42 | No Opt. Call | | AAA | | | 2,256,400 | |
| | 2,000 | | Texas State, General Obligation Bonds, Transportation Commission Highway Improvement, Series 2014, 5.000%, 4/01/44 | 4/24 at 100.00 | | AAA | | | 2,266,680 | |
| | 2,000 | | Texas State, General Obligation Bonds, Transportation Commission Mobility Fund, Refunding Series 2014, 5.000%, 10/01/34 | 4/24 at 100.00 | | AAA | | | 2,308,840 | |
| | 90 | | Texas State, General Obligation Bonds, Transportation Commission Mobility Fund, Series 2008, 5.000%, 4/01/30 (UB) | 4/18 at 100.00 | | N/R | | | 99,536 | |
| | 910 | | Texas State, General Obligation Bonds, Transportation Commission Mobility Fund, Series 2008, 5.000%, 4/01/30 (UB) | 4/18 at 100.00 | | AAA | | | 997,760 | |
| | 3,025 | | Victoria Independent School District, Victoria County, Texas, General Obligation Bonds, School Building Series 2007, 5.000%, 2/15/32 | 2/17 at 100.00 | | AAA | | | 3,197,546 | |
| | | | West Texas Independent School District, McLennan and Hill Counties, General Obligation Refunding Bonds, Series 1998: | | | | | | | |
| | 45 | | 0.000%, 8/15/22 | 11/15 at 100.00 | | AAA | | | 30,919 | |
| | 45 | | 0.000%, 8/15/24 | 11/15 at 100.00 | | AAA | | | 27,723 | |
| | 9,000 | | Wylie Independent School District, Collin County, Texas, General Obligation Bonds, Capital Appreciation Series 2015, 0.000%, 8/15/45 | 8/25 at 44.15 | | Aaa | | | 2,566,530 | |
| | 55,810 | | Total Tax Obligation/General | | | | | | 43,240,263 | |
| | | | Tax Obligation/Limited – 17.9% (12.4% of Total Investments) | | | | | | | |
| | 1,000 | | Bexar County, Texas, Venue Project Revenue Bonds, Refunding Series 2010, 5.250%, 8/15/38 – AGM Insured | 8/19 at 100.00 | | AA | | | 1,114,840 | |
| | 1,175 | | Dallas Area Rapid Transit, Texas, Sales Tax Revenue Bonds, Refunding Senior Lien Series 2014A, 5.000%, 12/01/36 | 12/24 at 100.00 | | AA+ | | | 1,351,250 | |
| | 3,315 | | Dallas Area Rapid Transit, Texas, Sales Tax Revenue Bonds, Senior Lien Refunding Series 2007, 5.000%, 12/01/36 – AMBAC Insured | 12/16 at 100.00 | | AA+ | | | 3,477,170 | |
| | 500 | | Flower Mound, Texas, Special Assessment Revenue Bonds, River Walk Public Improvement District 1, Series 2014, 6.500%, 9/01/36 | No Opt. Call | | N/R | | | 518,935 | |
| | 2,500 | | Harris County Metropolitan Transit Authority, Texas, Sales and Use Tax Revenue Bonds, Contractual Obligations Series 2015B, 5.000%, 11/01/25 | No Opt. Call | | AA+ | | | 3,064,200 | |
| | 1,390 | | Harris County Metropolitan Transit Authority, Texas, Sales and Use Tax Revenue Bonds, Series 2011A, 5.000%, 11/01/41 | 11/21 at 100.00 | | AA+ | | | 1,574,328 | |
| | | | Harris County-Houston Sports Authority, Texas, Revenue Bonds, Junior Lien Series 2001H: | | | | | | | |
| | 300 | | 0.000%, 11/15/24 – NPFG Insured | No Opt. Call | | AA– | | | 207,408 | |
| | 210 | | 0.000%, 11/15/32 – NPFG Insured | 11/31 at 94.05 | | AA– | | | 94,513 | |
| | 260 | | 0.000%, 11/15/33 | 11/31 at 88.44 | | AA– | | | 109,164 | |
| | 2,045 | | 0.000%, 11/15/34 – NPFG Insured | 11/31 at 83.17 | | AA– | | | 807,448 | |
| | 1,130 | | 0.000%, 11/15/36 – NPFG Insured | 11/31 at 73.51 | | AA– | | | 391,274 | |
| | 4,370 | | 0.000%, 11/15/38 – NPFG Insured | 11/31 at 64.91 | | AA– | | | 1,325,552 | |
| | 2,260 | | 0.000%, 11/15/39 – NPFG Insured | 11/31 at 60.98 | | AA– | | | 643,987 | |
| | Principal | | | Optional Call | | | | | | |
| | Amount (000) | | Description (1) | Provisions (2) | | Ratings (3) | | | Value | |
| | | | Tax Obligation/Limited (continued) | | | | | | | |
| $ | 400 | | Harris County-Houston Sports Authority, Texas, Revenue Bonds, Refunding Second Lien Series 2014C, 5.000%, 11/15/34 | 11/24 at 100.00 | | A3 | | $ | 440,564 | |
| | 3,440 | | Harris County-Houston Sports Authority, Texas, Revenue Bonds, Senior Lien Series 2001G, 0.000%, 11/15/41 – NPFG Insured | 11/31 at 53.78 | | AA– | | | 897,290 | |
| | 1,000 | | Harris County-Houston Sports Authority, Texas, Revenue Bonds, Third Lien Series 2004A-3, 0.000%, 11/15/33 – NPFG Insured | 11/24 at 59.10 | | AA– | | | 385,520 | |
| | 210 | | Houston, Texas, Hotel Occupancy Tax and Special Revenue Bonds, Convention and Entertainment Facilities Department, Refunding Series 2011B, 5.000%, 9/01/30 | 9/16 at 100.00 | | A2 | | | 214,274 | |
| | 1,015 | | Houston, Texas, Hotel Occupancy Tax and Special Revenue Bonds, Convention and Entertainment Facilities Department, Refunding Series 2014, 5.000%, 9/01/34 | No Opt. Call | | A2 | | | 1,130,020 | |
| | 1,470 | | Houston, Texas, Hotel Occupancy Tax and Special Revenue Bonds, Convention and Entertainment Project, Series 2001B, 0.000%, 9/01/32 – AMBAC Insured | No Opt. Call | | A2 | | | 691,591 | |
| | 250 | | Little Elm. Texas, Valencia Public Improvement District Phase I Special Assessment Revenue Bonds, Series 2014, 7.150%, 9/01/37 | 3/18 at 103.00 | | N/R | | | 260,260 | |
| | 3,000 | | North Texas Tollway Authority, Special Projects System Revenue Bonds, Current Interest Series 2011D, 5.000%, 9/01/31 | 9/21 at 100.00 | | AA+ | | | 3,451,710 | |
| | 2,000 | | North Texas Tollway Authority, Special Projects System Revenue Bonds, Series 2011A, 5.500%, 9/01/41 | 9/21 at 100.00 | | AA+ | | | 2,334,320 | |
| | 1,000 | | Uptown Development Authority, Houston, Texas, Tax Increment Revenue Bonds, Infrastructure Improvement Facilities, Series 2009, 5.500%, 9/01/29 | 9/19 at 100.00 | | BBB | | | 1,096,740 | |
| | 1,735 | | Via Metropolitan Transit Advanced Transportation District, Texas, Sales Tax Revenue Bonds, Refunding & Improvement Series 2014, 5.000%, 8/01/38 | 8/24 at 100.00 | | | | | 1,992,960 | |
| | 35,975 | | Total Tax Obligation/Limited | | | | | | 27,575,318 | |
| | | | Transportation – 17.7% (12.3% of Total Investments) | | | | | | | |
| | 3,000 | | Austin, Texas, Airport System Revenue Bonds, Series 2015, 5.000%, 11/15/39 (Alternative Minimum Tax) | 11/24 at 100.00 | | A1 | | | 3,279,720 | |
| | | | Central Texas Regional Mobility Authority, Revenue Bonds, Senior Lien Series 2010: | | | | | | | |
| | 2,945 | | 0.000%, 1/01/36 | No Opt. Call | | BBB | | | 1,134,502 | |
| | 2,205 | | 0.000%, 1/01/37 | No Opt. Call | | BBB | | | 805,464 | |
| | 2,160 | | 0.000%, 1/01/38 | No Opt. Call | | BBB | | | 750,730 | |
| | 1,000 | | 0.000%, 1/01/40 | No Opt. Call | | BBB | | | 310,260 | |
| | 665 | | Central Texas Regional Mobility Authority, Revenue Bonds, Subordinate Lien Refunding Series 2013, 5.000%, 1/01/42 | 1/23 at 100.00 | | BBB– | | | 714,436 | |
| | 1,000 | | Dallas-Fort Worth International Airport, Texas, Joint Revenue Bonds, Refunding Series 2010A, 5.000%, 11/01/42 | 11/20 at 100.00 | | A+ | | | 1,102,270 | |
| | 1,165 | | Dallas-Fort Worth International Airport, Texas, Joint Revenue Bonds, Refunding Series 2012B, 5.000%, 11/01/35 | 11/20 at 100.00 | | A+ | | | 1,309,588 | |
| | 1,670 | | Grand Parkway Transportation Corporation, Texas, System Toll Revenue Bonds, First Tier Series 2013A, 5.125%, 10/01/43 | 10/23 at 100.00 | | BBB+ | | | 1,801,847 | |
| | 1,165 | | Harris County, Texas, Toll Road Revenue Bonds, Refunding Senior Lien Series 2012C, 5.000%, 8/15/31 | No Opt. Call | | AA | | | 1,323,591 | |
| | 2,000 | | Houston, Texas, Subordinate Lien Airport System Revenue Refunding Bonds, Series 2012A, 5.000%, 7/01/31 (Alternative Minimum Tax) | 7/22 at 100.00 | | A | | | 2,189,740 | |
| | 1,750 | | Love Field Airport Modernization Corporation, Texas, General Airport Revenue Bonds Series 2015, 5.000%, 11/01/35 (Alternative Minimum Tax) | 11/25 at 100.00 | | A1 | | | 1,949,080 | |
| | 3,000 | | Love Field Airport Modernization Corporation, Texas, Special Facilities Revenue Bonds, Southwest Airlines Company, Series 2010, 5.250%, 11/01/40 | 11/20 at 100.00 | | Baa1 | | | 3,272,550 | |
| | | | North Texas Tollway Authority, System Revenue Bonds, First Tier Series 2009A: | | | | | | | |
| | 100 | | 6.100%, 1/01/28 | 1/19 at 100.00 | | A1 | | | 114,723 | |
| | 2,000 | | 6.250%, 1/01/39 | 1/19 at 100.00 | | A1 | | | 2,275,480 | |
| | 395 | | North Texas Tollway Authority, System Revenue Bonds, Refunding First Tier, Series 2008A, 5.750%, 1/01/40 | 1/18 at 100.00 | | A1 | | | 430,672 | |
| NTX | Nuveen Texas Quality Income Municipal Fund | |
| | Portfolio of Investments (continued) | August 31, 2015 (Unaudited) |
| | Principal | | | Optional Call | | | | | | |
| | Amount (000) | | Description (1) | Provisions (2) | | Ratings (3) | | | Value | |
| | | | Transportation (continued) | | | | | | | |
| | | | North Texas Tollway Authority, System Revenue Bonds, Refunding First Tier, Series 2008B: | | | | | | | |
| $ | 325 | | 5.750%, 1/01/40 | 1/18 at 100.00 | | A1 | | $ | 354,351 | |
| | 225 | | 5.750%, 1/01/40 – NPFG Insured | 1/18 at 100.00 | | AA– | | | 246,134 | |
| | 2,500 | | North Texas Tollway Authority, System Revenue Bonds, Refunding First Tier, Series 2008D, 0.000%, 1/01/36 – AGC Insured | No Opt. Call | | AA | | | 1,111,825 | |
| | 2,500 | | San Antonio, Texas, Airport System Revenue Bonds, Refunding Series 2012, 5.000%, 7/01/27 (Alternative Minimum Tax) | 7/22 at 100.00 | | A+ | | | 2,828,225 | |
| | 31,770 | | Total Transportation | | | | | | 27,305,188 | |
| | | | U.S. Guaranteed – 13.2% (9.2% of Total Investments) (4) | | | | | | | |
| | 2,000 | | Borger Independent School District, Hutchison County, Texas, General Obligation Bonds, Series 2006, 5.000%, 2/15/36 (Pre-refunded 2/15/16) | 2/16 at 100.00 | | AAA | | | 2,044,180 | |
| | 4,625 | | Dallas Area Rapid Transit, Texas, Sales Tax Revenue Bonds, Senior Lien Refunding Series 2007, 5.000%, 12/01/36 (Pre-refunded 12/01/16) – AMBAC Insured | 12/16 at 100.00 | | Aa2 (4) | | | 4,891,539 | |
| | 1,000 | | El Paso, Texas, Water and Sewer Revenue Bonds, Refunding Series 2008C, 5.375%, 3/01/29 (Pre-refunded 3/01/18) | 3/18 at 100.00 | | AA+ (4) | | | 1,112,810 | |
| | 3,615 | | Frisco, Texas, General Obligation Bonds, Series 2006, 5.000%, 2/15/26 (Pre-refunded 2/15/16) – FGIC Insured | 2/16 at 100.00 | | AA+ (4) | | | 3,694,855 | |
| | 1,290 | | Houston, Texas, Hotel Occupancy Tax and Special Revenue Bonds, Convention and Entertainment Facilities Department, Refunding Series 2011B, 5.000%, 9/01/30 (Pre-refunded 9/01/16) | 9/16 at 100.00 | | N/R (4) | | | 1,349,882 | |
| | 960 | | Leander Independent School District, Williamson and Travis Counties, Texas, General Obligation Bonds, Series 2008, 0.000%, 8/15/36 (Pre-refunded 8/15/17) | 8/17 at 33.01 | | N/R (4) | | | 312,106 | |
| | 25 | | Lower Colorado River Authority, Texas, Revenue Bonds, Refunding Series 2012B, 5.000%, 5/15/29 (Pre-refunded 5/15/22) | 5/22 at 100.00 | | N/R (4) | | | 29,972 | |
| | 1,000 | | Lufkin Health Facilities Development Corporation, Texas, Health System Revenue Bonds, Memorial Health System of East Texas, Series 2007, 5.500%, 2/15/32 (Pre-refunded 2/15/17) | 2/17 at 100.00 | | N/R (4) | | | 1,072,120 | |
| | 1,000 | | North Central Texas Health Facilities Development Corporation, Hospital Revenue Bonds, Presbyterian Healthcare System, Series 1996A, 5.750%, 6/01/26 – NPFG Insured (ETM) | No Opt. Call | | Aaa | | | 1,219,750 | |
| | 950 | | North Texas Tollway Authority, System Revenue Bonds, Refunding Second Tier, Series 2008F, 5.750%, 1/01/38 (Pre-refunded 1/01/18) | 1/18 at 100.00 | | A2 (4) | | | 1,058,594 | |
| | 2,500 | | Retama Development Corporation, Texas, Special Facilities Revenue Bonds, Retama Park Racetrack, Series 1993, 8.750%, 12/15/18 (Pre-refunded 12/15/17) | 12/17 at 100.00 | | Aaa | | | 2,951,425 | |
| | 95 | | Tarrant County Cultural Education Facilities Finance Corporation, Texas, Hospital Revenue Bonds, Scott & White Healthcare Project, Series 2010, 5.250%, 8/15/40 (Pre-refunded 8/15/20) | 8/20 at 100.00 | | N/R (4) | | | 111,719 | |
| | 410 | | Tarrant County Cultural Education Facilities Finance Corporation, Texas, Revenue Bonds, Christus Health, Refunding Series 2008A, 6.500%, 7/01/37 (Pre-refunded 1/01/19) – AGC Insured | 1/19 at 100.00 | | AA (4) | | | 481,008 | |
| | 19,470 | | Total U.S. Guaranteed | | | | | | 20,329,960 | |
| | | | Utilities – 18.3% (12.7% of Total Investments) | | | | | | | |
| | 3,000 | | Austin, Texas, Electric Utility System Revenue Bonds, Refunding Series 2012A, 5.000%, 11/15/40 | No Opt. Call | | AA– | | | 3,304,320 | |
| | 3,000 | | Austin, Texas, Electric Utility System Revenue Bonds, Refunding Series 2015A, 5.000%, 11/15/38 | 11/25 at 100.00 | | AA– | | | 3,366,810 | |
| | 2,560 | | Brazos River Authority, Texas, Pollution Control Revenue Refunding Bonds, TXU Electric Company, Series 1999C, 7.700%, 3/01/32 (Alternative Minimum Tax) (5) | 11/15 at 100.00 | | C | | | 153,600 | |
| | 2,000 | | Brownsville, Texas, Utility System Revenue Bonds, Refunding Series 2015, 5.000%, 9/01/31 | 9/25 at 100.00 | | A+ | | | 2,238,760 | |
| | 2,000 | | Bryan, Brazos County, Texas, Electric System Revenue Bonds, Series 2009, 5.000%, 7/01/34 | 7/17 at 100.00 | | A+ | | | 2,124,780 | |
| | 3,000 | | Lower Colorado River Authority, Texas, Revenue Bonds, Refunding Series 2010A, 5.000%, 5/15/40 | 5/20 at 100.00 | | A | | | 3,276,780 | |
| | 1,150 | | Lower Colorado River Authority, Texas, Revenue Bonds, Refunding Series 2012A, 5.000%, 5/15/36 | 5/22 at 100.00 | | A | | | 1,268,875 | |
| | 1,975 | | Lower Colorado River Authority, Texas, Revenue Bonds, Refunding Series 2012B, 5.000%, 5/15/29 | 5/22 at 100.00 | | A | | | 2,215,772 | |
| | 1,500 | | Matagorda County Navigation District Number One, Texas, Pollution Control Revenue Refunding Bonds, Central Power and Light Company Project, Series 2009A, 6.300%, 11/01/29 | 7/19 at 102.00 | | Baa1 | | | 1,702,335 | |
| | 1,000 | | Sam Rayburn Municipal Power Agency, Texas, Power Supply System Revenue Bonds, Refunding Series 2012, 5.000%, 10/01/20 | No Opt. Call | | BBB+ | | | 1,149,510 | |
| | Principal | | | Optional Call | | | | | | |
| | Amount (000) | | Description (1) | Provisions (2) | | Ratings (3) | | | Value | |
| | | | Utilities (continued) | | | | | | | |
| | | | Texas Municipal Gas Acquisition and Supply Corporation I, Gas Supply Revenue Bonds, Senior Lien Series 2008D: | | | | | | | |
| $ | 770 | | 5.625%, 12/15/17 | No Opt. Call | | A– | | $ | 816,108 | |
| | 3,000 | | 6.250%, 12/15/26 | No Opt. Call | | A– | | | 3,593,040 | |
| | 1,000 | | Texas Municipal Gas Acquisition and Supply Corporation I, Gas Supply Revenue Bonds, Series 2006A, 5.250%, 12/15/20 | No Opt. Call | | A– | | | 1,135,940 | |
| | | | Texas Municipal Power Agency, Revenue Bonds, Transmission Refunding Series 2010: | | | | | | | |
| | 640 | | 5.000%, 9/01/34 | 9/20 at 100.00 | | A+ | | | 708,070 | |
| | 1,000 | | 5.000%, 9/01/40 | 9/20 at 100.00 | | A+ | | | 1,097,820 | |
| | 60 | | Texas State, General Obligation Bonds, Water Utility, Series 2001, 5.250%, 8/01/23 | 2/16 at 100.00 | | AAA | | | 60,257 | |
| | 27,655 | | Total Utilities | | | | | | 28,212,777 | |
| | | | Water and Sewer – 16.8% (11.7% of Total Investments) | | | | | | | |
| | 1,575 | | Bell County Water Control Improvement District 1, Texas, Water Revenue Bonds, Series 2014, 5.000%, 7/10/38 – BAM Insured | 7/23 at 100.00 | | AA | | | 1,752,030 | |
| | 2,500 | | Bexar Metropolitan Water District, Texas, Waterworks System Revenue Bonds, Refunding Series 2010, 5.875%, 5/01/40 | 5/20 at 100.00 | | A+ | | | 2,876,550 | |
| | 2,500 | | Canadian River Municipal Water Authority, Texas, Contract Revenue Bonds, Conjunctive Use Groundwater Supply Project, Subordinate Lien Series 2011, 5.000%, 2/15/31 | 2/21 at 100.00 | | AA | | | 2,816,600 | |
| | 2,000 | | Corpus Christi, Texas, Utility System Revenue Bonds, Improvement Junior Lien Series 2013, 5.000%, 7/15/43 | 7/23 at 100.00 | | A+ | | | 2,212,040 | |
| | 2,000 | | Houston, Texas, First Lien Combined Utility System Revenue Bonds, Refunding Series 2012D, 5.000%, 11/15/42 | 11/22 at 100.00 | | AA | | | 2,229,940 | |
| | 4,000 | | Laredo, Webb County, Texas, Waterworks and Sewer System Revenue Bonds, Series 2010, 5.250%, 3/01/40 | 3/20 at 100.00 | | AA– | | | 4,578,160 | |
| | 710 | | North Fort Bend Water Authority, Texas, Water System Revenue Bonds, Series 2011, 5.000%, 12/15/36 – AGM Insured | 12/21 at 100.00 | | AA | | | 779,275 | |
| | 3,860 | | North Harris County Regional Water Authority, Texas, Water Revenue Bonds, Senior Lien Refunding Series 2013, 5.000%, 12/15/33 | 12/22 at 100.00 | | AA– | | | 4,326,983 | |
| | 1,000 | | Nueces River Authority, Texas, Water Supply Revenue Bonds, Corpus Christi Lake Texana Project, Refunding Series 2015, 5.000%, 7/15/26 (WI/DD, Settling 9/17/15) | 7/25 at 100.00 | | AA– | | | 1,194,980 | |
| | 2,640 | | San Antonio, Texas, Water System Revenue Bonds, Refunding Junior Lien Series 2015B, 5.000%, 5/15/34 | 5/25 at 100.00 | | AA | | | 3,050,335 | |
| | 22,785 | | Total Water and Sewer | | | | | | 25,816,893 | |
| $ | 238,905 | | Total Long-Term Investments (cost $207,344,505) | | | | | | 221,285,064 | |
| | | | Floating Rate Obligations – (0.4)% | | | | | | (660,000 | ) |
| | | | Institutional MuniFund Term Preferred Shares, at Liquidation Value – (46.7)% (6) | | | | | | (72,000,000 | ) |
| | | | Other Assets Less Liabilities – 3.5% | | | | | | 5,494,460 | |
| | | | Net Assets Applicable to Common Shares – 100% | | | | | $ | 154,119,524 | |
| (1) | All percentages shown in the Portfolio of Investments are based on net assets applicable to common shares unless otherwise noted. |
| (2) | Optional Call Provisions: Dates (month and year) and prices of the earliest optional call or redemption. There may be other call provisions at varying prices at later dates. Certain mortgage-backed securities may be subject to periodic principal paydowns. |
| (3) | Ratings: Using the highest of Standard & Poor's Group ("Standard & Poor's"), Moody's Investors Service, Inc. ("Moody's") or Fitch, Inc. ("Fitch") rating. Ratings below BBB by Standard & Poor's, Baa by Moody's or BBB by Fitch are considered to be below investment grade. Holdings designated N/R are not rated by any of these national rating agencies. |
| (4) | Backed by an escrow or trust containing sufficient U.S. Government or U.S. Government agency securities, which ensure the timely payment of principal and interest. Certain bonds backed by U.S. Government or agency securities are regarded as having an implied rating equal to the rating of such securities. |
| (5) | As of, or subsequent to, the end of the reporting period this security is non-income producing. Non-income producing, in the case of a fixed-income security, generally denotes that the issuer has (1) defaulted on the payment of principal or interest, (2) is under the protection of the Federal Bankruptcy Court or (3) the Fund's Adviser has concluded that the issue is not likely to meet its future interest payment obligations and has ceased accruing additional income on the Fund's records. |
| (6) | Institutional MuniFund Term Preferred Shares, at Liquidation Value as a percentage of Total Investments is 32.5%. |
| (ETM) | Escrowed to maturity. |
| (UB) | Underlying bond of an inverse floating rate trust reflected as a financing transaction. See Notes to Financial Statements, Note 3 – Portfolio Securities and Investments in Derivatives, Inverse Floating Rate Securities for more information. |
| (WI/DD) | Investment, or portion of investment, purchased on a when-issued or delayed delivery basis. |
See accompanying notes to financial statements.
| Statement of | |
| Assets and Liabilities | August 31, 2015 (Unaudited) |
| | | | Arizona | | | Michigan | | | Ohio | | | Texas | |
| | | | Premium | | | Quality | | | Quality | | | Quality | |
| | | | Income | | | Income | | | Income | | | Income | |
| | | | (NAZ | ) | | (NUM | ) | | (NUO | ) | | (NTX | ) |
| Assets | | | | | | | | | | | | | |
| Long-term investments, at value (cost $231,423,059, $451,587,647, $421,731,842 and $207,344,505, respectively) | | $ | 248,631,610 | | $ | 479,407,408 | | $ | 451,829,450 | | $ | 221,285,064 | |
| Cash | | | 2,235,675 | | | 5,126,207 | | | 824,764 | | | — | |
| Receivable for: | | | | | | | | | | | | | |
| Interest | | | 2,465,761 | | | 6,088,982 | | | 5,093,294 | | | 2,316,414 | |
| Investments sold | | | 120,000 | | | 1,118,792 | | | — | | | 5,000,000 | |
| Deferred offering costs | | | 62,283 | | | 98,137 | | | 275,979 | | | 520,030 | |
| Other assets | | | 3,130 | | | 45,284 | | | 126,590 | | | 7,792 | |
| Total assets | | | 253,518,459 | | | 491,884,810 | | | 458,150,077 | | | 229,129,300 | |
| Liabilities | | | | | | | | | | | | | |
| Cash overdraft | | | — | | | — | | | — | | | 473,918 | |
| Floating rate obligations | | | 2,755,000 | | | 6,625,000 | | | — | | | 660,000 | |
| Payable for: | | | | | | | | | | | | | |
| Dividends | | | 748,250 | | | 1,246,775 | | | 1,187,726 | | | 514,189 | |
| Interest | | | 65,083 | | | 130,990 | | | — | | | — | |
| Investments purchased | | | 1,265,839 | | | 1,232,359 | | | — | | | 1,186,880 | |
| Offering costs | | | — | | | — | | | 1,201 | | | — | |
| Institutional MuniFund Term Preferred ("iMTP") Shares, at liquidation value | | | — | | | — | | | — | | | 72,000,000 | |
| Variable Rate MuniFund Term Preferred ("VMTP") Shares, at liquidation value | | | 79,000,000 | | | 159,000,000 | | | — | | | — | |
| Variable Rate Demand Preferred ("VRDP") Shares, at liquidation value | | | — | | | — | | | 148,000,000 | | | — | |
| Accrued expenses: | | | | | | | | | | | | | |
| Management fees | | | 134,369 | | | 247,980 | | | 243,394 | | | 116,937 | |
| Trustees fees | | | 994 | | | 44,225 | | | 11,766 | | | 901 | |
| Other | | | 150,865 | | | 111,952 | | | 122,387 | | | 56,951 | |
| Total liabilities | | | 84,120,400 | | | 168,639,281 | | | 149,566,474 | | | 75,009,776 | |
| Net assets applicable to common shares | | $ | 169,398,059 | | $ | 323,245,529 | | $ | 308,583,603 | | $ | 154,119,524 | |
| Common shares outstanding | | | 11,566,134 | | | 20,828,387 | | | 18,521,955 | | | 10,027,210 | |
| Net asset value ("NAV") per common share outstanding | | $ | 14.65 | | $ | 15.52 | | $ | 16.66 | | $ | 15.37 | |
| Net assets applicable to common shares consist of: | | | | | | | | | | | | | |
| Common shares, $0.01 par value per share | | $ | 115,661 | | $ | 208,284 | | $ | 185,220 | | $ | 100,272 | |
| Paid-in surplus | | | 157,696,556 | | | 295,538,703 | | | 281,391,372 | | | 141,884,337 | |
| Undistributed (Over-distribution of) net investment income | | | 1,273,797 | | | 416,091 | | | 232,006 | | | (63,578 | ) |
| Accumulated net realized gain (loss) | | | (6,896,506 | ) | | (737,310 | ) | | (3,322,603 | ) | | (1,742,066 | ) |
| Net unrealized appreciation (depreciation) | | | 17,208,551 | | | 27,819,761 | | | 30,097,608 | | | 13,940,559 | |
| Net assets applicable to common shares | | $ | 169,398,059 | | $ | 323,245,529 | | $ | 308,583,603 | | $ | 154,119,524 | |
| Authorized shares: | | | | | | | | | | | | | |
| Common | | | Unlimited | | | Unlimited | | | Unlimited | | | Unlimited | |
| Preferred | | | Unlimited | | | Unlimited | | | Unlimited | | | Unlimited | |
See accompanying notes to financial statements.
| Statement of | |
| Operations | Six Months Ended August 31, 2015 (Unaudited) |
| | | | Arizona | | | Michigan | | | Ohio | | | Texas | |
| | | | Premium | | | Quality | | | Quality | | | Quality | |
| | | | Income | | | Income | | | Income | | | Income | |
| | | | (NAZ | ) | | (NUM | ) | | (NUO | ) | | (NTX | ) |
| Investment Income | | $ | 5,707,618 | | $ | 10,372,482 | | $ | 9,974,367 | | $ | 4,706,265 | |
| Expenses | | | | | | | | | | | | | |
| Management fees | | | 800,415 | | | 1,473,272 | | | 1,446,991 | | | 695,408 | |
| Interest expense and amortization of offering costs | | | 429,550 | | | 861,365 | | | 109,457 | | | 779,486 | |
| Liquidity fees | | | — | | | — | | | 693,395 | | | — | |
| Remarketing fees | | | — | | | — | | | 75,645 | | | — | |
| Custodian fees | | | 19,594 | | | 30,587 | | | 31,062 | | | 18,298 | |
| Trustees fees | | | 3,522 | | | 6,828 | | | 6,475 | | | 3,395 | |
| Professional fees | | | 16,632 | | | 18,209 | | | 19,778 | | | 20,236 | |
| Shareholder reporting expenses | | | 9,954 | | | 21,797 | | | 21,837 | | | 15,305 | |
| Shareholder servicing agent fees | | | 9,584 | | | 19,737 | | | 8,347 | | | 8,861 | |
| Stock exchange listing fees | | | 3,864 | | | 2,604 | | | 3,860 | | | 16,342 | |
| Investor relations expenses | | | 3,306 | | | 4,905 | | | 4,800 | | | 3,860 | |
| Other | | | 16,097 | | | 30,061 | | | 37,481 | | | 9,930 | |
| Total expenses | | | 1,312,518 | | | 2,469,365 | | | 2,459,128 | | | 1,571,121 | |
| Net investment income (loss) | | | 4,395,100 | | | 7,903,117 | | | 7,515,239 | | | 3,135,144 | |
| Realized and Unrealized Gain (Loss) | | | | | | | | | | | | | |
| Net realized gain (loss) from: | | | | | | | | | | | | | |
| Investments | | | 42,247 | | | 815,201 | | | 225,843 | | | 324,901 | |
| Swaps | | | — | | | 45,681 | | | 20,171 | | | 53,624 | |
| Change in net unrealized appreciation (depreciation) of: | | | | | | | | | | | | | |
| Investments | | | (4,106,123 | ) | | (6,278,718 | ) | | (6,342,703 | ) | | (3,664,881 | ) |
| Swaps | | | — | | | (187,352 | ) | | (197,460 | ) | | (94,558 | ) |
| Net realized and unrealized gain (loss) | | | (4,063,876 | ) | | (5,605,188 | ) | | (6,294,149 | ) | | (3,380,914 | ) |
| Net increase (decrease) in net assets applicable to common shares from operations | | $ | 331,224 | | $ | 2,297,929 | | $ | 1,221,090 | | $ | (245,770 | ) |
See accompanying notes to financial statements.
| Statement of | |
| Changes in Net Assets | (Unaudited) |
| | | Arizona Premium Income (NAZ) | | Michigan Quality Income (NUM) |
| | | | Six Months | | | Year | | | Six Months | | | Year | |
| | | | Ended | | | Ended | | | Ended | | | Ended | |
| | | | 8/31/15 | | | 2/28/15 | | | 8/31/15 | | | 2/28/15 | |
| Operations | | | | | | | | | | | | | |
| Net investment income (loss) | | $ | 4,395,100 | | $ | 9,114,999 | | $ | 7,903,117 | | $ | 16,591,557 | |
| Net realized gain (loss) from: | | | | | | | | | | | | | |
| Investments | | | 42,247 | | | (22,618 | ) | | 815,201 | | | 2,427,886 | |
| Swaps | | | — | | | — | | | 45,681 | | | (110,570 | ) |
| Change in net unrealized appreciation (depreciation) of: | | | | | | | | | | | | | |
| Investments | | | (4,106,123 | ) | | 10,106,125 | | | (6,278,718 | ) | | 15,834,489 | |
| Swaps | | | — | | | — | | | (187,352 | ) | | 187,352 | |
| Net increase (decrease) in net assets applicable to common shares from operations | | | 331,224 | | | 19,198,506 | | | 2,297,929 | | | 34,930,714 | |
| Distributions to Common Shareholders | | | | | | | | | | | | | |
| From net investment income | | | (4,614,436 | ) | | (9,185,193 | ) | | (8,218,618 | ) | | (17,879,214 | ) |
| Decrease in net assets applicable to common shares from distributions to common shareholders | | | (4,614,436 | ) | | (9,185,193 | ) | | (8,218,618 | ) | | (17,879,214 | ) |
| Capital Share Transactions | | | | | | | | | | | | | |
| Common shares: | | | | | | | | | | | | | |
| Net proceeds from shares issued to shareholders due to reinvestment of distributions | | | 33,128 | | | — | | | — | | | — | |
| Cost of shares repurchased and retired | | | — | | | — | | | (65,668 | ) | | — | |
| Net increase (decrease) in net assets applicable to common shares from capital share transactions | | | 33,128 | | | — | | | (65,668 | ) | | — | |
| Net increase (decrease) in net assets applicable to common shares | | | (4,250,084 | ) | | 10,013,313 | | | (5,986,357 | ) | | 17,051,500 | |
| Net assets applicable to common shares at the beginning of period | | | 173,648,143 | | | 163,634,830 | | | 329,231,886 | | | 312,180,386 | |
| Net assets applicable to common shares at the end of period | | $ | 169,398,059 | | $ | 173,648,143 | | $ | 323,245,529 | | $ | 329,231,886 | |
| Undistributed (Over-distribution of) net investment income at the end of period | | $ | 1,273,797 | | $ | 1,493,133 | | $ | 416,091 | | $ | 731,592 | |
See accompanying notes to financial statements.
| | | | | Texas Quality Income (NTX) |
| | | | Six Months | | | Year | | | Six Months | | | Year | |
| | | | Ended | | | Ended | | | Ended | | | Ended | |
| | | | 8/31/15 | | | 2/28/15 | | | 8/31/15 | | | 2/28/15 | |
| Operations | | | | | | | | | | | | | |
| Net investment income (loss) | | $ | 7,515,239 | | $ | 15,719,120 | | $ | 3,135,144 | | $ | 6,249,696 | |
| Net realized gain (loss) from: | | | | | | | | | | | | | |
| Investments | | | 225,843 | | | 1,769,803 | | | 324,901 | | | 12,259 | |
| Swaps | | | 20,171 | | | (102,819 | ) | | 53,624 | | | (50,337 | ) |
| Change in net unrealized appreciation (depreciation) of: | | | | | | | | | | | | | |
| Investments | | | (6,342,703 | ) | | 18,054,694 | | | (3,664,881 | ) | | 9,536,154 | |
| Swaps | | | (197,460 | ) | | 197,460 | | | (94,558 | ) | | 94,558 | |
| Net increase (decrease) in net assets applicable to common shares from operations | | | 1,221,090 | | | 35,638,258 | | | (245,770 | ) | | 15,842,330 | |
| Distributions to Common Shareholders | | | | | | | | | | | | | |
| From net investment income | | | (7,779,221 | ) | | (17,164,296 | ) | | (3,278,898 | ) | | (6,778,394 | ) |
| Decrease in net assets applicable to common shares from distributions to common shareholders | | | (7,779,221 | ) | | (17,164,296 | ) | | (3,278,898 | ) | | (6,778,394 | ) |
| Capital Share Transactions | | | | | | | | | | | | | |
| Common shares: | | | | | | | | | | | | | |
| Net proceeds from shares issued to shareholders due to reinvestment of distributions | | | — | | | — | | | — | | | — | |
| Cost of shares repurchased and retired | | | — | | | — | | | — | | | — | |
| Net increase (decrease) in net assets applicable to common shares from capital share transactions | | | — | | | — | | | — | | | — | |
| Net increase (decrease) in net assets applicable to common shares | | | (6,558,131 | ) | | 18,473,962 | | | (3,524,668 | ) | | 9,063,936 | |
| Net assets applicable to common shares at the beginning of period | | | 315,141,734 | | | 296,667,772 | | | 157,644,192 | | | 148,580,256 | |
| Net assets applicable to common shares at the end of period | | $ | 308,583,603 | | $ | 315,141,734 | | $ | 154,119,524 | | $ | 157,644,192 | |
| Undistributed (Over-distribution of) net investment income at the end of period | | $ | 232,006 | | $ | 495,988 | | $ | (63,578 | ) | $ | 80,176 | |
See accompanying notes to financial statements.
| Statement of | |
| Cash Flows | Six Months Ended August 31, 2015 (Unaudited) |
| | | | Arizona | | | Michigan | | | Ohio | | | Texas | |
| | | | Premium | | | Quality | | | Quality | | | Quality | |
| | | | Income | | | Income | | | Income | | | Income | |
| | | | (NAZ | ) | | (NUM | ) | | (NUO | ) | | (NTX | ) |
| Cash Flows from Operating Activities: | | | | | | | | | | | | | |
| Net Increase (Decrease) in Net Assets Applicable to Common Shares from Operations | | $ | 331,224 | | $ | 2,297,929 | | $ | 1,221,090 | | $ | (245,770 | ) |
| Adjustments to reconcile the net increase (decrease) in net assets applicable to common shares from operations to net cash provided by (used in) operating activities: | | | | | | | | | | | | | |
| Purchases of investments | | | (9,988,972 | ) | | (45,065,482 | ) | | (21,770,973 | ) | | (26,190,167 | ) |
| Proceeds from sales and maturities of investments | | | 9,389,574 | | | 41,207,696 | | | 18,574,171 | | | 28,719,558 | |
| Proceeds from (Payments for) swap contracts, net | | | — | | | 45,681 | | | 20,171 | | | 53,624 | |
| Investment transaction adjustments, net | | | (6 | ) | | (30,397 | ) | | (6,217 | ) | | (87,998 | ) |
| Taxes paid on undistributed capital gains | | | — | | | (144 | ) | | (56 | ) | | — | |
| Amortization (Accretion) of premiums and discounts, net | | | 517,179 | | | 681,424 | | | 510,604 | | | 158,783 | |
| Amortization of deferred offering costs | | | 24,593 | | | 37,080 | | | 4,964 | | | 233,861 | |
| (Increase) Decrease in: | | | | | | | | | | | | | |
| Credit default swap premiums paid | | | — | | | 904,298 | | | 884,666 | | | 419,803 | |
| Receivable for interest | | | 47,955 | | | (14,442 | ) | | 56,872 | | | 148,209 | |
| Receivable for investments sold | | | (120,000 | ) | | (1,118,792 | ) | | — | | | (470,687 | ) |
| Other assets | | | (1,973 | ) | | (13,785 | ) | | 3,200 | | | (6,823 | ) |
| Increase (Decrease) in: | | | | | | | | | | | | | |
| Payable for interest | | | 6,298 | | | 12,677 | | | — | | | (135,930 | ) |
| Payable for investments purchased | | | 1,265,839 | | | (1,564,473 | ) | | — | | | (4,391,450 | ) |
| Accrued management fees | | | 10,738 | | | 20,460 | | | 22,377 | | | 8,241 | |
| Accrued Trustees fees | | | (1,464 | ) | | 9,519 | | | 1,009 | | | (1,324 | ) |
| Accrued other expenses | | | (27,744 | ) | | (34,378 | ) | | (20,330 | ) | | (24,597 | ) |
| Net realized (gain) loss from: | | | | | | | | | | | | | |
| Investments and foreign currency | | | (42,247 | ) | | (815,201 | ) | | (225,843 | ) | | (324,901 | ) |
| Swaps | | | — | | | (45,681 | ) | | (20,171 | ) | | (53,624 | ) |
| Change in net unrealized appreciation (depreciation) of: | | | | | | | | | | | | | |
| Investments and foreign currency | | | 4,106,123 | | | 6,278,718 | | | 6,342,703 | | | 3,664,881 | |
| Swaps | | | — | | | 187,352 | | | 197,460 | | | 94,558 | |
| Net cash provided by (used in) operating activities | | | 5,517,117 | | | 2,980,059 | | | 5,795,697 | | | 1,568,247 | |
| Cash Flows from Financing Activities: | | | | | | | | | | | | | |
| (Payments for) deferred offering costs | | | — | | | — | | | — | | | (530,000 | ) |
| Increase (Decrease) in: | | | | | | | | | | | | | |
| Cash overdraft | | | — | | | — | | | — | | | 473,918 | |
| Floating rate obligations | | | — | | | — | | | — | | | (3,300,000 | ) |
| Payable for offering costs | | | (825 | ) | | — | | | — | | | — | |
| iMTP Shares, at liquidation value | | | — | | | — | | | — | | | 72,000,000 | |
| MTP Shares, at liquidation value | | | — | | | — | | | — | | | (70,920,000 | ) |
| Cash distribution paid to common shareholders | | | (4,580,842 | ) | | (8,281,351 | ) | | (7,847,627 | ) | | (3,276,899 | ) |
| Cost of common shares repurchased and retired | | | — | | | (65,668 | ) | | — | | | — | |
| Net cash provided by (used in) financing activities | | | (4,581,667 | ) | | (8,347,019 | ) | | (7,847,627 | ) | | (5,552,981 | ) |
| Net Increase (Decrease) in Cash | | | 935,450 | | | (5,366,960 | ) | | (2,051,930 | ) | | (3,984,734 | ) |
| Cash at beginning of period | | | 1,300,225 | | | 10,493,167 | | | 2,876,694 | | | 3,984,734 | |
| Cash at end of period | | $ | 2,235,675 | | $ | 5,126,207 | | $ | 824,764 | | $ | — | |
| | | | Arizona | | | Michigan | | | Ohio | | | Texas | |
| | | | Premium | | | Quality | | | Quality | | | Quality | |
| | | | Income | | | Income | | | Income | | | Income | |
| Supplemental Disclosures of Cash Flow Information | | | (NAZ | ) | | (NUM | ) | | (NUO | ) | | (NTX | ) |
| Cash paid for interest (excluding amortization of offering costs) | | $ | 399,485 | | $ | 811,609 | | $ | 104,492 | | $ | 631,735 | |
| Non-cash financing activities not included herein consists of reinvestments of common share distributions | | | 33,128 | | | — | | | — | | | — | |
See accompanying notes to financial statements.
THIS PAGE INTENTIONALLY LEFT BLANK
Financial
Highlights (Unaudited)
Selected data for a common share outstanding throughout each period:
| | | | | | Investment Operations | | | Less Distributions
to Common Shareholders | | | Common Share | |
| | | Beginning
Common
Share
NAV | | | Net
Investment
Income
(Loss | ) | | Net
Realized/
Unrealized
Gain (Loss | ) | | Distributions
from Net
Investment
Income to
ARPS
Share-
holders | (a) | | Distributions from Accum-
ulated Net
Realized
Gains to
ARPS
Share-
holders | (a) | | Total | | | From
Net
Investment
Income | | | From
Accum-
ulated Net
Realized
Gains | | | Total | | | Discount
per
Share
Repur-
chased
and
Retired | | | Ending
NAV | | | Ending
Share
Price | |
| Arizona Premium Income (NAZ) | | | | | | | | | | | | | | | | | | | | | | | | | | | | | | | |
| Year Ended 2/28–2/29: | | | | | | | | | | | | | | | | | | | | | | | | | | | | | | | |
| 2016(g) | | $ | 15.02 | | | $ | 0.38 | | | $ | (0.35 | ) | | $ | — | | | $ | — | | | $ | 0.03 | | | $ | (0.40 | ) | | $ | — | | | $ | (0.40 | ) | | $ | — | | | $ | 14.65 | | | $ | 14.73 | |
| 2015 | | | 14.15 | | | | 0.79 | | | | 0.87 | | | | — | | | | — | | | | 1.66 | | | | (0.79 | ) | | | — | | | | (0.79 | ) | | | — | | | | 15.02 | | | | 14.37 | |
| 2014 | | | 15.47 | | | | 0.55 | | | | (1.10 | ) | | | — | | | | — | | | | (0.55 | ) | | | (0.77 | ) | | | — | | | | (0.77 | ) | | | — | | | | 14.15 | | | | 12.79 | |
| 2013 | | | 14.82 | | | | 0.75 | | | | 0.67 | | | | — | | | | — | | | | 1.42 | | | | (0.77 | ) | | | — | | | | (0.77 | ) | | | — | | | | 15.47 | | | | 15.70 | |
| 2012 | | | 13.25 | | | | 0.80 | | | | 1.54 | | | | (0.01 | ) | | | — | | | | 2.33 | | | | (0.76 | ) | | | — | | | | (0.76 | ) | | | — | | | | 14.82 | | | | 14.61 | |
| 2011(f) | | | 13.99 | | | | 0.49 | | | | (0.77 | ) | | | (0.02 | ) | | | — | | | | (0.30 | ) | | | (0.44 | ) | | | — | | | | (0.44 | ) | | | — | | | | 13.25 | | | | 12.32 | |
| Year Ended 7/31: | | | | | | | | | | | | | | | | | | | | | | | | | | | | | | | | | | | | | | | | | | | | | | | | |
| 2010 | | | 12.92 | | | | 0.84 | | | | 0.96 | | | | (0.03 | ) | | | — | | | | 1.77 | | | | (0.70 | ) | | | — | | | | (0.70 | ) | | | — | | | | 13.99 | | | | 13.34 | |
| | | | | | | | | | | | | | | | | | | | | | | | | | | | | | | | | | | | | | | | | | | | | | | | | |
| Michigan Quality Income (NUM) | | | | | | | | | | | | | | | | | | | | | | | | | | | | | | | | | | | | | | | | | |
| Year Ended 2/28–2/29: | | | | | | | | | | | | | | | | | | | | | | | | | | | | | | | | | | | | | | | | | |
| 2016(g) | | | 15.80 | | | | 0.38 | | | | (0.27 | ) | | | — | | | | — | | | | 0.11 | | | | (0.39 | ) | | | — | | | | (0.39 | ) | | | — | * | | | 15.52 | | | | 13.21 | |
| 2015 | | | 14.98 | | | | 0.80 | | | | 0.88 | | | | — | | | | — | | | | 1.68 | | | | (0.86 | ) | | | — | | | | (0.86 | ) | | | — | | | | 15.80 | | | | 13.85 | |
| 2014 | | | 16.35 | | | | 0.80 | | | | (1.28 | ) | | | — | | | | — | | | | (0.48 | ) | | | (0.89 | ) | | | — | | | | (0.89 | ) | | | — | * | | | 14.98 | | | | 13.45 | |
| 2013 | | | 15.95 | | | | 0.74 | | | | 0.55 | | | | — | | | | — | | | | 1.29 | | | | (0.89 | ) | | | — | | | | (0.89 | ) | | | — | | | | 16.35 | | | | 15.62 | |
| 2012 | | | 14.18 | | | | 0.89 | | | | 1.75 | | | | (0.01 | ) | | | — | | | | 2.63 | | | | (0.86 | ) | | | — | | | | (0.86 | ) | | | — | * | | | 15.95 | | | | 15.40 | |
| 2011 | | | 14.79 | | | | 0.94 | | | | (0.69 | ) | | | (0.03 | ) | | | — | | | | 0.22 | | | | (0.83 | ) | | | — | | | | (0.83 | ) | | | — | * | | | 14.18 | | | | 12.75 | |
| (a) | The amounts shown for Auction Rate Preferred Shares ("ARPS") are based on common share equivalents. |
| (b) | Total Return Based on Common Share NAV is the combination of changes in common share NAV, reinvested dividend income at NAV and reinvested capital gains distributions at NAV, if any. The last dividend declared in the period, which is typically paid on the first business day of the following month, is assumed to be reinvested at the ending NAV. The actual reinvest price for the last dividend declared in the period may often be based on the Fund's market price (and not its NAV), and therefore may be different from the price used in the calculation. Total returns are not annualized. |
| | Total Return Based on Common Share Price is the combination of changes in the market price per share and the effect of reinvested dividend income and reinvested capital gains distributions, if any, at the average price paid per share at the time of reinvestment. The last dividend declared in the period, which is typically paid on the first business day of the following month, is assumed to be reinvested at the ending market price. The actual reinvestment for the last dividend declared in the period may take place over several days, and in some instances may not be based on the market price, so the actual reinvestment price may be different from the price used in the calculation. Total returns are not annualized. |
| * | Rounds to less than $0.01 per share. |
| | | Common Share Supplemental Data/ |
| | | Ratios Applicable to Common Shares |
| Common Share | | |
| Total Returns | | | | | | Ratios to Average Net Assets(c) | | | | |
| | | | | | | | | | | | | | | | | |
| | | | Based | | | | | | | | | Net | | | | |
| Based | | | on | | | Ending | | | | | | Investment | | | Portfolio | |
| on | | | Share | | | Net | | | | | | Income | | | Turnover | |
| NAV | (b) | | Price | (b) | | Assets (000 | ) | | Expenses | (d) | | (Loss | ) | | Rate | (e) |
| | | | | | | | | | | | | | | | | |
| | | | | | | | | | | | | | | | | |
| 0.20 | % | | 5.33 | % | $ | 169,398 | | | 1.53 | %** | | 5.12 | %** | | 4 | % |
| 12.01 | | | 18.94 | | | 173,648 | | | 1.56 | | | 5.37 | | | 13 | |
| (3.40 | ) | | (13.52 | ) | | 163,635 | | | 2.47 | | | 4.93 | | | 14 | |
| 9.77 | | | 13.02 | | | 69,236 | | | 1.80 | | | 4.94 | | | 10 | |
| 18.08 | | | 25.48 | | | 66,268 | | | 1.52 | | | 5.73 | | | 7 | |
| (2.23 | ) | | (4.55 | ) | | 59,256 | | | 1.19 | ** | | 6.11 | ** | | 5 | |
| | | | | | | | | | | | | | | | | |
| 13.94 | | | 14.47 | | | 62,549 | | | 1.21 | | | 6.13 | | | 8 | |
| | | | | | | | | | | | | | | | | |
| | | | | | | | | | | | | | | | | |
| 0.75 | | | (1.80 | ) | | 323,246 | | | 1.51 | ** | | 4.86 | ** | | 9 | |
| 11.45 | | | 9.48 | | | 329,232 | | | 1.57 | | | 5.14 | | | 15 | |
| (2.76 | ) | | (8.00 | ) | | 312,180 | | | 1.95 | | | 5.32 | | | 15 | |
| 8.27 | | | 7.30 | | | 341,057 | | | 1.84 | | | 5.09 | | | 12 | |
| 19.11 | | | 28.44 | | | 184,270 | | | 1.56 | | | 5.97 | | | 14 | |
| 1.39 | | | 4.69 | | | 163,876 | | | 1.18 | | | 6.37 | | | 6 | |
| (c) | Ratios do not reflect the effect of dividend payments to ARPS shareholders, during periods when ARPS were outstanding; Net Investment Income (Loss) ratios reflect income earned and expenses incurred on assets attributable to ARPS and other subsequent forms of preferred shares issued by the Fund, where applicable. |
| (d) | The expense ratios reflect, among other things, all interest expense and other costs related to preferred shares (as described in Note 4 – Fund Shares, Preferred Shares) and/or the interest expense deemed to have been paid by the Fund on the floating rate certificates issued by the special purpose trusts for the self-deposited inverse floaters held by the Fund (as described in Note 3 – Portfolio Securities and Investments in Derivatives, Inverse Floating Rate Securities), where applicable, as follows: |
| Arizona Premium Income (NAZ) | | |
| Year Ended 2/28–2/29: | | |
| 2016(g) | 0.50 | %** |
| 2015 | 0.50 | |
| 2014 | 1.32 | |
| 2013 | 0.57 | |
| 2012 | 0.35 | |
| 2011(f) | — | |
| Year Ended 7/31: | | |
| 2010 | — | |
| Michigan Quality Income (NUM) | | |
| Year Ended 2/28–2/29: | | |
| 2106(g) | 0.53 | %** |
| 2015 | 0.53 | |
| 2014 | 0.84 | |
| 2013 | 0.70 | |
| 2012 | 0.46 | |
| 2011 | 0.02 | |
| (e) | Portfolio Turnover Rate is calculated based on the lesser of long-term purchases or sales (as disclosed in Note 5 – Investment Transactions) divided by the average long-term market value during the period. |
| (f) | For the seven months ended February 28, 2011. |
| (g) | For the six months ended August 31, 2015. |
| ** | Annualized. |
See accompanying notes to financial statements.
Financial Highlights (Unaudited) (continued)
Selected data for a common share outstanding throughout each period:
| | | | | | Investment Operations | | | Less Distributions
to Common Shareholders | | | Common Share | |
| | | Beginning
Common
Share
NAV | | | Net
Investment
Income
(Loss | ) | | Net
Realized/
Unrealized
Gain (Loss | ) | | Distributions
from Net
Investment
Income to
ARPS
Share-
holders | (a) | | Distributions
from Accum-
ulated Net
Realized
Gains to
ARPS
Share-
holders | (a) | | Total | | | From
Net
Investment
Income | | | From
Accum-
ulated Net
Realized
Gains | | | Total | | | Shelf
Offering
Costs | | | Premium
Per
Share
Sold
through
Shelf
Offering | | | Ending
NAV | | | Ending
Share
Price | |
| Ohio Quality Income (NUO) | | | | | | | | | | | | | | | | | | | | | | | | | | | | | | | |
| Year Ended 2/28–2/29: | | | | | | | | | | | | | | | | | | | | | | | | | | | | | | |
| 2016(g) | | $ | 17.01 | | | $ | 0.41 | | | $ | (0.34 | ) | | $ | — | | | $ | — | | | $ | 0.07 | | | $ | (0.42 | ) | | $ | — | | | $ | (0.42 | ) | | $ | — | | | $ | — | | | $ | 16.66 | | | $ | 14.47 | |
| 2015 | | | 16.02 | | | | 0.85 | | | | 1.07 | | | | — | | | | — | | | | 1.92 | | | | (0.93 | ) | | | — | | | | (0.93 | ) | | | — | | | | — | | | | 17.01 | | | | 15.40 | |
| 2014 | | | 17.64 | | | | 0.76 | | | | (1.39 | ) | | | — | | | | — | | | | (0.63 | ) | | | (0.99 | ) | | | — | | | | (0.99 | ) | | | — | | | | — | | | | 16.02 | | | | 14.75 | |
| 2013 | | | 17.17 | | | | 0.89 | | | | 0.54 | | | | — | | | | — | | | | 1.43 | | | | (0.96 | ) | | | — | | | | (0.96 | ) | | | — | | | | — | | | | 17.64 | | | | 17.79 | |
| 2012 | | | 15.44 | | | | 0.99 | | | | 1.68 | | | | (0.01 | ) | | | — | | | | 2.66 | | | | (0.93 | ) | | | — | | | | (0.93 | ) | | | — | | | | — | | | | 17.17 | | | | 16.88 | |
| 2011 | | | 16.15 | | | | 1.01 | | | | (0.79 | ) | | | (0.03 | ) | | | — | | | | 0.19 | | | | (0.90 | ) | | | — | | | | (0.90 | ) | | | — | | | | — | | | | 15.44 | | | | 14.85 | |
| | | | | | | | | | | | | | | | | | | | | | | | | | | | | | | | | | | | | | | | | | | | | | | | | | | | | |
| Texas Quality Income (NTX) | | | | | | | | | | | | | | | | | | | | | | | | | | | | | | | | | | | | | | | | | |
| Year Ended 2/28–2/29: | | | | | | | | | | | | | | | | | | | | | | | | | | | | | | | | | | | | | | | | | |
| 2016(g) | | | 15.72 | | | | 0.31 | | | | (0.33 | ) | | | — | | | | — | | | | (0.02 | ) | | | (0.33 | ) | | | — | | | | (0.33 | ) | | | — | | | | — | | | | 15.37 | | | | 13.48 | |
| 2015 | | | 14.82 | | | | 0.62 | | | | 0.96 | | | | — | | | | — | | | | 1.58 | | | | (0.68 | ) | | | — | | | | (0.68 | ) | | | — | | | | — | | | | 15.72 | | | | 14.35 | |
| 2014 | | | 15.87 | | | | 0.66 | | | | (1.01 | ) | | | — | | | | — | | | | (0.35 | ) | | | (0.70 | ) | | | — | | | | (0.70 | ) | | | — | * | | | — | * | | | 14.82 | | | | 13.54 | |
| 2013 | | | 15.46 | | | | 0.68 | | | | 0.47 | | | | — | | | | — | | | | 1.15 | | | | (0.77 | ) | | | — | | | | (0.77 | ) | | | (0.01 | ) | | | 0.04 | | | | 15.87 | | | | 16.00 | |
| 2012 | | | 14.12 | | | | 0.75 | | | | 1.48 | | | | — | | | | — | | | | 2.23 | | | | (0.86 | ) | | | (.03 | ) | | | (0.89 | ) | | | — | | | | — | | | | 15.46 | | | | 16.31 | |
| 2011(f) | | | 15.01 | | | | 0.48 | | | | (0.85 | ) | | | (0.01 | ) | | | — | | | | (0.38 | ) | | | (0.50 | ) | | | (.01 | ) | | | (0.51 | ) | | | — | | | | — | | | | 14.12 | | | | 15.19 | |
| Year Ended 7/31: | | | | | | | | | | | | | | | | | | | | | | | | | | | | | | | | | | | | | | | | | | | | | |
| 2010 | | | 13.84 | | | | 0.94 | | | | 1.08 | | | | (0.03 | ) | | | — | * | | | 1.99 | | | | (0.81 | ) | | | (0.01 | ) | | | (0.82 | ) | | | — | | | | — | | | | 15.01 | | | | 16.92 | |
| (a) | The amounts shown for Auction Rate Preferred Shares ("ARPS") are based on common share equivalents. |
| (b) | Total Return Based on Common Share NAV is the combination of changes in common share NAV, reinvested dividend income at NAV and reinvested capital gains distributions at NAV, if any. The last dividend declared in the period, which is typically paid on the first business day of the following month, is assumed to be reinvested at the ending NAV. The actual reinvest price for the last dividend declared in the period may often be based on the Fund's market price (and not its NAV), and therefore may be different from the price used in the calculation. Total returns are not annualized. |
| | Total Return Based on Common Share Price is the combination of changes in the market price per share and the effect of reinvested dividend income and reinvested capital gains distributions, if any, at the average price paid per share at the time of reinvestment. The last dividend declared in the period, which is typically paid on the first business day of the following month, is assumed to be reinvested at the ending market price. The actual reinvestment for the last dividend declared in the period may take place over several days, and in some instances may not be based on the market price, so the actual reinvestment price may be different from the price used in the calculation. Total returns are not annualized. |
| * | Rounds to less than $0.01 per share. |
| | | Common Share Supplemental Data/ |
| | | Ratios Applicable to Common Shares |
| Common Share | | |
| Total Returns | | | | | | Ratios to Average Net Assets(c) | | | | |
| | | | | | | | | | | | | | | | | |
| | | | Based | | | | | | | | | Net | | | | |
| Based | | | on | | | Ending | | | | | | Investment | | | Portfolio | |
| on | | | Share | | | Net | | | | | | Income | | | Turnover | |
| NAV | (b) | | Price | (b) | | Assets (000 | ) | | Expenses | (d) | | (Loss | ) | | Rate | (e) |
| | | | | | | | | | | | | | | | | |
| | | | | | | | | | | | | | | | | |
| 0.43 | % | | (3.34 | )% | $ | 308,584 | | | 1.57 | %** | | 4.84 | %** | | 4 | % |
| 12.23 | | | 10.79 | | | 315,142 | | | 1.62 | | | 5.10 | | | 15 | |
| (3.38 | ) | | (11.39 | ) | | 296,668 | | | 2.15 | | | 5.45 | | | 13 | |
| 8.53 | | | 11.27 | | | 172,898 | | | 1.76 | | | 5.14 | | | 13 | |
| 17.73 | | | 20.55 | | | 167,709 | | | 1.50 | | | 6.10 | | | 10 | |
| 1.09 | | | 0.91 | | | 150,555 | | | 1.14 | | | 6.32 | | | 14 | |
| | | | | | | | | | | | | | | | | |
| | | | | | | | | | | | | | | | | |
| (0.13 | ) | | (3.84 | ) | | 154,120 | | | 2.02 | ** | | 4.04 | ** | | 12 | |
| 10.81 | | | 11.07 | | | 157,644 | | | 2.33 | | | 4.05 | | | 12 | |
| (2.11 | ) | | (11.03 | ) | | 148,580 | | | 2.49 | | | 4.46 | | | 13 | |
| 7.80 | | | 2.97 | | | 158,920 | | | 2.38 | | | 4.33 | | | 12 | |
| 16.23 | | | 13.81 | | | 148,222 | | | 2.48 | | | 5.10 | | | 9 | |
| (2.61 | ) | | (7.15 | ) | | 134,850 | | | 1.92 | ** | | 5.69 | ** | | 10 | |
| | | | | | | | | | | | | | | | | |
| 14.71 | | | 20.92 | | | 143,080 | | | 1.19 | | | 6.42 | | | 6 | |
| (c) | Ratios do not reflect the effect of dividend payments to ARPS shareholders, during periods when ARPS were outstanding; Net Investment Income (Loss) ratios reflect income earned and expenses incurred on assets attributable to ARPS and other subsequent forms of preferred shares issued by the Fund, where applicable. |
| (d) | The expense ratios reflect, among other things, all interest expense and other costs related to preferred shares (as described in Note 4 – Fund Shares, Preferred Shares) and/or the interest expense deemed to have been paid by the Fund on the floating rate certificates issued by the special purpose trusts for the self-deposited inverse floaters held by the Fund (as described in Note 3 – Portfolio Securities and Investments in Derivatives, Inverse Floating Rate Securities), where applicable, as follows: |
| Ohio Quality Income (NUO) | | |
| Year Ended 2/28–2/29: | | |
| 2016(g) | 0.57 | %** |
| 2015 | 0.57 | |
| 2014 | 1.05 | |
| 2013 | 0.61 | |
| 2012 | 0.40 | |
| 2011 | — | |
| Texas Quality Income (NTX) | | |
| Year Ended 2/28–2/29: | | |
| 2016(g) | 1.00 | %** |
| 2015 | 1.26 | |
| 2014 | 1.31 | |
| 2013 | 1.27 | |
| 2012 | 1.37 | |
| 2011(f) | 0.80 | ** |
| Year Ended 7/31: | | |
| 2010 | 0.02 | |
| (e) | Portfolio Turnover Rate is calculated based on the lesser of long-term purchases or sales (as disclosed in Note 5 – Investment Transactions) divided by the average long-term market value during the period. |
| (f) | For the seven months ended February 28, 2011. |
| (g) | For the six months ended August 31, 2015. |
| ** | Annualized. |
See accompanying notes to financial statements.
Financial Highlights (Unaudited) (continued)
| | | ARPS at the End of Period | | | MTP Shares
at the End of Period (a) | | | VMTP Shares
at the End of Period | | | MTP and VMTP
Shares at the
End of Period | |
| | | Aggregate
Amount
Outstanding
(000 | ) | | Asset
Coverage
Per $25,000
Share | | | Aggregate
Amount
Outstanding
(000 | ) | | Asset
Coverage
Per $10
Share | | | Aggregate
Amount
Outstanding
(000 | ) | | Asset
Coverage
Per $100,000
Share | | | Asset
Coverage
Per $1
Liquidation
Preference | |
| Arizona Premium Income (NAZ) | | | | | | | | | | | | | | | | | | | |
| Year Ended 2/28–2/29: | | | | | | | | | | | | | | | | | | | |
| 2016(c) | | $ | — | | | $ | — | | | $ | — | | | $ | — | | | $ | 79,000 | | | $ | 314,428 | | | $ | — | |
| 2015 | | | — | | | | — | | | | — | | | | — | | | | 79,000 | | | | 319,808 | | | | — | |
| 2014 | | | — | | | | — | | | | — | | | | — | | | | 79,000 | | | | 307,133 | | | | — | |
| 2013 | | | — | | | | — | | | | — | | | | — | | | | 28,000 | | | | 347,271 | | | | — | |
| 2012 | | | — | | | | — | | | | — | | | | — | | | | 28,000 | | | | 336,672 | | | | — | |
| 2011(b) | | | 27,875 | | | | 78,144 | | | | — | | | | — | | | | — | | | | — | | | | — | |
| Year Ended 7/31: | | | | | | | | | | | | | | | | | | | | | | | | | | | | |
| 2010 | | | 27,875 | | | | 81,097 | | | | — | | | | — | | | | — | | | | — | | | | — | |
| | | | | | | | | | | | | | | | | | | | | | | | | | | | | |
| Michigan Quality Income (NUM) | | | | | | | | | | | | | | | | | | | | | | | | | |
| Year Ended 2/28–2/29: | | | | | | | | | | | | | | | | | | | | | | | | | |
| 2016(c) | | | — | | | | — | | | | — | | | | — | | | | 159,000 | | | | 303,299 | | | | — | |
| 2015 | | | — | | | | — | | | | — | | | | — | | | | 159,000 | | | | 307,064 | | | | — | |
| 2014 | | | — | | | | — | | | | — | | | | — | | | | 159,000 | | | | 296,340 | | | | — | |
| 2013 | | | — | | | | — | | | | 16,313 | | | | 31.57 | | | | 141,800 | | | | 315,704 | | | | 3.16 | |
| 2012 | | | — | | | | — | | | | — | | | | — | | | | 87,900 | | | | 309,636 | | | | — | |
| 2011 | | | 87,325 | | | | 71,915 | | | | — | | | | — | | | | — | | | | — | | | | — | |
| (a) | The Ending and Average Market Value Per Share for each Series of the Fund's MTP Shares were as follows: |
| | | 2014 | | | 2013 | |
| Arizona Premium Income (NAZ) | | | | | | |
| Series 2015 (NAZ PRC) | | | | | | |
| Ending Market Value per Share | | $ | — | | | $ | — | |
| Average Market Value per Share | | 10.02 | Δ | | | — | |
| Series 2016 (NAZ PRD) | | | | | | | | |
| Ending Market Value per Share | | | — | | | | — | |
| Average Market Value per Share | | 10.11 | Δ | | | — | |
| | | | | | | | | |
| Michigan Quality Income (NUM) | | | | | | | | |
| Series 2015 (NUM PRC) | | | | | | | | |
| Ending Market Value per Share | | | — | | | | 10.08 | |
| Average Market Value per Share | | 10.02 | ΔΔΔ | | 10.06 | ΔΔ |
| (b) | For the seven months ended February 28, 2011. |
| (c) | For the six months ended August 31, 2015. |
| Δ | For the period April 8, 2013 (effective date of the reorganizations) through December 20, 2013. |
| ΔΔ | For the period January 7, 2013 (effective date of the reorganizations) through February 28, 2013. |
| ΔΔΔ | For the period March 1, 2013 through December 20, 2013. |
See accompanying notes to financial statements.
| | | ARPS at the End of Period | | | iMTP Shares
at the End of Period | | | MTP Shares
at the End of Period (a) | | | VMTP Shares
at the End of Period | | | VRDP Shares
at the End of Period | |
| | | Aggregate
Amount
Outstanding
(000 | ) | | Asset
Coverage
Per $25,000
Share | | | Aggregate
Amount
Outstanding
(000 | ) | | Asset
Coverage
Per $5,0000
Share | | | Aggregate
Amount
Outstanding
(000 | ) | | Asset
Coverage
Per $10
Share | | | Aggregate
Amount
Outstanding
(000 | ) | | Asset
Coverage
Per $100,000
Share | | | Aggregate
Amount
Outstanding
(000 | ) | | Asset
Coverage
Per $100,000
Share | |
| Ohio Quality Income (NUO) | | | | | | | | | | | | | | | | | | | | | | | | | | | | |
| Year Ended 2/28–2/29: | | | | | | | | | | | | | | | | | | | | | | | | | | | | |
| 2016(c) | | $ | — | | | $ | — | | | $ | — | | | $ | — | | | $ | — | | | $ | — | | | $ | — | | | $ | — | | | $ | 148,000 | | | $ | 308,502 | |
| 2015 | | | — | | | | — | | | | — | | | | — | | | | — | | | | — | | | | — | | | | — | | | | 148,000 | | | | 312,934 | |
| 2014 | | | — | | | | — | | | | — | | | | — | | | | — | | | | — | | | | — | | | | — | | | | 148,000 | | | | 300,451 | |
| 2013 | | | — | | | | — | | | | — | | | | — | | | | — | | | | — | | | | 73,500 | | | | 335,236 | | | | — | | | | — | |
| 2012 | | | — | | | | — | | | | — | | | | — | | | | — | | | | — | | | | 73,500 | | | | 328,176 | | | | — | | | | — | |
| 2011 | | | 73,000 | | | | 76,560 | | | | — | | | | — | | | | — | | | | — | | | | — | | | | — | | | | — | | | | — | |
| | | | | | | | | | | | | | | | | | | | | | | | | | | | | | | | | | | | | | | | | |
| Texas Quality Income (NTX) | | | | | | | | | | | | | | | | | | | | | | | | | | | | | | | | | | | | | |
| Year Ended 2/28–2/29: | | | | | | | | | | | | | | | | | | | | | | | | | | | | | | | | | | | | | |
| 2016(c) | | | — | | | | — | | | | 72,000 | | | | 15,703 | | | | — | | | | — | | | | — | | | | — | | | | — | | | | — | |
| 2015 | | | — | | | | — | | | | — | | | | — | | | | 70,920 | | | | 32.23 | | | | — | | | | — | | | | — | | | | — | |
| 2014 | | | — | | | | — | | | | — | | | | — | | | | 70,920 | | | | 30.95 | | | | — | | | | — | | | | — | | | | — | |
| 2013 | | | — | | | | — | | | | — | | | | — | | | | 70,920 | | | | 32.41 | | | | — | | | | — | | | | — | | | | — | |
| 2012 | | | — | | | | — | | | | — | | | | — | | | | 70,920 | | | | 30.90 | | | | — | | | | — | | | | — | | | | — | |
| 2011(b) | | | — | | | | — | | | | — | | | | — | | | | 70,920 | | | | 29.01 | | | | — | | | | — | | | | — | | | | — | |
| Year Ended 7/31: | | | | | | | | | | | | | | | | | | | | | | | | | | | | | | | | | | | | | |
| 2010 | | | 65,050 | | | | 79,988 | | | | — | | | | — | | | | — | | | | — | | | | — | | | | — | | | | — | | | | — | |
| (a) | The Ending and Average Market Value Per Share for each Series of the Fund's MTP Shares were as follows: |
| | | 2016(c) | | | 2015 | | | 2014 | | | 2013 | | | 2012 | | | 2011 | |
| Ohio Quality Income (NUO) | | | | | | | | | | | | | | | | | | |
| Series 2014 (NUO PRACL) | | | | | | | | | | | | | | | | | | |
| Ending Market Value per Share | | $ | — | | | $ | — | | | $ | — | | | $ | — | | | $ | — | | | $ | — | |
| Average Market Value per Share | | | — | | | | — | | | 10.01 | Ω | | | — | | | | — | | | | — | |
| Series 2015 (NUO PRCCL) | | | | | | | | | | | | | | | | | | | | | | | | |
| Ending Market Value per Share | | | — | | | | — | | | | — | | | | — | | | | — | | | | — | |
| Average Market Value per Share | | | — | | | | — | | | 10.03 | Ω | | | — | | | | — | | | | — | |
| Series 2016 (NUO PRDCL) | | | | | | | | | | | | | | | | | | | | | | | | |
| Ending Market Value per Share | | | — | | | | — | | | | — | | | | — | | | | — | | | | — | |
| Average Market Value per Share | | | — | | | | — | | | 10.06 | Ω | | | — | | | | — | | | | — | |
| | | | | | | | | | | | | | | | | | | | | | | | | |
| Texas Quality Income (NTX) | | | | | | | | | | | | | | | | | | | | | | | | |
| Series 2015 (NTX PRCCL) | | | | | | | | | | | | | | | | | | | | | | | | |
| Ending Market Value per Share | | | — | | | | 10.02 | | | | 10.03 | | | | 10.04 | | | | 10.05 | | | | 9.85 | |
| Average Market Value per Share | | 10.01 | ΩΩΩ | | | 10.04 | | | | 10.04 | | | | 10.06 | | | | 9.97 | | | 9.86 | ΩΩ |
| (b) | For the seven months ended February 28, 2011. |
| (c) | For the six months ended August 31, 2015. |
| Ω | For the period April 8, 2013 (effective date of the reorganization) through October 7, 2013. |
| ΩΩ | For the period November 2, 2010 (first issuance date of shares) through February 28, 2011. |
| ΩΩ | For the period March 1, 2015 through April 20, 2015. |
See accompanying notes to financial statements.
Notes to Financial Statements (Unaudited)
1. General Information and Significant Accounting Policies
General Information
Fund Information
The state funds covered in this report and their corresponding New York Stock Exchange ("NYSE") symbols are as follows (each a "Fund" and collectively, the "Funds"):
| | • | Nuveen Arizona Premium Income Municipal Fund (NAZ) ("Arizona Premium Income (NAZ)") |
| | | |
| | • | Nuveen Michigan Quality Income Municipal Fund (NUM) ("Michigan Quality Income (NUM)") |
| | | |
| | • | Nuveen Ohio Quality Income Municipal Fund (NUO) ("Ohio Quality Income (NUO)") |
| | | |
| | • | Nuveen Texas Quality Income Municipal Fund (NTX) ("Texas Quality Income (NTX)") |
The Funds are registered under the Investment Company Act of 1940, as amended, as diversified, closed-end management investment companies. Arizona Premium Income (NAZ), Michigan Quality Income (NUM) and Ohio Quality Income (NUO) were organized as Massachusetts business trusts on April 8, 2013, January 7, 2013 and April 8, 2013, respectively (previously organized as Minnesota trusts on January 23, 1991, July 25, 1991 and October 17, 1991, respectively). Texas Quality Income (NTX) was organized as a Massachusetts business trust on July 26, 1991.
The end of the reporting period for the Funds is August 31, 2015, and the period covered by these Notes to Financial Statements is the six months ended August 31, 2015 (the "current fiscal period").
Investment Adviser
The Funds' investment adviser is Nuveen Fund Advisors, LLC (the "Adviser"), a wholly-owned subsidiary of Nuveen Investments, Inc. ("Nuveen"). The Adviser is responsible for each Fund's overall investment strategy and asset allocation decisions. The Adviser has entered into sub-advisory agreements with Nuveen Asset Management, LLC (the "Sub-Adviser"), a subsidiary of the Adviser, under which the Sub-Adviser manages the investment portfolios of the Funds.
Investment Objectives and Principal Investment Strategies
Each Fund seeks to provide current income exempt from both regular federal and designated state income taxes by investing primarily in a portfolio of municipal obligations issued by state and local government authorities within a single state or certain U.S. territories.
Significant Accounting Policies
Each Fund is an investment company and follows accounting and reporting guidance under Financial Accounting Standards Board (FASB) Accounting Standards Codification (ASC) Topic 946 "Financial Services – Investment Companies." The following is a summary of significant accounting policies followed by the Funds in the preparation of their financial statements in accordance with U.S. generally accepted accounting principles ("U.S. GAAP").
Investment Transactions
Investment transactions are recorded on a trade date basis. Realized gains and losses from investment transactions are determined on the specific identification method, which is the same basis used for federal income tax purposes. Investments purchased on a when-issued/delayed delivery basis may have extended settlement periods. Any investments so purchased are subject to market fluctuation during this period. The Funds have earmarked securities in their portfolios with a current value at least equal to the amount of the when-issued/delayed delivery purchase commitments.
As of the end of the reporting period, the following Funds' outstanding when-issued/delayed delivery purchase commitments were as follows:
| | | | Arizona | | | Texas | |
| | | | Premium | | | Quality | |
| | | | Income | | | Income | |
| | | | (NAZ | ) | | (NTX | ) |
| Outstanding when-issued/delayed delivery purchase commitments | | $ | 1,265,839 | | $ | 1,186,880 | |
Investment Income
Investment income, which reflects the amortization of premiums and accretion of discounts for financial reporting purposes, is recorded on an accrual basis. Investment income also reflects paydown gains and losses, if any.
Professional Fees
Professional fees presented on the Statement of Operations consist of legal fees incurred in the normal course of operations, audit fees, tax consulting fees and, in some cases, workout expenditures. Workout expenditures are incurred in an attempt to protect or enhance an investment or to pursue other claims or legal actions on behalf of Fund shareholders. If a refund is received for workout expenditures paid in a prior reporting period, such amounts will be recognized as "Legal fee refund" on the Statement of Operations.
Dividends and Distributions to Common Shareholders
Dividends from net investment income are declared monthly. Net realized capital gains and/or market discount from investment transactions, if any, are distributed to shareholders at least annually. Furthermore, capital gains are distributed only to the extent they exceed available capital loss carryforwards.
Distributions to common shareholders of net investment income, net realized capital gains and/or market discount, if any, are recorded on the ex-dividend date. The amount and timing of distributions are determined in accordance with federal corporate income tax regulations, which may differ from U.S. GAAP.
Indemnifications
Under the Funds' organizational documents, their officers and trustees are indemnified against certain liabilities arising out of the performance of their duties to the Funds. In addition, in the normal course of business, the Funds enter into contracts that provide general indemnifications to other parties. The Funds' maximum exposure under these arrangements is unknown as this would involve future claims that may be made against the Funds that have not yet occurred. However, the Funds have not had prior claims or losses pursuant to these contracts and expect the risk of loss to be remote.
Netting Agreements
In the ordinary course of business, the Funds may enter into transactions subject to enforceable International Swaps and Derivative Association, Inc. ("ISDA") master agreements or other similar arrangements ("netting agreements"). Generally, the right to offset in netting agreements allows each Fund to offset certain securities and derivatives with a specific counterparty as well as any collateral received or delivered to that counterparty based on the terms of the agreements. Generally, each Fund manages its cash collateral and securities collateral on a counterparty basis.
The Funds' investments subject to netting agreements as of the end of the reporting period, if any, are further described in Note 3 – Portfolio Securities and Investments in Derivatives.
Use of Estimates
The preparation of financial statements in conformity with U.S. GAAP requires management to make estimates and assumptions that affect the reported amounts of assets and liabilities at the date of the financial statements and the reported amounts of increases and decreases in net assets applicable to common shares from operations during the reporting period. Actual results may differ from those estimates.
2. Investment Valuation and Fair Value Measurements
The fair valuation input levels as described below are for fair value measurement purposes.
Fair value is defined as the price that would be received upon selling an investment or transferring a liability in an orderly transaction to an independent buyer in the principal or most advantageous market for the investment. A three-tier hierarchy is used to maximize the use of observable market data and minimize the use of unobservable inputs and to establish classification of fair value measurements for disclosure purposes. Observable inputs reflect the assumptions market participants would use in pricing the asset or liability. Observable inputs are based on market data obtained from sources independent of the reporting entity. Unobservable inputs reflect the reporting entity's own assumptions about the assumptions market participants would use in pricing the asset or liability. Unobservable inputs are based on the best information available in the circumstances. The following is a summary of the three-tiered hierarchy of valuation input levels.
| Level 1 – | Inputs are unadjusted and prices are determined using quoted prices in active markets for identical securities. |
| Level 2 – | Prices are determined using other significant observable inputs (including quoted prices for similar securities, interest rates, prepayment speeds, credit risk, etc.). |
| Level 3 – | Prices are determined using significant unobservable inputs (including management's assumptions in determining the fair value of investments). |
Prices of fixed income securities are provided by a pricing service approved by the Funds' Board of Trustees (the "Board"). The pricing service establishes a security's fair value using methods that may include consideration of the following: yields or prices of investments of comparable quality, type of issue, coupon, maturity and rating, market quotes or indications of value from security dealers, evaluations of anticipated cash flows or collateral,
Notes to Financial Statements (Unaudited) (continued)
general market conditions and other information and analysis, including the obligor's credit characteristics considered relevant. These securities are generally classified as Level 2. In pricing certain securities, particularly less liquid and lower quality securities, the pricing service may consider information about a security, its issuer or market activity, provided by the Adviser. These securities are generally classified as Level 2 or Level 3 depending on the priority of the significant inputs.
Prices of swap contracts are also provided by a pricing service approved by the Board using the same methods as described above and are generally classified as Level 2.
Certain securities may not be able to be priced by the pre-established pricing methods as described above. Such securities may be valued by the Board and/or its appointee at fair value. These securities generally include, but are not limited to, restricted securities (securities which may not be publicly sold without registration under the Securities Act of 1933, as amended) for which a pricing service is unable to provide a market price; securities whose trading has been formally suspended; debt securities that have gone into default and for which there is no current market quotation; a security whose market price is not available from a pre-established pricing source; a security with respect to which an event has occurred that is likely to materially affect the value of the security after the market has closed but before the calculation of a Fund's net asset value ("NAV") (as may be the case in non-U.S. markets on which the security is primarily traded) or make it difficult or impossible to obtain a reliable market quotation; and a security whose price, as provided by the pricing service, is not deemed to reflect the security's fair value. As a general principle, the fair value of a security would appear to be the amount that the owner might reasonably expect to receive for it in a current sale. A variety of factors may be considered in determining the fair value of such securities, which may include consideration of the following: yields or prices of investments of comparable quality, type of issue, coupon, maturity and rating, market quotes or indications of value from security dealers, evaluations of anticipated cash flows or collateral, general market conditions and other information and analysis, including the obligor's credit characteristics considered relevant. These securities are generally classified as Level 2 or Level 3 depending on the priority of the significant inputs. Regardless of the method employed to value a particular security, all valuations are subject to review by the Board and/or its appointee.
The inputs or methodologies used for valuing securities are not an indication of the risks associated with investing in those securities. The following is a summary of each Fund's fair value measurements as of the end of the reporting period:
| Arizona Premium Income (NAZ) | | | Level 1 | | | Level 2 | | | Level 3 | | | Total | |
| Long-Term Investments*: | | | | | | | | | | | | | |
| Municipal Bonds | | $ | — | | $ | 248,631,610 | | $ | — | | $ | 248,631,610 | |
| Michigan Quality Income (NUM) | | | | | | | | | | | | | |
| Long-Term Investments*: | | | | | | | | | | | | | |
| Municipal Bonds | | $ | — | | $ | 479,407,408 | | $ | — | | $ | 479,407,408 | |
| Ohio Quality Income (NUO) | | | | | | | | | | | | | |
| Long-Term Investments*: | | | | | | | | | | | | | |
| Municipal Bonds | | $ | — | | $ | 451,829,450 | | $ | — | | $ | 451,829,450 | |
| Texas Quality Income (NTX) | | | | | | | | | | | | | |
| Long-Term Investments*: | | | | | | | | | | | | | |
| Municipal Bonds | | $ | — | | $ | 221,285,064 | | $ | — | | $ | 221,285,064 | |
| * | Refer to the Fund's Portfolio of Investments for industry classifications. |
The Board is responsible for the valuation process and has appointed the oversight of the daily valuation process to the Adviser's Valuation Committee. The Valuation Committee, pursuant to the valuation policies and procedures adopted by the Board, is responsible for making fair value determinations, evaluating the effectiveness of the Funds' pricing policies and reporting to the Board. The Valuation Committee is aided in its efforts by the Adviser's dedicated Securities Valuation Team, which is responsible for administering the daily valuation process and applying fair value methodologies as approved by the Valuation Committee. When determining the reliability of independent pricing services for investments owned by the Funds, the Valuation Committee, among other things, conducts due diligence reviews of the pricing services and monitors the quality of security prices received through various testing reports conducted by the Securities Valuation Team.
The Valuation Committee will consider pricing methodologies it deems relevant and appropriate when making a fair value determination, based on the facts and circumstances specific to the portfolio instrument. Fair value determinations generally will be derived as follows, using public or private market information:
(i) | If available, fair value determinations shall be derived by extrapolating from recent transactions or quoted prices for identical or comparable securities. |
(ii) | If such information is not available, an analytical valuation methodology may be used based on other available information including, but not limited to: analyst appraisals, research reports, corporate action information, issuer financial statements and shelf registration statements. Such analytical valuation methodologies may include, but are not limited to: multiple of earnings, discount from market value of a similar freely-traded security, discounted cash flow analysis, book value or a multiple thereof, risk premium/yield analysis, yield to maturity and/or fundamental investment analysis. |
The purchase price of a portfolio instrument will be used to fair value the instrument only if no other valuation methodology is available or deemed appropriate, and it is determined that the purchase price fairly reflects the instrument's current value.
For each portfolio security that has been fair valued pursuant to the policies adopted by the Board, the fair value price is compared against the last available and next available market quotations. The Valuation Committee reviews the results of such testing and fair valuation occurrences are reported to the Board.
3. Portfolio Securities and Investments in Derivatives
Portfolio Securities
Inverse Floating Rate Securities
Each Fund is authorized to invest in inverse floating rate securities. An inverse floating rate security is created by depositing a municipal bond (referred to as an "Underlying Bond"), typically with a fixed interest rate, into a special purpose tender option bond ("TOB") trust (referred to as the "TOB Trust") created by or at the direction of one or more Funds. In turn, the TOB Trust issues (a) floating rate certificates (referred to as "Floaters"), in face amounts equal to some fraction of the Underlying Bond's par amount or market value, and (b) an inverse floating rate certificate (referred to as an "Inverse Floater") that represents all remaining or residual interest in the TOB Trust. Floaters typically pay short-term tax-exempt interest rates to third parties who are also provided a right to tender their certificate and receive its par value, which may be paid from the proceeds of a remarketing of the Floaters, by a loan to the TOB Trust from a third party liquidity provider ("Liquidity Provider"), or by the sale of assets from the TOB Trust. The Inverse Floater is issued to a long term investor, such as one or more of the Funds. The income received by the Inverse Floater holder varies inversely with the short-term rate paid to holders of the Floaters, and in most circumstances the Inverse Floater holder bears substantially all of the Underlying Bond's downside investment risk and also benefits disproportionately from any potential appreciation of the Underlying Bond's value. The value of an Inverse Floater will be more volatile than that of the Underlying Bond because the interest rate is dependent on not only the fixed coupon rate of the Underlying Bond but also on the short-term interest paid on the Floaters, and because the Inverse Floater essentially bears the risk of loss (and possible gain) of the greater face value of the Underlying Bond.
The Inverse Floater held by a Fund gives the Fund the right to (a) cause the holders of the Floaters to tender their certificates at par (or slightly more than par in certain circumstances), and (b) have the trustee of the TOB Trust (the "Trustee") transfer the Underlying Bond held by the TOB Trust to the Fund, thereby collapsing the TOB Trust.
The Fund may acquire an Inverse Floater in a transaction where it (a) transfers an Underlying Bond that it owns to a TOB Trust created by a third party or (b) transfers an Underlying Bond that it owns, or that it has purchased in a secondary market transaction for the purpose of creating an Inverse Floater, to a TOB Trust created at its direction, and in return receives the Inverse Floater of the TOB Trust (referred to as a "self-deposited Inverse Floater"). A Fund may also purchase an Inverse Floater in a secondary market transaction from a third party creator of the TOB Trust without first owning the Underlying Bond (referred to as an "externally-deposited Inverse Floater").
An investment in a self-deposited Inverse Floater is accounted for as a "financing" transaction (i.e., a secured borrowing). For a self-deposited Inverse Floater, the Underlying Bond deposited into the TOB Trust is identified in the Fund's Portfolio of Investments as "(UB) – Underlying bond of an inverse floating rate trust reflected as a financing transaction," with the Fund recognizing as liabilities, labeled "Floating rate obligations" on the Statement of Assets and Liabilities, (a) the liquidation value of Floaters issued by the TOB Trust, and (b) the amount of any borrowings by the TOB Trust from a Liquidity Provider to enable the TOB Trust to purchase outstanding Floaters in lieu of a remarketing. In addition, the Fund recognizes in "Investment Income" the entire earnings of the Underlying Bond, and recognizes (a) the interest paid to the holders of the Floaters or on the TOB Trust's borrowings, and (b) other expenses related to remarketing, administration, trustee, liquidity and other services to a TOB Trust, as a component of "Interest expense" on the Statement of Operations.
In contrast, an investment in an externally-deposited Inverse Floater is accounted for as a purchase of the Inverse Floater and is identified in the Fund's Portfolio of Investments as "(IF) – Inverse floating rate investment." For an externally-deposited Inverse Floater, a Fund's Statement of Assets and Liabilities recognizes the Inverse Floater and not the Underlying Bond as an asset, and the Fund does not recognize the Floaters, or any related borrowings from a Liquidity Provider, as a liability. Additionally, the Fund reflects in "Investment Income" only the net amount of earnings on the Inverse Floater (net of the interest paid to the holders of the Floaters or the Liquidity Provider as lender, and the expenses of the Trust), and does not show the amount of that interest paid or the expenses of the TOB Trust as described above as interest expense on the Statement of Operations.
Notes to Financial Statements (Unaudited) (continued)
Fees paid upon the creation of a TOB Trust for self-deposited Inverse Floaters and externally-deposited Inverse Floaters are recognized as part of the cost basis of the Inverse Floater and are capitalized over the term of the TOB Trust.
As of the end of the reporting period, the aggregate value of Floaters issued by each Fund's TOB Trust for self-deposited Inverse Floaters and externally-deposited Inverse Floaters was as follows:
| | | | Arizona | | | Michigan | | | Ohio | | | Texas | |
| | | | Premium | | | Quality | | | Quality | | | Quality | |
| | | | Income | | | Income | | | Income | | | Income | |
| Floating Rate Obligations Outstanding | | | (NAZ | ) | | (NUM | ) | | (NUO | ) | | (NTX | ) |
| Floating rate obligations: self-deposited Inverse Floaters | | $ | 2,755,000 | | $ | 6,625,000 | | $ | — | | $ | 660,000 | |
| Floating rate obligations: externally-deposited Inverse Floaters | | | 14,215,000 | | | 8,430,000 | | | 23,155,000 | | | — | |
| Total | | $ | 16,970,000 | | $ | 15,055,000 | | $ | 23,155,000 | | $ | 660,000 | |
During the current fiscal period, the average amount of floating rate obligations (including any borrowings from a Liquidity Provider) outstanding, and the average annual interest rate and fees related to self-deposited Inverse Floaters, were as follows:
| | | | Arizona | | | Michigan | | | Ohio | | | Texas | |
| | | | Premium | | | Quality | | | Quality | | | Quality | |
| | | | Income | | | Income | | | Income | | | Income | |
| Self-Deposited Inverse Floaters | | | (NAZ | ) | | (NUM | ) | | (NUO | ) | | (NTX | ) |
| Average floating rate obligations outstanding | | $ | 2,755,000 | | $ | 6,625,000 | | $ | — | | $ | 1,126,304 | |
| Average annual interest rate and fees | | | 0.54 | % | | 0.68 | % | | — | % | | 0.27 | % |
TOB Trusts are supported by a liquidity facility provided by a Liquidity Provider pursuant to which the Liquidity Provider agrees, in the event that Floaters are (a) tendered to the Trustee for remarketing and the remarketing does not occur, or (b) subject to mandatory tender pursuant to the terms of the TOB Trust agreement, to either purchase Floaters or to provide the Trustee with an advance from a loan facility to fund the purchase of Floaters by the TOB Trust. In certain circumstances, the Liquidity Provider may otherwise elect to have the Trustee sell the Underlying Bond to retire the Floaters that were tendered and not remarketed prior to providing such a loan. In these circumstances, the Liquidity Provider remains obligated to provide a loan to the extent that the proceeds of the sale of the Underlying Bond is not sufficient to pay the purchase price of the Floaters.
The size of the commitment under the loan facility for a given TOB Trust is at least equal to the balance of that TOB Trust's outstanding Floaters plus any accrued interest. In consideration of the loan facility, fee schedules are in place and are charged by the Liquidity Provider(s). Any loans made by the Liquidity Provider will be secured by the purchased Floaters held by the TOB Trust. Interest paid on any outstanding loan balances will be effectively borne by the Fund that owns the Inverse Floaters of the TOB Trust that has incurred the borrowing and may be at a rate that is greater than the rate that would have been paid had the Floaters been successfully remarketed.
As described above, any amounts outstanding under a liquidity facility are recognized as a component of "Floating rate obligations" on the Statement of Assets and Liabilities by the Fund holding the corresponding Inverse Floaters issued by the borrowing TOB Trust. As of the end of the reporting period, there were no loans outstanding under any such facility.
Each Fund may also enter into shortfall and forbearance agreements (sometimes referred to as a "recourse arrangement" or "credit recovery swap") (TOB Trusts involving such agreements are referred to herein as "Recourse Trusts"), under which a Fund agrees to reimburse the Liquidity Provider for the Trust's Floaters, in certain circumstances, for the amount (if any) by which the liquidation value of the Underlying Bond held by the TOB Trust may fall short of the sum of the liquidation value of the Floaters issued by the TOB Trust plus any amounts borrowed by the TOB Trust from the Liquidity Provider, plus any shortfalls in interest cash flows. Under these agreements, a Fund's potential exposure to losses related to or on an Inverse Floater may increase beyond the value of the Inverse Floater as a Fund may potentially be liable to fulfill all amounts owed to holders of the Floaters or the Liquidity Provider. Any such shortfall amount in the aggregate is recognized as "Unrealized depreciation on Recourse Trusts" on the Statement of Assets and Liabilities.
As of the end of the reporting period, each Fund's maximum exposure to the Floaters issued by Recourse Trusts for self-deposited Inverse Floaters and externally-deposited Inverse Floaters was as follows:
| | | | Arizona | | | Michigan | | | Ohio | | | Texas | |
| | | | Premium | | | Quality | | | Quality | | | Quality | |
| | | | Income | | | Income | | | Income | | | Income | |
| Floating Rate Obligations – Recourse Trusts | | | (NAZ | ) | | (NUM | ) | | (NUO | ) | | (NTX | ) |
| Maximum exposure to Recourse Trusts: self-deposited Inverse Floaters | | $ | 2,755,000 | | $ | — | | $ | — | | $ | — | |
| Maximum exposure to Recourse Trusts: externally-deposited Inverse Floaters | | $ | 7,500,000 | | $ | 8,430,000 | | $ | 4,480,000 | | $ | — | |
| Total | | $ | 10,255,000 | | $ | 8,430,000 | | $ | 4,480,000 | | $ | — | |
Zero Coupon Securities
A zero coupon security does not pay a regular interest coupon to its holders during the life of the security. Income to the holder of the security comes from accretion of the difference between the original purchase price of the security at issuance and the par value of the security at maturity and is effectively paid at maturity. The market prices of zero coupon securities generally are more volatile than the market prices of securities that pay interest periodically.
Investments in Derivatives
In addition to the inverse floating rate securities in which each Fund may invest, which are considered portfolio securities for financial reporting purposes, each Fund is authorized to invest in certain other derivative instruments, such as futures, options and swap contracts. Each Fund will limit its investments in futures, options on futures and swap contracts to the extent necessary for the Adviser to claim the exclusion from registration by the Commodity Futures Trading Commission as a commodity pool operator with respect to the Fund. The Funds record derivative instruments at fair value, with changes in fair value recognized on the Statement of Operations, when applicable. Even though the Funds' investments in derivatives may represent economic hedges, they are not considered to be hedge transactions for financial reporting purposes.
Credit Default Swaps
A Fund may enter into a credit default swap contract to seek to maintain a total return on a particular investment or portion of its portfolio, or to take an active long or short position with respect to the likelihood of a particular issuer's default. Credit default swap contracts involve one party making a stream of payments to another party in exchange for the right to receive a specified return if/when there is a credit event by a third party. Generally, a credit event means bankruptcy, failure to pay, or restructuring. The specific credit events applicable for each credit default swap are stated in the terms of the particular swap agreement. Upon occurrence of a specific credit event with respect to the underlying referenced entity, the Fund will either (i) receive that security, or an equivalent amount of cash, from the counterparty in exchange for payment of the notional amount to the counterparty, or (ii) pay a net settlement amount of the credit default swap contract less the recovery value of the referenced obligation or underlying securities comprising the referenced index. The difference between the value of the security delivered and the notional amount received is recorded as a realized gain or loss. Payments received or made at the beginning of the measurement period are recognized as a component of "Credit default swaps premiums paid and/or received" on the Statement of Assets and Liabilities, when applicable.
Credit default swap contracts are valued daily. Changes in the value of a credit default swap during the fiscal period are recognized as a component of "Change in net unrealized appreciation (depreciation) of swaps" and realized gains and losses are recognized as a component of "Net realized gain (loss) from swaps" on the Statement of Operations.
For over-the-counter swaps, the daily change in the market value of the swap contract, along with any daily interest fees accrued, are recognized as components of "Unrealized appreciation or depreciation on credit default swaps (, net)" on the Statement of Assets and Liabilities.
Investments in swaps cleared through an exchange obligate a Fund and the clearing broker to settle monies on a daily basis representing changes in the prior days "mark-to-market" of the swap. If a Fund has unrealized appreciation the clearing broker would credit the Fund's account with an amount equal to the appreciation and conversely if a Fund has unrealized depreciation the clearing broker would debit a Fund's account with an amount equal to the depreciation. These daily cash settlements are also known as "variation margin." Variation margin is recognized as a receivable and/or payable for "Variation margin on swap contracts" on the Statement of Assets and Liabilities. The maximum potential amount of future payments the Fund could incur as a buyer or seller of protection in a credit default swap contract is limited to the notional amount of the contract. The maximum potential amount would be offset by the recovery value, if any, of the respective referenced entity. In certain instances, a Fund is obligated to deposit cash or eligible securities, also known as "initial margin," into an account at its clearing broker equal to a specified percentage of the contract amount. Cash held by the broker to cover initial margin requirements on open swap contracts, if any, is recognized as "Cash collateral at brokers" on the Statement of Assets and Liabilities.
During the current fiscal period, Michigan Quality Income (NUM), Ohio Quality Income (NUO) and Texas Quality Income (NTX) invested in credit default swaps to manage credit risk by purchasing credit protection.
The average notional amount of credit default swap contracts outstanding during the current fiscal period was as follows:
| | | | Michigan | | | Ohio | | | Texas | |
| | | | Quality | | | Quality | | | Quality | |
| | | | Income | | | Income | | | Income | |
| | | | (NUM | ) | | (NUO | ) | | (NTX | ) |
| Average notional amount of credit default swap contracts outstanding* | | $ | 2,300,000 | | $ | 2,566,667 | | $ | 920,000 | |
| * | The average notional amount is calculated based on the outstanding notional at the beginning of the fiscal period and at the end of each fiscal quarter within the current fiscal period. |
Notes to Financial Statements (Unaudited) (continued)
The following table presents the amount of net realized gain (loss) and change in net unrealized appreciation (depreciation) recognized on swap contracts on the Statement of Operations during the current fiscal period, and the primary underlying risk exposure.
| | | | | | | | | | | | | Change in Net | |
| | | | | | | | | | | | | Unrealized | |
| | | | | | | | | | Net Realized | | | Appreciation | |
| | | | Underlying | | | Derivative | | | Gain (Loss) from | | | (Depreciation) of | |
| Fund | | | Risk Exposure | | | Instrument | | | Swaps | | | Swaps | |
| Michigan Quality Income (NUM) | | | Credit | | | Swaps | | $ | 45,681 | | $ | (187,352 | ) |
| Ohio Quality Income (NUO) | | | Credit | | | Swaps | | | 20,171 | | | (197,460 | ) |
| Texas Quality Income (NTX) | | | Credit | | | Swaps | | | 53,624 | | | (94,558 | ) |
Market and Counterparty Credit Risk
In the normal course of business each Fund may invest in financial instruments and enter into financial transactions where risk of potential loss exists due to changes in the market (market risk) or failure of the other party to the transaction to perform (counterparty credit risk). The potential loss could exceed the value of the financial assets recorded on the financial statements. Financial assets, which potentially expose each Fund to counterparty credit risk, consist principally of cash due from counterparties on forward, option and swap transactions, when applicable. The extent of each Fund's exposure to counterparty credit risk in respect to these financial assets approximates their carrying value as recorded on the Statement of Assets and Liabilities.
Each Fund helps manage counterparty credit risk by entering into agreements only with counterparties the Adviser believes have the financial resources to honor their obligations and by having the Adviser monitor the financial stability of the counterparties. Additionally, counterparties may be required to pledge collateral daily (based on the daily valuation of the financial asset) on behalf of each Fund with a value approximately equal to the amount of any unrealized gain above a pre-determined threshold. Reciprocally, when each Fund has an unrealized loss, the Funds have instructed the custodian to pledge assets of the Funds as collateral with a value approximately equal to the amount of the unrealized loss above a pre-determined threshold. Collateral pledges are monitored and subsequently adjusted if and when the valuations fluctuate, either up or down, by at least the pre-determined threshold amount.
4. Fund Shares
Common Share Transactions
Transactions in common shares during the following Funds' current and prior fiscal period were as follows:
| | | Arizona Premium
Income (NAZ) | | Michigan Quality
Income (NUM) | |
| | | | Six Months | | | Year | | | Six Months | | | Year | |
| | | | Ended | | | Ended | | | Ended | | | Ended | |
| | | | 8/31/15 | | | 2/28/15 | | | 8/31/15 | | | 2/28/15 | |
| Common shares: | | | | | | | | | | | | | |
| Issued to shareholders due to reinvestment of distributions | | | 2,248 | | | — | | | — | | | — | |
| Repurchased and retired | | | — | | | — | | | (5,000 | ) | | — | |
| Total | | | 2,248 | | | — | | | (5,000 | ) | | — | |
| Weighted average common share: | | | | | | | | | | | | | |
| Price per share repurchased and retired | | $ | — | | $ | — | | $ | 13.11 | | $ | — | |
| Discount per share repurchased and retired | | | — | | | — | | | 15.20 | % | | — | |
Preferred Shares
Institutional MuniFund Term Preferred Shares
The following Fund has issued and outstanding Institutional MuniFund Term Preferred ("iMTP") Shares, with a $5,000 liquidation value per share. iMTP Shares are issued via private placement and are not publicly available.
As of the end of the reporting period, details of iMTP Shares outstanding were as follows:
| | | | | | | | | | Shares | |
| | | | | | | | | | Outstanding | |
| | | | | | | | | | at $5,000 | |
| | | | | | | Shares | | | Per Share | |
| Fund | | | Series | | | Outstanding | | | Liquidation Value | |
| Texas Quality Income (NTX) | | | 2018 | | | 14,400 | | $ | 72,000,000 | |
The Fund is obligated to redeem its iMTP Shares by the date as specified in its offering document ("Term Redemption Date"), unless earlier redeemed or repurchased by the Fund. iMTP Shares are subject to optional and mandatory redemption in certain circumstances. The iMTP Shares are not subject to redemption at the option of the Fund for one year following the date of issuance ("Non-Call Expiration Date"), at which point the Fund may begin to redeem at its option ("Optional Redemption Date"). The Fund may be obligated to redeem certain of the iMTP Shares if the Fund fails to maintain certain asset coverage and leverage ratio requirements and such failures are not cured by the applicable cure date. The redemption price per share is equal to the sum of the liquidation value per share plus any accumulated but unpaid dividends. The Term Redemption Date, Optional Redemption Date and Non-Call Expiration Date for the Fund's iMTP Shares are as follows:
| | | | | | | Term | | | Optional | | | Non-Call | |
| Fund | | | Series | | | Redemption Date | | | Redemption Date | | | Expiration Date | |
| Texas Quality Income (NTX) | | | 2018 | | | November 1, 2018 | | | May 1, 2016 | | | April 30, 2016 | |
The average liquidation value of iMTP Shares outstanding and annualized dividend rate for the Fund during the current fiscal period, were as follows:
| | | | Texas | |
| | | | Quality | |
| | | | Income | |
| | | | (NTX | )* |
| Average liquidation of iMTP Shares outstanding | | $ | 72,000,000 | |
| Annualized dividend rate | | | 0.96 | % |
* For the period April 10, 2015 (first issuance of shares) through August 31, 2015.
iMTP Shares generally do not trade, and market quotations are generally not available. iMTP Shares are short-term or short/intermediate-term instruments that pay a variable dividend rate tied to a short-term index, plus an additional fixed "spread" amount established at the time of issuance. The fair value of iMTP Shares is expected to be approximately their liquidation par value so long as the fixed "spread" on the iMTP Shares remains roughly in line with the "spread" rates being demanded by investors on instruments having similar terms in the current market environment. In present market conditions, the Fund's Adviser has determined that the fair value of iMTP Shares is their liquidation value, but their fair value could vary if market conditions change materially. For financial reporting purposes, the liquidation value of iMTP Shares is recorded as a liability and recognized as "Institutional MuniFund Term Preferred ("iMTP") Shares, at liquidation value" on the Statement of Assets and Liabilities.
Dividends on the iMTP Shares (which are treated as interest payments for financial reporting purposes) are set weekly. Unpaid dividends on iMTP Shares are recognized as a component of "Interest payable" on the Statement of Assets and Liabilities, when applicable. Dividends accrued on iMTP Shares are recognized as a component of "Interest expense and amortization of offering costs" on the Statement of Operations.
Offering costs of $530,000 were incurred in connection with the Fund's offering of iMTP Shares, which were recorded as a deferred charge and are being amortized over the life of the shares. These offering costs are recognized as components of "Deferred offering costs" on the Statement of Assets and Liabilities and "Interest expense and amortization of offering costs" on the Statement of Operations.
MuniFund Term Preferred Shares
During the current fiscal period, Texas Quality Income (NTX) had issued and outstanding MuniFund Term Preferred ("MTP") Shares, with a $10 liquidation value per share. The Fund's MTP Shares were issued in one or more Series and traded on the NYSE.
On April 20, 2015, Texas Quality Income (NTX) redeemed all of its outstanding Series 2015 MTP Shares. The Fund's MTP Shares were redeemed at their $10.00 liquidation value per share, plus dividend amounts owed, using proceeds from its issuance of iMTP Shares (as described above in
Institutional MuniFund Term Preferred Shares).
The average liquidation value of MTP Shares outstanding for the Fund during the current fiscal period, were as follows:
| | | | Texas | |
| | | | Quality | |
| | | | Income | |
| | | | (NTX | )* |
| Average liquidation value of MTP Shares outstanding | | $ | 70,920,000 | |
* For the period March 1, 2015 through April 20, 2015.
For financial reporting purposes, the liquidation value of MTP Shares is recorded as a liability and recognized as "MuniFund Term Preferred ("MTP") Shares, at liquidation value" on the Statement of Assets and Liabilities. Dividends on MTP Shares, which are recognized as interest expense for financial reporting purposes, are paid monthly at a fixed annual rate, subject to adjustments in certain circumstances. Unpaid dividends on MTP Shares are recognized as a component of "Interest payable" on the Statement of Assets and Liabilities. Dividends accrued on MTP Shares are recognized as a component of "Interest expense and amortization of offering costs" on the Statement of Operations. Costs incurred by the Fund in connection with its offering of MTP Shares were recorded as a deferred charge, which were amortized over the life of the shares and are recognized
Notes to Financial Statements (Unaudited) (continued)
as components of "Deferred offering costs" on the Statement of Assets and Liabilities and "Interest expense and amortization of offering costs" on the Statement of Operations.
In conjunction with Texas Quality Income's (NTX) redemption of MTP Shares, the remaining deferred offering costs of $191,443, were fully expensed during the current fiscal period, as the redemptions were deemed on extinguishment of debt.
Variable Rate MuniFund Term Preferred Shares
The following Funds have issued and outstanding Variable Rate MuniFund Term Preferred ("VMTP") Shares, with a $100,000 liquidation value per share. VMTP Shares are issued via private placement and are not publicly available.
As of the end of the reporting period, VMTP Shares outstanding, at liquidation value, for each Fund were as follows:
| | | | | | | | | | Shares | |
| | | | | | | | | | Outstanding | |
| | | | | | | Shares | | | at $100,000 Per Share | |
| Fund | | | Series | | | Outstanding | | | Liquidation Value | |
| Arizona Premium Income (NAZ) | | | 2016 | | | 790 | | $ | 79,000,000 | |
| Michigan Quality Income (NUM) | | | 2016 | | | 1,590 | | $ | 159,000,000 | |
Each Fund is obligated to redeem its VMTP Shares by the date as specified in its offering document ("Term Redemption Date"), unless earlier redeemed or repurchased by the Fund. VMTP Shares are subject to optional and mandatory redemption in certain circumstances. The VMTP Shares are subject to redemption at the option of each Fund ("Optional Redemption Date"), subject to payment of premium for one year following the date of issuance ("Premium Expiration Date"), and at par thereafter. Each Fund may be obligated to redeem certain of the VMTP Shares if the Fund fails to maintain certain asset coverage and leverage ratio requirements and such failures are not cured by the applicable cure date. The redemption price per share is equal to the sum of the liquidation value per share plus any accumulated but unpaid dividends. The Term Redemption Date, Optional Redemption Date and Premium Expiration Date for each Fund's VMTP Shares are as follows:
| | | | | | | Term | | | Optional | | | Premium | |
| Fund | | | Series | | | Redemption Date | | | Redemption Date | | | Expiration Date | |
| Arizona Premium Income (NAZ) | | | 2016 | | | December 30, 2016 | | | January 1, 2015 | | | December 31, 2014 | |
| Michigan Quality Income (NUM) | | | 2016 | | | December 30, 2016 | | | January 1, 2015 | | | December 31, 2014 | |
The average liquidation value of VMTP Shares outstanding and annualized dividend rate for each Fund during the current fiscal period, were as follows:
| | | | Arizona | | | Michigan | |
| | | | Premium | | | Quality | |
| | | | Income | | | Income | |
| | | | (NAZ | ) | | (NUM | ) |
| Average liquidation value of VMTP Shares outstanding | | $ | 79,000,000 | | $ | 159,000,000 | |
| Annualized dividend rate | | | 1.00 | % | | 1.00 | % |
VMTP Shares generally do not trade, and market quotations are generally not available. VMTP Shares are short-term or short/intermediate-term instruments that pay a variable dividend rate tied to a short-term index, plus an additional fixed "spread" amount established at the time of issuance. The fair value of VMTP Shares is expected to be approximately their liquidation par value so long as the fixed "spread" on the VMTP Shares remains roughly in line with the "spread" rates being demanded by investors on instruments having similar terms in the current market environment. In present market conditions, the Funds' Adviser has determined that the fair value of VMTP Shares is their liquidation value, but their fair value could vary if market conditions change materially. For financial reporting purposes, the liquidation value of VMTP Shares is a liability and is recognized as "Variable Rate MuniFund Term Preferred ("VMTP") Shares, at liquidation value" on the Statement of Assets and Liabilities.
Dividends on the VMTP Shares (which are treated as interest payments for financial reporting purposes) are set weekly. Unpaid dividends on VMTP Shares are recognized as a component of "Interest payable" on the Statement of Assets and Liabilities. Dividends accrued on VMTP Shares are recognized as a component of "Interest expense and amortization of offering costs" on the Statement of Operations.
Costs incurred by the Funds in connection with their offerings of VMTP Shares were recorded as a deferred charge, which are amortized over the life of the shares and are recognized as components of "Deferred offering costs" on the Statement of Assets and Liabilities and "Interest expense and amortization of offering costs" on the Statement of Operations.
Variable Rate Demand Preferred Shares
Ohio Quality Income (NUO) has issued and outstanding Variable Rate Demand Preferred ("VRDP") Shares, with a $100,000 liquidation value per share. VRDP Shares are issued via private placement and are not publicly available.
As of the end of the reporting period, details of the Fund's VRDP Shares outstanding were as follows:
| | | | | | | | | | Shares | | | | |
| | | | | | | | | | Outstanding | | | | |
| | | | | | | Shares | | | at $100,000 Per Share | | | | |
| Fund | | | Series | | | Outstanding | | | Liquidation Value | | | Maturity | |
| Ohio Quality Income (NUO) | | | 1 | | | 1,480 | | $ | 148,000,000 | | | September 1, 2043 | |
VRDP Shares include a liquidity feature that allows VRDP shareholders to have their shares purchased by a liquidity provider with whom the Fund has contracted in the event that purchase orders for VRDP Shares in a remarketing are not sufficient in number to be matched with the sale orders in that remarketing. The Fund is required to redeem any VRDP Shares that are still owned by the liquidity provider after six months of continuous, unsuccessful remarketing. The Fund pays an annual remarketing fee of 0.10% on the aggregate principal amount of all VRDP Shares outstanding. The Fund's VRDP Shares have successfully remarketed since issuance.
Dividends on the VRDP Shares (which are treated as interest payments for financial reporting purposes) are set weekly at a rate established by a remarketing agent; therefore, the market value of the VRDP Shares is expected to approximate its liquidation value. If remarketings for VRDP Shares are continuously unsuccessful for six months, the maximum rate is designed to escalate according to a specified schedule in order to enhance the remarketing agent's ability to successfully remarket the VRDP Shares.
Subject to certain conditions, VRDP Shares may be redeemed, in whole or in part, at any time at the option of the Fund. The Fund may also redeem certain of the VRDP Shares if the Fund fails to maintain certain asset coverage requirements and such failures are not cured by the applicable cure date. The redemption price per share is equal to the sum of the liquidation value per share plus any accumulated but unpaid dividends.
The average liquidation value of VRDP Shares outstanding and annualized dividend rate for the Fund during the current fiscal period were as follows:
| | | | Ohio | |
| | | | Quality | |
| | | | Income | |
| | | | (NUO | ) |
| Average liquidation value of VRDP Shares outstanding | | $ | 148,000,000 | |
| Annualized dividend rate | | | 0.14 | % |
For financial reporting purposes, the liquidation value of VRDP Shares is a liability and is recognized as "Variable Rate Demand Preferred ("VRDP") Shares, at liquidation value" on the Statement of Assets and Liabilities. Unpaid dividends on VRDP Shares are recognized as a component of "Interest payable" on the Statement of Assets and Liabilities, when applicable. Dividends accrued on VRDP Shares are recognized as a component of "Interest expense and amortization of offering costs" on the Statement of Operations. Costs incurred by the Fund in connection with its offerings of VRDP Shares were recorded as a deferred charge, which are being amortized over the life of the shares and are recognized as a component of "Deferred offering costs" on the Statement of Assets and Liabilities and "Interest expense and amortization of offerings costs" on the Statement of Operations. In addition to interest expense, the Fund also pays a per annum liquidity fee to the liquidity provider, as well as a remarketing fee, which are recognized as "Liquidity fees" and "Remarketing fees," respectively, on the Statement of Operations.
Preferred Share Transactions
Transactions in preferred shares for the Funds during the Funds' current and prior fiscal period, where applicable, are noted in the following tables.
Transactions in iMTP Shares for the Funds, where applicable, were as follows:
| | | | Six Months Ended | |
| | | | August 31, 2015 | |
| Texas Quality Income (NTX) | | | Series | | | Shares | | | Amount | |
| iMTP Shares issued | | | 2018 | | | 14,400 | | $ | 72,000,000 | |
Transactions in MTP Shares for the Funds, where applicable, were as follows:
| | | | Six Months Ended
August 31, 2015 | |
| | | | | | | NYSE | | | | | | | |
| Texas Quality Income (NTX) | | | Series | | | Ticker | | | Shares | | | Amount | |
| MTP Shares redeemed | | | 2015 | | | NTC PRCCL | | | (7,092,000 | ) | $ | (70,920,000 | ) |
Notes to Financial Statements (Unaudited) (continued)
5. Investment Transactions
Long-term purchases and sales (including maturities but excluding derivative transactions, where applicable) during the current fiscal period were as follows:
| | | | Arizona | | | Michigan | | | Ohio | | | Texas | |
| | | | Premium | | | Quality | | | Quality | | | Quality | |
| | | | Income | | | Income | | | Income | | | Income | |
| | | | (NAZ | ) | | (NUM | ) | | (NUO | ) | | (NTX | ) |
| Purchases | | $ | 9,988,972 | | $ | 45,065,482 | | $ | 21,770,973 | | $ | 26,190,167 | |
| Sales and maturities | | | 9,389,574 | | | 41,207,696 | | | 18,574,171 | | | 28,719,558 | |
6. Income Tax Information
Each Fund is a separate taxpayer for federal income tax purposes. Each Fund intends to distribute substantially all of its net investment income and net capital gains to shareholders and to otherwise comply with the requirements of Subchapter M of the Internal Revenue Code applicable to regulated investment companies. Therefore, no federal income tax provision is required. Furthermore, each Fund intends to satisfy conditions that will enable interest from municipal securities, which is exempt from regular federal and designated state income taxes, to retain such tax-exempt status when distributed to shareholders of the Funds. Net realized capital gains and ordinary income distributions paid by the Funds are subject to federal taxation.
For all open tax years and all major taxing jurisdictions, management of the Funds has concluded that there are no significant uncertain tax positions that would require recognition in the financial statements. Open tax years are those that are open for examination by taxing authorities (i.e., generally the last four tax year ends and the interim tax period since then). Furthermore, management of the Funds is also not aware of any tax positions for which it is reasonably possible that the total amounts of unrecognized tax benefits will significantly change in the next twelve months.
The following information is presented on an income tax basis. Differences between amounts for financial statement and federal income tax purposes are primarily due to timing differences in recognizing taxable market discount, timing differences in recognizing certain gains and losses on investment transactions and the treatment of investments in inverse floating rate securities reflected as financing transactions, if any. To the extent that differences arise that are permanent in nature, such amounts are reclassified within the capital accounts as detailed below. Temporary differences do not require reclassification. Temporary and permanent differences do not impact the NAVs of the Funds.
As of August 31, 2015, the cost and unrealized appreciation (depreciation) of investments (excluding investments in derivatives, where applicable), as determined on a federal income tax basis, were as follows:
| | | | Arizona | | | Michigan | | | Ohio | | | Texas | |
| | | | Premium | | | Quality | | | Quality | | | Quality | |
| | | | Income | | | Income | | | Income | | | Income | |
| | | | (NAZ | ) | | (NUM | ) | | (NUO | ) | | (NTX | ) |
| Cost of investments | | $ | 230,194,645 | | $ | 445,109,900 | | $ | 421,870,765 | | $ | 207,359,291 | |
| Gross unrealized: | | | | | | | | | | | | | |
| Appreciation | | $ | 18,716,765 | | $ | 28,891,344 | | $ | 32,645,292 | | $ | 17,179,815 | |
| Depreciation | | | (3,034,807 | ) | | (1,218,837 | ) | | (2,686,607 | ) | | (3,914,044 | ) |
| Net unrealized appreciation (depreciation) of investments | | $ | 15,681,958 | | $ | 27,672,507 | | $ | 29,958,685 | | $ | 13,265,771 | |
Permanent differences, primarily due to expiration of capital loss carryforwards, treatment of notional principal contracts, nondeductible reorganization expenses, federal taxes paid, taxable market discount and nondeductible offering costs, resulted in reclassifications among the Funds' components of common share net assets as of February 28, 2015, the Funds' last tax year end, as follows:
| | | | Arizona | | | Michigan | | | Ohio | | | Texas | |
| | | | Premium | | | Quality | | | Quality | | | Quality | |
| | | | Income | | | Income | | | Income | | | Income | |
| | | | (NAZ | ) | | (NUM | ) | | (NUO | ) | | (NTX | ) |
| Paid-in surplus | | $ | (309,943 | ) | $ | (37,134 | ) | $ | 245,591 | | $ | (294,053 | ) |
| Undistributed (Over-distribution of) net investment income | | | (59,630 | ) | | (88,379 | ) | | (356,317 | ) | | 179,243 | |
| Accumulated net realized gain (loss) | | | 369,573 | | | 125,513 | | | 110,726 | | | 114,810 | |
The tax components of undistributed net tax-exempt income, net ordinary income and net long-term capital gains as of February 28, 2015, the Funds' last tax year end, were as follows:
| | | | Arizona | | | Michigan | | | Ohio | | | Texas | |
| | | | Premium | | | Quality | | | Quality | | | Quality | |
| | | | Income | | | Income | | | Income | | | Income | |
| | | | (NAZ | ) | | (NUM | ) | | (NUO | ) | | (NTX | ) |
Undistributed net tax-exempt income 1 | | $ | 1,788,043 | | $ | 1,808,860 | | $ | 1,019,965 | | $ | 484,128 | |
Undistributed net ordinary income 2 | | | — | | | 958 | | | 29,139 | | | — | |
| Undistributed net long-term capital gains | | | — | | | — | | | — | | | — | |
| 1 | Undistributed net tax-exempt income (on a tax basis) has not been reduced for the dividend declared on February 2, 2015, paid on March 2, 2015. |
| 2 | Net ordinary income consists of taxable market discount income and net short-term capital gains, if any. |
The tax character of distributions paid during the Funds' last tax year ended February 28, 2015, was designated for purposes of the dividends paid deduction as follows:
| | | | Arizona | | | Michigan | | | Ohio | | | Texas | |
| | | | Premium | | | Quality | | | Quality | | | Quality | |
| | | | Income | | | Income | | | Income | | | Income | |
| | | | (NAZ | ) | | (NUM | ) | | (NUO | ) | | (NTX | ) |
| Distributions from net tax-exempt income | | $ | 9,960,313 | | $ | 19,600,465 | | $ | 17,430,996 | | $ | 8,434,464 | |
Distributions from net ordinary income2 | | | 3,316 | | | 4,167 | | | 50,009 | | | 10,213 | |
| Distributions from net long-term capital gains | | | — | | | — | | | — | | | — | |
| 2 | Net ordinary income consists of taxable market discount income and net short-term capital gains, if any. |
As of February 28, 2015, the Funds' last tax year end, the Funds had unused capital loss carryforwards available for federal income tax purposes to be applied against future capital gains, if any. If not applied, the carryforwards will expire as shown in the following table. The losses not subject to expiration will be utilized first by a Fund.
| | | | Arizona | | | Michigan | | | Ohio | | | Texas | |
| | | | Premium | | | Quality | | | Quality | | | Quality | |
| | | | Income | | | Income | | | Income | | | Income | |
| | | | (NAZ | ) | | (NUM | )3 | | (NUO | )3 | | (NTX | ) |
| Expiration: | | | | | | | | | | | | | |
| February 29, 2016 | | | 615,885 | | | — | | | — | | | — | |
| February 28, 2017 | | | 828,959 | | | 620,251 | | | 173,469 | | | — | |
| February 28, 2018 | | | 43,720 | | | 487,225 | | | 857,567 | | | — | |
| February 28, 2019 | | | — | | | — | | | 1,468,286 | | | — | |
| Not subject to expiration | | | 3,328,594 | | | — | | | — | | | 1,149,603 | |
| Total | | $ | 4,817,158 | | $ | 1,107,476 | | $ | 2,499,322 | | $ | 1,149,603 | |
| 3 | A portion of Michigan Quality Income's (NUM) and Ohio Quality Income's (NUO) capital loss carryforward is subject to an annual limitation under the Internal Revenue Code and related regulations. |
During the Funds' last tax year ended February 28, 2015, the following Funds utilized capital loss carryforwards as follows:
| | | | Michigan | | | Ohio | | | Texas | |
| | | | Quality | | | Quality | | | Quality | |
| | | | Income | | | Income | | | Income | |
| | | | (NUM | ) | | (NUO | ) | | (NTX | ) |
| Utilized capital loss carryforwards | | $ | 1,803,496 | | $ | 2,684,222 | | $ | 76,734 | |
As of February 28, 2015, the Funds' last tax year end, $363,937 of Arizona Premium Income's (NAZ) capital loss carryforward expired.
7. Management Fees and Other Transactions with Affiliates
Each Fund's management fee compensates the Adviser for overall investment advisory and administrative services and general office facilities. The Sub-Adviser is compensated for its services to the Funds from the management fees paid to the Adviser.
Each Fund's management fee consists of two components – a fund-level fee, based only on the amount of assets within each individual Fund, and a complex-level fee, based on the aggregate amount of all eligible fund assets managed by the Adviser.
This pricing structure enables Fund shareholders to benefit from growth in the assets within their respective Fund as well as from growth in the amount of complex-wide assets managed by the Adviser. The annual Fund-level fee, payable monthly, for each Fund is calculated according to the following schedule:
| Average Daily Managed Assets* | | Fund-Level Fee | |
| For the first $125 million | | | 0.4500 | % |
| For the next $125 million | | | 0.4375 | |
| For the next $250 million | | | 0.4250 | |
| For the next $500 million | | | 0.4125 | |
| For the next $1 billion | | | 0.4000 | |
| For the next $3 billion | | | 0.3875 | |
| For managed assets over $5 billion | | | 0.3750 | |
Notes to Financial Statements (Unaudited) (continued)
The annual complex-level fee, payable monthly, for each Fund is calculated according to the following schedule:
| Complex-Level Managed Asset Breakpoint Level* | | | Effective Rate at Breakpoint Level | |
| $55 billion | | | 0.2000 | % |
| $56 billion | | | 0.1996 | |
| $57 billion | | | 0.1989 | |
| $60 billion | | | 0.1961 | |
| $63 billion | | | 0.1931 | |
| $66 billion | | | 0.1900 | |
| $71 billion | | | 0.1851 | |
| $76 billion | | | 0.1806 | |
| $80 billion | | | 0.1773 | |
| $91 billion | | | 0.1691 | |
| $125 billion | | | 0.1599 | |
| $200 billion | | | 0.1505 | |
| $250 billion | | | 0.1469 | |
| $300 billion | | | 0.1445 | |
| * | For the fund-level and complex-level fees, managed assets include closed-end fund assets managed by the Adviser that are attributable to certain types of leverage. For these purposes, leverage includes the funds' use of preferred stock and borrowings and certain investments in the residual interest certificates (also called inverse floating rate securities) in tender option bond (TOB) trusts, including the portion of assets held by a TOB trust that has been effectively financed by the trust's issuance of floating rate securities, subject to an agreement by the Adviser as to certain funds to limit the amount of such assets for determining managed assets in certain circumstances. The complex-level fee is calculated based upon the aggregate daily managed assets of all Nuveen funds that constitute "eligible assets." Eligible assets do not include assets attributable to investments in other Nuveen funds or assets in excess of $2 billion added to the Nuveen fund complex in connection with the Adviser's assumption of the management of the former First American Funds effective January 1, 2011. As of August 31, 2015, the complex-level fee rate for the Funds was 0.1643%. |
The Funds pay no compensation directly to those of its trustees who are affiliated with the Adviser or to its officers, all of whom receive remuneration for their services to the Funds from the Adviser or its affiliates. The Board has adopted a deferred compensation plan for independent trustees that enables trustees to elect to defer receipt of all or a portion of the annual compensation they are entitled to receive from certain Nuveen-advised funds. Under the plan, deferred amounts are treated as though equal dollar amounts had been invested in shares of select Nuveen-advised funds.
8. Borrowing Arrangements
During the current fiscal period, the Funds participated in an unsecured bank line of credit ("Unsecured Credit Line") under which outstanding balances would bear interest at a variable rate. On December 31, 2014, Arizona Premium Income (NAZ) and Ohio Quality Income (NUO) utilized $1,787,533 and $2,246,517, respectively, of the Unsecured Credit Line at an annualized interest rate of 1.34% on each Fund's respective outstanding balance. Michigan Quality Income (NUM) and Texas Quality Income (NTX) did not draw on this Unsecured Credit Line during the current fiscal period.
During July 2015, the Funds, along with certain other funds managed by the Adviser ("Participating Funds"), established a 364-day, $2.53 billion standby credit facility with a group of lenders, under which the Participating Funds may borrow for various purposes other than leveraging for investment purposes. This credit agreement replaces the Unsecured Credit Line described above. A large portion of this facility's capacity (and its associated costs as described below) is currently dedicated for use by a small number of Participating Funds, which does not include any of the Funds covered by this shareholder report. The remaining capacity under the facility (and the corresponding portion of the facility's annual costs) is separately dedicated to most of the other open-end funds in the Nuveen fund family, along with a number of Nuveen closed-end funds, including all of the Funds covered by this shareholder report. The credit facility expires in July 2016 unless extended or renewed.
The credit facility has the following terms: a fee of 0.15% per annum on unused commitment amounts, and interest at a rate equal to the higher of (a) one-month LIBOR (London Inter-Bank Offered Rate) plus 1.25% per annum or (b) the Fed Funds rate plus 1.25% per annum on amounts borrowed. Participating Funds paid administration, legal and arrangement fees, which are recognized as a component of "other expenses" on the Statement of Operations, and along with commitment fees, have been allocated among such participating Funds based upon the relative proportions of the facility's aggregate capacity reserved for them and other factors deemed relevant by the Adviser and the Board of each Participating Fund.
During the current fiscal period, none of the Funds utilized this facility.
9. New Accounting Pronouncement
Financial Accounting Standards Board ("FASB") Transfers and Servicing (Topic 860): Repurchase-to-Maturity Transactions, Repurchase Financings, and Disclosures
In June 2014, the FASB issued Accounting Standards Update ("ASU") 2014-11, Transfers and Servicing (Topic 860): Repurchase-to-Maturity Transactions, Repurchase Financings, and Disclosures" ("ASU 2014-11"), that expanded secured borrowing accounting for certain reverse repurchase agreements. ASU 2014-11 also sets forth additional disclosure requirements for certain transactions accounted for as sales in order to provide financial statement users with information to compare to similar transactions accounted for as secured borrowings. ASU 2014-11 is effective prospectively for annual periods beginning after December 15, 2014, and interim periods beginning after March 15, 2015. Management is currently evaluating the impact, if any, of ASU 2014-11 on the Funds' financial statement disclosures.
Additional Fund Information
| Board of Trustees | | | | | | | | | | |
| William Adams IV* | | Jack B. Evans | | William C. Hunter | | David J. Kundert | | John K. Nelson | | William J. Schneider |
| Thomas S. Schreier, Jr.* | | Judith M. Stockdale | | Carole E. Stone | | Virginia L. Stringer** | | Terence J. Toth | | |
* Interested Board Member.
** Will retire from the Funds' Board of Trustees effective December 31, 2015.
Fund Manager Nuveen Fund Advisors, LLC 333 West Wacker Drive Chicago, IL 60606 | | Custodian State Street Bank & Trust Company Boston, MA 02111 | | Legal Counsel Chapman and Cutler LLP Chicago, IL 60603 | | Independent Registered Public Accounting Firm KPMG LLP Chicago, IL 60601 | | Transfer Agent and Shareholder Services State Street Bank & Trust Company Nuveen Funds P.O. Box 43071 Providence,
RI 02940-3071 (800) 257-8787 |
Quarterly Form N-Q Portfolio of Investments Information
Each Fund is required to file its complete schedule of portfolio holdings with the Securities and Exchange Commission (SEC) for the first and third quarters of each fiscal year on Form N-Q. You may obtain this information directly from the SEC. Visit the SEC on-line at http://www.sec.gov or in person at the SEC's Public Reference Room in Washington, D.C. Call the SEC toll-free at (800) SEC-0330 for room hours and operation.
Nuveen Funds' Proxy Voting Information
You may obtain (i) information regarding how each fund voted proxies relating to portfolio securities held during the most recent twelve-month period ended June 30, without charge, upon request, by calling Nuveen Investments toll-free at (800) 257-8787 or on Nuveen's website at www.nuveen.com and (ii) a description of the policies and procedures that each fund used to determine how to vote proxies relating to portfolio securities without charge, upon request, by calling Nuveen Investments toll free at (800) 257-8787. You may also obtain this information directly from the SEC. Visit the SEC on-line at http://www.sec.gov.
CEO Certification Disclosure
Each Fund's Chief Executive Officer (CEO) has submitted to the New York Stock Exchange (NYSE) the annual CEO certification as required by Section 303A.12(a) of the NYSE Listed Company Manual. Each Fund has filed with the SEC the certification of its CEO and Chief Financial Officer required by Section 302 of the Sarbanes-Oxley Act.
Common Share Repurchases
Each Fund intends to repurchase, through its open-market share repurchase program, shares of its own common stock at such times and in such amounts as is deemed advisable. During the period covered by this report, each Fund repurchased shares of its common stock, as shown in the accompanying table. Any future repurchases will be reported to shareholders in the next annual or semi-annual report.
| | | | NAZ | | | NUM | | | NUO | | | NTX | |
| Common shares repurchased | | | — | | | 5,000 | | | — | | | — | |
FINRA BrokerCheck
The Financial Industry Regulatory Authority (FINRA) provides information regarding the disciplinary history of FINRA member firms and associated investment professionals. This information as well as an investor brochure describing FINRA BrokerCheck is available to the public by calling the FINRA BrokerCheck Hotline number at (800) 289-9999 or by visiting www.FINRA.org.
Glossary of Terms Used in this Report
| ■ | Auction Rate Bond: An auction rate bond is a security whose interest payments are adjusted periodically through an auction process, which process typically also serves as a means for buying and selling the bond. Auctions that fail to attract enough buyers for all the shares offered for sale are deemed to have "failed," with current holders receiving a formula-based interest rate until the next scheduled auction. |
| | |
| ■ | Average Annual Total Return: This is a commonly used method to express an investment's performance over a particular, usually multi-year time period. It expresses the return that would have been necessary each year to equal the investment's actual cumulative performance (including change in NAV or market price and reinvested dividends and capital gains distributions, if any) over the time period being considered. |
| | |
| ■ | Duration: Duration is a measure of the expected period over which a bond's principal and interest will be paid, and consequently is a measure of the sensitivity of a bond's or bond fund's value to changes when market interest rates change. Generally, the longer a bond's or fund's duration, the more the price of the bond or fund will change as interest rates change. |
| | |
| ■ | Effective Leverage: Effective leverage is a fund's effective economic leverage, and includes both regulatory leverage (see leverage) and the leverage effects of certain derivative investments in the fund's portfolio. Currently, the leverage effects of Tender Option Bond (TOB) inverse floater holdings are included in effective leverage values, in addition to any regulatory leverage. |
| | |
| ■ | Inverse Floating Rate Securities: Inverse floating rate securities, also known as inverse floaters or tender option bonds (TOBs), are created by depositing a municipal bond, typically with a fixed interest rate, into a special purpose trust. This trust, in turn, (a) issues floating rate certificates typically paying short-term tax-exempt interest rates to third parties in amounts equal to some fraction of the deposited bond's par amount or market value, and (b) issues an inverse floating rate certificate (sometimes referred to as an "inverse floater") to an investor (such as a fund) interested in gaining investment exposure to a long-term municipal bond. The income received by the holder of the inverse floater varies inversely with the short-term rate paid to the floating rate certificates' holders, and in most circumstances the holder of the inverse floater bears substantially all of the underlying bond's downside investment risk. The holder of the inverse floater typically also benefits disproportionately from any potential appreciation of the underlying bond's value. Hence, an inverse floater essentially represents an investment in the underlying bond on a leveraged basis. |
| | |
| ■ | Leverage: Leverage is created whenever a fund has investment exposure (both reward and/or risk) equivalent to more than 100% of the investment capital. |
| | |
| ■ | Lipper Other States Municipal Debt Funds Classification Average: Calculated using the returns of all closed-end funds in this category. Shareholders should note that the performance of the Lipper Other States classification represents the overall average of returns for funds from ten states with a wide variety of municipal market conditions, making direct comparisons less meaningful. Lipper returns account for the effects of management fees and assume reinvestment of distributions, but do not reflect any applicable sales charges. |
| | |
| ■ | Net Asset Value (NAV) Per Share: A fund's Net Assets is equal to its total assets (securities, cash, accrued earnings and receivables) less its total liabilities. NAV per share is equal to the fund's Net Assets divided by its number of shares outstanding. |
| | |
| ■ | Pre-Refunding: Pre-Refunding, also known as advanced refundings or refinancings, is a procedure used by state and local governments to refinance municipal bonds to lower interest expenses. The issuer sells new bonds with a lower yield and uses the proceeds to buy U.S. Treasury securities, the interest from which is used to make payments on the higher-yielding bonds. Because of this collateral, pre-refunding generally raises a bond's credit rating and thus its value. |
| ■ | Regulatory Leverage: Regulatory leverage consists of preferred shares issued by or borrowings of a fund. Both of these are part of a fund's capital structure. Regulatory leverage is subject to asset coverage limits set in the Investment Company Act of 1940. |
| | |
| ■ | S&P Municipal Bond Indexes Arizona, Michigan, Ohio and Texas: Unleveraged, market value-weighted indexes designed to measure the performance of the tax-exempt, investment-grade municipal bond markets in Arizona, Michigan, Ohio and Texas, respectively. Index returns assume reinvestment of distributions, but do not reflect any applicable sales charges or management fees. |
| | |
| ■ | S&P Municipal Bond Index: An unleveraged, market value-weighted index designed to measure the performance of the tax-exempt, investment-grade U.S. municipal bond market. Index returns assume reinvestment of distributions, but do not reflect any applicable sales charges or management fees. |
| | |
| ■ | Total Investment Exposure: Total investment exposure is a fund's assets managed by the Adviser that are attributable to financial leverage. For these purposes, financial leverage includes a fund's use of preferred stock and borrowings and investments in the residual interest certificates (also called inverse floating rate securities) in tender option bond (TOB) trusts, including the portion of assets held by a TOB trust that has been effectively financed by the trust's issuance of floating rate securities. |
| | |
| ■ | Zero Coupon Bond: A zero coupon bond does not pay a regular interest coupon to its holders during the life of the bond. Income to the holder of the bond comes from accretion of the difference between the original purchase price of the bond at issuance and the par value of the bond at maturity and is effectively paid at maturity. The market prices of zero coupon bonds generally are more volatile than the market prices of bonds that pay interest periodically. |
Reinvest Automatically, Easily and Conveniently
Nuveen makes reinvesting easy. A phone call is all it takes to set up your reinvestment account.
Nuveen Closed-End Funds Automatic Reinvestment Plan
Nuveen Closed-End Fund allows you to conveniently reinvest distributions in additional Fund shares. By choosing to reinvest, you'll be able to invest money regularly and automatically, and watch your investment grow through the power of compounding. Just like distributions in cash, there may be times when income or capital gains taxes may be payable on distributions that are reinvested. It is important to note that an automatic reinvestment plan does not ensure a profit, nor does it protect you against loss in a declining market.
Easy and convenient
To make recordkeeping easy and convenient, each month you'll receive a statement showing your total distributions, the date of investment, the shares acquired and the price per share, and the total number of shares you own.
How shares are purchased
The shares you acquire by reinvesting will either be purchased on the open market or newly issued by the Fund. If the shares are trading at or above net asset value at the time of valuation, the Fund will issue new shares at the greater of the net asset value or 95% of the then-current market price. If the shares are trading at less than net asset value, shares for your account will be purchased on the open market. If the Plan Agent begins purchasing Fund shares on the open market while shares are trading below net asset value, but the Fund's shares subsequently trade at or above their net asset value before the Plan Agent is able to complete its purchases, the Plan Agent may cease open-market purchases and may invest the uninvested portion of the distribution in newly-issued Fund shares at a price equal to the greater of the shares' net asset value or 95% of the shares' market value on the last business day immediately prior to the purchase date. Distributions received to purchase shares in the open market will normally be invested shortly after the distribution payment date. No interest will be paid on distributions awaiting reinvestment. Because the market price of the shares may increase before purchases are completed, the average purchase price per share may exceed the market price at the time of valuation, resulting in the acquisition of fewer shares than if the distribution had been paid in shares issued by the Fund. A pro rata portion of any applicable brokerage commissions on open market purchases will be paid by Plan participants. These commissions usually will be lower than those charged on individual transactions.
Flexible
You may change your distribution option or withdraw from the Plan at any time, should your needs or situation change. You can reinvest whether your shares are registered in your name, or in the name of a brokerage firm, bank, or other nominee. Ask your investment advisor if his or her firm will participate on your behalf. Participants whose shares are registered in the name of one firm may not be able to transfer the shares to another firm and continue to participate in the Plan. The Fund reserves the right to amend or terminate the Plan at any time. Although the Fund reserves the right to amend the Plan to include a service charge payable by the participants, there is no direct service charge to participants in the Plan at this time.
Call today to start reinvesting distributions
For more information on the Nuveen Automatic Reinvestment Plan or to enroll in or withdraw from the Plan, speak with your financial advisor or call us at (800) 257-8787.
Annual Investment Management Agreement Approval Process (Unaudited)
I. The Approval Process
The Board of Trustees of each Fund (each, a "Board" and each Trustee, a "Board Member"), including the Board Members who are not parties to the Funds' advisory or sub-advisory agreements or "interested persons" of any such parties (the "Independent Board Members", is responsible for overseeing the performance of the investment adviser and sub-adviser to the respective Fund and determining whether to continue such Fund's advisory agreement (the "Investment Management Agreement") between the Fund and Nuveen Fund Advisors, LLC (the "Adviser") and the sub-advisory agreement (the "Sub-Advisory Agreement" and, together with the Investment Management Agreement, the "Advisory Agreements") between the Adviser and Nuveen Asset Management, LLC (the "Sub-Adviser"). Following an initial term with respect to each Fund upon its commencement of operations, the Board is required to consider the continuation of the Advisory Agreements on an annual basis pursuant to the requirements of the Investment Company Act of 1940, as amended (the "1940 Act"). Accordingly, at an in-person meeting held on May 11-13, 2015 (the "May Meeting"), the Board, including a majority of the Independent Board Members, considered and approved the existing Advisory Agreements for the Funds.
In preparation for its considerations at the May Meeting, the Board received in advance of the meeting extensive materials prepared in connection with the review of the Advisory Agreements. The materials provided a broad range of information regarding the Funds, including, among other things, the nature, extent and quality of services provided by the Adviser and Sub-Adviser (the Adviser and Sub-Adviser are collectively, the "Fund Advisers" and each, a "Fund Adviser"); Fund performance including performance assessments against peers and the appropriate benchmark(s); fee and expense information of the Funds compared to peers; a description and assessment of shareholder service levels for the Funds; a summary of the performance of certain service providers; a review of product initiatives and shareholder communications; and profitability information of the Fund Advisers as described in further detail below. As part of its annual review, the Board also held a separate meeting on April 14-15, 2015 to review the Funds' investment performance and consider an analysis by the Adviser of the Sub-Adviser which generally evaluated the Sub-Adviser's investment team, investment mandate, organizational structure and history, investment philosophy and process, and the performance of the Funds, and any significant changes to the foregoing. During the review, the Independent Board Members asked questions of and requested additional information from management.
The Board considered that the evaluation process with respect to the Fund Advisers is an ongoing process that encompassed the information and knowledge gained throughout the year. The Board, acting directly or through its committees, met regularly during the course of the year and received information and considered factors at each meeting that would be relevant to its annual consideration of the Advisory Agreements, including information relating to Fund performance; Fund expenses; investment team evaluations; and valuation, compliance, regulatory and risk matters. In addition to regular reports, the Adviser provided special reports to the Board to enhance the Board's understanding on topics that impact some or all of the Nuveen funds and the Adviser (such as presentations on risk and stress testing; the new governance, risk and compliance system; cybersecurity developments; Nuveen fund accounting and reporting matters; regulatory developments impacting the investment company industry and the business plans or other matters impacting the Adviser). The Board also met with key investment personnel managing certain Nuveen fund portfolios during the year.
The Board had created several standing committees including the Open-End Funds Committee and the Closed-End Funds Committee to assist the full Board in monitoring and gaining a deeper insight into the distinctive business practices of closed-end and open-end funds. These Committees met prior to each quarterly Board meeting, and the Adviser provided presentations to these Committees permitting them to delve further into specific matters or initiatives impacting the respective product line.
Annual Investment Management Agreement Approval Process (Unaudited) (continued)
The Board also continued its program of seeking to have the Board Members or a subset thereof visit each sub-adviser to the Nuveen funds at least once over a multiple year rotation, meeting with key investment and business personnel. In this regard, the Independent Board Members made site visits to multiple equity and fixed-income investment teams of the Sub-Adviser in June 2014.
The Board considered the information provided and knowledge gained at these meetings and visits during the year when performing its annual review of the Advisory Agreements. The Independent Board Members also were assisted throughout the process by independent legal counsel. During the course of the year and during their deliberations regarding the review of advisory contracts, the Independent Board Members met with independent legal counsel in executive sessions without management present. The Independent Board Members also received a memorandum from independent legal counsel outlining the legal standards for their consideration of the proposed continuation of the Advisory Agreements. In addition, it is important to recognize that the management arrangements for the Nuveen funds are the result of many years of review and discussion between the Independent Board Members and Fund management and that the Board Members' conclusions may be based, in part, on their consideration of fee arrangements and other factors developed in previous years.
The Board took into account all factors it believed relevant with respect to each Fund, including, among other things: (a) the nature, extent and quality of the services provided by the Fund Advisers; (b) the investment performance of the Funds and Fund Advisers; (c) the advisory fees and costs of the services to be provided to the Funds and the profitability of the Fund Advisers; (d) the extent of any economies of scale; (e) any benefits derived by the Fund Advisers from the relationship with the Funds; and (f) other factors. Each Board Member may have accorded different weight to the various factors in reaching his or her conclusions with respect to the Advisory Agreements for each Fund. The Independent Board Members did not identify any single factor as all-important or controlling. The Independent Board Members' considerations were instead based on a comprehensive consideration of all the information presented. The principal factors considered by the Board and its conclusions are described below.
| A. | Nature, Extent and Quality of Services |
| | In evaluating the renewal of the Advisory Agreements, the Independent Board Members received and considered information regarding the nature, extent and quality of the applicable Fund Adviser's services provided to each respective Fund. The Board reviewed information regarding, among other things, each Fund Adviser's organization and business, the types of services that each Fund Adviser or its affiliates provided to the Funds, the performance record of the Funds (as described in further detail below), and any initiatives that had been undertaken on behalf of the closed-end product line. The Board recognized the high quality of services the Adviser had provided to the Funds over the years and the conscientiousness with which the Adviser provided these services. The Board also considered the improved capital structure of Nuveen Investments, Inc. ("Nuveen") (the parent of the Adviser) following the acquisition of Nuveen by TIAA-CREF in 2014 (the "TIAA-CREF Transaction"). |
| | |
| | With respect to the services, the Board noted the Funds were registered investment companies that operated in a regulated industry and considered the myriad of investment management, administrative, compliance, oversight and other services the Adviser provided to manage and operate the Funds. Such services included, among other things: (a) product management (such as analyzing ways to better position a Nuveen fund in the marketplace, setting dividends; maintaining relationships to gain access to distribution platforms; and providing shareholder communications); (b) fund administration (such as preparing tax returns and other tax compliance services, preparing regulatory filings and shareholder reports; managing fund budgets and expenses; overseeing a fund's various service providers and supporting and analyzing new and existing funds); (c) Board administration (such as supporting the Board and its committees, in relevant part, by organizing and administering the Board and committee meetings and preparing the necessary reports to assist the Board in its duties); (d) compliance (such as monitoring adherence to a fund's investment policies and procedures and applicable law; reviewing the compliance program periodically and developing new policies or updating existing compliance policies and procedures as considered necessary or appropriate; responding to regulatory requests; and overseeing compliance testing of the funds' sub-advisers); (e) legal support (such as preparing or reviewing fund registration statements, proxy statements and other necessary materials; interpreting regulatory requirements and compliance thereof; and maintaining applicable registrations); and (f) investment services |
| | |
| | (such as overseeing and reviewing the funds' sub-advisers and their investment teams; analyzing performance of the funds; overseeing investment and risk management; evaluating brokerage transactions and securities lending, overseeing the daily valuation process for portfolio securities and developing and recommending valuation policies and methodologies and changes thereto; reporting to the Board on various matters including performance, risk and valuation; and participating in fund development, leverage management, and the developing or interpreting of investment policies and parameters). With respect to closed-end funds, the Adviser also monitored asset coverage levels on leveraged funds, managed leverage, negotiated the terms of leverage, evaluated alternative forms and types of leverage, promoted an orderly secondary market for common shares and maintained an asset maintenance system for compliance with certain rating agency criteria. |
| | |
| | In its review, the Board considered information highlighting the various initiatives that the Adviser had implemented or continued during the last year to enhance its services to the Nuveen funds. The Board recognized that some of these initiatives are a result of a multi-year process. In reviewing the activities of 2014, the Board recognized the Adviser's continued focus on fund rationalization for closed-end funds through mergers, fund closures or repositioning the funds in seeking to enhance shareholder value, reduce costs, improve performance, eliminate fund overlap and better meet shareholder needs. The Board noted the Adviser's investment in additional staffing to strengthen and improve its services to the Nuveen funds, including with respect to risk management and valuation. The Board recognized that expanding the depth and range of its risk oversight activities had been a major priority for the Adviser in recent years, and the Adviser continued to add to the risk management team, develop additional risk management programs and create committees or other teams designated to oversee or evaluate certain risks, such as liquidity risk, enterprise risk, investment risk and cybersecurity risk. The Adviser had also continued to add to the valuation team, launched its centralized securities valuation system which is intended to provide for uniform pricing and reporting across the complex as the system continues to develop, continued to refine its valuation analysis and updated related policies and procedures and evaluated and assessed pricing services. The Board considered the Adviser's ongoing investment in information technology and operations and the various projects of the information technology team to support the continued growth and complexity of the Nuveen funds and increase efficiencies in their operations. The Board also recognized the Adviser's strong commitment to compliance and reviewed information reflecting the compliance group's ongoing activities to enhance its compliance system and refine its compliance procedures as well as the Chief Compliance Officer's report regarding the compliance team, the initiatives the team had undertaken in 2014 and proposed for 2015, the compliance functions and reporting process, the record of compliance with the policies and procedures and its supervision activities of other service providers. |
| | |
| | With respect to the closed-end funds, the Board recognized the extensive resources, expertise and efforts required to oversee and manage the various forms of leverage utilized by various funds, including the development of new forms of leverage to achieve cost savings and/or broaden the array of leverage structures available to the closed-end funds, the development of enhanced reports analyzing the impact of leverage on performance, and the development of new forms of tender option bond structures to address new regulatory requirements. The Board also noted the Adviser's continued capital management services conducting share repurchases and/or share issuances throughout the year and monitoring market conditions to capitalize on opportunities for the closed-end funds. The Board further recognized the Adviser's use of data systems to more effectively solicit shareholder participation when seeking shareholder approvals and to monitor flow trends in various closed-end funds. The Board considered Nuveen's continued commitment to supporting the closed-end fund product line by providing an extensive investor relations program that encompassed, among other things, maintaining and enhancing the closed-end fund website; participating in conferences and education seminars; enhancing the ability for investors to access information; preparing educational materials; and implementing campaigns to educate financial advisers and investors on topics related to closed-end funds and their strategies. |
| | |
| | As noted, the Adviser also oversees the Sub-Adviser who primarily provides the portfolio advisory services to the Funds. The Board recognized the skill and competency of the Adviser in monitoring and analyzing the performance of the Sub-Adviser and managing the sub-advisory relationship. In considering the Sub-Advisory Agreements and supplementing its prior knowledge, |
Annual Investment Management Agreement Approval Process (Unaudited) (continued)
| | the Board considered a current report provided by the Adviser analyzing, among other things, the Sub-Adviser's investment team and changes thereto, investment approach, organization and history, and assets under management, and the investment performance of each Fund. |
| | |
| | Based on their review, the Independent Board Members found that, overall, the nature, extent and quality of services provided to the Funds under each respective Advisory Agreement were satisfactory. |
| | |
| B. | The Investment Performance of the Funds and Fund Advisers |
| | The Board, including the Independent Board Members, considered the performance history of each Fund over various time periods. The Board reviewed reports, including an analysis of the Funds' performance and the applicable investment team. The Board reviewed, among other things, each Fund's investment performance both on an absolute basis and in comparison to peer funds (the "Performance Peer Group") and to recognized and/or customized benchmarks (i.e., generally benchmarks derived from multiple recognized benchmarks) for the quarter, one-, three-and five-year periods ending December 31, 2014, as well as performance information reflecting the first quarter of 2015. The Independent Board Members also recognized the importance of the secondary market trading levels for the closed-end fund shares and therefore devoted significant time and focus evaluating the premium and discount levels of the closed-end funds at each of the quarterly meetings throughout the year. At these prior meetings as well as the May Meeting, the Board reviewed, among other things, the respective closed-end fund's premium or discount to net asset value as of a specified date and over various periods as well as in comparison to the premium/discount average in its Lipper peer category. At the May Meeting and/or prior meetings, the Board also reviewed information regarding the key economic, market and competitive trends affecting the closed-end fund market and considered any actions periodically proposed by the Adviser to address the trading discounts of certain funds. The Independent Board Members considered the evaluation of the premium and discount levels of the closed-end funds (either at the Board level or through the Closed-End Funds Committee) to be a continuing priority in their oversight of the closed-end funds. In its review, the Board noted that it also reviewed Fund performance results at each of its quarterly meetings. |
| | |
| | In evaluating performance, the Board recognized several factors that may impact the performance data as well as the consideration given to particular performance data. |
| | |
| | • The performance data reflected a snapshot in time, in this case as of the end of the most recent calendar year or quarter. A different performance period, however, could generate significantly different results. |
| | |
| | • Long-term performance can be adversely affected by even one period of significant underperformance so that a single investment decision or theme had the ability to disproportionately affect long-term performance. |
| | |
| | • The investment experience of a particular shareholder in a fund would vary depending on when such shareholder invested in the fund, the class held (if multiple classes are offered in the fund) and the performance of the fund (or respective class) during that shareholder's investment period. |
| | |
| | • The Board recognized that the funds in the Performance Peer Group may differ somewhat from the Nuveen fund with which it is being compared and due to these differences, performance comparisons between certain of the Nuveen funds and their Performance Peer Groups may be inexact and the relevancy limited. The Board considered that management had classified the Performance Peer Group as low, medium and high in relevancy. The Board took the analysis of the relevancy of the Performance Peer Group into account when considering the comparative performance data. The Board also considered comparative performance of an applicable benchmark. While the Board was cognizant of the relative performance of a Fund's peer set and/or benchmark(s), the Board evaluated Fund performance in light of the respective Fund's investment objectives, investment parameters and guidelines and considered that the variations between the objectives and investment parameters or guidelines of the Fund with its peers and/or benchmarks result in differences in performance results. Further, for funds that |
| | utilized leverage, the Board understood that leverage during different periods could provide both benefits and risks to a portfolio as compared to an unlevered benchmark. |
| | |
| | With respect to any Nuveen funds for which the Board has identified performance concerns, the Board monitors such funds closely until performance improves, discusses with the Adviser the reasons for such results, considers those steps necessary or appropriate to address such issues, and reviews the results of any efforts undertaken. The Board is aware, however, that shareholders chose to invest or remain invested in a fund knowing that the Adviser manages the fund and knowing the fund's fee structure. |
| | |
| | In considering the performance data, the Independent Board Members noted the following with respect to the Funds: |
| | |
| | For Nuveen Arizona Premium Income Municipal Fund, the Board noted that the Fund ranked in its Performance Peer Group in the third quartile in the one-year period and the second quartile in the three-and five-year periods and outperformed its benchmark in the one-, three-and five-year periods. |
| | |
| | For Nuveen Michigan Quality Income Municipal Fund, the Board noted that the Fund ranked in its Performance Peer Group in the second quartile in the one-and five-year periods and the third quartile in the three-year period. The Board also noted that, although the Fund underperformed its benchmark in the five-year period, it outperformed its benchmark in the one-and three-year periods. |
| | |
| | For Nuveen Ohio Quality Income Municipal Fund, the Board noted that the Fund ranked in its Performance Peer Group in the second quartile in the one-year period and the third quartile in the three-and five-year periods. The Board also noted that the Fund outperformed its benchmark in the one-, three-and five-year periods. |
| | |
| | For Nuveen Texas Quality Income Municipal Fund, the Board noted that the Fund ranked in its Performance Peer Group in the third quartile for the one-, three-and five-year periods, and outperformed its benchmark in each of such periods. |
| | |
| | Based on their review, the Independent Board Members determined that each Fund's investment performance had been satisfactory. |
| | |
| C. | Fees, Expenses and Profitability |
| | |
| | 1. Fees and Expenses |
| | |
| | The Board evaluated the management fees and other fees and expenses of each Fund (expressed as a percentage of average net assets) in absolute terms and in comparison to the fee and expense levels of a comparable universe of funds (the "Peer Universe") selected by an independent third-party fund data provider. The Independent Board Members reviewed the methodology regarding the construction of the Peer Universe for each Fund. The Board reviewed, among other things, such Fund's gross management fees, net management fees and net expense ratios in absolute terms as well as compared to the average and median fee and expense levels of the Peer Universe. The Board noted that the net total expense ratios paid by investors in the Funds were the most representative of an investor's net experience. |
| | |
| | In reviewing the comparative fee and expense information, the Independent Board Members recognized that various factors such as the limited size and particular composition of the Peer Universe (including the inclusion of other Nuveen funds in the peer set); expense anomalies; changes in the funds comprising the Peer Universe from year to year; levels of reimbursement or fee waivers; the timing of information used; the differences in the type and use of leverage (with respect to closed-end funds); differences in services provided and differences in the states reflected in the Peer Universe (with respect to state municipal funds) can impact the comparative data limiting the usefulness of the data to help make a conclusive assessment of the Funds' fees and expenses. |
Annual Investment Management Agreement Approval Process (Unaudited) (continued)
| | In reviewing the fee schedule for a fund, the Independent Board Members also considered the fund-level and complex-wide breakpoint schedules (described in further detail below) and any fee waivers and reimbursements provided by Nuveen. In reviewing fees and expenses (excluding leverage costs and leveraged assets for the closed-end funds), the Board considered the expenses and fees to be higher if they were over 10 basis points higher, slightly higher if they were approximately 6 to 10 basis points higher, in line if they were within approximately 5 basis points higher than the peer average and below if they were below the peer average of the Peer Universe. In reviewing the reports, the Board noted that the majority of the Nuveen funds had a net expense ratio near or below their peer average. |
| | |
| | The Board noted that the Funds each had a net management fee in line with their peer averages and a net expense ratio below their peer averages. |
| | |
| | Based on their review of the fee and expense information provided, the Independent Board Members determined that each Fund's management fees (as applicable) to a Fund Adviser were reasonable in light of the nature, extent and quality of services provided to the Fund. |
| | |
| | 2. Comparisons with the Fees of Other Clients |
| | |
| | The Board considered information regarding the fees a Fund Adviser assessed to the Nuveen funds compared to that of other clients as described in further detail below. With respect to municipal funds, such other clients of a Fund Adviser may include municipal separately managed accounts and passively managed exchange traded funds (ETFs) sub-advised by the Sub-Adviser. |
| | |
| | The Board recognized that each Fund had an affiliated sub-adviser and therefore the overall Fund management fee can be divided into two components, the fee retained by the Adviser and the fee paid to the Sub-Adviser. In reviewing the nature of the services provided by the Adviser, including through its affiliated sub-advisers, the Board considered the range of advisory fee rates for retail and institutional managed accounts advised by Nuveen-affiliated sub-advisers. The Board also reviewed, among other things, the average fee the affiliated sub-advisers assessed such clients as well as the range of fee rates assessed to the different types of clients (such as retail, institutional and wrap accounts as well as non-Nuveen funds) applicable to such sub-advisers. |
| | |
| | In reviewing the comparative information, the Board also reviewed information regarding the differences between the Funds and the other clients, including differences in services provided, investment policies, investor profiles, compliance and regulatory requirements and account sizes. The Board recognized the breadth of services necessary to operate a registered investment company (as described above) and that, in general terms, the Adviser provided the administrative and other support services to the Funds and, although the Sub-Adviser may provide some of these services, the Sub-Adviser essentially provided the portfolio management services. In general, the Board noted that higher fee levels reflected higher levels of service provided by the Fund Adviser, increased investment management complexity, greater product management requirements and higher levels of business risk or some combination of the foregoing. The Independent Board Members considered the differences in structure and operations of separately managed accounts and hedge funds from registered funds and noted that the range of day-to-day services was not generally of the breadth required for the registered funds. Many of the additional administrative services provided by the Adviser were not required for institutional clients or funds sub-advised by a Nuveen-affiliated sub-adviser that were offered by other fund groups. The Independent Board Members also recognized that the management fee rates of the foreign funds advised by the Adviser may vary due to, among other things, differences in the client base, governing bodies, operational complexities and services covered by the management fee. Given the inherent differences in the various products, particularly the extensive services provided to the Funds, the Independent Board Members believed such facts justify the different levels of fees. |
| | 3. Profitability of Fund Advisers |
| | In conjunction with their review of fees, the Independent Board Members also considered the profitability of Nuveen for its advisory activities and its financial condition. The Independent Board Members reviewed, among other things, the adjusted operating margins for Nuveen for the last two calendar years, the revenues, expenses, net income (pre-tax and after-tax) and net revenue margins (pre-tax and after-tax) of Nuveen's managed fund advisory activities for the last two calendar years, the allocation methodology used by Nuveen in preparing the profitability data and a history of the adjustments to the methodology due to changes in the business over time. The Independent Board Members also reviewed the revenues, expenses, net income (pre-tax and after-tax) and revenue margin (pre-tax and post-tax) of the Adviser and, as described in further detail below, each affiliated sub-adviser for the 2014 calendar year. In reviewing the profitability data, the Independent Board Members noted the subjective nature of cost allocation methodologies used to determine profitability as other reasonable methods could also have been employed but yield different results. The Independent Board Members reviewed an analysis of the key drivers behind the changes in revenues and expenses that impacted profitability in 2014. The Independent Board Members recognized that Nuveen's net revenue margin from advisory activities for 2014 was consistent with 2013. The Independent Board Members also considered the profitability of Nuveen in comparison to the adjusted operating margins of other investment advisers with publicly available data and with comparable assets under management (based on asset size and asset composition) to Nuveen. The Independent Board Members noted that Nuveen's adjusted operating margins appeared to be reasonable in relation to such other advisers. The Independent Board Members, however, recognized the difficulty of making comparisons of profitability from fund investment advisory contracts as the information is not generally publicly available, the information for the investment advisers that was publicly available may not be representative of the industry and various other factors would impact the profitability data such as differences in services offered, business mix, expense methodology and allocations, capital structure and costs, complex size, and types of funds and other accounts managed. |
| | |
| | The Independent Board Members noted this information supplemented the profitability information requested and received during the year and noted that two Independent Board Members served as point persons to review the profitability analysis and methodologies employed, and any changes thereto, and to keep the Board apprised of such changes during the year. |
| | |
| | The Independent Board Members determined that Nuveen appeared to be sufficiently profitable to operate as a viable investment management firm and to honor its obligations as a sponsor of the Nuveen funds. The Independent Board Members noted the Adviser's continued expenditures to upgrade its investment technology and increase personnel and recognized the Adviser's continued commitment to its business to enhance the Adviser's capacity and capabilities in providing the services necessary to meet the needs of the Nuveen funds as they grow or change over time. The Independent Board Members also noted that the sub-advisory fees for the Nuveen funds are paid by the Adviser, however, the Board recognized that many of the sub-advisers, including the Sub-Adviser, are affiliated with Nuveen. The Independent Board Members also noted the increased resources and support available to Nuveen as well as an improved capital structure as a result of the TIAA-CREF Transaction. |
| | |
| | With respect to the Sub-Adviser, the Independent Board Members reviewed the Sub-Adviser's revenues, expenses and revenue margins (pre-and post-tax) for its advisory activities for the calendar year ended December 31, 2014. The Independent Board Members also reviewed profitability analysis reflecting the revenues, expenses and the revenue margin (pre-and post-tax) by asset type for the Sub-Adviser for the calendar year ended December 31, 2014. |
| | |
| | In evaluating the reasonableness of the compensation, the Independent Board Members also considered other amounts paid to a Fund Adviser by the Funds as well as indirect benefits (such as soft dollar arrangements), if any, the Fund Adviser and its affiliates received or were expected to receive that were directly attributable to the management of a Fund. See Section E below for additional information on indirect benefits a Fund Adviser may receive as a result of its relationship with the Funds. |
| | |
| | Based on their review, the Independent Board Members determined that the Adviser's and the Sub-Adviser's level of profitability was reasonable in light of the respective services provided. |
Annual Investment Management Agreement Approval Process (Unaudited) (continued)
| D. | Economies of Scale and Whether Fee Levels Reflect These Economies of Scale |
| | The Independent Board Members recognized that, as the assets of a particular fund or the Nuveen complex in the aggregate increase over time, economies of scale may be realized, and the Independent Board Members considered the extent to which the funds benefit from such economies of scale. Although the Independent Board Members recognized that economies of scale are difficult to measure, the Board recognized that one method to help ensure the shareholders share in these benefits is to include breakpoints in the management fee schedule reducing fee rates as asset levels grow. The Independent Board Members noted that, subject to certain exceptions, the management fees of the funds in the Nuveen complex are generally comprised of a fund-level component and complex-level component. Each component of the management fee for each Fund included breakpoints to reduce management fee rates of the Fund as the Fund grows and, as described below, as the Nuveen complex grows. The Independent Board Members noted that, in the case of closed-end funds, however, such funds may from time-to-time make additional share offerings, but the growth of their assets would occur primarily through the appreciation of such funds' investment portfolios. In addition to fund-specific breakpoint schedules which reduce the fee rates of a particular fund as its assets increase, the Independent Board Members recognized that the Adviser also passed on the benefits of economies of scale through the complex-wide fee arrangement which reduced management fee rates as assets in the fund complex reached certain levels. The complex-wide fee arrangement seeks to provide the benefits of economies of scale to fund shareholders when total fund complex assets increase, even if assets of a particular fund are unchanged or have decreased. The approach reflected the notion that some of Nuveen's costs were attributable to services provided to all its funds in the complex, and therefore all funds benefit if these costs were spread over a larger asset base. The Independent Board Members reviewed the breakpoint and complex-wide schedules and the fee reductions achieved as a result of such structures for the 2014 calendar year. |
| | |
| | The Independent Board Members further considered that as part of the TIAA-CREF Transaction, Nuveen agreed, for a period of two years from the date of the closing of the TIAA-CREF Transaction, not to increase contractual management fees for any Nuveen fund. The commitment would not limit or otherwise affect mergers or liquidations of any funds in the ordinary course. |
| | |
| | Based on their review, the Independent Board Members concluded that the current fee structure was acceptable and reflected economies of scale to be shared with shareholders when assets under management increase. |
| | |
| E. | Indirect Benefits |
| | The Independent Board Members received and considered information regarding potential "fall out" or ancillary benefits the respective Fund Adviser or its affiliates may receive as a result of its relationship with the Funds. With respect to closed-end funds, the Independent Board Members noted any revenues received by affiliates of the Adviser for serving as co-manager in initial public offerings of new closed-end funds. |
| | |
| | In addition to the above, the Independent Board Members considered whether the Fund Adviser received any benefits from soft dollar arrangements whereby a portion of the commissions paid by a Fund for brokerage may be used to acquire research that may be useful to the Fund Adviser in managing the assets of the Fund and other clients. The Funds' portfolio transactions are allocated by the Sub-Adviser. Accordingly, the Independent Board Members considered that the Sub-Adviser may benefit from research provided by broker-dealers executing portfolio transactions on behalf of the Funds. With respect to any fixed income securities, however, the Board recognized that such securities generally trade on a principal basis that does not generate soft dollar credits. Similarly, the Board recognized that any research received pursuant to soft dollar arrangements by the Sub-Adviser may also benefit the Funds and shareholders to the extent the research enhanced the ability of the Sub-Adviser to manage the Funds. The Independent Board Members noted that the Sub-Adviser's profitability may be somewhat lower if it had to acquire any such research services directly. |
| | |
| | Based on their review, the Independent Board Members concluded that any indirect benefits received by a Fund Adviser as a result of its relationship with the Funds were reasonable and within acceptable parameters. |
| F. | Other Considerations |
| | The Independent Board Members did not identify any single factor discussed previously as all-important or controlling. The Board Members, including the Independent Board Members, concluded that the terms of each Advisory Agreement were fair and reasonable, that the respective Fund Adviser's fees were reasonable in light of the services provided to each Fund and that the Advisory Agreements be renewed. |
Nuveen Investments:
Serving Investors for Generations
Since 1898, financial advisors and their clients have relied on Nuveen Investments to provide dependable investment solutions through continued adherence to proven, long-term investing principles. Today, we offer a range of high quality equity and fixed-income solutions designed to be integral components of a well-diversified core portfolio.
Focused on meeting investor needs.Nuveen Investments provides high-quality investment services designed to help secure the long-term goals of institutional and individual investors as well as the consultants and financial advisors who serve them. Nuveen Investments markets a wide range of specialized investment solutions which provide investors access to capabilities of its high-quality boutique investment afiliates—Nuveen Asset Management, Symphony Asset Management, NWQ Investment Management Company, Santa Barbara Asset Management, Tradewinds Global Investors, Winslow Capital Management and Gresham Investment Management. In total, Nuveen Investments managed more than $220 billion as of September 30, 2015.
Find out how we can help you.To learn more about how the products and services of Nuveen Investments may be able to help you meet your financial goals, talk to your financial advisor, or call us at (800) 257-8787. Please read the information provided carefully before you invest. Investors should consider the investment objective and policies, risk considerations, charges and expenses of any investment carefully. Where applicable, be sure to obtain a prospectus, which contains this and other relevant information. To obtain a prospectus, please contact your securities representative or Nuveen Investments, 333 W. Wacker Dr., Chicago, IL 60606. Please read the prospectus carefully before you invest or send money.
Learn more about Nuveen Funds at: www.nuveen.com/cef
Distributed by Nuveen Investments, LLC | 333 West Wacker Drive | Chicago, IL 60606 | www.nuveen.com | |
ESA-B-0815D 11049-INV-B-10/16
ITEM 2. CODE OF ETHICS.
Not applicable to this filing.
ITEM 3. AUDIT COMMITTEE FINANCIAL EXPERT.
Not applicable to this filing.
ITEM 4. PRINCIPAL ACCOUNTANT FEES AND SERVICES.
Not applicable to this filing.
ITEM 5. AUDIT COMMITTEE OF LISTED REGISTRANTS.
Not applicable to this filing.
ITEM 6. SCHEDULE OF INVESTMENTS.
(a) See Portfolio of Investments in Item 1.
(b) Not applicable.
ITEM 7. DISCLOSURE OF PROXY VOTING POLICIES AND PROCEDURES FOR CLOSED-END MANAGEMENT INVESTMENT COMPANIES.
Not applicable to this filing.
ITEM 8. PORTFOLIO MANAGERS OF CLOSED-END MANAGEMENT INVESTMENT COMPANIES.
Not applicable to this filing.
ITEM 9. PURCHASES OF EQUITY SECURITIES BY CLOSED-END MANAGEMENT INVESTMENT COMPANY AND AFFILIATED PURCHASERS.
Not applicable.
ITEM 10. SUBMISSION OF MATTERS TO A VOTE OF SECURITY HOLDERS.
There have been no material changes to the procedures by which shareholders may recommend nominees to the registrant's Board implemented after the registrant last provided disclosure in response to this Item.
ITEM 11. CONTROLS AND PROCEDURES.
| (a) | The registrant's principal executive and principal financial officers, or persons performing similar functions, have concluded that the registrant's disclosure controls and procedures (as defined in Rule 30a-3(c) under the Investment Company Act of 1940, as amended (the "1940 Act") (17 CFR 270.30a-3(c))) are effective, as of a date within 90 days of the filing date of this report that includes the disclosure required by this paragraph, based on their evaluation of the controls and procedures required by Rule 30a-3(b) under the 1940 Act (17 CFR 270.30a-3(b)) and Rules 13a-15(b) or 15d-15(b) under the Securities Exchange Act of 1934, as amended (the "Exchange Act")(17 CFR 240.13a-15(b) or 240.15d-15(b)). |
| (b) | There were no changes in the registrant's internal control over financial reporting (as defined in Rule 30a-3(d) under the 1940 Act (17 CFR 270.30a-3(d)) that occurred during the second fiscal quarter of the period covered by this report that has materially affected, or is reasonably likely to materially affect, the registrant's internal control over financial reporting. |
ITEM 12. EXHIBITS.
File the exhibits listed below as part of this Form.
| (a)(1) | Any code of ethics, or amendment thereto, that is the subject of the disclosure required by Item 2, to the extent that the registrant intends to satisfy the Item 2 requirements through filing of an exhibit: Not applicable to this filing. |
| (a)(2) | A separate certification for each principal executive officer and principal financial officer of the registrant as required by Rule 30a-2(a) under the 1940 Act (17 CFR 270.30a-2(a)) in the exact form set forth below: See Ex-99.CERT attached hereto. |
| (a)(3) | Any written solicitation to purchase securities under Rule 23c-1 under the 1940 Act (17 CFR 270.23c-1) sent or given during the period covered by the report by or on behalf of the registrant to 10 or more persons: Not applicable. |
| (b) | If the report is filed under Section 13(a) or 15(d) of the Exchange Act, provide the certifications required by Rule 30a-2(b) under the 1940 Act (17 CFR 270.30a-2(b)); Rule 13a-14(b) or Rule 15d-14(b) under the Exchange Act (17 CFR 240.13a-14(b) or 240.15d-14(b)), and Section 1350 of Chapter 63 of Title 18 of the United States Code (18 U.S.C. 1350) as an exhibit. A certification furnished pursuant to this paragraph will not be deemed "filed" for purposes of Section 18 of the Exchange Act (15 U.S.C. 78r), or otherwise subject to the liability of that section. Such certification will not be deemed to be incorporated by reference into any filing under the Securities Act of 1933 or the Exchange Act, except to the extent that the registrant specifically incorporates it by reference: See Ex-99.906 CERT attached hereto. |
SIGNATURES
Pursuant to the requirements of the Securities Exchange Act of 1934 and the Investment Company Act of 1940, the registrant has duly caused this report to be signed on its behalf by the undersigned, thereunto duly authorized.
(Registrant) Nuveen Arizona Premium Income Municipal Fund
By (Signature and Title) /s/ Kevin J. McCarthy
Kevin J. McCarthy
Vice President and Secretary
Pursuant to the requirements of the Securities Exchange Act of 1934 and the Investment Company Act of 1940, this report has been signed below by the following persons on behalf of the registrant and in the capacities and on the dates indicated.
By (Signature and Title) /s/ Gifford R. Zimmerman
Gifford R. Zimmerman
Chief Administrative Officer
(principal executive officer)
Date: November 5, 2015
By (Signature and Title) /s/ Stephen D. Foy
Stephen D. Foy
Vice President and Controller
(principal financial officer)