Life is Complex
Nuveen makes things e-simple.
It only takes a minute to sign up for e-Reports. Once enrolled, you'll receive an e-mail as soon as your Nuveen Investments Fund information is ready—no more waiting for delivery by regular mail. Just click on the link within the e-mail to see the report and save it on your computer if you wish.
Free e-Reports right to your e-mail!
www.investordelivery.com
If you receive your Nuveen Fund dividends and statements from your financial advisor or brokerage account.
or
www.nuveen.com/accountaccess
If you receive your Nuveen Fund dividends and statements directly from Nuveen.
Table of Contents
| Chairman's Letter to Shareholders | 4 |
| | |
| Portfolio Managers' Comments | 5 |
| | |
| Fund Leverage | 12 |
| | |
| Common Share Information | 14 |
| | |
| Risk Considerations | 16 |
| | |
| Performance Overview and Holding Summaries | 17 |
| | |
| Shareholder Meeting Report | 21 |
| | |
| Report of Independent Registered Public Accounting Firm | 23 |
| | |
| Portfolios of Investments | 24 |
| | |
| Statement of Assets and Liabilities | 54 |
| | |
| Statement of Operations | 55 |
| | |
| Statement of Changes in Net Assets | 56 |
| | |
| Statement of Cash Flows | 58 |
| | |
| Financial Highlights | 60 |
| | |
| Notes to Financial Statements | 66 |
| | |
| Additional Fund Information | 81 |
| | |
| Glossary of Terms Used in this Report | 82 |
| | |
| Reinvest Automatically, Easily and Conveniently | 84 |
| | |
| Board Members & Officers | 85 |
Chairman's Letter to Shareholders
Dear Shareholders,
The financial markets saw an increase in volatility over the past year. Global economic growth has continued to look fragile, led by China's ongoing slowdown and stagnant growth in Europe and Japan. By contrast, the U.S. economy's modest recovery stayed on pace. However, concerns about downside risks to U.S. economic growth were heightened in early 2016 amid a weak global growth outlook and churning stock markets. In addition to the challenging economic backdrop, the persistent decline of oil prices and a rally in the U.S. dollar dampened U.S. corporate earnings growth, further contributing to an uncertain outlook.
For most of 2015, the U.S. Federal Reserve postponed the first increase to its main policy interest rate, which tended to boost risky assets and weigh on longer-term bond yields at points throughout the year. However, volatility rose in the late spring amid Greece's turbulent negotiations with its European Union creditors. Not soon after, China's stock market crashed amid worries about its decelerating economy and a loss of confidence in its policy makers. Conditions turned more favorable in the fall, as the Fed delayed its rate hike again in October, the European Central Bank appeared poised for further easing and China administered another round of stimulus measures. By the time the Fed announced the rate hike in December, the move was widely expected and had very little market impact.
Although volatility spiked in early 2016, conditions have generally improved since mid-February 2016. Global growth expectations remain subdued, but investors have gained more confidence that the Fed's interest rate increases will be gradual, oil prices appear more stable, the U.S. dollar has weakened and the U.S. economy continues to look fairly resilient. Consumer spending, which represents roughly two-thirds of the economy, continues to be supported by the meaningful improvement in the labor market, wage growth and cheaper gas prices.
The global markets may continue seeing bouts of market turbulence this year. While short-term volatility can be uncomfortable for investors, these periods can also provide opportunities. The experienced investment professionals working for you at Nuveen continue to seek upside potential and manage downside risks, whether markets are rising or falling. We also encourage you to contact your financial advisor, who can help you develop a plan to weather short-term price swings, while remaining consistent with your investment goals, time horizon and risk tolerance.
On behalf of the other members of the Nuveen Fund Board, we look forward to continuing to earn your trust in the months and years ahead.
Sincerely,
William J. Schneider
Chairman of the Board
April 25, 2016
Portfolio Managers' Comments
Nuveen Arizona Premium Income Municipal Fund (NAZ)
Nuveen Michigan Quality Income Municipal Fund (NUM)
Nuveen Ohio Quality Income Municipal Fund (NUO)
Nuveen Texas Quality Income Municipal Fund (NTX)
These Funds feature portfolio management by Nuveen Asset Management, LLC, an affiliate of Nuveen Investments, Inc. Portfolio managers Michael S. Hamilton and Daniel J. Close, CFA, review U.S. economic and municipal market conditions at the national and state levels, key investment strategies and the twelve-month performance of these four Nuveen Funds. Michael assumed portfolio management responsibility for NAZ in 2011, while Dan has managed NUM, NUO and NTX since 2007.
What factors affected the U.S. economy and the national municipal bond market during the twelve-month reporting period ended February 29, 2016?
The U.S. economy grew at an overall moderate pace during the twelve-month reporting period. Harsh winter weather and a West coast port strike weighed on growth in the first quarter of 2015, but those factors proved temporary. Rebounding economic activity in the second quarter was followed by a mediocre advance in the latter half of the year. Real gross domestic product (GDP), which is the value of the goods and services produced by the nation's economy less the value of the goods and services used up in production, adjusted for price changes, increased at an annual rate of 1.4% in the fourth quarter of 2015, as reported by the "third" estimate of the Bureau of Economic Analysis, down from 2.0% in the third quarter.
The labor and housing markets were among the bright spots in the economy during the reporting period, as both showed steady improvement. As reported by the Bureau of Labor Statistics, the unemployment rate fell to 4.9% in February 2016 from 5.5% in February 2015, and job gains averaged slightly above 200,000 per month for the past twelve months. The S&P/Case-Shiller U.S. National Home Price Index, which covers all nine U.S. census divisions, recorded a 5.4% annual gain in January 2016 (most recent data available at the time this report was prepared). The 10-City and 20-City Composites reported year-over-year increases of 5.1% and 5.7%, respectively.
With GDP growth averaging around 2% for the previous four quarters, the U.S. economic recovery continued to underwhelm. Consumers, whose purchases comprise the largest component of the U.S. economy, benefited from lower gasoline prices and an improving jobs market. Pessimism about the economy's future and lackluster wage growth likely contributed to consumers' somewhat muted spending. The sharp decline in energy prices and tepid wage growth also weighed on inflation during this reporting period. The Consumer Price Index CPI rose 1.0% over the twelve-month period ended February 2016 on a seasonally adjusted basis, as reported by the U.S. Bureau of Labor Statistics. The core CPI (which excludes food and energy) increased 2.3% during the same period, the largest twelve-month gain since May 2012 and slightly above the Fed's unofficial longer term inflation objective of 2.0%.
Certain statements in this report are forward-looking statements. Discussions of specific investments are for illustration only and are not intended as recommendations of individual investments. The forward-looking statements and other views expressed herein are those of the portfolio managers as of the date of this report. Actual future results or occurrences may differ significantly from those anticipated in any forward-looking statements, and the views expressed herein are subject to change at any time, due to numerous market and other factors. The Funds disclaim any obligation to update publicly or revise any forward-looking statements or views expressed herein.Ratings shown are the highest rating given by one of the following national rating agencies: Standard & Poor's (S&P), Moody's Investors Service, Inc. (Moody's) or Fitch, Inc. (Fitch). Credit ratings are subject to change. AAA, AA, A and BBB are investment grade ratings; BB, B, CCC, CC, C and D are below investment grade ratings. Certain bonds backed by U.S. Government or agency securities are regarded as having an implied rating equal to the rating of such securities. Holdings designated N/R are not rated by these national rating agencies.
Bond insurance guarantees only the payment of principal and interest on the bond when due, and not the value of the bonds themselves, which will fluctuate with the bond market and the financial success of the issuer and the insurer. Insurance relates specifically to the bonds in the portfolio and not to the share prices of a Fund. No representation is made as to the insurers' ability to meet their commitments.
Refer to the Glossary of Terms Used in this Report for further definition of the terms used within this section.
Portfolio Managers' Comments (continued)
Business investment was also rather restrained. Corporate earnings growth slowed during 2015, reflecting an array of factors ranging from weakening demand amid sluggish U.S. and global growth to the impact of falling commodity prices and a strong U.S. dollar. Energy, materials and industrials companies were hit particularly hard by the downturn in natural resource prices, as well as the expectation of rising interest rates, which would make their debts more costly to service. With demand waning, companies, especially in the health care and technology sectors, looked to consolidations with rivals as a way to boost revenues. Merger and acquisition deals, both in the U.S. and globally, reached record levels in the calendar year 2015.
Although the current expansion continued to look subpar relative to past recoveries, the U.S. Federal Reserve (Fed) believed the economy was strong enough to begin the withdrawal of its stimulus policies. After winding down its bond buying program, known as quantitative easing, in October 2014, the Fed began telegraphing its intention to raise the target federal funds rate some time in 2015. The Fed had held the fed funds rate near zero since December 2008. However, the timing of its first rate hike was uncertain, particularly as the inflation rate stayed stubbornly low and signs of global economic weakness, notably from China, merited caution.
After delaying the rate change at each prior meeting in 2015, the Fed announced in December 2015 that it would raise its main policy interest rate by 0.25%. The news had a relatively muted impact on the financial markets, as the move was widely expected. Although the Fed continued to emphasize future rate increases would be gradual, uncertainties lingered. Given the fragility of the global economy and concerns about the U.S.'s lackluster growth, the Fed seemed more than likely to remain on hold in the near term. Not surprisingly, the Fed kept its target rate unchanged at its January policy meeting.
In the broad municipal bond market, yields ended the twelve-month reporting period slightly below where they started, although their downward path was not a straight line. For most of the period, the generally improved condition of the U.S. economy and expectation of rising interest rates propelled municipal bond yields higher. However, after the Fed's first rate hike, subsequent rate hikes seemed unlikely in the near future as the pace of the U.S. economic recovery remained below average and weakness lingered abroad, especially in Europe and China. This helped renew demand for municipal bonds, bolstering prices and weighing on yields (as bond prices and yields move in opposite directions) in the final months of the reporting period.
The municipal market's supply-demand balance was generally favorable over this reporting period. Issuance was unusually strong at the beginning of 2015, fueling concerns about potential oversupply conditions. Over the twelve months ended February 29, 2016, municipal bond issuance nationwide totaled $349.2 billion, an increase of 9.8% from the issuance for the twelve-month period ended February 28, 2015. To articulate, gross municipal bond nationwide issuance is up. The surge in gross issuance is due mostly to increased refunding deals as issuers have been actively and aggressively refunding their outstanding debt given the very low interest rate environment. In these transactions the issuers are issuing new bonds and taking the bond proceeds and redeeming (calling) old bonds. These refunding transactions have ranged from 40%-60% of total issuance over the past few years. Thus, the net issuance (all bonds issued less bonds redeemed) is actually much lower than the gross issuance. In fact, the total municipal bonds outstanding has actually declined in each of the past four calendar years. So, the gross is surging, but the net is not and this has been an overall positive technical factor on municipal bond investment performance.
At the same time, regulatory changes, increased risk aversion and expectations for rising interest rates have encouraged bond dealers, typically brokers and banks, to reduce the size of their inventories in recent years. By holding smaller amounts of bonds on their books, dealers seek to mitigate their exposure to bonds that could potentially be worth less or be more difficult to sell in the future. Banks have reduced their participation in the markets in order to hold fewer bonds on their balance sheets. As a result, there has been less liquidity in the marketplace, which contributed to periods of increased price volatility.
How were the economic and market environments in Arizona, Michigan, Ohio and Texas during the twelve-month reporting period ended February 29, 2016?
Arizona's economy continued its recovery overall after experiencing a severe housing market decline. Growth in leisure/hospitality has led to recent improvements in the state's employment picture. New home construction is building up steam as foreclosures have flattened to the national levels. Construction is also forecasted to strengthen substantially with the approval of a $2 billion, three-year
South Mountain Freeway Project connecting the East Valley and the West Valley. However, in the long term, Arizona is expected to outperform because of its strong population growth and investment in biotech, medical devices and health care. Gains in Arizona housing prices have been driven primarily by the Phoenix market, with the state's smaller metropolitan areas also showing progress. According to the S&P/Case-Shiller Index, housing prices in Phoenix rose 6.1% over the twelve months ended January 2016 (most recent data available at the time this report was prepared), compared with a 4.9% price increase nationally. In the job market, the Arizona unemployment rate dropped to a preliminary 5.5% as of February 2016, the lowest level since April 2008. The Governor's Proposed Fiscal Year 2017 Budget totals $9.5 billion, up 3% over last year's enacted budget. The proposal focuses spending on the economy with money directed to education, public safety and health care initiatives to stimulate new jobs. The Arizona Supreme Court Ruled that the state did not provide inflation adjustments in school funding during Fiscal Years 2010-2013 as required under voter approved Proposition 301. As a result, the state legislature voted to put Proposition 123 on the May 17, 2016 ballot to settle a five-year lawsuit over school funding. The measure, if approved, would allocate $3.5 billion for education funding, of which $1.4 billion would come from the General Fund and the remaining $2 billion from increasing distributions from the state land trust permanent funds to education over the next 10 years. In May 2015, Moody's upgraded Arizona's issuer rating at Aa2 and changed its outlook for the state to stable with positive outlook. S&P also upgraded the State of Arizona's issuer credit rating to AA from AA- and revised its outlook to stable from positive on May 20, 2015. During the twelve months ended February 29, 2016, municipal issuance in Arizona totaled $6.1 billion, a gross issuance decrease of 10.6% from the twelve months ended February 28, 2015.
Michigan's economic recovery has strengthened over the last few years helping the state to reach the lowest level of unemployment in a decade. As of February 2016, Michigan's unemployment rate was 4.8%, down from 5.9% a year prior. Favorably, the state's labor force participation rate has remained stable as unemployment has improved, indicating a real improvement in employment. Auto manufacturing and health care hiring remained strong throughout 2015, providing the majority of job growth. To a large extent, the Michigan economy remained tied to events in the auto industry, as the "Big Three" (General Motors, Ford and Chrysler) continued to rank among the state's five largest employers. Last year was the strongest for automotive sales since 2006, directly benefiting the state's economy. Overall, Michigan remained heavily reliant on manufacturing, which represented 13.8% of employment in the state, compared with 8.8% nationally. Following the peak in housing prices in mid-2006, home prices in Michigan declined dramatically and the inventory of foreclosed homes remained elevated in many of the state's hardest-hit metropolitan areas, including Detroit, Warren and Flint. Improvement in the state economy has brought some recuperation in the housing market. Last year home prices rose faster in Michigan than the national average. According to the S&P/Case-Shiller Index of 20 major metropolitan areas, housing prices in Detroit rose 7.1% over the twelve months ended January 2016 (most recent data available at the time this report was prepared), above the national average increase of 5.4%. On the fiscal front, Michigan's budgetary performance over the last two years has been impressive. For fiscal year 2016 Michigan's $54.5 billion budget represents about a 3% spending increase over the prior year and includes additional funds for transportation, education and a $95 million contribution to the state's budget stabilization/rainy day reserve fund. State revenues have seen annual improvement since 2011 driven by income and sales tax growth. As revenues have improved, the state has demonstrated a commitment to rebuild reserves. By fiscal year end 2016, reserve balances are projected to be over $600 million, approximately 3% of operating revenues. Michigan's improved financial and cash position has positively eliminated the need for cash flow borrowing. The state's proposed budget for Fiscal 2017 is essentially flat. As of April 2016 (subsequent to the close of this reporting period), Moody's and S&P rated Michigan general obligation (GO) debt at Aa1 and AA-, respectively. Both maintain a stable outlook on the state. Moody's upgraded the state to Aa1 from Aa2 in July 2015. S&P revised their outlook from positive to stable in March 2016. During the twelve months ended February 29, 2016, municipal issuance in Michigan totaled $11 billion, a gross issuance increase of 0.2% from the twelve months ended February 28, 2015.
Ohio's economy has been growing at a moderate rate for the past two to three years. The state's unemployment rate was 4.9% in February 2016, matching the 4.9% for the national average. Overall, manufacturing and health care have been key components of Ohio's stabilized economy. Manufacturing is the largest of Ohio's major employment sectors and the state continues to be a leading producer of steel and autos. Like other manufacturing-heavy states, Ohio tends to have a somewhat more cyclical economy than the nation as a whole. The state has experienced a small boom in oil and gas production, due largely to hydraulic fracturing in the Utica shale field in the Appalachian Basin. The recent decline in natural gas prices has caused the number of active rotary rigs to fall
Portfolio Managers' Comments (continued)
sharply. According to the S&P/Case- Shiller Index, housing prices in Cleveland rose 2.9% over the twelve months ended January 2016 (most recent data available at the time this report was prepared), compared with a 5.4% price increase nationally. On the fiscal front, Ohio has seen revenue recovery in line with its economic recovery. Fiscal year-to-date (through January 2016) General Fund tax receipts are 5.4% higher than the prior year-to-date collections. Ohio's Fiscal Year 2016-2017 biennial budget was enacted in June 2015, with fiscal 2016 state tax receipts estimated at $22.2 billion, or 3.5% above fiscal 2015 actuals. Ohio funded its Budget Stabilization Fund in 2013 to its statutory maximum for the first time since 2000. The current balance in the state's Budget Stabilization Fund is $2 billion, which is 6.4% of prior year general fund revenues. As of March 2016 (subsequent to the close of this reporting period), Moody's and S&P rated Ohio general obligation (GO) debt at Aa1 and AA+, respectively, with stable outlooks. For the twelve months ended February 29, 2016, municipal issuance in Ohio totaled $9.8 billion, a decrease of 10.7% compared with the twelve months ended February 28, 2015.
Texas is starting to see weakness from a sustained period of low oil and gas prices since the state economy exhibits elevated exposure to the mining sector. As of February 2016, the state's 4.4% unemployment rate was flat compared to February 2015 and below the February 2016 national unemployment rate of 4.9%. State employment surpassed pre-recession levels in September 2011 and overall state employment growth continued in February 2016, but mining and logging and manufacturing sectors experienced year-over-year declines as of February 2016. The largest year-over-year employment gains were seen in transportation and utility, leisure and hospitality, and education and health services. Texas' three largest non-government employment sectors, education and health services, professional and business services, and retail trade, represented approximately 56% of state employment. According to the S&P/Case-Shiller Index, housing prices in Dallas posted a year-over-year increase of 9.2% as of January 2016 (most recent data available at the time this report was prepared). On the fiscal front, the state is starting to see some weakness in tax collections and in October 2015 Texas Comptroller Glen Hegar lowered the state's 2016-17 biennium general revenue estimate by $2.6 billion (new projection $110.4 billion) based on sustained weakness in oil and gas prices. The state maintains a large Economic Stabilization Fund (ESF or rainy day fund) for use in times of declining revenues and as of January 31, 2016, the ESF totaled $9.6 billion or 8.7% of biennial forecasted revenues. S&P upgraded its Texas general obligation (GO) rating to AAA from AA+ in December 2013, while Moody's and Fitch rated Texas GO debt at Aaa and AAA, respectively. For the twelve months ended February 29, 2016, municipal issuance in Texas totaled $47.6 billion a 10.8% increase from the previous twelve months. For the most recent twelve months, Texas was ranked as the second largest state issuer only behind California.
What key strategies were used to manage these Funds during the twelve-month reporting period ended February 29, 2016?
The broad municipal bond market enjoyed positive performance during the twelve-month reporting period overall. In general, the municipal bonds of Arizona, Michigan and Ohio outperformed the national municipal bond market return during this reporting period, while Texas municipal bonds performed in line with the national market.
We continued to take a bottom-up approach to discovering sectors that appeared undervalued as well as individual credits that we believed had the potential to perform well over the long term. Our trading activity continued to focus on pursuing the Funds' investment objectives. Generally speaking, throughout this reporting period, the Funds maintained their overall positioning strategies in terms of duration and yield curve positioning, credit quality exposures and sector allocations. We've also continued to be more cautious in selecting individual securities. As investor demand for municipal securities has increased and created a slight supply-demand imbalance, we've started to see underwriters bring new issues to market that are structured with terms more favorable to the issuer and perhaps less advantageous to the investor than in the recent past. We believe this shift in the marketplace merits extra vigilance on our part to ensure that every credit considered for the portfolio offers adequate reward potential for the level of risk to the bondholder. In cases where our convictions have been less certain, we've sought compensation for the additional risk or have passed on the deal all together.
To keep the Funds fully invested, we continued to focus on purchasing bonds in areas of the market that we expected to perform well as the economy continued to improve. We emphasized intermediate and longer maturities, lower-rated credits and sectors offering higher yields. To fund these purchases, we generally reinvested the proceeds from called and maturing bonds. In some cases, we sold bonds that we believed had deteriorating fundamentals or could be traded for a better relative value, as well as selling short-dated, higher quality issues that we tend to hold over short timeframes as a source of liquidity.
Purchases in NAZ were mainly in bonds dated 15 years and longer from a range of sectors and subsectors including charter schools, utility systems, health care, excise tax revenue, waste water and airports. We also found selected opportunities in U.S. territory bonds, such as a Guam Water Works bond that we believe has positive credit fundamentals. We also began to replace the Fund's non-insured Virgin Islands credits with insured structures. The trading activity in our Virgin Islands exposure temporarily increased NAZ's weighting as of the end of this reporting period, but the weighting subsequently declined the following week, after the close of this reporting period, when we sold some more of the Fund's non-insured exposure. These territory bonds offered attractive yields with shorter durations, while maintaining tax exempt status in Arizona. NAZ's Puerto Rico exposure, however, was a different story. Given our concerns about the weakening fundamental outlook for the Commonwealth, we sold some Puerto Rico bonds during this reporting period.
In NUM and NUO, we bought a mix of intermediate- and long-dated bonds across a number of sectors, tapping opportunities in both the primary and secondary markets. All of our bond purchases in the Michigan, Ohio and Texas Funds represented in-state paper. In the Michigan Fund, we continued to try to diversify away from exposure to the City of Detroit and Wayne County, as well as sought to reinvest call proceeds. In the second half of the reporting period, we bought bonds issued for electric utilities, a tax increment financing district, dedicated tax, health care and a local general obligation (GO) bond. We also participated in a newly issued University of Michigan credit for NUM. The Texas Fund bought some dedicated tax bonds and shorter-dated state GOs, reinvesting the proceeds from called bonds and from selling a position in Austin Electric bonds.
Notable additions to the Ohio Fund in the second half of the period included a local GO issued for Dublin, Ohio, a Cleveland dedicated tax bond, a Northeast Ohio water and sewer credit, a Dayton International Airport bond and some state GOs issued for Ohio schools. To fund these purchases, we sold some of NUO's shorter-dated, higher quality bonds, as well as some lower coupon, longer-dated bonds that had performed well early in the period. Cash for new purchases also came from the proceeds of several called bonds during this reporting period.
In addition, earlier in the reporting period, we unwound a portfolio hedge in NUM, NUO and NTX that was managed with a credit default swap on the debt obligations of the U.S. territory of Puerto Rico. These swaps had a negligible impact on performance for the full reporting period.
As of February 29, 2016, NAZ, NUM and NUO continued to use inverse floating rate securities. We employ inverse floaters for a variety of reasons, including duration management, income enhancement and total return enhancement.
How did the Funds perform for the twelve-month reporting period ended February 29, 2016?
The tables in each Fund's Performance Overview and Holding Summaries section of this report provide the Funds' total returns for the one-year, five-year and ten-year periods ended February 29, 2016. Each Fund's returns on common share net asset value (NAV) are compared with the performance of corresponding market index and Lipper classification average.
Portfolio Managers' Comments (continued)
For the twelve months ended February 29, 2016, the total returns on common share NAV for these four Funds outperformed the returns for their respective state's S&P Municipal Bond Index as well as that of the national S&P Municipal Bond Index. NUM and NUO outperformed the average return for the Lipper Other States Municipal Debt Funds Classification, while NAZ and NTX underper-formed this Lipper average. Shareholders should note that the performance of the Lipper Other States classification represents the overall average of returns for funds from ten states with a wide variety of municipal market conditions, making direct comparisons less meaningful.
The main contributor to the Funds' relative performance during this reporting period was yield curve and duration positioning. We continued to overweight the longer parts of the yield curve with corresponding underweights to the shorter end of the curve, which resulted in longer durations than the municipal market in general. This positioning was advantageous in this reporting period as intermediate- and longer-dated bonds generally outperformed shorter-dated bonds across all four states.
The Funds' credit quality exposures produced mixed results over this reporting period. For NAZ, overweight allocations to non-rated and BBB rated bonds added to relative performance but the gains were modestly offset by the Fund's exposure to the "other" category, which includes CCC rated and defaulted bonds. The "other" category detracted largely due to NAZ's position in an Industrial Development Authority of the City of Phoenix bond issued for Brighter Choice Foundation Charter Middle Schools Projects for two charter schools, which was downgraded to a CCC rating when the school system's charter was not renewed and the schools shuttered in June 2015. We should note that the Brighter Choice position represents a small portion of NAZ's overall portfolio and the bond continued to make interest payments during this reporting period. We continue to monitor the situation as the bond proceeds through a debt workout plan. Ratings allocations in NUM and NUO were unfavorable to relative performance. The Michigan Fund was dampened by its underweight exposure to BBB rated bonds, a group which outperformed in Michigan during this reporting period, and its overweight exposure to AA rated bonds, a group which underperformed in the state. The Ohio Fund was hurt mainly by its underweight allocation in B rated credits. Within the Ohio municipal market, tobacco bonds dominate the B rated category, and the tobacco sector performed strongly over this reporting period. The Fund's tobacco sector limits preclude it from owning as much as the Ohio benchmark's weighting and therefore NUO holds an underweight allocation relative to the Ohio index. In NTX, an overweight to BBB rated credits was particularly beneficial to relative performance.
Sector allocations also resulted in different performance impacts for each Fund. NAZ's sector exposure was a relative detractor for performance, which was hampered by the dedicated tax (primarily due to Virgin Islands bonds), education (the previously noted Brighter Choice charter schools), industrial development revenue/pollution control revenue (IDR/PCR) and other revenue sectors. However, NAZ's pre-refunded/escrowed to maturity sector allocation somewhat aided performance, as bonds that were refunded during the period benefited from price appreciation, particularly those that were refunded to longer (five- to six-year) call structures. For NUM, the positive contribution from its health care allocation was offset by the negative effect of an overweight exposure to pre-refunded bonds, resulting in an overall neutral impact on relative performance. The Ohio Fund was helped by its sector strategy, largely due to an underweight in IDR/PCR bonds, a group which underperformed in the Ohio municipal market. NTX's overweight to the dedicated tax sector added value, as the sector outperformed in Texas, but an underweight to toll roads, another outperforming sector, detracted from relative results. Overall, NTX's sector allocations were a negative influence on relative performance for this reporting period.
Individual credit selection boosted relative performance for all four Funds during this reporting period. Generally, longer-dated credits were strong contributors to the Funds, particularly for NUM, NUO and NTX with allocations to zero coupon bonds, which typically have very long maturities. Bonds bought in June, July and August 2015, when yields were higher, also added relative gains. Additionally, the Arizona Fund benefited from some charter school holdings (with the exception of Brighter Choice, as discussed previously) and some advance refunded credits (as discussed earlier). NUM's selection in tobacco securities further bolstered its relative performance, while NUO gained from good-performing TOBs.
An Update Involving Puerto Rico
As noted in the Funds' previous shareholder reports, we continue to monitor situations in the broader municipal market for any impact on the Funds' holdings and performance: the ongoing economic problems of Puerto Rico is one such case. Puerto Rico's continued economic weakening, escalating debt service obligations, and long-standing inability to deliver a balanced budget led to multiple downgrades on its debt over the past two years. Puerto Rico has warned investors since 2014 that the island's debt burden may be unsustainable and the Commonwealth has been exploring various strategies to deal with this burden, including Chapter 9 bankruptcy, which is currently not available by law.
In terms of Puerto Rico holdings, shareholders should note that NUM, NUO and NTX had no exposure to Puerto Rico debt during this reporting period, while NAZ had an allocation of approximately 0.34%, for an asset-backed refunding bond. throughout the reporting period. The Puerto Rico credits offered higher yields, added diversification and triple exemption (i.e., exemption from most federal, state and local taxes). Puerto Rico general obligation debt is currently rated Caa2/CC/CC (below investment grade) by Moody's, S&P and Fitch, respectively, with negative outlooks.
.
Fund Leverage
IMPACT OF THE FUNDS' LEVERAGE STRATEGY ON PERFORMANCE
One important factor impacting the returns of the Funds relative to their comparative benchmarks was the Funds' use of leverage through their issuance of preferred shares and/or investments in inverse floating rate securities, which represent leveraged investments in underlying bonds. The Funds use leverage because our research has shown that, over time, leveraging provides opportunities for additional income, particularly in the recent market environment where short-term market rates are at or near historical lows, meaning that the short-term rates the Fund has been paying on its leveraging instruments have been much lower than the interest the Fund has been earning on its portfolio of long-term bonds that it has bought with the proceeds of that leverage. However, use of leverage also can expose the Fund to additional price volatility. When a Fund uses leverage, the Fund will experience a greater increase in its net asset value if the municipal bonds acquired through the use of leverage increase in value, but it will also experience a correspondingly larger decline in its net asset value if the bonds acquired through leverage decline in value, which will make the Fund's net asset value more volatile, and its total return performance more variable over time. In addition, income in levered funds will typically decrease in comparison to unlevered funds when short-term interest rates increase and increase when short-term interest rates decrease. Leverage had a positive impact on the performance of the Funds over this reporting period.
As of February 29, 2016, the Funds' percentages of leverage are shown in the accompanying table.
| | NAZ | | NUM | | NUO | | NTX | |
| Effective Leverage* | 35.58% | | 35.98% | | 35.00% | | 31.23% | |
| Regulatory Leverage* | 31.25% | | 32.42% | | 31.77% | | 31.23% | |
| * | Effective leverage is a Fund's effective economic leverage, and includes both regulatory leverage and the leverage effects of certain derivative and other investments in a Fund's portfolio that increase the Fund's investment exposure. Currently, the leverage effects of Tender Option Bond (TOB) inverse floater holdings are included in effective leverage values, in addition to any regulatory leverage. Regulatory leverage consists of preferred shares issued or borrowings of a Fund. Both of these are part of a Fund's capital structure. Regulatory leverage is subject to asset coverage limits set forth in the Investment Company Act of 1940. |
THE FUNDS' REGULATORY LEVERAGE
As of February 29, 2016, the Funds have issued and outstanding Institutional MuniFund Term Preferred (iMTP) Shares, Variable Rate MuniFund Term Preferred (VMTP) Shares and/or Variable Rate Demand Preferred (VRDP) Shares as shown in the accompanying table.
| | | | iMTP Shares | | | VMTP Shares | | | VRDP Shares | |
| Fund | | | Series | | | Shares Issued at Liquidation Preference | | | Series | | | Shares Issued at Liquidation Preference | | | Series | | | Shares Issued at Liquidation Preference | |
| NAZ | | | — | | $ | — | | | 2016 | | $ | 79,000,000 | | | — | | $ | — | |
| NUM | | | — | | $ | — | | | 2016 | | $ | 159,000,000 | | | — | | $ | — | |
| NUO | | | — | | $ | — | | | — | | $ | — | | | 1 | | $ | 148,000,000 | |
| NTX | | | 2018 | | $ | 72,000,000 | | | — | | $ | — | | | — | | $ | — | |
During the current reporting period, NTX refinanced all of its outstanding $70.92 million MuniFund Term Preferred (MTP) Shares with the proceeds from newly issued iMTP Shares.
Refer to Notes to Financial Statements, Note 4 – Fund Shares, Preferred Shares for further details on iMTP, MTP, VMTP and VRDP Shares and each Funds' respective transactions.
COMMON SHARE DISTRIBUTION INFORMATION
The following information regarding the Funds' distributions is current as of February 29, 2016. Each Fund's distribution levels may vary over time based on each Fund's investment activities and portfolio investment value changes.
During the current reporting period, each Fund's distributions to common shareholders were as shown in the accompanying table.
| | | Per Common Share Amounts |
| Monthly Distributions (Ex-Dividend Date) | | | NAZ | | | NUM | | | NUO | | | NTX | |
| March 2015 | | $ | 0.0665 | | $ | 0.0675 | | $ | 0.0700 | | $ | 0.0545 | |
| April | | | 0.0665 | | | 0.0675 | | | 0.0700 | | | 0.0545 | |
| May | | | 0.0665 | | | 0.0675 | | | 0.0700 | | | 0.0545 | |
| June | | | 0.0665 | | | 0.0640 | | | 0.0700 | | | 0.0545 | |
| July | | | 0.0665 | | | 0.0640 | | | 0.0700 | | | 0.0545 | |
| August | | | 0.0665 | | | 0.0640 | | | 0.0700 | | | 0.0545 | |
| September | | | 0.0665 | | | 0.0640 | | | 0.0670 | | | 0.0545 | |
| October | | | 0.0665 | | | 0.0640 | | | 0.0670 | | | 0.0545 | |
| November | | | 0.0665 | | | 0.0640 | | | 0.0670 | | | 0.0545 | |
| December | | | 0.0665 | | | 0.0620 | | | 0.0670 | | | 0.0545 | |
| January | | | 0.0665 | | | 0.0620 | | | 0.0670 | | | 0.0545 | |
| February 2016 | | | 0.0665 | | | 0.0620 | | | 0.0670 | | | 0.0545 | |
| Total Monthly Per Share Distributions | | $ | 0.7980 | | $ | 0.7725 | | $ | 0.8220 | | $ | 0.6540 | |
| Ordinary Income Distribution* | | $ | — | | $ | 0.0035 | | $ | 0.0040 | | $ | — | |
| Total Distributions from Net Investment Income | | $ | 0.7980 | | $ | 0.7760 | | $ | 0.8260 | | $ | 0.6540 | |
| Total Distributions from Long-Term Capital Gains* | | $ | — | | $ | 0.0047 | | $ | — | | $ | — | |
| Total Distributions | | $ | 0.7980 | | $ | 0.7807 | | $ | 0.8260 | | $ | 0.6540 | |
| | | | | | | | | | | | | | |
| Yields | | | | | | | | | | | | | |
| Market Yield** | | | 5.07 | % | | 5.31 | % | | 5.21 | % | | 4.46 | % |
| Taxable-Equivalent Yield** | | | 7.38 | % | | 7.71 | % | | 7.58 | % | | 6.19 | % |
| * | Distribution paid in December 2015. |
| ** | Market Yield is based on the Fund's current annualized monthly distribution divided by the Fund's current market price as of the end of the reporting period. Taxable-Equivalent Yield represents the yield that must be earned on a fully taxable investment in order to equal the yield of the Fund on an after-tax basis. It is based on a combined federal and state income tax rate of 31.3%, 31.1% and 31.3% for the Arizona, Michigan and Ohio Funds, respectively. The Texas Fund is based on a federal income tax rate of 28.0%. When comparing a Fund to investments that generate qualified dividend income, the Taxable-Equivalent Yield is lower. |
Each Fund in this report seeks to pay regular monthly dividends out of its net investment income at a rate that reflects its past and projected net income performance. To permit each Fund to maintain a more stable monthly dividend, the Fund may pay dividends at a rate that may be more or less than the amount of net income actually earned by the Fund during the period. If a Fund has cumulatively earned more than it has paid in dividends, it will hold the excess in reserve as undistributed net investment income (UNII) as part of the Fund's net asset value. Conversely, if a Fund has cumulatively paid in dividends more than it has earned, the excess will constitute a negative UNII that will likewise be reflected in the Fund's net asset value. Each Fund will, over time, pay all its net investment income as dividends to shareholders.
As of February 29, 2016, the Funds had positive UNII balances for tax purposes and positive UNII balances for financial reporting purposes.
All monthly dividends paid by each Fund during the current reporting period, were paid from net investment income. If a portion of the Fund's monthly distributions was sourced from or comprised of elements other than net investment income, including capital gains and/or a return of capital, shareholders would have received a notice to that effect. For financial reporting purposes, the composition and per share amounts of each Fund's dividends for the reporting period are presented in this report's Statement of Changes in Net Assets and Financial Highlights, respectively. For income tax purposes, distribution information for each Fund as of its most recent tax year end is presented in Note 6 – Income Tax Information within the Notes to Financial Statements of this report.
COMMON SHARE REPURCHASES
During August 2015, the Funds' Board of Trustees reauthorized an open-market share repurchase program, allowing each Fund to repurchase an aggregate of up to approximately 10% of its outstanding shares.
As of February 29, 2016, and since the inception of the Funds' repurchase programs, the Funds have cumulatively repurchased and retired common shares as shown in the accompanying table.
| | NAZ | | NUM | | NUO | | NTX | |
| Common shares cumulatively repurchased and retired | — | | 207,500 | | — | | — | |
| Common shares authorized for repurchase | 1,155,000 | | 2,085,000 | | 1,850,000 | | 1,005,000 | |
During the current reporting period, the following Fund repurchased and retired its common shares at a weighted average price per common share and a weighted average discount per common share as shown in the accompanying table.
| | | | NUM | |
| Common shares repurchased and retired | | | 22,500 | |
| Weighted average price per common share repurchased and retired | | $ | 13.22 | |
| Weighted average discount per common share repurchased and retired | | | 14.99 | % |
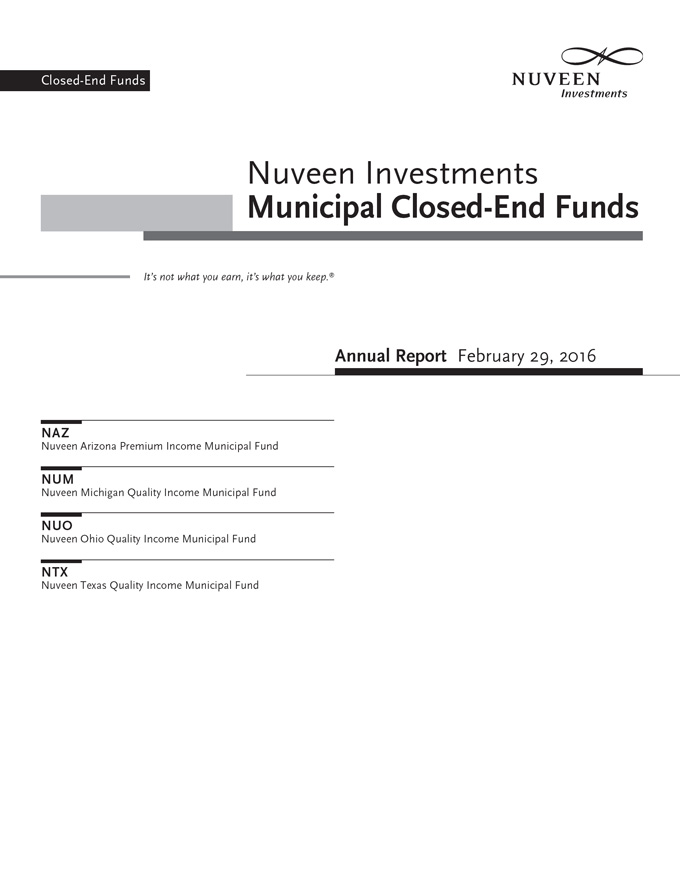
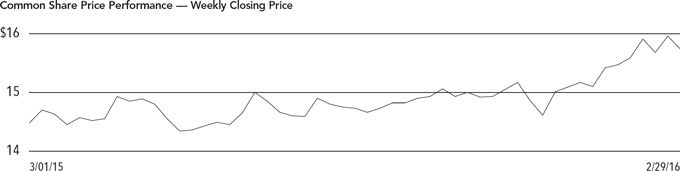
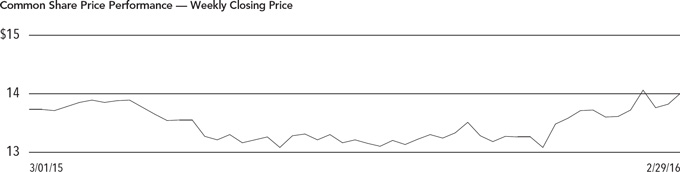
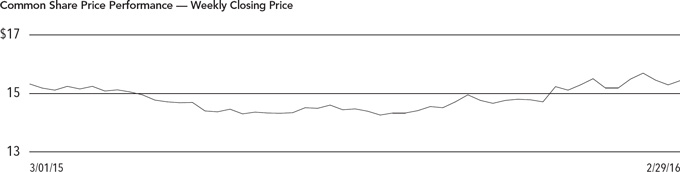
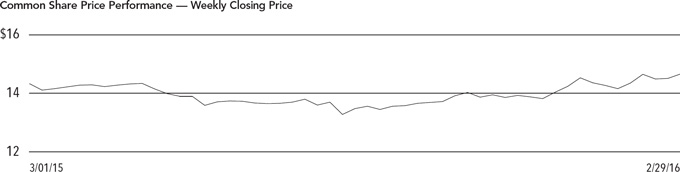
OTHER COMMON SHARE INFORMATION
As of February 29, 2016, and during the current reporting period, the Funds' common share prices were trading at a premium/ (discount) to their common share NAVs as shown in the accompanying table.
| | | | NAZ | | | NUM | | | NUO | | | NTX | | |
| Common share NAV | | $ | 15.01 | | $ | 15.93 | | $ | 17.16 | | $ | 15.81 | | |
| Common share price | | $ | 15.74 | | $ | 14.01 | | $ | 15.44 | | $ | 14.66 | | |
| Premium/(Discount) to NAV | | | 4.86 | % | | (12.05 | )% | | (10.02 | )% | | (7.27 | )% | |
| 12-month average premium/(discount) to NAV | | | 0.63 | % | | (9.85 | )% | | (13.80 | )% | | (11.86 | )% | |
Fund Shares are not guaranteed or endorsed by any bank or other insured depository institution, and are not federally insured by the Federal Deposit Insurance Corporation.
Nuveen Arizona Premium Income Municipal Fund (NAZ)
Nuveen Michigan Quality Income Municipal Fund (NUM)
Nuveen Ohio Quality Income Municipal Fund (NUO)
Nuveen Texas Quality Income Municipal Fund (NTX)
Investing in closed-end funds involves risk; principal loss is possible. There is no guarantee the Fund's investment objectives will be achieved. Closed-end fund shares may frequently trade at a discount or premium to their net asset value. Debt or fixed income securities such as those held by the Fund, are subject to market risk, credit risk, interest rate risk, derivatives risk, liquidity risk, and income risk. As interest rates rise, bond prices fall. Leverage increases return volatility and magnifies the Fund's potential return and its risks; there is no guarantee a fund's leverage strategy will be successful. State concentration makes the Fund more susceptible to local adverse economic, political, or regulatory changes affecting municipal bond issuers. These and other risk considerations such as inverse floater risk and tax risk are described in more detail on the Fund's web page at www.nuveen.com/NAZ, www.nuveen.com/NUM, www.nuveen.com/NUO, www.nuveen.com/NTX.
| NAZ | |
| | Nuveen Arizona Premium Income Municipal Fund |
| | Performance Overview and Holding Summaries as of February 29, 2016 |
Refer to the Glossary of Terms Used in this Report for further definition of the terms used within this section.
Average Annual Total Returns as of February 29, 2016
| | Average Annual |
| | 1-Year | 5-Year | 10-Year | |
| NAZ at Common Share NAV | 5.45% | 8.14% | 5.63% | |
| NAZ at Common Share Price | 15.59% | 11.01% | 6.43% | |
| S&P Municipal Bond Arizona Index | 3.92% | 5.68% | 4.87% | |
| S&P Municipal Bond Index | 3.78% | 5.63% | 4.68% | |
| Lipper Other States Municipal Debt Funds Classification Average | 5.82% | 8.13% | 5.49% | |
Past performance is not predictive of future results. Current performance may be higher or lower than the data shown. Returns do not reflect the deduction of taxes that shareholders may have to pay on Fund distributions or upon the sale of Fund shares. Returns at NAV are net of Fund expenses, and assume reinvestment of distributions. Comparative index and Lipper return information is provided for the Fund's shares at NAV only. Indexes and Lipper averages are not available for direct investment.
This data relates to the securities held in the Fund's portfolio of investments as of the end of the reporting period. It should not be construed as a measure of performance for the Fund itself. Holdings are subject to change.
Ratings shown are the highest rating given by one of the following national rating agencies: Standard & Poor's Group, Moody's Investors Service, Inc. or Fitch, Inc. Credit ratings are subject to change. AAA, AA, A and BBB are investment grade ratings; BB, B, CCC, CC, C and D are below-investment grade ratings. Certain bonds backed by U.S. Government or agency securities are regarded as having an implied rating equal to the rating of such securities. Holdings designated N/R are not rated by these national rating agencies.
Fund Allocation (% of net assets) | |
| Long-Term Municipal Bonds | 145.8% |
| Other Assets Less Liabilities | 1.3% |
| Net Assets Plus Floating Rate Obligations & VMTP Shares, at Liquidation Preference | 147.1% |
| Floating Rate Obligations | (1.6)% |
| VMTP Shares, at Liquidation Preference | (45.5)% |
| Net Assets | 100% |
| | |
Portfolio Composition (% of total investments) | |
| Tax Obligation/Limited | 24.6% |
| Education and Civic Organizations | 16.4% |
| Health Care | 13.7% |
| Utilities | 12.3% |
| Tax Obligation/General | 10.0% |
| U.S. Guaranteed | 9.5% |
| Water and Sewer | 9.1% |
| Other | 4.4% |
| Total | 100% |
| | |
Credit Quality (% of total investment exposure) | |
| AAA/U.S. Guaranteed | 19.3% |
| AA | 39.5% |
| A | 22.2% |
| BBB | 10.1% |
| BB or Lower | 2.5% |
| N/R (not rated) | 6.4% |
| Total | 100% |
| NUM | |
| | Nuveen Michigan Quality Income Municipal Fund |
| | Performance Overview and Holding Summaries as of February 29, 2016 |
Refer to the Glossary of Terms Used in this Report for further definition of the terms used within this section.
Average Annual Total Returns as of February 29, 2016
| | Average Annual |
| | 1-Year | 5-Year | 10-Year | |
| NUM at Common Share NAV | 5.97% | 8.17% | 5.75% | |
| NUM at Common Share Price | 7.15% | 8.27% | 5.01% | |
| S&P Municipal Bond Michigan Index | 4.40% | 6.10% | 4.87% | |
| S&P Municipal Bond Index | 3.78% | 5.63% | 4.68% | |
| Lipper Other States Municipal Debt Funds Classification Average | 5.82% | 8.13% | 5.49% | |
Past performance is not predictive of future results. Current performance may be higher or lower than the data shown. Returns do not reflect the deduction of taxes that shareholders may have to pay on Fund distributions or upon the sale of Fund shares. Returns at NAV are net of Fund expenses, and assume reinvestment of distributions. Comparative index and Lipper return information is provided for the Fund's shares at NAV only. Indexes and Lipper averages are not available for direct investment.
This data relates to the securities held in the Fund's portfolio of investments as of the end of the reporting period. It should not be construed as a measure of performance for the Fund itself. Holdings are subject to change.
Ratings shown are the highest rating given by one of the following national rating agencies: Standard & Poor's Group, Moody's Investors Service, Inc. or Fitch, Inc. Credit ratings are subject to change. AAA, AA, A and BBB are investment grade ratings; BB, B, CCC, CC, C and D are below-investment grade ratings. Certain bonds backed by U.S. Government or agency securities are regarded as having an implied rating equal to the rating of such securities. Holdings designated N/R are not rated by these national rating agencies.
Fund Allocation (% of net assets) | |
| Long-Term Municipal Bonds | 152.2% |
| Other Assets Less Liabilities | 1.5% |
| Net Assets Plus Floating Rate Obligations & VMTP Shares, at Liquidation Preference | 153.7% |
| Floating Rate Obligations | (5.7)% |
| VMTP Shares, at Liquidation Preference | (48.0)% |
| Net Assets | 100% |
| | |
Portfolio Composition (% of total investments) | |
| Tax Obligation/General | 23.1% |
| Health Care | 15.1% |
| Education and Civic Organizations | 13.4% |
| Tax Obligation/Limited | 11.5% |
| Water and Sewer | 10.1% |
| U.S. Guaranteed | 9.7% |
| Utilities | 9.0% |
| Other | 8.1% |
| Total | 100% |
| | |
Credit Quality (% of total investment exposure) | |
| AAA/U.S. Guaranteed | 22.9% |
| AA | 59.5% |
| A | 12.9% |
| BB or Lower | 3.6% |
| N/R (not rated) | 1.1% |
| Total | 100% |
| NUO | |
| | Nuveen Ohio Quality Income Municipal Fund |
| | Performance Overview and Holding Summaries as of February 29, 2016 |
Refer to the Glossary of Terms Used in this Report for further definition of the terms used within this section.
Average Annual Total Returns as of February 29, 2016
| | Average Annual |
| | 1-Year | 5-Year | 10-Year | |
| NUO at Common Share NAV | 5.95% | 7.98% | 5.93% | |
| NUO at Common Share Price | 5.96% | 6.89% | 4.77% | |
| S&P Municipal Bond Ohio Index | 5.23% | 6.56% | 4.81% | |
| S&P Municipal Bond Index | 3.78% | 5.63% | 4.68% | |
| Lipper Other States Municipal Debt Funds Classification Average | 5.82% | 8.13% | 5.49% | |
Past performance is not predictive of future results. Current performance may be higher or lower than the data shown. Returns do not reflect the deduction of taxes that shareholders may have to pay on Fund distributions or upon the sale of Fund shares. Returns at NAV are net of Fund expenses, and assume reinvestment of distributions. Comparative index and Lipper return information is provided for the Fund's shares at NAV only. Indexes and Lipper averages are not available for direct investment.
This data relates to the securities held in the Fund's portfolio of investments as of the end of the reporting period. It should not be construed as a measure of performance for the Fund itself. Holdings are subject to change.
Ratings shown are the highest rating given by one of the following national rating agencies: Standard & Poor's Group, Moody's Investors Service, Inc. or Fitch, Inc. Credit ratings are subject to change. AAA, AA, A and BBB are investment grade ratings; BB, B, CCC, CC, C and D are below-investment grade ratings. Certain bonds backed by U.S. Government or agency securities are regarded as having an implied rating equal to the rating of such securities. Holdings designated N/R are not rated by these national rating agencies.
Fund Allocation (% of net assets) | |
| Long-Term Municipal Bonds | 144.2% |
| Other Assets Less Liabilities | 2.4% |
| Net Assets Plus VRDP Shares, at Liquidation Preference | 146.6% |
| VRDP Shares, at Liquidation Preference | (46.6)% |
| Net Assets | 100% |
| | |
Portfolio Composition (% of total investments) | |
| Tax Obligation/Limited | 22.8% |
| Health Care | 21.0% |
| Tax Obligation/General | 15.2% |
| U.S. Guaranteed | 11.3% |
| Water and Sewer | 7.5% |
| Transportation | 6.9% |
| Education and Civic Organizations | 5.2% |
| Other | 10.1% |
| Total | 100% |
| | |
Credit Quality (% of total investment exposure) | |
| AAA/U.S. Guaranteed | 21.0% |
| AA | 49.8% |
| A | 18.8% |
| BBB | 5.5% |
| BB or Lower | 4.4% |
| N/R (not rated) | 0.5% |
| Total | 100% |
| NTX | |
| | Nuveen Texas Quality Income Municipal Fund |
| | Performance Overview and Holding Summaries as of February 29, 2016 |
Refer to the Glossary of Terms Used in this Report for further definition of the terms used within this section.
Average Annual Total Returns as of February 29, 2016
| | Average Annual |
| | 1-Year | 5-Year | 10-Year | |
| NTX at Common Share NAV | 4.89% | 7.35% | 5.55% | |
| NTX at Common Share Price | 7.02% | 4.39% | 5.03% | |
| S&P Municipal Bond Texas Index | 3.82% | 5.74% | 4.94% | |
| S&P Municipal Bond Index | 3.78% | 5.63% | 4.68% | |
| Lipper Other States Municipal Debt Funds Classification Average | 5.82% | 8.13% | 5.49% | |
Past performance is not predictive of future results. Current performance may be higher or lower than the data shown. Returns do not reflect the deduction of taxes that shareholders may have to pay on Fund distributions or upon the sale of Fund shares. Returns at NAV are net of Fund expenses, and assume reinvestment of distributions. Comparative index and Lipper return information is provided for the Fund's shares at NAV only. Indexes and Lipper averages are not available for direct investment.
This data relates to the securities held in the Fund's portfolio of investments as of the end of the reporting period. It should not be construed as a measure of performance for the Fund itself. Holdings are subject to change.
Ratings shown are the highest rating given by one of the following national rating agencies: Standard & Poor's Group, Moody's Investors Service, Inc. or Fitch, Inc. Credit ratings are subject to change. AAA, AA, A and BBB are investment grade ratings; BB, B, CCC, CC, C and D are below-investment grade ratings. Certain bonds backed by U.S. Government or agency securities are regarded as having an implied rating equal to the rating of such securities. Holdings designated N/R are not rated by these national rating agencies.
| Fund Allocation | |
| (% of net assets) | |
| Long-Term Municipal Bonds | 142.9% |
| Other Assets Less Liabilities | 2.5% |
| Net Assets Plus iMTP Shares, at Liquidation Preference | 145.4% |
| iMTP Shares, at Liquidation Preference | (454)% |
| Net Assets | 100% |
| | |
Portfolio Composition (% of total investments) | |
| Tax Obligation/General | 17.8% |
| Tax Obligation/Limited | 15.7% |
| Transportation | 12.2% |
| Utilities | 12.0% |
| Water and Sewer | 10.4% |
| U.S. Guaranteed | 9.6% |
| Education and Civic Organizations | 8.8% |
| Health Care | 8.0% |
| Other | 5.5% |
| Total | 100% |
| | |
Credit Quality (% of total investment exposure) | |
| AAA/U.S. Guaranteed | 24.2% |
| AA | 38.3% |
| A | 17.8% |
| BBB | 17.8% |
| BB or Lower | 1.6% |
| N/R (not rated) | 0.3% |
| Total | 100% |
| Shareholder Meeting Report |
The annual meeting of shareholders was held in the offices of Nuveen Investments on November 17, 2015 for NAZ, NUM, NUO and NTX; at this meeting the shareholders were asked to elect Board Members.
| | | | NAZ | | | NUM | |
| | | | Common and Preferred shares voting together as a class | | | Preferred Shares | | | Common and Preferred shares voting together as a class | | | Preferred Shares | |
| Approval of the Board Members was reached as follows: | | | | | | | | | | | | | |
| Jack B. Evans | | | | | | | | | | | | | |
| For | | | 10,241,508 | | | — | | | 17,993,572 | | | — | |
| Withhold | | | 231,444 | | | — | | | 508,612 | | | — | |
| Total | | | 10,472,952 | | | — | | | 18,502,184 | | | — | |
| William C. Hunter | | | | | | | | | | | | | |
| For | | | — | | | 790 | | | — | | | 1,590 | |
| Withhold | | | — | | | — | | | — | | | — | |
| Total | | | — | | | 790 | | | — | | | 1,590 | |
| William J. Schneider | | | | | | | | | | | | | |
| For | | | — | | | 790 | | | — | | | 1,590 | |
| Withhold | | | — | | | — | | | — | | | — | |
| Total | | | — | | | 790 | | | — | | | 1,590 | |
| Thomas S. Schreier, Jr. | | | | | | | | | | | | | |
| For | | | 10,236,423 | | | — | | | 18,028,763 | | | — | |
| Withhold | | | 236,529 | | | — | | | 473,421 | | | — | |
| Total | | | 10,472,952 | | | — | | | 18,502,184 | | | — | |
Shareholder Meeting Report (continued)
| | | | NUO | | | NTX | |
| | | | Common and Preferred shares voting together as a class | | | Preferred Shares | | | Common and Preferred shares voting together as a class | | | Preferred Shares | |
| Approval of the Board Members was reached as follows: | | | | | | | | | | | | | |
| Jack B. Evans | | | | | | | | | | | | | |
| For | | | 16,163,785 | | | — | | | 8,639,937 | | | — | |
| Withhold | | | 605,126 | | | — | | | 206,411 | | | — | |
| Total | | | 16,768,911 | | | — | | | 8,846,348 | | | — | |
| William C. Hunter | | | | | | | | | | | | | |
| For | | | — | | | 1,160 | | | — | | | 10,800 | |
| Withhold | | | — | | | — | | | — | | | — | |
| Total | | | — | | | 1,160 | | | — | | | 10,800 | |
| William J. Schneider | | | | | | | | | | | | | |
| For | | | — | | | 1,160 | | | — | | | 10,800 | |
| Withhold | | | — | | | — | | | — | | | — | |
| Total | | | — | | | 1,160 | | | — | | | 10,800 | |
| Thomas S. Schreier, Jr. | | | | | | | | | | | | | |
| For | | | 16,167,439 | | | — | | | 8,631,933 | | | — | |
| Withhold | | | 601,472 | | | — | | | 214,415 | | | — | |
| Total | | | 16,768,911 | | | — | | | 8,846,348 | | | — | |
Report of Independent Registered Public Accounting Firm
To the Board of Trustees and Shareholders of
Nuveen Arizona Premium Income Municipal Fund
Nuveen Michigan Quality Income Municipal Fund
Nuveen Ohio Quality Income Municipal Fund
Nuveen Texas Quality Income Municipal Fund:
We have audited the accompanying statements of assets and liabilities, including the portfolios of investments, of Nuveen Arizona Premium Income Municipal Fund, Nuveen Michigan Quality Income Municipal Fund, Nuveen Ohio Quality Income Municipal Fund and Nuveen Texas Quality Income Municipal Fund (the "Funds") as of February 29, 2016, and the related statements of operations for the year then ended, the statements of cash flows for the year then ended, and the statements of changes in net assets and the financial highlights for each of the years in the two-year period then ended. The financial highlights for the periods presented through February 28, 2014, were audited by other auditors whose report dated April 25, 2014, expressed an unqualified opinion on those financial highlights. These financial statements and financial highlights are the responsibility of the Funds' management. Our responsibility is to express an opinion on these financial statements and financial highlights based on our audits.
We conducted our audits in accordance with the standards of the Public Company Accounting Oversight Board (United States). Those standards require that we plan and perform the audit to obtain reasonable assurance about whether the financial statements and financial highlights are free of material misstatement. An audit includes examining, on a test basis, evidence supporting the amounts and disclosures in the financial statements. Our procedures included confirmation of securities owned as of February 29, 2016, by correspondence with the custodian and brokers or other appropriate auditing procedures. An audit also includes assessing the accounting principles used and significant estimates made by management, as well as evaluating the overall financial statement presentation. We believe that our audits provide a reasonable basis for our opinion.
In our opinion, the financial statements and financial highlights referred to above present fairly, in all material respects, the financial position of the Funds as of February 29, 2016, the results of their operations for the year then ended, their cash flows for the year then ended, and the changes in their net assets and the financial highlights for each of the years in the two-year period then ended, in conformity with U.S. generally accepted accounting principles.
/s/ KPMG LLP
Chicago, Illinois
April 27, 2016
| NAZ | | |
| | Nuveen Arizona Premium Income Municipal Fund | |
| | Portfolio of Investments | February 29, 2016 |
| | Principal Amount (000) | | Description (1) | Optional Call Provisions (2) | | Ratings (3) | | Value | |
| | | | LONG-TERM INVESTMENTS – 145.8% (100.0% of Total Investments) | | | | | | |
| | | | MUNICIPAL BONDS – 145.8% (100.0% of Total Investments) | | | | | | |
| | | | Consumer Staples – 0.5% (0.4% of Total Investments) | | | | | | |
| $ | 925 | | Puerto Rico, The Children's Trust Fund, Tobacco Settlement Asset-Backed Refunding Bonds, Series 2002, 5.375%, 5/15/33 | 4/16 at 100.00 | | BBB+ | $ | 941,641 | |
| | | | Education and Civic Organizations – 23.9% (16.4% of Total Investments) | | | | | | |
| | 1,500 | | Arizona Board of Regents, Arizona State University System Revenue Bonds, Refunding Green Series 2015A, 5.000%, 7/01/41 | 7/25 at 100.00 | | AA | | 1,744,035 | |
| | 3,480 | | Arizona Board of Regents, Arizona State University System Revenue Bonds, Refunding Series 2013A, 5.000%, 7/01/43 | No Opt. Call | | AA | | 3,993,577 | |
| | 1,500 | | Arizona Board of Regents, Arizona State University System Revenue Bonds, Series 2015D, 5.000%, 7/01/41 | 7/25 at 100.00 | | AA | | 1,746,690 | |
| | 2,815 | | Arizona Board of Regents, University of Arizona, SPEED Revenue Bonds, Stimulus Plan for Economic and Educational Development, Series 2014, 5.000%, 8/01/44 | 8/24 at 100.00 | | Aa3 | | 3,188,635 | |
| | 2,240 | | Arizona Board of Regents, University of Arizona, System Revenue Bonds, Tender Option Bond Trust 2015-XF0053, 17.938%, 6/01/20 (IF) | No Opt. Call | | Aa2 | | 3,551,005 | |
| | 1,400 | | Arizona Board of Regents, University of Arizona, SPEED Revenue Bonds, Stimulus Plan for Economic and Educational Development, Series 2013, 5.000%, 8/01/21 | No Opt. Call | | Aa3 | | 1,672,762 | |
| | 2,000 | | Glendale Industrial Development Authority, Arizona, Revenue Bonds, Midwestern University, Refunding Series 2007, 5.000%, 5/15/31 | 5/22 at 100.00 | | A– | | 2,245,520 | |
| | 3,775 | | Glendale Industrial Development Authority, Arizona, Revenue Bonds, Midwestern University, Refunding Series 2010, 5.125%, 5/15/40 | 5/20 at 100.00 | | A+ | | 4,243,289 | |
| | | | Industrial Development Authority of Phoenix, Arizona, Education Facility Revenue Bonds, Legacy Traditional Schools Projects, Series 2015: | | | | | | |
| | 315 | | 5.000%, 7/01/35 | No Opt. Call | | BB | | 325,427 | |
| | 300 | | 5.000%, 7/01/45 | No Opt. Call | | BB | | 304,227 | |
| | 440 | | Industrial Development Authority of Phoenix, Arizona, Education Facility Revenue Bonds, Villa Montessori, Inc. Projects, Series 2015, 3.250%, 7/01/25 | No Opt. Call | | N/R | | 446,807 | |
| | 1,875 | | Northern Arizona University, System Revenue Bonds, Refunding Series 2014, 5.000%, 6/01/40 | 6/24 at 100.00 | | A+ | | 2,133,263 | |
| | 910 | | Northern Arizona University, System Revenue Bonds, Series 2012, 5.000%, 6/01/41 | 6/21 at 100.00 | | A+ | | 1,002,028 | |
| | 70 | | Phoenix Industrial Development Authority, Arizona, Education Facility Revenue Bonds, Basis Schools, Inc. Projects, Series 2016A, 5.000%, 7/01/46 | 7/25 at 100.00 | | BB | | 72,258 | |
| | 900 | | Phoenix Industrial Development Authority, Arizona, Education Facility Revenue Bonds, Choice Academies Charter Schools Project, Series 2012, 5.625%, 9/01/42 | 9/22 at 100.00 | | BB+ | | 953,433 | |
| | 750 | | Phoenix Industrial Development Authority, Arizona, Education Facility Revenue Bonds, fbo Brighter Choice Foundation Charter Middle Schools Project, Albany, New York, Series 2012, 7.500%, 7/01/42 | 7/22 at 100.00 | | C | | 307,448 | |
| | 500 | | Phoenix Industrial Development Authority, Arizona, Education Facility Revenue Bonds, Legacy Traditional Schools Project, Series 2014A, 6.750%, 7/01/44 | 7/24 at 100.00 | | N/R | | 565,030 | |
| | 585 | | Phoenix Industrial Development Authority, Arizona, Education Revenue Bonds, Great Hearts Academies – Veritas Project, Series 2012, 6.300%, 7/01/42 | 7/21 at 100.00 | | BB | | 650,140 | |
| | 745 | | Phoenix Industrial Development Authority, Arizona, Education Revenue Bonds, Painted Rock Academy Charter School Project, Series 2012A, 7.500%, 7/01/42 | 7/20 at 100.00 | | N/R | | 787,741 | |
| | 3,675 | | Phoenix Industrial Development Authority, Arizona, Lease Revenue Bonds, Rowan University Project, Series 2012, 5.000%, 6/01/42 – AGM Insured (UB) (4) | 6/22 at 100.00 | | A | | 3,984,252 | |
| | 200 | | Pima County Industrial Development Authority, Arizona, Charter School Revenue Bonds, Desert Heights Charter School, Series 2014, 7.250%, 5/01/44 | 5/24 at 100.00 | | N/R | | 217,224 | |
| | Principal Amount (000) | | Description (1) | Optional Call Provisions (2) | | Ratings (3) | | Value | |
| | | | Education and Civic Organizations (continued) | | | | | | |
| $ | 745 | | Pima County Industrial Development Authority, Arizona, Education Revenue Bonds, Carden Traditional Schools Project, Series 2012, 7.500%, 1/01/42 | 1/22 at 100.00 | | B | $ | 715,416 | |
| | 1,000 | | Pima County Industrial Development Authority, Arizona, Education Revenue Bonds, Horizon Community Learning Center Project, Series 2000, 5.250%, 6/01/35 | 6/16 at 100.00 | | BBB– | | 1,002,500 | |
| | 500 | | Pima County Industrial Development Authority, Arizona, Education Revenue Bonds, Noah Webster Schools ? Mesa Project, Series 2015A, 5.000%, 12/15/34 | No Opt. Call | | BB+ | | 510,025 | |
| | | | Pima County Industrial Development Authority, Arizona, Education Revenue Bonds, Paradise Education Center Project, Series 2010: | | | | | | |
| | 745 | | 6.000%, 6/01/40 | 6/19 at 100.00 | | BB+ | | 775,456 | |
| | 550 | | 6.100%, 6/01/45 | 6/19 at 100.00 | | BB+ | | 573,282 | |
| | 655 | | Pima County Industrial Development Authority, Arizona, Educational Revenue Bonds, Paradise Education Center Charter School, Series 2006, 6.000%, 6/01/36 | 6/16 at 100.00 | | BB+ | | 657,175 | |
| | 1,000 | | Pima County Industrial Development Authority, Arizona, Educational Revenue Bonds, Valley Academy Charter School Project, Series 2008, 6.500%, 7/01/38 | 7/18 at 100.00 | | Baa3 | | 1,044,980 | |
| | 780 | | Student and Academic Services LLC, Arizona, Lease Revenue Bonds, Northern Arizona University Project, Series 2014, 5.000%, 6/01/39 – BAM Insured | 6/24 at 100.00 | | AA | | 892,070 | |
| | 250 | | Sun Devil Energy LLC, Arizona, Revenue Refunding Bonds, Arizona State University Project, Series 2008, 5.000%, 7/01/22 | No Opt. Call | | AA– | | 298,800 | |
| | 825 | | Yavapai County Industrial Development Authority, Arizona, Education Revenue Bonds, Arizona Agribusiness and Equine Center, Inc. Project, Series 2011, 7.875%, 3/01/42 | 3/21 at 100.00 | | BB+ | | 966,372 | |
| | 37,025 | | Total Education and Civic Organizations | | | | | 41,570,867 | |
| | | | Health Care – 19.9% (13.7% of Total Investments) | | | | | | |
| | 7,730 | | Arizona Health Facilities Authority, Hospital Revenue Bonds, Banner Health Systems, Series 2008D, 5.500%, 1/01/38 | 1/18 at 100.00 | | AA– | | 8,250,692 | |
| | 1,200 | | Arizona Health Facilities Authority, Hospital Revenue Bonds, Banner Health Systems, Series 2014A, 5.000%, 1/01/44 | 1/24 at 100.00 | | AA– | | 1,354,872 | |
| | 5,100 | | Arizona Health Facilities Authority, Hospital System Revenue Bonds, Phoenix Children's Hospital, Refunding Series 2012A, 5.000%, 2/01/42 | 2/22 at 100.00 | | BBB+ | | 5,524,269 | |
| | | | Arizona Health Facilities Authority, Revenue Bonds, Scottsdale Lincoln Hospitals Project, Series 2014A: | | | | | | |
| | 3,000 | | 5.000%, 12/01/39 | 12/24 at 100.00 | | A2 | | 3,413,040 | |
| | 2,860 | | 5.000%, 12/01/42 | 12/24 at 100.00 | | A2 | | 3,249,102 | |
| | 7,560 | | Maricopa County Industrial Development Authority, Arizona, Health Facility Revenue Bonds, Catholic Healthcare West, Series 2007A, 5.250%, 7/01/32 | 7/17 at 100.00 | | A | | 7,865,423 | |
| | 1,120 | | Scottsdale Industrial Development Authority, Arizona, Hospital Revenue Bonds, Scottsdale Healthcare, Series 2006C. Re-offering, 5.000%, 9/01/35 – AGC Insured | 9/20 at 100.00 | | AA | | 1,246,190 | |
| | | | Yavapai County Industrial Development Authority, Arizona, Hospital Revenue Bonds, Yavapai Regional Medical Center, Series 2013A: | | | | | | |
| | 210 | | 5.000%, 8/01/19 | No Opt. Call | | Baa1 | | 229,337 | |
| | 1,000 | | 5.250%, 8/01/33 | 8/23 at 100.00 | | Baa1 | | 1,127,770 | |
| | | | Yuma Industrial Development Authority, Arizona, Hospital Revenue Bonds, Yuma Regional Medical Center, Series 2014A: | | | | | | |
| | 1,000 | | 5.000%, 8/01/22 | No Opt. Call | | A– | | 1,184,750 | |
| | 1,000 | | 5.250%, 8/01/32 | 8/24 at 100.00 | | A– | | 1,162,700 | |
| | 31,780 | | Total Health Care | | | | | 34,608,145 | |
| | | | Long-Term Care – 0.8% (0.5% of Total Investments) | | | | | | |
| | 495 | | Arizona Health Facilities Authority, Health Care Facilities Revenue Bonds, The Beatitudes Campus Project, Series 2006, 5.100%, 10/01/22 | 10/16 at 100.00 | | N/R | | 497,465 | |
| | 780 | | Tempe Industrial Development Authority, Arizona, Revenue Bonds, Friendship Village of Tempe Project, Refunding Series 2012A, 6.000%, 12/01/32 | 12/21 at 100.00 | | N/R | | 848,983 | |
| | 1,275 | | Total Long-Term Care | | | | | 1,346,448 | |
| NAZ | Nuveen Arizona Premium Income Municipal Fund | |
| | Portfolio of Investments (continued) | February 29, 2016 |
| | Principal Amount (000) | | Description (1) | Optional Call Provisions (2) | | Ratings (3) | | Value | |
| | | | Tax Obligation/General – 14.6% (10.0% of Total Investments) | | | | | | |
| $ | 2,500 | | Chandler, Arizona, General Obligation Bonds, Refunding Series 2014, 5.000%, 7/01/24 | No Opt. Call | | AAA | $ | 3,168,875 | |
| | | | Dysart Unified School District Number 89, Maricopa County, Arizona, General Obligation Bonds, Refunding Series 2014: | | | | | | |
| | 1,000 | | 5.000%, 7/01/26 | 7/24 at 100.00 | | AA– | | 1,211,410 | |
| | 525 | | 5.000%, 7/01/27 | 7/24 at 100.00 | | AA– | | 630,887 | |
| | 2,140 | | El Mirage, Arizona, General Obligation Bonds Series 2012, 5.000%,
7/01/42 – AGM Insured | 7/22 at 100.00 | | AA | | 2,359,329 | |
| | 1,000 | | Maricopa County Elementary School District 83 Cartwright, Arizona, General Obligation Bonds, School Improvement, Project 2010, Series 2011A, 5.375%, 7/01/30 – AGM Insured | 7/21 at 100.00 | | AA | | 1,170,350 | |
| | 1,020 | | Maricopa County School District 6, Arizona, General Obligation Refunding Bonds, Washington Elementary School, Series 2002A, 5.375%,
7/01/16 – AGM Insured | No Opt. Call | | AA | | 1,037,340 | |
| | 775 | | Maricopa County School District 79 Litchfield Elementary, Arizona, General Obligation Bonds, Series 2011, 5.000%, 7/01/23 | 7/21 at 100.00 | | Aa2 | | 923,754 | |
| | 1,370 | | Pima County Continental Elementary School District 39, Arizona, General Obligation Bonds, Series 2011A, 6.000%, 7/01/30 – AGM Insured | 7/21 at 100.00 | | AA | | 1,647,302 | |
| | 2,895 | | Pima County Unified School District 12 Sunnyside, Arizona, General Obligation Bonds, School Improvement Project 2011, Series 2014D, 5.000%,
7/01/34 – AGM Insured | 7/24 at 100.00 | | AA | | 3,351,628 | |
| | 1,750 | | Pima County Unified School District 6, Marana, Arizona, General Obligation Bonds, School Improvement Project 2010 Series 2011A, 5.000%, 7/01/25 | 7/21 at 100.00 | | A+ | | 2,007,880 | |
| | 1,000 | | Pima County Unified School District 8 Flowing Wells, Arizona, General Obligation Bonds, Series 2011B, 5.375%, 7/01/29 | 7/21 at 100.00 | | A+ | | 1,153,980 | |
| | | | Scottsdale, Arizona, General Obligation Bonds, Preserve Acquisition Series 1999: | | | | | | |
| | 1,310 | | 5.000%, 7/01/32 | 7/21 at 100.00 | | AAA | | 1,520,648 | |
| | 1,360 | | 5.000%, 7/01/33 | 7/21 at 100.00 | | AAA | | 1,575,682 | |
| | 1,705 | | 5.000%, 7/01/34 | 7/21 at 100.00 | | AAA | | 1,970,707 | |
| | | | Western Maricopa Education Center District 402, Maricopa County, Arizona, General Obligation Bonds, School Improvement Project 2012, Series 2014B: | | | | | | |
| | 715 | | 4.500%, 7/01/33 | 7/24 at 100.00 | | AA– | | 812,219 | |
| | 665 | | 4.500%, 7/01/34 | 7/24 at 100.00 | | AA– | | 752,760 | |
| | 21,730 | | Total Tax Obligation/General | | | | | 25,294,751 | |
| | | | Tax Obligation/Limited – 35.9% (24.6% of Total Investments) | | | | | | |
| | 2,310 | | Arizona Sports and Tourism Authority, Tax Revenue Bonds, Multipurpose Stadium Facility Project, Refunding Senior Series 2012A, 5.000%, 7/01/36 | 7/22 at 100.00 | | A1 | | 2,484,936 | |
| | | | Arizona State Transportation Board, Highway Revenue Bonds, Refunding Subordinate Series 2011A: | | | | | | |
| | 1,275 | | 5.000%, 7/01/16 | No Opt. Call | | AA+ | | 1,295,757 | |
| | 1,025 | | 5.000%, 7/01/36 | 7/21 at 100.00 | | AA+ | | 1,184,736 | |
| | 1,000 | | Buckeye, Arizona, Excise Tax Revenue Obligations, Series 2015, 5.000%, 7/01/37 | 7/25 at 100.00 | | AA– | | 1,150,380 | |
| | | | Buckeye, Arizona, Festival Ranch Community Facilities District General Obligation Bonds, Series 2012: | | | | | | |
| | 345 | | 5.000%, 7/15/27 – BAM Insured | 7/22 at 100.00 | | AA | | 381,577 | |
| | 1,085 | | 5.000%, 7/15/31 – BAM Insured | 7/22 at 100.00 | | AA | | 1,178,560 | |
| | 586 | | Centerra Community Facilities District, Goodyear, Arizona, General Obligation Bonds, Series 2005, 5.500%, 7/15/29 | 4/16 at 100.00 | | N/R | | 586,457 | |
| | 1,210 | | Eastmark Community Facilities District 1, Mesa, Arizona, General Obligation Bonds, Series 2015, 5.000%, 7/15/39 | 7/25 at 100.00 | | N/R | | 1,237,382 | |
| | 494 | | Eastmark Community Facilities District 1, Mesa, Arizona, Special Assessment Revenue Bonds, Assessment District 1, Series 2013, 5.250%, 7/01/38 | 7/23 at 100.00 | | N/R | | 522,445 | |
| | | | Estrella Mountain Ranch Community Facilities District, Arizona, Special Assessment Bonds, Montecito Assessment District, Series 2007: | | | | | | |
| | 423 | | 5.700%, 7/01/27 | 1/17 at 100.00 | | N/R | | 431,126 | |
| | 454 | | 5.800%, 7/01/32 | 1/17 at 100.00 | | N/R | | 461,318 | |
| | 580 | | Estrella Mountain Ranch Community Facilities District, Goodyear, Arizona, Special Assessment Lien Bonds, Series 2001A, 7.875%, 7/01/25 | 4/16 at 100.00 | | N/R | | 582,036 | |
| | Principal Amount (000) | | Description (1) | Optional Call Provisions (2) | | Ratings (3) | | Value | |
| | | | Tax Obligation/Limited (continued) | | | | | | |
| $ | 1,500 | | Goodyear, Arizona, Community Facilities General District 1, Arizona, General Obligation Refunding Bonds, Series 2013, 5.000%, 7/15/23 | No Opt. Call | | A– | $ | 1,750,635 | |
| | | | Government of Guam, Business Privilege Tax Bonds, Series 2011A: | | | | | | |
| | 510 | | 5.000%, 1/01/31 | 1/22 at 100.00 | | A | | 568,869 | |
| | 200 | | 5.125%, 1/01/42 | 1/22 at 100.00 | | A | | 219,344 | |
| | 1,500 | | Government of Guam, Business Privilege Tax Bonds, Series 2012B-1, 5.000%, 1/01/37 | 1/22 at 100.00 | | A | | 1,643,535 | |
| | 1,550 | | Greater Arizona Development Authority, Infrastructure Revenue Bonds, Series 2006A, 5.000%, 8/01/23 – NPFG Insured | 8/16 at 100.00 | | AA– | | 1,580,318 | |
| | 250 | | La Paz County, Arizona, Excise Tax Revenue Bonds, Judgement Series 2011A, 4.750%, 7/01/36 | 7/17 at 100.00 | | AA | | 260,030 | |
| | 1,425 | | Marana, Arizona, Pledged Excise Tax Revenue Bonds, Refunding Series 2013, 5.000%, 7/01/33 | 7/23 at 100.00 | | AA | | 1,634,675 | |
| | 2,644 | | Marana, Arizona, Tangerine Farms Road Improvement District Revenue Bonds, Series 2006, 4.600%, 1/01/26 | 7/16 at 100.00 | | A2 | | 2,678,636 | |
| | 680 | | Marley Park Community Facilities District, City of Surprise, Arizona, Limited Tax General Obligation Bonds, Series 2008 (Bank Qualified), 6.100%, 7/15/32 | 7/17 at 100.00 | | N/R | | 693,960 | |
| | 1,160 | | Merrill Ranch Community Facilities District 1, Florence, Arizona, General Obligation Bonds, Series 2008A, 7.400%, 7/15/33 | 7/18 at 100.00 | | BBB– | | 1,248,148 | |
| | 300 | | Page, Arizona, Pledged Revenue Bonds, Refunding Series 2011, 5.000%, 7/01/26 | 7/21 at 100.00 | | AA– | | 345,189 | |
| | 1,500 | | Palm Valley Community Facility District 3, Goodyear, Arizona, General Obligation Bonds, Series 2006, 5.300%, 7/15/31 | 7/16 at 100.00 | | N/R | | 1,505,475 | |
| | 1,000 | | Palm Valley Community Facility District 3, Goodyear, Arizona, Limited Tax General Obligation Bonds, Series 2007, 5.800%, 7/15/32 | 7/17 at 100.00 | | N/R | | 1,016,570 | |
| | 400 | | Parkway Community Facilities District 1, Prescott Valley, Arizona, General Obligation Bonds, Series 2006, 5.350%, 7/15/31 | 7/16 at 100.00 | | N/R | | 401,236 | |
| | 1,010 | | Phoenix Civic Improvement Corporation, Arizona, Transit Excise Tax Revenue Refunding Bonds, Light Rail Project, Series 2013, 5.000%, 7/01/20 | No Opt. Call | | AA | | 1,182,518 | |
| | 2,500 | | Phoenix Industrial Development Authority, Arizona, Education Facility Revenue Bonds, JMF-Higley 2012 LLC Project, Series 2012, 5.000%, 12/01/36 | No Opt. Call | | A | | 2,753,775 | |
| | 580 | | Phoenix Mesa Gateway Airport Authority, Arizona, Special Facility Revenue Bonds, Mesa Project, Series 2012, 5.000%, 7/01/38 (Alternative Minimum Tax) | 7/22 at 100.00 | | AA+ | | 634,914 | |
| | 1,610 | | Pinal County Industrial Development Authority, Arizona, Correctional Facilities Contract Revenue Bonds, Florence West Prison LLC, Series 2002A, 5.000%, 10/01/18 – ACA Insured | 4/16 at 100.00 | | BBB– | | 1,612,930 | |
| | 1,000 | | Pinal County, Arizona, Pledged Revenue Obligations, Series 2014, 5.000%, 8/01/33 | 8/24 at 100.00 | | AA– | | 1,168,930 | |
| | 1,140 | | Pinetop Fire District of Navajo County, Arizona, Certificates of Participation, Series 2008, 7.750%, 6/15/29 | 6/16 at 102.00 | | A3 | | 1,178,304 | |
| | 1,000 | | Regional Public Transportation Authority, Arizona, Transportation Excise Tax Revenue Bonds, Maricopa County Public Transportation Fund Series 2014, 5.250%, 7/01/22 | No Opt. Call | | AA+ | | 1,242,010 | |
| | | | San Luis, Arizona, Pledged Excise Tax Revenue Bonds, Refunding Series 2014A: | | | | | | |
| | 1,400 | | 5.000%, 7/01/34 – BAM Insured | 7/24 at 100.00 | | AA | | 1,620,822 | |
| | 2,100 | | 5.000%, 7/01/38 – BAM Insured | 7/24 at 100.00 | | AA | | 2,404,416 | |
| | 3,000 | | Scottsdale Municipal Property Corporation, Arizona, Excise Tax Revenue Bonds, Refunding Series 2006, 5.000%, 7/01/24 | No Opt. Call | | AAA | | 3,786,600 | |
| | 5,000 | | Scottsdale Municipal Property Corporation, Arizona, Excise Tax Revenue Bonds, Water & Sewer Improvements Project, Series 2010, 5.000%, 7/01/36 | 7/20 at 100.00 | | AAA | | 5,668,200 | |
| | 1,570 | | Tartesso West Community Facility District, Buckeye, Arizona, Limited Tax General Obligation Bonds, Series 2007, 5.900%, 7/15/32 | 7/17 at 100.00 | | N/R | | 1,599,171 | |
| | 4,000 | | Tempe, Arizona, Transit Excise Tax Revenue Obligation Bonds, Refunding Series 2012, 5.000%, 7/01/37 | 7/22 at 100.00 | | AAA | | 4,641,200 | |
| | 1,750 | | Virgin Islands Public Finance Authority, Gross Receipts Taxes Loan Note, Refunding Series 2012A, 4.000%, 10/01/22 – AGM Insured | No Opt. Call | | AA | | 1,883,893 | |
| | 1,360 | | Virgin Islands Public Finance Authority, Matching Fund Loan Notes Revenue Bonds, Senior Lien Series 2010A, 5.000%, 10/01/29 | 10/20 at 100.00 | | BBB | | 1,480,632 | |
| NAZ | Nuveen Arizona Premium Income Municipal Fund | |
| | Portfolio of Investments (continued) | February 29, 2016 |
| | Principal Amount (000) | | Description (1) | Optional Call Provisions (2) | | Ratings (3) | | Value | |
| | | | Tax Obligation/Limited (continued) | | | | | | |
| $ | 1,489 | | Watson Road Community Facilities District, Arizona, Special Assessment Revenue Bonds, Series 2005, 6.000%, 7/01/30 | 7/16 at 100.00 | | N/R | $ | 1,496,341 | |
| | 1,000 | | Westpark Community Facilities District, Buckeye, Arizona, General Obligation Tax Increment Bonds Series 2006, 5.250%, 7/15/31 | 7/16 at 100.00 | | N/R | | 1,003,840 | |
| | 56,915 | | Total Tax Obligation/Limited | | | | | 62,401,826 | |
| | | | Transportation – 5.1% (3.5% of Total Investments) | | | | | | |
| | 180 | | Phoenix Civic Improvement Corporation, Arizona, Airport Revenue Bonds, Junior Lien Series 2010A, 5.000%, 7/01/40 | 7/20 at 100.00 | | A+ | | 201,893 | |
| | | | Phoenix Civic Improvement Corporation, Arizona, Airport Revenue Bonds, Junior Lien Series 2015A: | | | | | | |
| | 910 | | 5.000%, 7/01/40 | 7/25 at 100.00 | | A+ | | 1,045,253 | |
| | 2,185 | | 5.000%, 7/01/45 | 7/25 at 100.00 | | A+ | | 2,492,670 | |
| | | | Phoenix Civic Improvement Corporation, Arizona, Airport Revenue Bonds, Refunding Senior Lien Series 2013: | | | | | | |
| | 1,785 | | 5.000%, 7/01/30 (Alternative Minimum Tax) | 7/23 at 100.00 | | AA– | | 2,066,262 | |
| | 2,215 | | 5.000%, 7/01/32 (Alternative Minimum Tax) | 7/23 at 100.00 | | AA– | | 2,534,580 | |
| | 395 | | Virgin Islands Port Authority, Marine Revenue Bonds, Refunding Series 2014B, 5.000%, 9/01/44 | 9/24 at 100.00 | | BBB+ | | 433,086 | |
| | 7,670 | | Total Transportation | | | | | 8,773,744 | |
| | | | U.S. Guaranteed – 13.9% (9.5% of Total Investments) (5) | | | | | | |
| | 3,500 | | Arizona Health Facilities Authority, Hospital Revenue Bonds, Banner Health Systems, Series 2007A, 5.000%, 1/01/25 (Pre-refunded 1/01/17) | 1/17 at 100.00 | | AA– (5) | | 3,634,540 | |
| | 1,265 | | Gila County Unified School District 10 Payson, Arizona, School Improvement Bonds, Project 2006, Series 2008B, 5.750%, 7/01/28 (Pre-refunded 7/01/18) | 7/18 at 100.00 | | Aa3 (5) | | 1,412,461 | |
| | 2,965 | | Glendale Industrial Development Authority, Arizona, Revenue Bonds, John C. Lincoln Health Network, Series 2007, 5.000%, 12/01/42 (Pre-refunded 12/01/17) | 12/17 at 100.00 | | N/R (5) | | 3,187,464 | |
| | 2,280 | | Greater Arizona Development Authority, Infrastructure Revenue Bonds, Series 2006-1, 5.000%, 8/01/22 (Pre-refunded 8/01/16) – NPFG Insured | 8/16 at 100.00 | | AA– (5) | | 2,324,962 | |
| | 175 | | Maricopa County Industrial Development Authority, Arizona, Hospital Revenue Refunding Bonds, Samaritan Health Services, Series 1990A, 7.000%, 12/01/16 – NPFG Insured (ETM) | No Opt. Call | | N/R (5) | | 183,565 | |
| | 1,200 | | Maricopa County Unified School District 95 Queen Creek, Arizona, General Obligation Bonds, Series 2008, 5.000%, 7/01/27 (Pre-refunded 7/01/18) – AGM Insured | 7/18 at 100.00 | | Aa3 (5) | | 1,319,040 | |
| | 665 | | Maricopa County Union High School District 210 Phoenix, Arizona, General Obligation Bonds, Series 2006C, 5.000%, 7/01/24
(Pre-refunded 7/01/16) – NPFG Insured | 7/16 at 100.00 | | AA (5) | | 675,820 | |
| | 630 | | Mesa, Arizona, Utility System Revenue Refunding Bonds, Series 2002, 5.250%, 7/01/17 – FGIC Insured (ETM) | No Opt. Call | | Aa2 (5) | | 669,747 | |
| | 4,530 | | Pinal County Unified School District 1, Florence, Arizona, General Obligation Bonds, Series 2008C, 5.250%, 7/01/28 (Pre-refunded 7/01/18) | 7/18 at 100.00 | | A (5) | | 5,005,605 | |
| | 2,585 | | University Medical Center Corporation, Tucson, Arizona, Hospital Revenue Bonds, Series 2011, 6.000%, 7/01/39 (Pre-refunded 7/01/21) | 7/21 at 100.00 | | N/R (5) | | 3,234,636 | |
| | | | University Medical Center Corporation, Tucson, Arizona, Hospital Revenue Bonds, Series 2013: | | | | | | |
| | 200 | | 5.000%, 7/01/19 (ETM) | No Opt. Call | | N/R (5) | | 227,300 | |
| | 800 | | 5.000%, 7/01/20 (ETM) | No Opt. Call | | N/R (5) | | 937,208 | |
| | 1,340 | | Yuma & La Paz Counties Community College District, Arizona, General Obligation Bonds, Series 2006, 5.000%, 7/01/21
(Pre-refunded 7/01/16) – NPFG Insured | 7/16 at 100.00 | | AA– (5) | | 1,361,802 | |
| | 22,135 | | Total U.S. Guaranteed | | | | | 24,174,150 | |
| | | | Utilities – 17.9% (12.3% of Total Investments) | | | | | | |
| | 1,495 | | Apache County Industrial Development Authority, Arizona, Pollution Control Revenue Bonds, Tucson Electric Power Company, Series 20102A, 4.500%, 3/01/30 | 3/22 at 100.00 | | A3 | | 1,633,377 | |
| | 1,500 | | Arizona Power Authority, Special Obligation Power Resource Revenue Refunding Crossover Bonds, Hoover Project, Series 2001, 5.250%, 10/01/17 | No Opt. Call | | AA | | 1,610,250 | |
| | Principal Amount (000) | | Description (1) | Optional Call Provisions (2) | | Ratings (3) | | Value | |
| | | | Utilities (continued) | | | | | | |
| $ | 1,000 | | Guam Power Authority, Revenue Bonds, Series 2014A, 5.000%, 10/01/39 | 10/24 at 100.00 | | AA | $ | 1,147,970 | |
| | 4,310 | | Maricopa County Pollution Control Corporation, Arizona, Pollution Control Revenue Refunding Bonds, Southern California Edison Company, Series 2000A, 5.000%, 6/01/35 | 6/20 at 100.00 | | Aa3 | | 4,845,604 | |
| | 370 | | Mesa, Arizona, Utility System Revenue Refunding Bonds, Series 2002, 5.250%, 7/01/17 – FGIC Insured | No Opt. Call | | Aa2 | | 393,369 | |
| | 1,800 | | Pinal County Electrical District 3, Arizona, Electric System Revenue Bonds, Refunding Series 2011, 5.250%, 7/01/36 | 7/21 at 100.00 | | A | | 2,084,418 | |
| | 1,500 | | Salt River Project Agricultural Improvement and Power District, Arizona, Electric System Revenue Bonds, Refunding Series 2015A, 5.000%, 12/01/36 | 6/25 at 100.00 | | Aa1 | | 1,780,815 | |
| | 2,500 | | Salt River Project Agricultural Improvement and Power District, Arizona, Electric System Revenue Bonds, Tender Option Bond Trust 09-9W, 17.700%, 1/01/38 (IF) (4) | 1/18 at 100.00 | | Aa1 | | 3,145,500 | |
| | | | Salt Verde Financial Corporation, Arizona, Senior Gas Revenue Bonds, Citigroup Energy Inc. Prepay Contract Obligations, Series 2007: | | | | | | |
| | 4,500 | | 5.500%, 12/01/29 | No Opt. Call | | BBB+ | | 5,536,710 | |
| | 5,665 | | 5.000%, 12/01/37 | No Opt. Call | | BBB+ | | 6,711,494 | |
| | 2,370 | | Yuma County Industrial Development Authority, Arizona, Exempt Revenue Bonds, Far West Water & Sewer Inc. Refunding, Series 2007A, 6.375%, 12/01/37 (Alternative Minimum Tax) | 12/17 at 100.00 | | N/R | | 2,258,729 | |
| | 27,010 | | Total Utilities | | | | | 31,148,236 | |
| | | | Water and Sewer – 13.3% (9.1% of Total Investments) | | | | | | |
| | | | Central Arizona Water Conservation District, Arizona, Water Delivery O&M Revenue Bonds, Series 2016: | | | | | | |
| | 1,285 | | 5.000%, 1/01/35 | 1/26 at 100.00 | | AA+ | | 1,542,514 | |
| | 345 | | 5.000%, 1/01/36 | 1/26 at 100.00 | | AA+ | | 412,489 | |
| | 500 | | City of Goodyear, Arizona Subordinate Lien Water and Sewer Revenue Obligations, Series 2011, 5.500%, 7/01/41 | 7/21 at 100.00 | | AA | | 586,940 | |
| | 500 | | Glendale, Arizona, Water and Sewer Revenue Bonds, Refunding Series 2012, 5.000%, 7/01/28 | 7/22 at 100.00 | | AA | | 597,420 | |
| | 2,855 | | Goodyear, Arizona, Water and Sewer Revenue Obligations, Series 2010, 5.625%, 7/01/39 | 7/20 at 100.00 | | AA– | | 3,335,438 | |
| | 500 | | Guam Government Waterworks Authority, Water and Wastewater System Revenue Bonds, Series 2013, 5.250%, 7/01/33 | 7/23 at 100.00 | | A– | | 566,200 | |
| | 1,460 | | Guam Government Waterworks Authority, Water and Wastewater System Revenue Bonds, Series 2016, 5.000%, 1/01/46 | 7/26 at 100.00 | | A– | | 1,637,770 | |
| | 1,125 | | Lake Havasu City, Arizona, Wastewater System Revenue Bonds, Refunding Senior Lien Series 2015A, 5.000%, 7/01/36 – AGM Insured | 7/25 at 100.00 | | AA | | 1,316,025 | |
| | 1,135 | | Phoenix Civic Improvement Corporation, Arizona, Wastewater System Revenue Bonds, Refunding Junior Lien Series 2014, 5.000%, 7/01/29 | 7/24 at 100.00 | | AA+ | | 1,362,488 | |
| | 2,000 | | Phoenix Civic Improvement Corporation, Arizona, Water System Revenue Bonds, Junior Lien Series 2014A, 5.000%, 7/01/39 | 7/24 at 100.00 | | AAA | | 2,323,520 | |
| | | | Phoenix Civic Improvement Corporation, Arizona, Water System Revenue Bonds, Refunding Junior Lien Series 2001: | | | | | | |
| | 1,250 | | 5.500%, 7/01/21 – FGIC Insured | No Opt. Call | | AAA | | 1,538,788 | |
| | 1,040 | | 5.500%, 7/01/22 – FGIC Insured | No Opt. Call | | AAA | | 1,309,641 | |
| | 1,500 | | Pima County, Arizona, Sewer System Revenue Obligations, Series 2012A, 5.000%, 7/01/26 | No Opt. Call | | AA– | | 1,797,750 | |
| NAZ | Nuveen Arizona Premium Income Municipal Fund | |
| | Portfolio of Investments (continued) | February 29, 2016 |
| | Principal Amount (000) | | Description (1) | Optional Call Provisions (2) | | Ratings (3) | | Value | |
| | | | Water and Sewer (continued) | | | | | | |
| $ | 1,000 | | Pima County, Arizona, Sewer System Revenue Obligations, Series 2014, 5.000%, 7/01/22 | No Opt. Call | | AA– | $ | 1,215,940 | |
| | | | Surprise Municipal Property Corporation, Arizona, Wastewater System Revenue Bonds, Series 2007: | | | | | | |
| | 870 | | 4.700%, 4/01/22 | 10/16 at 100.00 | | A | | 873,367 | |
| | 1,970 | | 4.900%, 4/01/32 | 4/17 at 100.00 | | A | | 2,004,436 | |
| | 500 | | Tucson, Arizona, Water System Revenue Bonds, Refunding Series 2013A, 5.000%, 7/01/23 | No Opt. Call | | AA | | 616,500 | |
| | 19,835 | | Total Water and Sewer | | | | | 23,037,226 | |
| $ | 226,300 | | Total Long-Term Investments (cost $231,913,245) | | | | | 253,297,034 | |
| | | | Floating Rate Obligations – (1.6)% | | | | | (2,755,000 | ) |
| | | | Variable Rate MuniFund Term Preferred Shares, at Liquidation Preference – (45.5)% (6) | | | | | (79,000,000 | ) |
| | | | Other Assets Less Liabilities – 1.3% | | | | | 2,225,212 | |
| | | | Net Assets Applicable to Common Shares – 100% | | | | $ | 173,767,246 | |
| (1) | All percentages shown in the Portfolio of Investments are based on net assets applicable to common shares unless otherwise noted. |
| (2) | Optional Call Provisions (not covered by the report of independent registered public accounting firm): Dates (month and year) and prices of the earliest optional call or redemption. There may be other call provisions at varying prices at later dates. Certain mortgage-backed securities may be subject to periodic principal paydowns. |
| (3) | Ratings (not covered by the report of independent registered public accounting firm): Using the highest of Standard & Poor's Group ("Standard & Poor's"), Moody's Investors Service, Inc. ("Moody's") or Fitch, Inc. ("Fitch") rating. Ratings below BBB by Standard & Poor's, Baa by Moody's or BBB by Fitch are considered to be below investment grade. Holdings designated N/R are not rated by any of these national rating agencies. |
| (4) | Investment, or portion of investment, has been pledged to collateralize the net payment obligations for investments in inverse floating rate transactions. |
| (5) | Backed by an escrow or trust containing sufficient U.S. Government or U.S. Government agency securities, which ensure the timely payment of principal and interest. Certain bonds backed by U.S. Government or agency securities are regarded as having an implied rating equal to the rating of such securities. |
| (6) | Variable Rate MuniFund Term Preferred Shares, at Liquidation Preference as a percentage of Total Investments is 31.2%. |
| (ETM) | Escrowed to maturity. |
| (IF) | Inverse floating rate investment. |
| (UB) | Underlying bond of an inverse floating rate trust reflected as a financing transaction. See Notes to Financial Statements, Note 3 – Portfolio Securities and Investments in Derivatives, Inverse Floating Rate Securities for more information. |
| | See accompanying notes to financial statements. |
| NUM | | |
| | Nuveen Michigan Quality Income Municipal Fund | |
| | Portfolio of Investments | February 29, 2016 |
| | Principal Amount (000) | | Description (1) | Optional Call Provisions (2) | | Ratings (3) | | Value | |
| | | | LONG-TERM INVESTMENTS – 152.2% (100.0% of Total Investments) | | | | | | |
| | | | MUNICIPAL BONDS – 152.2% (100.0% of Total Investments) | | | | | | |
| | | | Consumer Staples – 4.7% (3.1% of Total Investments) | | | | | | |
| $ | 7,100 | | Michigan Tobacco Settlement Finance Authority, Tobacco Settlement Asset-Backed Revenue Bonds, Senior Lien Series 2007A, 6.000%, 6/01/34 | 6/17 at 100.00 | | B– | $ | 6,722,919 | |
| | 8,650 | | Michigan Tobacco Settlement Finance Authority, Tobacco Settlement Asset-Backed Revenue Bonds, Series 2008A, 6.875%, 6/01/42 | 6/18 at 100.00 | | B+ | | 8,892,545 | |
| | 15,750 | | Total Consumer Staples | | | | | 15,615,464 | |
| | | | Education and Civic Organizations – 20.4% (13.4% of Total Investments) | | | | | | |
| | 1,220 | | Central Michigan University Board of Trustees, General Revenue Bonds, Refunding Series 2014, 5.000%, 10/01/39 | 10/24 at 100.00 | | Aa3 | | 1,405,501 | |
| | 1,000 | | Conner Creek Academy East, Michigan, Public School Revenue Bonds, Series 2007, 5.250%, 11/01/36 | 11/16 at 100.00 | | B | | 732,050 | |
| | 1,255 | | Detroit Community High School, Michigan, Public School Academy Revenue Bonds, Series 2005, 5.750%, 11/01/30 | 5/16 at 100.00 | | B– | | 914,770 | |
| | 500 | | Grand Valley State University, Michigan, General Revenue Bonds, Refunding Series 2014B, 5.000%, 12/01/28 | 12/24 at 100.00 | | A+ | | 596,210 | |
| | 990 | | Michigan Finance Authority, Public School Academy Revenue Bonds, Detroit Service Learning Academy Project, Refunding Series 2011, 7.000%, 10/01/31 | 10/21 at 100.00 | | BB– | | 1,007,404 | |
| | | | Michigan Higher Education Facilities Authority, Limited Obligation Revenue Refunding Bonds, Kettering University, Series 2001: | | | | | | |
| | 1,685 | | 5.500%, 9/01/17 – AMBAC Insured | 3/16 at 100.00 | | N/R | | 1,687,393 | |
| | 1,170 | | 5.000%, 9/01/26 – AMBAC Insured | 3/16 at 100.00 | | N/R | | 1,170,480 | |
| | 240 | | Michigan Public Educational Facilities Authority, Charter School Revenue Bonds, American Montessori Academy, Series 2007, 6.500%, 12/01/37 | 12/17 at 100.00 | | N/R | | 243,938 | |
| | 5,000 | | Michigan State University, General Revenue Bonds, Refunding Series 2010C, 5.000%, 2/15/40 | 2/20 at 100.00 | | AA+ | | 5,587,000 | |
| | 7,790 | | Michigan State University, General Revenue Bonds, Series 2013A, 5.000%, 8/15/41 | 8/23 at 100.00 | | AA+ | | 8,931,001 | |
| | 3,445 | | Michigan Technological University, General Revenue Bonds, Refunding Series 2012A, 5.000%, 10/01/34 | 10/21 at 100.00 | | A1 | | 3,972,602 | |
| | 4,000 | | University of Michigan, General Revenue Bonds, Series 2014A, 5.000%, 4/01/44 | 4/24 at 100.00 | | AAA | | 4,642,360 | |
| | | | University of Michigan, General Revenue Bonds, Series 2015: | | | | | | |
| | 5,735 | | 5.000%, 4/01/40 (UB) (4) | 4/26 at 100.00 | | AAA | | 6,831,532 | |
| | 9,600 | | 5.000%, 4/01/46 (UB) (4) | 4/26 at 100.00 | | AAA | | 11,361,408 | |
| | 5,000 | | Wayne State University, Michigan, General Revenue Bonds, Refunding Series 2008, 5.000%, 11/15/35 – AGM Insured | No Opt. Call | | AA | | 5,466,100 | |
| | 3,700 | | Wayne State University, Michigan, General Revenue Bonds, Series 2013A, 5.000%, 11/15/40 | 11/23 at 100.00 | | AA– | | 4,184,145 | |
| | 525 | | Western Michigan University, General Revenue Bonds, Refunding Series 2011, 5.000%, 11/15/31 | 11/21 at 100.00 | | A1 | | 593,833 | |
| | | | Western Michigan University, General Revenue Bonds, Refunding Series 2013: | | | | | | |
| | 750 | | 5.250%, 11/15/33 – AGM Insured | 11/23 at 100.00 | | AA | | 873,225 | |
| | 4,250 | | 5.000%, 11/15/39 – AGM Insured | 11/23 at 100.00 | | AA | | 4,778,148 | |
| | | | Western Michigan University, General Revenue Bonds, Refunding Series 2015A: | | | | | | |
| | 1,500 | | 5.000%, 11/15/40 | 5/25 at 100.00 | | A1 | | 1,702,320 | |
| | 850 | | 5.000%, 11/15/45 | 5/25 at 100.00 | | A1 | | 958,171 | |
| | 60,205 | | Total Education and Civic Organizations | | | | | 67,639,591 | |
| | | | Health Care – 23.0% (15.1% of Total Investments) | | | | | | |
| | 4,000 | | Grand Traverse County Hospital Financial Authority, Michigan, Revenue Bonds, Munson Healthcare, Refunding Series 2011A, 5.000%, 7/01/29 | 7/21 at 100.00 | | AA– | | 4,515,960 | |
| NUM | Nuveen Michigan Quality Income Municipal Fund | |
| | Portfolio of Investments (continued) | February 29, 2016 |
| | Principal Amount (000) | | Description (1) | Optional Call Provisions (2) | | Ratings (3) | | Value | |
| | | | Health Care (continued) | | | | | | |
| $ | 1,800 | | Jackson County Hospital Finance Authority, Michigan, Hospital Revenue Bonds, Allegiance Health, Refunding Series 2010A, 5.000%, 6/01/37 – AGM Insured | 6/20 at 100.00 | | AA | $ | 1,976,706 | |
| | | | Kent Hospital Finance Authority, Michigan, Revenue Refunding Bonds, Spectrum Health System, Refunding Series 2011C: | | | | | | |
| | 5,500 | | 5.000%, 1/15/31 | 1/22 at 100.00 | | AA | | 6,167,260 | |
| | 2,000 | | 5.000%, 1/15/42 | 1/22 at 100.00 | | AA | | 2,184,700 | |
| | 1,780 | | Michigan Finance Authority, Hospital Revenue Bonds, Beaumont Health Credit Group, Refunding Series 2015A, 5.000%, 8/01/32 | 8/24 at 100.00 | | A1 | | 2,069,784 | |
| | 4,015 | | Michigan Finance Authority, Hospital Revenue Bonds, MidMichigan Health Credit Group, Refunding Series 2014, 5.000%, 6/01/39 | 6/24 at 100.00 | | A+ | | 4,493,749 | |
| | 3,930 | | Michigan Finance Authority, Hospital Revenue Bonds, Oakwood Obligated Group, Refunding Series 2013, 5.000%, 8/15/31 | 8/23 at 100.00 | | A1 | | 4,524,177 | |
| | 6,060 | | Michigan Finance Authority, Hospital Revenue Bonds, Sparrow Obligated Group, Refunding Series 2015, 5.000%, 11/15/45 | 5/25 at 100.00 | | A+ | | 6,884,463 | |
| | 3,000 | | Michigan Finance Authority, Hospital Revenue Bonds, Sparrow Obligated Group, Series 2012, 5.000%, 11/15/42 | 11/22 at 100.00 | | A+ | | 3,288,540 | |
| | 5,000 | | Michigan Finance Authority, Michigan, Revenue Bonds, Trinity Health Credit Group, Refunding Series 2016 MI, 5.000%, 12/01/45 | 6/26 at 100.00 | | AA | | 5,738,900 | |
| | | | Michigan Finance Authority, Revenue Bonds, Oakwood Obligated Group, Refunding Series 2012: | | | | | | |
| | 1,000 | | 5.000%, 11/01/25 | 11/22 at 100.00 | | A1 | | 1,165,860 | |
| | 1,000 | | 5.000%, 11/01/26 | No Opt. Call | | A1 | | 1,157,930 | |
| | 3,750 | | 5.000%, 11/01/42 | 11/22 at 100.00 | | A1 | | 4,115,888 | |
| | 9,615 | | Michigan Finance Authority, Revenue Bonds, Trinity Health Credit Group, Refunding Series 2011, 5.000%, 12/01/39 | 12/21 at 100.00 | | AA– | | 10,753,511 | |
| | | | Michigan State Hospital Finance Authority, Hospital Revenue Bonds, Henry Ford Health System, Refunding Series 2009: | | | | | | |
| | 150 | | 5.000%, 11/15/20 | 11/19 at 100.00 | | A– | | 169,025 | |
| | 7,300 | | 5.750%, 11/15/39 | 11/19 at 100.00 | | A– | | 8,299,443 | |
| | 2,000 | | Michigan State Hospital Finance Authority, Hospital Revenue Refunding Bonds, Henry Ford Health System, Series 2006A, 5.250%, 11/15/46 | 11/16 at 100.00 | | A– | | 2,059,180 | |
| | 1,000 | | Michigan State Hospital Finance Authority, Revenue Bonds, Trinity Health Care Group, Series 2009C, 5.000%, 12/01/48 | 6/22 at 100.00 | | AA | | 1,094,610 | |
| | 4,880 | | Royal Oak Hospital Finance Authority, Michigan, Hospital Revenue Bonds, William Beaumont Hospital Obligated Group, Refunding Series 2014D, 5.000%, 9/01/39 | 3/24 at 100.00 | | A1 | | 5,483,217 | |
| | 67,780 | | Total Health Care | | | | | 76,142,903 | |
| | | | Housing/Multifamily – 3.9% (2.5% of Total Investments) | | | | | | |
| | 2,675 | | Michigan Housing Development Authority, FNMA Limited Obligation Multifamily Housing Revenue Bonds, Parkview Place Apartments, Series 2002A, 5.550%, 12/01/34 (Alternative Minimum Tax) | 12/20 at 101.00 | | AA | | 2,945,603 | |
| | | | Michigan Housing Development Authority, Multifamily Housing Revenue Bonds, Series 1988A: | | | | | | |
| | 1,395 | | 3.375%, 11/01/16 (Alternative Minimum Tax) | 5/16 at 100.00 | | AA | | 1,397,874 | |
| | 1,405 | | 3.875%, 11/01/17 (Alternative Minimum Tax) | 5/16 at 100.00 | | AA | | 1,408,091 | |
| | 2,300 | | Michigan Housing Development Authority, Rental Housing Revenue Bonds, Series 2006D, 5.125%, 4/01/31 – AGM Insured (Alternative Minimum Tax) | 5/16 at 100.00 | | AA | | 2,303,542 | |
| | 1,825 | | Michigan Housing Development Authority, Rental Housing Revenue Bonds, Series 2010A, 5.000%, 10/01/35 | 10/20 at 100.00 | | AA | | 1,961,693 | |
| | 1,725 | | Michigan Housing Development Authority, Rental Housing Revenue Bonds, Series 2012A-2, 4.625%, 10/01/41 | 4/22 at 100.00 | | AA | | 1,795,001 | |
| | 1,000 | | Michigan Housing Development Authority, Rental Housing Revenue Bonds, Series 2012D, 4.000%, 10/01/42 | No Opt. Call | | AA | | 1,014,010 | |
| | 12,325 | | Total Housing/Multifamily | | | | | 12,825,814 | |
| | Principal Amount (000) | | Description (1) | Optional Call Provisions (2) | | Ratings (3) | | Value | |
| | | | Housing/Single Family – 0.9% (0.6% of Total Investments) | | | | | | |
| $ | 2,495 | | Michigan Housing Development Authority, Single Family Homeownership Revenue Bonds, Series 2010C, 5.500%, 12/01/28 (Alternative Minimum Tax) | 6/20 at 100.00 | | AA+ | $ | 2,669,151 | |
| | 380 | | Michigan Housing Development Authority, Single Family Homeownership Revenue Bonds, Series 2011A, 4.600%, 12/01/26 | 6/21 at 100.00 | | AA+ | | 393,304 | |
| | 2,875 | | Total Housing/Single Family | | | | | 3,062,455 | |
| | | | Tax Obligation/General – 35.1% (23.1% of Total Investments) | | | | | | |
| | 2,310 | | Ann Arbor Public School District, Washtenaw County, Michigan, General Obligation Bonds, Refunding Series 2012, 5.000%, 5/01/29 | 5/22 at 100.00 | | Aa1 | | 2,738,967 | |
| | 840 | | Ann Arbor Public School District, Washtenaw County, Michigan, General Obligation Bonds, School Building & Site Series 2015, 5.000%, 5/01/24 | No Opt. Call | | Aa2 | | 1,036,241 | |
| | 2,200 | | Ann Arbor, Michigan, General Obligation Bonds, Court & Police Facilities Capital Improvement Series 2008, 5.000%, 5/01/38 | 5/18 at 100.00 | | AA+ | | 2,374,262 | |
| | | | Byron Center Public Schools, Kent County, Michigan, General Obligation Bonds, Series 2012: | | | | | | |
| | 1,000 | | 4.000%, 5/01/32 | 5/21 at 100.00 | | AA– | | 1,049,010 | |
| | 500 | | 4.000%, 5/01/33 | 5/21 at 100.00 | | AA– | | 523,040 | |
| | 1,135 | | Caledonia Community Schools, Kent, Allegan and Barry Counties, Michigan, General Obligation Bonds, School Building & Site Series 2014, 5.000%, 5/01/39 | 5/24 at 100.00 | | AA– | | 1,275,638 | |
| | 7,740 | | Caledonia Community Schools, Kent, Allegan and Barry Counties, Michigan, General Obligation Bonds, Series 2007, 4.750%, 5/01/32 – NPFG Insured | 5/17 at 100.00 | | Aa1 | | 8,043,097 | |
| | 875 | | Charlotte Public School District, Easton County, Michigan, General Obligation Bonds, Refunding Series 2012, 5.000%, 5/01/20 | No Opt. Call | | AA– | | 1,012,358 | |
| | | | Comstock Park Public Schools, Kent County, Michigan, General Obligation Bonds, School Building & Site, Series 2011B: | | | | | | |
| | 1,200 | | 5.500%, 5/01/36 | 5/21 at 100.00 | | AA– | | 1,398,312 | |
| | 2,190 | | 5.500%, 5/01/41 | 5/21 at 100.00 | | AA– | | 2,551,919 | |
| | | | Detroit-Wayne County Stadium Authority, Michigan, Wayne County Limited Tax General Obligation Bonds, Building Authority Stadium Refunding Series 2012: | | | | | | |
| | 2,615 | | 5.000%, 10/01/20 – AGM Insured | No Opt. Call | | AA | | 2,936,514 | |
| | 1,000 | | 5.000%, 10/01/21 – AGM Insured | No Opt. Call | | AA | | 1,138,560 | |
| | 1,645 | | 5.000%, 10/01/22 – AGM Insured | No Opt. Call | | AA | | 1,892,293 | |
| | 4,850 | | 5.000%, 10/01/26 – AGM Insured | 10/22 at 100.00 | | AA | | 5,407,459 | |
| | | | Grand Rapids and Kent County Joint Building Authority, Michigan, Limited Tax General Obligation Bonds, Devos Place Project, Series 2001: | | | | | | |
| | 8,900 | | 0.000%, 12/01/25 | No Opt. Call | | AAA | | 7,259,017 | |
| | 3,000 | | 0.000%, 12/01/26 | No Opt. Call | | AAA | | 2,375,970 | |
| | 100 | | 0.000%, 12/01/27 | No Opt. Call | | AAA | | 76,842 | |
| | 4,305 | | 0.000%, 12/01/29 | No Opt. Call | | AAA | | 3,123,923 | |
| | | | Grand Rapids Building Authority, Kent County, Michigan, General Obligation Bonds, Refunding Series 2011: | | | | | | |
| | 560 | | 5.000%, 10/01/28 | 10/21 at 100.00 | | AA | | 657,059 | |
| | 500 | | 5.000%, 10/01/30 | 10/21 at 100.00 | | AA | | 576,575 | |
| | 500 | | 5.000%, 10/01/31 | 10/21 at 100.00 | | AA | | 576,575 | |
| | 1,000 | | Grand Rapids Building Authority, Kent County, Michigan, Limited Tax General Obligation Bonds, Series 1998, 5.000%, 4/01/16 | No Opt. Call | | AA | | 1,004,240 | |
| | 1,025 | | Kent County, Michigan, General Obligation Bonds, Limited Tax Series 2015, 5.000%, 1/01/34 | 1/25 at 100.00 | | AAA | | 1,211,899 | |
| | 3,440 | | Kent County, Michigan, General Obligation Bonds, Refunding Limited Tax Series 2015, 5.000%, 1/01/31 | 1/25 at 100.00 | | AAA | | 4,118,127 | |
| | | | Lake Saint Claire Clean Water Drain Drainage District, Macomb County, Michigan, General Obligation Bonds, Series 2013: | | | | | | |
| | 1,000 | | 5.000%, 10/01/25 | 10/23 at 100.00 | | AA+ | | 1,200,500 | |
| | 1,020 | | 5.000%, 10/01/26 | 10/23 at 100.00 | | AA+ | | 1,212,709 | |
| | 2,505 | | Lincoln Consolidated School District, Washtenaw and Wayne Counties, Michigan, General Obligation Bonds, Series 2006, 5.000%, 5/01/25 – NPFG Insured | 5/16 at 100.00 | | Aa1 | | 2,525,265 | |
| NUM | Nuveen Michigan Quality Income Municipal Fund | |
| | Portfolio of Investments (continued) | February 29, 2016 |
| | Principal Amount (000) | | Description (1) | Optional Call Provisions (2) | | Ratings (3) | | Value | |
| | | | Tax Obligation/General (continued) | | | | | | |
| $ | 2,160 | | Lowell Area Schools, Kent and Ionia Counties, Michigan, General Obligation Bonds, Series 2007, 5.000%, 5/01/37 – AGM Insured | 5/17 at 100.00 | | Aa1 | $ | 2,251,606 | |
| | 1,925 | | Marshall Public Schools, Calhoun County, Michigan, General Obligation Bonds, Series 2007, 5.000%, 5/01/30 – SYNCORA GTY Insured | 5/17 at 100.00 | | AA– | | 2,006,947 | |
| | 4,000 | | Michigan State, General Obligation Bonds, Environmental Program, Refunding Series 2011A, 5.000%, 12/01/22 | 12/21 at 100.00 | | Aa1 | | 4,817,440 | |
| | 1,000 | | Michigan State, General Obligation Bonds, Environmental Program, Series 2009A, 5.500%, 11/01/25 | 5/19 at 100.00 | | Aa1 | | 1,133,330 | |
| | 2,500 | | Montrose School District, Michigan, School Building and Site Bonds, Series 1997, 6.000%, 5/01/22 – NPFG Insured | No Opt. Call | | Aa2 | | 2,934,600 | |
| | 2,945 | | Muskegon Community College District, Michigan, General Obligation Bonds, Community Facility Series 2013I, 5.000%, 5/01/38 – BAM Insured | 5/24 at 100.00 | | AA | | 3,368,962 | |
| | | | Muskegon County, Michigan, General Obligation Wastewater Bonds, Management System 1, Refunding Series 2015: | | | | | | |
| | 1,350 | | 5.000%, 11/01/33 | 11/25 at 100.00 | | AA | | 1,581,350 | |
| | 1,730 | | 5.000%, 11/01/36 | 11/25 at 100.00 | | AA | | 1,994,984 | |
| | 6,820 | | Oakland Intermediate School District, Oakland County, Michigan, General Obligation Bonds, Series 2007, 5.000%, 5/01/36 – AGM Insured | 5/17 at 100.00 | | Aaa | | 7,121,511 | |
| | 5,785 | | Parchment School District, Kalamazoo County, Michigan, General Obligation Bonds, Series 2007, 4.750%, 5/01/36 – AGM Insured | 5/17 at 100.00 | | Aa1 | | 5,999,797 | |
| | 750 | | Plainwell Community Schools, Allegan County, Michigan, General Obligation Bonds, School Building & Site, Series 2008, 5.000%, 5/01/28 – AGC Insured | 5/18 at 100.00 | | Aa1 | | 809,693 | |
| | | | Port Huron, Michigan, General Obligation Bonds, Refunding & Capital Improvement Series 2011: | | | | | | |
| | 1,585 | | 5.000%, 10/01/31 – AGM Insured | 10/21 at 100.00 | | AA | | 1,751,251 | |
| | 640 | | 5.250%, 10/01/37 – AGM Insured | 10/21 at 100.00 | | AA | | 706,637 | |
| | | | Port Huron, Michigan, General Obligation Bonds, Series 2011B: | | | | | | |
| | 530 | | 5.000%, 10/01/31 – AGM Insured | 10/21 at 100.00 | | AA | | 585,592 | |
| | 800 | | 5.250%, 10/01/40 – AGM Insured | 10/21 at 100.00 | | AA | | 877,720 | |
| | 500 | | Rockford Public Schools, Kent County, Michigan, General Obligation Bonds, Refunding Series 2012, 5.000%, 5/01/19 | No Opt. Call | | AA– | | 560,845 | |
| | 2,100 | | Rockford Public Schools, Kent County, Michigan, General Obligation Bonds, Series 2008, 5.000%, 5/01/33 – AGM Insured | 5/18 at 100.00 | | Aa1 | | 2,256,954 | |
| | 625 | | Royal Oak City School District, Oakland County, Michigan, General Obligation Bonds, Refunding Series 2014, 5.000%, 5/01/20 | No Opt. Call | | Aa2 | | 724,869 | |
| | 1,435 | | South Haven Public Schools, Van Buren County, Michigan, General Obligation Bonds, School Building & Site, Series 2014A, 5.000%, 5/01/41 – BAM Insured | 5/24 at 100.00 | | AA | | 1,612,811 | |
| | 350 | | South Haven, Van Buren County, Michigan, General Obligation Bonds, Capital Improvement Series 2009, 5.125%, 12/01/33 – AGC Insured | 12/19 at 100.00 | | AA | | 391,934 | |
| | 3,600 | | Trenton Public Schools District, Michigan, General Obligation Bonds, School Building and Site Series 2008, 5.000%, 5/01/34 – AGM Insured | 5/18 at 100.00 | | Aa1 | | 3,869,064 | |
| | 550 | | Troy School District, Oakland County, Michigan, General Obligation Bonds, Refunding Series 2015, 5.000%, 5/01/26 | 5/25 at 100.00 | | AA | | 673,184 | |
| | | | Van Dyke Public Schools, Macomb County, Michigan, General Obligation Bonds, School Building & Site, Series 2008: | | | | | | |
| | 1,110 | | 5.000%, 5/01/31 – AGM Insured | 5/18 at 100.00 | | Aa1 | | 1,191,308 | |
| | 2,150 | | 5.000%, 5/01/38 – AGM Insured | 5/18 at 100.00 | | Aa1 | | 2,311,637 | |
| | 1,600 | | Walled Lake Consolidated School District, Oakland County, Michigan, General Obligation Bonds, School Building & Site Series 2014, 5.000%, 5/01/40 | 11/23 at 100.00 | | Aa1 | | 1,811,936 | |
| | 1,725 | | Williamston Community School District, Michigan, Unlimited Tax General Obligation QSBLF Bonds, Series 1996, 5.500%, 5/01/25 – NPFG Insured | No Opt. Call | | Aa2 | | 2,008,797 | |
| | 1,475 | | Willow Run Community Schools, Washtenaw County, Michigan, General Obligation Bonds, Refunding Series 2011, 4.500%, 5/01/31 – AGM Insured | 5/21 at 100.00 | | AA | | 1,639,138 | |
| | 109,695 | | Total Tax Obligation/General | | | | | 116,290,268 | |
| | Principal Amount (000) | | Description (1) | Optional Call Provisions (2) | | Ratings (3) | | Value | |
| | | | Tax Obligation/Limited – 17.5% (11.5% of Total Investments) | | | | | | |
| $ | 2,200 | | Lansing Township Downtown Development Authority, Ingham County, Michigan, Tax Increment Bonds, Series 2013A, 5.950%, 2/01/42 | 2/24 at 103.00 | | N/R | $ | 2,501,884 | |
| | | | Michigan Finance Authority, Local Government Loan Program Revenue Bonds, Detroit Regional Convention Facility Authority Local Project, Series 2014H-1: | | | | | | |
| | 1,240 | | 5.000%, 10/01/20 | 10/19 at 100.00 | | AA– | | 1,398,720 | |
| | 2,000 | | 5.000%, 10/01/24 | 10/23 at 100.00 | | AA– | | 2,392,080 | |
| | 2,000 | | 5.000%, 10/01/25 | 10/24 at 100.00 | | AA– | | 2,409,140 | |
| | 11,025 | | 5.000%, 10/01/39 | 10/24 at 100.00 | | AA– | | 12,346,456 | |
| | 3,230 | | Michigan Finance Authority, Unemployment Obligation Assessment Revenue Bonds, Series 2012B, 5.000%, 7/01/22 | 7/16 at 100.00 | | AAA | | 3,290,369 | |
| | | | Michigan State Building Authority, Revenue Bonds, Refunding Series 2006IA: | | | | | | |
| | 7,000 | | 0.000%, 10/15/27 – AGM Insured | 10/16 at 58.27 | | AA | | 4,046,140 | |
| | 7,720 | | 0.000%, 10/15/28 – AGM Insured | 10/16 at 55.35 | | AA | | 4,236,350 | |
| | 865 | | 0.000%, 10/15/30 – NPFG Insured | 10/16 at 50.02 | | Aa2 | | 428,045 | |
| | 6,140 | | 5.000%, 10/15/36 – NPFG Insured | 10/16 at 100.00 | | Aa2 | | 6,219,452 | |
| | 4,000 | | Michigan State Building Authority, Revenue Refunding Bonds, Facilities Program, Refunding Series 2015-I, 5.000%, 4/15/38 | 10/25 at 100.00 | | Aa2 | | 4,646,360 | |
| | | | Michigan State Trunk Line Fund Bonds, Series 2011: | | | | | | |
| | 1,100 | | 5.000%, 11/15/24 | 11/21 at 100.00 | | AA+ | | 1,303,995 | |
| | 1,750 | | 5.000%, 11/15/29 | 11/21 at 100.00 | | AA+ | | 2,064,965 | |
| | 1,605 | | 5.000%, 11/15/31 | 11/21 at 100.00 | | AA+ | | 1,878,123 | |
| | 1,160 | | 4.000%, 11/15/32 | 11/21 at 100.00 | | AA+ | | 1,234,217 | |
| | 1,970 | | 5.000%, 11/15/36 | 11/21 at 100.00 | | AA+ | | 2,287,840 | |
| | 1,370 | | Michigan State Trunk Line Fund Refunding Bonds, Refunding Series 2015, 5.000%, 11/15/22 | No Opt. Call | | AA+ | | 1,693,882 | |
| | | | Michigan State, Comprehensive Transportation Revenue Bonds, Refunding Series 2015: | | | | | | |
| | 1,065 | | 5.000%, 11/15/19 | No Opt. Call | | AA+ | | 1,229,393 | |
| | 1,950 | | 5.000%, 11/15/29 | 11/24 at 100.00 | | AA+ | | 2,365,545 | |
| | 59,390 | | Total Tax Obligation/Limited | | | | | 57,972,956 | |
| | | | Transportation – 2.9% (1.9% of Total Investments) | | | | | | |
| | 4,500 | | Wayne County Airport Authority, Michigan, Revenue Bonds, Detroit Metropolitan Airport, Refunding Series 2011A, 5.000%, 12/01/21 (Alternative Minimum Tax) | No Opt. Call | | A | | 5,199,390 | |
| | 4,000 | | Wayne County Airport Authority, Michigan, Revenue Bonds, Detroit Metropolitan Wayne County Airport, Series 2012A, 5.000%, 12/01/42 – AGM Insured | 12/22 at 100.00 | | AA | | 4,434,120 | |
| | 8,500 | | Total Transportation | | | | | 9,633,510 | |
| | | | U.S. Guaranteed – 14.8% (9.7% of Total Investments) (5) | | | | | | |
| | 100 | | Battle Creek School District, Calhoun County, Michigan, General Obligation Bonds, Series 2007, 5.000%, 5/01/37 (Pre-refunded 5/01/17) – AGM Insured | 5/17 at 100.00 | | Aa1 (5) | | 105,279 | |
| | | | Grand Rapids, Michigan, General Obligation Bonds, Capital Improvement Series 2007: | | | | | | |
| | 860 | | 5.000%, 9/01/24 (Pre-refunded 9/01/17) – NPFG Insured | 9/17 at 100.00 | | AA (5) | | 917,276 | |
| | 2,000 | | 5.000%, 9/01/27 (Pre-refunded 9/01/17) – NPFG Insured | 9/17 at 100.00 | | AA (5) | | 2,133,200 | |
| | 1,190 | | Grand Rapids, Michigan, Sanitary Sewer System Revenue Bonds, Series 2008, 5.000%, 1/01/38 (Pre-refunded 1/01/18) | 1/18 at 100.00 | | Aa1 (5) | | 1,285,260 | |
| | 1,650 | | Holly Area School District, Oakland County, Michigan, General Obligation Bonds, Series 2006, 5.125%, 5/01/32 (Pre-refunded 5/01/16) – NPFG Insured | 5/16 at 100.00 | | Aa1 (5) | | 1,664,075 | |
| | 1,185 | | Kalamazoo Public Schools, Michigan, General Obligation Bonds, Series 2006, 5.000%, 5/01/25 (Pre-refunded 5/01/16) – AGM Insured | 5/16 at 100.00 | | AA (5) | | 1,194,847 | |
| | 230 | | Kent County, Michigan, Airport Revenue Bonds, Gerald R. Ford International Airport, Series 2007, 5.000%, 1/01/32 (Pre-refunded 1/01/17) | 1/17 at 100.00 | | AAA | | 238,880 | |
| | 5,505 | | Michigan Finance Authority, Hospital Revenue Bonds, Crittenton Hospital Medical Center, Refunding Series 2012A, 5.000%, 6/01/39 (Pre-refunded 6/01/22) | 6/22 at 100.00 | | N/R (5) | | 6,712,577 | |
| | 35 | | Michigan Finance Authority, Revenue Bonds, Trinity Health Credit Group, Refunding Series 2011, 5.000%, 12/01/39 (Pre-refunded 12/01/21) | 12/21 at 100.00 | | N/R (5) | | 42,552 | |
| NUM | Nuveen Michigan Quality Income Municipal Fund | |
| | Portfolio of Investments (continued) | February 29, 2016 |
| | Principal Amount (000) | | Description (1) | Optional Call Provisions (2) | | Ratings (3) | | Value | |
| | | | U.S. Guaranteed (5) (continued) | | | | | | |
| | | | Michigan Municipal Bond Authority, Water Revolving Fund Revenue Bonds, Series 2007: | | | | | | |
| $ | 430 | | 5.000%, 10/01/23 (Pre-refunded 10/01/17) | 10/17 at 100.00 | | N/R (5) | $ | 460,190 | |
| | 1,775 | | 5.000%, 10/01/24 (Pre-refunded 10/01/17) | 10/17 at 100.00 | | N/R (5) | | 1,899,623 | |
| | | | Michigan State Building Authority, Revenue Bonds, Refunding Series 2006IA: | | | | | | |
| | 635 | | 0.000%, 10/15/30 (Pre-refunded 10/15/16) – NPFG Insured | 10/16 at 50.02 | | AA– (5) | | 316,725 | |
| | 1,900 | | 5.000%, 10/15/36 (Pre-refunded 10/15/16) – NPFG Insured | 10/16 at 100.00 | | AA– (5) | | 1,955,594 | |
| | 4,000 | | Michigan State Hospital Finance Authority, Hospital Revenue Bonds, MidMichigan Obligated Group, Series 2009A, 5.875%, 6/01/39 (Pre-refunded 6/01/19) – AGC Insured | 6/19 at 100.00 | | AA+ (5) | | 4,645,400 | |
| | 3,415 | | Michigan State Hospital Finance Authority, Hospital Revenue Refunding Bonds, St. John's Health System, Series 1998A, 5.000%, 5/15/28 – AMBAC Insured (ETM) | 5/16 at 100.00 | | Aaa | | 3,429,241 | |
| | 1,410 | | New Haven Community Schools, Macomb County, Michigan, General Obligation Bonds, Series 2006, 5.000%, 5/01/25 (Pre-refunded 5/01/16) – AGM Insured | 5/16 at 100.00 | | Aa1 (5) | | 1,421,717 | |
| | | | Ottawa County, Michigan, Water Supply System, General Obligation Bonds, Series 2007: | | | | | | |
| | 4,330 | | 5.000%, 8/01/26 (Pre-refunded 8/01/17) – NPFG Insured (UB) | 8/17 at 100.00 | | Aaa | | 4,604,609 | |
| | 5,620 | | 5.000%, 8/01/30 (Pre-refunded 8/01/17) – NPFG Insured (UB) | 8/17 at 100.00 | | Aaa | | 5,976,420 | |
| | 3,640 | | Royal Oak Hospital Finance Authority, Michigan, Hospital Revenue Bonds, William Beaumont Hospital Obligated Group, Refunding Series 2009W, 6.000%, 8/01/39 (Pre-refunded 8/01/19) | 8/19 at 100.00 | | A1 (5) | | 4,280,604 | |
| | 1,500 | | Royal Oak Hospital Finance Authority, Michigan, Hospital Revenue Bonds, William Beaumont Hospital, Refunding Series 2009V, 8.250%, 9/01/39 (Pre-refunded 9/01/18) | 9/18 at 100.00 | | Aaa | | 1,781,400 | |
| | 1,535 | | Thornapple Kellogg School District, Barry County, Michigan, General Obligation Bonds, Series 2007, 5.000%, 5/01/32 (Pre-refunded 5/01/17) – NPFG Insured | 5/17 at 100.00 | | Aa1 (5) | | 1,616,278 | |
| | 2,275 | | Troy City School District, Oakland County, Michigan, General Obligation Bonds, Series 2006, 5.000%, 5/01/19 (Pre-refunded 5/01/16) – NPFG Insured | 5/16 at 100.00 | | Aa1 (5) | | 2,293,905 | |
| | 45,220 | | Total U.S. Guaranteed | | | | | 48,975,652 | |
| | | | Utilities – 13.7% (9.0% of Total Investments) | | | | | | |
| | | | Holland, Michigan, Electric Utility System Revenue Bonds, Series 2014A: | | | | | | |
| | 2,750 | | 5.000%, 7/01/33 | 7/21 at 100.00 | | AA | | 3,154,470 | |
| | 6,020 | | 5.000%, 7/01/39 | No Opt. Call | | AA | | 6,925,106 | |
| | | | Lansing Board of Water and Light, Michigan, Steam and Electric Utility System Revenue Bonds, Series 2008A: | | | | | | |
| | 390 | | 5.000%, 7/01/28 | 7/18 at 100.00 | | AA– | | 424,176 | |
| | 8,250 | | 5.000%, 7/01/32 | 7/18 at 100.00 | | AA– | | 8,896,222 | |
| | | | Lansing Board of Water and Light, Michigan, Utility System Revenue Bonds, Tender Option Bond Trust 4700: | | | | | | |
| | 1,700 | | 18.374%, 7/01/37 (IF) (4) | 7/21 at 100.00 | | AA– | | 2,700,144 | |
| | 1,110 | | 18.374%, 7/01/37 (IF) (4) | 7/21 at 100.00 | | AA– | | 1,763,035 | |
| | | | Michigan Public Power Agency, AFEC Project Revenue Bonds, Series 2012A: | | | | | | |
| | 1,900 | | 5.000%, 1/01/27 | 1/22 at 100.00 | | A2 | | 2,131,268 | |
| | 4,530 | | 5.000%, 1/01/43 | 1/22 at 100.00 | | A2 | | 4,863,544 | |
| | | | Michigan Public Power Agency, Revenue Bonds, Combustion Turbine 1 Project, Refunding Series 2011: | | | | | | |
| | 1,760 | | 5.000%, 1/01/24 – AGM Insured | 1/21 at 100.00 | | AA | | 2,013,686 | |
| | 1,990 | | 5.000%, 1/01/25 – AGM Insured | 1/21 at 100.00 | | AA | | 2,261,038 | |
| | 2,180 | | 5.000%, 1/01/26 – AGM Insured | 1/21 at 100.00 | | AA | | 2,465,100 | |
| | 290 | | 5.000%, 1/01/27 – AGM Insured | 1/21 at 100.00 | | AA | | 326,221 | |
| | 3,640 | | Michigan Strategic Fund, Limited Obligation Revenue Refunding Bonds, Detroit Edison Company, Series 1991BB, 7.000%, 5/01/21 – AMBAC Insured | No Opt. Call | | Aa3 | | 4,634,776 | |
| | 2,700 | | Wyandotte, Michigan, Electric Revenue Bonds, Refunding Series 2015, 5.000%, 10/01/44 – BAM Insured | 10/25 at 100.00 | | AA | | 2,893,185 | |
| | 39,210 | | Total Utilities | | | | | 45,451,971 | |
| | Principal Amount (000) | | Description (1) | Optional Call Provisions (2) | | Ratings (3) | | Value | |
| | | | Water and Sewer – 15.3% (10.1% of Total Investments) | | | | | | |
| $ | 425 | | Detroit, Michigan, Sewage Disposal System Revenue Bonds, Second Lien Series 2006A, 5.500%, 7/01/36 – BHAC Insured | 7/18 at 100.00 | | AA+ | $ | 459,115 | |
| | 10,100 | | Detroit, Michigan, Water Supply System Second Lien Revenue Bonds, Series 2006A, 5.000%, 7/01/34 – AGM Insured | 7/16 at 100.00 | | AA | | 10,178,981 | |
| | 190 | | Detroit, Michigan, Water Supply System Second Lien Revenue Refunding Bonds, Series 2006C, 5.000%, 7/01/33 – AGM Insured | No Opt. Call | | AA | | 191,493 | |
| | | | Grand Rapids, Michigan, Sanitary Sewer System Revenue Bonds, Improvement & Refunding Series 2014: | | | | | | |
| | 1,000 | | 5.000%, 1/01/32 | 1/24 at 100.00 | | Aa1 | | 1,176,930 | |
| | 1,000 | | 5.000%, 1/01/33 | 1/24 at 100.00 | | Aa1 | | 1,173,050 | |
| | 1,000 | | 5.000%, 1/01/34 | 1/24 at 100.00 | | Aa1 | | 1,169,180 | |
| | 1,855 | | 5.000%, 1/01/44 | 1/24 at 100.00 | | Aa1 | | 2,120,729 | |
| | 2,605 | | Grand Rapids, Michigan, Water Supply System Revenue Bonds, Series 2009, 5.100%, 1/01/39 – AGC Insured | 1/19 at 100.00 | | AA | | 2,863,859 | |
| | | | Michigan Finance Authority, Local Government Loan Program Revenue Bonds, Detroit Water &Sewerage Department Water Supply System Local Project, Refunding Senior Loan Series 2014D-1: | | | | | | |
| | 1,500 | | 5.000%, 7/01/35 – AGM Insured | 7/24 at 100.00 | | AA | | 1,702,050 | |
| | 1,220 | | 5.000%, 7/01/37 – AGM Insured | 7/24 at 100.00 | | AA | | 1,374,806 | |
| | | | Michigan Finance Authority, State Revolving Fund Revenue Bonds, Clean Water Series 2012: | | | | | | |
| | 2,000 | | 5.000%, 10/01/31 | 10/22 at 100.00 | | AAA | | 2,374,060 | |
| | 1,135 | | 5.000%, 10/01/32 | 10/22 at 100.00 | | AAA | | 1,342,274 | |
| | | | Michigan Finance Authority, State Revolving Fund Revenue Bonds, Clean Water Subordinate Refunding Series 2013: | | | | | | |
| | 2,005 | | 5.000%, 10/01/19 | No Opt. Call | | AAA | | 2,305,008 | |
| | 1,955 | | 5.000%, 10/01/22 | No Opt. Call | | AAA | | 2,416,243 | |
| | 3,200 | | 5.000%, 10/01/25 | 10/22 at 100.00 | | AAA | | 3,903,488 | |
| | 2,000 | | Michigan Finance Authority, State Revolving Fund Revenue Bonds, Clean Water, Refunding Series 2012, 5.000%, 10/01/20 | No Opt. Call | | AAA | | 2,367,800 | |
| | 580 | | Michigan Municipal Bond Authority, Clean Water Revolving Fund Revenue Bonds, Series 2004, 5.000%, 10/01/19 | 5/16 at 100.00 | | AAA | | 582,407 | |
| | 170 | | Michigan Municipal Bond Authority, Clean Water Revolving Fund Revenue Bonds, Series 2005, 5.000%, 10/01/19 | 5/16 at 100.00 | | AAA | | 173,645 | |
| | | | Michigan Municipal Bond Authority, Clean Water Revolving Fund Revenue Bonds, Series 2010: | | | | | | |
| | 390 | | 5.000%, 10/01/26 | No Opt. Call | | AAA | | 455,637 | |
| | 475 | | 5.000%, 10/01/30 | No Opt. Call | | AAA | | 549,133 | |
| | 90 | | Michigan Municipal Bond Authority, Drinking Water Revolving Fund Revenue Bonds, Series 2004, 5.000%, 10/01/23 | 5/16 at 100.00 | | AAA | | 90,373 | |
| | | | Michigan Municipal Bond Authority, Water Revolving Fund Revenue Bonds, Series 2007: | | | | | | |
| | 70 | | 5.000%, 10/01/23 | 10/17 at 100.00 | | AAA | | 74,962 | |
| | 225 | | 5.000%, 10/01/24 | 10/17 at 100.00 | | AAA | | 241,025 | |
| | 8,245 | | North Kent Sewer Authority, Michigan, Sewer Revenue Bonds, Series 2006, 5.000%, 11/01/31 – NPFG Insured | 11/16 at 100.00 | | AA | | 8,447,826 | |
| | | | Port Huron, Michigan, Water Supply System Revenue Bonds, Series 2011: | | | | | | |
| | 500 | | 5.250%, 10/01/31 | 10/21 at 100.00 | | A | | 552,870 | |
| | 1,500 | | 5.625%, 10/01/40 | 10/21 at 100.00 | | A | | 1,692,945 | |
| | 700 | | Saginaw, Michigan, Water Supply System Revenue Bonds, Series 2008, 5.250%, 7/01/22 – NPFG Insured | 7/18 at 100.00 | | AA– | | 759,941 | |
| | 46,135 | | Total Water and Sewer | | | | | 50,739,830 | |
| $ | 467,085 | | Total Long-Term Investments (cost $468,108,771) | | | | | 504,350,414 | |
| | | | Floating Rate Obligations – (5.7)% | | | | | (18,890,000 | ) |
| | | | Variable Rate MuniFund Term Preferred Shares, at Liquidation Preference – (48.0)% (6) | | | | | (159,000,000 | ) |
| | | | Other Assets Less Liabilities – 1.5% | | | | | 5,005,310 | |
| | | | Net Assets Applicable to Common Shares – 100% | | | | $ | 331,465,724 | |
| NUM | Nuveen Michigan Quality Income Municipal Fund | |
| | Portfolio of Investments (continued) | February 29, 2016 |
| (1) | All percentages shown in the Portfolio of Investments are based on net assets applicable to common shares unless otherwise noted. |
| (2) | Optional Call Provisions (not covered by the report of independent registered public accounting firm): Dates (month and year) and prices of the earliest optional call redemption. There may be other call provisions at varying prices at later dates. Certain mortgage-backed securities may be subject to periodic principal paydowns. |
| (3) | Ratings (not covered by the report of independent registered public accounting firm): Using the highest of Standard & Poor's Group ("Standard & Poor's"), Moody's Investors Service, Inc. ("Moody's") or Fitch, Inc. ("Fitch") rating. Ratings below BBB by Standard & Poor's, Baa by Moody's or BBB by Fitch are considered to be below investment grade. Holdings designated N/R are not rated by any of these national rating agencies. |
| (4) | Investment, or portion of investment, has been pledged to collateralize the net payment obligations for investments in inverse floating rate transactions. |
| (5) | Backed by an escrow or trust containing sufficient U.S. Government or U.S. Government agency securities, which ensure the timely payment of principal and interest. Certain bonds backed by U.S. Government or agency securities are regarded as having an implied rating equal to the rating of such securities. |
| (6) | Variable Rate MuniFund Term Preferred Shares, at Liquidation Preference as a percentage of Total Investments is 31.5%. |
| (ETM) | Escrowed to maturity. |
| (IF) | Inverse floating rate investment. |
| (UB) | Underlying bond of an inverse floating rate trust reflected as a financing transaction. See Notes to Financial Statements, Note 3 – Portfolio Securities and Investments in Derivatives, Inverse Floating Rate Securities for more information. |
| | |
| | See accompanying notes to financial statements. |
| NUO | | |
| | Nuveen Ohio Quality Income Municipal Fund | |
| | Portfolio of Investments | February 29, 2016 |
| | Principal Amount (000) | | Description (1) | Optional Call Provisions (2) | | Ratings (3) | | Value | |
| | | | LONG-TERM INVESTMENTS – 144.2% (100.0% of Total Investments) | | | | | | |
| | | | MUNICIPAL BONDS – 144.2% (100.0% of Total Investments) | | | | | | |
| | | | Consumer Staples – 4.8% (3.3% of Total Investments) | | | | | | |
| $ | 400 | | Buckeye Tobacco Settlement Financing Authority, Ohio, Tobacco Settlement Asset-Backed Revenue Bonds, Senior Lien, Series 2007A-1, 5.000%, 6/01/16 | No Opt. Call | | Aaa | $ | 403,924 | |
| | | | Buckeye Tobacco Settlement Financing Authority, Ohio, Tobacco Settlement Asset-Backed Revenue Bonds, Senior Lien, Series 2007A-2: | | | | | | |
| | 15,035 | | 5.125%, 6/01/24 | 6/17 at 100.00 | | B– | | 13,870,539 | |
| | 1,085 | | 5.875%, 6/01/47 | 6/17 at 100.00 | | B– | | 977,661 | |
| | 16,520 | | Total Consumer Staples | | | | | 15,252,124 | |
| | | | Education and Civic Organizations – 7.5% (5.2% of Total Investments) | | | | | | |
| | 4,375 | | Miami University of Ohio, General Receipts Bonds, Refunding Series 2014, 5.000%, 9/01/33 | 9/24 at 100.00 | | AA | | 5,153,356 | |
| | | | Miami University of Ohio, General Receipts Bonds, Series 2011: | | | | | | |
| | 130 | | 5.000%, 9/01/33 | No Opt. Call | | AA | | 150,604 | |
| | 1,960 | | 5.000%, 9/01/36 | 9/21 at 100.00 | | AA | | 2,270,640 | |
| | | | Miami University of Ohio, General Receipts Bonds, Series 2012: | | | | | | |
| | 480 | | 4.000%, 9/01/32 | 9/22 at 100.00 | | AA | | 518,486 | |
| | 1,000 | | 4.000%, 9/01/33 | 9/22 at 100.00 | | AA | | 1,076,470 | |
| | 370 | | Ohio Higher Education Facilities Commission, General Revenue Bonds, Kenyon College, Series 2006, 5.000%, 7/01/41 | 7/16 at 100.00 | | A+ | | 374,806 | |
| | 2,280 | | Ohio Higher Educational Facilities Commission, General Revenue Bonds, University of Dayton, 2006 Project, Series 2006, 5.000%, 12/01/30 – AMBAC Insured | 12/16 at 100.00 | | A | | 2,345,801 | |
| | | | Ohio Higher Educational Facilities Commission, Revenue Bonds, Denison University Project, Series 2012: | | | | | | |
| | 120 | | 5.000%, 11/01/27 | 5/22 at 100.00 | | AA | | 143,327 | |
| | 590 | | 5.000%, 11/01/32 | 5/22 at 100.00 | | AA | | 691,781 | |
| | 5,000 | | Ohio Higher Educational Facilities Commission, Revenue Bonds, University of Dayton, Series 2013, 5.000%, 12/01/43 | 12/22 at 100.00 | | A | | 5,574,800 | |
| | 2,250 | | Ohio State Higher Education Facilities, Revenue Bonds, Case Western Reserve University, Series 2006, 5.000%, 12/01/44 – NPFG Insured | 12/16 at 100.00 | | AA– | | 2,316,465 | |
| | 950 | | Ohio State, Higher Educational Facility Revenue Bonds, Otterbein College Project, Series 2008A, 5.500%, 12/01/28 | 12/18 at 100.00 | | A3 | | 1,049,370 | |
| | 1,000 | | Ohio University at Athens, General Receipts Bonds, Series 2013, 5.000%, 12/01/39 | 12/22 at 100.00 | | Aa3 | | 1,150,350 | |
| | 1,000 | | Tuscarawas County Economic Development and Finance Alliance, Ohio, Higher Education Facilities Revenue Bonds, Ashland University, Refunding & Improvement Series 2015, 6.000%, 3/01/45 | 3/25 at 100.00 | | N/R | | 1,019,490 | |
| | 21,505 | | Total Education and Civic Organizations | | | | | 23,835,746 | |
| | | | Health Care – 30.3% (21.0% of Total Investments) | | | | | | |
| | 3,000 | | Akron, Bath and Copley Joint Township Hospital District, Ohio, Hospital Revenue Bonds, Children's Hospital Medical Center, Improvement Series 2013, 5.000%, 11/15/38 | 5/23 at 100.00 | | A1 | | 3,313,620 | |
| | 1,950 | | Allen County, Ohio, Hospital Facilities Revenue Bonds, Catholic Healthcare Partners, Series 2010A, 5.250%, 6/01/38 | 6/20 at 100.00 | | AA– | | 2,183,552 | |
| | 3,500 | | Butler County, Ohio, Hospital Facilities Revenue Bonds, UC Health, Series 2010, 5.500%, 11/01/40 | 11/20 at 100.00 | | A | | 4,095,700 | |
| | 6,575 | | Butler County, Ohio, Hospital Facilities Revenue Bonds, Cincinnati Children's Medical Center Project, Series 2006K, 5.000%, 5/15/31 – FGIC Insured | 5/16 at 100.00 | | A3 | | 6,620,170 | |
| | 2,400 | | Fairfield County, Ohio, Hospital Facilities Revenue Bonds, Fairfield Medical Center Project, Series 2013, 5.000%, 6/15/43 | 6/23 at 100.00 | | Baa2 | | 2,601,720 | |
| NUO | Nuveen Ohio Quality Income Municipal Fund | |
| | Portfolio of Investments (continued) | February 29, 2016 |
| | Principal Amount (000) | | Description (1) | Optional Call Provisions (2) | | Ratings (3) | | Value | |
| | | | Health Care (continued) | | | | | | |
| | | | Franklin County, Ohio, Hospital Revenue Bonds, Nationwide Children's Hospital Project, Improvement Series 2009: | | | | | | |
| $ | 250 | | 5.000%, 11/01/34 | 11/19 at 100.00 | | Aa2 | $ | 277,263 | |
| | 2,615 | | 5.250%, 11/01/40 | 11/19 at 100.00 | | Aa2 | | 2,907,514 | |
| | 2,470 | | Franklin County, Ohio, Hospital Revenue Bonds, Nationwide Children's Hospital Project, Series 2008A, 5.000%, 11/01/40 | 11/18 at 100.00 | | Aa2 | | 2,649,791 | |
| | 250 | | Franklin County, Ohio, Hospital Revenue Bonds, OhioHealth Corporation, Series 2011A, 5.000%, 11/15/41 | 11/21 at 100.00 | | AA+ | | 278,693 | |
| | 4,480 | | Franklin County, Ohio, Hospital Revenue Bonds, OhioHealth Corporation, Tender Option Bond Trust 11-21B, 9.394%, 11/15/41 (IF) (4) | 11/21 at 100.00 | | AA+ | | 5,508,339 | |
| | 3,225 | | Hancock County, Ohio, Hospital Revenue Bonds, Blanchard Valley Regional Health Center, Series 2011A, 6.250%, 12/01/34 | 6/21 at 100.00 | | A2 | | 3,814,369 | |
| | 300 | | Lake County, Ohio, Hospital Facilities Revenue Bonds, Lake Hospital System, Inc., Refunding Series 2008C, 6.000%, 8/15/29 | 8/18 at 100.00 | | A3 | | 329,283 | |
| | | | Lucas County, Ohio, Hospital Revenue Bonds, ProMedica Healthcare Obligated Group, Series 2008D: | | | | | | |
| | 90 | | 5.000%, 11/15/38 | 11/18 at 100.00 | | AA | | 96,915 | |
| | 40 | | 5.125%, 11/15/40 | 11/18 at 100.00 | | AA | | 43,084 | |
| | 3,965 | | Lucas County, Ohio, Hospital Revenue Bonds, ProMedica Healthcare Obligated Group, Series 2011A, 6.000%, 11/15/41 | 11/21 at 100.00 | | AA | | 4,766,961 | |
| | 1,500 | | Miami County, Ohio, Hospital Facilities Revenue Refunding Bonds, Upper Valley Medical Center Inc., Series 2006, 5.250%, 5/15/21 | 5/16 at 100.00 | | A | | 1,514,670 | |
| | 820 | | Middleburg Heights, Ohio, Hospital Facilities Revenue Bonds, Southwest General Health Center Project, Refunding Series 2011, 5.250%, 8/01/41 | 8/21 at 100.00 | | A2 | | 898,982 | |
| | | | Montgomery County, Ohio, Revenue Bonds, Catholic Health Initiatives, Series 2004A: | | | | | | |
| | 3,700 | | 5.000%, 5/01/30 | 5/16 at 100.00 | | A+ | | 3,712,654 | |
| | 2,500 | | 5.000%, 5/01/32 | 5/16 at 100.00 | | A+ | | 2,505,875 | |
| | 6,105 | | Muskingum County, Ohio, Hospital Facilities Revenue Bonds, Genesis HealthCare System Obligated Group Project, Series 2013, 5.000%, 2/15/44 | 2/23 at 100.00 | | BB+ | | 6,315,073 | |
| | | | Ohio State Higher Educational Facilities Commission, Hospital Revenue Bonds, Cleveland Clinic Health System Obligated Group, Series 2008A: | | | | | | |
| | 3,000 | | 5.000%, 1/01/25 | 1/18 at 100.00 | | Aa2 | | 3,227,220 | |
| | 240 | | 5.250%, 1/01/33 | 1/18 at 100.00 | | Aa2 | | 258,535 | |
| | 1,100 | | Ohio State Higher Educational Facilities Commission, Hospital Revenue Bonds, Cleveland Clinic Health System Obligated Group, Series 2012A, 5.000%, 1/01/38 | 1/22 at 100.00 | | Aa2 | | 1,255,562 | |
| | | | Ohio State Higher Educational Facilities Commission, Hospital Revenue Bonds, Summa Health System Project, Series 2010: | | | | | | |
| | 1,500 | | 5.750%, 11/15/40 – AGM Insured | 5/20 at 100.00 | | AA | | 1,698,780 | |
| | 1,520 | | 5.250%, 11/15/40 – AGM Insured | 5/20 at 100.00 | | AA | | 1,682,822 | |
| | 8,050 | | Ohio State, Hospital Facility Revenue Bonds, Cleveland Clinic Health System Obligated Group, Refunding Series 2009A, 5.500%, 1/01/39 | 1/19 at 100.00 | | Aa2 | | 9,042,002 | |
| | | | Ohio State, Hospital Facility Revenue Refunding Bonds, Cleveland Clinic Health System Obligated Group, Tender Option Bond Trust 2015-XF0105: | | | | | | |
| | 5,350 | | 20.047%, 1/01/33 (IF) | 1/19 at 100.00 | | Aa2 | | 7,987,122 | |
| | 875 | | 20.047%, 7/01/36 (IF) | 1/18 at 100.00 | | Aa2 | | 1,149,855 | |
| | | | Ohio State, Hospital Revenue Bonds, University Hospitals Health System, Inc., Series 2013A: | | | | | | |
| | 1,000 | | 5.000%, 1/15/28 | 1/23 at 100.00 | | A | | 1,154,630 | |
| | 2,000 | | 5.000%, 1/15/29 | 1/23 at 100.00 | | A | | 2,298,420 | |
| | | | Ross County, Ohio, Hospital Revenue Refunding Bonds, Adena Health System Series 2008: | | | | | | |
| | 1,425 | | 5.750%, 12/01/28 | 12/18 at 100.00 | | A– | | 1,590,343 | |
| | 1,385 | | 5.750%, 12/01/35 | 12/18 at 100.00 | | A– | | 1,534,940 | |
| | 1,000 | | 5.750%, 12/01/35 – AGC Insured | 12/18 at 100.00 | | AA | | 1,108,260 | |
| | Principal | | | Optional Call | | | | | | |
| | Amount (000) | | Description (1) | Provisions (2) | | Ratings (3) | | | Value | |
| | | | Health Care (continued) | | | | | | | |
| | | | Wood County, Ohio, Hospital Facilities Refunding and Improvement Revenue Bonds, Wood County Hospital Project, Series 2012: | | | | | | | |
| $ | 2,635 | | 5.000%, 12/01/37 | No Opt. Call | | Baa2 | | $ | 2,790,281 | |
| | 4,920 | | 5.000%, 12/01/42 | No Opt. Call | | Baa2 | | | 5,186,074 | |
| | 85,735 | | Total Health Care | | | | | | 96,399,074 | |
| | | | Housing/Multifamily – 2.6% (1.8% of Total Investments) | | | | | | | |
| | 1,265 | | Clermont County, Ohio, GNMA Collateralized Mortgage Revenue Bonds, S.E.M. Villa II Project, Series 1994A, 5.950%, 2/20/30 | 8/16 at 100.00 | | N/R | | | 1,267,973 | |
| | 495 | | Franklin County, Ohio, GNMA Collateralized Multifamily Housing Mortgage Revenue Bonds, Agler Project, Series 2002A, 5.550%, 5/20/22 (Alternative Minimum Tax) | 5/16 at 100.00 | | Aaa | | | 496,346 | |
| | 1,600 | | Montgomery County, Ohio, GNMA Guaranteed Multifamily Housing Revenue Bonds, Canterbury Court Project, Series 2007, 5.500%, 10/20/42 (Alternative Minimum Tax) | 10/18 at 101.00 | | Aa1 | | | 1,684,368 | |
| | 1,165 | | Ohio Housing Finance Agency, FHA-Insured Multifamily Housing Mortgage Revenue Bonds, Madonna Homes, Series 2006M, 4.900%, 6/20/48 (Alternative Minimum Tax) | 6/16 at 102.00 | | A1 | | | 1,187,193 | |
| | 3,390 | | Summit County Port Authority, Ohio, Multifamily Housing Revenue Bonds, Callis Tower Apartments Project, Series 2007, 5.250%, 9/20/47 (Alternative Minimum Tax) | 9/17 at 102.00 | | Aa1 | | | 3,523,600 | |
| | 7,915 | | Total Housing/Multifamily | | | | | | 8,159,480 | |
| | | | Industrials – 2.0% (1.4% of Total Investments) | | | | | | | |
| | 2,055 | | Cleveland-Cuyahoga County Port Authority, Ohio, Common Bond Fund Revenue Bonds, Cleveland Christian Home Project, Series 2002C, 5.950%, 5/15/22 | 5/16 at 100.00 | | BBB+ | | | 2,063,446 | |
| | 3,495 | | Toledo-Lucas County Port Authority, Ohio, Revenue Refunding Bonds, CSX Transportation Inc., Series 1992, 6.450%, 12/15/21 | No Opt. Call | | Baa1 | | | 4,421,105 | |
| | 1,600 | | Western Reserve Port Authority, Ohio, Solid Waste Facility Revenue Bonds, Central Waste Inc., Series 2007A, 6.350%, 7/01/27 (Alternative Minimum Tax) (5) | 7/17 at 102.00 | | N/R | | | 7,824 | |
| | 7,150 | | Total Industrials | | | | | | 6,492,375 | |
| | | | Long-Term Care – 1.1% (0.8% of Total Investments) | | | | | | | |
| | 895 | | Franklin County, Ohio, Healthcare Facilities Revenue Bonds, Ohio Presbyterian Retirement Services, Improvement Series 2010A, 5.625%, 7/01/26 | 7/21 at 100.00 | | BBB– | | | 983,569 | |
| | 2,220 | | Montgomery County, Ohio, Health Care and Multifamily Housing Revenue Bonds, Saint Leonard, Refunding & improvement Series 2010, 6.625%, 4/01/40 | 4/20 at 100.00 | | BBB– | | | 2,469,550 | |
| | 3,115 | | Total Long-Term Care | | | | | | 3,453,119 | |
| | | | Tax Obligation/General – 21.8% (15.2% of Total Investments) | | | | | | | |
| | | | Central Ohio Solid Waste Authority, General Obligation Bonds, Refunding & Improvements, Series 2012: | | | | | | | |
| | 1,140 | | 5.000%, 12/01/26 | 6/22 at 100.00 | | Aaa | | | 1,369,573 | |
| | 2,545 | | 5.000%, 12/01/28 | 6/22 at 100.00 | | Aaa | | | 3,031,884 | |
| | 1,605 | | 5.000%, 12/01/29 | 6/22 at 100.00 | | Aaa | | | 1,906,660 | |
| | 2,000 | | Cleveland, Ohio, General Obligation Bonds, Series 2011, 5.000%, 12/01/29 | 12/19 at 100.00 | | AA | | | 2,258,760 | |
| | 1,140 | | Columbia Local School District, Lorain County, Ohio, General Obligation Bonds, School Facilities Improvement Series 2011, 5.000%, 11/01/39 – AGM Insured | 11/21 at 100.00 | | A2 | | | 1,263,713 | |
| | | | Columbus City School District, Franklin County, Ohio, General Obligation Bonds, Refunding Series 2006: | | | | | | | |
| | 4,310 | | 0.000%, 12/01/27 – AGM Insured | No Opt. Call | | AA+ | | | 3,199,399 | |
| | 5,835 | | 0.000%, 12/01/28 – AGM Insured | No Opt. Call | | AA+ | | | 4,196,065 | |
| | | | Dublin, Ohio, General Obligation Bonds, Limited Tax Various Purpose Series 2015: | | | | | | | |
| | 725 | | 5.000%, 12/01/26 | 12/25 at 100.00 | | Aaa | | | 930,074 | |
| | 900 | | 5.000%, 12/01/32 | 12/25 at 100.00 | | Aaa | | | 1,110,348 | |
| | 1,000 | | 5.000%, 12/01/34 | 12/25 at 100.00 | | Aaa | | | 1,222,960 | |
| | 1,730 | | Franklin County, Ohio, General Obligation Bonds, Refunding Series 2014, 5.000%, 6/01/31 | 12/23 at 100.00 | | AAA | | | 2,106,638 | |
| NUO | Nuveen Ohio Quality Income Municipal Fund | |
| | Portfolio of Investments (continued) | February 29, 2016 |
| | Principal | | | Optional Call | | | | | | |
| | Amount (000) | | Description (1) | Provisions (2) | | Ratings (3) | | | Value | |
| | | | Tax Obligation/General (continued) | | | | | | | |
| | | | Gallia County Local School District, Gallia and Jackson Counties, Ohio, General Obligation Bonds, Refunding School Improvement Series 2014: | | | | | | | |
| $ | 1,260 | | 5.000%, 11/01/30 | 11/24 at 100.00 | | Aa2 | | $ | 1,498,946 | |
| | 1,540 | | 5.000%, 11/01/31 | 11/24 at 100.00 | | Aa2 | | | 1,822,621 | |
| | | | Greenville City School District, Drake County, Ohio, General Obligation Bonds, School Improvement Series 2013: | | | | | | | |
| | 555 | | 5.250%, 1/01/38 | 1/22 at 100.00 | | AA | | | 630,635 | |
| | 1,355 | | 5.250%, 1/01/41 | 1/22 at 100.00 | | AA | | | 1,531,841 | |
| | 1,355 | | Grove City, Ohio, General Obligation Bonds, Construction & Improvement Series 2009, 5.125%, 12/01/36 | 12/19 at 100.00 | | Aa1 | | | 1,512,112 | |
| | 6,580 | | Indian Lake Local School District, Logan and Auglaize Counties, Ohio, School Facilities Improvement and Refunding Bonds, Series 2007, 5.000%,
12/01/34 – NPFG Insured | 6/17 at 100.00 | | AA– | | | 6,883,141 | |
| | 2,160 | | Kenston Local School District, Geauga County, Ohio, General Obligation Bonds, Series 2011, 0.000%, 12/01/21 | No Opt. Call | | Aa1 | | | 1,986,682 | |
| | 2,620 | | Lucas County, Ohio, General Obligation Bonds, Various Purpose Series 2010, 5.000%, 10/01/40 | 10/18 at 100.00 | | AA | | | 2,859,835 | |
| | 4,500 | | Middletown City School District, Butler County, Ohio, General Obligation Bonds, Refunding Series 2007, 5.250%, 12/01/31 – AGM Insured | No Opt. Call | | A2 | | | 5,757,075 | |
| | 1,305 | | Monroe Local School District, Butler County, Ohio, General Obligation Bonds, Series 2006, 5.500%, 12/01/24 – AMBAC Insured | No Opt. Call | | Baa1 | | | 1,607,616 | |
| | 725 | | Napoleon City School District, Henry County, Ohio, General Obligation Bonds, Facilities Construction & Improvement Series 2012, 5.000%, 12/01/36 | 6/22 at 100.00 | | Aa3 | | | 819,910 | |
| | 2,300 | | Northmor Local School District, Morrow County, Ohio, General Obligation Bonds, School Facilities Construction & Improvement Series 2008, 5.000%, 11/01/36 | 11/18 at 100.00 | | Aa2 | | | 2,512,888 | |
| | 3,000 | | Ohio State, General Obligation Bonds, Highway Capital Improvement, Series 2014R, 5.000%, 5/01/29 | 5/24 at 100.00 | | AAA | | | 3,635,910 | |
| | 3,055 | | Ohio State, General Obligation Bonds, Refunding Common Schools Series 2015B, 5.000%, 6/15/32 | 6/22 at 100.00 | | AA+ | | | 3,622,252 | |
| | 5,000 | | South Euclid, Ohio, General Obligation Bonds, Real Estate Acquisition and Urban Redevelopment, Series 2012, 5.000%, 6/01/42 | 6/22 at 100.00 | | Aa2 | | | 5,488,500 | |
| | 2,250 | | South-Western City School District, Franklin and Pickaway Counties, Ohio, General Obligation Bonds, School Facilities Construction & Improvement Series 2012, 5.000%, 12/01/36 | 6/22 at 100.00 | | AA | | | 2,612,295 | |
| | 1,500 | | Springboro Community City School District, Warren County, Ohio, General Obligation Bonds, Refunding Series 2007, 5.250%, 12/01/32 | No Opt. Call | | AA | | | 1,944,165 | |
| | 70 | | Strongsville, Ohio, Limited Tax General Obligation Various Purpose Improvement Bonds, Series 1996, 5.950%, 12/01/21 | 5/16 at 100.00 | | Aaa | | | 70,350 | |
| | 64,060 | | Total Tax Obligation/General | | | | | | 69,392,848 | |
| | | | Tax Obligation/Limited – 32.9% (22.8% of Total Investments) | | | | | | | |
| | | | Cleveland, Ohio, Income Tax Revenue Bonds, Bridges & Roadways Improvements, Subordinate Lien Series 2013A-2: | | | | | | | |
| | 1,315 | | 5.000%, 10/01/27 | 10/23 at 100.00 | | AA | | | 1,583,510 | |
| | 1,520 | | 5.000%, 10/01/30 | 10/23 at 100.00 | | AA | | | 1,801,930 | |
| | 1,600 | | 5.000%, 10/01/31 | 10/23 at 100.00 | | AA | | | 1,887,008 | |
| | 10,750 | | Cleveland, Ohio, Income Tax Revenue Bonds, Bridges & Roadways Improvements, Subordinate Lien Series 2015A-2, 5.000%, 10/01/37 | 10/23 at 100.00 | | AA | | | 12,404,210 | |
| | 3,000 | | Cleveland, Ohio, Income Tax Revenue Bonds, Public Facilities Improvements, Series 2014A-1, 5.000%, 11/15/38 | 11/23 at 100.00 | | AA | | | 3,434,610 | |
| | 500 | | Columbus-Franklin County Finance Authority, Ohio, Development Revenue Bonds, Hubbard Avenue Parking Facility Project, Series 2012A, 5.000%, 12/01/36 | 12/19 at 100.00 | | BBB | | | 511,115 | |
| | 6,750 | | Cuyahoga County, Ohio, Economic Development Revenue Bonds, Medical Mart-Convention Center Project, Recovery Zone Facility Series 2010F, 5.000%, 12/01/27 | 12/20 at 100.00 | | Aa2 | | | 7,765,200 | |
| | Principal | | | Optional Call | | | | | | |
| | Amount (000) | | Description (1) | Provisions (2) | | Ratings (3) | | | Value | |
| | | | Tax Obligation/Limited (continued) | | | | | | | |
| | | | Cuyahoga County, Ohio, Sales Tax Revenue Bonds, Various Purpose Series 2014: | | | | | | | |
| $ | 1,815 | | 5.000%, 12/01/32 | 12/24 at 100.00 | | AAA | | $ | 2,176,076 | |
| | 1,415 | | 5.000%, 12/01/33 | 12/24 at 100.00 | | AAA | | | 1,690,345 | |
| | 1,000 | | 5.000%, 12/01/34 | 12/24 at 100.00 | | AAA | | | 1,190,260 | |
| | 945 | | 5.000%, 12/01/35 | 12/24 at 100.00 | | AAA | | | 1,119,910 | |
| | 300 | | Delaware County District Library, Ohio, Library Fund Library Facilities Special Obligation Notes, Series 2009, 5.000%, 12/01/34 | 12/19 at 100.00 | | Aa2 | | | 324,921 | |
| | 1,920 | | Dublin, Ohio, Special Obligation Non-Tax Revenue Bonds, Series 2015A, 5.000%, 12/01/44 | 12/25 at 100.00 | | Aa1 | | | 2,219,750 | |
| | 10,350 | | Franklin County Convention Facilities Authority, Ohio, Tax and Lease Revenue Anticipation and Refunding Bonds, Columbus City & Franklin County Lessees, Series 2014, 5.000%, 12/01/35 | 12/24 at 100.00 | | Aaa | | | 12,071,825 | |
| | | | Greater Cleveland Regional Transit Authority, Ohio, Sales Tax Supported Capital Improvement Bonds, Refunding Series 2012: | | | | | | | |
| | 1,010 | | 5.250%, 12/01/27 | 12/21 at 100.00 | | AAA | | | 1,217,868 | |
| | 1,090 | | 5.250%, 12/01/28 | 12/21 at 100.00 | | AAA | | | 1,314,333 | |
| | 760 | | 5.250%, 12/01/30 | 12/21 at 100.00 | | AAA | | | 902,842 | |
| | 600 | | 5.000%, 12/01/31 | 12/21 at 100.00 | | AAA | | | 699,954 | |
| | 1,000 | | Greater Cleveland Regional Transit Authority, Ohio, Sales Tax Supported Capital Improvement Bonds, Refunding Series 2015, 5.000%, 12/01/34 | 12/25 at 100.00 | | AAA | | | 1,199,860 | |
| | 7,250 | | Hamilton County, Ohio, Sales Tax Bonds, Subordinate Lien, Series 2006A, 5.000%, 12/01/32 – AMBAC Insured | 12/16 at 100.00 | | A+ | | | 7,464,165 | |
| | 5,565 | | Hamilton County, Ohio, Sales Tax Bonds, Subordinate Series 2000B, 0.000%, 12/01/28 – AGM Insured | No Opt. Call | | AA | | | 3,805,124 | |
| | 5,000 | | Hamilton County, Ohio, Sales Tax Revenue Bonds, Refunding Series 2011A, 5.000%, 12/01/31 | 12/21 at 100.00 | | A+ | | | 5,631,750 | |
| | 20,700 | | JobsOhio Beverage System, Ohio, Statewide Liquor Profits Revenue Bonds, Senior Lien Series 2013A, 5.000%, 1/01/38 | 1/23 at 100.00 | | AA | | | 23,501,951 | |
| | 1,000 | | New Albany Community Authority, Ohio, Community Facilities Revenue Refunding Bonds, Series 2012C, 5.000%, 10/01/24 | 10/22 at 100.00 | | A1 | | | 1,164,510 | |
| | 2,000 | | Pinnacle Community Infrastructure Financing Authority, Grove City, Ohio, Community Facilities Bonds, Series 2015A, 4.250%, 12/01/36 – AGM Insured | No Opt. Call | | AA | | | 2,099,260 | |
| | | | Riversouth Authority, Ohio, Riversouth Area Redevelopment Bonds, Refunding Series 2012A: | | | | | | | |
| | 1,645 | | 5.000%, 12/01/23 | 12/22 at 100.00 | | AA+ | | | 1,992,539 | |
| | 1,200 | | 5.000%, 12/01/24 | 12/22 at 100.00 | | AA+ | | | 1,443,120 | |
| | | | Vermilion Local School District, East and Lorain Counties, Ohio, Certificates of Participation, Series 2012: | | | | | | | |
| | 765 | | 5.000%, 12/01/24 | No Opt. Call | | Aa3 | | | 890,269 | |
| | 805 | | 5.000%, 12/01/25 | 12/20 at 100.00 | | Aa3 | | | 934,565 | |
| | 93,570 | | Total Tax Obligation/Limited | | | | | | 104,442,780 | |
| | | | Transportation – 10.0% (6.9% of Total Investments) | | | | | | | |
| | | | Cleveland, Ohio, Airport System Revenue Bonds, Series 2012A: | | | | | | | |
| | 2,150 | | 5.000%, 1/01/30 | 1/22 at 100.00 | | A– | | | 2,396,949 | |
| | 1,500 | | 5.000%, 1/01/31 – AGM Insured | 1/22 at 100.00 | | AA | | | 1,689,480 | |
| | | | Dayton, Ohio, Airport Revenue Bonds, James M. Cox International Airport, Series 2015B: | | | | | | | |
| | 860 | | 5.000%, 12/01/33 – AGM Insured | 12/23 at 100.00 | | AA | | | 978,190 | |
| | 500 | | 5.000%, 12/01/34 – AGM Insured | 12/23 at 100.00 | | AA | | | 567,235 | |
| | | | Ohio State Treasurer, Tax-Exempt Private Activity Bonds, Portsmouth Gateway Group, LLC – Borrower, Portsmouth Bypass Project, Series 2015: | | | | | | | |
| | 2,500 | | 5.000%, 12/31/35 – AGM Insured (Alternative Minimum Tax) | 6/25 at 100.00 | | AA | | | 2,823,975 | |
| | 3,000 | | 5.000%, 12/31/39 – AGM Insured (Alternative Minimum Tax) | 6/25 at 100.00 | | AA | | | 3,355,620 | |
| | 4,250 | | 5.000%, 6/30/53 (Alternative Minimum Tax) | 6/25 at 100.00 | | A– | | | 4,615,373 | |
| | 3,550 | | Ohio Turnpike Commission, Revenue Refunding Bonds, Series 1998A, 5.500%, 2/15/18 – FGIC Insured | No Opt. Call | | AA | | | 3,887,712 | |
| | 2,050 | | Ohio Turnpike Commission, Turnpike Revenue Bonds, Infrastructure Project, Junior Lien Series 2013A-1, 5.250%, 2/15/39 | 2/23 at 100.00 | | A+ | | | 2,382,531 | |
| NUO | Nuveen Ohio Quality Income Municipal Fund | |
| | Portfolio of Investments (continued) | February 29, 2016 |
| | Principal | | | Optional Call | | | | | | |
| | Amount (000) | | Description (1) | Provisions (2) | | Ratings (3) | | | Value | |
| | | | Transportation (continued) | | | | | | | |
| | | | Ohio Turnpike Commission, Turnpike Revenue Bonds, Infrastructure Projects, Junior Lien, Capital Appreciation Series 2013A-2: | | | | | | | |
| $ | 5,000 | | 0.000%, 2/15/37 | No Opt. Call | | A+ | | $ | 2,236,600 | |
| | 11,260 | | 0.000%, 2/15/38 | No Opt. Call | | A+ | | | 4,816,015 | |
| | 5,000 | | 0.000%, 2/15/40 | No Opt. Call | | A+ | | | 1,928,850 | |
| | 41,620 | | Total Transportation | | | | | | 31,678,530 | |
| | | | U.S. Guaranteed – 16.3% (11.3% of Total Investments) (6) | | | | | | | |
| | 4,705 | | American Municipal Power Ohio Inc., Prairie State Energy Campus Project Revenue Bonds, Series 2008A, 5.250%, 2/15/43 (Pre-refunded 2/15/18) | 2/18 at 100.00 | | N/R (6) | | | 5,129,673 | |
| | 125 | | Barberton City School District, Summit County, Ohio, General Obligation Bonds, School Improvement Series 2008, 5.250%, 12/01/31 (Pre-refunded 6/01/18) | 6/18 at 100.00 | | AA (6) | | | 137,843 | |
| | | | Central Ohio Solid Waste Authority, General Obligation Bonds, Refunding & Improvements, Series 2012: | | | | | | | |
| | 110 | | 5.000%, 12/01/26 (Pre-refunded 6/01/22) | 6/22 at 100.00 | | N/R (6) | | | 135,093 | |
| | 245 | | 5.000%, 12/01/28 (Pre-refunded 6/01/22) | 6/22 at 100.00 | | N/R (6) | | | 300,889 | |
| | 160 | | 5.000%, 12/01/29 (Pre-refunded 6/01/22) | 6/22 at 100.00 | | N/R (6) | | | 196,499 | |
| | | | Cincinnati City School District, Ohio, Certificates of Participation, School Improvement Project, Series 2006: | | | | | | | |
| | 95 | | 5.000%, 12/15/32 (Pre-refunded 12/15/16) – AGM Insured | 12/16 at 100.00 | | AA (6) | | | 98,485 | |
| | 30 | | 5.000%, 12/15/32 (Pre-refunded 12/15/16) – AGM Insured | 12/16 at 100.00 | | AA (6) | | | 31,100 | |
| | | | Cincinnati, Ohio, General Obligation Bonds, Various Purpose Series 2012A: | | | | | | | |
| | 1,960 | | 5.000%, 12/01/31 (Pre-refunded 12/01/20) | 12/20 at 100.00 | | Aa2 (6) | | | 2,326,853 | |
| | 875 | | 5.000%, 12/01/32 (Pre-refunded 12/01/20) | 12/20 at 100.00 | | Aa2 (6) | | | 1,038,774 | |
| | | | Franklin County, Ohio, General Obligation Bonds, Various Purpose Series 2007: | | | | | | | |
| | 3,355 | | 5.000%, 12/01/27 (Pre-refunded 12/01/17) | 12/17 at 100.00 | | AAA | | | 3,614,107 | |
| | 1,840 | | 5.000%, 12/01/28 (Pre-refunded 12/01/17) | 12/17 at 100.00 | | AAA | | | 1,982,103 | |
| | 12,750 | | Hamilton City School District, Ohio, General Obligation Bonds, Series 2007, 5.000%, 12/01/34 (Pre-refunded 6/01/17) – AGM Insured | 6/17 at 100.00 | | AA (6) | | | 13,469,610 | |
| | 3,000 | | Hilliard City School District, Franklin County, Ohio, General Obligation Bonds, Series 2006A, 5.000%, 12/01/25 (Pre-refunded 12/01/16) – NPFG Insured | 12/16 at 100.00 | | Aa1 (6) | | | 3,105,180 | |
| | 1,565 | | Lake County, Ohio, Hospital Facilities Revenue Bonds, Lake Hospital System, Inc., Refunding Series 2008C, 6.000%, 8/15/29 (Pre-refunded 8/15/18) | 8/18 at 100.00 | | N/R (6) | | | 1,768,168 | |
| | | | Lakewood City School District, Cuyahoga County, Ohio, General Obligation Bonds, Series 2007: | | | | | | | |
| | 1,010 | | 5.000%, 12/01/25 (Pre-refunded 12/01/17) – FGIC Insured | 12/17 at 100.00 | | Aa2 (6) | | | 1,088,002 | |
| | 775 | | 5.000%, 12/01/30 (Pre-refunded 12/01/17) – FGIC Insured | 12/17 at 100.00 | | Aa2 (6) | | | 834,853 | |
| | 1,195 | | Marysville, Ohio, Wastewater Treatment System Revenue Bonds, Series 2006, 5.250%, 12/01/24 (Pre-refunded 12/01/16) – SYNCORA GTY Insured | 12/16 at 100.00 | | N/R (6) | | | 1,238,689 | |
| | 1,000 | | Mason City School District, Warren and Butler Counties, Ohio, General Obligation Bonds, School Improvement Series 2007, 5.000%, 12/01/31 (Pre-refunded 6/01/17) | 6/17 at 100.00 | | Aa1 (6) | | | 1,056,440 | |
| | 1,500 | | Milford Exempted Village School District, Ohio, General Obligation Bonds, Series 2008, 5.250%, 12/01/36 (Pre-refunded 12/01/18) | 12/18 at 100.00 | | Aa3 (6) | | | 1,686,360 | |
| | 2,780 | | Ohio Higher Education Facilities Commission, General Revenue Bonds, Kenyon College, Series 2006, 5.000%, 7/01/41 (Pre-refunded 7/01/16) | 7/16 at 100.00 | | N/R (6) | | | 2,824,369 | |
| | 95 | | Ohio Higher Educational Facilities Commission, Revenue Bonds, University Hospitals Health System Inc., Series 2007A, 5.250%, 1/15/46 (Pre-refunded 1/15/17) – BHAC Insured | 1/17 at 100.00 | | AA+ (6) | | | 99,013 | |
| | 140 | | Ohio Higher Educational Facilities Commission, General Revenue Bonds, University of Dayton, 2006 Project, Series 2006, 5.000%, 12/01/30 (Pre-refunded 12/01/16) – AMBAC Insured | 12/16 at 100.00 | | A2 (6) | | | 144,908 | |
| | 3,000 | | Ohio State Higher Educational Facility Commission, Higher Education Facility Revenue Bonds, Xavier University 2008C, 5.750%, 5/01/28 (Pre-refunded 11/01/18) | 11/18 at 100.00 | | A– (6) | | | 3,401,610 | |
| | 1,220 | | Ohio Water Development Authority, Revenue Bonds, Drinking Water Assistance Fund, State Match, Series 2008, 5.000%, 6/01/28
(Pre-refunded 6/01/18) – AGM Insured | 6/18 at 100.00 | | AAA | | | 1,338,523 | |
| | 500 | | Olentangy Local School District, Delaware and Franklin Counties, Ohio, General Obligation Bonds, Series 2008, 5.000%, 12/01/36 (Pre-refunded 6/01/18) | 6/18 at 100.00 | | AA+ (6) | | | 548,575 | |
| | Principal | | | Optional Call | | | | | | |
| | Amount (000) | | Description (1) | Provisions (2) | | Ratings (3) | | | Value | |
| | | | U.S. Guaranteed (6) (continued) | | | | | | | |
| $ | 2,300 | | Richland County, Ohio, Hospital Revenue Bonds, MidCentral Health System Group, Series 2006, 5.250%, 11/15/36 (Pre-refunded 11/15/16) | 11/16 at 100.00 | | N/R (6) | | $ | 2,377,947 | |
| | 700 | | Sylvania City School District, Lucas County, Ohio, General Obligation Bonds, School Improvement Series 1995, 5.250%, 12/01/36
(Pre-refunded 6/01/17) – AGC Insured | 6/17 at 100.00 | | AA (6) | | | 741,692 | |
| | | | Vandalia Butler City School District, Montgomery County, Ohio, General Obligation Bonds, School Improvement Series 2009: | | | | | | | |
| | 685 | | 5.125%, 12/01/37 (Pre-refunded 6/01/19) | 6/19 at 100.00 | | N/R (6) | | | 780,722 | |
| | 315 | | 5.125%, 12/01/37 (Pre-refunded 6/01/19) | 6/19 at 100.00 | | Aa3 (6) | | | 359,018 | |
| | 48,030 | | Total U.S. Guaranteed | | | | | | 51,855,098 | |
| | | | Utilities – 4.1% (2.8% of Total Investments) | | | | | | | |
| | | | American Municipal Power Ohio Inc., Prairie State Energy Campus Project Revenue Bonds, Series 2008A: | | | | | | | |
| | 50 | | 5.000%, 2/15/38 – AGC Insured | 2/18 at 100.00 | | AA | | | 53,408 | |
| | 295 | | 5.250%, 2/15/43 | 2/18 at 100.00 | | A1 | | | 316,470 | |
| | 1,500 | | American Municipal Power Ohio Inc., Prairie State Energy Campus Project Revenue Bonds, Series 2015A, 5.000%, 2/15/42 | 2/24 at 100.00 | | A1 | | | 1,681,695 | |
| | | | Cleveland, Ohio, Public Power System Revenue Bonds, Series 2008B: | | | | | | | |
| | 2,000 | | 0.000%, 11/15/28 – NPFG Insured | No Opt. Call | | AA– | | | 1,345,780 | |
| | 6,895 | | 0.000%, 11/15/32 – NPFG Insured | No Opt. Call | | AA– | | | 3,807,626 | |
| | 2,155 | | 0.000%, 11/15/34 – NPFG Insured | No Opt. Call | | AA– | | | 1,096,270 | |
| | 1,500 | | Ohio Air Quality Development Authority, Air Quality Revenue Refunding Bonds, Columbus Southern Power Company Project, Series 2009B, 5.800%, 12/01/38 | 12/19 at 100.00 | | Baa1 | | | 1,692,000 | |
| | 2,025 | | Ohio Air Quality Development Authority, Ohio, Revenue Bonds, Ohio Valley Electric Corporation Project, Series 2009E, 5.625%, 10/01/19 | No Opt. Call | | BBB– | | | 2,270,106 | |
| | 950 | | Ohio Municipal Electric Generation Agency, Beneficial Interest Certificates, Belleville Hydroelectric Project – Joint Venture 5, Series 2001, 0.000%, 2/15/29 – NPFG Insured | No Opt. Call | | AA– | | | 645,402 | |
| | 17,370 | | Total Utilities | | | | | | 12,908,757 | |
| | | | Water and Sewer – 10.8% (7.5% of Total Investments) | | | | | | | |
| | 8,150 | | Cincinnati, Ohio, Water System Revenue Bonds, Series 2012A, 5.000%, 12/01/37 Cleveland, Ohio, Water Revenue Bonds, Refunding Second Lien Series 2012A: | 12/21 at 100.00 | | AAA | | | 9,580,570 | |
| | 2,500 | | 5.000%, 1/01/25 | 1/22 at 100.00 | | Aa2 | | | 2,990,450 | |
| | 1,975 | | 5.000%, 1/01/26 | 1/22 at 100.00 | | Aa2 | | | 2,349,065 | |
| | 2,035 | | Cleveland, Ohio, Water Revenue Bonds, Senior Lien Series 2012X, 5.000%, 1/01/42 | 1/22 at 100.00 | | Aa1 | | | 2,359,623 | |
| | 865 | | Cleveland, Ohio, Waterworks First Mortgage Revenue Refunding and Improvement Bonds, Series 1993G, 5.500%, 1/01/21 – NPFG Insured | No Opt. Call | | Aa1 | | | 970,746 | |
| | 1,275 | | Hamilton County, Ohio, Sewer System Revenue Bonds, Metropolitan Sewer District of Greater Cincinnati, Refunding Series 2014A, 5.000%, 12/01/31 | 12/24 at 100.00 | | AA+ | | | 1,531,989 | |
| | 1,220 | | Hamilton, Ohio, Wastewater System Revenue Bonds, Series 2005, 5.250%, 10/01/22 – AGM Insured | 5/16 at 100.00 | | A1 | | | 1,225,246 | |
| | 2,025 | | Ironton, Ohio, Sewer System Improvement Revenue Bonds, Series 2011, 5.250%, 12/01/40 – AGM Insured | 12/20 at 100.00 | | A2 | | | 2,200,163 | |
| | 475 | | Marysville, Ohio, Wastewater Treatment System Revenue Bonds, Series 2006, 5.250%, 12/01/24 – SYNCORA GTY Insured | 12/16 at 100.00 | | A– | | | 492,542 | |
| | 225 | | Marysville, Ohio, Wastewater Treatment System Revenue Bonds, Series 2007, 5.000%, 12/01/37 – SYNCORA GTY Insured | 12/17 at 100.00 | | A– | | | 239,105 | |
| | 865 | | Marysville, Ohio, Water System Mortgage Revenue Bonds, Series 2007, 5.000%, 12/01/32 – AMBAC Insured | 12/17 at 100.00 | | A1 | | | 920,161 | |
| | 3,000 | | Northeast Ohio Regional Sewer District, Wastewater Improvement Revenue Bonds, Refunding & Improvement Series 2014, 5.000%, 11/15/44 | 11/24 at 100.00 | | AA+ | | | 3,464,280 | |
| | 2,000 | | Northeast Ohio Regional Sewer District, Wastewater Improvement Revenue Bonds, Series 2013, 5.000%, 11/15/38 | 5/23 at 100.00 | | AA+ | | | 2,339,480 | |
| NUO | Nuveen Ohio Quality Income Municipal Fund | |
| | Portfolio of Investments (continued) | February 29, 2016 |
| | Principal | | | Optional Call | | | | | | |
| | Amount (000) | | Description (1) | Provisions (2) | | Ratings (3) | | | Value | |
| | | | Water and Sewer (continued) | | | | | | | |
| | | | Toledo, Ohio, Sewerage System Revenue Bonds, Refunding Series 2013: | | | | | | | |
| $ | 820 | | 5.000%, 11/15/25 | 11/23 at 100.00 | | Aa3 | | $ | 987,977 | |
| | 605 | | 5.000%, 11/15/26 | 11/23 at 100.00 | | Aa3 | | | 721,807 | |
| | 1,075 | | 5.000%, 11/15/27 | 11/23 at 100.00 | | Aa3 | | | 1,273,563 | |
| | 695 | | 5.000%, 11/15/28 | 11/23 at 100.00 | | Aa3 | | | 818,217 | |
| | 29,805 | | Total Water and Sewer | | | | | | 34,464,984 | |
| $ | 436,395 | | Total Long-Term Investments (cost $419,167,294) | | | | | | 458,334,915 | |
| | | | Variable Rate Demand Preferred Shares, at Liquidation Preference – (46.6)% (7) | | | | | | (148,000,000 | ) |
| | | | Other Assets Less Liabilities – 2.4% | | | | | | 7,521,066 | |
| | | | Net Assets Applicable to Common Shares – 100% | | | | | $ | 317,855,981 | |
| (1) | All percentages shown in the Portfolio of Investments are based on net assets applicable to common shares unless otherwise noted. |
| (2) | Optional Call Provisions (not covered by the report of independent registered public accounting firm): Dates (month and year) and prices of the earliest optional call or redemption. There may be other call provisions at varying prices at later dates. Certain mortgage-backed securities may be subject to periodic principal paydowns. |
| (3) | Ratings (not covered by the report of independent registered public accounting firm): Using the highest of Standard & Poor's Group ("Standard & Poor's"), Moody's Investors Service, Inc. ("Moody's") or Fitch, Inc. ("Fitch") rating. Ratings below BBB by Standard & Poor's, Baa by Moody's or BBB by Fitch are considered to be below investment grade. Holdings designated N/R are not rated by any of these national rating agencies. |
| (4) | Investment, or portion of investment, has been pledged to collateralize the net payment obligations for investments in inverse floating rate transactions. |
| (5) | As of, or subsequent to, the end of the reporting period this security is non-income producing. Non-income producing, in the case of a fixed-income security, generally denotes that the issuer has (1) defaulted on the payment of principal or interest, (2) is under the protection of the Federal Bankruptcy Court or (3) the Fund's Adviser has concluded that the issue is not likely to meet its future interest payment obligations and has ceased accruing additional income on the Fund's records. |
| (6) | Backed by an escrow or trust containing sufficient U.S. Government or U.S. Government agency securities, which ensure the timely payment of principal and interest. Certain bonds backed by U.S. Government or agency securities are regarded as having an implied rating equal to the rating of such securities. |
| (7) | Variable Rate Demand Preferred Shares, at Liquidation Preference as a percentage of Total Investments is 32.3%. |
| (IF) | Inverse floating rate investment. |
See accompanying notes to financial statements.
| NTX | | |
| | Nuveen Texas Quality Income Municipal Fund | |
| | Portfolio of Investments | February 29, 2016 |
| | Principal | | | Optional Call | | | | | | |
| | Amount (000) | | Description (1) | Provisions (2) | | Ratings (3) | | | Value | |
| | | | LONG-TERM INVESTMENTS – 142.9% (100.0% of Total Investments) | | | | | | | |
| | | | MUNICIPAL BONDS – 142.9% (100.0% of Total Investments) | | | | | | | |
| | | | Consumer Discretionary – 3.6% (2.5% of Total Investments) | | | | | | | |
| | | | Austin Convention Enterprises Inc., Texas, Convention Center Hotel Revenue Bonds, First Tier Series 2006A: | | | | | | | |
| $ | 1,450 | | 5.250%, 1/01/18 – SYNCORA GTY Insured | 1/17 at 100.00 | | BBB– | | $ | 1,491,311 | |
| | 1,000 | | 5.250%, 1/01/24 – SYNCORA GTY Insured | 1/17 at 100.00 | | BBB– | | | 1,024,630 | |
| | 1,000 | | 5.000%, 1/01/34 – SYNCORA GTY Insured | 1/17 at 100.00 | | BBB– | | | 1,009,150 | |
| | 2,200 | | San Antonio Convention Center Hotel Finance Corporation, Texas, Contract Revenue Empowerment Zone Bonds, Series 2005A, 5.000%,
7/15/39 – AMBAC Insured (Alternative Minimum Tax) | 5/16 at 100.00 | | A3 | | | 2,208,338 | |
| | 5,650 | | Total Consumer Discretionary | | | | | | 5,733,429 | |
| | | | Education and Civic Organizations – 12.5% (8.8% of Total Investments) | | | | | | | |
| | 2,500 | | Board of Regents of the University of Texas, Permanent University Fund Bonds, Refunding Series 2015A, 5.000%, 7/01/28 | 7/24 at 100.00 | | AAA | | | 3,082,000 | |
| | 2,000 | | Board of Regents, University of Texas System, Financing System Revenue Bonds, Refunding Series 2012B, 5.000%, 8/15/22 | No Opt. Call | | AAA | | | 2,463,160 | |
| | | | Clifton Higher Education Finance Corporation, Texas, Education Revenue Bonds, Uplift Education Charter School, Series 2013A: | | | | | | | |
| | 2,000 | | 4.350%, 12/01/42 | 12/22 at 100.00 | | BBB– | | | 1,965,700 | |
| | 1,000 | | 4.400%, 12/01/47 | 12/22 at 100.00 | | BBB– | | | 981,470 | |
| | 1,000 | | Danbury Higher Education Authority, Texas, Charter School Revenue Bonds, John H. Wood Jr. Public Charter District, Inspire Academies, Series 2013A, 6.000%, 8/15/28 | 8/23 at 100.00 | | BBB– | | | 1,110,870 | |
| | 1,000 | | Hale Center Education Facilities Corporation, Texas, Revenue Bonds, Wayland Baptist University Project, Improvement and Refunding Series 2010, 5.000%, 3/01/35 | 3/21 at 100.00 | | A– | | | 1,093,970 | |
| | 1,000 | | Harris County Cultural Education Facilities Finance Corporation, Texas, Medical Facilities Revenue Refunding Bonds, Baylor College of Medicine, Series 2012A, 5.000%, 11/15/26 | 11/22 at 100.00 | | A– | | | 1,154,880 | |
| | 3,000 | | Harris County Cultural Education Facilities Finance Corporation, Texas, Revenue Refunding Bonds, Young Men's Christian Association of the Greater Houston Area, Series 2013A, 5.000%, 6/01/38 | 6/23 at 100.00 | | Baa3 | | | 3,238,080 | |
| | 2,000 | | Laredo Community College District, Webb County, Texas, Combined Fee Revenue Bonds, Series 2010, 5.250%, 8/01/35 – AGM Insured | 8/20 at 100.00 | | AA | | | 2,299,600 | |
| | 2,000 | | Lone Star College System, Harris, Montgomery and San Jacinto Counties, Texas, Revenue Financing System Bonds, Series 2013, 5.000%, 2/15/36 | 2/21 at 100.00 | | AA | | | 2,282,660 | |
| | 200 | | Newark Cultural Education Facilities Finance Corporation, Texas, Lease Revenue Bonds, A.W. Brown-Fellowship Leadership Academy, Series 2012A, 6.000%, 8/15/42 | 5/16 at 102.00 | | BBB– | | | 204,516 | |
| | 17,700 | | Total Education and Civic Organizations | | | | | | 19,876,906 | |
| | | | Energy – 1.3% (0.9% of Total Investments) | | | | | | | |
| | 2,000 | | Gulf Coast Industrial Development Authority, Texas, Solid Waste Disposal Revenue Bonds, Citgo Petroleum Corporation Project, Series 1995, 4.875%, 5/01/25 (Alternative Minimum Tax) | 10/22 at 100.00 | | BB | | | 2,109,540 | |
| | | | Health Care – 11.4% (8.0% of Total Investments) | | | | | | | |
| | 1,000 | | Harris County Cultural Education Facilities Finance Corporation, Texas, Hospital Revenue Bonds, Memorial Hermann Healthcare System, Refunding Series 2013A, 5.000%, 12/01/35 | 12/22 at 100.00 | | A+ | | | 1,120,460 | |
| | 1,000 | | Harris County Cultural Education Facilities Finance Corporation, Texas, Revenue Bonds, Houston Methodist Hospital System, Series 2015, 5.000%, 12/01/45 | 6/25 at 100.00 | | AA | | | 1,145,750 | |
| | 1,350 | | Harrison County Health Facilities Development Corporation, Texas, Hospital Revenue Bonds, Good Shepherd Health System, Refunding Series 2010, 5.250%, 7/01/28 | 7/20 at 100.00 | | BB– | | | 1,350,932 | |
| | 2,000 | | North Central Texas Health Facilities Development Corporation, Texas, Revenue Bonds, Children's Medical Center Dallas Project, Series 2009, 5.750%, 8/15/39 | 8/19 at 100.00 | | Aa2 | | | 2,267,520 | |
| NTX | Nuveen Texas Quality Income Municipal Fund | |
| | Portfolio of Investments (continued) | February 29, 2016 |
| | Principal | | | Optional Call | | | | | | |
| | Amount (000) | | Description (1) | Provisions (2) | | Ratings (3) | | | Value | |
| | | | Health Care (continued) | | | | | | | |
| $ | 885 | | North Central Texas Health Facilities Development Corporation, Texas, Revenue Bonds, Children's Medical Center Dallas Project, Series 2012, 5.000%, 8/15/32 | 8/22 at 100.00 | | Aa2 | | $ | 1,024,821 | |
| | 515 | | Tarrant County Cultural Education Facilities Finance Corporation, Texas, Hospital Revenue Bonds, Hendrick Medical Center, Refunding Series 2013, 5.125%, 9/01/33 | 9/23 at 100.00 | | A | | | 581,234 | |
| | 1,155 | | Tarrant County Cultural Education Facilities Finance Corporation, Texas, Hospital Revenue Bonds, Scott & White Healthcare Project, Series 2010, 5.250%, 8/15/40 | 8/20 at 100.00 | | AA– | | | 1,294,501 | |
| | 1,590 | | Tarrant County Cultural Education Facilities Finance Corporation, Texas, Revenue Bonds, Christus Health, Refunding Series 2008A, 6.500%,
7/01/37 – AGC Insured | 1/19 at 100.00 | | AA | | | 1,792,566 | |
| | 2,510 | | Tarrant County Cultural Education Facilities Finance Corporation, Texas, Revenue Bonds, Texas Health Resources, Series 2007B, 5.000%, 11/15/42 | 11/17 at 100.00 | | AA | | | 2,645,992 | |
| | 1,720 | | Tyler Health Facilities Development Corporation, Texas, Hospital Revenue Bonds, East Texas Medical Center Regional Healthcare System, Series 2007A, 5.375%, 11/01/37 | 11/17 at 100.00 | | Baa3 | | | 1,765,511 | |
| | 700 | | Tyler Health Facilities Development Corporation, Texas, Hospital Revenue Bonds, Mother Frances Hospital Regional Healthcare Center, Series 2007B, 5.000%, 7/01/37 | 7/17 at 100.00 | | Baa1 | | | 718,347 | |
| | 2,250 | | Tyler Health Facilities Development Corporation, Texas, Hospital Revenue Bonds, Mother Frances Hospital Regional Healthcare Center, Series 2007, 5.000%, 7/01/33 | 7/17 at 100.00 | | Baa1 | | | 2,313,765 | |
| | 16,675 | | Total Health Care | | | | | | 18,021,399 | |
| | | | Housing/Multifamily – 2.1% (1.5% of Total Investments) | | | | | | | |
| | 3,000 | | New Hope Cultural Education Facilities Finance Corporation, Texas, Student Housing Revenue Bonds, CHF-Collegiate Housing Foundation – College Station I LLC – Texas A&M University Project, Series 2014A, 5.000%, 4/01/46 – AGM Insured | 4/24 at 100.00 | | AA | | | 3,285,780 | |
| | | | Long-Term Care – 0.9% (0.6% of Total Investments) | | | | | | | |
| | | | Bexar County, Texas, Health Facilities Development Corporation Revenue Bonds, Army Retirement Residence, Series 2007: | | | | | | | |
| | 815 | | 5.000%, 7/01/27 | 7/17 at 100.00 | | BBB | | | 839,238 | |
| | 600 | | 5.000%, 7/01/37 | 7/17 at 100.00 | | BBB | | | 613,584 | |
| | 1,415 | | Total Long-Term Care | | | | | | 1,452,822 | |
| | | | Tax Obligation/General – 25.5% (17.8% of Total Investments) | | | | | | | |
| | 400 | | Calallen Independent School District, Nueces County, Texas, General Obligation Bonds, School Building Series 2008, 5.000%, 2/15/38 | 2/18 at 100.00 | | AAA | | | 429,928 | |
| | 1,620 | | Cameron County, Texas, General Obligation Bonds, State Highway 550 Project, Series 2012, 5.000%, 2/15/32 – AGM Insured | 2/22 at 100.00 | | AA | | | 1,825,772 | |
| | 1,500 | | College Station, Texas, Certificates of Obligation, Series 2012, 5.000%, 2/15/32 | 2/21 at 100.00 | | AA+ | | | 1,705,365 | |
| | 1,000 | | El Paso County Hospital District, Texas, General Obligation Bonds, Refunding Series 2013, 5.000%, 8/15/33 | 8/23 at 100.00 | | AA– | | | 1,109,160 | |
| | 1,750 | | El Paso County, Texas, Certificates of Obligation, Series 2001, 5.000%, 2/15/21 – AGM Insured | No Opt. Call | | AA | | | 2,089,850 | |
| | 3,255 | | Hutto Independent School District, Williamson County, Texas, General Obligation Bonds, Refunding Series 2012A, 0.000%, 8/01/45 | 8/21 at 100.00 | | A | | | 632,902 | |
| | 1,360 | | Jacksonville Independent School District, Cherokee County, Texas, General Obligation Bonds, School Building Series 2014, 5.000%, 2/15/39 | 2/24 at 100.00 | | Aaa | | | 1,562,762 | |
| | 2,675 | | Laredo Community College District, Webb County, Texas, General Obligation Bonds, Series 2014, 5.000%, 8/01/34 | 8/24 at 100.00 | | AA– | | | 3,111,587 | |
| | 40 | | Leander Independent School District, Williamson and Travis Counties, Texas, General Obligation Bonds, Series 2008, 0.000%, 8/15/36 | 8/17 at 33.01 | | AAA | | | 12,944 | |
| | 365 | | Lone Star College System, Harris and Montgomery Counties, Texas, General Obligation Bonds, Series 2009, 5.000%, 8/15/34 | 8/19 at 100.00 | | AAA | | | 408,431 | |
| | 1,350 | | Lubbock Independent School District, Lubbock County, Texas, General Obligation Bonds, School Building Series 2013A, 5.000%, 2/15/43 | No Opt. Call | | AAA | | | 1,556,942 | |
| | 1,750 | | Martin County Hospital District, Texas, Combination Limited Tax and Revenue Bonds, Series 2011A, 7.250%, 4/01/36 | 4/21 at 100.00 | | BBB | | | 1,961,978 | |
| | Principal | | | Optional Call | | | | | | |
| | Amount (000) | | Description (1) | Provisions (2) | | Ratings (3) | | | Value | |
| | | | Tax Obligation/General (continued) | | | | | | | |
| | | | McCamey County Hospital District, Texas, General Obligation Bonds, Series 2013: | | | | | | | |
| $ | 1,000 | | 5.750%, 12/01/33 | 12/25 at 100.00 | | Baa2 | | $ | 1,137,970 | |
| | 1,000 | | 6.125%, 12/01/38 | 12/25 at 100.00 | | Baa2 | | | 1,139,380 | |
| | 2,000 | | Plano Independent School District, Collin County, Texas, General Obligation Bonds, Series 2008A, 5.250%, 2/15/34 | 2/18 at 100.00 | | Aaa | | | 2,166,240 | |
| | 1,425 | | Port of Houston Authority, Harris County, Texas, General Obligation Bonds, Series 2010E, 0.000%, 10/01/35 | No Opt. Call | | AAA | | | 752,699 | |
| | 4,000 | | Prosper Independent School District, Collin County, Texas, General Obligation Bonds, Refunding Series 2015, 5.000%, 2/15/40 | 2/25 at 100.00 | | AAA | | | 4,648,360 | |
| | 205 | | Reagan Hospital District of Reagan County, Texas, Limited Tax Revenue Bonds, Series 2014A, 5.125%, 2/01/39 | 2/24 at 100.00 | | Baa2 | | | 221,459 | |
| | 2,000 | | Texas State, General Obligation Bonds, Transportation Commission Highway Improvement Series 2012A, 5.000%, 4/01/42 | No Opt. Call | | AAA | | | 2,291,680 | |
| | 2,000 | | Texas State, General Obligation Bonds, Transportation Commission Highway Improvement, Series 2014, 5.000%, 4/01/44 | 4/24 at 100.00 | | AAA | | | 2,305,520 | |
| | 2,000 | | Texas State, General Obligation Bonds, Transportation Commission Mobility Fund, Refunding Series 2014, 5.000%, 10/01/34 | 4/24 at 100.00 | | AAA | | | 2,368,900 | |
| | 910 | | Texas State, General Obligation Bonds, Transportation Commission Mobility Fund, Series 2008, 5.000%, 4/01/30 | 4/18 at 100.00 | | AAA | | | 986,840 | |
| | 3,025 | | Victoria Independent School District, Victoria County, Texas, General Obligation Bonds, School Building Series 2007, 5.000%, 2/15/32 | 2/17 at 100.00 | | AAA | | | 3,149,570 | |
| | | | West Texas Independent School District, McLennan and Hill Counties, General Obligation Refunding Bonds, Series 1998: | | | | | | | |
| | 45 | | 0.000%, 8/15/22 | 5/16 at 76.96 | | AAA | | | 31,772 | |
| | 45 | | 0.000%, 8/15/24 | 5/16 at 63.63 | | AAA | | | 28,488 | |
| | 9,000 | | Wylie Independent School District, Collin County, Texas, General Obligation Bonds, Capital Appreciation Series 2015, 0.000%, 8/15/45 | 8/25 at 44.15 | | Aaa | | | 2,802,960 | |
| | 45,720 | | Total Tax Obligation/General | | | | | | 40,439,459 | |
| | | | Tax Obligation/Limited – 22.4% (15.7% of Total Investments) | | | | | | | |
| | | | Bexar County, Texas, Venue Project Revenue Bonds, Refunding Combined Venue Tax Series 2015: | | | | | | | |
| | 1,060 | | 5.000%, 8/15/34 – AGM Insured | 8/24 at 100.00 | | AA | | | 1,213,106 | |
| | 1,160 | | 5.000%, 8/15/35 – AGM Insured | 8/24 at 100.00 | | AA | | | 1,317,366 | |
| | 1,000 | | Bexar County, Texas, Venue Project Revenue Bonds, Refunding Series 2010, 5.250%, 8/15/38 – AGM Insured | 8/19 at 100.00 | | AA | | | 1,117,330 | |
| | 1,175 | | Dallas Area Rapid Transit, Texas, Sales Tax Revenue Bonds, Refunding Senior Lien Series 2014A, 5.000%, 12/01/36 | 12/24 at 100.00 | | AA+ | | | 1,387,440 | |
| | 4,000 | | Dallas Area Rapid Transit, Texas, Sales Tax Revenue Bonds, Refunding Series 2016A, 5.000%, 12/01/41 | 12/25 at 100.00 | | AA+ | | | 4,694,280 | |
| | 3,315 | | Dallas Area Rapid Transit, Texas, Sales Tax Revenue Bonds, Senior Lien Refunding Series 2007, 5.000%, 12/01/36 – AMBAC Insured | 12/16 at 100.00 | | AA+ | | | 3,423,367 | |
| | 500 | | Flower Mound, Texas, Special Assessment Revenue Bonds, River Walk Public Improvement District 1, Series 2014, 6.500%, 9/01/36 | No Opt. Call | | N/R | | | 530,735 | |
| | 2,500 | | Harris County Metropolitan Transit Authority, Texas, Sales and Use Tax Revenue Bonds, Contractual Obligations Series 2015B, 5.000%, 11/01/25 | No Opt. Call | | AA+ | | | 3,164,450 | |
| | 1,390 | | Harris County Metropolitan Transit Authority, Texas, Sales and Use Tax Revenue Bonds, Series 2011A, 5.000%, 11/01/41 | 11/21 at 100.00 | | AA+ | | | 1,610,871 | |
| NTX | Nuveen Texas Quality Income Municipal Fund | |
| | Portfolio of Investments (continued) | February 29, 2016 |
| | Principal | | | Optional Call | | | | | | |
| | Amount (000) | | Description (1) | Provisions (2) | | Ratings (3) | | | Value | |
| | | | Tax Obligation/Limited (continued) | | | | | | | |
| | | | Harris County-Houston Sports Authority, Texas, Revenue Bonds, Junior Lien Series 2001H: | | | | | | | |
| $ | 300 | | 0.000%, 11/15/24 – NPFG Insured | No Opt. Call | | AA– | | $ | 216,219 | |
| | 210 | | 0.000%, 11/15/32 – NPFG Insured | 11/31 at 94.05 | | AA– | | | 100,525 | |
| | 260 | | 0.000%, 11/15/33 | 11/31 at 88.44 | | AA– | | | 116,134 | |
| | 2,045 | | 0.000%, 11/15/34 – NPFG Insured | 11/31 at 83.17 | | AA– | | | 859,023 | |
| | 1,130 | | 0.000%, 11/15/36 – NPFG Insured | 11/31 at 73.51 | | AA– | | | 416,360 | |
| | 4,370 | | 0.000%, 11/15/38 – NPFG Insured | 11/31 at 64.91 | | AA– | | | 1,410,855 | |
| | 2,260 | | 0.000%, 11/15/39 – NPFG Insured | 11/31 at 60.98 | | AA– | | | 685,413 | |
| | 400 | | Harris County-Houston Sports Authority, Texas, Revenue Bonds, Refunding Second Lien Series 2014C, 5.000%, 11/15/34 | 11/24 at 100.00 | | A3 | | | 452,068 | |
| | 3,440 | | Harris County-Houston Sports Authority, Texas, Revenue Bonds, Senior Lien Series 2001G, 0.000%, 11/15/41 – NPFG Insured | 11/31 at 53.78 | | AA– | | | 1,004,514 | |
| | 1,000 | | Harris County-Houston Sports Authority, Texas, Revenue Bonds, Third Lien Series 2004A-3, 0.000%, 11/15/33 – NPFG Insured | 11/24 at 59.10 | | AA– | | | 403,130 | |
| | 210 | | Houston, Texas, Hotel Occupancy Tax and Special Revenue Bonds, Convention and Entertainment Facilities Department, Refunding Series 2011B, 5.000%, 9/01/30 | 9/16 at 100.00 | | A2 | | | 212,688 | |
| | 1,015 | | Houston, Texas, Hotel Occupancy Tax and Special Revenue Bonds, Convention and Entertainment Facilities Department, Refunding Series 2014, 5.000%, 9/01/34 | No Opt. Call | | A2 | | | 1,174,649 | |
| | 1,470 | | Houston, Texas, Hotel Occupancy Tax and Special Revenue Bonds, Convention and Entertainment Project, Series 2001B, 0.000%, 9/01/32 – AMBAC Insured | No Opt. Call | | A2 | | | 782,731 | |
| | 250 | | Little Elm. Texas, Valencia Public Improvement District Phase I Special Assessment Revenue Bonds, Series 2014, 7.150%, 9/01/37 | 3/18 at 103.00 | | N/R | | | 262,065 | |
| | 3,000 | | North Texas Tollway Authority, Special Projects System Revenue Bonds, Current Interest Series 2011D, 5.000%, 9/01/31 | 9/21 at 100.00 | | AA+ | | | 3,506,190 | |
| | 2,000 | | North Texas Tollway Authority, Special Projects System Revenue Bonds, Series 2011A, 5.500%, 9/01/41 | 9/21 at 100.00 | | AA+ | | | 2,366,640 | |
| | 1,000 | | Uptown Development Authority, Houston, Texas, Tax Increment Revenue Bonds, Infrastructure Improvement Facilities, Series 2009, 5.500%, 9/01/29 | 9/19 at 100.00 | | BBB | | | 1,102,330 | |
| | 1,735 | | Via Metropolitan Transit Advanced Transportation District, Texas, Sales Tax Revenue Bonds, Refunding & Improvement Series 2014, 5.000%, 8/01/38 | 8/24 at 100.00 | | AAA | | | 2,030,939 | |
| | 42,195 | | Total Tax Obligation/Limited | | | | | | 35,561,418 | |
| | | | Transportation – 17.4% (12.2% of Total Investments) | | | | | | | |
| | 3,000 | | Austin, Texas, Airport System Revenue Bonds, Series 2015, 5.000%, 11/15/39 (Alternative Minimum Tax) | 11/24 at 100.00 | | A1 | | | 3,342,360 | |
| | | | Central Texas Regional Mobility Authority, Revenue Bonds, Senior Lien Series 2010: | | | | | | | |
| | 2,945 | | 0.000%, 1/01/36 | No Opt. Call | | BBB+ | | | 1,296,919 | |
| | 2,205 | | 0.000%, 1/01/37 | No Opt. Call | | BBB+ | | | 927,930 | |
| | 2,160 | | 0.000%, 1/01/38 | No Opt. Call | | BBB+ | | | 877,651 | |
| | 1,000 | | 0.000%, 1/01/40 | No Opt. Call | | BBB+ | | | 368,110 | |
| | 665 | | Central Texas Regional Mobility Authority, Revenue Bonds, Subordinate Lien Refunding Series 2013, 5.000%, 1/01/42 | 1/23 at 100.00 | | BBB | | | 715,533 | |
| | 1,000 | | Dallas-Fort Worth International Airport, Texas, Joint Revenue Bonds, Refunding Series 2010A, 5.000%, 11/01/42 | 11/20 at 100.00 | | A+ | | | 1,130,510 | |
| | 1,165 | | Dallas-Fort Worth International Airport, Texas, Joint Revenue Bonds, Refunding Series 2012B, 5.000%, 11/01/35 | 11/20 at 100.00 | | A+ | | | 1,327,086 | |
| | 1,670 | | Grand Parkway Transportation Corporation, Texas, System Toll Revenue Bonds, First Tier Series 2013A, 5.125%, 10/01/43 | 10/23 at 100.00 | | BBB+ | | | 1,839,739 | |
| | 1,165 | | Harris County, Texas, Toll Road Revenue Bonds, Refunding Senior Lien Series 2012C, 5.000%, 8/15/31 | No Opt. Call | | AA | | | 1,379,710 | |
| | 2,000 | | Houston, Texas, Subordinate Lien Airport System Revenue Refunding Bonds, Series 2012A, 5.000%, 7/01/31 (Alternative Minimum Tax) | 7/22 at 100.00 | | A+ | | | 2,239,060 | |
| | Principal | | | Optional Call | | | | | | |
| | Amount (000) | | Description (1) | Provisions (2) | | Ratings (3) | | | Value | |
| | | | Transportation (continued) | | | | | | | |
| $ | 1,750 | | Love Field Airport Modernization Corporation, Texas, General Airport Revenue Bonds Series 2015, 5.000%, 11/01/35 (Alternative Minimum Tax) | 11/25 at 100.00 | | A1 | | $ | 2,002,350 | |
| | 3,000 | | Love Field Airport Modernization Corporation, Texas, Special Facilities Revenue Bonds, Southwest Airlines Company, Series 2010, 5.250%, 11/01/40 | 11/20 at 100.00 | | Baa1 | | | 3,322,440 | |
| | | | North Texas Tollway Authority, System Revenue Bonds, First Tier Series 2009A: | | | | | | | |
| | 100 | | 6.100%, 1/01/28 | 1/19 at 100.00 | | A1 | | | 114,481 | |
| | 2,000 | | 6.250%, 1/01/39 | 1/19 at 100.00 | | A1 | | | 2,261,220 | |
| | 200 | | North Texas Tollway Authority, System Revenue Bonds, Refunding First Tier, Series 2008A, 5.750%, 1/01/40 | 1/18 at 100.00 | | A1 | | | 215,698 | |
| | | | North Texas Tollway Authority, System Revenue Bonds, Refunding First Tier, Series 2008B: | | | | | | | |
| | 35 | | 5.750%, 1/01/40 | 1/18 at 100.00 | | AA– | | | 37,914 | |
| | 40 | | 5.750%, 1/01/40 | 1/18 at 100.00 | | A1 | | | 43,140 | |
| | 2,500 | | North Texas Tollway Authority, System Revenue Bonds, Refunding First Tier, Series 2008D, 0.000%, 1/01/36 – AGC Insured | No Opt. Call | | AA | | | 1,221,000 | |
| | 2,500 | | San Antonio, Texas, Airport System Revenue Bonds, Refunding Series 2012, 5.000%, 7/01/27 (Alternative Minimum Tax) | 7/22 at 100.00 | | A+ | | | 2,876,100 | |
| | 31,100 | | Total Transportation | | | | | | 27,538,951 | |
| | | | U.S. Guaranteed – 13.8% (9.6% of Total Investments) (4) | | | | | | | |
| | 2,500 | | Bexar Metropolitan Water District, Texas, Waterworks System Revenue Bonds, Refunding Series 2010, 5.875%, 5/01/40 (Pre-refunded 5/01/20) | 5/20 at 100.00 | | A+ (4) | | | 3,005,300 | |
| | 4,670 | | Dallas Area Rapid Transit, Texas, Sales Tax Revenue Bonds, Senior Lien Refunding Series 2007, 5.000%, 12/01/36 (Pre-refunded 12/01/16) – AMBAC Insured | 12/16 at 100.00 | | Aa2 (4) | | | 4,833,123 | |
| | 1,000 | | El Paso, Texas, Water and Sewer Revenue Bonds, Refunding Series 2008C, 5.375%, 3/01/29 (Pre-refunded 3/01/18) | 3/18 at 100.00 | | AA+ (4) | | | 1,094,250 | |
| | 8,500 | | Grand Prairie Independent School District, Dallas County, Texas, General Obligation Bonds, Capital Appreciation Refunding Series 2009, 0.000%, 8/15/39 (Pre-refunded 8/15/18) | 8/18 at 22.64 | | AA (4) | | | 1,879,435 | |
| | 1,290 | | Houston, Texas, Hotel Occupancy Tax and Special Revenue Bonds, Convention and Entertainment Facilities Department, Refunding Series 2011B, 5.000%, 9/01/30 (Pre-refunded 9/01/16) | 9/16 at 100.00 | | N/R (4) | | | 1,320,560 | |
| | 960 | | Leander Independent School District, Williamson and Travis Counties, Texas, General Obligation Bonds, Series 2008, 0.000%, 8/15/36 (Pre-refunded 8/15/17) | 8/17 at 33.01 | | N/R (4) | | | 313,709 | |
| | 25 | | Lower Colorado River Authority, Texas, Revenue Bonds, Refunding Series 2012B, 5.000%, 5/15/29 (Pre-refunded 5/15/22) | 5/22 at 100.00 | | N/R (4) | | | 30,558 | |
| | 1,000 | | Lufkin Health Facilities Development Corporation, Texas, Health System Revenue Bonds, Memorial Health System of East Texas, Series 2007, 5.500%, 2/15/32 (Pre-refunded 2/15/17) | 2/17 at 100.00 | | N/R (4) | | | 1,048,450 | |
| | 1,500 | | Montgomery County, Texas, General Obligation Bonds, Refunding Series 2008B, 5.250%, 3/01/32 (Pre-refunded 3/01/19) | 3/19 at 100.00 | | AA+ (4) | | | 1,699,050 | |
| | 1,000 | | North Central Texas Health Facilities Development Corporation, Hospital Revenue Bonds, Presbyterian Healthcare System, Series 1996A, 5.750%,
6/01/26 – NPFG Insured (ETM) | No Opt. Call | | Aaa | | | 1,240,370 | |
| | 195 | | North Texas Tollway Authority, System Revenue Bonds, Refunding First Tier, Series 2008A, 5.750%, 1/01/40 (Pre-refunded 1/01/18) | 1/18 at 100.00 | | N/R (4) | | | 213,016 | |
| | | | North Texas Tollway Authority, System Revenue Bonds, Refunding First Tier, Series 2008B: | | | | | | | |
| | 285 | | 5.750%, 1/01/40 (Pre-refunded 1/01/18) | 1/18 at 100.00 | | A1 (4) | | | 311,331 | |
| | 190 | | 5.750%, 1/01/40 (Pre-refunded 1/01/18) | 1/18 at 100.00 | | AA– (4) | | | 207,554 | |
| | 950 | | North Texas Tollway Authority, System Revenue Bonds, Refunding Second Tier, Series 2008F, 5.750%, 1/01/38 (Pre-refunded 1/01/18) | 1/18 at 100.00 | | A2 (4) | | | 1,037,771 | |
| | 2,500 | | Retama Development Corporation, Texas, Special Facilities Revenue Bonds, Retama Park Racetrack, Series 1993, 8.750%, 12/15/18 (Pre-refunded 12/15/17) | 12/17 at 100.00 | | Aaa | | | 2,861,300 | |
| | 95 | | Tarrant County Cultural Education Facilities Finance Corporation, Texas, Hospital Revenue Bonds, Scott & White Healthcare Project, Series 2010, 5.250%, 8/15/40 (Pre-refunded 8/15/20) | 8/20 at 100.00 | | N/R (4) | | | 112,791 | |
| | 410 | | Tarrant County Cultural Education Facilities Finance Corporation, Texas, Revenue Bonds, Christus Health, Refunding Series 2008A, 6.500%, 7/01/37 (Pre-refunded 1/01/19) – AGC Insured | 1/19 at 100.00 | | AA (4) | | | 474,017 | |
| NTX | Nuveen Texas Quality Income Municipal Fund | |
| | Portfolio of Investments (continued) | February 29, 2016 |
| | Principal | | | Optional Call | | | | | | |
| | Amount (000) | | Description (1) | Provisions (2) | | Ratings (3) | | | Value | |
| | | | U.S. Guaranteed (4) (continued) | | | | | | | |
| $ | 90 | | Texas State, General Obligation Bonds, Transportation Commission Mobility Fund, Series 2008, 5.000%, 4/01/30 (Pre-refunded 4/01/18) | 4/18 at 100.00 | | N/R (4) | | $ | 98,149 | |
| | 60 | | Texas State, General Obligation Bonds, Water Utility, Series 2001, 5.250%, 8/01/23 | 5/16 at 100.00 | | AAA | | | 60,264 | |
| | 27,220 | | Total U.S. Guaranteed | | | | | | 21,840,998 | |
| | | | Utilities – 17.2% (12.0% of Total Investments) | | | | | | | |
| | 2,000 | | Austin, Texas, Electric Utility System Revenue Bonds, Refunding Series 2012A, 5.000%, 11/15/40 | No Opt. Call | | AA– | | | 2,264,800 | |
| | 3,000 | | Austin, Texas, Electric Utility System Revenue Bonds, Refunding Series 2015A, 5.000%, 11/15/38 | 11/25 at 100.00 | | AA– | | | 3,496,590 | |
| | 2,560 | | Brazos River Authority, Texas, Pollution Control Revenue Refunding Bonds, TXU Electric Company, Series 1999C, 7.700%, 3/01/32 (Alternative Minimum Tax) (5) | 5/16 at 100.00 | | C | | | 64,000 | |
| | 2,000 | | Brownsville, Texas, Utility System Revenue Bonds, Refunding Series 2015, 5.000%, 9/01/31 | 9/25 at 100.00 | | A+ | | | 2,364,980 | |
| | 2,000 | | Bryan, Brazos County, Texas, Electric System Revenue Bonds, Series 2009, 5.000%, 7/01/34 | 7/17 at 100.00 | | A+ | | | 2,100,480 | |
| | 3,000 | | Lower Colorado River Authority, Texas, Revenue Bonds, Refunding Series 2010A, 5.000%, 5/15/40 | 5/20 at 100.00 | | A | | | 3,316,380 | |
| | 1,150 | | Lower Colorado River Authority, Texas, Revenue Bonds, Refunding Series 2012A, 5.000%, 5/15/36 | 5/22 at 100.00 | | A | | | 1,296,062 | |
| | 1,975 | | Lower Colorado River Authority, Texas, Revenue Bonds, Refunding Series 2012B, 5.000%, 5/15/29 | 5/22 at 100.00 | | A | | | 2,288,788 | |
| | 1,500 | | Matagorda County Navigation District Number One, Texas, Pollution Control Revenue Refunding Bonds, Central Power and Light Company Project, Series 2009A, 6.300%, 11/01/29 | 7/19 at 102.00 | | Baa1 | | | 1,706,790 | |
| | 1,000 | | Sam Rayburn Municipal Power Agency, Texas, Power Supply System Revenue Bonds, Refunding Series 2012, 5.000%, 10/01/20 | No Opt. Call | | BBB+ | | | 1,158,240 | |
| | | | Texas Municipal Gas Acquisition and Supply Corporation I, Gas Supply Revenue Bonds, Senior Lien Series 2008D: | | | | | | | |
| | 530 | | 5.625%, 12/15/17 | No Opt. Call | | BBB+ | | | 555,281 | |
| | 3,000 | | 6.250%, 12/15/26 | No Opt. Call | | BBB+ | | | 3,660,540 | |
| | 1,000 | | Texas Municipal Gas Acquisition and Supply Corporation I, Gas Supply Revenue Bonds, Series 2006A, 5.250%, 12/15/20 | No Opt. Call | | BBB+ | | | 1,140,080 | |
| | | | Texas Municipal Power Agency, Revenue Bonds, Transmission Refunding Series 2010: | | | | | | | |
| | 640 | | 5.000%, 9/01/34 | 9/20 at 100.00 | | A+ | | | 720,262 | |
| | 1,000 | | 5.000%, 9/01/40 | 9/20 at 100.00 | | A+ | | | 1,126,330 | |
| | 26,355 | | Total Utilities | | | | | | 27,259,603 | |
| | | | Water and Sewer – 14.8% (10.4% of Total Investments) | | | | | | | |
| | 1,575 | | Bell County Water Control Improvement District 1, Texas, Water Revenue Bonds, Series 2014, 5.000%, 7/10/38 – BAM Insured | 7/23 at 100.00 | | AA | | | 1,783,908 | |
| | 2,500 | | Canadian River Municipal Water Authority, Texas, Contract Revenue Bonds, Conjunctive Use Groundwater Supply Project, Subordinate Lien Series 2011, 5.000%, 2/15/31 | 2/21 at 100.00 | | AA | | | 2,845,725 | |
| | 2,000 | | Corpus Christi, Texas, Utility System Revenue Bonds, Improvement Junior Lien Series 2013, 5.000%, 7/15/43 | 7/23 at 100.00 | | A+ | | | 2,222,340 | |
| | 2,000 | | Houston, Texas, First Lien Combined Utility System Revenue Bonds, Refunding Series 2012D, 5.000%, 11/15/42 | 11/22 at 100.00 | | AA | | | 2,312,440 | |
| | 4,000 | | Laredo, Webb County, Texas, Waterworks and Sewer System Revenue Bonds, Series 2010, 5.250%, 3/01/40 | 3/20 at 100.00 | | AA– | | | 4,608,000 | |
| | 710 | | North Fort Bend Water Authority, Texas, Water System Revenue Bonds, Series 2011, 5.000%, 12/15/36 – AGM Insured | 12/21 at 100.00 | | AA | | | 790,173 | |
| | Principal | | | Optional Call | | | | | | |
| | Amount (000) | | Description (1) | Provisions (2) | | Ratings (3) | | | Value | |
| | | | Water and Sewer (continued) | | | | | | | |
| $ | 3,860 | | North Harris County Regional Water Authority, Texas, Water Revenue Bonds, Senior Lien Refunding Series 2013, 5.000%, 12/15/33 | 12/22 at 100.00 | | AA– | | $ | 4,543,838 | |
| | 1,000 | | Nueces River Authority, Texas, Water Supply Revenue Bonds, Corpus Christi Lake Texana Project, Refunding Series 2015, 5.000%, 7/15/26 | 7/25 at 100.00 | | AA– | | | 1,233,380 | |
| | 2,640 | | San Antonio, Texas, Water System Revenue Bonds, Refunding Junior Lien Series 2015B, 5.000%, 5/15/34 | 5/25 at 100.00 | | AA | | | 3,139,250 | |
| | 20,285 | | Total Water and Sewer | | | | | | 23,479,054 | |
| $ | 239,315 | | Total Long-Term Investments (cost $208,462,845) | | | | | | 226,599,359 | |
| | | | Institutional MuniFund Term Preferred Shares, at Liquidation Preference – (45.4)% (6) | | | | | | (72,000,000 | ) |
| | | | Other Assets Less Liabilities – 2.5% | | | | | | 3,971,517 | |
| | | | Net Assets Applicable to Common Shares – 100% | | | | | $ | 158,570,876 | |
| (1) | All percentages shown in the Portfolio of Investments are based on net assets applicable to common shares unless otherwise noted. |
| (2) | Optional Call Provisions (not covered by the report of independent registered public accounting firm): Dates (month and year) and prices of the earliest optional call or redemption. There may be other call provisions at varying prices at later dates. Certain mortgage-backed securities may be subject to periodic principal paydowns. |
| (3) | Ratings (not covered by the report of independent registered public accounting firm): Using the highest of Standard & Poor's Group ("Standard & Poor's"), Moody's Investors Service, Inc. ("Moody's") or Fitch, Inc. ("Fitch") rating. Ratings below BBB by Standard & Poor's, Baa by Moody's or BBB by Fitch are considered to be below investment grade. Holdings designated N/R are not rated by any of these national rating agencies. |
| (4) | Backed by an escrow or trust containing sufficient U.S. Government or U.S. Government agency securities, which ensure the timely payment of principal and interest. Certain bonds backed by U.S. Government or agency securities are regarded as having an implied rating equal to the rating of such securities. |
| (5) | As of, or subsequent to, the end of the reporting period this security is non-income producing. Non-income producing, in the case of a fixed-income security, generally denotes that the issuer has (1) defaulted on the payment of principal or interest, (2) is under the protection of the Federal Bankruptcy Court or (3) the Fund's Adviser has concluded that the issue is not likely to meet its future interest payment obligations and has ceased accruing additional income on the Fund's records. |
| (6) | Institutional MuniFund Term Preferred Shares, at Liquidation Preference as a percentage of Total Investments is 31.8%. |
| (ETM) | Escrowed to maturity. |
| | See accompanying notes to financial statements. |
| Statement of | | |
| | Assets and Liabilities | February 29, 2016 |
| | | | | | | | | | | | | | |
| | | | Arizona | | | Michigan | | | Ohio | | | Texas | |
| | | | Premium | | | Quality | | | Quality | | | Quality | |
| | | | Income | | | Income | | | Income | | | Income | |
| | | | (NAZ | ) | | (NUM | ) | | (NUO | ) | | (NTX | ) |
| Assets | | | | | | | | | | | | | |
| Long-term investments, at value (cost $231,913,245, $468,108,771, $419,167,294 and $208,462,845, respectively) | | $ | 253,297,034 | | $ | 504,350,414 | | $ | 458,334,915 | | $ | 226,599,359 | |
| Cash | | | 723,153 | | | 222,658 | | | 3,414,508 | | | 1,867,828 | |
| Receivable for interest | | | 2,427,778 | | | 6,256,099 | | | 5,182,021 | | | 2,323,596 | |
| Deferred offering costs | | | 39,007 | | | 61,461 | | | 269,868 | | | 451,990 | |
| Other assets | | | 1,157 | | | 42,522 | | | 133,341 | | | 2,145 | |
| Total assets | | | 256,488,129 | | | 510,933,154 | | | 467,334,653 | | | 231,244,918 | |
| Liabilities | | | | | | | | | | | | | |
| Floating rate obligations | | | 2,755,000 | | | 18,890,000 | | | — | | | — | |
| Payable for dividends | | | 748,024 | | | 1,208,212 | | | 1,122,556 | | | 514,283 | |
| Institutional MuniFund Term Preferred ("iMTP") Shares, at liquidation preference | | | — | | | — | | | — | | | 72,000,000 | |
| Variable Rate MuniFund Term Preferred ("VMTP") Shares, at liquidation preference | | | 79,000,000 | | | 159,000,000 | | | — | | | — | |
| Variable Rate Demand Preferred ("VRDP") Shares, at liquidation preference | | | — | | | — | | | 148,000,000 | | | — | |
| Accrued expenses: | | | | | | | | | | | | | |
| Management fees | | | 127,945 | | | 236,505 | | | 232,903 | | | 111,593 | |
| Trustees fees | | | 1,080 | | | 42,999 | | | 12,830 | | | 986 | |
| Other | | | 88,834 | | | 89,714 | | | 110,383 | | | 47,180 | |
| Total liabilities | | | 82,720,883 | | | 179,467,430 | | | 149,478,672 | | | 72,674,042 | |
| Net assets applicable to common shares | | $ | 173,767,246 | | $ | 331,465,724 | | $ | 317,855,981 | | $ | 158,570,876 | |
| Common shares outstanding | | | 11,572,963 | | | 20,810,887 | | | 18,521,955 | | | 10,027,210 | |
| Net asset value ("NAV") per common share outstanding | | $ | 15.01 | | $ | 15.93 | | $ | 17.16 | | $ | 15.81 | |
| Net assets applicable to common shares consist of: | | | | | | | | | | | | | |
| Common shares, $0.01 par value per share | | $ | 115,730 | | $ | 208,109 | | $ | 185,220 | | $ | 100,272 | |
| Paid-in surplus | | | 157,165,347 | | | 295,177,163 | | | 281,326,215 | | | 141,518,858 | |
| Undistributed (Over-distribution of) net investment income | | | 1,020,363 | | | 279,165 | | | 96,460 | | | 435,913 | |
| Accumulated net realized gain (loss) | | | (5,917,983 | ) | | (440,356 | ) | | (2,919,535 | ) | | (1,620,681 | ) |
| Net unrealized appreciation (depreciation) | | | 21,383,789 | | | 36,241,643 | | | 39,167,621 | | | 18,136,514 | |
| Net assets applicable to common shares | | $ | 173,767,246 | | $ | 331,465,724 | | $ | 317,855,981 | | $ | 158,570,876 | |
| Authorized shares: | | | | | | | | | | | | | |
| Common | | | Unlimited | | | Unlimited | | | Unlimited | | | Unlimited | |
| Preferred | | | Unlimited | | | Unlimited | | | Unlimited | | | Unlimited | |
See accompanying notes to financial statements.
| Statement of | | |
| | Operations | Year Ended February 29, 2016 |
| | | | Arizona | | | Michigan | | | Ohio | | | Texas | |
| | | | Premium | | | Quality | | | Quality | | | Quality | |
| | | | Income | | | Income | | | Income | | | Income | |
| | | | (NAZ | ) | | (NUM | ) | | (NUO | ) | | (NTX | ) |
| Investment Income | | $ | 11,318,436 | | $ | 20,677,675 | | $ | 19,901,865 | | $ | 9,361,942 | |
| Expenses | | | | | | | | | | | | | |
| Management fees | | | 1,594,515 | | | 2,941,443 | | | 2,890,107 | | | 1,386,863 | |
| Interest expense and amortization of offering costs | | | 838,702 | | | 1,697,999 | | | 190,165 | | | 1,188,832 | |
| Liquidity fees | | | — | | | — | | | 1,379,253 | | | — | |
| Remarketing fees | | | — | | | — | | | 150,467 | | | — | |
| Custodian fees | | | 37,483 | | | 59,209 | | | 58,477 | | | 35,058 | |
| Trustees fees | | | 6,881 | | | 13,372 | | | 12,673 | | | 6,463 | |
| Professional fees | | | 37,857 | | | 41,417 | | | 49,468 | | | 38,825 | |
| Shareholder reporting expenses | | | 20,168 | | | 41,710 | | | 41,954 | | | 23,480 | |
| Shareholder servicing agent fees | | | 18,927 | | | 37,789 | | | 15,552 | | | 11,976 | |
| Stock exchange listing fees | | | 7,823 | | | 6,563 | | | 7,819 | | | 20,301 | |
| Investor relations expenses | | | 8,689 | | | 16,047 | | | 15,770 | | | 10,228 | |
| Other | | | 4,479 | | | 82,913 | | | 102,997 | | | 33,603 | |
| Total expenses | | | 2,575,524 | | | 4,938,462 | | | 4,914,702 | | | 2,755,629 | |
| Net investment income (loss) | | | 8,742,912 | | | 15,739,213 | | | 14,987,163 | | | 6,606,313 | |
| Realized and Unrealized Gain (Loss) | | | | | | | | | | | | | |
| Net realized gain (loss) from: | | | | | | | | | | | | | |
| Investments | | | 403,719 | | | 1,050,322 | | | 476,198 | | | 388,027 | |
| Swaps | | | — | | | 45,681 | | | 20,171 | | | 53,624 | |
| Change in net unrealized appreciation (depreciation) of: | | | | | | | | | | | | | |
| Investments | | | 69,115 | | | 2,143,164 | | | 2,727,310 | | | 531,074 | |
| Swaps | | | — | | | (187,352 | ) | | (197,460 | ) | | (94,558 | ) |
| Net realized and unrealized gain (loss) | | | 472,834 | | | 3,051,815 | | | 3,026,219 | | | 878,167 | |
| Net increase (decrease) in net assets applicable to common shares from operations | | $ | 9,215,746 | | $ | 18,791,028 | | $ | 18,013,382 | | $ | 7,484,480 | |
See accompanying notes to financial statements.
| Statement of | |
| | Changes in Net Assets |
| | | Arizona
Premium Income (NAZ) | | Michigan
Quality Income (NUM) | |
| | | | Year | | | Year | | | Year | | | Year | |
| | | | Ended | | | Ended | | | Ended | | | Ended | |
| | | | 2/29/16 | | | 2/28/15 | | | 2/29/16 | | | 2/28/15 | |
| Operations | | | | | | | | | | | | | |
| Net investment income (loss) | | $ | 8,742,912 | | $ | 9,114,999 | | $ | 15,739,213 | | $ | 16,591,557 | |
| Net realized gain (loss) from: | | | | | | | | | | | | | |
| Investments | | | 403,719 | | | (22,618 | ) | | 1,050,322 | | | 2,427,886 | |
| Swaps | | | — | | | — | | | 45,681 | | | (110,570 | ) |
| Change in net unrealized appreciation (depreciation) of: | | | | | | | | | | | | | |
| Investments | | | 69,115 | | | 10,106,125 | | | 2,143,164 | | | 15,834,489 | |
| Swaps | | | — | | | — | | | (187,352 | ) | | 187,352 | |
| Net increase (decrease) in net assets applicable to common shares from operations | | | 9,215,746 | | | 19,198,506 | | | 18,791,028 | | | 34,930,714 | |
| Distributions to Common Shareholders | | | | | | | | | | | | | |
| From net investment income | | | (9,230,917 | ) | | (9,185,193 | ) | | (16,161,393 | ) | | (17,879,214 | ) |
| From accumulated net realized gains | | | — | | | — | | | (97,893 | ) | | — | |
| Decrease in net assets applicable to common shares from distributions to common shareholders | | | (9,230,917 | ) | | (9,185,193 | ) | | (16,259,286 | ) | | (17,879,214 | ) |
| Capital Share Transactions | | | | | | | | | | | | | |
| Common shares: | | | | | | | | | | | | | |
| Net proceeds from shares issued to shareholders due to reinvestment of distributions | | | 134,274 | | | — | | | — | | | — | |
| Cost of shares repurchased and retired | | | — | | | — | | | (297,904 | ) | | — | |
| Net increase (decrease) in net assets applicable to common shares from capital share transactions | | | 134,274 | | | — | | | (297,904 | ) | | — | |
| Net increase (decrease) in net assets applicable to common shares | | | 119,103 | | | 10,013,313 | | | 2,233,838 | | | 17,051,500 | |
| Net assets applicable to common shares at the beginning of period | | | 173,648,143 | | | 163,634,830 | | | 329,231,886 | | | 312,180,386 | |
| Net assets applicable to common shares at the end of period | | $ | 173,767,246 | | $ | 173,648,143 | | $ | 331,465,724 | | $ | 329,231,886 | |
| Undistributed (Over-distribution of) net investment income at the end of period | | $ | 1,020,363 | | $ | 1,493,133 | | $ | 279,165 | | $ | 731,592 | |
See accompanying notes to financial statements.
| | | Ohio
Quality Income (NUO) | | Texas
Quality Income (NTX) | |
| | | | Year | | | Year | | | Year | | | Year | |
| | | | Ended | | | Ended | | | Ended | | | Ended | |
| | | | 2/29/16 | | | 2/28/15 | | | 2/29/16 | | | 2/28/15 | |
| Operations | | | | | | | | | | | | | |
| Net investment income (loss) | | $ | 14,987,163 | | $ | 15,719,120 | | $ | 6,606,313 | | $ | 6,249,696 | |
| Net realized gain (loss) from: | | | | | | | | | | | | | |
| Investments | | | 476,198 | | | 1,769,803 | | | 388,027 | | | 12,259 | |
| Swaps | | | 20,171 | | | (102,819 | ) | | 53,624 | | | (50,337 | ) |
| Change in net unrealized appreciation (depreciation) of: | | | | | | | | | | | | | |
| Investments | | | 2,727,310 | | | 18,054,694 | | | 531,074 | | | 9,536,154 | |
| Swaps | | | (197,460 | ) | | 197,460 | | | (94,558 | ) | | 94,558 | |
| Net increase (decrease) in net assets applicable to common shares from operations | | | 18,013,382 | | | 35,638,258 | | | 7,484,480 | | | 15,842,330 | |
| Distributions to Common Shareholders | | | | | | | | | | | | | |
| From net investment income | | | (15,299,135 | ) | | (17,164,296 | ) | | (6,557,796 | ) | | (6,778,394 | ) |
| From accumulated net realized gains | | | — | | | — | | | — | | | — | |
| Decrease in net assets applicable to common shares from distributions to common shareholders | | | (15,299,135 | ) | | (17,164,296 | ) | | (6,557,796 | ) | | (6,778,394 | ) |
| Capital Share Transactions | | | | | | | | | | | | | |
| Common shares: | | | | | | | | | | | | | |
| Net proceeds from shares issued to shareholders due to reinvestment of distributions | | | — | | | — | | | — | | | — | |
| Cost of shares repurchased and retired | | | — | | | — | | | — | | | — | |
| Net increase (decrease) in net assets applicable to common shares from capital share transactions | | | — | | | — | | | — | | | — | |
| Net increase (decrease) in net assets applicable to common shares | | | 2,714,247 | | | 18,473,962 | | | 926,684 | | | 9,063,936 | |
| Net assets applicable to common shares at the beginning of period | | | 315,141,734 | | | 296,667,772 | | | 157,644,192 | | | 148,580,256 | |
| Net assets applicable to common shares at the end of period | | $ | 317,855,981 | | $ | 315,141,734 | | $ | 158,570,876 | | $ | 157,644,192 | |
| Undistributed (Over-distribution of) net investment income at the end of period | | $ | 96,460 | | $ | 495,988 | | $ | 435,913 | | $ | 80,176 | |
See accompanying notes to financial statements.
| Statement of | | |
| | Cash Flows | Year Ended February 29, 2016 |
| | | | Arizona | | | Michigan | | | Ohio | | | Texas | |
| | | | Premium | | | Quality | | | Quality | | | Quality | |
| | | | Income | | | Income | | | Income | | | Income | |
| | | | (NAZ | ) | | (NUM | ) | | (NUO | ) | | (NTX | ) |
| Cash Flows from Operating Activities: | | | | | | | | | | | | | |
| Net Increase (Decrease) in Net Assets Applicable to Common Shares from Operations | | $ | 9,215,746 | | $ | 18,791,028 | | $ | 18,013,382 | | $ | 7,484,480 | |
| Adjustments to reconcile the net increase (decrease) in net assets applicable to common shares from operations to net cash provided by (used in) operating activities: | | | | | | | | | | | | | |
| Purchases of investments | | | (24,355,152 | ) | | (78,225,924 | ) | | (46,201,180 | ) | | (30,197,552 | ) |
| Proceeds from sales and maturities of investments | | | 23,082,266 | | | 57,221,958 | | | 45,272,567 | | | 31,358,000 | |
| Proceeds from (Payments for) swap contracts, net | | | — | | | 45,681 | | | 20,171 | | | 53,624 | |
| Premiums received (paid) for credit default swaps | | | — | | | 904,298 | | | 884,666 | | | 419,803 | |
| Taxes paid | | | — | | | (144 | ) | | (56 | ) | | — | |
| Amortization (Accretion) of premiums and discounts, net | | | 1,061,947 | | | 1,511,204 | | | 1,051,101 | | | 384,514 | |
| Amortization of deferred offering costs | | | 47,869 | | | 73,756 | | | 11,075 | | | 301,901 | |
| (Increase) Decrease in: | | | | | | | | | | | | | |
| Receivable for interest | | | 85,938 | | | (181,559 | ) | | (31,855 | ) | | 141,027 | |
| Receivable for investments sold | | | — | | | — | | | — | | | 4,529,313 | |
| Other assets | | | — | | | (11,023 | ) | | (3,551 | ) | | (1,176 | ) |
| Increase (Decrease) in: | | | | | | | | | | | | | |
| Payable for interest | | | (58,785 | ) | | (118,313 | ) | | — | | | (135,930 | ) |
| Payable for investments purchased | | | — | | | (2,796,832 | ) | | — | | | (5,578,330 | ) |
| Accrued management fees | | | 4,314 | | | 8,985 | | | 11,886 | | | 2,897 | |
| Accrued Trustees fees | | | (1,378 | ) | | 8,293 | | | 2,073 | | | (1,239 | ) |
| Accrued other expenses | | | (89,775 | ) | | (56,616 | ) | | (32,334 | ) | | (34,368 | ) |
| Net realized (gain) loss from: | | | | | | | | | | | | | |
| Investments | | | (403,719 | ) | | (1,050,322 | ) | | (476,198 | ) | | (388,027 | ) |
| Swaps | | | — | | | (45,681 | ) | | (20,171 | ) | | (53,624 | ) |
| Change in net unrealized appreciation (depreciation) of: | | | | | | | | | | | | | |
| Investments | | | (69,115 | ) | | (2,143,164 | ) | | (2,727,310 | ) | | (531,074 | ) |
| Swaps | | | — | | | 187,352 | | | 197,460 | | | 94,558 | |
| Net cash provided by (used in) operating activities | | | 8,520,156 | | | (5,877,023 | ) | | 15,971,726 | | | 7,848,797 | |
| Cash Flows from Financing Activities: | | | | | | | | | | | | | |
| (Payments for) deferred offering costs | | | — | | | — | | | — | | | (530,000 | ) |
| Increase (Decrease) in: | | | | | | | | | | | | | |
| Floating rate obligations | | | — | | | 12,265,000 | | | — | | | (3,960,000 | ) |
| Payable for offering costs | | | (825 | ) | | — | | | (1,201 | ) | | — | |
| iMTP Shares, at liquidation preference | | | — | | | — | | | — | | | 72,000,000 | |
| MTP Shares, at liquidation preference | | | — | | | — | | | — | | | (70,920,000 | ) |
| Cash distributions paid to common shareholders | | | (9,096,403 | ) | | (16,360,582 | ) | | (15,432,711 | ) | | (6,555,703 | ) |
| Cost of common shares repurchased and retired | | | — | | | (297,904 | ) | | — | | | — | |
| Net cash provided by (used in) financing activities | | | (9,097,228 | ) | | (4,393,486 | ) | | (15,433,912 | ) | | (9,965,703 | ) |
| Net Increase (Decrease) in Cash | | | (577,072 | ) | | (10,270,509 | ) | | 537,814 | | | (2,116,906 | ) |
| Cash at the beginning of period | | | 1,300,225 | | | 10,493,167 | | | 2,876,694 | | | 3,984,734 | |
| Cash at the end of period | | $ | 723,153 | | $ | 222,658 | | $ | 3,414,508 | | $ | 1,867,828 | |
| | | | Arizona | | | Michigan | | | Ohio | | | Texas | |
| | | | Premium | | | Quality | | | Quality | | | Quality | |
| | | | Income | | | Income | | | Income | | | Income | |
| Supplemental Disclosures of Cash Flow Information | | | (NAZ | ) | | (NUM | ) | | (NUO | ) | | (NTX | ) |
| Cash paid for interest (excluding amortization of offering costs) | | $ | 850,443 | | $ | 1,742,556 | | $ | 180,291 | | $ | 959,283 | |
| Non-cash financing activities not included herein consists of reinvestments of common share distributions | | | 134,274 | | | — | | | — | | | — | |
See accompanying notes to financial statements.
THIS PAGE INTENTIONALLY LEFT BLANK
Selected data for a common share outstanding throughout each period:
| | | | | Investment Operations | | Less Distributions
to Common Shareholders | | Common Share | |
| | | Beginning
Common
Share
NAV | | Net
Investment
Income
(Loss) | | Net
Realized/
Unrealized
Gain (Loss) | | Distributions
from Net
Investment
Income to
ARPS
Share-
holders | (a) | Distributions
from Accum-
ulated Net
Realized
Gains to
ARPS
Share-
holders | (a) | Total | | From
Net
Investment
Income | | From
Accum-
ulated Net
Realized
Gains | | Total | | Discount
per
Share
Repur-
chased
and
Retired | | Ending
NAV | | Ending
Share
Price | |
| Arizona Premium Income (NAZ) | | | | | | | | | | | | | | | | | | | | | | | | | | | | | | | |
| Year Ended 2/28–2/29: | | | | | | | | | | | | | | | | | | | | | | | | | | | | | | | | | | |
| 2016 | | $ | 15.02 | | $ | 0.76 | | $ | 0.03 | | $ | — | | $ | — | | $ | 0.79 | | $ | (0.80 | ) | $ | — | | $ | (0.80 | ) | $ | — | | $ | 15.01 | | $ | 15.74 | |
| 2015 | | | 14.15 | | | 0.79 | | | 0.87 | | | — | | | — | | | 1.66 | | | (0.79 | ) | | — | | | (0.79 | ) | | — | | | 15.02 | | | 14.37 | |
| 2014 | | | 15.47 | | | 0.55 | | | (1.10 | ) | | — | | | — | | | (0.55 | ) | | (0.77 | ) | | — | | | (0.77 | ) | | — | | | 14.15 | | | 12.79 | |
| 2013 | | | 14.82 | | | 0.75 | | | 0.67 | | | — | | | — | | | 1.42 | | | (0.77 | ) | | — | | | (0.77 | ) | | — | | | 15.47 | | | 15.70 | |
| 2012 | | | 13.25 | | | 0.80 | | | 1.54 | | | (0.01 | ) | | — | | | 2.33 | | | (0.76 | ) | | — | | | (0.76 | ) | | — | | | 14.82 | | | 14.61 | |
| | | | | | | | | | | | | | | | | | | | | | | | | | | | | | | | | | | | | | |
| Michigan Quality Income (NUM) | | | | | | | | | | | | | | | | | | | | | | | | | | | | | | | |
| Year Ended 2/28–2/29: | | | | | | | | | | | | | | | | | | | | | | | | | | | | | | | | | | |
| 2016 | | | 15.80 | | | 0.76 | | | 0.15 | | | — | | | — | | | 0.91 | | | (0.78 | ) | | — | * | | (0.78 | ) | | — | * | | 15.93 | | | 14.01 | |
| 2015 | | | 14.98 | | | 0.80 | | | 0.88 | | | — | | | — | | | 1.68 | | | (0.86 | ) | | — | | | (0.86 | ) | | — | | | 15.80 | | | 13.85 | |
| 2014 | | | 16.35 | | | 0.80 | | | (1.28 | ) | | — | | | — | | | (0.48 | ) | | (0.89 | ) | | — | | | (0.89 | ) | | — | * | | 14.98 | | | 13.45 | |
| 2013 | | | 15.95 | | | 0.74 | | | 0.55 | | | — | | | — | | | 1.29 | | | (0.89 | ) | | — | | | (0.89 | ) | | — | | | 16.35 | | | 15.62 | |
| 2012 | | | 14.18 | | | 0.89 | | | 1.75 | | | (0.01 | ) | | — | | | 2.63 | | | (0.86 | ) | | — | | | (0.86 | ) | | — | * | | 15.95 | | | 15.40 | |
| (a) | The amounts shown for Auction Rate Preferred Shares ("ARPS") are based on common share equivalents. |
| (b) | Total Return Based on Common Share NAV is the combination of changes in common share NAV, reinvested dividend income at NAV and reinvested capital gains distributions at NAV, if any. The last dividend declared in the period, which is typically paid on the first business day of the following month, is assumed to be reinvested at the ending NAV. The actual reinvest price for the last dividend declared in the period may often be based on the Fund's market price (and not its NAV), and therefore may be different from the price used in the calculation. Total returns are not annualized. |
| | |
| | Total Return Based on Common Share Price is the combination of changes in the market price per share and the effect of reinvested dividend income and reinvested capital gains distributions, if any, at the average price paid per share at the time of reinvestment. The last dividend declared in the period, which is typically paid on the first business day of the following month, is assumed to be reinvested at the ending market price. The actual reinvestment for the last dividend declared in the period may take place over several days, and in some instances may not be based on the market price, so the actual reinvestment price may be different from the price used in the calculation. Total returns are not annualized. |
| * | Rounds to less than $0.01 per share. |
| | | | | Common Share Supplemental Data/
Ratios Applicable to Common Shares | |
| | Common Share
Total Returns | | | | | | Ratios to Average Net Assets(c) | | | | |
| | | | | | | | | | | | | | | | | | |
| | | | | Based | | | | | | | | | Net | | | | |
| | Based | | | on | | | Ending | | | | | | Investment | | | Portfolio | |
| | on | | | Share | | | Net | | | | | | Income | | | Turnover | |
| | NAV | (b) | | Price | (b) | | Assets (000 | ) | | Expenses | (d) | | (Loss | ) | | Rate | (e) |
| | | | | | | | | | | | | | | | | | |
| | | | | | | | | | | | | | | | | | |
| | 5.45 | % | | 15.59 | % | $ | 173,767 | | | 1.51 | % | | 5.12 | % | | 9 | % |
| | 12.01 | | | 18.94 | | | 173,648 | | | 1.56 | | | 5.37 | | | 13 | |
| | (3.40 | ) | | (13.52 | ) | | 163,635 | | | 2.47 | | | 4.93 | | | 14 | |
| | 9.77 | | | 13.02 | | | 69,236 | | | 1.80 | | | 4.94 | | | 10 | |
| | 18.08 | | | 25.48 | | | 66,268 | | | 1.52 | | | 5.73 | | | 7 | |
| | | | | | | | | | | | | | | | | | |
| | | | | | | | | | | | | | | | | | |
| | 5.97 | | | 7.15 | | | 331,466 | | | 1.52 | | | 4.85 | | | 12 | |
| | 11.45 | | | 9.48 | | | 329,232 | | | 1.57 | | | 5.14 | | | 15 | |
| | (2.76 | ) | | (8.00 | ) | | 312,180 | | | 1.95 | | | 5.32 | | | 15 | |
| | 8.27 | | | 7.30 | | | 341,057 | | | 1.84 | | | 5.09 | | | 12 | |
| | 19.11 | | | 28.44 | | | 184,270 | | | 1.56 | | | 5.97 | | | 14 | |
| (c) | Ratios do not reflect the effect of dividend payments to ARPS shareholders, during periods when ARPS were outstanding; Net Investment Income (Loss) ratios reflect income earned and expenses incurred on assets attributable to ARPS and other subsequent forms of preferred shares issued by the Fund, where applicable. |
| (d) | The expense ratios reflect, among other things, all interest expense and other costs related to preferred shares (as described in Note 4 – Fund Shares, Preferred Shares) and/or the interest expense deemed to have been paid by the Fund on the floating rate certificates issued by the special purpose trusts for the self-deposited inverse floaters held by the Fund (as described in Note 3 – Portfolio Securities and Investments in Derivatives, Inverse Floating Rate Securities), where applicable, as follows: |
| Arizona Premium Income (NAZ) | | | | |
| Year Ended 2/28–2/29: | | | | |
| 2016 | | | 0.49 | % |
| 2015 | | | 0.50 | |
| 2014 | | | 1.32 | |
| 2013 | | | 0.57 | |
| 2012 | | | 0.35 | |
| Michigan Quality Income (NUM) | | | | |
| Year Ended 2/28–2/29: | | | | |
| 2016 | | | 0.52 | % |
| 2015 | | | 0.53 | |
| 2014 | | | 0.84 | |
| 2013 | | | 0.70 | |
| 2012 | | | 0.46 | |
| (e) | Portfolio Turnover Rate is calculated based on the lesser of long-term purchases or sales (as disclosed in Note 5 – Investment Transactions) divided by the average long-term market value during the period. |
See accompanying notes to financial statements.
Financial Highlights (continued) |
Selected data for a common share outstanding throughout each period:
| | | | | Investment Operations | | Less Distributions
to Common Shareholders | | Common Share | |
| | | Beginning
Common
Share
NAV | | Net
Investment
Income
(Loss) | | Net
Realized/
Unrealized
Gain (Loss) | | Distributions
from Net
Investment
Income to
ARPS
Share-
holders | (a) | Distributions
from Accum-
ulated Net
Realized
Gains to
ARPS
Share-
holders | (a) | Total | | From
Net
Investment
Income | | From
Accum-
ulated Net
Realized
Gains | | Total | | Shelf
Offering
Costs | | Premium Per
Share
Sold
through
Shelf
Offering | | Ending
NAV | | Ending
Share
Price | |
| Ohio Quality Income (NUO) | | | | | | | | | | | | | | | | | | | | | | | | | | | | | | | |
| Year Ended 2/28–2/29: | | | | | | | | | | | | | | | | | | | | | | | | | | | | | | | |
| 2016 | | $ | 17.01 | | $ | 0.81 | | $ | 0.17 | | $ | — | | $ | — | | $ | 0.98 | | $ | (0.83 | ) | $ | — | | $ | (0.83 | ) | $ | — | | $ | — | | $ | 17.16 | | $ | 15.44 | |
| 2015 | | | 16.02 | | | 0.85 | | | 1.07 | | | — | | | — | | | 1.92 | | | (0.93 | ) | | — | | | (0.93 | ) | | — | | | — | | | 17.01 | | | 15.40 | |
| 2014 | | | 17.64 | | | 0.76 | | | (1.39 | ) | | — | | | — | | | (0.63 | ) | | (0.99 | ) | | — | | | (0.99 | ) | | — | | | — | | | 16.02 | | | 14.75 | |
| 2013 | | | 17.17 | | | 0.89 | | | 0.54 | | | — | | | — | | | 1.43 | | | (0.96 | ) | | — | | | (0.96 | ) | | — | | | — | | | 17.64 | | | 17.79 | |
| 2012 | | | 15.44 | | | 0.99 | | | 1.68 | | | (0.01 | ) | | — | | | 2.66 | | | (0.93 | ) | | — | | | (0.93 | ) | | — | | | — | | | 17.17 | | | 16.88 | |
| | | | | | | | | | | | | | | | | | | | | | | | | | | | | | | | | | | | | | | | | |
| Texas Quality Income (NTX) | | | | | | | | | | | | | | | | | | | | | | | | | | | | | | | |
| Year Ended 2/28–2/29: | | | | | | | | | | | | | | | | | | | | | | | | | | | | | | | |
| 2016 | | | 15.72 | | | 0.66 | | | 0.08 | | | — | | | — | | | 0.74 | | | (0.65 | ) | | — | | | (0.65 | ) | | — | | | — | | | 15.81 | | | 14.66 | |
| 2015 | | | 14.82 | | | 0.62 | | | 0.96 | | | — | | | — | | | 1.58 | | | (0.68 | ) | | — | | | (0.68 | ) | | — | | | — | | | 15.72 | | | 14.35 | |
| 2014 | | | 15.87 | | | 0.66 | | | (1.01 | ) | | — | | | — | | | (0.35 | ) | | (0.70 | ) | | — | | | (0.70 | ) | | — | * | | — | * | | 14.82 | | | 13.54 | |
| 2013 | | | 15.46 | | | 0.68 | | | 0.47 | | | — | | | — | | | 1.15 | | | (0.77 | ) | | — | | | (0.77 | ) | | (0.01 | ) | | 0.04 | | | 15.87 | | | 16.00 | |
| 2012 | | | 14.12 | | | 0.75 | | | 1.48 | | | — | | | — | | | 2.23 | | | (0.86 | ) | | (.03 | ) | | (0.89 | ) | | — | | | — | | | 15.46 | | | 16.31 | |
| (a) | The amounts shown for Auction Rate Preferred Shares ("ARPS") are based on common share equivalents. |
| (b) | Total Return Based on Common Share NAV is the combination of changes in common share NAV, reinvested dividend income at NAV and reinvested capital gains distributions at NAV, if any. The last dividend declared in the period, which is typically paid on the first business day of the following month, is assumed to be reinvested at the ending NAV. The actual reinvest price for the last dividend declared in the period may often be based on the Fund's market price (and not its NAV), and therefore may be different from the price used in the calculation. Total returns are not annualized. |
| | Total Return Based on Common Share Price is the combination of changes in the market price per share and the effect of reinvested dividend income and reinvested capital gains distributions, if any, at the average price paid per share at the time of reinvestment. The last dividend declared in the period, which is typically paid on the first business day of the following month, is assumed to be reinvested at the ending market price. The actual reinvestment for the last dividend declared in the period may take place over several days, and in some instances may not be based on the market price, so the actual reinvestment price may be different from the price used in the calculation. Total returns are not annualized. |
| * | Rounds to less than $0.01 per share. |
| | | | | Common Share Supplemental Data/
Ratios Applicable to Common Shares | |
| | Common Share
Total Returns | | | | | | Ratios to Average Net Assets(c) | | | | |
| | | | | | | | | | | | | | | | | | |
| | | | | Based | | | | | | | | | Net | | | | |
| | Based | | | on | | | Ending | | | | | | Investment | | | Portfolio | |
| | on | | | Share | | | Net | | | | | | Income | | | Turnover | |
| | NAV | (b) | | Price | (b) | | Assets (000 | ) | | Expenses | (d) | | (Loss | ) | | Rate | (e) |
| | | | | | | | | | | | | | | | | | |
| | | | | | | | | | | | | | | | | | |
| | 5.95 | % | | 5.96 | % | $ | 317,856 | | | 1.58 | % | | 4.83 | % | | 10 | % |
| | 12.23 | | | 10.79 | | | 315,142 | | | 1.62 | | | 5.10 | | | 15 | |
| | (3.38 | ) | | (11.39 | ) | | 296,668 | | | 2.15 | | | 5.45 | | | 13 | |
| | 8.53 | | | 11.27 | | | 172,898 | | | 1.76 | | | 5.14 | | | 13 | |
| | 17.73 | | | 20.55 | | | 167,709 | | | 1.50 | | | 6.10 | | | 10 | |
| | | | | | | | | | | | | | | | | | |
| | | | | | | | | | | | | | | | | | |
| | 4.89 | | | 7.02 | | | 158,571 | | | 1.78 | | | 4.26 | | | 14 | |
| | 10.81 | | | 11.07 | | | 157,644 | | | 2.33 | | | 4.05 | | | 12 | |
| | (2.11 | ) | | (11.03 | ) | | 148,580 | | | 2.49 | | | 4.46 | | | 13 | |
| | 7.80 | | | 2.97 | | | 158,920 | | | 2.38 | | | 4.33 | | | 12 | |
| | 16.23 | | | 13.81 | | | 148,222 | | | 2.48 | | | 5.10 | | | 9 | |
| (c) | Ratios do not reflect the effect of dividend payments to ARPS shareholders, during periods when ARPS were outstanding; Net Investment Income (Loss) ratios reflect income earned and expenses incurred on assets attributable to ARPS and other subsequent forms of preferred shares issued by the Fund, where applicable. |
| (d) | The expense ratios reflect, among other things, all interest expense and other costs related to preferred shares (as described in Note 4 – Fund Shares, Preferred Shares) and/or the interest expense deemed to have been paid by the Fund on the floating rate certificates issued by the special purpose trusts for the self-deposited inverse floaters held by the Fund (as described in Note 3 – Portfolio Securities and Investments in Derivatives, Inverse Floating Rate Securities), where applicable, as follows: |
| Ohio Quality Income (NUO) | | | | |
| Year Ended 2/28–2/29: | | | | |
| 2016 | | | 0.55 | % |
| 2015 | | | 0.57 | |
| 2014 | | | 1.05 | |
| 2013 | �� | | 0.61 | |
| 2012 | | | 0.40 | |
| Texas Quality Income (NTX) | | | | |
| Year Ended 2/28–2/29: | | | | |
| 2016 | | | 0.77 | % |
| 2015 | | | 1.26 | |
| 2014 | | | 1.31 | |
| 2013 | | | 1.27 | |
| 2012 | | | 1.37 | |
| (e) | Portfolio Turnover Rate is calculated based on the lesser of long-term purchases or sales (as disclosed in Note 5 – Investment Transactions) divided by the average long-term market value during the period. |
See accompanying notes to financial statements.
Financial Highlights (continued)
| | | MTP Shares
at the End of Period(a) | | VMTP Shares
at the End of Period | | MTP and VMTP
Shares at the
End of Period | |
| | | | | | | | | | | | | | | | Asset | |
| | | | Aggregate | | | Asset | | | Aggregate | | | Asset | | | Coverage | |
| | | | Amount | | | Coverage | | | Amount | | | Coverage | | | Per $1 | |
| | | Outstanding | | Per $10 | | Outstanding | | Per $100,000 | | Liquidation | |
| | | | (000 | ) | | Share | | | (000 | ) | | Share | | | Preference | |
| Arizona Premium Income (NAZ) | | | | | | | | | | | | | | | | |
| Year Ended 2/28–2/29: | | | | | | | | | | | | | | | | |
| 2016 | | $ | — | | $ | — | | $ | 79,000 | | $ | 319,959 | | $ | — | |
| 2015 | | | — | | | — | | | 79,000 | | | 319,808 | | | — | |
| 2014 | | | — | | | — | | | 79,000 | | | 307,133 | | | — | |
| 2013 | | | — | | | — | | | 28,000 | | | 347,271 | | | — | |
| 2012 | | | — | | | — | | | 28,000 | | | 336,672 | | | — | |
| | | | | | | | | | | | | | | | | |
| Michigan Quality Income (NUM) | | | | | | | | | | | | | | | | |
| Year Ended 2/28–2/29: | | | | | | | | | | | | | | | | |
| 2016 | | | — | | | — | | | 159,000 | | | 308,469 | | | — | |
| 2015 | | | — | | | — | | | 159,000 | | | 307,064 | | | — | |
| 2014 | | | — | | | — | | | 159,000 | | | 296,340 | | | — | |
| 2013 | | | 16,313 | | | 31.57 | | | 141,800 | | | 315,704 | | | 3.16 | |
| 2012 | | | — | | | — | | | 87,900 | | | 309,636 | | | — | |
| (a) | The Ending and Average Market Value Per Share for each Series of the Fund's MTP Shares were as follows: |
| | | | 2014 | | | 2013 | |
| Arizona Premium Income (NAZ) | | | | | | | |
| Series 2015 (NAZ PRC) | | | | | | | |
| Ending Market Value per Share | | $ | — | | $ | — | |
| Average Market Value per Share | | | 10.02 | Δ | | — | |
| Series 2016 (NAZ PRD) | | | | | | | |
| Ending Market Value per Share | | | — | | | — | |
| Average Market Value per Share | | | 10.11 | Δ | | — | |
| | | | | | | | |
| Michigan Quality Income (NUM) | | | | | | | |
| Series 2015 (NUM PRC) | | | | | | | |
| Ending Market Value per Share | | | — | | | 10.08 | |
| Average Market Value per Share | | | 10.02 | ΔΔΔ | | 10.06 | ΔΔ |
| Δ | For the period April 8, 2013 (effective date of the reorganizations) through December 20, 2013. |
| ΔΔ | For the period January 7, 2013 (effective date of the reorganizations) through February 28, 2013. |
| ΔΔΔ | For the period March 1, 2013 through December 20, 2013. |
See accompanying notes to financial statements.
| | | | iMTP Shares
at the End of Period | | | MTP Shares
at the End of Period (a) | | | VMTP Shares
at the End of Period | | | VRDP Shares
at the End of Period | |
| | | | Aggregate | | | Asset | | | Aggregate | | | Asset | | | Aggregate | | | Asset | | | Aggregate | | | Asset | |
| | | | Amount | | | Coverage | | | Amount | | | Coverage | | | Amount | | | Coverage | | | Amount | | | Coverage | |
| | | Outstanding | | | Per $5,000 | | Outstanding | | | Per $10 | | Outstanding | | Per $100,000 | | Outstanding | | Per $100,000 | |
| | | | (000 | ) | | Share | | | (000 | ) | | Share | | | (000 | ) | | Share | | | (000 | ) | | Share | |
| Ohio Quality Income (NUO) | | | | | | | | | | | | | | | | | | | | | | |
| Year Ended 2/28–2/29: | | | | | | | | | | | | | | | | | | | | | | |
| 2016 | | $ | — | | $ | — | | $ | — | | $ | — | | $ | — | | $ | — | | $ | 148,000 | | $ | 314,768 | |
| 2015 | | | — | | | — | | | — | | | — | | | — | | | — | | | 148,000 | | | 312,934 | |
| 2014 | | | — | | | — | | | — | | | — | | | — | | | — | | | 148,000 | | | 300,451 | |
| 2013 | | | — | | | — | | | — | | | — | | | 73,500 | | | 335,236 | | | — | | | — | |
| 2012 | | | — | | | — | | | — | | | — | | | 73,500 | | | 328,176 | | | — | | | — | |
| | | | | | | | | | | | | | | | | | | | | | | | | | |
| Texas Quality Income (NTX) | | | | | | | | | | | | | | | | | | | | | | |
| Year Ended 2/28–2/29: | | | | | | | | | | | | | | | | | | | | | | |
| 2016 | | | 72,000 | | | 16,012 | | | — | | | — | | | — | | | — | | | — | | | — | |
| 2015 | | | — | | | — | | | 70,920 | | | 32.23 | | | — | | | — | | | — | | | — | |
| 2014 | | | — | | | — | | | 70,920 | | | 30.95 | | | — | | | — | | | — | | | — | |
| 2013 | | | — | | | — | | | 70,920 | | | 32.41 | | | — | | | — | | | — | | | — | |
| 2012 | | | — | | | — | | | 70,920 | | | 30.90 | | | — | | | — | | | — | | | — | |
| (a) | The Ending and Average Market Value Per Share for each Series of the Fund's MTP Shares were as follows: |
| | | | 2016 | | | 2015 | | | 2014 | | | 2013 | | | 2012 | |
| Ohio Quality Income (NUO) | | | | | | | | | | | | | | | | |
| Series 2014 (NUO PRACL) | | | | | | | | | | | | | | | | |
| Ending Market Value per Share | | $ | — | | $ | — | | $ | — | | $ | — | | $ | — | |
| Average Market Value per Share | | | — | | | — | | | 10.01 | Ω | | — | | | — | |
| Series 2015 (NUO PRCCL) | | | | | | | | | | | | | | | | |
| Ending Market Value per Share | | | — | | | — | | | — | | | — | | | — | |
| Average Market Value per Share | | | — | | | — | | | 10.03 | Ω | | — | | | — | |
| Series 2016 (NUO PRDCL) | | | | | | | | | | | | | | | | |
| Ending Market Value per Share | | | — | | | — | | | — | | | — | | | — | |
| Average Market Value per Share | | | — | | | — | | | 10.06 | Ω | | — | | | — | |
| | | | | | | | | | | | | | | | | |
| Texas Quality Income (NTX) | | | | | | | | | | | | | | | | |
| Series 2015 (NTX PRCCL) | | | | | | | | | | | | | | | | |
| Ending Market Value per Share | | | — | | | 10.02 | | | 10.03 | | | 10.04 | | | 10.05 | |
| Average Market Value per Share | | | 10.01 | ΩΩ | | 10.04 | | | 10.04 | | | 10.06 | | | 9.97 | |
| Ω | For the period April 8, 2013 (effective date of the reorganization) through October 7, 2013. |
| ΩΩ | For the period March 1, 2015 through April 20, 2015. |
See accompanying notes to financial statements.
| Notes to Financial Statements |
1. General Information and Significant Accounting Policies
General Information
Fund Information
The state funds covered in this report and their corresponding New York Stock Exchange ("NYSE") symbols are as follows (each a "Fund" and collectively, the "Funds"):
| | • | Nuveen Arizona Premium Income Municipal Fund (NAZ) ("Arizona Premium Income (NAZ)") |
| | • | Nuveen Michigan Quality Income Municipal Fund (NUM) ("Michigan Quality Income (NUM)") |
| | • | Nuveen Ohio Quality Income Municipal Fund (NUO) ("Ohio Quality Income (NUO)") |
| | • | Nuveen Texas Quality Income Municipal Fund (NTX) ("Texas Quality Income (NTX)") |
The Funds are registered under the Investment Company Act of 1940, as amended, as diversified, closed-end management investment companies. Arizona Premium Income (NAZ), Michigan Quality Income (NUM) and Ohio Quality Income (NUO) were organized as Massachusetts business trusts on April 8, 2013, January 7, 2013 and April 8, 2013, respectively (previously organized as Minnesota trusts on January 23, 1991, July 25, 1991 and October 17, 1991, respectively). Texas Quality Income (NTX) was organized as a Massachusetts business trust on July 26, 1991.
The end of the reporting period for the Funds is February 29, 2016, and the period covered by these Notes to Financial Statements is the fiscal year ended February 29, 2016 (the "current fiscal period").
Investment Adviser
The Funds' investment adviser is Nuveen Fund Advisors, LLC (the "Adviser"), a wholly-owned subsidiary of Nuveen Investments, Inc. ("Nuveen"). The Adviser is responsible for each Fund's overall investment strategy and asset allocation decisions. The Adviser has entered into sub-advisory agreements with Nuveen Asset Management, LLC (the "Sub-Adviser"), a subsidiary of the Adviser, under which the Sub-Adviser manages the investment portfolios of the Funds.
Investment Objectives and Principal Investment Strategies
Each Fund seeks to provide current income exempt from both regular federal and designated state income taxes by investing primarily in a portfolio of municipal obligations issued by state and local government authorities within a single state or certain U.S. territories.
Significant Accounting Policies
Each Fund is an investment company and follows accounting and reporting guidance under Financial Accounting Standards Board (FASB) Accounting Standards Codification (ASC) Topic 946 "Financial Services – Investment Companies." The following is a summary of significant accounting policies followed by the Funds in the preparation of their financial statements in accordance with U.S. generally accepted accounting principles ("U.S. GAAP").
Investment Transactions
Investment transactions are recorded on a trade date basis. Realized gains and losses from investment transactions are determined on the specific identification method, which is the same basis used for federal income tax purposes. Investments purchased on a when-issued/delayed delivery basis may have extended settlement periods. Any investments so purchased are subject to market fluctuation during this period. The Funds have earmarked securities in their portfolios with a current value at least equal to the amount of the when-issued/delayed delivery purchase commitments.
As of the end of the reporting period, the Funds did not have any outstanding when-issued/delayed delivery purchase commitments.
Investment Income
Investment income, which reflects the amortization of premiums and accretion of discounts for financial reporting purposes, is recorded on an accrual basis. Investment income also reflects paydown gains and losses, if any.
Professional Fees
Professional fees presented on the Statement of Operations consist of legal fees incurred in the normal course of operations, audit fees, tax consulting fees and, in some cases, workout expenditures. Workout expenditures are incurred in an attempt to protect or enhance an investment or to pursue other claims or legal actions on behalf of Fund shareholders. If a refund is received for workout expenditures paid in a prior reporting period, such amounts will be recognized as "Legal fee refund" on the Statement of Operations.
Dividends and Distributions to Common Shareholders
Dividends from net investment income are declared monthly. Net realized capital gains and/or market discount from investment transactions, if any, are distributed to shareholders at least annually. Furthermore, capital gains are distributed only to the extent they exceed available capital loss carryforwards.
Distributions to common shareholders of net investment income, net realized capital gains and/or market discount, if any, are recorded on the ex-dividend date. The amount and timing of distributions are determined in accordance with federal income tax regulations, which may differ from U.S. GAAP.
Indemnifications
Under the Funds' organizational documents, their officers and trustees are indemnified against certain liabilities arising out of the performance of their duties to the Funds. In addition, in the normal course of business, the Funds enter into contracts that provide general indemnifications to other parties. The Funds' maximum exposure under these arrangements is unknown as this would involve future claims that may be made against the Funds that have not yet occurred. However, the Funds have not had prior claims or losses pursuant to these contracts and expect the risk of loss to be remote.
Netting Agreements
In the ordinary course of business, the Funds may enter into transactions subject to enforceable International Swaps and Derivative Association, Inc. ("ISDA") master agreements or other similar arrangements ("netting agreements"). Generally, the right to offset in netting agreements allows each Fund to offset certain securities and derivatives with a specific counterparty as well as any collateral received or delivered to that counterparty based on the terms of the agreements. Generally, each Fund manages its cash collateral and securities collateral on a counterparty basis.
The Funds' investments subject to netting agreements as of the end of the reporting period, if any, are further described in Note 3 – Portfolio Securities and Investments in Derivatives.
Use of Estimates
The preparation of financial statements in conformity with U.S. GAAP requires management to make estimates and assumptions that affect the reported amounts of assets and liabilities at the date of the financial statements and the reported amounts of increases and decreases in net assets applicable to common shares from operations during the reporting period. Actual results may differ from those estimates.
2. Investment Valuation and Fair Value Measurements
The fair valuation input levels as described below are for fair value measurement purposes.
Fair value is defined as the price that would be received upon selling an investment or transferring a liability in an orderly transaction to an independent buyer in the principal or most advantageous market for the investment. A three-tier hierarchy is used to maximize the use of observable market data and minimize the use of unobservable inputs and to establish classification of fair value measurements for disclosure purposes. Observable inputs reflect the assumptions market participants would use in pricing the asset or liability. Observable inputs are based on market data obtained from sources independent of the reporting entity. Unobservable inputs reflect the reporting entity's own assumptions about the assumptions market participants would use in pricing the asset or liability. Unobservable inputs are based on the best information available in the circumstances. The following is a summary of the three-tiered hierarchy of valuation input levels.
| | Level 1 – | Inputs are unadjusted and prices are determined using quoted prices in active markets for identical securities. |
| | Level 2 – | Prices are determined using other significant observable inputs (including quoted prices for similar securities, interest rates, prepayment speeds, credit risk, etc.). |
| | Level 3 – | Prices are determined using significant unobservable inputs (including management's assumptions in determining the fair value of investments). |
Prices of fixed income securities are provided by an independent pricing service approved by the Funds' Board of Trustees (the "Board"). The pricing service establishes a security's fair value using methods that may include consideration of the following: yields or prices of investments of comparable quality, type of issue, coupon, maturity and rating, market quotes or indications of value from security dealers, evaluations of anticipated cash flows or collateral, general market conditions and other information and analysis, including the obligor's credit characteristics considered relevant. These securities are generally classified as Level 2. In pricing certain securities, particularly less liquid and lower quality securities, the pricing service may consider information about a security, its issuer or market activity, provided by the Adviser. These securities are generally classified as Level 2 or Level 3 depending on the priority of the significant inputs.
Notes to Financial Statements (continued)
Prices of swap contracts are also provided by a pricing service approved by the Board using the same methods as described above and are generally classified as Level 2.
Certain securities may not be able to be priced by the pre-established pricing methods as described above. Such securities may be valued by the Board and/or its appointee at fair value. These securities generally include, but are not limited to, restricted securities (securities which may not be publicly sold without registration under the Securities Act of 1933, as amended) for which a pricing service is unable to provide a market price; securities whose trading has been formally suspended; debt securities that have gone into default and for which there is no current market quotation; a security whose market price is not available from a pre-established pricing source; a security with respect to which an event has occurred that is likely to materially affect the value of the security after the market has closed but before the calculation of a Fund's net asset value ("NAV") (as may be the case in non-U.S. markets on which the security is primarily traded) or make it difficult or impossible to obtain a reliable market quotation; and a security whose price, as provided by the pricing service, is not deemed to reflect the security's fair value. As a general principle, the fair value of a security would appear to be the amount that the owner might reasonably expect to receive for it in a current sale. A variety of factors may be considered in determining the fair value of such securities, which may include consideration of the following: yields or prices of investments of comparable quality, type of issue, coupon, maturity and rating, market quotes or indications of value from security dealers, evaluations of anticipated cash flows or collateral, general market conditions and other information and analysis, including the obligor's credit characteristics considered relevant. These securities are generally classified as Level 2 or Level 3 depending on the priority of the significant inputs. Regardless of the method employed to value a particular security, all valuations are subject to review by the Board and/or its appointee.
The inputs or methodologies used for valuing securities are not an indication of the risks associated with investing in those securities. The following is a summary of each Fund's fair value measurements as of the end of the reporting period:
| Arizona Premium Income (NAZ) | | | Level 1 | | | Level 2 | | | Level 3 | | | Total | |
| Long-Term Investments*: | | | | | | | | | | | | | |
| Municipal Bonds | | $ | — | | $ | 253,297,034 | | $ | — | | $ | 253,297,034 | |
| Michigan Quality Income (NUM) | | | | | | | | | | | | | |
| Long-Term Investments*: | | | | | | | | | | | | | |
| Municipal Bonds | | $ | — | | $ | 504,350,414 | | $ | — | | $ | 504,350,414 | |
| Ohio Quality Income (NUO) | | | | | | | | | | | | | |
| Long-Term Investments*: | | | | | | | | | | | | | |
| Municipal Bonds | | $ | — | | $ | 458,334,915 | | $ | — | | $ | 458,334,915 | |
| Texas Quality Income (NTX) | | | | | | | | | | | | | |
| Long-Term Investments*: | | | | | | | | | | | | | |
| Municipal Bonds | | $ | — | | $ | 226,599,359 | | $ | — | | $ | 226,599,359 | |
| * | Refer to the Fund's Portfolio of Investments for industry classifications. |
The Board is responsible for the valuation process and has appointed the oversight of the daily valuation process to the Adviser's Valuation Committee. The Valuation Committee, pursuant to the valuation policies and procedures adopted by the Board, is responsible for making fair value determinations, evaluating the effectiveness of the Funds' pricing policies and reporting to the Board. The Valuation Committee is aided in its efforts by the Adviser's dedicated Securities Valuation Team, which is responsible for administering the daily valuation process and applying fair value methodologies as approved by the Valuation Committee. When determining the reliability of independent pricing services for investments owned by the Funds, the Valuation Committee, among other things, conducts due diligence reviews of the pricing services and monitors the quality of security prices received through various testing reports conducted by the Securities Valuation Team.
The Valuation Committee will consider pricing methodologies it deems relevant and appropriate when making a fair value determination, based on the facts and circumstances specific to the portfolio instrument. Fair value determinations generally will be derived as follows, using public or private market information:
| (i) | If available, fair value determinations shall be derived by extrapolating from recent transactions or quoted prices for identical or comparable securities. |
| | |
| (ii) | If such information is not available, an analytical valuation methodology may be used based on other available information including, but not limited to: analyst appraisals, research reports, corporate action information, issuer financial statements and shelf registration statements. Such analytical valuation methodologies may include, but are not limited to: multiple of earnings, discount from market value of a similar freely-traded security, discounted cash flow analysis, book value or a multiple thereof, risk premium/yield analysis, yield to maturity and/or fundamental investment analysis. |
The purchase price of a portfolio instrument will be used to fair value the instrument only if no other valuation methodology is available or deemed appropriate, and it is determined that the purchase price fairly reflects the instrument's current value.
For each portfolio security that has been fair valued pursuant to the policies adopted by the Board, the fair value price is compared against the last available and next available market quotations. The Valuation Committee reviews the results of such testing and fair valuation occurrences are reported to the Board.
3. Portfolio Securities and Investments in Derivatives
Portfolio Securities
Inverse Floating Rate Securities
Each Fund is authorized to invest in inverse floating rate securities. An inverse floating rate security is created by depositing a municipal bond (referred to as an "Underlying Bond"), typically with a fixed interest rate, into a special purpose tender option bond ("TOB") trust (referred to as the "TOB Trust") created by or at the direction of one or more Funds. In turn, the TOB Trust issues (a) floating rate certificates (referred to as "Floaters"), in face amounts equal to some fraction of the Underlying Bond's par amount or market value, and (b) an inverse floating rate certificate (referred to as an "Inverse Floater") that represents all remaining or residual interest in the TOB Trust. Floaters typically pay short-term tax-exempt interest rates to third parties who are also provided a right to tender their certificate and receive its par value, which may be paid from the proceeds of a remarketing of the Floaters, by a loan to the TOB Trust from a third party liquidity provider ("Liquidity Provider"), or by the sale of assets from the TOB Trust. The Inverse Floater is issued to a long term investor, such as one or more of the Funds. The income received by the Inverse Floater holder varies inversely with the short-term rate paid to holders of the Floaters, and in most circumstances the Inverse Floater holder bears substantially all of the Underlying Bond's downside investment risk and also benefits disproportionately from any potential appreciation of the Underlying Bond's value. The value of an Inverse Floater will be more volatile than that of the Underlying Bond because the interest rate is dependent on not only the fixed coupon rate of the Underlying Bond but also on the short-term interest paid on the Floaters, and because the Inverse Floater essentially bears the risk of loss (and possible gain) of the greater face value of the Underlying Bond.
The Inverse Floater held by a Fund gives the Fund the right to (a) cause the holders of the Floaters to tender their certificates at par (or slightly more than par in certain circumstances), and (b) have the trustee of the TOB Trust (the "Trustee") transfer the Underlying Bond held by the TOB Trust to the Fund, thereby collapsing the TOB Trust.
The Fund may acquire an Inverse Floater in a transaction where it (a) transfers an Underlying Bond that it owns to a TOB Trust created by a third party or (b) transfers an Underlying Bond that it owns, or that it has purchased in a secondary market transaction for the purpose of creating an Inverse Floater, to a TOB Trust created at its direction, and in return receives the Inverse Floater of the TOB Trust (referred to as a "self-deposited Inverse Floater"). A Fund may also purchase an Inverse Floater in a secondary market transaction from a third party creator of the TOB Trust without first owning the Underlying Bond (referred to as an "externally-deposited Inverse Floater").
An investment in a self-deposited Inverse Floater is accounted for as a "financing" transaction (i.e., a secured borrowing). For a self-deposited Inverse Floater, the Underlying Bond deposited into the TOB Trust is identified in the Fund's Portfolio of Investments as "(UB) – Underlying bond of an inverse floating rate trust reflected as a financing transaction," with the Fund recognizing as liabilities, labeled "Floating rate obligations" on the Statement of Assets and Liabilities, (a) the liquidation value of Floaters issued by the TOB Trust, and (b) the amount of any borrowings by the TOB Trust from a Liquidity Provider to enable the TOB Trust to purchase outstanding Floaters in lieu of a remarketing. In addition, the Fund recognizes in "Investment Income" the entire earnings of the Underlying Bond, and recognizes (a) the interest paid to the holders of the Floaters or on the TOB Trust's borrowings, and (b) other expenses related to remarketing, administration, trustee, liquidity and other services to a TOB Trust, as a component of "Interest expense and amortization of offering costs" on the Statement of Operations.
In contrast, an investment in an externally-deposited Inverse Floater is accounted for as a purchase of the Inverse Floater and is identified in the Fund's Portfolio of Investments as "(IF) – Inverse floating rate investment." For an externally-deposited Inverse Floater, a Fund's Statement of Assets and Liabilities recognizes the Inverse Floater and not the Underlying Bond as an asset, and the Fund does not recognize the Floaters, or any related borrowings from a Liquidity Provider, as a liability. Additionally, the Fund reflects in "Investment Income" only the net amount of earnings on the Inverse Floater (net of the interest paid to the holders of the Floaters or the Liquidity Provider as lender, and the expenses of the Trust), and does not show the amount of that interest paid or the expenses of the TOB Trust as described above as interest expense on the Statement of Operations.
Notes to Financial Statements (continued) |
Fees paid upon the creation of a TOB Trust for self-deposited Inverse Floaters and externally-deposited Inverse Floaters are recognized as part of the cost basis of the Inverse Floater and are capitalized over the term of the TOB Trust.
As of the end of the reporting period, the aggregate value of Floaters issued by each Fund's TOB Trust for self-deposited Inverse Floaters and externally-deposited Inverse Floaters was as follows:
| | | | Arizona | | | Michigan | | | Ohio | | | Texas | |
| | | | Premium | | | Quality | | | Quality | | | Quality | |
| | | | Income | | | Income | | | Income | | | Income | |
| Floating Rate Obligations Outstanding | | | (NAZ | ) | | (NUM | ) | | (NUO | ) | | (NTX | ) |
| Floating rate obligations: self-deposited Inverse Floaters | | $ | 2,755,000 | | $ | 18,890,000 | | $ | — | | $ | — | |
| Floating rate obligations: externally-deposited Inverse Floaters | | | 14,215,000 | | | 8,430,000 | | | 23,155,000 | | | — | |
| Total | | $ | 16,970,000 | | $ | 27,320,000 | | $ | 23,155,000 | | $ | — | |
During the current fiscal period, the average amount of Floaters (including any borrowings from a Liquidity Provider) outstanding, and the average annual interest rate and fees related to self-deposited Inverse Floaters, were as follows:
| | | | Arizona | | | Michigan | | | Ohio | | | Texas | |
| | | | Premium | | | Quality | | | Quality | | | Quality | |
| | | | Income | | | Income | | | Income | | | Income | |
| Self-Deposited Inverse Floaters | | | (NAZ | ) | | (NUM | ) | | (NUO | ) | | (NTX | ) |
| Average floating rate obligations outstanding | | $ | 2,755,000 | | $ | 9,171,831 | | $ | — | | $ | 618,525 | |
| Average annual interest rate and fees | | | 0.53 | % | | 0.65 | % | | — | % | | 0.27 | % |
TOB Trusts are supported by a liquidity facility provided by a Liquidity Provider pursuant to which the Liquidity Provider agrees, in the event that Floaters are (a) tendered to the Trustee for remarketing and the remarketing does not occur, or (b) subject to mandatory tender pursuant to the terms of the TOB Trust agreement, to either purchase Floaters or to provide the Trustee with an advance from a loan facility to fund the purchase of Floaters by the TOB Trust. In certain circumstances, the Liquidity Provider may otherwise elect to have the Trustee sell the Underlying Bond to retire the Floaters that were tendered and not remarketed prior to providing such a loan. In these circumstances, the Liquidity Provider remains obligated to provide a loan to the extent that the proceeds of the sale of the Underlying Bond is not sufficient to pay the purchase price of the Floaters.
The size of the commitment under the loan facility for a given TOB Trust is at least equal to the balance of that TOB Trust's outstanding Floaters plus any accrued interest. In consideration of the loan facility, fee schedules are in place and are charged by the Liquidity Provider(s). Any loans made by the Liquidity Provider will be secured by the purchased Floaters held by the TOB Trust. Interest paid on any outstanding loan balances will be effectively borne by the Fund that owns the Inverse Floaters of the TOB Trust that has incurred the borrowing and may be at a rate that is greater than the rate that would have been paid had the Floaters been successfully remarketed.
As described above, any amounts outstanding under a liquidity facility are recognized as a component of "Floating rate obligations" on the Statement of Assets and Liabilities by the Fund holding the corresponding Inverse Floaters issued by the borrowing TOB Trust. As of the end of the reporting period, there were no loans outstanding under any such facility.
Each Fund may also enter into shortfall and forbearance agreements (sometimes referred to as a "recourse arrangement" or "credit recovery swap") (TOB Trusts involving such agreements are referred to herein as "Recourse Trusts"), under which a Fund agrees to reimburse the Liquidity Provider for the Trust's Floaters, in certain circumstances, for the amount (if any) by which the liquidation value of the Underlying Bond held by the TOB Trust may fall short of the sum of the liquidation value of the Floaters issued by the TOB Trust plus any amounts borrowed by the TOB Trust from the Liquidity Provider, plus any shortfalls in interest cash flows. Under these agreements, a Fund's potential exposure to losses related to or on an Inverse Floater may increase beyond the value of the Inverse Floater as a Fund may potentially be liable to fulfill all amounts owed to holders of the Floaters or the Liquidity Provider. Any such shortfall amount in the aggregate is recognized as "Unrealized depreciation on Recourse Trusts" on the Statement of Assets and Liabilities.
As of the end of the reporting period, each Fund's maximum exposure to the Floaters issued by Recourse Trusts for self-deposited Inverse Floaters and externally-deposited Inverse Floaters was as follows:
| | | | Arizona | | | Michigan | | | Ohio | | | Texas | |
| | | | Premium | | | Quality | | | Quality | | | Quality | |
| | | | Income | | | Income | | | Income | | | Income | |
| Floating Rate Obligations – Recourse Trusts | | | (NAZ | ) | | (NUM | ) | | (NUO | ) | | (NTX | ) |
| Maximum exposure to Recourse Trusts: self-deposited Inverse Floaters | | $ | 2,755,000 | | $ | 12,265,000 | | $ | — | | $ | — | |
| Maximum exposure to Recourse Trusts: externally-deposited Inverse Floaters | | | 7,500,000 | | | 8,430,000 | | | 4,480,000 | | | — | |
| Total | | $ | 10,255,000 | | $ | 20,695,000 | | $ | 4,480,000 | | $ | — | |
Zero Coupon Securities
A zero coupon security does not pay a regular interest coupon to its holders during the life of the security. Income to the holder of the security comes from accretion of the difference between the original purchase price of the security at issuance and the par value of the security at maturity and is effectively paid at maturity. The market prices of zero coupon securities generally are more volatile than the market prices of securities that pay interest periodically.
Investments in Derivatives
In addition to the inverse floating rate securities in which each Fund may invest, which are considered portfolio securities for financial reporting purposes, each Fund is authorized to invest in certain other derivative instruments, such as futures, options and swap contracts. Each Fund limits its investments in futures, options on futures and swap contracts to the extent necessary for the Adviser to claim the exclusion from registration by the Commodity Futures Trading Commission as a commodity pool operator with respect to the Fund. The Funds record derivative instruments at fair value, with changes in fair value recognized on the Statement of Operations, when applicable. Even though the Funds' investments in derivatives may represent economic hedges, they are not considered to be hedge transactions for financial reporting purposes.
Credit Default Swaps
A Fund may enter into a credit default swap contract to seek to maintain a total return on a particular investment or portion of its portfolio, or to take an active long or short position with respect to the likelihood of a particular issuer's default. Credit default swap contracts involve one party making a stream of payments to another party in exchange for the right to receive a specified return if/when there is a credit event by a third party. Generally, a credit event means bankruptcy, failure to pay, or restructuring. The specific credit events applicable for each credit default swap are stated in the terms of the particular swap agreement. Upon occurrence of a specific credit event with respect to the underlying referenced entity, the Fund will either (i) receive that security, or an equivalent amount of cash, from the counterparty in exchange for payment of the notional amount to the counterparty, or (ii) pay a net settlement amount of the credit default swap contract less the recovery value of the referenced obligation or underlying securities comprising the referenced index. The difference between the value of the security delivered and the notional amount received is recorded as a realized gain or loss. Payments received or made at the beginning of the measurement period are recognized as a component of "Credit default swaps premiums paid and/or received" on the Statement of Assets and Liabilities, when applicable.
Credit default swap contracts are valued daily. Changes in the value of a credit default swap during the fiscal period are recognized as a component of "Change in net unrealized appreciation (depreciation) of swaps" and realized gains and losses are recognized as a component of "Net realized gain (loss) from swaps" on the Statement of Operations.
For over-the-counter ("OTC") swaps not cleared through a clearing house ("OTC Uncleared"), the daily change in the market value of the swap contract, along with any daily interest fees accrued, are recognized as components of "Unrealized appreciation or depreciation on credit default swaps (, net)" on the Statement of Assets and Liabilities.
Upon the execution of an OTC swap cleared through a clearing house ("OTC Cleared"), a Fund is obligated to deposit cash or eligible securities, also known as "initial margin," into an account at its clearing broker equal to a specified percentage of the contract amount. Cash held by the broker to cover initial margin requirements on open swap contracts, if any, is recognized as "Cash collateral at brokers" on the Statement of Assets and Liabilities. Investments in OTC Cleared swaps obligate a Fund and the clearing broker to settle monies on a daily basis representing changes in the prior day's "mark-to-market" of the swap. If a Fund has unrealized appreciation the clearing broker would credit the Fund's account with an amount equal to the appreciation and conversely if a Fund has unrealized depreciation the clearing broker would debit a Fund's account with an amount equal to the depreciation. These daily cash settlements are also known as "variation margin." Variation margin for OTC Cleared swaps is recognized as a receivable and/or payable for "Variation margin on swap contracts" on the Statement of Assets and Liabilities. Upon the execution of an OTC
Notes to Financial Statements (continued) |
Uncleared swap, neither the Fund nor the counterparty is required to deposit initial margin as the trades are recorded bilaterally between both parties to the swap contract, and the terms of the variation margin are subject to a predetermined threshold negotiated by the Fund and the counterparty. Variation margin for OTC Uncleared swaps is recognized as a component of "Unrealized appreciation or depreciation on credit default swaps (, net)" as described in the preceding paragraph. The maximum potential amount of future payments the Fund could incur as a buyer or seller of protection in a credit default swap contract is limited to the notional amount of the contract. The maximum potential amount would be offset by the recovery value, if any, of the respective referenced entity.
During the current fiscal period, Michigan Quality Income (NUM), Ohio Quality Income (NUO) and Texas Quality Income (NTX) invested in credit default swaps to manage credit risk by purchasing credit protection.
The average notional amount of credit default swap contracts outstanding during the current fiscal period was as follows:
| | | | Michigan | | | Ohio | | | Texas | |
| | | | Quality | | | Quality | | | Quality | |
| | | | Income | | | Income | | | Income | |
| | | | (NUM | ) | | (NUO | ) | | (NTX | ) |
| Average notional amount of credit default swap contracts outstanding* | | $ | 1,380,000 | | $ | 1,540,000 | | $ | 552,000 | |
| * | The average notional amount is calculated based on the outstanding notional at the beginning of the fiscal period and at the end of each fiscal quarter within the current fiscal period. |
The following table presents the amount of net realized gain (loss) and change in net unrealized appreciation (depreciation) recognized on swap contracts on the Statement of Operations during the current fiscal period, and the primary underlying risk exposure.
| | | | | | | | | | | | | Change in Net | |
| | | | | | | | | | | | | Unrealized | |
| | | | | | | | | | Net Realized | | | Appreciation | |
| | | | Underlying | | | Derivative | | | Gain (Loss) from | | | (Depreciation) of | |
| Fund | | | Risk Exposure | | | Instrument | | | Swaps | | | Swaps | |
| Michigan Quality Income (NUM) | | | Credit | | | Swaps | | $ | 45,681 | | $ | (187,352 | ) |
| Ohio Quality Income (NUO) | | | Credit | | | Swaps | | | 20,171 | | | (197,460 | ) |
| Texas Quality Income (NTX) | | | Credit | | | Swaps | | | 53,624 | | | (94,558 | ) |
Market and Counterparty Credit Risk
In the normal course of business each Fund may invest in financial instruments and enter into financial transactions where risk of potential loss exists due to changes in the market (market risk) or failure of the other party to the transaction to perform (counterparty credit risk). The potential loss could exceed the value of the financial assets recorded on the financial statements. Financial assets, which potentially expose each Fund to counterparty credit risk, consist principally of cash due from counterparties on forward, option and swap transactions, when applicable. The extent of each Fund's exposure to counterparty credit risk in respect to these financial assets approximates their carrying value as recorded on the Statement of Assets and Liabilities.
Each Fund helps manage counterparty credit risk by entering into agreements only with counterparties the Adviser believes have the financial resources to honor their obligations and by having the Adviser monitor the financial stability of the counterparties. Additionally, counterparties may be required to pledge collateral daily (based on the daily valuation of the financial asset) on behalf of each Fund with a value approximately equal to the amount of any unrealized gain above a pre-determined threshold. Reciprocally, when each Fund has an unrealized loss, the Funds have instructed the custodian to pledge assets of the Funds as collateral with a value approximately equal to the amount of the unrealized loss above a pre-determined threshold. Collateral pledges are monitored and subsequently adjusted if and when the valuations fluctuate, either up or down, by at least the pre-determined threshold amount.
4. Fund Shares
Common Share Transactions
Transactions in common shares for the Funds' during the Funds' current and prior fiscal period, where applicable, were as follows:
| | | | Arizona Premium | | Michigan Quality | |
| | | | Income (NAZ) | | Income (NUM) | |
| | | | Year | | | Year | | | Year | | | Year | |
| | | | Ended | | | Ended | | | Ended | | | Ended | |
| | | | 2/29/16 | | | 2/28/15 | | | 2/29/16 | | | 2/28/15 | |
| Common shares: | | | | | | | | | | | | | |
| Issued to shareholders due to reinvestment of distributions | | | 9,077 | | | — | | | — | | | — | |
| Repurchased and retired | | | — | | | — | | | (22,500 | ) | | — | |
| Total | | | 9,077 | | | — | | | (22,500 | ) | | — | |
| Weighted average common share: | | | | | | | | | | | | | |
| Price per share repurchased and retired | | $ | — | | $ | — | | $ | 13.22 | | $ | — | |
| Discount per share repurchased and retired | | | — | | | — | | | 14.99 | % | | — | |
Preferred Shares
Institutional MuniFund Term Preferred Shares
The following Fund has issued and has outstanding Institutional MuniFund Term Preferred ("iMTP") Shares, with a $5,000 liquidation preference per share. iMTP Shares are issued via private placement and are not publicly available.
As of the end of the reporting period, details of iMTP Shares outstanding were as follows:
| | | | | | | Shares | | | Liquidation | |
| Fund | | | Series | | Outstanding | | | Preference | |
| Texas Quality Income (NTX) | | | 2018 | | | 14,400 | | $ | 72,000,000 | |
The Fund is obligated to redeem its iMTP Shares by the date as specified in its offering document ("Term Redemption Date"), unless earlier redeemed by the Fund. iMTP Shares are subject to optional and mandatory redemption in certain circumstances. The iMTP Shares are not subject to redemption at the option of the Fund for approximately one year following the date of issuance, at which point the Fund may redeem at its option ("Optional Redemption Date") and any date thereafter. The Fund may be obligated to redeem a certain amount of iMTP Shares if the Fund fails to maintain certain asset coverage and leverage ratio requirements and such failures are not cured by the applicable cure date. The redemption price per share is equal to the sum of the liquidation preference per share plus any accumulated but unpaid dividends. The Term Redemption Date and Optional Redemption Date for the Fund's iMTP Shares are as follows:
| | | | | | | Term | | | Optional | |
| Fund | | | Series | | | Redemption Date | | | Redemption Date | |
| Texas Quality Income (NTX) | | | 2018 | | | November 1, 2018 | | | May 1, 2016 | |
The average liquidation preference of iMTP Shares outstanding and annualized dividend rate for the Fund during the current fiscal period, were as follows:
| | | | Texas | |
| | | | Quality | |
| | | | Income | |
| | | | (NTX | )* |
| Average liquidation preference of iMTP Shares outstanding | | $ | 72,000,000 | |
| Annualized dividend rate | | | 0.94 | % |
| * | For the period April 10, 2015 (first issuance of shares) through February 29, 2016. |
Notes to Financial Statements (continued) |
iMTP Shares are subject to restrictions on transfer and may only be sold or transferred to "qualified institutional buyers." iMTP Shares are short-term or short/intermediate-term instruments that pay a variable dividend rate tied to a short-term index, plus an additional fixed "spread" amount established at the time of issuance. The fair value of iMTP Shares is expected to be approximately their liquidation preference so long as the fixed "spread" on the iMTP Shares remains roughly in line with the "spread" being demanded by investors on instruments having similar terms in the current market environment. In present market conditions, the Fund's Adviser has determined that the fair value of iMTP Shares is approximately their liquidation preference, but their fair value could vary if market conditions change materially. For financial reporting purposes, the liquidation preference of iMTP Shares is recorded as a liability and recognized as "Institutional MuniFund Term Preferred ("iMTP") Shares, at liquidation preference" on the Statement of Assets and Liabilities.
Dividends on the iMTP Shares (which are treated as interest payments for financial reporting purposes) are set weekly. Unpaid dividends on iMTP Shares are recognized as a component of "Interest payable" on the Statement of Assets and Liabilities, when applicable. Dividends accrued on iMTP Shares are recognized as a component of "Interest expense and amortization of offering costs" on the Statement of Operations.
Offering costs of $530,000 were incurred in connection with the Fund's offering of iMTP Shares, which were recorded as a deferred charge and are being amortized over the life of the shares. These offering costs are recognized as components of "Deferred offering costs" on the Statement of Assets and Liabilities and "Interest expense and amortization of offering costs" on the Statement of Operations.
MuniFund Term Preferred Shares
During the current fiscal period, Texas Quality Income (NTX) had issued and had outstanding MuniFund Term Preferred ("MTP") Shares, with a $10 liquidation preference. The Fund's MTP Shares were issued in one or more Series and traded on the NYSE.
On April 20, 2015, Texas Quality Income (NTX) redeemed all of its outstanding Series 2015 MTP Shares. The Fund's MTP Shares were redeemed at their $10.00 liquidation preference, plus dividend amounts owed, using proceeds from its issuance of iMTP Shares (as described above in Institutional MuniFund Term Preferred Shares).
The average liquidation preference of MTP Shares outstanding for the Fund during the current fiscal period, were as follows:
| | | | Texas | |
| | | | Quality | |
| | | | Income | |
| | | | (NTX | )* |
| Average liquidation preference of MTP Shares outstanding | | $ | 70,920,000 | |
| * | For the period March 1, 2015 through April 20, 2015. |
For financial reporting purposes, the liquidation value of MTP Shares is recorded as a liability and recognized as "MuniFund Term Preferred ("MTP") Shares, at liquidation preference" on the Statement of Assets and Liabilities. Dividends on MTP Shares, which are recognized as interest expense for financial reporting purposes, are paid monthly at a fixed annual rate, subject to adjustments in certain circumstances. Unpaid dividends on MTP Shares are recognized as a component of "Interest payable" on the Statement of Assets and Liabilities. Dividends accrued on MTP Shares are recognized as a component of "Interest expense and amortization of offering costs" on the Statement of Operations. Costs incurred by the Fund in connection with its offering of MTP Shares were recorded as a deferred charge, which were amortized over the life of the shares and are recognized as components of "Deferred offering costs" on the Statement of Assets and Liabilities and "Interest expense and amortization of offering costs" on the Statement of Operations.
In conjunction with Texas Quality Income's (NTX) redemption of MTP Shares, the remaining deferred offering costs of $191,443, were fully expensed during the current fiscal period, as the redemptions were deemed on extinguishment of debt.
Variable Rate MuniFund Term Preferred Shares
The following Funds have issued and have outstanding Variable Rate MuniFund Term Preferred ("VMTP") Shares, with a $100,000 liquidation preference per share. VMTP Shares are issued via private placement and are not publicly available.
As of the end of the reporting period, VMTP Shares outstanding, at liquidation preference, for each Fund were as follows:
| | | | | | | Shares | | | Liquidation | |
| Fund | | | Series | | | Outstanding | | | Preference | |
| Arizona Premium Income (NAZ) | | | 2016 | | | 790 | | $ | 79,000,000 | |
| Michigan Quality Income (NUM) | | | 2016 | | | 1,590 | | $ | 159,000,000 | |
Each Fund is obligated to redeem its VMTP Shares by the date as specified in its offering document ("Term Redemption Date"), unless earlier redeemed by the Fund. VMTP Shares are subject to optional and mandatory redemption in certain circumstances. The VMTP Shares may be redeemed at the option of each Fund, subject to payment of premium for approximately one year following the date of issuance ("Premium Expiration Date"), and at the redemption price per share thereafter. The redemption price per share is equal to the sum of the liquidation preference per share plus any accumulated but unpaid dividends. Each Fund may be obligated to redeem a certain amount of the VMTP Shares if the Fund fails to maintain certain asset coverage and leverage ratio requirements and such failures are not cured by the applicable cure date. The Term Redemption Date and Premium Expiration Date for each Fund's series of VMTP Shares are as follows:
| | | | | | | Term | | | Premium | |
| Fund | | | Series | | | Redemption Date | | | Expiration Date | |
| Arizona Premium Income (NAZ) | | | 2016 | | | December 30, 2016 | | | December 31, 2014 | |
| Michigan Quality Income (NUM) | | | 2016 | | | December 30, 2016 | | | December 31, 2014 | |
The average liquidation preference of VMTP Shares outstanding and annualized dividend rate for each Fund during the current fiscal period were as follows:
| | | | Arizona | | | Michigan | |
| | | | Premium | | | Quality | |
| | | | Income | | | Income | |
| | | | (NAZ | ) | | (NUM | ) |
| Average liquidation preference of VMTP Shares outstanding | | $ | 79,000,000 | | $ | 159,000,000 | |
| Annualized dividend rate | | | 0.98 | % | | 0.98 | % |
VMTP Shares are subject to restrictions on transfer, generally do not trade, and market quotations are generally not available. VMTP Shares are short-term or short/intermediate-term instruments that pay a variable dividend rate tied to a short-term index, plus an additional fixed "spread" amount established at the time of issuance. The fair value of VMTP Shares is expected to be approximately their liquidation preference so long as the fixed "spread" on the VMTP Shares remains roughly in line with the "spread" being demanded by investors on instruments having similar terms in the current market environment. In present market conditions, the Funds' Adviser has determined that the fair value of VMTP Shares is approximately their liquidation preference, but their fair value could vary if market conditions change materially. For financial reporting purposes, the liquidation preference of VMTP Shares is a liability and is recognized as "Variable Rate MuniFund Term Preferred ("VMTP") Shares, at liquidation preference" on the Statement of Assets and Liabilities.
Dividends on the VMTP Shares (which are treated as interest payments for financial reporting purposes) are set weekly. Unpaid dividends on VMTP Shares are recognized as a component of "Interest payable" on the Statement of Assets and Liabilities. Dividends accrued on VMTP Shares are recognized as a component of "Interest expense and amortization of offering costs" on the Statement of Operations.
Costs incurred in connection with each Fund's offering of VMTP Shares were recorded as a deferred charge, which are amortized over the life of the shares and are recognized as components of "Deferred offering costs" on the Statement of Assets and Liabilities and "Interest expense and amortization of offering costs" on the Statement of Operations.
Variable Rate Demand Preferred Shares
Ohio Quality Income (NUO) has issued and has outstanding Variable Rate Demand Preferred ("VRDP") Shares, with a $100,000 liquidation preference per share. VRDP Shares are issued via private placement and are not publicly available.
Notes to Financial Statements (continued) |
As of the end of the reporting period, details of the Fund's VRDP Shares outstanding were as follows:
| | | | | | | Shares | | | Liquidation | | | | |
| Fund | | | Series | | | Outstanding | | | Preference | | | Maturity | |
| Ohio Quality Income (NUO) | | | 1 | | | 1,480 | | $ | 148,000,000 | | | September 1, 2043 | |
VRDP Shares include a liquidity feature that allows VRDP shareholders to have their shares purchased by a liquidity provider with whom the Fund has contracted in the event that the VRDP Shares are not able to be successfully remarketed. The Fund is required to redeem any VRDP Shares that are still owned by the liquidity provider after six months of continuous, unsuccessful remarketing. The Fund pays an annual remarketing fee of 0.10% on the aggregate principal amount of all VRDP Shares outstanding. The Fund's VRDP Shares have successfully remarketed since issuance.
Dividends on the VRDP Shares (which are treated as interest payments for financial reporting purposes) are set weekly at a rate established by a remarketing agent; therefore, the market value of the VRDP Shares is expected to approximate its liquidation preference. In the event that VRDP Shares are unable to be successfully remarketed, the dividend rate will be the maximum rate which is designed to escalate according to a specified schedule in order to enhance the remarketing agent's ability to successfully remarket the VRDP Shares.
Subject to certain conditions, VRDP Shares may be redeemed, in whole or in part, at any time at the option of the Fund. The Fund may also redeem certain of the VRDP Shares if the Fund fails to maintain certain asset coverage requirements and such failures are not cured by the applicable cure date. The redemption price per share is equal to the sum of the liquidation preference per share plus any accumulated but unpaid dividends.
The average liquidation preference of VRDP Shares outstanding and annualized dividend rate for the Fund during the current fiscal period were as follows:
| | | | Ohio | |
| | | | Quality | |
| | | | Income | |
| | | | (NUO | ) |
| Average liquidation preference of VRDP Shares outstanding | | $ | 148,000,000 | |
| Annualized dividend rate | | | 0.12 | % |
For financial reporting purposes, the liquidation preference of VRDP Shares is a liability and is recognized as "Variable Rate Demand Preferred ("VRDP") Shares, at liquidation preference" on the Statement of Assets and Liabilities. Unpaid dividends on VRDP Shares are recognized as a component of "Interest payable" on the Statement of Assets and Liabilities, when applicable. Dividends accrued on VRDP Shares are recognized as a component of "Interest expense and amortization of offering costs" on the Statement of Operations. Costs incurred by the Fund in connection with its offerings of VRDP Shares were recorded as a deferred charge, which are amortized over the life of the shares and are recognized as a component of "Deferred offering costs" on the Statement of Assets and Liabilities and "Interest expense and amortization of offerings costs" on the Statement of Operations. In addition to interest expense, the Fund also pays a per annum liquidity fee to the liquidity provider, as well as a remarketing fee, which are recognized as "Liquidity fees" and "Remarketing fees," respectively, on the Statement of Operations.
Preferred Share Transactions
Transactions in preferred shares for the Funds during the Funds' current and prior fiscal period, where applicable, are noted in the following tables.
Transactions in iMTP Shares for the Funds, where applicable, were as follows:
| | | | Year Ended
February 29, 2016 | |
| Texas Quality Income (NTX) | | | Series | | | Shares | | | Amount | |
| iMTP Shares issued | | | 2018 | | | 14,400 | | $ | 72,000,000 | |
Transactions in MTP Shares for the Funds, where applicable, were as follows:
| | | | Year Ended
February 29, 2016 | |
| | | | | | | NYSE | | | | | | | |
| Texas Quality Income (NTX) | | | Series | | | Ticker | | | Shares | | | Amount | |
| MTP Shares redeemed | | | 2015 | | | NTX PRCCL | | | (7,092,000 | ) | $ | (70,920,000 | ) |
5. Investment Transactions
Long-term purchases and sales (including maturities but excluding derivative transactions, where applicable) during the current fiscal period were as follows:
| | | | Arizona | | | Michigan | | | Ohio | | | Texas | |
| | | | Premium | | | Quality | | | Quality | | | Quality | |
| | | | Income | | | Income | | | Income | | | Income | |
| | | | (NAZ | ) | | (NUM | ) | | (NUO | ) | | (NTX | ) |
| Purchases | | $ | 24,355,152 | | $ | 78,225,924 | | $ | 46,201,180 | | $ | 30,197,552 | |
| Sales and maturities | | | 23,082,266 | | | 57,221,958 | | | 45,272,567 | | | 31,358,000 | |
6. Income Tax Information
Each Fund is a separate taxpayer for federal income tax purposes. Each Fund intends to distribute substantially all of its net investment income and net capital gains to shareholders and to otherwise comply with the requirements of Subchapter M of the Internal Revenue Code applicable to regulated investment companies. Therefore, no federal income tax provision is required. Furthermore, each Fund intends to satisfy conditions that will enable interest from municipal securities, which is exempt from regular federal and designated state income taxes, to retain such tax-exempt status when distributed to shareholders of the Funds. Net realized capital gains and ordinary income distributions paid by the Funds are subject to federal taxation.
For all open tax years and all major taxing jurisdictions, management of the Funds has concluded that there are no significant uncertain tax positions that would require recognition in the financial statements. Open tax years are those that are open for examination by taxing authorities (i.e., generally the last four tax year ends and the interim tax period since then). Furthermore, management of the Funds is also not aware of any tax positions for which it is reasonably possible that the total amounts of unrecognized tax benefits will significantly change in the next twelve months.
The following information is presented on an income tax basis. Differences between amounts for financial statement and federal income tax purposes are primarily due to timing differences in recognizing taxable market discount, timing differences in recognizing certain gains and losses on investment transactions and the treatment of investments in inverse floating rate securities reflected as financing transactions, if any. To the extent that differences arise that are permanent in nature, such amounts are reclassified within the capital accounts as detailed below. Temporary differences do not require reclassification. Temporary and permanent differences do not impact the NAVs of the Funds.
As of February 29, 2016, the cost and unrealized appreciation (depreciation) of investments (excluding investments in derivatives), as determined on a federal income tax basis, were as follows:
| | | | Arizona | | | Michigan | | | Ohio | | | Texas | |
| | | | Premium | | | Quality | | | Quality | | | Quality | |
| | | | Income | | | Income | | | Income | | | Income | |
| | | | (NAZ | ) | | (NUM | ) | | (NUO | ) | | (NTX | ) |
| Cost of investments | | $ | 230,684,853 | | $ | 449,334,302 | | $ | 419,212,108 | | $ | 209,034,377 | |
| Gross unrealized: | | | | | | | | | | | | | |
| Appreciation | | $ | 22,440,381 | | $ | 36,659,919 | | $ | 41,428,731 | | $ | 20,990,151 | |
| Depreciation | | | (2,583,203 | ) | | (532,844 | ) | | (2,305,924 | ) | | (3,425,169 | ) |
| Net unrealized appreciation (depreciation) of investments | | $ | 19,857,178 | | $ | 36,127,075 | | $ | 39,122,807 | | $ | 17,564,982 | |
Permanent differences, primarily due to expiration of capital loss carryforwards, treatment of notional principal contracts, nondeductible reorganization expenses, federal taxes paid, taxable market discount and nondeductible offering costs, resulted in reclassifications among the Funds' components of common share net assets as of February 29, 2016, the Funds' tax year end, as follows:
| | | | Arizona | | | Michigan | | | Ohio | | | Texas | |
| | | | Premium | | | Quality | | | Quality | | | Quality | |
| | | | Income | | | Income | | | Income | | | Income | |
| | | | (NAZ | ) | | (NUM | ) | | (NUO | ) | | (NTX | ) |
| Paid-in surplus | | $ | (632,286 | ) | $ | (129,623 | ) | $ | (65,213 | ) | $ | (365,479 | ) |
| Undistributed (Over-distribution of) net investment income | | | 15,235 | | | (30,247 | ) | | (87,556 | ) | | 307,220 | |
| Accumulated net realized gain (loss) | | | 617,051 | | | 159,870 | | | 152,769 | | | 58,259 | |
Notes to Financial Statements (continued)
The tax components of undistributed net tax-exempt income, net ordinary income and net long-term capital gains as of February 29, 2016, the Funds' tax year end, were as follows:
| | | | Arizona | | | Michigan | | | Ohio | | | Texas | |
| | | | Premium | | | Quality | | | Quality | | | Quality | |
| | | | Income | | | Income | | | Income | | | Income | |
| | | | (NAZ | ) | | (NUM | ) | | (NUO | ) | | (NTX | ) |
Undistributed net tax-exempt income 1 | | $ | 1,144,852 | | $ | 1,180,362 | | $ | 308,123 | | $ | 650,529 | |
Undistributed net ordinary income 2 | | | 50,129 | | | 12,786 | | | 4,771 | | | — | |
| Undistributed net long-term capital gains | | | — | | | 135,404 | | | — | | | — | |
| 1 | Undistributed net tax-exempt income (on a tax basis) has not been reduced for the dividend declared on February 1, 2016, paid on March 1, 2016. |
| 2 | Net ordinary income consists of taxable market discount income and net short-term capital gains, if any. |
The tax character of distributions paid during the Funds' tax years ended February 29, 2016 and February 28, 2015, was designated for purposes of the dividends paid deduction as follows:
| | | | Arizona | | | Michigan | | | Ohio | | | Texas | |
| | | | Premium | | | Quality | | | Quality | | | Quality | |
| | | | Income | | | Income | | | Income | | | Income | |
| 2016 | | | (NAZ | ) | | (NUM | ) | | (NUO | ) | | (NTX | ) |
Distributions from net tax-exempt income3 | | $ | 10,066,290 | | $ | 17,887,009 | | $ | 15,534,992 | | $ | 7,515,079 | |
Distributions from net ordinary income2 | | | — | | | 72,899 | | | 74,088 | | | 324 | |
Distributions from net long-term capital gains4 | | | — | | | 97,893 | | | — | | | — | |
| | | | Arizona | | | Michigan | | | Ohio | | | Texas | |
| | | | Premium | | | Quality | | | Quality | | | Quality | |
| | | | Income | | | Income | | | Income | | | Income | |
| 2015 | | | (NAZ | ) | | (NUM | ) | | (NUO | ) | | (NTX | ) |
| Distributions from net tax-exempt income | | $ | 9,960,313 | | $ | 19,600,465 | | $ | 17,430,996 | | $ | 8,434,464 | |
Distributions from net ordinary income2 | | | 3,316 | | | 4,167 | | | 50,009 | | | 10,213 | |
| Distributions from net long-term capital gains | | | — | | | — | | | — | | | — | |
| 2 | Net ordinary income consists of taxable market discount income and net short-term capital gains, if any. |
| 3 | The Funds hereby designate these amounts paid during the fiscal year ended February 29, 2016, as Exempt Interest Dividends. |
| 4 | The Funds designate as long-term capital gain dividend, pursuant to the Internal Revenue Code Section 852(b)(3), the amount necessary to reduce earnings and profits of the Funds related to net capital gain to zero for the tax year ended February 29, 2016. |
As of February 29, 2016, the Funds' tax year end, the Funds had unused capital loss carryforwards available for federal income tax purposes to be applied against future capital gains, if any. If not applied, the carryforwards will expire as shown in the following table. The losses not subject to expiration will be utilized first by a Fund.
| | | | Arizona | | | Michigan | | | Ohio | | | Texas | |
| | | | Premium | | | Quality | | | Quality | | | Quality | |
| | | | Income | | | Income | | | Income | | | Income | |
| | | | (NAZ | ) | | (NUM | )5 | | (NUO | )5 | | (NTX | ) |
| Expiration: | | | | | | | | | | | | | |
| February 28, 2017 | | $ | 828,959 | | $ | 84,900 | | $ | — | | $ | — | |
| February 28, 2018 | | | 43,720 | | | — | | | 381,898 | | | — | |
| February 28, 2019 | | | — | | | — | | | 1,468,286 | | | — | |
| Not subject to expiration | | | 2,923,709 | | | — | | | — | | | 717,282 | |
| Total | | $ | 3,796,388 | | $ | 84,900 | | $ | 1,850,184 | | $ | 717,282 | |
| 5 | A portion of Michigan Quality Income's (NUM) and Ohio Quality Income's (NUO) capital loss carryforward is subject to an annual limitation under the Internal Revenue Code and related regulations. |
During the Funds' tax year ended February 29, 2016, the Funds utilized capital loss carryforwards as follows:
| | | | Arizona | | | Michigan | | | Ohio | | | Texas | |
| | | | Premium | | | Quality | | | Quality | | | Quality | |
| | | | Income | | | Income | | | Income | | | Income | |
| | | | (NAZ | ) | | (NUM | ) | | (NUO | ) | | (NTX | ) |
| Utilized capital loss carryforwards | | $ | 404,885 | | $ | 1,022,576 | | $ | 649,138 | | $ | 432,321 | |
As of February 29, 2016, the Funds' tax year end, $615,885 of Arizona Premium Income's (NAZ) capital loss carryforward expired.
7. Management Fees and Other Transactions with Affiliates
Management Fees
Each Fund's management fee compensates the Adviser for overall investment advisory and administrative services and general office facilities. The Sub-Adviser is compensated for its services to the Funds from the management fees paid to the Adviser.
Each Fund's management fee consists of two components – a fund-level fee, based only on the amount of assets within each individual Fund, and a complex-level fee, based on the aggregate amount of all eligible fund assets managed by the Adviser. This pricing structure enables Fund shareholders to benefit from growth in the assets within their respective Fund as well as from growth in the amount of complex-wide assets managed by the Adviser.
The annual Fund-level fee, payable monthly, for each Fund is calculated according to the following schedule:
| Average Daily Managed Assets* | | | Fund-Level Fee |
| For the first $125 million | | | 0.4500 | % |
| For the next $125 million | | | 0.4375 | |
| For the next $250 million | | | 0.4250 | |
| For the next $500 million | | | 0.4125 | |
| For the next $1 billion | | | 0.4000 | |
| For the next $3 billion | | | 0.3875 | |
| For managed assets over $5 billion | | | 0.3750 | |
The annual complex-level fee, payable monthly, for each Fund is calculated according to the following schedule:
| Complex-Level Managed Asset Breakpoint Level* | | | Effective Rate at Breakpoint Level |
| $55 billion | | | 0.2000 | % |
| $56 billion | | | 0.1996 | |
| $57 billion | | | 0.1989 | |
| $60 billion | | | 0.1961 | |
| $63 billion | | | 0.1931 | |
| $66 billion | | | 0.1900 | |
| $71 billion | | | 0.1851 | |
| $76 billion | | | 0.1806 | |
| $80 billion | | | 0.1773 | |
| $91 billion | | | 0.1691 | |
| $125 billion | | | 0.1599 | |
| $200 billion | | | 0.1505 | |
| $250 billion | | | 0.1469 | |
| $300 billion | | | 0.1445 | |
| * | For the fund-level and complex-level fees, managed assets include closed-end fund assets managed by the Adviser that are attributable to certain types of leverage. For these purposes, leverage includes the funds' use of preferred stock and borrowings and certain investments in the residual interest certificates (also called inverse floating rate securities) in tender option bond (TOB) trusts, including the portion of assets held by a TOB trust that has been effectively financed by the trust's issuance of floating rate securities, subject to an agreement by the Adviser as to certain funds to limit the amount of such assets for determining managed assets in certain circumstances. The complex-level fee is calculated based upon the aggregate daily managed assets of all Nuveen funds that constitute "eligible assets." Eligible assets do not include assets attributable to investments in other Nuveen funds or assets in excess of $2 billion added to the Nuveen fund complex in connection with the Adviser's assumption of the management of the former First American Funds effective January 1, 2011. As of February 29, 2016, the complex-level fee rate for the Funds was 0.1640%. |
The Funds pay no compensation directly to those of its trustees who are affiliated with the Adviser or to its officers, all of whom receive remuneration for their services to the Funds from the Adviser or its affiliates. The Board has adopted a deferred compensation plan for independent trustees that enables trustees to elect to defer receipt of all or a portion of the annual compensation they are entitled to receive from certain Nuveen-advised funds. Under the plan, deferred amounts are treated as though equal dollar amounts had been invested in shares of select Nuveen-advised funds.
Other Transactions with Affiliates
Each Fund is permitted to purchase or sell securities from or to certain other funds managed by the Adviser ("inter-fund trade") under specified conditions outlined in procedures adopted by the Board. These procedures have been designed to ensure that any inter-fund trade of securities by the Fund from or to another fund that is, or could be, considered an affiliate of the Fund under certain limited circumstances by virtue of having a common investment adviser (or affiliated investment adviser), common officer and/or common trustee complies with Rule 17a-7 of the 1940 Act. Further, as defined under these procedures, each inter-fund trade is effected at the current market price as provided by an independent pricing service.
Notes to Financial Statements (continued) |
During the current fiscal period, the following Fund engaged in inter-fund trades pursuant to these procedures as follows:
| | | | Arizona | |
| | | | Premium | |
| | | | Income | |
| | | | (NAZ | ) |
| Purchases | | $ | 781,243 | |
| Sales | | | 781,243 | |
Unsettled inter-fund trades as of the end of the reporting period are recognized as a component of "Receivable for investments sold" and/or "Payable for investments purchased" on the Statement of Assets and Liabilities, when applicable.
8. Borrowing Arrangements
During the current fiscal period, the Funds, along with certain other funds managed by the Adviser ("Participating Funds"), established a 364-day, $2.53 billion standby credit facility with a group of lenders, under which the Participating Funds may borrow for various purposes other than leveraging for investment purposes. A large portion of this facility's capacity (and its associated costs as described below) is currently dedicated for use by a small number of Participating Funds, which does not include any of the Funds covered by this shareholder report. The remaining capacity under the facility (and the corresponding portion of the facility's annual costs) is separately dedicated to most of the other open-end funds in the Nuveen fund family, along with a number of Nuveen closed-end funds, including all of the Funds covered by this shareholder report. The credit facility expires in July 2016 unless extended or renewed.
The credit facility has the following terms: a fee of 0.15% per annum on unused commitment amounts, and interest at a rate equal to the higher of (a) one-month LIBOR (London Inter-Bank Offered Rate) plus 1.25% per annum or (b) the Fed Funds rate plus 1.25% per annum on amounts borrowed. Participating Funds paid administration, legal and arrangement fees, which are recognized as a component of "Other expenses" on the Statement of Operations, and along with commitment fees, have been allocated among such participating Funds based upon the relative proportions of the facility's aggregate capacity reserved for them and other factors deemed relevant by the Adviser and the Board of each Participating Fund.
During the current fiscal period, none of the Funds utilized this facility.
Additional Fund Information (Unaudited) |
| Board of Trustees | | | | | | | | | |
| William Adams IV* | | Jack B. Evans | | William C. Hunter | | David J. Kundert | John K. Nelson | | William J. Schneider |
| Thomas S. Schreier, Jr.** | | Judith M. Stockdale | | Carole E. Stone | | Terence J. Toth | Margaret L. Wolff | | |
| * | Interested Board Member. |
| ** | Interested Board Member and will retire from the Funds' Board of Trustees effective May 31, 2016. |
| | |
| Fund Manager | | Custodian | | Legal Counsel | | Independent Registered | | Transfer Agent and |
| Nuveen Fund Advisors, LLC | | State Street Bank | | Chapman and Cutler LLP | | Public Accounting Firm | | Shareholder Services |
| 333 West Wacker Drive | | & Trust Company | | Chicago, IL 60603 | | KPMG LLP | | State Street Bank |
| Chicago, IL 60606 | | Boston, MA 02111 | | | | Chicago, IL 60601 | | & Trust Company |
| | | | | | | | | Nuveen Funds |
| | | | | | | | | P.O. Box 43071 |
| | | | | | | | | Providence, RI 02940-3071 |
| | | | | | | | | (800) 257-8787 |
| | | | | | | | | |
Quarterly Form N-Q Portfolio of Investments Information
Each Fund is required to file its complete schedule of portfolio holdings with the Securities and Exchange Commission (SEC) for the first and third quarters of each fiscal year on Form N-Q. You may obtain this information directly from the SEC. Visit the SEC on-line at http://www.sec.gov or in person at the SEC's Public Reference Room in Washington, D.C. Call the SEC toll-free at (800) SEC-0330 for room hours and operation.
Nuveen Funds' Proxy Voting Information
You may obtain (i) information regarding how each fund voted proxies relating to portfolio securities held during the most recent twelve-month period ended June 30, without charge, upon request, by calling Nuveen Investments toll-free at (800) 257-8787 or on Nuveen's website at www.nuveen.com and (ii) a description of the policies and procedures that each fund used to determine how to vote proxies relating to portfolio securities without charge, upon request, by calling Nuveen Investments toll free at (800) 257-8787. You may also obtain this information directly from the SEC. Visit the SEC on-line at http://www.sec.gov.
CEO Certification Disclosure
Each Fund's Chief Executive Officer (CEO) has submitted to the New York Stock Exchange (NYSE) the annual CEO certification as required by Section 303A.12(a) of the NYSE Listed Company Manual. Each Fund has filed with the SEC the certification of its CEO and Chief Financial Officer required by Section 302 of the Sarbanes-Oxley Act.
Common Share Repurchases
Each Fund intends to repurchase, through its open-market share repurchase program, shares of its own common stock at such times and in such amounts as is deemed advisable. During the period covered by this report, each Fund repurchased shares of its common stock, as shown in the accompanying table. Any future repurchases will be reported to shareholders in the next annual or semi-annual report.
| | | | NAZ | | | NUM | | | NUO | | | NTX | |
| Common shares repurchased | | | — | | | 22,500 | | | — | | | — | |
FINRA BrokerCheck
The Financial Industry Regulatory Authority (FINRA) provides information regarding the disciplinary history of FINRA member firms and associated investment professionals. This information as well as an investor brochure describing FINRA BrokerCheck is available to the public by calling the FINRA BrokerCheck Hotline number at (800) 289-9999 or by visiting www.FINRA.org.
Glossary of Terms Used in this Report (Unaudited) |
| ■ | Auction Rate Bond: An auction rate bond is a security whose interest payments are adjusted periodically through an auction process, which process typically also serves as a means for buying and selling the bond. Auctions that fail to attract enough buyers for all the shares offered for sale are deemed to have "failed," with current holders receiving a formula-based interest rate until the next scheduled auction. |
| | |
| ■ | Average Annual Total Return: This is a commonly used method to express an investment's performance over a particular, usually multi-year time period. It expresses the return that would have been necessary each year to equal the investment's actual cumulative performance (including change in NAV or market price and reinvested dividends and capital gains distributions, if any) over the time period being considered. |
| | |
| ■ | Duration: Duration is a measure of the expected period over which a bond's principal and interest will be paid, and conse- quently is a measure of the sensitivity of a bond's or bond fund's value to changes when market interest rates change. Generally, the longer a bond's or fund's duration, the more the price of the bond or fund will change as interest rates change. |
| | |
| ■ | Effective Leverage: Effective leverage is a fund's effective economic leverage, and includes both regulatory leverage (see leverage) and the leverage effects of certain derivative investments in the fund's portfolio. Currently, the leverage effects of Tender Option Bond (TOB) inverse floater holdings are included in effective leverage values, in addition to any regulatory leverage. |
| | |
| ■ | Gross Domestic Product (GDP): The total market value of all final goods and services produced in a country/region in a given year, equal to total consumer, investment and government spending, plus the value of exports, minus the value of imports. |
| | |
| ■ | Inverse Floating Rate Securities: Inverse floating rate securities, also known as inverse floaters or tender option bonds (TOBs), are created by depositing a municipal bond, typically with a fixed interest rate, into a special purpose trust. This trust, in turn, (a) issues floating rate certificates typically paying short-term tax-exempt interest rates to third parties in amounts equal to some fraction of the deposited bond's par amount or market value, and (b) issues an inverse floating rate certificate (sometimes referred to as an "inverse floater") to an investor (such as a fund) interested in gaining investment exposure to a long-term municipal bond. The income received by the holder of the inverse floater varies inversely with the short-term rate paid to the floating rate certificates' holders, and in most circumstances the holder of the inverse floater bears substantially all of the underlying bond's downside investment risk. The holder of the inverse floater typically also benefits disproportionately from any potential appreciation of the underlying bond's value. Hence, an inverse floater essentially represents an investment in the underlying bond on a leveraged basis. |
| | |
| ■ | Leverage: Leverage is created whenever a fund has investment exposure (both reward and/or risk) equivalent to more than 100% of the investment capital. |
| | |
| ■ | Lipper Other States Municipal Debt Funds Classification Average: Calculated using the returns of all closed-end funds in this category. Shareholders should note that the performance of the Lipper Other States classification represents the overall average of returns for funds from ten states with a wide variety of municipal market conditions, making direct comparisons less meaningful. Lipper returns account for the effects of management fees and assume reinvestment of distributions, but do not reflect any applicable sales charges. |
| | |
| ■ | Net Asset Value (NAV) Per Share: A fund's Net Assets is equal to its total assets (securities, cash, accrued earnings and receivables) less its total liabilities. NAV per share is equal to the fund's Net Assets divided by its number of shares outstanding. |
| ■ | Pre-Refunding: Pre-Refunding, also known as advanced refundings or refinancings, is a procedure used by state and local governments to refinance municipal bonds to lower interest expenses. The issuer sells new bonds with a lower yield and uses the proceeds to buy U.S. Treasury securities, the interest from which is used to make payments on the higher-yielding bonds. Because of this collateral, pre-refunding generally raises a bond's credit rating and thus its value. |
| | |
| ■ | Regulatory Leverage: Regulatory leverage consists of preferred shares issued by or borrowings of a fund. Both of these are part of a fund's capital structure. Regulatory leverage is subject to asset coverage limits set in the Investment Company Act of 1940. |
| | |
| ■ | S&P Municipal Bond Indexes Arizona, Michigan, Ohio and Texas: Unleveraged, market value-weighted indexes designed to measure the performance of the tax-exempt, investment-grade municipal bond markets in Arizona, Michigan, Ohio and Texas, respectively. Index returns assume reinvestment of distributions, but do not reflect any applicable sales charges or management fees. |
| | |
| ■ | S&P Municipal Bond Index: An unleveraged, market value-weighted index designed to measure the performance of the tax- exempt, investment-grade U.S. municipal bond market. Index returns assume reinvestment of distributions, but do not reflect any applicable sales charges or management fees. |
| | |
| ■ | Total Investment Exposure: Total investment exposure is a fund's assets managed by the Adviser that are attributable to financial leverage. For these purposes, financial leverage includes a fund's use of preferred stock and borrowings and investments in the residual interest certificates (also called inverse floating rate securities) in tender option bond (TOB) trusts, including the portion of assets held by a TOB trust that has been effectively financed by the trust's issuance of floating rate securities. |
| | |
| ■ | Zero Coupon Bond: A zero coupon bond does not pay a regular interest coupon to its holders during the life of the bond. Income to the holder of the bond comes from accretion of the difference between the original purchase price of the bond at issuance and the par value of the bond at maturity and is effectively paid at maturity. The market prices of zero coupon bonds generally are more volatile than the market prices of bonds that pay interest periodically. |
| Reinvest Automatically, Easily and Conveniently |
Nuveen makes reinvesting easy. A phone call is all it takes to set up your reinvestment account.
Nuveen Closed-End Funds Automatic Reinvestment PlanNuveen Closed-End Fund allows you to conveniently reinvest distributions in additional Fund shares. By choosing to reinvest, you'll be able to invest money regularly and automatically, and watch your investment grow through the power of compounding. Just like distributions in cash, there may be times when income or capital gains taxes may be payable on distributions that are reinvested. It is important to note that an automatic reinvestment plan does not ensure a profit, nor does it protect you against loss in a declining market.
Easy and convenient
To make recordkeeping easy and convenient, each month you'll receive a statement showing your total distributions, the date of investment, the shares acquired and the price per share, and the total number of shares you own.
How shares are purchased
The shares you acquire by reinvesting will either be purchased on the open market or newly issued by the Fund. If the shares are trading at or above net asset value at the time of valuation, the Fund will issue new shares at the greater of the net asset value or 95% of the then-current market price. If the shares are trading at less than net as -set value, shares for your account will be purchased on the open market. If the Plan Agent begins purchasing Fund shares on the open market while shares are trading below net asset value, but the Fund's shares subsequently trade at or above their net asset value before the Plan Agent is able to complete its purchases, the Plan Agent may cease open-market purchases and may invest the uninvested portion of the distribution in newly-issued Fund shares at a price equal to the greater of the shares' net asset value or 95% of the shares' market value on the last business day imme -diately prior to the purchase date. Distributions received to purchase shares in the open market will normally be invested shortly after the distribution payment date. No interest will be paid on distributions awaiting reinvestment. Because the market price of the shares may increase before purchases are completed, the average purchase price per share may exceed the market price at the time of valuation, resulting in the acquisition of fewer shares than if the distribution had been paid in shares issued by the Fund. A pro rata portion of any applicable brokerage commissions on open market purchases will be paid by Plan participants. These commissions usually will be lower than those charged on individual transactions.
Flexible
You may change your distribution option or withdraw from the Plan at any time, should your needs or situation change. You can reinvest whether your shares are registered in your name, or in the name of a brokerage firm, bank, or other nominee. Ask your investment advisor if his or her firm will participate on your behalf. Participants whose shares are registered in the name of one firm may not be able to transfer the shares to another firm and continue to participate in the Plan. The Fund reserves the right to amend or terminate the Plan at any time. Although the Fund reserves the right to amend the Plan to include a service charge payable by the participants, there is no direct service charge to participants in the Plan at this time.
Call today to start reinvesting distributions
For more information on the Nuveen Automatic Reinvestment Plan or to enroll in or withdraw from the Plan, speak with your financial advisor or call us at (800) 257-8787.
The management of the Funds, including general supervision of the duties performed for the Funds by the Adviser, is the responsibility of the Board of Trustees of the Funds. The number of trustees of the Funds is currently set at eleven. None of the trustees who are not "interested" persons of the Funds (referred to herein as "independent trustees") has ever been a director or employee of, or consultant to, Nuveen or its affiliates. The names and business addresses of the trustees and officers of the Funds, their principal occupations and other affiliations during the past five years, the number of portfolios each oversees and other directorships they hold are set forth below.
| | Name, | | Position(s) Held | | Year First | | Principal | | Number |
| | Year of Birth | | with the Funds | | Elected or | | Occupation(s) | | of Portfolios |
| | & Address | | | | Appointed | | Including other | | in Fund Complex |
| | | | | | and Term(1) | | Directorships | | Overseen by |
| | | | | | | | During Past 5 Years | | Board Member |
| Independent Board Members: | | | | | | | | |
| | | | | | | | | |
| ■ | WILLIAM J. SCHNEIDER
1944
333 W. Wacker Drive
Chicago, IL 6o6o6 | | Chairman and Board Member | | 1996
Class III | | Chairman of Miller-Valentine Partners, a real estate investment company; formerly, Senior Partner and Chief Operating Officer (retired (2004) of Miller-Valentine Group; an owner in several other Miller Valentine entities; Board Member of Med-America Health System, and WDPR Public Radio station; formerly, member, Business Advisory Council, Cleveland Federal Reserve Bank and University of Dayton Business School Advisory Council. | | 191 |
| | | | | | | | | | |
| ■ | JACK B. EVANS
1948
333 W. Wacker Drive
Chicago, IL 6o6o6 | | Board Member | | 1999
Class III | | President, The Hall-Perrine Foundation, a private philanthropic corporation (since 1996); Director and Chairman, United Fire Group, a publicly held company; Director, The Gazette Company; Life Trustee of Coe College; formerly, President Pro-Tem of the Board of Regents for the State of Iowa University System; formerly, Director, Alliant Energy; formerly, Director, Federal Reserve Bank of Chicago; formerly, President and Chief Operating Officer, SCI Financial Group, Inc., a regional financial services firm. | | 191 |
| | | | | | | | | | |
| ■ | WILLIAM C. HUNTER
1948
333 W. Wacker Drive
Chicago, IL 6o6o6 | | Board Member | | 2004
Class I | | Dean Emeritus, formerly, Dean, Tippie College of Business, University of Iowa (2006-2012); Director (since 2004) of Xerox Corporation; Director (since 2005), and past President (2010-2014) Beta Gamma Sigma, Inc., The International Business Honor Society; Director of Wellmark, Inc. (since 2009); formerly, Dean and Distinguished Professor of Finance, School of Business at the University of Connecticut (2003-2006); previously, Senior Vice President and Director of Research at the Federal Reserve Bank of Chicago (1995-2003); formerly, Director (1997-2007), Credit Research Center at Georgetown University. | | 191 |
| | | | | | | | | | |
| ■ | DAVID J. KUNDERT
1942
333 W. Wacker Drive
Chicago, IL 6o6o6 | | Board Member | | 2005
Class II | | Formerly, Director, Northwestern Mutual Wealth Management Company (2006-2013), retired (since 2004) as Chairman, JPMorgan Fleming Asset Management, President and CEO, Banc One Investment Advisors Corporation, and President, One Group Mutual Funds; prior thereto, Executive Vice President, Banc One Corporation and Chairman and CEO, Banc One Investment Management Group; Regent Emeritus, Member of Investment Committee, Luther College; member of the Wisconsin Bar Association; member of Board of Directors and Chair of Investment Committee, Greater Milwaukee Foundation; member of the Board of Directors (Milwaukee), College Possible; Board member of Milwaukee Repertory Theatre (since 2016). | | 191 |
| | Name, | | Position(s) Held | | Year First | | Principal | | Number |
| | Year of Birth | | with the Funds | | Elected or | | Occupation(s) | | of Portfolios |
| | & Address | | | | Appointed | | Including other | | in Fund Complex |
| | | | | | and Term(1) | | Directorships | | Overseen by |
| | | | | | | | During Past 5 Years | | Board Member |
| Independent Board Members (continued): | | | | | | |
| | | | | | | |
| ■ | JOHN K. NELSON
1962
333 W. Wacker Drive
Chicago, IL 6o6o6 | | Board Member | | 2013
Class II | | Member of Board of Directors of Core12 LLC (since 2008), a private firm which develops branding, marketing and communications strategies for clients; Director of The Curran Center for Catholic American Studies (since 2009) and The President's Council, Fordham University (since 2010); formerly, senior external advisor to the financial services practice of Deloitte Consulting LLP (2012- 2014): formerly, Chairman of the Board of Trustees of Marian University (2010 as trustee, 2011-2014 as Chairman); formerly, Chief Executive Officer of ABN AMRO N.V. North America, and Global Head of its Financial Markets Division (2007-2008); prior senior positions held at ABN AMRO include Corporate Executive Vice President and Head of Global Markets-the Americas (2006- 2007), CEO of Wholesale Banking North America and Global Head of Foreign Exchange and Futures Markets (2001-2006), and Regional Commercial Treasurer and Senior Vice President Trading – North America (1996-2001); formerly, Trustee at St. Edmund Preparatory School in New York City. | | 191 |
| | | | | | | | | | |
| ■ | JUDITH M. STOCKDALE
1947
333 W. Wacker Drive
Chicago, IL 6o6o6 | | Board Member | | 1997
Class I | | Board Member, Land Trust Alliance (since 2013) and U.S. Endowment for Forestry and Communities (since 2013); formerly, Executive Director (1994-2012), Gaylord and Dorothy Donnelley Foundation; prior thereto, Executive Director, Great Lakes Protection Fund (1990-1994). | | 191 |
| | | | | | | | | | |
| ■ | CAROLE E. STONE
1947
333 W. Wacker Drive
Chicago, IL 6o6o6 | | Board Member | | 2007
Class I | | Director, Chicago Board Options Exchange, Inc. (since 2006); Director, C2 Options Exchange, Incorporated (since 2009); Director, CBOE Holdings, Inc. (since 2010); formerly, Commissioner, New York State Commission on Public Authority Reform (2005-2010). | | 191 |
| | | | | | | | | | |
| ■ | TERENCE J. TOTH
1959
333 W. Wacker Drive
Chicago, IL 6o6o6 | | Board Member | | 2008
Class II | | Managing Partner, Promus Capital (since 2008); Director, Fulcrum IT Service LLC (since 2010), Quality Control Corporation (since 2012) and LogicMark LLC (since 2012); formerly, Director, Legal & General Investment Management America, Inc. (2008-2013); formerly, CEO and President, Northern Trust Global Investments (2004-2007): Executive Vice President, Quantitative Management & Securities Lending (2000-2004); prior thereto, various positions with Northern Trust Company (since 1994); member: Chicago Fellowship Board (since 2005), Catalyst Schools of Chicago Board (since 2008) and Mather Foundation Board (since 2012), and chair of its investment committee; formerly, Member, Northern Trust Mutual Funds Board (2005-2007), Northern Trust Global Investments Board (2004- 2007), Northern Trust Japan Board (2004-2007), Northern Trust Securities Inc. Board (2003-2007) and Northern Trust Hong Kong Board (1997-2004). | | 191 |
| | | | | | | | | | |
| ■ | MARGARET L. WOLFF
1955
333 W. Wacker Drive
Chicago, IL 6o6o6 | | Board Member | | 2016
Class I | | Member of the Board of Directors (since 2013) of Travelers Insurance Company of Canada and The Dominion of Canada General Insurance Company (each, a part of Travelers Canada, the Canadian operation of The Travelers Companies, Inc.); formerly, Of Counsel, Skadden, Arps, Slate, Meagher & Flom LLP (Mergers & Acquisitions Group) (2005-2014); Member of the Board of Trustees of New York- Presbyterian Hospital (since 2005); Member (since 2004) and Chair (since 2015) of the Board of Trustees of The John A. Hartford Foundation (a philanthropy dedicated to improving the care of older adults); formerly, Member (2005-2015) and Vice Chair (2011-2015) of the Board of Trustees of Mt. Holyoke College. | | 191 |
| | Name, | | Position(s) Held | | Year First | | Principal | | Number |
| | Year of Birth | | with the Funds | | Elected or | | Occupation(s) | | of Portfolios |
| | & Address | | | | Appointed | | Including other | | in Fund Complex |
| | | | | | and Term(1) | | Directorships | | Overseen by |
| | | | | | | | During Past 5 Years | | Board Member |
| Interested Board Members: | | | | | | | | |
| | | | | | | | | | |
| ■ | WILLIAM ADAMS IV(2)
1955
333 W. Wacker Drive
Chicago, IL 6o6o6 | | Board Member | | 2013
Class II | | Co-Chief Executive Officer and Co-President (since March 2016), formerly, Senior Executive Vice President, Global Structured Products (2010-2015) of Nuveen Investments, Inc.; Co-President of Nuveen Fund Advisors, LLC (since 2011); Senior Executive Vice President of Nuveen Securities, LLC; President (since 2011), formerly, Managing Director (2010-2011) of Nuveen Commodities Asset Management, LLC; Board Member of the Chicago Symphony Orchestra and of Gilda's Club Chicago; formerly, Executive Vice President, U.S. Structured Products, of Nuveen Investments, Inc. (1999-2010). | | 191 |
| | | | | | | | | | |
| ■ | THOMAS S. SCHREIER, JR.(2)(3)
1962
333 W. Wacker Drive
Chicago, IL 6o6o6
| | Board Member | | 2013
Class III | | Vice Chairman, Wealth Management of Nuveen Investments, Inc. (since 2011); Co-President of Nuveen Fund Advisors, LLC; Chairman of Nuveen Asset Management, LLC (since 2011); Co-Chief Executive Officer of Nuveen Securities, LLC (since 2011); Member of Board of Governors and Chairman's Council of the Investment Company Institute; Director and Vice Chair of Allina Health and a member of its Finance, Audit and Investment Committees; Director of the Minneapolis Museum of Art; formerly, Chief Executive Officer (2000- 2010) and Chief Investment Officer (2007-2010) of FAF Advisors, Inc.; formerly, President of First American Funds (2001-2010). | | 191 |
| | Name, | | Position(s) Held | | Year First | | Principal | | Number |
| | Year of Birth | | with the Funds | | Elected or | | Occupation(s) | | of Portfolios |
| | & Address | | | | Appointed(4) | | During Past 5 Years | | in Fund Complex |
| | | | | | | | | | Overseen |
| | | | | | | | | | by Officer |
| Officers of the Funds: | | | | | | | | |
| | | | | | | | | |
| ■ | GIFFORD R. ZIMMERMAN
1956
333 W. Wacker Drive
Chicago, IL 6o6o6 | | Chief Administrative Officer | | 1988 | | Managing Director (since 2002), and Assistant Secretary of Nuveen Securities, LLC; Managing Director (since 2004) and Assistant Secretary (since 1994) of Nuveen Investments, Inc.; Managing Director (since 2002), Assistant Secretary (since 1997) and Co-General Counsel (since 2011) of Nuveen Fund Advisors, LLC; Managing Director, Assistant Secretary and Associate General Counsel of Nuveen Asset Management, LLC (since 2011); Managing Director and Assistant Secretary of Symphony Asset Management LLC (since 2003); Vice President and Assistant Secretary of NWQ Investment Management Company, LLC (since 2002), Nuveen Investments Advisers Inc. (since 2002), Santa Barbara Asset Management, LLC (since 2006), and of Winslow Capital Management, LLC, (since 2010); Vice President and Assistant Secretary (since 2013), formerly, Chief Administrative Officer and Chief Compliance Officer (2006-2013) of Nuveen Commodities Asset Management, LLC; Chartered Financial Analyst. | | 192 |
| | | | | | | | | | |
| ■ | CEDRIC H. ANTOSIEWIC
1962
333 W. Wacker Drive
Chicago, IL 6o6o6 | | Vice President | | 2007 | | Managing Director of Nuveen Securities, LLC. (since 2004); Managing Director of Nuveen Fund Advisors, LLC (since 2014). | | 84 |
| | | | | | | | | | |
| ■ | MARGO L. COOK
1964
333 W. Wacker Drive
Chicago, IL 6o6o6 | | Vice President | | 2009 | | Co-Chief Executive Officer and Co-President (since March 2016), formerly, Senior Executive Vice President of Nuveen Investments, Inc; Senior Executive Vice President of Nuveen Fund Advisors, LLC (Executive Vice President since 2011); Managing Director – Investment Services of Nuveen Commodities Asset Management, LLC (since 2011); Co-Chief Executive Officer (since 2015), previously, Executive Vice President (2013-2015) of Nuveen Securities, LLC; Chartered Financial Analyst. | | 192 |
| | Name, | | Position(s) Held | | Year First | | Principal | | Number |
| | Year of Birth | | with the Funds | | Elected or | | Occupation(s) | | of Portfolios |
| | & Address | | | | Appointed(4) | | During Past 5 Years | | in Fund Complex |
| | | | | | | | | | Overseen |
| | | | | | | | | | by Officer |
| Officers of the Funds (continued): | | | | | | |
| | | | | | | |
| ■ | LORNA C. FERGUSON
1945
333 W. Wacker Drive
Chicago, IL 6o6o6 | | Vice President | | 1998 | | Managing Director (since 2004) of Nuveen Investments Holdings, Inc. | | 192 |
| | | | | | | | | | |
| ■ | STEPHEN D. FOY
1954
333 W. Wacker Drive
Chicago, IL 6o6o6 | | Vice President and Controller | | 1998 | | Managing Director (since 2014), formerly, Senior Vice President (2013-2014) and Vice President (2005-2013) of Nuveen Fund Advisors, LLC; Chief Financial Officer of Nuveen Commodities Asset Management, LLC (since 2010); Certified Public Accountant. | | 192 |
| | | | | | | | | | |
| ■ | SHERRI A. HLAVACEK
1962
333 W. Wacker Drive
Chicago, IL 6o6o6 | | Vice President
and Treasurer | | 2015 | | Executive Vice President (since 2015, formerly, Managing Director) and Controller of Nuveen Fund Advisors, LLC; Managing Director and Controller of Nuveen Commodities Asset Management, LLC; Executive Vice President (since 2015, formerly, Managing Director), Treasurer and Controller of Nuveen Asset Management, LLC; Executive Vice President, Principal Financial Officer (since 2015, formerly, Managing Director), Treasurer and Corporate Controller of Nuveen Investments, Inc.; Executive Vice President (since 2015, formerly, Managing Director), Treasurer and Corporate Controller of Nuveen Investments Advisers, LLC and Nuveen Investments Holdings, Inc.; Managing Director, Chief Financial Officer and Corporate Controller of Nuveen Securities, LLC; Vice President, Controller and Treasurer of NWQ Investment Management Company, LLC; Vice President and Controller of Santa Barbara Asset Management, LLC, Tradewinds Global Investors, LLC, Symphony Asset Management LLC and Winslow Capital Management, LLC; Certified Public Accountant. | | 192 |
| | | | | | | | | | |
| ■ | WALTER M. KELLY
197o
333 W. Wacker Drive
Chicago, IL 6o6o6 | | Chief Compliance
Officer and
Vice President | | 2003 | | Senior Vice President (since 2008) of Nuveen Investment Holdings, Inc. | | 192 |
| | | | | | | | | | |
| ■ | DAVID J. LAMB
1963
333 W. Wacker Drive
Chicago, IL 6o6o6 | | Vice President | | 2015 | | Senior Vice President of Nuveen Investments Holdings, Inc. (since 2006), Vice President prior to 2006. | | 84 |
| | | | | | | | | | |
| ■ | TINA M. LAZAR
1961
333 W. Wacker Drive
Chicago, IL 6o6o6 | | Vice President | | 2002 | | Senior Vice President of Nuveen Investments Holdings, Inc. and Nuveen Securities, LLC. | | 192 |
| | | | | | | | | | |
| ■ | KEVIN J. MCCARTHY
1966
333 W. Wacker Drive
Chicago, IL 6o6o6 | | Vice President and Secretary | | 2007 | | Executive Vice President, Secretary and General Counsel (since March 2016), formerly, Managing Director and Assistant Secretary of Nuveen Investments, Inc.; Executive Vice President (since March 2016), formerly, Managing Director and Assistant Secretary (since 2008) of Nuveen Securities, LLC; Executive Vice President and Secretary (since March 2016), formerly, Managing Director (2008-2016) and Assistant Secretary (2007-2016) and Co-General Counsel (since 2011) of Nuveen Fund Advisors, LLC; Executive Vice President and Secretary (since March 2016), formerly, Managing Director, Assistant Secretary (2011-2016) and Associate General Counsel (since 2011) of Nuveen Asset Management, LLC; Executive Vice President and Secretary of Nuveen Investments Advisers, LLC; Vice President (since 2007) and Secretary (since March 2016) of NWQ Investment Management Company, LLC, Symphony Asset Management LLC, Santa Barbara Asset Management, LLC (since 2010) Winslow Capital Management, LLC and Tradewinds Global Investors, LLC (since 2016); Vice President (since 2010) and Secretary (since 2016), formerly, Assistant Secretary of Nuveen Commodities Asset Management, LLC. | | 192 |
| | Name, | | Position(s) Held | | Year First | | Principal | | Number |
| | Year of Birth | | with the Funds | | Elected or | | Occupation(s) | | of Portfolios |
| | & Address | | | | Appointed(4) | | During Past 5 Years | | in Fund Complex |
| | | | | | | | | | Overseen |
| | | | | | | | | | by Officer |
| Officers of the Funds (continued): | | | | | | |
| | | | | | | |
| ■ | KATHLEEN L. PRUDHOMME
1953
9o1 Marquette Avenue
Minneapolis, MN 554o2 | | Vice President and Assistant Secretary | | 2011 | | Managing Director, Assistant Secretary and Co-General Counsel (since 2011) of Nuveen Fund Advisors, LLC; Managing Director, Assistant Secretary and Associate General Counsel (since 2011) of Nuveen Asset Management, LLC; Managing Director and Assistant Secretary (since 2011) of Nuveen Securities, LLC; formerly, Deputy General Counsel, FAF Advisors, Inc. (2004-2010). | | 192 |
| | | | | | | | | | |
| ■ | JOEL T. SLAGER
1978
333 W. Wacker Drive
Chicago, IL 6o6o6 | | Vice President and Assistant Secretary | | 2013 | | Fund Tax Director for Nuveen Funds (since 2013); previously, Vice President of Morgan Stanley Investment Management, Inc., Assistant Treasurer of the Morgan Stanley Funds (from 2010 to 2013). | | 192 |
| (1) | The Board of Trustees is divided into three classes, Class I, Class II, and Class III, with each being elected to serve until the third succeeding annual shareholders' meeting subsequent to its election or thereafter in each case when its respective successors are duly elected or appointed, except two board members are elected by the holders of Preferred Shares, to serve until the next annual shareholders' meeting subsequent to its election or thereafter in each case when its respective successors are duly elected or appointed. The year first elected or appointed represents the year in which the board member was first elected or appointed to any fund in the Nuveen Complex. |
| (2) | "Interested person" as defined in the 1940 Act, by reason of his position with Nuveen Investments, Inc. and certain of its subsidiaries, which are affiliates of the Nuveen Funds. |
| (3) | Mr. Schreier will retire from the Funds' Board of Trustees effective May 31, 2016. |
| (4) | Officers serve one year terms through August of each year. The year first elected or appointed represents the year in which the Officer was first elected or appointed to any fund in the Nuveen Complex. |
Notes
Notes
| Nuveen Investments: |
| Serving Investors for Generations |
Since 1898, financial advisors and their clients have relied on Nuveen Investments to provide dependable investment solutions through continued adherence to proven, long-term investing principles. Today, we offer a range of high quality equity and fixed-income solutions designed to be integral components of a well-diversified core portfolio.
Focused on meeting investor needs.
Nuveen Investments provides high-quality investment services designed to help secure the long-term goals of institutional and individual investors as well as the consultants and financial advisors who serve them. Nuveen Investments markets a wide range of specialized investment solutions which provide investors access to capabilities of its high-quality boutique investment affiliates—Nuveen Asset Management, Symphony Asset Management, NWQ Investment Management Company, Santa Barbara Asset Management, Tradewinds Global Investors, Winslow Capital Management and Gresham Investment Management. In total, Nuveen Investments managed $229 billion as of March 31, 2016.
Find out how we can help you.
To learn more about how the products and services of Nuveen Investments may be able to help you meet your financial goals, talk to your financial advisor, or call us at (800) 257-8787. Please read the information provided carefully before you invest. Investors should consider the investment objective and policies, risk considerations, charges and expenses of any investment carefully. Where applicable, be sure to obtain a prospectus, which contains this and other relevant information. To obtain a prospectus, please contact your securities representative or Nuveen Investments, 333 W. Wacker Dr., Chicago, IL 60606. Please read the prospectus carefully before you invest or send money.
Learn more about Nuveen Funds at: www.nuveen.com/cef
Distributed by Nuveen Investments, LLC | 333 West Wacker Drive | Chicago, IL 60606 | www.nuveen.com | |
EAN-B-0216D 15310-INV-Y-04/17
ITEM 2. CODE OF ETHICS.