Washington, D.C. 20549
Gifford R. Zimmerman
Form N-CSR is to be used by management investment companies to file reports with the Commission not later than 10 days after the transmission to stockholders of any report that is required to be transmitted to stockholders under Rule 30e-1 under the Investment Company Act of 1940 (17 CFR 270.30e-1). The Commission may use the information provided on Form N-CSR in its regulatory, disclosure review, inspection, and policymaking roles.
A registrant is required to disclose the information specified by Form N-CSR, and the Commission will make this information public. A registrant is not required to respond to the collection of information contained in Form N-CSR unless the Form displays a currently valid Office of Management and Budget (“OMB”) control number. Please direct comments concerning the accuracy of the information collection burden estimate and any suggestions for reducing the burden to Secretary, Securities and Exchange Commission, 450 Fifth Street, NW, Washington, DC 20549-0609. The OMB has reviewed this collection of information under the clearance requirements of 44 U.S.C. ss. 3507.
ITEM 1. REPORTS TO STOCKHOLDERS.
Life is Complex.
Nuveen makes things e-simple.
It only takes a minute to sign up for e-Reports. Once enrolled, you’ll receive an e-mail as soon as your Nuveen Fund information is ready—no more waiting for delivery by regular mail. Just click on the link within the e-mail to see the report and save it on your computer if you wish.
Free e-Reports
right to your e-mail!
www.investordelivery.com
If you receive your Nuveen Fund
dividends and statements from your
financial advisor or brokerage account.
or
www.nuveen.com/client-access
If you receive your Nuveen Fund
dividends and statements directly from
Nuveen.
NOT FDIC INSURED MAY LOSE
VALUE NO BANK GUARANTEE
Table of Contents
| | |
| Chairman’s Letter to Shareholders | 4 |
| | |
| Portfolio Managers’ Comments | 5 |
| | |
| Fund Leverage | 12 |
| | |
| Common Share Information | 13 |
| | |
| Risk Considerations | 15 |
| | |
| Performance Overview and Holding Summaries | 16 |
| | |
| Shareholder Meeting Report | 24 |
| | |
| Report of Independent Registered Public Accounting Firm | 26 |
| | |
| Portfolios of Investments | 27 |
| | |
| Statement of Assets and Liabilities | 58 |
| | |
| Statement of Operations | 59 |
| | |
| Statement of Changes in Net Assets | 60 |
| | |
| Statement of Cash Flows | 62 |
| | |
| Financial Highlights | 64 |
| | |
| Notes to Financial Statements | 70 |
| | |
| Additional Fund Information | 85 |
| | |
| Glossary of Terms Used in this Report | 86 |
| | |
| Reinvest Automatically, Easily and Conveniently | 88 |
| | |
| Board Members & Officers | 89 |
3
Chairman’s Letter to Shareholders
Dear Shareholders,
Financial markets rallied in the early months of 2019, in sharp contrast to the downturn at the end of 2018, leaving investors to wonder whether such bullishness is warranted or sustainable. By the close of 2018, economic softness in China, Europe and Japan had proven more persistent than expected. The temporary boost to the U.S. economy from tax law changes appeared to be fading. Corporate earnings and profits were slowing, and some corporate managements, especially at high-profile technology companies, were downgrading their outlooks. Politics remained unpredictable, most notably with the Brexit and U.S.-China trade talks ongoing. The European Central Bank (ECB) ended its crisis-era monetary stimulus program with pledges to keep interest rates low for an extended period, while the U.S. Federal Reserve (Fed) planned to continue raising interest rates into 2019.
As the new year began, economic data have remained a mixed bag, and investors will be closely watching the first quarter 2019 corporate earnings reports. However, market sentiment shifted significantly after both the Fed and ECB turned remarkably more dovish in their interest rate projections and lowered their growth forecasts. The U.S. and China appear to be making progress on trade talks, such that President Trump did not increase tariffs as initially planned in March 2019. While these events did reduce some of the markets’ uncertainty, downside risks still appear to be rising.
Nevertheless, we believe the likelihood of a near-term recession remains low. Global growth is indeed slowing, but it’s still positive. The U.S. economy remains strong, even in the face of late-cycle pressures. Low unemployment and firming wages should continue to support consumer spending, and the November mid-term elections resulted in change, but no major surprises. In China, the government remains committed to using fiscal stimulus to offset softening exports. Europe also remains vulnerable to trade policy as well as Brexit uncertainty, but underlying strengths in European economies, including low unemployment that drives domestic demand, remain supportive of a mild expansion. In a slower growth environment, there are opportunities for investors who seek them more selectively.
We expect volatility and challenging conditions to persist in 2019 but also think there is potential for upside. You can prepare your investment portfolio by working with your financial advisor to review your goals, timeline and risk tolerance. On behalf of the other members of the Nuveen Fund Board, we look forward to continuing to earn your trust in the months and years ahead.
Sincerely,
Terence J. Toth
Chairman of the Board
April 23, 2019
4
Portfolio Managers’ Comments
Nuveen Arizona Quality Municipal Income Fund (NAZ)
Nuveen Michigan Quality Municipal Income Fund (NUM)
Nuveen Ohio Quality Municipal Income Fund (NUO)
Nuveen Texas Quality Municipal Income Fund (NTX)
These Funds feature portfolio management by Nuveen Asset Management, LLC (NAM), an affiliate of Nuveen, LLC. Portfolio managers Michael S. Hamilton and Daniel J. Close, CFA, review U.S. economic and municipal market conditions at the national and state levels, key investment strategies and the twelve-month reporting period performance of these four Nuveen Funds. Michael assumed portfolio management responsibility for NAZ in 2011, while Dan has managed NUM, NUO and NTX since 2007.
What factors affected the U.S. economy and the national municipal bond market during the twelve-month reporting period ended February 28, 2019?
The U.S. economy continued to grow at a solid pace during the reporting period. Gross domestic product (GDP), which measures the value of goods and services produced by the nation’s economy less the value of the goods and services used up in production, adjusted for price changes, grew at an annualized rate of 2.2% in the fourth quarter of 2018, according to the Bureau of Economic Analysis “third” estimate. Consumer and business spending supported growth in the final months of 2018, while a weaker housing market and a larger trade deficit subtracted from GDP. For the full year 2018, U.S. GDP growth came in at 2.9%, as economic activity cooled over the second half of 2018 after peaking at 4.2% (annualized) in the second quarter of 2018.
Consumer spending, the largest driver of the economy, remained well supported by low unemployment, wage gains and tax cuts. As reported by the Bureau of Labor Statistics, the unemployment rate fell to 3.8% in February 2019 from 4.1% in February 2018 and job gains averaged around 209,000 per month for the past twelve months. As the jobs market has tightened, average hourly earnings grew at an annualized rate of 3.4% in February 2019. However, falling energy prices led to a slower rate of inflation over the past twelve months. The Consumer Price Index (CPI) increased 1.5% over the twelve-month reporting period ended February 28, 2019 before seasonal adjustment, as reported by the Bureau of Labor Statistics.
Low mortgage rates and low inventory drove home prices higher during this recovery cycle. But the pace of price increases has slowed as mortgage rates drifted higher and homes have become less affordable. The S&P CoreLogic Case-Shiller U.S. National Home Price Index, which covers all nine U.S. census divisions, was up 4.3% year-over-year in January 2019 (most recent data available at the time this report was prepared). The 10-City and 20-City Composites reported year-over-year increases of 3.2% and 3.6%, respectively.
This material is not intended to be a recommendation or investment advice, does not constitute a solicitation to buy, sell or hold a security or an investment strategy and is not provided in a fiduciary capacity. The information provided does not take into account the specific objectives or circumstances of any particular investor, or suggest any specific course of action. Investment decisions should be made based on an investor’s objectives and circumstances and in consultation with his or her advisors.Certain statements in this report are forward-looking statements. Discussions of specific investments are for illustration only and are not intended as recommendations of individual investments. The forward-looking statements and other views expressed herein are those of the portfolio managers as of the date of this report. Actual future results or occurrences may differ significantly from those anticipated in any forward-looking statements, and the views expressed herein are subject to change at any time, due to numerous market and other factors. The Funds disclaim any obligation to update publicly or revise any forward-looking statements or views expressed herein.
For financial reporting purposes, the ratings disclosed are the highest rating given by one of the following national rating agencies: Standard & Poor’s Group (S&P), Moody’s Investors Service, Inc. (Moody’s) or Fitch, Inc. (Fitch). This treatment of split-rated securities may differ from that used for other purposes, such as for Fund investment policies. Credit ratings are subject to change. AAA, AA, A and BBB are investment grade ratings, while BB, B, CCC, CC, C and D are below investment grade ratings. Holdings designated N/R are not rated by these national rating agencies.
Bond insurance guarantees only the payment of principal and interest on the bond when due, and not the value of the bonds themselves, which will fluctuate with the bond market and the financial success of the issuer and the insurer. Insurance relates specifically to the bonds in the portfolio and not to the share prices of a Fund. No representation is made as to the insurers’ ability to meet their commitments.
Refer to the Glossary of Terms Used in this Report for further definition of the terms used within this section.
5
Portfolio Managers’ Comments (continued)
As some data began pointing to slower momentum in the overall economy, the Federal Reserve (Fed) notably shifted its stance. From December 2015 through December 2018, the Fed had gradually lifted its main policy interest rate to prevent the economy from overheating. In its final meeting of 2018, the Fed indicated that two more rate hikes might be forthcoming in 2019, roiling the markets, which had expected a more dovish tone. However, as more recent data revealed a mixed picture of the economy, the Fed said it would adopt a more “patient” approach, signaling the possibility of no rate hikes in 2019. As expected, the Fed held rates steady at its January 2019 committee meeting. Subsequent to the end of the reporting period, at its March 2019 meeting, the Fed again kept rates unchanged and further clarified that it will discontinued rolling assets off its balance sheet in September 2019, sooner than many observers expected.
During the twelve-month reporting period, geopolitical news remained a prominent market driver. The U.S. moved forward with tariffs on imported goods from China, as well as on steel and aluminum from Canada, Mexico and Europe. These countries announced retaliatory measures in kind, intensifying concerns about a trade war, although there have been some positive developments. In July 2018, the U.S. and the European Union announced they would refrain from further tariffs while they negotiate trade terms, and in October 2018, the U.S., Mexico and Canada agreed to a new trade deal to replace the North American Free Trade Agreement. At the November 2018 G-20 summit, the U.S. and China settled on a 90-day trade truce, and after the countries resumed trade talks in early 2019, President Trump said he would not increase the tariffs in March 2019 as planned. Brexit negotiations continued to be uncertain, and Prime Minister Theresa May faced significant difficulty getting a plan approved in Parliament. (Subsequent to the end of the reporting period, the European Union approved a conditional delay, allowing the U.K. more time to approve a plan.) Europe also contended with Italy’s new euroskeptic coalition government, the “yellow vest” protests in France, immigration policy concerns and political risk in Turkey. The U.S. Treasury issued additional sanctions on Russia in April 2018 and reimposed sanctions on Iran following the U.S. withdrawal from the 2015 nuclear agreement. Bearish crude oil supply news, along with heightened tensions between the U.S. and Saudi Arabia after the disappearance of a Saudi journalist, drove oil price volatility. On the Korean peninsula, the leaders of South Korea and North Korea met during April 2018 and jointly announced a commitment toward peace, while the U.S. and North Korea held a denuclearization summit in June 2018 and a second summit in February 2019 without securing an agreement. In late December 2018, the U.S. government entered a 35-day partial shutdown due to an impasse on border security funding. Concerns about a second shutdown were alleviated after the government passed a funding bill in February 2019.
Municipal bonds delivered positive performance in this reporting period. Interest rates were increasing through much of the reporting period, as a strong economic backdrop kept the Fed on its course of monetary tightening. The 10-year U.S. Treasury yield peaked at 3.24% in November 2018. However, in December 2018, market volatility spiked as uncertain trade policy, Brexit negotiations, and weak macro data in Europe and China weighed on the U.S. growth outlook. Equities and riskier segments of the bond market sold off sharply in the fourth quarter of 2018. Following the Fed’s December meeting, investor expectations for a pause in rate increases drove repricing in the markets, driving long-term interest meaningfully lower through the end of the reporting period. While the U.S. Treasury yield curve flattened over this reporting period, the municipal yield curve “twisted” by flattening at the short end and steepening at the long end of the curve. For the twelve-month period overall, municipal bond yields were marginally lower, belying larger intra-period swings.
Supply and demand conditions in the municipal bond market were favorable to performance in this reporting period, particularly in the latter three months. Issuance has been subdued since the passage of the Tax Cuts and Jobs Act of 2017. Because new issue advance refunding bonds are no longer tax exempt under the new tax law, the total supply of municipal bonds has decreased, boosting the scarcity value of existing municipal bonds. Municipal bond issuance nationwide totaled $347.3 billion in this reporting period, a 19.0% decrease from the issuance for the twelve-month reporting period ended February 28, 2018. Nevertheless, the overall low level of interest rates encouraged issuers to continue to actively refund their outstanding debt. In these transactions the issuers are issuing new bonds and taking the bond proceeds and redeeming (calling) old bonds. These refunding transactions have ranged from 40% to 60% of total issuance over the past few years. Thus, the net issuance (all bonds issued less bonds redeemed) is actually much lower than the gross issuance. So, while gross issuance volume has been strong, the net has not, and this was an over-
6
all positive technical factor on municipal bond investment performance in recent years. Although the pace of refundings is slowing, net negative issuance is expected to continue.
Low global interest rates have continued to drive investors toward higher after-tax yielding assets, including U.S. municipal bonds. The Fed’s pivot to a more dovish stance in early 2019 also brought investors back to fixed income markets, including municipal bonds, driving large inflows into the asset class in the early months of 2019. Additionally, as tax payers have begun to assess the impact of the 2017 tax law, which caps the state and local tax (SALT) deduction for individuals, demand for tax-exempt municipal bonds, especially in states with high income and/or property taxes, is expected to increase.
How were the economic and market environments in Arizona, Michigan, Ohio and Texas during the reporting period ended February 28, 2019?
Arizona’s economic growth is accelerating. The state’s job growth exceeded the nation’s for 2018, driven by construction and manufacturing as well as contributions from finance, technology, health care and hospitality sectors. Arizona’s favorable business environment and ample workforce has lured new businesses into the state, recently including financial institutions such as Bank of the West, Voya and Nationwide. The economy’s improvement continues to favorably impact the housing market. Gains in Arizona housing prices have been driven primarily by the Phoenix market, with the state’s smaller metropolitan areas also showing progress. According to the S&P CoreLogic Case-Shiller Index, housing prices in Phoenix rose 7.5% over the twelve months ended January 2019 (most recent data available at the time this report was prepared), compared with a 4.3% price increase nationally. In the job market, the Arizona unemployment rate was 5.1% as of February 2019. Governor Ducey signed the $10.4 billion Fiscal Year 2019 Budget, up 3.2% over the previously enacted budget and the largest budget in state history. It provides additional money for K-12 education, including teacher salary increase over three years, without raising taxes. The recovering economy has helped the state replenish its rainy day fund to $457.8 million as of Fiscal Year 2018 after it was almost depleted in Fiscal Year 2009. Governor Ducey’s Proposed General Fund Fiscal Year 2020 Budget totals $11.4 billion, up 9.1% over the prior enacted Fiscal Year. The Budget Proposal includes depositing $542 million into the rainy day fund, growing it to $1 billion; providing additional money for K-12 education, including a teacher salary increase; and increasing funding for public safety and drought contingency plans without raising taxes. As of February 2019, S&P and Moody’s rated Arizona’s Issuer Credit Rating at AA and Aa2, respectively, with a stable outlook. During the twelve months ended February 28, 2019 municipal issuance in Arizona totaled $4.4 billion, a gross issuance decrease of 35.4% from the twelve months ended February 28, 2018.
Michigan’s economic growth has outpaced many of its Great Lakes region neighbors in recent years, driven by employment growth, continued diversification and multiple years of strong domestic auto sales. Light motor vehicle sales were essentially flat in calendar year 2018, but it was the fourth consecutive year sales exceeded 17 million units, helping to sustain Michigan’s growth. To a large extent, the Michigan economy remains tied to events in the auto industry, as the “Big Three” (General Motors, Ford and Chrysler) continued to rank among the state’s five largest employers. Overall, Michigan remained heavily reliant on manufacturing, which represented 13.9% of employment in the state, compared with 8.6% nationally. As of February 2019, Michigan’s unemployment rate was 4.0%. Favorably, the state’s labor force participation rate has remained stable as unemployment has improved, indicating a real improvement in job growth. Following the peak in housing prices in mid-2006, home prices in Michigan declined dramatically and the inventory of foreclosed homes remained elevated in many of the state’s hardest-hit metropolitan areas, including Detroit, Warren and Flint. Improvement in the state economy has brought slow, steady improvement in the housing market. According to the S&P CoreLogic Case-Shiller Index of 20 major metropolitan areas, housing prices in Detroit rose 5.0% over the twelve months ended January 2019 (most recent data available at the time this report was prepared), ahead of the national average increase of 4.3%. On the fiscal front, as revenues improved, the state has demonstrated a commitment to rebuilding reserves and maintaining structurally balanced operations. The state’s previously depleted budget stabilization/rainy day reserve fund is now on pace to approach $1 billion by the end of Fiscal Year 2019. The state’s improved financial and cash position has eliminated the need for cash flow
7
Portfolio Managers’ Comments (continued)
borrowing, which the state hasn’t resorted to since 2011. Strong income and sales tax revenue growth have helped make this possible, though the pace of revenue growth is projected to slow over the next two years. This slowdown and the state’s gap in infrastructure spending have the potential to pose future budgetary pressure. Newly elected Governor Gretchen Whitmer campaigned on a promise to address Michigan’s deteriorating transportation infrastructure, and new funding for roads is a key part of her Fiscal 2020 budget proposal. The $60.2 billion budget, which represents a 3.5% increase over the prior year, dedicates much of the increased spending to road repairs and education. As proposed, spending on roads would be funded by a 45 cents per gallon increase in the fuel tax, to be implemented incrementally over a one-year period beginning in October 2019. The budget also increases education spending with funding increases targeted at lower funded schools. As of March 2019, Moody’s and S&P rated Michigan general obligation (GO) debt at Aa1 and AA-, respectively. During the twelve months ended February 28, 2019, municipal issuance in Michigan totaled $8.3 billion, a gross issuance increase of 27.7% from the twelve months ended February 28, 2018.
Ohio’s employment growth in 2018 was the strongest in years, although national leading economic indicators point to slower but continued growth in 2019. In 2018, Ohio had a job growth rate of 2.1%. That was the state’s best year since 1994’s rate of 3.6%. The U.S. labor force grew by 1.6% over the last year. It is rare for Ohio to outperform the nation’s job growth average, which it did in 2010 and in 2018, perhaps in response to federal stimulus policies in those years. As of February 2019, Ohio’s unemployment rate was 4.6%. The decades-long decline in manufacturing employment continues in the state, while more jobs get created in the health services sector, in particular. Ohio’s economy has also been affected by stagnant population growth. The state’s population grew by 174,000 to nearly 11.7 million between 2008 and 2018, placing the state’s lackluster growth 41st in the nation for that period. According to the S&P CoreLogic Case-Shiller Index, housing prices in Cleveland rose 3.8% over the twelve months ended January 2019 (most recent data available at the time this report was prepared), compared with a 4.3% price increase nationally. Ohio’s median household income continues to widen from the national median. Ohio’s household income stood at $54,021, which places it 35th in the U.S., according to the Census Bureau. Ohio began 2019 with a new governor, Mike DeWine, who emphasized greater investment in infrastructure, combatting the state’s addiction epidemic and workforce development as key themes in his first State of the State address. On the fiscal front, Ohio’s year-to-date revenues (through February 2019) are 1.6% below estimate but 1.8% above the prior year’s collections. The greatest increase in dollars comes from sales tax receipts, as recent tax reform gradually lowered the individual income tax rate while raising the state’s sales tax. The state’s conservative fiscal management has resulted in a strong financial position, with sound liquidity and reserve levels. Ohio prioritized the rebuilding of its Budget Stabilization Fund after the Great Recession. The current Budget Stabilization Fund balance of $2.7 billion is 8.5% of general fund revenues. As of February 2019, Moody’s and S&P rated Ohio GO debt at Aa1 and AA+, respectively, with stable outlooks. For the twelve months ended February 28, 2019, municipal issuance in Ohio totaled $8.2 billion, a gross issuance decrease of 41.6% compared with the twelve months ended February 28, 2018.
Texas’ economy is the second largest in the United States. Texas quickly recovered from Hurricane Harvey and job growth continues to remain strong. Despite the state’s economic diversity, the energy sector is still a major driver. Mining & manufacturing sector jobs represent 8.9% of total employment. Between 2014 and 2018, mining employment declined by 8.7% and manufacturing declined by 1.1%. Notably, oil prices are on the rebound and the mining sector had the largest year-over-year gain in employment of 13.3%. In addition, overall state employment has seen continued growth since 2009 and unemployment rates continue to improve. The state’s unemployment rate has decreased to 3.8% as of February 2019. After mining, the largest year-over-year employment gains were seen in construction (4.8%), professional & business services (3.9%), and leisure & hospitality (3.5%). Texas’ largest non-government employment sectors, which include trade transportation & utilities, education & health services, professional & business services, and financial activities, represented approximately 61% of state employment. According to the S&P CoreLogic Case-Shiller Index, housing prices in Dallas posted a year-over-year increase of 3.8% as of January 2019 (most recent data available at the time this report was prepared), compared with the national average price increase of 4.3%. On the fiscal front, the state is in the middle of its 2018-2019 biennium budget. As of February 2018, overall revenues collections are tracking ahead of budget and have increased 11.4% over the prior year. The State is anticipating ending Fiscal Year 2018 (ended August 31) with about a $94 million surplus, although much of that is already earmarked for Medicaid, education and transportation spending for Fiscal Year 2019. The
8
state maintains a large Economic Stabilization Fund, or rainy day fund, and as of Fiscal Year 2017, the fund totaled $11 billion or 11.3% of General Fund revenues. S&P, Moody’s and Fitch rate Texas GO debt at Aaa/AAA/AAA, and all have stable outlooks. For the twelve months ended February 28, 2019, municipal issuance in Texas totaled $34 billion, a gross issuance decrease of 12.0% from the previous twelve months.
What key strategies were used to manage these Funds during the twelve-month reporting period ended February 28, 2019?
Municipal bonds performed well during the reporting period amid positive fundamental credit conditions and a favorable technical supply-demand balance. Arizona’s and Texas’ municipal markets trailed the national municipal market. The municipal markets of Michigan and Ohio outperformed the national market.
We continued to take a bottom-up approach to discovering sectors that appeared undervalued as well as individual credits that we believed had the potential to perform well over the long term. Our trading activity continued to focus on pursuing the Funds’ investment objectives. In all four Funds, we bought bonds across a range of sectors and credit ratings, generally with intermediate to longer maturities. Additionally, for all four Funds, we took advantage of prevailing market conditions during the period of strongly rising interest rates in September and October 2018 to buy attractive higher yielding bonds by selling some depreciated bonds that were bought when interest rates were lower. These trades capitalized on the tax loss (which can be used to offset future taxable gains) and boosted the Funds’ income distribution.
NAZ added tax increment, higher education, airports, charter schools and local GO school district bonds, all of which had terms of 19 years and longer. We also established a tender option bond (TOB) trust, which increased the amount of leverage in the Fund. The proceeds for the new purchases mainly came from called and maturing bonds, as well as from the bond exchanging strategy described earlier.
NUM was active during the reporting period. In addition to the trades described in the Fund’s semiannual report dated August 31, 2018, we were active with bond exchanges and buying several new issues including water and sewer (BBB rated), tax increment (BBB rated), health care (A1/AA- rated) and Michigan State University higher education (AA rated) bonds, all of which were in-state issues. Secondary market buying was minimal in the second half of the reporting period. New purchases were funded from the proceeds of called and maturing bonds, as well as the sale of lower yielding, short maturity pre-refunded bonds and other positions at a loss.
In the second half of the reporting period, NUO also exchanged a number of bonds to increase income earnings, as well as bought in-state bonds issued for local appropriation, transportation (toll road), two local GOs, a state GO, two dedicated tax bonds and a public utility. The bonds were a mix of single A and AA rated credits, bought in both the primary and secondary markets. The majority of our buying was funded from the proceeds of called and maturing bonds. We also sold a lower yielding bond to reinvest in a more attractive, higher yielding long-term opportunity.
In NTX, we bought three new in-state issues in the second half of the reporting period. The bonds were primarily longer dated, lower investment grade issues from tax increment district, higher education and dedicated tax sectors. These credits were bought with the proceeds from maturing bonds and the sale of a lower yielding bond.
As of February 28, 2019, NAZ, NUM, NUO and NTX continued to use inverse floating rate securities. We employ inverse floaters for a variety of reasons, including duration management, income enhancement and total return enhancement.
How did the Funds perform for the twelve-month reporting period ended February 28, 2019?
The tables in each Fund’s Performance Overview and Holding Summaries section of this report provide the Funds’ total returns for the one-year, five-year and ten-year periods ended February 28, 2019. Each Fund’s returns on common share net asset value (NAV) are compared with the performance of corresponding market index and Lipper classification average.
9
Portfolio Managers’ Comments (continued)
For the twelve months ended February 28, 2019, the total returns on common share NAV for NAZ, NUM and NUO outperformed their respective state’s S&P Municipal Bond Index and the national S&P Municipal Bond Index, while NTX outperformed its state’s index and performed in line with the national index.
The factors driving performance in this reporting period included yield curve and duration positioning, credit ratings exposure, sector allocation and individual credit selection. For NAZ, yield curve and duration positioning contributed the most to relative performance. The Arizona Fund remained underweight to the short end of the yield curve and overweight to the long end, which was advantageous as longer maturities outperformed short maturities. An overweight allocation to the 6- to 9-year duration range was especially beneficial. Credit ratings and sector allocations had a relatively neutral impact on NAZ’s performance in this reporting period. The Fund’s overweight to lower rated credits, especially those rated BBB and lower, and exposure to sectors composed of predominantly lower rated bonds, were helpful, as these bonds’ higher yields provided enhanced income that contributed meaningfully to total return. The same theme emerged within our individual credit selection. Our most successful picks during the reporting period were those offering higher yields, including lower rated or non-rated tax increment bonds, charter school credits and health care (particularly continuing care retirement community) bonds. NAZ’s holdings in Salt Verde Prepay Gas bonds were another stand-out contributor. Additionally, several names bought during the peak in yields around September and October 2018 performed well over the remainder of the reporting period.
The Michigan Fund saw a modest boost from its duration and yield curve positioning, with positive contributions from underweight allocations to the shortest dated categories (ranging from zero to 4 years) and overweight allocations to longer dated categories (notably between 8 and 12 years). Credit ratings exposure was favorable on the whole. An overweight to single-B rated bonds, which are primarily tobacco securitization bonds, aided performance, while our AA rated exposure was somewhat detrimental. NUM’s sector allocations were a drag on performance, as an underweight to local GOs and overweight to public power detracted. Individual credit selection was beneficial, mainly due to outperformance among tender option bonds and intermediate- to longer-dated credits.
NUO’s yield curve and duration positioning marginally outperformed. An overweight to durations of 12 years and longer was disadvantageous, as the longest-dated categories in Ohio underperformed during this reporting period. However, the Fund benefited from its overweights to durations in the 8- to 12-year range. Credit ratings allocations produced gains, driven by strong results from non-rated bonds. However, NUO’s underweight to single-B rated bonds weighed on performance. In Ohio, tobacco settlement bonds comprise a substantial proportion of the state’s B rated municipal bonds. Given our assessment of the tobacco sector’s risk-reward characteristics, NUO’s maximum exposure to the sector is considerably lower than the benchmark index’s weighting, which detracts from performance when the sector performs well, as it did during this reporting period. On a sector basis, the Fund’s overweight to toll roads outperformed, but gains were partially offset by an overweight to pre-refunded bonds, which lagged in this reporting period. Our selection across individual bonds and tender option bonds added value. In particular, NUO’s position in distressed credit FirstEnergy Solutions was a large positive contributor to performance. The energy supplier had performed poorly earlier in 2017 amid credit concerns relating to its parent company’s plan to exit the power generation business. However, valuations recovered from those lows following progress on negotiations with bondholders (as explained in “An Update on FirstEnergy Solutions Corp.” at the end of this commentary).
In the Texas municipal market, longer-dated bonds outperformed shorter-dated bonds, which was favorable for NTX’s overweight to the longest maturities and underweight to the shortest maturities (namely, zero to 4 years). Our credit ratings allocations, however, detracted from performance, as the overweight to BBB rated bonds underperformed. Sector positioning was a strong contributor to performance, most notably in our overweights to the dedicated tax sector and water and sewer sectors, groups which outperformed. An underweight to the “other revenue” sector generated disappointing results and detracted somewhat from performance. Individual credit selection also contributed positively. Our selections in tender option bonds and longer-dated credits were the chief outperformers, offsetting weaker performance from shorter-dated, high credit quality bonds.
10
An Update on FirstEnergy Solutions Corp.
FirstEnergy Solutions Corp. and all of its subsidiaries filed for protection under Chapter 11 of the U.S. Bankruptcy Code on April 1, 2018. FirstEnergy Solutions and its subsidiaries specialize in coal and nuclear energy production. It is one of the main energy producers in the state of Ohio and a major energy provider in Pennsylvania. Because of the challenging market environment for nuclear and coal power in the face of inexpensive natural gas, FirstEnergy Corp., FirstEnergy Solution's parent announced in late 2016 that it would begin a strategic review of its generation assets. FirstEnergy Solutions is a unique corporate issuer in that the majority of its debt was issued in the municipal market to finance pollution control and waste disposal for its coal and nuclear plants. A substantial amount of bondholders, of which Nuveen Funds are included, entered into an “Agreement in Principal” with FirstEnergy Corp., to resolve potential claims that bondholders may have against FirstEnergy Corp. The agreement is subject to the approval of the FirstEnergy Corp. board of directors, FirstEnergy Solutions and the bankruptcy court.
In terms of FirstEnergy holdings, shareholders should note that NUO had 0.38% exposure, which was a mix of unsecured and secured holdings. NAZ, NUM and NTX had no exposure to FirstEnergy.
11
Fund Leverage
IMPACT OF THE FUNDS’ LEVERAGE STRATEGY ON PERFORMANCE
One important factor impacting the returns of the Funds’ common shares relative to their comparative benchmarks was the Funds’ use of leverage through their issuance of preferred shares and/or investments in inverse floating rate securities, which represent leveraged investments in underlying bonds. The Funds use leverage because our research has shown that, over time, leveraging provides opportunities for additional income, particularly in the recent market environment where short-term market rates are at or near historical lows, meaning that the short-term rates the Fund has been paying on its leveraging instruments in recent years have been much lower than the interest the Fund has been earning on its portfolio of long-term bonds that it has bought with the proceeds of that leverage.
However, use of leverage can expose Fund common shares to additional price volatility. When a Fund uses leverage, the Fund common shares will experience a greater increase in their net asset value if the municipal bonds acquired through the use of leverage increase in value, but will also experience a correspondingly larger decline in their net asset value if the bonds acquired through leverage decline in value, which will make the shares’ net asset value more volatile, and total return performance more variable, over time.
In addition, common share income in levered funds will typically decrease in comparison to unlevered funds when short-term interest rates increase and increase when short-term interest rates decrease. Over the last few quarters, short-term interest rates have indeed increased from their extended lows after the 2007-09 financial crisis. This increase has reduced common share net income, and also reduced potential for long-term total returns. Nevertheless, the ability to effectively borrow at current short-term rates is still resulting in enhanced common share income, and management believes that the advantages of continuation of leverage outweigh the associated increase in risk and volatility described above.
Leverage from issuance of preferred shares had a positive impact on the total return performance of the Funds over the reporting period. The use of leverage through inverse floating rate securities had a negligible impact on the total return performance of the Funds over the reporting period.
As of February 28, 2019, the Funds’ percentages of leverage are as shown in the accompanying table.
| | | | | |
| | NAZ | NUM | NUO | NTX |
| Effective Leverage* | 38.97% | 38.78% | 36.68% | 37.08% |
| Regulatory Leverage* | 34.99% | 36.14% | 33.20% | 32.53% |
| * | Effective leverage is a Fund’s effective economic leverage, and includes both regulatory leverage and the leverage effects of certain derivative and other investments in a Fund’s portfolio that increase the Fund’s investment exposure. Currently, the leverage effects of Tender Option Bond (TOB) inverse floater holdings are included in effective leverage values, in addition to any regulatory leverage. Regulatory leverage consists of preferred shares issued or borrowings of a Fund. Both of these are part of a Fund’s capital structure. A Fund, however, may from time to time borrow on a typically transient basis in connection with its day-to-day operations, primarily in connection with the need to settle portfolio trades. Such incidental borrowings are excluded from the calculation of a Fund’s effective leverage ratio. Regulatory leverage is subject to asset coverage limits set forth in the Investment Company Act of 1940. |
THE FUNDS’ REGULATORY LEVERAGE
As of February 28, 2019, the Funds have issued and outstanding preferred shares as shown in the accompanying table.
| | | | | | | | | | |
| | | Variable Rate Preferred* | | | Variable Rate Remarketed Preferred** | | | | |
| | | Shares | | | Shares | | | | |
| | | Issued at | | | Issued at | | | | |
| | | Liquidation | | | Liquidation | | | | |
| | | Preference | | | Preference | | | Total | |
| NAZ | | $ | 88,300,000 | | | $ | — | | | $ | 88,300,000 | |
| NUM | | $ | 173,000,000 | | | $ | — | | | $ | 173,000,000 | |
| NUO | | $ | 148,000,000 | | | $ | — | | | $ | 148,000,000 | |
| NTX | | $ | 72,000,000 | | | $ | — | | | $ | 72,000,000 | |
| * | Preferred shares of the Fund featuring a floating rate dividend based on a predetermined formula or spread to an index rate. Includes the following preferred shares AMTP, iMTP, VMTP, MFP- VRM and VRDP in Special Rate Mode, where applicable. See Notes to Financial Statements, Note 4 – Fund Shares, Preferred Shares for further details. |
| ** | Preferred shares of the Fund featuring floating rate dividends set by a remarketing agent via a regular remarketing. Includes the following preferred shares VRDP not in Special Rate Mode, MFP- VRRM and MFP-VRDM, where applicable. See Notes to Financial Statements, Note 4 – Fund Shares, Preferred Shares for further details. |
Refer to Notes to Financial Statements, Note 4 – Fund Shares, Preferred Shares for further details on preferred shares and each Fund’s respective transactions.
12
Common Share Information
COMMON SHARE DISTRIBUTION INFORMATION
The following information regarding the Funds’ distributions is current as of February 28, 2019. Each Fund’s distribution levels may vary over time based on each Fund’s investment activity and portfolio investment value changes.
During the current reporting period, each Fund’s distributions to common shareholders were as shown in the accompanying table.
| | | | | | | | | | | | | |
| | Per Common Share Amounts | |
| Monthly Distributions (Ex-Dividend Date) | | NAZ | | | NUM | | | NUO | | | NTX | |
| March 2018 | | $ | 0.0440 | | | $ | 0.0445 | | | $ | 0.0485 | | | $ | 0.0485 | |
| April | | | 0.0440 | | | | 0.0445 | | | | 0.0485 | | | | 0.0485 | |
| May | | | 0.0440 | | | | 0.0445 | | | | 0.0485 | | | | 0.0485 | |
| June | | | 0.0440 | | | | 0.0445 | | | | 0.0485 | | | | 0.0445 | |
| July | | | 0.0440 | | | | 0.0445 | | | | 0.0485 | | | | 0.0445 | |
| August | | | 0.0440 | | | | 0.0445 | | | | 0.0485 | | | | 0.0445 | |
| September | | | 0.0440 | | | | 0.0445 | | | | 0.0455 | | | | 0.0445 | |
| October | | | 0.0440 | | | | 0.0445 | | | | 0.0455 | | | | 0.0445 | |
| November | | | 0.0440 | | | | 0.0445 | | | | 0.0455 | | | | 0.0445 | |
| December | | | 0.0415 | | | | 0.0445 | | | | 0.0455 | | | | 0.0445 | |
| January | | | 0.0415 | | | | 0.0445 | | | | 0.0455 | | | | 0.0445 | |
| February 2019 | | | 0.0415 | | | | 0.0445 | | | | 0.0455 | | | | 0.0445 | |
| Total Distributions from Net Investment Income | | $ | 0.5205 | | | $ | 0.5340 | | | $ | 0.5640 | | | $ | 0.5460 | |
| Total Distributions from Long-Term Capital Gains* | | $ | — | | | $ | — | | | $ | 0.0271 | | | $ | — | |
| Total Distributions | | $ | 0.5205 | | | $ | 0.5340 | | | $ | 0.5911 | | | $ | 0.5460 | |
| | |
Yields | | | | | | | | | | | | | | | | |
| Market Yield** | | | 4.00 | % | | | 4.11 | % | | | 3.83 | % | | | 4.10 | % |
| Taxable-Equivalent Yield* | | | 5.59 | % | | | 5.73 | % | | | 5.31 | % | | | 5.39 | % |
| * | Distribution paid in December 2018. |
| ** | Market Yield is based on the Fund’s current annualized monthly distribution divided by the Fund’s current market price as of the end of the reporting period. Taxable-Equivalent Yield represents the yield that must be earned on a fully taxable investment in order to equal the yield of the Fund on an after-tax basis. It is based on a combined federal and state income tax rate of 28.5%, 28.3% and 26.1% for NAZ, NUM and NUO, respectively. NTX Fund is based on a federal income tax rate of 24.0%. The Taxable-Equivalent Yield also takes into account the percentage of the Fund’s income generated and paid by the Fund (based on payments made during the previous calendar year) that was either exempt from federal income tax but not from state income tax (e.g., income from an out-of-state municipal bond), or was exempt from neither federal nor state income tax. Separately, if the comparison were instead to investments that generate qualified dividend income, which is taxable at a rate lower than an individual’s ordinary graduated tax rate, the fund’s Taxable-Equivalent Yield would be lower. |
Each Fund seeks to pay regular monthly dividends out of its net investment income at a rate that reflects its past and projected net income performance. To permit each Fund to maintain a more stable monthly dividend, the Fund may pay dividends at a rate that may be more or less than the amount of net income actually earned by the Fund during the period. Distributions to shareholders are determined on a tax basis, which may differ from amounts recorded in the accounting records. In instances where the monthly dividend exceeds the earned net investment income, the Fund would report a negative undistributed net ordinary income. Refer to Note 6 – Income Tax Information for additional information regarding the amounts of undistributed net ordinary income and undistributed net long-term capital gains and the character of the actual distributions paid by the Fund during the period.
All monthly dividends paid by each Fund during the current reporting period were paid from net investment income. If a portion of the Fund’s monthly distributions is sourced or comprised of elements other than net investment income, including capital gains and/or a return of capital, shareholders will be notified of those sources. For financial reporting purposes, the per share amounts of
13
Common Share Information (continued)
each Fund’s distributions for the reporting period are presented in this report’s Financial Highlights. For income tax purposes, distribution information for each Fund as of its most recent tax year end is presented in Note 6 – Income Tax Information within the Notes to Financial Statements of this report.
COMMON SHARE REPURCHASES
During August 2018, the Funds’ Board of Trustees reauthorized an open-market share repurchase program, allowing each Fund to repurchase an aggregate of up to approximately 10% of its outstanding shares.
As of February 28, 2019, and since the inception of the Funds’ repurchase programs, the Funds have cumulatively repurchased and retired their outstanding common shares as shown in the accompanying table.
| | | | | |
| | NAZ | NUM | NUO | NTX |
| Common shares cumulatively repurchased and retired | 127,500 | 784,500 | 205,000 | 68,600 |
| Common shares authorized for repurchase | 1,170,000 | 2,065,000 | 1,850,000 | 1,005,000 |
During the current reporting period, the following Funds repurchased and retired their common shares at a weighted average price per share and a weighted average discount per share as shown in the accompanying table.
| | | | | | | | | | | | | |
| | | NAZ | | | NUM | | | NUO | | | NTX | |
| Common Shares Repurchased | | | 127,500 | | | | 562,500 | | | | 205,000 | | | | 68,600 | |
| Weighted average price per common share repurchased and retired | | $ | 11.60 | | | $ | 12.43 | | | $ | 13.36 | | | $ | 12.33 | |
| Weighted average discount per common share repurchased and retired | | | 15.61 | % | | | 16.07 | % | | | 15.59 | % | | | 15.38 | % |
COMMON SHARE EQUITY SHELF PROGRAM
During the current reporting period, NAZ was authorized by the Securities and Exchange Commission to issue additional common shares through an equity shelf program (Shelf Offering). Under this program NAZ, subject to market conditions, may raise additional capital from time to time in varying amounts and offering methods at a net price at or above the Fund’s NAV per common share. Under the Shelf Offering, the Fund was authorized to issue additional common shares as shown in the accompanying table.
| | |
| | NAZ |
| Additional authorized common shares | 1,100,000* |
| * Represents additional authorized common shares for the period March 1, 2018 through June 29, 2018. |
During the current reporting period, NAZ did not sell any common shares through its Shelf Offering.
Refer to the Notes to Financial Statements, Note 4 - Fund Shares, Common Shares Equity Shelf Programs and Offering Costs for further details of Shelf Offerings and the Fund’s transactions.
OTHER COMMON SHARE INFORMATION
As of February 28, 2019, and during the current reporting period, the Funds’ common share prices were trading at a premium/ (discount) to their common share NAVs as shown in the accompanying table.
| | | | | | | | | | | | | |
| | | NAZ | | | NUM | | | NUO | | | NTX | |
| Common share NAV | | $ | 14.18 | | | $ | 15.12 | | | $ | 16.26 | | | $ | 14.99 | |
| Common share price | | $ | 12.46 | | | $ | 12.99 | | | $ | 14.24 | | | $ | 13.03 | |
| Premium/(Discount) to NAV | | | (12.13 | )% | | | (14.09 | )% | | | (12.42 | )% | | | (13.08 | )% |
| 12-month average premium/(discount) to NAV | | | (11.17 | )% | | | (15.61 | )% | | | (14.71 | )% | | | (13.92 | )% |
14
Risk Considerations
Fund Shares are not guaranteed or endorsed by any bank or other insured depository institution, and are not federally insured by the Federal Deposit Insurance Corporation.
Nuveen Arizona Quality Municipal Income Fund (NAZ)
Nuveen Michigan Quality Municipal Income Fund (NUM)
Nuveen Ohio Quality Municipal Income Fund (NUO)
Nuveen Texas Quality Municipal Income Fund (NTX)
Investing in closed-end funds involves risk; principal loss is possible. There is no guarantee the Fund’s investment objectives will be achieved. Closed-end fund shares may frequently trade at a discount or premium to their net asset value. Debt or fixed income securities such as those held by the Fund, are subject to market risk, credit risk, interest rate risk, derivatives risk, liquidity risk, and income risk. As interest rates rise, bond prices fall. Leverage increases return volatility and magnifies the Fund’s potential return and its risks; there is no guarantee a fund’s leverage strategy will be successful. State concentration makes the Fund more susceptible to local adverse economic, political, or regulatory changes affecting municipal bond issuers. These and other risk considerations such as inverse floater risk and tax risk are described in more detail on the Fund’s web page at www.nuveen.com/NAZ, www.nuveen.com/NUM, www.nuveen.com/NUO and www.nuveen.com/NTX.
15
| | |
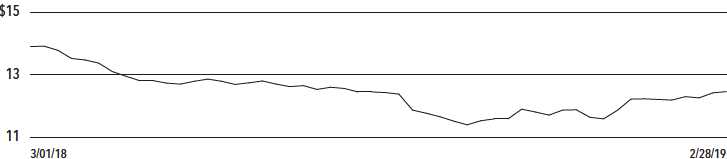
| NAZ | Nuveen Arizona Quality Municipal Income Fund Performance Overview and Holding Summaries as of February 28, 2019 |
| | | | | | | | | | |
Refer to the Glossary of Terms Used in this Report for further definition of the terms used within this section. | |
Average Annual Total Returns as of February 28, 2019 | |
| | |
| | | Average Annual | |
| | | 1-Year | | | 5-Year | | | 10-Year | |
| NAZ at Common Share NAV | | | 4.29 | % | | | 4.95 | % | | | 6.87 | % |
| NAZ at Common Share Price | | | (5.09 | )% | | | 4.53 | % | | | 6.76 | % |
| S&P Municipal Bond Arizona Index | | | 3.92 | % | | | 3.30 | % | | | 4.80 | % |
| S&P Municipal Bond Index | | | 4.03 | % | | | 3.45 | % | | | 4.77 | % |
Past performance is not predictive of future results. Current performance may be higher or lower than the data shown. Returns do not reflect the deduction of taxes that shareholders may have to pay on Fund distributions or upon the sale of Fund shares. Returns at NAV are net of Fund expenses, and assume reinvestment of distributions. Comparative index return information is provided for the Fund’s shares at NAV only. Indexes are not available for direct investment.
Common Share Price Performance — Weekly Closing Price
16
This data relates to the securities held in the Fund’s portfolio of investments as of the end of the reporting period. It should not be construed as a measure of performance for the Fund itself. Holdings are subject to change.
For financial reporting purposes, the ratings disclosed are the highest rating given by one of the following national rating agencies: Standard & Poor’s Group, Moody’s Investors Service, Inc. or Fitch, Inc. This treatment of split-rated securities may differ from that used for other purposes, such as for Fund investment policies. Credit ratings are subject to change. AAA, AA, A and BBB are investment grade ratings; BB, B, CCC, CC, C and D are below-investment grade ratings. Holdings designated N/R are not rated by these national rating agencies.
| | |
Fund Allocation | |
(% of net assets) | |
| Long-Term Municipal Bonds | 158.2% |
| Other Assets Less Liabilities | 1.4% |
Net Assets Plus Floating Rate | |
Obligations & AMTP Shares, | |
net of deferred offering costs | 159.6% |
| Floating Rate Obligations | (5.9)% |
| AMTP Shares, net of deferred | |
| offering costs | (53.7)% |
Net Assets | 100% |
States and Territories | |
(% of total municipal bonds) | |
| Arizona | 96.7% |
| Guam | 2.9% |
| Virgin Islands | 0.4% |
Total | 100% |
| | |
Portfolio Composition | |
(% of total investments) | |
| Education and Civic Organizations | 21.2% |
| Tax Obligation/Limited | 20.2% |
| Utilities | 13.2% |
| Tax Obligation/General | 11.8% |
| Health Care | 11.6% |
| U.S. Guaranteed | 9.9% |
| Water and Sewer | 6.3% |
| Other | 5.8% |
Total | 100% |
| | |
Portfolio Credit Quality | |
(% of total investment exposure) | |
| U.S. Guaranteed | 6.0% |
| AAA | 10.4% |
| AA | 46.5% |
| A | 25.2% |
| BBB | 1.0% |
| BB or Lower | 5.6% |
| N/R (not rated) | 5.3% |
Total | 100% |
17
| | |
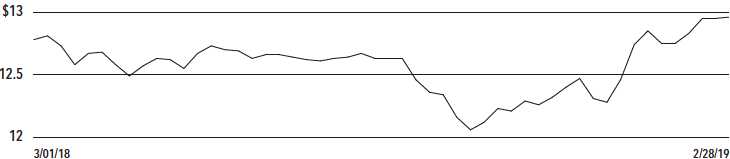
| NUM | Nuveen Michigan Quality Municipal Income Fund Performance Overview and Holding Summaries as of February 28, 2019 |
| | | | | | | | | | |
Refer to the Glossary of Terms Used in this Report for further definition of the terms used within this section. | |
Average Annual Total Returns as of February 28, 2019 | |
| | |
| | | Average Annual | |
| | | 1-Year | | | 5-Year | | | 10-Year | |
| NUM at Common Share NAV | | | 4.75 | % | | | 4.92 | % | | | 6.38 | % |
| NUM at Common Share Price | | | 5.54 | % | | | 4.64 | % | | | 7.98 | % |
| S&P Municipal Bond Michigan Index | | | 4.23 | % | | | 3.99 | % | | | 5.26 | % |
| S&P Municipal Bond Index | | | 4.03 | % | | | 3.45 | % | | | 4.77 | % |
Past performance is not predictive of future results. Current performance may be higher or lower than the data shown. Returns do not reflect the deduction of taxes that shareholders may have to pay on Fund distributions or upon the sale of Fund shares. Returns at NAV are net of Fund expenses, and assume reinvestment of distributions. Comparative index return information is provided for the Fund’s shares at NAV only. Indexes are not available for direct investment.
Common Share Price Performance — Weekly Closing Price
18
This data relates to the securities held in the Fund’s portfolio of investments as of the end of the reporting period. It should not be construed as a measure of performance for the Fund itself. Holdings are subject to change.
For financial reporting purposes, the ratings disclosed are the highest rating given by one of the following national rating agencies: Standard & Poor’s Group, Moody’s Investors Service, Inc. or Fitch, Inc. This treatment of split-rated securities may differ from that used for other purposes, such as for Fund investment policies. Credit ratings are subject to change. AAA, AA, A and BBB are investment grade ratings; BB, B, CCC, CC, C and D are below-investment grade ratings. Holdings designated N/R are not rated by these national rating agencies.
| | |
Fund Allocation | |
(% of net assets) | |
| Long-Term Municipal Bonds | 158.6% |
| Other Assets Less Liabilities | 1.9% |
Net Assets Plus Floating Rate | |
Obligations & AMTP Shares, | |
net of deferred offering costs | 160.5% |
| Floating Rate Obligations | (4.0)% |
| AMTP Shares, net of deferred | |
| offering costs | (56.5)% |
Net Assets | 100% |
States and Territories | |
(% of total municipal bonds) | |
| Michigan | 100.0% |
Total | 100% |
| | |
Portfolio Composition | |
(% of total investments) | |
| Education and Civic Organizations | 22.3% |
| Tax Obligation/General | 20.1% |
| Health Care | 14.7% |
| Water and Sewer | 10.8% |
| Tax Obligation/Limited | 10.4% |
| Utilities | 7.6% |
| U.S. Guaranteed | 7.5% |
| Other | 6.6% |
Total | 100% |
| | |
Portfolio Credit Quality | |
(% of total investment exposure) | |
| U.S. Guaranteed | 6.5% |
| AAA | 16.7% |
| AA | 56.7% |
| A | 15.4% |
| BBB | 0.4% |
| BB or Lower | 3.5% |
| N/R (not rated) | 0.8% |
Total | 100% |
19
| | |
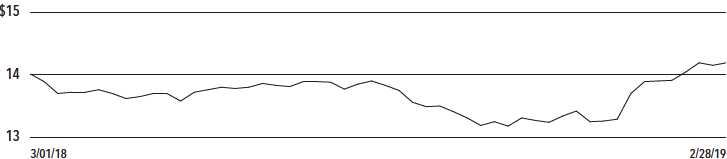
| NUO | Nuveen Ohio Quality Municipal Income Fund Performance Overview and Holding Summaries as of February 28, 2019 |
| | | | | | | | | | |
Refer to the Glossary of Terms Used in this Report for further definition of the terms used within this section. | |
Average Annual Total Returns as of February 28, 2019 | |
| | |
| | | Average Annual | |
| | | 1-Year | | | 5-Year | | | 10-Year | |
| NUO at Common Share NAV | | | 4.65 | % | | | 4.98 | % | | | 6.39 | % |
| NUO at Common Share Price | | | 5.14 | % | | | 4.45 | % | | | 6.64 | % |
| S&P Municipal Bond Ohio Index | | | 4.17 | % | | | 4.16 | % | | | 5.55 | % |
| S&P Municipal Bond Index | | | 4.03 | % | | | 3.45 | % | | | 4.77 | % |
Past performance is not predictive of future results. Current performance may be higher or lower than the data shown. Returns do not reflect the deduction of taxes that shareholders may have to pay on Fund distributions or upon the sale of Fund shares. Returns at NAV are net of Fund expenses, and assume reinvestment of distributions. Comparative index return information is provided for the Fund’s shares at NAV only. Indexes are not available for direct investment.
Common Share Price Performance — Weekly Closing Price
20
This data relates to the securities held in the Fund’s portfolio of investments as of the end of the reporting period. It should not be construed as a measure of performance for the Fund itself. Holdings are subject to change.
For financial reporting purposes, the ratings disclosed are the highest rating given by one of the following national rating agencies: Standard & Poor’s Group, Moody’s Investors Service, Inc. or Fitch, Inc. This treatment of split-rated securities may differ from that used for other purposes, such as for Fund investment policies. Credit ratings are subject to change. AAA, AA, A and BBB are investment grade ratings; BB, B, CCC, CC, C and D are below-investment grade ratings. Holdings designated N/R are not rated by these national rating agencies.
| | |
Fund Allocation | |
(% of net assets) | |
| Long-Term Municipal Bonds | 154.6% |
| Other Assets Less Liabilities | 1.7% |
Net Assets Plus Floating Rate | |
Obligations & VRDP Shares, | |
net of deferred offering costs | 156.3% |
| Floating Rate Obligations | (6.7)% |
| VRDP Shares, net of deferred | |
| offering costs | (49.6)% |
Net Assets | 100% |
States and Territories | |
(% of total municipal bonds) | |
| Ohio | 100.0% |
Total | 100% |
| | |
Portfolio Composition | |
(% of total investments) | |
| Tax Obligation/Limited | 24.3% |
| Tax Obligation/General | 14.1% |
| U.S. Guaranteed | 13.3% |
| Transportation | 12.5% |
| Health Care | 10.3% |
| Education and Civic Organizations | 9.2% |
| Water and Sewer | 7.6% |
| Other | 8.7% |
Total | 100% |
| | |
Portfolio Credit Quality | |
(% of total investment exposure) | |
| U.S. Guaranteed | 10.0% |
| AAA | 13.9% |
| AA | 51.9% |
| A | 13.4% |
| BBB | 2.3% |
| BB or Lower | 5.8% |
| N/R (not rated) | 2.7% |
Total | 100% |
21
| | |
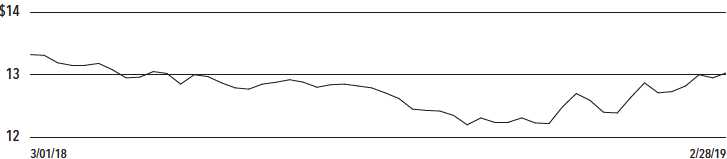
| NTX | Nuveen Texas Quality Municipal Income Fund Performance Overview and Holding Summaries as of February 28, 2019 |
| | | | | | | | | | |
Refer to the Glossary of Terms Used in this Report for further definition of the terms used within this section. | |
Average Annual Total Returns as of February 28, 2019 | |
| | |
| | | Average Annual | |
| | | 1-Year | | | 5-Year | | | 10-Year | |
| NTX at Common Share NAV | | | 4.02 | % | | | 4.44 | % | | | 6.09 | % |
| NTX at Common Share Price | | | 0.51 | % | | | 3.80 | % | | | 4.98 | % |
| S&P Municipal Bond Texas Index | | | 3.80 | % | | | 3.38 | % | | | 4.83 | % |
| S&P Municipal Bond Index | | | 4.03 | % | | | 3.45 | % | | | 4.77 | % |
Past performance is not predictive of future results. Current performance may be higher or lower than the data shown. Returns do not reflect the deduction of taxes that shareholders may have to pay on Fund distributions or upon the sale of Fund shares. Returns at NAV are net of Fund expenses, and assume reinvestment of distributions. Comparative index return information is provided for the Fund’s shares at NAV only. Indexes are not available for direct investment.
Common Share Price Performance — Weekly Closing Price
22
This data relates to the securities held in the Fund’s portfolio of investments as of the end of the reporting period. It should not be construed as a measure of performance for the Fund itself. Holdings are subject to change.
For financial reporting purposes, the ratings disclosed are the highest rating given by one of the following national rating agencies: Standard & Poor’s Group, Moody’s Investors Service, Inc. or Fitch, Inc. This treatment of split-rated securities may differ from that used for other purposes, such as for Fund investment policies. Credit ratings are subject to change. AAA, AA, A and BBB are investment grade ratings; BB, B, CCC, CC, C and D are below-investment grade ratings. Holdings designated N/R are not rated by these national rating agencies.
| | |
Fund Allocation | |
(% of net assets) | |
| Long-Term Municipal Bonds | 156.6% |
| Other Assets Less Liabilities | 2.1% |
Net Assets Plus Floating Rate | |
Obligations & MFP Shares, | |
net of deferred offering costs | 158.7% |
| Floating Rate Obligations | (10.7)% |
| MFP Shares, net of deferred | |
| offering costs | (48.0)% |
Net Assets | 100% |
States and Territories | |
(% of total municipal bonds) | |
| Texas | 100.0% |
Total | 100% |
| | |
Portfolio Composition | |
(% of total investments) | |
| Water and Sewer | 19.7% |
| Tax Obligation/Limited | 17.2% |
| Tax Obligation/General | 16.0% |
| Transportation | 14.0% |
| Utilities | 9.8% |
| U.S. Guaranteed | 9.7% |
| Education and Civic Organizations | 7.8% |
| Other | 5.8% |
Total | 100% |
| | |
Portfolio Credit Quality | |
(% of total investment exposure) | |
| U.S. Guaranteed | 8.7% |
| AAA | 27.4% |
| AA | 29.6% |
| A | 23.4% |
| BBB | 8.9% |
| BB or Lower | 1.8% |
| N/R (not rated) | 0.2% |
Total | 100% |
23
Shareholder Meeting Report
The annual meeting of shareholders was held in the offices of Nuveen on November 13, 2018 for NAZ, NUM, NUO and NTX; at this meeting the shareholders were asked to elect Board Members.
| | | | | | | |
| | | NAZ | | | NUM | |
| | Common and | | | Common and | | |
| | Preferred | | | Preferred | | |
| | shares voting | | | shares voting | | |
| | together | | Preferred | together | | Preferred |
| | as a class | | Shares | as a class | | Shares |
Approval of the Board Members was reached as follows: | | | | | | |
| Margo L. Cook | | | | | | |
| For | 10,133,644 | | — | 18,241,579 | | — |
| Withhold | 540,592 | | — | 800,948 | | — |
| Total | 10,674,236 | | — | 19,042,527 | | — |
| Jack B. Evans | | | | | | |
| For | 10,007,433 | | — | 17,916,316 | | — |
| Withhold | 666,803 | | — | 1,126,211 | | — |
| Total | 10,674,236 | | — | 19,042,527 | | — |
| Albin F. Moschner | | | | | | |
| For | 10,041,155 | | — | 18,227,155 | | — |
| Withhold | 633,081 | | — | 815,372 | | — |
| Total | 10,674,236 | | — | 19,042,527 | | — |
| William C. Hunter | | | | | | |
| For | — | | 883 | — | | 1,730 |
| Withhold | — | | — | — | | — |
| Total | — | | 883 | — | | 1,730 |
| William J. Schneider | | | | | | |
| For | — | | 883 | — | | 1,730 |
| Withhold | — | | — | — | | — |
| Total | — | | 883 | — | | 1,730 |
24
| | | | | | | |
| | | NUO | | | NTX | |
| |
| | Common and | | | Common and | | |
| | Preferred | | | Preferred | | |
| | shares voting | | | shares voting | | |
| | together | | Preferred | together | | Preferred |
| | as a class | | Shares | as a class | | Shares |
Approval of the Board Members was reached as follows: | | | | | | |
| Margo L. Cook | | | | | | |
| For | 15,823,393 | | — | 8,656,239 | | — |
| Withhold | 1,739,601 | | — | 250,714 | | — |
| Total | 17,562,994 | | — | 8,906,953 | | — |
| Jack B. Evans | | | | | | |
| For | 15,797,813 | | — | 8,747,600 | | — |
| Withhold | 1,765,181 | | — | 159,353 | | — |
| Total | 17,562,994 | | — | 8,906,953 | | — |
| Albin F. Moschner | | | | | | |
| For | 15,838,762 | | — | 8,699,545 | | — |
| Withhold | 1,724,232 | | — | 207,408 | | — |
| Total | 17,562,994 | | — | 8,906,953 | | — |
| William C. Hunter | | | | | | |
| For | — | | 1,480 | — | | 720 |
| Withhold | — | | — | — | | — |
| Total | — | | 1,480 | — | | 720 |
| William J. Schneider | | | | | | |
| For | — | | 1,480 | — | | 720 |
| Withhold | — | | — | — | | — |
| Total | — | | 1,480 | — | | 720 |
25
Report of Independent Registered Public Accounting Firm
To the Shareholders and Board of Trustees of
Nuveen Arizona Quality Municipal Income Fund
Nuveen Michigan Quality Municipal Income Fund
Nuveen Ohio Quality Municipal Income Fund
Nuveen Texas Quality Municipal Income Fund:
Opinion on the Financial Statements
We have audited the accompanying statements of assets and liabilities of Nuveen Arizona Quality Municipal Income Fund, Nuveen Michigan Quality Municipal Income Fund, Nuveen Ohio Quality Municipal Income Fund, and Nuveen Texas Quality Municipal Income Fund (the “Funds”), including the portfolios of investments, as of February 28, 2019, the related statements of operations and cash flows for the year then ended, the statements of changes in net assets for each of the years in the two year period then ended, and the related notes (collectively, the “financial statements”) and the financial highlights for each of the years in the five year period then ended. In our opinion, the financial statements and financial highlights present fairly, in all material respects, the financial position of the Funds as of February 28, 2019, the results of their operations and their cash flows for the year then ended, the changes in their net assets for each of the years in the two year period then ended, and the financial highlights for each of the years in the five year period then ended, in conformity with U.S. generally accepted accounting principles.
Basis for Opinion
These financial statements and financial highlights are the responsibility of the Funds’ management. Our responsibility is to express an opinion on these financial statements and financial highlights based on our audits. We are a public accounting firm registered with the Public Company Accounting Oversight Board (United States) (PCAOB) and are required to be independent with respect to the Funds in accordance with the U.S. federal securities laws and the applicable rules and regulations of the Securities and Exchange Commission and the PCAOB.
We conducted our audits in accordance with the standards of the PCAOB. Those standards require that we plan and perform the audit to obtain reasonable assurance about whether the financial statements and financial highlights are free of material misstatement, whether due to error or fraud. Our audits included performing procedures to assess the risks of material misstatement of the financial statements and financial highlights, whether due to error or fraud, and performing procedures that respond to those risks. Such procedures included examining, on a test basis, evidence regarding the amounts and disclosures in the financial statements and financial highlights. Such procedures also included confirmation of securities owned as of February 28, 2019, by correspondence with custodians and brokers or other appropriate auditing procedures. Our audits also included evaluating the accounting principles used and significant estimates made by management, as well as evaluating the overall presentation of the financial statements and financial highlights. We believe that our audits provide a reasonable basis for our opinion.
/s/ KPMG LLP
We have served as the auditor of one or more Nuveen investment companies since 2014.
Chicago, Illinois
April 26, 2019
26
| | |
| NAZ | Nuveen Arizona Quality Municipal Income Fund Portfolio of Investments February 28, 2019 |
| | | | | | |
Principal | | | Optional Call | | |
Amount (000) | | Description (1) | Provisions (2) | Ratings (3) | Value |
| | | LONG-TERM INVESTMENTS – 158.2% (100.0% of Total Investments) | | | |
| | | MUNICIPAL BONDS – 158.2% (100.0% of Total Investments) | | | |
| | | Education and Civic Organizations – 33.5% (21.2% of Total Investments) | | | |
| $ 2,175 | | Arizona Board of Regents, Arizona State University System Revenue Bonds, Green | 7/26 at 100.00 | AA | $ 2,440,154 |
| | | Series 2016B, 5.000%, 7/01/47 | | | |
| 1,500 | | Arizona Board of Regents, Arizona State University System Revenue Bonds, Refunding | 7/25 at 100.00 | AA | 1,691,175 |
| | | Green Series 2015A, 5.000%, 7/01/41 | | | |
| 1,500 | | Arizona Board of Regents, Arizona State University System Revenue Bonds, Series 2015D, | 7/25 at 100.00 | AA | 1,691,175 |
| | | 5.000%, 7/01/41 | | | |
| 2,515 | | Arizona Board of Regents, University of Arizona, SPEED Revenue Bonds, Stimulus Plan for | 8/24 at 100.00 | Aa3 | 2,794,970 |
| | | Economic and Educational Development, Series 2014, 5.000%, 8/01/44 | | | |
| 2,240 | | Arizona Board of Regents, University of Arizona, System Revenue Bonds, Tender Option | 6/22 at 100.00 | Aa2 | 2,944,928 |
| | | Bond Trust 2015-XF0053, 14.480%, 6/01/42, 144A (IF) | | | |
| 515 | | Arizona Industrial Development Authority, Arizona, Education Facility Revenue Bonds, Basis | 7/26 at 100.00 | BB | 532,592 |
| | | Schools, Inc. Projects, Series 2017A, 5.125%, 7/01/37, 144A | | | |
| 525 | | Arizona Industrial Development Authority, Arizona, Education Facility Revenue Bonds, Basis | 7/27 at 100.00 | AA– | 578,455 |
| | | Schools, Inc. Projects, Series 2017C, 5.000%, 7/01/47 | | | |
| 150 | | Arizona Industrial Development Authority, Arizona, Education Facility Revenue Bonds, Basis | 7/27 at 100.00 | BB | 152,440 |
| | | Schools, Inc. Projects, Series 2017D, 5.000%, 7/01/47, 144A | | | |
| | | Arizona Industrial Development Authority, Arizona, Education Facility Revenue Bonds, Basis | | | |
| | | Schools, Inc. Projects, Series 2017F: | | | |
| 1,700 | | 5.000%, 7/01/37 | 7/27 at 100.00 | AA– | 1,888,683 |
| 1,645 | | 5.000%, 7/01/47 | 7/27 at 100.00 | AA– | 1,801,324 |
| 315 | | Arizona Industrial Development Authority, Arizona, Education Facility Revenue Bonds, Basis | 7/27 at 100.00 | BB | 320,125 |
| | | Schools, Inc. Projects, Series 2017G, 5.000%, 7/01/47, 144A | | | |
| 240 | | Arizona Industrial Development Authority, Arizona, Education Facility Revenue Bonds, | 11/27 at 100.00 | N/R | 227,962 |
| | | Montessori Academy Projects, Refunding Series 2017A, 6.250%, 11/01/50, 144A | | | |
| 1,000 | | Arizona Industrial Development Authority, Arizona, Education Facility Revenue Bonds, | 9/23 at 105.00 | BB+ | 1,017,390 |
| | | Pinecrest Academy of Nevada-Sloan Canyon Project, Refunding Series 2018A, | | | |
| | | 6.000%, 9/15/38, 144A | | | |
| 375 | | Arizona Industrial Development Authority, Arizona, Education Revenue Bonds, Arizona | 9/27 at 100.00 | BB+ | 374,426 |
| | | Agribusiness and Equine Center, Inc. Project, Series 2017B, 5.000%, 3/01/48, 144A | | | |
| 380 | | Arizona Industrial Development Authority, Arizona, Education Revenue Bonds, Academies of | No Opt. Call | BB | 375,782 |
| | | Math & Science Projects, Series 2017B, 4.250%, 7/01/27, 144A | | | |
| | | Arizona Industrial Development Authority, Arizona, Education Revenue Bonds, Academies of | | | |
| | | Math & Science Projects, Series 2018A: | | | |
| 615 | | 5.000%, 7/01/38 | 1/28 at 100.00 | AA– | 684,354 |
| 1,000 | | 5.000%, 7/01/48 | 1/28 at 100.00 | AA– | 1,095,000 |
| 165 | | Arizona Industrial Development Authority, Arizona, Education Revenue Bonds, Legacy | 7/19 at 101.00 | N/R | 163,705 |
| | | Traditional School Southwest Las Vegas Nevada Campus, Series 2018, 5.250%, | | | |
| | | 7/01/22, 144A | | | |
| 455 | | Arizona Industrial Development Authority, Arizona, Education Revenue Bonds, Pinecrest | 7/26 at 100.00 | BB+ | 482,678 |
| | | Academy of Nevada ? Horizon, Inspirada, and St. Rose Campus Projects, Series 2018A, | | | |
| | | 5.750%, 7/15/38, 144A | | | |
| 1,500 | | Arizona Industrial Development Authority, Education Facility Revenue Bonds, Caurus Academy | 6/28 at 100.00 | N/R | 1,512,300 |
| | | Project, Series 2018A, 6.375%, 6/01/39, 144A | | | |
| 2,000 | | Glendale Industrial Development Authority, Arizona, Revenue Bonds, Midwestern University, | 5/22 at 100.00 | A | 2,167,620 |
| | | Refunding Series 2007, 5.000%, 5/15/31 | | | |
| 3,775 | | Glendale Industrial Development Authority, Arizona, Revenue Bonds, Midwestern University, | 5/20 at 100.00 | A+ | 3,901,311 |
| | | Refunding Series 2010, 5.125%, 5/15/40 | | | |
27
| | |
NAZ | Nuveen Arizona Quality Municipal Income Fund |
| Portfolio of Investments (continued) |
| | February 28, 2019 |
| | | | | | |
Principal | | | Optional Call | | |
Amount (000) | | Description (1) | Provisions (2) | Ratings (3) | Value |
| | | Education and Civic Organizations (continued) | | | |
| $ 870 | | Maricopa County Industrial Development Authority, Arizona, Education Revenue Bonds, | 7/26 at 100.00 | BB+ | $ 900,128 |
| | | Paradise Schools Projects, Series 2016, 5.000%, 7/01/36, 144A | | | |
| 355 | | Maricopa County Industrial Development Authority, Arizona, Education Revenue Bonds, Great | 7/27 at 100.00 | AA– | 400,149 |
| | | Hearts Academies Projects, Series 2017A, 5.000%, 7/01/37 | | | |
| 490 | | Maricopa County Industrial Development Authority, Arizona, Education Revenue Bonds, Great | | | |
| | | Hearts Academies Projects, Series 2017C, 5.000%, 7/01/48 | 7/27 at 100.00 | AA– | 542,425 |
| 2,095 | | McAllister Academic Village LLC, Arizona, Revenue Bonds, Arizona State University Hassayampa | 7/26 at 100.00 | AA– | 2,390,227 |
| | | Academic Village Project, Refunding Series 2016, 5.000%, 7/01/37 | | | |
| 1,875 | | Northern Arizona University, System Revenue Bonds, Refunding Series 2014, 5.000%, 6/01/40 | 6/24 at 100.00 | A+ | 2,095,294 |
| 910 | | Northern Arizona University, System Revenue Bonds, Series 2012, 5.000%, 6/01/41 | 6/21 at 100.00 | A+ | 963,026 |
| 70 | | Phoenix Industrial Development Authority, Arizona, Education Facility Revenue Bonds, Basis | 7/25 at 100.00 | BB | 70,942 |
| | | Schools, Inc. Projects, Series 2016A, 5.000%, 7/01/46, 144A | | | |
| 900 | | Phoenix Industrial Development Authority, Arizona, Education Facility Revenue Bonds, Choice | 9/22 at 100.00 | BB | 922,149 |
| | | Academies Charter Schools Project, Series 2012, 5.625%, 9/01/42 | | | |
| 1,400 | | Phoenix Industrial Development Authority, Arizona, Education Facility Revenue Bonds, Eagle | 7/22 at 100.00 | BB+ | 1,382,430 |
| | | College Prep Project, Series 2013A, 5.000%, 7/01/43 | | | |
| 800 | | Phoenix Industrial Development Authority, Arizona, Education Facility Revenue Bonds, Great | 7/25 at 100.00 | BBB– | 831,128 |
| | | Hearts Academies Project, Series 2016A, 5.000%, 7/01/41 | | | |
| 250 | | Phoenix Industrial Development Authority, Arizona, Education Facility Revenue Bonds, Legacy | 7/19 at 101.00 | N/R | 246,405 |
| | | Traditional Schools East Mesa and Cadence, Nevada Campuses, Series 2017A, | | | |
| | | 4.000%, 7/01/22, 144A | | | |
| 165 | | Phoenix Industrial Development Authority, Arizona, Education Facility Revenue Bonds, Legacy | 7/19 at 101.00 | N/R | 162,626 |
| | | Traditional Schools Phoenix/East Mesa and Cadence, Nevada Campuses, Series 2017B, | | | |
| | | 4.000%, 7/01/22, 144A | | | |
| 500 | | Phoenix Industrial Development Authority, Arizona, Education Facility Revenue Bonds, Legacy | 7/24 at 100.00 | Ba1 | 545,785 |
| | | Traditional Schools Project, Series 2014A, 6.750%, 7/01/44, 144A | | | |
| | | Phoenix Industrial Development Authority, Arizona, Education Facility Revenue Bonds, Legacy | | | |
| | | Traditional Schools Projects, Series 2015: | | | |
| 315 | | 5.000%, 7/01/35, 144A | 7/25 at 100.00 | Ba1 | 322,173 |
| 300 | | 5.000%, 7/01/45, 144A | 7/25 at 100.00 | Ba1 | 303,708 |
| 650 | | Phoenix Industrial Development Authority, Arizona, Education Facility Revenue Bonds, Legacy | 7/26 at 100.00 | Ba1 | 662,935 |
| | | Traditional Schools Projects, Series 2016A, 5.000%, 7/01/41, 144A | | | |
| | | Phoenix Industrial Development Authority, Arizona, Education Facility Revenue Bonds, Villa | | | |
| | | Montessori, Inc. Projects, Series 2015: | | | |
| 355 | | 3.250%, 7/01/25 | No Opt. Call | BBB– | 355,192 |
| 400 | | 5.000%, 7/01/35 | 7/25 at 100.00 | BBB– | 417,140 |
| 500 | | Phoenix Industrial Development Authority, Arizona, Education Facility Revenue Bonds, Vista | 7/28 at 100.00 | AA– | 514,910 |
| | | College Preparatory Project, Series 2018A, 4.125%, 7/01/38 | | | |
| 1,995 | | Phoenix Industrial Development Authority, Arizona, Lease Revenue Bonds, Eastern Kentucky | 10/26 at 100.00 | A2 | 2,202,221 |
| | | University Project, Series 2016, 5.000%, 10/01/36 | | | |
| 3,675 | | Phoenix Industrial Development Authority, Arizona, Lease Revenue Bonds, Rowan University | 6/22 at 100.00 | A | 3,924,018 |
| | | Project, Series 2012, 5.000%, 6/01/42 (UB) (4) | | | |
| 500 | | Pima County Community College District, Arizona, Revenue Bonds, Series 2019, 5.000%, 7/01/36 | 7/28 at 100.00 | Aa3 | 583,240 |
| 200 | | Pima County Industrial Development Authority, Arizona, Charter School Revenue Bonds, Desert | 5/24 at 100.00 | N/R | 217,006 |
| | | Heights Charter School, Series 2014, 7.250%, 5/01/44 | | | |
| | | Pima County Industrial Development Authority, Arizona, Education Facility Revenue Bonds, | | | |
| | | Champion Schools Project, Series 2017: | | | |
| 120 | | 6.000%, 6/15/37, 144A | 6/26 at 100.00 | N/R | 120,760 |
| 680 | | 6.125%, 6/15/47, 144A | 6/26 at 100.00 | N/R | 682,890 |
| 200 | | Pima County Industrial Development Authority, Arizona, Education Facility Revenue Bonds, | 7/26 at 100.00 | BB– | 176,148 |
| | | Edkey Charter Schools Project, Series 2016, 5.250%, 7/01/36 | | | |
28
| | | | | | |
Principal | | | Optional Call | | |
Amount (000) | | Description (1) | Provisions (2) | Ratings (3) | Value |
| | | Education and Civic Organizations (continued) | | | |
| $ 35 | | Pima County Industrial Development Authority, Arizona, Education Facility Revenue Bonds, | 2/24 at 100.00 | N/R | $ 35,584 |
| | | San Tan Montessori School Project, Series 2016, 6.500%, 2/01/48, 144A | | | |
| 115 | | Pima County Industrial Development Authority, Arizona, Education Facility Revenue Bonds, | 2/28 at 100.00 | N/R | 119,670 |
| | | San Tan Montessori School Project, Series 2017, 6.750%, 2/01/50, 144A | | | |
| 745 | | Pima County Industrial Development Authority, Arizona, Education Revenue Bonds, Carden | 1/22 at 100.00 | B | 668,272 |
| | | Traditional Schools Project, Series 2012, 7.500%, 1/01/42 | | | |
| 500 | | Pima County Industrial Development Authority, Arizona, Education Revenue Bonds, Noah | 6/25 at 100.00 | BB | 492,520 |
| | | Webster Schools ? Mesa Project, Series 2015A, 5.000%, 12/15/34, 144A | | | |
| 730 | | Pinal County Community College District, Arizona, Revenue Bonds, Central Arizona College, | 7/26 at 100.00 | AA | 831,806 |
| | | Series 2017, 5.000%, 7/01/35 – BAM Insured | | | |
| 780 | | Student and Academic Services LLC, Arizona, Lease Revenue Bonds, Northern Arizona | 6/24 at 100.00 | AA | 863,171 |
| | | University Project, Series 2014, 5.000%, 6/01/39 – BAM Insured | | | |
| 250 | | Sun Devil Energy LLC, Arizona, Revenue Refunding Bonds, Arizona State University Project, | No Opt. Call | AA– | 275,367 |
| | | Series 2008, 5.000%, 7/01/22 | | | |
| | | The Industrial Development Authority of the County of Maricopa, Arizona, Education | | | |
| | | Revenue Bonds, Reid Traditional School Projects, Series 2016: | | | |
| 520 | | 5.000%, 7/01/36 | 7/26 at 100.00 | Baa3 | 560,581 |
| 300 | | 5.000%, 7/01/47 | 7/26 at 100.00 | Baa3 | 317,502 |
| 50,830 | | Total Education and Civic Organizations | | | 54,938,077 |
| | | Health Care – 18.4% (11.6% of Total Investments) | | | |
| 1,200 | | Arizona Health Facilities Authority, Hospital Revenue Bonds, Banner Health Systems, | 1/24 at 100.00 | AA– | 1,299,564 |
| | | Series 2014A, 5.000%, 1/01/44 | | | |
| 5,100 | | Arizona Health Facilities Authority, Hospital System Revenue Bonds, Phoenix Children’s | 2/22 at 100.00 | A1 | 5,376,471 |
| | | Hospital, Refunding Series 2012A, 5.000%, 2/01/42 | | | |
| | | Arizona Health Facilities Authority, Revenue Bonds, Scottsdale Lincoln Hospitals Project, | | | |
| | | Refunding Series 2014A: | | | |
| 3,005 | | 5.000%, 12/01/39 | 12/24 at 100.00 | A2 | 3,275,510 |
| 2,860 | | 5.000%, 12/01/42 | 12/24 at 100.00 | A2 | 3,102,757 |
| 1,250 | | Maricopa County Industrial Development Authority, Arizona, Hospital Revenue Bonds, | 9/28 at 100.00 | A2 | 1,409,762 |
| | | HonorHealth, Series 2019A, 5.000%, 9/01/37 | | | |
| | | Maricopa County Industrial Development Authority, Arizona, Revenue Bonds, Banner Health, | | | |
| | | Refunding Series 2016A: | | | |
| 1,250 | | 5.000%, 1/01/32 | 1/27 at 100.00 | AA– | 1,450,775 |
| 1,000 | | 5.000%, 1/01/35 | 1/27 at 100.00 | AA– | 1,141,090 |
| 2,000 | | 5.000%, 1/01/38 | 1/27 at 100.00 | AA– | 2,251,960 |
| 1,120 | | Scottsdale Industrial Development Authority, Arizona, Hospital Revenue Bonds, Scottsdale | 9/20 at 100.00 | AA | 1,166,659 |
| | | Healthcare, Series 2006C. Re-offering, 5.000%, 9/01/35 – AGM Insured | | | |
| | | The Industrial Development Authority of the County of Maricopa, Arizona, Revenue Bonds, | | | |
| | | Banner Health, Series 2017A: | | | |
| 2,700 | | 4.000%, 1/01/41 | 1/28 at 100.00 | AA– | 2,780,028 |
| 2,000 | | 5.000%, 1/01/41 | 1/28 at 100.00 | AA– | 2,254,400 |
| 1,025 | | Yavapai County Industrial Development Authority, Arizona, Hospital Facility Revenue | 8/26 at 100.00 | A | 1,135,813 |
| | | Refunding Bonds, Yavapai Regional Medical Center, Series 2016, 5.000%, 8/01/36 | | | |
| | | Yavapai County Industrial Development Authority, Arizona, Hospital Revenue Bonds, Yavapai | | | |
| | | Regional Medical Center, Series 2013A: | | | |
| 210 | | 5.000%, 8/01/19 | No Opt. Call | A | 212,501 |
| 1,000 | | 5.250%, 8/01/33 | 8/23 at 100.00 | A | 1,096,800 |
| | | Yuma Industrial Development Authority, Arizona, Hospital Revenue Bonds, Yuma Regional | | | |
| | | Medical Center, Series 2014A: | | | |
| 1,000 | | 5.000%, 8/01/22 | No Opt. Call | A | 1,096,250 |
| 1,000 | | 5.250%, 8/01/32 | 8/24 at 100.00 | A | 1,135,350 |
| 27,720 | | Total Health Care | | | 30,185,690 |
29
| | |
NAZ | Nuveen Arizona Quality Municipal Income Fund |
| Portfolio of Investments (continued) |
| | February 28, 2019 |
| | | | | | |
Principal | | | Optional Call | | |
Amount (000) | | Description (1) | Provisions (2) | Ratings (3) | Value |
| | | Long-Term Care – 1.9% (1.2% of Total Investments) | | | |
| $ 285 | | Arizona Industrial Development Authority, Multifamily Housing Revenue Bonds, Bridgewater | 7/25 at 101.00 | N/R | $ 283,142 |
| | | Avondale Project, Series 2017, 5.375%, 1/01/38 | | | |
| 1,885 | | Phoenix Industrial Development Authority, Arizona, Multi-Family Housing Revenue Bonds, | 10/25 at 101.00 | N/R | 1,895,386 |
| | | 3rd and Indian Road Assisted Living Project, Series 2016, 5.400%, 10/01/36 | | | |
| 780 | | Tempe Industrial Development Authority, Arizona, Revenue Bonds, Friendship Village of | 12/21 at 100.00 | N/R | 820,490 |
| | | Tempe Project, Refunding Series 2012A, 6.000%, 12/01/32 | | | |
| 80 | | Tempe Industrial Development Authority, Arizona, Revenue Bonds, Mirabella at ASU | 10/27 at 100.00 | N/R | 86,733 |
| | | Project, Series 2017A, 6.125%, 10/01/47, 144A | | | |
| 3,030 | | Total Long-Term Care | | | 3,085,751 |
| | | Tax Obligation/General – 18.8% (11.8% of Total Investments) | | | |
| 575 | | Buckeye Union High School District 201, Maricopa County, Arizona, General Obligation Bonds, | 7/27 at 100.00 | AA | 658,024 |
| | | School Improvement Project, Refunding Series 2017, 5.000%, 7/01/35 – BAM Insured | | | |
| 835 | | Casa Grande, Arizona, General Obligation Bonds, Refunding Series 2016B, 4.000%, 8/01/34 | 8/26 at 100.00 | AAA | 889,901 |
| 525 | | Dysart Unified School District Number 89, Maricopa County, Arizona, General Obligation | | | |
| | | Bonds, Refunding Series 2014, 5.000%, 7/01/27 | 7/24 at 100.00 | AAA | 599,786 |
| 2,140 | | El Mirage, Arizona, General Obligation Bonds, Series 2012, 5.000%, 7/01/42 – AGM Insured | 7/22 at 100.00 | AA | 2,315,352 |
| 1,000 | | Maricopa County Elementary School District 83 Cartwright, Arizona, General Obligation Bonds, | 7/21 at 100.00 | AA | 1,075,400 |
| | | School Improvement, Project 2010, Series 2011A, 5.375%, 7/01/30 – AGM Insured | | | |
| 630 | | Maricopa County School District 214 Tolleson Union High, Arizona, General Obligation Bonds, | 7/27 at 100.00 | Aa1 | 728,015 |
| | | School Improvement Project 2017, Series 2018A, 5.000%, 7/01/37 | | | |
| 775 | | Maricopa County School District 79 Litchfield Elementary, Arizona, General Obligation Bonds, | 7/21 at 100.00 | Aa2 | 832,552 |
| | | Series 2011, 5.000%, 7/01/23 | | | |
| 1,500 | | Maricopa County Special Health Care District, Arizona, General Obligation Bonds, Series 2018C, | 7/28 at 100.00 | AAA | 1,737,780 |
| | | 5.000%, 7/01/36 | | | |
| 300 | | Maricopa County Unified School District 60 Higley, Arizona, General Obligation Bonds, School | 7/26 at 100.00 | AA | 322,458 |
| | | Improvement Project of 2013, Series 2016C, 4.000%, 7/01/33 – AGM Insured | | | |
| 1,350 | | Maricopa County Unified School District 95 Queen Creek, Arizona, General Obligation Bonds, | 7/25 at 102.00 | Aa2 | 1,544,954 |
| | | School Improvement Series 2018, 5.000%, 7/01/36 | | | |
| 1,275 | | Maricopa County Union High School District 210 Phoenix, Arizona, General Obligation Bonds, | 7/27 at 100.00 | AAA | 1,502,741 |
| | | School Improvement & Project of 2011 Series 2017E, 5.000%, 7/01/33 | | | |
| | | Mohave County Union High School District 2 Colorado River, Arizona, General Obligation | | | |
| | | Bonds, School Improvement Series 2017: | | | |
| 1,000 | | 5.000%, 7/01/34 | 7/27 at 100.00 | Aa3 | 1,157,610 |
| 1,000 | | 5.000%, 7/01/36 | 7/27 at 100.00 | Aa3 | 1,144,360 |
| 690 | | Northwest Fire District of Pima County, Arizona, General Obligation Bonds, Series 2017, | 7/27 at 100.00 | AA– | 800,069 |
| | | 5.000%, 7/01/36 | | | |
| 1,370 | | Pima County Continental Elementary School District 39, Arizona, General Obligation Bonds, | 7/21 at 100.00 | AA | 1,492,642 |
| | | Series 2011A, 6.000%, 7/01/30 – AGM Insured | | | |
| 2,895 | | Pima County Unified School District 12 Sunnyside, Arizona, General Obligation Bonds, | 7/24 at 100.00 | AA | 3,260,812 |
| | | School Improvement Project 2011, Series 2014D, 5.000%, 7/01/34 – AGM Insured | | | |
| 1,750 | | Pima County Unified School District 6 Marana, Arizona, General Obligation Bonds, School | 7/21 at 100.00 | A | 1,867,128 |
| | | Improvement Project 2010 Series 2011A, 5.000%, 7/01/25 | | | |
| 1,500 | | Pima County Unified School District 6 Marana, Arizona, General Obligation Bonds, School | 7/27 at 100.00 | AA | 1,733,265 |
| | | Improvement Project of 2014, Series 2017C, 5.000%, 7/01/36 – BAM Insured | | | |
| 1,000 | | Pima County Unified School District 8 Flowing Wells, Arizona, General Obligation Bonds, | 7/20 at 100.00 | A+ | 1,049,000 |
| | | School Improvement Project 2008 Series 2011B, 5.375%, 7/01/29 | | | |
| | | Pinal County School District 4 Casa Grande Elementary, Arizona, General Obligation Bonds, | | | |
| | | School improvement Project 2016, Series 2017A: | | | |
| 620 | | 5.000%, 7/01/34 – BAM Insured | 7/27 at 100.00 | AA | 717,718 |
| 1,000 | | 5.000%, 7/01/35 – BAM Insured | 7/27 at 100.00 | AA | 1,152,340 |
30
| | | | | | |
Principal | | | Optional Call | | |
Amount (000) | | Description (1) | Provisions (2) | Ratings (3) | Value |
| | | Tax Obligation/General (continued) | | | |
| $ 2,315 | | Tolleson Union High School District 214 of Maricopa County, Arizona, School Improvement Bonds, | 7/28 at 100.00 | Aa1 | $ 2,696,720 |
| | | Project of 1990, Series 1990A, 5.000%, 7/01/38 | | | |
| | | Western Maricopa Education Center District 402, Maricopa County, Arizona, General Obligation | | | |
| | | Bonds, School Improvement Project 2012, Series 2014B: | | | |
| 715 | | 4.500%, 7/01/33 | 7/24 at 100.00 | AA– | 776,211 |
| 665 | | 4.500%, 7/01/34 | 7/24 at 100.00 | AA– | 720,248 |
| 27,425 | | Total Tax Obligation/General | | | 30,775,086 |
| | | Tax Obligation/Limited – 32.0% (20.2% of Total Investments) | | | |
| 2,310 | | Arizona Sports and Tourism Authority, Tax Revenue Bonds, Multipurpose Stadium Facility Project, | | | |
| | | Refunding Senior Series 2012A, 5.000%, 7/01/36 | 7/22 at 100.00 | A1 | 2,442,386 |
| 1,250 | | Arizona State Transportation Board, Highway Revenue Bonds, Refunding Series 2016, | 7/26 at 100.00 | AA+ | 1,443,962 |
| | | 5.000%, 7/01/35 | | | |
| 275 | | Buckeye, Arizona, Excise Tax Revenue Obligations, Refunding Series 2016, 4.000%, 7/01/36 | 7/26 at 100.00 | AA | 288,615 |
| 1,000 | | Buckeye, Arizona, Excise Tax Revenue Obligations, Series 2015, 5.000%, 7/01/37 | 7/25 at 100.00 | AA | 1,135,520 |
| 135 | | Cahava Springs Revitalization District, Cave Creek, Arizona, Special Assessment Bonds, | 7/27 at 100.00 | N/R | 136,336 |
| | | Series 2017A, 7.000%, 7/01/41, 144A | | | |
| 1,210 | | Eastmark Community Facilities District 1, Mesa, Arizona, General Obligation Bonds, Series 2015, | 7/25 at 100.00 | N/R | 1,233,014 |
| | | 5.000%, 7/15/39, 144A | | | |
| 1,810 | | Eastmark Community Facilities District 1, Mesa, Arizona, General Obligation Bonds, Series 2017, | 7/27 at 100.00 | AA | 2,013,589 |
| | | 5.000%, 7/15/42 – AGM Insured | | | |
| 2,445 | | Eastmark Community Facilities District 1, Mesa, Arizona, General Obligation Bonds, Series 2018, | 7/27 at 100.00 | AA | 2,519,230 |
| | | 4.375%, 7/15/43 – BAM Insured | | | |
| 488 | | Eastmark Community Facilities District 1, Mesa, Arizona, Special Assessment Revenue Bonds, | 7/23 at 100.00 | N/R | 494,359 |
| | | Assessment District 1, Series 2013, 5.250%, 7/01/38 | | | |
| 700 | | Eastmark Community Facilities District 1, Mesa, Arizona, Special Assessment Revenue Bonds, | 7/27 at 100.00 | N/R | 704,459 |
| | | Assessment District 1, Series 2019, 5.200%, 7/01/43 | | | |
| 655 | | Estrella Mountain Ranch Community Facilities District, Goodyear, Arizona, General Obligation | 7/27 at 100.00 | AA | 740,812 |
| | | Bonds, Refunding Series 2017, 5.000%, 7/15/32 – AGM Insured | | | |
| | | Festival Ranch Community Facilities District, Buckeye, Arizona, General Obligation Bonds, | | | |
| | | Series 2012: | | | |
| 345 | | 5.000%, 7/15/27 – BAM Insured | 7/22 at 100.00 | AA | 373,000 |
| 1,085 | | 5.000%, 7/15/31 | 7/22 at 100.00 | AA | 1,168,686 |
| 500 | | Festival Ranch Community Facilities District, Buckeye, Arizona, General Obligation Bonds, | | | |
| | | Series 2016, 4.000%, 7/15/36 – BAM Insured | 7/26 at 100.00 | AA | 524,120 |
| 1,000 | | Festival Ranch Community Facilities District, Buckeye, Arizona, General Obligation Bonds, | 7/27 at 100.00 | AA | 1,123,650 |
| | | Series 2017, 5.000%, 7/15/37 – BAM Insured | | | |
| 405 | | Festival Ranch Community Facilities District, Buckeye, Arizona, Special Assessment Revenue | 7/27 at 100.00 | N/R | 409,605 |
| | | Bonds, Assessment District 11, Series 2017, 5.200%, 7/01/37 | | | |
| 590 | | Festival Ranch Community Facilities District, City of Buckeye, Arizona, General Obligation | 7/27 at 100.00 | AA | 669,473 |
| | | Bonds, Series 2018, 5.000%, 7/15/38 – BAM Insured | | | |
| 600 | | Goodyear Community Facilities Utilities District 1, Arizona, General Obligation Bonds, | 7/26 at 100.00 | A1 | 639,300 |
| | | Refunding Series 2016, 4.000%, 7/15/32 | | | |
| 1,500 | | Goodyear, Arizona, Community Facilities General District 1, Arizona, General Obligation | No Opt. Call | A– | 1,625,955 |
| | | Refunding Bonds, Series 2013, 5.000%, 7/15/23 | | | |
| 1,500 | | Government of Guam, Business Privilege Tax Bonds, Refunding Series 2015D, 5.000%, 11/15/39 | 11/25 at 100.00 | BB | 1,577,820 |
| | | Government of Guam, Business Privilege Tax Bonds, Series 2011A: | | | |
| 510 | | 5.000%, 1/01/31 | 1/22 at 100.00 | BB | 529,477 |
| 200 | | 5.125%, 1/01/42 | 1/22 at 100.00 | BB | 205,432 |
| 1,500 | | Government of Guam, Business Privilege Tax Bonds, Series 2012B-1, 5.000%, 1/01/37 | 1/22 at 100.00 | BB | 1,538,940 |
31
| | | | | | |
NAZ | | Nuveen Arizona Quality Municipal Income Fund | |
| | | Portfolio of Investments (continued) | | | |
| | | February 28, 2019 | | | |
| |
| |
Principal | | | Optional Call | | |
Amount (000) | | Description (1) | Provisions (2) | Ratings (3) | Value |
| | | Tax Obligation/Limited (continued) | | | |
| $ 1,250 | | Guam Government, Limited Obligation Section 30 Revenue Bonds, Series 2016A, | 12/26 at 100.00 | BB | $ 1,310,612 |
| | | 5.000%, 12/01/46 | | | |
| 1,425 | | Marana, Arizona, Pledged Excise Tax Revenue Bonds, Refunding Series 2013, 5.000%, 7/01/33 | 7/23 at 100.00 | AA | 1,590,471 |
| 65 | | Merrill Ranch Community Facilities District 1, Florence, Arizona, General Obligation Bonds, | 3/19 at 100.00 | BBB– | 65,209 |
| | | Series 2008A, 7.400%, 7/15/33 | | | |
| 200 | | Merrill Ranch Community Facilities District 2, Florence, Arizona, General Obligation Bonds, | 7/26 at 100.00 | BBB | 221,696 |
| | | Series 2016, 5.000%, 7/15/31 | | | |
| 385 | | Merrill Ranch Community Facilities District 2, Florence, Arizona, General Obligation Bonds, | 7/27 at 100.00 | AA | 424,478 |
| | | Series 2017, 5.000%, 7/15/42 – BAM Insured | | | |
| 300 | | Page, Arizona, Pledged Revenue Bonds, Refunding Series 2011, 5.000%, 7/01/26 | 7/21 at 100.00 | AA– | 320,856 |
| 400 | | Parkway Community Facilities District 1, Prescott Valley, Arizona, General Obligation Bonds, | 3/19 at 100.00 | N/R | 340,924 |
| | | Series 2006, 5.350%, 7/15/31 | | | |
| 2,500 | | Phoenix Industrial Development Authority, Arizona, Education Facility Revenue Bonds, | 12/22 at 100.00 | A | 2,702,575 |
| | | JMF-Higley 2012 LLC Project, Series 2012, 5.000%, 12/01/36 | | | |
| 580 | | Phoenix Mesa Gateway Airport Authority, Arizona, Special Facility Revenue Bonds, Mesa | 7/22 at 100.00 | AA+ | 620,049 |
| | | Project, Series 2012, 5.000%, 7/01/38 (AMT) | | | |
| 1,000 | | Pinal County, Arizona, Pledged Revenue Obligations, Series 2014, 5.000%, 8/01/33 | 8/24 at 100.00 | AA | 1,137,140 |
| | | Queen Creek, Arizona, Excise Tax & State Shared Revenue Obligation Bonds, Refunding | | | |
| | | Series 2016: | | | |
| 540 | | 4.000%, 8/01/34 | 8/26 at 100.00 | AA | 574,765 |
| 545 | | 4.000%, 8/01/36 | 8/26 at 100.00 | AA | 575,749 |
| 1,740 | | Queen Creek, Arizona, Excise Tax & State Shared Revenue Obligation Bonds, Series 2018A, | 8/28 at 100.00 | AA | 2,001,574 |
| | | 5.000%, 8/01/42 | | | |
| | | San Luis, Arizona, Pledged Excise Tax Revenue Bonds, Refunding Series 2014A: | | | |
| 1,400 | | 5.000%, 7/01/34 – BAM Insured | 7/24 at 100.00 | AA | 1,577,646 |
| 2,100 | | 5.000%, 7/01/38 – BAM Insured | 7/24 at 100.00 | AA | 2,350,866 |
| 3,000 | | Scottsdale Municipal Property Corporation, Arizona, Excise Tax Revenue Bonds, Refunding | No Opt. Call | AAA | 3,493,020 |
| | | Series 2006, 5.000%, 7/01/24 | | | |
| 1,320 | | Scottsdale Municipal Property Corporation, Arizona, Excise Tax Revenue Bonds, Refunding | 7/27 at 100.00 | AAA | 1,541,219 |
| | | Series 2017, 5.000%, 7/01/36 | | | |
| 1,650 | | Sundance Community Facilities District, City of Buckeye, Arizona, General Obligation Bonds, | 7/28 at 100.00 | AA | 1,898,655 |
| | | Refunding Series 2018, 5.000%, 7/15/39 – BAM Insured | | | |
| 500 | | Tempe, Arizona, Excise Tax Revenue Bonds, Refunding Series 2016, 5.000%, 7/01/29 | 7/26 at 100.00 | AAA | 590,705 |
| 2,505 | | Tempe, Arizona, Transit Excise Tax Revenue Obligation Bonds, Refunding Series 2012, | 7/22 at 100.00 | AAA | 2,738,817 |
| | | 5.000%, 7/01/37 | | | |
| 985 | | Virgin Islands Public Finance Authority, Gross Receipts Taxes Loan Note, Refunding | No Opt. Call | AA | 1,002,543 |
| | | Series 2012A, 4.000%, 10/01/22 – AGM Insured | | | |
| 750 | | Vistancia West Community Facilities District, Peoria, Arizona, General Obligation Bonds, | 7/21 at 100.00 | N/R | 736,852 |
| | | Series 2016, 3.250%, 7/15/25, 144A | | | |
| 1,224 | | Watson Road Community Facilities District, Arizona, Special Assessment Revenue Bonds, | 3/19 at 100.00 | N/R | 1,196,387 |
| | | Series 2005, 6.000%, 7/01/30 | | | |
| 48,377 | | Total Tax Obligation/Limited | | | 52,550,548 |
| | | Transportation – 7.2% (4.6% of Total Investments) | | | |
| | | Phoenix Civic Improvement Corporation, Arizona, Airport Revenue Bonds, Junior Lien | | | |
| | | Series 2015A: | | | |
| 910 | | 5.000%, 7/01/40 | 7/25 at 100.00 | A+ | 1,028,801 |
| 2,185 | | 5.000%, 7/01/45 | 7/25 at 100.00 | A+ | 2,458,081 |
32
| | | | | | |
Principal | | | Optional Call | | |
Amount (000) | | Description (1) | Provisions (2) | Ratings (3) | Value |
| | | Transportation (continued) | | | |
| | | Phoenix Civic Improvement Corporation, Arizona, Airport Revenue Bonds, Refunding Senior | | | |
| | | Lien Series 2013: | | | |
| $ 1,785 | | 5.000%, 7/01/30 (AMT) | 7/23 at 100.00 | AA– | $ 1,979,030 |
| 2,215 | | 5.000%, 7/01/32 (AMT) | 7/23 at 100.00 | AA– | 2,450,011 |
| 2,000 | | Phoenix Civic Improvement Corporation, Arizona, Airport Revenue Bonds, Senior Lien | 7/27 at 100.00 | AA– | 2,218,840 |
| | | Series 2017A, 5.000%, 7/01/47 (AMT) | | | |
| 1,500 | | Phoenix Civic Improvement Corporation, Arizona, Airport Revenue Bonds, Senior Lien | 7/28 at 100.00 | AA– | 1,686,015 |
| | | Series 2018, 5.000%, 7/01/43 (AMT) | | | |
| 10,595 | | Total Transportation | | | 11,820,778 |
| | | U.S. Guaranteed – 15.7% (9.9% of Total Investments) (5) | | | |
| 3,480 | | Arizona Board of Regents, Arizona State University System Revenue Bonds, Refunding | 7/22 at 100.00 | AA | 3,852,012 |
| | | Series 2013A, 5.000%, 7/01/43 (Pre-refunded 7/01/22) | | | |
| 1,025 | | Arizona State Transportation Board, Highway Revenue Bonds, Refunding Subordinate Series | 7/21 at 100.00 | AA+ | 1,102,982 |
| | | 2011A, 5.000%, 7/01/36 (Pre-refunded 7/01/21) | | | |
| 180 | | Phoenix Civic Improvement Corporation, Arizona, Airport Revenue Bonds, Junior Lien | 7/20 at 100.00 | A+ | 188,060 |
| | | Series 2010A, 5.000%, 7/01/40 (Pre-refunded 7/01/20) | | | |
| 585 | | Phoenix Industrial Development Authority, Arizona, Education Facility Revenue Bonds, | 7/21 at 100.00 | N/R | 646,074 |
| | | Great Hearts Academies – Veritas Project, Series 2012, 6.300%, 7/01/42 (Pre-refunded 7/01/21) | | | |
| 1,045 | | Phoenix Industrial Development Authority, Arizona, Education Facility Revenue Bonds, | 7/20 at 100.00 | N/R | 1,123,041 |
| | | Painted Rock Academy Charter School Project, Series 2012A, 7.500%, 7/01/42 | | | |
| | | (Pre-refunded 7/01/20) | | | |
| 550 | | Pima County Industrial Development Authority, Arizona, Education Revenue Bonds, Paradise | 6/19 at 100.00 | BB+ | 555,940 |
| | | Education Center Project, Series 2010, 6.100%, 6/01/45 (Pre-refunded 6/01/19) | | | |
| 1,800 | | Pinal County Electrical District 3, Arizona, Electric System Revenue Bonds, Refunding�� | 7/21 at 100.00 | A+ | 1,947,168 |
| | | Series 2011, 5.250%, 7/01/36 (Pre-refunded 7/01/21) | | | |
| 5,000 | | Scottsdale Municipal Property Corporation, Arizona, Excise Tax Revenue Bonds, Water & | 7/20 at 100.00 | AAA | 5,223,900 |
| | | Sewer Improvements Project, Series 2010, 5.000%, 7/01/36 (Pre-refunded 7/01/20) | | | |
| | | Scottsdale, Arizona, General Obligation Bonds, Preserve Acquisition, Project 2004 | | | |
| | | Series 2011: | | | |
| 1,310 | | 5.000%, 7/01/32 (Pre-refunded 7/01/21) | 7/21 at 100.00 | AAA | 1,409,665 |
| 1,360 | | 5.000%, 7/01/33 (Pre-refunded 7/01/21) | 7/21 at 100.00 | AAA | 1,463,469 |
| 1,705 | | 5.000%, 7/01/34 (Pre-refunded 7/01/21) | 7/21 at 100.00 | AAA | 1,834,716 |
| 1,495 | | Tempe, Arizona, Transit Excise Tax Revenue Obligation Bonds, Refunding Series 2012, | 7/22 at 100.00 | N/R | 1,652,259 |
| | | 5.000%, 7/01/37 (Pre-refunded 7/01/22) | | | |
| 2,585 | | University Medical Center Corporation, Tucson, Arizona, Hospital Revenue Bonds, Series | 7/21 at 100.00 | N/R | 2,834,168 |
| | | 2011, 6.000%, 7/01/39 (Pre-refunded 7/01/21) | | | |
| | | University Medical Center Corporation, Tucson, Arizona, Hospital Revenue Bonds, | | | |
| | | Series 2013: | | | |
| 200 | | 5.000%, 7/01/19 (ETM) | No Opt. Call | N/R | 202,124 |
| 800 | | 5.000%, 7/01/20 (ETM) | No Opt. Call | N/R | 834,208 |
| 825 | | Yavapai County Industrial Development Authority, Arizona, Education Revenue Bonds, | 3/21 at 100.00 | BB+ | 923,827 |
| | | Arizona Agribusiness and Equine Center, Inc. Project, Series 2011, 7.875%, 3/01/42 | | | |
| | | (Pre-refunded 3/01/21) | | | |
| 23,945 | | Total U.S. Guaranteed | | | 25,793,613 |
| | | Utilities – 20.8% (13.2% of Total Investments) | | | |
| 1,495 | | Apache County Industrial Development Authority, Arizona, Pollution Control Revenue | 3/22 at 100.00 | A– | 1,565,699 |
| | | Bonds, Tucson Electric Power Company, Series 20102A, 4.500%, 3/01/30 | | | |
| 1,100 | | Guam Power Authority, Revenue Bonds, Series 2014A, 5.000%, 10/01/39 | 10/24 at 100.00 | AA | 1,199,198 |
| 4,310 | | Maricopa County Pollution Control Corporation, Arizona, Pollution Control Revenue | 6/20 at 100.00 | A1 | 4,392,924 |
| | | Refunding Bonds, Southern California Edison Company, Series 2000A, 5.000%, 6/01/35 | | | |
33
| | | | | | |
NAZ | | Nuveen Arizona Quality Municipal Income Fund | |
| | | Portfolio of Investments (continued) | | | |
| | | February 28, 2019 | | | |
| |
| |
| |
Principal | | | Optional Call | | |
Amount (000) | | Description (1) | Provisions (2) | Ratings (3) | Value |
| | | Utilities (continued) | | | |
| $ 8,750 | | Mesa, Arizona, Utility System Revenue Bonds, Series 2018, 5.000%, 7/01/42 (UB) (4) | 7/28 at 100.00 | Aa2 | $ 10,110,625 |
| 695 | | Pinal County Electrical District 3, Arizona, Electric System Revenue Bonds, Refunding | 7/26 at 100.00 | A+ | 789,464 |
| | | Series 2016, 5.000%, 7/01/35 | | | |
| 1,500 | | Salt River Project Agricultural Improvement and Power District, Arizona, Electric System | 6/25 at 100.00 | Aa1 | 1,706,805 |
| | | Revenue Bonds, Refunding Series 2015A, 5.000%, 12/01/36 | | | |
| | | Salt Verde Financial Corporation, Arizona, Senior Gas Revenue Bonds, Citigroup Energy | | | |
| | | Inc Prepay Contract Obligations, Series 2007: | | | |
| 4,500 | | 5.500%, 12/01/29 | No Opt. Call | A3 | 5,521,770 |
| 5,665 | | 5.000%, 12/01/37 | No Opt. Call | A3 | 6,709,286 |
| 2,310 | | Yuma County Industrial Development Authority, Arizona, Exempt Revenue Bonds, Far West | 4/19 at 100.00 | N/R | 2,197,203 |
| | | Water & Sewer Inc. Refunding, Series 2007A, 6.375%, 12/01/37 (AMT) | | | |
| 30,325 | | Total Utilities | | | 34,192,974 |
| | | Water and Sewer – 9.9% (6.3% of Total Investments) | | | |
| 1,000 | | Central Arizona Water Conservation District, Arizona, Water Delivery O&M Revenue Bonds, | 1/26 at 100.00 | AA+ | 1,140,860 |
| | | Series 2016, 5.000%, 1/01/36 | | | |
| 500 | | Glendale, Arizona, Water and Sewer Revenue Bonds, Refunding Series 2012, 5.000%, 7/01/28 | 7/22 at 100.00 | AA | 549,040 |
| 785 | | Goodyear, Arizona, Water and Sewer Revenue Obligations, Refunding Subordinate Lien | 7/26 at 100.00 | AA | 878,368 |
| | | Series 2016, 5.000%, 7/01/45 – AGM Insured | | | |
| 2,855 | | Goodyear, Arizona, Water and Sewer Revenue Obligations, Series 2010, 5.625%, 7/01/39 | 7/20 at 100.00 | Aa3 | 2,994,010 |
| 500 | | Goodyear, Arizona, Water and Sewer Revenue Obligations, Subordinate Lien Series 2011, | 7/21 at 100.00 | AA | 540,895 |
| | | 5.500%, 7/01/41 | | | |
| 665 | | Guam Government Waterworks Authority, Water and Wastewater System Revenue Bonds, | 7/27 at 100.00 | A– | 727,178 |
| | | Refunding Series 2017, 5.000%, 7/01/36 | | | |
| 545 | | Guam Government Waterworks Authority, Water and Wastewater System Revenue Bonds, | 7/23 at 100.00 | A– | 584,540 |
| | | Series 2013, 5.250%, 7/01/33 | | | |
| 1,125 | | Lake Havasu City, Arizona, Wastewater System Revenue Bonds, Refunding Senior Lien | 7/25 at 100.00 | AA | 1,274,659 |
| | | Series 2015A, 5.000%, 7/01/36 – AGM Insured | | | |
| 1,135 | | Phoenix Civic Improvement Corporation, Arizona, Wastewater System Revenue Bonds, | 7/24 at 100.00 | AA+ | 1,300,381 |
| | | Refunding Junior Lien Series 2014, 5.000%, 7/01/29 | | | |
| 2,000 | | Phoenix Civic Improvement Corporation, Arizona, Water System Revenue Bonds, Junior Lien | 7/24 at 100.00 | AAA | 2,245,280 |
| | | Series 2014A, 5.000%, 7/01/39 | | | |
| | | Phoenix Civic Improvement Corporation, Arizona, Water System Revenue Bonds, Refunding | | | |
| | | Junior Lien Series 2001: | | | |
| 1,250 | | 5.500%, 7/01/21 – FGIC Insured | No Opt. Call | AAA | 1,360,287 |
| 1,040 | | 5.500%, 7/01/22 – FGIC Insured | No Opt. Call | AAA | 1,169,750 |
| | | Surprise, Arizona, Utility System Revenue Bonds, Refunding Senior Lien Series 2018: | | | |
| 500 | | 5.000%, 7/01/35 | 7/28 at 100.00 | AA+ | 591,760 |
| 805 | | 5.000%, 7/01/36 | 7/28 at 100.00 | AA+ | 949,803 |
| 14,705 | | Total Water and Sewer | | | 16,306,811 |
| $ 236,952 | | Total Long-Term Investments (cost $249,045,485) | | | 259,649,328 |
| | | Floating Rate Obligations – (5.9)% | | | (9,755,000) |
| | | Adjustable Rate MuniFund Term Preferred Shares, net of deferred offering costs – (53.7)% (6) | | | (88,143,383) |
| | | Other Assets Less Liabilities – 1.4% | | | 2,329,522 |
| | | Net Asset Applicable to Common Shares – 100% | | | $ 164,080,467 |
34
| | |
| (1) | All percentages shown in the Portfolio of Investments are based on net assets applicable to common shares unless otherwise noted. |
| (2) | Optional Call Provisions: Dates (month and year) and prices of the earliest optional call or redemption. There may be other call provisions at varying prices at later dates. Certain mortgage-backed securities may be subject to periodic principal paydowns. Optional Call Provisions are not covered by the report of independent registered public accounting firm. |
| (3) | For financial reporting purposes, the ratings disclosed are the highest of Standard & Poor’s Group (“Standard & Poor’s”), Moody’s Investors Service, Inc. (“Moody’s”) or Fitch, Inc. (“Fitch”) rating. This treatment of split-rated securities may differ from that used for other purposes, such as for Fund investment policies. Ratings below BBB by Standard & Poor’s, Baa by Moody’s or BBB by Fitch are considered to be below investment grade. Holdings designated N/R are not rated by any of these national rating agencies. Ratings are not covered by the report of independent registered public accounting firm. |
| (4) | Investment, or portion of investment, has been pledged to collateralize the net payment obligations for investments in inverse floating rate transactions. |
| (5) | Backed by an escrow or trust containing sufficient U.S. Government or U.S. Government agency securities, which ensure the timely payment of principal and interest. |
| (6) | Adjustable Rate MuniFund Term Preferred Shares, net of deferred offering costs as a percentage of Total Investments is 33.9%. |
| 144A | Investment is exempt from registration under Rule 144A of the Securities Act of 1933, as amended. These investments may only be resold in transactions exempt from registration, which are normally those transactions with qualified institutional buyers. |
| AMT | Alternative Minimum Tax. |
| ETM | Escrowed to maturity. |
| IF | Inverse floating rate security issued by a tender option bond (“TOB”) trust, the interest rate on which varies inversely with the Securities Industry Financial Markets Association (SIFMA) short-term rate, which resets weekly, or a similar short-term rate, and is reduced by the expenses related to the TOB trust. |
| UB | Underlying bond of an inverse floating rate trust reflected as a financing transaction. See Notes to Financial Statements, Note 3 – Portfolio Securities and Investments in Derivatives. Inverse Floating Rate Securities for more information. |
| | See accompanying notes to financial statements. |
35
| | |
| NUM | Nuveen Michigan Quality Municipal Income Fund Portfolio of Investments February 28, 2019 |
| | | | | | |
Principal | | | Optional Call | | |
Amount (000) | | Description (1) | Provisions (2) | Ratings (3) | Value |
| | | LONG-TERM INVESTMENTS – 158.6% (100.0% of Total Investments) | | | |
| | | MUNICIPAL BONDS – 158.6% (100.0% of Total Investments) | | | |
| | | Consumer Staples – 4.8% (3.0% of Total Investments) | | | |
| $ 6,000 | | Michigan Tobacco Settlement Finance Authority, Tobacco Settlement Asset-Backed Revenue | 2/19 at 100.00 | B– | $ 5,963,820 |
| | | Bonds, Senior Lien Series 2007A, 6.000%, 6/01/34 | | | |
| 8,650 | | Michigan Tobacco Settlement Finance Authority, Tobacco Settlement Asset-Backed Revenue | 2/19 at 100.00 | B2 | 8,651,730 |
| | | Bonds, Series 2008A, 6.875%, 6/01/42 | | | |
| 14,650 | | Total Consumer Staples | | | 14,615,550 |
| | | Education and Civic Organizations – 35.4% (22.3% of Total Investments) | | | |
| 1,220 | | Central Michigan University Board of Trustees, General Revenue Bonds, Refunding Series | 10/24 at 100.00 | Aa3 | 1,393,447 |
| | | 2014, 5.000%, 10/01/39 | | | |
| 1,000 | | Conner Creek Academy East, Michigan, Public School Revenue Bonds, Series 2007, | 3/19 at 100.00 | B | 852,000 |
| | | 5.250%, 11/01/36 | | | |
| 1,255 | | Detroit Community High School, Michigan, Public School Academy Revenue Bonds, Series | 3/19 at 100.00 | B– | 792,645 |
| | | 2005, 5.750%, 11/01/30 | | | |
| | | Eastern Michigan University, General Revenue Bonds, Refunding Series 2017A: | | | |
| 1,100 | | 5.000%, 3/01/33 – BAM Insured | 3/27 at 100.00 | AA | 1,261,271 |
| 2,270 | | 5.000%, 3/01/36 – BAM Insured | 3/27 at 100.00 | AA | 2,576,064 |
| 7,665 | | Eastern Michigan University, General Revenue Bonds, Series 2018A, 4.000%, 3/01/44 – | 3/28 at 100.00 | AA | 7,806,802 |
| | | AGM Insured | | | |
| 500 | | Grand Valley State University, Michigan, General Revenue Bonds, Refunding Series 2014B, | 12/24 at 100.00 | A+ | 575,065 |
| | | 5.000%, 12/01/28 | | | |
| | | Lake Superior State University Board of Trustees, Michigan, General Revenue Bonds, | | | |
| | | Series 2018: | | | |
| 2,395 | | 5.000%, 1/15/38 – AGM Insured | 1/28 at 100.00 | AA | 2,683,933 |
| 4,000 | | 5.000%, 1/15/43 – AGM Insured | 1/28 at 100.00 | AA | 4,432,880 |
| 3,500 | | Michigan Finance Authority, Higher Education Limited Obligation Revenue Bonds, Kalamazoo | 12/28 at 100.00 | A1 | 3,948,140 |
| | | College Project, Refunding Series 2018, 5.000%, 12/01/43 | | | |
| 990 | | Michigan Finance Authority, Public School Academy Revenue Bonds, Detroit Service | 10/21 at 100.00 | B | 937,758 |
| | | Learning Academy Project, Refunding Series 2011, 7.000%, 10/01/31 | | | |
| 1,170 | | Michigan Higher Education Facilities Authority, Limited Obligation Revenue Refunding | 3/19 at 100.00 | N/R | 1,170,538 |
| | | Bonds, Kettering University, Series 2001, 5.000%, 9/01/26 – AMBAC Insured | | | |
| 235 | | Michigan Public Educational Facilities Authority, Charter School Revenue Bonds, American | 3/19 at 100.00 | N/R | 235,014 |
| | | Montessori Academy, Series 2007, 6.500%, 12/01/37 | | | |
| 5,000 | | Michigan State University, General Revenue Bonds, Refunding Series 2010C, | 2/20 at 100.00 | AA | 5,136,200 |
| | | 5.000%, 2/15/40 | | | |
| 7,790 | | Michigan State University, General Revenue Bonds, Series 2013A, 5.000%, 8/15/41 | 8/23 at 100.00 | AA | 8,543,137 |
| 800 | | Michigan State University, General Revenue Bonds, Series 2015A, 5.000%, 8/15/27 | 8/25 at 100.00 | AA | 939,488 |
| 3,665 | | Michigan State University, General Revenue Bonds, Taxable Series 2019A, 5.000%, 2/15/48 | 2/29 at 100.00 | AA | 4,168,901 |
| 3,690 | | Michigan Technological University, General Revenue Bonds, Refunding Series 2012A, | 10/21 at 100.00 | A1 | 3,947,304 |
| | | 5.000%, 10/01/34 | | | |
| | | Northern Michigan University, General Revenue Bonds, Series 2018A: | | | |
| 400 | | 5.000%, 12/01/33 | 6/28 at 100.00 | A1 | 466,060 |
| 650 | | 5.000%, 12/01/35 | 6/28 at 100.00 | A1 | 750,880 |
| 5,400 | | Oakland University, Michigan, General Revenue Bonds, Series 2016, 5.000%, 3/01/47 | 3/26 at 100.00 | A1 | 5,901,876 |
| 810 | | Saginaw Valley State University, Michigan, General Revenue Bonds, Refunding Series | 7/26 at 100.00 | A1 | 910,999 |
| | | 2016A, 5.000%, 7/01/35 | | | |
36
| | | | | | |
Principal | | | Optional Call | | |
Amount (000) | | Description (1) | Provisions (2) | Ratings (3) | Value |
| | | Education and Civic Organizations (continued) | | | |
| | | University of Michigan, General Revenue Bonds, Refunding Series 2017A: | | | |
| $ 2,000 | | 5.000%, 4/01/34 | 4/27 at 100.00 | AAA | $ 2,351,520 |
| 2,000 | | 5.000%, 4/01/35 | 4/27 at 100.00 | AAA | 2,341,220 |
| 1,065 | | 5.000%, 4/01/36 | 4/27 at 100.00 | AAA | 1,241,726 |
| 2,000 | | 5.000%, 4/01/42 | 4/27 at 100.00 | AAA | 2,289,220 |
| 5,000 | | 5.000%, 4/01/47 | 4/27 at 100.00 | AAA | 5,711,800 |
| 7,200 | | 5.000%, 4/01/47 (UB) (4) | 4/27 at 100.00 | AAA | 8,224,992 |
| 4,000 | | University of Michigan, General Revenue Bonds, Series 2014A, 5.000%, 4/01/44 | 4/24 at 100.00 | AAA | 4,562,480 |
| | | University of Michigan, General Revenue Bonds, Series 2015: | | | |
| 5,735 | | 5.000%, 4/01/40 (UB) (4) | 4/26 at 100.00 | AAA | 6,496,149 |
| 2,400 | | 5.000%, 4/01/46 (UB) (4) | 4/26 at 100.00 | AAA | 2,705,736 |
| 3,700 | | Wayne State University, Michigan, General Revenue Bonds, Series 2013A, 5.000%, 11/15/40 | 11/23 at 100.00 | Aa3 | 4,143,334 |
| 525 | | Western Michigan University, General Revenue Bonds, Refunding Series 2011, | 11/21 at 100.00 | Aa3 | 567,289 |
| | | 5.000%, 11/15/31 | | | |
| | | Western Michigan University, General Revenue Bonds, Refunding Series 2013: | | | |
| 750 | | 5.250%, 11/15/33 – AGM Insured | 11/23 at 100.00 | AA | 852,113 |
| 4,250 | | 5.000%, 11/15/39 – AGM Insured | 11/23 at 100.00 | AA | 4,761,275 |
| | | Western Michigan University, General Revenue Bonds, Refunding Series 2015A: | | | |
| 1,500 | | 5.000%, 11/15/40 | 5/25 at 100.00 | Aa3 | 1,697,415 |
| 850 | | 5.000%, 11/15/45 | 5/25 at 100.00 | Aa3 | 959,276 |
| 98,480 | | Total Education and Civic Organizations | | | 108,335,947 |
| | | Health Care – 23.2% (14.7% of Total Investments) | | | |
| 2,000 | | County of Calhoun Hospital Finance Authority, Michigan, Hospital Revenue Bonds, Oaklawn | 2/27 at 100.00 | BBB– | 2,066,160 |
| | | Hospital, Refunding Series 2016, 5.000%, 2/15/47 | | | |
| 4,000 | | Grand Traverse County Hospital Finance Authority, Michigan, Revenue Bonds, Munson | 7/21 at 100.00 | AA– | 4,298,920 |
| | | Healthcare, Refunding Series 2011A, 5.000%, 7/01/29 | | | |
| | | Grand Traverse County Hospital Finance Authority, Michigan, Revenue Bonds, Munson | | | |
| | | Healthcare, Series 2019A: | | | |
| 1,720 | | 5.000%, 7/01/36 | 7/28 at 100.00 | AA– | 1,928,791 |
| 1,995 | | 5.000%, 7/01/39 | 7/28 at 100.00 | AA– | 2,204,734 |
| | | Kent Hospital Finance Authority, Michigan, Revenue Bonds, Spectrum Health System, | | | |
| | | Refunding Series 2011C: | | | |
| 5,500 | | 5.000%, 1/15/31 | 1/22 at 100.00 | AA | 5,872,625 |
| 2,000 | | 5.000%, 1/15/42 | 1/22 at 100.00 | AA | 2,113,900 |
| 1,780 | | Michigan Finance Authority, Hospital Revenue Bonds, Beaumont Health Credit Group, | 8/24 at 100.00 | A+ | 1,979,556 |
| | | Refunding Series 2015A, 5.000%, 8/01/32 | | | |
| 4,850 | | Michigan Finance Authority, Hospital Revenue Bonds, MidMichigan Health Credit Group, | 6/24 at 100.00 | A+ | 5,310,895 |
| | | Refunding Series 2014, 5.000%, 6/01/39 | | | |
| 3,930 | | Michigan Finance Authority, Hospital Revenue Bonds, Oakwood Obligated Group, Refunding | 8/23 at 100.00 | A+ | 4,335,458 |
| | | Series 2013, 5.000%, 8/15/31 | | | |
| 6,060 | | Michigan Finance Authority, Hospital Revenue Bonds, Sparrow Obligated Group, Refunding | 5/25 at 100.00 | A+ | 6,575,161 |
| | | Series 2015, 5.000%, 11/15/45 | | | |
| 3,000 | | Michigan Finance Authority, Hospital Revenue Bonds, Sparrow Obligated Group, Series | 11/22 at 100.00 | A+ | 3,205,530 |
| | | 2012, 5.000%, 11/15/42 | | | |
| 5,000 | | Michigan Finance Authority, Michigan, Revenue Bonds, Trinity Health Credit Group, | 6/26 at 100.00 | AA– | 5,504,850 |
| | | Refunding Series 2016MI, 5.000%, 12/01/45 | | | |
| 1,900 | | Michigan Finance Authority, Michigan, Revenue Bonds, Trinity Health Credit Group, | 6/27 at 100.00 | AA– | 2,238,200 |
| | | Refunding Series 2017MI, 5.000%, 12/01/30 | | | |
| | | Michigan Finance Authority, Revenue Bonds, Oakwood Obligated Group, Refunding | | | |
| | | Series 2012: | | | |
| 1,000 | | 5.000%, 11/01/25 | 11/22 at 100.00 | A+ | 1,106,960 |
| 1,000 | | 5.000%, 11/01/26 | 11/22 at 100.00 | A+ | 1,103,980 |
| 3,750 | | 5.000%, 11/01/42 | 11/22 at 100.00 | A+ | 4,062,638 |
37
| | | | | |
NUM | Nuveen Michigan Quality Municipal Income Fund | |
| | Portfolio of Investments (continued) February 28, 2019 | | | |
| |
| |
| |
| |
| |
Principal | | | Optional Call | | |
Amount (000) | | Description (1) | Provisions (2) | Ratings (3) | Value |
| | | Health Care (continued) | | | |
| $ 9,615 | | Michigan Finance Authority, Revenue Bonds, Trinity Health Credit Group, Refunding Series | 12/21 at 100.00 | AA– | $ 10,234,494 |
| | | 2011MI, 5.000%, 12/01/39 | | | |
| 1,000 | | Michigan State Hospital Finance Authority, Revenue Bonds, Trinity Health Care Group, | 6/22 at 100.00 | AA– | 1,064,880 |
| | | Series 2009C, 5.000%, 12/01/48 | | | |
| 5,380 | | Royal Oak Hospital Finance Authority, Michigan, Hospital Revenue Bonds, William Beaumont | 3/24 at 100.00 | A+ | 5,819,385 |
| | | Hospital Obligated Group, Refunding Series 2014D, 5.000%, 9/01/39 | | | |
| 65,480 | | Total Health Care | | | 71,027,117 |
| | | Housing/Multifamily – 2.4% (1.5% of Total Investments) | | | |
| 2,590 | | Michigan Housing Development Authority, FNMA Limited Obligation Multifamily Housing | 12/20 at 101.00 | AA | 2,719,785 |
| | | Revenue Bonds, Parkview Place Apartments, Series 2002A, 5.550%, 12/01/34 (AMT) | | | |
| 1,825 | | Michigan Housing Development Authority, Rental Housing Revenue Bonds, Series 2010A, | 10/20 at 100.00 | AA | 1,886,995 |
| | | 5.000%, 10/01/35 | | | |
| 1,725 | | Michigan Housing Development Authority, Rental Housing Revenue Bonds, Series 2012A-2, | 4/22 at 100.00 | AA | 1,764,520 |
| | | 4.625%, 10/01/41 | | | |
| 1,000 | | Michigan Housing Development Authority, Rental Housing Revenue Bonds, Series 2012D, | 4/22 at 100.00 | AA | 1,002,950 |
| | | 4.000%, 10/01/42 | | | |
| 7,140 | | Total Housing/Multifamily | | | 7,374,250 |
| | | Tax Obligation/General – 31.8% (20.1% of Total Investments) | | | |
| 2,310 | | Ann Arbor Public School District, Washtenaw County, Michigan, General Obligation Bonds, | 5/22 at 100.00 | Aa1 | 2,527,255 |
| | | Refunding Series 2012, 5.000%, 5/01/29 | | | |
| 840 | | Ann Arbor Public School District, Washtenaw County, Michigan, General Obligation Bonds, | No Opt. Call | Aa2 | 971,275 |
| | | School Building & Site Series 2015, 5.000%, 5/01/24 | | | |
| 895 | | Bloomfield Township, Michigan, General Obligation Bonds, Refunding Series 2016, | 5/26 at 100.00 | AAA | 1,058,892 |
| | | 5.000%, 5/01/28 | | | |
| 4,445 | | Byron Center Public Schools, Kent County, Michigan, General Obligation Bonds, School | 5/27 at 100.00 | AA | 4,967,154 |
| | | Building & Site Series 2017I, 5.000%, 5/01/47 | | | |
| | | Byron Center Public Schools, Kent County, Michigan, General Obligation Bonds, | | | |
| | | Series 2012: | | | |
| 1,000 | | 4.000%, 5/01/32 | 5/21 at 100.00 | AA | 1,015,290 |
| 500 | | 4.000%, 5/01/33 | 5/21 at 100.00 | AA | 506,180 |
| 1,135 | | Caledonia Community Schools, Kent, Allegan and Barry Counties, Michigan, General | 5/24 at 100.00 | AA | 1,269,600 |
| | | Obligation Bonds, School Building & Site Series 2014, 5.000%, 5/01/39 | | | |
| 875 | | Charlotte Public School District, Easton County, Michigan, General Obligation Bonds, | No Opt. Call | AA | 908,784 |
| | | Refunding Series 2012, 5.000%, 5/01/20 | | | |
| | | Grand Rapids and Kent County Joint Building Authority, Michigan, Limited Tax General | | | |
| | | Obligation Bonds, Devos Place Project, Series 2001: | | | |
| 8,900 | | 0.000%, 12/01/25 | No Opt. Call | AAA | 7,709,536 |
| 3,000 | | 0.000%, 12/01/26 | No Opt. Call | AAA | 2,518,200 |
| 100 | | 0.000%, 12/01/27 | No Opt. Call | AAA | 81,097 |
| 4,305 | | 0.000%, 12/01/29 | No Opt. Call | AAA | 3,251,566 |
| | | Grand Rapids Building Authority, Kent County, Michigan, General Obligation Bonds, | | | |
| | | Refunding Series 2011: | | | |
| 560 | | 5.000%, 10/01/28 | 10/21 at 100.00 | AA | 603,282 |
| 500 | | 5.000%, 10/01/30 | 10/21 at 100.00 | AA | 538,385 |
| 500 | | 5.000%, 10/01/31 | 10/21 at 100.00 | AA | 538,125 |
| | | Grand Rapids Public Schools, Kent County, Michigan, General Obligation Bonds, Refunding | | | |
| | | School Building & Site Series 2016: | | | |
| 1,700 | | 5.000%, 5/01/24 – AGM Insured | No Opt. Call | AA | 1,956,632 |
| 4,205 | | 5.000%, 5/01/28 – AGM Insured | 5/26 at 100.00 | AA | 4,959,755 |
| 1,000 | | 5.000%, 5/01/38 – AGM Insured | 5/26 at 100.00 | AA | 1,126,230 |
38
| | | | | | |
Principal | | | Optional Call | | |
Amount (000) | | Description (1) | Provisions (2) | Ratings (3) | Value |
| | | Tax Obligation/General (continued) | | | |
| | | Jenison Public Schools, Ottawa County, Michigan, General Obligation Bonds, Series 2017: | | | |
| $ 1,245 | | 5.000%, 5/01/29 | 5/27 at 100.00 | Aa3 | $ 1,467,668 |
| 1,265 | | 5.000%, 5/01/30 | 5/27 at 100.00 | Aa3 | 1,479,506 |
| | | Kalamazoo County, Michigan, General Obligation Bonds, Juvenile Home Facilities | | | |
| | | Series 2017: | | | |
| 300 | | 5.000%, 4/01/27 | No Opt. Call | AA+ | 361,593 |
| 1,675 | | 5.000%, 4/01/30 | 4/27 at 100.00 | AA+ | 1,982,865 |
| | | Kent County, Michigan, General Obligation Bonds, Limited Tax Capital Improvement | | | |
| | | Series 2016: | | | |
| 1,000 | | 5.000%, 6/01/31 | 6/26 at 100.00 | AAA | 1,168,390 |
| 1,445 | | 5.000%, 6/01/34 | 6/26 at 100.00 | AAA | 1,664,886 |
| 1,000 | | 5.000%, 6/01/35 | 6/26 at 100.00 | AAA | 1,150,360 |
| | | Kent County, Michigan, General Obligation Bonds, Limited Tax Capital Improvement | | | |
| | | Series 2017A: | | | |
| 1,570 | | 5.000%, 6/01/36 | 6/27 at 100.00 | AAA | 1,830,180 |
| 1,650 | | 5.000%, 6/01/37 | 6/27 at 100.00 | AAA | 1,914,165 |
| 1,025 | | Kent County, Michigan, General Obligation Bonds, Limited Tax Series 2015, | 1/25 at 100.00 | AAA | 1,172,805 |
| | | 5.000%, 1/01/34 | | | |
| 3,440 | | Kent County, Michigan, General Obligation Bonds, Refunding Limited Tax Series 2015, | 1/25 at 100.00 | AAA | 3,966,389 |
| | | 5.000%, 1/01/31 | | | |
| | | Lake Saint Claire Clean Water Drain Drainage District, Macomb County, Michigan, General | | | |
| | | Obligation Bonds, Series 2013: | | | |
| 1,000 | | 5.000%, 10/01/25 | 10/23 at 100.00 | AA+ | 1,132,090 |
| 1,020 | | 5.000%, 10/01/26 | 10/23 at 100.00 | AA+ | 1,153,304 |
| 1,000 | | L’Anse Creuse Public Schools, Macomb County, Michigan, General Obligation Bonds, | No Opt. Call | AA | 1,123,710 |
| | | Refunding Series 2015, 5.000%, 5/01/23 | | | |
| | | Lansing School District, Ingham County, Michigan, General Obligation Bonds, | | | |
| | | Series 2016I: | | | |
| 1,345 | | 5.000%, 5/01/26 | No Opt. Call | AA | 1,602,379 |
| 2,085 | | 5.000%, 5/01/38 | 5/26 at 100.00 | AA | 2,345,333 |
| 2,200 | | 5.000%, 5/01/41 | 5/26 at 100.00 | AA | 2,453,748 |
| 1,500 | | Michigan Finance Authority, Senior lien Distributable State Aid Revenue Bonds, Charter | 11/28 at 100.00 | Aa3 | 1,702,755 |
| | | County of Wayne Criminal Justice Center Project, Series 2018, 5.000%, 11/01/43 | | | |
| 4,000 | | Michigan State, General Obligation Bonds, Environmental Program, Refunding Series 2011A, | 12/21 at 100.00 | Aa1 | 4,353,080 |
| | | 5.000%, 12/01/22 | | | |
| 500 | | Michigan State, General Obligation Bonds, Environmental Program, Refunding Series 2015A, | 12/25 at 100.00 | Aa1 | 593,755 |
| | | 5.000%, 12/01/28 | | | |
| 1,000 | | Michigan State, General Obligation Bonds, Environmental Program, Series 2014A, | 12/24 at 100.00 | Aa1 | 1,167,160 |
| | | 5.000%, 12/01/28 | | | |
| 2,000 | | Montrose School District, Michigan, School Building and Site Bonds, Series 1997, 6.000%, | No Opt. Call | Aa2 | 2,134,340 |
| | | 5/01/22 – NPFG Insured | | | |
| 2,945 | | Muskegon Community College District, Michigan, General Obligation Bonds, Community | 5/24 at 100.00 | AA | 3,320,075 |
| | | Facility Series 2013I, 5.000%, 5/01/38 | | | |
| | | Muskegon County, Michigan, General Obligation Wastewater Bonds, Management System 1, | | | |
| | | Refunding Series 2015: | | | |
| 1,350 | | 5.000%, 11/01/33 | 11/25 at 100.00 | AA | 1,554,309 |
| 1,730 | | 5.000%, 11/01/36 | 11/25 at 100.00 | AA | 1,982,684 |
| | | Port Huron, Michigan, General Obligation Bonds, Limited Tax Refunding & Capital | | | |
| | | Improvement Series 2011: | | | |
| 1,585 | | 5.000%, 10/01/31 – AGM Insured | 10/21 at 100.00 | AA | 1,698,407 |
| 640 | | 5.250%, 10/01/37 – AGM Insured | 10/21 at 100.00 | AA | 689,946 |
| | | Port Huron, Michigan, General Obligation Bonds, Series 2011B: | | | |
| 530 | | 5.000%, 10/01/31 – AGM Insured | 10/21 at 100.00 | AA | 567,922 |
| 800 | | 5.250%, 10/01/40 – AGM Insured | 10/21 at 100.00 | AA | 861,808 |
39
| | | | | | |
NUM | | Nuveen Michigan Quality Municipal Income Fund | |
| | | Portfolio of Investments (continued) February 28, 2019 | | | |
| |
| |
| |
| |
| |
Principal | | | Optional Call | | |
Amount (000) | | Description (1) | Provisions (2) | Ratings (3) | Value |
| | | Tax Obligation/General (continued) | | | |
| $ 500 | | Rockford Public Schools, Kent County, Michigan, General Obligation Bonds, Refunding | No Opt. Call | AA | $ 502,720 |
| | | Series 2012, 5.000%, 5/01/19 | | | |
| 1,510 | | Royal Oak, Oakland County, Michigan, General Obligation Bonds, Taxable Limited Tax | 4/28 at 100.00 | AA+ | 1,720,056 |
| | | Series 2018, 5.000%, 4/01/43 | | | |
| 1,435 | | South Haven Public Schools, Van Buren County, Michigan, General Obligation Bonds, School | 5/24 at 100.00 | AA | 1,611,089 |
| | | Building & Site, Series 2014A, 5.000%, 5/01/41 – BAM Insured | | | |
| 550 | | Troy School District, Oakland County, Michigan, General Obligation Bonds, Refunding | 5/25 at 100.00 | AA | 643,132 |
| | | Series 2015, 5.000%, 5/01/26 | | | |
| 1,600 | | Walled Lake Consolidated School District, Oakland County, Michigan, General Obligation | 11/23 at 100.00 | Aa1 | 1,782,912 |
| | | Bonds, School Building & Site Series 2014, 5.000%, 5/01/40 | | | |
| 2,590 | | West Bloomfield School District, Oakland County, Michigan, General Obligation Bonds, | 5/27 at 100.00 | AA | 2,959,438 |
| | | School Building & Site Series 2017, 5.000%, 5/01/36 – AGM Insured | | | |
| 1,225 | | Williamston Community School District, Michigan, Unlimited Tax General Obligation QSBLF | No Opt. Call | Aa2 | 1,356,835 |
| | | Bonds, Series 1996, 5.500%, 5/01/25 – NPFG Insured | | | |
| 1,475 | | Willow Run Community Schools, Washtenaw County, Michigan, General Obligation Bonds, | 5/21 at 100.00 | AA | 1,540,298 |
| | | Refunding Series 2011, 4.500%, 5/01/31 – AGM Insured | | | |
| 90,500 | | Total Tax Obligation/General | | | 97,219,330 |
| | | Tax Obligation/Limited – 16.5% (10.4% of Total Investments) | | | |
| 4,400 | | Detroit Downtown Development Authority, Michigan, Tax Increment Revenue Bonds, Catalyst | 7/24 at 100.00 | AA | 4,717,108 |
| | | Development Project, Series 2018A, 5.000%, 7/01/48 – AGM Insured | | | |
| 2,200 | | Lansing Township Downtown Development Authority, Ingham County, Michigan, Tax Increment | 2/24 at 103.00 | N/R | 2,373,250 |
| | | Bonds, Series 2013A, 5.950%, 2/01/42 | | | |
| | | Michigan Finance Authority, Local Government Loan Program Revenue Bonds, Detroit | | | |
| | | Regional Convention Facility Authority Local Project, Series 2014H-1: | | | |
| 1,240 | | 5.000%, 10/01/20 | 10/19 at 100.00 | AA– | 1,262,295 |
| 2,000 | | 5.000%, 10/01/24 | 10/23 at 100.00 | AA– | 2,254,840 |
| 2,000 | | 5.000%, 10/01/25 | 10/24 at 100.00 | AA– | 2,296,760 |
| 11,025 | | 5.000%, 10/01/39 | 10/24 at 100.00 | AA– | 12,347,008 |
| 2,000 | | Michigan State Building Authority, Revenue Bonds, Facilities Program, Refunding Series | 10/21 at 100.00 | Aa2 | 2,164,680 |
| | | 2011-I-A, 5.375%, 10/15/41 | | | |
| 1,845 | | Michigan State Building Authority, Revenue Bonds, Facilities Program, Refunding Series | 10/23 at 100.00 | Aa2 | 2,073,134 |
| | | 2013-I-A, 5.000%, 10/15/29 | | | |
| 4,000 | | Michigan State Building Authority, Revenue Bonds, Facilities Program, Refunding Series | 10/25 at 100.00 | Aa2 | 4,573,480 |
| | | 2015-I, 5.000%, 4/15/38 | | | |
| | | Michigan State Building Authority, Revenue Bonds, Facilities Program, Refunding | | | |
| | | Series 2016-I: | | | |
| 1,500 | | 5.000%, 4/15/41 | 10/26 at 100.00 | Aa2 | 1,683,975 |
| 2,500 | | 5.000%, 10/15/46 | 10/26 at 100.00 | Aa2 | 2,779,450 |
| | | Michigan State Trunk Line Fund Bonds, Series 2011: | | | |
| 1,100 | | 5.000%, 11/15/24 | 11/21 at 100.00 | AA+ | 1,196,789 |
| 1,750 | | 5.000%, 11/15/29 | 11/21 at 100.00 | AA+ | 1,893,850 |
| 1,605 | | 5.000%, 11/15/31 | 11/21 at 100.00 | AA+ | 1,735,166 |
| 1,160 | | 4.000%, 11/15/32 | 11/21 at 100.00 | AA+ | 1,193,396 |
| 1,970 | | 5.000%, 11/15/36 | 11/21 at 100.00 | AA+ | 2,120,055 |
| 1,370 | | Michigan State Trunk Line Fund Refunding Bonds, Refunding Series 2015, 5.000%, 11/15/22 | No Opt. Call | AA+ | 1,535,167 |
| 1,950 | | Michigan State, Comprehensive Transportation Revenue Bonds, Refunding Series 2015, | 11/24 at 100.00 | AA+ | 2,270,463 |
| | | 5.000%, 11/15/29 | | | |
| 45,615 | | Total Tax Obligation/Limited | | | 50,470,866 |
40
| | | | | | |
Principal | | | Optional Call | | |
Amount (000) | | Description (1) | Provisions (2) | Ratings (3) | Value |
| | | Transportation – 3.4% (2.1% of Total Investments) | | | |
| $ 4,500 | | Wayne County Airport Authority, Michigan, Revenue Bonds, Detroit Metropolitan Airport, | No Opt. Call | A | $ 4,853,205 |
| | | Refunding Series 2011A, 5.000%, 12/01/21 (AMT) | | | |
| 1,000 | | Wayne County Airport Authority, Michigan, Revenue Bonds, Detroit Metropolitan Wayne | 12/27 at 100.00 | A | 1,123,190 |
| | | County Airport, Senior Series 2017A, 5.000%, 12/01/42 | | | |
| 4,000 | | Wayne County Airport Authority, Michigan, Revenue Bonds, Detroit Metropolitan Wayne | 12/22 at 100.00 | AA | 4,385,400 |
| | | County Airport, Series 2012A, 5.000%, 12/01/42 – AGM Insured | | | |
| 9,500 | | Total Transportation | | | 10,361,795 |
| | | U.S. Guaranteed – 11.9% (7.5% of Total Investments) (5) | | | |
| | | Comstock Park Public Schools, Kent County, Michigan, General Obligation Bonds, School | | | |
| | | Building & Site, Series 2011B: | | | |
| 1,200 | | 5.500%, 5/01/36 (Pre-refunded 5/01/21) | 5/21 at 100.00 | AA | 1,297,536 |
| 2,190 | | 5.500%, 5/01/41 (Pre-refunded 5/01/21) | 5/21 at 100.00 | AA | 2,368,003 |
| 1,800 | | Jackson County Hospital Finance Authority, Michigan, Hospital Revenue Bonds, Allegiance | 6/20 at 100.00 | AA | 1,873,314 |
| | | Health, Refunding Series 2010A, 5.000%, 6/01/37 (Pre-refunded 6/01/20) – AGM Insured | | | |
| 5,505 | | Michigan Finance Authority, Hospital Revenue Bonds, Crittenton Hospital Medical Center, | 6/22 at 100.00 | N/R | 6,069,978 |
| | | Refunding Series 2012A, 5.000%, 6/01/39 (Pre-refunded 6/01/22) | | | |
| 35 | | Michigan Finance Authority, Revenue Bonds, Trinity Health Credit Group, Refunding Series | 12/21 at 100.00 | N/R | 38,080 |
| | | 2011MI, 5.000%, 12/01/39 (Pre-refunded 12/01/21) | | | |
| | | Michigan Finance Authority, State Revolving Fund Revenue Bonds, Clean Water Series 2012: | | | |
| 2,000 | | 5.000%, 10/01/31 (Pre-refunded 10/01/22) | 10/22 at 100.00 | AAA | 2,229,440 |
| 1,135 | | 5.000%, 10/01/32 (Pre-refunded 10/01/22) | 10/22 at 100.00 | AAA | 1,265,207 |
| | | Michigan Municipal Bond Authority, Clean Water Revolving Fund Revenue Bonds, | | | |
| | | Series 2010: | | | |
| 390 | | 5.000%, 10/01/26 (Pre-refunded 10/01/20) | 10/20 at 100.00 | AAA | 410,413 |
| 475 | | 5.000%, 10/01/30 (Pre-refunded 10/01/20) | 10/20 at 100.00 | AAA | 499,862 |
| | | Michigan State Hospital Finance Authority, Hospital Revenue Bonds, Henry Ford Health | | | |
| | | System, Refunding Series 2009: | | | |
| 150 | | 5.000%, 11/15/20 (Pre-refunded 11/15/19) | 11/19 at 100.00 | N/R | 153,465 |
| 7,300 | | 5.750%, 11/15/39 (Pre-refunded 11/15/19) | 11/19 at 100.00 | N/R | 7,506,444 |
| 4,000 | | Michigan State Hospital Finance Authority, Hospital Revenue Bonds,MidMichigan Obligated | 6/19 at 100.00 | AA+ | 4,041,520 |
| | | Group, Series 2009A, 5.875%, 6/01/39 (Pre-refunded 6/01/19) – AGC Insured | | | |
| 3,415 | | Michigan State Hospital Finance Authority, Hospital Revenue Refunding Bonds, St. John’s | No Opt. Call | Aaa | 3,642,439 |
| | | Health System, Series 1998A, 5.000%, 5/15/28 – AMBAC Insured (ETM) | | | |
| 1,000 | | Michigan State, General Obligation Bonds, Environmental Program, Series 2009A, 5.500%, | 5/19 at 100.00 | Aa1 | 1,006,240 |
| | | 11/01/25 (Pre-refunded 5/01/19) | | | |
| 3,640 | | Royal Oak Hospital Finance Authority, Michigan, Hospital Revenue Bonds, William Beaumont | 8/19 at 100.00 | N/R | 3,703,773 |
| | | Hospital Obligated Group, Refunding Series 2009W, 6.000%, 8/01/39 (Pre-refunded 8/01/19) | | | |
| 350 | | South Haven, Van Buren County, Michigan, General Obligation Bonds, Capital Improvement | 12/19 at 100.00 | AA | 359,184 |
| | | Series 2009, 5.125%, 12/01/33 (Pre-refunded 12/01/19) – AGC Insured | | | |
| 34,585 | | Total U.S. Guaranteed | | | 36,464,898 |
| | | Utilities – 12.0% (7.6% of Total Investments) | | | |
| | | Holland, Michigan, Electric Utility System Revenue Bonds, Series 2014A: | | | |
| 2,750 | | 5.000%, 7/01/33 | 7/21 at 100.00 | AA | 2,934,057 |
| 6,020 | | 5.000%, 7/01/39 | 7/21 at 100.00 | AA | 6,411,601 |
| | | Lansing Board of Water and Light, Michigan, Utility System Revenue Bonds, Tender Option | | | |
| | | Bond Trust 2016-XF0394: | | | |
| 1,110 | | 14.805%, 7/01/37, 144A (IF) (4) | 7/21 at 100.00 | AA– | 1,394,637 |
| 1,700 | | 14.805%, 7/01/37, 144A (IF) (4) | 7/21 at 100.00 | AA– | 2,135,931 |
| | | Marquette, Michigan, Electric Utility System Revenue Bonds, Refunding Series 2016A: | | | |
| 1,000 | | 5.000%, 7/01/30 | 7/26 at 100.00 | A | 1,147,020 |
| 1,000 | | 5.000%, 7/01/31 | 7/26 at 100.00 | A | 1,139,520 |
| 75 | | 5.000%, 7/01/32 | 7/26 at 100.00 | A | 85,117 |
| 1,000 | | 5.000%, 7/01/33 | 7/26 at 100.00 | A | 1,129,930 |
41
| | | | | | |
NUM | | Nuveen Michigan Quality Municipal Income Fund | |
| | | Portfolio of Investments (continued) February 28, 2019 | | | |
| |
| |
| |
| |
| |
Principal | | | Optional Call | | |
Amount (000) | | Description (1) | Provisions (2) | Ratings (3) | Value |
| | | Utilities (continued) | | | |
| | | Michigan Public Power Agency, AFEC Project Revenue Bonds, Series 2012A: | | | |
| $ 1,900 | | 5.000%, 1/01/27 | 1/22 at 100.00 | A2 | $ 2,020,099 |
| 4,530 | | 5.000%, 1/01/43 | 1/22 at 100.00 | A2 | 4,748,210 |
| | | Michigan Public Power Agency, Revenue Bonds, Combustion Turbine 1 Project, Refunding | | | |
| | | Series 2011: | | | |
| 1,760 | | 5.000%, 1/01/24 – AGM Insured | 1/21 at 100.00 | AA | 1,849,848 |
| 1,990 | | 5.000%, 1/01/25 – AGM Insured | 1/21 at 100.00 | AA | 2,091,590 |
| 2,180 | | 5.000%, 1/01/26 – AGM Insured | 1/21 at 100.00 | AA | 2,291,289 |
| 290 | | 5.000%, 1/01/27 – AGM Insured | 1/21 at 100.00 | AA | 304,805 |
| 3,640 | | Michigan Strategic Fund, Limited Obligation Revenue Refunding Bonds, Detroit Edison | No Opt. Call | Aa3 | 4,009,824 |
| | | Company, Series 1991BB, 7.000%, 5/01/21 – AMBAC Insured | | | |
| 2,700 | | Wyandotte, Michigan, Electric Revenue Bonds, Refunding Series 2015A, 5.000%, 10/01/44 – | 10/25 at 100.00 | AA | 2,975,643 |
| | | BAM Insured | | | |
| 33,645 | | Total Utilities | | | 36,669,121 |
| | | Water and Sewer – 17.2% (10.8% of Total Investments) | | | |
| 15 | | Detroit, Michigan, Water Supply System Revenue Bonds, Refunding Second Lien Series | 3/19 at 100.00 | AA | 15,039 |
| | | 2004A, 5.000%, 7/01/34 – AGM Insured | | | |
| 1,700 | | Downriver Utility Wastewater Authority, Michigan, Sewer System Revenue Bonds, Series | 4/28 at 100.00 | AA | 1,887,034 |
| | | 2018, 5.000%, 4/01/43 – AGM Insured | | | |
| | | Grand Rapids, Michigan, Sanitary Sewer System Revenue Bonds, Improvement & Refunding | | | |
| | | Series 2014: | | | |
| 1,000 | | 5.000%, 1/01/32 | 1/24 at 100.00 | Aa1 | 1,134,780 |
| 1,000 | | 5.000%, 1/01/33 | 1/24 at 100.00 | Aa1 | 1,133,310 |
| 1,000 | | 5.000%, 1/01/34 | 1/24 at 100.00 | Aa1 | 1,131,340 |
| 1,855 | | 5.000%, 1/01/44 | 1/24 at 100.00 | Aa1 | 2,090,474 |
| | | Grand Rapids, Michigan, Sanitary Sewer System Revenue Bonds, Series 2018: | | | |
| 2,500 | | 5.000%, 1/01/43 | 1/28 at 100.00 | Aa1 | 2,844,825 |
| 1,055 | | 5.000%, 1/01/48 | 1/28 at 100.00 | Aa1 | 1,192,108 |
| 1,005 | | Great Lakes Water Authority, Michigan, Sewer Disposal System Revenue Bonds, Refunding | 7/26 at 100.00 | A | 1,146,253 |
| | | Second Lien Series 2016C, 5.000%, 7/01/32 | | | |
| 6,245 | | Great Lakes Water Authority, Michigan, Water Supply Revenue Bonds, Refunding Senior Lien | 7/26 at 100.00 | AA– | 7,202,983 |
| | | Series 2016C, 5.000%, 7/01/32 | | | |
| 5,000 | | Michigan Finance Authority, Clean Water Revolving Fund Revenue Bonds, Refunding Series | No Opt. Call | AAA | 5,983,850 |
| | | 2016B, 5.000%, 10/01/25 | | | |
| | | Michigan Finance Authority, Local Government Loan Program Revenue Bonds, Detroit Water & | | | |
| | | Sewerage Department Sewage Disposal System Local Project, Second Lien Series 2015C: | | | |
| 4,665 | | 5.000%, 7/01/34 | 7/25 at 100.00 | A | 5,187,713 |
| 1,070 | | 5.000%, 7/01/35 | 7/25 at 100.00 | A | 1,186,266 |
| | | Michigan Finance Authority, Local Government Loan Program Revenue Bonds, Detroit Water & | | | |
| | | Sewerage Department Water Supply System Local Project, Refunding Senior Loan Series 2014D-1: | | | |
| 1,500 | | 5.000%, 7/01/35 – AGM Insured | 7/24 at 100.00 | AA | 1,658,670 |
| 1,220 | | 5.000%, 7/01/37 – AGM Insured | 7/24 at 100.00 | AA | 1,342,744 |
| 3,340 | | Michigan Finance Authority, Local Government Loan Program Revenue Bonds, Detroit Water & | 7/24 at 100.00 | AA | 3,789,631 |
| | | Sewerage Department Water Supply System Local Project, Series 2014D-2, 5.000%, 7/01/27 – | | | |
| | | AGM Insured | | | |
| | | Michigan Finance Authority, State Revolving Fund Revenue Bonds, Clean Water Subordinate | | | |
| | | Refunding Series 2013: | | | |
| 1,955 | | 5.000%, 10/01/22 | No Opt. Call | AAA | 2,185,494 |
| 3,200 | | 5.000%, 10/01/25 | 10/22 at 100.00 | AAA | 3,568,992 |
| 2,000 | | Michigan Finance Authority, State Revolving Fund Revenue Bonds, Clean Water, Refunding | No Opt. Call | AAA | 2,106,600 |
| | | Series 2012, 5.000%, 10/01/20 | | | |
| 580 | | Michigan Municipal Bond Authority, Clean Water Revolving Fund Revenue Bonds, Series | 3/19 at 100.00 | AAA | 581,531 |
| | | 2004, 5.000%, 10/01/19 | | | |
42
| | | | | | |
Principal | | | Optional Call | | |
Amount (000) | | Description (1) | Provisions (2) | Ratings (3) | Value |
| | | Water and Sewer (continued) | | | |
| $ 170 | | Michigan Municipal Bond Authority, Clean Water Revolving Fund Revenue Bonds, Series | 3/19 at 100.00 | AAA | $ 170,449 |
| | | 2005, 5.000%, 10/01/19 | | | |
| 90 | | Michigan Municipal Bond Authority, Drinking Water Revolving Fund Revenue Bonds, Series | 3/19 at 100.00 | AAA | 90,226 |
| | | 2004, 5.000%, 10/01/23 | | | |
| 1,000 | | North Kent Sewer Authority, Michigan, Sewer Revenue Bonds, Refunding Series 2016, | No Opt. Call | AA | 1,153,590 |
| | | 5.000%, 11/01/24 | | | |
| | | Port Huron, Michigan, Water Supply System Revenue Bonds, Series 2011: | | | |
| 500 | | 5.250%, 10/01/31 | 10/21 at 100.00 | A– | 538,110 |
| 1,500 | | 5.625%, 10/01/40 | 10/21 at 100.00 | A– | 1,635,825 |
| | | Wyoming, Michigan, Water Supply System Revenue Bonds, Refunding Series 2016: | | | |
| 210 | | 5.000%, 6/01/26 | No Opt. Call | Aa3 | 248,455 |
| 505 | | 5.000%, 6/01/27 | 6/26 at 100.00 | Aa3 | 592,057 |
| 550 | | 5.000%, 6/01/28 | 6/26 at 100.00 | Aa3 | 639,441 |
| 46,430 | | Total Water and Sewer | | | 52,437,790 |
| $ 446,025 | | Total Long-Term Investments (cost $464,144,323) | | | 484,976,664 |
| | | Floating Rate Obligations – (4.0)% | | | (12,265,000) |
| | | Adjustable Rate MuniFund Term Preferred Shares, net of deferred offering costs – (56.5)% (6) | | | (172,804,230) |
| | | Other Assets Less Liabilities – 1.9% | | | 5,837,165 |
| | | Net Asset Applicable to Common Shares – 100% | | | $ 305,744,599 |
| | |
| (1) | All percentages shown in the Portfolio of Investments are based on net assets applicable to common shares unless otherwise noted. |
| (2) | Optional Call Provisions: Dates (month and year) and prices of the earliest optional call or redemption. There may be other call provisions at varying prices at later dates. Certain mortgage-backed securities may be subject to periodic principal paydowns. Optional Call Provisions are not covered by the report of independent registered public accounting firm. |
| (3) | For financial reporting purposes, the ratings disclosed are the highest of Standard & Poor’s Group (“Standard & Poor’s”), Moody’s Investors Service, Inc. (“Moody’s”) or Fitch, Inc. (“Fitch”) rating. This treatment of split-rated securities may differ from that used for other purposes, such as for Fund investment policies. Ratings below BBB by Standard & Poor’s, Baa by Moody’s or BBB by Fitch are considered to be below investment grade. Holdings designated N/R are not rated by any of these national rating agencies. Ratings are not covered by the report of independent registered public accounting firm. |
| (4) | Investment, or portion of investment, has been pledged to collateralize the net payment obligations for investments in inverse floating rate transactions. |
| (5) | Backed by an escrow or trust containing sufficient U.S. Government or U.S. Government agency securities, which ensure the timely payment of principal and interest. |
| (6) | Adjustable Rate MuniFund Term Preferred Shares, net of deferred offering costs as a percentage of Total Investments is 35.6%. |
| 144A | Investment is exempt from registration under Rule 144A of the Securities Act of 1933, as amended. These investments may only be resold in transactions exempt from registration, which are normally those transactions with qualified institutional buyers. |
| AMT | Alternative Minimum Tax. |
| ETM | Escrowed to maturity. |
| IF | Inverse floating rate security issued by a tender option bond (“TOB”) trust, the interest rate on which varies inversely with the Securities Industry Financial Markets Association (SIFMA) short-term rate, which resets weekly, or a similar short-term rate, and is reduced by the expenses related to the TOB trust. |
| UB | Underlying bond of an inverse floating rate trust reflected as a financing transaction. See Notes to Financial Statements, Note 3 – Portfolio Securities and Investments in Derivatives. Inverse Floating Rate Securities for more information. |
| | See accompanying notes to financial statements. |
43
| | |
| NUO | Nuveen Ohio Quality Municipal Income Fund Portfolio of Investments February 28, 2019 |
| | | | | | |
Principal | | | Optional Call | | |
Amount (000) | | Description (1) | Provisions (2) | Ratings (3) | Value |
| | | LONG-TERM INVESTMENTS – 154.6% (100.0% of Total Investments) | | | |
| | | MUNICIPAL BONDS – 154.6% (100.0% of Total Investments) | | | |
| | | Consumer Staples – 4.1% (2.7% of Total Investments) | | | |
| $ 13,120 | | Buckeye Tobacco Settlement Financing Authority, Ohio, Tobacco Settlement Asset-Backed | 2/19 at 100.00 | B– | $ 12,316,400 |
| | | Revenue Bonds, Senior Lien, Series 2007A-2, 5.875%, 6/01/47 | | | |
| | | Education and Civic Organizations – 14.2% (9.2% of Total Investments) | | | |
| | | Lorain County Community College District, Ohio, General Receipts Revenue Bonds, | | | |
| | | Refunding Series 2017: | | | |
| 1,305 | | 5.000%, 12/01/32 | 6/27 at 100.00 | Aa2 | 1,512,430 |
| 1,200 | | 5.000%, 12/01/33 | 6/27 at 100.00 | Aa2 | 1,386,816 |
| 505 | | 5.000%, 12/01/34 | 6/27 at 100.00 | Aa2 | 581,775 |
| | | Miami University of Ohio, General Receipts Bonds, Refunding Series 2014: | | | |
| 4,375 | | 5.000%, 9/01/33 | 9/24 at 100.00 | AA | 4,929,444 |
| 2,500 | | 4.000%, 9/01/39 | 9/24 at 100.00 | AA | 2,585,225 |
| 2,585 | | Miami University of Ohio, General Receipts Bonds, Refunding Series 2017, 5.000%, 9/01/41 | 9/26 at 100.00 | AA | 2,912,080 |
| | | Miami University of Ohio, General Receipts Bonds, Series 2011: | | | |
| 130 | | 5.000%, 9/01/33 | 9/21 at 100.00 | AA | 138,980 |
| 1,960 | | 5.000%, 9/01/36 | 9/21 at 100.00 | AA | 2,092,437 |
| | | Miami University of Ohio, General Receipts Bonds, Series 2012: | | | |
| 480 | | 4.000%, 9/01/32 | 9/22 at 100.00 | AA | 500,510 |
| 1,000 | | 4.000%, 9/01/33 | 9/22 at 100.00 | AA | 1,038,980 |
| | | Ohio Higher Educational Facilities Commission, Revenue Bonds, Denison University | | | |
| | | Project, Series 2012: | | | |
| 120 | | 5.000%, 11/01/27 | 5/22 at 100.00 | AA | 131,016 |
| 590 | | 5.000%, 11/01/32 | 5/22 at 100.00 | AA | 640,575 |
| 5,000 | | Ohio Higher Educational Facilities Commission, Revenue Bonds, University of Dayton, | 12/22 at 100.00 | A+ | 5,423,700 |
| | | Refunding Series 2013, 5.000%, 12/01/43 | | | |
| 1,000 | | Ohio University at Athens, General Receipts Bonds, Series 2013, 5.000%, 12/01/39 | 12/22 at 100.00 | Aa3 | 1,091,090 |
| 1,000 | | Tuscarawas County Economic Development and Finance Alliance, Ohio, Higher Education | 3/25 at 100.00 | N/R | 1,006,480 |
| | | Facilities Revenue Bonds, Ashland University, Refunding & Improvement Series 2015, | | | |
| | | 6.000%, 3/01/45 | | | |
| 1,000 | | University of Cincinnati, Ohio, General Receipts Bonds, Green Bond Series 2014C, | 12/24 at 100.00 | AA– | 1,127,110 |
| | | 5.000%, 6/01/41 | | | |
| 3,175 | | University of Cincinnati, Ohio, General Receipts Bonds, Series 2016C, 5.000%, 6/01/46 | 6/26 at 100.00 | AA– | 3,532,823 |
| 7,580 | | Wright State University, Ohio, General Receipts Bonds, Series 2011A, 5.000%, 5/01/31 – | 5/21 at 100.00 | AA | 8,033,815 |
| | | BAM Insured | | | |
| | | Youngstown State University, Ohio, General Receipts Bonds, Refunding Series 2017: | | | |
| 1,555 | | 5.000%, 12/15/29 | 12/26 at 100.00 | A+ | 1,814,607 |
| 1,670 | | 5.000%, 12/15/30 | 12/26 at 100.00 | A+ | 1,933,910 |
| 38,730 | | Total Education and Civic Organizations | | | 42,413,803 |
| | | Health Care – 15.9% (10.3% of Total Investments) | | | |
| 3,000 | | Akron, Bath and Copley Joint Township Hospital District, Ohio, Hospital Revenue Bonds, | 5/23 at 100.00 | AA– | 3,252,060 |
| | | Children’s Hospital Medical Center, Improvement Series 2013, 5.000%, 11/15/38 | | | |
| | | Chillicothe, Ohio, Hospital Facilities Revenue Bonds, Adena Health System Obligated | | | |
| | | Group Project, Refunding & Improvement Series 2017: | | | |
| 2,250 | | 5.000%, 12/01/37 | 12/27 at 100.00 | A– | 2,483,505 |
| 1,000 | | 5.000%, 12/01/47 | 12/27 at 100.00 | A– | 1,084,650 |
| 2,400 | | Fairfield County, Ohio, Hospital Facilities Revenue Bonds, Fairfield Medical Center | 6/23 at 100.00 | Baa3 | 2,441,112 |
| | | Project, Series 2013, 5.000%, 6/15/43 | | | |
44
| | | | | | |
Principal | | | Optional Call | | |
Amount (000) | | Description (1) | Provisions (2) | Ratings (3) | Value |
| | | Health Care (continued) | | | |
| $ 250 | | Franklin County, Ohio, Hospital Revenue Bonds, OhioHealth Corporation, Series 2011A, | 11/21 at 100.00 | AA+ | $ 267,005 |
| | | 5.000%, 11/15/41 | | | |
| 4,480 | | Franklin County, Ohio, Hospital Revenue Bonds, OhioHealth Corporation, Tender Option | 11/21 at 100.00 | AA+ | 5,089,414 |
| | | Bond Trust 2016-XL0004, 8.210%, 11/15/41, 144A (IF) (4) | | | |
| 1,730 | | Franklin County, Ohio, Revenue Bonds, Trinity Health Credit Group, Series 2017A, | 12/27 at 100.00 | AA– | 1,929,469 |
| | | 5.000%, 12/01/47 | | | |
| 300 | | Lake County, Ohio, Hospital Facilities Revenue Bonds, Lake Hospital System, Inc., | 3/19 at 100.00 | A– | 300,930 |
| | | Refunding Series 2008C, 6.000%, 8/15/43 | | | |
| 820 | | Middleburg Heights, Ohio, Hospital Facilities Revenue Bonds, Southwest General Health | 8/21 at 100.00 | A2 | 875,391 |
| | | Center Project, Refunding Series 2011, 5.250%, 8/01/41 | | | |
| | | Montgomery County, Ohio, Revenue Bonds, Catholic Health Initiatives, Series 2004A: | | | |
| 2,575 | | 5.000%, 5/01/30 | 3/19 at 100.00 | BBB+ | 2,602,733 |
| 2,040 | | 5.000%, 5/01/32 | 3/19 at 100.00 | BBB+ | 2,061,420 |
| 6,105 | | Muskingum County, Ohio, Hospital Facilities Revenue Bonds, Genesis HealthCare System | 2/23 at 100.00 | BB+ | 6,241,813 |
| | | Obligated Group Project, Series 2013, 5.000%, 2/15/44 | | | |
| 1,100 | | Ohio State Higher Educational Facilities Commission, Hospital Revenue Bonds, Cleveland | 1/22 at 100.00 | AA | 1,181,653 |
| | | Clinic Health System Obligated Group, Series 2012A, 5.000%, 1/01/38 | | | |
| | | Ohio State Higher Educational Facilities Commission, Hospital Revenue Bonds, Summa | | | |
| | | Health System Project, Series 2010: | | | |
| 1,520 | | 5.250%, 11/15/40 – AGM Insured | 5/20 at 100.00 | AA | 1,572,182 |
| 555 | | 5.750%, 11/15/40 – AGM Insured | 5/20 at 100.00 | AA | 578,249 |
| | | Ohio State, Hospital Revenue Bonds, Cleveland Clinic Health System Obligated Group, | | | |
| | | Refunding Series 2017A: | | | |
| 1,000 | | 5.000%, 1/01/30 | 1/28 at 100.00 | AA | 1,210,170 |
| 2,090 | | 5.000%, 1/01/33 | 1/28 at 100.00 | AA | 2,467,120 |
| | | Ohio State, Hospital Revenue Bonds, University Hospitals Health System, Inc., Series 2013A: | | | |
| 1,000 | | 5.000%, 1/15/28 | 1/23 at 100.00 | A | 1,100,000 |
| 2,000 | | 5.000%, 1/15/29 | 1/23 at 100.00 | A | 2,192,660 |
| | | Wood County, Ohio, Hospital Facilities Refunding and Improvement Revenue Bonds, Wood | | | |
| | | County Hospital Project, Series 2012: | | | |
| 2,670 | | 5.000%, 12/01/37 | 12/22 at 100.00 | Ba2 | 2,752,903 |
| 5,510 | | 5.000%, 12/01/42 | 12/22 at 100.00 | Ba2 | 5,639,485 |
| 44,395 | | Total Health Care | | | 47,323,924 |
| | | Housing/Multifamily – 1.2% (0.8% of Total Investments) | | | |
| 187 | | Franklin County, Ohio, GNMA Collateralized Multifamily Housing Mortgage Revenue Bonds, | 3/19 at 100.00 | Aaa | 187,473 |
| | | Agler Project, Series 2002A, 5.550%, 5/20/22 (AMT) | | | |
| 3,340 | | Summit County Port Authority, Ohio, Multifamily Housing Revenue Bonds, Callis Tower | 3/19 at 101.00 | Aa1 | 3,366,186 |
| | | Apartments Project, Series 2007, 5.250%, 9/20/47 (AMT) | | | |
| 3,527 | | Total Housing/Multifamily | | | 3,553,659 |
| | | Industrials – 1.3% (0.8% of Total Investments) | | | |
| 3,495 | | Toledo-Lucas County Port Authority, Ohio, Revenue Refunding Bonds, CSX Transportation | No Opt. Call | A3 | 3,874,277 |
| | | Inc., Series 1992, 6.450%, 12/15/21 | | | |
| 1,600 | | Western Reserve Port Authority, Ohio, Solid Waste Facility Revenue Bonds, Central Waste | 3/19 at 101.00 | N/R | 16 |
| | | Inc., Series 2007A, 6.350%, 7/01/27 (AMT) (5) | | | |
| 5,095 | | Total Industrials | | | 3,874,293 |
| | | Long-Term Care – 1.1% (0.7% of Total Investments) | | | |
| 895 | | Franklin County, Ohio, Healthcare Facilities Revenue Bonds, Ohio Presbyterian Retirement | 7/20 at 100.00 | BBB | 922,306 |
| | | Services, Improvement Series 2010A, 5.625%, 7/01/26 | | | |
| 2,220 | | Montgomery County, Ohio, Health Care and Multifamily Housing Revenue Bonds, Saint | 4/20 at 100.00 | BBB– | 2,304,205 |
| | | Leonard, Refunding & improvement Series 2010, 6.625%, 4/01/40 | | | |
| 3,115 | | Total Long-Term Care | | | 3,226,511 |
45
| | | | | | |
NUO | | Nuveen Ohio Quality Municipal Income Fund | | |
| | | Portfolio of Investments (continued) February 28, 2019 | | | |
| |
| |
| |
| |
| |
Principal | | | Optional Call | | |
Amount (000) | | Description (1) | Provisions (2) | Ratings (3) | Value |
| | | Tax Obligation/General – 21.9% (14.1% of Total Investments) | | | |
| $ 2,500 | | Clark-Shawnee Local School District, Clark County, Ohio, General Obligation Bonds, | 11/27 at 100.00 | AA | $ 2,818,750 |
| | | School Facilities Construction & Improvement Series 2017, 5.000%, 11/01/54 | | | |
| 1,050 | | Cleveland, Ohio, General Obligation Bonds, Various Purpose Series 2018, 5.000%, 12/01/43 | 6/28 at 100.00 | AA+ | 1,191,918 |
| | | Columbus City School District, Franklin County, Ohio, General Obligation Bonds, | | | |
| | | Refunding Series 2006: | | | |
| 4,310 | | 0.000%, 12/01/27 – AGM Insured | No Opt. Call | AA | 3,498,298 |
| 5,835 | | 0.000%, 12/01/28 – AGM Insured | No Opt. Call | AA | 4,557,894 |
| 2,250 | | Columbus, Ohio, General Obligation Bonds, Various Purpose Series 2018A, 5.000%, 4/01/29 | 10/28 at 100.00 | AAA | 2,787,322 |
| | | Dublin, Ohio, General Obligation Bonds, Limited Tax Various Purpose Series 2015: | | | |
| 725 | | 5.000%, 12/01/26 | 12/25 at 100.00 | Aaa | 870,558 |
| 900 | | 5.000%, 12/01/32 | 12/25 at 100.00 | Aaa | 1,057,599 |
| 1,000 | | 5.000%, 12/01/34 | 12/25 at 100.00 | Aaa | 1,171,000 |
| 1,730 | | Franklin County, Ohio, General Obligation Bonds, Refunding Series 2014, 5.000%, 6/01/31 | 12/23 at 100.00 | AAA | 1,971,508 |
| | | Gallia County Local School District, Gallia and Jackson Counties, Ohio, General | | | |
| | | Obligation Bonds, Refunding School Improvement Series 2014: | | | |
| 1,260 | | 5.000%, 11/01/30 | 11/24 at 100.00 | Aa2 | 1,432,620 |
| 1,540 | | 5.000%, 11/01/31 | 11/24 at 100.00 | Aa2 | 1,746,622 |
| | | Greenville City School District, Drake County, Ohio, General Obligation Bonds, School | | | |
| | | Improvement Series 2013: | | | |
| 555 | | 5.250%, 1/01/38 | 1/22 at 100.00 | AA | 604,428 |
| 1,355 | | 5.250%, 1/01/41 | 1/22 at 100.00 | AA | 1,473,725 |
| 1,355 | | Grove City, Ohio, General Obligation Bonds, Construction & Improvement Series 2009, | 12/19 at 100.00 | Aa1 | 1,387,805 |
| | | 5.125%, 12/01/36 | | | |
| 2,160 | | Kenston Local School District, Geauga County, Ohio, General Obligation Bonds, Series | No Opt. Call | Aa1 | 2,056,428 |
| | | 2011, 0.000%, 12/01/21 | | | |
| | | Middletown City School District, Butler County, Ohio, General Obligation Bonds, | | | |
| | | Refunding Series 2007: | | | |
| 3,625 | | 5.250%, 12/01/28 – AGM Insured | No Opt. Call | A2 | 4,439,247 |
| 4,500 | | 5.250%, 12/01/31 – AGM Insured | No Opt. Call | A2 | 5,544,270 |
| 1,305 | | Monroe Local School District, Butler County, Ohio, General Obligation Bonds, Series | No Opt. Call | A1 | 1,527,476 |
| | | 2006, 5.500%, 12/01/24 – AMBAC Insured | | | |
| 725 | | Napoleon City School District, Henry County, Ohio, General Obligation Bonds, Facilities | 6/22 at 100.00 | Aa3 | 784,900 |
| | | Construction & Improvement Series 2012, 5.000%, 12/01/36 | | | |
| 2,880 | | Ohio State, General Obligation Bonds, Higher Education, Series 2017A, 5.000%, 5/01/36 | 5/25 at 100.00 | AA+ | 3,269,520 |
| 3,000 | | Ohio State, General Obligation Bonds, Highway Capital Improvement, Series 2014R, | 5/24 at 100.00 | AAA | 3,437,010 |
| | | 5.000%, 5/01/29 | | | |
| | | Ohio State, General Obligation Bonds, Highway Capital Improvement, Series 2018V: | | | |
| 2,500 | | 5.000%, 5/01/33 | 5/28 at 100.00 | AAA | 2,999,775 |
| 1,250 | | 5.000%, 5/01/34 | 5/28 at 100.00 | AAA | 1,493,100 |
| 5,000 | | South Euclid, Ohio, General Obligation Bonds, Real Estate Acquisition and Urban | 6/22 at 100.00 | Aa2 | 5,426,150 |
| | | Redevelopment, Series 2012, 5.000%, 6/01/42 | | | |
| 4,000 | | Southwest Local School District, Hamilton and Butler Counties, Ohio, General Obligation | 1/28 at 100.00 | Aa2 | 4,012,240 |
| | | Bonds, School Improvement Series 2018A, 4.000%, 1/15/55 | | | |
| 450 | | South-Western City School District, Franklin and Pickaway Counties, Ohio, General | 6/22 at 100.00 | AA | 490,712 |
| | | Obligation Bonds, School Facilities Construction & Improvement Series 2012, 5.000%, 12/01/36 | | | |
| 1,500 | | Springboro Community City School District, Warren County, Ohio, General Obligation | No Opt. Call | AA | 1,880,910 |
| | | Bonds, Refunding Series 2007, 5.250%, 12/01/32 | | | |
| 1,000 | | Upper Arlington City School District, Franklin County, Ohio, General Obligation Bonds, | 12/27 at 100.00 | AAA | 1,143,570 |
| | | School Facilities & Improvement Series 2018A, 5.000%, 12/01/48 | | | |
| 60,260 | | Total Tax Obligation/General | | | 65,075,355 |
46
| | | | | | |
Principal | | | Optional Call | | |
Amount (000) | | Description (1) | Provisions (2) | Ratings (3) | Value |
| | | Tax Obligation/Limited – 37.6% (24.3% of Total Investments) | | | |
| $ 8,045 | | Cleveland, Ohio, Income Tax Revenue Bonds, Bridges & Roadways Improvements, Subordinate | 10/23 at 100.00 | AA+ | $ 8,928,904 |
| | | Lien Series 2015A-2, 5.000%, 10/01/37 | | | |
| | | Cleveland, Ohio, Income Tax Revenue Bonds, Bridges & Roadways Improvements, Subordinate | | | |
| | | Lien Series 2017B-2: | | | |
| 1,250 | | 5.000%, 10/01/31 | 4/28 at 100.00 | AA+ | 1,479,938 |
| 1,000 | | 5.000%, 10/01/32 | 4/28 at 100.00 | AA+ | 1,178,360 |
| 3,000 | | Cleveland, Ohio, Income Tax Revenue Bonds, Public Facilities Improvements, Series | 11/23 at 100.00 | AA+ | 3,331,200 |
| | | 2014A-1, 5.000%, 11/15/38 | | | |
| | | Cleveland, Ohio, Income Tax Revenue Bonds, Subordinate Lien Improvement and Refunding | | | |
| | | Series 2017A-2: | | | |
| 435 | | 5.000%, 10/01/30 | 10/27 at 100.00 | AA+ | 515,814 |
| 700 | | 5.000%, 10/01/33 | 10/27 at 100.00 | AA+ | 816,375 |
| 500 | | Columbus-Franklin County Finance Authority, Ohio, Development Revenue Bonds, Hubbard | 12/19 at 100.00 | BBB | 504,165 |
| | | Avenue Parking Facility Project, Series 2012A, 5.000%, 12/01/36 | | | |
| 6,750 | | Cuyahoga County, Ohio, Economic Development Revenue Bonds, Medical Mart-Convention | 12/20 at 100.00 | AA | 7,126,852 |
| | | Center Project, Recovery Zone Facility Series 2010F, 5.000%, 12/01/27 | | | |
| | | Cuyahoga County, Ohio, Sales Tax Revenue Bonds, Refunding Various Purpose Series 2014: | | | |
| 1,815 | | 5.000%, 12/01/32 | 12/24 at 100.00 | AAA | 2,083,257 |
| 1,415 | | 5.000%, 12/01/33 | 12/24 at 100.00 | AAA | 1,620,034 |
| 1,000 | | 5.000%, 12/01/34 | 12/24 at 100.00 | AAA | 1,143,170 |
| 945 | | 5.000%, 12/01/35 | 12/24 at 100.00 | AAA | 1,078,651 |
| 300 | | Delaware County District Library, Ohio, Library Fund Library Facilities Special | 12/19 at 100.00 | Aa2 | 307,212 |
| | | Obligation Notes, Series 2009, 5.000%, 12/01/34 | | | |
| 1,920 | | Dublin, Ohio, Special Obligation Non-Tax Revenue Bonds, Series 2015A, 5.000%, 12/01/44 | 12/25 at 100.00 | Aa1 | 2,177,626 |
| 10,350 | | Franklin County Convention Facilities Authority, Ohio, Excise Tax and Lease Revenue | 12/24 at 100.00 | Aa1 | 11,837,709 |
| | | Bonds, Columbus City & Franklin County Lessees, Refunding Anticipation Series 2014, | | | |
| | | 5.000%, 12/01/35 | | | |
| | | Franklin County, Ohio, Sales Tax Revenue Bonds, Various Purpose Series 2018: | | | |
| 2,120 | | 5.000%, 6/01/36 | 6/28 at 100.00 | AAA | 2,510,737 |
| 1,155 | | 5.000%, 6/01/37 | 6/28 at 100.00 | AAA | 1,361,653 |
| 6,500 | | 5.000%, 6/01/43 | 6/28 at 100.00 | AAA | 7,512,310 |
| 5,535 | | 5.000%, 6/01/48 | 6/28 at 100.00 | AAA | 6,357,280 |
| 1,000 | | Greater Cleveland Regional Transit Authority, Ohio, Sales Tax Supported Capital | 12/25 at 100.00 | AA+ | 1,155,430 |
| | | Improvement Bonds, Refunding Series 2015, 5.000%, 12/01/34 | | | |
| 1,200 | | Greater Cleveland Regional Transit Authority, Ohio, Sales Tax Supported Capital | 12/26 at 100.00 | AA+ | 1,434,936 |
| | | Improvement Bonds, Refunding Series 2016, 5.000%, 12/01/28 | | | |
| 5,565 | | Hamilton County, Ohio, Sales Tax Bonds, Subordinate Series 2000B, 0.000%, 12/01/28 – | No Opt. Call | AA | 4,223,445 |
| | | AGM Insured | | | |
| 5,000 | | Hamilton County, Ohio, Sales Tax Revenue Bonds, Refunding Series 2011A, 5.000%, 12/01/31 | 12/21 at 100.00 | A1 | 5,406,400 |
| 20,700 | | JobsOhio Beverage System, Ohio, Statewide Liquor Profits Revenue Bonds, Senior Lien | 1/23 at 100.00 | AA | 22,679,955 |
| | | Series 2013A, 5.000%, 1/01/38 | | | |
| 1,000 | | New Albany Community Authority, Ohio, Community Facilities Revenue Refunding Bonds, | 10/22 at 100.00 | Aa3 | 1,105,410 |
| | | Series 2012C, 5.000%, 10/01/24 | | | |
| | | Ohio State, Capital Facilities Lease-Appropriation Bonds, Parks & Recreation Improvement | | | |
| | | Fund Projects, Series 2017A: | | | |
| 915 | | 5.000%, 12/01/31 | 12/27 at 100.00 | AA | 1,090,259 |
| 1,345 | | 5.000%, 12/01/32 | 12/27 at 100.00 | AA | 1,589,669 |
| 1,250 | | Pickaway County, Ohio, Sales Tax Special Obligation Bonds, Series 2019, 5.000%, 12/01/48 | 12/28 at 100.00 | AA | 1,398,013 |
| 1,845 | | Pinnacle Community Infrastructure Financing Authority, Grove City, Ohio, Community | 12/25 at 100.00 | AA | 1,923,837 |
| | | Facilities Bonds, Series 2015A, 4.250%, 12/01/36 – AGM Insured | | | |
| 400 | | Port of Greater Cincinnati Development Authority, Ohio, Special Obligation Development | 12/28 at 100.00 | N/R | 417,648 |
| | | TIF Revenue Bonds, RBM Development – Phase 2B Project, Series 2018A, 6.000%, 12/01/50 | | | |
47
| | | | | | |
NUO | | Nuveen Ohio Quality Municipal Income Fund | | |
| | | Portfolio of Investments (continued) February 28, 2019 | | | |
| |
| |
| |
| |
| |
Principal | | | Optional Call | | |
Amount (000) | | Description (1) | Provisions (2) | Ratings (3) | Value |
| | | Tax Obligation/Limited (continued) | | | |
| | | Riversouth Authority, Ohio, Riversouth Area Redevelopment Bonds, Payable from City of | | | |
| | | Columbus, Ohio Annual Rental Appropriations, Refunding Series 2012A: | | | |
| $ 1,645 | | 5.000%, 12/01/23 | 12/22 at 100.00 | AA+ | $ 1,837,958 |
| 1,200 | | 5.000%, 12/01/24 | 12/22 at 100.00 | AA+ | 1,339,836 |
| | | Vermilion Local School District, Erie and Lorain Counties, Ohio, Certificates of | | | |
| | | Participation, School Facilities Project, Series 2012: | | | |
| 765 | | 5.000%, 12/01/24 | 12/20 at 100.00 | Aa3 | 805,813 |
| 805 | | 5.000%, 12/01/25 | 12/20 at 100.00 | Aa3 | 847,520 |
| 2,450 | | Westerville City School District, Franklin and Delaware Counties, Ohio, Certificates of | 12/27 at 100.00 | Aa2 | 2,784,474 |
| | | Participation, School Facilities Project, Series 2018, 5.000%, 12/01/39 | | | |
| 101,820 | | Total Tax Obligation/Limited | | | 111,911,850 |
| | | Transportation – 19.3% (12.5% of Total Investments) | | | |
| | | Cleveland, Ohio, Airport System Revenue Bonds, Series 2012A: | | | |
| 2,150 | | 5.000%, 1/01/30 | 1/22 at 100.00 | A | 2,308,971 |
| 1,500 | | 5.000%, 1/01/31 – AGM Insured | 1/22 at 100.00 | AA | 1,613,055 |
| | | Dayton, Ohio, Airport Revenue Bonds, James M. Cox International Airport, Series 2015B: | | | |
| 860 | | 5.000%, 12/01/33 – AGM Insured | 12/23 at 100.00 | AA | 956,913 |
| 500 | | 5.000%, 12/01/34 – AGM Insured | 12/23 at 100.00 | AA | 555,400 |
| | | Ohio State, Private Activity Bonds, Portsmouth Gateway Group, LLC – Borrower, Portsmouth | | | |
| | | Bypass Project, Series 2015: | | | |
| 2,500 | | 5.000%, 12/31/35 – AGM Insured (AMT) | 6/25 at 100.00 | AA | 2,787,800 |
| 3,000 | | 5.000%, 12/31/39 – AGM Insured (AMT) | 6/25 at 100.00 | AA | 3,307,200 |
| 4,250 | | 5.000%, 6/30/53 (AMT) | 6/25 at 100.00 | A– | 4,470,575 |
| | | Ohio Turnpike Commission, Turnpike Revenue Bonds, Infrastructure Project, Junior Lien | | | |
| | | Series 2013A-1: | | | |
| 2,050 | | 5.250%, 2/15/39 | 2/23 at 100.00 | Aa3 | 2,271,913 |
| 10,915 | | 5.000%, 2/15/48 | 2/23 at 100.00 | Aa3 | 11,733,843 |
| 15,000 | | Ohio Turnpike Commission, Turnpike Revenue Bonds, Infrastructure Projects, Junior Lien | 2/28 at 100.00 | Aa3 | 17,064,900 |
| | | Series 2018A, 5.000%, 2/15/46 (UB) | | | |
| | | Ohio Turnpike Commission, Turnpike Revenue Bonds, Infrastructure Projects, Junior Lien, | | | |
| | | Capital Appreciation Series 2013A-2: | | | |
| 5,000 | | 0.000%, 2/15/37 | No Opt. Call | Aa3 | 2,591,850 |
| 11,260 | | 0.000%, 2/15/38 | No Opt. Call | Aa3 | 5,553,770 |
| 5,000 | | 0.000%, 2/15/40 | No Opt. Call | Aa3 | 2,228,150 |
| 63,985 | | Total Transportation | | | 57,444,340 |
| | | U.S. Guaranteed – 20.6% (13.3% of Total Investments) (6) | | | |
| 1,950 | | Allen County, Ohio, Hospital Facilities Revenue Bonds, Catholic Healthcare Partners, | 6/20 at 100.00 | AA– | 2,034,143 |
| | | Series 2010A, 5.250%, 6/01/38 (Pre-refunded 6/01/20) | | | |
| | | Butler County, Ohio, Hospital Facilities Revenue Bonds, UC Health, Series 2010: | | | |
| 1,165 | | 5.500%, 11/01/40 (Pre-refunded 11/01/20) | 11/20 at 100.00 | N/R | 1,236,659 |
| 2,335 | | 5.500%, 11/01/40 (Pre-refunded 11/01/20) | 11/20 at 100.00 | A | 2,478,626 |
| | | Central Ohio Solid Waste Authority, General Obligation Bonds, Refunding & Improvements, | | | |
| | | Series 2012: | | | |
| 110 | | 5.000%, 12/01/26 (Pre-refunded 6/01/22) | 6/22 at 100.00 | N/R | 121,472 |
| 1,140 | | 5.000%, 12/01/26 (Pre-refunded 6/01/22) | 6/22 at 100.00 | Aaa | 1,260,794 |
| 245 | | 5.000%, 12/01/28 (Pre-refunded 6/01/22) | 6/22 at 100.00 | N/R | 270,551 |
| 2,545 | | 5.000%, 12/01/28 (Pre-refunded 6/01/22) | 6/22 at 100.00 | Aaa | 2,814,668 |
| 160 | | 5.000%, 12/01/29 (Pre-refunded 6/01/22) | 6/22 at 100.00 | N/R | 176,686 |
| 1,605 | | 5.000%, 12/01/29 (Pre-refunded 6/01/22) | 6/22 at 100.00 | Aaa | 1,775,066 |
| | | Cincinnati, Ohio, General Obligation Bonds, Various Purpose, Refunding Series 2012A: | | | |
| 1,960 | | 5.000%, 12/01/31 (Pre-refunded 12/01/20) | 12/20 at 100.00 | AA | 2,075,013 |
| 875 | | 5.000%, 12/01/32 (Pre-refunded 12/01/20) | 12/20 at 100.00 | AA | 926,345 |
48
| | | | | | |
Principal | | | Optional Call | | |
Amount (000) | | Description (1) | Provisions (2) | Ratings (3) | Value |
| | | U.S. Guaranteed (6) (continued) | | | |
| $ 8,150 | | Cincinnati, Ohio, Water System Revenue Bonds, Series 2012A, 5.000%, 12/01/37 | 12/21 at 100.00 | AAA | $ 8,890,183 |
| | | (Pre-refunded 12/01/21) | | | |
| 2,000 | | Cleveland, Ohio, General Obligation Bonds, Series 2011, 5.000%, 12/01/29 | 12/19 at 100.00 | AA+ | 2,050,640 |
| | | (Pre-refunded 12/01/19) | | | |
| | | Cleveland, Ohio, Income Tax Revenue Bonds, Bridges & Roadways Improvements, Subordinate | | | |
| | | Lien Series 2013A-2: | | | |
| 1,315 | | 5.000%, 10/01/27 (Pre-refunded 10/01/23) | 10/23 at 100.00 | AA+ | 1,503,966 |
| 1,520 | | 5.000%, 10/01/30 (Pre-refunded 10/01/23) | 10/23 at 100.00 | AA+ | 1,738,424 |
| 1,600 | | 5.000%, 10/01/31 (Pre-refunded 10/01/23) | 10/23 at 100.00 | AA+ | 1,829,920 |
| 2,705 | | Cleveland, Ohio, Income Tax Revenue Bonds, Bridges & Roadways Improvements, Subordinate | 10/23 at 100.00 | N/R | 3,093,708 |
| | | Lien Series 2015A-2, 5.000%, 10/01/37 (Pre-refunded 10/01/23) | | | |
| | | Cleveland, Ohio, Water Revenue Bonds, Refunding Second Lien Series 2012A: | | | |
| 2,500 | | 5.000%, 1/01/25 (Pre-refunded 1/01/22) | 1/22 at 100.00 | AA | 2,730,175 |
| 1,975 | | 5.000%, 1/01/26 (Pre-refunded 1/01/22) | 1/22 at 100.00 | AA | 2,156,838 |
| 1,140 | | Columbia Local School District, Lorain County, Ohio, General Obligation Bonds, School | 11/21 at 100.00 | A1 | 1,240,457 |
| | | Facilities Improvement Series 2011, 5.000%, 11/01/39 (Pre-refunded 11/01/21) – AGM Insured | | | |
| | | Franklin County, Ohio, Hospital Revenue Bonds, Nationwide Children’s Hospital Project, | | | |
| | | Improvement Series 2009: | | | |
| 250 | | 5.000%, 11/01/34 (Pre-refunded 11/01/19) | 11/19 at 100.00 | Aa2 | 255,373 |
| 2,615 | | 5.250%, 11/01/40 (Pre-refunded 11/01/19) | 11/19 at 100.00 | Aa2 | 2,675,459 |
| | | Greater Cleveland Regional Transit Authority, Ohio, Sales Tax Supported Capital | | | |
| | | Improvement Bonds, Refunding Series 2012: | | | |
| 1,010 | | 5.250%, 12/01/27 (Pre-refunded 12/01/21) | 12/21 at 100.00 | AA+ | 1,107,051 |
| 1,090 | | 5.250%, 12/01/28 (Pre-refunded 12/01/21) | 12/21 at 100.00 | AA+ | 1,194,738 |
| 760 | | 5.250%, 12/01/30 (Pre-refunded 12/01/21) | 12/21 at 100.00 | AA+ | 833,028 |
| 600 | | 5.000%, 12/01/31 (Pre-refunded 12/01/21) | 12/21 at 100.00 | AA+ | 653,646 |
| 3,225 | | Hancock County, Ohio, Hospital Revenue Bonds, Blanchard Valley Regional Health Center, | 6/21 at 100.00 | A+ | 3,546,307 |
| | | Series 2011A, 6.250%, 12/01/34 (Pre-refunded 6/01/21) | | | |
| 3,965 | | Lucas County, Ohio, Hospital Revenue Bonds, ProMedica Healthcare Obligated Group, Series | 11/21 at 100.00 | Baa1 | 4,412,490 |
| | | 2011A, 6.000%, 11/15/41 (Pre-refunded 11/15/21) | | | |
| 2,000 | | Northeast Ohio Regional Sewer District, Wastewater Improvement Revenue Bonds, Series | 5/23 at 100.00 | AA+ | 2,265,360 |
| | | 2013, 5.000%, 11/15/38 (Pre-refunded 5/15/23) | | | |
| 945 | | Ohio State Higher Educational Facilities Commission, Hospital Revenue Bonds, Summa | 5/20 at 100.00 | AA | 989,906 |
| | | Health System Project, Series 2010, 5.750%, 11/15/40 (Pre-refunded 5/15/20) – AGM Insured | | | |
| 1,800 | | South-Western City School District, Franklin and Pickaway Counties, Ohio, General | 6/22 at 100.00 | N/R | 1,987,722 |
| | | Obligation Bonds, School Facilities Construction & Improvement Series 2012, 5.000%, 12/01/36 | | | |
| | | (Pre-refunded 6/01/22) | | | |
| | | Vandalia Butler City School District, Montgomery County, Ohio, General Obligation Bonds, | | | |
| | | School Improvement Series 2009: | | | |
| 685 | | 5.125%, 12/01/37 (Pre-refunded 6/01/19) | 6/19 at 100.00 | N/R | 690,795 |
| 315 | | 5.125%, 12/01/37 (Pre-refunded 6/01/19) | 6/19 at 100.00 | AA– | 317,703 |
| 56,255 | | Total U.S. Guaranteed | | | 61,333,912 |
| | | Utilities – 5.7% (3.7% of Total Investments) | | | |
| 1,500 | | American Municipal Power Ohio Inc., Prairie State Energy Campus Project Revenue Bonds, | 2/24 at 100.00 | A1 | 1,637,055 |
| | | Series 2015A, 5.000%, 2/15/42 | | | |
| 1,430 | | American Municipal Power, Inc., Ohio, Greenup Hydroelectric Project Revenue Bonds, | 2/26 at 100.00 | A1 | 1,577,147 |
| | | Refunding Series 2016A, 5.000%, 2/15/41 | | | |
| 1,660 | | American Municipal Power, Inc., Ohio, Solar Electricity Prepayment Project Revenue | 2/29 at 100.00 | A | 1,869,857 |
| | | Bonds, Green Bonds Series 2019A, 5.000%, 2/15/44 | | | |
| 1,565 | | Cleveland, Ohio, Public Power System Revenue Bonds, Series 2008B-1, 0.000%, 11/15/33 – | No Opt. Call | A– | 924,664 |
| | | NPFG Insured | | | |
49
| | | | | | |
NUO | | Nuveen Ohio Quality Municipal Income Fund | | |
| | | Portfolio of Investments (continued) | | | |
| | | February 28, 2019 | | | |
| |
| |
| |
Principal | | | Optional Call | | |
Amount (000) | | Description (1) | Provisions (2) | Ratings (3) | Value |
| | | Utilities (continued) | | | |
| | | Cleveland, Ohio, Public Power System Revenue Bonds, Series 2008B-2: | | | |
| $ 2,000 | | 0.000%, 11/15/28 – NPFG Insured | No Opt. Call | A– | $ 1,483,120 |
| 6,895 | | 0.000%, 11/15/32 – NPFG Insured | No Opt. Call | A– | 4,257,180 |
| 2,155 | | 0.000%, 11/15/34 – NPFG Insured | No Opt. Call | A– | 1,215,959 |
| 1,500 | | Ohio Air Quality Development Authority, Air Quality Revenue Refunding Bonds, Columbus | 12/19 at 100.00 | A2 | 1,535,190 |
| | | Southern Power Company Project, Series 2009B, 5.800%, 12/01/38 | | | |
| 2,000 | | Ohio Air Quality Development Authority, Ohio, Pollution Control Revenue Bonds, | No Opt. Call | N/R | 1,740,000 |
| | | FirstEnergy Generation Project, Refunding Series 2006A, 3.750%, 12/01/23 (5) | | | |
| 950 | | Ohio Municipal Electric Generation Agency, Beneficial Interest Certificates, Belleville | No Opt. Call | A1 | 706,135 |
| | | Hydroelectric Project – Joint Venture 5, Series 2001, 0.000%, 2/15/29 – NPFG Insured | | | |
| 21,655 | | Total Utilities | | | 16,946,307 |
| | | Water and Sewer – 11.7% (7.6% of Total Investments) | | | |
| 8,000 | | Cincinnati, Ohio, Water System Revenue Bonds, Series 2016A, 5.000%, 12/01/46 | 12/26 at 100.00 | AAA | 9,117,120 |
| 2,035 | | Cleveland, Ohio, Water Revenue Bonds, Senior Lien Series 2012X, 5.000%, 1/01/42 | 1/22 at 100.00 | AA+ | 2,188,948 |
| 375 | | Cleveland, Ohio, Waterworks First Mortgage Revenue Refunding and Improvement Bonds, | No Opt. Call | Aa1 | 393,315 |
| | | Series 1993G, 5.500%, 1/01/21 – NPFG Insured | | | |
| 1,275 | | Hamilton County, Ohio, Sewer System Revenue Bonds, Metropolitan Sewer District of | 12/24 at 100.00 | AA+ | 1,469,387 |
| | | Greater Cincinnati, Refunding Series 2014A, 5.000%, 12/01/31 | | | |
| 2,025 | | Ironton, Ohio, Sewer System Improvement Revenue Bonds, Series 2011, 5.250%, 12/01/40 – | 12/20 at 100.00 | A2 | 2,081,437 |
| | | AGM Insured | | | |
| | | Northeast Ohio Regional Sewer District, Wastewater Improvement Revenue Bonds, | | | |
| | | Refunding & Improvement Series 2014: | | | |
| 2,950 | | 5.000%, 11/15/39 | 11/24 at 100.00 | AA+ | 3,331,110 |
| 1,400 | | 5.000%, 11/15/44 | 11/24 at 100.00 | AA+ | 1,563,534 |
| | | Toledo, Ohio, Sewerage System Revenue Bonds, Refunding Series 2013: | | | |
| 820 | | 5.000%, 11/15/25 | 11/23 at 100.00 | Aa3 | 926,452 |
| 605 | | 5.000%, 11/15/26 | 11/23 at 100.00 | Aa3 | 682,095 |
| 1,075 | | 5.000%, 11/15/27 | 11/23 at 100.00 | Aa3 | 1,209,934 |
| 695 | | 5.000%, 11/15/28 | 11/23 at 100.00 | Aa3 | 780,582 |
| 10,000 | | Toledo, Ohio, Water System Revenue Bonds, Refunding & Improvement Series 2016, | 11/26 at 100.00 | AA– | 11,254,600 |
| | | 5.000%, 11/15/41 (UB) (4) | | | |
| 31,255 | | Total Water and Sewer | | | 34,998,514 |
| $ 443,212 | | Total Long-Term Investments (cost $440,422,999) | | | 460,418,868 |
| | | Floating Rate Obligations – (6.7)% | | | (20,000,000) |
| | | Variable Rate Demand Preferred Shares, net of deferred offering costs – (49.6)% (7) | | | (147,759,533) |
| | | Other Assets Less Liabilities – 1.7% | | | 5,115,037 |
| | | Net Asset Applicable to Common Shares – 100% | | | $ 297,774,372 |
50
| | |
| (1) | All percentages shown in the Portfolio of Investments are based on net assets applicable to common shares unless otherwise noted. |
| (2) | Optional Call Provisions: Dates (month and year) and prices of the earliest optional call or redemption. There may be other call provisions at varying prices at later dates. Certain mortgage-backed securities may be subject to periodic principal paydowns. Optional Call Provisions are not covered by the report of independent registered public accounting firm. |
| (3) | For financial reporting purposes, the ratings disclosed are the highest of Standard & Poor’s Group (“Standard & Poor’s”), Moody’s Investors Service, Inc. (“Moody’s”) or Fitch, Inc. (“Fitch”) rating. This treatment of split-rated securities may differ from that used for other purposes, such as for Fund investment policies. Ratings below BBB by Standard & Poor’s, Baa by Moody’s or BBB by Fitch are considered to be below investment grade. Holdings designated N/R are not rated by any of these national rating agencies. Ratings are not covered by the report of independent registered public accounting firm. |
| (4) | Investment, or portion of investment, has been pledged to collateralize the net payment obligations for investments in inverse floating rate transactions. |
| (5) | As of, or subsequent to, the end of the reporting period this security is non-income producing. Non-income producing, in the case of a fixed-income security, generally denotes that the issuer has (1) defaulted on the payment of principal or interest, (2) is under the protection of the Federal Bankruptcy Court or (3) the Fund’s Adviser has concluded that the issue is not likely to meet its future interest payment obligations and has ceased accruing additional income on the Fund’s records. |
| (6) | Backed by an escrow or trust containing sufficient U.S. Government or U.S. Government agency securities, which ensure the timely payment of principal and interest. |
| (7) | Variable Rate Demand Preferred Shares, net of deferred offering costs as a percentage of Total Investments is 32.1%. |
| 144A | Investment is exempt from registration under Rule 144A of the Securities Act of 1933, as amended. These investments may only be resold in transactions exempt from registration, which are normally those transactions with qualified institutional buyers. |
| AMT | Alternative Minimum Tax. |
| IF | Inverse floating rate security issued by a tender option bond (“TOB”) trust, the interest rate on which varies inversely with the Securities Industry Financial Markets Association (SIFMA) short-term rate, which resets weekly, or a similar short-term rate, and is reduced by the expenses related to the TOB trust. |
| UB | Underlying bond of an inverse floating rate trust reflected as a financing transaction. See Notes to Financial Statements, Note 3 – Portfolio Securities and Investments in Derivatives. Inverse Floating Rate Securities for more information. |
| | See accompanying notes to financial statements. |
51
| | |
| NTX | Nuveen Texas Quality Municipal Income Fund Portfolio of Investments February 28, 2019 |
| | | | | | |
Principal | | | Optional Call | | |
Amount (000) | | Description (1) | Provisions (2) | Ratings (3) | Value |
| | | LONG-TERM INVESTMENTS – 156.6% (100.0% of Total Investments) | | | |
| | | MUNICIPAL BONDS – 156.6% (100.0% of Total Investments) | | | |
| | | Consumer Discretionary – 2.7% (1.7% of Total Investments) | | | |
| $ 4,060 | | San Antonio Convention Center Hotel Finance Corporation, Texas, Contract Revenue | 3/19 at 100.00 | A3 | $ 4,060,000 |
| | | Empowerment Zone Bonds, Series 2005A, 5.000%, 7/15/39 – AMBAC Insured (AMT) | | | |
| | | Education and Civic Organizations – 12.2% (7.8% of Total Investments) | | | |
| 2,500 | | Board of Regents of the University of Texas, Permanent University Fund Bonds, Refunding | 7/24 at 100.00 | AAA | 2,877,875 |
| | | Series 2015A, 5.000%, 7/01/28 | | | |
| 1,000 | | Board of Regents, University of Texas System, Financing System Revenue Bonds, Refunding | No Opt. Call | AAA | 1,112,460 |
| | | Series 2012B, 5.000%, 8/15/22 | | | |
| | | Clifton Higher Education Finance Corporation, Texas, Education Revenue Bonds, Uplift | | | |
| | | Education Charter School, Series 2013A: | | | |
| 1,000 | | 4.350%, 12/01/42 | 12/22 at 100.00 | BBB– | 968,270 |
| 1,000 | | 4.400%, 12/01/47 | 12/22 at 100.00 | BBB– | 965,130 |
| 1,230 | | Danbury Higher Education Authority, Texas, Charter School Revenue Bonds, John H. Wood | 8/23 at 100.00 | BBB– | 1,338,683 |
| | | Jr. Public Charter District, Inspire Academies, Series 2013A, 6.000%, 8/15/28 | | | |
| 1,000 | | Hale Center Education Facilities Corporation, Texas, Revenue Bonds, Wayland Baptist | 3/21 at 100.00 | A– | 1,052,590 |
| | | University Project, Improvement and Refunding Series 2010, 5.000%, 3/01/35 | | | |
| 1,000 | | Harris County Cultural Education Facilities Finance Corporation, Texas, Medical | 11/22 at 100.00 | A | 1,104,630 |
| | | Facilities Revenue Bonds, Baylor College of Medicine, Refunding Series 2012A, 5.000%, 11/15/26 | | | |
| 3,000 | | Harris County Cultural Education Facilities Finance Corporation, Texas, Revenue | 6/23 at 100.00 | Baa2 | 3,129,030 |
| | | Refunding Bonds, Young Men’s Christian Association of the Greater Houston Area, Series 2013A, | | | |
| | | 5.000%, 6/01/38 | | | |
| 2,000 | | Lone Star College System, Harris, Montgomery and San Jacinto Counties, Texas, Revenue | 2/21 at 100.00 | AA | 2,117,420 |
| | | Financing System Bonds, Series 2013, 5.000%, 2/15/36 | | | |
| 1,925 | | Stephen F. Austin State University, Texas, Revenue Bonds, Refunding & Improvement Series | 10/28 at 100.00 | AA– | 2,166,029 |
| | | 2016, 5.000%, 10/15/42 | | | |
| 1,240 | | Texas Public Finance Authority, Revenue Bonds, Texas Southern University Financing | 5/26 at 100.00 | AA | 1,444,104 |
| | | System, Refunding Series 2016, 5.000%, 5/01/27 – BAM Insured | | | |
| 16,895 | | Total Education and Civic Organizations | | | 18,276,221 |
| | | Energy – 1.3% (0.9% of Total Investments) | | | |
| 2,000 | | Gulf Coast Industrial Development Authority, Texas, Solid Waste Disposal Revenue Bonds, | 10/22 at 100.00 | BB | 1,987,800 |
| | | Citgo Petroleum Corporation Project, Series 1995, 4.875%, 5/01/25 (AMT) | | | |
| | | Health Care – 2.8% (1.8% of Total Investments) | | | |
| 1,000 | | Harris County Cultural Education Facilities Finance Corporation, Texas, Hospital Revenue | 12/22 at 100.00 | A+ | 1,088,100 |
| | | Bonds, Memorial Hermann Healthcare System, Refunding Series 2013A, 5.000%, 12/01/35 | | | |
| 1,000 | | Harris County Cultural Education Facilities Finance Corporation, Texas, Revenue Bonds, | 6/25 at 100.00 | AA | 1,097,880 |
| | | Houston Methodist Hospital System, Series 2015, 5.000%, 12/01/45 | | | |
| 515 | | Tarrant County Cultural Education Facilities Finance Corporation, Texas, Hospital | 9/23 at 100.00 | A | 568,416 |
| | | Revenue Bonds, Hendrick Medical Center, Refunding Series 2013, 5.125%, 9/01/33 | | | |
| 1,250 | | Tarrant County Cultural Education Facilities Finance Corporation, Texas, Hospital | 5/26 at 100.00 | AA– | 1,433,212 |
| | | Revenue Bonds, Scott & White Healthcare Project, Series 2016A, 5.000%, 11/15/32 | | | |
| 3,765 | | Total Health Care | | | 4,187,608 |
52
| | | | | | |
Principal | | | Optional Call | | |
Amount (000) | | Description (1) | Provisions (2) | Ratings (3) | Value |
| | | Housing/Multifamily – 2.2% (1.4% of Total Investments) | | | |
| $ 3,000 | | New Hope Cultural Education Facilities Finance Corporation, Texas, Student Housing | 4/24 at 100.00 | AA | $ 3,239,850 |
| | | Revenue Bonds, CHF-Collegiate Housing Foundation – College Station I LLC – Texas A&M | | | |
| | | University Project, Series 2014A, 5.000%, 4/01/46 – AGM Insured | | | |
| | | Tax Obligation/General – 25.1% (16.0% of Total Investments) | | | |
| 1,975 | | Allen Independent School District, Collin County, Texas, General Obligation Bonds, | 2/26 at 100.00 | AAA | 2,232,639 |
| | | School Building Series 2016, 5.000%, 2/15/39 | | | |
| 500 | | Austin Community College District, Texas, General Obligation Bonds, Refunding Limited | No Opt. Call | AA+ | 568,495 |
| | | Tax Series 2016, 5.000%, 8/01/23 | | | |
| 1,620 | | Cameron County, Texas, General Obligation Bonds, State Highway 550 Project, Series 2012, | 2/22 at 100.00 | AA | 1,751,998 |
| | | 5.000%, 2/15/32 – AGM Insured | | | |
| 1,500 | | College Station, Texas, Certificates of Obligation, Series 2012, 5.000%, 2/15/32 | 2/21 at 100.00 | AA+ | 1,588,365 |
| 1,000 | | El Paso County Hospital District, Texas, General Obligation Bonds, Refunding Series 2013, | 8/23 at 100.00 | A– | 1,057,160 |
| | | 5.000%, 8/15/33 | | | |
| 1,565 | | El Paso County, Texas, Certificates of Obligation, Series 2001, 5.000%, 2/15/21 – | No Opt. Call | AA | 1,666,600 |
| | | AGM Insured | | | |
| 2,000 | | Houston, Texas, General Obligation Bonds, Refunding Public Improvement Series 2017A, | 3/27 at 100.00 | AA | 2,350,560 |
| | | 5.000%, 3/01/31 | | | |
| 3,255 | | Hutto Independent School District, Williamson County, Texas, General Obligation Bonds, | 8/21 at 24.48 | A+ | 761,865 |
| | | Refunding Series 2012A, 0.000%, 8/01/45 | | | |
| 1,360 | | Jacksonville Independent School District, Cherokee County, Texas, General Obligation | 2/24 at 100.00 | Aaa | 1,521,405 |
| | | Bonds, School Building Series 2014, 5.000%, 2/15/39 | | | |
| 2,675 | | Laredo Community College District, Webb County, Texas, General Obligation Bonds, Series | 8/24 at 100.00 | AA– | 3,015,741 |
| | | 2014, 5.000%, 8/01/34 | | | |
| 1,350 | | Lubbock Independent School District, Lubbock County, Texas, General Obligation Bonds, | 2/23 at 100.00 | AAA | 1,481,355 |
| | | School Building Series 2013A, 5.000%, 2/15/43 | | | |
| 1,750 | | Martin County Hospital District, Texas, Combination Limited Tax and Revenue Bonds, | 4/21 at 100.00 | BBB | 1,859,987 |
| | | Series 2011A, 7.250%, 4/01/36 | | | |
| | | McCamey County Hospital District, Texas, General Obligation Bonds, Series 2013: | | | |
| 1,000 | | 5.750%, 12/01/33 | 12/25 at 100.00 | B1 | 1,059,090 |
| 1,000 | | 6.125%, 12/01/38 | 12/25 at 100.00 | B1 | 1,058,800 |
| 1,425 | | Port of Houston Authority, Harris County, Texas, General Obligation Bonds, Series 2010E, | No Opt. Call | AAA | 827,113 |
| | | 0.000%, 10/01/35 | | | |
| 4,000 | | Prosper Independent School District, Collin County, Texas, General Obligation Bonds, | 2/25 at 100.00 | AAA | 4,500,960 |
| | | Refunding Series 2015, 5.000%, 2/15/40 | | | |
| 205 | | Reagan Hospital District of Reagan County, Texas, Limited Tax Revenue Bonds, Series | 2/24 at 100.00 | Ba2 | 209,672 |
| | | 2014A, 5.125%, 2/01/39 | | | |
| 2,000 | | Texas State, General Obligation Bonds, Transportation Commission Highway Improvement | 4/22 at 100.00 | AAA | 2,157,880 |
| | | Series 2012A, 5.000%, 4/01/42 | | | |
| 2,000 | | Texas State, General Obligation Bonds, Transportation Commission Highway Improvement, | 4/24 at 100.00 | AAA | 2,219,100 |
| | | Series 2014, 5.000%, 4/01/44 | | | |
| 2,000 | | Texas State, General Obligation Bonds, Transportation Commission Mobility Fund, | 4/24 at 100.00 | AAA | 2,253,480 |
| | | Refunding Series 2014, 5.000%, 10/01/34 | | | |
| | | West Texas Independent School District, McLennan and Hill Counties, General Obligation | | | |
| | | Refunding Bonds, Series 1998: | | | |
| 45 | | 0.000%, 8/15/22 | 3/19 at 83.20 | AAA | 37,364 |
| 45 | | 0.000%, 8/15/24 | 3/19 at 74.60 | AAA | 33,500 |
| 9,000 | | Wylie Independent School District, Collin County, Texas, General Obligation Bonds, | 8/25 at 44.15 | Aaa | 3,196,260 |
| | | Capital Appreciation Series 2015, 0.000%, 8/15/45 | | | |
| 43,270 | | Total Tax Obligation/General | | | 37,409,389 |
53
| | | | | | |
NTX | | Nuveen Texas Quality Municipal Income Fund | |
| | | Portfolio of Investments (continued) February 28, 2019 | | | |
| |
| |
| |
| |
| |
Principal | | | Optional Call | | |
Amount (000) | | Description (1) | Provisions (2) | Ratings (3) | Value |
| | | Tax Obligation/Limited – 26.9% (17.2% of Total Investments) | | | |
| $ 1,000 | | Bexar County, Texas, Venue Project Revenue Bonds, Refunding Combined Venue Tax Series | 8/19 at 100.00 | AA | $ 1,015,370 |
| | | 2010, 5.250%, 8/15/38 – AGM Insured | | | |
| | | Bexar County, Texas, Venue Project Revenue Bonds, Refunding Combined Venue Tax | | | |
| | | Series 2015: | | | |
| 1,060 | | 5.000%, 8/15/34 – AGM Insured | 8/24 at 100.00 | AA | 1,191,758 |
| 1,160 | | 5.000%, 8/15/35 – AGM Insured | 8/24 at 100.00 | AA | 1,302,297 |
| 1,175 | | Dallas Area Rapid Transit, Texas, Sales Tax Revenue Bonds, Refunding Senior Lien Series | 12/24 at 100.00 | AA+ | 1,339,829 |
| | | 2014A, 5.000%, 12/01/36 | | | |
| 1,680 | | Dallas Area Rapid Transit, Texas, Sales Tax Revenue Bonds, Refunding Series 2016A, | 12/25 at 100.00 | AA+ | 1,887,850 |
| | | 5.000%, 12/01/48 | | | |
| 500 | | Flower Mound, Texas, Special Assessment Revenue Bonds, River Walk Public Improvement | 9/19 at 103.00 | N/R | 506,515 |
| | | District 1, Series 2014, 6.500%, 9/01/36 | | | |
| 2,500 | | Harris County Metropolitan Transit Authority, Texas, Sales and Use Tax Revenue Bonds, | No Opt. Call | AAA | 2,990,000 |
| | | Contractual Obligations Series 2015B, 5.000%, 11/01/25 | | | |
| 1,390 | | Harris County Metropolitan Transit Authority, Texas, Sales and Use Tax Revenue Bonds, | 11/21 at 100.00 | AAA | 1,492,165 |
| | | Series 2011A, 5.000%, 11/01/41 | | | |
| | | Harris County-Houston Sports Authority, Texas, Revenue Bonds, Junior Lien Series 2001H: | | | |
| 450 | | 0.000%, 11/15/24 – NPFG Insured | No Opt. Call | Baa2 | 376,177 |
| 210 | | 0.000%, 11/15/32 – NPFG Insured | 11/31 at 94.05 | Baa2 | 120,494 |
| 260 | | 0.000%, 11/15/33 | 11/31 at 88.44 | Baa2 | 139,407 |
| 2,045 | | 0.000%, 11/15/34 – NPFG Insured | 11/31 at 83.17 | Baa2 | 1,024,749 |
| 1,130 | | 0.000%, 11/15/36 – NPFG Insured | 11/31 at 73.51 | Baa2 | 494,330 |
| 4,370 | | 0.000%, 11/15/38 – NPFG Insured | 11/31 at 64.91 | Baa2 | 1,671,306 |
| 2,260 | | 0.000%, 11/15/39 – NPFG Insured | 11/31 at 60.98 | Baa2 | 808,922 |
| 400 | | Harris County-Houston Sports Authority, Texas, Revenue Bonds, Refunding Second Lien | 11/24 at 100.00 | A3 | 444,276 |
| | | Series 2014C, 5.000%, 11/15/34 | | | |
| 1,000 | | Harris County-Houston Sports Authority, Texas, Revenue Bonds, Refunding Senior Lien | 11/24 at 100.00 | A2 | 1,137,710 |
| | | Series 2014A, 5.000%, 11/15/28 | | | |
| 3,440 | | Harris County-Houston Sports Authority, Texas, Revenue Bonds, Senior Lien Series 2001G, | 11/31 at 53.78 | A2 | 1,142,665 |
| | | 0.000%, 11/15/41 – NPFG Insured | | | |
| 1,000 | | Harris County-Houston Sports Authority, Texas, Revenue Bonds, Third Lien Series 2004A-3, | 11/24 at 59.10 | Baa2 | 489,120 |
| | | 0.000%, 11/15/33 – NPFG Insured | | | |
| 1,015 | | Houston, Texas, Hotel Occupancy Tax and Special Revenue Bonds, Convention and | 9/24 at 100.00 | A2 | 1,131,502 |
| | | Entertainment Facilities Department, Refunding Series 2014, 5.000%, 9/01/34 | | | |
| 1,470 | | Houston, Texas, Hotel Occupancy Tax and Special Revenue Bonds, Convention and | No Opt. Call | A2 | 897,700 |
| | | Entertainment Project, Series 2001B, 0.000%, 9/01/32 – AMBAC Insured | | | |
| 10,000 | | Texas State Transportation Commission, Highway Fund Revenue Bonds, First Tier Series | 10/26 at 100.00 | AAA | 11,865,700 |
| | | 2016A, 5.000%, 10/01/30 (UB) (4) | | | |
| 1,875 | | Texas State Transportation Commission, Highway Fund Revenue Bonds, Highway 249 First | 2/29 at 100.00 | Baa3 | 2,039,869 |
| | | Tier Series 2019A, 5.000%, 8/01/57 | | | |
| 2,490 | | Uptown Development Authority, Houston, Texas, Tax Increment Contract Revenue Bonds, | 9/25 at 100.00 | Baa2 | 2,656,954 |
| | | Infrastructure Improvement Facilities, Series 2018, 5.000%, 9/01/40 | | | |
| 1,735 | | Via Metropolitan Transit Advanced Transportation District, Texas, Sales Tax Revenue | 8/24 at 100.00 | AA | 1,982,428 |
| | | Bonds, Refunding & Improvement Series 2014, 5.000%, 8/01/38 | | | |
| 45,615 | | Total Tax Obligation/Limited | | | 40,149,093 |
| | | Transportation – 22.0% (14.0% of Total Investments) | | | |
| 3,000 | | Austin, Texas, Airport System Revenue Bonds, Series 2015, 5.000%, 11/15/39 (AMT) | 11/24 at 100.00 | A1 | 3,307,200 |
| 665 | | Central Texas Regional Mobility Authority, Revenue Bonds, Refunding Subordinate Lien | 1/23 at 100.00 | BBB+ | 707,380 |
| | | Series 2013, 5.000%, 1/01/42 | | | |
54
| | | | | | |
Principal | | | Optional Call | | |
Amount (000) | | Description (1) | Provisions (2) | Ratings (3) | Value |
| | | Transportation (continued) | | | |
| | | Central Texas Regional Mobility Authority, Revenue Bonds, Senior Lien Series 2010: | | | |
| $ 2,945 | | 0.000%, 1/01/36 | No Opt. Call | A– | $ 1,554,548 |
| 2,205 | | 0.000%, 1/01/37 | No Opt. Call | A– | 1,098,641 |
| 2,160 | | 0.000%, 1/01/38 | No Opt. Call | A– | 1,023,170 |
| 1,000 | | 0.000%, 1/01/40 | No Opt. Call | A– | 430,300 |
| 1,000 | | Dallas-Fort Worth International Airport, Texas, Joint Revenue Bonds, Refunding Series | 11/20 at 100.00 | A+ | 1,039,850 |
| | | 2010A, 5.000%, 11/01/42 | | | |
| 1,165 | | Dallas-Fort Worth International Airport, Texas, Joint Revenue Bonds, Refunding Series | 11/20 at 100.00 | A+ | 1,216,458 |
| | | 2012B, 5.000%, 11/01/35 | | | |
| 1,670 | | Grand Parkway Transportation Corporation, Texas, System Toll Revenue Bonds, First Tier | 10/23 at 100.00 | A+ | 1,809,462 |
| | | Series 2013A, 5.125%, 10/01/43 | | | |
| 1,640 | | Grand Parkway Transportation Corporation, Texas, System Toll Revenue Bonds, Subordinate | 10/23 at 100.00 | AA+ | 1,766,378 |
| | | Lien Series 2013B, 5.000%, 4/01/53 | | | |
| 1,165 | | Harris County, Texas, Toll Road Revenue Bonds, Refunding Senior Lien Series 2012C, | 8/22 at 100.00 | AA | 1,273,462 |
| | | 5.000%, 8/15/31 | | | |
| 5,150 | | Harris County, Texas, Toll Road Revenue Bonds, Refunding Senior Lien Series 2016A, | 8/26 at 100.00 | Aa2 | 5,794,935 |
| | | 5.000%, 8/15/41 | | | |
| 2,000 | | Houston, Texas, Airport System Revenue Bonds, Refunding Subordinate Lien Series Series | 7/22 at 100.00 | A+ | 2,151,280 |
| | | 2012A, 5.000%, 7/01/31 (AMT) | | | |
| 1,750 | | Love Field Airport Modernization Corporation, Texas, General Airport Revenue Bonds | 11/25 at 100.00 | A1 | 1,959,020 |
| | | Series 2015, 5.000%, 11/01/35 (AMT) | | | |
| 3,000 | | Love Field Airport Modernization Corporation, Texas, Special Facilities Revenue Bonds, | 11/20 at 100.00 | A3 | 3,117,240 |
| | | Southwest Airlines Company, Series 2010, 5.250%, 11/01/40 | | | |
| | | North Texas Tollway Authority, System Revenue Bonds, First Tier Series 2009A: | | | |
| 20 | | 6.100%, 1/01/28 | 3/19 at 100.00 | A+ | 20,062 |
| 375 | | 6.250%, 1/01/39 | 3/19 at 100.00 | A+ | 376,189 |
| 2,500 | | North Texas Tollway Authority, System Revenue Bonds, Refunding First Tier, Series 2008D, | No Opt. Call | AA | 1,402,850 |
| | | 0.000%, 1/01/36 – AGC Insured | | | |
| 2,500 | | San Antonio, Texas, Airport System Revenue Bonds, Refunding Series 2012, 5.000%, | 7/22 at 100.00 | A+ | 2,723,250 |
| | | 7/01/27 (AMT) | | | |
| 35,910 | | Total Transportation | | | 32,771,675 |
| | | U.S. Guaranteed – 15.1% (9.7% of Total Investments) (5) | | | |
| 2,500 | | Bexar Metropolitan Water District, Texas, Waterworks System Revenue Bonds, Refunding | 5/20 at 100.00 | AA | 2,621,525 |
| | | Series 2010, 5.875%, 5/01/40 (Pre-refunded 5/01/20) | | | |
| 185 | | El Paso County, Texas, Certificates of Obligation, Series 2001, 5.000%, 2/15/21 – | No Opt. Call | AA | 196,899 |
| | | AGM Insured (ETM) | | | |
| 1,350 | | Harrison County Health Facilities Development Corporation, Texas, Hospital Revenue | 7/20 at 100.00 | A | 1,412,127 |
| | | Bonds, Good Shepherd Health System, Refunding Series 2010, 5.250%, 7/01/28 | | | |
| | | (Pre-refunded 7/01/20) | | | |
| 2,000 | | Laredo Community College District, Webb County, Texas, Combined Fee Revenue Bonds, | 8/20 at 100.00 | AA | 2,099,220 |
| | | Series 2010, 5.250%, 8/01/35 (Pre-refunded 8/01/20) – AGM Insured | | | |
| 4,000 | | Laredo, Webb County, Texas, Waterworks and Sewer System Revenue Bonds, Series 2010, | 3/20 at 100.00 | AA– | 4,140,640 |
| | | 5.250%, 3/01/40 (Pre-refunded 3/01/20) | | | |
| 365 | | Lone Star College System, Harris and Montgomery Counties, Texas, General Obligation | 8/19 at 100.00 | AAA | 370,687 |
| | | Bonds, Series 2009, 5.000%, 8/15/34 (Pre-refunded 8/15/19) | | | |
| 25 | | Lower Colorado River Authority, Texas, Revenue Bonds, Refunding Series 2012B, 5.000%, | 5/22 at 100.00 | N/R | 27,499 |
| | | 5/15/29 (Pre-refunded 5/15/22) | | | |
| 845 | | North Central Texas Health Facilities Development Corporation, Hospital Revenue Bonds, | No Opt. Call | Aaa | 971,167 |
| | | Presbyterian Healthcare System, Series 1996A, 5.750%, 6/01/26 – NPFG Insured (ETM) | | | |
| 2,000 | | North Central Texas Health Facilities Development Corporation, Texas, Revenue Bonds, | 8/19 at 100.00 | Aa2 | 2,037,360 |
| | | Children’s Medical Center Dallas Project, Series 2009, 5.750%, 8/15/39 (Pre-refunded 8/15/19) | | | |
55
| | | | | | |
NTX | | Nuveen Texas Quality Municipal Income Fund | |
| | | Portfolio of Investments (continued) | | | |
| | | February 28, 2019 | | | |
| |
| |
Principal | | | Optional Call | | |
Amount (000) | | Description (1) | Provisions (2) | Ratings (3) | Value |
| | | U.S. Guaranteed (5) (continued) | | | |
| $ 885 | | North Central Texas Health Facilities Development Corporation, Texas, Revenue Bonds, | 8/22 at 100.00 | Aa2 | $ 983,005 |
| | | Children’s Medical Center Dallas Project, Series 2012, 5.000%, 8/15/32 (Pre-refunded 8/15/22) | | | |
| 3,000 | | North Texas Tollway Authority, Special Projects System Revenue Bonds, Current Interest | 9/21 at 100.00 | N/R | 3,240,510 |
| | | Series 2011D, 5.000%, 9/01/31 (Pre-refunded 9/01/21) | | | |
| 2,000 | | North Texas Tollway Authority, Special Projects System Revenue Bonds, Series 2011A, | 9/21 at 100.00 | N/R | 2,184,640 |
| | | 5.500%, 9/01/41 (Pre-refunded 9/01/21) | | | |
| | | Tarrant County Cultural Education Facilities Finance Corporation, Texas, Hospital | | | |
| | | Revenue Bonds, Scott & White Healthcare Project, Series 2010: | | | |
| 95 | | 5.250%, 8/15/40 (Pre-refunded 8/15/20) | 8/20 at 100.00 | N/R | 99,842 |
| 1,155 | | 5.250%, 8/15/40 (Pre-refunded 8/15/20) | 8/20 at 100.00 | N/R | 1,213,870 |
| 1,000 | | Uptown Development Authority, Houston, Texas, Tax Increment Contract Revenue Bonds, | 9/19 at 100.00 | BBB | 1,018,820 |
| | | Infrastructure Improvement Facilities, Series 2009, 5.500%, 9/01/29 (Pre-refunded 9/01/19) | | | |
| 21,405 | | Total U.S. Guaranteed | | | 22,617,811 |
| | | Utilities – 15.4% (9.8% of Total Investments) | | | |
| 2,000 | | Austin, Texas, Electric Utility System Revenue Bonds, Refunding Series 2012A, | 11/22 at 100.00 | AA | 2,187,580 |
| | | 5.000%, 11/15/40 | | | |
| 3,000 | | Austin, Texas, Electric Utility System Revenue Bonds, Refunding Series 2015A, | 11/25 at 100.00 | AA | 3,408,420 |
| | | 5.000%, 11/15/38 | | | |
| 2,000 | | Brownsville, Texas, Utility System Revenue Bonds, Refunding Series 2015, 5.000%, 9/01/31 | 9/25 at 100.00 | A+ | 2,309,940 |
| 3,000 | | Lower Colorado River Authority, Texas, Revenue Bonds, Refunding Series 2010A, | 5/20 at 100.00 | A | 3,096,360 |
| | | 5.000%, 5/15/40 | | | |
| 1,150 | | Lower Colorado River Authority, Texas, Revenue Bonds, Refunding Series 2012A, | 5/22 at 100.00 | A | 1,242,311 |
| | | 5.000%, 5/15/36 | | | |
| 1,975 | | Lower Colorado River Authority, Texas, Revenue Bonds, Refunding Series 2012B, | 5/22 at 100.00 | A | 2,152,000 |
| | | 5.000%, 5/15/29 | | | |
| 1,500 | | Matagorda County Navigation District Number One, Texas, Pollution Control Revenue | 7/19 at 102.00 | A– | 1,549,560 |
| | | Refunding Bonds, Central Power and Light Company Project, Series 2009A, 6.300%, 11/01/29 | | | |
| 1,000 | | Sam Rayburn Municipal Power Agency, Texas, Power Supply System Revenue Bonds, Refunding | No Opt. Call | BBB+ | 1,041,990 |
| | | Series 2012, 5.000%, 10/01/20 | | | |
| 2,790 | | Texas Municipal Gas Acquisition and Supply Corporation I, Gas Supply Revenue Bonds, | No Opt. Call | A– | 3,227,500 |
| | | Senior Lien Series 2008D, 6.250%, 12/15/26 | | | |
| 1,000 | | Texas Municipal Gas Acquisition and Supply Corporation I, Gas Supply Revenue Bonds, | No Opt. Call | A– | 1,056,340 |
| | | Series 2006A, 5.250%, 12/15/20 | | | |
| | | Texas Municipal Power Agency, Revenue Bonds, Refunding Transmission Series 2010: | | | |
| 640 | | 5.000%, 9/01/34 | 9/20 at 100.00 | A+ | 667,526 |
| 1,000 | | 5.000%, 9/01/40 | 9/20 at 100.00 | A+ | 1,040,310 |
| 21,055 | | Total Utilities | | | 22,979,837 |
| | | Water and Sewer – 30.9% (19.7% of Total Investments) | | | |
| 1,450 | | Austin, Texas, Water and Wastewater System Revenue Bonds, Refunding Series 2016A, | 11/26 at 100.00 | AA | 1,643,575 |
| | | 5.000%, 11/15/41 | | | |
| 1,575 | | Bell County Water Control Improvement District 1, Texas, Water Revenue Bonds, Series | 7/23 at 100.00 | AA | 1,736,075 |
| | | 2014, 5.000%, 7/10/38 – BAM Insured | | | |
| 2,500 | | Canadian River Municipal Water Authority, Texas, Contract Revenue Bonds, Conjunctive Use | 2/21 at 100.00 | AA | 2,644,800 |
| | | Groundwater Supply Project, Subordinate Lien Series 2011, 5.000%, 2/15/31 | | | |
| 2,000 | | Corpus Christi, Texas, Utility System Revenue Bonds, Improvement Junior Lien Series | 7/23 at 100.00 | A+ | 2,192,940 |
| | | 2013, 5.000%, 7/15/43 | | | |
| 2,000 | | Houston, Texas, Combined Utility System Revenue Bonds, Refunding First Lien Series | 11/22 at 100.00 | AA | 2,171,320 |
| | | 2012D, 5.000%, 11/15/42 | | | |
| 3,000 | | Houston, Texas, Combined Utility System Revenue Bonds, Refunding First Lien Series | 11/28 at 100.00 | Aa2 | 3,523,890 |
| | | 2018D, 5.000%, 11/15/36 | | | |
56
| | | | | | |
Principal | | | Optional Call | | |
Amount (000) | | Description (1) | Provisions (2) | Ratings (3) | Value |
| | | Water and Sewer (continued) | | | |
| $ 710 | | North Fort Bend Water Authority, Texas, Water System Revenue Bonds, Series 2011, 5.000%, | 12/21 at 100.00 | AA | $ 763,697 |
| | | 12/15/36 – AGM Insured | | | |
| 3,860 | | North Harris County Regional Water Authority, Texas, Water Revenue Bonds, Refunding | 12/22 at 100.00 | AA– | 4,254,647 |
| | | Senior Lien Series 2013, 5.000%, 12/15/33 | | | |
| 1,000 | | Nueces River Authority, Texas, Water Supply Revenue Bonds, Corpus Christi Lake Texana | 7/25 at 100.00 | AA– | 1,177,770 |
| | | Project, Refunding Series 2015, 5.000%, 7/15/26 | | | |
| 2,640 | | San Antonio, Texas, Water System Revenue Bonds, Refunding Junior Lien Series 2015B, | 5/25 at 100.00 | AA | 2,997,139 |
| | | 5.000%, 5/15/34 | | | |
| 1,000 | | San Antonio, Texas, Water System Revenue Bonds, Refunding Junior Lien Series 2018A, | 5/28 at 100.00 | AA | 1,140,260 |
| | | 5.000%, 5/15/48 | | | |
| | | Texas Water Development Board, State Water Implementation Revenue Fund Bonds, Master | | | |
| | | Trust Series 2017A: | | | |
| 5,000 | | 5.000%, 10/15/42 | 10/27 at 100.00 | AAA | 5,734,550 |
| 10,000 | | 4.000%, 10/15/42 (UB) (4) | 10/27 at 100.00 | AAA | 10,454,000 |
| 5,000 | | Texas Water Development Board, State Water Implementation Revenue Fund Bonds, Master | 10/28 at 100.00 | AAA | 5,746,000 |
| | | Trust Series 2018B, 5.000%, 4/15/49 | | | |
| 41,735 | | Total Water and Sewer | | | 46,180,663 |
| $ 238,710 | | Total Long-Term Investments (cost $220,941,550) | | | 233,859,947 |
| | | Floating Rate Obligations – (10.7)% | | | (16,000,000) |
| | | MuniFund Preferred Shares, net of deferred offering costs – (48.0)% (6) | | | (71,637,960) |
| | | Other Assets Less Liabilities – 2.1% | | | 3,094,754 |
| | | Net Asset Applicable to Common Shares – 100% | | | $ 149,316,741 |
| | |
| (1) | All percentages shown in the Portfolio of Investments are based on net assets applicable to common shares unless otherwise noted. |
| (2) | Optional Call Provisions: Dates (month and year) and prices of the earliest optional call or redemption. There may be other call provisions at varying prices at later dates. Certain mortgage-backed securities may be subject to periodic principal paydowns. Optional Call Provisions are not covered by the report of independent registered public accounting firm. |
| (3) | For financial reporting purposes, the ratings disclosed are the highest of Standard & Poor’s Group (“Standard & Poor’s”), Moody’s Investors Service, Inc. (“Moody’s”) or Fitch, Inc. (“Fitch”) rating. This treatment of split-rated securities may differ from that used for other purposes, such as for Fund investment policies. Ratings below BBB by Standard & Poor’s, Baa by Moody’s or BBB by Fitch are considered to be below investment grade. Holdings designated N/R are not rated by any of these national rating agencies. Ratings are not covered by the report of independent registered public accounting firm. |
| (4) | Investment, or portion of investment, has been pledged to collateralize the net payment obligations for investments in inverse floating rate transactions. |
| (5) | Backed by an escrow or trust containing sufficient U.S. Government or U.S. Government agency securities, which ensure the timely payment of principal and interest. |
| (6) | MuniFund Preferred Shares, net of deferred offering costs as a percentage of Total Investments is 30.6%. |
| AMT | Alternative Minimum Tax. |
| ETM | Escrowed to maturity. |
| UB | Underlying bond of an inverse floating rate trust reflected as a financing transaction. See Notes to Financial Statements, Note 3 – Portfolio Securities and Investments in Derivatives. Inverse Floating Rate Securities for more information. |
| | See accompanying notes to financial statements. |
57
Statement of Assets and Liabilities
February 28, 2019
| | | | | | | | | | | | | |
| | | NAZ | | | NUM | | | NUO | | | NTX | |
Assets | | | | | | | | | | | | |
| Long-term investments, at value (cost $249,045,485, $464,144,323, | | | | | | | | | | | | |
| $440,422,999 and $220,941,550, respectively) | | $ | 259,649,328 | | | $ | 484,976,664 | | | $ | 460,418,868 | | | $ | 233,859,947 | |
| Cash | | | 893,644 | | | | 1,168,693 | | | | 1,331,596 | | | | — | |
| Receivable for: | | | | | | | | | | | | | | | | |
| Interest | | | 2,319,728 | | | | 6,204,970 | | | | 4,846,229 | | | | 2,552,585 | |
| Investments sold | | | — | | | | — | | | | — | | | | 1,500,000 | |
| Other assets | | | 1,025 | | | | 50,048 | | | | 23,626 | | | | 4,955 | |
| Total assets | | | 262,863,725 | | | | 492,400,375 | | | | 466,620,319 | | | | 237,917,487 | |
Liabilities | | | | | | | | | | | | | | | | |
| Cash overdraft | | | — | | | | — | | | | — | | | | 375,147 | |
| Floating rate obligations | | | 9,755,000 | | | | 12,265,000 | | | | 20,000,000 | | | | 16,000,000 | |
| Payable for: | | | | | | | | | | | | | | | | |
| Dividends | | | 465,354 | | | | 848,613 | | | | 765,674 | | | | 420,138 | |
| Interest | | | 165,181 | | | | 323,628 | | | | — | | | | — | |
| Adjustable Rate MuniFund Term Preferred (“AMTP”) Shares, net of deferred | | | | | | | | | | | | | | | | |
| offering costs (liquidation preference $88,300,000, $173,000,000, $—, | | | | | | | | | | | | | | | | |
| and $—, respectively) | | | 88,143,383 | | | | 172,804,230 | | | | — | | | | — | |
| MuniFund Preferred (“MFP”) Shares, net of deferred offering costs | | | | | | | | | | | | | | | | |
| (liquidation preference $—, $—, $— and $72,000,000, respectively) | | | — | | | | — | | | | — | | | | 71,637,960 | |
| Variable Rate Demand Preferred (“VRDP”) Shares, net of deferred | | | | | | | | | | | | | | | | |
| offering costs (liquidation preference $—, $—, $148,000,000, | | | | | | | | | | | | | | | | |
| and $—, respectively) | | | — | | | | — | | | | 147,759,533 | | | | — | |
| Accrued expenses: | | | | | | | | | | | | | | | | |
| Management fees | | | 123,894 | | | | 220,848 | | | | 214,025 | | | | 109,687 | |
| Trustees fees | | | 1,250 | | | | 51,089 | | | | 20,446 | | | | 1,095 | |
| Other | | | 129,196 | | | | 142,368 | | | | 86,269 | | | | 56,719 | |
| Total liabilities | | | 98,783,258 | | | | 186,655,776 | | | | 168,845,947 | | | | 88,600,746 | |
| Net assets applicable to common shares | | $ | 164,080,467 | | | $ | 305,744,599 | | | $ | 297,774,372 | | | $ | 149,316,741 | |
| Common shares outstanding | | | 11,571,158 | | | | 20,226,887 | | | | 18,316,955 | | | | 9,958,610 | |
| Net asset value (“NAV”) per common share outstanding | | $ | 14.18 | | | $ | 15.12 | | | $ | 16.26 | | | $ | 14.99 | |
Net assets applicable to common shares consist of: | | | | | | | | | | | | | | | | |
| Common shares, $0.01 par value per share | | $ | 115,712 | | | $ | 202,269 | | | $ | 183,170 | | | $ | 99,586 | |
| Paid-in-surplus | | | 156,322,204 | | | | 287,690,665 | | | | 278,282,549 | | | | 140,204,336 | |
| Total distributable earnings | | | 7,642,551 | | | | 17,851,665 | | | | 19,308,653 | | | | 9,012,819 | |
| Net assets applicable to common shares | | $ | 164,080,467 | | | $ | 305,744,599 | | | $ | 297,774,372 | | | $ | 149,316,741 | |
| Authorized shares: | | | | | | | | | | | | | | | | |
| Common | | Unlimited | | | Unlimited | | | Unlimited | | | Unlimited | |
| Preferred | | Unlimited | | | Unlimited | | | Unlimited | | | Unlimited | |
See accompanying notes to financial statements.
58
| | | | | |
| Statement of Operations | | | |
| |
Year Ended February 28, 2019 | | | |
| |
| |
| |
| | |
| | | NAZ | | | NUM | | | NUO | | | NTX | |
Investment Income | | $ | 10,332,383 | | | $ | 18,738,054 | | | $ | 17,135,237 | | | $ | 9,065,077 | |
Expenses | | | | | | | | | | | | | | | | |
| Management fees | | | 1,601,851 | | | | 2,882,629 | | | | 2,862,450 | | | | 1,425,296 | |
| Interest expense and amortization of offering costs | | | 2,266,639 | | | | 4,380,748 | | | | 3,798,602 | | | | 1,984,922 | |
| Custodian fees | | | 42,538 | | | | 62,192 | | | | 56,512 | | | | 33,407 | |
| Trustees fees | | | 7,444 | | | | 14,173 | | | | 13,139 | | | | 6,511 | |
| Professional fees | | | 42,845 | | | | 47,240 | | | | 87,843 | | | | 36,497 | |
| Shareholder reporting expenses | | | 24,047 | | | | 41,032 | | | | 41,688 | | | | 26,126 | |
| Shareholder servicing agent fees | | | 15,158 | | | | 26,119 | | | | 8,579 | | | | 4,159 | |
| Stock exchange listing fees | | | 7,198 | | | | 6,742 | | | | 6,742 | | | | 6,742 | |
| Investor relations expenses | | | 5,062 | | | | 8,947 | | | | 8,384 | | | | 4,424 | |
| Shelf offering expenses | | | 200,208 | | | | — | | | | — | | | | — | |
| Other | | | 37,648 | | | | 45,022 | | | | 61,747 | | | | 39,886 | |
| Total expenses | | | 4,250,638 | | | | 7,514,844 | | | | 6,945,686 | | | | 3,567,970 | |
| Net investment income (loss) | | | 6,081,745 | | | | 11,223,210 | | | | 10,189,551 | | | | 5,497,107 | |
Realized and Unrealized Gain (Loss) | | | | | | | | | | | | | | | | |
| Net realized gain (loss) from investments | | | (437,782 | ) | | | (1,094,781 | ) | | | (179,947 | ) | | | (869,105 | ) |
| Change in net unrealized appreciation (depreciation) of investments | | | 889,889 | | | | 2,661,036 | | | | 2,782,168 | | | | 1,109,883 | |
| Net realized and unrealized gain (loss) | | | 452,107 | | | | 1,566,255 | | | | 2,602,221 | | | | 240,778 | |
| Net increase (decrease) in net assets applicable to | | | | | | | | | | | | | | | | |
| common shares from operations | | $ | 6,533,852 | | | $ | 12,789,465 | | | $ | 12,791,772 | | | $ | 5,737,885 | |
See accompanying notes to financial statements.
59
Statement of Changes in Net Assets
| | | | | | | | | | | | | |
| | | NAZ | | | NUM | |
| | | Year | | | Year(1) | | | Year | | | Year(1) | |
| | | Ended | | | Ended | | | Ended | | | Ended | |
| | | 2/28/19 | | | 2/28/18 | | | 2/28/19 | | | 2/28/18 | |
Operations | | | | | | | | | | | | |
| Net investment income (loss) | | $ | 6,081,745 | | | $ | 7,342,444 | | | $ | 11,223,210 | | | $ | 12,701,288 | |
| Net realized gain (loss) from investments | | | (437,782 | ) | | | 2,324,539 | | | | (1,094,781 | ) | | | 111,781 | |
| Change in net unrealized appreciation (depreciation) of investments | | | 889,889 | | | | (3,887,305 | ) | | | 2,661,036 | | | | (2,895,282 | ) |
| Net increase (decrease) in net assets applicable | | | | | | | | | | | | | | | | |
| to common shares from operations | | | 6,533,852 | | | | 5,779,678 | | | | 12,789,465 | | | | 9,917,787 | |
Distributions to Common Shareholders(2) | | | | | | | | | | | | | | | | |
Dividends(3) | | | (6,065,999 | ) | | | (7,491,154 | ) | | | (10,961,603 | ) | | | (13,015,363 | ) |
| Decrease in net assets applicable to common | | | | | | | | | | | | | | | | |
| shares from distributions to common shareholders | | | (6,065,999 | ) | | | (7,491,154 | ) | | | (10,961,603 | ) | | | (13,015,363 | ) |
Capital Share Transactions | | | | | | | | | | | | | | | | |
| Common shares: | | | | | | | | | | | | | | | | |
| Proceeds from shelf offering, net of offering costs | | | 69,117 | | | | 1,484,129 | | | | — | | | | — | |
| Net proceeds from shares issued to shareholders | | | | | | | | | | | | | | | | |
| due to reinvestment of distributions | | | — | | | | 111,107 | | | | — | | | | — | |
| Cost of shares repurchased and retired | | | (1,481,001 | ) | | | — | | | | (7,000,749 | ) | | | (281,969 | ) |
| Net increase (decrease) in net assets applicable to | | | | | | | | | | | | | | | | |
| common shares from capital share transactions | | | (1,411,884 | ) | | | 1,595,236 | | | | (7,000,749 | ) | | | (281,969 | ) |
| Net increase (decrease) in net assets applicable to | | | | | | | | | | | | | | | | |
| common shares | | | (944,031 | ) | | | (116,240 | ) | | | (5,172,887 | ) | | | (3,379,545 | ) |
| Net assets applicable to common shares at the | | | | | | | | | | | | | | | | |
| beginning of period | | | 165,024,498 | | | | 165,140,738 | | | | 310,917,486 | | | | 314,297,031 | |
| Net assets applicable to common shares at | | | | | | | | | | | | | | | | |
| the end of period | | $ | 164,080,467 | | | $ | 165,024,498 | | | $ | 305,744,599 | | | $ | 310,917,486 | |
| (1) | Prior period amounts have been conformed to current year presentation. See Notes to Financial Statements, Note 9 – New Accounting Pronouncements for further details. |
| (2) | The composition and per share amounts of the Funds’ distributions are presented in the Financial Highlights. The distribution information for the Fund as of its most recent tax year end is presented within the Notes to Financial Statements, Note 6 – Income Tax Information. |
| (3) | For the fiscal year ended February 28, 2018 the Fund’s distributions to shareholders were paid from net investment income. |
See accompanying notes to financial statements.
60
| | | | | | | | | | | | | |
| | | NUO | | | NTX | |
| | | Year | | | Year(1) | | | Year | | | Year(1) | |
| | | Ended | | | Ended | | | Ended | | | Ended | |
| | | 2/28/19 | | | 2/28/18 | | | 2/28/19 | | | 2/28/18 | |
Operations | | | | | | | | | | | | |
| Net investment income (loss) | | $ | 10,189,551 | | | $ | 12,573,364 | | | $ | 5,497,107 | | | $ | 5,744,052 | |
| Net realized gain (loss) from investments | | | (179,947 | ) | | | 3,405,401 | | | | (869,105 | ) | | | 440,616 | |
| Change in net unrealized appreciation (depreciation) of investments | | | 2,782,168 | | | | (6,878,414 | ) | | | 1,109,883 | | | | (1,829,092 | ) |
| Net increase (decrease) in net assets applicable | | | | | | | | | | | | | | | | |
| to common shares from operations | | | 12,791,772 | | | | 9,100,351 | | | | 5,737,885 | | | | 4,355,576 | |
Distributions to Common Shareholders(2) | | | | | | | | | | | | | | | | |
Dividends(3) | | | (10,903,460 | ) | | | (13,161,701 | ) | | | (5,461,380 | ) | | | (6,412,401 | ) |
| Decrease in net assets applicable to common | | | | | | | | | | | | | | | | |
| shares from distributions to common shareholders | | | (10,903,460 | ) | | | (13,161,701 | ) | | | (5,461,380 | ) | | | (6,412,401 | ) |
Capital Share Transactions | | | | | | | | | | | | | | | | |
| Common shares: | | | | | | | | | | | | | | | | |
| Proceeds from shelf offering, net of offering costs | | | — | | | | — | | | | — | | | | — | |
| Net proceeds from shares issued to shareholders | | | | | | | | | | | | | | | | |
| due to reinvestment of distributions | | | — | | | | — | | | | — | | | | — | |
| Cost of shares repurchased and retired | | | (2,742,770 | ) | | | — | | | | (846,987 | ) | | | — | |
| Net increase (decrease) in net assets applicable to | | | | | | | | | | | | | | | | |
| common shares from capital share transactions | | | (2,742,770 | ) | | | — | | | | (846,987 | ) | | | — | |
| Net increase (decrease) in net assets applicable to | | | | | | | | | | | | | | | | |
| common shares | | | (854,458 | ) | | | (4,061,350 | ) | | | (570,482 | ) | | | (2,056,825 | ) |
| Net assets applicable to common shares at the | | | | | | | | | | | | | | | | |
| beginning of period | | | 298,628,830 | | | | 302,690,180 | | | | 149,887,223 | | | | 151,944,048 | |
| Net assets applicable to common shares at | | | | | | | | | | | | | | | | |
| the end of period | | $ | 297,774,372 | | | $ | 298,628,830 | | | $ | 149,316,741 | | | $ | 149,887,223 | |
| (1) | Prior period amounts have been conformed to current year presentation. See Notes to Financial Statements, Note 9 – New Accounting Pronouncements for further details. |
| (2) | The composition and per share amounts of the Funds’ distributions are presented in the Financial Highlights. The distribution information for the Fund as of its most recent tax year end is presented within the Notes to Financial Statements, Note 6 – Income Tax Information. |
| (3) | For the fiscal year ended February 28, 2018 the Fund’s distributions to shareholders were paid from net investment income. |
See accompanying notes to financial statements.
61
| |
| Statement of Cash Flows |
| |
| Year Ended February 28, 2019 |
| |
| | |
| | | NAZ | | | NUM | | | NUO | | | NTX | |
Cash Flows from Operating Activities: | | | | | | | | | | | | |
Net Increase (Decrease) in Net Assets Applicable to Common Shares | | | | | | | | | | | | |
from Operations | | $ | 6,533,852 | | | $ | 12,789,465 | | | $ | 12,791,772 | | | $ | 5,737,885 | |
| Adjustments to reconcile the net increase (decrease) in net assets | | | | | | | | | | | | | | | | |
| applicable to common shares from operations to net cash provided | | | | | | | | | | | | | | | | |
| by (used in) operating activities: | | | | | | | | | | | | | | | | |
| Purchases of investments | | | (34,917,614 | ) | | | (64,586,201 | ) | | | (56,155,633 | ) | | | (42,204,750 | ) |
| Proceeds from sales and maturities of investments | | | 28,490,530 | | | | 68,015,535 | | | | 56,608,760 | | | | 42,086,765 | |
| Taxes paid | | | (463 | ) | | | (5,365 | ) | | | (44,065 | ) | | | (252 | ) |
| Amortization (Accretion) of premiums and discounts, net | | | 1,759,153 | | | | 3,597,749 | | | | 3,335,919 | | | | 962,526 | |
| Amortization of deferred offering costs | | | 145,855 | | | | 22,167 | | | | 9,786 | | | | 12,691 | |
| (Increase) Decrease in: | | | | | | | | | | | | | | | | |
| Receivable for interest | | | 18,170 | | | | 207,448 | | | | 211,859 | | | | (149,884 | ) |
| Receivable for investments sold | | | 2,269,155 | | | | — | | | | 25,000 | | | | 678,490 | |
| Other assets | | | 27 | | | | 274 | | | | (768 | ) | | | 1,195 | |
| Increase (Decrease) in: | | | | | | | | | | | | | | | | |
| Payable for interest | | | 31,908 | | | | 62,516 | | | | — | | | | — | |
| Payable for investments purchased | | | (2,256,923 | ) | | | — | | | | — | | | | — | |
| Accrued management fees | | | 2,173 | | | | (3,129 | ) | | | (8,354 | ) | | | (575 | ) |
| Accrued Trustees fees | | | (1,553 | ) | | | (5,054 | ) | | | (2,914 | ) | | | (1,358 | ) |
| Accrued other expenses | | | 57,561 | | | | 33,679 | | | | (20,797 | ) | | | (7,306 | ) |
| Net realized (gain) loss from investments | | | 437,782 | | | | 1,094,781 | | | | 179,947 | | | | 869,105 | |
| Change in net unrealized (appreciation) depreciation of investments | | | (889,889 | ) | | | (2,661,036 | ) | | | (2,782,168 | ) | | | (1,109,883 | ) |
| Net cash provided by (used in) operating activities | | | 1,679,724 | | | | 18,562,829 | | | | 14,148,344 | | | | 6,874,649 | |
Cash Flows from Financing Activities: | | | | | | | | | | | | | | | | |
| (Payments for) deferred offering costs | | | (160,000 | ) | | | (200,000 | ) | | | — | | | | — | |
| Proceeds from shelf offering, net of offering costs | | | 69,117 | | | | — | | | | — | | | | — | |
| Proceeds from AMTP Shares issued, at liquidation preference | | | 88,300,000 | | | | 173,000,000 | | | | — | | | | — | |
| (Payments for) VMTP Shares redeemed, at liquidation preference | | | (88,300,000 | ) | | | (173,000,000 | ) | | | — | | | | — | |
| Increase (Decrease) in: | | | | | | | | | | | | | | | | |
| Cash overdraft | | | (52,223 | ) | | | — | | | | — | | | | (481,472 | ) |
| Floating rate obligations | | | 7,000,000 | | | | — | | | | — | | | | — | |
| Cash distributions paid to common shareholders | | | (6,161,973 | ) | | | (11,042,388 | ) | | | (11,009,059 | ) | | | (5,546,190 | ) |
| Cost of common shares repurchased and retired | | | (1,481,001 | ) | | | (7,000,749 | ) | | | (2,742,770 | ) | | | (846,987 | ) |
| Net cash provided by (used in) financing activities | | | (786,080 | ) | | | (18,243,137 | ) | | | (13,751,829 | ) | | | (6,874,649 | ) |
Net Increase (Decrease) in Cash | | | 893,644 | | | | 319,692 | | | | 396,515 | | | | — | |
| Cash at beginning of period | | | — | | | | 849,001 | | | | 935,081 | | | | — | |
| Cash at end of period | | $ | 893,644 | | | $ | 1,168,693 | | | $ | 1,331,596 | | | $ | — | |
| | |
Supplemental Disclosures of Cash Flow Information | | NAZ | | | NUM | | | NUO | | | NTX | |
| Cash paid for interest (excluding amortization of offering costs) | | $ | 2,219,967 | | | $ | 4,296,026 | | | $ | 3,788,817 | | | $ | 1,972, 230 | |
See accompanying notes to financial statements.
62
THIS PAGE INTENTIONALLY LEFT BLANK
63
| |
| Financial Highlights |
| |
| |
| |
| |
| Selected data for a common share outstanding throughout each period: |
| |
| | |
| | | | | | Investment Operations | | | Less Distributions to Common Shareholders | | | Common Share | |
| | | Beginning Common Share NAV | | | Net Investment Income (Loss) | | | Net Realized/ Unrealized Gain (Loss) | | | Total | | | From Net Investment Income | | | From Accumulated Net Realized Gains | | | Total | | | Shelf Offering Costs | | | Premium per Share Sold through Shelf Offering | | | Discount per Share Repurchased and Retired | | | Ending NAV | | | Ending Share Price | |
NAZ | | | | | | | | | | | | | | | | | | | | | | | | | | | | | | | | | | | | |
Year Ended 2/28–2/29: | | | | | | | | | | | | | | | | | | | |
| 2019 | | $ | 14.11 | | | $ | 0.52 | | | $ | 0.04 | | | $ | 0.56 | | | $ | (0.52 | ) | | $ | — | | | $ | (0.52 | ) | | $ | 0.01 | | | $ | — | | | $ | 0.02 | | | $ | 14.18 | | | $ | 12.46 | |
| 2018 | | | 14.26 | | | | 0.63 | | | | (0.13 | ) | | | 0.50 | | | | (0.64 | ) | | | — | | | | (0.64 | ) | | | (0.01 | ) | | | — | * | | | — | | | | 14.11 | | | | 13.69 | |
| 2017 | | | 15.01 | | | | 0.68 | | | | (0.68 | ) | | | (0.00 | ) | | | (0.75 | ) | | | — | | | | (0.75 | ) | | | — | | | | — | | | | — | | | | 14.26 | | | | 14.22 | |
| 2016 | | | 15.02 | | | | 0.76 | | | | 0.03 | | | | 0.79 | | | | (0.80 | ) | | | — | | | | (0.80 | ) | | | — | | | | — | | | | — | | | | 15.01 | | | | 15.74 | |
| 2015 | | | 14.15 | | | | 0.79 | | | | 0.87 | | | | 1.66 | | | | (0.79 | ) | | | — | | | | (0.79 | ) | | | — | | | | — | | | | — | | | | 15.02 | | | | 14.37 | |
| | |
NUM | | | | | | | | | | | | | | | | | | | | | | | | | | | | | | | | | | | | | | | | | | | | | | | | |
Year Ended 2/28–2/29: | | | | | | | | | | | | | | | | | | | | | | | | | |
| 2019 | | | 14.96 | | | | 0.55 | | | | 0.07 | | | | 0.62 | | | | (0.53 | ) | | | — | | | | (0.53 | ) | | | — | | | | — | | | | 0.07 | | | | 15.12 | | | | 12.99 | |
| 2018 | | | 15.10 | | | | 0.61 | | | | (0.12 | ) | | | 0.49 | | | | (0.63 | ) | | | — | | | | (0.63 | ) | | | — | | | | — | | | | — | * | | | 14.96 | | | | 12.84 | |
| 2017 | | | 15.93 | | | | 0.68 | | | | (0.73 | ) | | | (0.05 | ) | | | (0.72 | ) | | | (0.06 | ) | | | (0.78 | ) | | | — | | | | — | | | | — | | | | 15.10 | | | | 13.50 | |
| 2016 | | | 15.80 | | | | 0.76 | | | | 0.15 | | | | 0.91 | | | | (0.78 | ) | | | — | * | | | (0.78 | ) | | | — | | | | — | | | | — | * | | | 15.93 | | | | 14.01 | |
| 2015 | | | 14.98 | | | | 0.80 | | | | 0.88 | | | | 1.68 | | | | (0.86 | ) | | | — | | | | (0.86 | ) | | | — | | | | — | | | | — | | | | 15.80 | | | | 13.85 | |
| (a) | Total Return Based on Common Share NAV is the combination of changes in common share NAV, reinvested dividend income at NAV and reinvested capital gains distributions at NAV, if any. The last dividend declared in the period, which is typically paid on the first business day of the following month, is assumed to be reinvested at the ending NAV. The actual reinvest price for the last dividend declared in the period may often be based on the Fund’s market price (and not its NAV), and therefore may be different from the price used in the calculation. Total returns are not annualized. |
| | Total Return Based on Common Share Price is the combination of changes in the market price per share and the effect of reinvested dividend income and reinvested capital gains distributions, if any, at the average price paid per share at the time of reinvestment. The last dividend declared in the period, which is typically paid on the first business day of the following month, is assumed to be reinvested at the ending market price. The actual reinvestment for the last dividend declared in the period may take place over several days, and in some instances may not be based on the market price, so the actual reinvestment price may be different from the price used in the calculation. Total returns are not annualized. |
64
| | | | | | | | | | | | | | | | | |
| | | | | | | Common Share Supplemental Data/ Ratios Applicable to Common Shares | |
Common Share Total Returns | | | | | | | | | | | | | |
| | | | | Ratios to Average Net Assets(b) | | | | |
| | |
| | |
| | |
| | | | Based | | | Ending | | | | | | Net | | | | |
Based | | | on | | | Net | | | | | | Investment | | | Portfolio | |
on | | | Share | | | Assets | | | | | | Income | | | Turnover | |
NAV(a) | | | Price(a) | | | | (000 | ) | | Expenses(c) | | | (Loss) | | | Rate(d) | |
| | |
| | |
| | 4.29 | % | | | (5.09 | )% | | $ | 164,080 | | | | 2.61 | % | | | 3.73 | % | | | 11 | % |
| | 3.44 | | | | 0.69 | | | | 165,024 | | | | 2.03 | | | | 4.35 | | | | 19 | |
| | (0.07 | ) | | | (5.03 | ) | | | 165,141 | | | | 1.91 | | | | 4.54 | | | | 13 | |
| | 5.45 | | | | 15.59 | | | | 173,767 | | | | 1.51 | | | | 5.12 | | | | 9 | |
| | 12.01 | | | | 18.94 | | | | 173,648 | | | | 1.56 | | | | 5.37 | | | | 13 | |
| | |
| | |
| | |
| | 4.75 | | | | 5.54 | | | | 305,745 | | | | 2.46 | | | | 3.67 | | | | 13 | |
| | 3.19 | | | | (0.39 | ) | | | 310,917 | | | | 2.07 | | | | 3.98 | | | | 8 | |
| | (0.40 | ) | | | 1.74 | | | | 314,297 | | | | 1.88 | | | | 4.34 | | | | 20 | |
| | 5.97 | | | | 7.15 | | | | 331,466 | | | | 1.52 | | | | 4.85 | | | | 12 | |
| | 11.45 | | | | 9.48 | | | | 329,232 | | | | 1.57 | | | | 5.14 | | | | 15 | |
| (b) | Net Investment Income (Loss) ratios reflect income earned and expenses incurred on assets attributable to preferred shares issued by the Fund. |
| (c) | The expense ratios reflect, among other things, all interest expense and other costs related to preferred shares (as described in Note 4 – Fund Shares, Preferred Shares) and/or the interest expense deemed to have been paid by the Fund on the floating rate certificates issued by the special purpose trusts for the self-deposited inverse floaters held by the Fund (as described in Note 3 – Portfolio Securities and Investments in Derivatives, Inverse Floating Rate Securities), where applicable, as follows: |
| | | | | |
NAZ | | | NUM | |
| Year Ended 2/28–2/29: | | | Year Ended 2/28–2/29: | |
| 2019 | 1.39% | | 2019 | 1.43% |
| 2018 | 0.95 | | 2018 | 1.06 |
| 2017 | 0.87 | | 2017 | 0.88 |
| 2016 | 0.49 | | 2016 | 0.52 |
| 2015 | 0.50 | | 2015 | 0.53 |
| (d) | Portfolio Turnover Rate is calculated based on the lesser of long-term purchases or sales (as disclosed in Note 5 – Investment Transactions) divided by the average long-term market value during the period. |
| * | Rounds to less than $0.01 per share. |
See accompanying notes to financial statements.
65
| |
| Financial Highlights (continued) |
| |
| |
| |
| |
| Selected data for a common share outstanding throughout each period: |
| |
| | |
| | | | | | Investment Operations | | | Less Distributions to Common Shareholders | | | Common Share | |
| | | Beginning Common Share NAV | | | Net Investment Income (Loss) | | | Net Realized/ Unrealized Gain (Loss) | | | Total | | | From Net Investment Income | | | From Accumulated Net Realized Gains | | | Total | | | Shelf Offering Costs | | | Premium per Share Sold through Shelf Offering | | | Discount per Share Repurchased and Retired | | | Ending NAV | | | Ending Share Price | |
NUO | | | | | | | | | | | | | | | | | | | | | | | | | | | | | | | | | | | | |
Year Ended 2/28–2/29: | | | | | | | | | | | | | | | | |
| 2019 | | $ | 16.12 | | | $ | 0.55 | | | $ | 0.15 | | | $ | 0.70 | | | $ | (0.56 | ) | | $ | (0.03 | ) | | $ | (0.59 | ) | | $ | — | | | $ | — | | | $ | 0.03 | | | $ | 16.26 | | | $ | 14.24 | |
| 2018 | | | 16.34 | | | | 0.68 | | | | (0.19 | ) | | | 0.49 | | | | (0.71 | ) | | | — | | | | (0.71 | ) | | | — | | | | — | | | | — | | | | 16.12 | | | | 14.14 | |
| 2017 | | | 17.16 | | | | 0.74 | | | | (0.81 | ) | | | (0.07 | ) | | | (0.75 | ) | | | — | | | | (0.75 | ) | | | — | | | | — | | | | — | | | | 16.34 | | | | 14.97 | |
| 2016 | | | 17.01 | | | | 0.81 | | | | 0.17 | | | | 0.98 | | | | (0.83 | ) | | | — | | | | (0.83 | ) | | | — | | | | — | | | | — | | | | 17.16 | | | | 15.44 | |
| 2015 | | | 16.02 | | | | 0.85 | | | | 1.07 | | | | 1.92 | | | | (0.93 | ) | | | — | | | | (0.93 | ) | | | — | | | | — | | | | — | | | | 17.01 | | | | 15.40 | |
| | |
NTX | | | | | | | | | | | | | | | | | | | | | | | | | | | | | | | | | | | | | | | | | | | | | | | | |
Year Ended 2/28–2/29: | | | | | | | | | | | | | | | | | |
| 2019 | | | 14.95 | | | | 0.55 | | | | 0.02 | | | | 0.57 | | | | (0.55 | ) | | | — | | | | (0.55 | ) | | | — | | | | — | | | | 0.02 | | | | 14.99 | | | | 13.03 | |
| 2018 | | | 15.15 | | | | 0.57 | | | | (0.13 | ) | | | 0.44 | | | | (0.64 | ) | | | — | | | | (0.64 | ) | | | — | | | | — | | | | — | | | | 14.95 | | | | 13.53 | |
| 2017 | | | 15.81 | | | | 0.63 | | | | (0.64 | ) | | | (0.01 | ) | | | (0.65 | ) | | | — | | | | (0.65 | ) | | | — | | | | — | | | | — | | | | 15.15 | | | | 14.28 | |
| 2016 | | | 15.72 | | | | 0.66 | | | | 0.08 | | | | 0.74 | | | | (0.65 | ) | | | — | | | | (0.65 | ) | | | — | | | | — | | | | — | | | | 15.81 | | | | 14.66 | |
| 2015 | | | 14.82 | | | | 0.62 | | | | 0.96 | | | | 1.58 | | | | (0.68 | ) | | | — | | | | (0.68 | ) | | | — | | | | — | | | | — | | | | 15.72 | | | | 14.35 | |
| (a) | Total Return Based on Common Share NAV is the combination of changes in common share NAV, reinvested dividend income at NAV and reinvested capital gains distributions at NAV, if any. The last dividend declared in the period, which is typically paid on the first business day of the following month, is assumed to be reinvested at the ending NAV. The actual reinvest price for the last dividend declared in the period may often be based on the Fund’s market price (and not its NAV), and therefore may be different from the price used in the calculation. Total returns are not annualized. |
| | Total Return Based on Common Share Price is the combination of changes in the market price per share and the effect of reinvested dividend income and reinvested capital gains distributions, if any, at the average price paid per share at the time of reinvestment. The last dividend declared in the period, which is typically paid on the first business day of the following month, is assumed to be reinvested at the ending market price. The actual reinvestment for the last dividend declared in the period may take place over several days, and in some instances may not be based on the market price, so the actual reinvestment price may be different from the price used in the calculation. Total returns are not annualized. |
66
| | | | | | | | | | | | | | | | | |
| | | | | | | Common Share Supplemental Data/ Ratios Applicable to Common Shares | |
Common Share Total Returns | | | | | | Ratios to Average Net Assets(b) | | | | |
| | |
| | |
| | |
| | | | Based | | | Ending | | | | | | Net | | | | |
Based | | | on | | | Net | | | | | | Investment | | | Portfolio | |
on | | | Share | | | Assets | | | | | | Income | | | Turnover | |
NAV(a) | | | Price(a) | | | | (000 | ) | | Expenses(c) | | | (Loss) | | | Rate(d) | |
| | |
| | |
| | 4.65 | % | | | 5.14 | % | | $ | 297,774 | | | | 2.35 | % | | | 3.44 | % | | | 12 | % |
| | 2.98 | | | | (0.93 | ) | | | 298,629 | | | | 1.94 | | | | 4.10 | | | | 16 | |
| | (0.49 | ) | | | 1.67 | | | | 302,690 | | | | 1.79 | | | | 4.35 | | | | 8 | |
| | 5.95 | | | | 5.96 | | | | 317,856 | | | | 1.58 | | | | 4.83 | | | | 10 | |
| | 12.23 | | | | 10.79 | | | | 315,142 | | | | 1.62 | | | | 5.10 | | | | 15 | |
| | |
| | |
| | |
| | 4.02 | | | | 0.51 | | | | 149,317 | | | | 2.41 | | | | 3.71 | | | | 18 | |
| | 2.88 | | | | (0.94 | ) | | | 149,887 | | | | 2.16 | | | | 3.73 | | | | 11 | |
| | (0.12 | ) | | | 1.79 | | | | 151,944 | | | | 1.78 | | | | 4.05 | | | | 9 | |
| | 4.89 | | | | 7.02 | | | | 158,571 | | | | 1.78 | | | | 4.26 | | | | 14 | |
| | 10.81 | | | | 11.07 | | | | 157,644 | | | | 2.33 | | | | 4.05 | | | | 12 | |
| (b) | Net Investment Income (Loss) ratios reflect income earned and expenses incurred on assets attributable to preferred shares issued by the Fund. |
| (c) | The expense ratios reflect, among other things, all interest expense and other costs related to preferred shares (as described in Note 4 – Fund Shares, Preferred Shares) and/or the interest expense deemed to have been paid by the Fund on the floating rate certificates issued by the special purpose trusts for the self-deposited inverse floaters held by the Fund (as described in Note 3 – Portfolio Securities and Investments in Derivatives, Inverse Floating Rate Securities), where applicable, as follows: |
| | | | | |
NUO | | | NTX | |
| Year Ended 2/28–2/29: | | | Year Ended 2/28–2/29: | |
| 2019 | 1.28% | | 2019 | 1.34% |
| 2018 | 0.90 | | 2018 | 1.13 |
| 2017 | 0.77 | | 2017 | 0.77 |
| 2016 | 0.55 | | 2016 | 0.77 |
| 2015 | 0.57 | | 2015 | 1.26 |
| (d) | Portfolio Turnover Rate is calculated based on the lesser of long-term purchases or sales (as disclosed in Note 5 – Investment Transactions) divided by the average long- term market value during the period. |
| * | Rounds to less than $0.01 per share. |
See accompanying notes to financial statements.
67
| |
| Financial Highlights (continued) |
| |
| |
| |
| | |
| | | AMTP Shares at the End of Period | | | VMTP Shares at the End of Period | |
| |
| | | Aggregate Amount Outstanding (000) | | | Asset Coverage Per $100,000 Share | | | Aggregate Amount Outstanding (000) | | | Asset Coverage Per $100,000 Share | |
NAZ | | | | | | | | | | | | |
| Year Ended 2/28-2/29: | | | | | | | | | | | | |
| 2019 | | $ | 88,300 | | | $ | 285,822 | | | $ | — | | | $ | — | |
| 2018 | | | — | | | | — | | | | 88,300 | | | | 286,891 | |
| 2017 | | | — | | | | — | | | | 88,300 | | | | 287,022 | |
| 2016 | | | — | | | | — | | | | 79,000 | | | | 319,959 | |
| 2015 | | | — | | | | — | | | | 79,000 | | | | 319,808 | |
| | |
NUM | | | | | | | | | | | | | | | | |
| Year Ended 2/28-2/29: | | | | | | | | | | | | | | | | |
| 2019 | | | 173,000 | | | | 276,731 | | | | — | | | | — | |
| 2018 | | | — | | | | — | | | | 173,000 | | | | 279,721 | |
| 2017 | | | — | | | | — | | | | 173,000 | | | | 281,675 | |
| 2016 | | | — | | | | — | | | | 159,000 | | | | 308,469 | |
| 2015 | | | — | | | | — | | | | 159,000 | | | | 307,064 | |
See accompanying notes to financial statements.
68
| | | | | | | | | | | | | | | | | | | | | | | | | |
| | | iMTP Shares | | | MTP Shares | | | MFP Shares | | | VRDP Shares | |
| | | at the End of Period | | | at the End of Period (a) | | | at the End of Period | | | at the End of Period | |
| | | Aggregate | | | Asset | | | Aggregate | | | Asset | | | Aggregate | | | Asset | | | Aggregate | | | Asset | |
| | | Amount | | | Coverage | | | Amount | | | Coverage | | | Amount | | | Coverage | | | Amount | | | Coverage | |
| | | Outstanding | | | Per $5,000 | | | Outstanding | | | Per $10 | | | Outstanding | | | Per $100,000 | | | Outstanding | | | Per $100,000 | |
| | | | (000 | ) | | Share | | | | (000 | ) | | Share | | | | (000 | ) | | Share | | | | (000 | ) | | Share | |
NUO | | | | | | | | | | | | | | | | | | | | | | | | | | | | |
Year Ended 2/28-2/29: | | | | | | | | | | | | | | | | | | | | | | |
| 2019 | | $ | — | | | $ | — | | | $ | — | | | $ | — | | | $ | — | | | $ | — | | | $ | 148,000 | | | $ | 301,199 | |
| 2018 | | | — | | | | — | | | | — | | | | — | | | | — | | | | — | | | | 148,000 | | | | 301,776 | |
| 2017 | | | — | | | | — | | | | — | | | | — | | | | — | | | | — | | | | 148,000 | | | | 304,520 | |
| 2016 | | | — | | | | — | | | | — | | | | — | | | | — | | | | — | | | | 148,000 | | | | 314,768 | |
| 2015 | | | — | | | | — | | | | — | | | | — | | | | — | | | | — | | | | 148,000 | | | | 312,934 | |
| | |
NTX | | | | | | | | | | | | | | | | | | | | | | | | | | | | | | | | |
Year Ended 2/28-2/29: | | | | | | | | | | | | | | | | | | | | | | | | | |
| 2019 | | | — | | | | — | | | | — | | | | — | | | | 72,000 | | | | 307,384 | | | | — | | | | — | |
| 2018 | | | — | | | | — | | | | — | | | | — | | | | 72,000 | | | | 308,177 | | | | — | | | | — | |
| 2017 | | | 72,000 | | | | 15,552 | | | | — | | | | — | | | | — | | | | — | | | | — | | | | — | |
| 2016 | | | 72,000 | | | | 16,012 | | | | — | | | | — | | | | — | | | | — | | | | — | | | | — | |
| 2015 | | | — | | | | — | | | | 70,920 | | | | 32.23 | | | | — | | | | — | | | | — | | | | — | |
| (a) | The Ending and Average Market Value Per Share for each Series of the Fund’s MTP Shares were as follows: |
| | | | | | | |
| | | 2016 | | | 2015 | |
NTX | | | | | | |
Series 2015 (NTX PRCCL) | | | | | | |
| Ending Market Value per Share | | $ | — | | | $ | 10.02 | |
| Average Market Value per Share | | | 10.01 | Ω | | | 10.04 | |
| For the period March 1, 2015 through April 20, 2015. |
See accompanying notes to financial statements.
69
Notes to
Financial Statements
1. General Information and Significant Accounting Policies
General Information
Fund Information
The state funds covered in this report and their corresponding New York Stock Exchange (“NYSE”) symbols are as follows (each a “Fund” and collectively, the “Funds”):
| · | Nuveen Arizona Quality Municipal Income Fund (NAZ) |
| · | Nuveen Michigan Quality Municipal Income Fund (NUM) |
| · | Nuveen Ohio Quality Municipal Income Fund (NUO) |
| · | Nuveen Texas Quality Municipal Income Fund (NTX) |
The Funds are registered under the Investment Company Act of 1940 (the “1940 Act”), as amended, as diversified, closed-end management investment companies. NAZ, NUM and NUO were organized as Massachusetts business trusts on April 8, 2013, January 7, 2013 and April 8, 2013, respectively (previously organized as Minnesota trusts on January 23, 1991, July 25, 1991 and October 17, 1991, respectively). NTX was organized as a Massachusetts business trust on July 26, 1991.
The end of the reporting period for the Funds is February 28, 2019, and the period covered by these Notes to Financial Statements is the fiscal year ended February 28, 2019 (the “current fiscal period”).
Investment Adviser
The Funds’ investment adviser is Nuveen Fund Advisors, LLC (the “Adviser”), a subsidiary of Nuveen, LLC (“Nuveen”). Nuveen is the investment management arm of Teachers Insurance and Annuity Association of America (TIAA). The Adviser has overall responsibility for management of the Funds, oversees the management of the Funds’ portfolios, manages the Funds’ business affairs and provides certain clerical, bookkeeping and other administrative services, and, if necessary, asset allocation decisions. The Adviser has entered into sub-advisory agreements with Nuveen Asset Management, LLC (the “Sub-Adviser”), a subsidiary of the Adviser, under which the Sub-Adviser manages the investment portfolios of the Funds.
Investment Objectives and Principal Investment Strategies
Each Fund seeks to provide current income exempt from both regular federal and designated state income taxes by investing primarily in a portfolio of municipal obligations issued by state and local government authorities within a single state or certain U.S. territories. Under normal market conditions, each Fund invests at least 80% of the sum of its net assets and the amount of any borrowings for investment purposes in municipal bonds that pay interest that is exempt from regular federal personal income tax and a single state’s personal income tax. Each Fund may invest up to 20% in municipal securities that are exempt from regular federal income tax, but not from that single state’s income tax if, in the Sub-Adviser’s judgement, such purchases are expected to enhance the Fund’s after-tax total return potential. To the extent that the Funds invest in bonds of municipal issuers located in other states, each Fund may have income that is not exempt from state personal income tax.
Significant Accounting Policies
Each Fund is an investment company and follows accounting and reporting guidance under Financial Accounting Standards Board (“FASB”) Accounting Standards Codification (ASC) Topic 946 “Financial Services – Investment Companies.” The following is a summary of significant accounting policies followed by the Funds in the preparation of their financial statements in accordance with U.S. generally accepted accounting principles (“U.S. GAAP”).
Investment Transactions
Investment transactions are recorded on a trade date basis. Realized gains and losses from investment transactions are determined on the specific identification method, which is the same basis used for federal income tax purposes. Investments purchased on a when-issued/delayed delivery basis may have extended settlement periods. Any investments so purchased are subject to market fluctuation during this period. The Funds have earmarked securities in their portfolios with a current value at least equal to the amount of the when-issued/delayed delivery purchase commitments.
70
As of the end of the reporting period, the Funds did not have any outstanding when-issued/delayed delivery purchase commitments.
Investment Income
Investment income is comprised of interest income, which reflects the amortization of premiums and accretion of discounts for financial reporting purposes, and is recorded on an accrual basis. Investment income also reflects payment-in-kind (“PIK”) interest and paydown gains and losses, if any. PIK interest represents income received in the form of securities in lieu of cash.
Professional Fees
Professional fees presented on the Statement of Operations consist of legal fees incurred in the normal course of operations, audit fees, tax consulting fees and, in some cases, workout expenditures. Workout expenditures are incurred in an attempt to protect or enhance an investment or to pursue other claims or legal actions on behalf of Fund shareholders. If a refund is received for workout expenditures paid in a prior reporting period, such amounts will be recognized as “Legal fee refund” on the Statement of Operations.
Dividends and Distributions to Common Shareholders
Dividends from net investment income, if any, are declared monthly. Net realized capital gains and/or market discount from investment transactions, if any, are distributed to shareholders at least annually. Furthermore, capital gains are distributed only to the extent they exceed available capital loss carryforwards.
Distributions to common shareholders of net investment income, net realized capital gains and/or market discount, if any, are recorded on the ex-dividend date. The amount and timing of distributions are determined in accordance with federal income tax regulations, which may differ from U.S. GAAP.
Compensation
The Funds pay no compensation directly to those of its trustees who are affiliated with the Adviser or to its officers, all of whom receive remuneration for their services to the Funds from the Adviser or its affiliates. The Funds’ Board of Trustees (the “Board”) has adopted a deferred compensation plan for independent trustees that enables trustees to elect to defer receipt of all or a portion of the annual compensation they are entitled to receive from certain Nuveen-advised funds. Under the plan, deferred amounts are treated as though equal dollar amounts had been invested in shares of select Nuveen-advised funds.
Indemnifications
Under the Funds’ organizational documents, their officers and trustees are indemnified against certain liabilities arising out of the performance of their duties to the Funds. In addition, in the normal course of business, the Funds enter into contracts that provide general indemnifications to other parties. The Funds’ maximum exposure under these arrangements is unknown as this would involve future claims that may be made against the Funds that have not yet occurred. However, the Funds have not had prior claims or losses pursuant to these contracts and expect the risk of loss to be remote.
Netting Agreements
In the ordinary course of business, the Funds may enter into transactions subject to enforceable International Swaps and Derivatives Association, Inc. (ISDA) master agreements or other similar arrangements (“netting agreements”). Generally, the right to offset in netting agreements allows each Fund to offset certain securities and derivatives with a specific counterparty, when applicable, as well as any collateral received or delivered to that counterparty based on the terms of the agreements. Generally, each Fund manages its cash collateral and securities collateral on a counterparty basis.
The Funds’ investments subject to netting agreements as of the end of the reporting period, if any, are further described in Note 3 – Portfolio Securities and Investments in Derivatives.
Use of Estimates
The preparation of financial statements in conformity with U.S. GAAP requires management to make estimates and assumptions that affect the reported amounts of assets and liabilities at the date of the financial statements and the reported amounts of increases and decreases in net assets applicable to common shares from operations during the current fiscal period. Actual results may differ from those estimates.
2. Investment Valuation and Fair Value Measurements
The fair valuation input levels as described below are for fair value measurement purposes.
Fair value is defined as the price that would be received upon selling an investment or transferring a liability in an orderly transaction to an independent buyer in the principal or most advantageous market for the investment. A three-tier hierarchy is used to maximize the use of observable market data and minimize the use of unobservable inputs and to establish classification of fair value measurements for disclosure purposes. Observable inputs reflect the assumptions market participants would use in pricing the asset or liability. Observable inputs are based on market data obtained from
71
Notes to Financial Statements (continued)
sources independent of the reporting entity. Unobservable inputs reflect the reporting entity’s own assumptions about the assumptions market participants would use in pricing the asset or liability. Unobservable inputs are based on the best information available in the circumstances. The following is a summary of the three-tiered hierarchy of valuation input levels.
Level 1 – Inputs are unadjusted and prices are determined using quoted prices in active markets for identical securities.
Level 2 – Prices are determined using other significant observable inputs (including quoted prices for similar securities, interest rates, credit spreads, etc.).
Level 3 – Prices are determined using significant unobservable inputs (including management’s assumptions in determining the fair value of investments).
Prices of fixed income securities are provided by an independent pricing service (“pricing service”) approved by the Board. The pricing service establishes a security’s fair value using methods that may include consideration of the following: yields or prices of investments of comparable quality, type of issue, coupon, maturity and rating, market quotes or indications of value from security dealers, evaluations of anticipated cash flows or collateral, general market conditions and other information and analysis, including the obligor’s credit characteristics considered relevant. These securities are generally classified as Level 2. In pricing certain securities, particularly less liquid and lower quality securities, the pricing service may consider information about a security, its issuer or market activity, provided by the Adviser. These securities are generally classified as Level 2 or Level 3 depending on the observability of the significant inputs.
Certain securities may not be able to be priced by the pre-established pricing methods as described above. Such securities may be valued by the Board and/or its appointee at fair value. These securities generally include, but are not limited to, restricted securities (securities which may not be publicly sold without registration under the Securities Act of 1933, as amended) for which a pricing service is unable to provide a market price; securities whose trading has been formally suspended; debt securities that have gone into default and for which there is no current market quotation; a security whose market price is not available from a pre-established pricing source; a security with respect to which an event has occurred that is likely to materially affect the value of the security after the market has closed but before the calculation of a Fund’s net asset value (“NAV”) (as may be the case in non-U.S. markets on which the security is primarily traded) or make it difficult or impossible to obtain a reliable market quotation; and a security whose price, as provided by the pricing service, is not deemed to reflect the security’s fair value. As a general principle, the fair value of a security would appear to be the amount that the owner might reasonably expect to receive for it in a current sale. A variety of factors may be considered in determining the fair value of such securities, which may include consideration of the following: yields or prices of investments of comparable quality, type of issue, coupon, maturity and rating, market quotes or indications of value from security dealers, evaluations of anticipated cash flows or collateral, general market conditions and other information and analysis, including the obligor’s credit characteristics considered relevant. These securities are generally classified as Level 2 or Level 3 depending on the observability of the significant inputs. Regardless of the method employed to value a particular security, all valuations are subject to review by the Board and/or its appointee.
The inputs or methodologies used for valuing securities are not an indication of the risks associated with investing in those securities. The following is a summary of each Fund’s fair value measurements as of the end of the reporting period:
| | | | | | | | | | | | | |
NAZ | | Level 1 | | | Level 2 | | | Level 3 | | | Total | |
| Long-Term Investments*: | | | | | | | | | | | | |
| Municipal Bonds | | $ | — | | | $ | 259,649,328 | | | $ | — | | | $ | 259,649,328 | |
NUM | | | | | | | | | | | | | | | | |
| Long-Term Investments*: | | | | | | | | | | | | | | | | |
| Municipal Bonds | | $ | — | | | $ | 484,976,664 | | | $ | — | | | $ | 484,976,664 | |
NUO | | | | | | | | | | | | | | | | |
| Long-Term Investments*: | | | | | | | | | | | | | | | | |
| Municipal Bonds | | $ | — | | | $ | 460,418,868 | | | $ | — | | | $ | 460,418,868 | |
NTX | | | | | | | | | | | | | | | | |
| Long-Term Investments*: | | | | | | | | | | | | | | | | |
| Municipal Bonds | | $ | — | | | $ | 233,859,947 | | | $ | — | | | $ | 233,859,947 | |
| * Refer to the Fund’s Portfolio of Investments for industry classifications. |
72
3. Portfolio Securities and Investments in Derivatives
Portfolio Securities
Inverse Floating Rate Securities
Each Fund is authorized to invest in inverse floating rate securities. An inverse floating rate security is created by depositing a municipal bond (referred to as an “Underlying Bond”), typically with a fixed interest rate, into a special purpose tender option bond (“TOB”) trust (referred to as the “TOB Trust”) created by or at the direction of one or more Funds. In turn, the TOB Trust issues (a) floating rate certificates (referred to as “Floaters”), in face amounts equal to some fraction of the Underlying Bond’s par amount or market value, and (b) an inverse floating rate certificate (referred to as an “Inverse Floater”) that represents all remaining or residual interest in the TOB Trust. Floaters typically pay short-term tax-exempt interest rates to third parties who are also provided a right to tender their certificate and receive its par value, which may be paid from the proceeds of a remarketing of the Floaters, by a loan to the TOB Trust from a third party liquidity provider (“Liquidity Provider”), or by the sale of assets from the TOB Trust. The Inverse Floater is issued to a long term investor, such as one or more of the Funds. The income received by the Inverse Floater holder varies inversely with the short-term rate paid to holders of the Floaters, and in most circumstances the Inverse Floater holder bears substantially all of the Underlying Bond’s downside investment risk and also benefits disproportionately from any potential appreciation of the Underlying Bond’s value. The value of an Inverse Floater will be more volatile than that of the Underlying Bond because the interest rate is dependent on not only the fixed coupon rate of the Underlying Bond but also on the short-term interest paid on the Floaters, and because the Inverse Floater essentially bears the risk of loss (and possible gain) of the greater face value of the Underlying Bond.
The Inverse Floater held by a Fund gives the Fund the right to (a) cause the holders of the Floaters to tender their certificates at par (or slightly more than par in certain circumstances), and (b) have the trustee of the TOB Trust (the “Trustee”) transfer the Underlying Bond held by the TOB Trust to the Fund, thereby collapsing the TOB Trust.
The Fund may acquire an Inverse Floater in a transaction where it (a) transfers an Underlying Bond that it owns to a TOB Trust created by a third party or (b) transfers an Underlying Bond that it owns, or that it has purchased in a secondary market transaction for the purpose of creating an Inverse Floater, to a TOB Trust created at its direction, and in return receives the Inverse Floater of the TOB Trust (referred to as a “self-deposited Inverse Floater”). A Fund may also purchase an Inverse Floater in a secondary market transaction from a third party creator of the TOB Trust without first owning the Underlying Bond (referred to as an “externally-deposited Inverse Floater”).
An investment in a self-deposited Inverse Floater is accounted for as a “financing” transaction (i.e., a secured borrowing). For a self-deposited Inverse Floater, the Underlying Bond deposited into the TOB Trust is identified in the Fund’s Portfolio of Investments as “(UB) – Underlying bond of an inverse floating rate trust reflected as a financing transaction,” with the Fund recognizing as liabilities, labeled “Floating rate obligations” on the Statement of Assets and Liabilities, (a) the liquidation value of Floaters issued by the TOB Trust, and (b) the amount of any borrowings by the TOB Trust from a Liquidity Provider to enable the TOB Trust to purchase outstanding Floaters in lieu of a remarketing. In addition, the Fund recognizes in “Investment Income” the entire earnings of the Underlying Bond, and recognizes (a) the interest paid to the holders of the Floaters or on the TOB Trust’s borrowings, and (b) other expenses related to remarketing, administration, trustee, liquidity and other services to a TOB Trust, as a component of “Interest expense and amortization of offering costs” on the Statement of Operations.
In contrast, an investment in an externally-deposited Inverse Floater is accounted for as a purchase of the Inverse Floater and is identified in the Fund’s Portfolio of Investments as “(IF) – Inverse floating rate investment.” For an externally-deposited Inverse Floater, a Fund’s Statement of Assets and Liabilities recognizes the Inverse Floater and not the Underlying Bond as an asset, and the Fund does not recognize the Floaters, or any related borrowings from a Liquidity Provider, as a liability. Additionally, the Fund reflects in “Investment Income” only the net amount of earnings on the Inverse Floater (net of the interest paid to the holders of the Floaters or the Liquidity Provider as lender, and the expenses of the Trust), and does not show the amount of that interest paid or the expenses of the TOB Trust as described above as interest expense on the Statement of Operations.
Fees paid upon the creation of a TOB Trust for self-deposited Inverse Floaters and externally-deposited Inverse Floaters are recognized as part of the cost basis of the Inverse Floater and are capitalized over the term of the TOB Trust.
As of the end of the reporting period, the aggregate value of Floaters issued by each Fund’s TOB Trust for self-deposited Inverse Floaters and externally-deposited Inverse Floaters was as follows:
| | | | | | | | | | | | | |
Floating Rate Obligations Outstanding | | NAZ | | | NUM | | | NUO | | | NTX | |
| Floating rate obligations: self-deposited Inverse Floaters | | $ | 9,755,000 | | | $ | 12,265,000 | | | $ | 20,000,000 | | | $ | 16,000,000 | |
| Floating rate obligations: externally-deposited Inverse Floaters | | | 6,715,000 | | | | 8,430,000 | | | | 4,480,000 | | | | — | |
| Total | | $ | 16,470,000 | | | $ | 20,695,000 | | | $ | 24,480,000 | | | $ | 16,000,000 | |
73
Notes to Financial Statements (continued)
During the current fiscal period, the average amount of Floaters (including any borrowings from a Liquidity Provider) outstanding, and the average annual interest rate and fees related to self-deposited Inverse Floaters, were as follows:
| | | | | | | | | | | | | |
Self-Deposited Inverse Floaters | | NAZ | | | NUM | | | NUO | | | NTX | |
| Average floating rate obligations outstanding | | $ | 7,875,548 | | | $ | 12,265,000 | | | $ | 20,000,000 | | | $ | 16,021,918 | |
| Average annual interest rate and fees | | | 1.99 | % | | | 2.07 | % | | | 2.00 | % | | | 2.02 | % |
TOB Trusts are supported by a liquidity facility provided by a Liquidity Provider pursuant to which the Liquidity Provider agrees, in the event that Floaters are (a) tendered to the Trustee for remarketing and the remarketing does not occur, or (b) subject to mandatory tender pursuant to the terms of the TOB Trust agreement, to either purchase Floaters or to provide the Trustee with an advance from a loan facility to fund the purchase of Floaters by the TOB Trust. In certain circumstances, the Liquidity Provider may otherwise elect to have the Trustee sell the Underlying Bond to retire the Floaters that were tendered and not remarketed prior to providing such a loan. In these circumstances, the Liquidity Provider remains obligated to provide a loan to the extent that the proceeds of the sale of the Underlying Bond is not sufficient to pay the purchase price of the Floaters.
The size of the commitment under the loan facility for a given TOB Trust is at least equal to the balance of that TOB Trust’s outstanding Floaters plus any accrued interest. In consideration of the loan facility, fee schedules are in place and are charged by the Liquidity Provider(s). Any loans made by the Liquidity Provider will be secured by the purchased Floaters held by the TOB Trust. Interest paid on any outstanding loan balances will be effectively borne by the Fund that owns the Inverse Floaters of the TOB Trust that has incurred the borrowing and may be at a rate that is greater than the rate that would have been paid had the Floaters been successfully remarketed.
As described above, any amounts outstanding under a liquidity facility are recognized as a component of “Floating rate obligations” on the Statement of Assets and Liabilities by the Fund holding the corresponding Inverse Floaters issued by the borrowing TOB Trust. As of the end of the reporting period, there were no loans outstanding under such facilities for any of the other Funds as of the end of the reporting period.
Each Fund may also enter into shortfall and forbearance agreements (sometimes referred to as a “recourse arrangement”) (TOB Trusts involving such agreements are referred to herein as “Recourse Trusts”), under which a Fund agrees to reimburse the Liquidity Provider for the Trust’s Floaters, in certain circumstances, for the amount (if any) by which the liquidation value of the Underlying Bond held by the TOB Trust may fall short of the sum of the liquidation value of the Floaters issued by the TOB Trust plus any amounts borrowed by the TOB Trust from the Liquidity Provider, plus any shortfalls in interest cash flows. Under these agreements, a Fund’s potential exposure to losses related to or on an Inverse Floater may increase beyond the value of the Inverse Floater as a Fund may potentially be liable to fulfill all amounts owed to holders of the Floaters or the Liquidity Provider. Any such shortfall amount in the aggregate is recognized as “Unrealized depreciation on Recourse Trusts” on the Statement of Assets and Liabilities.
As of the end of the reporting period, each Fund’s maximum exposure to the Floaters issued by Recourse Trusts for self-deposited Inverse Floaters and externally-deposited Inverse Floaters was as follows:
| | | | | | | | | | | | | |
Floating Rate Obligations – Recourse Trusts | | NAZ | | | NUM | | | NUO | | | NTX | |
| Maximum exposure to Recourse Trusts: self-deposited Inverse Floaters | | $ | 9,755,000 | | | $ | 12,265,000 | | | $ | 12,000,000 | | | $ | 16,000,000 | |
| Maximum exposure to Recourse Trusts: externally-deposited Inverse Floaters | | | — | | | | 8,430,000 | | | | 4,480,000 | | | | — | |
| Total | | $ | 9,755,000 | | | $ | 20,695,000 | | | $ | 16,480,000 | | | $ | 16,000,000 | |
Zero Coupon Securities
A zero coupon security does not pay a regular interest coupon to its holders during the life of the security. Income to the holder of the security comes from accretion of the difference between the original purchase price of the security at issuance and the par value of the security at maturity and is effectively paid at maturity. The market prices of zero coupon securities generally are more volatile than the market prices of securities that pay interest periodically.
Investments in Derivatives
In addition to the inverse floating rate securities in which each Fund may invest, which are considered portfolio securities for financial reporting purposes, each Fund is authorized to invest in certain other derivative instruments, such as futures, options and swap contracts. Each Fund limits its investments in futures, options on futures and swap contracts to the extent necessary for the Adviser to claim the exclusion from registration by the Commodity Futures Trading Commission as a commodity pool operator with respect to the Fund. The Funds record derivative instruments at fair value, with changes in fair value recognized on the Statement of Operations, when applicable. Even though the Funds’ investments in derivatives may represent economic hedges, they are not considered to be hedge transactions for financial reporting purposes.
Although the Funds are authorized to invest in derivative instruments and may do so in the future, they did not make any such investments during the current fiscal period.
74
Market and Counterparty Credit Risk
In the normal course of business each Fund may invest in financial instruments and enter into financial transactions where risk of potential loss exists due to changes in the market (market risk) or failure of the other party to the transaction to perform (counterparty credit risk). The potential loss could exceed the value of the financial assets recorded on the financial statements. Financial assets, which potentially expose each Fund to counterparty credit risk, consist principally of cash due from counterparties on forward, option and swap transactions, when applicable. The extent of each Fund’s exposure to counterparty credit risk in respect to these financial assets approximates their carrying value as recorded on the Statement of Assets and Liabilities.
Each Fund helps manage counterparty credit risk by entering into agreements only with counterparties the Adviser believes have the financial resources to honor their obligations and by having the Adviser monitor the financial stability of the counterparties. Additionally, counterparties may be required to pledge collateral daily (based on the daily valuation of the financial asset) on behalf of each Fund with a value approximately equal to the amount of any unrealized gain above a pre-determined threshold. Reciprocally, when each Fund has an unrealized loss, the Funds have instructed the custodian to pledge assets of the Funds as collateral with a value approximately equal to the amount of the unrealized loss above a pre-determined threshold. Collateral pledges are monitored and subsequently adjusted if and when the valuations fluctuate, either up or down, by at least the pre-determined threshold amount.
4. Fund Shares
Common Shares
Common Shares Equity Shelf Program and Offering Costs
NAZ has filed a registration statement with the Securities and Exchange Commission (“SEC”) authorizing the Fund to issue additional common shares through one or more equity shelf programs (“Shelf Offering”), which became effective with the SEC during the prior fiscal period.
Under this Shelf Offering, the Fund, subject to market conditions, may raise additional equity capital by issuing additional common shares from time to time in varying amounts and by different offering methods at a net price at or above the Fund’s NAV per common share. In the event the Fund’s Shelf Offering registration statement is no longer current, the Fund may not issue additional common shares until a post-effective amendment to the registration statement has been filed with the SEC.
Additional authorized common shares, common shares sold and offering proceeds, net of offering costs under the Fund’s Shelf Offering during the Fund’s current and prior fiscal period were as follows:
| | | | | | | |
| | | NAZ | |
| | | Year | | | Year | |
| | | Ended | | | Ended | |
| | | 2/28/19 | | | 2/28/18 | |
| Additional authorized common shares | | | 1,100,000 | ** | | | 1,100,000 | * |
| Common shares sold | | | — | | | | 107,600 | |
| Offering proceeds, net of offering costs | | $ | 69,117 | | | $ | 1,484,129 | |
| * | Represents additional authorized shares for the period June 6, 2017 through February 28, 2018. |
| ** | Represents additional authorized shares for the period March 1, 2018 through June 29, 2018. |
Costs incurred by the Fund in connection with its initial shelf registrations are recorded as a prepaid expense and recognized as “Deferred offering costs” on the Statement of Assets and Liabilities. These costs are amortized pro rata as common shares are sold and are recognized as a component of “Proceeds from shelf offering, net of offering costs” on the Statement of Changes in Net Assets. Any deferred offering costs remaining one year after effectiveness of the initial shelf registration will be expensed. Costs incurred by the Funds to keep the shelf registration current are expensed as incurred and recognized as a component of “Shelf offering expenses” on the Statement of Operations.
75
Notes to Financial Statements (continued)
Common Share Transactions
Transactions in common shares for the Funds during the Funds’ current and prior fiscal period, where applicable, were as follows:
| | | | | | | |
| | | NAZ | |
| | | Year | | | Year | |
| | | Ended | | | Ended | |
| | | 2/28/19 | | | 2/28/18 | |
| Common Shares: | | | | | | |
| Issued to shareholders due to reinvestment of distributions | | | — | | | | 7,629 | |
| Sold through shelf offering | | | — | | | | 107,600 | |
| Repurchased and retired | | | (127,500 | ) | | | — | |
| Weighted average common share: | | | | | | | | |
| Premium to NAV per shelf offering share sold | | | — | % | | | 1.64 | % |
| Price per share repurchased and retired | | $ | 11.60 | | | | — | |
| Discount per share repurchased and retired | | | 15.61 | % | | | — | |
| | |
| | | NUM | | | NUO | | | NTX | |
| | | Year | | | Year | | | Year | | | Year | | | Year | | | Year | |
| | | Ended | | | Ended | | | Ended | | | Ended | | | Ended | | | Ended | |
| | | 2/28/19 | | | 2/28/18 | | | 2/28/19 | | | 2/28/18 | | | 2/28/19 | | | 2/28/18 | |
| Common Shares: | | | | | | | | | | | | | | | | | | |
| Repurchased and retired | | | (562,500 | ) | | | (21,500 | ) | | | (205,000 | ) | | | — | | | | (68,600 | ) | | | — | |
| Weighted average common share: | | | | | | | | | | | | | | | | | | | | | | | | |
| Price per share repurchased and retired | | $ | 12.43 | | | $ | 13.09 | | | $ | 13.36 | | | | — | | | $ | 12.33 | | | | — | |
| Discount per share repurchased and retired | | | 16.07 | % | | | 13.90 | % | | | 15.59 | % | | | — | % | | | 15.38 | % | | | — | % |
Preferred Shares
Adjustable Rate MuniFund Term Preferred Shares
The following Funds have issued and have outstanding Adjustable Rate MuniFund Term Preferred (“AMTP”) Shares, with a $100,000 liquidation preference per share. AMTP Shares are issued via private placement and are not publicly available.
The details of each Fund’s AMTP Shares outstanding as of the end of the reporting period, were as follows:
| | | | | | | | | | | |
Fund | Series | | Shares Outstanding | | | Liquidation Preference | | | Liquidation Preference Net of Deferred Offering Costs | |
NAZ | 2028 | | | 883 | | | $ | 88,300,000 | | | $ | 88,143,383 | |
NUM | 2028 | | | 1,730 | | | $ | 173,000,000 | | | $ | 172,804,230 | |
Each Fund is obligated to redeem its AMTP Shares by the date as specified in its offering document (“Term Redemption Date”), unless earlier redeemed by the Fund. AMTP Shares are subject to optional and mandatory redemption in certain circumstances. The AMTP Shares may be redeemed at the option of each Fund, subject to payment of premium for approximately six months following the date of issuance (“Premium Expiration Date”), and at the redemption price per share thereafter. The redemption price per share is equal to the sum of the liquidation preference per share plus any accumulated but unpaid dividends.
AMTP Shares are short-term or short/intermediate-term instruments that pay a variable dividend rate tied to a short-term index, plus an additional fixed “spread” amount which is initially established at the time of issuance and may be adjusted in the future based upon a mutual agreement between the majority owner and each Fund. From time-to-time the majority owner may propose to each Fund an adjustment to the dividend rate. Should the majority owner and the Funds fail to agree upon an adjusted dividend rate, and such proposed dividend rate adjustment is not withdrawn, the Funds will be required to redeem all outstanding shares upon the end of a notice period.
76
In addition, the Funds may be obligated to redeem a certain amount of the AMTP Shares if the Funds fail to maintain certain asset coverage and leverage ratio requirements and such failures are not cured by the applicable cure date. The Term Redemption Date and Premium Expiration Date for each Fund’s AMTP Shares are as follows:
| | | | | |
Fund | Notice Period | Series | Term Redemption Date | Premium Expiration Date |
NAZ | 540-day | 2028 | December 1, 2028* | February 13, 2019 |
NUM | 540-day | 2028 | December 1, 2028* | December 13, 2019 |
* Subject to early termination by either the Fund or the holder.
The average liquidation preference of AMTP Shares outstanding and annualized dividend rate for the Fund during the current fiscal period were as follows:
| | | | | | | |
| | | NAZ* | | | NUM* | |
| Average liquidation preference of AMTP Shares outstanding | | $ | 88,300,000 | | | $ | 173,000,000 | |
| Annualized dividend rate | | | 2.37 | % | | | 2.37 | % |
| * For the period December 14, 2018 through February 28, 2019 | |
AMTP Shares are subject to restrictions on transfer, generally do not trade, and market quotations are generally not available. The fair value of AMTP Shares is expected to be approximately their liquidation preference so long as the fixed “spread” on the AMTP Shares remains roughly in line with the “spread” being demanded by investors on instruments having similar terms in the current market environment. In present market conditions, the Funds’ Adviser has determined that the fair value of AMTP Shares is approximately their liquidation preference, but their fair value could vary if market conditions change materially. For financial reporting purposes, the liquidation preference of AMTP Shares is a liability and is recognized as a component of “Adjustable Rate MuniFund Term Preferred (“AMTP”) Shares, net of deferred offering costs” on the Statement of Assets and Liabilities.
AMTP Share dividends are treated as interest payments for financial reporting purposes. Unpaid dividends on AMTP Shares are recognized as a component of “Interest payable” on the Statement of Assets and Liabilities. Dividends accrued on AMTP Shares are recognized as a component of “Interest expense and amortization of offering costs” on the Statement of Operations.
NAZ and NUM incurred offering costs of $160,000 and $200,000, respectively, in connection with its offering of AMTP Shares were recorded as deferred charges which are amortized over the life of the shares and are recognized as components of “Adjustable Rate MuniFund Term Preferred (“AMTP”) Shares, net of deferred offering costs” on the Statement of Assets and Liabilities and “Interest expense and amortization of offering costs” on the Statement of Operations.
MuniFund Preferred Shares
NTX has issued and has outstanding MuniFund Preferred (“MFP”) Shares, with a $100,000 liquidation preference per share. These MFP Shares were issued via private placement and are not publically available.
The Fund is obligated to redeem its MFP Shares by the date as specified in its offering documents (“Term Redemption Date”), unless earlier redeemed by the Fund. MFP Shares are initially issued in a pre-specified mode, however, MFP Shares can be subsequently designated as an alternative mode at a later date at the discretion of the Fund. The modes within MFP Shares detail the dividend mechanics and are described as follows. At a subsequent date, the Fund may establish additional mode structures with the MFP Share.
| · | Variable Rate Remarketed Mode (“VRRM”) – Dividends for MFP Shares within this mode will be established by a remarketing agent; therefore, market value of the MFP Shares is expected to approximate its liquidation preference. Shareholders have the ability to request a best-efforts tender of its shares upon seven days notice. If the remarketing agent is unable to identify an alternative purchaser, the shares will be retained by the shareholder requesting tender and the subsequent dividend rate will increase to its step-up dividend rate. If after one consecutive year of unsuccessful remarketing attempts, the Fund will be required to designate an alternative mode or redeem the shares. The Fund will pay a remarketing fee on the aggregate principal amount of all MFP Shares while designated in VRRM. Payments made by the Fund to the remarketing agent are recognized as “Remarketing fees” on the Statement of Operations. |
| · | Variable Rate Mode (“VRM”) – Dividends for MFP Shares designated in this mode are based upon a short-term index plus an additional fixed “spread” amount established at the time of issuance or renewal / conversion of its mode. At the end of the period of the mode, the Fund will be required to either extend the term of the mode, designate an alternative mode or redeem the MFP Shares. |
77
Notes to Financial Statements (continued)
The fair value of MFP Shares while in VRM are expected to approximate their liquidation preference so long as the fixed “spread” on the shares remains roughly in line with the “spread” being demanded by investors on instruments having similar terms in the current market. In current market conditions, the Adviser has determined that the fair value of the shares are approximately their liquidation preference, but their fair value could vary if market conditions change materially.
| · | Variable Rate Demand Mode (“VRDM”) – Dividends for MFP Shares designated in this mode will be established by a remarketing agent; therefore, the market value of the MFP Shares is expected to approximate its liquidation preference. While in this mode, shares will have an unconditional liquidity feature that enable its shareholders to require a liquidity provider, which the Fund has entered into a contractual agreement, to purchase shares in the event that the shares are not able to be successfully remarketed. In the event that shares within this mode are unable to be successfully remarketed and are purchased by the liquidity provider, the dividend rate will be the maximum rate which is designed to escalate according to a specified schedule in order to enhance the remarketing agent’s ability to successfully remarket the shares. Each Fund is required to redeem any shares that are still owned by a liquidity provider after six months of continuous, unsuccessful remarketing. The Fund will pay a liquidity and remarketing fee on the aggregate principal amount of all MFP shares while within VRDM. Payments made by the Fund to the liquidity provider and remarketing agent are recognized as “Liquidity fees” and “Remarketing fees”, respectively, on the Statement Operations. |
For financial reporting purposes, the liquidation preference of MFP Shares is recorded as a liability and is recognized as a component of “MuniFund Preferred (“MFP”) Shares, net of deferred offering costs” on the Statement of Assets and Liabilities. Dividends on the MFP shares are treated as interest payments for financial reporting purposes. Unpaid dividends on MFP shares are recognized as a component on “Interest payable” on the Statement of Assets and Liabilities. Dividends accrued on MFP Shares are recognized as a component of “Interest expense and amortization of offering costs” on the Statement of Operations.
Subject to certain conditions, MFP Shares may be redeemed, in whole or in part, at any time at the option of the Fund. The Fund may also be required to redeem certain MFP Shares if the Fund fails to maintain certain asset coverage requirements and such failures are not cured by the applicable cure date. The redemption price per share in all circumstances is equal to the liquidation preference per share plus any accumulated but unpaid dividends.
Costs incurred in connection with NTX’s offering of MFP Shares were recorded as deferred charges, which are amortized over the life of the shares and are recognized as a component of “MuniFund Preferred (“MFP”) Shares, net of deferred offering costs” on the Statement of Assets and Liabilities and “Interest expense and amortization of offering costs” on the Statement of Operations.
As of the end of the reporting period, details of NTX’s MFP Shares outstanding were as follows:
| | | | | | | | |
Fund | Series | Shares Outstanding | Liquidation Preference, net of deferred offering costs | Liquidation Preference | Term Redemption Date | Mode | Mode Termination Date |
NTX | A | 720 | $71,637,960 | $72,000,000 | September 1, 2047 | VRM | 10/02/19* |
| * Subject to early termination by either the Fund or the holder. |
The average liquidation preference of MFP Shares outstanding and annualized dividend rate for the Fund during the current fiscal period were as follows:
| | | NTX | |
| Average liquidation preference of MFP Shares outstanding | | $ | 72,000,000 | |
| Annualized dividend rate | | | 2.29 | % |
Variable Rate MuniFund Term Preferred Shares
The following Funds had issued and had outstanding Variable Rate MuniFund Term Preferred (“VMTP”) Shares, with a $100,000 liquidation preference per share. VMTP Shares were issued via private placement and were not publicly available.
On December 14, 2018, the Funds redeemed all of its outstanding Series 2019 VMTP Shares. Each Fund’s VMTP Shares were redeemed at their $100,000 liquidation value per share, plus dividend amounts owed, using proceeds from its issuance of AMTP Shares (as described above in Adjustable Rate MuniFund Term Preferred Shares).
The average liquidation preference of VMTP Shares outstanding and annualized dividend rate for each Fund during the current fiscal period were as follows:
| | | | | | | |
| | | NAZ* | | | NUM* | |
| Average liquidation preference of VMTP Shares outstanding | | $ | 88,300,000 | | | $ | 173,000,000 | |
| Annualized dividend rate | | | 2.37 | % | | | 2.37 | % |
| * For the period March 1, 2018 through December 13, 2018. |
78
VMTP Shares are subject to restrictions on transfer, generally do not trade, and market quotations are generally not available. VMTP Shares are short-term or short/intermediate-term instruments that pay a variable dividend rate tied to a short-term index, plus an additional fixed “spread” amount established at the time of issuance. The fair value of VMTP Shares is expected to be approximately their liquidation preference so long as the fixed “spread” on the VMTP Shares remains roughly in line with the “spread” being demanded by investors on instruments having similar terms in the current market environment. In present market conditions, the Funds’ Adviser has determined that the fair value of VMTP Shares is approximately their liquidation preference, but their fair value could vary if market conditions change materially. For financial reporting purposes, the liquidation preference of VMTP Shares is a liability and is recognized as a component of “Variable Rate MuniFund Term Preferred (“VMTP”) Shares, net of deferred offering costs” on the Statement of Assets and Liabilities.
Dividends on the VMTP Shares (which are treated as interest payments for financial reporting purposes) are set weekly. Unpaid dividends on VMTP Shares are recognized as a component of “Interest payable” on the Statement of Assets and Liabilities. Dividends accrued on VMTP Shares are recognized as a component of “Interest expense and amortization of offering costs” on the Statement of Operations.
Costs incurred in connection with each Fund’s offering of VMTP Shares were recorded as a deferred charges, which are amortized over the life of the shares and are recognized as components of “Variable Rate MuniFund Term Preferred (“VMTP”) Shares, net of deferred offering costs” on the Statement of Assets and Liabilities and “Interest expense and amortization of offering costs” on the Statement of Operations.
In conjunction with NAZ’s and NUM’s redemption of VMTP Shares, the remaining deferred cost of $4,221 and $6,659, respectively, were fully expensed during the current fiscal period, as the redemptions were deemed an extinguishment of debt.
Variable Rate Demand Preferred Shares
The following Fund has issued and has outstanding Variable Rate Demand Preferred (“VRDP”) Shares, with a $100,000 liquidation preference per share. VRDP Shares are issued via private placement and are not publicly available.
As of the end of the reporting period, details of the Fund’s VRDP Shares outstanding were as follows:
Fund | Series | Shares Outstanding | Liquidation Preference, net of deferred offering costs | Liquidation Preference | Maturity |
NUO | 1 | 1,480 | $147,759,533 | $148,000,000 | September 1, 2043 |
VRDP Shares include a liquidity feature that allows VRDP shareholders to have their shares purchased by a liquidity provider with whom the Fund has contracted in the event that the VRDP Shares are not able to be successfully remarketed. The Fund is required to redeem any VRDP Shares that are still owned by the liquidity provider after six months of continuous, unsuccessful remarketing. The Fund pays an annual remarketing fee of 0.10% on the aggregate principal amount of all VRDP Shares outstanding. The Fund’s VRDP Shares have successfully remarketed since issuance.
NUO designated a special rate period until November 14, 2019, for its Series 1 VRDP Shares. During the special rate period, the VRDP Shares will not be remarketed by a remarketing agent, be subject to optional or mandatory tender events, or be supported by a liquidity provider. During the special rate period, VRDP dividends will be set monthly as a floating rate based on the predetermined formula. Following the initial special rate period, Special Rate Period VRDP Shares will transition to traditional VRDP Shares with dividends set at weekly remarketings, and be supported by a designated liquidity provider, unless the Board approves a subsequent special rate period.
Dividends on the VRDP Shares (which are treated as interest payments for financial reporting purposes) are set at a rate established by a remarketing agent; therefore, the market value of the VRDP Shares is expected to approximate its liquidation preference. In the event that VRDP Shares are unable to be successfully remarketed, the dividend rate will be the maximum rate which is designed to escalate according to a specified schedule in order to enhance the remarketing agent’s ability to successfully remarket the VRDP Shares.
Subject to certain conditions, VRDP Shares may be redeemed, in whole or in part, at any time at the option of the Fund. The Fund may also redeem certain of the VRDP Shares if the Fund fails to maintain certain asset coverage requirements and such failures are not cured by the applicable cure date. The redemption price per share is equal to the sum of the liquidation preference per share plus any accumulated but unpaid dividends.
The average liquidation preference of VRDP Shares outstanding and annualized dividend rate for the Fund during the current fiscal period were as follows:
| | | | |
| | | NUO | |
| Average liquidation preference of VRDP Shares outstanding | | $ | 148,000,000 | |
| Annualized dividend rate | | | 2.29 | % |
For financial reporting purposes, the liquidation preference of VRDP Shares is a liability and is recognized as a component of “Variable Rate Demand Preferred (“VRDP”) Shares, net of deferred offering costs” on the Statement of Assets and Liabilities. Unpaid dividends on VRDP Shares are recognized as a component of “Interest payable” on the Statement of Assets and Liabilities, when applicable. Dividends accrued on VRDP Shares are recognized
79
Notes to Financial Statements (continued)
as a component of “Interest expense and amortization of offering costs” on the Statement of Operations. Costs incurred by the Fund in connection with its offerings of VRDP Shares were recorded as a deferred charge, which are amortized over the life of the shares and are recognized as a component of “Variable Rate Demand Preferred (“VRDP”) Shares, net of deferred offering costs” on the Statement of Assets and Liabilities and “Interest expense and amortization of offerings costs” on the Statement of Operations. In addition to interest expense, the Fund also pays a per annum liquidity fee to the liquidity provider, as well as a remarketing fee, which are recognized as “Liquidity fees” and “Remarketing fees,” respectively, on the Statement of Operations, when applicable.
Preferred Share Transactions
Transactions in preferred shares for the Funds during the Funds’ current and prior fiscal period, where applicable, are noted in the following tables.
Transactions in AMTP Shares for the Funds, where applicable, were as follows:
| | | | |
| | Year Ended |
| | February 28, 2019 |
NAZ | Series | Shares | Amount |
| AMTP Shares issued | 2028 | 883 | $88,300,000 |
| |
| | Year Ended |
| | February 28, 2019 |
NUM | Series | Shares | Amount |
| AMTP Shares issued | 2028 | 1,730 | $173,000,000 |
| |
| Transactions in VMTP Shares for the Funds, where applicable, were as follows: |
| | Year Ended |
| | February 28, 2019 |
NAZ | Series | Shares | Amount |
| VMTP Shares redeemed | 2019 | (883) | $(88,300,000) |
| |
| | Year Ended |
| | February 28, 2019 |
NUM | Series | Shares | Amount |
| VMTP Shares redeemed | 2019 | (1,730) $(173,000,000) |
| |
| Transactions in iMTP Shares for the Funds, where applicable, were as follows: |
| | Year Ended |
| | February 28, 2018 |
NTX | Series | Shares | Amount |
| iMTP Shares redeemed | 2018 | (14,400) | $(72,000,000) |
| |
| Transactions in MFP Shares for the Funds, where applicable, were as follows: |
| | Year Ended |
| | February 28, 2018 |
NTX | Series | Shares | Amount |
| MFP Shares issued | A | 720 | $72,000,000 |
5. Investment Transactions
Long-term purchases and sales (including maturities) during the current fiscal period were as follows:
| | | | | | | | | | | | | |
| | | NAZ | | | NUM | | | NUO | | | NTX | |
| Purchases | | $ | 34,917,614 | | | $ | 64,586,201 | | | $ | 56,155,633 | | | $ | 42,204,750 | |
| Sales and maturities | | | 28,490,530 | | | | 68,015,535 | | | | 56,608,760 | | | | 42,086,765 | |
80
6. Income Tax Information
Each Fund is a separate taxpayer for federal income tax purposes. Each Fund intends to distribute substantially all of its net investment income and net capital gains to shareholders and to otherwise comply with the requirements of Subchapter M of the Internal Revenue Code applicable to regulated investment companies. Therefore, no federal income tax provision is required. Furthermore, each Fund intends to satisfy conditions that will enable interest from municipal securities, which is exempt from regular federal and designated state income taxes, to retain such tax-exempt status when distributed to shareholders of the Funds. Net realized capital gains and ordinary income distributions paid by the Funds are subject to federal taxation.
For all open tax years and all major taxing jurisdictions, management of the Funds has concluded that there are no significant uncertain tax positions that would require recognition in the financial statements. Open tax years are those that are open for examination by taxing authorities (i.e., generally the last four tax year ends and the interim tax period since then). Furthermore, management of the Funds is also not aware of any tax positions for which it is reasonably possible that the total amounts of unrecognized tax benefits will significantly change in the next twelve months.
The following information is presented on an income tax basis. Differences between amounts for financial statement and federal income tax purposes are primarily due to timing differences in recognizing taxable market discount, timing differences in recognizing certain gains and losses on investment transactions and the treatment of investments in inverse floating rate securities reflected as financing transactions, if any. To the extent that differences arise that are permanent in nature, such amounts are reclassified within the capital accounts as detailed below. Temporary differences do not require reclassification. Temporary and permanent differences do not impact the NAVs of the Funds.
The table below presents the cost and unrealized appreciation (depreciation) of each Fund’s investment portfolio, as determined on a federal income tax basis, as of February 28, 2019.
| | | | | | | | | | | | | |
| | | NAZ | | | NUM | | | NUO | | | NTX | |
| Tax cost of investments | | $ | 239,118,546 | | | $ | 451,598,984 | | | $ | 420,141,460 | | | $ | 204,602,983 | |
| Gross unrealized: | | | | | | | | | | | | | | | | |
| Appreciation | | $ | 11,180,250 | | | $ | 21,833,521 | | | $ | 22,676,882 | | | $ | 13,513,462 | |
| Depreciation | | | (404,487 | ) | | | (720,315 | ) | | | (2,399,514 | ) | | | (256,498 | ) |
| Net unrealized appreciation (depreciation) of investments | | $ | 10,775,763 | | | $ | 21,113,206 | | | $ | 20,277,368 | | | $ | 13,256,964 | |
Permanent differences, primarily due to federal taxes paid, taxable market discount, distribution reallocations and nondeductible offering costs, resulted in reclassifications among the Funds’ components of common share net assets as of February 28, 2019, the Funds’ tax year end.
The tax components of undistributed net tax-exempt income, net ordinary income and net long-term capital gains as of February 28, 2019, the Funds’ tax year end, were as follows:
| | | | | | | | | | | | | |
| | | NAZ | | | NUM | | | NUO | | | NTX | |
Undistributed net tax-exempt income1 | | $ | 289,804 | | | $ | 498,045 | | | $ | — | | | $ | 155,658 | |
Undistributed net ordinary income2 | | | 10,700 | | | | — | | | | — | | | | 3,664 | |
| Undistributed net long-term capital gains | | | — | | | | — | | | | — | | | | — | |
1 | Undistributed net tax-exempt income (on a tax basis) has not been reduced for the dividend declared on February 1, 2019, paid on March 1, 2019. |
2 | Net ordinary income consists of taxable market discount income and net short-term capital gains, if any. |
The tax character of distributions paid during the Funds’ tax years ended February 28, 2019 and February 28, 2018 was designated for purposes of the dividends paid deduction as follows:
| | | | | | | | | | | | | |
2019 | | NAZ | | | NUM | | | NUO | | | NTX | |
Distributions from net tax-exempt income3 | | $ | 8,204,833 | | | $ | 15,101,888 | | | $ | 13,648,599 | | | $ | 7,177,693 | |
Distributions from net ordinary income2 | | | 23,353 | | | | — | | | | 274,619 | | | | 20,761 | |
Distributions from net long-term capital gains4 | | | — | | | | — | | | | 499,143 | | | | — | |
2018 | | NAZ | | | NUM | | | NUO | | | NTX | |
| Distributions from net tax-exempt income | | $ | 9,082,658 | | | $ | 16,339,018 | | | $ | 15,173,143 | | | $ | 7,717,699 | |
Distributions from net ordinary income2 | | | 100,573 | | | | — | | | | 687,164 | | | | 35,095 | |
| Distributions from net long-term capital gains | | | — | | | | — | | | | — | | | | — | |
2 | Net ordinary income consists of taxable market discount income and net short-term capital gains, if any. |
3 | The Funds hereby designate these amounts paid during the fiscal year ended February 28, 2019, as Exempt Interest Dividends. |
4 | The Funds hereby designate as long-term capital gain dividend, pursuant to the Internal Revenue Code 852(b)(3), the amount necessary to reduce earnings and profits of the Funds related to net capital gain to zero for the tax year ended February 28, 2019. |
81
Notes to Financial Statements (continued)
As of February 28, 2019, the Funds’ tax year end, the Funds had unused capital losses carrying forward available for federal income tax purposes to be applied against future capital gains, if any. The capital losses are not subject to expiration.
| | | | | | | | | | | | | |
| | | NAZ | | | NUM | | | NUO | | | NTX | |
| Not subject to expiration: | | | | | | | | | | | | |
| Short-term | | $ | 1,179,768 | | | $ | 1,144,010 | | | $ | 135,294 | | | $ | 1,252,716 | |
| Long-term | | | 1,608,564 | | | | 1,391,852 | | | | — | | | | 2,707,593 | |
| Total | | $ | 2,788,332 | | | $ | 2,535,862 | | | $ | 135,294 | | | $ | 3,960,309 | |
7. Management Fees and Other Transactions with Affiliates
Management Fees
Each Fund’s management fee compensates the Adviser for overall investment advisory and administrative services and general office facilities. The Sub-Adviser is compensated for its services to the Funds from the management fees paid to the Adviser.
Each Fund’s management fee consists of two components – a fund-level fee, based only on the amount of assets within each individual Fund, and a complex-level fee, based on the aggregate amount of all eligible fund assets managed by the Adviser. This pricing structure enables Fund shareholders to benefit from growth in the assets within their respective Fund as well as from growth in the amount of complex-wide assets managed by the Adviser.
The annual fund-level fee, payable monthly, for each Fund is calculated according to the following schedule:
| | | | |
Average Daily Managed Assets* | | Fund-Level Fee Rate | |
| For the first $125 million | | | 0.4500 | % |
| For the next $125 million | | | 0.4375 | |
| For the next $250 million | | | 0.4250 | |
| For the next $500 million | | | 0.4125 | |
| For the next $1 billion | | | 0.4000 | |
| For the next $3 billion | | | 0.3750 | |
| For managed assets over $5 billion | | | 0.3625 | |
The annual complex-level fee, payable monthly, for each Fund is calculated by multiplying the current complex-wide fee rate, determined according to the following schedule by the Fund’s daily managed assets:
| | | | |
Complex-Level Eligible Asset Breakpoint Level* | | Effective Complex-Level Fee Rate at Breakpoint Level | |
| $55 billion | | | 0.2000 | % |
| $56 billion | | | 0.1996 | |
| $57 billion | | | 0.1989 | |
| $60 billion | | | 0.1961 | |
| $63 billion | | | 0.1931 | |
| $66 billion | | | 0.1900 | |
| $71 billion | | | 0.1851 | |
| $76 billion | | | 0.1806 | |
| $80 billion | | | 0.1773 | |
| $91 billion | | | 0.1691 | |
| $125 billion | | | 0.1599 | |
| $200 billion | | | 0.1505 | |
| $250 billion | | | 0.1469 | |
| $300 billion | | | 0.1445 | |
| * | For the complex-level fees, managed assets include closed-end fund assets managed by the Adviser that are attributable to certain types of leverage. For these purposes, leverage includes the funds’ use of preferred stock and borrowings and certain investments in the residual interest certificates (also called inverse floating rate securities) in tender option bond (TOB) trusts, including the portion of assets held by a TOB trust that has been effectively financed by the trust’s issuance of floating rate securities, subject to an agreement by the Adviser as to certain funds to limit the amount of such assets for determining managed assets in certain circumstances. The complex-level fee is calculated based upon the aggregate daily managed assets of all Nuveen open-end and closed-end funds that constitute “eligible assets.” Eligible assets do not include assets attributable to investments in other Nuveen funds or assets in excess of a determined amount (originally $2 billion) added to the Nuveen fund complex in connection with the Adviser’s assumption of the management of the former First American Funds effective January 1, 2011. As of February 28, 2019, the complex-level fee for each Fund was 0.1591%. |
Other Transactions with Affiliates
Each Fund is permitted to purchase or sell securities from or to certain other funds managed by the Adviser (“inter-fund trade”) under specified conditions outlined in procedures adopted by the Board. These procedures have been designed to ensure that any inter-fund trade of securities by the Fund from or to another fund that is, or could be, considered an affiliate of the Fund under certain limited circumstances by virtue of having a common
82
investment adviser (or affiliated investment adviser), common officer and/or common trustee complies with Rule 17a-7 of the 1940 Act. Further, as defined under these procedures, each inter-fund trade is effected at the current market price as provided by an independent pricing service. Unsettled inter-fund trades as of the end of the reporting period are recognized as a component of “Receivable for investments sold” and/or “Payable for investments purchased” on the Statement of Assets and Liabilities, when applicable.
During the current fiscal period, the following Fund engaged in inter-fund trades pursuant to these procedures as follows:
| | | | |
Inter-Fund Trades | | NAZ | |
| Purchases | | $ | 414,424 | |
| Sales | | | 1,864,879 | |
8. Borrowing Arrangements
Committed Line of Credit
The Funds, along with certain other funds managed by the Adviser (“Participating Funds”), have established a 364-day, approximately $2.65 billion standby credit facility with a group of lenders, under which the Participating Funds may borrow for various purposes other than leveraging for investment purposes. Each Participating Fund is allocated a designated proportion of the facility’s capacity (and its associated costs, as described below) based upon a multi-factor assessment of the likelihood and frequency of its need to draw on the facility, the size of the Fund and its anticipated draws, and the potential importance of such draws to the operations and well-being of the Fund, relative to those of the other Funds. A Fund may effect draws on the facility in excess of its designated capacity if and to the extent that other Participating Funds have undrawn capacity. The credit facility expires in July 2019 unless extended or renewed.
The credit facility has the following terms: a fee of 0.15% per annum on unused commitment amounts, and interest at a rate equal to the higher of (a) one-month LIBOR (London Inter-Bank Offered Rate) plus 1.00% per annum or (b) the Fed Funds rate plus 1.00% per annum on amounts borrowed. Participating Funds paid administration, legal and arrangement fees, which are recognized as a component of “Other expenses” on the Statement of Operations, and along with commitment fees, have been allocated among such Participating Funds based upon the relative proportions of the facility’s aggregate capacity reserved for them and other factors deemed relevant by the Adviser and the Board of each Participating Fund.
During the current fiscal period, the following Funds utilized this facility. Each Fund’s maximum outstanding balance during the utilization period was as follows:
| | | | | | | | | | |
| | | NAZ | | | NUM | | | NTX | |
| Maximum Outstanding Balance | | $ | 1,470,524 | | | $ | 3,324,287 | | | $ | 572,809 | |
During each Fund’s utilization period(s) during the current fiscal period, the average daily balance outstanding and average annual interest rate on the Borrowings were as follows:
| | | | | | | | | | |
| | | NAZ | | | NUM | | | NTX | |
| Average daily balance outstanding | | $ | 1,470,524 | | | $ | 3,324,287 | | | $ | 572,809 | |
| Average annual interest rate | | | 3.50 | % | | | 3.50 | % | | | 3.50 | % |
During the current fiscal period, NUO did not utilize this facility.
Borrowings outstanding as of the end of the reporting period are recognized as “Borrowings” on the Statement of Asset and Liabilities, where applicable.
Inter-Fund Borrowing and Lending
The SEC has granted an exemptive order permitting registered open-end and closed-end Nuveen funds to participate in an inter-fund lending facility whereby the Nuveen funds may directly lend to and borrow money from each other for temporary purposes (e.g., to satisfy redemption requests or when a sale of securities “fails,” resulting in an unanticipated cash shortfall) (the “Inter-Fund Program”). The closed-end Nuveen funds, including the Funds covered by this shareholder report, will participate only as lenders, and not as borrowers, in the Inter-Fund Program because such closed-end funds rarely, if ever, need to borrow cash to meet redemptions. The Inter-Fund Program is subject to a number of conditions, including, among other things, the requirements that (1) no fund may borrow or lend money through the Inter-Fund Program unless it receives a more favorable interest rate than is typically available from a bank or other financial institution for a comparable transaction; (2) no fund may borrow on an unsecured basis through the Inter-Fund Program unless the fund’s outstanding borrowings from all sources immediately after the inter-fund borrowing total 10% or less of its total assets; provided that if the borrowing fund has a secured borrowing outstanding from any other lender, including but not limited to another fund, the inter-fund loan must be secured on at least an equal priority basis with at least an equivalent percentage of collateral to loan value; (3) if a fund’s
83
Notes to Financial Statements (continued)
total outstanding borrowings immediately after an inter-fund borrowing would be greater than 10% of its total assets, the fund may borrow through the inter-fund loan on a secured basis only; (4) no fund may lend money if the loan would cause its aggregate outstanding loans through the Inter-Fund Program to exceed 15% of its net assets at the time of the loan; (5) a fund’s inter-fund loans to any one fund shall not exceed 5% of the lending fund’s net assets; (6) the duration of inter-fund loans will be limited to the time required to receive payment for securities sold, but in no event more than seven days; and (7) each interfund loan may be called on one business day’s notice by a lending fund and may be repaid on any day by a borrowing fund. In addition, a Nuveen fund may participate in the Inter-Fund Program only if and to the extent that such participation is consistent with the fund’s investment objective and investment policies. The Board is responsible for overseeing the Inter-Fund Program.
The limitations detailed above and the other conditions of the SEC exemptive order permitting the Inter-Fund Program are designed to minimize the risks associated with Inter-Fund Program for both the lending fund and the borrowing fund. However, no borrowing or lending activity is without risk. When a fund borrows money from another fund, there is a risk that the loan could be called on one day’s notice or not renewed, in which case the fund may have to borrow from a bank at a higher rate or take other actions to payoff such loan if an inter-fund loan is not available from another fund. Any delay in repayment to a lending fund could result in a lost investment opportunity or additional borrowing costs.
During the current reporting period, none of the Funds covered by this shareholder report have entered into any inter-fund loan activity.
9. New Accounting Pronouncements
Disclosure Update and Simplification
During August 2018, the SEC issued Final Rule Release No. 33-10532, Disclosure Update and Simplification (“Final Rule Release No. 33-10532”). Final Rule Release No. 33-10532 amends certain financial statement disclosure requirements to conform to U.S. GAAP. The amendments to Rule 6-04.17 of Regulation S-X (balance sheet) remove the requirement to separately state the book basis components of net assets: undistributed (over-distribution of) net investment income (“UNII”), accumulated undistributed net realized gains (losses), and net unrealized appreciation (depreciation) at the balance sheet date. Instead, consistent with U.S. GAAP, funds will be required to disclose total distributable earnings. The amendments to Rule 6-09 of Regulation S-X (statement of changes in net assets) remove the requirement to separately state the sources of distributions paid. Instead, consistent with U.S. GAAP, funds will be required to disclose the total amount of distributions paid, except that any tax return of capital must be separately disclosed. The amendments also remove the requirement to parenthetically state the book basis amount of UNII on the statement of changes in net assets.
The requirements of Final Rule Release No. 33-10532 are effective November 5, 2018, and the Funds’ Statement of Assets and Liabilities and Statement of Changes in Net Assets for the current reporting period have been modified accordingly. In addition, certain amounts within each Fund’s Statement of Changes in Net Assets for the prior fiscal period have been modified to conform to Final Rule Release No. 33-10532.
For the prior fiscal period, the total amount of distributions paid to shareholders from net investment income and from accumulated net realized gains, if any, are recognized as “Dividends” on the Statement of Changes in Net Assets.
As of February 28, 2018, the Funds’ Statement of Changes in Net Assets reflected the following UNII balances.
| | | | | | | | | | | | | |
| | | NAZ | | | NUM | | | NUO | | | NTX | |
| UNII at the end of period | | $ | 9,746 | | | $ | (671,426 | ) | | $ | (273,658 | ) | | $ | 7,977 | |
Fair Value Measurement: Disclosure Framework
During August 2018, the FASB issued ASU 2018-13 (“ASU 2018-13”), Fair Value Measurement: Disclosure Framework – Changes to the Disclosure Requirements for Fair Value Measurements. ASU 2018-13 modifies the disclosures required by Topic 820, Fair Value Measurements. The amendments in ASU 2018-13 are effective for all entities for fiscal years, and interim periods within those fiscal years, beginning after December 15, 2019. During the current reporting period, management early implemented this guidance. This implementation did not have a material impact on the Funds’ financial statements.
84
Additional Fund Information (Unaudited)
| | | | | | |
Board of Trustees | | | | | |
| Margo Cook* | Jack B. Evans | William C. Hunter | Albin F. Moschner | John K. Nelson | Judith M. Stockdale |
| Carole E. Stone | Terence J. Toth | Margaret L. Wolff | Robert L. Young | | |
| |
* Interested Board Member. |
| |
| |
Fund Manager | Custodian | Legal Counsel | Independent Registered | Transfer Agent and |
| Nuveen Fund Advisors, LLC | State Street Bank | Chapman and Cutler LLP | Public Accounting Firm | Shareholder Services |
| 333 West Wacker Drive | & Trust Company | Chicago, IL 60603 | KPMG LLP | Computershare Trust |
| Chicago, IL 60606 | One Lincoln Street | | 200 East Randolph Street | Company, N.A. |
| | Boston, MA 02111 | | Chicago, IL 60601 | 250 Royall Street |
| | | | | Canton, MA 02021 |
| | | | | (800) 257-8787 |
Portfolio of Investments Information
Each Fund is required to file its complete schedule of portfolio holdings with the Securities and Exchange Commission (SEC) for the first and third quarters of each fiscal year as an exhibit to its report on Form N-PORT. You may obtain this information on the SEC’s Website at http://www.sec.gov.
Nuveen Funds’ Proxy Voting InformationYou may obtain (i) information regarding how each fund voted proxies relating to portfolio securities held during the most recent twelve-month period ended June 30, without charge, upon request, by calling Nuveen toll-free at (800) 257-8787 or on Nuveen’s website at www.nuveen.com and (ii) a description of the policies and procedures that each fund used to determine how to vote proxies relating to portfolio securities without charge, upon request, by calling Nuveen toll free at (800) 257-8787. You may also obtain this information directly from the SEC. Visit the SEC on-line at http://www.sec.gov.
CEO Certification DisclosureEach Fund’s Chief Executive Officer (CEO) has submitted to the New York Stock Exchange (NYSE) the annual CEO certification as required by Section 303A.12(a) of the NYSE Listed Company Manual. Each Fund has filed with the SEC the certification of its CEO and Chief Financial Officer required by Section 302 of the Sarbanes-Oxley Act.
Common Share RepurchasesEach Fund intends to repurchase, through its open-market share repurchase program, shares of its own common stock at such times and in such amounts as is deemed advisable. During the period covered by this report, each Fund repurchased shares of its common stock, as shown in the accompanying table. Any future repurchases will be reported to shareholders in the next annual or semi-annual report.
| | | | | |
| | NAZ | NUM | NUO | NTX |
| Common shares repurchased | 127,500 | 562,500 | 205,000 | 68,600 |
FINRA BrokerCheck
The Financial Industry Regulatory Authority (FINRA) provides information regarding the disciplinary history of FINRA member firms and associated investment professionals. This information as well as an investor brochure describing FINRA BrokerCheck is available to the public by calling the FINRA BrokerCheck Hotline number at (800) 289-9999 or by visiting www.FINRA.org.
85Glossary of Terms Used in this Report (Unaudited)
| · | Auction Rate Bond: An auction rate bond is a security whose interest payments are adjusted periodically through an auction process, which process typically also serves as a means for buying and selling the bond. Auctions that fail to attract enough buyers for all the shares offered for sale are deemed to have “failed,” with current holders receiving a formula-based interest rate until the next scheduled auction. |
| · | Average Annual Total Return: This is a commonly used method to express an investment’s performance over a particular, usually multi-year time period. It expresses the return that would have been necessary each year to equal the investment’s actual cumulative performance (including change in NAV or market price and reinvested dividends and capital gains distributions, if any) over the time period being considered. |
| · | Duration: Duration is a measure of the expected period over which a bond’s principal and interest will be paid, and consequently is a measure of the sensitivity of a bond’s or bond fund’s value to changes when market interest rates change. Generally, the longer a bond’s or fund’s duration, the more the price of the bond or fund will change as interest rates change. |
| · | Effective Leverage: Effective leverage is a fund’s effective economic leverage, and includes both regulatory leverage (see leverage) and the leverage effects of certain derivative investments in the fund’s portfolio. Currently, the leverage effects of Tender Option Bond (TOB) inverse floater holdings are included in effective leverage values, in addition to any regulatory leverage. |
| · | Escrowed to Maturity Bond: When proceeds of a refunding issue are deposited in an escrow account for investment in an amount sufficient to pay the principal and interest on the issue being refunded. In some cases, though, an issuer may expressly reserve its right to exercise an early call of bonds that have been escrowed to maturity. |
| · | Gross Domestic Product (GDP): The total market value of all final goods and services produced in a country/region in a given year, equal to total consumer, investment and government spending, plus the value of exports, minus the value of imports. |
| · | Inverse Floating Rate Securities: Inverse floating rate securities, also known as inverse floaters or tender option bonds (TOBs), are created by depositing a municipal bond, typically with a fixed interest rate, into a special purpose trust. This trust, in turn, (a) issues floating rate certificates typically paying short-term tax-exempt interest rates to third parties in amounts equal to some fraction of the deposited bond’s par amount or market value, and (b) issues an inverse floating rate certificate (sometimes referred to as an “inverse floater”) to an investor (such as a Fund) interested in gaining investment exposure to a long-term municipal bond. The income received by the holder of the inverse floater varies inversely with the short-term rate paid to the floating rate certificates’ holders, and in most circumstances the holder of the inverse floater bears substantially all of the underlying bond’s downside investment risk. The holder of the inverse floater typically also benefits disproportionately from any potential appreciation of the underlying bond’s value. Hence, an inverse floater essentially represents an investment in the underlying bond on a leveraged basis. |
| · | Leverage: Leverage is created whenever a fund has investment exposure (both reward and/or risk) equivalent to more than 100% of the investment capital. |
| · | Net Asset Value (NAV) Per Share: A fund’s Net Assets is equal to its total assets (securities, cash, accrued earnings and receivables) less its total liabilities. NAV per share is equal to the fund’s Net Assets divided by its number of shares outstanding. |
| · | Pre-Refunding: Pre-Refunding, also known as advanced refundings or refinancings, is a procedure used by state and local governments to refinance municipal bonds to lower interest expenses. The issuer sells new bonds with a lower yield and uses the proceeds to buy U.S. Treasury securities, the interest from which is used to make payments on the higher-yielding bonds. Because of this collateral, pre-refunding generally raises a bond’s credit rating and thus its value. |
86
| · | Regulatory Leverage: Regulatory leverage consists of preferred shares issued by or borrowings of a fund. Both of these are part of a fund’s capital structure. Regulatory leverage is subject to asset coverage limits set in the Investment Company Act of 1940. |
| · | S&P Municipal Bond Indexes Arizona, Michigan, Ohio and Texas: Unleveraged, market value-weighted indexes designed to measure the performance of the tax-exempt, investment-grade municipal bond markets in Arizona, Michigan, Ohio and Texas, respectively. Index returns assume reinvestment of distributions, but do not reflect any applicable sales charges or management fees. |
| · | S&P Municipal Bond Index: An unleveraged, market value-weighted index designed to measure the performance of the tax- exempt, investment-grade U.S. municipal bond market. Index returns assume reinvestment of distributions, but do not reflect any applicable sales charges or management fees. |
| · | Total Investment Exposure: Total investment exposure is a fund’s assets managed by the Adviser that are attributable to finan- cial leverage. For these purposes, financial leverage includes a fund’s use of preferred stock and borrowings and investments in the residual interest certificates (also called inverse floating rate securities) in tender option bond (TOB) trusts, including the portion of assets held by a TOB trust that has been effectively financed by the trust’s issuance of floating rate securities. |
| · | Zero Coupon Bond: A zero coupon bond does not pay a regular interest coupon to its holders during the life of the bond. Income to the holder of the bond comes from accretion of the difference between the original purchase price of the bond at issuance and the par value of the bond at maturity and is effectively paid at maturity. The market prices of zero coupon bonds generally are more volatile than the market prices of bonds that pay interest periodically. |
87
Reinvest Automatically, Easily and Conveniently
Nuveen makes reinvesting easy. A phone call is all it takes to set up your reinvestment account.
Nuveen Closed-End Funds Automatic Reinvestment PlanNuveen Closed-End Fund allows you to conveniently reinvest distributions in additional Fund shares. By choosing to reinvest, you’ll be able to invest money regularly and automatically, and watch your investment grow through the power of compounding. Just like distributions in cash, there may be times when income or capital gains taxes may be payable on distributions that are reinvested. It is important to note that an automatic reinvestment plan does not ensure a profit, nor does it protect you against loss in a declining market.
Easy and convenient
To make recordkeeping easy and convenient, each month you’ll receive a statement showing your total distributions, the date of investment, the shares acquired and the price per share, and the total number of shares you own.
How shares are purchased
The shares you acquire by reinvesting will either be purchased on the open market or newly issued by the Fund. If the shares are trading at or above net asset value at the time of valuation, the Fund will issue new shares at the greater of the net asset value or 95% of the then-current market price. If the shares are trading at less than net asset value, shares for your account will be purchased on the open market. If the Plan Agent begins purchasing Fund shares on the open market while shares are trading below net asset value, but the Fund’s shares subsequently trade at or above their net asset value before the Plan Agent is able to complete its purchases, the Plan Agent may cease open-market purchases and may invest the uninvested portion of the distribution in newly-issued Fund shares at a price equal to the greater of the shares’ net asset value or 95% of the shares’ market value on the last business day immediately prior to the purchase date. Distributions received to purchase shares in the open market will normally be invested shortly after the distribution payment date. No interest will be paid on distributions awaiting reinvestment. Because the market price of the shares may increase before purchases are completed, the average purchase price per share may exceed the market price at the time of valuation, resulting in the acquisition of fewer shares than if the distribution had been paid in shares issued by the Fund. A pro rata portion of any applicable brokerage commissions on open market purchases will be paid by Plan participants. These commissions usually will be lower than those charged on individual transactions.
Flexible
You may change your distribution option or withdraw from the Plan at any time, should your needs or situation change. You can reinvest whether your shares are registered in your name, or in the name of a brokerage firm, bank, or other nominee. Ask your investment advisor if his or her firm will participate on your behalf. Participants whose shares are registered in the name of one firm may not be able to transfer the shares to another firm and continue to participate in the Plan. The Fund reserves the right to amend or terminate the Plan at any time. Although the Fund reserves the right to amend the Plan to include a service charge payable by the participants, there is no direct service charge to participants in the Plan at this time.
Call today to start reinvesting distributions
For more information on the Nuveen Automatic Reinvestment Plan or to enroll in or withdraw from the Plan, speak with your financial advisor or call us at (800) 257-8787.
88
Board Members & Officers (Unaudited)
The management of the Funds, including general supervision of the duties performed for the Funds by the Adviser, is the responsibility of the Board of Trustees of the Funds. The number of trustees of the Funds is set at ten. None of the trustees who are not “interested” persons of the Funds (referred to herein as “independent board members”) has ever been a director or employee of, or consultant to, Nuveen or its affiliates. The names and business addresses of the trustees and officers of the Funds, their principal occupations and other affiliations during the past five years, the number of portfolios each oversees and other directorships they hold are set forth below.
| | | | | |
Name, | Position(s) Held | Year First | Principal | Number |
| Year of Birth | with the Funds | Elected or | Occupation(s) | of Portfolios |
& Address | | Appointed | Including other | in Fund Complex |
| | | and Term(1) | Directorships | Overseen by |
| | | | During Past 5 Years | Board Member |
| |
| Independent Board Members: |
| |
■ TERENCE J. TOTH | | | Formerly, a Co-Founding Partner, Promus Capital (2008-2017); Director, | |
| 1959 | | | Fulcrum IT Service LLC (since 2010) and Quality Control Corporation | |
333 W. Wacker Drive | Chairman and | 2008 | (since 2012); member: Catalyst Schools of Chicago Board (since 2008) | 168 |
| Chicago, IL 6o6o6 | Board Member | Class II | and Mather Foundation Board (since 2012), and chair of its Investment | |
| | | | Committee; formerly, Director, Legal & General Investment | |
| | | | Management America, Inc. (2008-2013); formerly, CEO and President, | |
| | | | Northern Trust Global Investments (2004-2007): Executive Vice President, | |
| | | | Quantitative Management & Securities Lending (2000-2004); prior | |
| | | | thereto, various positions with Northern Trust Company (since 1994); | |
| | | | formerly, Member, Northern Trust Mutual Funds Board (2005-2007), | |
| | | | Northern Trust Global Investments Board (2004-2007), Northern Trust | |
| | | | Japan Board (2004-2007), Northern Trust Securities Inc. Board | |
| | | | (2003- 2007) and Northern Trust Hong Kong Board (1997-2004). | |
| |
■ JACK B. EVANS | | | Chairman (since 2019), formerly, President (1996-2019), The Hall-Perrine | |
| 1948 | | | Foundation, a private philanthropic corporation; Director and Chairman, | |
333 W. Wacker Drive | Board Member | 1999 | United Fire Group, a publicly held company; Director, Public Member, | 168 |
| Chicago, IL 6o6o6 | | Class III | American Board of Orthopaedic Surgery (since 2015); Life Trustee of | |
| | | | Coe College and the Iowa College Foundation; formerly, President | |
| | | | Pro-Tem of the Board of Regents for the State of Iowa University | |
| | | | System; formerly, Director, Alliant Energy and The Gazette Company; | |
| | | | formerly, Director, Federal Reserve Bank of Chicago; formerly, | |
| | | | President and Chief Operating Officer, SCI Financial Group, Inc., a | |
| | | | regional financial services firm. | |
| |
■ WILLIAM C. HUNTER | | | Dean Emeritus, formerly, Dean, Tippie College of Business, University of | |
| 1948 | | | Iowa(2006-2012); Director of Wellmark, Inc. (since 2009); past Director | |
333 W. Wacker Drive | Board Member | 2003 | (2005-2015), and past President (2010-2014) Beta Gamma Sigma, Inc., | 168 |
| Chicago, IL 6o6o6 | | Class I | The International Business Honor Society; formerly, Director (2004-2018) | |
| | | | of Xerox Corporation; Dean and Distinguished Professor of Finance, | |
| | | | School of Business at the University of Connecticut (2003-2006); | |
| | | | previously, Senior Vice President and Director of Research at the Federal | |
| | | | Reserve Bank of Chicago (1995-2003); formerly, Director (1997-2007), | |
| | | | Credit Research Center at Georgetown University. | |
| |
■ ALBIN F. MOSCHNER | | | Founder and Chief Executive Officer, Northcroft Partners, LLC, a | |
| 1952 | | | management consulting firm (since 2012); Chairman (since 2019), | |
333 W. Wacker Drive | Board Member | 2016 | and Director (since 2012), USA Technologies, Inc., a provider of solutions | 168 |
| Chicago, IL 6o6o6 | | Class III | and services to facilitate electronic payment transactions (since 2012); | |
| | | | formerly, Director, Wintrust Financial Corporation (1996-2016); previously, | |
| | | | held positions at Leap Wireless International, Inc., including Consultant | |
| | | | (2011-2012), Chief Operating Officer (2008-2011), and Chief Marketing | |
| | | | Officer (2004-2008); formerly, President, Verizon Card Services division of | |
| | | | Verizon Communications, Inc. (2000-2003); formerly, President, One Point | |
| | | | Services at One Point Communications (1999- 2000); formerly, Vice | |
| | | | Chairman of the Board, Diba, Incorporated (1996-1997); formerly, various | |
| | | | executive positions (1991-1996) and Chief Executive Officer (1995-1996) of | |
| | | | Zenith Electronics Corporation. | |
89
Board Members & Officers (Unaudited) (continued)
| | | | | |
Name, | Position(s) Held | Year First | Principal | Number |
Year of Birth | with the Funds | Elected or | Occupation(s) | of Portfolios |
& Address | | Appointed | Including other | in Fund Complex |
| | | and Term(1) | Directorships | Overseen by |
| | | | During Past 5 Years | Board Member |
| |
Independent Board Members (continued): |
| |
■ JOHN K. NELSON | | | Member of Board of Directors of Core12 LLC (since 2008), a private firm | |
| 1962 | | | which develops branding, marketing and communications strategies for | |
| 333 W. Wacker Drive | Board Member | 2013 | clients; serves on The President’s Council, Fordham University (since | 168 |
| Chicago, IL 6o6o6 | | Class II | 2010); and previously was a Director of The Curran Center for Catholic | |
| | | | American Studies (2009-2018) formerly, senior external advisor to the | |
| | | | financial services practice of Deloitte Consulting LLP (2012-2014): | |
| | | | formerly, Chairman of the Board of Trustees of Marian University (2010 | |
| | | | as trustee, 2011-2014 as Chairman); formerly, Chief Executive Officer of | |
| | | | ABN AMRO N.V. North America, and Global Head of its Financial Markets | |
| | | | Division (2007-2008); prior senior positions held at ABN AMRO include | |
| | | | Corporate Executive Vice President and Head of Global Markets-the | |
| | | | Americas (2006-2007), CEO of Wholesale Banking North America and | |
| | | | Global Head of Foreign Exchange and Futures Markets (2001-2006), and | |
| | | | Regional Commercial Treasurer and Senior Vice President Trading-North | |
| | | | America (1996-2001); formerly, Trustee at St. Edmund Preparatory | |
| | | | School in New York City. | |
| |
■ JUDITH M. STOCKDALE | | | Board Member, Land Trust Alliance (since 2013) and U.S. Endowment for | |
| 1947 | | | Forestry and Communities (since 2013); formerly, Executive Director | |
| 333 W. Wacker Drive | Board Member | 1997 | (1994-2012), Gaylord and Dorothy Donnelley Foundation; prior thereto, | 168 |
| Chicago, IL 6o6o6 | | Class I | Executive Director, Great Lakes Protection Fund (1990-1994). | |
| |
■ CAROLE E. STONE | | | Former Director, Chicago Board Options Exchange, Inc. (2006-2017); | |
| 1947 | | | and C2 Options Exchange, Incorporated (2009-2017); Director, Cboe, | |
| 333 W. Wacker Drive | Board Member | 2007 | L.C. Global Markets, Inc., formerly, CBOE Holdings, Inc. (since 2010); | 168 |
| Chicago, IL 6o6o6 | | Class I | formerly, Commissioner, New York State Commission on Public | |
| | | | Authority Reform (2005-2010). | |
| |
■ MARGARET L. WOLFF | | | Formerly, member of the Board of Directors (2013-2017) of Travelers | |
| 1955 | | | Insurance Company of Canada and The Dominion of Canada General | |
| 333 W. Wacker Drive | Board Member | 2016 | Insurance Company (each, a part of Travelers Canada, the Canadian | 168 |
| Chicago, IL 6o6o6 | | Class I | operation of The Travelers Companies, Inc.); formerly, Of Counsel, | |
| | | | Skadden, Arps, Slate, Meagher & Flom LLP (Mergers & Acquisitions | |
| | | | Group) (2005-2014); Member of the Board of Trustees of New York- | |
| | | | Presbyterian Hospital (since 2005); Member (since 2004) and Chair | |
| | | | (since 2015) of the Board of Trustees of The John A. Hartford Foundation | |
| | | | (a philanthropy dedicated to improving the care of older adults); | |
| | | | formerly, Member (2005-2015) and Vice Chair (2011-2015) of the | |
| | | | Board of Trustees of Mt. Holyoke College. | |
| |
■ ROBERT L. YOUNG(2) | | | Formerly, Chief Operating Officer and Director, J.P.Morgan Investment | |
| 1963 | | | Management Inc. (2010-2016); formerly, President and Principal | |
| 333 W. Wacker Drive | Board Member | 2017 | Executive Officer (2013-2016), and Senior Vice President and Chief | 166 |
| Chicago, IL 6o6o6 | | Class II | Operating Officer (2005-2010), of J.P.Morgan Funds; formerly, Director | |
| | | | and various officer positions for J.P.Morgan Investment Management | |
| | | | Inc. (formerly, JPMorgan Funds Management, Inc. and formerly, One | |
| | | | Group Administrative Services) and JPMorgan Distribution Services, | |
| | | | Inc. (formerly, One Group Dealer Services, Inc.) (1999-2017). | |
90
| | | | | |
Name, | Position(s) Held | Year First | Principal | Number |
Year of Birth | with the Funds | Elected or | Occupation(s) | of Portfolios |
& Address | | Appointed | Including other | in Fund Complex |
| | | and Term(1) | Directorships | Overseen by |
| | | | During Past 5 Years | Board Member |
| |
Interested Board Member: |
| |
■ MARGO L. COOK(3) | | | President (since 2017), formerly, Co-Chief Executive Officer and | |
| 1964 | | | Co-President (2016-2017), formerly, Senior Executive Vice President of | |
| 333 W. Wacker Drive | Board Member | 2016 | Nuveen Investments, Inc.; President, Global Products and Solutions | 168 |
| Chicago, IL 6o6o6 | | Class III | (since 2017), and, Co-Chief Executive Officer (since 2015), formerly, | |
| | | | Executive Vice President (2013-2015), of Nuveen Securities, LLC; | |
| | | | Executive Vice President (since 2017) of Nuveen, LLC; President (since | |
| | | | August 2017), formerly Co-President (2016- 2017), formerly, Senior | |
| | | | Executive Vice President of Nuveen Fund Advisors, LLC (Executive Vice | |
| | | | President since 2011); President (since 2017), Nuveen Alternative | |
| | | | Investments, LLC; Chartered Financial Analyst. | |
| |
Name, Year of Birth & Address | Position(s) Held with the Funds | Year First Elected or Appointed(4) | Principal Occupation(s) During Past 5 Years |
| |
Officers of the Funds: |
| |
■ CEDRIC H. ANTOSIEWICZ | | | Senior Managing Director (since 2017), formerly, Managing Director |
| 1962 | Chief | | (2004-2017) of Nuveen Securities, LLC; Senior Managing Director (since |
| 333 W. Wacker Drive | Administrative | 2007 | 2017), formerly, Managing Director (2014-2017) of Nuveen Fund |
| Chicago, IL 6o6o6 | Officer | | Advisors, LLC. |
| |
■ NATHANIEL T. JONES | | | Managing Director (since 2017), formerly, Senior Vice President |
| 1979 | | | (2016-2017), formerly, Vice President (2011-2016) of Nuveen; Managing |
| 333 W. Wacker Drive | Vice President | 2016 | Director of Nuveen Fund Advisors, LLC; Chartered Financial Analyst. |
| Chicago, IL 6o6o6 | and Treasurer | | |
| |
■ WALTER M. KELLY | | | Managing Director (since 2017), formerly, Senior Vice President |
| 1970 | Chief Compliance | | (2008-2017) of Nuveen. |
| 333 W. Wacker Drive | Officer and | 2003 | |
| Chicago, IL 6o6o6 | Vice President | | |
| |
■ DAVID J. LAMB | | | Managing Director (since 2017), formerly, Senior Vice President of |
| 1963 | | | Nuveen (since 2006), Vice President prior to 2006. |
| 333 W. Wacker Drive | Vice President | 2015 | |
| Chicago, IL 6o6o6 | | | |
| |
■ TINA M. LAZAR | | | Managing Director (since 2017), formerly, Senior Vice President |
| 1961 | | | (2014-2017) of Nuveen Securities, LLC. |
| 333 W. Wacker Drive | Vice President | 2002 | |
| Chicago, IL 6o6o6 | | | |
91
Board Members & Officers (Unaudited) (continued)
Name, Year of Birth & Address | Position(s) Held with the Funds | Year First Elected or Appointed(4) | Principal Occupation(s) During Past 5 Years |
| |
| Officers of the Funds (continued): |
| |
■ KEVIN J. MCCARTHY | | | Senior Managing Director (since 2017) and Secretary and General Counsel |
| 1966 | Vice President | | (since 2016) of Nuveen Investments, Inc., formerly, Executive Vice |
333 W. Wacker Drive | and Assistant | 2007 | President (2016-2017) and Managing Director and Assistant Secretary |
| Chicago, IL 6o6o6 | Secretary | | (2008-2016); Senior Managing Director (since 2017) and Assistant |
| | | | Secretary (since 2008) of Nuveen Securities, LLC, formerly Executive |
| | | | Vice President (2016-2017) and Managing Director (2008-2016); Senior |
| | | | Managing Director (since 2017), Secretary (since 2016) and Co-General |
| | | | Counsel (since 2011) of Nuveen Fund Advisors, LLC, formerly, Executive |
| | | | Vice President (2016-2017), Managing Director (2008-2016) and |
| | | | Assistant Secretary (2007-2016); Senior Managing Director (since 2017), |
| | | | Secretary (since 2016) and Associate General Counsel (since 2011) of |
| | | | Nuveen Asset Management, LLC, formerly Executive Vice President |
| | | | (2016-2017) and Managing Director and Assistant Secretary (2011-2016); |
| | | | Senior Managing Director (since 2017) and Secretary (since 2016) of |
| | | | Nuveen Investments Advisers, LLC, formerly Executive Vice President |
| | | | (2016-2017); Vice President (since 2007) and Secretary (since 2016), |
| | | | formerly, Assistant Secretary, of NWQ Investment Management |
| | | | Company, LLC, Symphony Asset Management LLC, Santa Barbara Asset |
| | | | Management, LLC and Winslow Capital Management, LLC (since 2010). |
| | | | Senior Managing Director (since 2017) and Secretary (since 2016) of |
| | | | Nuveen Alternative Investments, LLC. |
| |
■ WILLIAM T. MEYERS | | | Senior Managing Director (since 2017), formerly, Managing Director |
| 1966 | Vice President | | (2016-2017), Senior Vice President (2010-2016) of Nuveen Securities, LLC; |
333 W. Wacker Drive | | 2018 | and Nuveen Fund Advisors, LLC; Senior Managing Director (since 2017), |
| Chicago, IL 60606 | | | formerly, Managing Director (2016-2017), Senior Vice President |
| | | | (2010-2016) of Nuveen, has held various positions with Nuveen since 1991. |
| |
■ MICHAEL A. PERRY | | | Executive Vice President (since 2017), previously Managing Director |
| 1967 | | | from 2016), of Nuveen Fund Advisors, LLC and Nuveen Alternative |
333 W. Wacker Drive | Vice President | 2017 | Investments, LLC; Executive Vice President (since 2017), formerly, |
| Chicago, IL 6o6o6 | | | Managing Director (2015-2017), of Nuveen Securities, LLC; formerly, |
| | | | Managing Director (2010-2015) of UBS Securities, LLC. |
| |
■ CHRISTOPHER M. ROHRBACHER | | Managing Director (since 2017) and Assistant Secretary of Nuveen |
| 1971 | Vice President | | Securities, LLC; Managing Director (since 2017), formerly, Senior |
333 W. Wacker Drive | and Assistant | 2008 | Vice President (2016-2017) and Assistant Secretary (since 2016) of |
| Chicago, IL 6o6o6 | Secretary | | Nuveen Fund Advisors, LLC. |
| |
■ WILLIAM A. SIFFERMANN | | | Managing Director (since 2017), formerly Senior Vice President |
| 1975 | | | (2016-2017) and Vice President (2011-2016) of Nuveen. |
| 333 W. Wacker Drive | Vice President | 2017 | |
| Chicago, IL 6o6o6 | | | |
| |
■ JOEL T. SLAGER | | | Fund Tax Director for Nuveen Funds (since 2013); previously, |
| 1978 | Vice President | | Vice President of Morgan Stanley Investment Management, Inc., |
333 W. Wacker Drive | and Assistant | 2013 | Assistant Treasurer of the Morgan Stanley Funds (from 2010 to 2013). |
| Chicago, IL 6o6o6 | Secretary | | |
| |
■ E. SCOTT WICKERHAM | | | Senior Managing Director, Head of Fund Administration at Nuveen, LLC |
| 1973 | Vice President | | (since 2019), formerly, Managing Director; Principal Financial Officer, |
| TIAA | and Controller | 2019 | Principal Accounting Officer and Treasurer (since 2017) to the TIAA-CREF |
| 730 Third Avenue | | | Funds, the TIAA-CREF Life Funds, the TIAA Separate Account VA-1 and the |
| New York, NY 10017 | | | Treasurer (since 2017) to the CREF Accounts; Senior Director, TIAA-CREF |
| | | | Fund Administration (2014-2015); has held various positions with TIAA |
| | | | since 2006. |
92
Name, Year of Birth & Address | Position(s) Held with the Funds | Year First Elected or Appointed(4) | Principal Occupation(s) During Past 5 Years |
| |
| Officers of the Funds (continued): | | |
| |
■ MARK L. WINGET | | | Vice President and Assistant Secretary of Nuveen Securities, LLC |
| 1968 | Vice President | | (since 2008); Vice President (since 2010) and Associate General |
333 W. Wacker Drive | and Assistant | 2008 | Counsel (since 2008) of Nuveen. |
| Chicago, IL 60606 | Secretary | | |
| |
■ GIFFORD R. ZIMMERMAN | | | Managing Director (since 2002), and Assistant Secretary of Nuveen |
| 1956 | Vice President | | Securities, LLC; Managing Director (since 2004) and Assistant Secretary |
333 W. Wacker Drive | Secretary | 1988 | (since 1994) of Nuveen Investments, Inc.; Managing Director (since |
| Chicago, IL 60606 | | | 2002), Assistant Secretary (since 1997) and Co-General Counsel (since |
| | | | 2011) of Nuveen Fund Advisors, LLC; Managing Director, Assistant |
| | | | Secretary and Associate General Counsel of Nuveen Asset |
| | | | Management, LLC (since 2011); Vice President (since 2017), formerly, |
| | | | Managing Director (2003-2017) and Assistant Secretary (since 2003) of |
| | | | Symphony Asset Management LLC; Managing Director and Assistant |
| | | | Secretary (since 2002) of Nuveen Investments Advisers, LLC; Vice |
| | | | President and Assistant Secretary of NWQ Investment Management |
| | | | Company, LLC (since 2002), Santa Barbara Asset Management, LLC |
| | | | (since 2006), and of Winslow Capital Management, LLC, (since 2010); |
| | | | Chartered Financial Analyst. |
| | |
| (1) | The Board of Trustees is divided into three classes, Class I, Class II, and Class III, with each being elected to serve until the third succeeding annual shareholders’ meeting subsequent to its election or thereafter in each case when its respective successors are duly elected or appointed, except two board members are elected by the holders of Preferred Shares, when applicable, to serve until the next annual shareholders’ meeting subsequent to its election or thereafter in each case when its respective successors are duly elected or appointed. The year first elected or appointed represents the year in which the board member was first elected or appointed to any fund in the Nuveen Complex. |
| (2) | On May 25, 2017, Mr. Young was appointed as a Board Member, effective July 1, 2017. He is a Board Member of each of the Nuveen Funds, except Nuveen Diversified Dividend and Income Fund and Nuveen Real Estate Income Fund. |
| (3) | “Interested person” as defined in the 1940 Act, by reason of her position with Nuveen, LLC. and certain of its subsidiaries, which are affiliates of the Nuveen Funds. |
| (4) | Officers serve one year terms through August of each year. The year first elected or appointed represents the year in which the Officer was first elected or appointed to any fund in the Nuveen Complex. |
93
Notes
94
Notes
95
Nuveen:
Serving Investors for Generations
Since 1898, financial advisors and their clients have relied on Nuveen to provide dependable investment solutions through continued adherence to proven, long-term investing principles. Today, we offer a range of high quality solutions designed to be integral components of a well-diversified core portfolio.
Focused on meeting investor needs.
Nuveen is the investment manager of TIAA. We have grown into one of the world’s premier global asset managers, with specialist knowledge across all major asset classes and particular strength in solutions that provide income for investors and that draw on our expertise in alternatives and responsible investing. Nuveen is driven not only by the independent investment processes across the firm, but also the insights, risk management, analytics and other tools and resources that a truly world-class platform provides. As a global asset manager, our mission is to work in partnership with our clients to create solutions which help them secure their financial future.
Find out how we can help you.
To learn more about how the products and services of Nuveen may be able to help you meet your financial goals, talk to your financial advisor, or call us at (800) 257-8787. Please read the information provided carefully before you invest. Investors should consider the investment objective and policies, risk considerations, charges and expenses of any investment carefully. Where applicable, be sure to obtain a prospectus, which contains this and other relevant information. To obtain a prospectus, please contact your securities representative or Nuveen, 333 W. Wacker Dr., Chicago, IL 60606. Please read the prospectus carefully before you invest or send money.
Learn more about Nuveen Funds at: www.nuveen.com/closed-end funds
| Nuveen Securities, LLC, member FINRA and SIPC | 333 West Wacker Drive Chicago, IL 60606 | www.nuveen.com | | EAN-B-0219D 803989-INV-Y-04/20 |
ITEM 2. CODE OF ETHICS.
As of the end of the period covered by this report, the registrant has adopted a code of ethics that applies to the registrant’s principal executive officer, principal financial officer, principal accounting officer or controller, or persons performing similar functions. There were no amendments to or waivers from the Code during the period covered by this report. The registrant has posted the code of ethics on its website at www.nuveen.com/CEF/Shareholder/FundGovernance.aspx. (To view the code, click on Code of Conduct.)
ITEM 3. AUDIT COMMITTEE FINANCIAL EXPERT.
As of the end of the period covered by this report, the registrant’s Board of Directors or Trustees (“Board”) determined that the registrant has at least one “audit committee financial expert” (as defined in Item 3 of Form N-CSR) serving on its Audit Committee. The registrant’s audit committee financial experts are Carole E. Stone, Jack B. Evans and William C. Hunter, who are “independent” for purposes of Item 3 of Form N-CSR.
ITEM 4. PRINCIPAL ACCOUNTANT FEES AND SERVICES.
SERVICES THAT THE FUND’S AUDITOR BILLED TO THE ADVISER AND AFFILIATED FUND SERVICE PROVIDERS
Audit Committee Pre-Approval Policies and Procedures. Generally, the Audit Committee must approve (i) all non-audit services to be performed for the Fund by the Fund’s independent accountants and (ii) all audit and non-audit services to be performed by the Fund’s independent accountants for the Affiliated Fund Service Providers with respect to operations and financial reporting of the Fund. Regarding tax and research projects conducted by the independent accountants for the Fund and Affiliated Fund Service Providers (with respect to operations and financial reports of the Fund) such engagements will be (i) pre-approved by the Audit Committee if they are expected to be for amounts greater than $10,000; (ii) reported to the Audit Committee chairman for his verbal approval prior to engagement if they are expected to be for amounts under $10,000 but greater than $5,000; and (iii) reported to the Audit Committee at the next Audit Committee meeting if they are expected to be for an amount under $5,000.
ITEM 6. SCHEDULE OF INVESTMENTS.
a) See Portfolio of Investments in Item 1.
b) Not applicable.
ITEM 8. PORTFOLIO MANAGERS OF CLOSED-END MANAGEMENT INVESTMENT COMPANIES.
Nuveen Fund Advisors, LLC is the registrant’s investment adviser (also referred to as the “Adviser”). The Adviser is responsible for the selection and on-going monitoring of the Fund’s investment portfolio, managing the Fund’s business affairs and providing certain clerical, bookkeeping and administrative services. The Adviser has engaged Nuveen Asset Management, LLC (“Nuveen Asset Management” or “Sub-Adviser”) as Sub-Adviser to provide discretionary investment advisory services. The following section provides information on the portfolio manager at the Sub-Adviser:
Item 8(a)(1). PORTFOLIO MANAGER BIOGRAPHY
As of the date of filing this report, the following individual at the Sub-Adviser (the “Portfolio Manager”) has primary responsibility for the day-to-day implementation of the Fund’s investment strategy:
Michael Hamilton, Senior Vice President of Nuveen Asset Management, manages several municipal funds. He joined Nuveen Asset Management on January 1, 2011 in connection with Nuveen Fund Advisors acquiring a portion of the asset management business of FAF Advisors. He began working in the financial industry when he joined FAF Advisors in 1989, as a fixed-income fund manager and trader. He became a portfolio manager in 1992. He received a B.A. from Albertson’s College of Idaho and an M.B.A. from Western Washington University. He is a member of the Portland Society of Financial Analysts. Currently, he manages investments for 12 Nuveen-sponsored investment companies.
Item 8(a)(2).OTHER ACCOUNTS MANAGED BY THE PORTFOLIO MANAGER
Actual or apparent conflicts of interest may arise when a portfolio manager has day-to-day management responsibilities with respect to more than one account. More specifically, portfolio managers who manage multiple accounts are presented a number of potential conflicts, including, among others, those discussed below.
The management of multiple accounts may result in a portfolio manager devoting unequal time and attention to the management of each account. Nuveen Asset Management seeks to manage such competing interests for the time and attention of portfolio managers by having portfolio managers focus on a particular investment discipline. Most accounts managed by a portfolio manager in a particular investment strategy are managed using the same investment models.
If a portfolio manager identifies a limited investment opportunity which may be suitable for more than one account, an account may not be able to take full advantage of that opportunity due to an allocation of filled purchase or sale orders across all eligible accounts. To deal with these situations, Nuveen Asset Management has adopted procedures for allocating limited opportunities across multiple accounts.
With respect to many of its clients’ accounts, Nuveen Asset Management determines which broker to use to execute transaction orders, consistent with its duty to seek best execution of the transaction. However, with respect to certain other accounts, Nuveen Asset Management may be limited by the client with respect to the selection of brokers or may be instructed to direct trades through a particular broker. In these cases, Nuveen Asset Management may place separate, non-simultaneous, transactions for a Fund and other accounts which may temporarily affect the market price of the security or the execution of the transaction, or both, to the detriment of the Fund or the other accounts.
Some clients are subject to different regulations. As a consequence of this difference in regulatory requirements, some clients may not be permitted to engage in all the investment techniques or transactions or to engage in these transactions to the same extent as the other accounts managed by the portfolio manager. Finally, the appearance of a conflict of interest may arise where Nuveen Asset Management has an incentive, such as a performance-based management fee, which relates to the management of some accounts, with respect to which a portfolio manager has day-to-day management responsibilities.
Nuveen Asset Management has adopted certain compliance procedures which are designed to address these types of conflicts common among investment managers. However, there is no guarantee that such procedures will detect each and every situation in which a conflict arises.
Item 8(a)(3). FUND MANAGER COMPENSATION
As of the most recently completed fiscal year end, the primary portfolio manager’s compensation is as follows:
Portfolio manager compensation consists primarily of base pay, an annual cash bonus and long term incentive payments.
A portion of each portfolio manager’s annual cash bonus is based on the Fund’s pre-tax investment performance, generally measured over the past one- and three or five-year periods unless the portfolio manager’s tenure is shorter. Investment performance for the Fund generally is determined by evaluating the Fund’s performance relative to its benchmark(s) and/or Lipper industry peer group.
A portion of the cash bonus is based on a qualitative evaluation made by each portfolio manager’s supervisor taking into consideration a number of factors, including the portfolio manager’s team collaboration, expense management, support of personnel responsible for asset growth, and his or her compliance with Nuveen Asset Management’s policies and procedures.
The final factor influencing a portfolio manager’s cash bonus is the financial performance of Nuveen Asset Management based on its operating earnings.
There are generally no differences between the methods used to determine compensation with respect to the Fund and the Other Accounts shown in the table above.
Item 8(a)(4). OWNERSHIP OF NAZ SECURITIES AS OF FEBRUARY 28, 2019