Washington, D.C. 20549
Mark L. Winget
Form N-CSR is to be used by management investment companies to file reports with the Commission not later than 10 days after the transmission to stockholders of any report that is required to be transmitted to stockholders under Rule 30e-1 under the Investment Company Act of 1940 (17 CFR 270.30e-1). The Commission may use the information provided on Form N-CSR in its regulatory, disclosure review, inspection, and policymaking roles.
A registrant is required to disclose the information specified by Form N-CSR, and the Commission will make this information public. A registrant is not required to respond to the collection of information contained in Form N-CSR unless the Form displays a currently valid Office of Management and Budget (“OMB”) control number. Please direct comments concerning the accuracy of the information collection burden estimate and any suggestions for reducing the burden to Secretary, Securities and Exchange Commission, 450 Fifth Street, NW, Washington, DC 20549-0609. The OMB has reviewed this collection of information under the clearance requirements of 44 U.S.C. ss. 3507.
ITEM 1. REPORTS TO STOCKHOLDERS.
Life is Complex.
Nuveen makes things e-simple.
It only takes a minute to sign up for e-Reports. Once enrolled, you’ll receive an e-mail as soon as your Nuveen Fund information is ready—no more waiting for delivery by regular mail. Just click on the link within the e-mail to see the report and save it on your computer if you wish.
Free e-Reports
right to your e-mail!
www.investordelivery.com
If you receive your Nuveen Fund
dividends and statements from your
financial professional or brokerage account.
or
www.nuveen.com/client-access
If you receive your Nuveen Fund
dividends and statements directly from
Nuveen.
NOT FDIC INSURED MAY LOSE
VALUE NO BANK GUARANTEE
Table of Contents
| | |
| 4 |
| 5 |
| 13 |
| 14 |
| 16 |
| 24 |
| 25 |
| 26 |
| 67 |
| 68 |
| 69 |
| 71 |
| 72 |
| 78 |
| 90 |
| 114 |
| 115 |
| 117 |
3
Chair’s Letterto Shareholders Dear Shareholders,
A year has passed since the World Health Organization declared COVID-19 a global pandemic in March 2020. A year of global economic recession, financial market turbulence and some immeasurable losses. A year later the health crisis persists but the widespread distribution of vaccines in the U.S. is enabling us to look forward to what our “new normal” might be. In the meantime, extraordinary economic interventions by governments and central banks, around the world, are helping to bridge the gap.
With vaccine progress and economic stimulus beginning to provide real benefits to the global economy, markets are anticipating a strong rebound in growth, especially in the U.S. To extend relief programs enacted earlier in the crisis, the U.S. government passed $900 billion in aid to individuals and businesses in late December 2020. Another $1.9 trillion relief package was signed into law in March 2021 providing extended unemployment benefits, direct payments to individuals and families, assistance to state and local municipalities, grants to education and public health, and other support. The U.S. Federal Reserve, along with other central banks around the world, has pledged to keep monetary conditions accommodative for as long as necessary, as they consider the recent increase in inflation risks as transitory.
While the markets’ longer-term outlook has brightened, we expect intermittent bouts of volatility to continue. COVID-19 cases are still elevated in some regions, as more virulent strains have spread and vaccination rollouts have been uneven around the world. The recovery hinges on controlling the virus, and estimates vary considerably on when economic activity might be fully restored. While achieving sufficient inoculation of the population depends on many variables, including logistics, public confidence, real-world efficacy and the emergence of variant virus strains, vaccination rates are gathering pace and three options (Pfizer/BioNTech, Moderna and Johnson & Johnson) were authorized for use in the U.S. By early April the U.S. was administering an average of 3 million doses per day, up from 1.3 million per day on average at the beginning of February, according to Bloomberg’s vaccine tracker. On the political front, the Biden administration’s full policy agenda and the potential for Congressional gridlock remain to be seen, either of which could cause investment outlooks to shift. Nevertheless, short-term market fluctuations can provide opportunities to invest in new ideas as well as upgrade existing positioning within our goal of providing long-term value for our shareholders. For more than 120 years, the careful consideration of risk and reward has guided Nuveen’s focus on delivering long-term results to our shareholders.
If you have concerns about what’s coming next, it can be an opportune time to assess your portfolio’s resilience and readiness. We encourage you to review your time horizon, risk tolerance and investment goals with your financial professional. On behalf of the other members of the Nuveen Fund Board, we look forward to continuing to earn your trust in the months and years ahead.
Sincerely,
Terence J. Toth
Chair of the Board
April 23, 2021
4
Portfolio Managers’ Comments
Nuveen Arizona Quality Municipal Income Fund (NAZ)
Nuveen Ohio Quality Municipal Income Fund (NUO)
Nuveen New Jersey Quality Municipal Income Fund (NXJ)
Nuveen Pennsylvania Quality Municipal Income Fund (NQP)
These Funds feature portfolio management by Nuveen Asset Management, LLC (NAM), an affiliate of Nuveen Fund Advisors, LLC, the Funds’ investment adviser. Portfolio managers Michael S. Hamilton, Daniel J. Close, CFA, and Paul L. Brennan, CFA, review U.S. economic and market conditions, key investment strategies and the twelve-month reporting period performance of these Nuveen Funds.
Michael assumed portfolio management responsibility for NAZ in 2011, while Dan has managed NUO since 2007. Paul assumed portfolio management responsibility for the NXJ and NQP in 2011.
What factors affected the U.S. economy and the market during the twelve-month annual reporting period ended February 28, 2021?
The U.S. economy rebounded more quickly than expected from the deep downturn caused by the COVID-19 crisis and containment measures, but had not made a full recovery by the end of 2020. The economy fell into a deep recession in February 2020 due to the restrictions on business and social activity to mitigate the COVID-19 spread. In the first and second quarters of 2020, annualized gross domestic product (GDP) shrank 5% and 31.4%, respectively. Government relief programs provided significant aid to individuals and businesses as the economy began reopening in May 2020, which helped the economy bounce back strongly over the second half of the year. U.S. GDP grew 4.3% on an annualized basis in the fourth quarter of 2020 and 33.4% (annualized) in the third quarter, but remained down 3.5% in 2020 overall (from the 2019 annual level to the 2020 annual level) as measured by the Bureau of Economic Analysis “third” estimate. GDP measures the value of goods and services produced by the nation’s economy less the value of the goods and services used up in production, adjusted for price changes.
Although, consumer spending, the largest driver of the economy, remained resilient despite the disruption caused by the health and economic crisis, it declined significantly as unemployment rose sharply starting in March 2020. These measures rebounded markedly in the second half of 2020, although the momentum slowed toward the end of 2020 amid a resurgence of COVID-19 infections. As of February 2021, slightly more than half of the 22 million jobs lost in March and April 2020 have been recovered resulting
This material is not intended to be a recommendation or investment advice, does not constitute a solicitation to buy, sell or hold a security or an investment strategy and is not provided in a fiduciary capacity. The information provided does not take into account the specific objectives or circumstances of any particular investor, or suggest any specific course of action. Investment decisions should be made based on an investor’s objectives and circumstances and in consultation with his or her advisors.Certain statements in this report are forward-looking statements. Discussions of specific investments are for illustration only and are not intended as recommendations of individual investments. The forward-looking statements and other views expressed herein are those of the portfolio managers as of the date of this report. Actual future results or occurrences may differ significantly from those anticipated in any forward-looking statements, and the views expressed herein are subject to change at any time, due to numerous market and other factors. The Funds disclaim any obligation to update publicly or revise any forward-looking statements or views expressed herein.
For financial reporting purposes, the ratings disclosed are the highest rating given by one of the following national rating agencies: Standard & Poor’s Group (S&P), Moody’s Investors Service, Inc. (Moody’s) or Fitch, Inc. (Fitch). This treatment of split-rated securities may differ from that used for other purposes, such as for Fund investment policies. Credit ratings are subject to change. AAA, AA, A and BBB are investment grade ratings, while BB, B, CCC, CC, C and D are below investment grade ratings. Holdings designated N/R are not rated by these national rating agencies.
Bond insurance guarantees only the payment of principal and interest on the bond when due, and not the value of the bonds themselves, which will fluctuate with the bond market and the financial success of the issuer and the insurer. Insurance relates specifically to the bonds in the portfolio and not to the share prices of a Fund. No representation is made as to the insurers’ ability to meet their commitments.
Refer to the Glossary of Terms Used in this Report for further definition of the terms used within this section.
5
Portfolio Managers’ Comments (continued)
in an unemployment rate of 6.2% in February 2021 as reported by the Bureau of Labor Statistics, up from 3.5% in February 2020. The average hourly earnings rate increased, growing at an annualized rate of 5.3% in February 2021, despite the spike in unemployment. Earnings data was skewed by the concentration of job losses in lower-wage work, which effectively eliminated most of the low-wage data, resulting in an average of mostly higher numbers. The overall trend of inflation remained muted, as decreases in apparel, transportation and pharmaceutical drug prices offset an increase in food, energy and used car prices. The Bureau of Labor Statistics said the Consumer Price Index (CPI) increased 1.7% over the twelve-month reporting period ended February 28, 2021, before seasonal adjustment.
With the onset of the COVID-19 crisis, the Federal Reserve (Fed) enacted an array of emergency measures in March 2020 to stabilize the financial system and support the markets, including cutting its main interest rate to near zero, offering lending programs to aid small and large companies and allowing unlimited bond purchases, known as quantitative easing. In August 2020, the Fed announced a change in its inflation targeting policy, moving from a program of absolute targeting to an average inflation targeting policy. Under this regime, the Fed will tolerate the inflation rate temporarily overshooting the target rate to offset periods of below-target inflation, so that inflation averages a 2% target rate over time. Fed officials remained cautious, acknowledging the economy’s significant improvement from the COVID-19 recession but also expressing concerns about near-term weakness, and left monetary policy unchanged over the remainder of their meetings in 2020 and early 2021.
The federal government also intervened with historic relief measures, starting with three aid packages in March and April 2020. These included $2 trillion allocated across direct payments to Americans, an expansion of unemployment insurance, loans to large and small businesses, funding to hospitals and health agencies and support to state and local governments, and more than $100 billion in funding to health agencies and employers offering paid leave. In December 2020, the government enacted a $900 billion relief package extending some of these programs, and followed in March 2021 with another $1.9 trillion deal providing support to individuals and families, small businesses, state and local governments, education and public health/vaccination.
The COVID-19 crisis rapidly dwarfed all other market concerns starting in late February 2020. Equity and commodity markets sold off and safe-haven assets rallied in March 2020 as countries initiated quarantines, restricted travel and shuttered factories and businesses. The potential economic shock was particularly difficult to assess at the time, which amplified market volatility. An ill-timed oil price war between the Organization of the Petroleum Exporting Countries (OPEC) and non-OPEC member Russia, which caused oil prices to plunge in March 2020, exacerbated the market sell-off. At year end, the announcement of high efficacy rates in several COVID-19 vaccine trials, followed by regulatory authorizations and public vaccination drives across Western countries, improved the outlook for 2021 and led to risk-on sentiment in the markets. Market volatility picked up in early 2021, however, as a stronger economic outlook and improving vaccination rates led to rising inflation concerns and an increase in long-term interest rates.
Geopolitical uncertainty remained elevated during 2020 in anticipation of the U.S. presidential election in November 2020 and the Brexit transition period set to expire in December 2020. However, political risks began to ease with the election of President Joe Biden and a final deal struck between the European Union and U.K. before the end of the transition period. Although China and the U.S. signed a “phase one” trade deal in January 2020, tensions continued to flare over other trade and technology/security issues, Hong Kong’s sovereignty and the management of the COVID-19 crisis.
Despite the severe sell-off in March 2020 and an abrupt increase in interest rates toward the end of the reporting period, the broad municipal bond market managed positive performance in the twelve-month reporting period overall. For most of the reporting period, a significant decline in interest rates drove municipal bond prices higher, with positive technical and fundamental conditions also supporting credit spread tightening. This contrasted sharply with the beginning of the reporting period when coronavirus risks drove U.S. Treasury yields to historic lows and rate volatility increased sharply during a six-week period from late February to the end of March 2020. As liquidity became stressed, investors began to liquidate any asset possible, including municipal bonds. Municipal bond prices declined rapidly (and yields spiked higher), amid rampant selling across both the high grade and high yield segments that was exacerbated in some cases by exchange-traded fund and closed-end fund selling. Municipal bond prices became severely
6
dislocated from Treasury prices. Credit spreads widened significantly during the March 2020 sell-off, ending the month above their long-term average. Ongoing monetary and fiscal interventions from the Fed and U.S. government helped the market stabilize, then recover over the course of 2020.
The municipal yield curve steepened over this reporting period, initially driven by a pronounced drop in yields at the short end of the curve. Then a new steepening cycle began in early 2021 as markets priced in a stronger economic recovery and higher inflation, fueled by increasing vaccination rates and more federal stimulus, which drove longer-term interest rates higher.
Municipal bond gross issuance nationwide remained strong in the reporting period, with deals postponed rather than canceled during the COVID-driven sell-off. The overall low level of interest rates has encouraged issuers to continue to actively refund their outstanding debt. In these transactions the issuers are issuing new bonds and taking the bond proceeds and redeeming (calling) old bonds. These refunding transactions have ranged from 30% to 60% of total issuance over the past few years. Thus, the net issuance (all bonds issued less bonds redeemed) is actually much lower than the gross issuance. This lower net issuance was an overall positive technical factor on municipal bond investment performance in recent years. Notably, taxable municipal bond issuance has increased meaningfully since the advent of the Tax Cut and Jobs Act of 2017, which prohibits municipal issuers from issuing new tax-exempt bonds to pre-refund existing tax-exempt bonds. However, municipalities have taken advantage of the low interest rate environment and the strong demand for yield to issue taxable municipal debt, enabling them to save on net interest costs while adding to the scarcity value of tax-exempt issues.
While municipal bond funds suffered significant outflows in March 2020, particularly from high yield municipal bond funds, fund flows rebounded strongly over the remainder of 2020 and sustained a robust pace through early 2021. Demand has been resilient even though municipal defaults, as expected, have increased somewhat during the COVID-19 crisis. Notably, default activity has occurred mainly in sectors with greater COVID-19 risk exposure, such as senior living, corporate-backed and real estate-backed. Moreover, while there are some pockets of municipal credit ratings stress, a wave of downgrades has not materialized. With interest rates in the U.S. and globally still near all-time lows, even after the recent increase in long-term rates, the appetite for yield has continued to drive investors toward higher after-tax yielding assets, including U.S. municipal bonds. Additionally, as tax payers have adjusted to the 2017 tax law, which caps the state and local tax (SALT) deduction for individuals, there has been increased demand for tax-exempt municipal bonds, especially in states with high income taxes and/or property taxes.
How were the economic and market environments in Arizona, New Jersey, Ohio and Pennsylvania during the twelve-month reporting period ended February 28, 2021?
Arizona’s economy has held up better than the nation as its shutdowns were relatively shorter and less strict. Employment fell at the start of the COVID-19 crisis but has since recorded consecutive month gains. Given Arizona’s service-based economy, leisure/hospitality jobs have been most affected by COVID-19 crisis related shutdowns. Arizona’s favorable business environment and ample workforce continues to lure new businesses into the state. Gains in the housing market were supported by low interest rates and increased demand. According to the S&P CoreLogic Case-Shiller Index, housing prices in Phoenix rose 15.8% over the twelve months ended January 2021 (most recent data available at the time this report was prepared), compared with an 11.2% price increase nationally. In the job market, prior to the economic fallout from COVID-19, Arizona’s unemployment rate was a low 4.2% in February 2020, then peaked at 13.1% in April 2020 and now sits at 6.9% as of February 2021 versus 6.2% for the nation. On March 28, 2020, Governor Ducey enacted the state’s $11.8 billion general fund Fiscal Year 2021 budget, down 2.7% over the previously enacted budget. The budget includes money to respond to COVID-19 crisis, additional money for K-12 education, including a teacher salary increase, and increased funding for public safety and drought contingency plans without raising taxes. Governor Ducey presented his Fiscal Year 2022 Budget in January totaling $12.6 billion, up 9.2% over revised Fiscal Year 2021 budget. The state projects a $351 million budget surplus as revenues have performed better than expected. Under the American Rescue Plan, the state is expected to receive $7.48 billion: $4 billion for the state and $3.48 billion for local governments. Due to the COVID-19
7
Portfolio Managers’ Comments (continued)
crisis, the state’s budget will be impacted to a varying degree as tax receipts are reduced and the expense to fight the virus increases. For the state of Arizona, its Biennial Fiscal Year end is June 30, 2021. Moody’s upgraded the state’s issuer credit rating (ICR) on November 19, 2019, from Aa2 to Aa1, citing “the state’s continued economic growth, the rebuilding of its reserves and the reduction to its already low debt burden.” As of May 2020, S&P and Moody’s rated Arizona’s ICR at AA and Aa1, respectively, with a stable outlook.
Ohio has a population of 11.7 million, making it the seventh-largest U.S. state by population. The state has a large, diverse economy that is the seventh largest among the states. After above-average job losses and GDP contraction in the first few months of the COVID-19 crisis, Ohio’s initial economic recovery has been strong and compares favorably to the nation’s recovery. From February 2020 to April 2020, Ohio lost 16% of its total non-farm jobs, compared to 14.7% for the U.S. However, the state’s unemployment rate was 5.0% in February 2021, compared to 6.2% for the nation, although some of this may reflect declining labor force participation. According to the S&P CoreLogic Case-Shiller Index, housing prices in Cleveland rose 11.7% over the twelve months ended January 2021 (most recent data available at the time this report was prepared), which outpaced the national average of 11.2%. Ohio’s real median household income in 2019 stood at $64,663, which places it 33rd in the U.S., according to the Census Bureau. Ohio operates on a biennial budget cycle. To balance the state budget in Fiscal Year 2020, due to anticipated declines in revenue and increased costs related to the state’s response to the COVID-19 crisis, Governor DeWine directed spending cuts of $775 million for the remainder of the Fiscal Year (June 30, 2020) and reduced spending by $390 million across all agencies for Fiscal Year 2021. Ohio was directly allocated a minimum of $2.49 billion of the total $4.53 billion granted by the federal government under the CARES Act in March 2020 to the state and its eligible local governments. The federal government also allocated approximately $5.6 billion directly to the state under the American Rescue Plan Act of 2021 out of a total $11.2 billion granted to the state and its eligible local governments. According to the latest revenue figures, Ohio’s tax revenues are $1.3 billion (8.3%) above last year through February 2021. On a year-over-year basis, February total General Revenue Fund disbursements were $289.2 million (-12.0%) lower than those of the same month in the previous Fiscal Year, with a decrease in Medicaid largely responsible for the difference. The governor’s proposed Fiscal Year 2022-2023 budget is structurally balanced and based on conservative economic forecasts that assume slower economic recovery than the nation. The state’s conservative fiscal management has resulted in a strong financial position, with sound liquidity and reserve levels, heading into the COVID-19 crisis. Ohio prioritized the rebuilding of its budget stabilization fund after the Great Recession. The current budget stabilization fund balance of $2.7 billion is 8.0% of general fund revenues and, to date, there has been no draw on these rainy day funds. Ohio has maintained a moderate debt burden relative to other states. The state’s net tax-supported debt totaled $13.3 billion in 2020, which is 2.3% of state personal income, compared to the Moody’s 50-state median of 2.0%. For the state of Ohio, its Biennial Fiscal Year end is June 30, 2021. As of March 2021, Moody’s and S&P rated Ohio GO debt at Aa1 and AA+, respectively, with stable outlooks.
New Jersey’s economy is slowly recovering from the COVID-19 crisis. Several characteristics that historically positioned the state to do quite well, such as its proximity to New York City’s extensive job market, a shoreline along the Atlantic coast that benefits from a strong tourism industry and two large transportation hubs in the Port of New York and New Jersey and Newark airport, exposed the state to the epicenter of the virus outbreak. New Jersey lost 341,700 jobs in 2020, led by declines in leisure and hospitality as well as education and health services sectors. After steep losses at the beginning of the COVID-19 crisis, from April to December 2020, the state regained 49% of jobs lost. This is lower than the 55.5% of jobs regained nationally. New Jersey’s unemployment rate peaked at 16.6% in April 2020 and has declined to 7.8% as of February 2021, well above the national rate of 6.2%. New Jersey continues to be challenged by a structural budget gap and low reserves. For Fiscal Year 2021, the state implemented a “millionaire’s tax,” cut expenses and issued $4.3 billion in bonds to finance the expected budget deficit. Revenue has declined less than originally projected, allowing Governor Murphy to propose funding 100% of the actuarially recommended pension contribution in the Fiscal Year 2022 budget, one year earlier than expected. The governor’s budget proposal does not raise taxes but spends down $4 billion in reserves. The budget that is ultimately enacted by the legislature could vary from this proposal, particularly since the state will be receiving federal stimulus funds from the American Rescue Plan that were not accounted for in the governor’s spending plan. For the state of New Jersey, its Fiscal Year end is June 30, 2021. The state carries a BBB+ rating and stable outlook by S&P and A- rating
8
and negative outlook by Fitch. On April 9, 2021 (subsequent to the close of the reporting period), Moody’s affirmed its rating on New Jersey’s general obligation debt at A3 but changed the outlook to stable from negative.
Pennsylvania has the sixth-largest economy among U.S. states, based on a 2019 real total GDP of $726.2 billion. The Commonwealth is home to 12.8 million residents, making it the fifth-largest state by population. Severe job losses associated with the fallout of the COVID-19 crisis caused employment in Pennsylvania to contract by 7.3% on a year-over-year basis, as of February 2021. The nation’s employment contracted by 6.2% over the same period. Pennsylvania’s economy is large and diverse, but it has lagged the U.S. for the better part of a decade in terms of job, GDP and income growth. Pennsylvania’s Independent Fiscal Office projects that it will take six years for the Commonwealth’s labor market to return to its pre-COVID-19 crisis level. Pennsylvania came into the current economic recession with a weaker financial position than most states. This is most evident in the state’s very slim budget reserve, which covers just 0.3 days of expenses. Through February 2021, General Fund collections totaled $23.9 billion, which is $901.3 million, or 3.9%, above estimate. Pennsylvania received $4.7 billion in federal aid under the CARES Act in 2020, with $2.2 billion of the funds allocated to eligible local governments. An estimated $7.3 billion of federal relief funding is expected to come to the Pennsylvania state government from the American Rescue Plan Act of 2021. Governor Wolf’s Fiscal Year 2022 proposed budget totals $37.8 billion and is a $3.8 billion (11.1%) increase over the prior year. The budget includes a $1.35 billion increase in K-12 spending as well as $3 billion over a ten-year period to workers and businesses to recover from the COVID-19 crisis. Funding for this spending increase comes from a proposal to raise income taxes from 3.07% to 4.49% on higher-income earners, legalizing and taxing marijuana, and a severance tax on the natural gas industry. The Commonwealth has an above-average debt burden relative to other states. Its net tax-supported debt totaled $19.4 billion in 2019, which is 2.6% of state personal income, compared to the Moody’s 50-state median of 2.0%. Pennsylvania’s adjusted net pension liability totaling $79 billion is also above average, ranking it the fifth highest among the states. For the state of Pennsylvania, its Fiscal Year end is June 30, 2021. As of March 2021, Pennsylvania’s general obligation (GO) debt was rated Aa3 by Moody’s and A+ by S&P.
What key strategies were used to manage these Funds during the twelve-month reporting period ended February 28, 2021?
The Nuveen Arizona Quality Municipal Income Fund’s primary investment objective is current income exempt from both regular federal income taxes and Arizona individual income taxes; its secondary investment objective is the enhancement of portfolio value. The Fund invests in municipal securities that are exempt from federal and Arizona state income taxes. The Fund invests at least 80% of its managed assets in securities rated, at the time of investment, investment grade or, if they are unrated, are judged by the manager to be of comparable quality. The Fund may invest up to 20% of its managed assets in municipal securities rated below investment quality or judged by the manager to be of comparable quality, of which up to 10% of its managed assets may be rated below B-/B3 or of comparable quality. The Fund uses leverage.
The Nuveen Ohio Quality Municipal Income Fund’s primary investment objective is current income exempt from both regular federal income taxes and Ohio personal income taxes. The secondary objective is the enhancement of portfolio value. The Fund invests in municipal securities that are exempt from federal, Ohio state, and local income taxes. The Fund invests at least 80% of its managed assets in securities rated, at the time of investment, investment grade or, if they are unrated, are judged by the manager to be of comparable quality. The Fund may invest up to 20% of its managed assets in municipal securities rated below investment quality or judged by the manager to be of comparable quality, of which up to 10% of its managed assets may be rated below B-/B3 or of comparable quality. The Fund uses leverage.
The Nuveen New Jersey Quality Municipal Income Fund’s investment objective is to provide current income exempt from regular federal and New Jersey income tax and to enhance portfolio value. The Fund invests in municipal securities that are exempt from federal and New Jersey state income taxes. The Fund invests at least 80% of its managed assets in securities rated, at the time of investment, investment grade or, if they are unrated, are judged by the portfolio manager to be of comparable quality. The Fund may invest up to 20% of its managed assets in municipal securities rated below investment quality or judged by the portfolio
9
Portfolio Managers’ Comments (continued)
manager to be of comparable quality, of which up to 10% of its managed assets may be rated below B-/B3 or of comparable quality. The Fund uses leverage.
The Nuveen Pennsylvania Quality Municipal Income Fund’s primary investment objective is current income exempt from regular federal income taxes and Pennsylvania income taxes. The secondary objective is the enhancement of portfolio value. The Fund invests in municipal securities that are exempt from federal, Pennsylvania state, and local income taxes. The Fund invests at least 80% of its managed assets in securities rated, at the time of investment, investment grade or, if they are unrated, are judged by the portfolio manager to be of comparable quality. The Fund may invest up to 20% of its managed assets in municipal securities rated below investment quality or judged by the portfolio manager to be of comparable quality, of which up to 10% of its managed assets may be rated below B-/B3 or of comparable quality. The Fund uses leverage.
The twelve-month reporting period was bookended by challenging conditions in the municipal bond market, with the advent of the COVID-19 crisis at the beginning of the reporting period and a sudden increase in long-term interest rates at the end of the reporting period. The health and economic crisis and the anticipated recovery from the COVID-19 crisis recession contributed to elevated interest rate volatility and considerable swings in municipal market valuations during this reporting period. Despite these fluctuations, municipal yields ended the reporting period slightly higher than where they began and credit spreads largely recovered from the dramatic widening seen at the peak of the market sell-off in March-April 2020. The municipal yield curve steepened over the reporting period as a whole, with the market pricing in the prospects for a strengthening economic recovery aided by massive fiscal stimulus, accommodative monetary policy and vaccination progress. The Arizona municipal market performed nearly in line with the national market and the New Jersey, Ohio and Pennsylvania municipal markets outperformed the national market during the reporting period, as measured by their respective state S&P Municipal Bond Indexes.
The Funds’ trading activity continued to focus on pursuing its investment objectives. The Funds‘ continued to seek bonds in areas of the market that demonstrated resilience and would perform well over the long term. Additionally, as closed ends funds do not need to manage cash to meet investor redemptions, the Funds weren’t forced to sell positions during periods of market turbulence.
NAZ’s positioning remained relatively stable as the Fund remained fully invested and continued to maintain its duration target. Early in the reporting period, the March-April 2020 market sell-off provided ample opportunities for tax loss swapping. This strategy entails selling depreciated bonds with lower yields and buying similarly structured but higher yielding bonds. This approach was implemented to enhance the Fund’s income earning capability and seek to make the Fund more tax efficient. We would also note that many of the positions we swapped during that timeframe were among the best performing holdings by the end of the reporting period. Outside of these one-for-one bond exchanges, the Fund added bonds issued for dedicated tax, a children’s hospital and other health care names, primarily in maturities of 20 years and longer to help maintain the Fund’s duration target. The Fund sold maturities less than 18 months to fund our buying in longer-dated credits, as well as used the proceeds of called and maturing bonds.
NUO also stayed fully invested, using bond calls and maturities to make new purchases. The Ohio Fund was also active with tax loss swaps earlier in the reporting period, as well as added attractively valued bonds whose revenues are generated from public gathering/social activities. In the second half of the reporting period, the Fund bought three local GOs, two water and sewer, one health care and one state GO. These purchases were a mix of 4% and 5% coupon structures trading at a premium, in the intermediate to long maturity range and with mid to high grade credit quality.
For NXJ and NQP, trading activity was somewhat lighter during this reporting period as the Funds were well positioned for the environment and the prevailing environment offered fewer opportunities to replace positions with more attractive names. Portfolio turnover was mainly driven by the proceeds from called and maturing bonds, bond coupon income and a small amount of strategic and tactical sales. For NXJ and NQP, the Funds took some small precautionary steps early in the reporting period to prepare for the possibility of deleveraging, including delaying the reinvestment of cash proceeds from called bonds and coupon income. However, market liquidity, although stressed, remains sufficient and deleveraging was not needed.
10
The state of New Jersey was an active issuer during this reporting period, with three deals coming to market in November 2020, December 2020 and January 2021 for COVID-19 GO Emergency Bonds, New Jersey Transportation Trust Fund Authority and New Jersey Economic Development Authority. NXJ participated in all three new issues, which were well received by the marketplace. Additionally, the New Jersey Fund added issues for Barnabas Health, Atlantic City Electric, New Jersey Housing and Mortgage Finance Agency, New Jersey-American Water Company, New Jersey State Turnpike Authority and a number of county and local municipalities (including Mercer, Monmouth, Somerset and Union counties and Berkeley Heights Township and Cherry Hill Township).
NQP added issues for Pennsylvania Housing Finance Agency, Geisinger Health System, Westmoreland County Water, Puerto Rico sales tax revenue bonds (known as COFINAs), Saint Joseph’s University, St. Luke’s Hospital Bethlehem, Philadelphia Gas Works and Delaware River Port Authority. We continued to limit NXJ’s and NQP’s exposure to each state’s government debt due to concerns about their fiscal health that pre-dated the COVID-19 crisis.
Also during this reporting period, NUO and NQP acquired shares in Energy Harbor when their holdings of certain municipal bonds issued by FirstEnergy Solutions were converted into Energy Harbor equity as part of FirstEnergy Solution’s emergence from bankruptcy protection. Over time, the Fund expects to sell these shares and reinvest the proceeds into municipal bonds.
As of February 28, 2021, the four Funds continued to use inverse floating rate securities. The Funds employ inverse floaters for a variety of reasons, including duration management, income enhancement and total return enhancement. As part of the Funds’ duration management strategies, NXJ and NQP used U.S. Treasury futures as part of an overall portfolio construction strategy to manage portfolio duration and yield curve exposure. The hedging strategies performed as expected given the direction of interest rates during the reporting period, the Treasury futures had a neutral impact to NXJ and NQP (which removed the positions in August 2020) and they enabled the Funds to invest in longer duration bonds that were contributors to performance and that helped support the Funds’ dividends. The Treasury futures positions were eliminated from NXJ and NQP prior to the end of the reporting period.
How did the Funds perform for the twelve-month reporting period ended February 28, 2021?
The tables in the Performance Overview and Holding Summaries section of this report provides total returns at net asset value (NAV) for the period ended February 28, 2021. Each Fund’s total returns at net asset value (NAV) are compared with the performance of corresponding market indexes.
For the twelve months ended February 28, 2021, the total returns on common share NAV for the four Funds underperformed their respective state’s S&P Municipal Bond Index.
The factors driving performance during this reporting period included yield curve and duration positioning, credit ratings exposure and sector allocation. The use of regulatory leverage was also a factor affecting the Funds’ performance. Leverage is discussed in more detail later in the Fund Leverage section of this report.
We continued to position the Funds with longer duration profiles than their respective state’s S&P Municipal Bond Index. NAZ’s large overweight to durations in the 6- to 8-year range detracted from performance, but the relative loss was more than offset by a slight overweight to durations of 8 years and longer, which outperformed. NUO’s duration and yield curve positioning was a modest detractor overall. Although NUO’s underweight to bonds with 4- to 6-year durations added to relative performance, it was outweighed by the negative impact of the overweight to the 2- to 4-year duration category. The longer duration positioning was a positive relative contributor to NXJ and had a neutral impact on NQP relative to their respective state indexes, but the steepening yield curve partially offset the advantage of the two Funds’ longer duration.
Credit quality and sector positioning produced mixed results for relative performance. The Funds continued to emphasize lower rated, higher yielding bonds and sectors, which generally performed better than high grade, low yielding bonds and sectors. For NAZ, overweight allocations to BB and A rated credits were favorable, but the negative impact of an overweight to BBB rated debt
11
Portfolio Managers’ Comments (continued)
and an underweight to AA rated paper outweighed the relative gains. NUO’s credit ratings allocations were the main detractor from its relative performance. The Ohio Fund’s overweight to the AA rated segment was the largest drag, negating the relative advantage of holding strong performing B rated credits. NXJ’s credit ratings and sector allocations detracted from performance relative to the New Jersey index. The Fund holds less exposure than the state index to state appropriation debt, much of which is BBB rated, and the resulting underweight to both the sector and BBB rated credit cost NXJ in terms of relative performance. Credit quality and sector positioning for NQP was unfavorable relative to the Pennsylvania index, as lower rated bonds severely underperformed during the COVID-19 crisis sell-off and only partially recovered over the remainder of the reporting period.
On a sector basis, NAZ’s positioning added to relative performance. While an overweight to longer duration dedicated tax bonds and an underweight to the industrial development revenue (IDR) sector were negative for performance, an underweight in life care and an overweight to gas prepay bonds were positive contributors that more than compensated for the sector weakness elsewhere. NUO’s sector allocations were an overall negative influence on performance, largely due to overweights to the dedicated tax and public power sectors, both of which underperformed in this reporting period. For New Jersey, the better performing sectors included transportation, housing, tobacco and other revenue, and NXJ held underweights in each of these sectors except housing. But New Jersey saw the most weakness in the education sector (where NXJ was overweighted), while the tax-supported (slight overweight), health care (overweight) and pre-refunded sectors (neutral weight) trailed only marginally. Pennsylvania’s municipal market was led by the tax supported, transportation and utility sectors (and NQP was overweighted utility and underweight in tax supported and transportation), whereas the biggest laggards were the health care, IDR and housing sectors (and NQP held overweights in each sector).
Individual security selection contributed positively to NUO’s relative performance. The Fund’s selection in tender option bonds and longer-dated credits that were held through the full reporting period, especially those bonds that recovered from the crisis sell-off by the end of the period, were the most beneficial to performance.
Security selection in NXJ added value relative to the New Jersey index. The Fund had more favorable yield curve/duration positioning in its state debt selections, including GOs, New Jersey Transportation Trust Fund Authority and New Jersey Economic Development Authority. However, some of the relative gain was offset by our selection in housing and education bonds. Holdings in housing bonds underperformed as the low interest rate environment accelerated mortgage refinancing activity, shortening the expected average life of the bonds. NXJ’s education holdings included a number of smaller, lower rated private schools (such as Rider University, Stevens Institute of Technology and Seton Hall), student residence halls project and student loan debt, which hadn’t rebounded to the same extent as higher rated education credits.
Mixed performance from NQP’s security selection resulted in an overall neutral impact to relative performance versus the state index. The Fund’s selection was most beneficial in utilities, transportation (Pittsburgh and Allegheny County Sports and Exhibition Authority Parking Revenue Bonds and Pennsylvania Turnpike Commission), IDR (American Water Works, Amtrak and Pennsylvania Economic Development Financing Authority KDC Agribusiness Fairless Hills) and health care (especially in life care bonds). In utilities, a position in Energy Harbor stock was the leading performer as the stock price recovered from negative headline risk earlier in the reporting period. The Fund owns Energy Harbor common stock after certain bonds held by the Fund were converted to equity as part of the company’s exit from bankruptcy in February 2020. However, selection in housing (particularly Pennsylvania Housing Finance Agency Revenue Bonds) and tax supported debt (especially state GOs) was disadvantageous.
12
IMPACT OF THE FUNDS’ LEVERAGE STRATEGIES ON PERFORMANCE
One important factor impacting the returns of the Funds’ common shares relative to their comparative benchmarks was the Funds’ use of leverage through their issuance of preferred shares and/or investments in inverse floating rate securities, which represent leveraged investments in underlying bonds. The Funds use leverage because our research has shown that, over time, leveraging provides opportunities for additional income. The opportunity arises when short-term rates that a Fund pays on its leveraging instruments are lower than the interest the Fund earns on its portfolio of long-term bonds that it has bought with the proceeds of that leverage. This has been particularly true in the recent market environment where short-term rates have been low by historical standards.
However, use of leverage can expose Fund common shares to additional price volatility. When a Fund uses leverage, the Fund’s common shares will experience a greater increase in their net asset value if the municipal bonds acquired through the use of leverage increase in value, but will also experience a correspondingly larger decline in their net asset value if the bonds acquired through leverage decline in value. All this will make the shares’ total return performance more variable over time.
In addition, common share income in levered funds will typically decrease in comparison to unlevered funds when short-term interest rates increase and increase when short-term interest rates decrease. In recent quarters, fund leverage expenses have generally tracked the overall movement of short-term tax-exempt interest rates. While fund leverage expenses are somewhat higher than their recent lows, leverage nevertheless continues to provide the opportunity for incremental common share income, particularly over longer-term periods.
Leverage from issuance of preferred shares had a negative impact on the total return performance of the Funds over the reporting period. The use of leverage through inverse floating rate securities was negligible to the total return performance of the Funds over the reporting period.
As of February 28, 2021, the Funds’ percentages of leverage are as shown in the accompanying table. | | | |
| NAZ | NUO | NXJ | NQP |
Effective Leverage* | 37.53% | 35.16% | 38.02% | 38.42% |
Regulatory Leverage* | 33.61% | 31.75% | 31.52% | 27.07% |
* | Effective Leverage is a Fund’s effective economic leverage, and includes both regulatory leverage and the leverage effects of certain derivative and other investments in a Fund’s portfolio that increase the Fund’s investment exposure. Currently, the leverage effects of Tender Option Bond (TOB) inverse floater holdings are included in effective leverage values, in addition to any regu- latory leverage. Regulatory leverage consists of preferred shares issued or borrowings of a Fund. Both of these are part of a Fund’s capital structure. A Fund, however, may from time to time borrow on a typically transient basis in connection with its day-to-day operations, primarily in connection with the need to settle portfolio trades. Such incidental borrowings are excluded from the calculation of a Fund’s effective leverage ratio. Regulatory leverage is subject to asset coverage limits set forth in the Investment Company Act of 1940. |
THE FUNDS’ REGULATORY LEVERAGE
As of February 28, 2021, the following Funds have issued and outstanding preferred shares as shown in the accompanying table.
| Variable Rate | | Variable Rate | |
| Preferred* | | Remarketed Preferred** | |
| Shares Issued at | | Shares Issued at | |
| Liquidation Preference | | Liquidation Preference | Total |
NAZ | $ 88,300,000 | | $ — | $ 88,300,000 |
NUO | $148,000,000 | | $ — | $148,000,000 |
NXJ | $313,900,000 | | $ — | $313,900,000 |
NQP | $217,500,000 | | $ — | $217,500,000 |
* | Preferred shares of the Fund featuring a floating rate dividend based on a predetermined formula or spread to an index rate. Includes the following preferred shares AMTP, iMTP, MFP-VRM and VRDP in Special Rate Mode, where applicable. See Notes to Financial Statements, Note 5 – Fund Shares, Preferred Shares for further details. |
** | Preferred shares of the Fund featuring floating rate dividends set by a remarketing agent via a regular remarketing. Includes the following preferred shares VRDP not in Special Rate Mode, MFP- VRRM and MFP-VRDM, where applicable. See Notes to Financial Statements, Note 5 – Fund Shares, Preferred Shares for further details. |
Refer to Notes to Financial Statements, Note – 5 Fund Shares, for further details on preferred shares and each Fund’s respective transactions.
13
COMMON SHARE DISTRIBUTION INFORMATION
The following information regarding the Funds’ distributions is current as of February 28, 2021. Each Fund’s distribution levels may vary over time based on each Fund’s investment activity and portfolio investment value changes.
During the current reporting period, each Fund’s distributions to common shareholders were as shown in the accompanying table.
| Per Common Share Amounts
|
| Monthly Distributions (Ex-Dividend Date) | NAZ | NUO | NXJ | NQP |
March 2020 | $0.0438 | $0.0440 | $0.0515 | $0.0505 |
April | 0.0438 | 0.0440 | 0.0515 | 0.0505 |
May | 0.0438 | 0.0440 | 0.0515 | 0.0505 |
June | 0.0475 | 0.0440 | 0.0555 | 0.0535 |
July | 0.0475 | 0.0440 | 0.0555 | 0.0535 |
August | 0.0475 | 0.0440 | 0.0555 | 0.0535 |
September | 0.0475 | 0.0440 | 0.0555 | 0.0535 |
October | 0.0500 | 0.0490 | 0.0585 | 0.0560 |
November | 0.0500 | 0.0490 | 0.0585 | 0.0560 |
December | 0.0500 | 0.0490 | 0.0585 | 0.0560 |
January | 0.0500 | 0.0490 | 0.0585 | 0.0560 |
February 2021 | 0.0500 | 0.0490 | 0.0585 | 0.0560 |
| Total Distributions from Net Investment Income | $0.5714 | $0.5530 | $0.6690 | $0.6455 |
| Total Distributions from Long-Term Capital Gains* | $ — | $0.0291 | $ — | $ — |
| Total Distributions | $0.5714 | $0.5821 | $0.6690 | $0.6455 |
| |
| Yields | | | | |
Market Yield** | 3.96% | 3.88% | 4.98% | 4.75% |
Taxable-Equivalent Yield** | 7.23% | 7.09% | 10.27% | 8.44% |
* | Distribution paid in December 2020. |
** | Market Yield is based on the Fund’s current annualized monthly distribution divided by the Fund’s current market price as of the end of the reporting period. Taxable-Equivalent Yield represents the yield that must be earned on a fully taxable investment in order to equal the yield of the Fund on an after-tax basis. It is based on a combined federal and state income tax rate of 45.3%, 45.6%, 51.6% and 43.9% for NAZ, NUO, NXJ and NQP, respectively. Your actual combined federal and state income tax rate may differ from the assumed rate. The Taxable-Equivalent Yield also takes into account the percentage of the Fund’s income generated and paid by the Fund (based on payments made during the previous calendar year) that was either exempt from federal income tax but not from state income tax (e.g., income from an out-of-state municipal bond), or was exempt from neither federal nor state income tax. Separately, if the comparison were instead to invest- ments that generate qualified dividend income, which is taxable at a rate lower than an individual’s ordinary graduated tax rate, the fund’s Taxable-Equivalent Yield would be lower. |
Each Fund seeks to pay regular monthly dividends out of its net investment income at a rate that reflects its past and projected net income performance. To permit each Fund to maintain a more stable monthly dividend, the Fund may pay dividends at a rate that may be more or less than the amount of net income actually earned by the Fund during the period. Distributions to common shareholders are determined on a tax basis, which may differ from amounts recorded in the accounting records. In instances where the monthly dividend exceeds the earned net investment income, the Fund would report a negative undistributed net ordinary income. Refer to Note 6 – Income Tax Information for additional information regarding the amounts of undistributed net ordinary income and undistributed net long-term capital gains and the character of the actual distributions paid by the Fund during the period.
14
All monthly dividends paid by each Fund during the current reporting period were paid from net investment income. If a portion of the Fund’s monthly distributions is sourced or comprised of elements other than net investment income, including capital gains and/or a return of capital, shareholders will be notified of those sources. For financial reporting purposes, the per share amounts of each Fund’s distributions for the reporting period are presented in this report’s Financial Highlights. For income tax purposes, distribution information for each Fund as of its most recent tax year end is presented in Note 6 – Income Tax Information within the Notes to Financial Statements of this report.
NUVEEN CLOSED-END FUND DISTRIBUTION AMOUNTS
The Nuveen Closed-End Funds’ monthly and quarterly periodic distributions to shareholders are posted on www.nuveen.com and can be found on Nuveen’s enhanced closed-end fund resource page, which is at https://www.nuveen.com/resource-center-closed-endfunds, along with other Nuveen closed-end fund product updates. To ensure timely access to the latest information, shareholders may use a subscribe function, which can be activated at this web page (https://www.nuveen.com/subscriptions).
COMMON SHARE REPURCHASES
During August 2020, the Funds’ Board of Trustees reauthorized an open-market share repurchase program, allowing each Fund to repurchase an aggregate of up to approximately 10% of its outstanding shares.
As of February 28, 2021, and since the inception of the Funds’ repurchase programs, the Funds have cumulatively repurchased and retired their outstanding common shares as shown in the accompanying table.
| NAZ | NUO | NXJ | NQP |
Common shares cumulatively repurchased and retired | 127,500 | 205,000 | 1,710,343 | 734,900 |
Common shares authorized for repurchase | 1,155,000 | 1,830,000 | 4,145,000 | 3,735,000 |
During the current reporting period, the following Funds repurchased and retired their common shares at a weighted average price per share and a weighted average discount per share as shown in the following table.
| NXJ |
Common shares repurchased and retired | 25,343
|
Weighted average price per common share repurchased and retired | $13.36
|
Weighted average discount per common share repurchased and retired | 16.96% |
OTHER COMMON SHARE INFORMATION
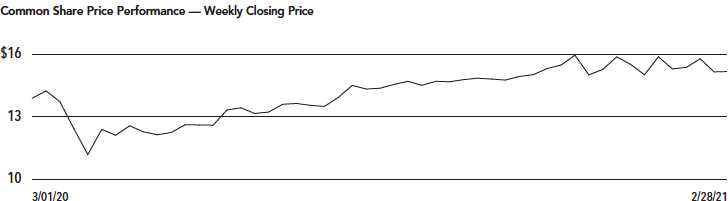
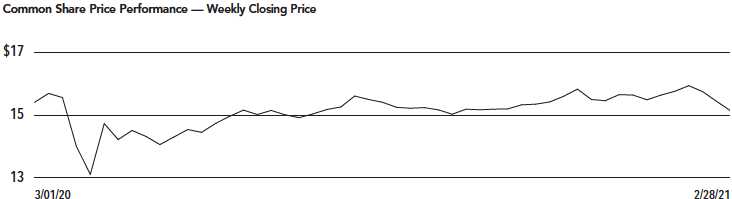
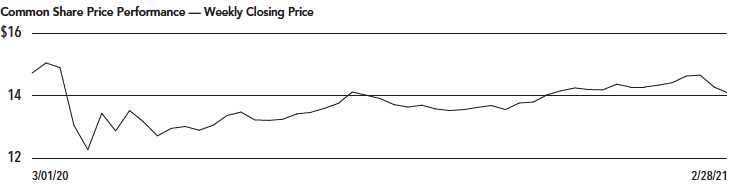
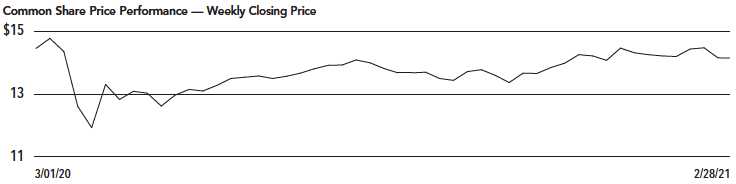
As of February 28, 2021, and during the current reporting period, the Funds’ common share prices were trading at a premium/ (discount) to their common share NAVs as shown in the accompanying table.
| NAZ | NUO | NXJ | NQP |
Common share NAV | $15.07
| $17.37
| $16.44
| $15.68
|
Common share price | $15.17
| $15.14
| $14.09
| $14.15
|
Premium/(Discount) to NAV | 0.66% | (12.84)% | (14.29)% | (9.76)% |
12-month average premium/(discount) to NAV | (5.56)% | (13.31)% | (15.37)% | (12.41)% |
15
| Nuveen Arizona Quality Municipal Income Fund Performance Overview and Holding Summaries as of February 28, 2021 |
Refer to the Glossary of Terms Used in this Report for further definition of the terms used within this section. | | |
| Average Annual Total Returns as of February 28, 2021 | | | |
| Average Annual |
| 1-Year | 5-Year | 10-Year |
NAZ at Common Share NAV | 0.62% | 4.26% | 6.19% |
NAZ at Common Share Price | 13.67% | 3.64% | 7.26% |
S&P Municipal Bond Arizona Index | 1.26% | 3.14% | 4.40% |
S&P Municipal Bond Index | 1.22% | 3.41% | 4.51% |
Past performance is not predictive of future results. Current performance may be higher or lower than the data shown. Returns do not reflect the deduction of taxes that shareholders may have to pay on Fund distributions or upon the sale of Fund shares. Returns at NAV are net of Fund expenses, and assume reinvestment of distributions. Comparative index return information is provided for the Fund’s shares at NAV only. Indexes are not available for direct investment.
16
This data relates to the securities held in the Fund’s portfolio of investments as of the end of the reporting period. It should not be construed as a measure of performance for the Fund itself. Holdings are subject to change.
For financial reporting purposes, the ratings disclosed are the highest rating given by one of the following national rating agencies: Standard & Poor’s Group, Moody’s Investors Service, Inc. or Fitch, Inc. This treatment of split-rated securities may differ from that used for other purposes, such as for Fund investment policies. Credit ratings are subject to change. AAA, AA, A and BBB are investment grade ratings; BB, B, CCC, CC, C and D are below-investment grade ratings. Holdings designated N/R are not rated by these national rating agencies.
| Fund Allocation | |
| (% of net assets) | |
Long-Term Municipal Bonds | 155.3% |
Other Assets Less Liabilities | 0.9% |
| Net Assets Plus Floating Rate | |
| Obligations & AMTP Shares, | |
| net of deferred offering costs | 156.2% |
Floating Rate Obligations | (5.6)% |
AMTP Shares, net of deferred | |
offering costs | (50.6)% |
| Net Assets | 100% |
| States and Territories | |
| (% of total municipal bonds) | |
Arizona | 95.1% |
Guam | 2.9% |
Puerto Rico | 1.9% |
Virgin Islands | 0.1% |
| Total | 100% |
| Portfolio Composition | |
| (% of total investments) | |
Tax Obligation/Limited | 25.6% |
Education and Civic Organizations | 22.6% |
Utilities | 16.1% |
Health Care | 14.3% |
Tax Obligation/General | 10.5% |
Transportation | 5.3% |
Other | 5.6% |
| Total | 100% |
| Portfolio Credit Quality | |
| (% of total investment exposure) | |
U.S. Guaranteed | 2.1% |
AAA | 4.6% |
AA | 51.3% |
A | 24.5% |
BBB | 3.1% |
BB or Lower | 6.0% |
N/R (not rated) | 8.4% |
| Total | 100% |
17
NUO
| Nuveen Ohio Quality Municipal Income Fund |
| Performance Overview and Holding Summaries as of February 28, 2021 |
Refer to the Glossary of Terms Used in this Report for further definition of the terms used within this section. | | |
| Average Annual Total Returns as of February 28, 2021 | | | |
| Average Annual |
| 1-Year | 5-Year | 10-Year |
NUO at Common Share NAV | 0.78% | 4.15% | 6.05% |
NUO at Common Share Price | 2.07% | 3.97% | 5.42% |
S&P Municipal Bond Ohio Index | 2.81% | 4.13% | 5.34% |
S&P Municipal Bond Index | 1.22% | 3.41% | 4.51% |
Past performance is not predictive of future results. Current performance may be higher or lower than the data shown. Returns do not reflect the deduction of taxes that shareholders may have to pay on Fund distributions or upon the sale of Fund shares. Returns at NAV are net of Fund expenses, and assume reinvestment of distributions. Comparative index return information is provided for the Fund’s shares at NAV only. Indexes are not available for direct investment.
18
This data relates to the securities held in the Fund’s portfolio of investments as of the end of the reporting period. It should not be construed as a measure of performance for the Fund itself. Holdings are subject to change.
For financial reporting purposes, the ratings disclosed are the highest rating given by one of the following national rating agencies: Standard & Poor’s Group, Moody’s Investors Service, Inc. or Fitch, Inc. This treatment of split-rated securities may differ from that used for other purposes, such as for Fund investment policies. Credit ratings are subject to change. AAA, AA, A and BBB are investment grade ratings; BB, B, CCC, CC, C and D are below-investment grade ratings. Holdings designated N/R are not rated by these national rating agencies.
| Fund Allocation | |
| (% of net assets) | |
Long-Term Municipal Bonds | 151.5% |
Common Stocks | 0.6% |
Other Assets Less Liabilities | 0.7% |
| Net Assets Plus Floating Rate | |
| Obligations & VRDP Shares, | |
| net of deferred offering costs | 152.8% |
Floating Rate Obligations | (6.3)% |
VRDP Shares, net of deferred | |
offering costs | (46.5)% |
| Net Assets | 100% |
| States and Territories | |
| (% of total municipal bonds) | |
Ohio | 90.2% |
Puerto Rico | 2.7% |
Texas | 1.6% |
Michigan | 1.4% |
Colorado | 1.1% |
North Carolina | 1.1% |
Florida | 0.8% |
Missouri | 0.5% |
Kentucky | 0.3% |
Oregon | 0.2% |
Washington | 0.1% |
| Total | 100% |
| Portfolio Composition | |
| (% of total investments) | |
U.S. Guaranteed | 27.4% |
Tax Obligation/Limited | 15.7% |
Tax Obligation/General | 12.3% |
Transportation | 11.3% |
Utilities | 10.4% |
Health Care | 9.6% |
Education and Civic Organizations | 7.8% |
Other | 5.5% |
| Total | 100% |
| Portfolio Credit Quality | |
| (% of total investment exposure) | |
U.S. Guaranteed | 22.4% |
AAA | 15.3% |
AA | 37.5% |
A | 13.4% |
BBB | 1.3% |
BB or Lower | 3.5% |
N/R (not rated) | 6.2% |
N/A (not applicable) | 0.4% |
| Total | 100% |
19
| NXJ | Nuveen New Jersey Quality Municipal Income Fund Performance Overview and Holding Summaries as of February 28, 2021 |
Refer to Glossary of Terms Used in this Report for further definition of the terms used within this section. | | |
| Average Annual Total Returns as of February 28, 2021 | | | |
| Average Annual |
| 1-Year | 5-Year | 10-Year |
NXJ at Common Share NAV | 0.08% | 5.31% | 6.91% |
NXJ at Common Share Price | 0.42% | 5.47% | 6.82% |
S&P Municipal Bond New Jersey Index | 1.31% | 4.38% | 5.11% |
S&P Municipal Bond Index | 1.22% | 3.41% | 4.51% |
Past performance is not predictive of future results. Current performance may be higher or lower than the data shown. Returns do not reflect the deduction of taxes that shareholders may have to pay on Fund distributions or upon the sale of Fund shares. Returns at NAV are net of Fund expenses, and assume reinvestment of distributions. Comparative index return information is provided for the Fund’s shares at NAV only. Indexes are not available for direct investment.
20
This data relates to the securities held in the Fund’s portfolio of investments as of the end of the reporting period. It should not be construed as a measure of performance for the Fund itself. Holdings are subject to change.
For financial reporting purposes, the ratings disclosed are the highest rating given by one of the following national rating agencies: Standard & Poor’s Group, Moody’s Investors Service, Inc. or Fitch, Inc. This treatment of split-rated securities may differ from that used for other purposes, such as for Fund investment policies. Credit ratings are subject to change. AAA, AA, A and BBB are investment grade ratings; BB, B, CCC, CC, C and D are below-investment grade ratings. Holdings designated N/R are not rated by these national rating agencies.
| Fund Allocation | |
| (% of net assets) | |
Long-Term Municipal Bonds | 149.6% |
Short-Term Municipal Bonds | 0.0% |
Other Assets Less Liabilities | 1.3% |
| Net Assets Plus Floating Rate | |
| Obligations & VRDP Shares, | |
| net of deferred offering costs | 150.9% |
Floating Rate Obligations | (5.1)% |
VRDP Shares, net of deferred offering costs | (45.8)% |
| Net Assets | 100% |
| States and Territories | |
| (% of total municipal bonds) | |
New Jersey | 90.4% |
New York | 3.4% |
Pennsylvania | 3.2% |
Delaware | 2.1% |
Guam | 0.9% |
| Total | 100% |
| Portfolio Composition | |
| (% of total investments) | |
Tax Obligation/Limited | 24.7% |
Transportation | 15.2% |
Health Care | 14.0% |
Education and Civic Organizations | 11.5% |
U.S. Guaranteed | 8.3% |
Tax Obligation/General | 7.9% |
Housing/Single Family | 5.9% |
Other | 12.5% |
| Total | 100% |
| Portfolio Credit Quality | |
| (% of total investment exposure) | |
U.S. Guaranteed | 10.1% |
AAA | 9.5% |
AA | 32.5% |
A | 17.8% |
BBB | 22.7% |
BB or Lower | 5.4% |
N/R (not rated) | 2.0% |
| Total | 100% |
21
| NQP | Nuveen Pennsylvania Quality Municipal Income Fund Performance Overview and Holding Summaries as of February 28, 2021 |
Refer to Glossary of Terms Used in this Report for further definition of the terms used within this section. | | |
| Average Annual Total Returns as of February 28, 2021 | | | |
| | Average Annual | |
| 1-Year | 5-Year | 10-Year |
NQP at Common Share NAV | (0.29)% | 4.27% | 6.37% |
NQP at Common Share Price | 2.56% | 4.92% | 6.70% |
S&P Municipal Bond Pennsylvania Index | 1.37% | 3.66% | 4.69% |
S&P Municipal Bond Index | 1.22% | 3.41% | 4.51% |
Past performance is not predictive of future results. Current performance may be higher or lower than the data shown. Returns do not reflect the deduction of taxes that shareholders may have to pay on Fund distributions or upon the sale of Fund shares. Returns at NAV are net of Fund expenses, and assume reinvestment of distributions. Comparative index return information is provided for the Fund’s shares at NAV only. Indexes are not available for direct investment.
22
This data relates to the securities held in the Fund’s portfolio of investments as of the end of the reporting period. It should not be construed as a measure of performance for the Fund itself. Holdings are subject to change.
For financial reporting purposes, the ratings disclosed are the highest rating given by one of the following national rating agencies: Standard & Poor’s Group, Moody’s Investors Service, Inc. or Fitch, Inc. This treatment of split-rated securities may differ from that used for other purposes, such as for Fund investment policies. Credit ratings are subject to change. AAA, AA, A and BBB are investment grade ratings; BB, B, CCC, CC, C and D are below-investment grade ratings. Holdings designated N/R are not rated by these national rating agencies.
| Fund Allocation | |
| (% of net assets) | |
Long-Term Municipal Bonds | 156.2% |
Common Stocks | 2.9% |
Short-Term Municipal Bonds | 0.2% |
Other Assets Less Liabilities | 0.0% |
| Net Assets Plus Floating Rate | |
| Obligations & VRDP Shares, | |
| net of deferred offering costs | 159.3% |
Floating Rate Obligations | (22.3)% |
VRDP Shares, net of deferred offering costs | (37.0)% |
| Net Assets | 100% |
| States and Territories | |
| (% of total municipal bonds) | |
Pennsylvania | 97.1% |
Puerto Rico | 1.7% |
New Jersey | 0.9% |
Guam | 0.3% |
| Total | 100% |
| Portfolio Composition | |
| (% of total investments) | |
Health Care | 22.2% |
U.S. Guaranteed | 14.4% |
Tax Obligation/General | 11.9% |
Utilities | 9.5% |
Housing/Single Family | 10.9% |
Education and Civic Organizations | 10.2% |
Transportation | 6.7% |
Tax Obligation/Limited | 6.2% |
Other | 8.0% |
| Total | 100% |
| Portfolio Credit Quality | |
| (% of total investment exposure) | |
U.S. Guaranteed | 15.9% |
AAA | 0.4% |
AA | 35.2% |
A | 27.7% |
BBB | 8.4% |
BB or Lower | 6.5% |
N/R (not rated) | 4.1% |
N/A (not applicable) | 1.8% |
| Total | 100% |
23
Shareholder Meeting Report
The annual meeting of shareholders was held on November 16, 2020 for NAZ, NUO, NXJ and NQP. The meeting was held virtually due to public health concerns regarding the ongoing COVID-19 pandemic; at this meeting the shareholders were asked to elect Board members.
| NAZ | NUO | NXJ | NQP |
| Common and | | Common and | | Common and | | Common and | |
| Preferred | | Preferred | | Preferred | | Preferred | |
| shares voting | | shares voting | | shares voting | | shares voting | |
| together | Preferred | together | Preferred | together | Preferred | together | Preferred |
| as a class | Shares* | as a class | Shares* | as a class | Shares | as a class | Shares* |
| Election of Board Members: | | | | | | | | |
John K. Nelson | | | | | | | | |
| For | 8,560,659 | — | 10,828,257 | — | 28,162,851 | — | 24,055,135 | — |
| Withhold | 1,381,174 | — | 5,913,280 | — | 8,145,272 | — | 7,983,822 | — |
| Total | 9,941,833 | — | 16,741,537 | — | 36,308,123 | — | 32,038,957 | — |
Terence J. Toth | | | | | | | | |
| For | 8,560,659 | — | 10,823,211 | — | 28,152,806 | — | 23,997,361 | — |
| Withhold | 1,381,174 | — | 5,918,326 | — | 8,155,317 | — | 8,041,596 | — |
| Total | 9,941,833 | — | 16,741,537 | — | 36,308,123 | — | 32,038,957 | — |
Robert L. Young | | | | | | | | |
| For | 8,560,659 | — | 10,828,383 | — | 28,161,190 | — | 24,052,981 | — |
| Withhold | 1,381,174 | — | 5,913,154 | — | 8,146,933 | — | 7,985,976 | — |
| Total | 9,941,833 | — | 16,741,537 | — | 36,308,123 | — | 32,038,957 | — |
William C. Hunter | | | | | | | | |
| For | — | — | — | — | — | 810 | — | — |
| Withhold | — | 883 | — | 1,480 | — | 2,329 | — | 2,175 |
| Total | — | 883 | — | 1,480 | — | 3,139 | — | 2,175 |
Albin F. Moschner | | | | | | | | |
| For | — | — | — | — | — | 810 | — | — |
| Withhold | — | 883 | — | 1,480 | — | 2,329 | — | 2,175 |
| Total | — | 883 | — | 1,480 | — | 3,139 | — | 2,175 |
* Each Board Member will continue to serve on the Board as a “holdover” Board Member until his successor has been duly elected and qualified.
24
Report of Independent Registered Public Accounting Firm
To the Shareholders and Board of Trustees
Nuveen Arizona Quality Municipal Income Fund
Nuveen Ohio Quality Municipal Income Fund
Nuveen New Jersey Quality Municipal Income Fund
Nuveen Pennsylvania Quality Municipal Income Fund:
Opinion on the Financial Statements
We have audited the accompanying statements of assets and liabilities of Nuveen Arizona Quality Municipal Income Fund, Nuveen Ohio Quality Municipal Income Fund, Nuveen New Jersey Quality Municipal Income Fund, and Nuveen Pennsylvania Quality Municipal Income Fund (the Funds), including the portfolios of investments, as of February 28, 2021, the related statements of operations and cash flows for the year then ended, the statements of changes in net assets for each of the years in the two-year period then ended, and the related notes (collectively, the financial statements) and the financial highlights for each of the years in the five-year period then ended for Nuveen Arizona Quality Municipal Income Fund and Nuveen Ohio Quality Municipal Income Fund, and the financial highlights for each of the years in the four-year period then ended, the ten-month period from May 1, 2016 through February 28, 2017, and the year ended April 30, 2016 for Nuveen New Jersey Quality Municipal Income Fund and Nuveen Pennsylvania Quality Municipal Income Fund. In our opinion, the financial statements and financial highlights present fairly, in all material respects, the financial position of the Funds as of February 28, 2021, the results of their operations and their cash flows for the year then ended, the changes in their net assets for each of the years in the two-year period then ended, and the financial highlights for each of the years in the five-year period then ended for Nuveen Arizona Quality Municipal Income Fund and Nuveen Ohio Quality Municipal Income Fund, and the financial highlights for each of the years in the four-year period then ended, the ten-month period from May 1, 2016 through February 28, 2017, and the year ended April 30, 2016 for Nuveen New Jersey Quality Municipal Income Fund and Nuveen Pennsylvania Quality Municipal Income Fund in conformity with U.S. generally accepted accounting principles.
Basis for Opinion
These financial statements and financial highlights are the responsibility of the Funds’ management. Our responsibility is to express an opinion on these financial statements and financial highlights based on our audits. We are a public accounting firm registered with the Public Company Accounting Oversight Board (United States) (PCAOB) and are required to be independent with respect to the Funds in accordance with the U.S. federal securities laws and the applicable rules and regulations of the Securities and Exchange Commission and the PCAOB.
We conducted our audits in accordance with the standards of the PCAOB. Those standards require that we plan and perform the audit to obtain reasonable assurance about whether the financial statements and financial highlights are free of material misstatement, whether due to error or fraud. Our audits included performing procedures to assess the risks of material misstatement of the financial statements and financial highlights, whether due to error or fraud, and performing procedures that respond to those risks. Such procedures included examining, on a test basis, evidence regarding the amounts and disclosures in the financial statements and financial highlights. Such procedures also included confirmation of securities owned as of February 28, 2021, by correspondence with custodians and brokers or other appropriate auditing procedures. Our audits also included evaluating the accounting principles used and significant estimates made by management, as well as evaluating the overall presentation of the financial statements and financial highlights. We believe that our audits provide a reasonable basis for our opinion.
/s/ KPMG LLP
We have served as the auditor of one or more Nuveen investment companies since 2014.
Chicago, Illinois
April 27, 2021
25
| Nuveen Arizona Quality Municipal Income Fund Portfolio of Investments February 28, 2021 |
| Principal | | | Optional Call | | |
| Amount (000) | | Description (1) | Provisions (2) | Ratings (3) | Value |
| | LONG-TERM INVESTMENTS – 155.3% (100.0% of Total Investments) | | | |
|
| | MUNICIPAL BONDS – 155.3% (100.0% of Total Investments) | | | |
|
| | Education and Civic Organizations – 35.1% (22.6% of Total Investments) | | | |
| $ 2,175 | | Arizona Board of Regents, Arizona State University System Revenue Bonds, Green Series | 7/26 at 100.00 | AA | $ 2,527,046 |
| | 2016B, 5.000%, 7/01/47 | | | |
| 1,500 | | Arizona Board of Regents, Arizona State University System Revenue Bonds, Refunding Green | 7/25 at 100.00 | AA | 1,710,615 |
| | Series 2015A, 5.000%, 7/01/41 | | | |
| 1,500 | | Arizona Board of Regents, Arizona State University System Revenue Bonds, Series 2015D, | 7/25 at 100.00 | AA | 1,710,615 |
| | 5.000%, 7/01/41 | | | |
| 1,255 | | Arizona Board of Regents, Arizona State University System Revenue Bonds, Series 2020B, | 7/30 at 100.00 | AA | 1,460,544 |
| | 4.000%, 7/01/47 | | | |
| 2,515 | | Arizona Board of Regents, University of Arizona, SPEED Revenue Bonds, Stimulus Plan for | 8/24 at 100.00 | Aa3 | 2,773,039 |
| | Economic and Educational Development, Series 2014, 5.000%, 8/01/44 | | | |
| 2,240 | | Arizona Board of Regents, University of Arizona, System Revenue Bonds, Tender Option | 6/22 at 100.00 | Aa2 | 2,760,038 |
| | Bond Trust 2015-XF0053, 17.818%, 6/01/42, 144A (IF) | | | |
| 515 | | Arizona Industrial Development Authority, Arizona, Education Facility Revenue Bonds, | 7/26 at 100.00 | BB | 575,785 |
| | Basis Schools, Inc Projects, Series 2017A, 5.125%, 7/01/37, 144A | | | |
| 525 | | Arizona Industrial Development Authority, Arizona, Education Facility Revenue Bonds, | 7/27 at 100.00 | AA– | 600,028 |
| | Basis Schools, Inc Projects, Series 2017C, 5.000%, 7/01/47 | | | |
| 250 | | Arizona Industrial Development Authority, Arizona, Education Facility Revenue Bonds, | 7/27 at 100.00 | BB | 278,015 |
| | Basis Schools, Inc Projects, Series 2017D, 5.000%, 7/01/47, 144A | | | |
| | Arizona Industrial Development Authority, Arizona, Education Facility Revenue Bonds, | | | |
| | Basis Schools, Inc Projects, Series 2017F: | | | |
| 1,700 | | 5.000%, 7/01/37 | 7/27 at 100.00 | AA– | 1,983,509 |
| 1,645 | | 5.000%, 7/01/47 | 7/27 at 100.00 | AA– | 1,880,087 |
| 380 | | Arizona Industrial Development Authority, Arizona, Education Facility Revenue Bonds, | 7/27 at 100.00 | BB | 422,583 |
| | Basis Schools, Inc Projects, Series 2017G, 5.000%, 7/01/47, 144A | | | |
| 240 | | Arizona Industrial Development Authority, Arizona, Education Facility Revenue Bonds, | 11/27 at 100.00 | N/R | 249,636 |
| | Montessori Academy Projects, Refunding Series 2017A, 6.250%, 11/01/50, 144A | | | |
| 375 | | Arizona Industrial Development Authority, Arizona, Education Revenue Bonds, Arizona | 9/27 at 100.00 | BB+ | 412,928 |
| | Agribusiness and Equine Center, Inc Project, Series 2017B, 5.000%, 3/01/48, 144A | | | |
| 310 | | Arizona Industrial Development Authority, Arizona, Education Revenue Bonds, Academies of | No Opt. Call | BB | 331,461 |
| | Math & Science Projects, Series 2017B, 4.250%, 7/01/27, 144A | | | |
| | Arizona Industrial Development Authority, Arizona, Education Revenue Bonds, Academies of | | | |
| | Math & Science Projects, Series 2018A: | | | |
| 615 | | 5.000%, 7/01/38 | 1/28 at 100.00 | AA– | 723,800 |
| 1,000 | | 5.000%, 7/01/48 | 1/28 at 100.00 | AA– | 1,154,790 |
| 455 | | Arizona Industrial Development Authority, Arizona, Education Revenue Bonds, Pinecrest | 7/26 at 100.00 | BB+ | 522,445 |
| | Academy of Nevada ? Horizon, Inspirada and St Rose Campus Projects, Series 2018A, 5.750%, | | | |
| | 7/15/38, 144A | | | |
| 1,000 | | Arizona Industrial Development Authority, Arizona, Education Revenue Bonds, Pinecrest | 9/23 at 105.00 | BB+ | 1,128,140 |
| | Academy of Nevada ? Sloan Canyon Campus Project, Series 2020A-2, 6.000%, 9/15/38, 144A | | | |
| 180 | | Arizona Industrial Development Authority, Arizona, Education Revenue Bonds, Social Bonds | 7/28 at 100.00 | BB– | 184,478 |
| | Pensar Academy Project, Series 2020, 4.000%, 7/01/30, 144A | | | |
| | Arizona Industrial Development Authority, Arizona, Lease Revenue Bonds, University of | | | |
| | Indianapolis – Health Pavilion Project, Series 2019A: | | | |
| 1,645 | | 4.000%, 10/01/39 | 10/29 at 100.00 | BBB+ | 1,785,500 |
| 1,000 | | 4.000%, 10/01/49 | 10/29 at 100.00 | BBB+ | 1,066,810 |
| 1,500 | | Arizona Industrial Development Authority, Education Facility Revenue Bonds, Caurus | 6/28 at 100.00 | N/R | 1,687,950 |
| | Academy Project, Series 2018A, 6.375%, 6/01/39, 144A | | | |
| 2,000 | | Glendale Industrial Development Authority, Arizona, Revenue Bonds, Midwestern | 5/22 at 100.00 | A+ | 2,078,600 |
| | University, Refunding Series 2007, 5.000%, 5/15/31 | | | |
26
| | | | | | |
| Principal | | | Optional Call | | |
| Amount (000) | | Description (1) | Provisions (2) | Ratings (3) | Value |
| | Education and Civic Organizations (continued) | | | |
| | Industrial Development Authority, Pima County, Arizona, Education Revenue Bonds, Center | | | |
| | for Academic Success Project, Refunding Series 2019: | | | |
| $ 360 | | 4.000%, 7/01/31 | 7/29 at 100.00 | BBB | $ 404,622 |
| 340 | | 4.000%, 7/01/33 | 7/29 at 100.00 | BBB | 377,879 |
| 355 | | Maricopa County Industrial Development Authority, Arizona, Education Revenue Bonds, | 7/27 at 100.00 | AA– | 419,965 |
| | Great Hearts Academies Projects, Series 2017A, 5.000%, 7/01/37 | | | |
| 490 | | Maricopa County Industrial Development Authority, Arizona, Education Revenue Bonds, | 7/27 at 100.00 | AA– | 568,493 |
| | Great Hearts Academies Projects, Series 2017C, 5.000%, 7/01/48 | | | |
| 1,495 | | Maricopa County Industrial Development Authority, Arizona, Education Revenue Bonds, | 1/30 at 100.00 | AA– | 1,813,614 |
| | Highland Prep Project, Series 2019, 5.000%, 1/01/43 | | | |
| 665 | | Maricopa County Industrial Development Authority, Arizona, Education Revenue Bonds, | 7/29 at 100.00 | AA– | 785,850 |
| | Legacy Traditional Schools Projects, Series 2019A, 5.000%, 7/01/49 | | | |
| 870 | | Maricopa County Industrial Development Authority, Arizona, Education Revenue Bonds, | 7/26 at 100.00 | BB+ | 944,359 |
| | Paradise Schools Projects, Series 2016, 5.000%, 7/01/47, 144A | | | |
| | Maricopa County Industrial Development Authority, Arizona, Education Revenue Bonds, Reid | | | |
| | Traditional School Projects, Series 2016: | | | |
| 520 | | 5.000%, 7/01/36 | 7/26 at 100.00 | Baa3 | 579,561 |
| 300 | | 5.000%, 7/01/47 | 7/26 at 100.00 | Baa3 | 327,933 |
| 2,500 | | Maricopa County Industrial Development Authority, Arizona, Educational Facilities | 1/30 at 100.00 | A2 | 3,060,925 |
| | Revenue Bonds, Creighton University Projects, Series 2020, 5.000%, 7/01/47 | | | |
| 2,095 | | McAllister Academic Village LLC, Arizona, Revenue Bonds, Arizona State University | 7/26 at 100.00 | AA– | 2,439,334 |
| | Hassayampa Academic Village Project, Refunding Series 2016, 5.000%, 7/01/37 | | | |
| 1,155 | | Northern Arizona University, System Revenue Bonds, Refunding Series 2014, 5.000%, 6/01/40 | 6/24 at 100.00 | A+ | 1,265,984 |
| 70 | | Phoenix Industrial Development Authority, Arizona, Education Facility Revenue Bonds, | 7/25 at 100.00 | BB | 75,555 |
| | Basis Schools, Inc Projects, Series 2016A, 5.000%, 7/01/46, 144A | | | |
| 900 | | Phoenix Industrial Development Authority, Arizona, Education Facility Revenue Bonds, | 9/22 at 100.00 | BB | 927,252 |
| | Choice Academies Charter Schools Project, Series 2012, 5.625%, 9/01/42 | | | |
| 1,400 | | Phoenix Industrial Development Authority, Arizona, Education Facility Revenue Bonds, | 7/22 at 100.00 | BB+ | 1,431,402 |
| | Eagle College Prep Project, Series 2013A, 5.000%, 7/01/43 | | | |
| 800 | | Phoenix Industrial Development Authority, Arizona, Education Facility Revenue Bonds, | 7/25 at 100.00 | BBB– | 876,816 |
| | Great Hearts Academies Project, Series 2016A, 5.000%, 7/01/41 | | | |
| 500 | | Phoenix Industrial Development Authority, Arizona, Education Facility Revenue Bonds, | 7/24 at 100.00 | BB+ | 576,400 |
| | Legacy Traditional Schools Project, Series 2014A, 6.750%, 7/01/44, 144A | | | |
| | Phoenix Industrial Development Authority, Arizona, Education Facility Revenue Bonds, | | | |
| | Legacy Traditional Schools Projects, Series 2015: | | | |
| 315 | | 5.000%, 7/01/35, 144A | 7/25 at 100.00 | BB+ | 339,731 |
| 300 | | 5.000%, 7/01/45, 144A | 7/25 at 100.00 | BB+ | 318,666 |
| 650 | | Phoenix Industrial Development Authority, Arizona, Education Facility Revenue Bonds, | 7/26 at 100.00 | BB+ | 710,580 |
| | Legacy Traditional Schools Projects, Series 2016A, 5.000%, 7/01/41, 144A | | | |
| 610 | | Phoenix Industrial Development Authority, Arizona, Education Facility Revenue Bonds, | 9/30 at 100.00 | Ba2 | 658,306 |
| | Northwest Christian School Project, Series 2020A, 5.000%, 9/01/45, 144A | | | |
| | Phoenix Industrial Development Authority, Arizona, Education Facility Revenue Bonds, | | | |
| | Villa Montessori, Inc Projects, Series 2015: | | | |
| 260 | | 3.250%, 7/01/25 | No Opt. Call | BBB– | 269,136 |
| 400 | | 5.000%, 7/01/35 | 7/25 at 100.00 | BBB– | 438,736 |
| 500 | | Phoenix Industrial Development Authority, Arizona, Education Facility Revenue Bonds, | 7/28 at 100.00 | AA– | 557,425 |
| | Vista College Preparatory Project, Series 2018A, 4.125%, 7/01/38 | | | |
| 1,995 | | Phoenix Industrial Development Authority, Arizona, Lease Revenue Bonds, Eastern Kentucky | 10/26 at 100.00 | A3 | 2,295,666 |
| | University Project, Series 2016, 5.000%, 10/01/36 | | | |
| 3,675 | | Phoenix Industrial Development Authority, Arizona, Lease Revenue Bonds, Rowan University | 6/22 at 100.00 | A | 3,803,148 |
| | Project, Series 2012, 5.000%, 6/01/42 (UB) (4) | | | |
| 500 | | Pima County Community College District, Arizona, Revenue Bonds, Series 2019, 5.000%, 7/01/36 | 7/28 at 100.00 | Aa3 | 612,905 |
27
| NAZ | Nuveen Arizona Quality Municipal Income Fund Portfolio of Investments (continued) February 28, 2021 |
| | | | | | |
| Principal | | | Optional Call | | |
| Amount (000) | | Description (1) | Provisions (2) | Ratings (3) | Value |
| | Education and Civic Organizations (continued) | | | |
| $ 200 | | Pima County Industrial Development Authority, Arizona, Charter School Revenue Bonds, | 5/24 at 100.00 | N/R | $ 218,686 |
| | Desert Heights Charter School, Series 2014, 7.250%, 5/01/44 | | | |
| | Pima County Industrial Development Authority, Arizona, Education Facility Revenue Bonds, | | | |
| | Champion Schools Project, Series 2017: | | | |
| 120 | | 6.000%, 6/15/37, 144A | 6/26 at 100.00 | N/R | 112,298 |
| 680 | | 6.125%, 6/15/47, 144A | 6/26 at 100.00 | N/R | 620,194 |
| 200 | | Pima County Industrial Development Authority, Arizona, Education Facility Revenue Bonds, | 7/26 at 100.00 | BB– | 211,588 |
| | Edkey Charter Schools Project, Series 2016, 5.250%, 7/01/36 | | | |
| 35 | | Pima County Industrial Development Authority, Arizona, Education Facility Revenue Bonds, | 2/24 at 100.00 | N/R | 36,763 |
| | San Tan Montessori School Project, Series 2016, 6.500%, 2/01/48, 144A | | | |
| 115 | | Pima County Industrial Development Authority, Arizona, Education Facility Revenue Bonds, | 2/28 at 100.00 | N/R | 129,134 |
| | San Tan Montessori School Project, Series 2017, 6.750%, 2/01/50, 144A | | | |
| 745 | | Pima County Industrial Development Authority, Arizona, Education Revenue Bonds, Carden | 1/22 at 100.00 | B– | 746,363 |
| | Traditional Schools Project, Series 2012, 7.500%, 1/01/42 | | | |
| 500 | | Pima County Industrial Development Authority, Arizona, Education Revenue Bonds, Noah | 6/25 at 100.00 | BB | 537,415 |
| | Webster Schools ? Mesa Project, Series 2015A, 5.000%, 12/15/34, 144A | | | |
| 730 | | Pinal County Community College District, Arizona, Revenue Bonds, Central Arizona | 7/26 at 100.00 | AA | 870,489 |
| | College, Series 2017, 5.000%, 7/01/35 – BAM Insured | | | |
| 780 | | Student and Academic Services LLC, Arizona, Lease Revenue Bonds, Northern Arizona | 6/24 at 100.00 | AA | 875,230 |
| | University Project, Series 2014, 5.000%, 6/01/39 – BAM Insured | | | |
| 54,645 | | Total Education and Civic Organizations | | | 61,246,845 |
| | Health Care – 22.3% (14.3% of Total Investments) | | | |
| 1,200 | | Arizona Health Facilities Authority, Hospital Revenue Bonds, Banner Health Systems, | 1/24 at 100.00 | AA– | 1,327,980 |
| | Series 2014A, 5.000%, 1/01/44 | | | |
| 5,100 | | Arizona Health Facilities Authority, Hospital System Revenue Bonds, Phoenix Children’s | 2/22 at 100.00 | A1 | 5,254,836 |
| | Hospital, Refunding Series 2012A, 5.000%, 2/01/42 | | | |
| | Arizona Health Facilities Authority, Revenue Bonds, Scottsdale Lincoln Hospitals | | | |
| | Project, Refunding Series 2014A: | | | |
| 3,005 | | 5.000%, 12/01/39 | 12/24 at 100.00 | A+ | 3,393,276 |
| 2,860 | | 5.000%, 12/01/42 | 12/24 at 100.00 | A+ | 3,216,184 |
| | Arizona Industrial Development Authority, Arizona, Lease Revenue Bonds, Children’s | | | |
| | National Prince County Regional Medical Center, Series 2020A: | | | |
| 430 | | 4.000%, 9/01/40 | 9/30 at 100.00 | A1 | 497,936 |
| 100 | | 3.000%, 9/01/50 | 9/30 at 100.00 | A1 | 102,540 |
| | Arizona Industrial Development Authority, Hospital Revenue Bonds, Phoenix Children’s | | | |
| | Hospital, Series 2020A: | | | |
| 1,400 | | 5.000%, 2/01/40 | 2/30 at 100.00 | A1 | 1,763,524 |
| 1,950 | | 4.000%, 2/01/50 | 2/30 at 100.00 | A1 | 2,177,155 |
| 1,250 | | Maricopa County Industrial Development Authority, Arizona, Hospital Revenue Bonds, | 9/28 at 100.00 | A+ | 1,546,863 |
| | HonorHealth, Series 2019A, 5.000%, 9/01/37 | | | |
| | Maricopa County Industrial Development Authority, Arizona, Revenue Bonds, Banner Health, | | | |
| | Refunding Series 2016A: | | | |
| 1,250 | | 5.000%, 1/01/32 | 1/27 at 100.00 | AA– | 1,514,500 |
| 1,000 | | 5.000%, 1/01/35 | 1/27 at 100.00 | AA– | 1,200,470 |
| 2,000 | | 5.000%, 1/01/38 | 1/27 at 100.00 | AA– | 2,376,300 |
| | Maricopa County Industrial Development Authority, Arizona, Revenue Bonds, Banner Health, | | | |
| | Series 2017A: | | | |
| 2,700 | | 4.000%, 1/01/41 | 1/28 at 100.00 | AA– | 3,045,870 |
| 2,000 | | 5.000%, 1/01/41 | 1/28 at 100.00 | AA– | 2,404,600 |
| 1,000 | | Maricopa County Industrial Development Authority, Arizona, Revenue Bonds, Banner Health, | 7/29 at 100.00 | AA– | 1,142,950 |
| | Series 2019A, 4.000%, 1/01/44 | | | |
| 1,500 | | Maricopa County Industrial Development Authority, Arizona, Revenue Bonds, Banner Health, | 7/30 at 100.00 | AA– | 1,729,260 |
| | Variable Rate Demand Series 2019F, 4.000%, 1/01/45 | | | |
28
| | | | | | |
| Principal | | | Optional Call | | |
| Amount (000) | | Description (1) | Provisions (2) | Ratings (3) | Value |
| | Health Care (continued) | | | |
| $ 1,025 | | Yavapai County Industrial Development Authority, Arizona, Hospital Revenue Bonds, | 8/26 at 100.00 | A+ | $ 1,186,960 |
| | Yavapai Regional Medical Center, Refunding Series 2016, 5.000%, 8/01/36 | | | |
| 1,000 | | Yavapai County Industrial Development Authority, Arizona, Hospital Revenue Bonds, | 8/23 at 100.00 | A+ | 1,087,960 |
| | Yavapai Regional Medical Center, Series 2013A, 5.250%, 8/01/33 | | | |
| 1,450 | | Yavapai County Industrial Development Authority, Arizona, Hospital Revenue Bonds, | 8/29 at 100.00 | A+ | 1,614,619 |
| | Yavapai Regional Medical Center, Series 2019, 4.000%, 8/01/43 | | | |
| | Yuma Industrial Development Authority, Arizona, Hospital Revenue Bonds, Yuma Regional | | | |
| | Medical Center, Series 2014A: | | | |
| 1,000 | | 5.000%, 8/01/22 | No Opt. Call | A | 1,064,790 |
| 1,000 | | 5.250%, 8/01/32 | 8/24 at 100.00 | A | 1,127,360 |
| 34,220 | | Total Health Care | | | 38,775,933 |
| | Housing/Multifamily – 0.8% (0.5% of Total Investments) | | | |
| 1,250 | | Arizona Industrial Development Authority, Student Housing Revenue Bonds, Provident Group – | 6/29 at 100.00 | AA | 1,358,288 |
| | NCCU Properties LLC- North Carolina Central University, Series 2019A, 4.000%, 6/01/44 – | | | |
| | BAM Insured | | | |
| | Long-Term Care – 3.7% (2.4% of Total Investments) | | | |
| 285 | | Arizona Industrial Development Authority, Multifamily Housing Revenue Bonds, Bridgewater | 7/25 at 101.00 | N/R | 257,312 |
| | Avondale Project, Series 2017, 5.375%, 1/01/38 | | | |
| 2,115 | | Glendale Industrial Development Authority, Arizona, Senior Living Revenue Bonds, Royal | 5/26 at 103.00 | BBB– | 2,356,533 |
| | Oaks Royal Oaks – Inspirata Pointe Project, Series 2020A, 5.000%, 5/15/56 | | | |
| 1,870 | | Phoenix Industrial Development Authority, Arizona, Multi-Family Housing Revenue Bonds, | 10/25 at 101.00 | N/R | 1,905,044 |
| | 3rd and Indian Road Assisted Living Project, Series 2016, 5.400%, 10/01/36 | | | |
| 780 | | Tempe Industrial Development Authority, Arizona, Revenue Bonds, Friendship Village of | 12/21 at 100.00 | N/R | 794,734 |
| | Tempe Project, Refunding Series 2012A, 6.000%, 12/01/32 | | | |
| 1,080 | | Tempe Industrial Development Authority, Arizona, Revenue Bonds, Mirabella at ASU | 10/27 at 100.00 | N/R | 1,150,481 |
| | Project, Series 2017A, 6.125%, 10/01/47, 144A | | | |
| 6,130 | | Total Long-Term Care | | | 6,464,104 |
| | Tax Obligation/General – 16.2% (10.5% of Total Investments) | | | |
| 575 | | Buckeye Union High School District 201, Maricopa County, Arizona, General Obligation | 7/27 at 100.00 | AA | 693,818 |
| | Bonds, School Improvement Project, Refunding Series 2017, 5.000%, 7/01/35 – BAM Insured | | | |
| 2,140 | | El Mirage, Arizona, General Obligation Bonds, Series 2012, 5.000%, 7/01/42 – AGM | 7/22 at 100.00 | AA | 2,255,325 |
| | Insured | | | |
| 1,000 | | Maricopa County Elementary School District 83 Cartwright, Arizona, General Obligation | 7/21 at 100.00 | AA | 1,016,280 |
| | Bonds, School Improvement, Project 2010, Series 2011A, 5.375%, 7/01/30 – AGM Insured | | | |
| 2,315 | | Maricopa County School District 214 Tolleson Union High, Arizona, General Obligation | 7/28 at 100.00 | Aa1 | 2,858,006 |
| | Bonds, School Improvement Project 1990, Series 1990A, 5.000%, 7/01/38 | | | |
| 630 | | Maricopa County School District 214 Tolleson Union High, Arizona, General Obligation | 7/27 at 100.00 | Aa1 | 762,420 |
| | Bonds, School Improvement Project 2017, Series 2018A, 5.000%, 7/01/37 | | | |
| 775 | | Maricopa County School District 79 Litchfield Elementary, Arizona, General Obligation | 7/21 at 100.00 | Aa1 | 787,261 |
| | Bonds, Series 2011, 5.000%, 7/01/23 | | | |
| 1,500 | | Maricopa County Special Health Care District, Arizona, General Obligation Bonds, Series | 7/28 at 100.00 | Aa3 | 1,815,720 |
| | 2018C, 5.000%, 7/01/36 | | | |
| 1,350 | | Maricopa County Unified School District 95 Queen Creek, Arizona, General Obligation | 7/25 at 102.00 | Aa1 | 1,572,115 |
| | Bonds, School Improvement Series 2018, 5.000%, 7/01/36 | | | |
| 1,275 | | Maricopa County Union High School District 210 Phoenix, Arizona, General Obligation | 7/27 at 100.00 | AAA | 1,559,095 |
| | Bonds, School Improvement & Project of 2011 Series 2017E, 5.000%, 7/01/33 | | | |
| | Mohave County Union High School District 2 Colorado River, Arizona, General Obligation | | | |
| | Bonds, School Improvement Series 2017: | | | |
| 1,000 | | 5.000%, 7/01/34 | 7/27 at 100.00 | Aa3 | 1,202,640 |
| 1,000 | | 5.000%, 7/01/36 | 7/27 at 100.00 | Aa3 | 1,193,330 |
| 690 | | Northwest Fire District of Pima County, Arizona, General Obligation Bonds, Series 2017, | 7/27 at 100.00 | AA– | 830,270 |
| | 5.000%, 7/01/36 | | | |
29
| | |
| NAZ | Nuveen Arizona Quality Municipal Income Fund Portfolio of Investments (continued) February 28, 2021 |
| | | | | | |
| Principal | | | Optional Call | | |
| Amount (000) | | Description (1) | Provisions (2) | Ratings (3) | Value |
| | Tax Obligation/General (continued) | | | |
| $ 1,370 | | Pima County Continental Elementary School District 39, Arizona, General Obligation | 7/21 at 100.00 | AA | $ 1,395,030 |
| | Bonds, Series 2011A, 6.000%, 7/01/30 – AGM Insured | | | |
| 2,895 | | Pima County Unified School District 12 Sunnyside, Arizona, General Obligation Bonds, | 7/24 at 100.00 | AA | 3,278,616 |
| | School Improvement Project 2011, Series 2014D, 5.000%, 7/01/34 – AGM Insured | | | |
| 1,750 | | Pima County Unified School District 6 Marana, Arizona, General Obligation Bonds, School | 7/21 at 100.00 | A | 1,776,740 |
| | Improvement Project 2010 Series 2011A, 5.000%, 7/01/25 | | | |
| 1,500 | | Pima County Unified School District 6 Marana, Arizona, General Obligation Bonds, School | 7/27 at 100.00 | AA | 1,804,935 |
| | Improvement Project of 2014, Series 2017C, 5.000%, 7/01/36 – BAM Insured | | | |
| | Pinal County School District 4 Casa Grande Elementary, Arizona, General Obligation | | | |
| | Bonds, School improvement Project 2016, Series 2017A: | | | |
| 620 | | 5.000%, 7/01/34 – BAM Insured | 7/27 at 100.00 | AA | 743,572 |
| 1,000 | | 5.000%, 7/01/35 – BAM Insured | 7/27 at 100.00 | AA | 1,196,640 |
| | Western Maricopa Education Center District 402, Maricopa County, Arizona, General | | | |
| | Obligation Bonds, School Improvement Project 2012, Series2014B: | | | |
| 715 | | 4.500%, 7/01/33 | 7/24 at 100.00 | AA– | 787,623 |
| 665 | | 4.500%, 7/01/34 | 7/24 at 100.00 | AA– | 731,414 |
| 24,765 | | Total Tax Obligation/General | | | 28,260,850 |
| | Tax Obligation/Limited – 39.7% (25.6% of Total Investments) | | | |
| 100 | | Arizona Industrial Development Authority, Arizona, Economic Development Revenue Bonds, | No Opt. Call | N/R | 103,273 |
| | Linder Village Project in Meridian, Ada County, Idaho, Series 2020, 5.000%, 6/01/31, 144A | | | |
| 2,310 | | Arizona Sports and Tourism Authority, Tax Revenue Bonds, Multipurpose Stadium Facility | 7/22 at 100.00 | A1 | 2,398,473 |
| | Project, Refunding Senior Series 2012A, 5.000%, 7/01/36 | | | |
| 1,250 | | Arizona State Transportation Board, Highway Revenue Bonds, Refunding Series 2016, | 7/26 at 100.00 | AA+ | 1,496,987 |
| | 5.000%, 7/01/35 | | | |
| 275 | | Buckeye, Arizona, Excise Tax Revenue Obligations, Refunding Series 2016, 4.000%, 7/01/36 | 7/26 at 100.00 | AA | 304,004 |
| 1,000 | | Buckeye, Arizona, Excise Tax Revenue Obligations, Series 2015, 5.000%, 7/01/37 | 7/25 at 100.00 | AA | 1,166,400 |
| 1,215 | | Cadence Community Facilities District, Mesa, Arizona, Special Assessment Revenue Bonds, | 7/30 at 100.00 | N/R | 1,308,081 |
| | Assessment District 3, Series 2020, 4.000%, 7/01/45 | | | |
| 123 | | Cahava Springs Revitalization District, Cave Creek, Arizona, Special Assessment Bonds, | 7/27 at 100.00 | N/R | 94,597 |
| | Series 2017A, 7.000%, 7/01/41, 144A (5) | | | |
| 1,210 | | Eastmark Community Facilities District 1, Mesa, Arizona, General Obligation Bonds, | 7/25 at 100.00 | N/R | 1,282,721 |
| | Series 2015, 5.000%, 7/15/39, 144A | | | |
| 1,810 | | Eastmark Community Facilities District 1, Mesa, Arizona, General Obligation Bonds, | 7/27 at 100.00 | AA | 2,132,850 |
| | Series 2017, 5.000%, 7/15/42 – AGM Insured | | | |
| 2,445 | | Eastmark Community Facilities District 1, Mesa, Arizona, General Obligation Bonds, | 7/27 at 100.00 | AA | 2,754,121 |
| | Series 2018, 4.375%, 7/15/43 – BAM Insured | | | |
| 484 | | Eastmark Community Facilities District 1, Mesa, Arizona, Special Assessment Revenue | 7/23 at 100.00 | N/R | 495,684 |
| | Bonds, Assessment District 1, Series 2013, 5.250%, 7/01/38 | | | |
| 697 | | Eastmark Community Facilities District 1, Mesa, Arizona, Special Assessment Revenue | 7/27 at 100.00 | N/R | 738,193 |
| | Bonds, Assessment District 1, Series 2019, 5.200%, 7/01/43 | | | |
| 2,280 | | Eastmark Community Facilities District 1, Mesa, Arizona, Special Assessment Revenue | 7/30 at 100.00 | N/R | 2,312,239 |
| | Bonds, Assessment District 12, Series 2021, 3.750%, 7/01/45 | | | |
| 1,035 | | Eastmark Community Facilities District 2, Mesa, Arizona, General Obligation Bonds, | 7/30 at 100.00 | N/R | 994,842 |
| | Series 2020, 3.500%, 7/15/44 | | | |
| 655 | | Estrella Mountain Ranch Community Facilities District, Goodyear, Arizona, General | 7/27 at 100.00 | AA | 773,575 |
| | Obligation Bonds, Refunding Series 2017, 5.000%, 7/15/32 – AGM Insured | | | |
| | Festival Ranch Community Facilities District, Buckeye, Arizona, General Obligation | | | |
| | Bonds, Series 2012: | | | |
| 345 | | 5.000%, 7/15/27 – BAM Insured | 7/22 at 100.00 | AA | 367,594 |
| 1,085 | | 5.000%, 7/15/31 | 7/22 at 100.00 | AA | 1,150,653 |
| 500 | | Festival Ranch Community Facilities District, Buckeye, Arizona, General Obligation | 7/26 at 100.00 | AA | 566,425 |
| | Bonds, Series 2016, 4.000%, 7/15/36 – BAM Insured | | | |
30
| Principal | | | Optional Call | | |
| Amount (000) | | Description (1) | Provisions (2) | Ratings (3) | Value |
| | Tax Obligation/Limited (continued) | | | |
| $ 1,000 | | Festival Ranch Community Facilities District, Buckeye, Arizona, General Obligation | 7/27 at 100.00 | AA | $ 1,213,340 |
| | Bonds, Series 2017, 5.000%, 7/15/37 – BAM Insured | | | |
| 590 | | Festival Ranch Community Facilities District, Buckeye, Arizona, General Obligation | 7/27 at 100.00 | AA | 717,871 |
| | Bonds, Series 2018, 5.000%, 7/15/38 – BAM Insured | | | |
| 1,000 | | Festival Ranch Community Facilities District, Buckeye, Arizona, General Obligation | 7/30 at 100.00 | AA | 1,173,180 |
| | Bonds, Series 2020, 4.000%, 7/15/40 – BAM Insured | | | |
| 381 | | Festival Ranch Community Facilities District, Buckeye, Arizona, Special Assessment | 7/27 at 100.00 | N/R | 395,737 |
| | Revenue Bonds, Assessment District 11, Series 2017, 5.200%, 7/01/37 | | | |
| 600 | | Goodyear Community Facilities Utilities District 1, Arizona, General Obligation Bonds, | 7/26 at 100.00 | A1 | 666,864 |
| | Refunding Series 2016, 4.000%, 7/15/32 | | | |
| 1,170 | | Goodyear, Arizona, Community Facilities General District 1, Arizona, General Obligation | No Opt. Call | A– | 1,231,367 |
| | Refunding Bonds, Series 2013, 5.000%, 7/15/23 | | | |
| 1,500 | | Government of Guam, Business Privilege Tax Bonds, Refunding Series 2015D, 5.000%, | 11/25 at 100.00 | BB | 1,663,005 |
| | 11/15/39 | | | |
| | Government of Guam, Business Privilege Tax Bonds, Series 2011A: | | | |
| 510 | | 5.000%, 1/01/31 | 1/22 at 100.00 | BB | 523,138 |
| 200 | | 5.125%, 1/01/42 | 1/22 at 100.00 | BB | 204,560 |
| 1,500 | | Government of Guam, Business Privilege Tax Bonds, Series 2012B-1, 5.000%, 1/01/37 | 1/22 at 100.00 | BB | 1,534,530 |
| 1,250 | | Guam Government, Limited Obligation Section 30 Revenue Bonds, Series 2016A, | 12/26 at 100.00 | BB | 1,390,388 |
| | 5.000%, 12/01/46 | | | |
| 1,425 | | Marana, Arizona, Pledged Excise Tax Revenue Bonds, Refunding Series 2013, 5.000%, 7/01/33 | 7/23 at 100.00 | AA | 1,567,756 |
| 200 | | Merrill Ranch Community Facilities District 2, Florence, Arizona, General Obligation | 7/26 at 100.00 | BBB | 231,112 |
| | Bonds, Series 2016, 5.000%, 7/15/31 | | | |
| 385 | | Merrill Ranch Community Facilities District 2, Florence, Arizona, General Obligation | 7/27 at 100.00 | AA | 450,157 |
| | Bonds, Series 2017, 5.000%, 7/15/42 – BAM Insured | | | |
| 300 | | Page, Arizona, Pledged Revenue Bonds, Refunding Series 2011, 5.000%, 7/01/26 | 7/21 at 100.00 | AA– | 304,563 |
| 400 | | Parkway Community Facilities District 1, Prescott Valley, Arizona, General Obligation | 3/21 at 100.00 | N/R | 336,164 |
| | Bonds, Series 2006, 5.350%, 7/15/31 | | | |
| 2,500 | | Phoenix Industrial Development Authority, Arizona, Education Facility Revenue Bonds, | 12/22 at 100.00 | A | 2,673,850 |
| | JMF-Higley 2012 LLC Project, Series 2012, 5.000%, 12/01/36 | | | |
| 580 | | Phoenix Mesa Gateway Airport Authority, Arizona, Special Facility Revenue Bonds, Mesa | 7/22 at 100.00 | AA+ | 611,813 |
| | Project, Series 2012, 5.000%, 7/01/38 (AMT) | | | |
| 1,000 | | Pinal County, Arizona, Pledged Revenue Obligations, Series 2014, 5.000%, 8/01/33 | 8/24 at 100.00 | AA | 1,128,540 |
| 1,600 | | Pinal County, Arizona, Pledged Revenue Obligations, Series 2019, 4.000%, 8/01/39 | 8/28 at 100.00 | AA | 1,821,248 |
| | Puerto Rico Sales Tax Financing Corporation, Sales Tax Revenue Bonds, Restructured 2018A-1: | | | |
| 1,550 | | 4.550%, 7/01/40 | 7/28 at 100.00 | N/R | 1,689,577 |
| 2,040 | | 5.000%, 7/01/58 | 7/28 at 100.00 | N/R | 2,259,382 |
| 1,085 | | Puerto Rico Sales Tax Financing Corporation, Sales Tax Revenue Bonds, Taxable | 7/28 at 100.00 | N/R | 1,167,080 |
| | Restructured Cofina Project Series 2019A-2, 4.329%, 7/01/40 | | | |
| | Queen Creek, Arizona, Excise Tax & State Shared Revenue Obligation Bonds, Refunding | | | |
| | Series 2016: | | | |
| 540 | | 4.000%, 8/01/34 | 8/26 at 100.00 | AA | 604,811 |
| 545 | | 4.000%, 8/01/36 | 8/26 at 100.00 | AA | 607,675 |
| 1,740 | | Queen Creek, Arizona, Excise Tax & State Shared Revenue Obligation Bonds, Series 2018A, | 8/28 at 100.00 | AA | 2,124,244 |
| | 5.000%, 8/01/42 | | | |
| 2,400 | | Queen Creek, Arizona, Excise Tax & State Shared Revenue Obligation Bonds, Series 2020, | 8/30 at 100.00 | AA | 2,784,360 |
| | 4.000%, 8/01/50 | | | |
| | San Luis, Arizona, Pledged Excise Tax Revenue Bonds, Refunding Series2014A: | | | |
| 1,400 | | 5.000%, 7/01/34 – BAM Insured | 7/24 at 100.00 | AA | 1,562,036 |
| 2,100 | | 5.000%, 7/01/38 – BAM Insured | 7/24 at 100.00 | AA | 2,330,748 |
| 3,000 | | Scottsdale Municipal Property Corporation, Arizona, Excise Tax Revenue Bonds, Refunding | No Opt. Call | AAA | 3,460,590 |
| | Series 2006, 5.000%, 7/01/24 | | | |
31
| | |
| NAZ | Nuveen Arizona Quality Municipal Income Fund Portfolio of Investments (continued) February 28, 2021 |
| | | | | | |
| Principal | | | Optional Call | | |
| Amount (000) | | Description (1) | Provisions (2) | Ratings (3) | Value |
| | Tax Obligation/Limited (continued) | | | |
| $ 1,650 | | Sundance Community Facilities District, City of Buckeye, Arizona, General Obligation | 7/28 at 100.00 | AA | $ 2,029,005 |
| | Bonds, Refunding Series 2018, 5.000%, 7/15/39 – BAM Insured | | | |
| 2,505 | | Tempe, Arizona, Transit Excise Tax Revenue Obligation Bonds, Refunding Series 2012, | 7/22 at 100.00 | AAA | 2,652,720 |
| | 5.000%, 7/01/37 | | | |
| 150 | | Virgin Islands Public Finance Authority, Gross Receipts Taxes Loan Note, Refunding | No Opt. Call | AA | 154,833 |
| | Series 2012A, 4.000%, 10/01/22 – AGM Insured | | | |
| 750 | | Vistancia West Community Facilities District, Peoria, Arizona, General Obligation Bonds, | 7/21 at 100.00 | N/R | 753,300 |
| | Series 2016, 3.250%, 7/15/25, 144A | | | |
| 4,240 | | Yavapai County Jail District, Arizona, Pledged Revenue Obligation Bonds, Series 2020, | 7/29 at 100.00 | AA | 4,778,268 |
| | 4.000%, 7/01/40 – BAM Insured | | | |
| 62,605 | | Total Tax Obligation/Limited | | | 69,238,524 |
| | Transportation – 8.3% (5.3% of Total Investments) | | | |
| | Phoenix Civic Improvement Corporation, Arizona, Airport Revenue Bonds, Junior Lien | | | |
| | Series 2015A: | | | |
| 910 | | 5.000%, 7/01/40 | 7/25 at 100.00 | A1 | 1,045,590 |
| 2,185 | | 5.000%, 7/01/45 | 7/25 at 100.00 | A1 | 2,496,734 |
| | Phoenix Civic Improvement Corporation, Arizona, Airport Revenue Bonds, Refunding Senior | | | |
| | Lien Series 2013: | | | |
| 1,785 | | 5.000%, 7/01/30 (AMT) | 7/23 at 100.00 | Aa3 | 1,955,521 |
| 2,215 | | 5.000%, 7/01/32 (AMT) | 7/23 at 100.00 | Aa3 | 2,420,131 |
| 2,000 | | Phoenix Civic Improvement Corporation, Arizona, Airport Revenue Bonds, Senior Lien | 7/27 at 100.00 | Aa3 | 2,325,180 |
| | Series 2017A, 5.000%, 7/01/47 (AMT) | | | |
| 1,500 | | Phoenix Civic Improvement Corporation, Arizona, Airport Revenue Bonds, Senior Lien | 7/28 at 100.00 | Aa3 | 1,773,645 |
| | Series 2018, 5.000%, 7/01/43 (AMT) | | | |
| | Phoenix Civic Improvement Corporation, Arizona, Rental Car Facility Charge Revenue | | | |
| | Bonds, Series 2019A: | | | |
| 975 | | 5.000%, 7/01/33 | 7/29 at 100.00 | A3 | 1,163,779 |
| 1,045 | | 5.000%, 7/01/35 | 7/29 at 100.00 | A3 | 1,239,548 |
| 12,615 | | Total Transportation | | | 14,420,128 |
| | U.S. Guaranteed ��� 4.2% (2.7% of Total Investments) (6) | | | |
| 1,980 | | Arizona Board of Regents, Arizona State University System Revenue Bonds, Refunding | 7/22 at 100.00 | AA | 2,106,760 |
| | Series 2013A, 5.000%, 7/01/43 (Pre-refunded 7/01/22) | | | |
| 545 | | Guam Government Waterworks Authority, Water and Wastewater System Revenue Bonds, Series | 7/23 at 100.00 | A– | 607,195 |
| | 2013, 5.250%, 7/01/33 (Pre-refunded 7/01/23) | | | |
| 720 | | Northern Arizona University, System Revenue Bonds, Refunding Series 2014, 5.000%, | 6/24 at 100.00 | N/R | 825,228 |
| | 6/01/40 (Pre-refunded 6/01/24) | | | |
| 585 | | Phoenix Industrial Development Authority, Arizona, Education Facility Revenue Bonds, | 7/21 at 100.00 | N/R | 596,407 |
| | Great Hearts Academies – Veritas Project, Series 2012, 6.300%, 7/01/42 (Pre-refunded 7/01/21) | | | |
| 1,320 | | Scottsdale Municipal Property Corporation, Arizona, Excise Tax Revenue Bonds, Refunding | 7/27 at 100.00 | AAA | 1,655,056 |
| | Series 2017, 5.000%, 7/01/36 (Pre-refunded 7/01/27) | | | |
| 1,495 | | Tempe, Arizona, Transit Excise Tax Revenue Obligation Bonds, Refunding Series 2012, | 7/22 at 100.00 | N/R | 1,589,678 |
| | 5.000%, 7/01/37 (Pre-refunded 7/01/22) | | | |
| 6,645 | | Total U.S. Guaranteed | | | 7,380,324 |
| | Utilities – 25.0% (16.1% of Total Investments) | | | |
| 1,495 | | Apache County Industrial Development Authority, Arizona, Pollution Control Revenue | 3/22 at 100.00 | A– | 1,537,398 |
| | Bonds, Tucson Electric Power Company, Series 20102A, 4.500%, 3/01/30 | | | |
| 655 | | Central Arizona Water Conservation District, Arizona, Water Delivery O&M Revenue Bonds, | 1/26 at 100.00 | AA+ | 774,223 |
| | Series 2016, 5.000%, 1/01/36 | | | |
| 785 | | Goodyear, Arizona, Water and Sewer Revenue Obligations, Refunding Subordinate Lien | 7/26 at 100.00 | AA | 919,706 |
| | Series 2016, 5.000%, 7/01/45 – AGM Insured | | | |
| 1,500 | | Goodyear, Arizona, Water and Sewer Revenue Obligations, Subordinate Lien Series 2020, | 7/29 at 100.00 | AA | 1,722,615 |
| | 4.000%, 7/01/45 – AGM Insured | | | |
32
| | | | | | |
| Principal | | | Optional Call | | |
| Amount (000) | | Description (1) | Provisions (2) | Ratings (3) | Value |
| | Utilities (continued) | | | |
| $ 665 | | Guam Government Waterworks Authority, Water and Wastewater System Revenue Bonds, | 7/27 at 100.00 | A– | $ 772,358 |
| | Refunding Series 2017, 5.000%, 7/01/36 | | | |
| 1,100 | | Guam Power Authority, Revenue Bonds, Series 2014A, 5.000%, 10/01/39 | 10/24 at 100.00 | AA | 1,221,935 |
| 1,125 | | Lake Havasu City, Arizona, Wastewater System Revenue Bonds, Refunding Senior Lien Series | 7/25 at 100.00 | AA | 1,306,508 |
| | 2015A, 5.000%, 7/01/36 – AGM Insured | | | |
| 8,750 | | Mesa, Arizona, Utility System Revenue Bonds, Series 2018, 5.000%, 7/01/42 (UB) (4) | 7/28 at 100.00 | Aa2 | 10,697,225 |
| 1,135 | | Phoenix Civic Improvement Corporation, Arizona, Wastewater System Revenue Bonds, | 7/24 at 100.00 | AA+ | 1,301,516 |
| | Refunding Junior Lien Series 2014, 5.000%, 7/01/29 | | | |
| 2,000 | | Phoenix Civic Improvement Corporation, Arizona, Water System Revenue Bonds, Junior Lien | 7/24 at 100.00 | AAA | 2,274,200 |
| | Series 2014A, 5.000%, 7/01/39 | | | |
| 1,040 | | Phoenix Civic Improvement Corporation, Arizona, Water System Revenue Bonds, Refunding | No Opt. Call | AAA | 1,113,497 |
| | Junior Lien Series 2001, 5.500%, 7/01/22 – FGIC Insured | | | |
| 695 | | Pinal County Electrical District 3, Arizona, Electric System Revenue Bonds, Refunding | 7/26 at 100.00 | A+ | 826,779 |
| | Series 2016, 5.000%, 7/01/35 | | | |
| 1,500 | | Salt River Project Agricultural Improvement and Power District, Arizona, Electric System | 6/25 at 100.00 | AA+ | 1,750,920 |
| | Revenue Bonds, Refunding Series 2015A, 5.000%, 12/01/36 | | | |
| | Salt Verde Financial Corporation, Arizona, Senior Gas Revenue Bonds, Citigroup Energy | | | |
| | Inc Prepay Contract Obligations, Series 2007: | | | |
| 4,500 | | 5.500%, 12/01/29 | No Opt. Call | A3 | 5,850,315 |
| 5,665 | | 5.000%, 12/01/37 | No Opt. Call | A3 | 7,825,744 |
| | Surprise, Arizona, Utility System Revenue Bonds, Refunding Senior Lien Series 2018: | | | |
| 500 | | 5.000%, 7/01/35 | 7/28 at 100.00 | AA+ | 620,295 |
| 805 | | 5.000%, 7/01/36 | 7/28 at 100.00 | AA+ | 995,527 |
| 2,180 | | Yuma County Industrial Development Authority, Arizona, Exempt Revenue Bonds, Far West | 4/21 at 100.00 | N/R | 2,129,947 |
| | Water & Sewer Inc Refunding, Series 2007A, 6.375%, 12/01/37 (AMT) | | | |
| 36,095 | | Total Utilities | | | 43,640,708 |
| $ 238,970 | | Total Long-Term Investments (cost $251,658,314) | | | 270,785,704 |
| | Floating Rate Obligations – (5.6)% | | | (9,755,000) |
| | Adjustable Rate MuniFund Term Preferred Shares, net of deferred offering costs – (50.6)% (7) | | | (88,232,585) |
| | Other Assets Less Liabilities – 0.9% | | | 1,602,507 |
| | Net Asset Applicable to Common Shares – 100% | | | $ 174,400,626 |
(1) All percentages shown in the Portfolio of Investments are based on net assets applicable to common shares unless otherwise noted.
(2) Optional Call Provisions: Dates (month and year) and prices of the earliest optional call or redemption. There may be other call provisions at varying prices at later dates. Certain mortgage-backed securities may be subject to periodic principal paydowns. Optional Call Provisions are not covered by the report of independent registered public accounting firm.
(3) For financial reporting purposes, the ratings disclosed are the highest of Standard & Poor’s Group (“Standard & Poor’s”), Moody’s Investors Service, Inc. (“Moody’s”) or Fitch, Inc. (“Fitch”) rating. This treatment of split-rated securities may differ from that used for other purposes, such as for Fund investment policies. Ratings below BBB by Standard & Poor’s, Baa by Moody’s or BBB by Fitch are considered to be below investment grade. Holdings designated N/R are not rated by any of these national rating agencies. Ratings are not covered by the report of independent registered public accounting firm.
(4) Investment, or portion of investment, has been pledged to collateralize the net payment obligations for investments in inverse floating rate transactions.
(5) Defaulted security. A security whose issuer has failed to fully pay principal and/or interest when due, or is under the protection of bankruptcy.
(6) Backed by an escrow or trust containing sufficient U.S. Government or U.S. Government agency securities, which ensure the timely payment of principal and interest.
(7) Adjustable Rate MuniFund Term Preferred Shares, net of deferred offering cost as a percentage of Total Investments is 32.6%.
144A Investment is exempt from registration under Rule 144A of the Securities Act of 1933, as amended. These investments may only be resold in transactions exempt from registration, which are normally those transactions with qualified institutional buyers.
AMT Alternative Minimum Tax
IF Inverse floating rate security issued by a tender option bond (“TOB”) trust, the interest rate on which varies inversely with the Securities Industry Financial Markets Association (SIFMA) short-term rate, which resets weekly, or a similar short-term rate, and is reduced by the expenses related to the TOB trust.
UB Underlying bond of an inverse floating rate trust reflected as a financing transaction. See Notes to Financial Statements, Note 4 – Portfolio Securities and Investments in Derivatives for more information.
See accompanying notes to financial statements.
33
| NUO | Nuveen Ohio Quality Municipal Income Fund Portfolio of Investments February 28, 2021 |
| | | | | | |
| Principal | | | Optional Call | | |
| Amount (000) | | Description (1) | Provisions (2) | Ratings (3) | Value |
| | LONG-TERM INVESTMENTS – 152.1% (100.0% of Total Investments) | | | |
|
| | MUNICIPAL BONDS – 151.5% (99.6% of Total Investments) | | | |
|
| | Consumer Discretionary – 0.9% (0.6% of Total Investments) | | | |
| $ 2,680 | | Franklin County Convention Facilities Authority, Ohio, Hotel Project Revenue Bonds, | 12/29 at 100.00 | BBB– | $ 2,763,107 |
| | Greater Columbus Convention Center Hotel Expansion Project, Series 2019, 5.000%, 12/01/51 | | | |
| | Consumer Staples – 4.7% (3.1% of Total Investments) | | | |
| 20,605 | | Buckeye Tobacco Settlement Financing Authority, Ohio, Tobacco Settlement Asset-Backed | 6/30 at 22.36 | N/R | 3,089,514 |
| | Revenue Bonds, Refunding Senior Lien Capital Appreciation Series 2020B-3 Class 2, | | | |
| | 0.000%, 6/01/57 | | | |
| 1,025 | | Buckeye Tobacco Settlement Financing Authority, Ohio, Tobacco Settlement Asset-Backed | 6/30 at 100.00 | BBB+ | 1,145,817 |
| | Revenue Bonds, Refunding Senior Lien Series 2020A-2 Class 1, 4.000%, 6/01/48 | | | |
| 9,595 | | Buckeye Tobacco Settlement Financing Authority, Ohio, Tobacco Settlement Asset-Backed | 6/30 at 100.00 | N/R | 10,803,874 |
| | Revenue Bonds, Refunding Senior Lien Series 2020B-2 Class 2, 5.000%, 6/01/55 | | | |
| 31,225 | | Total Consumer Staples | | | 15,039,205 |
| | Education and Civic Organizations – 11.9% (7.8% of Total Investments) | | | |
| | Lorain County Community College District, Ohio, General Receipts Revenue Bonds, | | | |
| | Refunding Series 2017: | | | |
| 1,305 | | 5.000%, 12/01/32 | 6/27 at 100.00 | Aa2 | 1,564,747 |
| 1,200 | | 5.000%, 12/01/33 | 6/27 at 100.00 | Aa2 | 1,434,276 |
| 505 | | 5.000%, 12/01/34 | 6/27 at 100.00 | Aa2 | 602,258 |
| | Miami University of Ohio, General Receipts Bonds, Refunding Series 2011: | | | |
| 130 | | 5.000%, 9/01/33 | 9/21 at 100.00 | AA | 132,941 |
| 1,960 | | 5.000%, 9/01/36 | 9/21 at 100.00 | AA | 2,003,355 |
| | Miami University of Ohio, General Receipts Bonds, Refunding Series 2014: | | | |
| 4,375 | | 5.000%, 9/01/33 | 9/24 at 100.00 | AA | 4,999,269 |
| 2,500 | | 4.000%, 9/01/39 | 9/24 at 100.00 | AA | 2,689,125 |
| 2,585 | | Miami University of Ohio, General Receipts Bonds, Refunding Series 2017, 5.000%, 9/01/41 | 9/26 at 100.00 | AA | 3,016,617 |
| 1,125 | | Miami University of Ohio, General Receipts Bonds, Refunding Series 2020A, 4.000%, 9/01/45 | 9/30 at 100.00 | AA | 1,282,691 |
| | Miami University of Ohio, General Receipts Bonds, Series 2012: | | | |
| 480 | | 4.000%, 9/01/32 | 9/22 at 100.00 | AA | 499,104 |
| 1,000 | | 4.000%, 9/01/33 | 9/22 at 100.00 | AA | 1,038,580 |
| | Ohio Higher Educational Facilities Commission, Revenue Bonds, Denison University | | | |
| | Project, Series 2012: | | | |
| 120 | | 5.000%, 11/01/27 | 5/22 at 100.00 | AA | 125,922 |
| 590 | | 5.000%, 11/01/32 | 5/22 at 100.00 | AA | 614,562 |
| 5,000 | | Ohio Higher Educational Facilities Commission, Revenue Bonds, University of Dayton, | 12/22 at 100.00 | A+ | 5,265,350 |
| | Refunding Series 2013, 5.000%, 12/01/43 | | | |
| 1,000 | | Ohio State University, General Receipts Bonds, Multiyear Debt Issuance Program, Series | No Opt. Call | Aa1 | 1,313,660 |
| | 2020A, 5.000%, 12/01/29 | | | |
| 1,000 | | Tuscarawas County Economic Development and Finance Alliance, Ohio, Higher Education | 3/25 at 100.00 | N/R | 1,083,190 |
| | Facilities Revenue Bonds, Ashland University, Refunding & Improvement Series 2015, | | | |
| | 6.000%, 3/01/45 | | | |
| 1,000 | | University of Cincinnati, Ohio, General Receipts Bonds, Green Bond Series 2014C, | 12/24 at 100.00 | AA– | 1,115,270 |
| | 5.000%, 6/01/41 | | | |
| 3,175 | | University of Cincinnati, Ohio, General Receipts Bonds, Series 2016C, 5.000%, 6/01/46 | 6/26 at 100.00 | AA– | 3,656,171 |
| 1,375 | | University of Kentucky, General Receipts Bonds, University of Kentucky Mixed-Use Parking | 5/29 at 100.00 | AA– | 1,541,361 |
| | Project, Series 2019A, 4.000%, 5/01/44 | | | |
| | Youngstown State University, Ohio, General Receipts Bonds, Refunding Series 2017: | | | |
| 1,555 | | 5.000%, 12/15/29 | 12/26 at 100.00 | A+ | 1,881,877 |
| 1,670 | | 5.000%, 12/15/30 | 12/26 at 100.00 | A+ | 2,012,818 |
| 33,650 | | Total Education and Civic Organizations | | | 37,873,144 |
34
| | | | | | |
| Principal | | | Optional Call | | |
| Amount (000) | | Description (1) | Provisions (2) | Ratings (3) | Value |
| | Health Care – 14.5% (9.6% of Total Investments) | | | |
| $ 3,000 | | Akron, Bath and Copley Joint Township Hospital District, Ohio, Hospital Revenue Bonds, | 5/23 at 100.00 | AA– | $ 3,193,500 |
| | Children’s Hospital Medical Center, Improvement Series 2013, 5.000%, 11/15/38 | | | |
| | Chillicothe, Ohio, Hospital Facilities Revenue Bonds, Adena Health System Obligated | | | |
| | Group Project, Refunding & Improvement Series 2017: | | | |
| 2,250 | | 5.000%, 12/01/37 | 12/27 at 100.00 | A– | 2,693,948 |
| 1,000 | | 5.000%, 12/01/47 | 12/27 at 100.00 | A– | 1,177,200 |
| 2,945 | | Colorado Health Facilities Authority, Colorado, Revenue Bonds, AdventHealth Obligated | 11/29 at 100.00 | AA | 3,364,015 |
| | Group, Series 2019A, 4.000%, 11/15/43 | | | |
| 1,660 | | Colorado Health Facilities Authority, Colorado, Revenue Bonds, CommonSpirit Health, | 8/29 at 100.00 | BBB+ | 1,834,018 |
| | Series 2019A-2, 4.000%, 8/01/49 | | | |
| 2,400 | | Fairfield County, Ohio, Hospital Facilities Revenue Bonds, Fairfield Medical Center | 6/23 at 100.00 | Ba2 | 2,476,104 |
| | Project, Series 2013, 5.000%, 6/15/43 | | | |
| 1,730 | | Franklin County, Ohio, Revenue Bonds, Trinity Health Credit Group, Series 2017A, | 12/27 at 100.00 | AA– | 2,058,077 |
| | 5.000%, 12/01/47 | | | |
| 200 | | Franklin County, Ohio, Revenue Bonds, Trinity Health Credit Group, Series 2019A, | 12/29 at 100.00 | AA– | 224,784 |
| | 4.000%, 12/01/49 | | | |
| 300 | | Lake County, Ohio, Hospital Facilities Revenue Bonds, Lake Hospital System, Inc, | 3/21 at 100.00 | A– | 300,807 |
| | Refunding Series 2008C, 6.000%, 8/15/43 | | | |
| 820 | | Middleburg Heights, Ohio, Hospital Facilities Revenue Bonds, Southwest General Health | 8/21 at 100.00 | A2 | 837,400 |
| | Center Project, Refunding Series 2011, 5.250%, 8/01/41 | | | |
| 6,105 | | Muskingum County, Ohio, Hospital Facilities Revenue Bonds, Genesis HealthCare System | 2/23 at 100.00 | BB+ | 6,342,729 |
| | Obligated Group Project, Series 2013, 5.000%, 2/15/44 | | | |
| 4,500 | | North Carolina Medical Care Commission, Health Care Facilities Revenue Bonds, Novant | 11/29 at 100.00 | AA– | 5,113,620 |
| | Health Obligated Group, Series 2019A, 4.000%, 11/01/49 | | | |
| 2,090 | | Ohio State, Hospital Revenue Bonds, Cleveland Clinic Health System Obligated Group, | 1/28 at 100.00 | AA | 2,590,722 |
| | Refunding Series 2017A, 5.000%, 1/01/33 | | | |
| | Ohio State, Hospital Revenue Bonds, University Hospitals Health System, Inc, Series 2013A: | | | |
| 1,000 | | 5.000%, 1/15/28 | 1/23 at 100.00 | A | 1,076,060 |
| 2,000 | | 5.000%, 1/15/29 | 1/23 at 100.00 | A | 2,147,460 |
| 1,605 | | Ross County, Ohio, Hospital Facilities Revenue Bonds, Adena Health System Obligated | 12/29 at 100.00 | A– | 1,958,357 |
| | Group Project, Refunding & Improvement Series 2019, 5.000%, 12/01/44 | | | |
| 555 | | Washington Health Care Facilities Authority, Revenue Bonds, CommonSpirit Health, Series | 8/29 at 100.00 | BBB+ | 615,922 |
| | 2019A-1, 4.000%, 8/01/44 | | | |
| | Wood County, Ohio, Hospital Facilities Refunding and Improvement Revenue Bonds, Wood | | | |
| | County Hospital Project, Series 2012: | | | |
| 2,670 | | 5.000%, 12/01/37 | 12/22 at 100.00 | Ba3 | 2,703,081 |
| 5,510 | | 5.000%, 12/01/42 | 12/22 at 100.00 | Ba3 | 5,551,325 |
| 42,340 | | Total Health Care | | | 46,259,129 |
| | Housing/Multifamily – 1.1% (0.7% of Total Investments) | | | |
| 85 | | Franklin County, Ohio, GNMA Collateralized Multifamily Housing Mortgage Revenue Bonds, | 3/21 at 100.00 | Aaa | 85,309 |
| | Agler Project, Series 2002A, 5.550%, 5/20/22 (AMT) | | | |
| 3,240 | | Summit County Port Authority, Ohio, Multifamily Housing Revenue Bonds, Callis Tower | 3/21 at 100.00 | Aa1 | 3,246,286 |
| | Apartments Project, Series 2007, 5.250%, 9/20/47 (AMT) | | | |
| 3,325 | | Total Housing/Multifamily | | | 3,331,595 |
| | Industrials – 1.1% (0.7% of Total Investments) | | | |
| 3,495 | | Toledo-Lucas County Port Authority, Ohio, Revenue Refunding Bonds, CSX Transportation | No Opt. Call | A3 | 3,645,984 |
| | Inc, Series 1992, 6.450%, 12/15/21 | | | |
| | Tax Obligation/General – 18.7% (12.3% of Total Investments) | | | |
| 2,500 | | Clark-Shawnee Local School District, Clark County, Ohio, General Obligation Bonds, | 11/27 at 100.00 | AA | 2,947,875 |
| | School Facilities Construction & Improvement Series 2017, 5.000%, 11/01/54 | | | |
| 1,050 | | Cleveland, Ohio, General Obligation Bonds, Various Purpose Series 2018, 5.000%, 12/01/43 | 6/28 at 100.00 | AA+ | 1,273,639 |
35
| | |
| NUO | Nuveen Ohio Quality Municipal Income Fund Portfolio of Investments (continued) February 28, 2021 |
| | | | | | |
| Principal | | | Optional Call | | |
| Amount (000) | | Description (1) | Provisions (2) | Ratings (3) | Value |
| | Tax Obligation/General (continued) | | | |
| | Columbus City School District, Franklin County, Ohio, General Obligation Bonds, | | | |
| | Refunding Series 2006: | | | |
| $ 4,310 | | 0.000%, 12/01/27 – AGM Insured | No Opt. Call | AA | $ 3,941,064 |
| 5,835 | | 0.000%, 12/01/28 – AGM Insured | No Opt. Call | AA | 5,195,659 |
| 2,250 | | Columbus, Ohio, General Obligation Bonds, Various Purpose Series 2018A, 5.000%, 4/01/29 | 10/28 at 100.00 | AAA | 2,908,485 |
| 500 | | Cuyahoga County, Ohio, General Obligation Bonds, Refunding & Capital Improvement Series | 6/30 at 100.00 | AA | 596,430 |
| | 2020A, 4.000%, 12/01/34 | | | |
| | Dublin, Ohio, General Obligation Bonds, Limited Tax Various Purpose Series 2015: | | | |
| 900 | | 5.000%, 12/01/32 | 12/25 at 100.00 | Aaa | 1,079,910 |
| 1,000 | | 5.000%, 12/01/34 | 12/25 at 100.00 | Aaa | 1,197,310 |
| 1,730 | | Franklin County, Ohio, General Obligation Bonds, Refunding Series 2014, 5.000%, 6/01/31 | 12/23 at 100.00 | AAA | 1,945,817 |
| | Gallia County Local School District, Gallia and Jackson Counties, Ohio, General | | | |
| | Obligation Bonds, Refunding School Improvement Series 2014: | | | |
| 1,260 | | 5.000%, 11/01/30 | 11/24 at 100.00 | Aa2 | 1,440,281 |
| 1,540 | | 5.000%, 11/01/31 | 11/24 at 100.00 | Aa2 | 1,757,941 |
| 1,005 | | Grandview Heights City School District, Franklin County, Ohio, General Obligation Bonds, | 6/29 at 100.00 | AA+ | 1,220,794 |
| | School Facilities Construction & Improvement Series 2019, 5.000%, 12/01/53 | | | |
| 2,160 | | Kenston Local School District, Geauga County, Ohio, General Obligation Bonds, Series | No Opt. Call | Aa1 | 2,154,211 |
| | 2011, 0.000%, 12/01/21 | | | |
| | Lorain County, Ohio, General Obligation Bonds, Limited Tax Various Purpose Series 2020B: | | | |
| 345 | | 4.000%, 12/01/29 | 12/25 at 100.00 | Aa2 | 390,806 |
| 145 | | 4.000%, 12/01/30 | 12/25 at 100.00 | Aa2 | 163,808 |
| 240 | | 4.000%, 12/01/40 | 12/25 at 100.00 | Aa2 | 265,279 |
| 415 | | 4.000%, 12/01/45 | 12/25 at 100.00 | Aa2 | 455,384 |
| 4,500 | | Middletown City School District, Butler County, Ohio, General Obligation Bonds, | No Opt. Call | A2 | 5,974,785 |
| | Refunding Series 2007, 5.250%, 12/01/31 – AGM Insured | | | |
| 1,305 | | Monroe Local School District, Butler County, Ohio, General Obligation Bonds, Series | No Opt. Call | Aa3 | 1,540,905 |
| | 2006, 5.500%, 12/01/24 – AMBAC Insured | | | |
| | Ohio State, General Obligation Bonds, Highway Capital Improvement, Series 2018V: | | | |
| 2,500 | | 5.000%, 5/01/33 | 5/28 at 100.00 | AAA | 3,138,575 |
| 1,250 | | 5.000%, 5/01/34 | 5/28 at 100.00 | AAA | 1,564,112 |
| | Ohio State, General Obligation Bonds, Infrastructure Improvement Series 2020C: | | | |
| 1,365 | | 5.000%, 3/01/37 | 3/31 at 100.00 | AA+ | 1,796,217 |
| 2,200 | | 5.000%, 3/01/38 | 3/31 at 100.00 | AA+ | 2,885,432 |
| 4,000 | | Southwest Local School District, Hamilton and Butler Counties, Ohio, General Obligation | 1/28 at 100.00 | Aa2 | 4,374,840 |
| | Bonds, School Improvement Series 2018A, 4.000%, 1/15/55 | | | |
| 1,500 | | Springboro Community City School District, Warren County, Ohio, General Obligation | No Opt. Call | AA | 2,036,820 |
| | Bonds, Refunding Series 2007, 5.250%, 12/01/32 | | | |
| 4,000 | | Sycamore Community School District, Hamilton County, Ohio, General Obligation Bonds, | 6/29 at 100.00 | AAA | 4,586,080 |
| | School Improvement Series 2020, 4.000%, 12/01/45 | | | |
| 1,200 | | Toledo, Ohio, General Obligation Bonds, Limited Tax Capital Improvement Series 2020, | 12/30 at 100.00 | A2 | 1,357,056 |
| | 4.000%, 12/01/35 | | | |
| 1,000 | | Upper Arlington City School District, Franklin County, Ohio, General Obligation Bonds, | 12/27 at 100.00 | AAA | 1,195,800 |
| | School Facilities & Improvement Series 2018A, 5.000%, 12/01/48 | | | |
| 52,005 | | Total Tax Obligation/General | | | 59,385,315 |
| | Tax Obligation/Limited – 23.9% (15.7% of Total Investments) | | | |
| | Cleveland, Ohio, Income Tax Revenue Bonds, Bridges & Roadways Improvements, Subordinate | | | |
| | Lien Series 2017B-2: | | | |
| 1,250 | | 5.000%, 10/01/31 | 4/28 at 100.00 | AA | 1,541,875 |
| 1,000 | | 5.000%, 10/01/32 | 4/28 at 100.00 | AA | 1,228,620 |
| | Cleveland, Ohio, Income Tax Revenue Bonds, Subordinate Lien Improvement and Refunding | | | |
| | Series 2017A-2: | | | |
| 435 | | 5.000%, 10/01/30 | 10/27 at 100.00 | AA | 533,401 |
| 700 | | 5.000%, 10/01/33 | 10/27 at 100.00 | AA | 848,883 |
36
| | | | | | |
| Principal | | | Optional Call | | |
| Amount (000) | | Description (1) | Provisions (2) | Ratings (3) | Value |
| | Tax Obligation/Limited (continued) | | | |
| $ 1,000 | | Columbus-Franklin County Finance Authority, Ohio, Tax Increment Financing Revenue Bonds, | No Opt. Call | N/R | $ 1,055,640 |
| | Easton Project, Series 2020, 5.000%, 6/01/28, 144A | | | |
| 1,920 | | Dublin, Ohio, Special Obligation Non-Tax Revenue Bonds, Series 2015A, 5.000%, 12/01/44 | 12/25 at 100.00 | Aa1 | 2,240,198 |
| 2,500 | | Franklin County Convention Facilities Authority, Ohio, Lease Appropriation Bonds, | 12/29 at 100.00 | AA | 2,929,125 |
| | Greater Columbus Convention Center Hotel Expansion Project, Series 2019, 5.000%, 12/01/46 | | | |
| | Franklin County, Ohio, Sales Tax Revenue Bonds, Various Purpose Series 2018: | | | |
| 2,120 | | 5.000%, 6/01/36 | 6/28 at 100.00 | AAA | 2,626,892 |
| 1,155 | | 5.000%, 6/01/37 | 6/28 at 100.00 | AAA | 1,426,875 |
| 6,500 | | 5.000%, 6/01/43 | 6/28 at 100.00 | AAA | 7,916,935 |
| 5,535 | | 5.000%, 6/01/48 | 6/28 at 100.00 | AAA | 6,696,631 |
| 1,220 | | Great Oaks Career Campuses Board of Education, Brown, Butler, Clermont, Clinton, | 12/29 at 100.00 | Aa1 | 1,428,022 |
| | Fayette, Greene, Hamilton, Highland, Madison, Pickaway, Ross and Warren, Ohio, Certificates | | | |
| | of Participation, School, 4.000%, 12/01/37, (WI/DD, Settling 3/09/21) | | | |
| 1,000 | | Greater Cleveland Regional Transit Authority, Ohio, Sales Tax Supported Capital | 12/25 at 100.00 | AAA | 1,189,590 |
| | Improvement Bonds, Refunding Series 2015, 5.000%, 12/01/34 | | | |
| 5,565 | | Hamilton County, Ohio, Sales Tax Bonds, Subordinate Series 2000B, 0.000%, 12/01/28 – | No Opt. Call | AA | 4,849,786 |
| | AGM Insured | | | |
| 5,000 | | Hamilton County, Ohio, Sales Tax Revenue Bonds, Refunding Series 2011A, 5.000%, 12/01/31 | 12/21 at 100.00 | A1 | 5,151,100 |
| 6,000 | | Michigan State Building Authority, Revenue Bonds, Facilities Program, Refunding Series | 10/29 at 100.00 | Aa2 | 6,865,260 |
| | 2019-I, 4.000%, 10/15/49 | | | |
| 1,000 | | New Albany Community Authority, Ohio, Community Facilities Revenue Refunding Bonds, | 10/22 at 100.00 | Aa3 | 1,072,510 |
| | Series 2012C, 5.000%, 10/01/24 | | | |
| 2,000 | | Ohio State, Capital Facilities Lease Appropriation Bonds, Juvenile Correctional Building | 4/29 at 100.00 | AA | 2,496,980 |
| | Fund Projects, Series 2019A, 5.000%, 4/01/37 | | | |
| 1,250 | | Pickaway County, Ohio, Sales Tax Special Obligation Bonds, Series 2019, 5.000%, 12/01/48 | 12/28 at 100.00 | AA | 1,548,775 |
| 1,845 | | Pinnacle Community Infrastructure Financing Authority, Grove City, Ohio, Community | 12/25 at 100.00 | AA | 2,029,408 |
| | Facilities Bonds, Series 2015A, 4.250%, 12/01/36 – AGM Insured | | | |
| 400 | | Port of Greater Cincinnati Development Authority, Ohio, Special Obligation Development | 12/28 at 100.00 | N/R | 428,312 |
| | TIF Revenue Bonds, RBM Development – Phase 2B Project, Series 2018A, 6.000%, 12/01/50 | | | |
| 1,000 | | Port of Greater Cincinnati Development Authority, Ohio, Special Obligation Tax Increment | 11/30 at 100.00 | N/R | 986,720 |
| | Financing Revenue Bonds, Cooperative Township Public Parking Project, Gallery at Kenwood, | | | |
| | Senior Lien Series 2019A, 5.000%, 11/01/51 | | | |
| | Puerto Rico Sales Tax Financing Corporation, Sales Tax Revenue Bonds, Restructured | | | |
| | 2018A-1: | | | |
| 6,450 | | 4.500%, 7/01/34 | 7/25 at 100.00 | N/R | 7,039,595 |
| 3,580 | | 4.550%, 7/01/40 | 7/28 at 100.00 | N/R | 3,902,379 |
| 1,780 | | Puerto Rico Sales Tax Financing Corporation, Sales Tax Revenue Bonds, Restructured | 7/28 at 100.00 | N/R | 1,940,289 |
| | Cofina Project Series 2019A-2A, 4.550%, 7/01/40 | | | |
| | Riversouth Authority, Ohio, Riversouth Area Redevelopment Bonds, Payable from City of | | | |
| | Columbus, Ohio Annual Rental Appropriations, Refunding Series 2012A: | | | |
| 1,645 | | 5.000%, 12/01/23 | 12/22 at 100.00 | AA+ | 1,780,367 |
| 1,200 | | 5.000%, 12/01/24 | 12/22 at 100.00 | AA+ | 1,298,532 |
| 2,450 | | Westerville City School District, Franklin and Delaware Counties, Ohio, Certificates of | 12/27 at 100.00 | Aa2 | 2,938,261 |
| | Participation, School Facilities Project, Series 2018, 5.000%, 12/01/39 | | | |
| 67,500 | | Total Tax Obligation/Limited | | | 75,990,961 |
| | Transportation – 17.1% (11.3% of Total Investments) | | | |
| | Dayton, Ohio, Airport Revenue Bonds, James M Cox International Airport, Series 2015B: | | | |
| 860 | | 5.000%, 12/01/33 – AGM Insured | 12/23 at 100.00 | AA | 949,337 |
| 500 | | 5.000%, 12/01/34 – AGM Insured | 12/23 at 100.00 | AA | 551,515 |
| 6,835 | | North Texas Tollway Authority, System Revenue Bonds, Refunding First Tier, Series 2019A, | 1/29 at 100.00 | A+ | 7,705,574 |
| | 4.000%, 1/01/44 | | | |
37
| | |
| NUO | Nuveen Ohio Quality Municipal Income Fund Portfolio of Investments (continued) February 28, 2021 |
| Principal | | | Optional Call | | |
| Amount (000) | | Description (1) | Provisions (2) | Ratings (3) | Value |
| | Transportation (continued) | | | |
| | Ohio State, Private Activity Bonds, Portsmouth Gateway Group, LLC – Borrower, Portsmouth | | | |
| | Bypass Project, Series 2015: | | | |
| $ 2,500 | | 5.000%, 12/31/35 – AGM Insured (AMT) | 6/25 at 100.00 | AA | $ 2,849,700 |
| 3,000 | | 5.000%, 12/31/39 – AGM Insured (AMT) | 6/25 at 100.00 | AA | 3,399,480 |
| 4,250 | | 5.000%, 6/30/53 (AMT) | 6/25 at 100.00 | A3 | 4,735,180 |
| | Ohio State, Turnpike Revenue Bonds, Ohio Turnpike and Infrastructure Commission | | | |
| | Infrastructure Projects, Junior Lien, Capital Appreciation Series 2013A-2: | | | |
| 5,000 | | 0.000%, 2/15/37 | No Opt. Call | Aa3 | 3,471,150 |
| 11,260 | | 0.000%, 2/15/38 | No Opt. Call | Aa3 | 7,563,004 |
| 5,000 | | 0.000%, 2/15/40 | No Opt. Call | Aa3 | 3,139,350 |
| 2,050 | | Ohio State, Turnpike Revenue Bonds, Ohio Turnpike and Infrastructure Commission | 2/23 at 100.00 | Aa3 | 2,228,883 |
| | Infrastructure Projects, Junior Lien, Current Interest Series 2013A-1, 5.250%, 2/15/39 | | | |
| 15,000 | | Ohio State, Turnpike Revenue Bonds, Ohio Turnpike and Infrastructure Commission, | 2/28 at 100.00 | Aa3 | 17,947,950 |
| | Infrastructure Projects, Junior Lien Series 2018A, 5.000%, 2/15/46 (UB) (4) | | | |
| 56,255 | | Total Transportation | | | 54,541,123 |
| | U.S. Guaranteed – 41.7% (27.4% of Total Investments) (5) | | | |
| | Central Ohio Solid Waste Authority, General Obligation Bonds, Refunding & Improvements, | | | |
| | Series 2012: | | | |
| 110 | | 5.000%, 12/01/26 (Pre-refunded 6/01/22) | 6/22 at 100.00 | N/R | 116,459 |
| 245 | | 5.000%, 12/01/28 (Pre-refunded 6/01/22) | 6/22 at 100.00 | N/R | 259,386 |
| 160 | | 5.000%, 12/01/29 (Pre-refunded 6/01/22) | 6/22 at 100.00 | N/R | 169,395 |
| 1,605 | | 5.000%, 12/01/29 (Pre-refunded 6/01/22) | 6/22 at 100.00 | Aaa | 1,702,375 |
| 8,150 | | Cincinnati, Ohio, Water System Revenue Bonds, Series 2012A, 5.000%, 12/01/37 | 12/21 at 100.00 | AAA | 8,446,986 |
| | (Pre-refunded 12/01/21) | | | |
| 8,000 | | Cincinnati, Ohio, Water System Revenue Bonds, Series 2016A, 5.000%, 12/01/46 | 12/26 at 100.00 | AAA | 9,959,920 |
| | (Pre-refunded 12/01/26) | | | |
| | Cleveland, Ohio, Airport System Revenue Bonds, Series 2012A: | | | |
| 2,150 | | 5.000%, 1/01/30 (Pre-refunded 1/01/22) | 1/22 at 100.00 | A2 | 2,236,150 |
| 1,500 | | 5.000%, 1/01/31 (Pre-refunded 1/01/22) – AGM Insured | 1/22 at 100.00 | AA | 1,560,105 |
| | Cleveland, Ohio, Income Tax Revenue Bonds, Bridges & Roadways Improvements, Subordinate | | | |
| | Lien Series 2013A-2: | | | |
| 1,315 | | 5.000%, 10/01/27 (Pre-refunded 10/01/23) | 10/23 at 100.00 | AA | 1,475,930 |
| 1,520 | | 5.000%, 10/01/30 (Pre-refunded 10/01/23) | 10/23 at 100.00 | AA | 1,706,018 |
| 1,600 | | 5.000%, 10/01/31 (Pre-refunded 10/01/23) | 10/23 at 100.00 | AA | 1,795,808 |
| | Cleveland, Ohio, Income Tax Revenue Bonds, Bridges & Roadways Improvements, Subordinate | | | |
| | Lien Series 2015A-2: | | | |
| 2,705 | | 5.000%, 10/01/37 (Pre-refunded 10/01/23) | 10/23 at 100.00 | N/R | 3,021,160 |
| 8,045 | | 5.000%, 10/01/37 (Pre-refunded 10/01/23) | 10/23 at 100.00 | AA+ | 9,029,547 |
| 3,000 | | Cleveland, Ohio, Income Tax Revenue Bonds, Public Facilities Improvements, Series | 11/23 at 100.00 | AA | 3,384,480 |
| | 2014A-1, 5.000%, 11/15/38 (Pre-refunded 11/15/23) | | | |
| 2,035 | | Cleveland, Ohio, Water Revenue Bonds, Senior Lien Series 2012X, 5.000%, 1/01/42 | 1/22 at 100.00 | AA+ | 2,117,418 |
| | (Pre-refunded 1/01/22) | | | |
| 1,140 | | Columbia Local School District, Lorain County, Ohio, General Obligation Bonds, School | 11/21 at 100.00 | Aa3 | 1,176,902 |
| | Facilities Improvement Series 2011, 5.000%, 11/01/39 (Pre-refunded 11/01/21) – AGM Insured | | | |
| | Cuyahoga County, Ohio, Sales Tax Revenue Bonds, Refunding Various Purpose Series 2014: | | | |
| 1,815 | | 5.000%, 12/01/32 (Pre-refunded 12/01/24) | 12/24 at 100.00 | AAA | 2,126,690 |
| 1,415 | | 5.000%, 12/01/33 (Pre-refunded 12/01/24) | 12/24 at 100.00 | AAA | 1,657,998 |
| 1,000 | | 5.000%, 12/01/34 (Pre-refunded 12/01/24) | 12/24 at 100.00 | AAA | 1,171,730 |
| 945 | | 5.000%, 12/01/35 (Pre-refunded 12/01/24) | 12/24 at 100.00 | AAA | 1,107,285 |
| 10,350 | | Franklin County Convention Facilities Authority, Ohio, Excise Tax and Lease Revenue | 12/24 at 100.00 | Aa1 | 12,127,405 |
| | Bonds, Columbus City & Franklin County Lessees, Refunding Anticipation Series 2014, 5.000%, | | | |
| | 12/01/35 (Pre-refunded 12/01/24) | | | |
| 250 | | Franklin County, Ohio, Hospital Revenue Bonds, OhioHealth Corporation, Series 2011A, | 11/21 at 100.00 | AA+ | 258,568 |
| | 5.000%, 11/15/41 (Pre-refunded 11/15/21) | | | |
38
| | | | | | |
| Principal | | | Optional Call | | |
| Amount (000) | | Description (1) | Provisions (2) | Ratings (3) | Value |
| | U.S. Guaranteed (5) (continued) | | | |
| $ 4,480 | | Franklin County, Ohio, Hospital Revenue Bonds, OhioHealth Corporation, Tender Option | 11/21 at 100.00 | AA+ | $ 4,787,059 |
| | Bond Trust 2016-XL0004, 9.314%, 11/15/41 (Pre-refunded 11/15/21), 144A (IF) (4) | | | |
| | Greater Cleveland Regional Transit Authority, Ohio, Sales Tax Supported Capital | | | |
| | Improvement Bonds, Refunding Series 2012: | | | |
| 760 | | 5.250%, 12/01/30 (Pre-refunded 12/01/21) | 12/21 at 100.00 | AAA | 789,108 |
| 600 | | 5.000%, 12/01/31 (Pre-refunded 12/01/21) | 12/21 at 100.00 | AAA | 621,864 |
| | Greenville City School District, Drake County, Ohio, General Obligation Bonds, School | | | |
| | Improvement Series 2013: | | | |
| 555 | | 5.250%, 1/01/38 (Pre-refunded 1/01/22) | 1/22 at 100.00 | AA | 578,626 |
| 1,355 | | 5.250%, 1/01/41 (Pre-refunded 1/01/22) | 1/22 at 100.00 | AA | 1,412,682 |
| 3,225 | | Hancock County, Ohio, Hospital Revenue Bonds, Blanchard Valley Regional Health Center, | 6/21 at 100.00 | A+ | 3,272,859 |
| | Series 2011A, 6.250%, 12/01/34 (Pre-refunded 6/01/21) | | | |
| 20,700 | | JobsOhio Beverage System, Ohio, Statewide Liquor Profits Revenue Bonds, Senior Lien | 1/23 at 100.00 | AA+ | 22,514,562 |
| | Series 2013A, 5.000%, 1/01/38 (Pre-refunded 1/01/23) | | | |
| 3,965 | | Lucas County, Ohio, Hospital Revenue Bonds, ProMedica Healthcare Obligated Group, Series | 11/21 at 100.00 | BBB | 4,126,693 |
| | 2011A, 6.000%, 11/15/41 (Pre-refunded 11/15/21) | | | |
| 725 | | Napoleon City School District, Henry County, Ohio, General Obligation Bonds, Facilities | 6/22 at 100.00 | Aa3 | 768,986 |
| | Construction & Improvement Series 2012, 5.000%, 12/01/36 (Pre-refunded 6/01/22) | | | |
| | Northeast Ohio Regional Sewer District, Wastewater Improvement Revenue Bonds, Refunding | | | |
| | & Improvement Series 2014: | | | |
| 2,950 | | 5.000%, 11/15/39 (Pre-refunded 11/15/24) | 11/24 at 100.00 | AA+ | 3,450,615 |
| 1,400 | | 5.000%, 11/15/44 (Pre-refunded 11/15/24) | 11/24 at 100.00 | AA+ | 1,637,580 |
| 2,000 | | Northeast Ohio Regional Sewer District, Wastewater Improvement Revenue Bonds, Series | 5/23 at 100.00 | AA+ | 2,207,140 |
| | 2013, 5.000%, 11/15/38 (Pre-refunded 5/15/23) | | | |
| 1,100 | | Ohio Higher Educational Facilities Commission, Hospital Revenue Bonds, Cleveland Clinic | 1/22 at 100.00 | Aa2 | 1,144,550 |
| | Health System Obligated Group, Series 2012A, 5.000%, 1/01/38 (Pre-refunded 1/01/22) | | | |
| 10,915 | | Ohio State, Turnpike Revenue Bonds, Ohio Turnpike and Infrastructure Commission | 2/23 at 100.00 | Aa3 | 11,924,310 |
| | Infrastructure Projects, Junior Lien, Current Interest Series 2013A-1, 5.000%, 2/15/48 | | | |
| | (Pre-refunded 2/15/23) | | | |
| 1,000 | | Ohio University at Athens, General Receipts Bonds, Series 2013, 5.000%, 12/01/39 | 12/22 at 100.00 | Aa3 | 1,084,410 |
| | (Pre-refunded 12/01/22) | | | |
| 5,000 | | South Euclid, Ohio, General Obligation Bonds, Real Estate Acquisition and Urban | 6/22 at 100.00 | Aa3 | 5,303,350 |
| | Redevelopment, Series 2012, 5.000%, 6/01/42 (Pre-refunded 6/01/22) | | | |
| 450 | | South-Western City School District, Franklin and Pickaway Counties, Ohio, General | 6/22 at 100.00 | AA | 477,302 |
| | Obligation Bonds, School Facilities Construction & Improvement Series 2012, 5.000%, 12/01/36 | | | |
| | (Pre-refunded 6/01/22) | | | |
| 120,235 | | Total U.S. Guaranteed | | | 132,709,411 |
| | Utilities – 15.9% (10.4% of Total Investments) | | | |
| 1,500 | | American Municipal Power Ohio Inc, Prairie State Energy Campus Project Revenue Bonds, | 2/24 at 100.00 | A1 | 1,669,005 |
| | Series 2015A, 5.000%, 2/15/42 | | | |
| 1,430 | | American Municipal Power, Inc, Ohio, Greenup Hydroelectric Project Revenue Bonds, | 2/26 at 100.00 | A1 | 1,684,383 |
| | Refunding Series 2016A, 5.000%, 2/15/41 | | | |
| 1,660 | | American Municipal Power, Inc, Ohio, Solar Electricity Prepayment Project Revenue Bonds, | 2/29 at 100.00 | A | 2,017,265 |
| | Green Bonds Series 2019A, 5.000%, 2/15/44 | | | |
| 1,815 | | Cleveland, Ohio, Public Power System Revenue Bonds, Series 2008B-1, 0.000%, 11/15/33 – | No Opt. Call | A– | 1,371,015 |
| | NPFG Insured | | | |
| | Cleveland, Ohio, Public Power System Revenue Bonds, Series 2008B-2: | | | |
| 2,000 | | 0.000%, 11/15/28 – NPFG Insured | No Opt. Call | A– | 1,766,440 |
| 6,895 | | 0.000%, 11/15/32 – NPFG Insured | No Opt. Call | A– | 5,385,478 |
| 2,155 | | 0.000%, 11/15/34 – NPFG Insured | No Opt. Call | A– | 1,581,253 |
39
| | |
| NUO | Nuveen Ohio Quality Municipal Income Fund Portfolio of Investments (continued) February 28, 2021 |
| | | | | | |
| Principal | | | Optional Call | | |
| Amount (000) | | Description (1) | Provisions (2) | Ratings (3) | Value |
| | Utilities (continued) | | | |
| $ 3,380 | | Fort Myers, Florida, Utility System Revenue Bonds, Refunding Series 2019A, 4.000%, | 10/28 at 100.00 | Aa3 | $ 3,863,576 |
| | 10/01/44 | | | |
| 1,000 | | Hamilton County, Ohio, Sewer System Revenue Bonds, Metropolitan Sewer District of | 12/30 at 100.00 | AA+ | 1,309,940 |
| | Greater Cincinnati, Refunding Series 2020A, 5.000%, 12/01/35 | | | |
| 2,000 | | Ohio Air Quality Development Authority, Ohio, Pollution Control Revenue Bonds, | No Opt. Call | N/R | 2,500 |
| | FirstEnergy Generation Project, Refunding Series 2006A, 3.750%, 12/01/23 (6) | | | |
| 950 | | Ohio Municipal Electric Generation Agency, Beneficial Interest Certificates, Belleville | No Opt. Call | A1 | 826,519 |
| | Hydroelectric Project – Joint Venture 5, Series 2001, 0.000%, 2/15/29 – NPFG Insured | | | |
| 3,225 | | Ohio Water Development Authority, Revenue Bonds, Fresh Water Development, Series 2019, | 12/29 at 100.00 | AAA | 4,061,113 |
| | 5.000%, 6/01/44 | | | |
| 4,500 | | Ohio Water Development Authority, Water Pollution Control Loan Fund Revenue Bonds, | 6/30 at 100.00 | AAA | 5,692,500 |
| | Series 2020A, 5.000%, 12/01/50 | | | |
| 2,290 | | Saint Charles County Public Water Supply District 2, Missouri, Certificates of | 12/25 at 100.00 | AA+ | 2,507,367 |
| | Participation, Missouri Project Series 2019, 4.000%, 12/01/41 | | | |
| | Toledo, Ohio, Sewerage System Revenue Bonds, Refunding Series 2013: | | | |
| 820 | | 5.000%, 11/15/25 | 11/23 at 100.00 | Aa3 | 918,876 |
| 605 | | 5.000%, 11/15/26 | 11/23 at 100.00 | Aa3 | 678,991 |
| 1,075 | | 5.000%, 11/15/27 | 11/23 at 100.00 | Aa3 | 1,203,075 |
| 695 | | 5.000%, 11/15/28 | 11/23 at 100.00 | Aa3 | 775,808 |
| 10,000 | | Toledo, Ohio, Water System Revenue Bonds, Refunding & Improvement Series 2016, 5.000%, | 11/26 at 100.00 | AA– | 11,989,900 |
| | 11/15/41 (UB) (4) | | | |
| 1,000 | | Warm Springs Reservation Confederated Tribes, Oregon, Hydroelectric Revenue Bonds, | 5/29 at 100.00 | A3 | 1,171,290 |
| | Tribal Economic Development Bond Pelton Round Butte Project, Taxable Refunding Green Series | | | |
| | 2019B, 5.000%, 11/01/39, 144A | | | |
| 48,995 | | Total Utilities | | | 50,476,294 |
| $ 461,705 | | Total Municipal Bonds (cost $442,399,855) | | | 482,015,268 |
40
| | | | |
| Shares | | Description (1) | Value |
| | COMMON STOCKS – 0.6% (0.4% of Total Investments) | |
| | Electric Utilities – 0.6% (0.4% of Total Investments) | |
| 64,677 | | Energy Harbor Corp (7), (8), (9) | $ 1,819,040 |
| | Total Common Stocks (cost $1,843,715) | 1,819,040 |
| | Total Long-Term Investments (cost $444,243,570) | 483,834,308 |
| | Floating Rate Obligations – (6.3)% | (20,000,000) |
| | Variable Rate Demand Preferred Shares, net of deferred offering costs – (46.5)% (10) | (147,779,178) |
| | Other Assets Less Liabilities – 0.7% | 2,080,289 |
| | Net Asset Applicable to Common Shares – 100% | $ 318,135,419 |
(1) All percentages shown in the Portfolio of Investments are based on net assets applicable to common shares unless otherwise noted.
(2) Optional Call Provisions: Dates (month and year) and prices of the earliest optional call or redemption. There may be other call provisions at varying prices at later dates. Certain mortgage-backed securities may be subject to periodic principal paydowns. Optional Call Provisions are not covered by the report of independent registered public accounting firm.
(3) For financial reporting purposes, the ratings disclosed are the highest of Standard & Poor’s Group (“Standard & Poor’s”), Moody’s Investors Service, Inc. (“Moody’s”) or Fitch, Inc. (“Fitch”) rating. This treatment of split-rated securities may differ from that used for other purposes, such as for Fund investment policies. Ratings below BBB by Standard & Poor’s, Baa by Moody’s or BBB by Fitch are considered to be below investment grade. Holdings designated N/R are not rated by any of these national rating agencies. Ratings are not covered by the report of independent registered public accounting firm.
(4) Investment, or portion of investment, has been pledged to collateralize the net payment obligations for investments in inverse floating rate transactions.
(5) Backed by an escrow or trust containing sufficient U.S. Government or U.S. Government agency securities, which ensure the timely payment of principal and interest.
(6) Defaulted security. A security whose issuer has failed to fully pay principal and/or interest when due, or is under the protection of bankruptcy.
(7) Common Stock received as part of the bankruptcy settlement for Ohio Air Quality Development Authority, Ohio, Pollution Control Revenue Bonds, FirstEnergy Generation Project, Refunding Series 2006A, 3.750%, 12/01/23.
(8) For fair value measurement disclosure purposes, investment classified as Level 2. See Notes to Financial Statements, Note 3 - Investment Valuation and Fair Value Measurements for more information.
(9) Non-income producing; issuer has not declared an ex-dividend date within the past twelve months.
(10) Variable Rate Demand Preferred Shares, net of deferred offering costs as a percentage of Total Investments is 30.5%.
144A Investment is exempt from registration under Rule 144A of the Securities Act of 1933, as amended. These investments may only be resold in transactions exempt from registration, which are normally those transactions with qualified institutional buyers.
AMT Alternative Minimum Tax
IF Inverse floating rate security issued by a tender option bond (“TOB”) trust, the interest rate on which varies inversely with the Securities Industry Financial Markets Association (SIFMA) short-term rate, which resets weekly, or a similar short-term rate, and is reduced by the expenses related to the TOB trust.
UB Underlying bond of an inverse floating rate trust reflected as a financing transaction. See Notes to Financial Statements, Note 4 – Portfolio Securities and Investments in Derivatives for more information.
WI/DD Purchased on a when-issued or delayed delivery basis.
See accompanying notes to financial statements.
41
| | |
| NXJ | Nuveen New Jersey Quality Municipal Income Fund Portfolio of Investments February 28, 2021 |
| | | | | | |
| Principal | | | Optional Call | | |
| Amount (000) | | Description (1) | Provisions (2) | Ratings (3) | Value |
| | LONG-TERM INVESTMENTS – 149.6% (100.0% of Total Investments) | | | |
|
| | MUNICIPAL BONDS – 149.6% (100.0% of Total Investments) | | | |
|
| | Consumer Discretionary – 0.4% (0.3% of Total Investments) | | | |
| | Middlesex County Improvement Authority, New Jersey, Senior Revenue Bonds, Heldrich | | | |
| | Center Hotel/Conference Center Project, Series 2005A: | | | |
| $ 2,460 | | 5.000%, 1/01/32 | 3/21 at 100.00 | Caa3 | $ 1,688,520 |
| 1,485 | | 5.125%, 1/01/37 | 3/21 at 100.00 | Caa3 | 957,127 |
| 3,945 | | Total Consumer Discretionary | | | 2,645,647 |
| | Consumer Staples – 4.9% (3.3% of Total Investments) | | | |
| | Tobacco Settlement Financing Corporation, New Jersey, Tobacco Settlement Asset-Backed | | | |
| | Bonds, Series 2018A: | | | |
| 8,695 | | 4.000%, 6/01/37 | 6/28 at 100.00 | A– | 9,793,787 |
| 1,365 | | 5.000%, 6/01/46 | 6/28 at 100.00 | BBB+ | 1,591,836 |
| 11,680 | | 5.250%, 6/01/46 | 6/28 at 100.00 | BBB+ | 13,898,849 |
| 6,930 | | Tobacco Settlement Financing Corporation, New Jersey, Tobacco Settlement Asset-Backed | 6/28 at 100.00 | BB+ | 8,007,061 |
| | Bonds, Series 2018B, 5.000%, 6/01/46 | | | |
| 28,670 | | Total Consumer Staples | | | 33,291,533 |
| | Education and Civic Organizations – 17.2% (11.5% of Total Investments) | | | |
| 1,760 | | Camden County Improvement Authority, New Jersey, Lease Revenue Bonds, Rowan University | 12/23 at 100.00 | A | 1,928,379 |
| | School of Osteopathic Medicine Project, Refunding Series 2013A, 5.000%, 12/01/32 | | | |
| 1,000 | | New Jersey Economic Development Authority, Charter School Revenue Bonds, Foundation | 1/28 at 100.00 | BBB– | 1,128,290 |
| | Academy Charter School, Series 2018A, 5.000%, 7/01/50 | | | |
| 175 | | New Jersey Economic Development Authority, Charter School Revenue Bonds, Teaneck | 9/27 at 100.00 | BB | 184,324 |
| | Community Charter School, Series 2017A, 5.125%, 9/01/52, 144A | | | |
| 2,025 | | New Jersey Economic Development Authority, Revenue Bonds, The Seeing Eye Inc, Refunding | No Opt. Call | A | 2,337,761 |
| | Series 2015, 5.000%, 3/01/25 | | | |
| | New Jersey Economic Development Authority, Revenue Bonds, The Seeing Eye Inc, Refunding | | | |
| | Series 2017: | | | |
| 500 | | 5.000%, 6/01/32 | 12/27 at 100.00 | A | 587,160 |
| 820 | | 3.000%, 6/01/32 | 12/27 at 100.00 | A | 834,817 |
| 1,100 | | New Jersey Educational Facilities Authority, Revenue Bonds, Kean University, Refunding | 7/25 at 100.00 | AA | 1,183,105 |
| | Series 2015H, 4.000%, 7/01/39 – AGM Insured | | | |
| 5,950 | | New Jersey Educational Facilities Authority, Revenue Bonds, Montclair State University, | 7/24 at 100.00 | A+ | 6,611,878 |
| | Series 2014A, 5.000%, 7/01/44 | | | |
| | New Jersey Educational Facilities Authority, Revenue Bonds, Montclair State University, | | | |
| | Series 2015D: | | | |
| 2,395 | | 5.000%, 7/01/31 | 7/25 at 100.00 | A+ | 2,762,297 |
| 1,600 | | 5.000%, 7/01/33 | 7/25 at 100.00 | A+ | 1,836,144 |
| 1,000 | | 5.000%, 7/01/34 | 7/25 at 100.00 | A+ | 1,145,350 |
| 4,335 | | New Jersey Educational Facilities Authority, Revenue Bonds, Princeton University, Tender | 7/21 at 100.00 | AAA | 4,523,919 |
| | Option Bond Trust 2015-XF0099, 13.459%, 7/01/39, 144A (IF) | | | |
| 4,000 | | New Jersey Educational Facilities Authority, Revenue Bonds, Princeton University, Tender | 7/24 at 100.00 | AAA | 5,384,640 |
| | Option Bond Trust 2015-XF0149, 13.707%, 7/01/44, 144A (IF) (4) | | | |
| | New Jersey Educational Facilities Authority, Revenue Bonds, Ramapo College, Refunding | | | |
| | Series 2012B: | | | |
| 550 | | 5.000%, 7/01/37 | 7/22 at 100.00 | A | 577,154 |
| 1,050 | | 5.000%, 7/01/42 | 7/22 at 100.00 | A | 1,099,045 |
42
| | | | | | |
| Principal | | | Optional Call | | |
| Amount (000) | | Description (1) | Provisions (2) | Ratings (3) | Value |
| | Education and Civic Organizations (continued) | | | |
| | New Jersey Educational Facilities Authority, Revenue Bonds, Rider University, Series 2012A: | | | |
| $ 1,150 | | 5.000%, 7/01/32 | 7/21 at 100.00 | BB+ | $ 1,154,082 |
| 740 | | 5.000%, 7/01/37 | 7/21 at 100.00 | BB+ | 741,968 |
| | New Jersey Educational Facilities Authority, Revenue Bonds, Rider University, Series 2017F: | | | |
| 330 | | 3.750%, 7/01/37 | 7/27 at 100.00 | BB+ | 306,643 |
| 3,830 | | 4.000%, 7/01/42 | 7/27 at 100.00 | BB+ | 3,578,943 |
| 4,205 | | 5.000%, 7/01/47 | 7/27 at 100.00 | BB+ | 4,328,795 |
| 1,200 | | New Jersey Educational Facilities Authority, Revenue Bonds, Seton Hall University, | 7/25 at 100.00 | BBB+ | 1,330,740 |
| | Refunding Series 2015C, 5.000%, 7/01/35 | | | |
| 775 | | New Jersey Educational Facilities Authority, Revenue Bonds, Seton Hall University, | 7/27 at 100.00 | BBB+ | 796,778 |
| | Refunding Series 2017D, 3.500%, 7/01/44 | | | |
| | New Jersey Educational Facilities Authority, Revenue Bonds, Seton Hall University, | | | |
| | Series 2013D: | | | |
| 685 | | 5.000%, 7/01/38 | 7/23 at 100.00 | BBB+ | 726,936 |
| 1,935 | | 5.000%, 7/01/43 | 7/23 at 100.00 | BBB+ | 2,049,088 |
| 1,970 | | New Jersey Educational Facilities Authority, Revenue Bonds, Seton Hall University, | 7/26 at 100.00 | BBB+ | 1,949,729 |
| | Series 2016C, 3.000%, 7/01/46 | | | |
| 860 | | New Jersey Educational Facilities Authority, Revenue Bonds, Stevens Institute of | 7/30 at 100.00 | BBB+ | 938,888 |
| | Technology Issue, Green Series 2020A, 4.000%, 7/01/50 | | | |
| | New Jersey Educational Facilities Authority, Revenue Bonds, Stevens Institute of | | | |
| | Technology, Series 2017A: | | | |
| 1,060 | | 5.000%, 7/01/37 | 7/27 at 100.00 | BBB+ | 1,229,568 |
| 2,500 | | 5.000%, 7/01/42 | 7/27 at 100.00 | BBB+ | 2,868,675 |
| 3,160 | | 5.000%, 7/01/47 | 7/27 at 100.00 | BBB+ | 3,582,429 |
| 1,050 | | 4.000%, 7/01/47 | 7/27 at 100.00 | BBB+ | 1,119,531 |
| 975 | | New Jersey Educational Facilities Authority, Revenue Bonds, The College of Saint | 7/26 at 100.00 | BB | 1,014,215 |
| | Elizabeth, Series 2016D, 5.000%, 7/01/46 | | | |
| 4,560 | | New Jersey Educational Facilities Authority, Revenue Bonds, William Paterson University, | 7/25 at 100.00 | A3 | 5,117,551 |
| | Series 2015C, 5.000%, 7/01/40 | | | |
| | New Jersey Educational Facilities Authority, Revenue Bonds, William Paterson University, | | | |
| | Series 2017B: | | | |
| 2,000 | | 5.000%, 7/01/42 – AGM Insured | 7/27 at 100.00 | AA | 2,325,140 |
| 2,420 | | 5.000%, 7/01/47 – AGM Insured | 7/27 at 100.00 | AA | 2,793,382 |
| | New Jersey Higher Education Assistance Authority, Senior Student Loan Revenue Bonds, | | | |
| | Refunding Series 2018A: | | | |
| 2,500 | | 3.750%, 12/01/30 (AMT) | 6/28 at 100.00 | Aaa | 2,684,975 |
| 2,560 | | 4.000%, 12/01/32 (AMT) | 6/28 at 100.00 | Aaa | 2,762,752 |
| 2,000 | | 4.000%, 12/01/33 (AMT) | 6/28 at 100.00 | Aaa | 2,150,500 |
| 2,135 | | 4.000%, 12/01/35 (AMT) | 6/28 at 100.00 | Aaa | 2,283,148 |
| | New Jersey Higher Education Assistance Authority, Student Loan Revenue Bonds, Senior | | | |
| | Lien Series 2016-1A: | | | |
| 4,765 | | 3.500%, 12/01/32 (AMT) | 12/25 at 100.00 | Aaa | 4,936,874 |
| 1,105 | | 4.000%, 12/01/39 (AMT) | 12/25 at 100.00 | Aaa | 1,146,835 |
| 2,030 | | New Jersey Higher Education Assistance Authority, Student Loan Revenue Bonds, Senior | 6/28 at 100.00 | Aa1 | 2,060,450 |
| | Series 2019B, 3.250%, 12/01/39 (AMT) | | | |
| 765 | | New Jersey Higher Education Assistance Authority, Student Loan Revenue Bonds, Senior | 12/28 at 100.00 | Aa1 | 786,871 |
| | Series 2020B, 3.500%, 12/01/39 (AMT) | | | |
| 960 | | New Jersey Higher Education Assistance Authority, Student Loan Revenue Bonds, Series | 3/21 at 100.00 | Aaa | 960,662 |
| | 2010-2, 5.000%, 12/01/30 | | | |
| 615 | | New Jersey Higher Education Assistance Authority, Student Loan Revenue Bonds, Series | 12/21 at 100.00 | Aaa | 637,337 |
| | 2011-1, 5.750%, 12/01/27 (AMT) | | | |
| | New Jersey Higher Education Assistance Authority, Student Loan Revenue Bonds, Series 2012-1A: | | | |
| 1,445 | | 4.250%, 12/01/25 (AMT) | 12/22 at 100.00 | Aaa | 1,523,276 |
| 475 | | 4.375%, 12/01/26 (AMT) | 12/22 at 100.00 | Aaa | 500,769 |
43
| | |
| NXJ | Nuveen New Jersey Quality Municipal Income Fund Portfolio of Investments (continued) February 28, 2021 |
| | | | | |
| Principal | | Optional Call | | |
| Amount (000) | Description (1) | Provisions (2) | Ratings (3) | Value |
| Education and Civic Organizations (continued) | | | |
| $ 500 | New Jersey Higher Education Assistance Authority, Student Loan Revenue Bonds, Series | 12/22 at 100.00 | Aaa | $ 530,645 |
| 2012-1B, 5.750%, 12/01/39 (AMT) | | | |
| New Jersey Higher Education Assistance Authority, Student Loan Revenue Bonds, Series 2013-1A: | | | |
| 139 | 3.500%, 12/01/23 (AMT) | 12/22 at 100.00 | Aaa | 144,689 |
| 465 | 3.750%, 12/01/26 (AMT) | 12/22 at 100.00 | Aaa | 483,163 |
| New Jersey Higher Education Assistance Authority, Student Loan Revenue Bonds, Series 2015-1A: | | | |
| 3,630 | 4.000%, 12/01/28 (AMT) | 12/24 at 100.00 | Aaa | 3,892,993 |
| 2,010 | 4.000%, 12/01/30 (AMT) | 12/24 at 100.00 | Aaa | 2,140,007 |
| 7,070 | New Jersey Higher Education Assistance Authority, Student Loan Revenue Bonds, | 12/26 at 100.00 | Aaa | 7,429,015 |
| Subordinate Series 2017-C, 4.250%, 12/01/47 (AMT) | | | |
| 4,795 | New Jersey Higher Education Assistance Authority, Student Loan Revenue Bonds, | 6/28 at 100.00 | A2 | 4,876,179 |
| Subordinate Series 2019C, 3.625%, 12/01/49 (AMT) | | | |
| New Jersey Higher Education Assistance Authority, Student Loan Revenue Bonds, Tender | | | |
| Option Bond Trust 2015-XF0151: | | | |
| 436 | 11.901%, 12/01/23 (AMT), 144A (IF) | 12/22 at 100.00 | Aaa | 506,641 |
| 390 | 12.118%, 12/01/24 (AMT), 144A (IF) | 12/22 at 100.00 | Aaa | 450,189 |
| 265 | 12.461%, 12/01/25 (AMT), 144A (IF) | 12/22 at 100.00 | Aaa | 306,104 |
| 80 | 12.557%, 12/01/26 (AMT), 144A (IF) | 12/22 at 100.00 | Aaa | 91,874 |
| 1,165 | 13.875%, 12/01/27 (AMT), 144A (IF) | 12/23 at 100.00 | Aaa | 1,461,737 |
| 2,300 | New Jersey Institute of Technology, New Jersey, General Obligation Bonds, Series 2015A, | 7/25 at 100.00 | A1 | 2,572,389 |
| 5.000%, 7/01/45 | | | |
| 108,265 | Total Education and Civic Organizations | | | 117,397,418 |
| Financials – 0.5% (0.4% of Total Investments) | | | |
| New Jersey Economic Development Authority, Revenue Refunding Bonds, Kapkowski Road | | | |
| Landfill Project, Series 2002: | | | |
| 2,000 | 5.750%, 10/01/21 | No Opt. Call | Ba2 | 2,017,840 |
| 1,500 | 6.500%, 4/01/28 | No Opt. Call | Ba2 | 1,644,945 |
| 3,500 | Total Financials | | | 3,662,785 |
| Health Care – 21.0% (14.0% of Total Investments) | | | |
| Camden County Improvement Authority, New Jersey, Health Care Redevelopment Revenue | | | |
| Bonds, Cooper Health System Obligated Group Issue, Refunding Series 2014A: | | | |
| 175 | 5.000%, 2/15/25 | 2/24 at 100.00 | BBB+ | 195,806 |
| 220 | 5.000%, 2/15/26 | 2/24 at 100.00 | BBB+ | 245,326 |
| 1,320 | 5.000%, 2/15/27 | 2/24 at 100.00 | BBB+ | 1,467,035 |
| 1,385 | 5.000%, 2/15/28 | 2/24 at 100.00 | BBB+ | 1,533,403 |
| 1,385 | 5.000%, 2/15/29 | 2/24 at 100.00 | BBB+ | 1,526,242 |
| 2,500 | 5.000%, 2/15/32 | 2/24 at 100.00 | BBB+ | 2,727,000 |
| 3,040 | 5.000%, 2/15/33 | 2/24 at 100.00 | BBB+ | 3,295,846 |
| 1,000 | 5.000%, 2/15/34 | 2/24 at 100.00 | BBB+ | 1,082,450 |
| 1,950 | 5.000%, 2/15/35 | 2/24 at 100.00 | BBB+ | 2,108,672 |
| 6,100 | Camden County Improvement Authority, New Jersey, Health Care Redevelopment Revenue | 2/23 at 100.00 | BBB+ | 6,489,973 |
| Bonds, Cooper Health System Obligated Group Issue, Series 2013A, 5.750%, 2/15/42 | | | |
| 225 | New Jersey Health Care Facilities Finance Authority, Revenue Bonds, AHS Hospital | 3/21 at 100.00 | AA– | 225,653 |
| Corporation, Series 2008A, 5.000%, 7/01/27 | | | |
| New Jersey Health Care Facilities Financing Authority, New Jersey, Revenue Bonds, Saint | | | |
| Peters University Hospital, Refunding Series 2011: | | | |
| 2,000 | 6.000%, 7/01/26 | 7/21 at 100.00 | BB+ | 2,025,500 |
| 3,425 | 6.250%, 7/01/35 | 7/21 at 100.00 | BB+ | 3,468,429 |
| 3,550 | New Jersey Health Care Facilities Financing Authority, New Jersey, Revenue Bonds, Saint | 3/21 at 100.00 | BB+ | 3,560,189 |
| Peters University Hospital, Series 2007, 5.750%, 7/01/37 | | | |
| 1,145 | New Jersey Health Care Facilities Financing Authority, Revenue and Refunding Bonds, | 7/22 at 100.00 | AA– | 1,216,105 |
| Barnabas Health, Series 2012A, 5.000%, 7/01/24 | | | |
| 2,525 | New Jersey Health Care Facilities Financing Authority, Revenue Bonds, AHS Hospital | 1/27 at 100.00 | AA– | 2,782,803 |
| Corporation, Refunding Series 2016, 4.000%, 7/01/41 | | | |
44
| | | | | | |
| Principal | | | Optional Call | | |
| Amount (000) | | Description (1) | Provisions (2) | Ratings (3) | Value |
| | Health Care (continued) | | | |
| $ 11,000 | | New Jersey Health Care Facilities Financing Authority, Revenue Bonds, Barnabas Health, | 7/24 at 100.00 | AA– | $ 12,357,180 |
| | Refunding Series 2014A, 5.000%, 7/01/44 | | | |
| | New Jersey Health Care Facilities Financing Authority, Revenue Bonds, Hackensack | | | |
| | Meridian Health Obligated Group, Refunding Series 2017A: | | | |
| 700 | | 5.000%, 7/01/28 | 7/27 at 100.00 | AA– | 866,278 |
| 4,140 | | 5.000%, 7/01/57 | 7/27 at 100.00 | AA– | 4,774,496 |
| 1,310 | | New Jersey Health Care Facilities Financing Authority, Revenue Bonds, Hunterdon Medical | 7/24 at 100.00 | A+ | 1,361,627 |
| | Center, Refunding Series 2014A, 4.000%, 7/01/45 | | | |
| 12,010 | | New Jersey Health Care Facilities Financing Authority, Revenue Bonds, Inspira Health | 7/27 at 100.00 | AA– | 14,133,008 |
| | Obligated Group Issue, Series 2017A, 5.000%, 7/01/42 (UB) (4) | | | |
| | New Jersey Health Care Facilities Financing Authority, Revenue Bonds, Meridian Health | | | |
| | System Obligated Group, Refunding Series 2011: | | | |
| 3,000 | | 5.000%, 7/01/25 | 7/22 at 100.00 | AA– | 3,178,440 |
| 3,000 | | 5.000%, 7/01/26 | 7/22 at 100.00 | AA– | 3,173,160 |
| 2,500 | | 5.000%, 7/01/27 | 7/22 at 100.00 | AA– | 2,641,650 |
| 1,450 | | New Jersey Health Care Facilities Financing Authority, Revenue Bonds, Meridian Health | 7/23 at 100.00 | AA– | 1,566,827 |
| | System Obligated Group, Refunding Series 2013A, 5.000%, 7/01/32 | | | |
| | New Jersey Health Care Facilities Financing Authority, Revenue Bonds, Princeton | | | |
| | HealthCare System, Series 2016A: | | | |
| 830 | | 5.000%, 7/01/32 | 7/26 at 100.00 | AA | 1,000,001 |
| 1,055 | | 5.000%, 7/01/33 | 7/26 at 100.00 | AA | 1,268,690 |
| 1,370 | | 5.000%, 7/01/34 | 7/26 at 100.00 | AA | 1,642,808 |
| | New Jersey Health Care Facilities Financing Authority, Revenue Bonds, Robert Wood | | | |
| | Johnson University Hospital Issue, Series 2014A: | | | |
| 4,235 | | 5.000%, 7/01/39 | 7/24 at 100.00 | AA– | 4,770,304 |
| 5,955 | | 5.000%, 7/01/43 | 7/24 at 100.00 | AA– | 6,690,978 |
| 3,945 | | New Jersey Health Care Facilities Financing Authority, Revenue Bonds, Robert Wood | 7/23 at 100.00 | AA– | 4,344,905 |
| | Johnson University Hospital, Series 2013A, 5.500%, 7/01/43 | | | |
| 4,320 | | New Jersey Health Care Facilities Financing Authority, Revenue Bonds, RWJ Barnabas | 7/26 at 100.00 | AA– | 5,112,936 |
| | Health Obligated Group, Refunding Series 2016A, 5.000%, 7/01/43 | | | |
| | New Jersey Health Care Facilities Financing Authority, Revenue Bonds, Saint Joseph’s | | | |
| | Healthcare System Obligated Group Issue, Refunding Series 2016: | | | |
| 1,600 | | 3.000%, 7/01/32 | 7/26 at 100.00 | BBB– | 1,683,824 |
| 1,135 | | 4.000%, 7/01/34 | 7/26 at 100.00 | BBB– | 1,263,255 |
| 1,600 | | 5.000%, 7/01/35 | 7/26 at 100.00 | BBB– | 1,871,600 |
| 2,700 | | 5.000%, 7/01/36 | 7/26 at 100.00 | BBB– | 3,150,792 |
| 3,095 | | 5.000%, 7/01/41 | 7/26 at 100.00 | BBB– | 3,586,238 |
| 5,600 | | 4.000%, 7/01/48 | 7/26 at 100.00 | BBB– | 6,116,488 |
| 2,345 | | New Jersey Health Care Facilities Financing Authority, Revenue Bonds, Saint Luke’s | 8/23 at 100.00 | A– | 2,450,314 |
| | Warren Hospital Obligated Group, Series 2013, 4.000%, 8/15/37 | | | |
| | New Jersey Health Care Facilities Financing Authority, Revenue Bonds, University | | | |
| | Hospital Issue, Refunding Series 2015A: | | | |
| 5,055 | | 4.125%, 7/01/38 – AGM Insured | 7/25 at 100.00 | AA | 5,442,718 |
| 3,910 | | 5.000%, 7/01/46 – AGM Insured | 7/25 at 100.00 | AA | 4,383,540 |
| | New Jersey Health Care Facilities Financing Authority, Revenue Bonds, Valley Health | | | |
| | System Obligated Group, Series 2019: | | | |
| 2,055 | | 4.000%, 7/01/44 | 7/29 at 100.00 | A+ | 2,328,623 |
| 7,840 | | 3.000%, 7/01/49 | 7/29 at 100.00 | A+ | 7,977,278 |
| 129,700 | | Total Health Care | | | 143,088,390 |
| | Housing/Multifamily – 3.9% (2.6% of Total Investments) | | | |
| 1,845 | | New Jersey Economic Development Authority, Revenue Bonds, Provident Group – Kean | 1/27 at 100.00 | B | 1,865,313 |
| | Properties LLC – Kean University Student Housing Project, Series 2017A, 5.000%, 7/01/47 | | | |
| 1,900 | | New Jersey Economic Development Authority, Revenue Bonds, Provident Group – Rowan | 1/25 at 100.00 | Ba3 | 1,953,162 |
| | Properties LLC – Rowan University Student Housing Project, Series 2015A, 5.000%, 1/01/48 | | | |
45
| | |
| NXJ | Nuveen New Jersey Quality Municipal Income Fund Portfolio of Investments (continued) February 28, 2021 |
| | | | | | |
| Principal | | | Optional Call | | |
| Amount (000) | | Description (1) | Provisions (2) | Ratings (3) | Value |
| | Housing/Multifamily (continued) | | | |
| $ 6,575 | | New Jersey Economic Development Authority, Revenue Bonds, West Campus Housing LLC – New | 7/25 at 100.00 | BB– | $ 6,620,302 |
| | Jersey City University Student Housing Project, Series 2015, 5.000%, 7/01/47 | | | |
| | New Jersey Housing and Mortgage Finance Agency, Multifamily Housing Revenue Bonds, | | | |
| | Series 2013-2: | | | |
| 2,165 | | 4.350%, 11/01/33 (AMT) | 11/22 at 100.00 | AA | 2,241,360 |
| 1,235 | | 4.600%, 11/01/38 (AMT) | 11/22 at 100.00 | AA | 1,277,595 |
| 1,235 | | 4.750%, 11/01/46 (AMT) | 11/22 at 100.00 | AA | 1,275,175 |
| 4,320 | | New Jersey Housing and Mortgage Finance Agency, Multifamily Revenue Bonds, Series 2015A, | 11/24 at 100.00 | AA– | 4,525,675 |
| | 4.000%, 11/01/45 | | | |
| | New Jersey Housing and Mortgage Finance Agency, Multifamily Revenue Bonds, Series 2017D: | | | |
| 1,125 | | 3.900%, 11/01/32 (AMT) | 5/26 at 100.00 | AA– | 1,223,584 |
| 1,750 | | 4.250%, 11/01/37 (AMT) | 5/26 at 100.00 | AA– | 1,902,792 |
| | New Jersey Housing and Mortgage Finance Agency, Multifamily Revenue Bonds, Series 2020A: | | | |
| 1,150 | | 2.300%, 11/01/40 | 11/29 at 100.00 | AA– | 1,127,011 |
| 500 | | 2.450%, 11/01/45 | 11/29 at 100.00 | AA– | 485,725 |
| 1,000 | | 2.550%, 11/01/50 | 11/29 at 100.00 | AA– | 976,330 |
| 1,000 | | 2.625%, 11/01/56 | 11/29 at 100.00 | AA– | 978,980 |
| 25,800 | | Total Housing/Multifamily | | | 26,453,004 |
| | Housing/Single Family – 8.9% (5.9% of Total Investments) | | | |
| | New Jersey Housing & Mortgage Finance Agency, Single Family Home Mortgage Revenue Bonds, | | | |
| | Series 2011A: | | | |
| 7,130 | | 4.450%, 10/01/25 | 4/21 at 100.00 | Aa2 | 7,154,884 |
| 5,445 | | 4.650%, 10/01/29 | 4/21 at 100.00 | Aa2 | 5,464,874 |
| | New Jersey Housing and Mortgage Finance Agency, Single Family Housing Revenue Bonds, | | | |
| | Series 2018A: | | | |
| 6,360 | | 3.600%, 4/01/33 | 10/27 at 100.00 | AA | 6,908,741 |
| 3,950 | | 3.750%, 10/01/35 | 10/27 at 100.00 | AA | 4,322,761 |
| 3,405 | | New Jersey Housing and Mortgage Finance Agency, Single Family Housing Revenue Bonds, | 10/27 at 100.00 | AA | 3,692,450 |
| | Series 2018B, 3.800%, 10/01/32 (AMT) | | | |
| | New Jersey Housing and Mortgage Finance Agency, Single Family Housing Revenue Bonds, | | | |
| | Series 2019C: | | | |
| 5,260 | | 3.500%, 10/01/34 (UB) (4) | 4/28 at 100.00 | AA | 5,685,324 |
| 5,255 | | 3.850%, 10/01/39 (UB) (4) | 4/28 at 100.00 | AA | 5,705,669 |
| 3,590 | | 3.950%, 10/01/44 (UB) (4) | 4/28 at 100.00 | AA | 3,863,091 |
| | New Jersey Housing and Mortgage Finance Agency, Single Family Housing Revenue Bonds, | | | |
| | Series 2020E: | | | |
| 6,000 | | 2.050%, 10/01/35 | 4/29 at 100.00 | AA | 5,983,800 |
| 7,790 | | 2.250%, 10/01/40 | 4/29 at 100.00 | AA | 7,698,312 |
| 4,000 | | 2.400%, 10/01/45 | 4/29 at 100.00 | AA | 3,922,280 |
| 58,185 | | Total Housing/Single Family | | | 60,402,186 |
| | Long-Term Care – 1.8% (1.2% of Total Investments) | | | |
| 1,110 | | New Jersey Economic Development Authority, Fixed Rate Revenue Bonds, Lions Gate Project, | 1/24 at 100.00 | N/R | 1,124,752 |
| | Series 2014, 5.250%, 1/01/44 | | | |
| 5,000 | | New Jersey Economic Development Authority, Revenue Bonds, United Methodist Homes of New | 7/23 at 100.00 | BBB– | 5,217,550 |
| | Jersey Obligated Group Issue, Refunding Series 2013, 5.000%, 7/01/34 | | | |
| 1,410 | | New Jersey Economic Development Authority, Revenue Bonds, United Methodist Homes of New | 7/24 at 100.00 | BBB– | 1,522,871 |
| | Jersey Obligated Group Issue, Refunding Series 2014A, 5.000%, 7/01/29 | | | |
| 2,755 | | New Jersey Economic Development Authority, Revenue Bonds, White Horse HMT Urban Renewal | 1/28 at 102.00 | N/R | 2,727,009 |
| | LLC Project, Series 2020, 5.000%, 1/01/40, 144A | | | |
| 1,450 | | New Jersey Health Care Facilities Financing Authority, Revenue Bonds, Village Drive | 10/26 at 102.00 | N/R | 1,370,279 |
| | Healthcare Urban Renewal LLC, Series 2018, 5.750%, 10/01/38, 144A | | | |
| 11,725 | | Total Long-Term Care | | | 11,962,461 |
46
| | | | | | |
| Principal | | | Optional Call | | |
| Amount (000) | | Description (1) | Provisions (2) | Ratings (3) | Value |
| | Tax Obligation/General – 11.8% (7.9% of Total Investments) | | | |
| $ 5,000 | | Cherry Hill Township, Camden County, New Jersey, General Obligation Bonds, Bond | No Opt. Call | N/R | $ 5,058,600 |
| | Anticipation Note Series 2020B, 2.000%, 10/27/21 | | | |
| 440 | | Cumberland County Improvement Authority, New Jersey, County General Obligation Revenue | 1/28 at 100.00 | AA | 481,056 |
| | Bonds, Technical High School Project, Series 2018, 3.125%, 1/15/32 – BAM Insured | | | |
| 2,920 | | Cumberland County Improvement Authority, New Jersey, Guaranteed Lease Revenue Bonds, | 10/28 at 100.00 | AA | 3,300,184 |
| | County Correctional Facility Project, Series 2018, 4.000%, 10/01/43 – BAM Insured | | | |
| 4,150 | | Essex County Improvement Authority, New Jersey, Project Consolidation Revenue Bonds, | No Opt. Call | Aaa | 4,528,936 |
| | Refunding Series 2007, 5.250%, 12/15/22 – AMBAC Insured | | | |
| 680 | | Hamilton Township, Mercer County Board of Education, New Jersey, General Obligation | 12/27 at 100.00 | AA | 721,922 |
| | Bonds, Series 2017, 3.250%, 12/15/38 | | | |
| | Harrison, New Jersey, General Obligation Bonds, Parking Utility Series 2018: | | | |
| 1,340 | | 3.125%, 3/01/31 – BAM Insured | 3/28 at 100.00 | AA | 1,449,009 |
| 1,110 | | 3.250%, 3/01/32 – BAM Insured | 3/28 at 100.00 | AA | 1,202,474 |
| 1,255 | | 3.500%, 3/01/36 – BAM Insured | 3/28 at 100.00 | AA | 1,360,081 |
| | Hudson County Improvement Authority, New Jersey, County Guaranteed Governmental Loan | | | |
| | Revenue Bonds, Guttenberg General Obligation Bond Project, Series 2018: | | | |
| 375 | | 3.250%, 8/01/34 | 8/25 at 100.00 | AA | 395,164 |
| 1,040 | | 5.000%, 8/01/42 | 8/25 at 100.00 | AA | 1,207,617 |
| 2,000 | | Hudson County Improvement Authority, New Jersey, County Secured Lease Revenue Bonds, | 10/30 at 100.00 | AA | 2,286,520 |
| | Hudson County Courthouse Project, Refunding Series 2020, 4.000%, 10/01/51 | | | |
| | Hudson County Improvement Authority, New Jersey, County Secured Lease Revenue Bonds, | | | |
| | Hudson County Vocational Technical Schools Project, Series 2016: | | | |
| 10,310 | | 5.000%, 5/01/46 | 5/26 at 100.00 | AA | 12,200,235 |
| 3,700 | | 5.250%, 5/01/51 | 5/26 at 100.00 | AA | 4,420,316 |
| | Jersey City, New Jersey, General Obligation Bonds, Refunding General Improvement Series 2017A: | | | |
| 1,000 | | 5.000%, 11/01/29 | 11/27 at 100.00 | AA– | 1,228,320 |
| 515 | | 5.000%, 11/01/31 | 11/27 at 100.00 | AA– | 626,848 |
| 440 | | 5.000%, 11/01/33 | 11/27 at 100.00 | AA– | 531,771 |
| 1,100 | | Linden, New Jersey, General Obligation Bonds, Refunding Series 2011, 4.000%, 5/01/23 | 5/21 at 100.00 | AA– | 1,106,435 |
| 2,000 | | Mercer County, New Jersey, General Obligation Bonds, General Capital Improvement Open | No Opt. Call | N/R | 2,010,060 |
| | Space Farmland NotesSeries 2020A, 2.000%, 6/10/21 | | | |
| 3,825 | | Monmouth County Improvement Authority, New Jersey, Governmental Pooled Loan Revenue | No Opt. Call | N/R | 3,850,589 |
| | Bonds, Series 2020A, 2.000%, 7/12/21 | | | |
| 760 | | Montclair Township, Essex County, New Jersey, General Obligation Bonds, Refunding | 1/24 at 100.00 | AAA | 853,108 |
| | Parking Utility Series 2014A, 5.000%, 1/01/37 | | | |
| | New Brunswick Parking Authority, Middlesex County, New Jersey, Guaranteed Parking | | | |
| | Revenue Bonds, Refunding Series 2012: | | | |
| 465 | | 5.000%, 9/01/28 | 9/22 at 100.00 | A+ | 492,235 |
| 610 | | 5.000%, 9/01/29 | 9/22 at 100.00 | A+ | 645,167 |
| 300 | | 5.000%, 9/01/31 | 9/22 at 100.00 | A+ | 316,878 |
| 250 | | 3.625%, 9/01/34 | 9/22 at 100.00 | A+ | 254,755 |
| 2,190 | | New Brunswick, New Jersey, General Obligation Bonds, Cultural Center Project, Series | 9/27 at 100.00 | AA | 2,423,432 |
| | 2017, 4.000%, 9/15/44 – AGM Insured | | | |
| | New Jersey State, General Obligation Bonds, Covid-19 Emergency Series 2020A: | | | |
| 3,000 | | 3.000%, 6/01/32 | No Opt. Call | A3 | 3,315,180 |
| 3,045 | | 4.000%, 6/01/32 | No Opt. Call | A3 | 3,688,104 |
| 3,040 | | New Jersey State, General Obligation Bonds, Various Purpose Series 2020, 2.250%, 6/01/35 | 12/27 at 100.00 | A3 | 3,008,810 |
| 2,000 | | Somerset County, New Jersey, General Obligation Bonds, Bond Anticipation Notes Series | No Opt. Call | N/R | 2,039,760 |
| | 2020, 4.000%, 9/09/21 | | | |
| | South Orange Village Township, New Jersey, General Obligation Bonds, Refunding Series 2020: | | | |
| 500 | | 4.000%, 1/15/23 | No Opt. Call | AA– | 534,755 |
| 400 | | 4.000%, 1/15/25 | No Opt. Call | AA– | 451,468 |
| 500 | | 4.000%, 1/15/26 | No Opt. Call | AA– | 576,715 |
| 5,165 | | Union County Utilities Authority, New Jersey, Resource Recovery Facility Lease Revenue | 12/21 at 100.00 | AA+ | 5,353,264 |
| | Bonds, Covantan Union Inc Lessee, Refunding Series 2011B, 5.250%, 12/01/31 (AMT) | | | |
47
| | |
| NXJ | Nuveen New Jersey Quality Municipal Income Fund Portfolio of Investments (continued) February 28, 2021 |
| | | | | | |
| Principal | | | Optional Call | | |
| Amount (000) | | Description (1) | Provisions (2) | Ratings (3) | Value |
| | Tax Obligation/General (continued) | | | |
| $ 2,515 | | Union County Utilities Authority, New Jersey, Solid Waste System County Deficiency | 6/21 at 100.00 | Aaa | $ 2,546,186 |
| | Revenue Bonds, Series 2011A, 5.000%, 6/15/41 | | | |
| 2,000 | | Union County, New Jersey, General Obligation Bonds, Bond Anticipation Notes Series 2020, | No Opt. Call | N/R | 2,022,860 |
| | 4.000%, 6/18/21 | | | |
| 2,170 | | Union County, New Jersey, General Obligation Bonds, Refunding Series 2017, 3.000%, 3/01/27 | 9/25 at 100.00 | Aaa | 2,376,758 |
| 1,515 | | Washington Township Board of Education, Mercer County, New Jersey, General Obligation | No Opt. Call | Aa3 | 1,879,130 |
| | Bonds, Series 2005, 5.250%, 1/01/27 – AGM Insured | | | |
| 73,625 | | Total Tax Obligation/General | | | 80,744,702 |
| | Tax Obligation/Limited – 37.0% (24.7% of Total Investments) | | | |
| 3,775 | | Bergen County Improvement Authority, New Jersey, Guaranteed Lease Revenue Bonds, County | No Opt. Call | Aaa | 4,690,136 |
| | Administration Complex Project, Series 2005, 5.000%, 11/15/26 | | | |
| 1,000 | | Bergen County Improvement Authority, New Jersey, Lease Revenue Bonds, Boro Ridgefield | 10/30 at 100.00 | Aaa | 1,187,630 |
| | Project, County Guaranteed Series 2020, 4.000%, 10/15/42 | | | |
| 3,000 | | Garden State Preservation Trust, New Jersey, Open Space and Farmland Preservation Bonds, | No Opt. Call | AA | 2,831,700 |
| | Series 2003B, 0.000%, 11/01/25 – AGM Insured | | | |
| 2,230 | | Garden State Preservation Trust, New Jersey, Open Space and Farmland Preservation Bonds, | No Opt. Call | AA | 2,762,078 |
| | Series 2005A, 5.750%, 11/01/28 – AGM Insured | | | |
| | Government of Guam, Business Privilege Tax Bonds, Series 2011A: | | | |
| 5,005 | | 5.250%, 1/01/36 | 1/22 at 100.00 | BB | 5,136,732 |
| 3,020 | | 5.125%, 1/01/42 | 1/22 at 100.00 | BB | 3,088,856 |
| 500 | | Government of Guam, Business Privilege Tax Bonds, Series 2012B-1, 5.000%, 1/01/29 | 1/22 at 100.00 | BB | 513,735 |
| | New Jersey Economic Development Authority, Cigarette Tax Revenue Refunding Bonds, | | | |
| | Series 2012: | | | |
| 310 | | 5.000%, 6/15/21 | No Opt. Call | BBB | 314,182 |
| 6,400 | | 5.000%, 6/15/25 | 6/22 at 100.00 | BBB | 6,700,608 |
| 3,480 | | 5.000%, 6/15/26 | 6/22 at 100.00 | BBB | 3,634,477 |
| 7,945 | | 5.000%, 6/15/28 | 6/22 at 100.00 | BBB | 8,268,679 |
| 415 | | 5.000%, 6/15/29 | 6/22 at 100.00 | BBB | 431,251 |
| 5,445 | | New Jersey Economic Development Authority, Lease Revenue Bonds, State House Project, | 12/28 at 100.00 | Baa1 | 6,172,234 |
| | Series 2017B, 4.500%, 6/15/40 | | | |
| 5,495 | | New Jersey Economic Development Authority, Revenue Bonds, Motor Vehicle Surcharge, | 7/27 at 100.00 | BBB | 5,694,578 |
| | Refunding Series 2017A, 3.375%, 7/01/30 | | | |
| 6,000 | | New Jersey Economic Development Authority, Revenue Bonds, New Jersey Transit Corporation | No Opt. Call | Baa1 | 7,063,380 |
| | Projects Sublease, Refunding Series 2017B, 5.000%, 11/01/25 | | | |
| 6,385 | | New Jersey Economic Development Authority, School Facilities Construction Bonds, Series | 6/24 at 100.00 | Baa1 | 7,163,523 |
| | 2014UU, 5.000%, 6/15/27 | | | |
| 11,345 | | New Jersey Economic Development Authority, School Facilities Construction Bonds, Series | 6/25 at 100.00 | Baa1 | 12,813,610 |
| | 2015WW, 5.250%, 6/15/40 | | | |
| | New Jersey Economic Development Authority, School Facilities Construction Bonds, Social | | | |
| | Series 2021QQQ: | | | |
| 1,300 | | 5.000%, 6/15/31 | 12/30 at 100.00 | Baa1 | 1,641,263 |
| 1,000 | | 5.000%, 6/15/32 | 12/30 at 100.00 | Baa1 | 1,254,290 |
| 235 | | 4.000%, 6/15/50 | 12/30 at 100.00 | Baa1 | 254,714 |
| 5,000 | | New Jersey Economic Development Authority, School Facilities Construction Financing | 6/24 at 100.00 | Baa1 | 5,629,350 |
| | Program Bonds, Refunding Series 2014PP, 5.000%, 6/15/26 | | | |
| | New Jersey Transportation Trust Fund Authority, Federal Highway Reimbursement Revenue | | | |
| | Notes, Series 2016A-1: | | | |
| 1,130 | | 5.000%, 6/15/29 | 6/26 at 100.00 | A+ | 1,326,428 |
| 655 | | 5.000%, 6/15/30 | 6/26 at 100.00 | A+ | 763,422 |
| 32,965 | | New Jersey Transportation Trust Fund Authority, Transportation System Bonds, Capital | No Opt. Call | Baa1 | 26,496,278 |
| | Appreciation Series 2010A, 0.000%, 12/15/30 | | | |
48
| | | | | | |
| Principal | | | Optional Call | | |
| Amount (000) | | Description (1) | Provisions (2) | Ratings (3) | Value |
| | Tax Obligation/Limited (continued) | | | |
| $ 8,100 | | New Jersey Transportation Trust Fund Authority, Transportation System Bonds, Refunding | No Opt. Call | Baa1 | $ 8,837,505 |
| | Series 2006A, 5.500%, 12/15/22 | | | |
| | New Jersey Transportation Trust Fund Authority, Transportation System Bonds, Refunding | | | |
| | Series 2006C: | | | |
| 37,565 | | 0.000%, 12/15/32 – AGM Insured | No Opt. Call | AA | 29,684,990 |
| 39,090 | | 0.000%, 12/15/33 – AGM Insured | No Opt. Call | AA | 29,982,030 |
| 5,160 | | 0.000%, 12/15/34 – AGM Insured | No Opt. Call | AA | 3,845,129 |
| 7,000 | | New Jersey Transportation Trust Fund Authority, Transportation System Bonds, Series | No Opt. Call | Baa1 | 8,072,190 |
| | 2010D, 5.000%, 12/15/24 | | | |
| | New Jersey Transportation Trust Fund Authority, Transportation System Bonds, Series 2011B: | | | |
| 460 | | 5.500%, 6/15/31 | 6/21 at 100.00 | Baa1 | 465,833 |
| 4,650 | | 5.250%, 6/15/36 | 6/21 at 100.00 | Baa1 | 4,703,522 |
| 1,090 | | New Jersey Transportation Trust Fund Authority, Transportation System Bonds, Series | 6/22 at 100.00 | Baa1 | 1,133,360 |
| | 2012A, 5.000%, 6/15/42 | | | |
| 45 | | New Jersey Transportation Trust Fund Authority, Transportation System Bonds, Series | 6/23 at 100.00 | Baa1 | 48,342 |
| | 2013AA, 5.000%, 6/15/36 | | | |
| | New Jersey Transportation Trust Fund Authority, Transportation System Bonds, Series 2018A: | | | |
| 1,150 | | 5.000%, 12/15/35 | 12/28 at 100.00 | Baa1 | 1,374,170 |
| 440 | | 5.000%, 12/15/36 | 12/28 at 100.00 | Baa1 | 523,301 |
| 4,950 | | New Jersey Transportation Trust Fund Authority, Transportation System Bonds, Series | 12/29 at 100.00 | Baa1 | 5,462,721 |
| | 2019A, 4.000%, 12/15/39 | | | |
| | New Jersey Transportation Trust Fund Authority, Transportation System Bonds, Series 2019BB: | | | |
| 4,860 | | 3.500%, 6/15/46 | 12/28 at 100.00 | Baa1 | 5,031,023 |
| 2,900 | | 4.000%, 6/15/50 | 12/28 at 100.00 | Baa1 | 3,132,174 |
| | New Jersey Transportation Trust Fund Authority, Transportation System Bonds, Series 2020AA: | | | |
| 1,200 | | 4.000%, 6/15/45 | 12/30 at 100.00 | Baa1 | 1,307,328 |
| 955 | | 5.000%, 6/15/45 | 12/30 at 100.00 | Baa1 | 1,139,764 |
| 2,200 | | 5.000%, 6/15/50 | 12/30 at 100.00 | Baa1 | 2,610,828 |
| 5,075 | | 3.000%, 6/15/50 | 12/30 at 100.00 | Baa1 | 4,954,418 |
| 3,860 | | Passaic County Improvement Authority, New Jersey, Lease Revenue Bonds, Preakness | 5/25 at 100.00 | AA | 4,096,618 |
| | Healthcare Center Expansion Project, Refunding Series 2015, 3.750%, 5/01/36 | | | |
| 4,005 | | Passaic County Improvement Authority, New Jersey, Lease Revenue Bonds, Preakness | 5/22 at 100.00 | Aa1 | 4,078,292 |
| | Healthcare Center Expansion Project, Series 2012, 3.500%, 5/01/35 | | | |
| | Union County Improvement Authority, New Jersey, General Obligation Lease Bonds, Juvenile | | | |
| | Detention Center Facility Project, Tender Option Bond Trust 2015-XF1019: | | | |
| 285 | | 25.049%, 5/01/28, 144A (IF) (4) | No Opt. Call | Aaa | 734,325 |
| 285 | | 25.135%, 5/01/29, 144A (IF) (4) | No Opt. Call | Aaa | 780,561 |
| 200 | | 25.135%, 5/01/30, 144A (IF) (4) | No Opt. Call | Aaa | 575,978 |
| 370 | | 24.869%, 5/01/31, 144A (IF) (4) | No Opt. Call | Aaa | 1,114,266 |
| 385 | | 25.007%, 5/01/32, 144A (IF) (4) | No Opt. Call | Aaa | 1,218,317 |
| 400 | | 25.012%, 5/01/33, 144A (IF) (4) | No Opt. Call | Aaa | 1,320,796 |
| 415 | | 25.135%, 5/01/34, 144A (IF) (4) | No Opt. Call | Aaa | 1,430,389 |
| 3,975 | | Union County Improvement Authority, New Jersey, General Obligation Lease Revenue Bonds, | No Opt. Call | AA+ | 8,630,043 |
| | Series 2019-XG0221, 18.040%, 3/01/34, 144A (IF) (4) | | | |
| 255,105 | | Total Tax Obligation/Limited | | | 252,121,347 |
| | Transportation – 22.7% (15.2% of Total Investments) | | | |
| 2,400 | | Delaware River and Bay Authority, Delaware and New Jersey, Revenue Bonds, Series 2012A, | 1/23 at 100.00 | A1 | 2,559,120 |
| | 5.000%, 1/01/42 | | | |
| | Delaware River and Bay Authority, Delaware and New Jersey, Revenue Bonds, Series 2014A: | | | |
| 1,285 | | 5.000%, 1/01/34 | 1/24 at 100.00 | A1 | 1,416,828 |
| 5,890 | | 4.125%, 1/01/39 | 1/24 at 100.00 | A1 | 6,297,117 |
| 7,800 | | 5.000%, 1/01/44 | 1/24 at 100.00 | A1 | 8,547,630 |
| 2,580 | | Delaware River and Bay Authority, Delaware and New Jersey, Revenue Bonds, Series 2019, | 1/29 at 100.00 | A1 | 2,912,562 |
| | 4.000%, 1/01/44 | | | |
49
| | |
| NXJ | Nuveen New Jersey Quality Municipal Income Fund Portfolio of Investments (continued) February 28, 2021 |
| | | | | | |
| Principal | | | Optional Call | | |
| Amount (000) | | Description (1) | Provisions (2) | Ratings (3) | Value |
| | Transportation (continued) | | | |
| | Delaware River Joint Toll Bridge Commission, New Jersey and Pennsylvania, Bridge System | | | |
| | Revenue Bonds, Refunding Series 2015: | | | |
| $ 1,000 | | 4.000%, 7/01/34 – BAM Insured | 7/25 at 100.00 | AA | $ 1,110,700 |
| 2,820 | | 4.000%, 7/01/35 – BAM Insured | 7/25 at 100.00 | AA | 3,122,107 |
| | Delaware River Joint Toll Bridge Commission, New Jersey and Pennsylvania, Bridge System | | | |
| | Revenue Bonds, Refunding Series 2019B: | | | |
| 2,005 | | 5.000%, 7/01/28 | No Opt. Call | A1 | 2,563,252 |
| 1,520 | | 5.000%, 7/01/29 | No Opt. Call | A1 | 1,981,305 |
| | Delaware River Joint Toll Bridge Commission, New Jersey and Pennsylvania, Bridge System | | | |
| | Revenue Bonds, Series 2017: | | | |
| 2,820 | | 5.000%, 7/01/42 | 7/27 at 100.00 | A1 | 3,396,577 |
| 10,210 | | 5.000%, 7/01/47 | 7/27 at 100.00 | A1 | 12,175,731 |
| | Delaware River Joint Toll Bridge Commission, New Jersey and Pennsylvania, Bridge System | | | |
| | Revenue Bonds, Series 2019A: | | | |
| 1,050 | | 5.000%, 7/01/28 | No Opt. Call | A1 | 1,342,352 |
| 1,350 | | 5.000%, 7/01/29 | No Opt. Call | A1 | 1,759,712 |
| 950 | | 5.000%, 7/01/30 | 7/29 at 100.00 | A1 | 1,229,794 |
| 7,035 | | Delaware River Port Authority, New Jersey and Pennsylvania, Revenue Bonds, Series 2013, | 1/24 at 100.00 | A+ | 7,827,422 |
| | 5.000%, 1/01/40 | | | |
| 2,325 | | Delaware River Port Authority, New Jersey and Pennsylvania, Revenue Bonds, Series 2018A, | 1/29 at 100.00 | A+ | 2,850,008 |
| | 5.000%, 1/01/37 | | | |
| | Delaware River Port Authority, Pennsylvania and New Jersey, Revenue Refunding Bonds, | | | |
| | Port District Project, Series 2012: | | | |
| 1,800 | | 5.000%, 1/01/24 | 1/23 at 100.00 | A | 1,920,852 |
| 1,635 | | 5.000%, 1/01/25 | 1/23 at 100.00 | A | 1,738,119 |
| 1,875 | | 5.000%, 1/01/26 | 1/23 at 100.00 | A | 1,988,175 |
| 3,525 | | 5.000%, 1/01/27 | 1/23 at 100.00 | A | 3,728,040 |
| 5,555 | | New Jersey Economic Development Authority, Private Activity Bonds, The Goethals Bridge | 1/24 at 100.00 | BBB+ | 6,146,774 |
| | Replacement Project, Series 2013, 5.625%, 1/01/52 (AMT) | | | |
| | New Jersey Economic Development Authority, Special Facilities Revenue Bonds, Continental | | | |
| | Airlines Inc, Series 1999: | | | |
| 775 | | 5.125%, 9/15/23 (AMT) | 8/22 at 101.00 | Ba3 | 823,182 |
| 1,800 | | 5.250%, 9/15/29 (AMT) | 8/22 at 101.00 | Ba3 | 1,913,130 |
| 2,250 | | New Jersey Economic Development Authority, Special Facilities Revenue Bonds, Continental | 3/24 at 101.00 | Ba3 | 2,515,027 |
| | Airlines Inc, Series 2000A & 2000B, 5.625%, 11/15/30 (AMT) | | | |
| | New Jersey Economic Development Authority, Special Facility Revenue Bonds, Port Newark | | | |
| | Container Terminal LLC Project, Refunding Series 2017: | | | |
| 5,660 | | 5.000%, 10/01/37 (AMT) | 10/27 at 100.00 | Baa3 | 6,410,742 |
| 7,440 | | 5.000%, 10/01/47 (AMT) | 10/27 at 100.00 | Baa3 | 8,280,125 |
| 5,750 | | New Jersey Transit Corporation, Grant Anticipation Notes, Federal Transit Administration | No Opt. Call | A | 5,884,262 |
| | Section 5307 Urbanized Area Formula Funds, Series 2014A, 5.000%, 9/15/21 | | | |
| 6,570 | | New Jersey Turnpike Authority, Revenue Bonds, Refunding Series 2015E, 5.000%, 1/01/45 | 1/25 at 100.00 | A+ | 7,556,880 |
| 3,065 | | New Jersey Turnpike Authority, Revenue Bonds, Series 2005A, 5.250%, 1/01/29 – | No Opt. Call | AA | 3,989,159 |
| | AGM Insured | | | |
| 2,050 | | New Jersey Turnpike Authority, Turnpike Revenue Bonds, Series 2021A, 4.000%, 1/01/42 | 1/31 at 100.00 | A+ | 2,379,825 |
| 2,750 | | Passaic County Improvement Authority, New Jersey, Revenue Bonds, Paterson Parking Deck | 3/21 at 100.00 | A2 | 2,759,570 |
| | Facility, Series 2005, 5.000%, 4/15/35 – AGM Insured | | | |
| 7,235 | | Port Authority of New York and New Jersey, Consolidated Revenue Bonds, One Hundred | 12/23 at 100.00 | Aa3 | 7,978,324 |
| | Seventy Ninth Series 2013, 5.000%, 12/01/43 | | | |
| 5,000 | | Port Authority of New York and New Jersey, Consolidated Revenue Bonds, One Hundred | 1/23 at 100.00 | Aa3 | 5,192,050 |
| | Seventy Seventh Series 2013, 4.000%, 1/15/43 (AMT) | | | |
50
| | | | | | |
| Principal | | | Optional Call | | |
| Amount (000) | | Description (1) | Provisions (2) | Ratings (3) | Value |
| | Transportation (continued) | | | |
| | Port Authority of New York and New Jersey, Consolidated Revenue Bonds, Two Hundred | | | |
| | Eighteen Series 2019: | | | |
| $ 8,000 | | 4.000%, 11/01/41 (AMT) (UB) (4) | 11/29 at 100.00 | Aa3 | $ 9,039,200 |
| 4,000 | | 4.000%, 11/01/47 (AMT) (UB) (4) | 11/29 at 100.00 | Aa3 | 4,470,480 |
| | Port Authority of New York and New Jersey, Consolidated Revenue Bonds, Two Hundred | | | |
| | Fourteen Series 2019: | | | |
| 4,500 | | 4.000%, 9/01/38 (AMT) (UB) (4) | 9/29 at 100.00 | Aa3 | 5,119,830 |
| 2,500 | | 4.000%, 9/01/39 (AMT) (UB) (4) | 9/29 at 100.00 | Aa3 | 2,837,225 |
| 1,040 | | South Jersey Transportation Authority, New Jersey, Transportation System Revenue Bonds, | 11/30 at 100.00 | BBB+ | 1,285,336 |
| | Series 2020A, 5.000%, 11/01/45 | | | |
| 137,815 | | Total Transportation | | | 155,048,524 |
| | U.S. Guaranteed – 12.4% (8.3% of Total Investments) (5) | | | |
| 2,225 | | Cumberland County Improvement Authority, New Jersey, County General Obligation Revenue | 9/24 at 100.00 | AA | 2,582,624 |
| | Bonds, Technical High School Project, Series 2014, 5.000%, 9/01/39 (Pre-refunded 9/01/24) – | | | |
| | AGM Insured | | | |
| | Delaware River Joint Toll Bridge Commission, Pennsylvania, Bridge System Revenue Bonds, | | | |
| | Refunding Series 2012A: | | | |
| 2,150 | | 5.000%, 7/01/24 (Pre-refunded 7/01/22) | 7/22 at 100.00 | A1 | 2,287,643 |
| 650 | | 4.000%, 7/01/26 (Pre-refunded 7/01/22) | 7/22 at 100.00 | A1 | 682,981 |
| 625 | | 4.000%, 7/01/27 (Pre-refunded 7/01/22) | 7/22 at 100.00 | A1 | 656,713 |
| 25 | | Essex County Improvement Authority, New Jersey, Project Consolidation Revenue Bonds, | No Opt. Call | Aaa | 27,269 |
| | Refunding Series 2007, 5.250%, 12/15/22 – AMBAC Insured (ETM) | | | |
| 2,455 | | New Jersey Economic Development Authority, Rutgers University General Obligation Lease | 6/23 at 100.00 | Aa3 | 3,510,454 |
| | Revenue Bonds, Tender Option Bond 2016-XF2357, 18.143%, 6/15/46 (Pre-refunded 6/15/23), | | | |
| | 144A (IF) (4) | | | |
| 655 | | New Jersey Economic Development Authority, School Facilities Construction Bonds, Series | 6/25 at 100.00 | N/R | 785,836 |
| | 2015WW, 5.250%, 6/15/40 (Pre-refunded 6/15/25) | | | |
| | New Jersey Education Facilities Authority Revenue Bonds, The College of New Jersey | | | |
| | Issue, Series 2013A: | | | |
| 2,475 | | 5.000%, 7/01/38 (Pre-refunded 7/01/23) | 7/23 at 100.00 | A | 2,749,230 |
| 3,250 | | 5.000%, 7/01/43 (Pre-refunded 7/01/23) | 7/23 at 100.00 | A | 3,610,100 |
| 70 | | New Jersey Environmental Infrastructure Trust, Environmental Infrastructure Bonds, | No Opt. Call | N/R | 71,332 |
| | Refunding Series 2012A-R, 4.000%, 9/01/21 (ETM) | | | |
| 30 | | New Jersey Environmental Infrastructure Trust, Environmental Infrastructure Bonds, | 9/21 at 100.00 | N/R | 30,449 |
| | Series 2012A, 3.250%, 9/01/31 (Pre-refunded 9/01/21) | | | |
| 2,055 | | New Jersey Health Care Facilities Financing Authority, Revenue Bonds, Hunterdon Medical | 7/24 at 100.00 | A+ | 2,366,682 |
| | Center, Refunding Series 2014A, 5.000%, 7/01/45 (Pre-refunded 7/01/24) | | | |
| | New Jersey Health Care Facilities Financing Authority, Revenue Bonds, Kennedy Health | | | |
| | System Obligated Group Issue, Refunding Series 2012: | | | |
| 4,165 | | 3.750%, 7/01/27 (ETM) | No Opt. Call | N/R | 4,663,134 |
| 3,375 | | 5.000%, 7/01/31 (Pre-refunded 7/01/22) | 7/22 at 100.00 | N/R | 3,591,067 |
| 1,500 | | 5.000%, 7/01/37 (Pre-refunded 7/01/22) | 7/22 at 100.00 | N/R | 1,596,030 |
| | New Jersey Health Care Facilities Financing Authority, Revenue Bonds, Palisades Medical | | | |
| | Center Obligated Group Issue, Refunding Series 2013: | | | |
| 555 | | 5.250%, 7/01/31 (Pre-refunded 7/01/23) | 7/23 at 100.00 | N/R | 614,224 |
| 2,570 | | 5.250%, 7/01/31 (Pre-refunded 7/01/23) | 7/23 at 100.00 | N/R | 2,866,501 |
| 275 | | 5.500%, 7/01/43 (Pre-refunded 7/01/23) | 7/23 at 100.00 | N/R | 305,932 |
| 1,285 | | 5.500%, 7/01/43 (Pre-refunded 7/01/23) | 7/23 at 100.00 | N/R | 1,440,703 |
| 7,670 | | New Jersey Health Care Facilities Financing Authority, Revenue Bonds, Saint Barnabas | 7/21 at 100.00 | N/R | 7,806,909 |
| | Health Care System, Refunding Series 2011A, 5.625%, 7/01/37 (Pre-refunded 7/01/21) | | | |
| | New Jersey Institute of Technology, New Jersey, General Obligation Bonds, Series 2012A: | | | |
| 175 | | 5.000%, 7/01/42 (Pre-refunded 7/01/22) | 7/22 at 100.00 | N/R | 186,083 |
| 400 | | 5.000%, 7/01/42 (Pre-refunded 7/01/22) | 7/22 at 100.00 | A1 | 425,608 |
| 1,555 | | New Jersey Sports and Exposition Authority, Convention Center Luxury Tax Bonds, Series | No Opt. Call | Baa2 | 1,636,575 |
| | 2004, 5.500%, 3/01/22 – NPFG Insured (ETM) | | | |
51
| | |
| NXJ | Nuveen New Jersey Quality Municipal Income Fund Portfolio of Investments (continued) February 28, 2021 |
| | | | | | |
| Principal | | | Optional Call | | |
| Amount (000) | | Description (1) | Provisions (2) | Ratings (3) | Value |
| | U.S. Guaranteed (5) (continued) | | | |
| | New Jersey Transportation Trust Fund Authority, Transportation System Bonds, Series 2011A: | | | |
| $ 80 | | 6.000%, 6/15/35 (Pre-refunded 6/15/21) | 6/21 at 100.00 | Baa1 | $ 81,317 |
| 1,015 | | 5.500%, 6/15/41 (Pre-refunded 6/15/21) | 6/21 at 100.00 | Baa1 | 1,030,316 |
| | New Jersey Transportation Trust Fund Authority, Transportation System Bonds, Series 2011B: | | | |
| 335 | | 5.000%, 6/15/37 (Pre-refunded 6/15/21) | 6/21 at 100.00 | Baa1 | 339,576 |
| 130 | | 5.000%, 6/15/42 (Pre-refunded 6/15/21) | 6/21 at 100.00 | Baa1 | 131,776 |
| 7,620 | | New Jersey Turnpike Authority, Revenue Bonds, Series 2012B, 5.000%, 1/01/28 | 1/23 at 100.00 | A+ | 8,287,969 |
| | (Pre-refunded 1/01/23) | | | |
| | New Jersey Turnpike Authority, Revenue Bonds, Tender Option Bond Trust 2016-XF1057: | | | |
| 2,260 | | 17.257%, 1/01/43 (Pre-refunded 7/01/22), 144A (IF) (4) | 7/22 at 100.00 | N/R | 2,843,758 |
| 1,365 | | 17.257%, 1/01/43 (Pre-refunded 7/01/22), 144A (IF) (4) | 7/22 at 100.00 | A+ | 1,717,580 |
| | North Hudson Sewerage Authority, New Jersey, Gross Revenue Lease Certificates, Senior | | | |
| | Lien Series 2012A: | | | |
| 1,455 | | 5.000%, 6/01/27 (Pre-refunded 6/01/22) | 6/22 at 100.00 | N/R | 1,543,275 |
| 2,365 | | 5.000%, 6/01/27 (Pre-refunded 6/01/22) | 6/22 at 100.00 | A+ | 2,506,947 |
| 225 | | 5.000%, 6/01/42 (Pre-refunded 6/01/22) | 6/22 at 100.00 | N/R | 238,651 |
| 15,840 | | North Hudson Sewerage Authority, New Jersey, Sewerage Revenue Refunding Bonds, Series | No Opt. Call | Baa2 | 15,650,237 |
| | 2001A, 0.000%, 8/01/23 – NPFG Insured (ETM) | | | |
| 2,170 | | Rutgers State University, New Jersey, Revenue Bonds, Tender Option Bond 2016-XF2356, | 5/23 at 100.00 | Aa3 | 3,064,170 |
| | 18.183%, 5/01/43 (Pre-refunded 5/01/23), 144A (IF) (4) | | | |
| | Sparta Township Board of Education, Sussex County, New Jersey, General Obligation Bonds, | | | |
| | Refunding Series 2015: | | | |
| 1,000 | | 5.000%, 2/15/34 (Pre-refunded 2/15/25) | 2/25 at 100.00 | AA | 1,176,340 |
| 1,395 | | 5.000%, 2/15/35 (Pre-refunded 2/15/25) | 2/25 at 100.00 | AA | 1,640,994 |
| 77,445 | | Total U.S. Guaranteed | | | 84,746,985 |
| | Utilities – 7.1% (4.7% of Total Investments) | | | |
| 1,510 | | Industrial Pollution Control Financing Authority of Cape May County (New Jersey), | No Opt. Call | A | 1,510,000 |
| | Pollution Control Revenue Refunding Bonds, 1991 Series A (Atlantic City Electric Company | | | |
| | Project), 6.800%, 3/01/21 – NPFG Insured | | | |
| | New Jersey Economic Development Authority, Energy Facilities Revenue Bonds, UMM Energy | | | |
| | Partners, LLC Project, Series 2012A: | | | |
| 1,000 | | 4.750%, 6/15/32 (AMT) | 6/22 at 100.00 | Baa2 | 1,040,740 |
| 1,225 | | 5.125%, 6/15/43 (AMT) | 6/22 at 100.00 | Baa2 | 1,275,225 |
| 1,925 | | New Jersey Economic Development Authority, Natural Gas Facilities Revenue Bonds, New | 8/24 at 100.00 | A1 | 1,937,185 |
| | Jersey Natural Gas Company Project, Refunding Series 2011A, 2.750%, 8/01/39 | | | |
| 15,670 | | New Jersey Economic Development Authority, Water Facilities Revenue Bonds, Middlesex | 10/22 at 100.00 | A+ | 16,042,476 |
| | Water Company, Series 2012C, 4.250%, 10/01/47 (AMT) | | | |
| 2,355 | | New Jersey Economic Development Authority, Water Facilities Revenue Bonds, Middlesex | 8/29 at 100.00 | A+ | 2,562,287 |
| | Water Company, Series 2019, 4.000%, 8/01/59 (AMT) | | | |
| 3,505 | | New Jersey Economic Development Authority, Water Facilities Revenue Bonds, New | No Opt. Call | A+ | 3,546,219 |
| | Jersey-American Water Company Inc Project, Refunding Series 2020B, 1.200%, 11/01/34 (AMT) | | | |
| | (Mandatory Put 6/01/23) | | | |
| | New Jersey Environmental Infrastructure Trust, Environmental Infrastructure Bonds, | | | |
| | Series 2012A: | | | |
| 65 | | 3.250%, 9/01/31 | No Opt. Call | N/R | 65,972 |
| 1,585 | | 3.250%, 9/01/31 | No Opt. Call | N/R | 1,609,488 |
| 2,700 | | Passaic County Utilities Authority, New Jersey, Solid Waste Disposal Revenue Bonds, | No Opt. Call | AA | 3,675,240 |
| | Refunding Series 2018, 5.000%, 3/01/37 | | | |
| 1,825 | | Salem County Pollution Control Financing Authority, New Jersey, Pollution Control | No Opt. Call | BBB | 1,914,370 |
| | Revenue Bonds, Chambers Project, Refunding Series 2014A, 5.000%, 12/01/23 (AMT) | | | |
| 13,000 | | Salem County Pollution Control Financing Authority, New Jersey, Revenue Bonds, Atlantic | No Opt. Call | A | 12,965,290 |
| | City Electric Company Project, Refunding Series 2020, 2.250%, 6/01/29 | | | |
| 46,365 | | Total Utilities | | | 48,144,492 |
| $ 960,145 | | Total Long-Term Investments (cost $931,639,655) | | | 1,019,709,474 |
52
| | | | | | |
| Principal | | | Optional Call | | |
| Amount (000) | | Description (1) | Provisions (2) | Ratings (3) | Value |
| | SHORT-TERM INVESTMENTS – 0.0% (0.0% of Total Investments) | | | |
| | MUNICIPAL BONDS – 0.0% (0.0% of Total Investments) | | | |
| | Health Care – 0.0% (0.0% of Total Investments) | | | |
| $ 100 | | New Jersey Health Care Facilities Financing Authority, Revenue Bonds, Virtua Health, Variable | | | |
| | Rate Demand Obligations, Series 2009D, 0.010%, 7/01/43 (6) | 3/21 at 100.00 | A-1+ | $ 100,000 |
| $ 100 | | Total Short-Term Investments (cost $100,000) | | | 100,000 |
| | Total Investments (cost $931,739,655) – 149.6% | | | 1,019,809,474 |
| | Floating Rate Obligations – (5.1)% | | | (34,780,000) |
| | Variable Rate Demand Preferred Shares, net of deferred offering costs – (45.8)% (7) | | | (312,560,795) |
| | Other Assets Less Liabilities – 1.3% | | | 9,377,591 |
| | Net Asset Applicable to Common Shares – 100% | | | $ 681,846,270 |
| | |
(1) | All percentages shown in the Portfolio of Investments are based on net assets applicable to common shares unless otherwise noted. |
(2) | Optional Call Provisions: Dates (month and year) and prices of the earliest optional call or redemption. There may be other call provisions at varying prices at later dates. Certain mortgage-backed securities may be subject to periodic principal paydowns. Optional Call Provisions are not covered by the report of independent registered public accounting firm.
|
(3) | For financial reporting purposes, the ratings disclosed are the highest of Standard & Poor’s Group (“Standard & Poor’s”), Moody’s Investors Service, Inc. (“Moody’s”) or Fitch, Inc. (“Fitch”) rating. This treatment of split-rated securities may differ from that used for other purposes, such as for Fund investment policies. Ratings below BBB by Standard & Poor’s, Baa by Moody’s or BBB by Fitch are considered to be below investment grade. Holdings designated N/R are not rated by any of these national rating agencies. Ratings are not covered by the report of independent registered public accounting firm.
|
(4) | Investment, or portion of investment, has been pledged to collateralize the net payment obligations for investments in inverse floating rate transactions. |
(5) | Backed by an escrow or trust containing sufficient U.S. Government or U.S. Government agency securities, which ensure the timely payment of principal and interest. |
(6) | Investment has a maturity of greater than one year, but has variable rate and/or demand features which qualify it as a short-term investment. The rate disclosed, as well as the reference rate and spread, where applicable, is that in effect as of the end of the reporting period. This rate changes periodically based on market conditions or a specified market index. |
(7) | Variable Rate Demand Preferred Shares, net of deferred offering costs as a percentage of Total Investments is 30.6%. |
144A | Investment is exempt from registration under Rule 144A of the Securities Act of 1933, as amended. These investments may only be resold in transactions exempt from registration, which are normally those transactions with qualified institutional buyers.
|
AMT | Alternative Minimum Tax |
ETM | Escrowed to maturity |
IF | Inverse floating rate security issued by a tender option bond (“TOB”) trust, the interest rate on which varies inversely with the Securities Industry Financial Markets Association (SIFMA) short-term rate, which resets weekly, or a similar short-term rate, and is reduced by the expenses related to the TOB trust.
|
UB | Underlying bond of an inverse floating rate trust reflected as a financing transaction. See Notes to Financial Statements, Note 4 – Portfolio Securities and Investments in |
| Derivatives for more information. |
| See accompanying notes to financial statements. |
53
| | |
| NQP | Nuveen Pennsylvania Quality Municipal Income Fund Portfolio of Investments February 28, 2021 |
| | | | | | |
| Principal | | | Optional Call | | |
| Amount (000) | | Description (1) | Provisions (2) | Ratings (3) | Value |
| | LONG-TERM INVESTMENTS – 159.1% (99.9% of Total Investments) | | | |
|
| | MUNICIPAL BONDS – 156.2% (98.1% of Total Investments) | | | |
|
| | Consumer Staples – 0.5% (0.3% of Total Investments) | | | |
| $ 2,000 | | Pennsylvania Economic Development Financing Authority, Solid Waste Disposal Revenue | No Opt. Call | AA– | $ 2,623,960 |
| | Bonds, Procter & Gamble Paper Project, Series 2001, 5.375%, 3/01/31 (AMT) | | | |
| | Education and Civic Organizations – 16.2% (10.2% of Total Investments) | | | |
| 1,060 | | Allegheny County Higher Education Building Authority, Pennsylvania, College Revenue | No Opt. Call | Baa3 | 1,228,604 |
| | Refunding Bonds, Robert Morris College, Series 1998A, 6.000%, 5/01/28 | | | |
| 940 | | Allegheny County Higher Education Building Authority, Pennsylvania, Revenue Bonds, | 3/23 at 100.00 | A | 965,286 |
| | Duquesne University, Series 2013A, 3.500%, 3/01/34 | | | |
| | Allegheny County Higher Education Building Authority, Pennsylvania, Revenue Bonds, | | | |
| | Robert Morris University, Series 2016: | | | |
| 735 | | 3.000%, 10/15/30 | 10/26 at 100.00 | Baa3 | 743,342 |
| 1,000 | | 5.000%, 10/15/38 | 10/26 at 100.00 | Baa3 | 1,108,690 |
| 1,625 | | Allegheny County Higher Education Building Authority, Pennsylvania, Revenue Bonds, | 10/27 at 100.00 | Baa3 | 1,799,184 |
| | Robert Morris University, Series 2017, 5.000%, 10/15/47 | | | |
| | Berks County Municipal Authority, Pennsylvania, Revenue Bonds, Alvernia University | | | |
| | Project, Series 2020: | | | |
| 590 | | 5.000%, 10/01/39 | 10/29 at 100.00 | BB+ | 626,214 |
| 20 | | 5.000%, 10/01/49 | 10/29 at 100.00 | BB+ | 21,010 |
| 3,215 | | Bucks County Industrial Development Authority, Pennsylvania, Revenue Bonds, School Lane | 3/27 at 100.00 | BBB– | 3,636,165 |
| | Charter School Project, Series 2016, 5.125%, 3/15/36 | | | |
| 835 | | Chester County Industrial Development Authority, Pennsylvania, Avon Grove Charter School | 12/27 at 100.00 | BBB– | 927,443 |
| | Revenue Bonds, Series 2017A, 5.000%, 12/15/47 | | | |
| 2,200 | | Crawford County Industrial Development Authority, Pennsylvania, College Revenue Bonds, | 5/26 at 100.00 | A– | 2,273,128 |
| | Allegheny College, Series 2016, 3.000%, 5/01/34 | | | |
| 1,000 | | Cumberland County Municipal Authority, Pennsylvania, Revenue Bonds, Dickinson College | 11/27 at 100.00 | A+ | 1,170,470 |
| | Project, Second Series 2017A, 5.000%, 11/01/39 | | | |
| 1,470 | | Dallas Area Municipal Authority, Pennsylvania, Revenue Bonds, Misericordia University | 5/29 at 100.00 | Baa3 | 1,662,482 |
| | Project, Series 2019, 5.000%, 5/01/48 | | | |
| 1,020 | | Dallas Area Municipal Authority, Pennsylvania, Revenue Bonds, Misericordia University, | 5/24 at 100.00 | Baa3 | 1,091,614 |
| | Series 2014, 5.000%, 5/01/37 | | | |
| 750 | | Delaware County Authority, Pennsylvania, General Revenue Bonds, Eastern University, | 3/21 at 100.00 | AA | 750,652 |
| | Series 2006, 4.500%, 10/01/27 – RAAI Insured | | | |
| 4,595 | | Erie Higher Education Building Authority, Pennsylvania, Revenue Bonds, Gannon | 11/26 at 100.00 | BBB+ | 4,757,341 |
| | University, Series 2016, 4.000%, 5/01/46 | | | |
| 2,395 | | General Authority of Southcentral Pennsylvania, Revenue Bonds, AICUP Financing | 10/27 at 100.00 | A– | 2,511,062 |
| | Program-York College of Pennsylvania, Series 2017 PP4, 3.375%, 11/01/37 | | | |
| | Huntingdon County General Authority, Pennsylvania, Revenue Bonds, Juniata College, | | | |
| | Series 2016OO2: | | | |
| 590 | | 3.250%, 5/01/36 | 5/26 at 100.00 | BBB | 590,820 |
| 1,555 | | 3.500%, 5/01/41 | 5/26 at 100.00 | BBB | 1,560,785 |
| | Lackawanna County Industrial Development Authority, Pennsylvania, Revenue Bonds, | | | |
| | University of Scranton, Series 2017: | | | |
| 475 | | 3.375%, 11/01/33 | 11/27 at 100.00 | A– | 505,818 |
| 2,910 | | 4.000%, 11/01/40 | 11/27 at 100.00 | A– | 3,167,302 |
| 5,235 | | Lycoming County Authority, Pennsylvania, Revenue Bonds, Pennsylvania College of | 5/22 at 100.00 | A | 5,509,733 |
| | Technology, Series 2012, 5.000%, 5/01/32 | | | |
| 1,855 | | Montgomery County Higher Education and Health Authority, Pennsylvania, Revenue Bonds, | 9/28 at 100.00 | A | 2,185,375 |
| | Thomas Jefferson University, Series 2018A, 5.000%, 9/01/48 | | | |
54
| | | | | | |
| Principal | | | Optional Call | | |
| Amount (000) | | Description (1) | Provisions (2) | Ratings (3) | Value |
| | Education and Civic Organizations (continued) | | | |
| | Montgomery County Higher Education and Health Authority, Pennsylvania, Revenue Bonds, | | | |
| | Thomas Jefferson University, Series 2019: | | | |
| $ 3,410 | | 4.000%, 9/01/44 | 9/29 at 100.00 | A | $ 3,806,037 |
| 395 | | 4.000%, 9/01/49 | 9/29 at 100.00 | A | 438,016 |
| 1,465 | | Pennsylvania Higher Educational Facilities Authority, Revenue Bonds, Holy Family | 9/23 at 100.00 | BBB– | 1,603,106 |
| | University, Series 2013A, 6.500%, 9/01/38 | | | |
| 2,415 | | Pennsylvania Higher Educational Facilities Authority, Revenue Bonds, AICUP Financing | 11/21 at 100.00 | BBB+ | 2,463,445 |
| | Program-Mount Aloysius College Project, Series 2011R-1, 5.000%, 11/01/35 | | | |
| | Pennsylvania Higher Educational Facilities Authority, Revenue Bonds, Bryn Mawr College, | | | |
| | Refunding Series 2014: | | | |
| 2,545 | | 5.000%, 12/01/38 | 12/24 at 100.00 | AA+ | 2,842,409 |
| 2,080 | | 5.000%, 12/01/44 | 12/24 at 100.00 | AA+ | 2,305,181 |
| 85 | | Pennsylvania Higher Educational Facilities Authority, Revenue Bonds, Drexel University, | 5/21 at 100.00 | A– | 85,707 |
| | Series 2011A, 5.250%, 5/01/41 | | | |
| 1,000 | | Pennsylvania Higher Educational Facilities Authority, Revenue Bonds, Gwynedd Mercy | 5/22 at 100.00 | BBB | 1,031,690 |
| | College, Series 2012-KK1, 5.375%, 5/01/42 | | | |
| 330 | | Pennsylvania Higher Educational Facilities Authority, Revenue Bonds, LaSalle University, | 11/22 at 100.00 | BB+ | 332,366 |
| | Series 2012, 4.000%, 5/01/32 | | | |
| 7,125 | | Pennsylvania Higher Educational Facilities Authority, Revenue Bonds, Thomas Jefferson | 3/25 at 100.00 | A | 8,005,935 |
| | University, Refunding Series 2015A, 5.250%, 9/01/50 (UB) (4) | | | |
| 760 | | Pennsylvania Higher Educational Facilities Authority, Revenue Bonds, Thomas Jefferson | 9/22 at 100.00 | A | 795,522 |
| | University, Series 2012, 5.000%, 3/01/42 | | | |
| | Pennsylvania Higher Educational Facilities Authority, Revenue Bonds, University of the | | | |
| | Sciences in Philadelphia, Series 2012: | | | |
| 1,030 | | 4.000%, 11/01/39 | 11/22 at 100.00 | Baa1 | 1,057,717 |
| 4,300 | | 5.000%, 11/01/42 | 11/22 at 100.00 | Baa1 | 4,514,871 |
| 1,310 | | Pennsylvania Higher Educational Facilities Authority, Revenue Bonds, University of the | 11/25 at 100.00 | Baa1 | 1,476,042 |
| | Sciences in Philadelphia, Series 2015A, 5.000%, 11/01/36 | | | |
| 1,590 | | Pennsylvania Higher Educational Facilities Authority, Revenue Bonds, Widener University, | 7/23 at 100.00 | A– | 1,690,981 |
| | Series 2013A, 5.500%, 7/15/38 | | | |
| 400 | | Philadelphia Authority for Industrial Development, Pennsylvania, Charter School Revenue | 6/28 at 100.00 | BB+ | 454,564 |
| | Bonds, Philadelphia Performing Arts: A String Theory Charter School, Series 2020, 5.000%, | | | |
| | 6/15/50, 144A | | | |
| 1,255 | | Philadelphia Authority for Industrial Development, Pennsylvania, Revenue Bonds, La Salle | 11/27 at 100.00 | BB+ | 1,237,832 |
| | University, Series 2017, 3.625%, 5/01/35 | | | |
| 500 | | Philadelphia Authority for Industrial Development, Pennsylvania, Revenue Bonds, Richard | 3/21 at 100.00 | N/R | 459,595 |
| | Allen Preparatory Charter School, Series 2006, 6.250%, 5/01/33 | | | |
| | Philadelphia Authority for Industrial Development, Pennsylvania, Revenue Bonds, Saint | | | |
| | Joseph?s University Project, Refunding Series 2020C Forward Delivery: | | | |
| 1,500 | | 4.000%, 11/01/36 | 11/29 at 100.00 | A– | 1,714,950 |
| 1,400 | | 4.000%, 11/01/37 | 11/29 at 100.00 | A– | 1,595,440 |
| 2,420 | | Philadelphia Authority for Industrial Development, Pennsylvania, Revenue Bonds, | 3/28 at 100.00 | BB+ | 2,557,940 |
| | University of the Arts, Series 2017, 5.000%, 3/15/45, 144A | | | |
| 2,320 | | Scranton-Lackawanna Health and Welfare Authority, Pennsylvania, Revenue Bonds, | 5/26 at 100.00 | A– | 2,641,506 |
| | University of Scranton, Series 2016, 5.000%, 11/01/37 | | | |
| 5,250 | | Scranton-Lackawanna Health and Welfare Authority, Pennsylvania, University Revenue | 6/26 at 100.00 | BB+ | 5,511,187 |
| | Bonds, Marywood University, Series 2016, 5.000%, 6/01/46 | | | |
| 3,555 | | Washington County Industrial Development Authority, Pennsylvania, College Revenue Bonds, | 11/27 at 100.00 | A– | 3,738,971 |
| | AICUP Financing Program-Washington and Jefferson College Project, Series 2017-PP5, | | | |
| | 3.375%, 11/01/36 | | | |
55
| | |
| NQP | Nuveen Pennsylvania Quality Municipal Income Fund Portfolio of Investments (continued) February 28, 2021 |
| | | | | | |
| Principal | | | Optional Call | | |
| Amount (000) | | Description (1) | Provisions (2) | Ratings (3) | Value |
| | Education and Civic Organizations (continued) | | | |
| | Wilkes-Barre Finance Authority, Pennsylvania, Revenue Bonds, University of Scranton, | | | |
| | Series 2015A: | | | |
| $ 1,890 | | 5.000%, 11/01/32 | 11/25 at 100.00 | A– | $ 2,165,732 |
| 740 | | 5.000%, 11/01/33 | 11/25 at 100.00 | A– | 845,872 |
| 740 | | 4.000%, 11/01/35 | 11/25 at 100.00 | A– | 796,825 |
| 87,880 | | Total Education and Civic Organizations | | | 94,961,959 |
| | Health Care – 35.3% (22.2% of Total Investments) | | | |
| 17,315 | | Allegheny County Hospital Development Authority, Pennsylvania, Revenue Bonds, Allegheny | 4/28 at 100.00 | A | 18,922,525 |
| | Health Network Obligated Group Issue, Series 2018A, 4.000%, 4/01/44 | | | |
| | Allegheny County Hospital Development Authority, Pennsylvania, Revenue Bonds, University | | | |
| | of Pittsburgh Medical Center, Series 2019A: | | | |
| 210 | | 4.000%, 7/15/35 | 7/29 at 100.00 | A | 240,803 |
| 1,000 | | 4.000%, 7/15/37 | 7/29 at 100.00 | A | 1,138,710 |
| 1,310 | | 4.000%, 7/15/38 | 7/29 at 100.00 | A | 1,487,413 |
| | Berks County Industrial Development Authority, Pennsylvania, Health System Revenue | | | |
| | Bonds, Tower Health Project, Series 2017: | | | |
| 10,110 | | 5.000%, 11/01/50 | 11/27 at 100.00 | BB– | 11,000,287 |
| 4,100 | | 5.000%, 11/01/50 (UB) (4) | 11/27 at 100.00 | BB– | 4,461,046 |
| 3,300 | | Berks County Municipal Authority, Pennsylvania, Revenue Bonds, Reading Hospital & | 5/22 at 100.00 | BB+ | 3,339,996 |
| | Medical Center Project, Series 2012A, 4.500%, 11/01/41 | | | |
| 10,355 | | Bucks County Industrial Development Authority, Pennsylvania, Hospital Revenue Bonds, | 8/30 at 100.00 | A– | 10,421,168 |
| | Saint Luke’s University Health Network Project, Series 2021, 3.000%, 8/15/53 | | | |
| | Centre County Hospital Authority, Pennsylvania, Hospital Revenue Bonds, Mount Nittany | | | |
| | Medical Center Project, Series 2016A: | | | |
| 805 | | 5.000%, 11/15/41 | 11/25 at 100.00 | AA– | 923,496 |
| 2,985 | | 5.000%, 11/15/46 | 11/25 at 100.00 | AA– | 3,411,616 |
| | Chester County Health and Education Facilities Authority, Pennsylvania, Health System | | | |
| | Revenue Bonds, Main Line Health System, Series 2017A: | | | |
| 3,200 | | 4.000%, 10/01/36 | 10/27 at 100.00 | AA | 3,636,768 |
| 1,935 | | 4.000%, 10/01/37 | 10/27 at 100.00 | AA | 2,193,381 |
| 6,395 | | Chester County Health and Education Facilities Authority, Pennsylvania, Health System | 9/30 at 100.00 | AA | 7,350,093 |
| | Revenue Bonds, Main Line Health System, Series 2020A, 4.000%, 9/01/50 | | | |
| | Dauphin County General Authority, Pennsylvania, Health System Revenue Bonds, Pinnacle | | | |
| | Health System Project, Refunding Series 2016A: | | | |
| 1,375 | | 5.000%, 6/01/34 | 6/26 at 100.00 | A | 1,615,735 |
| 375 | | 5.000%, 6/01/35 | 6/26 at 100.00 | A | 439,020 |
| 3,460 | | Dauphin County General Authority, Pennsylvania, Health System Revenue Bonds, Pinnacle | 6/22 at 100.00 | A | 3,600,268 |
| | Health System Project, Series 2012A, 5.000%, 6/01/42 | | | |
| 1,500 | | Doylestown Hospital Authority, Pennsylvania, Hospital Revenue Bonds, Series 2013A, | 7/23 at 100.00 | BBB– | 1,596,120 |
| | 5.000%, 7/01/28 | | | |
| 2,275 | | Doylestown Hospital Authority, Pennsylvania, Hospital Revenue Bonds, Series 2016A, | 7/26 at 100.00 | BBB– | 2,488,327 |
| | 5.000%, 7/01/41 | | | |
| 1,225 | | Doylestown Hospital Authority, Pennsylvania, Hospital Revenue Bonds, Series 2019A, | 7/29 at 100.00 | BBB– | 1,267,765 |
| | 4.000%, 7/01/45 | | | |
| 5,000 | | Dubois Hospital Authority, Pennsylvania, Hospital Revenue Bonds, Penn Highlands | 1/28 at 100.00 | A– | 5,699,950 |
| | Healthcare, Series 2018, 5.000%, 7/15/48 | | | |
| 4,555 | | Geisinger Authority, Montour County, Pennsylvania, Health System Revenue Bonds, | 6/24 at 100.00 | AA– | 5,051,586 |
| | Geisinger Health System, Series 2014A, 5.000%, 6/01/41 | | | |
| 10,000 | | Geisinger Authority, Montour County, Pennsylvania, Health System Revenue Bonds, | 4/30 at 100.00 | AA– | 11,304,300 |
| | Geisinger Health System, Series 2020A, 4.000%, 4/01/50 | | | |
| 1,370 | | Indiana County Hospital Authority, Pennsylvania, Hospital Revenue Bonds, Indiana | 6/23 at 100.00 | Ba3 | 1,439,980 |
| | Regional Medical Center, Series 2014A, 6.000%, 6/01/39 | | | |
56
| | | | | | |
| Principal | | | Optional Call | | |
| Amount (000) | | Description (1) | Provisions (2) | Ratings (3) | Value |
| | Health Care (continued) | | | |
| $ 2,200 | | Lancaster County Hospital Authority, Revenue Bonds, University of Pennsylvania Health | 8/26 at 100.00 | AA | $ 2,602,864 |
| | System, Refunding Series 2016B, 5.000%, 8/15/46 (UB) (4) | | | |
| 3,000 | | Lancaster County Hospital Authority, Revenue Bonds, University of Pennsylvania Health | 8/26 at 100.00 | AA | 3,571,080 |
| | System, Series 2016A, 5.000%, 8/15/42 (UB) (4) | | | |
| 3,450 | | Lehigh County General Purpose Authority, Pennsylvania, Hospital Revenue Bonds, Lehigh | 7/26 at 100.00 | A+ | 3,832,398 |
| | Valley Health Network, Refunding Series 2016A, 4.000%, 7/01/35 | | | |
| 2,565 | | Lehigh County General Purpose Authority, Pennsylvania, Hospital Revenue Bonds, Lehigh | 7/22 at 100.00 | A+ | 2,629,817 |
| | Valley Health Network, Series 2012B, 4.000%, 7/01/43 | | | |
| | Lehigh County General Purpose Authority, Pennsylvania, Revenue Bonds, Good Shepherd | | | |
| | Group, Refunding Series 2016: | | | |
| 1,265 | | 3.000%, 11/01/36 | 5/26 at 100.00 | A | 1,304,367 |
| 2,850 | | 4.000%, 11/01/41 (UB) (4) | 5/26 at 100.00 | A | 3,049,414 |
| 4,955 | | 4.000%, 11/01/46 (UB) (4) | 5/26 at 100.00 | A | 5,245,165 |
| | Monroe County Hospital Authority, Pennsylvania, Hospital Revenue Bonds, Pocono Medical | | | |
| | Center, Series 2016: | | | |
| 1,020 | | 3.375%, 7/01/32 | 7/26 at 100.00 | A+ | 1,094,848 |
| 2,650 | | 5.000%, 7/01/41 | 7/26 at 100.00 | A+ | 3,070,608 |
| 7,500 | | Montgomery County Industrial Development Authority, Pennsylvania, Health System Revenue | 1/25 at 100.00 | Ba1 | 8,220,450 |
| | Bonds, Albert Einstein Healthcare Network Issue, Series 2015A, 5.250%, 1/15/45 | | | |
| 4,000 | | Pennsylvania Economic Development Financing Authority, Revenue Bonds, University of | 7/23 at 100.00 | A | 4,346,040 |
| | Pittsburgh Medical Center, Series 2013A, 5.000%, 7/01/43 | | | |
| 16,385 | | Pennsylvania Higher Educational Facilities Authority, Revenue Bonds, University of | 8/26 at 100.00 | AA | 18,155,235 |
| | Pennsylvania Health System, Refunding Series 2016C, 4.000%, 8/15/41 (UB) (4) | | | |
| 3,100 | | Pennsylvania Higher Educational Facilities Authority, Revenue Bonds, University of | 8/22 at 100.00 | AA | 3,272,577 |
| | Pennsylvania Health System, Series 2012A, 5.000%, 8/15/42 | | | |
| 13,525 | | Pennsylvania Higher Educational Facilities Authority, Revenue Bonds, University of | 8/29 at 100.00 | AA | 15,221,305 |
| | Pennsylvania Health System, Series 2019, 4.000%, 8/15/49 (UB) (4) | | | |
| 7,305 | | Philadelphia Hospitals and Higher Education Facilities Authority, Pennsylvania, Hospital | 7/21 at 100.00 | AA | 7,391,053 |
| | Revenue Bonds, Children’s Hospital of Philadelphia, Series 2011C, 5.000%, 7/01/41 | | | |
| 4,885 | | Philadelphia Hospitals and Higher Education Facilities Authority, Pennsylvania, Hospital | 7/22 at 100.00 | BBB– | 5,137,310 |
| | Revenue Bonds, Temple University Health System Obligated Group, Series 2012A, 5.625%, 7/01/42 | | | |
| 1,800 | | Philadelphia Hospitals and Higher Education Facilities Authority, Pennsylvania, Hospital | 7/27 at 100.00 | BBB– | 2,077,416 |
| | Revenue Bonds, Temple University Health System Obligated Group, Series of 2017, 5.000%, 7/01/30 | | | |
| | Pocono Mountains Industrial Park Authority, Pennsylvania, Hospital Revenue Bonds, Saint | | | |
| | Luke’s Hospital -Monroe Project, Series 2015A: | | | |
| 3,000 | | 5.000%, 8/15/40 | 2/25 at 100.00 | A– | 3,331,920 |
| 1,170 | | 4.000%, 8/15/45 | 2/25 at 100.00 | A– | 1,238,164 |
| 3,000 | | Pottsville Hospital Authority, Pennsylvania, Hospital Revenue Bonds, Lehigh Valley | 1/27 at 100.00 | A+ | 3,483,510 |
| | Health Network, Series 2016B, 5.000%, 7/01/45 | | | |
| 2,000 | | Saint Mary Hospital Authority, Pennsylvania, Hospital Revenue Bonds, Trinity Health | 12/28 at 100.00 | AA– | 2,416,680 |
| | Credit Group, Refunding Series 2019PA, 5.000%, 12/01/48 | | | |
| 2,000 | | Southcentral Pennsylvania General Authority, Revenue Bonds, Wellspan Health Obligated | 6/29 at 100.00 | Aa3 | 2,440,140 |
| | Group, Series 2019A, 5.000%, 6/01/49 | | | |
| 685 | | Westmoreland County Industrial Development Authority, Pennsylvania, Revenue Bonds, | 1/31 at 100.00 | Baa1 | 773,653 |
| | Excela Health Project, Series 2020A, 4.000%, 7/01/37 | | | |
| 188,465 | | Total Health Care | | | 206,936,367 |
| | Housing/Multifamily – 1.2% (0.7% of Total Investments) | | | |
| 160 | | Chester County Industrial Development Authority, Pennsylvania, Student Housing Revenue | 8/23 at 100.00 | Ba2 | 160,904 |
| | Bonds, University Student Housing, LLC Project at West Chester University Series 2013A, | | | |
| | 5.000%, 8/01/45 | | | |
| 1,650 | | Clarion County Industrial Development Authority, Pennsylvania, Revenue Bonds, Clarion | 7/24 at 100.00 | A1 | 1,797,394 |
| | University Foundation Inc Student Housing Project at Clarion University, Series 2014A, | | | |
| | 5.000%, 7/01/45 | | | |
57
| | |
| NQP | Nuveen Pennsylvania Quality Municipal Income Fund Portfolio of Investments (continued) February 28, 2021 |
| | | | | | |
| Principal | | | Optional Call | | |
| Amount (000) | | Description (1) | Provisions (2) | Ratings (3) | Value |
| | Housing/Multifamily (continued) | | | |
| $ 1,235 | | East Hempfield Township Industrial Development Authority, Pennsylvania, Student Services | 7/24 at 100.00 | BB+ | $ 1,257,267 |
| | Inc – Student Housing Project at Millersville University, Series 2014, 5.000%, 7/01/46 | | | |
| 1,900 | | East Hempfield Township Industrial Development Authority, Pennsylvania, Student Services | 7/25 at 100.00 | BB+ | 1,943,358 |
| | Inc – Student Housing Project at Millersville University, Series 2015, 5.000%, 7/01/47 | | | |
| 270 | | Pennsylvania Higher Educational Facilities Authority, Revenue Bonds, University | 7/26 at 100.00 | Baa3 | 291,981 |
| | Properties Inc Student Housing Project at East Stroudsburg University of Pennsylvania, Series | | | |
| | 2016A, 5.000%, 7/01/31 | | | |
| 1,517 | | Philadelphia Authority for Industrial Development, Pennsylvania, Multifamily Housing | 3/21 at 100.00 | Baa3 | 1,517,728 |
| | Revenue Bonds, Presbyterian Homes Germantown – Morrisville Project, Series 2005A, | | | |
| | 5.625%, 7/01/35 | | | |
| 6,732 | | Total Housing/Multifamily | | | 6,968,632 |
| | Housing/Single Family – 17.3% (10.9% of Total Investments) | | | |
| | Pennsylvania Housing Finance Agency, Single Family Mortgage Revenue Bonds, Series 2012-114: | | | |
| 4,750 | | 3.300%, 10/01/32 (UB) (4) | 10/21 at 100.00 | AA+ | 4,799,637 |
| 4,425 | | 3.650%, 10/01/37 | 10/21 at 100.00 | AA+ | 4,466,728 |
| 2,275 | | 3.650%, 10/01/37 (UB) (4) | 10/21 at 100.00 | AA+ | 2,296,453 |
| 1,830 | | 3.700%, 10/01/42 (UB) (4) | 10/21 at 100.00 | AA+ | 1,847,751 |
| 3,290 | | Pennsylvania Housing Finance Agency, Single Family Mortgage Revenue Bonds, Series | 10/24 at 100.00 | AA+ | 3,435,089 |
| | 2015-117B, 3.900%, 10/01/35 (UB) (4) | | | |
| 1,985 | | Pennsylvania Housing Finance Agency, Single Family Mortgage Revenue Bonds, Series | 4/25 at 100.00 | AA+ | 2,048,123 |
| | 2016-119, 3.500%, 10/01/36 | | | |
| 6,730 | | Pennsylvania Housing Finance Agency, Single Family Mortgage Revenue Bonds, Series | 10/25 at 100.00 | AA+ | 6,951,686 |
| | 2016-120, 3.200%, 4/01/40 (UB) (4) | | | |
| 22,450 | | Pennsylvania Housing Finance Agency, Single Family Mortgage Revenue Bonds, Series | 10/25 at 100.00 | AA+ | 23,125,072 |
| | 2016-121, 3.200%, 10/01/41 (UB) (4) | | | |
| | Pennsylvania Housing Finance Agency, Single Family Mortgage Revenue Bonds, Series | | | |
| | 2017-122: | | | |
| 2,000 | | 3.650%, 10/01/32 (UB) (4) | 4/26 at 100.00 | AA+ | 2,113,480 |
| 5,380 | | 3.900%, 10/01/36 (UB) (4) | 4/21 at 100.00 | AA+ | 5,396,086 |
| | Pennsylvania Housing Finance Agency, Single Family Mortgage Revenue Bonds, Series | | | |
| | 2017-123B: | | | |
| 4,160 | | 3.450%, 10/01/32 (UB) (4) | 10/26 at 100.00 | AA+ | 4,453,114 |
| 2,245 | | 3.900%, 10/01/37 (UB) (4) | 4/21 at 100.00 | AA+ | 2,251,713 |
| 5,000 | | Pennsylvania Housing Finance Agency, Single Family Mortgage Revenue Bonds, Series | 10/26 at 100.00 | AA+ | 5,206,850 |
| | 2017-124B, 3.500%, 10/01/37 (UB) (4) | | | |
| 2,400 | | Pennsylvania Housing Finance Agency, Single Family Mortgage Revenue Bonds, Series | 4/27 at 100.00 | AA+ | 2,559,600 |
| | 2018-126A, 3.700%, 10/01/33 (UB) (4) | | | |
| 1,000 | | Pennsylvania Housing Finance Agency, Single Family Mortgage Revenue Bonds, Series | 10/28 at 100.00 | AA+ | 1,019,540 |
| | 2019-130A, 3.000%, 10/01/46 | | | |
| 3,880 | | Pennsylvania Housing Finance Agency, Single Family Mortgage Revenue Bonds, Series | 4/29 at 100.00 | AA+ | 4,073,418 |
| | 2019-131A, 3.000%, 10/01/39 | | | |
| | Pennsylvania Housing Finance Agency, Single Family Mortgage Revenue Bonds, Series | | | |
| | 2020-132A: | | | |
| 2,000 | | 2.550%, 10/01/41 | 10/29 at 100.00 | AA+ | 2,026,100 |
| 10,000 | | 2.550%, 10/01/41 (UB) (4) | 10/29 at 100.00 | AA+ | 10,130,500 |
| | Pennsylvania Housing Finance Agency, Single Family Mortgage Revenue Bonds, Series | | | |
| | 2020-133: | | | |
| 1,000 | | 2.350%, 10/01/40 | 10/29 at 100.00 | AA+ | 1,012,830 |
| 1,350 | | 2.500%, 10/01/45 | 10/29 at 100.00 | AA+ | 1,363,932 |
| | Pennsylvania Housing Finance Agency, Single Family Mortgage Revenue Bonds, Social Series | | | |
| | 2020-134A: | | | |
| 5,000 | | 1.850%, 4/01/36, (WI/DD, Settling 3/31/21) | 10/29 at 100.00 | AA+ | 4,861,000 |
| 3,650 | | 2.050%, 4/01/41, (WI/DD, Settling 3/31/21) | 10/29 at 100.00 | AA+ | 3,512,432 |
| 2,650 | | 2.100%, 10/01/43, (WI/DD, Settling 3/31/21) | 10/29 at 100.00 | AA+ | 2,538,886 |
| 99,450 | | Total Housing/Single Family | | | 101,490,020 |
58
| | | | | | |
| Principal | | | Optional Call | | |
| Amount (000) | | Description (1) | Provisions (2) | Ratings (3) | Value |
| | Industrials – 2.2% (1.4% of Total Investments) | | | |
| $ 500 | | Pennsylvania Economic Development Financing Authority, Exempt Facilities Revenue Bonds, | 6/30 at 100.00 | N/R | $ 533,715 |
| | KDC Agribusiness Fairless Hills LLC Project, Series 2020A-1, 10.000%, 12/01/40, 144A | | | |
| 500 | | Pennsylvania Economic Development Financing Authority, Exempt Facilities Revenue Bonds, | 6/30 at 100.00 | N/R | 533,715 |
| | KDC Agribusiness Fairless Hills LLC Project, Series 2020A-2, 10.000%, 12/01/40 (AMT), 144A | | | |
| 6,455 | | Pennsylvania Economic Development Financing Authority, Exempt Facilities Revenue Bonds, | 11/24 at 100.00 | N/R | 6,701,258 |
| | National Gypsum Company, Refunding Series 2014, 5.500%, 11/01/44 (AMT) | | | |
| | Pennsylvania Economic Development Financing Authority, Exempt Facilities Revenue | | | |
| | Refunding Bonds, Amtrak Project, Series 2012A: | | | |
| 2,495 | | 5.000%, 11/01/23 (AMT) | 11/22 at 100.00 | A1 | 2,674,341 |
| 545 | | 5.000%, 11/01/27 (AMT) | 11/22 at 100.00 | A1 | 582,856 |
| 2,000 | | 5.000%, 11/01/41 (AMT) | 11/22 at 100.00 | A1 | 2,126,200 |
| 12,495 | | Total Industrials | | | 13,152,085 |
| | Long-Term Care – 6.2% (3.8% of Total Investments) | | | |
| | Berks County Industrial Development Authority, Pennsylvania, Healthcare Facilities | | | |
| | Revenue Bonds, Highlands at Wyomissing, Series 2017A: | | | |
| 940 | | 5.000%, 5/15/37 | 5/27 at 100.00 | BBB | 1,063,826 |
| 1,160 | | 5.000%, 5/15/47 | 5/27 at 100.00 | BBB | 1,291,068 |
| | Berks County Industrial Development Authority, Pennsylvania, Healthcare Facilities | | | |
| | Revenue Bonds, The Highlands at Wyomissing, Series 2018: | | | |
| 1,000 | | 5.000%, 5/15/43 | 5/25 at 102.00 | BBB | 1,101,890 |
| 400 | | 5.000%, 5/15/48 | 5/25 at 102.00 | BBB | 439,244 |
| 230 | | Chester County Health and Education Facilities Authority, Pennsylvania, Revenue Bonds, | 12/25 at 100.00 | N/R | 237,130 |
| | Simpson Senior Services Project, Series 2015A, 5.000%, 12/01/35 | | | |
| 1,760 | | Chester County Health and Education Facilities Authority, Pennsylvania, Revenue Bonds, | 12/25 at 103.00 | N/R | 1,792,683 |
| | Simpson Senior Services Project, Series 2019, 5.000%, 12/01/51 | | | |
| 3,005 | | Cumberland County Municipal Authority, Pennsylvania, Revenue Bonds, Asbury Pennsylvania | 1/25 at 104.00 | N/R | 3,235,213 |
| | Obligated Group, Refunding Series 2019, 5.000%, 1/01/45 | | | |
| | Cumberland County Municipal Authority, Pennsylvania, Revenue Bonds, Diakon Lutheran | | | |
| | Social Ministries Project, Series 2015: | | | |
| 3,755 | | 4.000%, 1/01/33 | 1/25 at 100.00 | BBB+ | 3,966,482 |
| 5,180 | | 5.000%, 1/01/38 | 1/25 at 100.00 | BBB+ | 5,699,865 |
| | Cumberland County Municipal Authority, Pennsylvania, Revenue Bonds, Diakon Lutheran | | | |
| | Social Ministries Project, Series 2016: | | | |
| 985 | | 5.000%, 1/01/28 | 1/26 at 100.00 | BBB+ | 1,135,607 |
| 1,815 | | 5.000%, 1/01/29 | 1/26 at 100.00 | BBB+ | 2,086,143 |
| 735 | | 5.000%, 1/01/30 | 1/26 at 100.00 | BBB+ | 840,767 |
| 300 | | 3.250%, 1/01/36 | 1/26 at 100.00 | BBB+ | 308,517 |
| 1,405 | | 3.250%, 1/01/39 | 1/26 at 100.00 | N/R | 1,437,174 |
| | Cumberland County Municipal Authority, Pennsylvania, Revenue Bonds, Diakon Lutheran | | | |
| | Social Ministries Project, Series 2019A: | | | |
| 690 | | 4.125%, 1/01/38 | 1/29 at 100.00 | BBB+ | 779,748 |
| 1,410 | | 5.000%, 1/01/39 | 1/29 at 100.00 | BBB+ | 1,660,331 |
| 650 | | Lancaster County Hospital Authority, Pennsylvania, Health Center Revenue Bonds, Masonic | 5/25 at 100.00 | A | 714,519 |
| | Villages Project, Series 2015, 5.000%, 11/01/35 | | | |
| 530 | | Lancaster County Hospital Authority, Pennsylvania, Health Center Revenue Bonds, Saint | 4/22 at 100.00 | BB+ | 539,079 |
| | Anne’s Retirement Community, Inc, Series 2012, 5.000%, 4/01/33 | | | |
| | Lancaster County Hospital Authority, Pennsylvania, Health Center Revenue Bonds, Saint | | | |
| | Anne’s Retirement Community, Inc, Series 2020: | | | |
| 975 | | 5.000%, 3/01/40 | 3/27 at 102.00 | BB+ | 1,056,617 |
| 715 | | 5.000%, 3/01/50 | 3/27 at 102.00 | BB+ | 766,051 |
| 1,250 | | Lancaster County Hospital Authority, Pennsylvania, Revenue Bonds, Landis Homes | 7/25 at 100.00 | BBB– | 1,339,213 |
| | Retirement Community Project, Refunding Series 2015A, 5.000%, 7/01/45 | | | |
| 1,500 | | Langhorne Manor Boro Higher Education and Health Authority, Pennsylvania, Revenue Bonds, | 3/21 at 100.00 | A– | 1,502,295 |
| | Woods Services Project, Series 2013, 4.000%, 11/15/38 | | | |
59
| | |
| NQP | Nuveen Pennsylvania Quality Municipal Income Fund Portfolio of Investments (continued) February 28, 2021 |
| | | | | | |
| Principal | | | Optional Call | | |
| Amount (000) | | Description (1) | Provisions (2) | Ratings (3) | Value |
| | Long-Term Care (continued) | | | |
| | Northampton County Industrial Development Authority, Pennsylvania, Revenue Bonds, | | | |
| | Morningstar Senior Living, Inc, Series 2019: | | | |
| $ 1,845 | | 5.000%, 11/01/44 | 11/26 at 103.00 | BB+ | $ 1,959,427 |
| 1,000 | | 5.000%, 11/01/49 | 11/26 at 103.00 | BB+ | 1,060,530 |
| 33,235 | | Total Long-Term Care | | | 36,013,419 |
| | Tax Obligation/General – 18.8% (11.8% of Total Investments) | | | |
| 840 | | Adams County, Pennsylvania, General Obligation Bonds, Series 2017B, 2.500%, 11/15/29 | 11/25 at 100.00 | Aa2 | 890,392 |
| | Allegheny County, Pennsylvania, General Obligation Bonds, Series 2014C-74: | | | |
| 1,750 | | 5.000%, 12/01/32 | 12/24 at 100.00 | AA– | 2,024,802 |
| 1,285 | | 5.000%, 12/01/34 | 12/24 at 100.00 | AA– | 1,484,727 |
| 2,400 | | Allegheny County, Pennsylvania, General Obligation Bonds, Series 2018C-77, | 11/28 at 100.00 | AA– | 2,952,576 |
| | 5.000%, 11/01/43 | | | |
| | Bethel Park School District, Allegheny County, Pennsylvania, General Obligation Bonds, | | | |
| | Refunding Series 2016: | | | |
| 1,500 | | 4.000%, 8/01/31 | 8/26 at 100.00 | Aa2 | 1,729,005 |
| 1,255 | | 4.000%, 8/01/33 | 8/26 at 100.00 | Aa2 | 1,440,502 |
| 1,950 | | Boyertown Area School District, Berks and Montgomery Counties, Pennsylvania, General | 4/24 at 100.00 | AA– | 2,193,243 |
| | Obligation Bonds, Series 2015, 5.000%, 10/01/38 | | | |
| | Canon-McMillan School District, Washington County, Pennsylvania, General Obligation | | | |
| | Bonds, Series 2014D: | | | |
| 3,000 | | 5.000%, 12/15/37 | 12/24 at 100.00 | AA | 3,426,900 |
| 1,075 | | 5.000%, 12/15/38 – BAM Insured | 12/24 at 100.00 | AA | 1,226,693 |
| 1,100 | | 5.000%, 12/15/39 | 12/24 at 100.00 | AA | 1,255,221 |
| 2,900 | | Colonial School District, Montgomery County, Pennsylvania, General Obligation Bonds, | 2/27 at 100.00 | Aaa | 3,480,899 |
| | Series 2020, 5.000%, 2/15/44 | | | |
| 7,465 | | Erie City School District, Erie County, Pennsylvania, General Obligation Bonds, Series | No Opt. Call | N/R | 5,993,574 |
| | 2000, 0.000%, 9/01/30 – AMBAC Insured | | | |
| 650 | | Lancaster School District, Lancaster County, Pennsylvania, General Obligation Bonds, | 12/28 at 100.00 | AA | 762,976 |
| | Series 2020, 4.000%, 6/01/36 – AGM Insured | | | |
| 6,225 | | Lehighton Area School District, Carbon County, Pennsylvania, General Obligation Bonds, | 11/23 at 100.00 | AA | 6,879,745 |
| | Limited Tax Series 2015A, 5.000%, 11/15/43 – BAM Insured | | | |
| | North Allegheny School District, Allegheny County, Pennsylvania, General Obligation | | | |
| | Bonds, Series 2015: | | | |
| 5,000 | | 5.000%, 5/01/31 | 5/25 at 100.00 | AA | 5,873,650 |
| 4,000 | | 5.000%, 5/01/32 | 5/25 at 100.00 | AA | 4,695,320 |
| 2,875 | | 5.000%, 5/01/33 | 5/25 at 100.00 | AA | 3,370,909 |
| | Penn Manor School District, Lancaster County, Pennsylvania, General Obligation Bonds, | | | |
| | Series 2019A: | | | |
| 1,000 | | 4.000%, 3/01/35 | 9/27 at 100.00 | AA | 1,142,070 |
| 1,000 | | 4.000%, 3/01/36 | 9/27 at 100.00 | AA | 1,138,130 |
| | Pennsbury School District, Bucks County, Pennsylvania, General Obligation Bonds, Series 2016A: | | | |
| 1,000 | | 5.000%, 10/01/33 | 4/25 at 100.00 | Aa3 | 1,169,020 |
| 1,860 | | 5.000%, 10/01/34 | 4/25 at 100.00 | Aa3 | 2,171,104 |
| 2,045 | | 5.000%, 10/01/35 | 4/25 at 100.00 | Aa3 | 2,382,568 |
| 2,620 | | Pennsylvania Economic Development Financing Authority, Parking System Revenue Bonds, | 1/24 at 100.00 | AA | 2,952,059 |
| | Capitol Region Parking System, Junior Insured Series 2013C, 5.500%, 1/01/30 – AGM Insured | | | |
| 3,925 | | Philadelphia School District, Pennsylvania, General Obligation Bonds, Series 2007A, | No Opt. Call | A+ | 5,418,423 |
| | 5.000%, 6/01/34 – NPFG Insured | | | |
| 745 | | Pittsburgh School District, Allegheny County, Pennsylvania, General Obligation Bonds, | 9/22 at 100.00 | AA | 797,418 |
| | Series 2014A, 5.000%, 9/01/25 – BAM Insured | | | |
60
| | | | | | |
| Principal | | | Optional Call | | |
| Amount (000) | | Description (1) | Provisions (2) | Ratings (3) | Value |
| | Tax Obligation/General (continued) | | | |
| $ 11,440 | | Reading School District, Berks County, Pennsylvania, General Obligation Bonds, Series | No Opt. Call | Baa2 | $ 8,703,781 |
| | 2003B, 0.000%, 1/15/32 – NPFG Insured | | | |
| | Scranton, Lackawanna County, Pennsylvania, General Obligation Notes, Series 2016: | | | |
| 250 | | 5.000%, 11/15/26 | 5/24 at 100.00 | BB+ | 270,950 |
| 2,925 | | 5.000%, 11/15/32 | 5/24 at 100.00 | BB+ | 3,118,606 |
| 21,000 | | State Public School Building Authority, Pennsylvania, Lease Revenue Bonds, Philadelphia | No Opt. Call | AA | 26,839,470 |
| | School District, Series 2003, 5.500%, 6/01/28 – AGM Insured (UB) (4) | | | |
| | The Redevelopment Authority of the City of Scranton, Lackawanna county, Pennsylvania, | | | |
| | Guaranteed Lease Revenue Bonds, Series 2016A: | | | |
| 85 | | 5.000%, 11/15/21 | No Opt. Call | BB+ | 85,696 |
| 170 | | 5.000%, 11/15/28 | 5/24 at 100.00 | BB+ | 173,924 |
| | Upper Dublin School District, Montgomery County, Pennsylvania, General Obligation Bonds, | | | |
| | Series 2021A: | | | |
| 400 | | 4.000%, 9/15/28 | No Opt. Call | Aa3 | 483,704 |
| 450 | | 4.000%, 9/15/31 | 3/29 at 100.00 | Aa3 | 532,728 |
| 670 | | 4.000%, 9/15/34 | 3/29 at 100.00 | Aa3 | 783,304 |
| 1,000 | | 4.000%, 9/15/38 | 3/29 at 100.00 | Aa3 | 1,149,820 |
| 400 | | 4.000%, 9/15/40 | 3/29 at 100.00 | Aa3 | 457,728 |
| 500 | | Upper Dublin School District, Montgomery County, Pennsylvania, General Obligation Bonds, | No Opt. Call | Aa3 | 596,005 |
| | Series 2021AA, 4.000%, 9/15/27 | | | |
| 98,755 | | Total Tax Obligation/General | | | 110,047,642 |
| | Tax Obligation/Limited – 9.8% (6.2% of Total Investments) | | | |
| 1,070 | | Allegheny County Redevelopment Authority, Pennsylvania, TIF Revenue Bonds, Pittsburg | 3/21 at 100.00 | N/R | 963,000 |
| | Mills Project, Series 2004, 5.600%, 7/01/23 (5) | | | |
| 1,475 | | Allentown Neighborhood Improvement Zone Development Authority, Pennsylvania, Tax | 5/22 at 100.00 | Baa3 | 1,534,295 |
| | Revenue Bonds, Series 2012A, 5.000%, 5/01/35 | | | |
| 205 | | Allentown Neighborhood Improvement Zone Development Authority, Pennsylvania, Tax Revenue | 5/31 at 100.00 | N/R | 248,577 |
| | Bonds, 615 Waterfront Project, Senior Series 2021, 6.000%, 5/01/42, 144A | | | |
| 155 | | Allentown Neighborhood Improvement Zone Development Authority, Pennsylvania, Tax Revenue | 5/28 at 100.00 | Baa3 | 180,598 |
| | Bonds, City Center Project, Series 2018, 5.000%, 5/01/33, 144A | | | |
| 1,115 | | Allentown Neighborhood Improvement Zone Development Authority, Pennsylvania, Tax Revenue | 5/27 at 100.00 | Baa3 | 1,265,101 |
| | Bonds, City Center Refunding Project, Series 2017, 5.000%, 5/01/42, 144A | | | |
| 1,400 | | Chester, Delaware County, Pennsylvania, Tax and Revenue Anticipation Notes, Series 2021, | 7/21 at 100.00 | N/R | 1,397,444 |
| | 4.500%, 11/30/21, 144A | | | |
| | Commonwealth Financing Authority, Pennsylvania, State Appropriation Lease Bonds, Master | | | |
| | Settlement, Series 2018: | | | |
| 1,135 | | 5.000%, 6/01/33 | 6/28 at 100.00 | A1 | 1,389,819 |
| 1,180 | | 4.000%, 6/01/39 – AGM Insured | 6/28 at 100.00 | AA | 1,335,052 |
| 7,215 | | 4.000%, 6/01/39 – AGM Insured (UB) (4) | 6/28 at 100.00 | AA | 8,163,051 |
| | Government of Guam, Business Privilege Tax Bonds, Series 2011A: | | | |
| 1,670 | | 5.250%, 1/01/36 | 1/22 at 100.00 | BB | 1,713,954 |
| 655 | | 5.125%, 1/01/42 | 1/22 at 100.00 | BB | 669,934 |
| 1,578 | | Monroe County Industrial Development Authority, Pennsylvania, Special Obligation Revenue | 7/24 at 100.00 | N/R | 1,623,257 |
| | Bonds, Tobyhanna Township Project, Series 2014, 6.875%, 7/01/33, 144A | | | |
| | Pennsylvania Turnpike Commission, Motor License Fund-Enhanced Turnpike Subordinate | | | |
| | Special Revenue Bonds, Series 2014A: | | | |
| 2,650 | | 0.000%, 12/01/37 (6) | 12/26 at 100.00 | AA– | 2,909,037 |
| 4,000 | | 0.000%, 12/01/44 (6) | 12/26 at 100.00 | AA– | 4,358,360 |
| 2,500 | | Pennsylvania Turnpike Commission, Oil Franchise Tax Revenue Bonds, Subordinate Series | 12/28 at 100.00 | A+ | 2,975,525 |
| | 2018B, 5.000%, 12/01/48 | | | |
| 5,530 | | Philadelphia Authority For Industrial Development, Pennsylvania, City Agreement Revenue | 12/25 at 100.00 | A | 6,581,253 |
| | Bonds, Cultural and Commercial Corridors Program, Refunding Series 2016A, 5.000%, 12/01/30 | | | |
61
| | |
| NQP | Nuveen Pennsylvania Quality Municipal Income Fund Portfolio of Investments (continued) February 28, 2021 |
| | | | | | |
| Principal | | | Optional Call | | |
| Amount (000) | | Description (1) | Provisions (2) | Ratings (3) | Value |
| | Tax Obligation/Limited (continued) | | | |
| $ 3,820 | | Pittsburgh and Allegheny County Sports and Exhibition Authority, Pennsylvania, Hotel | 8/22 at 100.00 | AA | $ 4,048,627 |
| | Room Excise Tax Revenue Bonds, Refunding Series 2012, 5.000%, 2/01/26 – AGM Insured | | | |
| 4,225 | | Puerto Rico Highway and Transportation Authority, Highway Revenue Bonds, Series 2007N, | No Opt. Call | C | 4,759,082 |
| | 5.500%, 7/01/29 – AMBAC Insured | | | |
| | Puerto Rico Sales Tax Financing Corporation, Sales Tax Revenue Bonds, Restructured 2018A-1: | | | |
| 1,455 | | 4.750%, 7/01/53 | 7/28 at 100.00 | N/R | 1,588,031 |
| 3,285 | | 5.000%, 7/01/58 | 7/28 at 100.00 | N/R | 3,638,269 |
| | Puerto Rico Sales Tax Financing Corporation, Sales Tax Revenue Bonds, Taxable | | | |
| | Restructured Cofina Project Series 2019A-2: | | | |
| 1,030 | | 4.329%, 7/01/40 | 7/28 at 100.00 | N/R | 1,107,920 |
| 532 | | 4.329%, 7/01/40 | 7/28 at 100.00 | N/R | 572,246 |
| 3,344 | | 4.784%, 7/01/58 | 7/28 at 100.00 | N/R | 3,656,898 |
| 825 | | Washington County Redevelopment Authority, Pennsylvania, Tanger Outlet Victory Center | 1/28 at 100.00 | BB | 889,688 |
| | Tax Increment Bonds, Series 2018, 5.000%, 7/01/35 | | | |
| 52,049 | | Total Tax Obligation/Limited | | | 57,569,018 |
| | Transportation – 10.6% (6.7% of Total Investments) | | | |
| 2,250 | | Delaware River Port Authority, New Jersey and Pennsylvania, Revenue Bonds, Series 2018A, | 1/29 at 100.00 | A+ | 2,743,110 |
| | 5.000%, 1/01/39 | | | |
| | Delaware River Port Authority, Pennsylvania and New Jersey, Revenue Refunding Bonds, | | | |
| | Port District Project, Series 2012: | | | |
| 2,425 | | 5.000%, 1/01/23 | No Opt. Call | A | 2,592,689 |
| 2,310 | | 5.000%, 1/01/24 | 1/23 at 100.00 | A | 2,465,093 |
| 610 | | 5.000%, 1/01/25 | 1/23 at 100.00 | A | 648,473 |
| 4,000 | | Pennsylvania Economic Development Financing Authority, Parking System Revenue Bonds, | 1/24 at 100.00 | AA | 4,344,520 |
| | Capitol Region Parking System, Series 2013A, 5.250%, 1/01/44 – AGM Insured | | | |
| 12,100 | | Pennsylvania Turnpike Commission, Turnpike Revenue Bonds, Capital Appreciation Series | 12/27 at 100.00 | A | 15,923,479 |
| | 2009E, 6.375%, 12/01/38 | | | |
| 820 | | Pennsylvania Turnpike Commission, Turnpike Revenue Bonds, Refunding Subordinate Second | 6/26 at 100.00 | A3 | 962,475 |
| | Series 2016B-2, 5.000%, 6/01/39 | | | |
| 3,000 | | Pennsylvania Turnpike Commission, Turnpike Revenue Bonds, Series 2014C, 5.000%, 12/01/44 | 12/24 at 100.00 | A+ | 3,396,750 |
| 10,470 | | Pennsylvania Turnpike Commission, Turnpike Revenue Bonds, Series 2015B, 5.000%, | 12/25 at 100.00 | A1 | 12,127,820 |
| | 12/01/45 (UB) (4) | | | |
| 2,000 | | Pennsylvania Turnpike Commission, Turnpike Revenue Bonds, Subordinate Series 2009C, | 6/26 at 100.00 | AA | 2,512,740 |
| | 6.250%, 6/01/33 – AGM Insured | | | |
| | Pennsylvania Turnpike Commission, Turnpike Revenue Bonds, Subordinate Series 2017B-1: | | | |
| 1,430 | | 5.000%, 6/01/31 | 6/27 at 100.00 | A3 | 1,723,922 |
| 1,430 | | 5.000%, 6/01/33 | 6/27 at 100.00 | A3 | 1,711,867 |
| 1,500 | | Pennsylvania Turnpike Commission, Turnpike Revenue Bonds, Subordinate Series 2019A, | 12/29 at 100.00 | A3 | 1,699,800 |
| | 4.000%, 12/01/49 | | | |
| 1,000 | | Pennsylvania Turnpike Commission, Turnpike Revenue Bonds, Subordinate Series 2021A, | 12/30 at 100.00 | A | 1,122,000 |
| | 4.000%, 12/01/50 | | | |
| 585 | | Philadelphia, Pennsylvania, Airport Revenue Bonds, Refunding Series 2017A, 3.000%, | 7/27 at 100.00 | AA | 605,528 |
| | 7/01/34 – AGM Insured | | | |
| 1,500 | | Philadelphia, Pennsylvania, Airport Revenue Bonds, Refunding Series 2017B, 5.000%, | 7/27 at 100.00 | A2 | 1,729,530 |
| | 7/01/47 (AMT) | | | |
| 1,725 | | Philadelphia, Pennsylvania, Airport Revenue Bonds, Refunding Series 2020A, 4.000%, 7/01/35 | 7/30 at 100.00 | A2 | 1,992,030 |
| | Pittsburgh and Allegheny County Sports and Exhibition Authority, Pennsylvania, Parking | | | |
| | Revenue Bonds, Series 2017: | | | |
| 1,000 | | 5.000%, 12/15/30 | 12/27 at 100.00 | A | 1,233,380 |
| 500 | | 5.000%, 12/15/33 | 12/27 at 100.00 | A | 611,945 |
| 550 | | 5.000%, 12/15/34 | 12/27 at 100.00 | A | 670,780 |
| 1,000 | | 5.000%, 12/15/36 | 12/27 at 100.00 | A | 1,214,050 |
| 250 | | 5.000%, 12/15/37 | 12/27 at 100.00 | A | 301,687 |
| 52,455 | | Total Transportation | | | 62,333,668 |
62
| | | | | | |
| Principal | | | Optional Call | | |
| Amount (000) | | Description (1) | Provisions (2) | Ratings (3) | Value |
| | U.S. Guaranteed – 22.9% (14.4% of Total Investments) (7) | | | |
| $ 1,700 | | Allegheny County, Pennsylvania, General Obligation Bonds, Series 2011C-65, 5.375%, | 5/21 at 100.00 | AA– | $ 1,714,637 |
| | 5/01/31 (Pre-refunded 5/01/21) | | | |
| | Allegheny County, Pennsylvania, General Obligation Bonds, Series 2013C-72: | | | |
| 2,780 | | 5.250%, 12/01/32 (Pre-refunded 12/01/23) | 12/23 at 100.00 | AA– | 3,160,304 |
| 2,000 | | 5.250%, 12/01/33 (Pre-refunded 12/01/23) | 12/23 at 100.00 | AA– | 2,273,600 |
| 5,100 | | Allegheny County, Pennsylvania, General Obligation Bonds, Series C69-C70 of 2012, | 12/22 at 100.00 | AA– | 5,530,491 |
| | 5.000%, 12/01/37 (Pre-refunded 12/01/22) | | | |
| | Beaver County Hospital Authority, Pennsylvania, Revenue Bonds, Heritage Valley Health | | | |
| | System, Inc, Series 2012: | | | |
| 4,010 | | 5.000%, 5/15/26 (Pre-refunded 5/15/21) | 5/21 at 100.00 | A3 | 4,048,817 |
| 1,910 | | 5.000%, 5/15/27 (Pre-refunded 5/15/21) | 5/21 at 100.00 | A3 | 1,928,489 |
| 2,000 | | 5.000%, 5/15/28 (Pre-refunded 5/15/21) | 5/21 at 100.00 | A3 | 2,019,360 |
| 3,000 | | Bristol Township School District, Bucks County, Pennsylvania, General Obligation Bonds, | 6/23 at 100.00 | A2 | 3,337,350 |
| | Series 2013, 5.250%, 6/01/43 (Pre-refunded 6/01/23) | | | |
| | Bucks County Water and Sewer Authority, Pennsylvania, Revenue Bonds, Tender Option Bond | | | |
| | Trust 2015-XF0123: | | | |
| 825 | | 13.398%, 12/01/29 – AGM Insured, (Pre-refunded 12/01/21), 144A (IF) (4) | 12/21 at 100.00 | AA | 915,181 |
| 1,665 | | 13.411%, 12/01/33 – AGM Insured, (Pre-refunded 12/01/21), 144A (IF) (4) | 12/21 at 100.00 | AA | 1,847,184 |
| 4,000 | | Central Bradford Progress Authority, Pennsylvania, Revenue Bonds, Guthrie Health, | 12/21 at 100.00 | AA– | 4,155,400 |
| | Refunding Series 2011, 5.375%, 12/01/41 (Pre-refunded 12/01/21) | | | |
| 4,100 | | Centre County Hospital Authority, Pennsylvania, Hospital Revenue Bonds, Mount Nittany | 11/21 at 100.00 | AA– | 4,297,169 |
| | Medical Center Project, Series 2011, 7.000%, 11/15/46 (Pre-refunded 11/15/21) | | | |
| | Cumberland County Municipal Authority, Pennsylvania, Revenue Bonds, Diakon Lutheran | | | |
| | Social Ministries Project, Series 2015: | | | |
| 625 | | 4.000%, 1/01/33 (Pre-refunded 1/01/25) | 1/25 at 100.00 | N/R | 704,588 |
| 560 | | 5.000%, 1/01/38 (Pre-refunded 1/01/25) | 1/25 at 100.00 | N/R | 652,473 |
| 610 | | Cumberland County Municipal Authority, Pennsylvania, Revenue Bonds, Diakon Lutheran | 1/26 at 100.00 | N/R | 681,596 |
| | Social Ministries Project, Series 2016, 3.250%, 1/01/39 (Pre-refunded 1/01/26) | | | |
| 6,680 | | Gateway School District, Allegheny County, Pennsylvania, General Obligation Bonds, | 10/22 at 100.00 | A1 | 7,091,354 |
| | Refunding Series 2012, 4.000%, 10/15/32 (Pre-refunded 10/15/22) | | | |
| 3,385 | | Lancaster County Hospital Authority, Pennsylvania, Health System Revenue Bonds, | 1/22 at 100.00 | N/R | 3,787,341 |
| | Lancaster General Hospital Project, Tender Option Bond Trust 2015-XF0065, 13.457%, 7/01/42 | | | |
| | (Pre-refunded 1/01/22), 144A (IF) (4) | | | |
| | Lancaster Industrial Development Authority, Pennsylvania, Revenue Bonds, Garden Spot | | | |
| | Village Project, Series 2013: | | | |
| 1,000 | | 5.375%, 5/01/28 (Pre-refunded 5/01/23) | 5/23 at 100.00 | N/R | 1,109,840 |
| 1,665 | | 5.750%, 5/01/35 (Pre-refunded 5/01/23) | 5/23 at 100.00 | N/R | 1,861,337 |
| 6,685 | | Lehigh County Authority, Pennsylvania, Water and Sewer Revenue Bonds, Allentown | 12/23 at 100.00 | N/R | 7,556,925 |
| | Concession, Series 2013A, 5.125%, 12/01/47 (Pre-refunded 12/01/23) | | | |
| 4,600 | | Lehigh County General Purpose Authority, Pennsylvania, Revenue Bonds, Good Shepherd | 11/22 at 100.00 | A | 4,890,214 |
| | Group, Series 2012, 4.000%, 11/01/32 (Pre-refunded 11/01/22) | | | |
| | Monroe County Hospital Authority, Pennsylvania, Hospital Revenue Bonds, Pocono Medical | | | |
| | Center, Series 2012A: | | | |
| 365 | | 4.000%, 1/01/25 (Pre-refunded 1/01/22) | 1/22 at 100.00 | N/R | 376,133 |
| 3,000 | | 5.000%, 1/01/41 (Pre-refunded 1/01/22) | 1/22 at 100.00 | N/R | 3,116,340 |
| 3,730 | | Montgomery County Higher Education and Health Authority, Pennsylvania, Hospital Revenue | 6/22 at 100.00 | N/R | 3,951,450 |
| | Bonds, Abington Memorial Hospital Obligated Group, Series 2012A, 5.000%, 6/01/31 | | | |
| | (Pre-refunded 6/01/22) | | | |
| 925 | | Montgomery County Industrial Development Authority, Pennsylvania, Health Facilities | 4/22 at 100.00 | Aa3 | 973,627 |
| | Revenue Bonds, Jefferson Health System, Series 2012A, 5.000%, 10/01/41 (Pre-refunded 4/01/22) | | | |
| 2,150 | | Montgomery County Industrial Development Authority, Pennsylvania, Revenue Bonds, ACTS | 5/22 at 100.00 | A– | 2,275,796 |
| | Retirement-Life Communities, Inc Obligated Group, Refunding Series 2012, 5.000%, 11/15/26 | | | |
| | (Pre-refunded 5/15/22) | | | |
63
| | |
| NQP | Nuveen Pennsylvania Quality Municipal Income Fund Portfolio of Investments (continued) February 28, 2021 |
| | | | | | |
| Principal | | | Optional Call | | |
| Amount (000) | | Description (1) | Provisions (2) | Ratings (3) | Value |
| | U.S. Guaranteed (7) (continued) | | | |
| $ 3,500 | | Norristown Area School District, Pennsylvania, Installment Purchase Certificates of | 4/22 at 100.00 | N/R | $ 3,672,235 |
| | Participation, Series 2012, 5.000%, 4/01/32 (Pre-refunded 4/01/22) | | | |
| 1,415 | | Pennsylvania Higher Educational Facilities Authority, Revenue Bonds, Drexel University, | 5/21 at 100.00 | N/R | 1,426,773 |
| | Series 2011A, 5.250%, 5/01/41 (Pre-refunded 5/01/21) | | | |
| | Pennsylvania Higher Educational Facilities Authority, Revenue Bonds, Foundation for | | | |
| | Student Housing at Indiana University, Project Series 2012A: | | | |
| 1,000 | | 5.000%, 7/01/27 (Pre-refunded 7/01/22) | 7/22 at 100.00 | N/R | 1,061,250 |
| 750 | | 5.000%, 7/01/32 (Pre-refunded 7/01/22) | 7/22 at 100.00 | N/R | 795,937 |
| 1,195 | | Pennsylvania Higher Educational Facilities Authority, Revenue Bonds, Philadelphia | 6/23 at 100.00 | N/R | 1,321,264 |
| | University, Refunding Series 2013, 5.000%, 6/01/32 (Pre-refunded 6/01/23) | | | |
| 420 | | Pennsylvania Higher Educational Facilities Authority, Revenue Bonds, Shippensburg | 10/22 at 100.00 | N/R | 451,865 |
| | University Student Services, Inc Student Housing Project at Shippensburg University of | | | |
| | Pennsylvania, Series 2012, 5.000%, 10/01/44 (Pre-refunded 10/01/22) | | | |
| 2,000 | | Pennsylvania Higher Educational Facilities Authority, Revenue Bonds, Temple University, | 4/22 at 100.00 | Aa3 | 2,105,140 |
| | First Series of 2012, 5.000%, 4/01/42 (Pre-refunded 4/01/22) | | | |
| | Pennsylvania Turnpike Commission, Motor License Fund-Enhanced Turnpike Special Revenue | | | |
| | Bonds, Subordinate Series 2011B: | | | |
| 2,065 | | 5.000%, 12/01/41 (Pre-refunded 12/01/21) | 12/21 at 100.00 | A2 | 2,140,249 |
| 1,935 | | 5.000%, 12/01/41 (Pre-refunded 12/01/21) | 12/21 at 100.00 | AA– | 2,004,757 |
| 3,180 | | Pennsylvania Turnpike Commission, Motor License Fund-Enhanced Turnpike Special Revenue | 12/21 at 100.00 | AA– | 3,295,879 |
| | Bonds, Subordinate Series 2012A, 5.000%, 12/01/31 (Pre-refunded 12/01/21) | | | |
| 7,000 | | Pennsylvania Turnpike Commission, Motor License Fund-Enhanced Turnpike Subordinate | 12/23 at 100.00 | AA– | 7,916,300 |
| | Special Revenue Bonds, Series 2013B-1, 5.250%, 12/01/43 (Pre-refunded 12/01/23) | | | |
| 2,500 | | Philadelphia, Pennsylvania, Water and Wastewater Revenue Bonds, Series 2013A, 5.125%, | 1/22 at 100.00 | A+ | 2,602,775 |
| | 1/01/43 (Pre-refunded 1/01/22) | | | |
| | Pittsburgh, Pennsylvania, General Obligation Bonds, Series 2012B: | | | |
| 2,590 | | 5.000%, 9/01/25 (Pre-refunded 9/01/22) | 9/22 at 100.00 | AA– | 2,778,189 |
| 6,800 | | 5.000%, 9/01/26 (Pre-refunded 9/01/22) | 9/22 at 100.00 | AA– | 7,294,088 |
| 1,000 | | Radnor Township, Pennsylvania, General Obligation Bonds, Series 2012, 4.000%, 11/01/37 | 11/22 at 100.00 | Aa1 | 1,063,950 |
| | (Pre-refunded 11/01/22) | | | |
| 3,000 | | Southcentral Pennsylvania General Authority, Revenue Bonds, Wellspan Health Obligated | 6/24 at 100.00 | Aa3 | 3,443,700 |
| | Group, Refunding Series 2014A, 5.000%, 6/01/44 (Pre-refunded 6/01/24) | | | |
| | Union County Hospital Authority, Pennsylvania, Hospital Revenue Bonds, Evangelical | | | |
| | Community Hospital Project, Refunding & Improvement Series 2011: | | | |
| 3,130 | | 6.875%, 8/01/31 (Pre-refunded 8/01/21) | 8/21 at 100.00 | A– | 3,215,731 |
| 2,500 | | 7.000%, 8/01/41 (Pre-refunded 8/01/21) | 8/21 at 100.00 | A– | 2,569,750 |
| 3,470 | | Washington County Hospital Authority, Pennsylvania, Hospital Revenue Bonds, The | 7/23 at 100.00 | N/R | 3,841,602 |
| | Washington Hospital Project, Series 2013A, 5.000%, 7/01/28 (Pre-refunded 7/01/23) | | | |
| | West Shore Area Authority, Cumberland County, Pennsylvania, Hospital Revenue Bonds, Holy | | | |
| | Spirit Hospital of the Sisters of Christian Charity, Series 2011B: | | | |
| 1,885 | | 5.625%, 1/01/32 (Pre-refunded 1/01/22) | 1/22 at 100.00 | A1 | 1,970,296 |
| 1,970 | | 5.750%, 1/01/41 (Pre-refunded 1/01/22) | 1/22 at 100.00 | A1 | 2,061,191 |
| 1,930 | | Westmoreland County Municipal Authority, Pennsylvania, Municipal Service Revenue Bonds, | 8/23 at 100.00 | A+ | 2,815,735 |
| | Tender Option Bond Trust 2016-XF1058, 18.397%, 8/15/37 (Pre-refunded 8/15/23), 144A (IF) (4) | | | |
| 124,305 | | Total U.S. Guaranteed | | | 134,105,652 |
| | Utilities – 15.2% (9.5% of Total Investments) | | | |
| | Allegheny County Sanitary Authority, Pennsylvania, Sewer Revenue Bonds, Refunding Series 2015: | | | |
| 3,325 | | 5.000%, 12/01/40 | 12/25 at 100.00 | Aa3 | 3,911,330 |
| 3,320 | | 5.000%, 12/01/45 | 12/25 at 100.00 | Aa3 | 3,876,996 |
| 3,000 | | Beaver County Industrial Development Authority, Pennsylvania, Pollution Control Revenue Bonds, | No Opt. Call | N/R | 3,090,000 |
| | FirstEnergy Generation Project, Refunding Series 2006A, 4.375%, 1/01/35 (Mandatory Put 7/01/22) | | | |
| 2,540 | | Beaver County Industrial Development Authority, Pennsylvania, Pollution Control Revenue | No Opt. Call | N/R | 3,175 |
| | Bonds, FirstEnergy Nuclear Generation Project, Refunding Series 2005A, 4.000%, 1/01/35 (5) | | | |
64
| | | | | | |
| Principal | | | Optional Call | | |
| Amount (000) | | Description (1) | Provisions (2) | Ratings (3) | Value |
| | Utilities (continued) | | | |
| $ 9,855 | | Beaver County Industrial Development Authority, Pennsylvania, Pollution Control Revenue | No Opt. Call | N/R | $ 12,319 |
| | Bonds, FirstEnergy Nuclear Generation Project, Refunding Series 2008A, 2.700%, 4/01/35 (5) | | | |
| 6,210 | | Beaver County Industrial Development Authority, Pennsylvania, Pollution Control Revenue | No Opt. Call | N/R | 7,763 |
| | Bonds, FirstEnergy Nuclear Generation Project, Series 2006B, 3.500%, 12/01/35 (5) | | | |
| 2,000 | | Bethel Park Municipal Authority, Pennsylvania, Guaranteed Sewer Revenue Bonds, Series | 9/30 at 100.00 | AA | 2,082,040 |
| | 2020B, 3.000%, 9/01/47 | | | |
| | Bucks County Water and Sewer Authority, Pennsylvania, Water System Revenue Bonds, | | | |
| | Series 2020: | | | |
| 290 | | 2.000%, 12/01/40 | 12/28 at 100.00 | AA | 263,883 |
| 905 | | 2.125%, 12/01/45 | 12/28 at 100.00 | AA | 813,106 |
| | Delaware County Regional Water Quality Control Authority, Pennsylvania, Sewer Revenue | | | |
| | Bonds, Series 2015: | | | |
| 1,110 | | 5.000%, 5/01/40 | 5/25 at 100.00 | Aa3 | 1,284,647 |
| 2,220 | | 4.000%, 5/01/45 | 5/25 at 100.00 | Aa3 | 2,359,904 |
| | Lehigh County Authority, Pennsylvania, Water and Sewer Revenue Bonds, Allentown | | | |
| | Concession, Capital Appreciation Series 2013B: | | | |
| 7,295 | | 0.000%, 12/01/34 | No Opt. Call | A | 5,125,905 |
| 4,420 | | 0.000%, 12/01/35 | No Opt. Call | A | 2,993,622 |
| 5,815 | | Lehigh County Authority, Pennsylvania, Water and Sewer Revenue Bonds, Allentown | 12/23 at 100.00 | A | 6,445,346 |
| | Concession, Series 2013A, 5.125%, 12/01/47 | | | |
| 295 | | Luzerne County Industrial Development Authority, Pennsylvania, Revenue Bonds, | 12/29 at 100.00 | A+ | 314,538 |
| | Pennsylvania-American Water Company Project, Refunding Series 2019, 2.450%, 12/01/39 (AMT) | | | |
| | (Mandatory Put 12/03/29) | | | |
| 3,475 | | Pennsylvania Economic Development Financing Authority, Exempt Facilities Revenue Bonds, | 10/29 at 100.00 | A– | 3,627,031 |
| | York Water Company Project, Refunding Series 2019A, 3.000%, 10/01/36 (AMT) | | | |
| 3,400 | | Pennsylvania Economic Development Financing Authority, Exempt Facilities Revenue Bonds, | 11/29 at 100.00 | A– | 3,552,694 |
| | York Water Company Project, Refunding Series 2019B, 3.100%, 11/01/38 (AMT) | | | |
| 2,025 | | Pennsylvania Economic Development Financing Authority, Exempt Facilities Revenue | 9/25 at 100.00 | B | 1,785,969 |
| | Refunding Bonds, PPL Energy Supply, LLC Project, Series 2009A, 6.400%, 12/01/38 | | | |
| 7,500 | | Pennsylvania Economic Development Financing Authority, Revenue Bonds, | 10/29 at 100.00 | A+ | 7,981,875 |
| | Pennsylvania-American Water Company, Refunding Series 2019, 3.000%, 4/01/39 | | | |
| 3,165 | | Philadelphia Gas Works, Pennsylvania, Revenue Bonds, 1998 General Ordinance, Sixteenth | 8/30 at 100.00 | AA | 3,904,249 |
| | Series 2020A, 5.000%, 8/01/50 – AGM Insured | | | |
| 5,000 | | Philadelphia Gas Works, Pennsylvania, Revenue Bonds, General Ordinance, Fifteenth Series | 8/27 at 100.00 | A | 5,858,700 |
| | 2017, 5.000%, 8/01/47 | | | |
| 2,735 | | Philadelphia Gas Works, Pennsylvania, Revenue Bonds, Refunding Thirteenth Series 2015, | 8/25 at 100.00 | A | 3,193,742 |
| | 5.000%, 8/01/29 | | | |
| | Philadelphia, Pennsylvania, Water and Wastewater Revenue Bonds, Series 2018A: | | | |
| 5,000 | | 5.000%, 10/01/48 (UB) (4) | 10/28 at 100.00 | A+ | 6,018,100 |
| 7,000 | | 5.000%, 10/01/53 (UB) (4) | 10/28 at 100.00 | A+ | 8,419,250 |
| 1,000 | | Philadelphia, Pennsylvania, Water and Wastewater Revenue Bonds, Series 2019B, | 11/29 at 100.00 | A+ | 1,228,230 |
| | 5.000%, 11/01/54 | | | |
| 5,000 | | Pittsburgh Water and Sewer Authority, Pennsylvania, Water and Sewer System Revenue | 9/23 at 100.00 | A | 5,559,650 |
| | Bonds, First Lien Series 2013B, 5.250%, 9/01/40 | | | |
| 350 | | Pittsburgh Water and Sewer Authority, Pennsylvania, Water and Sewer System Revenue | 9/30 at 100.00 | AA | 403,564 |
| | Bonds, First Lien Series 2020B, 4.000%, 9/01/50 – AGM Insured | | | |
| | Westmoreland County Municipal Authority, Pennsylvania, Municipal Service Revenue Bonds, | | | |
| | Refunding Series 2020: | | | |
| 1,000 | | 4.000%, 8/15/24 – AGM Insured | No Opt. Call | AA | 1,112,940 |
| 1,000 | | 2.450%, 8/15/37 – AGM Insured | 8/28 at 100.00 | AA | 1,001,270 |
| | Williamsport Sanitary Authority, Lycoming County, Pennsylvania, Sewer Revenue Bonds, | | | |
| | Series 2021: | | | |
| 1,600 | | 5.000%, 1/01/25 – BAM Insured | No Opt. Call | AA | 1,871,264 |
| 520 | | 5.000%, 1/01/28 – BAM Insured | No Opt. Call | AA | 660,052 |
| 102,370 | | Total Utilities | | | 88,763,154 |
| $ 860,191 | | Total Municipal Bonds (cost $854,616,732) | | | 914,965,576 |
65
| | |
| NQP | Nuveen Pennsylvania Quality Municipal Income Fund Portfolio of Investments (continued) February 28, 2021 |
| | | | | | |
| Shares | | Description (1) | | | Value |
| | COMMON STOCKS – 2.9% (1.8% of Total Investments) | | | |
| | Electric Utilities – 2.9% (1.8% of Total Investments) | | | |
| 601,606 | | Energy Harbor Corp (8), (9), (10) | | | $ 16,920,169 |
| | Total Common Stocks (cost $16,839,773) | | | 16,920,169 |
| | Total Long-Term Investments (cost $871,456,505) | | | 931,885,745 |
| Principal | | | Optional Call | | |
| Amount (000) | | Description (1) | Provisions (2) | Ratings (3) | Value |
| | SHORT-TERM INVESTMENTS – 0.2% (0.1% of Total Investments) | | | |
| | MUNICIPAL BONDS – 0.2% (0.1% of Total Investments) | | | |
| | Tax Obligation/General – 0.2 (0.1% of Total Investments) | | | |
| $ 1,450 | | Mercer County, Pennsylvania, General Obligation Bonds, Variable Rate Demand Series 2011, | 2/21 at 100.00 | A-1 | $ 1,450,000 |
| | | 0.040%, 10/01/31 – AGM Insured (11)
| | | |
| $ 1,450 | | Total Short-Term Investments (cost $1,450,000) | | | 1,450,000 |
| | Total Investments (cost $872,906,505) – 159.3% | | | 933,335,745 |
| | Floating Rate Obligations – (22.3)% | | | (130,595,000) |
| | Variable Rate Demand Preferred Shares, net of deferred offering costs – (37.0)% (12) | | | (216,751,142) |
| | Other Assets Less Liabilities – 0.0% | | | 38,034 |
| | Net Asset Applicable to Common Shares – 100% | | | $ 586,027,637 |
| | |
(1) | All percentages shown in the Portfolio of Investments are based on net assets applicable to common shares unless otherwise noted. |
(2) | Optional Call Provisions: Dates (month and year) and prices of the earliest optional call or redemption. There may be other call provisions at varying prices at later dates. Certain mortgage-backed securities may be subject to periodic principal paydowns. Optional Call Provisions are not covered by the report of independent registered public accounting firm.
|
(3) | For financial reporting purposes, the ratings disclosed are the highest of Standard & Poor’s Group (“Standard & Poor’s”), Moody’s Investors Service, Inc. (“Moody’s”) or Fitch, Inc. (“Fitch”) rating. This treatment of split-rated securities may differ from that used for other purposes, such as for Fund investment policies. Ratings below BBB by Standard & Poor’s, Baa by Moody’s or BBB by Fitch are considered to be below investment grade. Holdings designated N/R are not rated by any of these national rating agencies. Ratings are not covered by the report of independent registered public accounting firm.
|
(4) | Investment, or portion of investment, has been pledged to collateralize the net payment obligations for investments in inverse floating rate transactions. |
(5) | Defaulted security. A security whose issuer has failed to fully pay principal and/or interest when due, or is under the protection of bankruptcy. |
(6) | Step-up coupon bond, a bond with a coupon that increases (“steps up”), usually at regular intervals, while the bond is outstanding. The rate shown is the coupon as of the end of the reporting period.
|
(7) | Backed by an escrow or trust containing sufficient U.S. Government or U.S. Government agency securities, which ensure the timely payment of principal and interest. |
(8) | Common Stock received as part of the bankruptcy settlements for Beaver County Industrial Development Authority, Pennsylvania, Pollution Control Revenue Bonds, FirstEnergy Nuclear Generation Project, Refunding Series 2005A, 4.000%, 1/01/35; Beaver County Industrial Development Authority, Pennsylvania, Pollution Control Revenue Refunding Bonds, FirstEnergy Nuclear Generation Project, Series 2006A, 4.375%, 1/01/35; and Beaver County Industrial Development Authority, Pennsylvania, Pollution Control Revenue Refunding Bonds, FirstEnergy Nuclear Generation Project, Series 2006B, 3.500%, 12/01/35.
|
(9) | For fair value measurement disclosure purposes, investment classified as Level 2. See Notes to Financial Statements, Note 3 - Investment Valuation and Fair Value Measurements for more information.
|
(10) | Non-income producing; issuer has not declared an ex-dividend date within the past twelve months. |
(11) | Investment has a maturity of greater than one year, but has variable rate and/or demand features which qualify it as a short-term investment. The rate disclosed, as well as the reference rate and spread, where applicable, is that in effect as of the end of the reporting period. This rate changes periodically based on market conditions or a specified market index.
|
(12) | Variable Rate Demand Preferred Shares, net of deferred offering costs as a percentage of Total Investments is 23.2%. |
144A | Investment is exempt from registration under Rule 144A of the Securities Act of 1933, as amended. These investments may only be resold in transactions exempt from registration, which are normally those transactions with qualified institutional buyers.
|
AMT | Alternative Minimum Tax |
IF | Inverse floating rate security issued by a tender option bond (“TOB”) trust, the interest rate on which varies inversely with the Securities Industry Financial Markets Association (SIFMA) short-term rate, which resets weekly, or a similar short-term rate, and is reduced by the expenses related to the TOB trust.
|
UB | Underlying bond of an inverse floating rate trust reflected as a financing transaction. See Notes to Financial Statements, Note 4 – Portfolio Securities and Investments in Derivatives for more information.
|
WI/DD | Purchased on a when-issued or delayed delivery basis. |
| See accompanying notes to financial statements. |
66
Statement of Assets and Liabilities
February 28, 2021
| | | | | | | | | | | | | |
| | NAZ | | | NUO | | | NXJ | | | NQP | |
| Assets | | | | | | | | | | | | |
Long-term investments, at value (cost $251,658,314, $444,243,570, | | | | | | | | | | | | |
| $931,639,655 and $871,456,505, respectively) | | $ | 270,785,704 | | | $ | 483,834,308 | | | $ | 1,019,709,474 | | | $ | 931,885,745 | |
Short-term investments, at value (cost approximates value) | | | — | | | | — | | | | 100,000 | | | | 1,450,000 | |
Cash | | | 99,711 | | | | 23,803 | | | | 2,784,211 | | | | 1,923,703 | |
Receivable for: | | | | | | | | | | | | | | | | |
| Interest | | | 2,304,175 | | | | 4,689,407 | | | | 9,784,557 | | | | 10,186,757 | |
| Investments sold | | | — | | | | — | | | | 224,111 | | | | 5,000,000 | |
Other assets | | | 26 | | | | 36,702 | | | | 192,545 | | | | 178,022 | |
| Total assets | | | 273,189,616 | | | | 488,584,220 | | | | 1,032,794,898 | | | | 950,624,227 | |
| Liabilities | | | | | | | | | | | | | | | | |
Floating Rate Obligations | | | 9,755,000 | | | | 20,000,000 | | | | 34,780,000 | | | | 130,595,000 | |
Payable for: | | | | | | | | | | | | | | | | |
| Dividends | | | 559,243 | | | | 842,707 | | | | 2,206,002 | | | | 1,919,779 | |
| Interest | | | 11,181 | | | | 17,102 | | | | 64,947 | | | | 243,303 | |
| Investments purchased - regular settlement | | | — | | | | — | | | | 495,017 | | | | 3,026,190 | |
| Investments purchased - when-issued/delayed-delivery settlement | | | — | | | | 1,439,088 | | | | — | | | | 11,300,000 | |
Adjustable Rate MuniFund Term Preferred (“AMTP”) Shares, net of deferred | | | | | | | | | | | | | | | | |
| offering costs (liquidation preference $88,300,000, $—, $— and | | | | | | | | | | | | | | | | |
| $—, respectively) | | | 88,232,585 | | | | — | | | | — | | | | — | |
Variable Rate Demand Preferred (“VRDP”) Shares, net of deferred offering | | | | | | | | | | | | | | | | |
| costs (liquidation preference $—, $148,000,000, $313,900,000 and | | | | | | | | | | | | | | | | |
| $217,500,000, respectively) | | | — | | | | 147,779,178 | | | | 312,560,795 | | | | 216,751,142 | |
Accrued expenses: | | | | | | | | | | | | | | | | |
| Management fees | | | 129,601 | | | | 225,017 | | | | 467,130 | | | | 413,980 | |
| Trustees fees | | | 2,900 | | | | 37,744 | | | | 194,214 | | | | 181,881 | |
| Other | | | 98,480 | | | | 107,965 | | | | 180,523 | | | | 165,315 | |
| Total liabilities | | | 98,788,990 | | | | 170,448,801 | | | | 350,948,628 | | | | 364,596,590 | |
Net assets applicable to common shares | | $ | 174,400,626 | | | $ | 318,135,419 | | | $ | 681,846,270 | | | $ | 586,027,637 | |
Common shares outstanding | | | 11,574,513 | | | | 18,316,955 | | | | 41,482,936 | | | | 37,383,341 | |
Net asset value (“NAV”) per common share outstanding | | $ | 15.07 | | | $ | 17.37 | | | $ | 16.44 | | | $ | 15.68 | |
| | |
| Net assets applicable to common shares consist of: | | | | | | | | | | | | | | | | |
Common shares, $0.01 par value per share | | $ | 115,745 | | | $ | 183,170 | | | $ | 414,829 | | | $ | 373,833 | |
Paid-in-surplus | | | 156,351,399 | | | | 278,300,757 | | | | 591,916,150 | | | | 528,814,663 | |
Total distributable earnings | | | 17,933,482 | | | | 39,651,492 | | | | 89,515,291 | | | | 56,839,141 | |
Net assets applicable to common shares | | $ | 174,400,626 | | | $ | 318,135,419 | | | $ | 681,846,270 | | | $ | 586,027,637 | |
Authorized shares: | | | | | | | | | | | | | | | | |
| Common | | Unlimited | | | Unlimited | | | Unlimited | | | Unlimited | |
| Preferred | | Unlimited | | | Unlimited | | | Unlimited | | | Unlimited | |
See accompanying notes to financial statements.
67
Statement of OperationsYear Ended February 28, 2021 | | | | | | | | | | | | | |
| | NAZ | | | NUO | | | NXJ | | | NQP | |
| Investment Income | | $ | 10,065,785 | | | $ | 16,470,695 | | | $ | 39,757,836 | | | $ | 34,403,971 | |
| Expenses | | | | | | | | | | | | | | | | |
Management fees | | | 1,665,148 | | | | 2,909,601 | | | | 5,954,143 | | | | 5,321,410 | |
Interest expense and amortization of offering costs | | | 1,181,889 | | | | 2,270,684 | | | | 4,013,699 | | | | 3,713,821 | |
Custodian fees | | | 36,735 | | | | 48,363 | | | | 91,763 | | | | 82,107 | |
Trustees fees | | | 7,395 | | | | 13,529 | | | | 27,834 | | | | 22,682 | |
Professional fees | | | 44,239 | | | | 81,662 | | | | 123,429 | | | | 86,353 | |
Shareholder reporting expenses | | | 22,749 | | | | 95,240 | | | | 63,836 | | | | 65,950 | |
Shareholder servicing agent fees | | | 14,852 | | | | 12,436 | | | | 18,983 | | | | 20,854 | |
Stock exchange listing fees | | | 6,577 | | | | 6,577 | | | | 11,194 | | | | 10,076 | |
Investor relations expenses | | | 12,289 | | | | 21,650 | | | | 46,552 | | | | 37,629 | |
Other | | | 35,318 | | | | 64,881 | | | | 90,676 | | | | 76,189 | |
Total expenses | | | 3,027,191 | | | | 5,524,623 | | | | 10,442,109 | | | | 9,437,071 | |
Net investment income (loss) | | | 7,038,594 | | | | 10,946,072 | | | | 29,315,727 | | | | 24,966,900 | |
| Realized and Unrealized Gain (Loss) | | | | | | | | | | | | | | | | |
Net realized gain (loss) from: | | | | | | | | | | | | | | | | |
| Investments | | | 331,564 | | | | 245,489 | | | | (362,036 | ) | | | (993 | ) |
| Futures contracts | | | — | | | | — | | | | (652,366 | ) | | | (2,566,296 | ) |
Change in net unrealized appreciation (depreciation) of: | | | | | | | | | | | | | | | | |
| Investments | | | (6,433,033 | ) | | | (8,679,685 | ) | | | (28,995,471 | ) | | | (25,091,595 | ) |
| Futures contracts | | | — | | | | — | | | | 203,441 | | | | 830,629 | |
Net realized and unrealized gain (loss) | | | (6,101,469 | ) | | | (8,434,196 | ) | | | (29,806,432 | ) | | | (26,828,255 | ) |
Net increase (decrease) in net assets applicable to common shares | | | | | | | | | | | | | | | | |
| from operations | | $ | 937,125 | | | $ | 2,511,876 | | | $ | (490,705 | ) | | $ | (1,861,355 | ) |
See accompanying notes to financial statements.
68
Statement of Changes in Net Assets
| | | | | | |
| | Year | | | Year | | | Year | | | Year | |
| | Ended | | | Ended | | | Ended | | | Ended | |
| | 2/28/21 | | | 2/29/20 | | | 2/28/21 | | | 2/29/20 | |
| Operations | | | | | | | | | | | | |
Net investment income (loss) | | $ | 7,038,594 | | | $ | 6,464,341 | | | $ | 10,946,072 | | | $ | 8,418,469 | |
Net realized gain (loss) from: | | | | | | | | | | | | | | | | |
| Investments | | | 331,564 | | | | 524,499 | | | | 245,489 | | | | 2,511,885 | |
| Futures contracts | | | — | | | | — | | | | — | | | | — | |
| Swaps | | | — | | | | — | | | | — | | | | — | |
Change in net unrealized appreciation | | | | | | | | | | | | | | | | |
(depreciation) of: | | | | | | | | | | | | | | | | |
| Investments | | | (6,433,033 | ) | | | 14,956,580 | | | | (8,679,685 | ) | | | 28,274,554 | |
| Futures contracts | | | — | | | | — | | | | — | | | | — | |
| Swaps | | | — | | | | — | | | | — | | | | — | |
Net increase (decrease) in net assets | | | | | | | | | | | | | | | | |
| applicable to common shares | | | | | | | | | | | | | | | | |
| from operations | | | 937,125 | | | | 21,945,420 | | | | 2,511,876 | | | | 39,204,908 | |
| Distributions to Common Shareholders | | | | | | | | | | | | | | | | |
Dividends | | | (6,612,097 | ) | | | (6,001,960 | ) | | | (10,662,299 | ) | | | (10,693,438 | ) |
Decrease in net assets applicable to | | | | | | | | | | | | | | | | |
| common shares from distributions | | | | | | | | | | | | | | | | |
| to common shareholders | | | (6,612,097 | ) | | | (6,001,960 | ) | | | (10,662,299 | ) | | | (10,693,438 | ) |
| Capital Share Transactions | | | | | | | | | | | | | | | | |
Common shares: | | | | | | | | | | | | | | | | |
| Net proceeds from shares issued to | | | | | | | | | | | | | | | | |
| shareholders due to reinvestment | | | | | | | | | | | | | | | | |
| of distributions | | | 51,671 | | | | — | | | | — | | | | — | |
| Cost of shares repurchased | | | | | | | | | | | | | | | | |
| and retired | | | — | | | | — | | | | — | | | | — | |
Net increase (decrease) in net assets | | | | | | | | | | | | | | | | |
| applicable to common shares from | | | | | | | | | | | | | | | | |
| capital share transactions | | | 51,671 | | | | — | | | | — | | | | — | |
Net increase (decrease) in net assets | | | | | | | | | | | | | | | | |
| applicable to common shares | | | (5,623,301 | ) | | | 15,943,460 | | | | (8,150,423 | ) | | | 28,511,470 | |
Net assets applicable to common | | | | | | | | | | | | | | | | |
| shares at the beginning of period | | | 180,023,927 | | | | 164,080,467 | | | | 326,285,842 | | | | 297,774,372 | |
Net assets applicable to common | | | | | | | | | | | | | | | | |
| shares at the end of period | | $ | 174,400,626 | | | $ | 180,023,927 | | | $ | 318,135,419 | | | $ | 326,285,842 | |
See accompanying notes to financial statements.
69
Statement of Changes in Net Assets (continued)
| | | | | | |
| | Year | | | Year | | | Year | | | Year | |
| | Ended | | | Ended | | | Ended | | | Ended | |
| | 2/28/21 | | | 2/29/20 | | | 2/28/21 | | | 2/29/20 | |
| Operations | | | | | | | | | | | | |
Net investment income (loss) | | $ | 29,315,727 | | | $ | 26,706,428 | | | $ | 24,966,900 | | | $ | 23,186,876 | |
Net realized gain (loss) from: | | | | | | | | | | | | | | | | |
| Investments | | | (362,036 | ) | | | 1,066,098 | | | | (993 | ) | | | 2,791,478 | |
| Futures contracts | | | (652,366 | ) | | | (567,288 | ) | | | (2,566,296 | ) | | | (4,309,126 | ) |
| Swaps | | | — | | | | (820,253 | ) | | | — | | | | — | |
Change in net unrealized appreciation | | | | | | | | | | | | | | | | |
| (depreciation) of: | | | | | | | | | | | | | | | | |
| Investments | | | (28,995,471 | ) | | | 68,238,463 | | | | (25,091,595 | ) | | | 53,710,447 | |
| Futures contracts | | | 203,441 | | | | (203,441 | ) | | | 830,629 | | | | (1,100,046 | ) |
| Swaps | | | — | | | | 259,758 | | | | — | | | | — | |
Net increase (decrease) in net assets | | | | | | | | | | | | | | | | |
| applicable to common shares | | | | | | | | | | | | | | | | |
| from operations | | | (490,705 | ) | | | 94,679,765 | | | | (1,861,355 | ) | | | 74,279,629 | |
| Distributions to Common Shareholders | | | | | | | | | | | | | | | | |
Dividends | | | (27,757,563 | ) | | | (27,204,525 | ) | | | (24,130,948 | ) | | | (22,654,307 | ) |
Decrease in net assets applicable to | | | | | | | | | | | | | | | | |
| common shares from distributions | | | | | | | | | | | | | | | | |
| to common shareholders | | | (27,757,563 | ) | | | (27,204,525 | ) | | | (24,130,948 | ) | | | (22,654,307 | ) |
| Capital Share Transactions | | | | | | | | | | | | | | | | |
Common shares: | | | | | | | | | | | | | | | | |
| Net proceeds from shares issued to | | | | | | | | | | | | | | | | |
| shareholders due to reinvestment | | | | | | | | | | | | | | | | |
| of distributions | | | — | | | | — | | | | — | | | | — | |
| Cost of shares repurchased | | | | | | | | | | | | | | | | |
| and retired | | | (342,032 | ) | | | — | | | | — | | | | — | |
Net increase (decrease) in net assets | | | | | | | | | | | | | | | | |
| applicable to common shares from | | | | | | | | | | | | | | | | |
| capital share transactions | | | (342,032 | ) | | | — | | | | — | | | | — | |
Net increase (decrease) in net assets | | | | | | | | | | | | | | | | |
| applicable to common shares | | | (28,590,300 | ) | | | 67,475,240 | | | | (25,992,303 | ) | | | 51,625,322 | |
Net assets applicable to common | | | | | | | | | | | | | | | | |
| shares at the beginning of period | | | 710,436,570 | | | | 642,961,330 | | | | 612,019,940 | | | | 560,394,618 | |
Net assets applicable to common | | | | | | | | | | | | | | | | |
| shares at the end of period | | $ | 681,846,270 | | | $ | 710,436,570 | | | $ | 586,027,637 | | | $ | 612,019,940 | |
See accompanying notes to financial statements.
70
Statement of Cash FlowsYear Ended February 28, 2021 | | NAZ | | | NUO | | | NXJ | | | NQP | |
| Cash Flows from Operating Activities: | | | | | | | | | | | | |
| Net Increase (Decrease) in Net Assets Applicable to Common | | | | | | | | | | | | |
| Shares from Operations | | $ | 937,125 | | | $ | 2,511,876 | | | $ | (490,705 | ) | | $ | (1,861,355 | ) |
Adjustments to reconcile the net increase (decrease) in net assets | | | | | | | | | | | | | | | | |
| applicable to common shares from operations to net cash provided by | | | | | | | | | | | | | | | | |
| (used in) operating activities: | | | | | | | | | | | | | | | | |
Purchases of investments | | | (36,950,525 | ) | | | (39,565,577 | ) | | | (117,749,954 | ) | | | (94,446,408 | ) |
Proceeds from sales and maturities of investments | | | 34,771,394 | | | | 27,865,720 | | | | 118,894,112 | | | | 91,077,330 | |
Proceeds from (Purchase of) short-term investments, net | | | — | | | | — | | | | (100,000 | ) | | | (1,450,000 | ) |
Taxes paid | | | (44 | ) | | | (26,528 | ) | | | (1,942 | ) | | | (7,660 | ) |
Amortization (Accretion) of premiums and discounts, net | | | 2,015,930 | | | | 2,664,153 | | | | 1,153,183 | | | | 3,590,717 | |
Amortization of deferred offering costs | | | 8,691 | | | | 9,804 | | | | 60,284 | | | | 34,397 | |
(Increase) Decrease in: | | | | | | | | | | | | | | | | |
| Receivable for interest | | | 100,741 | | | | (96,496 | ) | | | 202,324 | | | | 301,816 | |
| Receivable for investments sold | | | — | | | | 13,361,252 | | | | (224,111 | ) | | | 20,418 | |
| Other assets | | | 75 | | | | (5,569 | ) | | | (26,159 | ) | | | (23,905 | ) |
Increase (Decrease) in: | | | | | | | | | | | | | | | | |
| Payable for interest | | | (19,196 | ) | | | (29,911 | ) | | | (126,646 | ) | | | (463,940 | ) |
| Investments purchased – regular settlement | | | — | | | | (7,101,791 | ) | | | 495,017 | | | | 3,026,190 | |
| Investments purchased – when-issued/delayed-delivery settlement | | | (886,845 | ) | | | 1,439,088 | | | | (2,655,000 | ) | | | 9,362,649 | |
| Payable for variation margin on futures contracts | | | — | | | | — | | | | (139,344 | ) | | | (542,828 | ) |
| Accrued management fees | | | (3,714 | ) | | | (5,647 | ) | | | (14,831 | ) | | | (15,862 | ) |
| Accrued Trustees fees | | | 1,989 | | | | 9,276 | | | | 35,750 | | | | 32,321 | |
| Accrued other expenses | | | 36,762 | | | | 44,773 | | | | 73,014 | | | | 61,193 | |
Net realized (gain) loss from Investments | | | (331,564 | ) | | | (245,489 | ) | | | 362,036 | | | | 993 | |
Change in net unrealized appreciation (depreciation) of Investments | | | 6,433,033 | | | | 8,679,685 | | | | 28,995,471 | | | | 25,091,595 | |
Net cash provided by (used in) operating activities | | | 6,113,852 | | | | 9,508,619 | | | | 28,742,499 | | | | 33,787,661 | |
| Cash Flow from Financing Activities: | | | | | | | | | | | | | | | | |
Proceeds from borrowings | | | 2,279,330 | | | | — | | | | — | | | | 2,122,885 | |
(Payments for) borrowings | | | (2,279,330 | ) | | | — | | | | — | | | | (2,122,885 | ) |
Increase (Decrease) in cash overdraft | | | — | | | | — | | | | — | | | | (3,778,443 | ) |
Proceeds from floating rate obligations | | | — | | | | — | | | | 8,000,000 | | | | 4,865,000 | |
(Repayments of) floating rate obligations | | | — | | | | — | | | | (8,000,000 | ) | | | (9,525,000 | ) |
Cash distributions paid to common shareholders | | | (6,492,026 | ) | | | (10,572,476 | ) | | | (27,494,239 | ) | | | (23,940,561 | ) |
Cost of shares repurchased and retired | | | — | | | | — | | | | (342,032 | ) | | | — | |
Net cash provided by (used in) financing activities | | | (6,492,026 | ) | | | (10,572,476 | ) | | | (27,836,271 | ) | | | (32,379,004 | ) |
| Net Increase (Decrease) in Cash and Cash Collateral at Brokers | | | (378,174 | ) | | | (1,063,857 | ) | | | 906,228 | | | | 1,408,657 | |
Cash and cash collateral at brokers at the beginning of period | | | 477,885 | | | | 1,087,660 | | | | 1,877,983 | | | | 515,046 | |
Cash and cash collateral at brokers at the end of period | | | 99,711 | | | | 23,803 | | | | 2,784,211 | | | | 1,923,703 | |
| | |
| Supplemental Disclosure of Cash Flow Information | | NAZ | | | NUO | | | NXJ | | | NQP | |
Cash paid for interest (excluding amortization of offering costs) | | $ | 1,192,394 | | | $ | 2,290,791 | | | $ | 4,080,061 | | | $ | 4,143,363 | |
Non-cash financing activities not included herein consists of reinvestments | | | | | | | | | | | | | | | | |
| of common share distributions | | | 51,671 | | | | — | | | | — | | | | — | |
See accompanying notes to financial statements.
71
Selected data for a common share outstanding throughout each period:
| | | | | | Less Distributions | | | | | | |
| Investment Operations
| | to Common Shareholders | | Common Share |
| | | | | | | | | | | Premium | Discount | | |
| | | | | | | | | | | per | per | | |
| | | | | | | From | | | | Share | Share | | |
| Beginning | Net | Net | | | From | Accum- | | | | Sold | Repur- | | |
| Common | Investment | Realized/ | | | Net | ulated Net | | | Shelf | through | chased | | Ending |
| Share | Income | Unrealized | | | Investment | Realized | | | Offering | Shelf | and | Ending | Share |
| NAV | (Loss) | Gain (Loss) | Total | | Income | Gains | Total | | Costs | Offering | Retired | NAV | Price |
| NAZ | | | | | | | | | | | | | | |
Year Ended 2/29-2/28: | | | | | | | | | | | | | |
2021 | $15.56 | $0.61 | $(0.53) | $ 0.08 | | $(0.57) | $ — | $(0.57) | | $ — | $ — | $ — | $15.07 | $15.17 |
2020 | 14.18 | 0.56 | 1.34 | 1.90 | | (0.52) | — | (0.52) | | — | — | — | 15.56 | 13.89 |
2019 | 14.11 | 0.52 | 0.04 | 0.56 | | (0.52) | — | (0.52) | | 0.01 | — | 0.02 | 14.18 | 12.46 |
2018 | 14.26 | 0.63 | (0.13) | 0.50 | | (0.64) | — | (0.64) | | (0.01) | —* | — | 14.11 | 13.69 |
2017 | 15.01 | 0.68 | (0.68) | — | | (0.75) | — | (0.75) | | — | — | — | 14.26 | 14.22 |
|
| NUO | | | | | | | | | | | | | | |
Year Ended 2/29-2/28: | | | | | | | | | | | | | |
2021 | 17.81 | 0.60 | (0.46) | 0.14 | | (0.55) | (0.03) | (0.58) | | — | — | — | 17.37 | 15.14 |
2020 | 16.26 | 0.46 | 1.67 | 2.13 | | (0.52) | (0.06) | (0.58) | | — | — | — | 17.81 | 15.41 |
2019 | 16.12 | 0.55 | 0.15 | 0.70 | | (0.56) | (0.03) | (0.59) | | — | — | 0.03 | 16.26 | 14.24 |
2018 | 16.34 | 0.68 | (0.19) | 0.49 | | (0.71) | — | (0.71) | | — | — | — | 16.12 | 14.14 |
2017 | 17.16 | 0.74 | (0.81) | (0.07) | | (0.75) | — | (0.75) | | — | — | — | 16.34 | 14.97 |
(a) | Total Return Based on Common Share NAV is the combination of changes in common share NAV, reinvested dividend income at NAV and reinvested capital gains distributions at NAV, if any. The last dividend declared in the period, which is typically paid on the first business day of the following month, is assumed to be reinvested at the ending NAV. The actual reinvest price for the last dividend declared in the period may often be based on the Fund’s market price (and not its NAV), and therefore may be different from the price used in the calculation. Total returns are not annualized.
|
| Total Return Based on Common Share Price is the combination of changes in the market price per share and the effect of reinvested dividend income and reinvested capital gains distributions, if any, at the average price paid per share at the time of reinvestment. The last dividend declared in the period, which is typically paid on the first business day of the following month, is assumed to be reinvested at the ending market price. The actual reinvestment for the last dividend declared in the period may take place over several days, and in some instances may not be based on the market price, so the actual reinvestment price may be different from the price used in the calculation. Total returns are not annualized. |
72
| | | Common Share Supplemental Data/ | |
| | | Ratios Applicable to Common Shares | |
| Common Share | | | | |
Total Returns
| | Ratios to Average Net Assets(b) | |
| | Based | Ending | | Net | |
| Based | on | Net | | Investment | Portfolio |
| on | Share | Assets | | Income | Turnover |
| NAV(a) | Price(a) | (000) | Expenses(c) | (Loss) | Rate(d) |
| |
| 0.62% | 13.67% | $174,401 | 1.75% | 4.06% | 13% |
| 13.60 | 15.89 | 180,024 | 2.32 | 3.76 | 6 |
| 4.29 | (5.09) | 164,080 | 2.61 | 3.73 | 11 |
| 3.44 | 0.69 | 165,024 | 2.03 | 4.35 | 19 |
| (0.07) | (5.03) | 165,141 | 1.91 | 4.54 | 13 |
| |
| 0.78 | 2.07 | 318,135 | 1.73 | 3.43 | 6 |
| 13.39 | 12.40 | 326,286 | 2.34 | 2.70 | 15 |
| 4.65 | 5.14 | 297,774 | 2.35 | 3.44 | 12 |
| 2.98 | (0.93) | 298,629 | 1.94 | 4.10 | 16 |
| (0.49) | 1.67 | 302,690 | 1.79 | 4.35 | 8 |
(b) | Net Investment Income (Loss) ratios reflect income earned and expenses incurred on assets attributable to preferred shares issued by the Fund. |
(c) | The expense ratios reflect, among other things, all interest expense and other costs related to preferred shares (as described in Note 5 – Fund Shares) and/or the interest expense deemed to have been paid by the Fund in the floating rate certificates issued by the special purpose trusts for the self-deposited inverse floaters held by the Fund (as described in Note 4 – Portfolio Securities and Investments in Derivatives), where applicable, as follows: |
| | | | | | |
| NAZ | | | NUO | | |
Year Ended 2/29-2/28: | | | Year Ended 2/29-2/28: | | |
2021 | 0.68% | | 2021 | 0.71% | |
2020 | 1.25 | | 2020 | 1.20 | |
2019 | 1.39 | | 2019 | 1.28 | |
2018 | 0.95 | | 2018 | 0.90 | |
2017 | 0.87 | | 2017 | 0.77 | |
(d) | Portfolio Turnover Rate is calculated based on the lesser of long-term purchases or sales (as disclosed in Note 4 – Portfolio Securities and Investments in Derivatives) divided by the average long-term market value during the period. |
* | Rounds to less than $0.01 per share. |
See accompanying notes to financial statements.
73
Financial Highlights (continued)
Selected data for a common share outstanding throughout each period:
| | | | | | Less Distributions | | | | | | |
| Investment Operations | | to Common Shareholders | | | Common Share | |
| | | | | | | | | | | Premium | Discount | | |
| | | | | | | | | | | per | per | | |
| | | | | | | From | | | | Share | Share | | |
| Beginning | Net | Net | | | From | Accum- | | | | Sold | Repur- | | |
| Common | Investment | Realized/ | | | Net | ulated Net | | | Shelf | through | chased | | Ending |
| Share | Income | Unrealized | | | Investment | Realized | | | Offering | Shelf | and | Ending | Share |
| NAV | (Loss) | Gain (Loss) | Total | | Income | Gains | Total | | Costs | Offering | Retired | NAV | Price |
| NXJ | | | | | | | | | | | | | | |
Year Ended 2/29-2/28: | | | | | | | | | | | | | |
2021 | $17.12 | $0.71 | $(0.72) | $(0.01) | | $(0.67) | $ — | $(0.67) | | $ — | $ — | $ — | $16.44 | $14.09 |
2020 | 15.49 | 0.64 | 1.65 | 2.29 | | (0.65) | (0.01) | (0.66) | | — | — | — | 17.12 | 14.73 |
2019 | 15.37 | 0.66 | 0.14 | 0.80 | | (0.66) | (0.08) | (0.74) | | — | — | 0.06 | 15.49 | 13.47 |
2018 | 15.21 | 0.71 | 0.15 | 0.86 | | (0.70) | — | (0.70) | | — | — | —* | 15.37 | 13.10 |
2017(e) | 16.18 | 0.60 | (0.94) | (0.34) | | (0.63) | — | (0.63) | | — | — | — | 15.21 | 13.42 |
Year Ended 4/30: | | | | | | | | | | | | | |
2016 | 15.53 | 0.79 | 0.66 | 1.45 | | (0.82) | (0.01) | (0.83) | | — | — | 0.03 | 16.18 | 14.66 |
|
| NQP | | | | | | | | | | | | | | |
Year Ended 2/29-2/28: | | | | | | | | | | | | | |
2021 | 16.37 | 0.67 | (0.71) | (0.04) | | (0.65) | — | (0.65) | | — | — | — | 15.68 | 14.15 |
2020 | 14.99 | 0.62 | 1.37 | 1.99 | | (0.61) | — | (0.61) | | — | — | — | 16.37 | 14.46 |
2019 | 14.71 | 0.62 | 0.27 | 0.89 | | (0.59) | (0.04) | (0.63) | | — | — | 0.02 | 14.99 | 13.02 |
2018 | 14.79 | 0.69 | (0.08) | 0.61 | | (0.69) | —*** | (0.69) | | — | — | —* | 14.71 | 12.52 |
2017(e) | 16.08 | 0.60 | (1.24) | (0.64) | | (0.62) | (0.03) | (0.65) | | — | — | — | 14.79 | 13.30 |
Year Ended 4/30: | | | | | | | | | | | | | |
2016 | 15.64 | 0.80 | 0.46 | 1.26 | | (0.83) | — | (0.83) | | — | — | 0.01 | 16.08 | 14.91 |
(a) | Total Return Based on Common Share NAV is the combination of changes in common share NAV, reinvested dividend income at NAV and reinvested capital gains distributions at NAV, if any. The last dividend declared in the period, which is typically paid on the first business day of the following month, is assumed to be reinvested at the ending NAV. The actual reinvest price for the last dividend declared in the period may often be based on the Fund’s market price (and not its NAV), and therefore may be different from the price used in the calculation. Total returns are not annualized.
|
| Total Return Based on Common Share Price is the combination of changes in the market price per share and the effect of reinvested dividend income and reinvested capital gains distributions, if any, at the average price paid per share at the time of reinvestment. The last dividend declared in the period, which is typically paid on the first business day of the following month, is assumed to be reinvested at the ending market price. The actual reinvestment for the last dividend declared in the period may take place over several days, and in some instances may not be based on the market price, so the actual reinvestment price may be different from the price used in the calculation. Total returns are not annualized. |
74
| | | Common Share Supplemental Data/ | |
| | | Ratios Applicable to Common Shares | |
| Common Share | | | | |
| Total Returns | | Ratios to Average Net Assets(b) | |
|
|
|
| | Based | Ending | | Net | |
| Based | on | Net | | Investment | Portfolio |
| on | Share | Assets | | Income | Turnover |
| NAV(a) | Price(a) | (000) | Expenses(c) | (Loss) | Rate(d) |
| |
| 0.08% | 0.42% | $681,846 | 1.55% | 4.36% | 12% |
| 15.02 | 14.43 | 710,437 | 2.07 | 3.94 | 8 |
| 5.77 | 8.86 | 642,961 | 2.13 | 4.30 | 16 |
| 5.66 | 2.74 | 653,684 | 1.78 | 4.55 | 11 |
| (2.20) | (4.35) | 647,626 | 1.76** | 4.54** | 12 |
| |
| 9.85 | 14.79 | 688,971 | 1.56 | 5.12 | 14 |
| |
| (0.29) | 2.56 | 586,028 | 1.62 | 4.28 | 10 |
| 13.62 | 15.97 | 612,020 | 2.24 | 3.95 | 11 |
| 6.40 | 9.41 | 560,395 | 2.44 | 4.19 | 8 |
| 4.12 | (0.85) | 555,094 | 2.05 | 4.56 | 12 |
| (4.19) | (6.66) | 558,373 | 1.87** | 4.57** | 16 |
| |
| 8.46 | 14.21 | 607,240 | 1.51 | 5.13 | 16 |
(b) | Net Investment Income (Loss) ratios reflect income earned and expenses incurred on assets attributable to preferred shares issued by the Fund. |
(c) | The expense ratios reflect, among other things, all interest expense and other costs related to preferred shares (as described in Note 5 – Fund Shares) and/or the interest expense deemed to have been paid by the Fund in the floating rate certificates issued by the special purpose trusts for the self-deposited inverse floaters held by the Fund (as described in Note 4 – Portfolio Securities and Investments in Derivatives), where applicable, as follows: |
| NXJ | | | NQP | | |
Year Ended 2/29-2/28: | | | Year Ended 2/29-2/28: | | |
2021 | 0.60% | | 2021 | 0.64% | |
2020 | 1.11 | | 2020 | 1.26 | |
2019 | 1.13 | | 2019 | 1.43 | |
2018 | 0.80 | | 2018 | 1.06 | |
2017(e) | 0.79** | | 2017(e) | 0.89** | |
Year Ended 4/30: | | | Year Ended 4/30: | | |
2016 | 0.57 | | 2016 | 0.56 | |
(d) | Portfolio Turnover Rate is calculated based on the lesser of long-term purchases or sales (as disclosed in Note 4 – Portfolio Securities and Investments in Derivatives, Investment Transactions) divided by the average long-term market value during the period. |
(e) | For the ten months ended February 28, 2017. |
* | Rounds to less than $0.01 per share. |
** | Annualized. |
*** | Rounds to more than $(0.01) per share. |
See accompanying notes to financial statements.
75
Financial Highlights (continued)
| AMTP Shares | VMTP Shares | VRDP Shares |
| at the End of Period | at the End of Period | at the End of Period |
| Aggregate | Asset | Aggregate | Asset | Aggregate | Asset |
| Amount | Coverage | Amount | Coverage | Amount | Coverage |
| Outstanding
| Per $100,000
| Outstanding
| Per $100,000
| Outstanding
| Per $100,000
|
| (000) | Share | (000) | Share | (000) | Share |
| NAZ | | | | | | |
Year Ended 2/29-2/28: | | | | | | |
2021 | $88,300 | $297,509 | $ — | $ — | $ — | $ — |
2020 | 88,300 | 303,878 | — | — | — | — |
2019 | 88,300 | 285,822 | — | — | — | — |
2018 | — | — | 88,300 | 286,891 | — | — |
2017 | — | — | 88,300 | 287,022 | — | — |
|
| NUO | | | | | | |
Year Ended 2/29-2/28: | | | | | | |
2021 | — | — | — | — | 148,000 | 314,956 |
2020 | — | — | — | — | 148,000 | 320,463 |
2019 | — | — | — | — | 148,000 | 301,199 |
2018 | — | — | — | — | 148,000 | 301,776 |
2017 | — | — | — | — | 148,000 | 304,520 |
76
| | | | | VMTP and |
| VMTP Shares | VRDP Shares | VRDP Shares at |
| at the End of Period | at the End of Period | the End of Period |
| | | | | Asset |
| Aggregate | Asset | Aggregate | Asset | Coverage |
| Amount | Coverage | Amount | Coverage | Per $1 |
| Outstanding | Per $100,000 | Outstanding | Per $100,000 | Liquidation |
| (000) | Share | (000) | Share | Preference |
| NXJ | | | | | |
Year Ended 2/29-2/28: | | | | | |
2021 | $ — | $ — | $313,900 | $317,218 | $ — |
2020 | — | — | 313,900 | 326,326 | — |
2019 | — | — | 313,900 | 304,830 | — |
2018 | — | — | 313,900 | 308,246 | — |
2017(a) | — | — | 313,900 | 306,316 | — |
Year Ended 4/30: | | | | | |
2016 | — | — | 313,900 | 319,488 | — |
|
| NQP | | | | | |
Year Ended 2/29-2/28: | | | | | |
2021 | — | — | 217,500 | 369,438 | — |
2020 | — | — | 217,500 | 381,388 | — |
2019 | — | — | 217,500 | 357,653 | — |
2018 | 87,000 | 282,297 | 217,500 | 282,297 | 2.82 |
2017(a) | 87,000 | 283,374 | 217,500 | 283,374 | 2.83 |
Year Ended 4/30: | | | | | |
2016 | 48,000 | 328,716 | 217,500 | 328,716 | 3.29 |
(a) | For the ten months ended February 28, 2017. |
See accompanying notes to financial statements.
77
Notes toFinancial Statements 1. General Information
Fund Information
The funds covered in this report and their corresponding New York Stock Exchange (“NYSE”) symbols are as follows (each a “Fund” and collectively, the “Funds”):
• Nuveen Arizona Quality Municipal Income Fund (NAZ)
• Nuveen Ohio Quality Municipal Income Fund (NUO)
• Nuveen New Jersey Quality Municipal Income Fund (NXJ)
• Nuveen Pennsylvania Quality Municipal Income Fund (NQP)
The Funds are registered under the Investment Company Act of 1940 (the “1940 Act”), as amended, as diversified, closed-end management investment companies. NAZ, NUO, NXJ and NQP were organized as Massachusetts business trusts on April 8, 2013, April 8, 2013, June 1, 1999, and December 20, 1990, respectively (NAZ and NUO previously organized as Minnesota trusts on January 23, 1991 and October 17, 1991, respectively).
The end of the reporting period for the Funds is February 28, 2021, and the period covered by these Notes to Financial Statements is the fiscal year ended February 28, 2021 (the “current fiscal period”).
Investment Adviser and Sub-Adviser
The Funds’ investment adviser is Nuveen Fund Advisors, LLC (the “Adviser”), a subsidiary of Nuveen, LLC (“Nuveen”). Nuveen is the investment management arm of Teachers Insurance and Annuity Association of America (TIAA). The Adviser has overall responsibility for management of the Funds, oversees the management of the Funds’ portfolios, manages the Funds’ business affairs and provides certain clerical, bookkeeping and other administrative services, and, if necessary, asset allocation decisions. The Adviser has entered into sub-advisory agreements with Nuveen Asset Management, LLC (the “Sub-Adviser”), a subsidiary of the Adviser, under which the Sub-Adviser manages the investment portfolios of the Funds.
Other Matters
The outbreak of the novel coronavirus (“COVID-19”) and subsequent global pandemic began significantly impacting the U.S. and global financial markets and economies during the calendar quarter ended March 31, 2020. The worldwide spread of COVID-19 has created significant uncertainty in the global economy. The duration and extent of COVID-19 over the long term cannot be reasonably estimated at this time. The ultimate impact of COVID-19 and the extent to which COVID-19 impacts the Funds’ normal course of business, results of operations, investments, and cash flows will depend on future developments, which are highly uncertain and difficult to predict. Management continues to monitor and evaluate this situation.
2. Significant Accounting Policies
The accompanying financial statements were prepared in accordance with accounting principles generally accepted in the United States of America (“U.S. GAAP”), which may require the use of estimates made by management and the evaluation of subsequent events. Actual results may differ from those estimates. Each Fund is an investment company and follows the accounting guidance in the Financial Accounting Standards Board (“FASB”) Accounting Standards Codification 946, Financial Services—Investment Companies. The net asset value (“NAV”) for financial reporting purposes may differ from the NAV for processing security and common share transactions. The NAV for financial reporting purposes includes security and common share transactions through the date of the report. Total return is computed based on the NAV used for processing security and common share transactions. The following is a summary of the significant accounting policies consistently followed by the Funds.
Compensation
The Funds pay no compensation directly to those of its trustees who are affiliated with the Adviser or to its officers, all of whom receive remuneration for their services to the Funds from the Adviser or its affiliates. The Fund’s Board of Trustees (the “Board”) has adopted a deferred compensation plan for independent trustees that enables trustees to elect to defer receipt of all or a portion of the annual compensation they are entitled to receive from certain Nuveen-advised funds. Under the plan, deferred amounts are treated as though equal dollar amounts had been invested in shares of select Nuveen-advised funds.
Distributions to Common Shareholders
Distributions to common shareholders are recorded on the ex-dividend date. The amount, character and timing of distributions are determined in accordance with federal income tax regulations, which may differ from U.S. GAAP.
78
Indemnifications
Under the Funds’ organizational documents, their officers and trustees are indemnified against certain liabilities arising out of the performance of their duties to the Funds. In addition, in the normal course of business, the Funds enter into contracts that provide general indemnifications to other parties. The Funds’ maximum exposure under these arrangements is unknown as this would involve future claims that may be made against the Funds that have not yet occurred. However, the Funds have not had prior claims or losses pursuant to these contracts and expect the risk of loss to be remote.
Investments and Investment Income
Securities transactions are accounted for as of the trade date for financial reporting purposes. Realized gains and losses on securities transactions are based upon the specific identification method. Investment income is comprised of interest income, which reflects the amortization of premiums and accretion of discounts for financial reporting purposes and, is recorded on an accrual basis. Investment income also reflects payment-in-kind (“PIK”) interest and paydown gains and losses, if any. PIK interest represents income received in the form of securities in lieu of cash. Investment income also reflects dividend income, which is recorded on the ex-dividend date.
Netting Agreements
In the ordinary course of business, the Funds may enter into transactions subject to enforceable International Swaps and Derivatives Association, Inc. (ISDA) master agreements or other similar arrangements (“netting agreements”). Generally, the right to offset in netting agreements allows each Fund to offset certain securities and derivatives with a specific counterparty, when applicable, as well as any collateral received or delivered to that counterparty based on the terms of the agreements. Generally, each Fund manages its cash collateral and securities collateral on a counterparty basis.
The Funds’ investments subject to netting agreements as of the end of the reporting period, if any, are further described in Note 4 – Portfolio Securities and Investments in Derivatives.
New Accounting Pronouncements and Rule Issuances
Reference Rate Reform
In March 2020, FASB issued Accounting Standards Update (“ASU”) 2020-04, Reference Rate Reform: Facilitation of the Effects of Reference Rate Reform on Financial Reporting. The main objective of the new guidance is to provide relief to companies that will be impacted by the expected change in benchmark interest rates at the end of 2021, when participating banks will no longer be required to submit London Interbank Offered Rate (LIBOR) quotes by the UK Financial Conduct Authority (FCA). The new guidance allows companies to, provided the only change to existing contracts are a change to an approved benchmark interest rate, account for modifications as a continuance of the existing contract without additional analysis. For new and existing contracts, the Funds may elect to apply the amendments as of March 12, 2020 through December 31, 2022. Management has not yet elected to apply the amendments, but is currently assessing the impact of the ASU’s adoption to the Fund’s financial statements and various filings.
Securities and Exchange Commission (“SEC”) Adopts New Rules to Modernize Fund Valuation Framework
In December 2020, the SEC voted to adopt a new rule governing fund valuation practices. New Rule 2a-5 under the 1940 Act establishes requirements for determining fair value in good faith for purposes of the 1940 Act. Rule 2a-5 will permit fund boards to designate certain parties to perform fair value determinations, subject to board oversight and certain other conditions. Rule 2a-5 also defines when market quotations are “readily available” for purposes of Section 2(a)(41) of the 1940 Act, which requires a fund to fair value a security when market quotation are not readily available. The SEC also adopted new Rule 31a-4 under the 1940 Act, which sets forth the recordkeeping requirements associated with fair value determinations. Finally, the SEC is rescinding previously issued guidance on related issues, including the role of a board in determining fair value and the accounting and auditing of fund investments. Rule 2a-5 and Rule 31a-4 will become effective on March 8, 2021, with a compliance date of September 8, 2022. A fund may voluntarily comply with the rules after the effective date, and in advance of the compliance date, under certain conditions. Management is currently assessing the impact of these provisions on the Funds’ financial statements.
3. Investment Valuation and Fair Value Measurements
The Funds’ investments in securities are recorded at their estimated fair value utilizing valuation methods approved by the Board. Fair value is defined as the price that would be received upon selling an investment or transferring a liability in an orderly transaction to an independent buyer in the principal or most advantageous market for the investment. U.S. GAAP establishes the three-tier hierarchy which is used to maximize the use of observable market data and minimize the use of unobservable inputs and to establish classification of fair value measurements for disclosure purposes. Observable inputs reflect the assumptions market participants would use in pricing the asset or liability. Observable inputs are based on market data obtained from sources independent of the reporting entity. Unobservable inputs reflect management’s assumptions about the assumptions market participants would use in pricing the asset or liability. Unobservable inputs are based on the best information available in the circumstances. The following is a summary of the three-tiered hierarchy of valuation input levels.
Level 1 – Inputs are unadjusted and prices are determined using quoted prices in active markets for identical securities.
79
Notes to Financial Statements (continued)
Level 2 – Prices are determined using other significant observable inputs (including quoted prices for similar securities, interest rates, credit spreads, etc.).
Level 3 – Prices are determined using significant unobservable inputs (including management’s assumptions in determining the fair value of investments).
A description of the valuation techniques applied to the Funds’ major classifications of assets and liabilities measured at fair value follows:
Equity securities and exchange-traded funds listed or traded on a national market or exchange are valued based on their sale price at the official close of business of such market or exchange on the valuation date. Foreign equity securities are valued at the last sale price or official closing price reported on the exchange where traded and converted to U.S. dollars at the prevailing rates of exchange on the date of valuation. To the extent these securities are actively traded and that valuation adjustments are not applied, they are generally classified as Level 1. If there is no official close of business, then the latest available sale price is utilized. If no sales are reported, then the mean of the latest available bid and ask prices is utilized and are generally classified as Level 2.
Prices of fixed-income securities are generally provided by an independent pricing service (“pricing service”) approved by the Board. The pricing service establishes a security’s fair value using methods that may include consideration of the following: yields or prices of investments of comparable quality, type of issue, coupon, maturity and rating, market quotes or indications of value from security dealers, evaluations of anticipated cash flows or collateral, general market conditions and other information and analysis, including the obligor’s credit characteristics considered relevant. In pricing certain securities, particularly less liquid and lower quality securities, the pricing service may consider information about a security, its issuer or market activity, provided by the Adviser. These securities are generally classified as Level 2.
Any portfolio security or derivative for which market quotations are not readily available or for which the above valuation procedures are deemed not to reflect fair value are valued at fair value, as determined in good faith using procedures approved by the Board. As a general principle, the fair value of a security would appear to be the amount that the owner might reasonably expect to receive for it in a current sale. A variety of factors may be considered in determining the fair value of such securities, which may include consideration of the following: yields or prices of investments of comparable quality, type of issue, coupon, maturity and rating, market quotes or indications of value from security dealers, evaluations of anticipated cash flows or collateral, general market conditions and other information and analysis, including the obligor’s credit characteristics considered relevant. To the extent the inputs are observable and timely, the values would be classified as Level 2 of the fair value hierarchy; otherwise they would be classified as Level 3.
The following table summarizes the market value of the Funds’ investments as of the end of the reporting period, based on the inputs used to value them:
| NAZ | | Level 1 | | | Level 2 | | | Level 3 | | | Total | |
Long-Term Investments*: | | | | | | | | | | | | |
| Municipal Bonds | | $ | — | | | $ | 270,785,704 | | | $ | — | | | $ | 270,785,704 | |
Total | | $ | — | | | $ | 270,785,704 | | | $ | — | | | $ | 270,785,704 | |
| | |
| NUO | | | | | | | | | | | | | | | | |
Long-Term Investments*: | | | | | | | | | | | | | | | | |
| Municipal Bonds | | $ | — | | | $ | 482,015,268 | | | $ | — | | | $ | 482,015,268 | |
| Common Stocks | | | — | | | | 1,819,040 | ** | | | — | | | | 1,819,040 | |
Total | | $ | — | | | $ | 483,834,308 | | | $ | — | | | $ | 483,834,308 | |
| | |
| NXJ | | | | | | | | | | | | | | | | |
Long-Term Investments*: | | | | | | | | | | | | | | | | |
| Municipal Bonds | | $ | — | | | $ | 1,019,709,474 | | | $ | — | | | $ | 1,019,709,474 | |
Short-Term Investments*: | | | | | | | | | | | | | | | | |
| Municipal Bonds | | | — | | | | 100,000 | | | | — | | | | 100,000 | |
Total | | $ | — | | | $ | 1,019,809,474 | | | $ | — | | | $ | 1,019,809,474 | |
| | |
| NQP | | | | | | | | | | | | | | | | |
Long-Term Investments*: | | | | | | | | | | | | | | | | |
| Municipal Bonds | | $ | — | | | $ | 914,965,576 | | | $ | — | | | $ | 914,965,576 | |
| Common Stocks | | | — | | | | 16,920,169 | ** | | | — | | | | 16,920,169 | |
Short-Term Investments*: | | | | | | | | | | | | | | | | |
| Municipal Bonds | | | — | | | | 1,450,000 | | | | — | | | | 1,450,000 | |
Total | | $ | — | | | $ | 933,335,745 | | | $ | — | | | $ | 933,335,745 | |
* | Refer to the Fund’s Portfolio of Investments for industry classifications. |
** | Refer to the Fund’s Portfolio of Investments for securities classified as Level 2. |
80
4. Portfolio Securities and Investments in Derivatives
Portfolio Securities
Inverse Floating Rate Securities
Each Fund is authorized to invest in inverse floating rate securities. An inverse floating rate security is created by depositing a municipal bond (referred to as an “Underlying Bond”), typically with a fixed interest rate, into a special purpose tender option bond (“TOB”) trust (referred to as the “TOB Trust”) created by or at the direction of one or more Funds. In turn, the TOB Trust issues (a) floating rate certificates (referred to as “Floaters”), in face amounts equal to some fraction of the Underlying Bond’s par amount or market value, and (b) an inverse floating rate certificate (referred to as an “Inverse Floater”) that represents all remaining or residual interest in the TOB Trust. Floaters typically pay short-term tax-exempt interest rates to third parties who are also provided a right to tender their certificate and receive its par value, which may be paid from the proceeds of a remarketing of the Floaters, by a loan to the TOB Trust from a third party liquidity provider (“Liquidity Provider”), or by the sale of assets from the TOB Trust. The Inverse Floater is issued to a long term investor, such as one or more of the Funds. The income received by the Inverse Floater holder varies inversely with the short-term rate paid to holders of the Floaters, and in most circumstances the Inverse Floater holder bears substantially all of the Underlying Bond’s downside investment risk and also benefits disproportionately from any potential appreciation of the Underlying Bond’s value. The value of an Inverse Floater will be more volatile than that of the Underlying Bond because the interest rate is dependent on not only the fixed coupon rate of the Underlying Bond but also on the short-term interest paid on the Floaters, and because the Inverse Floater essentially bears the risk of loss (and possible gain) of the greater face value of the Underlying Bond.
The Inverse Floater held by a Fund gives the Fund the right to (a) cause the holders of the Floaters to tender their certificates at par (or slightly more than par in certain circumstances), and (b) have the trustee of the TOB Trust (the “Trustee”) transfer the Underlying Bond held by the TOB Trust to the Fund, thereby collapsing the TOB Trust.
The Fund may acquire an Inverse Floater in a transaction where it (a) transfers an Underlying Bond that it owns to a TOB Trust created by a third party or (b) transfers an Underlying Bond that it owns, or that it has purchased in a secondary market transaction for the purpose of creating an Inverse Floater, to a TOB Trust created at its direction, and in return receives the Inverse Floater of the TOB Trust (referred to as a “self-deposited Inverse Floater”). A Fund may also purchase an Inverse Floater in a secondary market transaction from a third party creator of the TOB Trust without first owning the Underlying Bond (referred to as an “externally-deposited Inverse Floater”).
An investment in a self-deposited Inverse Floater is accounted for as a “financing” transaction (i.e., a secured borrowing). For a self-deposited Inverse Floater, the Underlying Bond deposited into the TOB Trust is identified in the Fund’s Portfolio of Investments as “(UB) – Underlying bond of an inverse floating rate trust reflected as a financing transaction,” with the Fund recognizing as liabilities, labeled “Floating rate obligations” on the Statement of Assets and Liabilities, (a) the liquidation value of Floaters issued by the TOB Trust, and (b) the amount of any borrowings by the TOB Trust from a Liquidity Provider to enable the TOB Trust to purchase outstanding Floaters in lieu of a remarketing. In addition, the Fund recognizes in “Investment Income” the entire earnings of the Underlying Bond, and recognizes (a) the interest paid to the holders of the Floaters or on the TOB Trust’s borrowings, and (b) other expenses related to remarketing, administration, trustee, liquidity and other services to a TOB Trust, as a component of “Interest expense and amortization of offering costs” on the Statement of Operations. Earnings due from Underlying Bond and interest due to the holders of the Floaters as of the end of the reporting period are recognized as components of “Receivable for interest” and “Payable for interest” on the Statement of Assets and Liabilities, respectively.
In contrast, an investment in an externally-deposited Inverse Floater is accounted for as a purchase of the Inverse Floater and is identified in the Fund’s Portfolio of Investments as “(IF) – Inverse floating rate investment.” For an externally-deposited Inverse Floater, a Fund’s Statement of Assets and Liabilities recognizes the Inverse Floater and not the Underlying Bond as an asset, and the Fund does not recognize the Floaters, or any related borrowings from a Liquidity Provider, as a liability. Additionally, the Fund reflects in “Investment Income” only the net amount of earnings on the Inverse Floater (net of the interest paid to the holders of the Floaters or the Liquidity Provider as lender, and the expenses of the Trust), and does not show the amount of that interest paid or the expenses of the TOB Trust as described above as interest expense on the Statement of Operations.
Fees paid upon the creation of a TOB Trust for self-deposited Inverse Floaters and externally-deposited Inverse Floaters are recognized as part of the cost basis of the Inverse Floater and are capitalized over the term of the TOB Trust.
As of the end of the reporting period, the aggregate value of Floaters issued by each Fund’s TOB Trust for self-deposited Inverse Floaters and externally-deposited Inverse Floaters was as follows:
| Floating Rate Obligations Outstandings | | NAZ | | | NUO | | | NXJ | | | NQP | |
Floating rate obligations: self-deposited Inverse Floaters | | $ | 9,755,000 | | | $ | 20,000,000 | | | $ | 34,780,000 | | | $ | 130,595,000 | |
Floating rate obligations: externally-deposited Inverse Floaters | | | 6,715,000 | | | | 4,480,000 | | | | 69,625,000 | | | | 17,525,000 | |
Total | | $ | 16,470,000 | | | $ | 24,480,000 | | | $ | 104,405,000 | | | $ | 148,120,000 | |
81
Notes to Financial Statements (continued)
During the current fiscal period, the average amount of Floaters (including any borrowings from a Liquidity Provider) outstanding, and the average annual interest rate and fees related to self-deposited Inverse Floaters, were as follows:
| Self-Deposited Inverse Floaters | | NAZ | | | NUO | | | NXJ | | | NQP | |
Average floating rate obligations outstanding | | $ | 9,755,000 | | | $ | 20,000,000 | | | $ | 34,762,466 | | | $ | 135,204,945 | |
Average annual interest rate and fees | | | 0.95 | % | | | 0.93 | % | | | 0.89 | % | | | 0.93 | % |
TOB Trusts are supported by a liquidity facility provided by a Liquidity Provider pursuant to which the Liquidity Provider agrees, in the event that Floaters are (a) tendered to the Trustee for remarketing and the remarketing does not occur, or (b) subject to mandatory tender pursuant to the terms of the TOB Trust agreement, to either purchase Floaters or to provide the Trustee with an advance from a loan facility to fund the purchase of Floaters by the TOB Trust. In certain circumstances, the Liquidity Provider may otherwise elect to have the Trustee sell the Underlying Bond to retire the Floaters that were tendered and not remarketed prior to providing such a loan. In these circumstances, the Liquidity Provider remains obligated to provide a loan to the extent that the proceeds of the sale of the Underlying Bond is not sufficient to pay the purchase price of the Floaters.
The size of the commitment under the loan facility for a given TOB Trust is at least equal to the balance of that TOB Trust’s outstanding Floaters plus any accrued interest. In consideration of the loan facility, fee schedules are in place and are charged by the Liquidity Provider(s). Any loans made by the Liquidity Provider will be secured by the purchased Floaters held by the TOB Trust. Interest paid on any outstanding loan balances will be effectively borne by the Fund that owns the Inverse Floaters of the TOB Trust that has incurred the borrowing and may be at a rate that is greater than the rate that would have been paid had the Floaters been successfully remarketed.
As described above, any amounts outstanding under a liquidity facility are recognized as a component of “Floating rate obligations” on the Statement of Assets and Liabilities by the Fund holding the corresponding Inverse Floaters issued by the borrowing TOB Trust. As of the end of the reporting period, there were no loans outstanding under such facilities for any of the other Funds as of the end of the reporting period.
Each Fund may also enter into shortfall and forbearance agreements (sometimes referred to as a “recourse arrangement”) (TOB Trusts involving such agreements are referred to herein as “Recourse Trusts”), under which a Fund agrees to reimburse the Liquidity Provider for the Trust’s Floaters, in certain circumstances, for the amount (if any) by which the liquidation value of the Underlying Bond held by the TOB Trust may fall short of the sum of the liquidation value of the Floaters issued by the TOB Trust plus any amounts borrowed by the TOB Trust from the Liquidity Provider, plus any shortfalls in interest cash flows. Under these agreements, a Fund’s potential exposure to losses related to or on an Inverse Floater may increase beyond the value of the Inverse Floater as a Fund may potentially be liable to fulfill all amounts owed to holders of the Floaters or the Liquidity Provider. Any such shortfall amount in the aggregate is recognized as “Unrealized depreciation on Recourse Trusts” on the Statement of Assets and Liabilities.
As of the end of the reporting period, each Fund’s maximum exposure to the Floaters issued by Recourse Trusts for self-deposited Inverse Floaters and externally-deposited Inverse Floaters was as follows:
| Floating Rate Obligations – Recourse Trusts | | NAZ | | | NUO | | | NXJ | | | NQP | |
Maximum exposure to Recourse Trusts: self-deposited Inverse Floaters | | $ | 9,755,000 | | | $ | 12,000,000 | | | $ | 34,780,000 | | | $ | 130,595,000 | |
Maximum exposure to Recourse Trusts: externally-deposited Inverse Floaters | | | — | | | | 4,480,000 | | | | 60,960,000 | | | | 10,760,000 | |
Total | | $ | 9,755,000 | | | $ | 16,480,000 | | | $ | 95,740,000 | | | $ | 141,355,000 | |
Zero Coupon Securities
A zero coupon security does not pay a regular interest coupon to its holders during the life of the security. Income to the holder of the security comes from accretion of the difference between the original purchase price of the security at issuance and the par value of the security at maturity and is effectively paid at maturity. The market prices of zero coupon securities generally are more volatile than the market prices of securities that pay interest periodically.
Investment Transactions
Long-term purchases and sales (including maturities but excluding derivative transactions, where applicable) during the current fiscal period were as follows:
| NAZ | NUO | NXJ | NQP |
Purchases | 36,950,525 | 39,565,577 | 117,749,954 | 94,446,408 |
Sales and maturities | 34,771,394 | 27,865,720 | 118,894,112 | 91,077,330 |
The Funds may purchase securities on a when-issued or delayed-delivery basis. Securities purchased on a when-issued or delayed-delivery basis may have extended settlement periods; interest income is not accrued until settlement date. Any securities so purchased are subject to market fluctuation during this period. The Funds have earmarked securities in their portfolios with a current value at least equal to the amount of the when issued/delayed-delivery purchase commitments. If a Fund has outstanding when-issued/delayed-delivery purchases commitments as of the end of the reporting period, such amounts are recognized on the Statement of Assets and Liabilities.
82
Investments in Derivatives
In addition to the inverse floating rate securities in which each Fund may invest, which are considered portfolio securities for financial reporting purposes, each Fund is authorized to invest in certain derivative investments such as futures, options and swap contracts. Each Fund limits its investments in futures, options on futures and swap contracts to the extent necessary for the Adviser to claim exclusion from registration by the Commodity Futures Trading Commission as a commodity pool operator with respect to the Fund. The Funds record derivative instruments at fair value, with changes in fair value recognized on the Statement of Operations, when applicable. Even though the Funds’ investments in derivatives may represent economic hedges, they are not considered to be hedge transactions for financial reporting purposes.
Futures Contracts
Upon execution of a futures contract, a Fund is obligated to deposit cash or eligible securities, also known as “initial margin,” into an account at its clearing broker equal to a specified percentage of the contract amount. Cash held by the broker to cover initial margin requirements on open futures contracts, if any, is recognized as “Cash collateral at brokers for investments in futures contracts” on the Statement of Assets and Liabilities. Investments in futures contracts obligate a Fund and the clearing broker to settle monies on a daily basis representing changes in the prior days “mark-to-market” of the open contracts. If a Fund has unrealized appreciation the clearing broker would credit the Fund’s account with an amount equal to appreciation and conversely if a Fund has unrealized depreciation the clearing broker would debit the Fund’s account with an amount equal to depreciation. These daily cash settlements are also known as “variation margin.” Variation margin is recognized as a receivable and/or payable for “Variation margin on futures contracts” on the Statement of Assets and Liabilities.
During the period the futures contract is open, changes in the value of the contract are recognized as an unrealized gain or loss by “marking-to-market” on a daily basis to reflect the changes in market value of the contract, which is recognized as a component of “Change in net unrealized appreciation (depreciation) of futures contracts” on the Statement of Operations. When the contract is closed or expired, a Fund records a realized gain or loss equal to the difference between the value of the contract on the closing date and value of the contract when originally entered into, which is recognized as a component of “Net realized gain (loss) from futures contracts” on the Statement of Operations.
Risks of investments in futures contracts include the possible adverse movement in the price of the securities or indices underlying the contracts, the possibility that there may not be a liquid secondary market for the contracts and/or that a change in the value of the contract may not correlate with a change in the value of the underlying securities or indices.
During the current fiscal period, NXJ and NQP used U.S. Treasury futures as part of an overall portfolio construction strategy to manage portfolio duration and yield curve exposure.
The average notional amount of futures contracts outstanding during the current fiscal period was as follows: | | |
| NXJ | NQP |
Average notional amount of futures contracts outstanding* | $5,234,201 | $16,114,019 |
* | The average notional amount is calculated based on the absolute aggregate notional of contracts outstanding at the beginning of the current fiscal period and at the end of each fiscal quarter within the current fiscal period. |
The following table presents the amount of net realized gain (loss) and change in net unrealized appreciation (depreciation) recognized on futures contracts on the Statement of Operations during the current fiscal period, and the primary underlying risk exposure.
| | | | Change in Net |
| | | | Unrealized |
| | | Net Realized | Appreciation |
| Underlying | Derivative | Gain (Loss) from | (Depreciation) of |
| Fund | Risk Exposure | Instrument | Futures Contracts | Futures Contracts |
| NXJ | Interest rate | Futures contracts | $ (652,366) | $203,441 |
| NQP | Interest rate | Futures contracts | $(2,566,296) | $830,629 |
Market and Counterparty Credit Risk
In the normal course of business each Fund may invest in financial instruments and enter into financial transactions where risk of potential loss exists due to changes in the market (market risk) or failure of the other party to the transaction to perform (counterparty credit risk). The potential loss could exceed the value of the financial assets recorded on the financial statements. Financial assets, which potentially expose each Fund to counterparty credit risk, consist principally of cash due from counterparties on forward, option and swap transactions, when applicable. The extent of each Fund’s exposure to counterparty credit risk in respect to these financial assets approximates their carrying value as recorded on the Statement of Assets and Liabilities.
Each Fund helps manage counterparty credit risk by entering into agreements only with counterparties the Adviser believes have the financial resources to honor their obligations and by having the Adviser monitor the financial stability of the counterparties. Additionally, counterparties may be required to
83
Notes to Financial Statements (continued)
pledge collateral daily (based on the daily valuation of the financial asset) on behalf of each Fund with a value approximately equal to the amount of any unrealized gain above a pre-determined threshold. Reciprocally, when each Fund has an unrealized loss, the Funds have instructed the custodian to pledge assets of the Funds as collateral with a value approximately equal to the amount of the unrealized loss above a pre-determined threshold. Collateral pledges are monitored and subsequently adjusted if and when the valuations fluctuate, either up or down, by at least the pre-determined threshold amount.
5. Fund Shares
Common Share Transactions
Transactions in common shares for the Funds during the Funds’ current and prior fiscal period, where applicable, were as follows:
| | NAZ | | | NUO | |
| | Year | | | Year | | | Year | | | Year | |
| | Ended | | | Ended | | | Ended | | | Ended | |
| | 2/28/21 | | | 2/29/20 | | | 2/28/21 | | | 2/29/20 | |
Common shares: | | | | | | | | | | | | |
| Issued to shareholders due to reinvestments of distributions | | | 3,355 | | | | — | | | | — | | | | — | |
| Repurchased and retired | | | — | | | | — | | | | — | | | | — | |
Weighted average common share: | | | | | | | | | | | | | | | | |
| Price per share repurchased and retired | | $ | — | | | $ | — | | | $ | — | | | $ | — | |
| Discount per share repurchased and retired | | | — | % | | | — | % | | | — | % | | | — | % |
| | NXJ | | | NQP | |
| | Year | | | Year | | | Year | | | Year | |
| | Ended | | | Ended | | | Ended | | | Ended | |
| | 2/28/21 | | | 2/29/20 | | | 2/28/21 | | | 2/29/20 | |
Common shares: | | | | | | | | | | | | | | | | |
| Issued to shareholders due to reinvestments of distributions | | | — | | | | — | | | | — | | | | — | |
| Repurchased and retired | | | (25,343 | ) | | | — | | | | — | | | | — | |
Weighted average common share: | | | | | | | | | | | | | | | | |
| Price per share repurchased and retired | | $ | 13.36 | | | $ | — | | | $ | — | | | $ | — | |
| Discount per share repurchased and retired | | | 16.96 | % | | | — | % | | | — | % | | | — | % |
Preferred Shares
Adjustable Rate MuniFund Term Preferred Shares
The following Fund has issued and has outstanding Adjustable Rate MuniFund Term Preferred (“AMTP”) Shares, with a $100,000 liquidation preference per share. AMTP Shares are issued via private placement and are not publicly available.
The details of the Fund’s AMTP Shares outstanding as of the end of the reporting period, were as follows: | | | |
|
| | | | Liquidation |
| | | | Preference, |
| | Shares | Liquidation | Net of Deferred |
| Fund | Series | Outstanding | Preference | Offering Costs |
NAZ | 2028 | 883 | $88,300,000 | $88,232,585 |
The Fund is obligated to redeem its AMTP Shares by the date as specified in its offering document (“Term Redemption Date”), unless earlier redeemed by the Fund. AMTP Shares are subject to optional and mandatory redemption in certain circumstances. The AMTP Shares may be redeemed at the option of the Fund, subject to payment of premium for approximately six months following the date of issuance (“Premium Expiration Date”), and at the redemption price per share thereafter. The redemption price per share is equal to the sum of the liquidation preference per share plus any accumulated but unpaid dividends.
AMTP Shares are short-term or short/intermediate-term instruments that pay a variable dividend rate tied to a short-term index, plus an additional fixed “spread” amount which is initially established at the time of issuance and may be adjusted in the future based upon a mutual agreement between the majority owner and the Fund. From time-to-time the majority owner may propose to the Fund an adjustment to the dividend rate. Should the majority owner and the Fund fails to agree upon an adjusted dividend rate, and such proposed dividend rate adjustment is not withdrawn, the Fund will be required to redeem all outstanding shares upon the end of a notice period.
84
In addition, the Fund may be obligated to redeem a certain amount of the AMTP Shares if the Fund fails to maintain certain asset coverage and leverage ratio requirements and such failures are not cured by the applicable cure date. The Term Redemption Date and Premium Expiration Date for the Fund’s AMTP Shares are as follows:
| | | | | |
| | | Term | |
| Notice | | Redemption | Premium |
| Fund | Period | Series | Date | Expiration Date |
NAZ | 540-day | 2028 | December 1, 2028* | February 13, 2019 |
* Subject to early termination by either the Fund or the holder. | | | | |
The average liquidation preference of AMTP Shares outstanding and annualized dividend rate for the Fund during the current fiscal period were as follows:
| NAZ |
Average liquidation preference of AMTP Shares outstanding | $88,300,000 |
Annualized dividend rate | 1.22% |
AMTP Shares are subject to restrictions on transfer, generally do not trade, and market quotations are generally not available. The fair value of AMTP Shares is expected to be approximately their liquidation preference so long as the fixed “spread” on the AMTP Shares remains roughly in line with the “spread” being demanded by investors on instruments having similar terms in the current market environment. In present market conditions, the Funds’ Adviser has determined that the fair value of AMTP Shares is approximately their liquidation preference, but their fair value could vary if market conditions change materially. For financial reporting purposes, the liquidation preference of AMTP Shares is a liability and is recognized as a component of “Adjustable Rate MuniFund Term Preferred (“AMTP”) Shares, net of deferred offering costs” on the Statement of Assets and Liabilities.
AMTP Share dividends are treated as interest payments for financial reporting purposes. Unpaid dividends on AMTP Shares are recognized as a component of “Interest payable” on the Statement of Assets and Liabilities. Dividends accrued on AMTP Shares are recognized as a component of “Interest expense and amortization of offering costs” on the Statement of Operations.
Costs incurred in connection with the Fund’s offering of AMTP Shares were recorded as deferred charges, which are amortized over the life of the shares and are recognized as components of “Adjustable Rate MuniFund Term Preferred (“AMTP”) Shares, net of deferred offering costs” on the Statement of Assets and Liabilities and “Interest expense and amortization of offering costs” on the Statement of Operations.
Variable Rate Demand Preferred Shares
The following Funds have issued and have outstanding Variable Rate Demand Preferred (“VRDP”) Shares, with a $100,000 liquidation preference per share. VRDP Shares are issued via private placement and are not publicly available.
As of the end of the reporting period, NUO, NXJ and NQP had $147,779,178, $312,560,795 and $216,751,142 VRDP Shares at liquidation preference, net of deferred offering costs, respectively. Further details of the Funds’ VRDP Shares outstanding as of the end of the reporting period, were as follows:
| | Shares | Remarketing | Liquidation | Special Rate | |
| Fund | Series | Outstanding | Fees* | Preference | Period Expiration | Maturity |
| NUO | 1 | 1,480 | N/A | $148,000,000 | November 9, 2022 | September 1, 2043 |
| NXJ | 1 | 810 | N/A | $ 81,000,000 | July 21, 2021 | August 3, 2043 |
| 2 | 1,443 | N/A | 144,300,000 | April 1, 2043** | April 1, 2043 |
| 3 | 886 | N/A | 88,600,000 | April 1, 2043** | April 1, 2043 |
| NQP | 2 | 1,125 | N/A | $112,500,000 | December 1, 2042** | December 1, 2042 |
| 3 | 1,050 | N/A | 105,000,000 | December 1, 2042** | December 1, 2042 |
* Remarketing fees as a percentage of the aggregate principal amount of all VRDP Shares outstanding for each series.
** Subject to earlier termination by either the Fund or the holder.
N/A - Not applicable. Series is considered to be Special Rate VRDP and therefore does not pay a remarketing fee.
VRDP Shares include a liquidity feature that allows VRDP shareholders to have their shares purchased by a liquidity provider with whom each Fund has contracted in the event that the VRDP Shares are not able to be successfully remarketed. Each Fund is required to redeem any VRDP Shares that are still owned by the liquidity provider after six months of continuous, unsuccessful remarketing. Each Fund pays an annual remarketing fee on the aggregate principal amount of all VRDP Shares outstanding. Each Fund’s VRDP Shares have successfully remarketed since issuance.
85
Notes to Financial Statements (continued)
All series of NUO’s, NXJ’s, and NQP’s VRDP Shares are considered to be Special Rate Period VRDP, which are sold to institutional investors. During the special rate period, the VRDP Shares will not be remarketed by a remarketing agent, be subject to optional or mandatory tender events, or be supported by a liquidity provider and are not subject to remarking fees or liquidity fees. During the special rate period, VRDP dividends will be set monthly as a floating rate based on the predetermined formula. Following the initial special rate period, Special Rate Period VRDP Shares may transition to traditional VRDP Shares with dividends set at weekly remarketings, and be supported by a designated liquidity provider, or the Board may approve a subsequent special rate period.
Dividends on the VRDP Shares (which are treated as interest payments for financial reporting purposes) are set at a rate established by a remarketing agent; therefore, the market value of the VRDP Shares is expected to approximate its liquidation preference. In the event that VRDP Shares are unable to be successfully remarketed, the dividend rate will be the maximum rate which is designed to escalate according to a specified schedule in order to enhance the remarketing agent’s ability to successfully remarket the VRDP Shares.
Subject to certain conditions, VRDP Shares may be redeemed, in whole or in part, at any time at the option of each Fund. Each Fund may also redeem certain of the VRDP Shares if the Fund fails to maintain certain asset coverage requirements and such failures are not cured by the applicable cure date. The redemption price per share is equal to the sum of the liquidation preference per share plus any accumulated but unpaid dividends.
The average liquidation preference of VRDP Shares outstanding and annualized dividend rate for each Fund during the current fiscal period were as follows:
| NUO | NXJ | NQP |
Average liquidation preference of VRDP Shares outstanding | $148,000,000 | $313,900,000 | $217,500,000 |
Annualized dividend rate | 1.40% | 1.16% | 1.11% |
For financial reporting purposes, the liquidation preference of VRDP Shares is a liability and is recognized as a component of “Variable Rate Demand Preferred (“VRDP”) Shares, net of deferred offering costs” on the Statement of Assets and Liabilities. Unpaid dividends on VRDP Shares are recognized as a component of “Interest payable” on the Statement of Assets and Liabilities, when applicable. Dividends accrued on VRDP Shares are recognized as a component of “Interest expense and amortization of offering costs” on the Statement of Operations. Costs incurred by the Funds in connection with their offerings of VRDP Shares were recorded as a deferred charge, which are amortized over the life of the shares and are recognized as a component of “Variable Rate Demand Preferred (“VRDP”) Shares, net of deferred offering costs” on the Statement of Assets and Liabilities and “Interest expense and amortization of offering costs” on the Statement of Operations. In addition to interest expense, each Fund may also pay a per annum liquidity fee to the liquidity provider, as well as a remarketing fee, which are recognized as “Liquidity fees” and “Remarketing fees,” respectively, on the Statement of Operations.
Preferred Share Transactions
The Funds did not have any transactions in preferred shares during the current or prior fiscal period.
6. Income Tax Information
Each Fund is a separate taxpayer for federal income tax purposes. Each Fund intends to distribute substantially all of its net investment income and net capital gains to shareholders and to otherwise comply with the requirements of Subchapter M of the Internal Revenue Code applicable to regulated investment companies. Therefore, no federal income tax provision is required. Furthermore, each Fund intends to satisfy conditions that will enable interest from municipal securities, which is exempt from regular federal and designated state income taxes, to retain such tax-exempt status when distributed to shareholders of the Funds. Net realized capital gains and ordinary income distributions paid by the Funds are subject to federal taxation.
For all open tax years and all major taxing jurisdictions, management of the Funds has concluded that there are no significant uncertain tax positions that would require recognition in the financial statements. Open tax years are those that are open for examination by taxing authorities (i.e., generally the last four tax year ends and the interim tax period since then). Furthermore, management of the Funds is also not aware of any tax positions for which it is reasonably possible that the total amounts of unrecognized tax benefits will significantly change in the next twelve months.
The following information is presented on an income tax basis. Differences between amounts for financial statement and federal income tax purposes are primarily due to timing differences in recognizing taxable market discount, timing differences in recognizing certain gains and losses on investment transactions and the treatment of investments in inverse floating rate securities reflected as financing transactions, if any. To the extent that differences arise that are permanent in nature, such amounts are reclassified within the capital accounts as detailed below. Temporary differences do not require reclassification. Temporary and permanent differences do not impact the NAVs of the Funds.
86
The table below presents the cost and unrealized appreciation (depreciation) of each Fund’s investment portfolio, as determined on a federal income tax basis, as of February 28, 2021.
| | NAZ | | | NUO | | | NXJ | | | NQP | |
Tax cost of investments | | $ | 241,760,144 | | | $ | 424,238,964 | | | $ | 895,701,039 | | | $ | 742,123,625 | |
Gross unrealized: | | | | | | | | | | | | | | | | |
| Appreciation | | | 19,570,985 | | | | 40,183,936 | | | | 91,764,787 | | | | 62,275,396 | |
| Depreciation | | | (300,453 | ) | | | (588,512 | ) | | | (2,436,326 | ) | | | (1,658,292 | ) |
Net unrealized appreciation (depreciation) of investments | | $ | 19,270,532 | | | $ | 39,595,424 | | | $ | 89,328,461 | | | $ | 60,617,104 | |
Permanent differences, primarily due to treatment of distribution reallocations, federal taxes paid, taxable market discount and nondeductible offering costs, resulted in reclassifications among the Funds’ components of common share net assets as of February 28, 2021, the Funds’ tax year end.
The tax components of undistributed net tax-exempt income, net ordinary income and net long-term capital gains as of February 28, 2021, the Funds’ tax year end, were as follows:
| NAZ | NUO | NXJ | NQP |
Undistributed net tax-exempt income1 | $1,104,598 | $953,599 | $3,869,402 | $2,851,108 |
Undistributed net ordinary income2 | 21,142 | — | — | — |
Undistributed net long-term capital gains | — | — | — | — |
1 | Undistributed net tax-exempt income (on a tax basis) has not been reduced for the dividend declared on February 1, 2021, paid on March 1, 2021. |
2 | Net ordinary income consists of taxable market discount income and net short-term capital gains, if any. |
The tax character of distributions paid during the Funds’ tax years ended February 28, 2021 and February 29, 2020 was designated for purposes of the dividends paid deduction as follows:
| | | | | |
| 2021 | NAZ | NUO | NXJ | NQP |
Distributions from net tax-exempt income3 | $6,607,032 | $10,082,161 | $27,753,806 | $23,962,492 |
Distributions from net ordinary income2 | 5,065 | 47,767 | 3,757 | 168,456 |
Distributions from net long-term capital gains4 | — | 532,371 | — | — |
| 2020 | NAZ | NUO | NXJ | NQP |
Distributions from net tax-exempt income | $8,083,529 | $12,939,050 | $33,822,993 | $27,340,285 |
Distributions from net ordinary income2 | 8,995 | 29,235 | 96,471 | 38,513 |
Distributions from net long-term capital gains | — | 1,100,898 | 433,490 | — |
2 | Net ordinary income consists of taxable market discount income and net short-term capital gains, if any. |
3 | The Funds hereby designate these amounts paid during the fiscal year ended February 28, 2021, as Exempt Interest Dividends. |
4 | The Funds hereby designate as long-term capital gain dividend, pursuant to the Internal Revenue Code 852(b)(3), the amount necessary to reduce earnings and profits of the Funds related to net capital gain to zero for the tax year ended February 28, 2021. |
As of February 28, 2021, the Funds’ tax year end, the following Funds had unused capital losses carrying forward available for federal income tax purposes to be applied against future capital gains, if any. The capital losses are not subject to expiration.
| NAZ | NXJ | NQP |
Not subject to expiration: | | | |
| Short-term | $1,694,456 | $1,088,334 | $3,035,210 |
| Long-term | 189,608 | 167,486 | 1,500,394 |
Total | $1,884,064 | $1,255,820 | $4,535,604 |
During the Funds’ tax year ended February 28, 2021, NAZ utilized $365,557 of its capital loss carryforward. |
87
Notes to Financial Statements (continued)
7. Management Fees and Other Transactions with Affiliates
Management Fees
Each Fund’s management fee compensates the Adviser for overall investment advisory and administrative services and general office facilities. The Sub-Adviser is compensated for its services to the Funds from the management fees paid to the Adviser.
Each Fund’s management fee consists of two components – a fund-level fee, based only on the amount of assets within each individual Fund, and a complex-level fee, based on the aggregate amount of all eligible fund assets managed by the Adviser. This pricing structure enables Fund shareholders to benefit from growth in the assets within their respective Fund as well as from growth in the amount of complex-wide assets managed by the Adviser.
The annual fund-level fee, payable monthly, for each Fund is calculated according to the following schedules: | |
| Average Daily Managed Assets* | Fund-Level Fee Rate |
For the first $125 million | 0.4500% |
For the next $125 million | 0.4375
|
For the next $250 million | 0.4250
|
For the next $500 million | 0.4125
|
For the next $1 billion | 0.4000
|
For the next $3 billion | 0.3750
|
For managed assets over $5 billion | 0.3625
|
The annual complex-level fee, payable monthly, for each Fund is calculated by multiplying the current complex-wide fee rate, determined according to the following schedule by the Fund’s daily managed assets:
| Complex-Level Eligible Asset Breakpoint Level* | Effective Complex-Level Fee Rate at Breakpoint Level |
$55 billion | 0.2000% |
$56 billion | 0.1996
|
$57 billion | 0.1989
|
$60 billion | 0.1961
|
$63 billion | 0.1931
|
$66 billion | 0.1900
|
$71 billion | 0.1851
|
$76 billion | 0.1806
|
$80 billion | 0.1773
|
$91 billion | 0.1691
|
$125 billion | 0.1599
|
$200 billion | 0.1505
|
$250 billion | 0.1469
|
$300 billion | 0.1445
|
* | For the complex-level fees, managed assets include closed-end fund assets managed by the Adviser that are attributable to certain types of leverage. For these purposes, leverage includes the funds’ use of preferred stock and borrowings and certain investments in the residual interest certificates (also called inverse floating rate securities) in tender option bond (TOB) trusts, including the portion of assets held by a TOB trust that has been effectively financed by the trust’s issuance of floating rate securities, subject to an agreement by the Adviser as to certain funds to limit the amount of such assets for determining managed assets in certain circumstances. The complex-level fee is calculated based upon the aggregate daily managed assets of all Nuveen open-end and closed-end funds that constitute “eligible assets.” Eligible assets do not include assets attributable to investments in other Nuveen funds or assets in excess of a determined amount (originally $2 billion) added to the Nuveen fund complex in connection with the Adviser’s assumption of the management of the former First American Funds effective January 1, 2011, but do not include certain assets of certain Nuveen funds that were reorganized into funds advised by an affiliate of the Adviser during the 2019 calendar year. As of February 28, 2021, the complex-level fee for each Fund was 0.1558%. |
Other Transactions with Affiliates
Each Fund is permitted to purchase or sell securities from or to certain other funds or accounts managed by the Sub-Adviser (“Affiliated Entity”) under specified conditions outlined in procedures adopted by the Board (“cross-trade”). These procedures have been designed to ensure that any cross-trade of securities by the Fund from or to an Affiliated Entity by virtue of having a common investment adviser (or affiliated investment adviser), common officer and/or common trustee complies with Rule 17a-7 under the 1940 Act. These transactions are effected at the current market price (as provided by an independent pricing service) without incurring broker commissions.
During the current fiscal period, the following Funds engaged in cross-trades pursuant to these procedures as follows:
| Cross-Trades | NAZ | NUO | NXJ | NQP |
Purchase | $2,979,612 | $1,674,482 | $4,995,265 | $1,025,000 |
Sales | 3,084,840 | 1,765,956 | 4,920,700 | 6,000,000 |
88
8. Borrowing Arrangements
Committed Line of Credit
The Funds, along with certain other funds managed by the Adviser (“Participating Funds”), have established a 364-day, $2.405 billion standby credit facility with a group of lenders, under which the Participating Funds may borrow for various purposes other than leveraging for investment purposes. Each Participating Fund is allocated a designated proportion of the facility’s capacity (and its associated costs, as described below) based upon a multi-factor assessment of the likelihood and frequency of its need to draw on the facility, the size of the Fund and its anticipated draws, and the potential importance of such draws to the operations and well-being of the Fund, relative to those of the other Funds. A Fund may effect draws on the facility in excess of its designated capacity if and to the extent that other Participating Funds have undrawn capacity. The credit facility expires in June 2021 unless extended or renewed.
The credit facility has the following terms: a 0.10% upfront fee, 0.15% per annum on unused commitment amounts and a drawn interest rate equal to the higher of (a) one-month LIBOR (London Inter-Bank Offered Rate) plus 1.25% (1.00% prior to June 24, 2020) per annum or (b) the Fed Funds rate plus 1.25% (1.00% prior to June 24, 2020) per annum on amounts borrowed. Participating Funds paid administration, legal and arrangement fees, which are recognized as a component of “other expenses” on the Statement of Operations, and along with commitment fees, have been allocated among such Participating Funds based upon the relative proportions of the facility’s aggregate capacity reserved for them and other factors deemed relevant by the Adviser and the Board of each Participating Fund.
During the current fiscal period, the following Funds utilized this facility. Each Fund’s maximum outstanding balance during the utilization period was as follows:
| NAZ | NQP |
Maximum outstanding balance | $2,279,330 | $2,122,885 |
During the Funds’ utilization period(s) during the current fiscal period, the average daily balance outstanding and average annual interest rate on the Borrowings were as follows:
| NAZ | NQP |
Utilization period (days outstanding) | 4 | 4 |
Average daily balance outstanding | $2,279,330 | $2,122,885 |
Average annual interest rate | 1.39% | 1.39% |
Borrowings outstanding as of the end of the reporting period are recognized as “Borrowings” on the Statement of Assets and Liabilities, where applicable.
Inter-Fund Borrowing and Lending
The SEC has granted an exemptive order permitting registered open-end and closed-end Nuveen funds to participate in an inter-fund lending facility whereby the Nuveen funds may directly lend to and borrow money from each other for temporary purposes (e.g., to satisfy redemption requests or when a sale of securities “fails,” resulting in an unanticipated cash shortfall) (the “Inter-Fund Program”). The closed-end Nuveen funds, including the Funds covered by this shareholder report, will participate only as lenders, and not as borrowers, in the Inter-Fund Program because such closed-end funds rarely, if ever, need to borrow cash to meet redemptions. The Inter-Fund Program is subject to a number of conditions, including, among other things, the requirements that (1) no fund may borrow or lend money through the Inter-Fund Program unless it receives a more favorable interest rate than is typically available from a bank or other financial institution for a comparable transaction; (2) no fund may borrow on an unsecured basis through the Inter-Fund Program unless the fund’s outstanding borrowings from all sources immediately after the inter-fund borrowing total 10% or less of its total assets; provided that if the borrowing fund has a secured borrowing outstanding from any other lender, including but not limited to another fund, the inter-fund loan must be secured on at least an equal priority basis with at least an equivalent percentage of collateral to loan value; (3) if a fund’s total outstanding borrowings immediately after an inter-fund borrowing would be greater than 10% of its total assets, the fund may borrow through the inter-fund loan on a secured basis only; (4) no fund may lend money if the loan would cause its aggregate outstanding loans through the Inter-Fund Program to exceed 15% of its net assets at the time of the loan; (5) a fund’s inter-fund loans to any one fund shall not exceed 5% of the lending fund’s net assets; (6) the duration of inter-fund loans will be limited to the time required to receive payment for securities sold, but in no event more than seven days; and (7) each inter-fund loan may be called on one business day’s notice by a lending fund and may be repaid on any day by a borrowing fund. In addition, a Nuveen fund may participate in the Inter-Fund Program only if and to the extent that such participation is consistent with the fund’s investment objective and investment policies. The Board is responsible for overseeing the Inter-Fund Program.
The limitations detailed above and the other conditions of the SEC exemptive order permitting the Inter-Fund Program are designed to minimize the risks associated with Inter-Fund Program for both the lending fund and the borrowing fund. However, no borrowing or lending activity is without risk. When a fund borrows money from another fund, there is a risk that the loan could be called on one day’s notice or not renewed, in which case the fund may have to borrow from a bank at a higher rate or take other actions to payoff such loan if an inter-fund loan is not available from another fund. Any delay in repayment to a lending fund could result in a lost investment opportunity or additional borrowing costs.
During the current reporting period, none of the Funds covered by this shareholder report have entered into any inter-fund loan activity.
89
Shareholder Update
(Unaudited)
CURRENT INVESTMENT OBJECTIVES, INVESTMENT POLICIES AND PRINCIPAL RISKS OF THE FUNDS
NUVEEN ARIZONA QUALITY MUNICIPAL INCOME FUND (NAZ)
Investment Objectives
The Fund’s primary investment objective is current income exempt from both regular federal income taxes and Arizona individual income taxes, and its secondary investment objective is the enhancement of portfolio value relative to the Arizona municipal bond market through investments in tax-exempt Arizona Municipal Obligations (as defined below) that, in the opinion of the Fund’s investment adviser, are underrated or undervalued or that represent municipal market sectors that are undervalued.
Investment Policies
As a fundamental policy, under normal circumstances, the Fund will invest at least 80% of its Assets (as defined below) in municipal securities and other related investments the income from which is exempt from regular federal and Arizona income taxes.
The Fund invests in Arizona municipal securities with intermediate or long-term maturities in order to maintain an average portfolio maturity of 15 to 30 years, although this may be shortened depending on market conditions, and on an assessment by the Fund’s portfolio manager of which segments of the municipal securities market offer the most favorable relative investment values and opportunities for tax-exempt income and total return. As a result, the Fund’s portfolio may include long-term and intermediate-term municipal securities.
“Assets” mean the net assets of the Fund plus the amount of any borrowings for investment purposes. “Managed Assets” mean the total assets of the Fund, minus the sum of its accrued liabilities (other than Fund liabilities incurred for the express purpose of creating leverage). Total assets for this purpose shall include assets attributable to the Fund’s use of leverage (whether or not those assets are reflected in the Fund’s financial statements for purposes of generally accepted accounting principles), and derivatives will be valued at their market value.
Under normal circumstances:
| • | The Fund will invest at least 80% of its Managed Assets in investment grade securities that, at the time of investment, are rated within the four highest grades (Baa or BBB or better) by at least one nationally recognized statistical rating organization (“NRSRO”) or are unrated but judged to be of comparable quality by the Fund’s sub-adviser. |
| • | The Fund may invest up to 20% of its Managed Assets in municipal securities that at the time of investment are rated below investment grade or are unrated but judged to be of comparable quality by the Fund’s sub-adviser. |
| • | No more than 10% of the Fund’s Managed Assets may be invested in municipal securities rated below B3/B- or that are unrated but judged to be of comparable quality by the Fund’s sub-adviser. |
| • | The Fund may invest up to 20% of its Managed Assets in municipal securities that pay interest that is taxable under the federal alternative minimum tax. |
| • | The Fund may invest up to 15% of its Managed Assets in inverse floating rate securities |
| • | The Fund may invest up to 10% of its Managed Assets in securities of other open- or closed-end investment companies (including exchange-traded funds (“ETFs”) that invest primarily in municipal securities of the types in which the Fund may invest directly. |
The foregoing policies apply only at the time of any new investment.
Approving Changes in Investment Policies
The Board of Trustees of the Fund may change the policies described above without a shareholder vote. However, the Fund’s (i) investment objectives, (ii) policy of investing at least 80% of its Assets in municipal securities and other related investments the income from which is exempt from regular federal and Arizona income taxes, (iii) policy (as described below) that it may not issue debt securities that rank senior to Preferred Shares (as defined below) other than for temporary or emergency purposes and (iv) policy (as described below) that it may not borrow money, except from banks for temporary or emergency purposes, or to repurchase its shares, subject to certain restrictions, may not be changed without the approval of the holders of a majority of the outstanding common shares and preferred shares voting together as a single class, and the approval of the holders of a majority of the outstanding preferred shares, voting separately as a single class. A “majority of the outstanding” shares means (i) 67% or more of the shares present at a meeting, if the holders of more than 50% of the shares are present or represented by proxy or (ii) more than 50% of the shares, whichever is less.
90
Portfolio Contents
The Fund invests in various municipal securities, including municipal bonds and notes, other securities issued to finance and refinance public projects, and other related securities and derivative instruments creating exposure to municipal bonds, notes and securities that provide for the payment of interest income that is exempt from federal and Arizona income tax (for purposes of the Fund’s investment objectives, “Arizona Municipal Obligations”).
The Fund generally invests in municipal securities. Municipal securities include municipal bonds, notes, securities issued to finance and refinance public projects, certificates of participation, variable rate demand obligations, lease obligations, municipal notes, pre-refunded municipal bonds, private activity bonds, securities issued by tender option bond trusts (“TOB trusts”), including inverse floating rate securities, and other forms of municipal bonds and securities, and other related instruments that create exposure to municipal bonds, notes and securities that provide for the payment of interest income that is exempt from regular U.S. federal income tax and Arizona income taxes.
Municipal securities are debt obligations generally issued by states, cities and local authorities and certain possessions and territories of the United States (such as Puerto Rico and Guam) to finance or refinance public purpose projects such as roads, schools, and water supply systems.
The Fund may also invest in municipal securities that pay interest that is taxable under the federal alternative minimum tax applicable to noncorporate taxpayers (“AMT Bonds”). AMT Bonds may trigger adverse tax consequences for Fund shareholders who are subject to the federal alternative minimum tax.
The municipal securities in which the Fund invests are generally issued by the State of Arizona, a municipality of Arizona, or a political subdivision of either, and pay interest that, in the opinion of bond counsel to the issuer (or on the basis of other authority believed by the Fund’s sub-adviser to be reliable), is exempt from regular federal and Arizona income taxes, although the interest may be subject to the federal alternative minimum tax. The Fund may invest in municipal securities issued by U.S. territories (such as Puerto Rico or Guam) that are exempt from regular federal and Arizona income taxes.
The Fund may invest in municipal securities that represent lease obligations and certificates of participation in such leases. A municipal lease is an obligation in the form of a lease or installment purchase that is issued by a state or local government to acquire equipment and facilities. Income from such obligations generally is exempt from state and local taxes in the state of issuance. A certificate of participation represents an undivided interest in an unmanaged pool of municipal leases, an installment purchase agreement or other instruments. The certificates typically are issued by a municipal agency, a trust or other entity that has received an assignment of the payments to be made by the state or political subdivision under such leases or installment purchase agreements. Such certificates provide the Fund with the right to a pro rata undivided interest in the underlying municipal securities. In addition, such participations generally provide the Fund with the right to demand payment, on not more than seven days’ notice, of all or any part of the Fund’s participation interest in the underlying municipal securities, plus accrued interest.
The Fund may invest in municipal notes. Municipal securities in the form of notes generally are used to provide for short-term capital needs, in anticipation of an issuer’s receipt of other revenues or financing, and typically have maturities of up to three years. Such instruments may include tax anticipation notes, revenue anticipation notes, bond anticipation notes, tax and revenue anticipation notes and construction loan notes. Tax anticipation notes are issued to finance the working capital needs of governments. Generally, they are issued in anticipation of various tax revenues, such as income, sales, property, use and business taxes, and are payable from these specific future taxes. Revenue anticipation notes are issued in expectation of receipt of other kinds of revenue, such as federal revenues available under federal revenue sharing programs. Bond anticipation notes are issued to provide interim financing until long-term bond financing can be arranged. In most cases, the long-term bonds then provide the funds needed for repayment of the bond anticipation notes. Tax and revenue anticipation notes combine the funding sources of both tax anticipation notes and revenue anticipation notes. Construction loan notes are sold to provide construction financing. Mortgage notes insured by the Federal Housing Authority secure these notes; however, the proceeds from the insurance may be less than the economic equivalent of the payment of principal and interest on the mortgage note if there has been a default. The anticipated revenues from taxes, grants or bond financing generally secure the obligations of an issuer of municipal notes.
The Fund may invest in “tobacco settlement bonds.” Tobacco settlement bonds are municipal securities that are secured or payable solely from the collateralization of the proceeds from class action or other litigation against the tobacco industry.
The Fund may invest in pre-refunded municipal securities. The principal of and interest on pre-refunded municipal securities are no longer paid from the original revenue source for the securities. Instead, the source of such payments is typically an escrow fund consisting of U.S. government securities. The assets in the escrow fund are derived from the proceeds of refunding bonds issued by the same issuer as the pre-refunded municipal securities. Issuers of municipal securities use this advance refunding technique to obtain more favorable terms with respect to securities that are not yet subject to call or redemption by the issuer. For example, advance refunding enables an issuer to refinance debt at lower market interest rates, restructure debt to improve cash flow or eliminate restrictive covenants in the indenture or other governing instrument for the pre-refunded municipal securities. However, except for a change in the revenue source from which principal and interest payments are made, the pre-refunded municipal securities remain outstanding on their original terms until they mature or are redeemed by the issuer.
91
Shareholder Update (Unaudited) (continued)
The Fund may invest in private activity bonds. Private activity bonds are issued by or on behalf of public authorities to obtain funds to provide privately operated housing facilities, airport, mass transit or port facilities, sewage disposal, solid waste disposal or hazardous waste treatment or disposal facilities and certain local facilities for water supply, gas or electricity. Other types of private activity bonds, the proceeds of which are used for the construction, equipment, repair or improvement of privately operated industrial or commercial facilities, may constitute municipal securities, although the current federal tax laws place substantial limitations on the size of such issues.
The Fund may invest in inverse floating rate securities issued by a TOB trust, the interest rate on which varies inversely with the Securities Industry Financial Markets Association short-term rate, which resets weekly, or a similar short-term rate, and is reduced by the expenses related to the TOB trust. Typically, inverse floating rate securities represent beneficial interests in a special purpose trust (sometimes called a TOB trust) formed by a third party sponsor for the purpose of holding municipal bonds. Inverse floating rate securities may increase or decrease in value at a greater rate than the underlying interest rate on the municipal bond held by the TOB trust, which effectively leverages the Fund’s investment.
The Fund may invest in floating rate securities issued by special purpose trusts. Floating rate securities may take the form of short-term floating rate securities or the option period may be substantially longer. Generally, the interest rate earned will be based upon the market rates for municipal securities with maturities or remarketing provisions that are comparable in duration to the periodic interval of the tender option, which may vary from weekly, to monthly, to extended periods of one year or multiple years. Since the option feature has a shorter term than the final maturity or first call date of the underlying bond deposited in the trust, the Fund as the holder of the floating rate security relies upon the terms of the agreement with the financial institution furnishing the option as well as the credit strength of that institution. As further assurance of liquidity, the terms of the trust provide for a liquidation of the municipal security deposited in the trust and the application of the proceeds to pay off the floating rate security. The trusts that are organized to issue both short-term floating rate securities and inverse floaters generally include liquidation triggers to protect the investor in the floating rate security.
The Fund may invest in municipal securities issued by special taxing districts. Special taxing districts are organized to plan and finance infrastructure developments to induce residential, commercial and industrial growth and redevelopment. The bond financing methods such as tax increment finance, tax assessment, special services district and Mello-Roos bonds, are generally payable solely from taxes or other revenues attributable to the specific projects financed by the bonds without recourse to the credit or taxing power of related or overlapping municipalities.
The Fund may invest in zero coupon bonds. A zero coupon bond is a bond that typically does not pay interest for the entire life of the obligation or for an initial period after the issuance of the obligation.
The Fund may buy and sell securities on a when-issued or delayed delivery basis, making payment or taking delivery at a later date, normally within 15 to 45 days of the trade date.
The Fund may utilize structured notes and similar instruments for investment purposes and also for hedging purposes. Structured notes are privately negotiated debt obligations where the principal and/or interest is determined by reference to the performance of a benchmark asset, market or interest rate (an “embedded index”), such as selected securities, an index of securities or specified interest rates, or the differential performance of two assets or markets.
The Fund may invest in illiquid securities (i.e., securities that are not readily marketable), including, but not limited to, restricted securities (securities the disposition of which is restricted under the federal securities laws), securities that may be resold only pursuant to Rule 144A under the Securities Act of 1933, as amended (the “1933 Act”), and repurchase agreements with maturities in excess of seven days.
The Fund may enter into certain derivative instruments in pursuit of its investment objectives, including to seek to enhance return, to hedge certain risks of its investments in municipal securities or as a substitute for a position in the underlying asset. Such instruments include financial futures contracts, swap contracts (including interest rate swaps, credit default swaps and municipal market data rate locks (“MMD Rate Locks”)), options on financial futures, options on swap contracts or other derivative instruments.
The Fund may purchase and sell MMD Rate Locks. An MMD Rate Lock permits the Fund to lock in a specified municipal interest rate for a portion of its portfolio to preserve a return on a particular investment or a portion of its portfolio as a duration management technique or to protect against any increase in the price of securities to be purchased at a later date. By using an MMD Rate Lock, the Fund can create a synthetic long or short position, allowing the Fund to select what the manager believes is an attractive part of the yield curve. The Fund will ordinarily use these transactions as a hedge or for duration or risk management although it is permitted to enter into them to enhance income or gain or to increase the Fund’s yield, for example, during periods of steep interest rate yield curves (i.e., wide differences between short term and long term interest rates).
The Fund may also invest in securities of other open- or closed-end investment companies (including ETFs) that invest primarily in municipal securities of the types in which the Fund may invest directly, to the extent permitted by the Investment Company Act of 1940, as amended (the “1940 Act”), the rules and regulations issued thereunder and applicable exemptive orders issued by the Securities and Exchange Commission (“SEC”).
92
Use of Leverage
The Fund uses leverage to pursue its investment objectives. The Fund may use leverage to the extent permitted by the 1940 Act. The Fund may source leverage through a number of methods including the issuance of preferred shares of beneficial interest (“Preferred Shares”) and investments in inverse floating rate securities. However, pursuant to its fundamental policies, the Fund may not (i) issue debt securities that rank senior to Preferred Shares other than for temporary or emergency purposes and (ii) borrow money (including reverse repurchase agreements), except from banks for temporary or emergency purposes, or to repurchase its shares, subject to certain restrictions. In addition, the Fund may also use certain derivatives that have the economic effect of leverage by creating additional investment exposure. The amount and sources of leverage will vary depending on market conditions.
Temporary Defensive Periods
During temporary defensive periods (e.g., times when, in the Fund’s investment adviser’s and/or the Fund’s sub-adviser’s opinion, temporary imbalances of supply and demand or other temporary dislocations in the tax-exempt bond market adversely affect the price at which long-term or intermediate-term municipal securities are available), the Fund may invest up to 100% of its net assets in cash or cash equivalents, short-term investments or municipal bonds and deviate from its investment policies including the Fund’s 80% names rule policy. Also, during these periods, the weighted average maturity of the Fund’s investment portfolio may fall below the effective maturity range of at least 15 to 30 years and the Fund may not achieve its investment objectives.
93
Shareholder Update (Unaudited) (continued)
NUVEEN OHIO QUALITY MUNICIPAL INCOME FUND (NUO)
Investment Objectives
The Fund’s primary investment objective is current income exempt from both regular federal income taxes and Ohio personal income taxes, and its secondary investment objective is the enhancement of portfolio value relative to the Ohio municipal bond market through investments in tax-exempt Ohio Municipal Obligations that, in the opinion of the Fund’s investment adviser are underrated or undervalued or that represent municipal market sectors that are undervalued.
Investment Policies
As a fundamental policy, under normal circumstances, at least 80% of its Assets (as defined below), in municipal securities and other related investments the income from which is exempt from regular federal and Ohio income taxes.
The Fund emphasizes investments in municipal securities with long- or intermediate-term maturities. The Fund generally invests in municipal securities with different maturities to maintain an average portfolio maturity of 15 to 30 years, although this may be shortened depending on market conditions.
“Assets” mean the net assets of the Fund plus the amount of any borrowings for investment purposes. “Managed Assets” mean the total assets of the Fund, minus the sum of its accrued liabilities (other than Fund liabilities incurred for the express purpose of creating leverage). Total assets for this purpose shall include assets attributable to the Fund’s use of leverage (whether or not those assets are reflected in the Fund’s financial statements for purposes of generally accepted accounting principles), and derivatives will be valued at their market value.
Under normal circumstances:
| • | The Fund will invest at least 80% of its Managed Assets in investment grade municipal securities that, at the time of investment, are rated within the four highest grades (Baa or BBB or better) by at least one NRSRO or are unrated but judged to be of comparable quality by the Fund’s investment adviser. |
| • | The Fund may invest up to 20% of its Managed Assets in municipal securities that at the time of investment are rated below investment grade (Ba or BB or lower) or are unrated but judged to be of comparable quality by the Fund’s investment adviser. |
| • | No more than 10% of the Fund’s Managed Assets may be invested in municipal securities rated below B3/B- or that are unrated but judged to be of comparable quality by the Fund’s investment adviser. |
| • | The Fund may not enter into a futures contract or related options or forward contracts if more than 30% of its Managed Assets would be represented by futures contracts or more than 5% of its Managed Assets would be committed to initial margin deposits and premiums on futures contracts or related options. |
| • | The Fund may invest up to 20% of its Managed Assets in municipal securities that pay interest that is taxable under the federal alternative minimum tax applicable to individuals. |
| • | The Fund may invest up to 15% of its Managed Assets in inverse floating rate securities. |
| • | The Fund may invest up to 10% of its Managed Assets in securities of other open- or closed-end investment companies (including ETFs) that invest primarily in municipal securities of the types in which the Fund may invest directly. |
The foregoing policies apply only at the time of any new investment.
Approving Changes in Investment Policies
The Board of Trustees of the Fund may change the policies described above without a shareholder vote. However, the Fund’s (i) investment objectives (ii) policy of investing at least 80% of its Assets, in municipal securities and other related investments the income from which is exempt from regular federal and Ohio income taxes and (iii) policy (as described below) that it may not issue debt securities that rank senior to Preferred Shares other than for temporary or emergency purposes, may not be changed without the approval of the holders of a majority of the outstanding common shares and preferred shares voting together as a single class, and the approval of the holders of a majority of the outstanding preferred shares, voting separately as a single class. A “majority of the outstanding” shares means (i) 67% or more of the shares present at a meeting, if the holders of more than 50% of the shares are present or represented by proxy or (ii) more than 50% of the shares, whichever is less.
Portfolio Contents
The Fund generally invests in municipal securities. Municipal securities include municipal bonds, notes, securities issued to finance and refinance public projects, certificates of participation, variable rate demand obligations, lease obligations, municipal notes, pre-refunded municipal bonds, private activity bonds, securities issued by TOB trusts, including inverse floating rate securities, and other forms of municipal bonds and securities, and other related instruments that create exposure to municipal bonds, notes and securities that provide for the payment of interest income that is exempt from U.S. federal and Ohio income tax.
94
Municipal securities are debt obligations generally issued by states, cities and local authorities and certain possessions and territories of the United States (such as Puerto Rico and Guam) to finance or refinance public purpose projects such as roads, schools, and water supply systems.
The Fund may also invest in AMT Bonds. AMT Bonds may trigger adverse tax consequences for Fund shareholders who are subject to the federal alternative minimum tax.
The municipal securities in which the Fund invests generally are issued by the State of Ohio, a municipality of Ohio, or a political subdivision of either, and pay interest that, in the opinion of bond counsel to the issuer (or on the basis of other authority believed by the Fund’s investment adviser to be reliable), is exempt from regular federal and Ohio income taxes, although the interest may be subject to the federal alternative minimum tax and the Fund may invest in municipal securities issued by U.S. territories (such as Puerto Rico or Guam) that are exempt from regular federal and Ohio income taxes.
The Fund may invest in municipal securities that represent lease obligations and certificates of participation in such leases. A municipal lease is an obligation in the form of a lease or installment purchase that is issued by a state or local government to acquire equipment and facilities. Income from such obligations generally is exempt from state and local taxes in the state of issuance. A certificate of participation represents an undivided interest in an unmanaged pool of municipal leases, an installment purchase agreement or other instruments. The certificates typically are issued by a municipal agency, a trust or other entity that has received an assignment of the payments to be made by the state or political subdivision under such leases or installment purchase agreements. Such certificates provide the Fund with the right to a pro rata undivided interest in the underlying municipal securities. In addition, such participations generally provide the Fund with the right to demand payment, on not more than seven days’ notice, of all or any part of the Fund’s participation interest in the underlying municipal securities, plus accrued interest.
The Fund may invest in municipal notes. Municipal securities in the form of notes generally are used to provide for short-term capital needs, in anticipation of an issuer’s receipt of other revenues or financing, and typically have maturities of up to three years. Such instruments may include tax anticipation notes, revenue anticipation notes, bond anticipation notes, tax and revenue anticipation notes and construction loan notes. Tax anticipation notes are issued to finance the working capital needs of governments. Generally, they are issued in anticipation of various tax revenues, such as income, sales, property, use and business taxes, and are payable from these specific future taxes. Revenue anticipation notes are issued in expectation of receipt of other kinds of revenue, such as federal revenues available under federal revenue sharing programs. Bond anticipation notes are issued to provide interim financing until long-term bond financing can be arranged. In most cases, the long-term bonds then provide the funds needed for repayment of the bond anticipation notes. Tax and revenue anticipation notes combine the funding sources of both tax anticipation notes and revenue anticipation notes. Construction loan notes are sold to provide construction financing. Mortgage notes insured by the Federal Housing Authority secure these notes; however, the proceeds from the insurance may be less than the economic equivalent of the payment of principal and interest on the mortgage note if there has been a default. The anticipated revenues from taxes, grants or bond financing generally secure the obligations of an issuer of municipal notes.
The Fund may invest in “tobacco settlement bonds.” Tobacco settlement bonds are municipal securities that are secured or payable solely from the collateralization of the proceeds from class action or other litigation against the tobacco industry.
The Fund may invest in pre-refunded municipal securities. The principal of and interest on pre-refunded municipal securities are no longer paid from the original revenue source for the securities. Instead, the source of such payments is typically an escrow fund consisting of U.S. government securities. The assets in the escrow fund are derived from the proceeds of refunding bonds issued by the same issuer as the pre-refunded municipal securities. Issuers of municipal securities use this advance refunding technique to obtain more favorable terms with respect to securities that are not yet subject to call or redemption by the issuer. For example, advance refunding enables an issuer to refinance debt at lower market interest rates, restructure debt to improve cash flow or eliminate restrictive covenants in the indenture or other governing instrument for the pre-refunded municipal securities. However, except for a change in the revenue source from which principal and interest payments are made, the pre-refunded municipal securities remain outstanding on their original terms until they mature or are redeemed by the issuer.
The Fund may invest in private activity bonds. Private activity bonds, formerly referred to as industrial development bonds, are issued by or on behalf of public authorities to obtain funds to provide privately operated housing facilities, airport, mass transit or port facilities, sewage disposal, solid waste disposal or hazardous waste treatment or disposal facilities and certain local facilities for water supply, gas or electricity. Other types of private activity bonds, the proceeds of which are used for the construction, equipment, repair or improvement of privately operated industrial or commercial facilities, may constitute municipal securities, although the current federal tax laws place substantial limitations on the size of such issues. The Fund’s distributions of its interest income from private activity bonds may subject certain investors to the federal alternative minimum tax applicable to individuals. However, the Fund will only invest in private activity bonds that are not subject to the federal alternative minimum tax.
The Fund may invest in inverse floating rate securities issued by a TOB trust, the interest rate on which varies inversely with the Securities Industry Financial Markets Association short-term rate, which resets weekly, or a similar short-term rate, and is reduced by the expenses related to the TOB trust. Typically, inverse floating rate securities represent beneficial interests in a special purpose trust (sometimes called a TOB trust) formed by a third party sponsor for the purpose of holding municipal bonds. Inverse floating rate securities may increase or decrease in value at a greater rate than the underlying interest rate on the municipal bond held by the TOB trust, which effectively leverages the Fund’s investment.
95
Shareholder Update (Unaudited) (continued)
The Fund may invest in floating rate securities issued by special purpose trusts. Floating rate securities may take the form of short-term floating rate securities or the option period may be substantially longer. Generally, the interest rate earned will be based upon the market rates for municipal securities with maturities or remarketing provisions that are comparable in duration to the periodic interval of the tender option, which may vary from weekly, to monthly, to extended periods of one year or multiple years. Since the option feature has a shorter term than the final maturity or first call date of the underlying bond deposited in the trust, the Fund as the holder of the floating rate security relies upon the terms of the agreement with the financial institution furnishing the option as well as the credit strength of that institution. As further assurance of liquidity, the terms of the trust provide for a liquidation of the municipal security deposited in the trust and the application of the proceeds to pay off the floating rate security. The trusts that are organized to issue both short-term floating rate securities and inverse floaters generally include liquidation triggers to protect the investor in the floating rate security.
The Fund may invest in municipal securities issued by special taxing districts. Special taxing districts are organized to plan and finance infrastructure developments to induce residential, commercial and industrial growth and redevelopment. The bond financing methods such as tax increment finance, tax assessment, special services district and Mello-Roos bonds, are generally payable solely from taxes or other revenues attributable to the specific projects financed by the bonds without recourse to the credit or taxing power of related or overlapping municipalities.
The Fund may invest in zero coupon bonds. A zero coupon bond is a bond that typically does not pay interest for the entire life of the obligation or for an initial period after the issuance of the obligation.
The Fund may utilize structured notes and similar instruments for investment purposes and also for hedging purposes. Structured notes are privately negotiated debt obligations where the principal and/or interest is determined by reference to the performance of a benchmark asset, market or interest rate (an “embedded index”), such as selected securities, an index of securities or specified interest rates, or the differential performance of two assets or markets.
The Fund may invest in illiquid securities (i.e., securities that are not readily marketable), including, but not limited to, restricted securities (securities the disposition of which is restricted under the federal securities laws), securities that may be resold only pursuant to Rule 144A under the 1933 Act, and repurchase agreements with maturities in excess of seven days.
The Fund may enter into certain derivative instruments in pursuit of its investment objectives, including to seek to enhance return, to hedge certain risks of its investments in municipal securities or as a substitute for a position in the underlying asset. Such instruments include financial futures contracts, swap contracts (including interest rate swaps, credit default swaps and MMD Rate Locks), options on financial futures, options on swap contracts or other derivative instruments.
The Fund may purchase and sell MMD Rate Locks. An MMD Rate Lock permits the Fund to lock in a specified municipal interest rate for a portion of its portfolio to preserve a return on a particular investment or a portion of its portfolio as a duration management technique or to protect against any increase in the price of securities to be purchased at a later date. By using an MMD Rate Lock, the Fund can create a synthetic long or short position, allowing the Fund to select what the manager believes is an attractive part of the yield curve. The Fund will ordinarily use these transactions as a hedge or for duration or risk management although it is permitted to enter into them to enhance income or gain or to increase the Fund’s yield, for example, during periods of steep interest rate yield curves (i.e., wide differences between short term and long term interest rates).
The Fund may also invest in securities of other open- or closed-end investment companies (including ETFs) that invest primarily in municipal securities of the types in which the Fund may invest directly, to the extent permitted by the 1940 Act, the rules and regulations issued thereunder and applicable exemptive orders issued by the SEC. In addition, the Fund may invest a portion of its Managed Assets in pooled investment vehicles (other than investment companies) that invest primarily in municipal securities of the types in which the Fund may invest directly.
Use of Leverage
The Fund uses leverage to pursue its investment objectives. The Fund may use leverage to the extent permitted by the 1940 Act. The Fund may source leverage through a number of methods including the issuance of Preferred Shares and investments in inverse floating rate securities and reverse repurchase agreements. However, pursuant to its fundamental policies, the Fund may not (i) issue senior securities other than Preferred Shares and (ii) borrow money (including reverse repurchase agreements), except from banks for temporary or emergency purposes, or to repurchase its shares, subject to certain restrictions. In addition, the Fund may also use certain derivatives that have the economic effect of leverage by creating additional investment exposure. The amount and sources of leverage will vary depending on market conditions.
Temporary Defensive Periods
During temporary defensive periods (e.g., times when, in the Fund’s investment adviser’s and/or the Fund’s sub-adviser’s opinion, temporary imbalances of supply and demand or other temporary dislocations in the tax-exempt bond market adversely affect the price at which long-term or intermediate-term municipal securities are available), the Fund may invest up to 100% of its net assets in cash or cash equivalents, short-term investments or municipal bonds and deviate from its investment policies including the Fund’s 80% names rule policy. Also, during these periods, the weighted average maturity of the Fund’s investment portfolio may fall below the effective maturity range of 15 to 30 years and the Fund may not achieve its investment objectives.
96
NUVEEN NEW JERSEY QUALITY MUNICIPAL INCOME FUND (NXJ)
Investment Objectives
The Fund’s investment objectives are to provide current income exempt from regular federal and New Jersey income tax, and to enhance portfolio value relative to the municipal bond market by investing in tax-exempt municipal bonds that the Fund’s investment adviser believes are underrated or undervalued or that represent municipal market sectors that are undervalued.
Investment Policies
As a fundamental policy, under normal circumstances, at least 80% of its Assets (as defined below), in municipal securities and other related investments, the income from which is exempt from regular federal and New Jersey income taxes.
The Fund generally invests in municipal securities with long-term maturities in order to maintain an average effective maturity of 15-30 years, including the effects of leverage, but the average effective maturity of obligations held by the Fund may be lengthened or shortened as a result of portfolio transactions effected by the Fund’s investment adviser and/or the Fund’s sub-adviser, depending on market conditions and on an assessment by the portfolio manager of which segments of the municipal securities markets offer the most favorable relative investment values and opportunities for tax-exempt income and total return. As a result, the Fund’s portfolio at any given time may include both long-term and intermediate-term municipal securities.
“Assets” mean the net assets of the Fund plus the amount of any borrowings for investment purposes. “Managed Assets” mean the total assets of the Fund, minus the sum of its accrued liabilities (other than Fund liabilities incurred for the express purpose of creating leverage). Total assets for this purpose shall include assets attributable to the Fund’s use of leverage (whether or not those assets are reflected in the Fund’s financial statements for purposes of generally accepted accounting principles), and derivatives will be valued at their market value.
Under normal circumstances:
| • | The Fund will invest at least 80% of its Managed Assets in investment grade municipal securities that, at the time of investment, are rated within the four highest grades (Baa or BBB or better) by at least one NRSRO or are unrated but judged to be of comparable quality by the Fund’s investment adviser and/or the Fund’s sub-adviser. |
| • | The Fund may invest up to 20% of its Managed Assets in municipal securities that at the time of investment are rated below investment grade (Ba or BB or lower) or are unrated but judged to be of comparable quality by the Fund’s investment adviser and/or the Fund’s sub- adviser. |
| • | No more than 10% of the Fund’s Managed Assets may be invested in municipal securities rated below B3/B- or that are unrated but judged to be of comparable quality by the Fund’s investment adviser and/or the Fund’s sub-adviser. |
| • | The Fund may invest up to 20% of its Managed Assets in municipal securities that pay interest that is taxable under the federal alternative minimum tax applicable to individuals. |
| • | The Fund may not enter into a futures contract or related options or forward contracts if more than 30% of its Managed Assets would be represented by futures contracts or more than 5% of its Managed Assets would be committed to initial margin deposits and premiums on futures contracts or related options. |
| • | The Fund may invest up to 10% of its Managed Assets in securities of other open- or closed-end investment companies (including ETFs) that invest primarily in municipal securities of the types in which the Fund may invest directly. |
The foregoing policies apply only at the time of any new investment.
Approving Changes in Investment Policies
The Board of Trustees of the Fund may change the policies described above without a shareholder vote. However, the Fund’s (i) investment objectives, (ii) policy of investing at least 80% of its Assets, in municipal securities and other related investments, the income from which is exempt from regular federal and New Jersey income taxes and (iii) policy that it may not issue debt securities that rank senior to Preferred Shares other than for temporary or emergency purposes, may not be changed without the approval of the holders of a majority of the outstanding common shares and preferred shares voting together as a single class, and the approval of the holders of a majority of the outstanding preferred shares, voting separately as a single class. A “majority of the outstanding” shares means (i) 67% or more of the shares present at a meeting, if the holders of more than 50% of the shares are present or represented by proxy or (ii) more than 50% of the shares, whichever is less.
Portfolio Contents
The Fund generally invests in municipal securities. Municipal securities include municipal bonds, notes, securities issued to finance and refinance public projects, certificates of participation, variable rate demand obligations, lease obligations, municipal notes, pre-refunded municipal bonds, private activity bonds, securities issued by TOB trusts, including inverse floating rate securities, and other forms of municipal bonds and securities, and other related instruments that create exposure to municipal bonds, notes and securities that provide for the payment of interest income that is exempt from U.S. federal and New Jersey personal income taxes.
97
Shareholder Update (Unaudited) (continued)
Municipal securities are debt obligations generally issued by states, cities and local authorities and certain possessions and territories of the United States (such as Puerto Rico and Guam) to finance or refinance public purpose projects such as roads, schools, and water supply systems.
The Fund may also invest in AMT Bonds. AMT Bonds may trigger adverse tax consequences for Fund shareholders who are subject to the federal alternative minimum tax.
The municipal securities in which the Fund invests are generally issued by the State of New Jersey, a municipality in New Jersey, or a political subdivision or agency or instrumentality of such State or municipality, and pay interest that, in the opinion of bond counsel to the issuer (or on the basis of other authority believed by the Fund’s investment adviser and/or the Fund’s sub-adviser to be reliable), is exempt from regular federal income tax and New Jersey personal income taxes, although the interest may be subject to the federal alternative minimum tax. The Fund may invest in municipal bonds issued by United States territories and possessions (such as Puerto Rico or Guam) that are exempt from regular federal and New Jersey income taxes.
The Fund may invest in municipal securities that represent lease obligations and certificates of participation in such leases. A municipal lease is an obligation in the form of a lease or installment purchase that is issued by a state or local government to acquire equipment and facilities. Income from such obligations generally is exempt from state and local taxes in the state of issuance. A certificate of participation represents an undivided interest in an unmanaged pool of municipal leases, an installment purchase agreement or other instruments. The certificates typically are issued by a municipal agency, a trust or other entity that has received an assignment of the payments to be made by the state or political subdivision under such leases or installment purchase agreements. Such certificates provide the Fund with the right to a pro rata undivided interest in the underlying municipal securities. In addition, such participations generally provide the Fund with the right to demand payment, on not more than seven days’ notice, of all or any part of the Fund’s participation interest in the underlying municipal securities, plus accrued interest.
The Fund may invest in municipal notes. Municipal securities in the form of notes generally are used to provide for short-term capital needs, in anticipation of an issuer’s receipt of other revenues or financing, and typically have maturities of up to three years. Such instruments may include tax anticipation notes, revenue anticipation notes, bond anticipation notes, tax and revenue anticipation notes and construction loan notes. Tax anticipation notes are issued to finance the working capital needs of governments. Generally, they are issued in anticipation of various tax revenues, such as income, sales, property, use and business taxes, and are payable from these specific future taxes. Revenue anticipation notes are issued in expectation of receipt of other kinds of revenue, such as federal revenues available under federal revenue sharing programs. Bond anticipation notes are issued to provide interim financing until long-term bond financing can be arranged. In most cases, the long-term bonds then provide the funds needed for repayment of the bond anticipation notes. Tax and revenue anticipation notes combine the funding sources of both tax anticipation notes and revenue anticipation notes. Construction loan notes are sold to provide construction financing. Mortgage notes insured by the Federal Housing Authority secure these notes; however, the proceeds from the insurance may be less than the economic equivalent of the payment of principal and interest on the mortgage note if there has been a default. The anticipated revenues from taxes, grants or bond financing generally secure the obligations of an issuer of municipal notes.
The Fund may invest in “tobacco settlement bonds.” Tobacco settlement bonds are municipal securities that are secured or payable solely from the collateralization of the proceeds from class action or other litigation against the tobacco industry.
The Fund may invest in pre-refunded municipal securities. The principal of and interest on pre-refunded municipal securities are no longer paid from the original revenue source for the securities. Instead, the source of such payments is typically an escrow fund consisting of U.S. government securities. The assets in the escrow fund are derived from the proceeds of refunding bonds issued by the same issuer as the pre-refunded municipal securities. Issuers of municipal securities use this advance refunding technique to obtain more favorable terms with respect to securities that are not yet subject to call or redemption by the issuer. For example, advance refunding enables an issuer to refinance debt at lower market interest rates, restructure debt to improve cash flow or eliminate restrictive covenants in the indenture or other governing instrument for the pre-refunded municipal securities. However, except for a change in the revenue source from which principal and interest payments are made, the pre-refunded municipal securities remain outstanding on their original terms until they mature or are redeemed by the issuer.
The Fund may invest in private activity bonds. Private activity bonds, formerly referred to as industrial development bonds, are issued by or on behalf of public authorities to obtain funds to provide privately operated housing facilities, airport, mass transit or port facilities, sewage disposal, solid waste disposal or hazardous waste treatment or disposal facilities and certain local facilities for water supply, gas or electricity. Other types of private activity bonds, the proceeds of which are used for the construction, equipment, repair or improvement of privately operated industrial or commercial facilities, may constitute municipal securities, although the current federal tax laws place substantial limitations on the size of such issues. The Fund’s distributions of its interest income from private activity bonds may subject certain investors to the federal alternative minimum tax applicable to individuals. However, the Fund will only invest in private activity bonds that are not subject to the federal alternative minimum tax.
The Fund may invest in inverse floating rate securities issued by a TOB trust, the interest rate on which varies inversely with the Securities Industry Financial Markets Association short-term rate, which resets weekly, or a similar short-term rate, and is reduced by the expenses related to the TOB trust. Typically, inverse floating rate securities represent beneficial interests in a special purpose trust (sometimes called a TOB trust) formed by a third party sponsor for the purpose of holding municipal bonds. Inverse floating rate securities may increase or decrease in value at a greater rate than the underlying interest rate on the municipal bond held by the TOB trust, which effectively leverages the Fund’s investment.
98
The Fund may invest in floating rate securities issued by special purpose trusts. Floating rate securities may take the form of short-term floating rate securities or the option period may be substantially longer. Generally, the interest rate earned will be based upon the market rates for municipal securities with maturities or remarketing provisions that are comparable in duration to the periodic interval of the tender option, which may vary from weekly, to monthly, to extended periods of one year or multiple years. Since the option feature has a shorter term than the final maturity or first call date of the underlying bond deposited in the trust, the Fund as the holder of the floating rate security relies upon the terms of the agreement with the financial institution furnishing the option as well as the credit strength of that institution. As further assurance of liquidity, the terms of the trust provide for a liquidation of the municipal security deposited in the trust and the application of the proceeds to pay off the floating rate security. The trusts that are organized to issue both short-term floating rate securities and inverse floaters generally include liquidation triggers to protect the investor in the floating rate security.
The Fund may invest in municipal securities issued by special taxing districts. Special taxing districts are organized to plan and finance infrastructure developments to induce residential, commercial and industrial growth and redevelopment. The bond financing methods such as tax increment finance, tax assessment, special services district and Mello-Roos bonds, are generally payable solely from taxes or other revenues attributable to the specific projects financed by the bonds without recourse to the credit or taxing power of related or overlapping municipalities.
The Fund may invest in zero coupon bonds. A zero coupon bond is a bond that typically does not pay interest for the entire life of the obligation or for an initial period after the issuance of the obligation.
The Fund may utilize structured notes and similar instruments for investment purposes and also for hedging purposes. Structured notes are privately negotiated debt obligations where the principal and/or interest is determined by reference to the performance of a benchmark asset, market or interest rate (an “embedded index”), such as selected securities, an index of securities or specified interest rates, or the differential performance of two assets or markets.
The Fund may invest in illiquid securities (i.e., securities that are not readily marketable), including, but not limited to, restricted securities (securities the disposition of which is restricted under the federal securities laws), securities that may be resold only pursuant to Rule 144A under the 1933 Act, and repurchase agreements with maturities in excess of seven days.
The Fund may enter into certain derivative instruments in pursuit of its investment objectives, including to seek to enhance return, to hedge certain risks of its investments in municipal securities or as a substitute for a position in the underlying asset. Such instruments include financial futures contracts, swap contracts (including interest rate swaps, credit default swaps and MMD Rate Locks), options on financial futures, options on swap contracts or other derivative instruments.
The Fund may purchase and sell MMD Rate Locks. An MMD Rate Lock permits the Fund to lock in a specified municipal interest rate for a portion of its portfolio to preserve a return on a particular investment or a portion of its portfolio as a duration management technique or to protect against any increase in the price of securities to be purchased at a later date. By using an MMD Rate Lock, the Fund can create a synthetic long or short position, allowing the Fund to select what the manager believes is an attractive part of the yield curve. The Fund will ordinarily use these transactions as a hedge or for duration or risk management although it is permitted to enter into them to enhance income or gain or to increase the Fund’s yield, for example, during periods of steep interest rate yield curves (i.e., wide differences between short term and long term interest rates).
The Fund may also invest in securities of other open- or closed-end investment companies (including ETFs) that invest primarily in municipal securities of the types in which the Fund may invest directly, to the extent permitted by the 1940 Act, the rules and regulations issued thereunder and applicable exemptive orders issued by the SEC. In addition, the Fund may invest a portion of its Managed Assets in pooled investment vehicles (other than investment companies) that invest primarily in municipal securities of the types in which the Fund may invest directly.
Use of Leverage
The Fund uses leverage to pursue its investment objectives. The Fund may use leverage to the extent permitted by the 1940 Act. The Fund may source leverage through a number of methods including the issuance of Preferred Shares and investments in inverse floating rate securities and reverse repurchase agreements. However, pursuant to its fundamental policies, the Fund may not (i) issue senior securities other than Preferred Shares and (ii) borrow money (including reverse repurchase agreements), except from banks for temporary or emergency purposes, or to repurchase its shares, subject to certain restrictions. In addition, the Fund may also use certain derivatives that have the economic effect of leverage by creating additional investment exposure. The amount and sources of leverage will vary depending on market conditions.
Temporary Defensive Periods
During temporary defensive periods (e.g., times when, in the Fund’s investment adviser’s and/or the Fund’s sub-adviser’s opinion, temporary imbalances of supply and demand or other temporary dislocations in the tax-exempt bond market adversely affect the price at which long-term or intermediate-term municipal securities are available), the Fund may invest up to 100% of its net assets in cash or cash equivalents, short-term investments or municipal bonds and deviate from its investment policies including the Fund’s 80% names rule policy. Also, during these periods, the weighted average maturity of the Fund’s investment portfolio may fall below the effective maturity range of 15 to 30 years and the Fund may not achieve its investment objectives.
99
Shareholder Update (Unaudited) (continued)
NUVEEN PENNSYLVANIA QUALITY MUNICIPAL FUND (NQP)
Investment Objectives
The Fund’s investment objectives are to provide current income exempt from regular federal and Pennsylvania income taxes and to enhance portfolio value relative to the Pennsylvania municipal bond market by investing in tax-exempt Pennsylvania municipal bonds that the Fund’s investment adviser believes are underrated or undervalued or that represent municipal market sectors that are undervalued.
Investment Policies
As a fundamental policy, under normal circumstances, the Fund will invest at least 80% of its Assets (as defined below) in municipal securities and other related investments that pay interest exempt from regular federal and Pennsylvania income taxes.
The Fund invests primarily in municipal securities with long-term maturities in order to maintain an average effective maturity of 15 to 30 years, including the effects of leverage, but the average effective maturity of obligations held by the Fund may be lengthened or shortened as a result of portfolio transactions effected by the Fund’s investment adviser and/or the Fund’s sub-adviser, depending on market conditions and on an assessment by the portfolio manager of which segments of the municipal securities markets offer the most favorable relative investment values and opportunities for tax-exempt income and total return. As a result, the Fund’s portfolio at any given time may include both long-term and intermediate-term municipal securities.
“Assets” mean the net assets of the Fund plus the amount of any borrowings for investment purposes. “Managed Assets” mean the total assets of the Fund, minus the sum of its accrued liabilities (other than Fund liabilities incurred for the express purpose of creating leverage). Total assets for this purpose shall include assets attributable to the Fund’s use of leverage (whether or not those assets are reflected in the Fund’s financial statements for purposes of generally accepted accounting principles), and derivatives will be valued at their market value.
Under normal circumstances:
| • | The Fund will invest at least 80% of its Managed Assets in municipal securities that, at the time of investment, are rated within the four highest grades (Baa or BBB or better) by at least one NRSRO or are unrated but judged to be of comparable quality by the Fund’s sub- adviser. |
| • | The Fund may invest up to 20% of its Managed Assets in municipal securities that at the time of investment are rated below investment grade or are unrated but judged to be of comparable quality by the Fund’s sub-adviser. |
| • | No more than 10% of the Fund’s Managed Assets may be invested in municipal securities rated below B3/B- or that are unrated but judged to be of comparable quality by the Fund’s sub-adviser. |
| • | The Fund may invest up to 20% of its Managed Assets in municipal securities that pay interest that is taxable under the federal alternative minimum tax applicable to individuals. |
| • | The Fund may invest up to 10% of its Managed Assets in securities of other open- or closed-end investment companies (including ETFs) that invest primarily in municipal securities of the types in which the Fund may invest directly. |
| • | The Fund may not enter into a futures contract or related options or forward contracts if more than 30% of the Fund’s Managed Assets would be represented by futures contracts or more than 5% of the Fund’s Managed Assets would be committed to initial margin deposits and premiums on futures contracts or related options. |
The foregoing policies apply only at the time of any new investment.
Approving Changes in Investment Policies
The Board of Trustees of the Fund may change the policies described above without a shareholder vote. However, the Fund’s (i) investment objectives (ii) policy of investing at least 80% of its Assets in municipal securities and other related investments that pay interest exempt from regular federal and Pennsylvania income taxes and (iii) policy (as described below) that it may not borrow money, except from banks for temporary or emergency purposes, or to repurchase its shares, subject to certain restrictions, may not be changed without the approval of the holders of a majority of the outstanding common shares and preferred shares voting together as a single class, and the approval of the holders of a majority of the outstanding preferred shares, voting separately as a single class. A “majority of the outstanding” shares means (i) 67% or more of the shares present at a meeting, if the holders of more than 50% of the shares are present or represented by proxy or (ii) more than 50% of the shares, whichever is less.
Portfolio Contents
The Fund generally invests in municipal securities. Municipal securities include municipal bonds, notes, securities issued to finance and refinance public projects, certificates of participation, variable rate demand obligations, lease obligations, municipal notes, pre-refunded municipal bonds, private activity bonds, securities issued by TOB trusts, including inverse floating rate securities, and other forms of municipal bonds and securities, and other related instruments that create exposure to municipal bonds, notes and securities that provide for the payment of interest income that is exempt from regular U.S. federal income tax and Pennsylvania personal income taxes.
100
Municipal securities are debt obligations generally issued by states, cities and local authorities and certain possessions and territories of the United States (such as Puerto Rico and Guam) to finance or refinance public purpose projects such as roads, schools, and water supply systems.
The Fund may also invest in AMT Bonds. AMT Bonds may trigger adverse tax consequences for Fund shareholders who are subject to the federal alternative minimum tax.
The municipal securities in which the Fund invests are generally issued by the Commonwealth of Pennsylvania (the “Commonwealth”), a municipality in Pennsylvania, or a political subdivision or agency or instrumentality of such state or municipality, and pay interest that, in the opinion of bond counsel to the issuer (or on the basis of other authority believed by the Fund’s investment adviser to be reliable), is exempt from both regular federal income taxes and Pennsylvania personal income tax, although the interest may be subject to the federal alternative minimum tax.
The Fund may invest in municipal securities that represent lease obligations and certificates of participation in such leases. A municipal lease is an obligation in the form of a lease or installment purchase that is issued by a state or local government to acquire equipment and facilities. Income from such obligations generally is exempt from state and local taxes in the state of issuance. A certificate of participation represents an undivided interest in an unmanaged pool of municipal leases, an installment purchase agreement or other instruments. The certificates typically are issued by a municipal agency, a trust or other entity that has received an assignment of the payments to be made by the state or political subdivision under such leases or installment purchase agreements. Such certificates provide the Fund with the right to a pro rata undivided interest in the underlying municipal securities. In addition, such participations generally provide the Fund with the right to demand payment, on not more than seven days’ notice, of all or any part of the Fund’s participation interest in the underlying municipal securities, plus accrued interest.
The Fund may invest in municipal notes. Municipal securities in the form of notes generally are used to provide for short-term capital needs, in anticipation of an issuer’s receipt of other revenues or financing, and typically have maturities of up to three years. Such instruments may include tax anticipation notes, revenue anticipation notes, bond anticipation notes, tax and revenue anticipation notes and construction loan notes. Tax anticipation notes are issued to finance the working capital needs of governments. Generally, they are issued in anticipation of various tax revenues, such as income, sales, property, use and business taxes, and are payable from these specific future taxes. Revenue anticipation notes are issued in expectation of receipt of other kinds of revenue, such as federal revenues available under federal revenue sharing programs. Bond anticipation notes are issued to provide interim financing until long-term bond financing can be arranged. In most cases, the long-term bonds then provide the funds needed for repayment of the bond anticipation notes. Tax and revenue anticipation notes combine the funding sources of both tax anticipation notes and revenue anticipation notes. Construction loan notes are sold to provide construction financing. Mortgage notes insured by the Federal Housing Authority secure these notes; however, the proceeds from the insurance may be less than the economic equivalent of the payment of principal and interest on the mortgage note if there has been a default. The anticipated revenues from taxes, grants or bond financing generally secure the obligations of an issuer of municipal notes.
The Fund may invest in “tobacco settlement bonds.” Tobacco settlement bonds are municipal securities that are secured or payable solely from the collateralization of the proceeds from class action or other litigation against the tobacco industry.
The Fund may invest in pre-refunded municipal securities. The principal of and interest on pre-refunded municipal securities are no longer paid from the original revenue source for the securities. Instead, the source of such payments is typically an escrow fund consisting of U.S. government securities. The assets in the escrow fund are derived from the proceeds of refunding bonds issued by the same issuer as the pre-refunded municipal securities. Issuers of municipal securities use this advance refunding technique to obtain more favorable terms with respect to securities that are not yet subject to call or redemption by the issuer. For example, advance refunding enables an issuer to refinance debt at lower market interest rates, restructure debt to improve cash flow or eliminate restrictive covenants in the indenture or other governing instrument for the pre-refunded municipal securities. However, except for a change in the revenue source from which principal and interest payments are made, the pre-refunded municipal securities remain outstanding on their original terms until they mature or are redeemed by the issuer.
The Fund may invest in private activity bonds. Private activity bonds are issued by or on behalf of public authorities to obtain funds to provide privately operated housing facilities, airport, mass transit or port facilities, sewage disposal, solid waste disposal or hazardous waste treatment or disposal facilities and certain local facilities for water supply, gas or electricity. Other types of private activity bonds, the proceeds of which are used for the construction, equipment, repair or improvement of privately operated industrial or commercial facilities, may constitute municipal securities, although the current federal tax laws place substantial limitations on the size of such issues.
The Fund may invest in inverse floating rate securities issued by a TOB trust, the interest rate on which varies inversely with the Securities Industry Financial Markets Association short-term rate, which resets weekly, or a similar short-term rate, and is reduced by the expenses related to the TOB trust. Typically, inverse floating rate securities represent beneficial interests in a special purpose trust (sometimes called a TOB trust) formed by a third party sponsor for the purpose of holding municipal bonds. Inverse floating rate securities may increase or decrease in value at a greater rate than the underlying interest rate on the municipal bond held by the TOB trust, which effectively leverages the Fund’s investment.
The Fund may invest in floating rate securities issued by special purpose trusts. Floating rate securities may take the form of short-term floating rate securities or the option period may be substantially longer. Generally, the interest rate earned will be based upon the market rates for municipal securities with maturities or remarketing provisions that are comparable in duration to the periodic interval of the tender option, which may vary from weekly, to monthly, to extended periods of one year or multiple years. Since the option feature has a shorter term than the final maturity or first call
101
Shareholder Update (Unaudited) (continued)
date of the underlying bond deposited in the trust, the Fund as the holder of the floating rate security relies upon the terms of the agreement with the financial institution furnishing the option as well as the credit strength of that institution. As further assurance of liquidity, the terms of the trust provide for a liquidation of the municipal security deposited in the trust and the application of the proceeds to pay off the floating rate security. The trusts that are organized to issue both short-term floating rate securities and inverse floaters generally include liquidation triggers to protect the investor in the floating rate security.
The Fund may invest in municipal securities issued by special taxing districts. Special taxing districts are organized to plan and finance infrastructure developments to induce residential, commercial and industrial growth and redevelopment. The bond financing methods such as tax increment finance, tax assessment, special services district and Mello-Roos bonds, are generally payable solely from taxes or other revenues attributable to the specific projects financed by the bonds without recourse to the credit or taxing power of related or overlapping municipalities.
The Fund may invest in zero coupon bonds. A zero coupon bond is a bond that typically does not pay interest for the entire life of the obligation or for an initial period after the issuance of the obligation.
The Fund may buy and sell securities on a when-issued or delayed delivery basis, making payment or taking delivery at a later date, normally within 15 to 45 days of the trade date.
The Fund may utilize structured notes and similar instruments for investment purposes and also for hedging purposes. Structured notes are privately negotiated debt obligations where the principal and/or interest is determined by reference to the performance of a benchmark asset, market or interest rate (an “embedded index”), such as selected securities, an index of securities or specified interest rates, or the differential performance of two assets or markets.
The Fund may invest in illiquid securities (i.e., securities that are not readily marketable), including, but not limited to, restricted securities (securities the disposition of which is restricted under the federal securities laws), securities that may be resold only pursuant to Rule 144A under the 1933 Act, and repurchase agreements with maturities in excess of seven days.
The Fund may enter into certain derivative instruments in pursuit of its investment objectives, including to seek to enhance return, to hedge certain risks of its investments in municipal securities or as a substitute for a position in the underlying asset. Such instruments include financial futures contracts, swap contracts (including interest rate swaps, credit default swaps and MMD Rate Locks), options on financial futures, options on swap contracts or other derivative instruments.
The Fund may purchase and sell MMD Rate Locks. An MMD Rate Lock permits the Fund to lock in a specified municipal interest rate for a portion of its portfolio to preserve a return on a particular investment or a portion of its portfolio as a duration management technique or to protect against any increase in the price of securities to be purchased at a later date. By using an MMD Rate Lock, the Fund can create a synthetic long or short position, allowing the Fund to select what the manager believes is an attractive part of the yield curve. The Fund will ordinarily use these transactions as a hedge or for duration or risk management although it is permitted to enter into them to enhance income or gain or to increase the Fund’s yield, for example, during periods of steep interest rate yield curves (i.e., wide differences between short term and long term interest rates).
The Fund may also invest in securities of other open- or closed-end investment companies (including ETFs) that invest primarily in municipal securities of the types in which the Fund may invest directly, to the extent permitted by the 1940 Act, the rules and regulations issued thereunder and applicable exemptive orders issued by the SEC.
Use of Leverage
The Fund uses leverage to pursue its investment objectives. The Fund may use leverage to the extent permitted by the 1940 Act. The Fund may source leverage through a number of methods including the issuance of Preferred Shares and investments in inverse floating rate securities. However, pursuant to its fundamental policy, the Fund may not borrow money (including reverse repurchase agreements), except from banks for temporary or emergency purposes, or to repurchase its shares, subject to certain restrictions. In addition, the Fund may also use certain derivatives that have the economic effect of leverage by creating additional investment exposure. The amount and sources of leverage will vary depending on market conditions.
Temporary Defensive Periods
During temporary defensive periods (e.g., times when, in the Fund’s investment adviser’s and/or the Fund’s sub-adviser’s opinion, temporary imbalances of supply and demand or other temporary dislocations in the tax-exempt bond market adversely affect the price at which long-term or intermediate-term municipal securities are available), the Fund may invest up to 100% of its net assets in cash or cash equivalents, short-term investments or municipal bonds and deviate from its investment policies including the Fund’s 80% names rule policy. Also, during these periods, the weighted average maturity of the Fund’s investment portfolio may fall below the effective maturity range of at least 15 to 30 years and the Fund may not achieve its investment objectives.
102
PRINCIPAL RISKS OF THE FUNDS
The factors that are most likely to have a material effect on a particular Fund’s portfolio as a whole are called “principal risks.” Each Fund is subject to the principal risks indicated below, whether through direct investment or derivative positions. Each Fund may be subject to additional risks other than those identified and described below because the types of investments made by a Fund can change over time.
| Nuveen | Nuveen | Nuveen | Nuveen |
| Arizona | Ohio | New Jersey | Pennsylvania |
| Quality | Quality | Quality | Quality |
| Municipal | Municipal | Municipal | Municipal |
| Income Fund | Income Fund | Income Fund | Income Fund |
| Risk | (NAZ) | (NUO) | (NXJ) | (NQP) |
| Portfolio Level Risks | | | | |
Alternative Minimum Tax Risk | X | X | X | X |
Below Investment Grade Risk | X | X | X | X |
Call Risk | X | X | X | X |
Credit Risk | X | X | X | X |
Credit Spread Risk | X | X | X | X |
Deflation Risk | X | X | X | X |
Derivatives Risk | X | X | X | X |
Distressed Securities Risk | X | X | X | X |
Duration Risk | X | X | X | X |
Economic Sector Risk | X | X | X | X |
Financial Futures and Options Risk | X | X | X | X |
Hedging Risk | X | X | X | X |
Illiquid Investments Risk | X | X | X | X |
Income Risk | X | X | X | X |
Inflation Risk | X | X | X | X |
Insurance Risk | X | X | X | X |
Interest Rate Risk | X | X | X | X |
Inverse Floating Rate Securities Risk | X | X | X | X |
Municipal Securities Market Liquidity Risk | X | X | X | X |
Municipal Securities Market Risk | X | X | X | X |
Other Investment Companies Risk | X | X | X | X |
Puerto Rico Municipal Securities Market Risk | X | X | X | X |
Reinvestment Risk | X | X | X | X |
Sector and Industry Risk | X | X | X | X |
Sector Focus Risk | X | X | X | X |
Special Considerations Related to Single State Concentration Risk | X | X | X | X |
Special Risks Related to Certain Municipal Obligations | X | X | X | X |
Swap Transactions Risk | X | X | X | X |
Tax Risk | X | X | X | X |
Taxability Risk | X | X | X | X |
Tobacco Settlement Bond Risk | X | X | X | X |
Valuation Risk | X | X | X | X |
Zero Coupon Bonds Risk | X | X | X | X |
103
Shareholder Update (Unaudited) (continued)
| | | | | |
| Nuveen | Nuveen | Nuveen | Nuveen |
| Arizona | Ohio | New Jersey | Pennsylvania |
| Quality | Quality | Quality | Quality |
| Municipal | Municipal | Municipal | Municipal |
| Income Fund | Income Fund | Income Fund | Income Fund |
| Risk | (NAZ) | (NUO) | (NXJ) | (NQP) |
| Fund Level and Other Risks | | | | |
Anti-Takeover Provisions | X | X | X | X |
Counterparty Risk | X | X | X | X |
Cybersecurity Risk | X | X | X | X |
Economic and Political Events Risk | X | X | X | X |
Global Economic Risk | X | X | X | X |
Investment and Market Risk | X | X | X | X |
Legislation and Regulatory Risk | X | X | X | X |
Leverage Risk | X | X | X | X |
Market Discount from Net Asset Value | X | X | X | X |
Recent Market Conditions | X | X | X | X |
Reverse Repurchase Agreement Risk | X | X | X | X |
Alternative Minimum Tax Risk. The Fund may invest in AMT Bonds. Therefore, a portion of the Fund’s otherwise exempt-interest dividends may be taxable to those shareholders subject to the federal alternative minimum tax.
Below Investment Grade Risk. Municipal securities of below investment grade quality are regarded as having speculative characteristics with respect to the issuer’s capacity to pay interest and repay principal, and may be subject to higher price volatility and default risk than investment grade municipal securities of comparable terms and duration. Issuers of lower grade municipal securities may be highly leveraged and may not have available to them more traditional methods of financing. The prices of these lower grade securities are typically more sensitive to negative developments, such as a decline in the issuer’s revenues or a general economic downturn. The secondary market for lower rated municipal securities may not be as liquid as the secondary market for more highly rated municipal securities, a factor which may have an adverse effect on the Fund’s ability to dispose of a particular municipal security. If a below investment grade municipal security goes into default, or its issuer enters bankruptcy, it might be difficult to sell that security in a timely manner at a reasonable price.
Call Risk. The Fund may invest in municipal securities that are subject to call risk. Such municipal securities may be redeemed at the option of the issuer, or “called,” before their stated maturity or redemption date. In general, an issuer will call its instruments if they can be refinanced by issuing new instruments that bear a lower interest rate. The Fund is subject to the possibility that during periods of falling interest rates, an issuer will call its high yielding municipal securities. The Fund would then be forced to invest the unanticipated proceeds at lower interest rates, resulting in a decline in the Fund’s income.
Credit Risk. Issuers of municipal securities in which the Fund may invest may default on their obligations to pay principal or interest when due. This non-payment would result in a reduction of income to the Fund, a reduction in the value of a municipal security experiencing non-payment and potentially a decrease in the net asset value (“NAV”) of the Fund. To the extent that the credit rating assigned to a municipal security in the Fund’s portfolio is downgraded, the market price and liquidity of such security may be adversely affected.
Credit Spread Risk. Credit spread risk is the risk that credit spreads (i.e., the difference in yield between securities that is due to differences in their credit quality) may increase when the market believes that municipal securities generally have a greater risk of default. Increasing credit spreads may reduce the market values of the Fund’s securities. Credit spreads often increase more for lower rated and unrated securities than for investment grade securities. In addition, when credit spreads increase, reductions in market value will generally be greater for longer-maturity securities.
Deflation Risk. Deflation risk is the risk that prices throughout the economy decline over time. Deflation may have an adverse effect on the creditworthiness of issuers and may make issuer default more likely, which may result in a decline in the value of the Fund’s portfolio.
Derivatives Risk. The use of derivatives involves additional risks and transaction costs which could leave the Fund in a worse position than if it had not used these instruments. Derivative instruments can be used to acquire or to transfer the risk and returns of a municipal security or other asset without buying or selling the municipal security or asset. These instruments may entail investment exposures that are greater than their cost would suggest. As a result, a small investment in derivatives can result in losses that greatly exceed the original investment. Derivatives can be highly volatile, illiquid and difficult to value. An over-the-counter derivative transaction between the Fund and a counterparty that is not cleared through a central counterparty also involves the risk that a loss may be sustained as a result of the failure of the counterparty to the contract to make required payments. The payment
104
obligation for a cleared derivative transaction is guaranteed by a central counterparty, which exposes the Fund to the creditworthiness of the central counterparty.
It is possible that developments in the derivatives market, including changes in government regulation, could adversely impact the Fund’s ability to invest in certain derivatives.
Distressed Securities Risk. The Fund may invest in low-rated securities or securities unrated but judged by the sub-adviser to be of comparable quality. Some or many of these low-rated securities, although not in default, may be “distressed,” meaning that the issuer is experiencing financial difficulties or distress at the time of acquisition. Such securities would present a substantial risk of future default which may cause the Fund to incur losses, including additional expenses, to the extent it is required to seek recovery upon a default in the payment of principal or interest on those securities. In any reorganization or liquidation proceeding relating to a portfolio security, the Fund may lose its entire investment or may be required to accept cash or securities with a value less than its original investment. Distressed securities may be subject to restrictions on resale.
Duration Risk. Duration is the sensitivity, expressed in years, of the price of a fixed-income security to changes in the general level of interest rates (or yields). Securities with longer durations tend to be more sensitive to interest rate (or yield) changes, which typically corresponds to increased volatility and risk, than securities with shorter durations. For example, if a security or portfolio has a duration of three years and interest rates increase by 1%, then the security or portfolio would decline in value by approximately 3%. Duration differs from maturity in that it considers potential changes to interest rates, and a security’s coupon payments, yield, price and par value and call features, in addition to the amount of time until the security matures. The duration of a security will be expected to change over time with changes in market factors and time to maturity.
Economic Sector Risk. The Fund may invest a significant amount of its total assets in municipal securities in the same economic sector. This may make the Fund more susceptible to adverse economic, political or regulatory occurrences affecting an economic sector. As concentration increases, so does the potential for fluctuation in the value of the Fund’s assets. In addition, the Fund may invest a significant portion of its assets in certain sectors of the municipal securities market, such as health care facilities, private educational facilities, special taxing districts and start-up utility districts, and private activity bonds including industrial development bonds on behalf of transportation companies, whose credit quality and performance may be more susceptible to economic, business, political, regulatory and other developments than other sectors of municipal issuers. If the Fund invests a significant portion of its assets in the sectors noted above, the Fund’s performance may be subject to additional risk and variability.
Financial Futures and Options Transactions Risk. The Fund may use certain transactions for hedging the portfolio’s exposure to credit risk and the risk of increases in interest rates, which could result in poorer overall performance for the Fund. There may be an imperfect correlation between price movements of the futures and options and price movements of the portfolio securities being hedged.
If the Fund engages in futures transactions or in the writing of options on futures, it will be required to maintain initial margin and maintenance margin and may be required to make daily variation margin payments in accordance with applicable rules of the exchanges and the Commodity Futures Trading Commission (“CFTC”). If the Fund purchases a financial futures contract or a call option or writes a put option in order to hedge the anticipated purchase of municipal securities, and if the Fund fails to complete the anticipated purchase transaction, the Fund may have a loss or a gain on the futures or options transaction that will not be offset by price movements in the municipal securities that were the subject of the anticipatory hedge. There can be no assurance that a liquid market will exist at a time when the Fund seeks to close out a derivatives or futures or a futures option position, and the Fund would remain obligated to meet margin requirements until the position is closed.
Hedging Risk. The Fund’s use of derivatives or other transactions to reduce risk involves costs and will be subject to the investment adviser’s and/or the sub-adviser’s ability to predict correctly changes in the relationships of such hedge instruments to the Fund’s portfolio holdings or other factors. No assurance can be given that the investment adviser’s and/or the sub-adviser’s judgment in this respect will be correct, and no assurance can be given that the Fund will enter into hedging or other transactions at times or under circumstances in which it may be advisable to do so. Hedging activities may reduce the Fund’s opportunities for gain by offsetting the positive effects of favorable price movements and may result in net losses.
Illiquid Investments Risk. Illiquid investments are investments that are not readily marketable and may include restricted securities, which are securities that may not be resold unless they have been registered under the 1933 Act or that can be sold in a private transaction pursuant to an available exemption from such registration. Illiquid investments involve the risk that the investments will not be able to be sold at the time desired by the Fund or at prices approximating the value at which the Fund is carrying the investments on its books from time to time.
Income Risk. The Fund’s income could decline due to falling market interest rates. This is because, in a falling interest rate environment, the Fund generally will have to invest the proceeds from maturing portfolio securities in lower-yielding securities.
Inflation Risk. Inflation risk is the risk that the value of assets or income from investments will be worth less in the future as inflation decreases the value of money. As inflation increases, the real value of the common shares and distributions can decline.
Insurance Risk. The Fund may purchase municipal securities that are secured by insurance, bank credit agreements or escrow accounts. The credit quality of the companies that provide such credit enhancements will affect the value of those securities. Certain significant providers of insurance for municipal securities have incurred significant losses as a result of exposure to sub-prime mortgages and other lower credit quality investments. As a result, such losses reduced the insurers’ capital and called into question their continued ability to perform their obligations under such insurance if they
105
Shareholder Update (Unaudited) (continued)
are called upon to do so in the future. While an insured municipal security will typically be deemed to have the rating of its insurer, if the insurer of a municipal security suffers a downgrade in its credit rating or the market discounts the value of the insurance provided by the insurer, the value of the municipal security would more closely, if not entirely, reflect such rating. In such a case, the value of insurance associated with a municipal security may not add any value. The insurance feature of a municipal security does not guarantee the full payment of principal and interest through the life of an insured obligation, the market value of the insured obligation or the NAV of the common shares represented by such insured obligation.
Interest Rate Risk. Interest rate risk is the risk that municipal securities in the Fund’s portfolio will decline in value because of changes in market interest rates. Generally, when market interest rates rise, the market value of such securities will fall, and vice versa. As interest rates decline, issuers of municipal securities may prepay principal earlier than scheduled, forcing the Fund to reinvest in lower-yielding securities and potentially reducing the Fund’s income. As interest rates increase, slower than expected principal payments may extend the average life of municipal securities, potentially locking in a below-market interest rate and reducing the Fund’s value. In typical market interest rate environments, the prices of longer-term municipal securities generally fluctuate more than prices of shorter-term municipal securities as interest rates change.
Inverse Floating Rate Securities Risk. The Fund may invest in inverse floating rate securities. In general, income on inverse floating rate securities will decrease when short-term interest rates increase and increase when short-term interest rates decrease. Investments in inverse floating rate securities may subject the Fund to the risks of reduced or eliminated interest payments and losses of principal. In addition, inverse floating rate securities may increase or decrease in value at a greater rate than the underlying interest rate, which effectively leverages the Fund’s investment. As a result, the market value of such securities generally will be more volatile than that of fixed rate securities.
The Fund may invest in inverse floating rate securities issued by special purpose trusts that have recourse to the Fund. In such instances, the Fund may be at risk of loss that exceeds its investment in the inverse floating rate securities.
The Fund may be required to sell its inverse floating rate securities at less than favorable prices, or liquidate other Fund portfolio holdings in certain circumstances, including, but not limited to, the following:
| • | If the Fund has a need for cash and the securities in a special purpose trust are not actively trading due to adverse market conditions; |
| • | If special purpose trust sponsors (as a collective group or individually) experience financial hardship and consequently seek to terminate their respective outstanding special purpose trusts; and |
| • | If the value of an underlying security declines significantly and if additional collateral has not been posted by the Fund. |
Municipal Securities Market Liquidity Risk. Inventories of municipal securities held by brokers and dealers have decreased in recent years, lessening their ability to make a market in these securities. This reduction in market making capacity has the potential to decrease the Fund’s ability to buy or sell municipal securities at attractive prices, and increase municipal security price volatility and trading costs, particularly during periods of economic or market stress. In addition, recent federal banking regulations may cause certain dealers to reduce their inventories of municipal securities, which may further decrease the Fund’s ability to buy or sell municipal securities. As a result, the Fund may be forced to accept a lower price to sell a security, to sell other securities to raise cash, or to give up an investment opportunity, any of which could have a negative effect on performance. If the Fund needed to sell large blocks of municipal securities to raise cash to meet its obligations, those sales could further reduce the municipal securities’ prices and hurt performance.
Municipal Securities Market Risk. The amount of public information available about the municipal securities in the Fund’s portfolio is generally less than that for corporate equities or bonds, and the investment performance of the Fund may therefore be more dependent on the analytical abilities of the sub-adviser than if the Fund were a stock fund or taxable bond fund. The secondary market for municipal securities, particularly below investment grade municipal securities, also tends to be less well-developed or liquid than many other securities markets, which may adversely affect the Fund’s ability to sell its municipal securities at attractive prices.
Other Investment Companies Risk. The Fund may invest in the securities of other investment companies, including ETFs. Investing in an investment company exposes the Fund to all of the risks of that investment company’s investments. The Fund, as a holder of the securities of other investment companies, will bear its pro rata portion of the other investment companies’ expenses, including advisory fees. These expenses are in addition to the direct expenses of the Fund’s own operations. As a result, the cost of investing in investment company shares may exceed the costs of investing directly in its underlying investments. In addition, securities of other investment companies may be leveraged. As a result, the Fund may be indirectly exposed to leverage through an investment in such securities and therefore magnify the Fund’s leverage risk.
With respect to ETF’s, an ETF that is based on a specific index may not be able to replicate and maintain exactly the composition and relative weighting of securities in the index. The value of an ETF based on a specific index is subject to change as the values of its respective component assets fluctuate according to market volatility. ETFs typically rely on a limited pool of authorized participants to create and redeem shares, and an active trading market for ETF shares may not develop or be maintained. The market value of shares of ETFs and closed-end funds may differ from their NAV.
Puerto Rico Municipal Securities Market Risk. To the extent that the Fund invests a significant portion of its assets in the securities issued by the Commonwealth of Puerto Rico or its political subdivisions, agencies, instrumentalities, or public corporations (collectively referred to as “Puerto Rico” or
106
the “Commonwealth”), it will be disproportionally affected by political, social and economic conditions and developments in the Commonwealth. In addition, economic, political or regulatory changes in that territory could adversely affect the value of the Fund’s investment portfolio.
Puerto Rico currently is experiencing significant fiscal and economic challenges, including substantial debt service obligations, high levels of unemployment, underfunded public retirement systems, and persistent government budget deficits. These challenges may negatively affect the value of the Fund’s investments in Puerto Rican municipal securities. Several major ratings agencies have downgraded the general obligation debt of Puerto Rico to below investment grade and continue to maintain a negative outlook for this debt, which increases the likelihood that the rating will be lowered further. Puerto Rico recently defaulted on its debt by failing to make full payment due on its outstanding bonds, and there can be no assurance that Puerto Rico will be able to satisfy its future debt obligations. Further downgrades or defaults may place additional strain on the Puerto Rico economy and may negatively affect the value, liquidity, and volatility of the Fund’s investments in Puerto Rican municipal securities. Additionally, numerous issuers have entered Title III of the Puerto Rico Oversight, Management and Economic Stability Act (“PROMESA”), which is similar to bankruptcy protection, through which the Commonwealth of Puerto Rico can restructure its debt. However, Puerto Rico’s case is the first ever heard under PROMESA and there is no existing case precedent to guide the proceedings. Accordingly, Puerto Rico’s debt restructuring process could take significantly longer than traditional municipal bankruptcy proceedings. Further, it is not clear whether a debt restructuring process will ultimately be approved or, if so, the extent to which it will apply to Puerto Rico municipal securities sold by an issuer other than the territory. A debt restructuring could reduce the principal amount due, the interest rate, the maturity, and other terms of Puerto Rico municipal securities, which could adversely affect the value of Puerto Rican municipal securities. Legislation that would allow Puerto Rico to restructure its municipal debt obligations, thus increasing the risk that Puerto Rico may never pay off municipal indebtedness, or may pay only a small fraction of the amount owed, could also impact the value of the Fund’s investments in Puerto Rican municipal securities.
These challenges and uncertainties have been exacerbated by multiple hurricanes and the resulting natural disasters that have stuck Puerto Rico since 2017. The full extent of the natural disasters’ impact on Puerto Rico’s economy and foreign investment in Puerto Rico is difficult to estimate.
Reinvestment Risk. Reinvestment risk is the risk that income from the Fund’s portfolio will decline if and when the Fund invests the proceeds from matured, traded or called municipal securities at market interest rates that are below the portfolio’s current earnings rate. A decline in income could affect the common shares’ market price, NAV and/or a common shareholder’s overall returns.
Sector and Industry Risk. Subject to the concentration limits of the Fund’s investment policies and guidelines, a Fund may invest a significant portion of its net assets in certain sectors of the municipal securities market, such as hospitals and other health care facilities, charter schools and other private educational facilities, special taxing districts and start-up utility districts, and private activity bonds including industrial development bonds on behalf of transportation companies such as airline companies, whose credit quality and performance may be more susceptible to economic, business, political, regulatory and other developments than other sectors of municipal issuers. If the Fund invests a significant portion of its net assets in the sectors noted above, the Fund’s performance may be subject to additional risk and variability.
Sector Focus Risk. At times, the Fund may focus its investments (i.e., overweight its investments relative to the overall municipal securities market) in one or more particular sectors, which may subject the Fund to additional risk and variability. Securities issued in the same sector may be similarly affected by economic or market events, making the Fund more vulnerable to unfavorable developments in that sector than funds that invest more broadly. As the percentage of the Fund’s Managed Assets invested in a particular sector increases, so does the potential for fluctuation in the NAV of the Fund’s common shares.
Special Considerations Related to Single State Concentration Risk. Because the Fund primarily invests in municipal securities from a single state, the Fund is more susceptible to political, economic or regulatory factors affecting issuers of single state municipal securities. Information regarding the financial condition of the state is ordinarily included in various public documents issued thereby, such as the official statements prepared in connection with the issuance of general obligation bonds for the state.
Additionally, the states are party to numerous legal proceedings, many of which normally occur in governmental operations. The creditworthiness of obligations issued by local issuers of the state may be unrelated to the creditworthiness of obligations issued by the state, and that there is no obligation on the part of the state to make payment on such local obligations in the event of default.
Special Risks Related to Certain Municipal Obligations. Municipal leases and certificates of participation involve special risks not normally associated with general obligations or revenue bonds. Leases and installment purchase or conditional sale contracts (which normally provide for title to the leased asset to pass eventually to the governmental issuer) have evolved as a means for governmental issuers to acquire property and equipment without meeting the constitutional and statutory requirements for the issuance of debt. The debt issuance limitations are deemed to be inapplicable because of the inclusion in many leases or contracts of “non-appropriation” clauses that relieve the governmental issuer of any obligation to make future payments under the lease or contract unless money is appropriated for such purpose by the appropriate legislative body. In addition, such leases or contracts may be subject to the temporary abatement of payments in the event that the governmental issuer is prevented from maintaining occupancy of the leased premises or utilizing the leased equipment. Although the obligations may be secured by the leased equipment or facilities, the disposition of the property in the event of non-appropriation or foreclosure might prove difficult, time consuming and costly, and may result in a delay in recovering or
107
Shareholder Update (Unaudited) (continued)
the failure to fully recover the Fund’s original investment. In the event of non-appropriation, the issuer would be in default and taking ownership of the assets may be a remedy available to the Fund, although the Fund does not anticipate that such a remedy would normally be pursued.
Certificates of participation involve the same risks as the underlying municipal leases. In addition, the Fund may be dependent upon the municipal authority issuing the certificates of participation to exercise remedies with respect to the underlying securities. Certificates of participation also entail a risk of default or bankruptcy, both of the issuer of the municipal lease and also the municipal agency issuing the certificate of participation.
Swap Transactions Risk. The Fund may enter into debt-related derivative instruments such as credit default swap contracts and interest rate swaps. Like most derivative instruments, the use of swaps is a highly specialized activity that involves investment techniques and risks different from those associated with ordinary portfolio securities transactions. In addition, the use of swaps requires an understanding by the adviser and/or the sub-adviser of not only the referenced asset, rate or index, but also of the swap itself. If the investment adviser and/or the sub-adviser is incorrect in its forecasts of default risks, market spreads or other applicable factors or events, the investment performance of the Fund would diminish compared with what it would have been if these techniques were not used.
Tax Risk. The value of the Fund’s investments and its NAV may be adversely affected by changes in tax rates, rules and policies. Because interest income from municipal securities is normally not subject to regular federal income taxation, the attractiveness of municipal securities in relation to other investment alternatives is affected by changes in federal income tax rates or changes in the tax exempt status of interest income from municipal securities. Additionally, the Fund is not a suitable investment for individual retirement accounts, for other tax exempt or tax-deferred accounts, for investors who are not sensitive to the federal income tax consequences of their investments.
Taxability Risk. The Fund will invest in municipal securities in reliance at the time of purchase on an opinion of bond counsel to the issuer that the interest paid on those securities will be excludable from gross income for regular federal income tax purposes, and the sub-adviser will not independently verify that opinion. Subsequent to the Fund’s acquisition of such a municipal security, however, the security may be determined to pay, or to have paid, taxable income. As a result, the treatment of dividends previously paid or to be paid by the Fund as “exempt-interest dividends” could be adversely affected, subjecting the Fund’s shareholders to increased federal income tax liabilities. Certain other investments made by the Fund, including derivatives transactions, may result in the receipt of taxable income or gains by the Fund.
Tobacco Settlement Bond Risk. The Fund may invest in tobacco settlement bonds. Tobacco settlement bonds are municipal securities that are backed solely by expected revenues to be derived from lawsuits involving tobacco related deaths and illnesses which were settled between certain states and American tobacco companies. Tobacco settlement bonds are secured by an issuing state’s proportionate share in the Master Settlement Agreement, an agreement between 46 states and nearly all of the U.S. tobacco manufacturers (the “MSA”). Under the terms of the MSA, the actual amount of future settlement payments by tobacco-manufacturers is dependent on many factors, including, among other things, reduced cigarette consumption. Payments made by tobacco manufacturers could be negatively impacted if the decrease in tobacco consumption is significantly greater than the forecasted decline.
Valuation Risk. The municipal securities in which the Fund invests typically are valued by a pricing service utilizing a range of market-based inputs and assumptions, including readily available market quotations obtained from broker-dealers making markets in such instruments, cash flows and transactions for comparable instruments. There is no assurance that the Fund will be able to sell a portfolio security at the price established by the pricing service, which could result in a loss to the Fund. Pricing services generally price municipal securities assuming orderly transactions of an institutional “round lot” size, but some trades may occur in smaller, “odd lot” sizes, often at lower prices than institutional round lot trades. Different pricing services may incorporate different assumptions and inputs into their valuation methodologies, potentially resulting in different values for the same securities. As a result, if the Fund were to change pricing services, or if the Fund’s pricing service were to change its valuation methodology, there could be a material impact, either positive or negative, on the Fund’s NAV.
Zero Coupon Bonds Risk. Because interest on zero coupon bonds is not paid on a current basis, the values of zero coupon bonds will be more volatile in response to interest rate changes than the values of bonds that distribute income regularly. Although zero coupon bonds generate income for accounting purposes, they do not produce cash flow, and thus the Fund could be forced to liquidate securities at an inopportune time in order to generate cash to distribute to shareholders as required by tax laws.
Fund Level and Other Risks:
Anti-Takeover Provisions. The Fund’s organizational documents include provisions that could limit the ability of other entities or persons to acquire control of the Fund or convert the Fund to open-end status. These provisions could have the effect of depriving the common shareholders of opportunities to sell their common shares at a premium over the then-current market price of the common shares.
Counterparty Risk. Changes in the credit quality of the companies that serve as the Fund’s counterparties with respect to derivatives or other transactions supported by another party’s credit will affect the value of those instruments. Certain entities that have served as counterparties in the markets for these transactions have incurred or may incur in the future significant financial hardships including bankruptcy and losses as a result of exposure to sub-prime mortgages and other lower-quality credit investments. As a result, such hardships have reduced these entities’ capital and called into question their continued ability to perform their obligations under such transactions. By using such derivatives or other transactions, the Fund
108
assumes the risk that its counterparties could experience similar financial hardships. In the event of the insolvency of a counterparty, the Fund may sustain losses or be unable to liquidate a derivatives position.
Cybersecurity Risk. The Fund and its service providers are susceptible to operational and information security risk resulting from cyber incidents. Cyber incidents refer to both intentional attacks and unintentional events including: processing errors, human errors, technical errors including computer glitches and system malfunctions, inadequate or failed internal or external processes, market-wide technical-related disruptions, unauthorized access to digital systems (through “hacking” or malicious software coding), computer viruses, and cyber-attacks which shut down, disable, slow or otherwise disrupt operations, business processes or website access or functionality (including denial of service attacks). Cyber incidents could adversely impact the Fund and cause the Fund to incur financial loss and expense, as well as face exposure to regulatory penalties, reputational damage, and additional compliance costs associated with corrective measures. In addition, substantial costs may be incurred in order to prevent any cyber incidents in the future. Furthermore, the Fund cannot control the cybersecurity plans and systems put in place by its service providers or any other third parties whose operations may affect the Fund.
Economic and Political Events Risk. The Fund may be more sensitive to adverse economic, business or political developments if it invests a substantial portion of its assets in the municipal securities of similar projects (such as those relating to the education, health care, housing, transportation, or utilities industries), industrial development bonds, or in particular types of municipal securities (such as general obligation bonds, private activity bonds or moral obligation bonds). Such developments may adversely affect a specific industry or local political and economic conditions, and thus may lead to declines in the creditworthiness and value of such municipal securities.
Global Economic Risk. National and regional economies and financial markets are becoming increasingly interconnected, which increases the possibilities that conditions in one country, region or market might adversely impact issuers in a different country, region or market. Changes in legal, political, regulatory, tax and economic conditions may cause fluctuations in markets and securities prices around the world, which could negatively impact the value of the Fund’s investments. Major economic or political disruptions, particularly in large economies like China’s, may have global negative economic and market repercussions. Additionally, events such as war, terrorism, natural and environmental disasters and the spread of infectious illnesses or other public health emergencies may adversely affect the global economy and the markets and issuers in which the Fund invests. Recent examples of such events include the outbreak of a novel coronavirus known as COVID-19 that was first detected in China in December 2019 and heightened concerns regarding North Korea’s nuclear weapons and long-range ballistic missile programs. These events could reduce consumer demand or economic output, result in market closure, travel restrictions or quarantines, and generally have a significant impact on the economy. These events could also impair the information technology and other operational systems upon which the Fund’s service providers, including the investment adviser and sub-adviser, rely, and could otherwise disrupt the ability of employees of the Fund’s service providers to perform essential tasks on behalf of the Fund. Governmental and quasi-governmental authorities and regulators throughout the world have in the past responded to major economic disruptions with a variety of significant fiscal and monetary policy changes, including but not limited to, direct capital infusions into companies, new monetary programs and dramatically lower interest rates. An unexpected or quick reversal of these policies, or the ineffectiveness of these policies, could increase volatility in securities markets, which could adversely affect the Fund’s investments.
Investment and Market Risk. An investment in common shares is subject to investment risk, including the possible loss of the entire principal amount that you invest. Common shares frequently trade at a discount to their NAV. An investment in common shares represents an indirect investment in the securities owned by the Fund. Common shares at any point in time may be worth less than your original investment, even after taking into account the reinvestment of Fund dividends and distributions.
Legislation and Regulatory Risk. At any time after the date of this report, legislation or additional regulations may be enacted that could negatively affect the assets of the Fund, securities held by the Fund or the issuers of such securities. Fund shareholders may incur increased costs resulting from such legislation or additional regulation. There can be no assurance that future legislation, regulation or deregulation will not have a material adverse effect on the Fund or will not impair the ability of the Fund to achieve its investment objectives.
The SEC recently adopted rules governing the use of derivatives by registered investment companies, which could affect the nature and extent of derivatives used by the Fund. The full impact of such rules is uncertain at this time. It is possible that such rules, as interpreted, applied and enforced by the SEC, could limit the implementation of the Fund’s use of derivatives, which could have an adverse impact on the Fund.
Leverage Risk. The use of leverage creates special risks for common shareholders, including potential interest rate risks and the likelihood of greater volatility of NAV and market price of, and distributions on, the common shares. The use of leverage in a declining market will likely cause a greater decline in the Fund’s NAV, which may result at a greater decline of the common share price, than if the Fund were not to have used leverage.
The Fund will pay (and common shareholders will bear) any costs and expenses relating to the Fund’s use of leverage, which will result in a reduction in the Fund’s NAV. The investment adviser may, based on its assessment of market conditions and composition of the Fund’s holdings, increase or decrease the amount of leverage. Such changes may impact the Fund’s distributions and the price of the common shares in the secondary market.
The Fund may seek to refinance its leverage over time, in the ordinary course, as current forms of leverage mature or it is otherwise desirable to refinance; however, the form that such leverage will take cannot be predicted at this time. If the Fund is unable to replace existing leverage on
109
Shareholder Update (Unaudited) (continued)
comparable terms, its costs of leverage will increase. Accordingly, there is no assurance that the use of leverage may result in a higher yield or return to common shareholders.
The amount of fees paid to the investment adviser and the sub-adviser for investment advisory services will be higher if the Fund uses leverage because the fees will be calculated based on the Fund’s Managed Assets - this may create an incentive for the investment adviser and the sub-adviser to leverage the Fund or increase the Fund’s leverage.
Market Discount from Net Asset Value. Shares of closed-end investment companies like the Fund frequently trade at prices lower than their NAV. This characteristic is a risk separate and distinct from the risk that the Fund’s NAV could decrease as a result of investment activities. Whether investors will realize gains or losses upon the sale of the common shares will depend not upon the Fund’s NAV but entirely upon whether the market price of the common shares at the time of sale is above or below the investor’s purchase price for the common shares. Furthermore, management may have difficulty meeting the Fund’s investment objectives and managing its portfolio when the underlying securities are redeemed or sold during periods of market turmoil and as investors’ perceptions regarding closed-end funds or their underlying investments change. Because the market price of the common shares will be determined by factors such as relative supply of and demand for the common shares in the market, general market and economic circumstances, and other factors beyond the control of the Fund, the Fund cannot predict whether the common shares will trade at, below or above NAV. The common shares are designed primarily for long-term investors, and you should not view the Fund as a vehicle for short-term trading purposes.
Recent Market Conditions. In response to the financial crisis and recent market events, policy and legislative changes by the United States government and the Federal Reserve to assist in the ongoing support of financial markets, both domestically and in other countries, are changing many aspects of financial regulation. The impact of these changes on the markets, and the practical implications for market participants, may not be fully known for some time. Withdrawal of government support, failure of efforts in response to the crisis, or investor perception that such efforts are not succeeding, could adversely impact the value and liquidity of certain securities. The severity or duration of adverse economic conditions may also be affected by policy changes made by governments or quasi-governmental organizations, including changes in tax laws and the imposition of trade barriers. The impact of new financial regulation legislation on the markets and the practical implications for market participants may not be fully known for some time. Changes to the Federal Reserve policy may affect the value, volatility and liquidity of dividend and interest paying securities. In addition, the contentious domestic political environment, as well as political and diplomatic events within the United States and abroad, such as the U.S. government’s inability at times to agree on a long-term budget and deficit reduction plan, the threat of a federal government shutdown and threats not to increase the federal government’s debt limit, may affect investor and consumer confidence and may adversely impact financial markets and the broader economy, perhaps suddenly and to a significant degree.
Interest rates have been unusually low in recent years in the United States and abroad but there is consensus that interest rates will increase during the life of the Fund, which could negatively impact the price of debt securities. Because there is little precedent for this situation, it is difficult to predict the impact of a significant rate increase on various markets.
The current political climate has intensified concerns about a potential trade war between China and the United States, as each country has recently imposed tariffs on the other country’s products. These actions may trigger a significant reduction in international trade, the oversupply of certain manufactured goods, substantial price reductions of goods and possible failure of individual companies and/or large segments of China’s export industry, which could have a negative impact on the Fund’s performance.
The impact of these developments in the near- and long-term is unknown and could have additional adverse effects on economies, financial markets and asset valuations around the world.
Reverse Repurchase Agreement Risk. A reverse repurchase agreement, in economic essence, constitutes a securitized borrowing by the Fund from the security purchaser. The Fund may enter into reverse repurchase agreements for the purpose of creating a leveraged investment exposure and, as such, their usage involves essentially the same risks associated with a leveraging strategy generally since the proceeds from these agreements may be invested in additional portfolio securities. Reverse repurchase agreements tend to be short-term in tenor, and there can be no assurances that the purchaser (lender) will commit to extend or “roll” a given agreement upon its agreed-upon repurchase date or an alternative purchaser can be identified on similar terms. Reverse repurchase agreements also involve the risk that the purchaser fails to return the securities as agreed upon, files for bankruptcy or becomes insolvent. The Fund may be restricted from taking normal portfolio actions during such time, could be subject to loss to the extent that the proceeds of the agreement are less than the value of securities subject to the agreement and may experience adverse tax consequences.
110
EFFECTS OF LEVERAGE
The following table is furnished in response to requirements of the SEC. It is designed to illustrate the effects of leverage through the use of senior securities, as that term is defined under Section 18 of the 1940 Act, as well as certain other forms of leverage, such as reverse repurchase agreements and investments in inverse floating rate securities, on common share total return, assuming investment portfolio total returns (consisting of income and changes in the value of investments held in a Fund’s portfolio) of -10%, -5%, 0%, 5% and 10%. The table below reflects each Fund’s (i) continued use of leverage as of February 28, 2021 as a percentage of Managed Assets (including assets attributable to such leverage), (ii) the estimated annual effective interest expense rate payable by the Fund on such instruments (based on actual leverage costs incurred during the fiscal year ended February 28, 2021) as set forth in the table, and (iii) the annual return that the Fund’s portfolio must experience (net of expenses) in order to cover such costs of leverage based on such estimated annual effective interest expense rate. The information below does not reflect any Fund’s use of certain other forms of economic leverage achieved through the use of other instruments or transactions not considered to be senior securities under the 1940 Act, such as certain derivative instruments and investments in inverse floating rate securities.
The numbers are merely estimates, used for illustration. The costs of leverage may vary frequently and may be significantly higher or lower than the estimated rate. The assumed investment portfolio returns in the table below are hypothetical figures and are not necessarily indicative of the investment portfolio returns experienced or expected to be experienced by the Fund. Your actual returns may be greater or less than those appearing below.
| Nuveen | Nuveen | Nuveen | Nuveen |
| Arizona | Ohio | New Jersey | Pennsylvania |
| Quality | Quality | Quality | Quality |
| Municipal | Municipal | Municipal | Municipal |
| Income Fund | Income Fund | Income Fund | Income Fund |
| (NAZ) | (NUO) | (NXJ) | (NQP) |
Estimated Leverage as a Percentage of Managed Assets (Including Assets | | | | |
Attributable to Leverage) | 37.53% | 35.16% | 38.13% | 38.72% |
Estimated Annual Effective Leverage Expense Rate Payable by Fund on Leverage | 1.21% | 1.35% | 1.15% | 1.05% |
Annual Return Fund Portfolio Must Experience (net of expenses) to Cover | | | | |
Estimated Annual Effective Interest Expense Rate on Leverage | 0.45% | 0.48% | 0.44% | 0.41% |
Common Share Total Return for (10.00)% Assumed Portfolio Total Return | -16.73% | -16.16% | -16.87% | -16.98% |
Common Share Total Return for (5.00)% Assumed Portfolio Total Return | -8.73% | -8.44% | -8.79% | -8.82% |
Common Share Total Return for 0.00% Assumed Portfolio Total Return | -0.72% | -0.73% | -0.71% | -0.67% |
Common Share Total Return for 5.00% Assumed Portfolio Total Return | 7.28% | 6.98% | 7.37% | 7.49% |
Common Share Total Return for 10.00% Assumed Portfolio Total Return | 15.28% | 14.69% | 15.45% | 15.65% |
Common Share total return is composed of two elements — the distributions paid by a Fund to holders of common shares (the amount of which is largely determined by the net investment income of the Fund after paying dividend payments on any preferred shares issued by the Fund and expenses on any forms of leverage outstanding) and gains or losses on the value of the securities and other instruments the Fund owns. As required by SEC rules, the table assumes that a Fund is more likely to suffer capital losses than to enjoy capital appreciation. For example, to assume a total return of 0%, a Fund must assume that the income it receives on its investments is entirely offset by losses in the value of those investments. This table reflects hypothetical performance of a Fund’s portfolio and not the actual performance of the Fund’s common shares, the value of which is determined by market forces and other factors. Should a Fund elect to add additional leverage to its portfolio, any benefits of such additional leverage cannot be fully achieved until the proceeds resulting from the use of such leverage have been received by the Fund and invested in accordance with the Fund’s investment objectives and policies. As noted above, a Fund’s willingness to use additional leverage, and the extent to which leverage is used at any time, will depend on many factors.
111
Shareholder Update (Unaudited) (continued)
DIVIDEND REINVESTMENT PLAN
Nuveen Closed-End Funds Automatic Reinvestment Plan
Your Nuveen Closed-End Fund allows you to conveniently reinvest distributions in additional Fund shares. By choosing to reinvest, you’ll be able to invest money regularly and automatically, and watch your investment grow through the power of compounding. Just like distributions in cash, there may be times when income or capital gains taxes may be payable on distributions that are reinvested. It is important to note that an automatic reinvestment plan does not ensure a profit, nor does it protect you against loss in a declining market.
Easy and convenient
To make recordkeeping easy and convenient, each month you’ll receive a statement showing your total distributions, the date of investment, the shares acquired and the price per share, and the total number of shares you own.
How shares are purchased
The shares you acquire by reinvesting will either be purchased on the open market or newly issued by the Fund. If the shares are trading at or above NAV at the time of valuation, the Fund will issue new shares at the greater of the NAV or 95% of the then-current market price. If the shares are trading at less than NAV, shares for your account will be purchased on the open market. If Computershare Trust Company, N.A. (the “Plan Agent”) begins purchasing Fund shares on the open market while shares are trading below NAV, but the Fund’s shares subsequently trade at or above their NAV before the Plan Agent is able to complete its purchases, the Plan Agent may cease open-market purchases and may invest the uninvested portion of the distribution in newly-issued Fund shares at a price equal to the greater of the shares’ NAV or 95% of the shares’ market value on the last business day immediately prior to the purchase date. Distributions received to purchase shares in the open market will normally be invested shortly after the distribution payment date. No interest will be paid on distributions awaiting reinvestment. Because the market price of the shares may increase before purchases are completed, the average purchase price per share may exceed the market price at the time of valuation, resulting in the acquisition of fewer shares than if the distribution had been paid in shares issued by the Fund. A pro rata portion of any applicable brokerage commissions on open market purchases will be paid by Dividend Reinvestment Plan (the “Plan”) participants. These commissions usually will be lower than those charged on individual transactions.
Flexible
You may change your distribution option or withdraw from the Plan at any time, should your needs or situation change. You can reinvest whether your shares are registered in your name, or in the name of a brokerage firm, bank, or other nominee. Ask your investment advisor if his or her firm will participate on your behalf. Participants whose shares are registered in the name of one firm may not be able to transfer the shares to another firm and continue to participate in the Plan. The Fund reserves the right to amend or terminate the Plan at any time. Although the Fund reserves the right to amend the Plan to include a service charge payable by the participants, there is no direct service charge to participants in the Plan at this time.
Call today to start reinvesting distributions
For more information on the Nuveen Automatic Reinvestment Plan or to enroll in or withdraw from the Plan, speak with your financial professional or call us at (800) 257-8787.
112
CHANGES OCCURRING DURING THE FISCAL YEAR
The following information in this annual report is a summary of certain changes during the most recent fiscal year. This information may not reflect all of the changes that have occurred since you purchased shares of a Fund.
During the most recent fiscal year, there have been no changes to: (i) the Funds’ investment objectives and principal investment policies that have not been approved by shareholders, (ii) the principal risks of the Fund, (iii) the portfolio managers of the Funds; (iv) a Fund’s charter or by-laws that would delay or prevent a change of control of the Fund that have not been approved by shareholders except as follows:
Amended and Restated By-Laws
On October 5, 2020, after a rigorous and deliberative review, and consistent with the interests of the Nuveen Arizona Quality Municipal Income Fund, Nuveen Pennsylvania Quality Municipal Income Fund, Nuveen Ohio Quality Municipal Income Fund and the Nuveen New Jersey Quality Municipal Income Fund (each a “Fund” and collectively the “Funds”) long-term shareholders, the Board of Trustees of each Fund adopted Amended and Restated By-Laws.
Among other changes, the Amended and Restated By-Laws require compliance with certain amended deadlines and procedural and informational requirements in connection with advance notice of shareholder proposals or nominations, including certain information about the proponent and the proposal, or in the case of a nomination, the nominee. Any shareholder considering making a nomination or other proposal should carefully review and comply with those provisions of the Amended and Restated By-Laws.
The Amended and Restated By-Laws also include provisions (the “Control Share By-Law”) pursuant to which, in summary, a shareholder who obtains beneficial ownership of common shares of a Fund in a “Control Share Acquisition” may exercise voting rights with respect to such shares only to the extent the authorization of such voting rights is approved by other shareholders of the Fund. The Control Share By-Law is primarily intended to protect the interests of the Fund and its long-term shareholders by limiting the risk that the Fund will become subject to undue influence by opportunistic traders pursuing short-term agendas adverse to the best interests of the Fund and its long-term shareholders. The Control Share By-Law does not eliminate voting rights for common shares acquired in Control Share Acquisitions, but rather entrusts the Fund’s other “non-interested” shareholders with determining whether to approve the authorization of the voting rights of the person acquiring such shares.
Subject to various conditions and exceptions, the Control Share By-Law defines a “Control Share Acquisition” to include an acquisition of common shares that, but for the Control Share By-Law, would give the beneficial owner, upon the acquisition of such shares, the ability to exercise voting power in the election of Trustees of a Fund in any of the following ranges:
| (i) | one-tenth or more, but less than one-fifth of all voting power;
|
| (ii) | one-fifth or more, but less than one-third of all voting power;
|
| (iii) | one-third or more, but less than a majority of all voting power; or
|
| (iv) | a majority or more of all voting power. |
The Control Share By-Law generally excludes certain acquisitions of common shares from the definition of a Control Share Acquisition, including acquisitions of common shares that occurred prior to October 5, 2020, though such shares are included in assessing whether any subsequent share acquisition exceeds one of the enumerated thresholds.
Subject to certain conditions and procedural requirements set forth in the Control Share By-Law, including the delivery of a “Control Share Acquisition Statement” to the Funds’ Secretary setting forth certain required information, a shareholder who obtains or proposes to obtain beneficial ownership of common shares in a Control Share Acquisition generally may demand a special meeting of shareholders for the purpose of considering whether the voting rights of such acquiring person with respect to such shares shall be authorized.
This discussion is only a high-level summary of certain aspects of the Amended and Restated By-Laws, and is qualified in its entirety by reference to the Amended and Restated By-Laws. Shareholders should refer to the Amended and Restated By-Laws for more information. A copy of the Amended and Restated By-Laws can be found in the Current Report on Form 8-K filed by the Funds with the Securities and Exchange Commission on October 6, 2020, which is available at www.sec.gov, and may also be obtained by writing to the Secretary of the Funds at 333 West Wacker Drive, Chicago, Illinois 60606.
113
Additional Fund Information
(Unaudited)
| Board of Trustees | | | | | | |
Jack B. Evans | William C. Hunter | Albin F. Moschner | John K. Nelson | Judith M. Stockdale | Carole E. Stone |
Terence J. Toth | Matthew Thornton III | Margaret L. Wolff | Robert L. Young | | | |
|
| Investment Adviser | Custodian | Legal Counsel | Independent Registered | Transfer Agent and |
Nuveen Fund Advisors, LLC | State Street Bank | Chapman and Cutler LLP | Public Accounting Firm | Shareholder Services |
333 West Wacker Drive | & Trust Company | Chicago, IL 60603 | KPMG LLP | | Computershare Trust |
Chicago, IL 60606 | One Lincoln Street | | 200 East Randolph Street | Company, N.A. |
| Boston, MA 02111 | | Chicago, IL 60601 | 150 Royall Street |
| | | | | Canton, MA 02021 |
| | | | | (800) 257-8787 |
Portfolio of Investments Information
Each Fund is required to file its complete schedule of portfolio holdings with the Securities and Exchange Commission (SEC) for the first and third quarters of each fiscal year as an exhibit to its report on Form N-PORT. You may obtain this information on the SEC’s Website at http://www.sec.gov.
Nuveen Funds’ Proxy Voting Information
You may obtain (i) information regarding how each fund voted proxies relating to portfolio securities held during the most recent twelve-month period ended June 30, without charge, upon request, by calling Nuveen toll-free at (800) 257-8787 or on Nuveen’s website at www.nuveen.com and (ii) a description of the policies and procedures that each fund used to determine how to vote proxies relating to portfolio securities without charge, upon request, by calling Nuveen toll free at (800) 257-8787. You may also obtain this information directly from the SEC. Visit the SEC on-line at http://www.sec.gov.
CEO Certification Disclosure
Each Fund’s Chief Executive Officer (CEO) has submitted to the New York Stock Exchange (NYSE) the annual CEO certification as required by Section 303A.12(a) of the NYSE Listed Company Manual. Each Fund has filed with the SEC the certification of its CEO and Chief Financial Officer required by Section 302 of the Sarbanes-Oxley Act.
Common Share Repurchases
Each Fund intends to repurchase, through its open-market share repurchase program, shares of its own common stock at such times and in such amounts as is deemed advisable. During the period covered by this report, each Fund repurchased shares of its common stock, as shown in the accompanying table. Any future repurchases will be reported to shareholders in the next annual or semi-annual report.
| NAZ | NUO | NXJ | NQP |
Common shares repurchased | 0 | 0 | 25,343 | 0 |
FINRA BrokerCheck
The Financial Industry Regulatory Authority (FINRA) provides information regarding the disciplinary history of FINRA member firms and associated investment professionals. This information as well as an investor brochure describing FINRA BrokerCheck is available to the public by calling the FINRA BrokerCheck Hotline number at (800) 289-9999 or by visiting www.FINRA.org.
114
Glossary of Terms
Used in this Report (Unaudited)
Average Annual Total Return: This is a commonly used method to express an investment’s performance over a particular, usually multi-year time period. It expresses the return that would have been necessary each year to equal the investment’s actual cumulative performance (including change in NAV or market price and reinvested dividends and capital gains distributions, if any) over the time period being considered.
Duration: Duration is a measure of the expected period over which a bond’s principal and interest will be paid, and consequently is a measure of the sensitivity of a bond’s or bond fund’s value to changes when market interest rates change. Generally, the longer a bond’s or fund’s duration, the more the price of the bond or fund will change as interest rates change.
Effective Leverage: Effective leverage is a fund’s effective economic leverage, and includes both regulatory leverage (see leverage) and the leverage effects of certain derivative investments in the fund’s portfolio. Currently, the leverage effects of Tender Option Bond (TOB) inverse floater holdings are included in effective leverage values, in addition to any regulatory leverage.
Escrowed to Maturity Bond: When proceeds of a refunding issue are deposited in an escrow account for investment in an amount sufficient to pay the principal and interest on the issue being refunded. In some cases, though, an issuer may expressly reserve its right to exercise an early call of bonds that have been escrowed to maturity.
Gross Domestic Product (GDP): The total market value of all final goods and services produced in a country/region in a given year, equal to total consumer, investment and government spending, plus the value of exports, minus the value of imports.
Inverse Floating Rate Securities: Inverse floating rate securities, also known as inverse floaters or tender option bonds (TOBs), are created by depositing a municipal bond, typically with a fixed interest rate, into a special purpose trust. This trust, in turn, (a) issues floating rate certificates typically paying short-term tax-exempt interest rates to third parties in amounts equal to some fraction of the deposited bond’s par amount or market value, and (b) issues an inverse floating rate certificate (sometimes referred to as an “inverse floater”) to an investor (such as a Fund) interested in gaining investment exposure to a long-term municipal bond. The income received by the holder of the inverse floater varies inversely with the short-term rate paid to the floating rate certificates’ holders, and in most circumstances the holder of the inverse floater bears substantially all of the underlying bond’s downside investment risk. The holder of the inverse floater typically also benefits disproportionately from any potential appreciation of the underlying bond’s value. Hence, an inverse floater essentially represents an investment in the underlying bond on a leveraged basis.
Leverage: Leverage is created whenever a fund has investment exposure (both reward and/or risk) equivalent to more than 100% of the investment capital.
Net Asset Value (NAV) Per Share: A fund’s Net Assets is equal to its total assets (securities, cash, accrued earnings and receivables) less its total liabilities. NAV per share is equal to the fund’s Net Assets divided by its number of shares outstanding.
Pre-Refunding: Pre-Refunding, also known as advanced refundings or refinancings, is a procedure used by state and local governments to refinance municipal bonds to lower interest expenses. The issuer sells new bonds with a lower yield and uses the proceeds to buy U.S. Treasury securities, the interest from which is used to make payments on the higher-yielding bonds. Because of this collateral, pre-refunding generally raises a bond’s credit rating and thus its value.
Regulatory Leverage: Regulatory leverage consists of preferred shares issued by or borrowings of a fund. Both of these are part of a fund’s capital structure. Regulatory leverage is subject to asset coverage limits set in the Investment Company Act of 1940.
115
Glossary of Terms Used in this Report (Unaudited) (continued)
S&P Municipal Bond Indexes Arizona, New Jersey, Pennsylvania and Ohio: Unleveraged, market value-weighted indexes designed to measure the performance of the tax-exempt, investment-grade municipal bond markets in Arizona, New Jersey, Pennsylvania and Ohio, respectively. Index returns assume reinvestment of distributions, but do not reflect any applicable sales charges or management fees.
S&P Municipal Bond Index: An unleveraged, market value-weighted index designed to measure the performance of the tax-exempt, investment-grade U.S. municipal bond market. Index returns assume reinvestment of distributions, but do not reflect any applicable sales charges or management fees.
Total Investment Exposure: Total investment exposure is a fund’s assets managed by the Adviser that are attributable to financial leverage. For these purposes, financial leverage includes a fund’s use of preferred stock and borrowings and investments in the residual interest certificates (also called inverse floating rate securities) in tender option bond (TOB) trusts, including the portion of assets held by a TOB trust that has been effectively financed by the trust’s issuance of floating rate securities.
Zero Coupon Bond: A zero coupon bond does not pay a regular interest coupon to its holders during the life of the bond. Income to the holder of the bond comes from accretion of the difference between the original purchase price of the bond at issuance and the par value of the bond at maturity and is effectively paid at maturity. The market prices of zero coupon bonds generally are more volatile than the market prices of bonds that pay interest periodically.
116
Board Members &Officers (Unaudited) The management of the Funds, including general supervision of the duties performed for the Funds by the Adviser, is the responsibility of the Board of Trustees of the Funds. None of the trustees who are not “interested” persons of the Funds (referred to herein as “independent board members”) has ever been a director or employee of, or consultant to, Nuveen or its affiliates. The names and business addresses of the trustees and officers of the Funds, their principal occupations and other affiliations during the past five years, the number of portfolios each Trustee oversees and other directorships they hold are set forth below.
| | | | | |
| Name, | Position(s) Held | Year First | Principal | Number |
| Year of Birth | with the Funds | Elected or | Occupation(s) | of Portfolios |
| & Address | | Appointed | Including other | in Fund Complex |
| | and Term(1) | Directorships | Overseen by |
| | | During Past 5 Years | Board Member |
|
Independent Board Members: | | | | |
|
| TERENCE J. TOTH | | | Formerly, a Co-Founding Partner, Promus Capital (investment advisory | |
| 1959 | | | firm) (2008-2017); Director, Quality Control Corporation (manufacturing) | |
| 333 W. Wacker Drive | Chair and | 2008 | (since 2012); member: Catalyst Schools of Chicago Board (since 2008) | 142 |
| Chicago, IL 6o6o6 | Board Member | Class II | and Mather Foundation Board (philanthropy) (since 2012), and chair of | |
| | | its Investment Committee; formerly, Director, Fulcrum IT Services LLC | |
| | | (information technology services firm to government entities) (2010-2019); | |
| | | formerly, Director, Legal & General Investment Management America, Inc. | |
| | | (asset management) (2008-2013); formerly, CEO and President, Northern | |
| | | Trust Global Investments (financial services) (2004-2007): Executive Vice | |
| | | President, Quantitative Management & Securities Lending (2000-2004); | |
| | | prior thereto, various positions with Northern Trust Company (financial | |
| | | services) (since 1994); formerly, Member, Northern Trust Mutual Funds | |
| | | Board (2005-2007), Northern Trust Global Investments Board (2004-2007), | |
| | | Northern Trust Japan Board (2004-2007), Northern Trust Securities Inc. | |
| | | Board (2003-2007) and Northern Trust Hong Kong Board (1997-2004). | |
|
| JACK B. EVANS | | | Chairman (since 2019), formerly, President (1996-2019), The Hall-Perrine | |
| 1948 | | | Foundation, (private philanthropic corporation); Director and Chairman | |
| 333 W. Wacker Drive | Board Member | 1999 | (since 2009), United Fire Group, a publicly held company; formerly, | 142 |
| Chicago, IL 6o6o6 | | Class III | Director, Public Member, American Board of Orthopaedic Surgery | |
| | | (2015-2020); Life Trustee of Coe College and the Iowa College Foundation; | |
| | | formerly, Member and President Pro-Tem of the Board of Regents for the | |
| | | State of Iowa University System (2000- 2004); formerly, Director | |
| | | (2000-2004), Alliant Energy; formerly, Director (1996- 2015), The Gazette | |
| | | Company (media and publishing); formerly, Director (1998- 2003), Federal | |
| | | Reserve Bank of Chicago; formerly, President and Chief Operating Officer | |
| | | (1972-1995), SCI Financial Group, Inc., (regional financial services firm). | |
|
| WILLIAM C. HUNTER | | | Dean Emeritus, formerly, Dean, Tippie College of Business, University of | |
| 1948 | | | Iowa (2006-2012); Director of Wellmark, Inc. (since 2009); past Director | |
| 333 W. Wacker Drive | Board Member | 2003 | (2005-2015), and past President (2010-2014) Beta Gamma Sigma, Inc., | 142 |
| Chicago, IL 6o6o6 | | Class I | The International Business Honor Society; formerly, Director (2004-2018) | |
| | | of Xerox Corporation; Dean and Distinguished Professor of Finance, | |
| | | School of Business at the University of Connecticut (2003-2006); | |
| | | previously, Senior Vice President and Director of Research at the Federal | |
| | | Reserve Bank of Chicago (1995-2003); formerly, Director (1997-2007), | |
| | | Credit Research Center at Georgetown University. | |
117
Board Members & Officers (Unaudited) (continued)
| | | | | |
| Name, | Position(s) Held | Year First | Principal | Number |
| Year of Birth | with the Funds | Elected or | Occupation(s) | of Portfolios |
| & Address | | Appointed | Including other | in Fund Complex |
| | and Term(1) | Directorships | Overseen by |
| | | During Past 5 Years | Board Member |
|
Independent Board Members (continued): | | | |
|
| ALBIN F. MOSCHNER | | | Founder and Chief Executive Officer, Northcroft Partners, LLC, | |
| 1952 | | | (management consulting) (since 2012); formerly, Chairman (2019), | |
| 333 W. Wacker Drive | Board Member | 2016 | and Director (2012-2019), USA Technologies, Inc., (provider of | 142 |
| Chicago, IL 6o6o6 | | Class III | solutions and services to facilitate electronic payment transactions); | |
| | | formerly, Director, Wintrust Financial Corporation (1996-2016); | |
| | | previously, held positions at Leap Wireless International, Inc., (consumer | |
| | | wireless services) including Consultant (2011-2012), Chief Operating | |
| | | Officer (2008-2011), and Chief Marketing Officer (2004-2008); formerly, | |
| | | President, Verizon Card Services division of Verizon Communications, | |
| | | Inc. (2000-2003); formerly, President, One Point Services at One Point | |
| | | Communications (telecommunication services) (1999-2000); formerly, | |
| | | Vice Chairman of the Board, Diba, Incorporated (internet technology | |
| | | provider) (1996-1997); formerly, various executive positions (1991-1996) | |
| | | and Chief Executive Officer (1995-1996) of Zenith Electronics Corporation | |
| | | (consumer electronics). | |
|
| JOHN K. NELSON | | | Member of Board of Directors of Core12 LLC. (private firm which develops | |
| 1962 | | | branding, marketing and communications strategies for clients) (since | |
| 333 W. Wacker Drive | Board Member | 2013 | 2008); served on The President’s Council of Fordham University (2010- | 142 |
| Chicago, IL 6o6o6 | | Class II | 2019) and previously a Director of the Curran Center for Catholic American | |
| | | Studies (2009-2018); formerly, senior external advisor to the Financial | |
| | | Services practice of Deloitte Consulting LLP. (2012-2014); former Chair of | |
| | | the Board of Trustees of Marian University (2010-2014 as trustee, 2011-2014 | |
| | | as Chair); formerly Chief Executive Officer of ABN AMRO Bank N.V., North | |
| | | America, and Global Head of the Financial Markets Division (2007-2008), | |
| | | with various executive leadership roles in ABN AMRO Bank N.V. between | |
| | | 1996 and 2007. | |
|
| JUDITH M. STOCKDALE | | | Board Member, Land Trust Alliance (national public charity addressing | |
| 1947 | | | natural land and water conservation in the U.S.) (since 2013); formerly, | |
| 333 W. Wacker Drive | Board Member | 1997 | Board Member, U.S. Endowment for Forestry and Communities | 142 |
| Chicago, IL 6o6o6 | | Class I | (national endowment addressing forest health, sustainable forest | |
| | | production and markets, and economic health of forest-reliant communities | |
| | | in the U.S.) (2013-2019); formerly, Executive Director (1994-2012), Gaylord | |
| | | and Dorothy Donnelley Foundation (private foundation endowed to support | |
| | | both natural land conservation and artistic vitality); prior thereto, Executive | |
| | | Director, Great Lakes Protection Fund (1990-1994). | |
|
| CAROLE E. STONE | | | Former Director, Chicago Board Options Exchange, Inc. (2006-2017); and | |
| 1947 | | | C2 Options Exchange, Incorporated (2009-2017); formerly, Director, Cboe, | |
| 333 W. Wacker Drive | Board Member | 2007 | Global Markets, Inc. (2010-2020) (formerly named CBOE Holdings, Inc.; | 142 |
| Chicago, IL 6o6o6 | | Class I | formerly, Commissioner, New York State Commission on Public | |
| | | Authority Reform (2005-2010). | |
118
| | | | | |
| Name, | Position(s) Held | Year First | Principal | Number |
| Year of Birth | with the Funds | Elected or | Occupation(s) | of Portfolios |
| & Address | | Appointed | Including other | in Fund Complex |
| | and Term(1) | Directorships | Overseen by |
| | | During Past 5 Years | Board Member |
|
Independent Board Members (continued): | | | |
|
| MATTHEW THORNTON III | | | Formerly, Executive Vice President and Chief Operating Officer (2018-2019), | |
| 1958 | | | FedEx Freight Corporation, a subsidiary of FedEx Corporation (“FedEx”) | |
| 333 W. Wacker Drive | Board Member | 2020 | (provider of transportation, e-commerce and business services through its | 142 |
| Chicago, IL 6o6o6 | | Class III | portfolio of companies); formerly, Senior Vice President, U.S. Operations | |
| | | (2006-2018), Federal Express Corporation, a subsidiary of FedEx; formerly, | |
| | | Member of the Board of Directors (2012-2018), Safe Kids Worldwide® (a | |
| | | non-profit organization dedicated to preventing childhood injuries). | |
| | | Member of the Board of Directors (since 2014), The Sherwin-Williams | |
| | | Company (develops, manufactures, distributes and sells paints, coatings | |
| | | and related products); Director (since 2020), Crown Castle International | |
| | | (provider of communications infrastructure) | |
|
| MARGARET L. WOLFF | | | Formerly, member of the Board of Directors (2013-2017) of Travelers | |
| 1955 | | | Insurance Company of Canada and The Dominion of Canada General | |
| 333 W. Wacker Drive | Board Member | 2016 | Insurance Company (each, a part of Travelers Canada, the Canadian | 142 |
| Chicago, IL 6o6o6 | | Class I | operation of The Travelers Companies, Inc.); formerly, Of Counsel, | |
| | | Skadden, Arps, Slate, Meagher & Flom LLP (legal services, Mergers & | |
| | | Acquisitions Group) (2005-2014); Member of the Board of Trustees of | |
| | | New York-Presbyterian Hospital (since 2005); Member (since 2004) and | |
| | | Chair (since 2015) of the Board of Trustees of The John A. Hartford | |
| | | Foundation (philanthropy dedicated to improving the care of older adults); | |
| | | formerly, Member (2005-2015) and Vice Chair (2011-2015) of the Board of | |
| | | Trustees of Mt. Holyoke College. | |
|
| ROBERT L. YOUNG | | | Formerly, Chief Operating Officer and Director, J.P.Morgan Investment | |
| 1963 | | | Management Inc. (financial services) (2010-2016); formerly, President | |
| 333 W. Wacker Drive | Board Member | 2017 | and Principal Executive Officer (2013-2016), and Senior Vice President | 142 |
| Chicago, IL 6o6o6 | | Class II | and Chief Operating Officer (2005-2010), of J.P.Morgan Funds; formerly, | |
| | | Director and various officer positions for J.P.Morgan Investment | |
| | | Management Inc. (formerly, JPMorgan Funds Management, Inc. and | |
| | | formerly, One Group Administrative Services) and JPMorgan Distribution | |
| | | Services, Inc. (financial services) (formerly, One Group Dealer Services, | |
| | | Inc.) (1999-2017). | |
119
Board Members & Officers (Unaudited) (continued)
| | | | |
| Name, | Position(s) Held | Year First | Principal |
| Year of Birth | with the Funds | Elected or | Occupation(s) |
| & Address | | Appointed(2) | During Past 5 Years |
|
Officers of the Funds: | | | |
|
| DAVID J. LAMB | | | Managing Director of Nuveen Fund Advisors, LLC and Nuveen Securities, LLC (since 2020); |
| 1963 | Chief | | Managing Director (since 2017), formerly, Senior Vice President of Nuveen, LLC (since 2006), |
| 333 W. Wacker Drive | Administrative | 2015 | Vice President prior to 2006 |
| Chicago, IL 6o6o6 | Officer | | |
|
| MARK J. CZARNIECKI | | | Vice President and Assistant Secretary of Nuveen Securities, LLC (since 2016) and Nuveen Fund |
| 1979 | Vice President | | Advisors (since 2017); Vice President and Associate General Counsel of Nuveen, LLC (since 2013) |
| 901 Marquette Avenue | and Assistant | 2013 | and Vice President, Assistant Secretary and Associate General Counsel of Nuveen Asset |
| Minneapolis, MN 55402 | Secretary | | Management (since 2018). |
|
| DIANA R. GONZALEZ | | | Vice President and Assistant Secretary of Nuveen Fund Advisors, LLC (since 2017); Vice President |
| 1978 | Vice President | | and Associate General Counsel of Nuveen, LLC (since 2017); Associate General Counsel of Jackson |
| 333 W. Wacker Drive | and Assistant | 2017 | National Asset Management, LLC (2012-2017). |
| Chicago, IL 6o6o6 | Secretary | | |
|
| NATHANIEL T. JONES | | | Managing Director (since 2017), formerly, Senior Vice President (2016-2017), formerly, |
| 1979 | | | Vice President (2011-2016) of Nuveen, LLC; Managing Director (since 2015) of Nuveen Fund |
| 333 W. Wacker Drive | Vice President | 2016 | Advisors, LLC; Chartered Financial Analyst. |
| Chicago, IL 6o6o6 | and Treasurer | | |
|
| TINA M. LAZAR | | | Managing Director (since 2017), formerly, Senior Vice President (2014-2017) of |
| 1961 | | | Nuveen Securities, LLC. |
| 333 W. Wacker Drive | Vice President | 2002 | |
| Chicago, IL 6o6o6 | | | |
|
| BRIAN J. LOCKHART | | | Managing Director (since 2019) of Nuveen Fund Advisors, LLC; Managing Director (since 2017), |
| 1974 | | | formerly, Vice President (2010-2017) of Nuveen, LLC; Head of Investment Oversight (since 2017), |
| 333 W. Wacker Drive | Vice President | 2019 | formerly, Team Leader of Manager Oversight (2015-2017); Chartered Financial Analyst and Certified |
| Chicago, IL 6o6o6 | | | Financial Risk Manager. |
|
| JACQUES M. LONGERSTAEY | | | Senior Managing Director, Chief Risk Officer, Nuveen, LLC (since May 2019); Senior Managing |
| 1963 | | | Director (since May 2019) of Nuveen Fund Advisors, LLC; formerly, Chief Investment and Model |
| 8500 Andrew Carnegie Blvd. | Vice President | 2019 | Risk Officer, Wealth & Investment Management Division, Wells Fargo Bank (NA) (2013-2019). |
| Charlotte, NC 28262 | | | |
|
| KEVIN J. MCCARTHY | | | Senior Managing Director (since 2017) and Secretary and General Counsel (since 2016) of Nuveen |
| 1966 | Vice President | | Investments, Inc., formerly, Executive Vice President (2016-2017) and Managing Director and |
| 333 W. Wacker Drive | and Assistant | 2007 | Assistant Secretary (2008-2016); Senior Managing Director (since 2017) and Assistant Secretary |
| Chicago, IL 6o6o6 | Secretary | | (since 2008) of Nuveen Securities, LLC, formerly Executive Vice President (2016-2017) and |
| | | Managing Director (2008-2016); Senior Managing Director (since 2017), and Secretary (since 2016) |
| | | of Nuveen Fund Advisors, LLC, formerly, Co-General Counsel (2011-2020), Executive Vice President |
| | | (2016-2017), Managing Director (2008-2016) and Assistant Secretary (2007-2016); Senior |
| | | Managing Director (since 2017), Secretary (since 2016) of Nuveen Asset Management, LLC, |
| | | formerly, Associate General Counsel (2011-2020), Executive Vice President (2016-2017) and |
| | | Managing Director and Assistant Secretary (2011- 2016); Vice President (since 2007) and Secretary |
| | | (since 2016), formerly, Assistant Secretary, of NWQ Investment Management Company, LLC, Santa |
| | | Barbara Asset Management, LLC and Winslow Capital Management, LLC (since 2010). Senior |
| | | Managing Director (since 2017) and Secretary (since 2016) of Nuveen Alternative Investments, LLC. |
120
| | | | |
| Name, | Position(s) Held | Year First | Principal |
| Year of Birth | with the Funds | Elected or | Occupation(s) |
| & Address | | Appointed(2) | During Past 5 Years |
|
Officers of the Funds (continued) | | |
|
| JON SCOTT MEISSNER | | | Managing Director of Mutual Fund Tax and Financial Reporting groups at Nuveen (since 2017); |
| 1973 | Vice President | | Managing Director of Nuveen Fund Advisors, LLC (since 2019); Senior Director of Teachers |
| 8500 Andrew Carnegie Blvd. | and Assistant | 2019 | Advisors, LLC and TIAA-CREF Investment Management, LLC (since 2016); Senior Director |
| Charlotte, NC 28262 | Secretary | | (since 2015) Mutual Fund Taxation to the TIAA-CREF Funds, the TIAA-CREF Life Funds, the TIAA |
| | | Separate Account VA-1 and the CREF Accounts; has held various positions with TIAA since 2004. |
|
| DEANN D. MORGAN | | | President, Nuveen Fund Advisors, LLC (since 2020); Executive Vice President, Global Head of |
| 1969 | | | Product at Nuveen, LLC (since 2019); Co-Chief Executive Officer of Nuveen Securities, LLC |
| 730 Third Avenue | Vice President | 2020 | since 2020); Managing Member of MDR Collaboratory LLC (since 2018); Managing Director, |
| New York, NY 10017 | | | (Head of Wealth Management Product Structuring & COO Multi Asset Investing. The Blackstone |
| | | Group (2013-2017) |
|
| CHRISTOPHER M. ROHRBACHER | | | Managing Director (since 2017) and Assistant Secretary of Nuveen Securities, LLC; Managing |
| 1971 | Vice President | | Director (since 2017) General Counsel (since 2020), and Assistant Secretary (since 2016), |
| 333 W. Wacker Drive | and Assistant | 2008 | formerly, Senior Vice President (2016-2017), of Nuveen Fund Advisors, LLC; Managing |
| Chicago, IL 6o6o6 | Secretary | | Director, Associate General Counsel and Assistant Secretary of Nuveen Asset Management, |
| | | LLC (since 2020); Managing Director (since 2017), and Associate General Counsel (since 2016), |
| | | formerly, Senior Vice President (2012-2017) and Assistant General Counsel (2008-2016) of |
| | | Nuveen, LLC. |
|
| WILLIAM A. SIFFERMANN | | | Managing Director (since 2017), formerly Senior Vice President (2016-2017) and Vice President |
| 1975 | | | (2011-2016) of Nuveen, LLC. |
| 333 W. Wacker Drive | Vice President | 2017 | |
| Chicago, IL 6o6o6 | | | |
|
| E. SCOTT WICKERHAM | | | Senior Managing Director, Head of Fund Administration at Nuveen, LLC (since 2019), |
| 1973 | Vice President | | formerly, Managing Director; Senior Managing Director (since 2019) of Nuveen Fund Advisers, |
| 8500 Andrew Carnegie Blvd. | and Controller | 2019 | (LLC; Principal Financial Officer, Principal Accounting Officer and Treasurer (since 2017) of the |
| Charlotte, NC 28262 | | | TIAA-CREF Funds, the TIAA-CREF Life Funds, the TIAA Separate Account VA-1 and Principal |
| | | Financial Officer, Principal Accounting Officer (since 2020) and Treasurer (since 2017) to the CREF |
| | | Accounts; formerly, Senior Director, TIAA-CREF Fund Administration (2014-2015); has held various |
| | | positions with TIAA since 2006. |
|
| MARK L. WINGET | | | Vice President and Assistant Secretary of Nuveen Securities, LLC (since 2008), and Nuveen |
| 1968 | Vice President | | Fund Advisors, LLC (since 2019); Vice President, Associate General Counsel and Assistant |
| 333 W. Wacker Drive | and Secretary | 2008 | Secretary of Nuveen Asset Management, LLC (since 2020); Vice President (since 2010) and |
| Chicago, IL 60606 | | | Associate General Counsel (since 2019), formerly, Assistant General Counsel (2008-2016) of |
| | | Nuveen, LLC. |
121
Board Members & Officers (Unaudited) (continued)
| | | | |
| Name, | Position(s) Held | Year First | Principal |
| Year of Birth | with the Funds | Elected or | Occupation(s) |
| & Address | | Appointed(2) | During Past 5 Years |
|
Officers of the Funds (continued) | | |
|
| GIFFORD R. ZIMMERMAN | | | Formerly: Managing Director (2002-2020) and Assistant Secretary (2002-2020) of Nuveen |
| 1956 | Vice President | | Securities, LLC; formerly, Managing Director (2002-2020), Assistant Secretary (1997-2020) and |
| 333 W. Wacker Drive | and Chief | 1988 | Co-General Counsel (2011- 2020) of Nuveen Fund Advisors, LLC; formerly, Managing Director |
| Chicago, IL 60606 | Compliance Officer | | (2004-2020) and Assistant Secretary (1994-2020) of Nuveen Investments, Inc.; formerly, |
| | | Managing Director, Assistant Secretary and Associate General Counsel of Nuveen Asset |
| | | Management, LLC (2011-2020); formerly, Vice President and Assistant Secretary of NWQ |
| | | Investment Management Company, LLC (2002-2020), Santa Barbara Asset Management, LLC |
| | | (2006-2020) and Winslow Capital Management, LLC (2010-2020); Chartered Financial Analyst. |
(1) | The Board of Trustees is divided into three classes, Class I, Class II, and Class III, with each being elected to serve until the third succeeding annual shareholders’ meeting subsequent to its election or thereafter in each case when its respective successors are duly elected or appointed, except two board members are elected by the holders of Preferred Shares, when applicable, to serve until the next annual shareholders’ meeting subsequent to its election or thereafter in each case when its respective successors are duly elected or appointed. The year first elected or appointed represents the year in which the board member was first elected or appointed to any fund in the Nuveen complex.
|
(2) | Officers serve indefinite terms until their successor has been duly elected and qualified, their death or their resignation or removal. The year first elected or appointed represents the year in which the Officer was first elected or appointed to any fund in the Nuveen complex. |
122
Notes
123
Nuveen:
Serving Investors for Generations
Since 1898, financial professionals and their clients have relied on Nuveen to provide dependable investment solutions through continued adherence to proven, long-term investing principles. Today, we offer a range of high quality solutions designed to be integral components of a well-diversified core portfolio.
Focused on meeting investor needs.
Nuveen is the investment manager of TIAA. We have grown into one of the world’s premier global asset managers, with specialist knowledge across all major asset classes and particular strength in solutions that provide income for investors and that draw on our expertise in alternatives and responsible investing. Nuveen is driven not only by the independent investment processes across the firm, but also the insights, risk management, analytics and other tools and resources that a truly world-class platform provides. As a global asset manager, our mission is to work in partnership with our clients to create solutions which help them secure their financial future.
Find out how we can help you.
To learn more about how the products and services of Nuveen may be able to help you meet your financial goals, talk to your financial professional, or call us at (800) 257-8787. Please read the information provided carefully before you invest. Investors should consider the investment objective and policies, risk considerations, charges and expenses of any investment carefully. Where applicable, be sure to obtain a prospectus, which contains this and other relevant information. To obtain a prospectus, please contact your securities representative or Nuveen, 333 W. Wacker Dr., Chicago, IL 60606. Please read the prospectus carefully before you invest or send money.
Learn more about Nuveen Funds at: www.nuveen.com/closed-end funds
Nuveen Securities, LLC, member FINRA and SIPC | 333 West Wacker Drive Chicago, IL 60606 | www.nuveen.com
EAN-B-0221D 1596443-INV-Y-04/22
ITEM 2. CODE OF ETHICS.
ITEM 3. AUDIT COMMITTEE FINANCIAL EXPERT.
ITEM 4. PRINCIPAL ACCOUNTANT FEES AND SERVICES.
SERVICES THAT THE FUND’S AUDITOR BILLED TO THE ADVISER AND AFFILIATED FUND SERVICE PROVIDERS
Audit Committee Pre-Approval Policies and Procedures. Generally, the Audit Committee must approve (i) all non-audit services to be performed for the Fund by the Fund’s independent accountants and (ii) all audit and non-audit services to be performed by the Fund’s independent accountants for the Affiliated Fund Service Providers with respect to operations and financial reporting of the Fund. Regarding tax and research projects conducted by the independent accountants for the Fund and Affiliated Fund Service Providers (with respect to operations and financial reports of the Fund) such engagements will be (i) pre-approved by the Audit Committee if they are expected to be for amounts greater than $10,000; (ii) reported to the Audit Committee chair for her verbal approval prior to engagement if they are expected to be for amounts under $10,000 but greater than $5,000; and (iii) reported to the Audit Committee at the next Audit Committee meeting if they are expected to be for an amount under $5,000.
ITEM 5. AUDIT COMMITTEE OF LISTED REGISTRANTS.
The registrant’s Board has a separately designated Audit Committee established in accordance with Section 3(a)(58)(A) of the Securities Exchange Act of 1934, as amended (15 U.S.C. 78c(a)(58)(A)). As of the end of the period covered by this report the members of the audit committee are Jack B. Evans, William C. Hunter, John K. Nelson, Judith M. Stockdale and Carole E. Stone, Chair.
ITEM 6. SCHEDULE OF INVESTMENTS.
a) See Portfolio of Investments in Item 1.
b) Not applicable.
ITEM 9. PURCHASES OF EQUITY SECURITIES BY CLOSED-END MANAGEMENT INVESTMENT COMPANY AND AFFILIATED PURCHASERS.
Not applicable.
ITEM 10. SUBMISSION OF MATTERS TO A VOTE OF SECURITY HOLDERS.
There have been no material changes to the procedures by which shareholders may recommend nominees to the registrant’s Board implemented after the registrant last provided disclosure in response to this Item.
ITEM 11. CONTROLS AND PROCEDURES.
ITEM 12. DISCLOSURE OF SECURITIES LENDING ACTIVITIES FOR CLOSED-END MANAGEMENT INVESTMENT COMPANIES.
Not applicable.
ITEM 13. EXHIBITS.
File the exhibits listed below as part of this Form.
Pursuant to the requirements of the Securities Exchange Act of 1934 and the Investment Company Act of 1940, the registrant has duly caused this report to be signed on its behalf by the undersigned, thereunto duly authorized.
Pursuant to the requirements of the Securities Exchange Act of 1934 and the Investment Company Act of 1940, this report has been signed below by the following persons on behalf of the registrant and in the capacities and on the dates indicated.
E. Scott Wickerham