I am pleased to present the Annual Report to Shareholders for the ISI Funds. This report covers the 12-month reporting period ended October 31, 2009 and includes commentary from the Funds’ portfolio managers at International Strategy & Investment, Inc. (“ISI”) (see Management Discussion of Fund Performance that follows this letter for more details), a complete list of holdings and the financial statements.
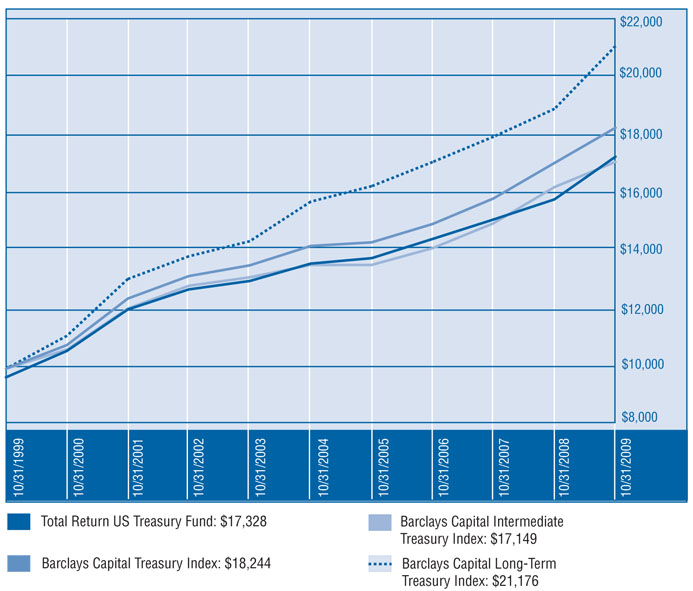
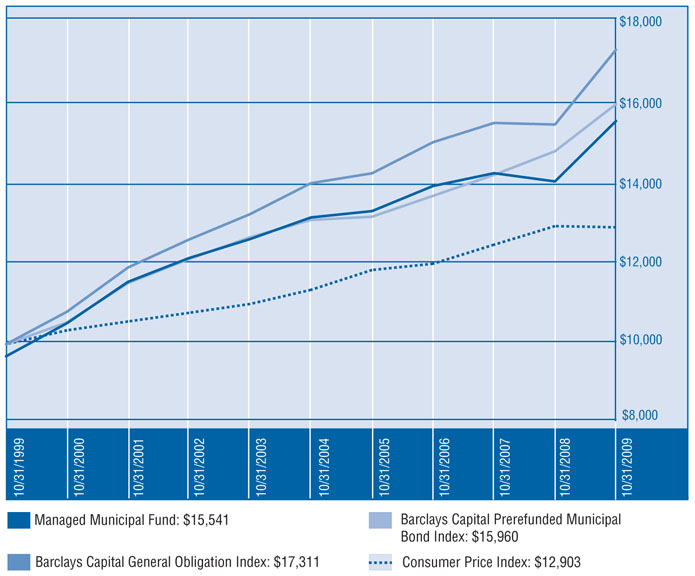
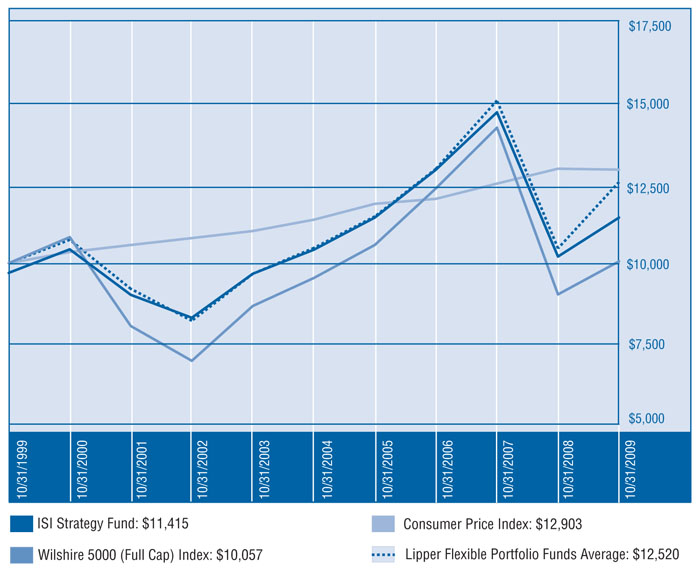
Stocks recorded a positive return for the last fiscal year and a small positive return for the last five years. For example, the Dow Jones Wilshire 5000 Index was +11.36% for the last fiscal year and averaged +1.06% for the past five years. US Treasury securities recorded positive returns over the last fiscal year and were up over the last five years. For example, the Barclays Capital Treasury Index was +6.33% for the past fiscal year and averaged +5.03% for the past five years. Top quality municipal indices were also up for the last fiscal year and for the last five years. For example, the Barclays Capital General Obligation Bond Index was +12.02% for the past fiscal year and averaged +4.34% for the past five years. The following is a summary of Fund performance during the reporting period. These performance figures assume the reinvestment of dividend and capital gain distributions and exclude the impact of any sales charges.
During the year ended October 31, 2009, Total Return US Treasury Fund and North American Government Bond Fund continued their policy of paying dividends at a fixed rate, which resulted in dividends consisting of net investment income, short-term capital gains, and long-term capital gains.
Total Return US Treasury Fund’s investment objective is to achieve a high level of total return with relative stability of principal, and secondarily, high current income consistent with an investment in securities issued by the United States Treasury. For the reporting period, the Fund produced a one-year total return of +9.05% and a five-year average annual total return of +4.88%. From its inception on August 10, 1988 through October 31, 2009, the Fund has posted a cumulative total return of +319.02%, which translates into an average annual total return of +6.98%. The Fund’s net assets totaled $112.30 million at the end of the reporting period.
Managed Municipal Fund’s investment objective is to provide a high level of total return with relative stability of principal and, secondarily, high current income exempt from federal income tax through investment in a portfolio consisting primarily of tax-free municipal obligations. For the reporting period, the Fund produced a one-year total return of +10.68% and a five-year average annual total return of +3.40%. From its inception on February 26, 1990 through October 31, 2009, the Fund has posted a cumulative total return of +181.13%, which translates into an average annual total return of +5.39%. The Fund’s net assets totaled $100.92 million at the end of the reporting period.
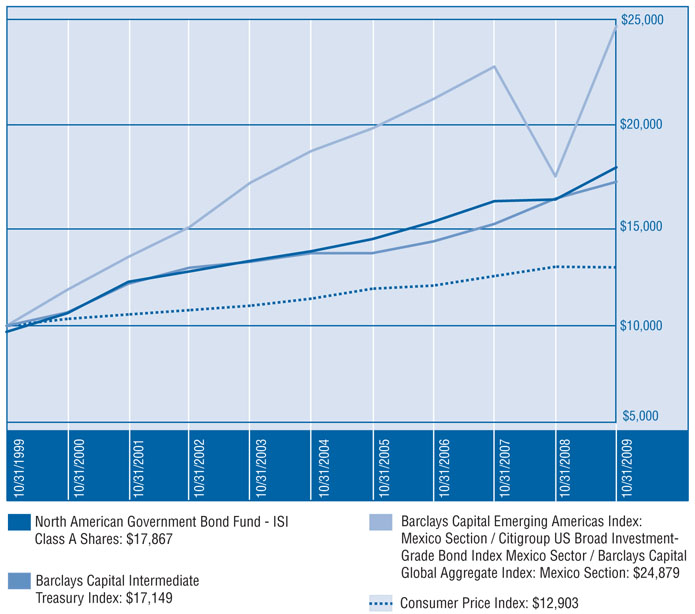
North American Government Bond Fund’s investment objective is to provide a high level of current income, consistent with prudent investment risk, by investing primarily in a portfolio consisting of fixed income securities issued or guaranteed by the governments of the United States, Canada and Mexico. For the reporting period, the ISI Class A Shares produced a one-year total return of +9.80% and a five year average annual total return of +5.45%. From its
inception on January 15, 1993, through October 31, 2009, the ISI Class A Shares have posted a cumulative total return of +161.84%, which translates into an average annual total return of +5.90%. For the reporting period, the ISI Class C Shares produced a one-year total return of +8.97% and a five year average annual total return of +4.75%. From its inception on May 16, 2003, through October 31, 2009, the ISI Class C Shares have posted a cumulative total return of +26.39%, which translates into an average annual total return of +3.69%. The Fund’s net assets totaled $157.47 million at the end of the reporting period.
ISI Strategy Fund has an investment objective of maximizing total return through a combination of long-term growth of capital and current income by actively allocating the Fund’s assets between common stocks of US issuers and US Treasury securities. For the reporting period, the Fund produced a one-year total return of +11.84% and a five-year average annual total return of +1.84%. From its inception on September 16, 1997 through October 31, 2009, the Fund has posted a cumulative total return of +48.99%, which translates into an average annual total return of +3.34%. The Fund’s net assets totaled $53.73 million at the end of the reporting period.
We would like to welcome new investors to the ISI Funds and thank those who have been with us for some time. We appreciate your confidence.
R. Alan Medaugh
The performance numbers stated above do not include a deduction for the maximum sales charge (3.00%) or maximum deferred sales charge, as applicable to each Fund. If the maximum sales charge or maximum deferred sales charge (as applicable) was deducted for each Fund the stated performance numbers would be lower. Performance data quoted represents past performance and is no guarantee of future results. Current performance may be lower or higher than the performance data quoted. Investment return and principal value will fluctuate so that an investor’s shares, when redeemed, may be worth more or less than original cost. For the most recent month-end performance of a Fund, please call (800) 882-8585. The total annualized operating expense ratios of the Funds as of October 31, 2009 were as follows: Total Return US Treasury Fund, Inc. – 0.80%; Managed Municipal Fund, Inc.- 0.97%; North American Government Bond Fund, Inc. – Class A – 1.13%; North American Government Bond Fund, Inc. – Class C – 1.76% and ISI Strategy Fund, Inc. – 1.10%. The operating expense ratios may vary over time.
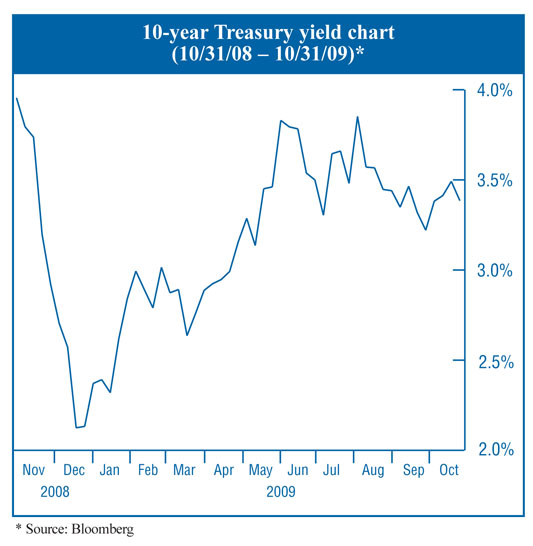
This fiscal year, the US Treasury market based its movement on the unfolding global financial crisis which was set in motion by a series of company bankruptcies and home mortgage defaults. The volatility in the financial markets was heightened by the Presidential election and the subsequent change in Administration. The safe haven value of Treasuries was magnified in the early part of the fiscal year. As the global coordinated response to the crisis began to calm the financial markets, other markets rallied and Treasuries rose in yield. The Fund’s managed duration approach meant the portfolio’s maturity was reduced as the crisis eased. As a result, the duration was reduced from 7.5 years to 4.7 years. By comparison, the Treasury market at the close of the year was 5.2 years.
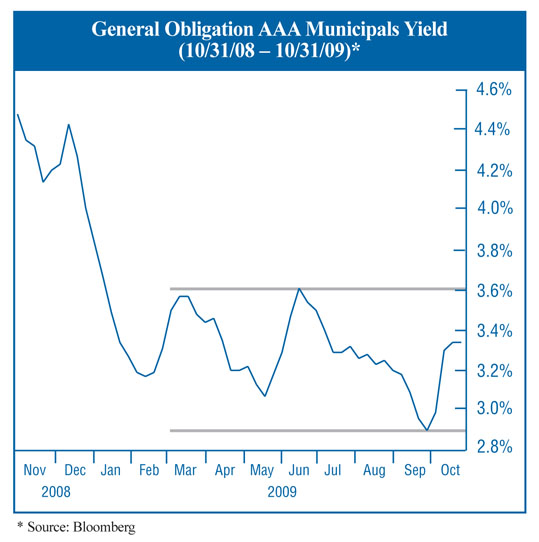
The financial crisis also affected the municipal market. Yields were at their highest levels as the financial crisis moved through the first part of the fiscal year. Since February, rates have been in a trading range based on factors such as new issue supply. Please see chart below.
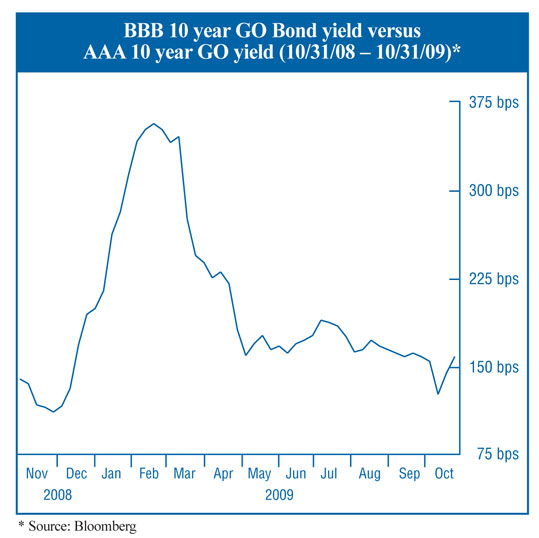
Further, the financial crisis has affected the credit quality spreads. The yield spread between medium quality BBB general obligation bonds versus AAA general obligation bonds was at its widest when the financial crisis peaked (357 bps on 2/18/09), as investors were seeking the safe haven of AAA municipals. Since then, the spread has narrowed, but is still higher than where it was prior to the start of the crisis. Please see chart on next page.
The Fund’s average duration fell as market yields came down even though the Fund’s purchase program focused on longer maturities. The cause was the 10-year call feature in most long maturity municipals. This comes into effect when new issue rates fall below the bond’s coupon rate. As a result, the duration fell from 6.7 years to 5.1 years during the fiscal year.
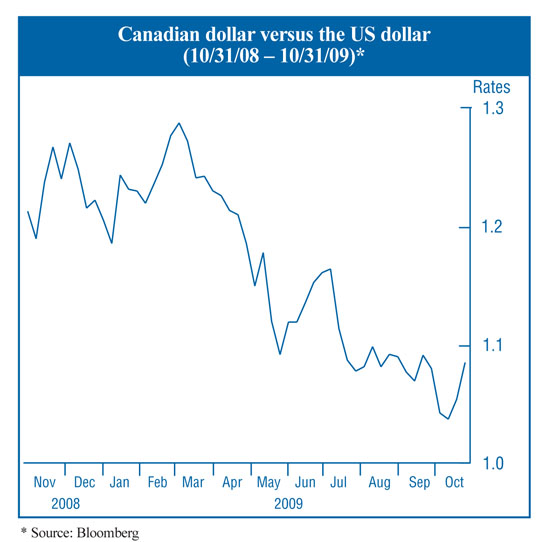
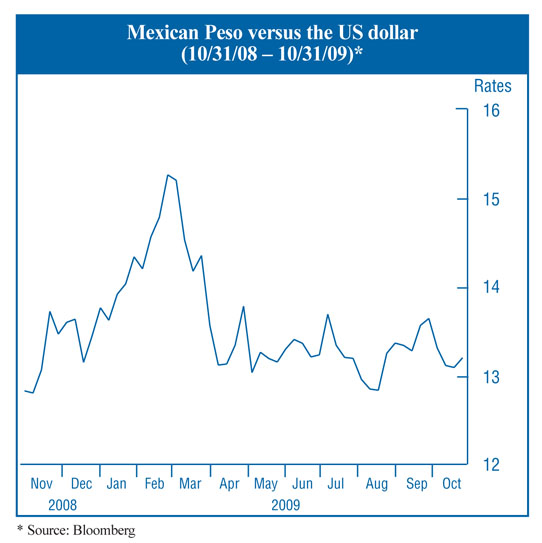
The Fund’s US Treasury section followed a duration management strategy similar to that of the Total Return US Treasury Fund. The Fund’s duration was reduced as the year proceeded. Both the Canadian dollar and the Mexican peso came under pressure early in the fiscal year. The financial crisis, while it helped the Treasury section of the Fund, hurt the Canadian and Mexican currencies. Both currencies bottomed against the dollar in February/March 2009, i.e. a U.S. dollar purchased over 1.25 Canadian dollars and over 15.0 Mexican pesos. The Canadian dollar rallied significantly so that by the end of the fiscal year it was much better versus the U.S. dollar than at the beginning of the fiscal year. The peso improved from its lowest levels in the post-crisis environment, but was still somewhat below where it began the fiscal year. Please see charts below, noting that each graph depicts the number of currency units one U.S. dollar purchases. In the case of the Canadian dollar, the fiscal year began with the U.S. dollar buying 1.22 Canadian dollars and ended the fiscal year buying only 1.08 Canadian dollars. The Canadian dollar rallied versus the U.S. dollar. The Fund actively manages the proportion of the funds held in Canadian and Mexican currency-denominated government bonds. This fiscal year the proportion in Canadian dollars generally exceeded that in Mexican pesos. For example, at the beginning of the fiscal year, the Fund held 13.5% in Canada and 6.8% in Mexico. At the end of the fiscal year, the proportion was 18.5% in Canada and 7.3% in Mexico.
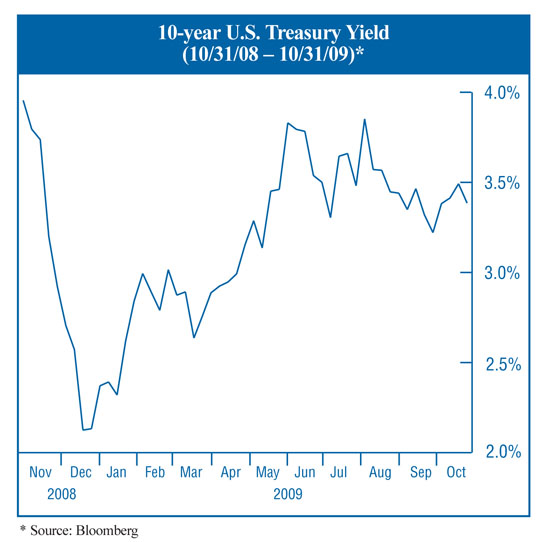
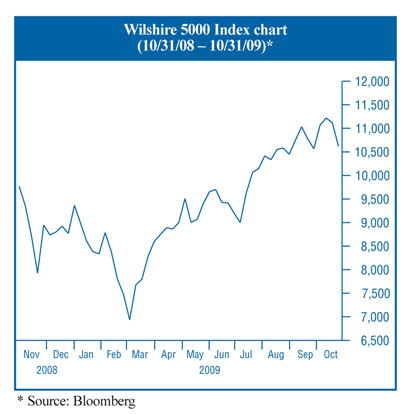
This fiscal year, the Treasury bond section and the equity section performance was roughly the same at +10.40%. The pattern of the performance for the sectors, however, was opposite during the fiscal year. Treasuries rallied shortly as the crisis took on momentum early in the fiscal year. From the turn of the calendar year, Treasuries have moved up in yield, down in price. The equity market by contrast took a hard hit from the crisis early in the fiscal year, bottoming in early March. As the crisis eased, the market put on a major rally. Please see the 10-year Treasury yield chart and the price chart on the Wilshire 5000 Index below.
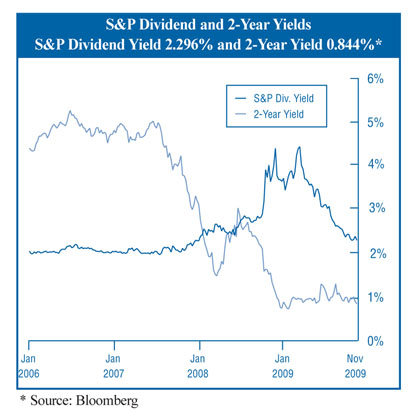
At the beginning of the fiscal year, the Fund held roughly 80% in equities and 20% in bonds. As the crisis unfolded, our asset allocation kept the equity proportion from falling much below 78% (even though the stock market fell much more than that), expecting that stocks had the longer term capacity to rally. From the lows, the asset allocation has increased equities to the higher 80’s. At the end of the fiscal year, the proportion in stocks was roughly 87% while bonds were down to 13%. The present yield advantage lies with stocks over Treasuries. As reference, please see the S&P dividend yield versus the yield on a 2-year Treasury on the chart below.
As a shareholder of the Funds, you may incur two types of cost; (1) transaction costs, including sales charges (loads); and (2) ongoing costs, including management fees, Rule 12b-1 distribution/shareholder service fees and other Fund expenses. This example is intended to help you understand your ongoing costs (in dollars) of investing in each Fund and to compare these costs with the ongoing costs of investing in other mutual funds.
A mutual fund’s ongoing costs are expressed as a percentage of its average net assets. This figure is known as the expense ratio. The expenses in the tables below are based on an investment of $1,000 made at the beginning of the period shown (May 1, 2009) and held for the entire period (October 31, 2009).
Expenses shown in the tables are meant to highlight your ongoing costs only and do not reflect any transactional costs, such as sales charges (loads). Therefore, “Hypothetical Returns” in the table are useful in comparing ongoing costs only, and will not help you determine the relative total costs of owning different funds. If these transactional costs were included, your costs would have been higher.
See Notes to Financial Statements.
See Notes to Financial Statements.
See Notes to Financial Statements.
See Notes to Financial Statements.
See Notes to Financial Statements.
See Notes to Financial Statements.
See Notes to Financial Statements.
See Notes to Financial Statements.
See Notes to Financial Statements.
See Notes to Financial Statements.
See Notes to Financial Statements.
See Notes to Financial Statements.
| Statements of Assets and Liabilities | October 31, 2009 |
| | | Total Return US Treasury Fund | | | Managed Municipal Fund | |
| ASSETS | | | | | | |
| Investments in securities: | | | | | | |
| At cost | | $ | 111,078,944 | | | $ | 96,583,333 | |
| At value (Note 1) | | $ | 111,293,330 | | | $ | 100,055,289 | |
| Cash | | | 699 | | | | 733 | |
| Interest receivable | | | 1,186,604 | | | | 1,010,403 | |
| Receivable for capital shares sold | | | 1,974 | | | | 67,376 | |
| Other assets | | | 20,630 | | | | 27,115 | |
| TOTAL ASSETS | | | 112,503,237 | | | | 101,160,916 | |
| | | | | | | | | |
| LIABILITIES | | | | | | | | |
| Distributions payable | | | 95,903 | | | | 108,983 | |
| Payable for capital shares redeemed | | | 15,901 | | | | 28,480 | |
| Accrued investment advisory fees (Note 2) | | | 23,733 | | | | 34,390 | |
| Accrued distribution expenses (Note 2) | | | 23,962 | | | | 21,493 | |
| Accrued administration fees (Note 2) | | | 11,200 | | | | 10,000 | |
| Accrued transfer agent fees (Note 2) | | | 2,700 | | | | 1,300 | |
| Other accrued expenses | | | 34,343 | | | | 33,258 | |
| TOTAL LIABILITIES | | | 207,742 | | | | 237,904 | |
| | | | | | | | | |
| NET ASSETS | | $ | 112,295,495 | | | $ | 100,923,012 | |
| | | | | | | | | |
| NET ASSETS CONSIST OF: | | | | | | | | |
| Paid-in capital | | $ | 107,444,347 | | | $ | 97,105,256 | |
| Undistributed net investment income | | | — | | | | 887 | |
| Accumulated net realized gains from security transactions | | | 4,636,762 | | | | 344,913 | |
| Net unrealized appreciation on investments | | | 214,386 | | | | 3,471,956 | |
| Net assets | | $ | 112,295,495 | | | $ | 100,923,012 | |
| | | | | | | | | |
| Shares of capital stock outstanding of $0.001 par value ISI Shares (115,000,000 and 55,000,000 shares authorized, respectively) | | | 11,109,076 | | | | 9,450,112 | |
| | | | | | | | | |
| Net asset value and redemption price per share | | $ | 10.11 | | | $ | 10.68 | |
| | | | | | | | | |
| Maximum offering price value per share (100/97) x Net asset value per share | | $ | 10.42 | | | $ | 11.01 | |
See Notes to Financial Statements.
| Statements of Assets and Liabilities | October 31, 2009 |
| | | North American Government Bond Fund | | | ISI Strategy Fund | |
| ASSETS | | | | | | |
| Investments in securities: | | | | | | |
| At cost | | $ | 157,713,541 | | | $ | 52,948,899 | |
| At value (Note 1) | | $ | 155,531,090 | | | $ | 53,680,990 | |
Cash denominated in foreign currency (Note 1) (a) | | | 20,177 | | | | — | |
| Dividends and interest receivable, at value | | | 2,434,812 | | | | 113,555 | |
| Receivable for investment securities sold | | | — | | | | 13,622 | |
| Receivable for capital shares sold | | | 409,808 | | | | 9,683 | |
| Other assets | | | 26,575 | | | | 18,474 | |
| TOTAL ASSETS | | | 158,422,462 | | | | 53,836,324 | |
| | | | | | | | | |
| LIABILITIES | | | | | | | | |
| Bank overdraft | | | 94,088 | | | | 19,216 | |
| Distributions payable | | | 231,246 | | | | — | |
| Payable for capital shares redeemed | | | 440,976 | | | | 17,020 | |
| Accrued investment advisory fees (Note 2) | | | 53,943 | | | | 18,988 | |
| Accrued distribution fees (Note 2) | | | 61,369 | | | | 11,867 | |
| Accrued shareholder servicing fees (Note 2) | | | 5,304 | | | | — | |
| Accrued administration fees (Note 2) | | | 15,700 | | | | 5,500 | |
| Accrued transfer agent fees (Note 2) | | | 5,800 | | | | 1,900 | |
| Other accrued expenses and liabilities | | | 40,678 | | | | 31,052 | |
| TOTAL LIABILITIES | | | 949,104 | | | | 105,543 | |
| | | | | | | | | |
| NET ASSETS | | $ | 157,473,358 | | | $ | 53,730,781 | |
| | | | | | | | | |
| NET ASSETS CONSIST OF: | | | | | | | | |
| Paid-in capital | | $ | 157,809,766 | | | $ | 58,169,089 | |
| Undistributed net investment income | | | — | | | | 10,950 | |
| Accumulated net realized gains (losses) from security and foreign currency transactions | | | 1,838,430 | | | | (5,181,349 | ) |
| Net unrealized appreciation (depreciation) on investments and foreign currencies | | | (2,174,838 | ) | | | 732,091 | |
| Net assets | | $ | 157,473,358 | | | $ | 53,730,781 | |
| (a) | For North American Government Bond Fund, the cost of cash denominated in foreign currency is $20,549. |
See Notes to Financial Statements.
| Statements of Assets and Liabilities (continued) | | October 31, 2009 | |
| | | | |
| | | North American Government Bond Fund | | | ISI Strategy Fund | |
| |
| |
| SHARES OF CAPITAL STOCK OUTSTANDING OF $0.001 PAR VALUE | | | | | | |
| ISI Class A Shares (50,000,000 shares authorized) | | | 17,579,342 | | | | — | |
| ISI Class C Shares (5,000,000 shares authorized) | | | 3,268,968 | | | | — | |
| ISI Shares (25,000,000 shares authorized) | | | — | | | | 5,050,502 | |
| | | | | | | | | |
| NET ASSET VALUE AND REDEMPTION PRICE PER SHARE | | | | | | | | |
| ISI Class A Shares (based on net assets of $132,814,254) | | $ | 7.56 | | | $ | — | |
| ISI Class C Shares (based on net assets of $24,659,104)* | | $ | 7.54 | | | $ | — | |
| ISI Shares | | $ | — | | | $ | 10.64 | |
| | | | | | | | | |
| MAXIMUM OFFERING PRICE VALUE PER SHARE (100/97) X NET ASSET VALUE PER SHARE | | | | | | | | |
| ISI Class A Shares | | $ | 7.79 | | | $ | — | |
| ISI Shares | | $ | — | | | $ | 10.97 | |
| | * | Contingent deferred sales charge of 1.00% is imposed on the sale of shares if redeemed within the first year of purchase. |
See Notes to Financial Statements.
| Statements of Operations | Year Ended October 31, 2009 |
| | | Total Return US Treasury Fund | | | Managed Municipal Fund | |
| INVESTMENT INCOME | | | | | | |
| Interest | | $ | 3,018,698 | | | $ | 3,538,459 | |
| | | | | | | | | |
| EXPENSES | | | | | | | | |
| Investment advisory fees (Note 2) | | | 285,670 | | | | 354,158 | |
| Distribution fees (Note 2) | | | 304,439 | | | | 221,348 | |
| Administration fees (Note 2) | | | 143,225 | | | | 104,363 | |
| Professional fees | | | 62,195 | | | | 51,338 | |
| Registration fees | | | 29,373 | | | | 35,831 | |
| Transfer agent fees (Note 2) | | | 33,878 | | | | 13,667 | |
| Compliance fees and expenses (Note 2) | | | 23,746 | | | | 16,590 | |
| Directors’ fees and expenses | | | 18,571 | | | | 13,306 | |
| Custodian fees | | | 15,596 | | | | 10,544 | |
| Other expenses | | | 55,127 | | | | 37,686 | |
| TOTAL EXPENSES | | | 971,820 | | | | 858,831 | |
| | | | | | | | | |
| NET INVESTMENT INCOME | | | 2,046,878 | | | | 2,679,628 | |
| | | | | | | | | |
| REALIZED AND UNREALIZED GAINS ON INVESTMENTS | | | | | | | | |
| Net realized gains from security transactions | | | 6,818,548 | | | | 344,913 | |
| Net change in unrealized appreciation/depreciation on investments | | | 2,085,460 | | | | 5,313,236 | |
| | | | | | | | | |
| NET REALIZED AND UNREALIZED GAINS ON INVESTMENTS | | | 8,904,008 | | | | 5,658,149 | |
| | | | | | | | | |
| NET INCREASE IN NET ASSETS FROM OPERATIONS | | $ | 10,950,886 | | | $ | 8,337,777 | |
See Notes to Financial Statements.
| Statements of Operations | Year Ended October 31, 2009 |
| | | North American Government Bond Fund | | | ISI Strategy Fund | |
| INVESTMENT INCOME | | | | | | |
| Dividends | | $ | — | | | $ | 895,252 | |
| Interest | | | 4,945,856 | | | | 241,743 | |
| TOTAL INVESTMENT INCOME | | | 4,945,856 | | | | 1,136,995 | |
| EXPENSES | | | | | | | | |
| Investment advisory fees (Note 2) | | | 660,117 | | | | 198,572 | |
| Distribution fees (Note 2): | | | | | | | | |
| ISI Class A Shares | | | 563,604 | | | | — | |
| ISI Class C Shares | | | 180,962 | | | | — | |
| ISI Shares | | | — | | | | 124,107 | |
| Administration fees (Note 2) | | | 194,069 | | | | 58,343 | |
| Professional fees | | | 75,964 | | | | 38,571 | |
| Transfer agent fees (Note 2): | | | | | | | | |
| ISI Class A Shares | | | 58,938 | | | | — | |
| ISI Class C Shares | | | 11,624 | | | | — | |
| ISI Shares | | | — | | | | 23,043 | |
| Registration fees | | | 24,746 | | | | 29,580 | |
| Registration fees - ISI Class A Shares | | | 14,890 | | | | — | |
| Registration fees - ISI Class C Shares | | | 9,753 | | | | — | |
| Shareholder servicing fees (Note 2): | | | | | | | | |
| ISI Class C Shares | | | 60,321 | | | | — | |
| Compliance fees and expenses (Note 2) | | | 32,140 | | | | 9,906 | |
| Directors’ fees and expenses | | | 24,760 | | | | 7,707 | |
| Custodian fees | | | 21,034 | | | | 6,273 | |
| Other expenses | | | 84,523 | | | | 50,289 | |
| TOTAL EXPENSES | | | 2,017,445 | | | | 546,391 | |
| NET INVESTMENT INCOME | | | 2,928,411 | | | | 590,604 | |
| REALIZED AND UNREALIZED GAINS (LOSSES) ON INVESTMENTS AND FOREIGN CURRENCIES (Notes 1 and 5) | | | | | | | | |
| Net realized gains (losses) from: | | | | | | | | |
| Security transactions | | | 6,976,703 | | | | (4,102,643 | ) |
| Foreign currency transactions | | | (122,591 | ) | | | — | |
| Net change in unrealized appreciation/depreciation on: | | | | | | | | |
| Investments | | | 5,207,533 | | | | 8,739,425 | |
| Foreign currency translation | | | 114,253 | | | | — | |
| NET REALIZED AND UNREALIZED GAINS ON INVESTMENTS AND FOREIGN CURRENCIES | | | 12,175,898 | | | | 4,636,782 | |
| NET INCREASE IN NET ASSETS FROM OPERATIONS | | $ | 15,104,309 | | | $ | 5,227,386 | |
See Notes to Financial Statements.
| ISI Total Return US Treasury Fund |
Statements of Changes in Net Assets
| | | Year Ended October 31, 2009 | | | Year Ended October 31, 2008 | |
| FROM OPERATIONS | | | | | | |
| Net investment income | | $ | 2,046,878 | | | $ | 3,508,326 | |
| Net realized gains from security transactions | | | 6,818,548 | | | | 1,336,175 | |
| Net change in unrealized appreciation/depreciation on investments | | | 2,085,460 | | | | 713,946 | |
| Net increase in net assets from operations | | | 10,950,886 | | | | 5,558,447 | |
| | | | | | | | | |
| DISTRIBUTIONS TO SHAREHOLDERS | | | | | | | | |
| From net investment income | | | (1,951,726 | ) | | | (3,593,392 | ) |
| From net realized gains from security transactions | | | (2,181,786 | ) | | | (802,706 | ) |
| Decrease in net assets from distributions to shareholders | | | (4,133,512 | ) | | | (4,396,098 | ) |
| | | | | | | | | |
| FROM CAPITAL SHARE TRANSACTIONS | | | | | | | | |
| Proceeds from shares sold | | | 7,367,906 | | | | 9,736,141 | |
| Net asset value of shares issued in reinvestment of distributions to shareholders | | | 2,838,482 | | | | 3,006,912 | |
| Payments for shares redeemed | | | (24,700,965 | ) | | | (18,700,781 | ) |
| Net decrease in net assets from capital share transactions | | | (14,494,577 | ) | | | (5,957,728 | ) |
| | | | | | | | | |
| TOTAL DECREASE IN NET ASSETS | | | (7,677,203 | ) | | | (4,795,379 | ) |
| | | | | | | | | |
| NET ASSETS | | | | | | | | |
| Beginning of year | | | 119,972,698 | | | | 124,768,077 | |
| End of year | | $ | 112,295,495 | | | $ | 119,972,698 | |
| | | | | | | | | |
| END OF YEAR UNDISTRIBUTED (DISTRIBUTIONS IN EXCESS OF) NET INVESTMENT INCOME | | $ | — | | | $ | (95,152 | ) |
| | | | | | | | | |
| CAPITAL SHARE ACTIVITY | | | | | | | | |
| Shares sold | | | 721,397 | | | | 994,698 | |
| Shares reinvested | | | 276,336 | | | | 309,350 | |
| Shares redeemed | | | (2,399,296 | ) | | | (1,921,166 | ) |
| Net decrease in shares outstanding | | | (1,401,563 | ) | | | (617,118 | ) |
| Shares outstanding, beginning of year | | | 12,510,639 | | | | 13,127,757 | |
| Shares outstanding, end of year | | | 11,109,076 | | | | 12,510,639 | |
See Notes to Financial Statements.
| ISI Managed Municipal Fund |
Statements of Changes in Net Assets
| | | Year Ended October 31, 2009 | | | Year Ended October 31, 2008 | |
| FROM OPERATIONS | | | | | | |
| Net investment income | | $ | 2,679,628 | | | $ | 2,594,704 | |
| Net realized gains from security transactions | | | 344,913 | | | | 124,614 | |
| Net change in unrealized appreciation/depreciation on investments | | | 5,313,236 | | | | (3,752,876 | ) |
| Net increase (decrease) in net assets from operations | | | 8,337,777 | | | | (1,033,558 | ) |
| | | | | | | | | |
| DISTRIBUTIONS TO SHAREHOLDERS | | | | | | | | |
| From net investment income | | | (2,678,741 | ) | | | (3,320,777 | ) |
| From net realized gains from security transactions | | | (124,276 | ) | | | (302,252 | ) |
| Decrease in net assets from distributions to shareholders | | | (2,803,017 | ) | | | (3,623,029 | ) |
| | | | | | | | | |
| FROM CAPITAL SHARE TRANSACTIONS | | | | | | | | |
| Proceeds from shares sold | | | 30,987,833 | | | | 14,259,928 | |
| Net asset value of shares issued in reinvestment of distributions to shareholders | | | 1,488,003 | | | | 1,901,352 | |
| Payments for shares redeemed | | | (12,159,543 | ) | | | (9,470,677 | ) |
| Net increase in net assets from capital share transactions | | | 20,316,293 | | | | 6,690,603 | |
| | | | | | | | | |
| TOTAL INCREASE IN NET ASSETS | | | 25,851,053 | | | | 2,034,016 | |
| | | | | | | | | |
| NET ASSETS | | | | | | | | |
| Beginning of year | | | 75,071,959 | | | | 73,037,943 | |
| End of year | | $ | 100,923,012 | | | $ | 75,071,959 | |
| | | | | | | | | |
| END OF YEAR UNDISTRIBUTED NET INVESTMENT INCOME | | $ | 887 | | | $ | — | |
| | | | | | | | | |
| CAPITAL SHARE ACTIVITY | | | | | | | | |
| Shares sold | | | 2,923,152 | | | | 1,370,154 | |
| Shares reinvested | | | 140,914 | | | | 181,645 | |
| Shares redeemed | | | (1,147,728 | ) | | | (903,279 | ) |
| Net increase in shares outstanding | | | 1,916,338 | | | | 648,520 | |
| Shares outstanding, beginning of year | | | 7,533,774 | | | | 6,885,254 | |
| Shares outstanding, end of year | | | 9,450,112 | | | | 7,533,774 | |
See Notes to Financial Statements.
| ISI North American Government Bond Fund |
Statements of Changes in Net Assets
| | | Year Ended October 31, 2009 | | | Year Ended October 31, 2008 | |
| FROM OPERATIONS | | | | | | |
| Net investment income | | $ | 2,928,411 | | | $ | 4,535,624 | |
| Net realized gains from security and foreign currency transactions | | | 6,854,112 | | | | 2,096,946 | |
| Net change in unrealized appreciation/depreciation on investments and foreign currency translation | | | 5,321,786 | | | | (6,447,206 | ) |
| Net increase in net assets from operations | | | 15,104,309 | | | | 185,364 | |
| DISTRIBUTIONS TO SHAREHOLDERS | | | | | | | | |
| From net investment income | | | | | | | | |
| ISI Class A Shares | | | (1,471,302 | ) | | | (3,389,286 | ) |
| ISI Class C Shares | | | (71,732 | ) | | | (348,008 | ) |
| From net realized gains from security transactions | | | | | | | | |
| ISI Class A Shares | | | (5,181,835 | ) | | | (2,557,037 | ) |
| ISI Class C Shares | | | (926,946 | ) | | | (357,527 | ) |
| Return of capital | | | | | | | | |
| ISI Class A Shares | | | — | | | | (569,757 | ) |
| ISI Class C Shares | | | — | | | | (79,664 | ) |
| Decrease in net assets from distributions to shareholders | | | (7,651,815 | ) | | | (7,301,279 | ) |
| FROM CAPITAL SHARE TRANSACTIONS | | | | | | | | |
| Proceeds from shares sold | | | | | | | | |
| ISI Class A Shares | | | 31,569,732 | | | | 43,826,856 | |
| ISI Class C Shares | | | 8,405,659 | | | | 8,998,180 | |
| Net asset value of shares issued in reinvestment of distributions to shareholders | | | | | | | | |
| ISI Class A Shares | | | 3,936,266 | | | | 3,405,028 | |
| ISI Class C Shares | | | 657,990 | | | | 531,357 | |
| Payments for shares redeemed | | | | | | | | |
| ISI Class A Shares | | | (49,531,989 | ) | | | (32,470,695 | ) |
| ISI Class C Shares | | | (5,979,135 | ) | | | (4,808,955 | ) |
| Net increase (decrease) in net assets from capital share transactions | | | (10,941,477 | ) | | | 19,481,771 | |
| TOTAL INCREASE (DECREASE) IN NET ASSETS | | | (3,488,983 | ) | | | 12,365,856 | |
| NET ASSETS | | | | | | | | |
| Beginning of year | | | 160,962,341 | | | | 148,596,485 | |
| End of year | | $ | 157,473,358 | | | $ | 160,962,341 | |
| END OF YEAR UNDISTRIBUTED (DISTRIBUTIONS IN EXCESS OF) NET INVESTMENT INCOME | | $ | — | | | $ | (292,278 | ) |
See Notes to Financial Statements.
| ISI North American Government Bond Fund |
Statements of Changes in Net Assets (continued)
| | | Year Ended October 31, 2009 | | | Year Ended October 31, 2008 | |
| CAPITAL SHARE ACTIVITY | | | | | | |
| Shares sold | | | | | | |
| ISI Class A Shares | | | 4,150,857 | | | | 5,760,050 | |
| ISI Class C Shares | | | 1,106,156 | | | | 1,176,213 | |
| Shares reinvested | | | | | | | | |
| ISI Class A Shares | | | 519,788 | | | | 447,131 | |
| ISI Class C Shares | | | 87,038 | | | | 69,882 | |
| Shares redeemed | | | | | | | | |
| ISI Class A Shares | | | (6,529,777 | ) | | | (4,273,002 | ) |
| ISI Class C Shares | | | (786,953 | ) | | | (624,903 | ) |
| | | | | | | | | |
| Net increase (decrease) in shares outstanding | | | | | | | | |
| ISI Class A Shares | | | (1,859,132 | ) | | | 1,934,179 | |
| ISI Class C Shares | | | 406,241 | | | | 621,192 | |
| | | | | | | | | |
| Shares outstanding, beginning of year | | | | | | | | |
| ISI Class A Shares | | | 19,438,474 | | | | 17,504,295 | |
| ISI Class C Shares | | | 2,862,727 | | | | 2,241,535 | |
| Shares outstanding, end of year | | | | | | | | |
| ISI Class A Shares | | | 17,579,342 | | | | 19,438,474 | |
| ISI Class C Shares | | | 3,268,968 | | | | 2,862,727 | |
See Notes to Financial Statements.
Statements of Changes in Net Assets
| | | Year Ended October 31, 2009 | | | Year Ended October 31, 2008 | |
| FROM OPERATIONS | | | | | | |
| Net investment income | | $ | 590,604 | | | $ | 736,224 | |
| Net realized losses from security transactions | | | (4,102,643 | ) | | | (971,359 | ) |
| Net change in unrealized appreciation/depreciation on investments | | | 8,739,425 | | | | (23,945,840 | ) |
| Net increase (decrease) in net assets from operations | | | 5,227,386 | | | | (24,180,975 | ) |
| | | | | | | | | |
| DISTRIBUTIONS TO SHAREHOLDERS | | | | | | | | |
| From net investment income | | | (604,469 | ) | | | (738,026 | ) |
| From net realized gains from security transactions | | | — | | | | (4,289,022 | ) |
| Decrease in net assets from distributions to shareholders | | | (604,469 | ) | | | (5,027,048 | ) |
| | | | | | | | | |
| FROM CAPITAL SHARE TRANSACTIONS | | | | | | | | |
| Proceeds from shares sold | | | 3,988,025 | | | | 11,373,856 | |
| Net asset value of shares issued in reinvestment of distributions to shareholders | | | 539,019 | | | | 4,465,374 | |
| Payments for shares redeemed | | | (8,663,997 | ) | | | (13,921,636 | ) |
| Net increase (decrease) in net assets from capital share transactions | | | (4,136,953 | ) | | | 1,917,594 | |
| | | | | | | | | |
| TOTAL INCREASE (DECREASE) IN NET ASSETS | | | 485,964 | | | | (27,290,429 | ) |
| | | | | | | | | |
| NET ASSETS | | | | | | | | |
| Beginning of year | | | 53,244,817 | | | | 80,535,246 | |
| End of year | | $ | 53,730,781 | | | $ | 53,244,817 | |
| | | | | | | | | |
| END OF YEAR UNDISTRIBUTED NET INVESTMENT INCOME | | $ | 10,950 | | | $ | 34,455 | |
| | | | | | | | | |
| CAPITAL SHARE ACTIVITY | | | | | | | | |
| Shares sold | | | 423,996 | | | | 882,661 | |
| Shares reinvested | | | 56,560 | | | | 334,700 | |
| Shares redeemed | | | (957,762 | ) | | | (1,122,582 | ) |
| Net increase (decrease) in shares outstanding | | | (477,206 | ) | | | 94,779 | |
| Shares outstanding, beginning of year | | | 5,527,708 | | | | 5,432,929 | |
| Shares outstanding, end of year | | | 5,050,502 | | | | 5,527,708 | |
See Notes to Financial Statements.
| ISI Total Return US Treasury Fund |
Financial Highlights
Selected Per Share Data and Ratios for a Share Outstanding Throughout Each Year
| | | Years Ended October 31, | |
| | | 2009 | | | 2008 | | | 2007 | | | 2006 | | | 2005 | |
| Net asset value at beginning of year | | $ | 9.59 | | | $ | 9.50 | | | $ | 9.42 | | | $ | 9.33 | | | $ | 9.57 | |
| | | | | | | | | | | | | | | | | | | | | |
| Income (loss) from investment operations: | | | | | | | | | | | | | | | | | | | | |
Net investment income (a) | | | 0.17 | | | | 0.28 | | | | 0.35 | | | | 0.32 | | | | 0.29 | |
| Net realized and unrealized gains (losses) on investments | | | 0.70 | | | | 0.16 | | | | 0.08 | | | | 0.12 | | | | (0.16 | ) |
| Total from investment operations | | | 0.87 | | | | 0.44 | | | | 0.43 | | | | 0.44 | | | | 0.13 | |
| | | | | | | | | | | | | | | | | | | | | |
| Less distributions: | | | | | | | | | | | | | | | | | | | | |
| Dividends from net investment income | | | (0.17 | ) | | | (0.28 | ) | | | (0.34 | ) | | | (0.35 | ) | | | (0.25 | ) |
| Distributions from net realized gains | | | (0.18 | ) | | | (0.07 | ) | | | (0.00 | )* | | | — | | | | (0.03 | ) |
| Return of capital | | | — | | | | — | | | | (0.01 | ) | | | — | | | | (0.09 | ) |
| Total distributions | | | (0.35 | ) | | | (0.35 | ) | | | (0.35 | ) | | | (0.35 | ) | | | (0.37 | ) |
| | | | | | | | | | | | | | | | | | | | | |
| Net asset value at end of year | | $ | 10.11 | | | $ | 9.59 | | | $ | 9.50 | | | $ | 9.42 | | | $ | 9.33 | |
| | | | | | | | | | | | | | | | | | | | | |
TOTAL RETURN(b) | | | 9.05% | | | | 4.61% | | | | 4.66% | | | | 4.83% | | | | 1.38% | |
| | | | | | | | | | | | | | | | | | | | | |
| Net assets at end of year (000’s) | | $ | 112,295 | | | $ | 119,973 | | | $ | 124,768 | | | $ | 153,784 | | | $ | 165,974 | |
| | | | | | | | | | | | | | | | | | | | | |
| Ratio of expenses to average net assets | | | 0.80% | | | | 0.79% | | | | 0.79% | | | | 0.76% | (c) | | | 0.70% | |
| | | | | | | | | | | | | | | | | | | | | |
| Ratio of net investment income to average net assets | | | 1.68% | | | | 2.86% | | | | 3.68% | | | | 3.44% | (c) | | | 3.01% | |
| | | | | | | | | | | | | | | | | | | | | |
| Portfolio turnover rate | | | 109% | | | | 70% | | | | 29% | | | | 51% | | | | 16% | |
| (a) | Calculated using the average shares outstanding for the period. |
| (b) | Total return is a measure of the change in value of an investment in the Fund over the period covered, which assumes any dividends or capital gains distributions are reinvested in shares of the Fund. Returns shown do not reflect the deduction of taxes a shareholder would pay on Fund distributions or the redemption of Fund shares. |
| (c) | The October 31, 2006 ratios of expenses and net investment income to average net assets were unaffected by the waiver of distribution fees during the year. |
| * | Amount less than $0.005 per share. |
See Notes to Financial Statements
| ISI Managed Municipal Fund |
Financial Highlights
Selected Per Share Data and Ratios for a Share Outstanding Throughout Each Year
| | | Years Ended October 31, | |
| | | 2009 | | | 2008 | | | 2007 | | | 2006 | | | 2005 | |
| Net asset value at beginning of year | | $ | 9.96 | | | $ | 10.61 | | | $ | 10.80 | | | $ | 10.68 | | | $ | 10.91 | |
| | | | | | | | | | | | | | | | | | | | | |
| Income (loss) from investment operations: | | | | | | | | | | | | | | | | | | | | |
Net investment income (a) | | | 0.32 | | | | 0.36 | | | | 0.38 | | | | 0.39 | | | | 0.40 | |
| Net realized and unrealized gains (losses) on investments | | | 0.74 | | | | (0.50 | ) | | | (0.14 | ) | | | 0.10 | | | | (0.27 | ) |
| Total from investment operations | | | 1.06 | | | | (0.14 | ) | | | 0.24 | | | | 0.49 | | | | 0.13 | |
| | | | | | | | | | | | | | | | | | | | | |
| Less distributions: | | | | | | | | | | | | | | | | | | | | |
| Dividends from net investment income | | | (0.32 | ) | | | (0.47 | ) | | | (0.34 | ) | | | (0.34 | ) | | | (0.36 | ) |
| Distributions from net realized gains | | | (0.02 | ) | | | (0.04 | ) | | | (0.09 | ) | | | (0.03 | ) | | | — | |
| Total distributions | | | (0.34 | ) | | | (0.51 | ) | | | (0.43 | ) | | | (0.37 | ) | | | (0.36 | ) |
| | | | | | | | | | | | | | | | | | | | | |
| Net asset value at end of year | | $ | 10.68 | | | $ | 9.96 | | | $ | 10.61 | | | $ | 10.80 | | | $ | 10.68 | |
| | | | | | | | | | | | | | | | | | | | | |
TOTAL RETURN(b) | | | 10.68% | | | | (1.44% | ) | | | 2.29% | | | | 4.68% | | | | 1.19% | |
| | | | | | | | | | | | | | | | | | | | | |
| Net assets at end of year (000’s) | | $ | 100,923 | | | $ | 75,072 | | | $ | 73,038 | | | $ | 82,880 | | | $ | 94,027 | |
| | | | | | | | | | | | | | | | | | | | | |
| Ratio of expenses to average net assets | | | 0.97% | | | | 0.96% | | | | 0.94% | | | | 0.91% | | | | 0.86% | |
| | | | | | | | | | | | | | | | | | | | | |
| Ratio of net investment income to average net assets | | | 3.02% | | | | 3.48% | | | | 3.57% | | | | 3.63% | | | | 3.64% | |
| | | | | | | | | | | | | | | | | | | | | |
| Portfolio turnover rate | | | 10% | | | | 7% | | | | 5% | | | | 7% | | | | 7% | |
| (a) | Calculated using the average shares outstanding for the period. |
| (b) | Total return is a measure of the change in value of an investment in the Fund over the period covered, which assumes any dividends or capital gains distributions are reinvested in shares of the Fund. Returns shown do not reflect the deduction of taxes a shareholder would pay on Fund distributions or the redemption of Fund shares. |
See Notes to Financial Statements.
| ISI North American Government Bond Fund – Class A |
| Selected Per Share Data and Ratios for a Share Outstanding Throughout Each Year |
| | | Years Ended October 31, | |
| | | 2009 | | | 2008 | | | 2007 | | | 2006 | | | 2005 | |
| Net asset value at beginning of year | | $ | 7.22 | | | $ | 7.53 | | | $ | 7.41 | | | $ | 7.34 | | | $ | 7.41 | |
| | | | | | | | | | | | | | | | | | | | | |
| Income (loss) from investment operations: | | | | | | | | | | | | | | | | | | | | |
Net investment income (a) | | | 0.14 | | | | 0.23 | | | | 0.26 | | | | 0.25 | | | | 0.26 | |
| Net realized and unrealized gains (losses) on investments and foreign currencies | | | 0.56 | | | | (0.18 | ) | | | 0.22 | | | | 0.18 | | | | 0.06 | |
| Total from investment operations | | | 0.70 | | | | 0.05 | | | | 0.48 | | | | 0.43 | | | | 0.32 | |
| | | | | | | | | | | | | | | | | | | | | |
| Less distributions: | | | | | | | | | | | | | | | | | | | | |
| Dividends from net investment income | | | (0.08 | ) | | | (0.19 | ) | | | (0.35 | ) | | | (0.30 | ) | | | (0.31 | ) |
| Distributions from net realized gains | | | (0.28 | ) | | | (0.14 | ) | | | — | | | | (0.01 | ) | | | (0.03 | ) |
| Return of capital | | | — | | | | (0.03 | ) | | | (0.01 | ) | | | (0.05 | ) | | | (0.05 | ) |
| Total distributions | | | (0.36 | ) | | | (0.36 | ) | | | (0.36 | ) | | | (0.36 | ) | | | (0.39 | ) |
| | | | | | | | | | | | | | | | | | | | | |
| Net asset value at end of year | | $ | 7.56 | | | $ | 7.22 | | | $ | 7.53 | | | $ | 7.41 | | | $ | 7.34 | |
| | | | | | | | | | | | | | | | | | | | | |
TOTAL RETURN(b) | | | 9.80% | | | | 0.51% | | | | 6.71% | | | | 6.04% | | | | 4.39% | |
| | | | | | | | | | | | | | | | | | | | | |
| Net assets at end of year (000’s) | | $ | 132,814 | | | $ | 140,326 | | | $ | 131,748 | | | $ | 146,854 | | | $ | 177,101 | |
| | | | | | | | | | | | | | | | | | | | | |
| Ratio of expenses to average net assets | | | 1.13% | | | | 1.11% | | | | 1.11% | | | | 1.06% | (c) | | | 1.04% | |
| | | | | | | | | | | | | | | | | | | | | |
| Ratio of net investment income to average net assets | | | 1.87% | | | | 2.97% | | | | 3.54% | | | | 3.47% | (c) | | | 3.55% | |
| | | | | | | | | | | | | | | | | | | | | |
| Portfolio turnover rate | | | 131% | | | | 108% | | | | 49% | | | | 53% | | | | 66% | |
| (a) | Calculated using the average shares outstanding for the period. |
| (b) | Total return is a measure of the change in value of an investment in the Fund over the period covered, which assumes any dividends or capital gains distributions are reinvested in shares of the Fund. Returns shown do not reflect the deduction of taxes a shareholder would pay on Fund distributions or the redemption of Fund shares. |
| (c) | The October 31, 2006 ratios of expenses and net investment income to average net assets were unaffected by the waiver of distribution fees during the year. |
See Notes to Financial Statements.
| ISI North American Government Bond Fund – Class C |
Financial Highlights
Selected Per Share Data and Ratios for a Share Outstanding Throughout Each Year
| | | Years Ended October 31, | |
| | | 2009 | | | 2008 | | | 2007 | | | 2006 | | | 2005 | |
| Net asset value at beginning of year | | $ | 7.21 | | | $ | 7.52 | | | $ | 7.40 | | | $ | 7.33 | | | $ | 7.40 | |
| | | | | | | | | | | | | | | | | | | | | |
| Income (loss) from investment operations: | | | | | | | | | | | | | | | | | | | | |
Net investment income (a) | | | 0.09 | | | | 0.18 | | | | 0.21 | | | | 0.21 | | | | 0.21 | |
| Net realized and unrealized gains (losses) on investments and foreign currencies | | | 0.55 | | | | (0.18 | ) | | | 0.22 | | | | 0.17 | | | | 0.06 | |
| Total from investment operations | | | 0.64 | | | | 0.00 | | | | 0.43 | | | | 0.38 | | | | 0.27 | |
| | | | | | | | | | | | | | | | | | | | | |
| Less distributions: | | | | | | | | | | | | | | | | | | | | |
| Dividends from net investment income | | | (0.03 | ) | | | (0.14 | ) | | | (0.30 | ) | | | (0.25 | ) | | | (0.26 | ) |
| Distributions from net realized gains | | | (0.28 | ) | | | (0.14 | ) | | | — | | | | (0.01 | ) | | | (0.03 | ) |
| Return of capital | | | — | | | | (0.03 | ) | | | (0.01 | ) | | | (0.05 | ) | | | (0.05 | ) |
| Total distributions | | | (0.31 | ) | | | (0.31 | ) | | | (0.31 | ) | | | (0.31 | ) | | | (0.34 | ) |
| | | | | | | | | | | | | | | | | | | | | |
| Net asset value at end of year | | $ | 7.54 | | | $ | 7.21 | | | $ | 7.52 | | | $ | 7.40 | | | $ | 7.33 | |
| | | | | | | | | | | | | | | | | | | | | |
TOTAL RETURN(b) | | | 8.97% | | | | (0.12% | ) | | | 6.03% | | | | 5.35% | | | | 3.73% | |
| | | | | | | | | | | | | | | | | | | | | |
| Net assets at end of year (000’s) | | $ | 24,659 | | | $ | 20,636 | | | $ | 16,848 | | | $ | 15,579 | | | $ | 15,944 | |
| | | | | | | | | | | | | | | | | | | | | |
| Ratio of expenses to average net assets | | | 1.76% | | | | 1.73% | | | | 1.74% | | | | 1.72% | | | | 1.69% | |
| | | | | | | | | | | | | | | | | | | | | |
| Ratio of net investment income to average net assets | | | 1.22% | | | | 2.34% | | | | 2.93% | | | | 2.81% | | | | 2.89% | |
| | | | | | | | | | | | | | | | | | | | | |
| Portfolio turnover rate | | | 131% | | | | 108% | | | | 49% | | | | 53% | | | | 66% | |
| (a) | Calculated using the average shares outstanding for the period. |
| (b) | Total return is a measure of the change in value of an investment in the Fund over the period covered, which assumes any dividends or capital gains distributions are reinvested in shares of the Fund. Returns shown do not reflect the deduction of taxes a shareholder would pay on Fund distributions or the redemption of Fund shares. |
See Notes to Financial Statements.
Financial Highlights
Selected Per Share Data and Ratios for a Share Outstanding Throughout Each Year
| | | Years Ended October 31, | |
| | | 2009 | | | 2008 | | | 2007 | | | 2006 | | | 2005 | |
| Net asset value at beginning of year | | $ | 9.63 | | | $ | 14.82 | | | $ | 13.54 | | | $ | 12.12 | | | $ | 11.21 | |
| | | | | | | | | | | | | | | | | | | | | |
| Income (loss) from investment operations: | | | | | | | | | | | | | | | | | | | | |
Net investment income (a) | | | 0.11 | | | | 0.13 | | | | 0.17 | | | | 0.15 | | | | 0.16 | |
| Net realized and unrealized gains (losses) on investments | | | 1.02 | | | | (4.39 | ) | | | 1.65 | | | | 1.42 | | | | 0.91 | |
| Total from investment operations | | | 1.13 | | | | (4.26 | ) | | | 1.82 | | | | 1.57 | | | | 1.07 | |
| | | | | | | | | | | | | | | | | | | | | |
| Less distributions: | | | | | | | | | | | | | | | | | | | | |
| Dividends from net investment income | | | (0.12 | ) | | | (0.13 | ) | | | (0.17 | ) | | | (0.15 | ) | | | (0.16 | ) |
| Distributions from net realized gains | | | — | | | | (0.80 | ) | | | (0.37 | ) | | | — | | | | — | |
| Total distributions | | | (0.12 | ) | | | (0.93 | ) | | | (0.54 | ) | | | (0.15 | ) | | | (0.16 | ) |
| | | | | | | | | | | | | | | | | | | | | |
| Net asset value at end of year | | $ | 10.64 | | | $ | 9.63 | | | $ | 14.82 | | | $ | 13.54 | | | $ | 12.12 | |
| | | | | | | | | | | | | | | | | | | | | |
TOTAL RETURN(b) | | | 11.84% | | | | (30.49% | ) | | | 13.79% | | | | 13.01% | | | | 9.59% | |
| | | | | | | | | | | | | | | | | | | | | |
| Net assets at end of year (000’s) | | $ | 53,731 | | | $ | 53,245 | | | $ | 80,535 | | | $ | 69,438 | | | $ | 60,205 | |
| | | | | | | | | | | | | | | | | | | | | |
| Ratio of expenses to average net assets | | | 1.10% | | | | 0.99% | | | | 0.96% | | | | 0.95% | | | | 0.94% | |
| | | | | | | | | | | | | | | | | | | | | |
| Ratio of net investment income to average net assets | | | 1.19% | | | | 1.02% | | | | 1.21% | | | | 1.17% | | | | 1.33% | |
| | | | | | | | | | | | | | | | | | | | | |
| Portfolio turnover rate | | | 55% | | | | 42% | | | | 62% | | | | 41% | | | | 30% | |
| (a) | Calculated using the average shares outstanding for the period. |
| (b) | Total return is a measure of the change in value of an investment in the Fund over the period covered, which assumes any dividends or capital gains distributions are reinvested in shares of the Fund. Returns shown do not reflect the deduction of taxes a shareholder would pay on Fund distributions or the redemption of Fund shares. |
See Notes to Financial Statements.
Notes to Financial Statements
October 31, 2009
Note 1 - Organization and Significant Accounting Policies
A. Organization
Total Return US Treasury Fund, Inc. (“Total Return”), Managed Municipal Fund, Inc. (“Managed Municipal”), North American Government Bond Fund, Inc. (“North American”) and ISI Strategy Fund, Inc. (“Strategy”) (each a “Fund” and collectively, the “Funds”) are registered under the Investment Company Act of 1940 as open-end management investment companies. The Funds are organized as corporations under the laws of the State of Maryland.
Total Return’s investment objective is to achieve a high level of total return with relative stability of principal and, secondarily, high current income consistent with an investment in securities issued by the United States Treasury. Managed Municipal’s investment objective is to provide a high level of total return with relative stability of principal and, secondarily, high current income exempt from Federal income tax through investment in a portfolio consisting primarily of tax-free municipal obligations. North American’s investment objective is designed to provide a high level of current income, consistent with prudent investment risk. Strategy’s investment objective is to maximize total return through a combination of long-term growth of capital and current income.
Total Return, Managed Municipal and Strategy each currently offer a single class of shares (ISI Shares) to investors. North American offers two classes of shares – ISI Class A Shares and ISI Class C Shares. ISI Shares and ISI Class A Shares are subject to a maximum front-end sales charge equal to 3.00%. A contingent deferred sales charge of 1.00% is imposed on the sale of ISI Class C Shares if redeemed within the first year of purchase.
Total Return, Managed Municipal and Strategy are authorized to issue 115,000,000, 55,000,000 and 25,000,000 shares, respectively, of ISI Shares at $0.001 par value. North American is authorized to issue 50,000,000 ISI Class A Shares and 5,000,000 ISI Class C Shares at $0.001 par value.
B. Valuation of Securities
Exchange traded securities and over-the-counter securities listed on the NASDAQ National Market System for which market quotations are readily available are valued each Fund business day using the last reported sales price or the NASDAQ Official Closing Price (“NOCP”) provided by independent pricing services as of the close of trading on the New York Stock Exchange (normally 4:00 p.m. Eastern time). In the absence of a sale price or NOCP, such securities are valued at the mean of the last bid and the last asked prices. Non-exchange traded securities for which quotations are readily available are generally valued at the mean between the last bid and the last asked prices. Debt securities may be valued at prices supplied by a Fund’s pricing agent based on broker or dealer supplied valuations or matrix pricing, a method of valuing securities by reference to the
Notes to Financial Statements (continued)
value of other securities with similar characteristics such as rating, interest rate, and maturity. Money market instruments that mature in 60 days or less may be valued at amortized cost unless the Fund’s investment advisor believes another valuation is more appropriate.
When valuing securities for which market quotations are not readily available or for which the market quotations that are readily available are considered unreliable, the Funds determine a fair value in good faith under procedures established by and under the general supervision of the Funds’ Boards of Directors (the “Board”). The Funds may use these procedures to establish the fair value of securities when, for example, a significant event occurs between the time the market closes and the calculation of the net asset value per share, and the event is likely to affect the Fund’s net asset value per share. Fair valuation may also be used for securities that are subject to legal or contractual restrictions on resale, securities for which no or limited trading activity has occurred for a period of time, or securities that are otherwise deemed to be illiquid (i.e., securities that cannot be disposed of within seven days at approximately the price at which the security is currently priced by the Funds).
If a fair value is required, the investment advisor, or the sub-advisor in the case of Strategy, determines the value of the security until the Board meets to establish the fair value of the security.
As of October 31, 2009, there were no fair valued securities.
Accounting principles generally accepted in the United States (“GAAP”) establish a single authoritative definition of fair value, set out a frame work for measuring fair value and require additional disclosures about fair value measurements.
Various inputs are used in determining the value of each Fund’s investments. These inputs are summarized in the three broad levels listed below:
Level 1 – quoted prices in active markets for identical securities
Level 2 – other significant observable inputs
Level 3 – significant unobservable inputs
The inputs or methodology used for valuing securities are not necessarily an indication of the risks associated with investing in those securities.
The following is a summary of the inputs used to value each Fund’s investments as of October 31, 2009:
| | | Total Return | | | Managed Municipal | | | North American | | | Strategy | |
| Level 1 - Quoted prices | | $ | — | | | $ | — | | | $ | — | | | $ | 46,628,559 | |
| Level 2 - Other significant observable inputs | | | 111,293,330 | | | | 100,055,289 | | | | 155,531,090 | | | | 7,052,431 | |
| Level 3 - Significant unobservable inputs | | | — | | | | — | | | | — | | | | — | |
| Total | | $ | 111,293,330 | | | $ | 100,055,289 | | | $ | 155,531,090 | | | $ | 53,680,990 | |
Notes to Financial Statements (continued)
The following is a summary of the inputs used to value each Fund’s investments as of October 31, 2009 by security type, as required by GAAP:
| | | Level 1 | | | Level 2 | | | Level 3 | | | Total | |
| US Treasury Obligations | | $ | — | | | $ | 109,720,330 | | | $ | — | | | $ | 111,293,330 | |
| Repurchase Agreements | | | — | | | | 1,573,000 | | | | — | | | | 1,573,000 | |
| Total | | $ | — | | | $ | 111,293,330 | | | $ | — | | | $ | 111,293,330 | |
Managed Municipal
| | | Level 1 | | | Level 2 | | | Level 3 | | | Total | |
| Municipal Bonds | | $ | — | | | $ | 95,019,348 | | | $ | — | | | $ | 95,019,348 | |
| US Treasury Obligations | | | — | | | | 504,941 | | | | — | | | | 504,941 | |
| Repurchase Agreements | | | — | | | | 4,531,000 | | | | — | | | | 4,531,000 | |
| Total | | $ | — | | | $ | 100,055,289 | | | $ | — | | | $ | 100,055,289 | |
North American
| | | Level 1 | | | Level 2 | | | Level 3 | | | Total | |
| Foreign Government Bonds | | $ | — | | | $ | 40,513,271 | | | $ | — | | | $ | 40,513,271 | |
| US Treasury Obligations | | | — | | | | 113,450,819 | | | | — | | | | 113,450,819 | |
| Repurchase Agreements | | | — | | | | 1,567,000 | | | | — | | | | 1,567,000 | |
| Total | | $ | — | | | $ | 155,531,090 | | | $ | — | | | $ | 155,531,090 | |
Strategy
| | | Level 1 | | | Level 2 | | | Level 3 | | | Total | |
| Common Stocks | | $ | 46,628,559 | | | $ | — | | | $ | — | | | $ | 46,628,559 | |
| US Treasury Obligations | | | — | | | | 6,613,431 | | | | — | | | | 6,613,431 | |
| Repurchase Agreements | | | — | | | | 439,000 | | | | — | | | | 439,000 | |
| Total | | $ | 46,628,559 | | | $ | 7,052,431 | | | $ | — | | | $ | 53,680,990 | |
See Strategy’s Schedule of Investments for a listing of the common stocks valued using Level 1 inputs by industry type, as required by GAAP.
C. Securities Transactions and Investment Income
Securities transactions are recorded on trade date. Realized gains and losses are determined by comparing the proceeds of a sale or the cost of a purchase with a specific offsetting transaction. Dividend income is recorded on the ex-dividend date. Interest income, including amortization of premiums and accretion of discounts, is accrued daily. Estimated expenses are also accrued daily. With respect to North American, income, gains (losses) and common expenses are allocated to each class based on its respective net assets. Class specific expenses are charged directly to each class.
Notes to Financial Statements (continued)
D. Distributions
Total Return declares distributions daily, and North American declares monthly distributions at fixed rates approved by the Board. These distributions are paid monthly. To the extent that a Fund’s net investment income is less than an approved fixed rate, some of its distributions may be designated as a return of capital. Managed Municipal declares and pays dividends monthly from its net investment income. Strategy declares and pays dividends quarterly from its net investment income. Net realized capital gains, if any, are distributed at least annually. The Funds record dividends and distributions on the ex-dividend date.
E. Federal Income Taxes
Each Fund has a policy to qualify as a regulated investment company under subchapter M of the Internal Revenue Code. As provided therein in any fiscal year in which a Fund so qualifies and distributes at least 90% of its net taxable income, the Fund (but not its shareholders) will be relieved of Federal income tax on the income distributed. In addition, by distributing in each calendar year substantially all of its net investment income and net realized capital gains, a Fund will not be subject to Federal excise taxes. Accordingly, no Federal income or excise taxes have been accrued.
F. Foreign Currency Translation
The Funds maintain their accounting records in U.S. dollars. North American determines the U.S. dollar value of foreign currency-denominated assets, liabilities and transactions by using prevailing exchange rates. In valuing security transactions, the receipt of income and the payment of expenses, North American uses the prevailing exchange rate on the transaction date.
Net realized gains and losses on foreign currency transactions shown on North American’s financial statements result from the sale of foreign currencies, currency gains or losses realized between the trade and settlement dates on securities transactions, and from the difference between the amounts of interest recorded on North American’s books and the U.S. dollar equivalent of the amounts actually received or paid. That portion of realized gains (losses) from security transactions that results from fluctuation in foreign currency exchange rates relating to the sale of foreign securities is not separately disclosed but is included in net realized gains (losses) from security transactions. That portion of unrealized gains and losses on investments that results from fluctuations in foreign currency exchange rates is not separately disclosed but is included in the net change in unrealized appreciation/depreciation on investments.
G. Forward Foreign Currency Contracts
North American may use forward foreign currency contracts to manage foreign exchange rate risk. The Fund may use these contracts to fix the U.S. dollar value of securities transactions for the period between the date of the transaction and the date the security is received or delivered or to hedge the U.S. dollar value of securities that it already owns. The use of forward foreign currency contracts does not eliminate fluctuations in the prices of the underlying securities, but does establish a rate of exchange that can be
Notes to Financial Statements (continued)
achieved in the future. North American determines the net U.S. dollar value of the forward foreign currency contracts using prevailing exchange rates.
H. Derivatives Disclosure
GAAP requires enhanced disclosures about a fund’s derivative and hedging activities, including how such activities are accounted for and their effect on a fund’s financial position, performance and cash flows. During the year ended October 31, 2009, North American utilized forward foreign currency contracts to manage foreign exchange rate risk. The net realized loss of $216,555 on these foreign currency contracts are included on the Statement of Operations under net realized gains (losses) from foreign currency transactions. As of October 31, 2009, there were no open forward foreign currency contracts.
I. Repurchase Agreements
Each Fund may make short-term investments in repurchase agreements that are fully collateralized by U.S. government securities. Under the terms of a repurchase agreement, a financial institution sells U.S. government securities to a Fund and agrees to buy them back on a specified day in return for the principal amount of the original sale plus accrued interest. The custodial bank holds the collateral in a separate account until the agreement matures. If the value of the securities falls below the principal amount of the repurchase agreement plus accrued interest, the financial institution deposits additional collateral by the following business day. If the financial institution either fails to deposit the required additional collateral or fails to repurchase the securities as agreed, a Fund has the right to sell the securities and recover any resulting loss from the financial institution. If the financial institution enters into bankruptcy, a Fund’s claim on the collateral may be subject to legal proceedings.
J. Estimates
In preparing its financial statements in conformity with GAAP, management makes estimates and assumptions that affect the reported amounts of assets and liabilities and disclosure of contingent assets and liabilities at the date of the financial statements and the reported amounts of revenues and expenses during the period. Actual results may be different.
Note 2 - Fees and Transactions with Affiliates
International Strategy & Investment, Inc. (“ISI”) is the Funds’ investment advisor. As compensation for ISI’s advisory services, Total Return pays ISI an annual fee based on the Fund’s average daily net assets, which is calculated daily and paid monthly at the following annual rates: 0.20% of the first $100 million, 0.18% of the next $100 million, 0.16% of the next $100 million, 0.14% of the next $200 million and 0.12% of the amount over $500 million. In addition, Total Return pays ISI 1.50% of the Fund’s gross interest income. As compensation for ISI’s advisory services, Managed Municipal, North American and Strategy each pay ISI a fee, which is calculated daily and paid monthly, at the annual rate of 0.40% of such Fund’s average daily net assets.
Notes to Financial Statements (continued)
ISI has contractually agreed to waive its advisory fees and/or reimburse expenses of North American through February 28, 2011 to the extent necessary to limit the annual ordinary operating expenses of ISI Class C Shares to 1.85% of the average daily net assets attributable to such shares. During the year ended October 31, 2009, ISI was not required to waive any advisory fees.
Los Angeles Capital Management and Equity Research, Inc. is Strategy’s Sub-Advisor and is responsible for managing the common stocks in Strategy’s portfolio. The Sub-Advisor is paid by ISI, not Strategy.
International Strategy & Investment Group, Inc. (“ISI Group”), an affiliate of ISI, is the distributor for the Funds. Total Return, Managed Municipal and Strategy each pay ISI Group a distribution/shareholder service fee, pursuant to Rule 12b-1, that is calculated daily and paid monthly at the annual rate of 0.25% of average daily net assets. North American’s ISI Class A Shares and ISI Class C Shares pay ISI Group a distribution/shareholder service fee, pursuant to Rule 12b-1, that is calculated daily and paid monthly at the annual rates of 0.40% and 1.00% (which may include up to 0.25% for shareholder servicing fees for each class) of their average daily net assets, respectively.
During the year ended October 31, 2009, ISI Group earned commissions on sales of ISI Shares of Total Return, Managed Municipal and Strategy of $10,814, $24,001 and $3,760, respectively, and earned commissions of $17,776 on sales of ISI Class A Shares of North American. ISI Group retained $16,443 of contingent deferred sales charges on redemptions of ISI Class C Shares of North American during the year ended October 31, 2009.
Ultimus Fund Solutions, LLC (“Ultimus”) is the administrator and fund accountant for the Funds pursuant to the terms of a Mutual Fund Services Agreement. Ultimus supplies internal regulatory compliance services and executive and administrative services. Ultimus supervises the preparation of tax returns, reports to shareholders of the Funds, reports to and filings with the Securities and Exchange Commission (the “SEC”) and state securities commissions, and materials for meetings of the Board. Ultimus also calculates the net asset value per share of each Fund and provides information necessary to prepare the Funds’ financial statements and tax returns. For the performance of these services, the Funds pay Ultimus a fee at the annual rate of 0.10% of the combined average value of their daily net assets up to $500 million, 0.075% of such assets from $500 million to $1 billion, and 0.06% of such assets in excess of $1 billion, subject to an annual minimum fee of $500,000. This fee is allocated among the Funds based on the relative net assets of each Fund.
Ultimus also maintains the records of each shareholder’s account, answers shareholders’ inquiries concerning their accounts, processes purchases and redemptions of each Fund’s shares, acts as dividend and distribution disbursing agent and performs other shareholder service functions. For these services, Ultimus receives a monthly fee from each Fund at an annual rate of $20 for each direct account and $15 for certain
Notes to Financial Statements (continued)
accounts established through financial intermediaries; provided, however, that the minimum monthly fee is $1,000 with respect to each Fund. In addition, the Funds reimburse Ultimus for its out-of-pocket expenses including, but not limited to, postage and supplies.
EJV Financial Services, LLC (“EJV”) provides certain compliance services to the Funds. Edward J. Veilleux, Vice President and Chief Compliance Officer of the Funds, is also a principal of EJV Financial Services, LLC. The Funds pay EJV $18,750 quarterly for providing CCO services. In addition, the Funds reimburse EJV for any reasonable out-of-pocket expenses relating to these compliance services.
Note 3 – Federal Income Tax
The Funds may periodically make reclassifications among certain capital accounts as a result of differences in the characterization and allocation of certain income and capital gain distributions determined annually in accordance with Federal tax regulations, which may differ from GAAP. These book/tax differences may be either temporary or permanent in nature. To the extent they are permanent, they are charged or credited to paid-in-capital, undistributed net investment income or accumulated net realized gains, as appropriate, in the period that the differences arose. The reclassifications have no impact on the net assets or net asset value per share of the Funds.
The Funds determine their net investment income and capital gain distributions in accordance with income tax regulations, which may differ from GAAP.
During the year ended October 31, 2009, North American reduced accumulated net realized gains by $1,093,099 and increased undistributed net investment income. Strategy reclassified $9,640 of undistributed income to paid-in capital.
During the years ended October 31, 2009 and October 31, 2008, the tax character of distributions paid by each of the Funds was as follows:
| | | Ordinary Income | | | Tax-Exempt Income | | | Long-Term Capital Gains | | | Return of Capital | |
| | | October 31, 2009 | | | October 31, 2008 | | | October 31, 2009 | | | October 31, 2008 | | | October 31, 2009 | | | October 31, 2008 | | | October 31, 2009 | | | October 31, 2008 | |
| |
| Total Return | | $ | 4,133,512 | | | $ | 3,921,060 | | | $ | — | | | $ | — | | | $ | — | | | $ | 475,038 | | | $ | — | | | $ | — | |
| Managed Municipal | | | 17,145 | | | | 94,841 | | | | 2,661,596 | | | | 3,241,083 | | | | 124,276 | | | | 287,105 | | | | — | | | | — | |
| North American | | | 7,368,367 | | | | 5,382,558 | | | | — | | | | — | | | | 283,448 | | | | 1,269,300 | | | | — | | | | 649,421 | |
| Strategy | | | 604,469 | | | | 809,371 | | | | — | | | | — | | | | — | | | | 4,217,677 | | | | — | | | | — | |
The Funds recognize the tax benefits or expenses of uncertain tax positions only when the position is “more likely than not” to be sustained assuming examination by tax authorities. Management has reviewed each Fund’s tax positions taken on Federal income tax returns for all open tax years (tax years ended October 31, 2006 through October 31, 2009) and concluded that no provision for unrecognized tax benefits or expenses is required in these financial statements.
Notes to Financial Statements (continued)
As of October 31, 2009, the components of distributable earnings (accumulated deficit) on a tax basis were as follows:
| | | Total Return | | | Managed Municipal | | | North American | | | Strategy | |
| Undistributed ordinary income | | $ | 1,359,088 | | | $ | 109,168 | | | $ | 231,246 | | | $ | 10,950 | |
| Undistributed tax-exempt income | | | — | | | | 702 | | | | — | | | | — | |
| Undistributed long-term capital gains | | | 3,373,577 | | | | 344,913 | | | | 1,838,430 | | | | — | |
| Capital loss carryforwards | | | — | | | | — | | | | — | | | | (5,066,319 | ) |
| Net unrealized appreciation (depreciation) | | | 214,386 | | | | 3,471,956 | | | | (2,174,838 | ) | | | 617,061 | |
| Other temporary differences | | | (95,903 | ) | | | (108,983 | ) | | | (231,246 | ) | | | — | |
| Total | | $ | 4,851,148 | | | $ | 3,817,756 | | | $ | (336,408 | ) | | $ | (4,438,308 | ) |
As of October 31, 2009, Strategy had capital loss carryforwards of $5,066,319, of which $989,548 expires October 31, 2016 and $4,076,771 expires October 31, 2017. These capital loss carryforwards may be utilized in future years to offset net realized capital gains, if any, prior to distributing such gains to shareholders.
The difference between the federal income tax cost of portfolio investments and the financial statement cost for Strategy is due to certain timing differences in the recognition of capital gains or losses under income tax reporting regulations and GAAP. These “book/tax” differences are temporary in nature and are primarily due to the tax deferral of losses on wash sales.
Note 4 – Investment Transactions
The aggregate cost of purchases and proceeds from sales of investments, other than short-term obligations, for the year ended October 31, 2009 were as follows:
| | | Non-US Government Obligations | | | US Government Obligations | |
| | | Purchases | | | Sales | | | Purchases | | | Sales | |
| Total Return | | $ | — | | | $ | — | | | $ | 95,839,251 | | | $ | 122,112,119 | |
| Managed Municipal | | | 27,564,969 | | | | 7,806,800 | | | | — | | | | — | |
| North American | | | 27,610,121 | | | | 23,428,374 | | | | 129,403,559 | | | | 141,542,875 | |
| Strategy | | | 17,783,401 | | | | 17,169,537 | | | | 9,065,535 | | | | 11,834,895 | |
Note 5 – Market and Credit Risk
North American invests in Canadian and Mexican government securities. Investing in Canadian and Mexican government securities may have different risks than investing in U.S. government securities. An investment in Canada or Mexico may be affected by developments unique to those countries. These developments may not affect the U.S. economy or the prices of U.S. government securities in the same manner. In addition, the value of bonds issued by non-U.S. governments may be affected by adverse international political and economic developments that may not impact the value of U.S. government securities.
Notes to Financial Statements (continued)
Note 6 – Contractual Obligations
In the ordinary course of business, the Funds enter into contracts that contain a variety of indemnifications. Each Fund’s maximum exposure under these arrangements is unknown. However, the Funds have not had prior claims or losses pursuant to these indemnification provisions and believe the risk of loss thereunder to be remote.
Note 7 – Recent Accounting Pronouncement
In June 2009, the Financial Accounting Standards Board (“FASB”) issued Statement of Financial Accounting Standards No. 168, “The FASB Accounting Standards CodificationTM and the Hierarchy of Generally Accepted Accounting Principles – a replacement of FASB Statement 162” (“SFAS 168”). SFAS 168 replaces SFAS No. 162, “The Hierarchy of Generally Accepted Accounting Principles” and establishes the “FASB Accounting Standards CodificationTM” (the “Codification”) as the source of authoritative accounting principles recognized by FASB to be applied by nongovernmental entities in the preparation of financial statements in conformity with GAAP. All guidance contained in the Codification carries an equal level of authority. The Codification supersedes all existing non-SEC accounting and reporting standards. All other non-grandfathered non-SEC accounting literature not included in the Codification has become non-authoritative. SFAS 168 is effective for financial statements issued for interim and annual periods ending after September 15, 2009 and therefore, the Funds have adopted SFAS 168 with these financial statements. Management has evaluated this new pronouncement, and has determined that it does not have a material impact on the determination or reporting of these financial statements.
Note 8 – Subsequent Events
GAAP requires the Funds to recognize in the financial statements the effects of all subsequent events that provide additional evidence about conditions that existed as of the date of the Statements of Assets and Liabilities. For non-recognized subsequent events that must be disclosed to keep the financial statements from being misleading, the Funds are required to disclose the nature of the event as well as an estimate of its financial effect, or a statement that such an estimate cannot be made. In addition, GAAP requires the Funds to disclose the date through which subsequent events have been evaluated. Management has evaluated subsequent events through the issuance of these financial statements on December 29, 2009 and has noted no such events.
| Report of Independent Registered Public Accounting Firm |
To the Board of Directors and
Shareholders of Total Return U.S. Treasury Fund, Inc.,
Managed Municipal Fund, Inc., North American Government Bond Fund, Inc.,
and ISI Strategy Fund, Inc.
We have audited the accompanying statements of assets and liabilities of the Total Return U.S. Treasury Fund, Inc., Managed Municipal Fund, Inc., North American Government Bond Fund, Inc., and ISI Strategy Fund, Inc., including the schedules of investments, as of October 31, 2009, and the related statements of operations for the year then ended, the statements of changes in net assets for each of the two years in the period then ended, and the financial highlights for each of the four years in the period then ended. These financial statements and financial highlights are the responsibility of the Funds’ management. Our responsibility is to express an opinion on these financial statements and financial highlights based on our audits. The financial highlights for the year ended October 31, 2005 were audited by other auditors whose report dated December 23, 2005 expressed an unqualified opinion on such financial highlights.
We conducted our audits in accordance with the standards of the Public Company Accounting Oversight Board (United States). Those standards require that we plan and perform the audits to obtain reasonable assurance about whether the financial statements and financial highlights are free of material misstatement. An audit includes examining, on a test basis, evidence supporting the amounts and disclosures in the financial statements. Our procedures included confirmation of securities owned as of October 31, 2009 by correspondence with the custodian and brokers or by other appropriate auditing procedures where replies from brokers were not received. An audit also includes assessing the accounting principles used and significant estimates made by management, as well as evaluating the overall financial statement presentation. We believe that our audits provide a reasonable basis for our opinion.
In our opinion, the financial statements and financial highlights referred to above present fairly, in all material respects, the financial position of the Total Return U.S. Treasury Fund, Inc., Managed Municipal Fund, Inc., North American Government Bond Fund, Inc., and ISI Strategy Fund, Inc., as of October 31, 2009, the results of their operations for the year then ended, the changes in their net assets for each of the two years in the period then ended, and their financial highlights for each of the four years in the period then ended, in conformity with accounting principles generally accepted in the United States of America.
BRIGGS, BUNTING & DOUGHERTY, LLP
Philadelphia, Pennsylvania
December 29, 2009
| Fund Directors and Officers (Unaudited) |
| Name and Age | Length of Time Served | Business Experience During the Past Five Years | Other Directorships Held By Director |
| Independent Directors |
W. Murray Jacques (age 73) | since 2002 | President, WMJ Consulting, LLC (real estate investment management company). | None |
Louis E. Levy (age 77) | since 1994 | Retired Partner, KPMG Peat Marwick (retired 1990); Formerly a Director of Kimberly-Clark Corp. (personal consumer products) (retired 2001), Household International, Inc. (consumer finance) (retired 2004), and Scudder Group of Mutual Funds (retired 2005). | None |
Edward A. Kuczmarski (age 60) | since 2007 | Certified Public Accountant and Partner of Crowe Horwath LLP (accounting firm). | Director or Trustee of 12 funds in the Reich & Tang Fund Complex; Trustee of Empire Builder Tax Free Bond Fund. |
| Interested Director |
R. Alan Medaugh* (age 66) President and Director | President since 1991; Director since 2007 | President, International Strategy & Investment, Inc. (registered investment advisor) (1991 to present). Director, International Strategy & Investment Group, Inc. (registered broker-dealer) (1991 to present). | None |
| * | Mr. Medaugh is deemed to be an Interested Director, as defined in the Investment Company Act of 1940, because he is President of ISI and a Director of ISI Group. |
| Fund Directors and Officers (Unaudited) (continued) |
| Name and Age | Length of Time Served | Business Experience During the Past Five Years |
| Executive Officers |
Nancy Lazar (age 52) Vice President | since 1997 | Executive Vice President, Assistant Treasurer, and Secretary of International Strategy & Investment, Inc. (registered investment advisor) (1991 to present); Executive Vice President, Assistant Treasurer and Secretary of International Strategy & Investment Group, Inc. (registered broker-dealer) (1991 to present). |
Thomas D. Stevens* (age 60) Vice President | since 1997 | Chairman and President, Los Angeles Capital Management and Equity Research, Inc. (registered investment advisor) (March 2002 to present). |
Carrie L. Butler (age 42) Vice President | since 1991 | Managing Director, International Strategy & Investment, Inc. (registered investment advisor) (2000 to present). |
Edward J. Veilleux (age 66) Vice President and Chief Compliance Officer | since 1992 | President, EJV Financial Services, LLC (2002 to present); Officer of various investment companies for which EJV Financial Services provides consulting and compliance services. |
Stephen V. Killorin (age 56) Vice President | since 2002 | Executive Managing Director and Chief Financial Officer, International Strategy & Investment, Inc. (registered investment advisor) (December 2000 to present); Executive Managing Director and Chief Financial Officer, International Strategy & Investment Group, Inc. (registered broker-dealer) (December 2000 to present). |
Margaret M. Beeler (age 42) Vice President and Secretary | Vice President since 1996; Secretary since 2004 | Managing Director, International Strategy & Investment, Inc. (registered investment advisor) (July 2004 to present). |
Mark J. Seger (age 47) Treasurer | since 2008 | Managing Director, Ultimus Fund Solutions, LLC and Ultimus Fund Distributions, LLC. |
Heena Dhruv (age 33) Assistant Vice President | since 2005 | Managing Director, International Strategy & Investment, Inc. (registered investment advisor) (July 2005 to present), Associate Managing Director, International Strategy & Investment, Inc. (January 2003 to July 2005). |
| * | Thomas D. Stevens is an officer for only the ISI Strategy Fund. |
| Notice to Shareholders (Unaudited) |
Proxy Voting Policies and Procedures
A description of the policies and procedures that Strategy uses to determine how to vote proxies relating to securities held in Strategy’s portfolio is available, without charge and upon request, by calling (800) 955-7175. Information regarding how Strategy voted proxies relating to portfolio securities during the most recent twelve-month period ended June 30 is available, without charge, upon request, by calling (800) 955-7175 or on the SEC’s website at http://www.sec.gov.
Availability of Quarterly Portfolio Schedule
The Funds file their complete schedule of portfolio holdings with the SEC for the first and third quarters of each fiscal year on Form N-Q. Each Fund’s Form N-Q is available on the SEC’s website at http://www.sec.gov or may be reviewed and copied at the SEC’s Public Reference Room in Washington, DC. Information on the operation of the Public Reference Room may be obtained by calling 800-SEC-0330.
Privacy Notice for ISI Mutual Funds
Privacy Policy
The mutual funds in the ISI Fund Complex believe that your privacy is extremely important. We are firmly committed to protecting any personal or financial information you provide to us as well as information about your transactions with us, such as transaction amounts, account balance and account holdings (“Personal Information”). We use Personal Information only to develop and deliver products and services that you request and to fulfill any applicable legal and regulatory requirements. We do not disclose Personal Information about you or our former customers except to our affiliates and service providers. We require our employees, affiliates and service providers to maintain appropriate safeguards to ensure the security of your non-public information.
Limits of Use of Personal Information
We limit the use, collection and retention of customer information to what is necessary to provide personal financial services and related products. We have security practices and procedures in place to ensure the confidentiality and security of your Personal Information.
Accuracy of Personal Information
We strive to keep your personal and financial information accurate. If our records are incorrect or out-of-date, please notify us immediately by contacting the Service Center listed on your account statement.
Change to Our Policies
If you have any privacy or security questions, please contact us at 800-882-8585. We may, at our discretion, change this Privacy Policy at any time. If we make material changes to the policy, we will provide you with notice of these changes.
| Investment Advisory Agreement Approval (Unaudited) |
At a Board meeting held on September 16, 2009, the Board, including the Independent Directors voting separately, unanimously approved the continuance of the Investment Advisory Agreement between ISI and each of the Funds as well as the Sub-Advisory Agreement between ISI and the Sub-Advisor with respect to Strategy. In evaluating the Investment Advisory Agreements and the Sub-Advisory Agreement, the Board reviewed materials furnished by ISI and the Sub-Advisor. Specifically, the Board considered: (1) the nature, extent and quality of the services provided to the Funds by ISI and the Sub-Advisor, including information on the investment performance of the Funds; (2) the total expense ratio of each Fund compared to its relevant peer group; (3) the investment advisory fee schedule for each Fund; (4) the cost of the services provided and profitability to ISI and the Sub-Advisor with respect to their relationship with the Fund(s); (5) the extent to which economies of scale would be realized as each Fund grows and whether the advisory fees reflect these economies of scale for the benefit of shareholders of each Fund; and (6) other benefits received by ISI and the Sub-Advisor from their relationship with the Funds. In their deliberations, the Board did not identify any particular information that was all-important or controlling, and the Board attributed different weights to the various factors. In particular, the Board focused on the factors discussed below.
NATURE, EXTENT AND QUALITY OF SERVICES. The Directors reviewed information provided by ISI which included statistics on each Fund’s performance, the performance of its peers, its portfolio structure and purchase and sales activity. The Board noted that senior management of ISI provides the Board, on a quarterly basis, detailed information about its management approach with respect to each Fund, recent economic statistics and reports and its general economic outlook. With respect to Strategy, the Board noted that, under the Sub-Advisory Agreement, the Sub-Advisor manages the equity portfolio of Strategy and the Sub-Advisor had presented the Board with detailed information about its operations and investment process. The Board also considered the background and quality of the investment management team of ISI and the Sub-Advisor.
| | • | Total Return. The Board reviewed information comparing the Fund’s performance to the returns of relevant indices for selected periods ended July 31, 2009. The Board noted that the Fund’s return of 8.41% during the one-year period compared favorably to the 6.46% return by the Barclays U.S. Treasury Total Return Index and the 7.41% return of the Lipper General U.S. Treasury Funds Average. The Board compared the Fund’s returns with its benchmarks and peers over longer-term periods and concluded that the results achieved by Total Return demonstrate a consistent pattern of favorable performance. |
| | • | Managed Municipal. The Board reviewed the Fund’s performance for selected periods ended July 31, 2009 against the returns of the Barclays State General Obligation Index and the averages of its Lipper and Morningstar peers. The Board noted that the Fund’s benchmark index and peer groups do not provide a precise comparison since they include investment grade bonds of varying credit quality, while the Fund’s portfolio as of July 31, 2009 consisted exclusively of |
Investment Advisory Agreement Approval (Unaudited) (continued) |
municipal securities rated AAA (83%) or AA (17%). The Board was advised that the wide spreads between AAA and BBB-rated municipal bonds reflect doubt about the average issue’s budget discipline and revenue quality and ISI believes this skepticism is warranted. The Board noted that the Fund placed in the top 6% of the Lipper General Municipal Debt Fund category and in the top quartile of its Morningstar category for the one-year period ended July 31, 2009 and concluded that the Fund performed in line with expectations.
| | • | North American. The Board noted that the Fund’s investment objective is to provide high current income consistent with investments in fixed-income securities issued or guaranteed by governments in North America and they examined its performance against the performance of the blended North American Index for selected periods. The Board found that the Fund’s one-year return (4.05%) compared favorably with the 3.44% return by the blended North American Index and its returns for longer periods were in line with the Index results. The Board considered the positioning of the currency and the maturity mix in the Fund’s portfolio and was advised that the Fund’s low Mexican exposure and low duration helped it to achieve good performance results during the past year. The Board compared the Fund’s performance with the results of its Lipper and Morningstar averages and noted that the Lipper universe is limited to U.S. Government securities and the Morningstar universe is representative of the general bond market and they do not reflect a bias towards prudent investment in North American government bonds. |
| | • | Strategy. The Board discussed the means by which the Fund’s equity and bond holdings are allocated and noted that as of July 31, 2009, the Fund held approximately 85% of its portfolio in equities and 15% in bonds. The Board was advised that the Fund’s equity position is the highest since the Fund’s inception and the high equity weighting is predominately attributable to the increase in equity valuations, but reflects ISI’s conviction that the present yield advantage lies with stocks over Treasuries. The Board reviewed the performance of the equity section and the bond section of the Fund’s portfolio for selected periods ended July 31, 2009 and compared such performance with the performance of its blended 80% Wilshire 5000/20% Barclays Treasury Index. The Board found that the Fund performed slightly below the average of the blended Index during the one-year period and the period since its inception, but performed above average for the three-year period. The Board also reviewed information comparing the Fund’s relative performance against its peer groups for periods ended July 31, 2009. It found that the Fund fell below the average of the Lipper Flexible Portfolio and above the average of the Lipper Multi-Cap Core Funds during all of the reported periods. The Board further noted that the Fund placed in the top 20% of the Morningstar large blend universe during all of the reported periods. The Board concluded that the Fund performed in line with expectations. |
Investment Advisory Agreement Approval (Unaudited) (continued) |
The Board determined that ISI and the Sub-Advisor have demonstrated consistency in their investment approach and each provides an extensive array of ancillary services to the Funds in the areas of oversight and administration. Based upon the above information, the Board concluded that it was satisfied with the nature, extent and quality of services provided to the Funds by ISI and the Sub-Advisor.
INVESTMENT ADVISORY FEE SCHEDULES FOR EACH FUND. The Board considered the investment advisory fees paid by each Fund to ISI. The Board noted that the sub-advisory fee for Strategy is paid by ISI and not the Fund. The Board concluded that the fee schedules under the Investment Advisory Agreements provide fair compensation to ISI in light of the nature, extent and quality of the services being provided to the Funds and the performance of the Funds.
COSTS OF SERVICES PROVIDED AND PROFITABILITY. The Board reviewed the costs associated with ISI’s portfolio management, research and corporate governance and considered the profitability of ISI from the advisory and ancillary services provided to the Funds. The Board was advised by ISI of the methodology it used to assign its costs associated with the portfolio management, research and corporate governance services provided to the Funds. The Board was also provided with a report from the Sub-Advisor showing its profitability with respect to its management of Strategy and the methodology used by the Sub-Advisor to prepare its profitability analysis. The Board also was advised that lower revenues and higher expenses caused ISI to attain a considerably lower profit margin this year than during the past year. The Board considered that the profitability of ISI is vital towards retaining qualified investment professionals and administrative personnel necessary for the Funds’ portfolio management, compliance and operational processes. The Board concluded that the profitability of ISI derived from its relationship with the Funds was fair and reasonable.
EXPENSE RATIOS AND ECONOMIES OF SCALE. The Board discussed economy of scale considerations and the expense ratios of the Funds. The Board noted that the investment advisory fees for Managed Municipal, North American and Strategy do not contain breakpoints and considered the extent to which economies of scale would be realized as the Funds grow. The Board concluded that due to the declining asset levels in each of these Funds except North American, economy of scale considerations were not relevant at this time. The Board also reviewed information which compared each Fund’s expense ratio as of July 31, 2009 with the average of comparably managed funds and made the following determinations:
| | • | Total Return. The Board found that Total Return’s 0.80% expense ratio was below the 0.94% average of comparably managed funds. |
| | • | Managed Municipal. The Board found that Managed Municipal’s 0.97% expense ratio was slightly above the 0.96% average of comparably managed funds, but noted that its asset size ($93 million) is well below the size of the average municipal bond fund ($213 million). |
Investment Advisory Agreement Approval (Unaudited) (continued) |
| | • | North American. The Board found that the 1.15% expense ratio for North American’s Class A shares is above the 1.08% average for other government bond funds. The Board noted, however, that there are no other mutual funds that invest exclusively in North American bonds that can be used for comparative purposes at this time. |
| | • | Strategy. The Board found that Strategy’s expense ratio as of July 31, 2009 was 1.13%, which is below the 1.17% average for comparably managed funds. |
The Board concluded that the current advisory fees are reasonable in light of the services provided to the Funds.
OTHER BENEFITS REVIEWED. The Board considered the fact that ISI Group, an affiliate of ISI, serves as the distributor of the Funds. The Board reviewed the costs and profitability of ISI Group in rendering distribution services to each of the Funds and noted that ISI Group operates at a loss with respect to distribution services provided to the Funds. The Board also considered other benefits received by ISI from its relationship with the Funds. It noted that ISI benefits from the shared costs of its two primary lines of business, but that ISI’s profit margins are considerably higher for its institutional line of business than from its mutual fund business. The Board considered the benefits received by the Sub-Advisor from its relationship with Strategy and concluded that the Sub-Advisor’s profitability from its relationship with Strategy (including fall-out benefits) was fair and reasonable.
ent |
Louis E. Levy Chairman W. Murray Jacques Director Edward A. Kuczmarski Director R. Alan Medaugh President Director Nancy Lazar Vice President Carrie L. Butler Vice President | Edward J. Veilleux Vice President Chief Compliance Officer Thomas D. Stevens* Vice President Stephen V. Killorin Vice President Margaret M. Beeler Vice President Secretary Mark J. Seger Treasurer Edward S. Hyman Senior Economic Advisor * Thomas D. Stevens is an officer for only the ISI Strategy Fund. |
| | Investment Advisor |
| | ISI, Inc. 40 West 57th Street, 18th Floor New York, NY 10019 (800) 955-7175 |
| | Shareholder Servicing Agent |
| | Ultimus Fund Solutions, LLC P.O. Box 460707 Cincinnati, OH 45246-0707 |
| | Distributor |
| | ISI Group, Inc. 40 West 57th Street, 18th Floor New York, NY 10019 (800) 955-7175 |