N-CSR
UNITED STATES
SECURITIES AND EXCHANGE COMMISSION
Washington, D.C. 20549
FORM N-CSR
CERTIFIED SHAREHOLDER REPORT OF REGISTERED
MANAGEMENT INVESTMENT COMPANIES
Investment Company Act file number: 811-07322
The Integrity Funds
(Exact name of registrant as specified in charter)
1 Main Street North, Minot, ND |
| 58703 |
(Address of principal offices) |
| (Zip code) |
Brent Wheeler and/or Kevin Flagstad, PO Box 500, Minot, ND 58702
(Name and address of agent for service)
Registrant’s telephone number, including area code: 701-852-5292
Date of fiscal year end: December 31st
Date of reporting period: December 31, 2017
Item 1. REPORTS TO STOCKHOLDERS.

THE INTEGRITY FUNDS
Integrity Dividend Harvest Fund
Integrity Energized Dividend Fund
Integrity Growth & Income Fund
Integrity High Income Fund
Williston Basin/Mid-North America Stock Fund
Annual Report
December 31, 2017
|
|
Investment Adviser | Principal Underwriter |
Transfer Agent | Custodian |
Independent Registered Public Accounting Firm
| |
| |
*The Funds are distributed through Integrity Funds Distributor, LLC. Member FINRA | |
INTEGRITY DIVIDEND HARVEST FUND
DEAR SHAREHOLDERS:
Enclosed is the report of the operations for the Integrity Dividend Harvest Fund (the “Dividend Harvest Fund” or “Fund”) for the year ended December 31, 2017. The Fund’s portfolio and related financial statements are presented within for your review.
The S&P 500 Index (“S&P”) returned 6.07% in the first quarter of 2017. Overall, investors were optimistic in the quarter as they continued to digest the new administration’s pro-business rhetoric. The Consumer Confidence Index reached highs not seen since 2000 as consumers expressed much greater optimism regarding the short-term outlook for business, jobs and personal income prospects. As expected, the U.S. Federal Reserve (“Fed”) voted to raise interest rates for the first time in 2017 at its two-day Federal Open Market Committee (“FOMC”) March meeting. At a press conference following the decision, Fed Chairwoman Janet Yellen said, “Our decision to make another gradual reduction in the amount of policy accommodation reflects the economy’s continued progress toward the employment and price-stability objectives assigned to us by law.” Information technology was the best performing sector over the first quarter as computer hardware and semiconductor companies provided optimistic guidance. Energy was the worst performing sector. Energy equities fell along with oil prices as U.S. oil inventory numbers came in higher than expected.
The second quarter saw the S&P return 3.09%. Investors remained bullish in the quarter as they continued to see strength in the economy. The U.S. economy added an average of 194,000 jobs per month in the second quarter, compared to 166,000 per month in the first quarter and an average of 187,000 per month in 2016. Unemployment remained low while wage growth stayed positive yet modest. Earnings season wrapped up with S&P earnings per share growing 13.9% year-over-year on revenue growth of 7.7%. As expected, the FOMC voted to raise interest rates for the second time in 2017 at its June meeting. Healthcare was the best performing sector over the second quarter as it appeared less likely that Congress would be able to repeal any material aspects of the Affordable Care Act within a short time frame. Telecommunications was the worst performing sector amid fears of increased competition in the space from smaller players, particularly for mobile data plans.
The market was strong in the third quarter with the S&P returning 4.48%. July and August saw a majority of S&P companies report earnings. It was the second quarter in a row to show double-digit earnings growth. The S&P grew earnings approximately 10.1% on revenue growth of 5.1%, year-over-year. The U.S. Bureau of Labor Statistics reported that the unemployment rate dropped to 4.2% in September, its lowest rate since 2001. As expected, the FOMC voted to maintain the target range for the federal funds rate at its September meeting. The Fed continued to see strength in the labor market and increasing economic activity. Information technology was the best performing sector over the quarter as the sector reported a high level of earnings growth year-over-year. Consumer staples was the only sector with a negative return for the quarter as investors appeared to shun the space in favor of sectors with more growth such as information technology and energy.
The fourth quarter finished 2017 with the year’s strongest S&P return of 6.64%. The market was driven by a continuation of positive economic data. The companies comprising the S&P reported earnings that grew approximately 8.5% on revenue growth of 5.5%, year-over-year. Nearly 73% of these companies beat analyst expectations. The U.S. Bureau of Labor Statistics reported that the unemployment rate dropped to 4.1% in October, its lowest rate since 2000, and remained there throughout the quarter. As expected, the FOMC voted to increase the target range for the federal funds rate by 0.25% at its December meeting. The Fed noted strength in economic activity and maintained expectations for a median federal funds rate of 2.1% in 2018 and 2.7% in 2019. Consumer discretionary was the best performing sector over the quarter with discretionary giants like Amazon, Disney, McDonald’s and Home Depot all outperforming. While all sectors had a positive return for the quarter, utilities trailed, likely due to expectations of increasing interest rates.
The information technology sector performed best over the year with a return of 38.76% as earnings growth in the sector continued to surprise to the upside. The materials, consumer discretionary, financials, healthcare, and industrials sectors also had strong years with returns of more than 20%. Telecommunications and energy were the only sectors with a negative year, returning -1.20% and -0.94%, respectively. The large cap telecommunication companies were under pressure throughout the year from data plan competition. Energy equities lagged in performance even as oil rebounded in the second half, ending the year above $65.
The Fund’s total returns for Class A, C, and I shares were 11.10%*, 10.26%*, and 11.37%*, respectively, for the year ended December 31, 2017 while the S&P gained 21.83% and the Morningstar Large-Cap Value Category average was up 15.91%. In relation to the S&P, underperformance was primarily driven by sector allocation in accordance with the Fund strategy. Detracting from relative performance was an underweight allocation in information technology, selection in financials, selection in information technology, and an overweight allocation in energy. Contributing positively was selection in energy, industrials, and telecommunications.
The Fund seeks to maximize total return by emphasizing high current income with long term appreciation as a secondary objective, consistent with preservation of capital. The Portfolio Management Team (“Team”) considers dividend yield, dividend growth rate, earnings growth, price-to-earnings multiples, and balance sheet strength. The Team emphasizes dividend yield in selecting stocks for the Fund because the Team believes that, over time, dividend income can contribute significantly to total return and is a more consistent source of investment return than appreciation.
If you would like more frequent updates, please visit the Fund’s website at integrityvikingfunds.com for daily prices along with pertinent Fund information.
Sincerely,
The Portfolio Management Team
The views expressed are those of The Portfolio Management Team of Viking Fund Management. The views are subject to change at any time in response to changing circumstances in the market and are not intended to predict or guarantee the future performance of any individual security, market sector, the markets generally, or any of the funds in the Integrity Viking family of funds.
*Performance does not include applicable front-end or contingent deferred sales charges, which would have reduced the performance. The total annual fund operating expense ratio (before expense waivers and reimbursements and including acquired fund fees and expenses) as of the most recent fiscal year-end was 1.49%, 2.24%, and 1.24% for Class A, C, and I, respectively. The net annual fund operating expense ratio (after expense waivers and reimbursements and excluding acquired fund fees and expenses) as of the most recent fiscal year-end was 0.95%, 1.70%, and 0.70% for Class A, C, and I, respectively. The Fund’s investment adviser has contractually agreed to waive fees and reimburse expenses through April 30, 2018 so that total annual fund operating expenses after fee waivers and expense reimbursements (excluding taxes, brokerage fees, commissions, extraordinary and non-recurring expenses, and acquired fund fees and expenses) do not exceed 0.95%, 1.70%, and 0.70% for Class A, C, and I, respectively. This expense limitation agreement may only be terminated or modified prior to April 30, 2018 with the approval of the Fund’s Board of Trustees.
Performance data quoted above is historical. Past performance is no guarantee of future results. Current performance may be higher or lower than the performance data quoted. The principal value and investment return of an investment will fluctuate so that your shares, when redeemed, may be worth more or less than the original cost. You can obtain performance data current to the most recent month end (available within seven business days of the most recent month end) by calling 800-276-1262.
You should consider the Fund’s investment objectives, risks, charges, and expenses carefully before investing. For this and other important information, please obtain a Fund prospectus at no cost from your financial adviser and read it carefully before investing.
INTEGRITY DIVIDEND HARVEST FUND
PERFORMANCE (unaudited)
Comparison of change in value of a $10,000 investment
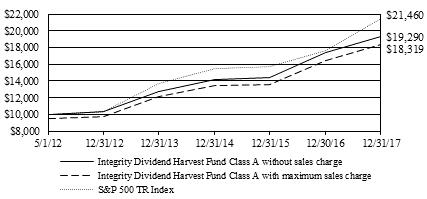
Average Annual Total Returns for the periods ended December 31, 2017
| 1 year | 3 year | 5 year | 10 year | Since Inception* |
Class A Without sales charge | 11.10% | 10.76% | 13.40% | N/A | 12.30% |
Class A With sales charge (5.00%) | 5.57% | 8.87% | 12.24% | N/A | 11.28% |
Class C Without CDSC | 10.26% | N/A | N/A | N/A | 12.40% |
Class C With CDSC (1.00%) | 9.26% | N/A | N/A | N/A | 12.40% |
Class I Without sales charge | 11.37% | N/A | N/A | N/A | 11.46% |
* May 1, 2012 for Class A; August 3, 2015 for Class C; August 1, 2016 for Class I | |||||
The total annual fund operating expense ratio (before expense waivers and reimbursements and including acquired fund fees and expenses) as of the most recent fiscal year-end was 1.49%, 2.24%, and 1.24% for Class A, C, and I, respectively. The net annual fund operating expense ratio (after expense waivers and reimbursements and excluding acquired fund fees and expenses) as of the most recent fiscal year-end was 0.95%, 1.70%, and 0.70% for Class A, C, and I, respectively. The Fund’s investment adviser has contractually agreed to waive fees and reimburse expenses through April 30, 2018 so that total annual fund operating expenses after fee waivers and expense reimbursements (excluding taxes, brokerage fees, commissions, extraordinary and non-recurring expenses, and acquired fund fees and expenses) do not exceed 0.95%, 1.70%, and 0.70% for Class A, C, and I, respectively. This expense limitation agreement may only be terminated or modified prior to April 30, 2018 with the approval of the Fund’s Board of Trustees.
Performance data quoted above is historical. Past performance is no guarantee of future results. Current performance may be higher or lower than the performance data quoted. The principal value and investment return of an investment will fluctuate so that your shares, when redeemed, may be worth more or less than the original cost. You can obtain performance data current to the most recent month end (available within seven business days of the most recent month end) by calling 800-276-1262.
The table and graph above do not reflect the deduction of taxes that a shareholder would pay on Fund distributions and redemptions of Fund shares. The graph comparing the Fund’s performance to a benchmark index provides you with a general sense of how the Fund performed. To put this information in context, it may be helpful to understand the special differences between the two. The Fund’s total return for the period shown appears with and without sales charges and includes Fund expenses and management fees. A securities index measures the performance of a theoretical portfolio. Unlike a fund, the index is unmanaged; there are no expenses that affect the results. In addition, few investors could purchase all of the securities to match the index. If they could, transaction costs and other expenses would be incurred. All Fund and benchmark returns include reinvested dividends.
INTEGRITY ENERGIZED DIVIDEND FUND
DEAR SHAREHOLDERS:
Enclosed is the report of the operations for the Integrity Energized Dividend Fund (the “Energized Dividend Fund” or “Fund”) for the year ended December 31, 2017. The Fund’s portfolio and related financial statements are presented within for your review.
The S&P 500 Index (“S&P”) returned 6.07% in the first quarter of 2017. Overall, investors were optimistic in the quarter as they continued to digest the new administration’s pro-business rhetoric. The Consumer Confidence Index reached highs not seen since 2000 as consumers expressed much greater optimism regarding the short-term outlook for business, jobs and personal income prospects. As expected, the U.S. Federal Reserve (“Fed”) voted to raise interest rates for the first time in 2017 at its two-day Federal Open Market Committee (“FOMC”) March meeting. At a press conference following the decision, Fed Chairwoman Janet Yellen said, “Our decision to make another gradual reduction in the amount of policy accommodation reflects the economy’s continued progress toward the employment and price-stability objectives assigned to us by law.” Information technology was the best performing sector over the first quarter as computer hardware and semiconductor companies provided optimistic guidance. Energy was the worst performing sector. Energy equities fell along with oil prices as U.S. oil inventory numbers came in higher than expected.
The second quarter saw the S&P return 3.09%. Investors remained bullish in the quarter as they continued to see strength in the economy. The U.S. economy added an average of 194,000 jobs per month in the second quarter, compared to 166,000 per month in the first quarter and an average of 187,000 per month in 2016. Unemployment remained low while wage growth stayed positive yet modest. Earnings season wrapped up with S&P earnings per share growing 13.9% year-over-year on revenue growth of 7.7%. As expected, the FOMC voted to raise interest rates for the second time in 2017 at its June meeting. Healthcare was the best performing sector over the second quarter as it appeared less likely that Congress would be able to repeal any material aspects of the Affordable Care Act within a short time frame. Telecommunications was the worst performing sector amid fears of increased competition in the space from smaller players, particularly for mobile data plans.
The market was strong in the third quarter with the S&P returning 4.48%. July and August saw a majority of S&P companies report earnings. It was the second quarter in a row to show double-digit earnings growth. The S&P grew earnings approximately 10.1% on revenue growth of 5.1%, year-over-year. The U.S. Bureau of Labor Statistics reported that the unemployment rate dropped to 4.2% in September, its lowest rate since 2001. As expected, the FOMC voted to maintain the target range for the federal funds rate at its September meeting. The Fed continued to see strength in the labor market and increasing economic activity. Information technology was the best performing sector over the quarter as the sector reported a high level of earnings growth year-over-year. Consumer staples was the only sector with a negative return for the quarter as investors appeared to shun the space in favor of sectors with more growth such as information technology and energy.
The fourth quarter finished 2017 with the year’s strongest S&P return of 6.64%. The market was driven by a continuation of positive economic data. The companies comprising the S&P reported earnings that grew approximately 8.5% on revenue growth of 5.5%, year-over-year. Nearly 73% of these companies beat analyst expectations. The U.S. Bureau of Labor Statistics reported that the unemployment rate dropped to 4.1% in October, its lowest rate since 2000, and remained there throughout the quarter. As expected, the FOMC voted to increase the target range for the federal funds rate by 0.25% at its December meeting. The Fed noted strength in economic activity and maintained expectations for a median federal funds rate of 2.1% in 2018 and 2.7% in 2019. Consumer discretionary was the best performing sector over the quarter with discretionary giants like Amazon, Disney, McDonald’s and Home Depot all outperforming. While all sectors had a positive return for the quarter, utilities trailed, likely due to expectations of increasing interest rates.
After a year of strong gains, the energy sector faced multiple headwinds during the 1Q2017. While global OECD inventories continued to fall, U.S. crude inventories remained stubbornly high. In addition, the rising U.S. rig count continued to concern investors as rising domestic production would further pressure crude oil prices. While most concerns surrounded the pace of U.S. production growth and OPEC’s production levels, there was clear evidence that global inventories began to fall. OPEC reduced their production quota to normalize global inventory levels, and while the strategy appeared to be working, it became apparent they would have to extend their production cut to reach their goal of normalized inventory levels.
The second quarter brought a continuation of an unpleasant period for oil prices. Sentiment within the energy sector turned further negative as crude prices and energy equities plummeted. We believe the drop in crude was driven by a technical breakdown with headlines adding fuel to the fire. Over the second quarter, there seemed to be a disconnect between market fundamentals and investor sentiment. From March through the end of the second quarter, U.S. crude inventories declined by 280,000 barrels per day, compared to a build of 150,000 barrels per day over the same period on a ten-year average. This counter seasonal draw implied a tightening oil market and demonstrated the positive effects of OPEC’s production cut. Investors, however, continued to speculate on rising U.S. production, OPEC production compliance, and the possibility of weakening global demand. An additional headwind for the energy sector over the second quarter was increased production from Libya and Nigeria (both countries are exempt from OPEC’s production cut). The two tumultuous countries produced 2.6 million barrels per day in June, over 400,000 barrels per day more than in the first quarter. This came as a surprise to many analysts and has offset some of OPEC’s production cut. While this has been a major headwind for crude prices, production from these two countries has been far from stable and highly susceptible to supply disruptions.
During the third quarter, macro fundamentals provided much needed support for crude oil. Strong global demand, a flat U.S. rig count, and slowing U.S. oil production growth all provided tailwinds for the commodity. For the third quarter, WTI crude oil traded up over 10%, breaking out of bear market territory by setting higher highs and higher lows. We believe a continuation of OPEC compliance, strong global demand, and slowing domestic activity will be supportive for crude. Additionally, increased turmoil in the Middle East could disrupt production and provide additional support for higher crude prices. Energy equities continued to lag crude oil over the third quarter which added to the disconnect between market fundamentals and investor sentiment towards energy equities. We believe the 3Q2017 recovery in crude oil and energy equities marks the beginning of a recovery for the beaten down sector. Improved fundamentals and efficiencies should provide shale focused energy companies with a sustained tailwind that should deliver solid returns over the coming years.
Over the fourth quarter, oil prices rallied on improved macro fundamentals. Global oil demand remained robust, OPEC’s production complied with the cartels stated production cap, and global inventories fell. While crude prices rallied by more than fifteen percent, the S&P 1500 Energy Composite gained only six percent. We expect energy equities will begin to close this performance gap in 2018 if crude prices stabilize. Additionally, we believe positive analyst revisions for energy equities will provide upside for the sector.
The Fund’s total returns for Class A, C, and I shares were 17.47%*, 16.64%*, and 17.74%*, respectively, for the year ended December 31, 2017 compared to returns of -4.84%, -2.05%, and 21.13% for the Morningstar Equity Energy Category, the S&P Composite 1500 Energy Index, and the S&P Composite 1500 Index, respectively. The energy sector lagged the broader market as the price of oil fell in the first half of the year before rebounding to multi-year highs by year-end. Energy equities did not move up as fast as the commodity in the second half. Key contributions to the Fund’s relative outperformance over the Morningstar category included stock selection within integrateds, refiners, and midstream, and an overweight allocation in refiners. Detracting from relative performance was an underweight allocation in diversified industrials and an overweight allocation in midstream.
If you would like more frequent updates, please visit the Fund’s website at integrityvikingfunds.com for daily prices along with pertinent Fund information.
Sincerely,
The Portfolio Management Team
The views expressed are those of The Portfolio Management Team of Viking Fund Management. The views are subject to change at any time in response to changing circumstances in the market and are not intended to predict or guarantee the future performance of any individual security, market sector, the markets generally, or any of the funds in the Integrity Viking family of funds.
*Performance does not include applicable front-end or contingent deferred sales charges, which would have reduced the performance. The total annual fund operating expense ratio (before expense waivers and reimbursements and including acquired fund fees and expenses) as of the most recent fiscal year-end was 4.49%, 5.17%, and 3.72% for Class A, C, and I, respectively. The net annual fund operating expense ratio (after expense waivers and reimbursements and excluding acquired fund fees and expenses) as of the most recent fiscal year-end was 0.35%, 1.10%, and 0.10% for Class A, C, and I, respectively. The Fund’s investment adviser has contractually agreed to waive fees and reimburse expenses through April 30, 2018 so that total annual fund operating expenses after fee waivers and expense reimbursements (excluding taxes, brokerage fees, commissions, extraordinary and non-recurring expenses, and acquired fund fees and expenses) do not exceed 1.05%, 1.80%, and 0.80% for Class A, C, and I, respectively. This expense limitation agreement may only be terminated or modified prior to April 30, 2018 with the approval of the Fund’s Board of Trustees.
Performance data quoted above is historical. Past performance is no guarantee of future results. Current performance may be higher or lower than the performance data quoted. The principal value and investment return of an investment will fluctuate so that your shares, when redeemed, may be worth more or less than the original cost. You can obtain performance data current to the most recent month end (available within seven business days of the most recent month end) by calling 800-276-1262.
You should consider the Fund’s investment objectives, risks, charges, and expenses carefully before investing. For this and other important information, please obtain a Fund prospectus at no cost from your financial adviser and read it carefully before investing.
INTEGRITY ENERGIZED DIVIDEND FUND
PERFORMANCE (unaudited)
Comparison of change in value of a $10,000 investment

Average Annual Total Returns for the periods ended December 31, 2017
| 1 year | 3 year | 5 year | 10 year | Since Inception* |
Class A Without sales charge | 17.47% | N/A | N/A | N/A | 22.95% |
Class A With sales charge (5.00%) | 11.58% | N/A | N/A | N/A | 19.18% |
Class C Without CDSC | 16.64% | N/A | N/A | N/A | 22.02% |
Class C With CDSC (1.00%) | 15.64% | N/A | N/A | N/A | 22.02% |
Class I Without sales charge | 17.74% | N/A | N/A | N/A | 27.56% |
* May 2, 2016 for Class A and C; August 1, 2016 for Class I | |||||
The total annual fund operating expense ratio (before expense waivers and reimbursements and including acquired fund fees and expenses) as of the most recent fiscal year-end was 4.49%, 5.17%, and 3.72% for Class A, C, and I, respectively. The net annual fund operating expense ratio (after expense waivers and reimbursements and excluding acquired fund fees and expenses) as of the most recent fiscal year-end was 0.35%, 1.10%, and 0.10% for Class A, C, and I, respectively. The Fund’s investment adviser has contractually agreed to waive fees and reimburse expenses through April 30, 2018 so that total annual fund operating expenses after fee waivers and expense reimbursements (excluding taxes, brokerage fees, commissions, extraordinary and non-recurring expenses, and acquired fund fees and expenses) do not exceed 1.05%, 1.80%, and 0.80% for Class A, C, and I, respectively. This expense limitation agreement may only be terminated or modified prior to April 30, 2018 with the approval of the Fund’s Board of Trustees.
Performance data quoted above is historical. Past performance is no guarantee of future results. Current performance may be higher or lower than the performance data quoted. The principal value and investment return of an investment will fluctuate so that your shares, when redeemed, may be worth more or less than the original cost. You can obtain performance data current to the most recent month end (available within seven business days of the most recent month end) by calling 800-276-1262.
The table and graph above do not reflect the deduction of taxes that a shareholder would pay on Fund distributions and redemptions of Fund shares. The graph comparing the Fund’s performance to a benchmark index provides you with a general sense of how the Fund performed. To put this information in context, it may be helpful to understand the special differences between the two. The Fund’s total return for the period shown appears with and without sales charges and includes Fund expenses and management fees. A securities index measures the performance of a theoretical portfolio. Unlike a fund, the index is unmanaged; there are no expenses that affect the results. In addition, few investors could purchase all of the securities to match the index. If they could, transaction costs and other expenses would be incurred. All Fund and benchmark returns include reinvested dividends.
INTEGRITY GROWTH & INCOME FUND
DEAR SHAREHOLDERS:
Enclosed is the report of the operations for the Integrity Growth & Income Fund (the “Growth & Income Fund” or “Fund”) for the year ended December 31, 2017. The Fund’s portfolio and related financial statements are presented within for your review.
The S&P 500 Index (“S&P”) returned 6.07% in the first quarter of 2017. Overall, investors were optimistic in the quarter as they continued to digest the new administration’s pro-business rhetoric. The Consumer Confidence Index reached highs not seen since 2000 as consumers expressed much greater optimism regarding the short-term outlook for business, jobs and personal income prospects. As expected, the U.S. Federal Reserve (“Fed”) voted to raise interest rates for the first time in 2017 at its two-day Federal Open Market Committee (“FOMC”) March meeting. At a press conference following the decision, Fed Chairwoman Janet Yellen said, “Our decision to make another gradual reduction in the amount of policy accommodation reflects the economy’s continued progress toward the employment and price-stability objectives assigned to us by law.” Information technology was the best performing sector over the first quarter as computer hardware and semiconductor companies provided optimistic guidance. Energy was the worst performing sector. Energy equities fell along with oil prices as U.S. oil inventory numbers came in higher than expected.
The second quarter saw the S&P return 3.09%. Investors remained bullish in the quarter as they continued to see strength in the economy. The U.S. economy added an average of 194,000 jobs per month in the second quarter, compared to 166,000 per month in the first quarter and an average of 187,000 per month in 2016. Unemployment remained low while wage growth stayed positive yet modest. Earnings season wrapped up with S&P earnings per share growing 13.9% year-over-year on revenue growth of 7.7%. As expected, the FOMC voted to raise interest rates for the second time in 2017 at its June meeting. Healthcare was the best performing sector over the second quarter as it appeared less likely that Congress would be able to repeal any material aspects of the Affordable Care Act within a short time frame. Telecommunications was the worst performing sector amid fears of increased competition in the space from smaller players, particularly for mobile data plans.
The market was strong in the third quarter with the S&P returning 4.48%. July and August saw a majority of S&P companies report earnings. It was the second quarter in a row to show double-digit earnings growth. The S&P grew earnings approximately 10.1% on revenue growth of 5.1%, year-over-year. The U.S. Bureau of Labor Statistics reported that the unemployment rate dropped to 4.2% in September, its lowest rate since 2001. As expected, the FOMC voted to maintain the target range for the federal funds rate at its September meeting. The Fed continued to see strength in the labor market and increasing economic activity. Information technology was the best performing sector over the quarter as the sector reported a high level of earnings growth year-over-year. Consumer staples was the only sector with a negative return for the quarter as investors appeared to shun the space in favor of sectors with more growth such as information technology and energy.
The fourth quarter finished 2017 with the year’s strongest S&P return of 6.64%. The market was driven by a continuation of positive economic data. The companies comprising the S&P reported earnings that grew approximately 8.5% on revenue growth of 5.5%, year-over-year. Nearly 73% of these companies beat analyst expectations. The U.S. Bureau of Labor Statistics reported that the unemployment rate dropped to 4.1% in October, its lowest rate since 2000, and remained there throughout the quarter. As expected, the FOMC voted to increase the target range for the federal funds rate by 0.25% at its December meeting. The Fed noted strength in economic activity and maintained expectations for a median federal funds rate of 2.1% in 2018 and 2.7% in 2019. Consumer discretionary was the best performing sector over the quarter with discretionary giants like Amazon, Disney, McDonald’s and Home Depot all outperforming. While all sectors had a positive return for the quarter, utilities trailed, likely due to expectations of increasing interest rates.
The information technology sector performed best over the year with a return of 38.76% as earnings growth in the sector continued to surprise to the upside. The materials, consumer discretionary, financials, healthcare, and industrials sectors also had strong years with returns of more than 20%. Telecommunications and energy were the only sectors with a negative year, returning -1.20% and -0.94%, respectively. The large cap telecommunication companies were under pressure throughout the year from data plan competition. Energy equities lagged in performance even as oil rebounded in the second half, ending the year above $65.
The Fund’s total returns for Class A, C, and I shares were 18.68%*, 17.79%*, and 18.96%*, respectively, for the year ended December 31, 2017 while the S&P gained 21.83% and the Morningstar Large-Cap Blend Category average returned 20.44%. In relation to the S&P, underperformance was driven by a mix of sector allocation and stock selection. Detracting from relative performance was selection in information technology, selection in consumer staples, and an underweight allocation in information technology. Contributing positively was selection in industrials, financials, and utilities.
The Fund is managed using a blended growth and income investment strategy. We seek to invest primarily in domestic common stocks, balancing investments between growth & dividend paying stocks, depending on where we see the best value. We also try to emphasize companies we believe offer attractive investment opportunities and operate their business with consideration of environmental, social, and governance (“ESG”) factors.
If you would like more frequent updates, please visit the Fund’s website at integrityvikingfunds.com for daily prices along with pertinent Fund information.
Sincerely,
The Portfolio Management Team
The views expressed are those of The Portfolio Management Team of Viking Fund Management. The views are subject to change at any time in response to changing circumstances in the market and are not intended to predict or guarantee the future performance of any individual security, market sector, the markets generally, or any of the funds in the Integrity Viking family of funds.
*Performance does not include applicable front-end or contingent deferred sales charges, which would have reduced the performance. The total annual fund operating expense ratio (before expense waivers and reimbursements and including acquired fund fees and expenses) as of the most recent fiscal year-end was 1.95%, 2.70%, and 1.69% for Class A, C, and I, respectively. The net annual fund operating expense ratio (after expense waivers and reimbursements and excluding acquired fund fees and expenses) as of the most recent fiscal year-end was 1.25%, 2.00%, and 1.00% for Class A, C, and I, respectively. The Fund’s investment adviser has contractually agreed to waive fees and reimburse expenses through April 30, 2018 so that total annual fund operating expenses after fee waivers and expense reimbursements (excluding taxes, brokerage fees, commissions, extraordinary and non-recurring expenses, and acquired fund fees and expenses) do not exceed 1.25%, 2.00%, and 1.00% for Class A, C, and I, respectively. This expense limitation agreement may only be terminated or modified prior to April 30, 2018 with the approval of the Fund’s Board of Trustees.
Performance data quoted above is historical. Past performance is no guarantee of future results. Current performance may be higher or lower than the performance data quoted. The principal value and investment return of an investment will fluctuate so that your shares, when redeemed, may be worth more or less than the original cost. You can obtain performance data current to the most recent month end (available within seven business days of the most recent month end) by calling 800-276-1262.
You should consider the Fund’s investment objectives, risks, charges, and expenses carefully before investing. For this and other important information, please obtain a Fund prospectus at no cost from your financial adviser and read it carefully before investing.
INTEGRITY GROWTH & INCOME FUND
PERFORMANCE (unaudited)
Comparison of change in value of a $10,000 investment
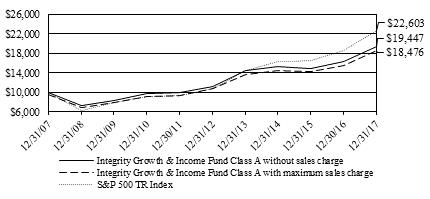
Average Annual Total Returns for the periods ended December 31, 2017
| 1 year | 3 year | 5 year | 10 year | Since Inception* |
Class A Without sales charge | 18.68% | 8.46% | 11.56% | 6.88% | 8.69% |
Class A With sales charge (5.00%) | 12.74% | 6.62% | 10.42% | 6.33% | 8.45% |
Class C Without CDSC | 17.79% | N/A | N/A | N/A | 7.60% |
Class C With CDSC (1.00%) | 16.79% | N/A | N/A | N/A | 7.60% |
Class I Without sales charge | 18.96% | N/A | N/A | N/A | 15.49% |
* January 3, 1995 for Class A; August 3, 2015 for Class C; August 1, 2016 for Class I | |||||
The total annual fund operating expense ratio (before expense waivers and reimbursements and including acquired fund fees and expenses) as of the most recent fiscal year-end was 1.95%, 2.70%, and 1.69% for Class A, C, and I, respectively. The net annual fund operating expense ratio (after expense waivers and reimbursements and excluding acquired fund fees and expenses) as of the most recent fiscal year-end was 1.25%, 2.00%, and 1.00% for Class A, C, and I, respectively. The Fund’s investment adviser has contractually agreed to waive fees and reimburse expenses through April 30, 2018 so that total annual fund operating expenses after fee waivers and expense reimbursements (excluding taxes, brokerage fees, commissions, extraordinary and non-recurring expenses, and acquired fund fees and expenses) do not exceed 1.25%, 2.00%, and 1.00% for Class A, C, and I, respectively. This expense limitation agreement may only be terminated or modified prior to April 30, 2018 with the approval of the Fund’s Board of Trustees.
Performance data quoted above is historical. Past performance is no guarantee of future results. Current performance may be higher or lower than the performance data quoted. The principal value and investment return of an investment will fluctuate so that your shares, when redeemed, may be worth more or less than the original cost. You can obtain performance data current to the most recent month end (available within seven business days of the most recent month end) by calling 800-276-1262.
The table and graph above do not reflect the deduction of taxes that a shareholder would pay on Fund distributions and redemptions of Fund shares. The graph comparing the Fund’s performance to a benchmark index provides you with a general sense of how the Fund performed. To put this information in context, it may be helpful to understand the special differences between the two. The Fund’s total return for the period shown appears with and without sales charges and includes Fund expenses and management fees. A securities index measures the performance of a theoretical portfolio. Unlike a fund, the index is unmanaged; there are no expenses that affect the results. In addition, few investors could purchase all of the securities to match the index. If they could, transaction costs and other expenses would be incurred. All Fund and benchmark returns include reinvested dividends. The results prior to August 1, 2009 were achieved while the Fund was managed by a different investment adviser. The current investment adviser may produce different investment results than those achieved by the previous investment adviser.
INTEGRITY HIGH INCOME FUND
DEAR SHAREHOLDERS:
Enclosed is the report of the operations for the Integrity High Income Fund (the “High Income Fund” or “Fund”) for the year ended December 31, 2017. The Fund’s portfolio and related financial statements are presented within for your review.
Market Environment
The high yield market total return for 2017 was 7.48% (as measured by the BofA Merrill Lynch US High Yield Master II Constrained Index). Despite seemingly constant geopolitical concerns, commodity price fluctuations, post-election uncertainty in the U.S., and central bank policy changes globally, improving fundamentals more often than not won out in the end, as each quarter of the year generated positive total returns. Synchronized, global economic growth improved throughout the year, and in the U.S. in particular, a higher level of optimism, less regulation and fewer global headwinds help drive above-trend growth. Fundamentals continued to strengthen throughout the year, culminating with the passage of a pro-growth tax reform bill.
Relative to the five-year Treasury, high yield generated over 675 basis points (bps) of excess return and outperformed emerging markets bonds (EMCB), 6.87%; high-grade credit (C0A0), 6.48%; U.S. Aggregate (D0A0), 3.63%; and the aforementioned five-year Treasuries (GA05), 0.72%. High-yield spreads decreased to 373 bps, 66 bps tighter for the 12-month period. For the same period, yields dropped from 6.17% at December 31, 2016, to 5.84% at December 31, 2017.
Lower quality led the way on the year, with CCCs returning 9.26%; Bs, 6.86%; and BBs, 7.25%. All sectors posted positive returns in 2017 with transportation (2.75%), utilities (11.60%) and banking (10.84%) leading as the best-performing sectors and retail (1.48%), consumer goods (4.60%) and media (5.20%) trailing as the worst-performing sectors.
High-yield bond new issuance totaled $328.1 billion for 2017, up 15% from last year. Refinancing purposes were the still-dominant use of proceeds, accounting for 63% of the activity this year. U.S. high-yield mutual funds reported $20.3 billion in outflows this year versus $9.6 billion of inflows in 2016.
The trailing 12-month default rate declined in 2017. On a par-weighted basis, as of December 31, the trailing 12-month default rate was 1.27%, down 230 bps from 3.57% at the beginning of the year.
Portfolio Performance and Positioning
For the year, the Integrity High Income Fund returned 6.78%*, 5.98%*, and 7.19%* for Class A, Class C and Class I Shares, respectively, compared to its benchmark, the Barclays Capital U.S. Corporate High Yield Index, which returned 7.50%, and the Morningstar High Yield category annual return of 6.47%. The Fund underperformed its benchmark due to security selection within the wirelines, retailers and consumer product sectors. Specifically, relative weightings in Windstream Holdings, Argos Holdings, Remington Outdoor Company, DISH Network Corporation and T.I.M. SpA hindered results this year. Alternatively, contributions from security selection in the gaming, other-REITs (real estate investment trusts) and pharmaceutical sectors enhanced annual performance. The largest contributors came from relative weightings in Caesars Entertainment Corporation, VICI Properties, Valeant Pharmaceuticals, Intelsat and Kestrel Acquisition Corporation.
Compared to the benchmark at year-end, the Fund was overweight in cable satellite, technology and other-REITs due to our view of the relative value opportunities within those sectors. The Fund remains underweight in metals and mining, home construction and oil field services because we have not found these sectors attractive due to challenging fundamental outlooks or rich valuations. Relative to the benchmark at year-end, the Fund’s yield, spread and duration were all lower than those of the benchmark.
Market Outlook
Synchronized global growth remains supportive of fundamentals. Corporate balance sheets remain sound as improved cash flow and modest spending plans keep leverage stable. We expect a continuation of improved earnings growth and solid cash flow. We believe broader-market high-yield spreads are fair to slightly attractive relative to current and expected defaults, which are expected to remain between 1-2% in the near term. We anticipate episodes of volatility to persist as central bank policies develop and policy direction further evolves. We also expect increased merger-and-acquisition activity, which should be a net positive for high yield issuers. The range-bound rate environment has been supportive of fixed income assets, including high yield. Technicals have been mixed due to retail outflows, foreign demand and low net issuance. While gross issuance volume has been high, given that greater than 63% of all new issues this year have been refinancings, net issuance reflects a multi-year low. High-yield spreads have the ability for modest spread tightening in either a gradual rise or stable rate environment. Yields are approaching historical lows and leave less room to absorb rate or credit volatility. We believe our current portfolio positioning and our fundamental research, bottom-up oriented style should allow us to take advantage of market opportunities.
If you would like more frequent updates, please visit the Fund’s website at integrityvikingfunds.com for daily prices along with pertinent Fund information.
Sincerely,
Robert L. Cook | Thomas G. Hauser |
The views expressed are those of Robert L. Cook, Senior Portfolio Manager and Managing Director, and Thomas G. Hauser, Vice President, J.P. Morgan Investment Management, Inc. (“JPMIM”), sub-adviser to the Fund. The views are subject to change at any time in response to changing circumstances in the market and are not intended to predict or guarantee the future performance of any individual security, market sector, the markets generally, or any of the funds in the Integrity Viking family of funds.
*Performance does not include applicable front-end or contingent deferred sales charges, which would have reduced the performance. The total annual fund operating expense ratio (before expense waivers and reimbursements and including acquired fund fees and expenses) as of the most recent fiscal year-end was 1.71%, 2.46%, and 1.46% for Class A, C, and I, respectively. The net annual fund operating expense ratio (after expense waivers and reimbursements and excluding acquired fund fees and expenses) as of the most recent fiscal year-end was 1.13%, 1.88%, and 0.87% for Class A, C, and I, respectively. The Fund’s investment adviser has contractually agreed to waive fees and reimburse expenses through April 30, 2019 so that total annual fund operating expenses after fee waivers and expense reimbursements (excluding taxes, brokerage fees, commissions, extraordinary and non-recurring expenses, and acquired fund fees and expenses) do not exceed 0.89%, 1.64%, and 0.64% for Class A, C, and I, respectively. This expense limitation agreement may only be terminated or modified prior to April 30, 2019 with the approval of the Fund’s Board of Trustees.
Performance data quoted above is historical. Past performance is no guarantee of future results. Current performance may be higher or lower than the performance data quoted. The principal value and investment return of an investment will fluctuate so that your shares, when redeemed, may be worth more or less than the original cost. You can obtain performance data current to the most recent month end (available within seven business days of the most recent month end) by calling 800-276-1262.
You should consider the Fund’s investment objectives, risks, charges, and expenses carefully before investing. For this and other important information, please obtain a Fund prospectus at no cost from your financial adviser and read it carefully before investing.
INTEGRITY HIGH INCOME FUND
PERFORMANCE (unaudited)
Comparison of change in value of a $10,000 investment
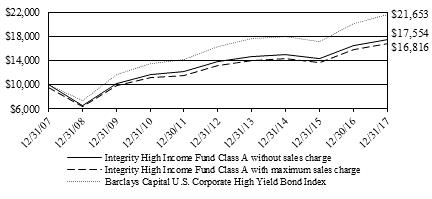
Average Annual Total Returns for the periods ended December 31, 2017
| 1 year | 3 year | 5 year | 10 year | Since Inception* |
Class A Without sales charge | 6.78% | 5.45% | 4.89% | 5.79% | 5.44% |
Class A With sales charge (4.25%) | 2.25% | 3.95% | 3.99% | 5.34% | 5.11% |
Class C Without CDSC | 5.98% | 4.67% | 4.11% | 5.01% | 4.63% |
Class C With CDSC (1.00%) | 4.98% | 4.67% | 4.11% | 5.01% | 4.63% |
Class I Without sales charge | 7.19% | NA | N/A | N/A | 7.94% |
* April 30, 2004 for Class A and C; August 1, 2016 for Class I | |||||
The total annual fund operating expense ratio (before expense waivers and reimbursements and including acquired fund fees and expenses) as of the most recent fiscal year-end was 1.71%, 2.46%, and 1.46% for Class A, C, and I, respectively. The net annual fund operating expense ratio (after expense waivers and reimbursements and excluding acquired fund fees and expenses) as of the most recent fiscal year-end was 1.13%, 1.88%, and 0.87% for Class A, C, and I, respectively. The Fund’s investment adviser has contractually agreed to waive fees and reimburse expenses through April 30, 2019 so that total annual fund operating expenses after fee waivers and expense reimbursements (excluding taxes, brokerage fees, commissions, extraordinary and non-recurring expenses, and acquired fund fees and expenses) do not exceed 0.89%, 1.64%, and 0.64% for Class A, C, and I, respectively. This expense limitation agreement may only be terminated or modified prior to April 30, 2019 with the approval of the Fund’s Board of Trustees.
Performance data quoted above is historical. Past performance is no guarantee of future results. Current performance may be higher or lower than the performance data quoted. The principal value and investment return of an investment will fluctuate so that your shares, when redeemed, may be worth more or less than the original cost. You can obtain performance data current to the most recent month end (available within seven business days of the most recent month end) by calling 800-276-1262.
The table and graph above do not reflect the deduction of taxes that a shareholder would pay on Fund distributions and redemptions of Fund shares. The graph comparing the Fund’s performance to a benchmark index provides you with a general sense of how the Fund performed. To put this information in context, it may be helpful to understand the special differences between the two. The Fund’s total return for the period shown appears with and without sales charges and includes Fund expenses and management fees. A securities index measures the performance of a theoretical portfolio. Unlike a fund, the index is unmanaged; there are no expenses that affect the results. In addition, few investors could purchase all of the securities to match the index. If they could, transaction costs and other expenses would be incurred. All Fund and benchmark returns include reinvested dividends. The results prior to August 1, 2009 were achieved while the Fund was managed by a different investment adviser. The current investment adviser may produce different investment results than those achieved by the previous investment adviser.
WILLISTON BASIN/MID-NORTH AMERICA STOCK FUND
DEAR SHAREHOLDERS:
Enclosed is the report of the operations for the Williston Basin/Mid-North America Stock Fund (the “WB/MNA Stock Fund” or “Fund”) for the year ended December 31, 2017. The Fund’s portfolio and related financial statements are presented within for your review.
The S&P 500 Index (“S&P”) returned 6.07% in the first quarter of 2017. Overall, investors were optimistic in the quarter as they continued to digest the new administration’s pro-business rhetoric. The Consumer Confidence Index reached highs not seen since 2000 as consumers expressed much greater optimism regarding the short-term outlook for business, jobs and personal income prospects. As expected, the U.S. Federal Reserve (“Fed”) voted to raise interest rates for the first time in 2017 at its two-day Federal Open Market Committee (“FOMC”) March meeting. At a press conference following the decision, Fed Chairwoman Janet Yellen said, “Our decision to make another gradual reduction in the amount of policy accommodation reflects the economy’s continued progress toward the employment and price-stability objectives assigned to us by law.” Information technology was the best performing sector over the first quarter as computer hardware and semiconductor companies provided optimistic guidance. Energy was the worst performing sector. Energy equities fell along with oil prices as U.S. oil inventory numbers came in higher than expected.
The second quarter saw the S&P return 3.09%. Investors remained bullish in the quarter as they continued to see strength in the economy. The U.S. economy added an average of 194,000 jobs per month in the second quarter, compared to 166,000 per month in the first quarter and an average of 187,000 per month in 2016. Unemployment remained low while wage growth stayed positive yet modest. Earnings season wrapped up with S&P earnings per share growing 13.9% year-over-year on revenue growth of 7.7%. As expected, the FOMC voted to raise interest rates for the second time in 2017 at its June meeting. Healthcare was the best performing sector over the second quarter as it appeared less likely that Congress would be able to repeal any material aspects of the Affordable Care Act within a short time frame. Telecommunications was the worst performing sector amid fears of increased competition in the space from smaller players, particularly for mobile data plans.
The market was strong in the third quarter with the S&P returning 4.48%. July and August saw a majority of S&P companies report earnings. It was the second quarter in a row to show double-digit earnings growth. The S&P grew earnings approximately 10.1% on revenue growth of 5.1%, year-over-year. The U.S. Bureau of Labor Statistics reported that the unemployment rate dropped to 4.2% in September, its lowest rate since 2001. As expected, the FOMC voted to maintain the target range for the federal funds rate at its September meeting. The Fed continued to see strength in the labor market and increasing economic activity. Information technology was the best performing sector over the quarter as the sector reported a high level of earnings growth year-over-year. Consumer staples was the only sector with a negative return for the quarter as investors appeared to shun the space in favor of sectors with more growth such as information technology and energy.
The fourth quarter finished 2017 with the year’s strongest S&P return of 6.64%. The market was driven by a continuation of positive economic data. The companies comprising the S&P reported earnings that grew approximately 8.5% on revenue growth of 5.5%, year-over-year. Nearly 73% of these companies beat analyst expectations. The U.S. Bureau of Labor Statistics reported that the unemployment rate dropped to 4.1% in October, its lowest rate since 2000, and remained there throughout the quarter. As expected, the FOMC voted to increase the target range for the federal funds rate by 0.25% at its December meeting. The Fed noted strength in economic activity and maintained expectations for a median federal funds rate of 2.1% in 2018 and 2.7% in 2019. Consumer discretionary was the best performing sector over the quarter with discretionary giants like Amazon, Disney, McDonald’s and Home Depot all outperforming. While all sectors had a positive return for the quarter, utilities trailed, likely due to expectations of increasing interest rates.
After a year of strong gains, the energy sector faced multiple headwinds during the 1Q2017. While global OECD inventories continued to fall, U.S. crude inventories remained stubbornly high. In addition, the rising U.S. rig count continued to concern investors as rising domestic production would further pressure crude oil prices. While most concerns surrounded the pace of U.S. production growth and OPEC’s production levels, there was clear evidence that global inventories began to fall. OPEC reduced their production quota to normalize global inventory levels, and while the strategy appeared to be working, it became apparent they would have to extend their production cut to reach their goal of normalized inventory levels.
The second quarter brought a continuation of an unpleasant period for oil prices. Sentiment within the energy sector turned further negative as crude prices and energy equities plummeted. We believe the drop in crude was driven by a technical breakdown with headlines adding fuel to the fire. Over the second quarter, there seemed to be a disconnect between market fundamentals and investor sentiment. From March through the end of the second quarter, U.S. crude inventories declined by 280,000 barrels per day, compared to a build of 150,000 barrels per day over the same period on a ten-year average. This counter seasonal draw implied a tightening oil market and demonstrated the positive effects of OPEC’s production cut. Investors, however, continued to speculate on rising U.S. production, OPEC production compliance, and the possibility of weakening global demand. An additional headwind for the energy sector over the second quarter was increased production from Libya and Nigeria (both countries are exempt from OPEC’s production cut). The two tumultuous countries produced 2.6 million barrels per day in June, over 400,000 barrels per day more than in the first quarter. This came as a surprise to many analysts and has offset some of OPEC’s production cut. While this has been a major headwind for crude prices, production from these two countries has been far from stable and highly susceptible to supply disruptions.
During the third quarter, macro fundamentals provided much needed support for crude oil. Strong global demand, a flat U.S. rig count, and slowing U.S. oil production growth all provided tailwinds for the commodity. For the third quarter, WTI crude oil traded up over 10%, breaking out of bear market territory by setting higher highs and higher lows. We believe a continuation of OPEC compliance, strong global demand, and slowing domestic activity will be supportive for crude. Additionally, increased turmoil in the Middle East could disrupt production and provide additional support for higher crude prices. Energy equities continued to lag crude oil over the third quarter which added to the disconnect between market fundamentals and investor sentiment towards energy equities. We believe the 3Q2017 recovery in crude oil and energy equities marks the beginning of a recovery for the beaten down sector. Improved fundamentals and efficiencies should provide shale focused energy companies with a sustained tailwind that should deliver solid returns over the coming years.
Over the fourth quarter, oil prices rallied on improved macro fundamentals. Global oil demand remained robust, OPEC’s production complied with the cartels stated production cap, and global inventories fell. While crude prices rallied by more than fifteen percent, the S&P 1500 Energy Composite gained only six percent. We expect energy equities will begin to close this performance gap in 2018 if crude prices stabilize. Additionally, we believe positive analyst revisions for energy equities will provide upside for the sector.
In 2018 we should see a continuation of the strong performance seen in the 2H2017 from the energy sector as tailwinds continue to build. The International Energy Agency (“IEA”) has forecasted global oil demand for 2018 to climb by 1.3 million barrels of oil per day. We believe there is upside to this number as the IEA has underestimated global demand for several consecutive years and global GDP, a statistic that has been strongly correlated to oil consumption, has been on the rise. On the supply side, growth will be driven by increasing shale production, but at a level that demand can absorb. OPEC extended their production quota to the end of 2018 in an effort to normalize global oil inventories. OPEC also stated they plan to slowly bring production back online in order to avoid a supply shock that could send crude prices lower. Adding to our conviction that OPEC compliance will remain high is the planned IPO of Saudi Aramco. Oil prices would likely need to trade in the mid-sixties in order to fetch the $100 billion for the 5% stake Saudi Aramco has planned to IPO. The impressive macro fundamental backdrop for the energy sector appears poised to provide energy equities with strong returns in 2018.
The Fund’s total returns for Class A, C, and I shares were -7.48%*, -7.81%*, and -6.92%*, respectively, for the year ended December 31, 2017 compared to returns of -4.84%, -2.05%, and 21.13% for the Morningstar Equity Energy Category, the S&P Composite 1500 Energy Index, and the S&P Composite 1500 Index, respectively. Detracting from the Fund’s performance relative to its Morningstar category was an underweight allocation in diversified industrials, an underweight allocation in integrateds, and an overweight allocation in midstream. Aiding relative performance was stock selection in refiners and midstream.
If you would like more frequent updates, please visit the Fund’s website at integrityvikingfunds.com for daily prices along with pertinent Fund information.
Sincerely,
The Portfolio Management Team
The views expressed are those of The Portfolio Management Team of Viking Fund Management, LLC (“Viking Fund Management”, “VFM”, or the “Adviser”). The views are subject to change at any time in response to changing circumstances in the market and are not intended to predict or guarantee the future performance of any individual security, market sector, the markets generally, or any of the funds in the Integrity Viking family of funds.
*Performance does not include applicable front-end or contingent deferred sales charges, which would have reduced the performance. The total annual fund operating expense ratio (before expense waivers and reimbursements and including acquired fund fees and expenses) as of the most recent fiscal year-end was 1.47%, 1.97%, and 0.97% for Class A, C, and I, respectively. The net annual fund operating expense ratio (after expense waivers and reimbursements and excluding acquired fund fees and expenses) as of the most recent fiscal year-end was 1.47%, 1.97%, and 0.97% for Class A, C, and I, respectively. The Fund’s investment adviser has contractually agreed to waive fees and reimburse expenses through April 30, 2018 so that total annual fund operating expenses after fee waivers and expense reimbursements (excluding taxes, brokerage fees, commissions, extraordinary and non-recurring expenses, and acquired fund fees and expenses) do not exceed 1.50%, 2.00%, and 1.00% for Class A, C, and I, respectively. This expense limitation agreement may only be terminated or modified prior to April 30, 2018 with the approval of the Fund’s Board of Trustees.
Performance data quoted above is historical. Past performance is no guarantee of future results. Current performance may be higher or lower than the performance data quoted. The principal value and investment return of an investment will fluctuate so that your shares, when redeemed, may be worth more or less than the original cost. You can obtain performance data current to the most recent month end (available within seven business days of the most recent month end) by calling 800-276-1262.
You should consider the Fund’s investment objectives, risks, charges, and expenses carefully before investing. For this and other important information, please obtain a Fund prospectus at no cost from your financial adviser and read it carefully before investing.
WILLISTON BASIN/MID-NORTH AMERICA STOCK FUND
PERFORMANCE (unaudited)
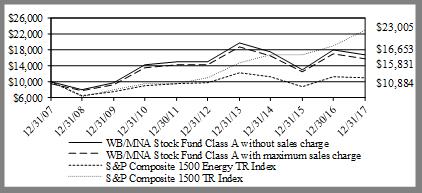 | |
Comparison of change in value of a $10,000 investment
Average Annual Total Returns for the periods ended December 31, 2017
| 1 year | 3 year | 5 year | 10 year | Since Inception* |
Class A Without sales charge | -7.48% | -1.55% | 2.21% | 5.23% | 6.62% |
Class A With sales charge (5.00%) | -12.08% | -3.24% | 1.15% | 4.70% | 6.33% |
Class C Without CDSC | -7.81% | -2.02% | N/A | N/A | -7.10% |
Class C With CDSC (1.00%) | -8.73% | -2.02% | N/A | N/A | -7.10% |
Class I Without sales charge | -6.92% | N/A | N/A | N/A | 11.73% |
* April 5, 1999 for Class A; May 1, 2014 for Class C; August 1, 2016 for Class I | |||||
The total annual fund operating expense ratio (before expense waivers and reimbursements and including acquired fund fees and expenses) as of the most recent fiscal year-end was 1.47%, 1.97%, and 0.97% for Class A, C, and I, respectively. The net annual fund operating expense ratio (after expense waivers and reimbursements and excluding acquired fund fees and expenses) as of the most recent fiscal year-end was 1.47%, 1.97%, and 0.97% for Class A, C, and I, respectively. The Fund’s investment adviser has contractually agreed to waive fees and reimburse expenses through April 30, 2018 so that total annual fund operating expenses after fee waivers and expense reimbursements (excluding taxes, brokerage fees, commissions, extraordinary and non-recurring expenses, and acquired fund fees and expenses) do not exceed 1.50%, 2.00%, and 1.00% for Class A, C, and I, respectively. This expense limitation agreement may only be terminated or modified prior to April 30, 2018 with the approval of the Fund’s Board of Trustees.
Performance data quoted above is historical. Past performance is no guarantee of future results. Current performance may be higher or lower than the performance data quoted. The principal value and investment return of an investment will fluctuate so that your shares, when redeemed, may be worth more or less than the original cost. You can obtain performance data current to the most recent month end (available within seven business days of the most recent month end) by calling 800-276-1262.
The table and graph above do not reflect the deduction of taxes that a shareholder would pay on Fund distributions and redemptions of Fund shares. The graph comparing the Fund’s performance to a benchmark index provides you with a general sense of how the Fund performed. To put this information in context, it may be helpful to understand the special differences between the two. The Fund’s total return for the period shown appears with and without sales charges and includes Fund expenses and management fees. A securities index measures the performance of a theoretical portfolio. Unlike a fund, the index is unmanaged; there are no expenses that affect the results. In addition, few investors could purchase all of the securities to match the index. If they could, transaction costs and other expenses would be incurred. All Fund and benchmark returns include reinvested dividends. The results prior to August 1, 2009 were achieved while the Fund was managed by a different investment adviser. The current investment adviser may produce different investment results than those achieved by the previous investment adviser. The Fund’s performance prior to November 10, 2008 was achieved under the previous investment strategy, which may have produced different results than the current investment strategy.
INTEGRITY DIVIDEND HARVEST FUND
PORTFOLIO MARKET SECTORS December 31, 2017
Consumer Staples | 25.0% |
Energy | 12.2% |
Financials | 11.1% |
Utilities | 10.8% |
Telecommunication Services | 10.6% |
Health Care | 8.0% |
Industrials | 7.2% |
Consumer Discretionary | 7.0% |
Information Technology | 5.6% |
Cash Equivalents and Other | 1.8% |
Materials | 0.7% |
100.0% |
Market sectors are breakdowns of the Fund’s portfolio holdings into specific investment classes.
These percentages are based on net assets.
SCHEDULE OF INVESTMENTS December 31, 2017
Fair | ||||
Shares |
| Value | ||
COMMON STOCKS (98.2%) | ||||
| ||||
Consumer Discretionary (7.0%) | ||||
Genuine Parts Co | 30,000 | $ | 2,850,300 | |
McDonald's Corp | 28,000 | 4,819,360 | ||
Target Corp | 18,000 | 1,174,500 | ||
VF Corp | 22,000 |
| 1,628,000 | |
| 10,472,160 | |||
Consumer Staples (25.0%) | ||||
Altria Group Inc | 94,000 | 6,712,540 | ||
Coca-Cola Co/The | 137,000 | 6,285,560 | ||
General Mills Inc | 33,000 | 1,956,570 | ||
Kimberly-Clark Corp | 63,000 | 7,601,580 | ||
Kraft Heinz Co/The | 12,000 | 933,120 | ||
PepsiCo Inc | 35,000 | 4,197,200 | ||
Philip Morris International Inc | 29,000 | 3,063,850 | ||
Procter & Gamble Co/The | 73,000 |
| 6,707,240 | |
| 37,457,660 | |||
Energy (12.2%) | ||||
BP PLC - ADR | 48,000 | 2,017,440 | ||
Chevron Corp | 21,000 | 2,628,990 | ||
Enbridge Inc | 47,000 | 1,838,170 | ||
Exxon Mobil Corp | 55,000 | 4,600,200 | ||
Occidental Petroleum Corp | 44,000 | 3,241,040 | ||
ONEOK Inc | 43,000 | 2,298,350 | ||
Royal Dutch Shell PLC - ADR | 26,000 |
| 1,775,540 | |
| 18,399,730 | |||
Financials (11.1%) | ||||
CME Group Inc | 28,000 | 4,089,400 | ||
Mercury General Corp | 66,000 | 3,527,040 | ||
Old Republic International Corp | 136,000 | 2,907,680 | ||
People's United Financial Inc | 178,000 | 3,328,600 | ||
United Bankshares Inc/WV | 29,000 | 1,007,750 | ||
Wells Fargo & Co | 31,000 |
| 1,880,770 | |
| 16,741,240 | |||
Health Care (8.0%) | ||||
Johnson & Johnson | 36,000 | 5,029,920 | ||
Merck & Co Inc | 52,000 | 2,926,040 | ||
Pfizer Inc | 111,000 |
| 4,020,420 | |
| 11,976,380 | |||
Industrials (7.2%) | ||||
Emerson Electric Co | 40,000 | 2,787,600 | ||
Lockheed Martin Corp | 18,000 | 5,778,900 | ||
3M Co | 9,500 |
| 2,236,015 | |
| 10,802,515 | |||
Information Technology (5.6%) | ||||
Cisco Systems Inc | 50,000 | 1,915,000 | ||
International Business Machines Corp | 21,000 | 3,221,820 | ||
QUALCOMM Inc | 50,000 |
| 3,201,000 | |
| 8,337,820 | |||
Materials (0.7%) | ||||
Sonoco Products Co | 20,000 |
| 1,062,800 | |
| ||||
Telecommunication Services (10.6%) | ||||
AT&T Inc | 210,000 | 8,164,800 | ||
Verizon Communications Inc | 125,000 | 6,616,250 | ||
Vodafone Group PLC | 36,000 |
| 1,148,400 | |
| 15,929,450 | |||
Utilities (10.8%) | ||||
Consolidated Edison Inc | 23,000 | 1,953,850 | ||
Dominion Energy Inc | 55,000 | 4,458,300 | ||
Duke Energy Corp | 41,000 | 3,448,510 | ||
Southern Co/The | 90,000 | 4,328,100 | ||
WEC Energy Group Inc | 30,000 |
| 1,992,900 | |
| 16,181,660 | |||
| ||||
TOTAL COMMON STOCKS (COST: $131,841,551) | $ | 147,361,415 | ||
| ||||
OTHER ASSETS LESS LIABILITES (1.8%) | $ | 2,712,203 | ||
| ||||
NET ASSETS (100.0%) | $ | 150,073,618 | ||
|
|
|
|
|
ADR - American Depositary Receipt
| ||||
| ||||
The accompanying notes are an integral part of these financial statements. | ||||
INTEGRITY ENERGIZED DIVIDEND FUND
PORTFOLIO MARKET SECTORS December 31, 2017
Energy | 74.9% |
Cash Equivalents and Other | 8.2% |
Materials | 5.6% |
Utilities | 4.8% |
Industrials | 3.3% |
Financials | 3.2% |
100.0% |
Market sectors are breakdowns of the Fund’s portfolio holdings into specific investment classes.
These percentages are based on net assets.
SCHEDULE OF INVESTMENTS December 31, 2017
Fair | ||||
Shares | Value | |||
COMMON STOCKS (91.8%) | ||||
| ||||
Energy (74.9%) | ||||
Bp Plc ADR | 7,400 | $ | 311,022 | |
Royal Dutch ADR | 7,500 | 512,175 | ||
Statoil Asa ADR | 1,300 | 27,846 | ||
Total Sa Sp ADR | 3,600 | 199,008 | ||
Altagas Ltd | 8,700 | 198,086 | ||
Chevron Corp | 1,650 | 206,563 | ||
Enbridge Inc | 5,500 | 215,105 | ||
Exxon Mobil Corp | 700 | 58,548 | ||
Gibson Energy | 14,000 | 202,482 | ||
Helmerich & Payn | 2,500 | 161,600 | ||
Hollyfrontier Co | 800 | 40,976 | ||
Kinder Morgan In | 5,000 | 90,350 | ||
Occidental Pete | 4,600 | 338,836 | ||
Oneok Inc | 3,900 | 208,455 | ||
Pbf Energy Inc A | 2,000 | 70,900 | ||
Pembina Pipeline | 6,000 | 217,080 | ||
Schlumberger Ltd | 1,700 | 114,563 | ||
Semgroup Corp A | 18,000 | 543,600 | ||
Transcanada Corp | 3,200 | 155,648 | ||
Valero Energy | 1,000 | 91,910 | ||
Williams Cos Inc | 6,300 | 192,087 | ||
| 4,156,840 | |||
Financials (3.2%) | ||||
Cme Group Inc | 1,200 | $ | 175,260 | |
| ||||
Industrials (3.3%) | ||||
Covanta Holding | 11,000 |
| 185,900 | |
| ||||
Materials (5.6%) | ||||
CF Industries Holdings | 2,000 | 85,080 | ||
Compass Minerals | 2,100 | 151,725 | ||
Lyondellbasell A | 700 | 77,224 | ||
| 314,029 | |||
Utilities (4.8%) | ||||
Entergy Corp | 1,000 | 81,390 | ||
Southern Co | 3,800 | 182,742 | ||
| 264,132 | |||
| ||||
TOTAL COMMON STOCKS (COST: $4,669,144) | $ | 5,096,161 | ||
| ||||
OTHER ASSETS LESS LIABILITIES (8.2%) |
| 454,418 | ||
| ||||
NET ASSETS (100.0%) | $ | 5,550,579 | ||
| ||||
ADR - American Depositary Receipt | ||||
| ||||
| ||||
The accompanying notes are an integral part of these financial statements. | ||||
INTEGRITY GROWTH & INCOME FUND
PORTFOLIO MARKET SECTORS December 31, 2017
Information Technology | 22.0% |
Financials | 17.5% |
Health Care | 15.3% |
Industrials | 13.4% |
Consumer Discretionary | 11.2% |
Consumer Staples | 8.9% |
Utilities | 3.8% |
Telecommunication Services | 3.7% |
Materials | 2.1% |
Cash Equivalents and Other | 2.1% |
100.0% |
Market sectors are breakdowns of the Fund’s portfolio holdings into specific investment classes.
These percentages are based on net assets.
SCHEDULE OF INVESTMENTS December 31, 2017
Fair | ||||
Shares |
| Value | ||
COMMON STOCKS (97.9%) | ||||
| ||||
Consumer Discretionary (11.2%) | ||||
Best Buy Co Inc | 10,000 | $ | 684,700 | |
Walt Disney Co/The | 4,000 | 430,040 | ||
Home Depot Inc/The | 3,500 | 663,355 | ||
Lowe's Cos Inc | 7,200 | 669,168 | ||
Starbucks Corp | 20,000 | 1,148,600 | ||
Target Corp | 6,000 | 391,500 | ||
| 3,987,363 | |||
Consumer Staples (8.9%) | ||||
Campbell Soup Co | 19,000 | 914,090 | ||
Kimberly-Clark Corp | 6,500 | 784,290 | ||
PepsiCo Inc | 8,500 | 1,019,320 | ||
Procter & Gamble Co/The | 5,000 |
| 459,400 | |
| 3,177,100 | |||
Financials (17.5%) | ||||
Bank of America Corp | 23,000 | 678,960 | ||
BlackRock Inc | 3,500 | 1,797,985 | ||
JPMorgan Chase & Co | 16,000 | 1,711,040 | ||
PNC Financial Services Group Inc/The | 3,500 | 505,015 | ||
S&P Global Inc | 3,000 | 508,200 | ||
US Bancorp | 19,000 |
| 1,018,020 | |
| 6,219,220 | |||
Health Care (15.3%) | ||||
Becton Dickinson and Co | 3,500 | 749,210 | ||
*Celgene Corp | 6,000 | 626,160 | ||
Johnson & Johnson | 5,000 | 698,600 | ||
Pfizer Inc | 33,000 | 1,195,260 | ||
Thermo Fisher Scientific Inc | 8,500 | 1,613,980 | ||
UnitedHealth Group Inc | 2,500 |
| 551,150 | |
| 5,434,360 | |||
Industrials (13.4%) | ||||
Caterpillar Inc | 5,500 | 866,690 | ||
Covanta Holding Corp | 47,000 | 794,300 | ||
Deere & Co | 4,500 | 704,295 | ||
FedEx Corp | 1,500 | 374,310 | ||
3M Co | 3,700 | 870,869 | ||
Waste Management Inc | 7,000 | 604,100 | ||
Ingersoll-Rand PLC | 6,000 |
| 535,140 | |
| 4,749,704 | |||
Information Technology (22.0%) | ||||
*Advanced Micro Devices Inc | 58,000 | 596,240 | ||
*Alphabet Inc | 1,300 | 1,369,420 | ||
Apple Inc | 2,000 | 338,460 | ||
*Facebook Inc | 2,000 | 352,920 | ||
HP Inc | 28,000 | 588,280 | ||
Intel Corp | 24,000 | 1,107,840 | ||
International Business Machines Corp | 4,000 | 613,680 | ||
NVIDIA Corp | 2,500 | 483,750 | ||
QUALCOMM Inc | 12,000 | 768,240 | ||
Visa Inc | 14,000 |
| 1,596,280 | |
| 7,815,110 | |||
Materials (2.1%) | ||||
Air Products & Chemicals Inc | 2,500 | 410,200 | ||
Praxair Inc | 2,200 |
| 340,296 | |
| 750,496 | |||
Telecommunication Services (3.7%) | ||||
AT&T Inc | 20,000 | 777,600 | ||
Verizon Communications Inc | 10,000 |
| 529,300 | |
| 1,306,900 | |||
Utilities (3.8%) | ||||
ALLETE Inc | 9,500 | 706,420 | ||
Exelon Corp | 16,000 |
| 630,560 | |
| 1,336,980 | |||
| ||||
TOTAL COMMON STOCKS (COST: $25,858,401) | $ | 34,777,233 | ||
| ||||
OTHER ASSETS AND LIABILITES (2.1%) | $ | 738,521 | ||
| ||||
NET ASSETS (100.0%) | $ | 35,515,754 | ||
| ||||
* Non-income producing | ||||
| ||||
| ||||
The accompanying notes are an integral part of these financial statements. | ||||
INTEGRITY HIGH INCOME FUND
PORTFOLIO MARKET SECTORS December 31, 2017
Consumer Discretionary | 27.0% |
Energy | 10.6% |
Health Care | 10.4% |
Telecommunication Services | 10.1% |
Industrials | 9.8% |
Information Technology | 9.3% |
Cash Equivalents and Other | 6.9% |
Materials | 5.9% |
Financials | 5.2% |
Consumer Staples | 2.2% |
Real Estate | 1.5% |
Utilities | 1.1% |
100.0% |
Market sectors are breakdowns of the Fund’s portfolio holdings into specific investment classes.
These percentages are based on net assets.
SCHEDULE OF INVESTMENTS December 31, 2017
Principal | Fair | |||
Amount |
| Value | ||
CORPORATE BONDS (90.6%) | ||||
| ||||
Consumer Discretionary (25.3%) | ||||
AMC Networks Inc 5.000% 04/01/2024 | $ | 80,000 | $ | 81,000 |
*AMC Entertainment Inc 5.750% 06/15/2025 | 95,000 | 93,931 | ||
AMC Entertainment Holdings Inc 5.875% 11/15/2026 | 15,000 | 14,775 | ||
American Axle & Manufacturing Inc 6.625% 10/15/2022 | 80,000 | 83,000 | ||
Boyd Gaming Corp 6.875% 05/15/2023 | 30,000 | 31,800 | ||
Cinemark USA Inc 4.875% 06/01/2023 | 85,000 | 86,062 | ||
iHeartCommunications Inc 9.000% 03/01/2021 | 135,000 | 96,525 | ||
Clear Channel Worldwide Holdings Inc 7.625% 03/15/2020 | 50,000 | 48,937 | ||
Clear Channel Worldwide Holdings Inc 7.625% 03/15/2020 | 165,000 | 161,700 | ||
Clear Channel Worldwide Holdings Inc 6.500% 11/15/2022 | 95,000 | 95,712 | ||
*Clear Channel Worldwide Holdings Inc 6.500% 11/15/2022 | 380,000 | 385,700 | ||
*Dana Inc 6.000% 09/15/2023 | 150,000 | 156,375 | ||
Dana Inc 5.500% 12/15/2024 | 15,000 | 15,844 | ||
DISH Network Corp 3.375% 08/15/2026 | 50,000 | 54,406 | ||
*DISH DBS Corp 5.875% 07/15/2022 | 190,000 | 190,950 | ||
DISH DBS Corp 5.000% 03/15/2023 | 260,000 | 245,700 | ||
DISH DBS Corp 5.875% 11/15/2024 | 255,000 | 248,305 | ||
DISH DBS Corp 7.750% 07/01/2026 | 30,000 | 31,537 | ||
TEGNA Inc 6.375% 10/15/2023 | 15,000 | 15,712 | ||
General Motors Co 4.875% 10/02/2023 | 135,000 | 146,093 | ||
Goodyear Tire & Rubber Co/The 5.125% 11/15/2023 | 35,000 | 36,519 | ||
Goodyear Tire & Rubber Co/The 5.000% 05/31/2026 | 15,000 | 15,466 | ||
Hilton Domestic Operating Co Inc 4.250% 09/01/2024 | 10,000 | 10,100 | ||
Hilton Worldwide Finance LLC / Hilton Worldwide Finance Corp 4.625% 04/01/2025 | 25,000 | 25,688 | ||
Hilton Worldwide Finance LLC / Hilton Worldwide Finance Corp 4.875% 04/01/2027 | 10,000 | 10,462 | ||
Hughes Satellite Systems Corp 6.625% 08/01/2026 | 10,000 | 10,475 | ||
iHeartCommunications Inc 10.625% 03/15/2023 | 45,000 | 31,725 | ||
Interval Acquisition Corp 5.625% 04/15/2023 | 70,000 | 72,450 | ||
L Brands Inc 6.750% 07/01/2036 | 50,000 | 50,000 | ||
Lear Corp 5.250% 01/15/2025 | 65,000 | 69,397 | ||
*MGM Resorts International 7.750% 03/15/2022 | 215,000 | 245,100 | ||
MGM Resorts International 6.750% 10/01/2020 | 30,000 | 32,400 | ||
*MGM Resorts International 5.250% 03/31/2020 | 30,000 | 31,050 | ||
MGM Resorts International 6.000% 03/15/2023 | 140,000 | 151,200 | ||
MGM Resorts International 4.625% 09/01/2026 | 10,000 | 10,100 | ||
MGM Growth Properties Operating Partnership LP / MGP Finance Co Issuer Inc 4.500% 09/01/2026 | 15,000 | 14,924 | ||
MGM Growth Properties Operating Partnership LP / MGP Finance Co Issuer Inc 5.625% 05/01/2024 | 20,000 | 21,300 | ||
JC Penney Corp Inc 6.375% 10/15/2036 | 55,000 | 32,725 | ||
Quebecor Media Inc 5.750% 01/15/2023 | 205,000 | 217,300 | ||
RHP Hotel Properties LP / RHP Finance Corp 5.000% 04/15/2021 | 160,000 | 162,400 | ||
Regal Entertainment Group 5.750% 06/15/2023 | 10,000 | 10,338 | ||
Regal Entertainment Group 5.750% 03/15/2022 | 55,000 | 56,718 | ||
Service Corp International/US 7.500% 04/01/2027 | 135,000 | 162,675 | ||
Service Corp International/US 5.375% 05/15/2024 | 15,000 | 15,806 | ||
Tempur Sealy International Inc 5.625% 10/15/2023 | 70,000 | 72,800 | ||
Tempur Sealy International Inc 5.500% 06/15/2026 | 40,000 | 41,008 | ||
Tenneco Inc 5.000% 07/15/2026 | 5,000 | 5,125 | ||
VICI Properties 1 LLC / VICI FC Inc 8.000% 10/15/2023 | 90,649 | 101,282 | ||
VICI Properties 1 LLC / VICI FC Inc 4.867% 10/15/2022 | 25,275 | 25,275 | ||
Vista Outdoor Inc 5.875% 10/01/2023 | 125,000 | 120,000 | ||
Zayo Group LLC / Zayo Capital Inc 6.375% 05/15/2025 | 50,000 | 52,875 | ||
Zayo Group LLC / Zayo Capital Inc 6.000% 04/01/2023 | 85,000 | 88,532 | ||
(1) Neiman Marcus Group LTD LLC - 144A 8.750% (9.500%) 10/15/2021 | 83,800 | 44,816 | ||
Altice Luxembourg SA - 144A 7.750% 05/15/2022 | 200,000 | 197,000 | ||
American Axle & Manufacturing Inc - 144A 6.250% 04/01/2025 | 50,000 | 52,625 | ||
American Axle & Manufacturing Inc - 144A 6.500% 04/01/2027 | 95,000 | 100,581 | ||
Arch Merger Sub Inc - 144A 8.500% 09/15/2025 | 125,000 | 115,625 | ||
Alpine Finance Merger Sub LLC - 144A 6.875% 08/01/2025 | 25,000 | 25,813 | ||
CBS Radio Inc - 144A 7.250% 11/01/2024 | 25,000 | 26,359 | ||
CCO Holdings LLC / CCO Holdings Capital Corp - 144A 5.125% 05/01/2023 | 25,000 | 25,500 | ||
CCO Holdings LLC / CCO Holdings Capital Corp - 144A 5.375% 05/01/2025 | 40,000 | 41,213 | ||
CCO Holdings LLC / CCO Holdings Capital Corp - 144A 5.750% 02/15/2026 | 100,000 | 103,875 | ||
CCO Holdings LLC / CCO Holdings Capital Corp - 144A 5.875% 04/01/2024 | 405,000 | 422,213 | ||
CCO Holdings LLC / CCO Holdings Capital Corp - 144A 5.500% 05/01/2026 | 80,000 | 82,000 | ||
CCO Holdings LLC / CCO Holdings Capital Corp - 144A 5.000% 02/01/2028 | 100,000 | 97,250 | ||
Claire's Stores Inc - 144A 9.000% 03/15/2019 | 100,000 | 65,250 | ||
Constellation Merger Sub Inc - 144A 8.500% 09/15/2025 | 55,000 | 53,625 | ||
Cooper- 144A Standard Automotive Inc - 5.625% 11/15/2026 | 60,000 | 61,950 | ||
Dana Financing Luxembourg Sarl - 144A 6.500% 06/01/2026 | 45,000 | 48,769 | ||
Delphi Jersey Holdings PLC - 144A 5.000% 10/01/2025 | 45,000 | 45,563 | ||
TEGNA Inc - 144A 4.875% 09/15/2021 | 15,000 | 15,300 | ||
TEGNA Inc - 144A 5.500% 09/15/2024 | 50,000 | 52,438 | ||
Gates Global LLC / Gates Global Co - 144A 6.000% 07/15/2022 | 90,000 | 92,025 | ||
HD Supply Inc - 144A 5.750% 04/15/2024 | 55,000 | 58,438 | ||
Hanesbrands Inc - 144A 4.625% 05/15/2024 | 30,000 | 30,600 | ||
Hilton Grand Vacations Borrower LLC/Hilton Grand Vacations Borrower Inc - 144A 6.125% 12/01/2024 | 15,000 | 16,388 | ||
International Game Technology PLC - 144A 6.500% 02/15/2025 | 200,000 | 223,500 | ||
Jack Ohio Finance LLC / Jack Ohio Finance 1 Corp - 144A 6.750% 11/15/2021 | 95,000 | 99,987 | ||
Live Nation Entertainment Inc - 144A 4.875% 11/01/2024 | 10,000 | 10,250 | ||
LTF Merger Sub Inc - 144A 8.500% 06/15/2023 | 80,000 | 84,700 | ||
MGM Growth Properties Operating Partnership LP / MGP Finance Co- 144A Issuer Inc - 4.500% 01/15/2028 | 10,000 | 9,800 | ||
Neiman Marcus Group LTD LLC - 144A 8.000% 10/15/2021 | 40,000 | 23,008 | ||
Mattel Inc - 144A 6.750% 12/31/2025 | 80,000 | 81,076 | ||
Midcontinent Communications / Midcontinent Finance Corp - 144A 6.875% 08/15/2023 | 70,000 | 74,288 | ||
Netflix Inc 4.875% 04/15/2028 | 65,000 | 63,700 | ||
Nexstar Broadcasting Inc - 144A 6.125% 02/15/2022 | 15,000 | 15,525 | ||
Nielsen Finance LLC / Nielsen Finance Co - 144A 5.000% 04/15/2022 |
| 135,000 | 138,880 | |
SFR Group SA - 144A 7.375% 05/01/2026 | 200,000 | 205,250 | ||
TI Group Automotive Systems LLC - 144A 8.750% 07/15/2023 | 47,000 | 50,408 | ||
PetSmart Inc - 144A 5.875% 06/01/2025 | 65,000 | 49,888 | ||
PetSmart Inc - 144A 8.875% 06/01/2025 | 50,000 | 30,125 | ||
RSI Home Products Inc - 144A 6.500% 03/15/2023 | 150,000 | 157,125 | ||
Sabre GLBL Inc - 144A 5.375% 04/15/2023 | 65,000 | 66,950 | ||
Sabre GLBL Inc - 144A 5.250% 11/15/2023 | 40,000 | 40,912 | ||
Scientific Games International Inc - 144A 7.000% 01/01/2022 | 85,000 | 89,568 | ||
Sirius XM Radio Inc - 144A 6.000% 07/15/2024 | 120,000 | 126,900 | ||
Sirius XM Radio Inc - 144A 5.375% 04/15/2025 | 150,000 | 156,188 | ||
Sirius XM Radio Inc - 144A 5.375% 07/15/2026 | 40,000 | 41,450 | ||
Sirius XM Radio Inc - 144A 5.000% 08/01/2027 | 10,000 | 10,025 | ||
Six Flags Entertainment Corp - 144A 4.875% 07/31/2024 | 20,000 | 20,300 | ||
Time Inc 7.500% 10/15/2025 | 45,000 | 53,100 | ||
Videotron Ltd - 144A 5.375% 06/15/2024 | 35,000 | 37,713 | ||
Videotron Ltd / Videotron Ltee - 144A 5.125% 04/15/2027 | 30,000 | 31,350 | ||
Wynn Las Vegas LLC / Wynn Las Vegas Capital Corp - 144A 5.500% 03/01/2025 | 120,000 | 123,600 | ||
| 8,278,061 | |||
Consumer Staples (2.2%) | ||||
Albertsons Cos LLC / Safeway Inc / New Albertson's Inc / Albertson's LLC 6.625% 06/15/2024 | 60,000 | 56,850 | ||
Central Garden & Pet Co 6.125% 11/15/2023 | 50,000 | 52,874 | ||
Central Garden & Pet Co 5.125% 02/01/2028 | 35,000 | 35,000 | ||
HRG Group Inc 7.750% 01/15/2022 | 50,000 | 51,875 | ||
HRG Group Inc 7.875% 07/15/2019 | 15,000 | 15,030 | ||
Reynolds Group Issuer Inc / Reynolds Group Issuer LLC / Reynolds Group Issuer 5.750% 10/15/2020 | 140,521 | 142,628 | ||
Spectrum Brands Inc 6.625% 11/15/2022 | 25,000 | 25,875 | ||
Spectrum Brands Inc 5.750% 07/15/2025 | 30,000 | 31,575 | ||
High Ridge Brands Co - 144A 8.875% 03/15/2025 | 45,000 | 40,050 | ||
POST 5 1/2 03/01/25 - 144A 5.500% 03/01/2025 | 35,000 | 36,225 | ||
Post Holdings Inc - 144A 5.625% 01/15/2028 | 30,000 | 30,159 | ||
Reynolds Group Issuer Inc / Reynolds Group Issuer LLC / Reynolds Group Issuer - 144A 7.000% 07/15/2024 | 25,000 | 26,750 | ||
Rite Aid Corp - 144A 6.125% 04/01/2023 | 100,000 | 90,250 | ||
TreeHouse Foods Inc - 144A 6.000% 02/15/2024 | 75,000 |
| 78,000 | |
| 713,141 | |||
Energy (10.4%) | ||||
Antero Resources Corp 5.125% 12/01/2022 | 95,000 | 96,900 | ||
Antero Resources Corp 5.625% 06/01/2023 | 15,000 | 15,600 | ||
Antero Midstream Partners LP / Antero Midstream Finance Corp 5.375% 09/15/2024 | 30,000 | 30,900 | ||
Boardwalk Pipelines LP 5.950% 06/01/2026 | 40,000 | 44,618 | ||
Carrizo Oil & Gas Inc 7.500% 09/15/2020 | 37,000 | 37,694 | ||
Carrizo Oil & Gas Inc 6.250% 04/15/2023 | 35,000 | 36,313 | ||
Carrizo Oil & Gas Inc 8.250% 07/15/2025 | 20,000 | 21,975 | ||
CSI Compressco LP / CSI Compressco Finance Inc 7.250% 08/15/2022 | 20,000 | 18,850 | ||
Continental Resources Inc/OK 5.000% 09/15/2022 | 10,000 | 10,150 | ||
Continental Resources Inc/OK 4.500% 04/15/2023 | 90,000 | 91,800 | ||
Crestwood Midstream Partners LP / Crestwood Midstream Finance Corp 6.250% 04/01/2023 | 35,000 | 36,372 | ||
EnLink Midstream Partners LP 4.400% 04/01/2024 | 50,000 | 51,645 | ||
GCI Inc 6.875% 04/15/2025 | 30,000 | 31,950 | ||
Gulfport Energy Corp 6.000% 10/15/2024 | 15,000 | 15,000 | ||
Laredo Petroleum Inc 5.625% 01/15/2022 | 45,000 | 45,450 | ||
MPLX LP 5.500% 02/15/2023 | 75,000 | 77,181 | ||
MPLX LP 4.875% 12/01/2024 | 30,000 | 32,337 | ||
MPLX LP 4.875% 06/01/2025 | 25,000 | 26,793 | ||
Nabors Industries Inc 5.500% 01/15/2023 | 15,000 | 14,550 | ||
Newfield Exploration Co 5.750% 01/30/2022 | 35,000 | 37,363 | ||
Oasis Petroleum Inc 6.500% 11/01/2021 | 20,000 | 20,425 | ||
Oasis Petroleum Inc 6.875% 01/15/2023 | 80,000 | 81,800 | ||
Oasis Petroleum Inc 6.875% 03/15/2022 | 40,000 | 41,050 | ||
Precision Drilling Corp 6.500% 12/15/2021 | 7,000 | 7,131 | ||
Precision Drilling Corp 7.750% 12/15/2023 | 30,000 | 31,500 | ||
QEP Resources Inc 5.625% 03/01/2026 | 20,000 | 20,275 | ||
RSP Permian Inc 6.625% 10/01/2022 | 25,000 | 26,219 | ||
Range Resources Corp 4.875% 05/15/2025 | 50,000 | 48,250 | ||
Range Resources Corp 5.000% 08/15/2022 | 10,000 | 9,950 | ||
Range Resources Corp 5.000% 03/15/2023 | 15,000 | 14,925 | ||
SM Energy Co 6.500% 01/01/2023 | 15,000 | 15,300 | ||
SM Energy Co 6.125% 11/15/2022 | 70,000 | 71,313 | ||
SM Energy Co 5.625% 06/01/2025 | 30,000 | 29,100 | ||
Sanchez Energy Corp 7.750% 06/15/2021 | 30,000 | 28,200 | ||
Sanchez Energy Corp 6.125% 01/15/2023 | 25,000 | 21,125 | ||
Southwestern Energy Co 4.100% 03/15/2022 | 30,000 | 29,550 | ||
Southwestern Energy Co 6.700% 01/23/2025 | 100,000 | 103,875 | ||
Southwestern Energy Co 7.500% 04/01/2026 | 25,000 | 26,563 | ||
Southwestern Energy Co 7.750% 10/01/2027 | 25,000 | 26,688 | ||
Summit Midstream Holdings LLC / Summit Midstream Finance Corp 5.750% 04/15/2025 | 30,000 | 30,252 | ||
Targa Resources Partners LP / Targa Resources Partners Finance Corp 4.250% 11/15/2023 | 10,000 | 9,887 | ||
Targa Resources Partners LP / Targa Resources Partners Finance Corp 6.750% 03/15/2024 | 120,000 | 128,700 | ||
Targa Resources Partners LP / Targa Resources Partners Finance Corp 5.125% 02/01/2025 | 15,000 | 15,356 | ||
Tesoro Logistics LP / Tesoro Logistics Finance Corp 6.250% 10/15/2022 | 11,000 | 11,671 | ||
Tesoro Logistics LP / Tesoro Logistics Finance Corp 6.375% 05/01/2024 | 25,000 | 27,125 | ||
Tesoro Logistics LP / Tesoro Logistics Finance Corp 5.250% 01/15/2025 | 25,000 | 26,292 | ||
Weatherford International Ltd 9.875% 02/15/2024 | 10,000 | 10,625 | ||
Whiting Petroleum Corp 5.750% 03/15/2021 | 15,000 | 15,394 | ||
Whiting Petroleum Corp 6.250% 04/01/2023 | 85,000 | 87,231 | ||
WildHorse Resource Development Corp 6.875% 02/01/2025 | 60,000 | 61,350 | ||
WPX Energy Inc 6.000% 01/15/2022 | 40,000 | 41,800 | ||
WPX Energy Inc 8.250% 08/01/2023 | 75,000 | 85,125 | ||
Alta Mesa Holdings LP / Alta Mesa Finance Services Corp 7.875% 12/15/2024 | 25,000 | 27,406 | ||
Blue Racer Midstream LLC / Blue Racer Finance Corp - 144A 6.125% 11/15/2022 | 100,000 | 104,250 | ||
Cheniere Corpus Christi Holdings LLC 5.125% 06/30/2027 | 35,000 | 36,204 | ||
Chesapeake Energy Corp - 144A 8.000% 12/15/2022 | 62,000 | 66,883 | ||
Chesapeake Energy Corp - 144A 5.500% 09/15/2026 | 20,000 | 18,213 | ||
Chesapeake Energy Corp - 144A 8.000% 01/15/2025 | 105,000 | 106,050 | ||
Chesapeake Energy Corp - 144A 8.000% 06/15/2027 | 80,000 | 76,800 | ||
Communications Sales & Leasing Inc / CSL Capital LLC - 144A 7.125% 12/15/2024 | 75,000 | 68,250 | ||
Covey Park Energy LLC / Covey Park Finance Corp - 144A 7.500% 05/15/2025 | 40,000 | 41,688 | ||
Denbury Resources Inc 9.250% 03/31/2022 | 58,000 | 58,725 | ||
Denbury Resources Inc - 144A 3.500% 03/31/2024 | 13,000 | 13,398 | ||
EP Energy LLC / Everest Acquisition Finance Inc - 144A 8.000% 11/29/2024 | 65,000 | 67,113 | ||
EP Energy LLC / Everest Acquisition Finance Inc - 144A 8.000% 02/15/2025 | 65,000 | 47,450 | ||
Halcon Resources Corp - 144A 6.750% 02/15/2025 | 80,000 | 83,200 | ||
Hess Infrastructure Partners LP / Hess Infrastructure Partners Finance Corp - 144A 5.625% 02/15/2026 | 25,000 | 25,813 | ||
MEG Energy Corp - 144A 6.375% 01/30/2023 | 90,000 | 76,500 | ||
MEG Energy Corp - 144A 7.000% 03/31/2024 | 110,000 | 92,813 | ||
MEG Energy Corp - 144A 6.500% 01/15/2025 | 75,000 | 74,063 | ||
NGPL PipeCo LLC - 144A 4.375% 08/15/2022 | 45,000 | 45,760 | ||
NGPL PipeCo LLC - 144A 4.875% 08/15/2027 | 10,000 | 10,375 | ||
Parsley Energy LLC / Parsley Finance Corp - 144A 5.250% 08/15/2025 | 30,000 | 30,075 | ||
Parsley Energy LLC / Parsley Finance Corp 5.625% 10/15/2027 | 25,000 | 25,563 | ||
Precision Drilling Corp - 144A 7.125% 01/15/2026 | 35,000 | 35,700 | ||
RSP Permian Inc 5.250% 01/15/2025 | 15,000 | 15,375 | ||
Tallgrass Energy Partners LP / Tallgrass Energy Finance Corp - 144A 5.500% 01/15/2028 | 70,000 | 70,854 | ||
Targa Resources Partners LP / Targa Resources Partners Finance Corp 5.000% 01/15/2028 | 35,000 | 34,913 | ||
Transocean Inc 7.500% 01/15/2026 | 40,000 | 40,962 | ||
Whiting Petroleum Corp - 144A 6.625% 01/15/2026 | 15,000 |
| 15,300 | |
| 3,387,184 | |||
Financials (5.2%) | ||||
Ally Financial Inc 4.125% 02/13/2022 | 70,000 | 71,561 | ||
Ally Financial Inc 4.625% 03/30/2025 | 125,000 | 131,250 | ||
Ally Financial Inc 4.625% 05/19/2022 | 130,000 | 135,200 | ||
Ally Financial Inc 5.750% 11/20/2025 | 40,000 | 43,600 | ||
Ally Financial Inc 4.250% 04/15/2021 | 40,000 | 41,000 | ||
*(3)Bank of America Corp -8.000% Perpetual Maturity | 210,000 | 210,714 | ||
CIT Group Inc 3.875% 02/19/2019 | 60,000 | 60,600 | ||
(3)Citigroup Inc - 5.800% Perpetual Maturity | 35,000 | 36,269 | ||
(3)Citigroup Inc -5.875% Perpetual Maturity | 30,000 | 31,125 | ||
(3)Citigroup Inc -5.950% Perpetual Maturity | 10,000 | 10,650 | ||
International Lease Finance Corp 6.250% 05/15/2019 | 55,000 | 57,635 | ||
*International Lease Finance Corp 5.875% 04/01/2019 | 210,000 | 218,567 | ||
International Lease Finance Corp 4.625% 04/15/2021 | 10,000 | 10,527 | ||
Adient Global Holdings Ltd - 144A 4.875% 08/15/2026 | 40,000 | 41,100 | ||
PetSmart Inc - 144A 7.125% 03/15/2023 | 125,000 | 74,063 | ||
Diamond 1 Finance Corp / Diamond 2 Finance Corp - 144A 5.450% 06/15/2023 | 60,000 | 64,838 | ||
Diamond 1 Finance Corp / Diamond 2 Finance Corp - 144A 6.020% 06/15/2026 | 75,000 | 82,696 | ||
Diamond 1 Finance Corp / Diamond 2 Finance Corp - 144A 5.875% 06/15/2021 | 20,000 | 20,750 | ||
Infinity Acquisition LLC / Infinity Acquisition Finance Corp - 144A 7.250% 08/01/2022 | 60,000 | 60,450 | ||
inVentiv Group Holdings Inc/inVentiv Health Inc/inVentiv Health Clinical Inc - 144A 7.500% 10/01/2024 | 49,000 | 52,920 | ||
Nielsen Co Luxembourg SARL/The - 144A 5.500% 10/01/2021 | 20,000 | 20,550 | ||
UPCB Finance IV Ltd - 144A 5.375% 01/15/2025 | 200,000 | 201,380 | ||
WMG Acquisition Corp - 144A 5.625% 04/15/2022 | 13,000 | 13,390 | ||
WMG Acquisition Corp - 144A 4.875% 11/01/2024 | 10,000 |
| 10,300 | |
| 1,701,135 | |||
Health Care (10.4%) | ||||
Care Capital Properties LP 5.125% 08/15/2026 | 40,000 | 40,560 | ||
DaVita Inc 5.000% 05/01/2025 | 70,000 | 69,979 | ||
HCA Inc 5.250% 04/15/2025 | 15,000 | 15,863 | ||
*HCA Inc 5.375% 02/01/2025 | 380,000 | 393,300 | ||
HCA Inc 5.875% 02/15/2026 | 175,000 | 185,063 | ||
HCA Inc 5.250% 06/15/2026 | 60,000 | 63,600 | ||
*HCA Inc 7.500% 02/15/2022 | 350,000 | 393,750 | ||
HealthSouth Corp 5.750% 11/01/2024 | 65,000 | 66,544 | ||
HealthSouth Corp 5.750% 09/15/2025 | 30,000 | 31,200 | ||
Kindred Healthcare Inc 8.750% 01/15/2023 | 105,000 | 111,300 | ||
Tenet Healthcare Corp 4.500% 04/01/2021 | 95,000 | 95,475 | ||
Tenet Healthcare Corp 8.125% 04/01/2022 | 275,000 | 279,813 | ||
Tenet Healthcare Corp 6.750% 06/15/2023 | 85,000 | 82,450 | ||
Avantor Inc - 144A 6.000% 10/01/2024 | 50,000 | 49,813 | ||
DJO Finco Inc / DJO Finance LLC / DJO Finance Corp - 144A 8.125% 06/15/2021 | 155,000 | 144,925 | ||
Hill- 144A Rom Holdings Inc - 5.750% 09/01/2023 | 80,000 | 83,700 | ||
Hill- 144A Rom Holdings Inc - 5.000% 02/15/2025 | 10,000 | 10,197 | ||
Hologic Inc - 144A 5.250% 07/15/2022 | 80,000 | 82,800 | ||
Hologic Inc 4.375% 10/15/2025 | 10,000 | 10,150 | ||
Kinetic Concepts Inc / KCI USA Inc - 144A 7.875% 02/15/2021 | 85,000 | 88,825 | ||
Mallinckrodt International Finance SA / Mallinckrodt CB LLC - 144A 5.750% 08/01/2022 | 25,000 | 22,688 | ||
Mallinckrodt International Finance SA / Mallinckrodt CB LLC - 144A 5.500% 04/15/2025 | 45,000 | 36,675 | ||
Mallinckrodt International Finance SA / Mallinckrodt CB LLC - 144A 5.625% 10/15/2023 | 30,000 | 25,500 | ||
Tenet Healthcare Corp - 144A 7.500% 01/01/2022 | 25,000 | 26,250 | ||
^(2)21st Century Oncology Inc - 144A 11.000% 05/01/2023 | 66,474 | 45,867 | ||
Valeant Pharmaceuticals International Inc - 144A 5.875% 05/15/2023 | 210,000 | 194,775 | ||
Valeant Pharmaceuticals International Inc - 144A 6.125% 04/15/2025 | 140,000 | 128,100 | ||
Valeant Pharmaceuticals International Inc - 144A 6.500% 03/15/2022 | 20,000 | 21,000 | ||
Valeant Pharmaceuticals International Inc - 144A 7.000% 03/15/2024 | 55,000 | 58,850 | ||
Valeant Pharmaceuticals International Inc 5.500% 11/01/2025 | 35,000 | 35,613 | ||
Valeant Pharmaceuticals International Inc - 144A 9.000% 12/15/2025 | 70,000 | 72,954 | ||
Valeant Pharmaceuticals International - 144A 6.750% 08/15/2021 | 80,000 | 80,600 | ||
Valeant Pharmaceuticals International - 144A 7.250% 07/15/2022 | 115,000 | 116,294 | ||
Valeant Pharmaceuticals International Inc - 144A 7.500% 07/15/2021 | 230,000 |
| 234,025 | |
| 3,398,498 | |||
Industrials (9.8%) | ||||
ADT Corp/The 3.500% 07/15/2022 | 80,000 | 78,800 | ||
ADT Corp/The 4.125% 06/15/2023 | 15,000 | 15,000 | ||
AECOM 5.750% 10/15/2022 | 70,000 | 72,975 | ||
AECOM 5.875% 10/15/2024 | 30,000 | 32,496 | ||
Aircastle Ltd 5.000% 04/01/2023 | 75,000 | 79,031 | ||
Arconic Inc 5.900% 02/01/2027 | 50,000 | 56,159 | ||
Avis Budget Car Rental LLC / Avis Budget Finance Inc 5.500% 04/01/2023 | 125,000 | 128,125 | ||
CNH Industrial Capital LLC 4.375% 11/06/2020 | 35,000 | 36,313 | ||
CNH Industrial Capital LLC 4.875% 04/01/2021 | 70,000 | 73,500 | ||
CNH Industrial Capital LLC 4.375% 04/05/2022 | 40,000 | 41,439 | ||
Clean Harbors Inc 5.125% 06/01/2021 | 25,000 | 25,250 | ||
FGI Operating Co LLC / FGI Finance Inc 7.875% 05/01/2020 | 125,000 | 27,500 | ||
General Cable Corp 5.750% 10/01/2022 | 95,000 | 98,444 | ||
Great Lakes Dredge & Dock Corp 8.000% 05/15/2022 | 35,000 | 36,619 | ||
Hertz Corp/The 7.375% 01/15/2021 | 85,000 | 85,850 | ||
Hertz Corp/The 6.250% 10/15/2022 | 160,000 | 154,400 | ||
Iron Mountain Inc 6.000% 08/15/2023 | 75,000 | 78,375 | ||
Manitowoc Foodservice Inc 9.500% 02/15/2024 | 50,000 | 56,938 | ||
Oshkosh Corp 5.375% 03/01/2022 | 45,000 | 46,406 | ||
Oshkosh Corp 5.375% 03/01/2025 | 20,000 | 21,225 | ||
TransDigm Inc 6.500% 05/15/2025 | 50,000 | 51,125 | ||
Triumph Group Inc 4.875% 04/01/2021 | 80,000 | 78,600 | ||
United Rentals North America Inc 5.750% 11/15/2024 | 45,000 | 47,363 | ||
United Rentals North America Inc 5.875% 09/15/2026 | 35,000 | 37,450 | ||
United Rentals North America Inc 5.500% 05/15/2027 | 40,000 | 42,100 | ||
United Rentals North America Inc 4.875% 01/15/2028 | 70,000 | 70,350 | ||
ACCO BRANDS CORP 5.250% 12/15/2024 | 30,000 | 30,825 | ||
Air Medical Group Holdings Inc - 144A 6.375% 05/15/2023 | 85,000 | 81,600 | ||
AMER GREETINGS - 144A 7.875% 02/15/2025 | 10,000 | 10,800 | ||
Avis Budget Car Rental LLC / Avis Budget Finance Inc - 144A 6.375% 04/01/2024 | 90,000 | 93,627 | ||
Bombardier Inc - 144A 7.500% 03/15/2025 | 90,000 | 90,702 | ||
CD&R Waterworks Merger Sub LLC - 144A 6.125% 08/15/2025 | 25,000 | 25,375 | ||
Energizer Holdings Inc - 144A 5.500% 06/15/2025 | 75,000 | 78,116 | ||
Hillman Group Inc/The - 144A 6.375% 07/15/2022 | 95,000 | 94,763 | ||
Hertz Corp/The - 144A 5.500% 10/15/2024 | 70,000 | 63,175 | ||
Hertz Corp/The - 144A 7.625% 06/01/2022 | 90,000 | 94,275 | ||
Herc Rentals Inc - 144A 7.500% 06/01/2022 | 37,000 | 39,867 | ||
Herc Rentals Inc - 144A 7.750% 06/01/2024 | 81,000 | 88,897 | ||
Jeld- 144A Wen Inc - 4.625% 12/15/2025 | 15,000 | 15,113 | ||
Jeld- 144A Wen Inc - 4.875% 12/15/2027 | 15,000 | 15,150 | ||
KLX Inc - 144A 5.875% 12/01/2022 | 85,000 | 89,012 | ||
Kratos Defense & Security Solutions Inc - 144A 6.500% 11/30/2025 | 30,000 | 31,200 | ||
NXP BV / NXP Funding LLC - 144A 4.625% 06/01/2023 | 200,000 | 209,200 | ||
RBS Global Inc / Rexnord LLC 4.875% 12/15/2025 | 20,000 | 20,200 | ||
SPX FLOW Inc - 144A 5.625% 08/15/2024 | 20,000 | 21,050 | ||
SPX FLOW Inc - 144A 5.875% 08/15/2026 | 35,000 | 37,100 | ||
Sensata Technologies BV - 144A 4.875% 10/15/2023 | 65,000 | 67,925 | ||
Standard Industries Inc/NJ - 144A 4.750% 01/15/2028 | 70,000 | 70,162 | ||
Terex Corp - 144A 5.625% 02/01/2025 | 50,000 | 52,250 | ||
TriMas Corp - 144A 4.875% 10/15/2025 | 25,000 | 25,094 | ||
Triumph Group Inc - 144A 7.750% 08/15/2025 | 40,000 | 42,450 | ||
Wabash National Corp - 144A 5.500% 10/01/2025 | 30,000 | 30,225 | ||
XPO Logistics Inc - 144A 6.500% 06/15/2022 | 90,000 | 93,937 | ||
XPO Logistics Inc - 144A 6.125% 09/01/2023 | 20,000 | 21,150 | ||
| 3,205,073 | |||
Information Technology (9.3%) | ||||
Amkor Technology Inc 6.625% 06/01/2021 | 34,000 | 34,363 | ||
*Amkor Technology Inc 6.375% 10/01/2022 | 115,000 | 118,680 | ||
Anixter Inc 5.500% 03/01/2023 | 80,000 | 86,124 | ||
CDW LLC / CDW Finance Corp 5.000% 09/01/2025 | 10,000 | 10,350 | ||
Equinix Inc 5.375% 01/01/2022 | 20,000 | 20,800 | ||
Equinix Inc 5.750% 01/01/2025 | 10,000 | 10,613 | ||
Infor US Inc 6.500% 05/15/2022 | 215,000 | 222,525 | ||
Magnachip Semiconductor Corp 6.625% 07/15/2021 | 95,000 | 92,150 | ||
Sabine Pass Liquefaction LLC 6.250% 03/15/2022 | 100,000 | 111,263 | ||
*Sabine Pass Liquefaction LLC 5.750% 05/15/2024 | 100,000 | 111,148 | ||
Sabine Pass Liquefaction LLC 5.875% 06/30/2026 | 15,000 | 16,852 | ||
Sinclair Television Group Inc 6.125% 10/01/2022 | 105,000 | 108,150 | ||
Western Digital Corp 10.500% 04/01/2024 | 180,000 | 208,575 | ||
(1)Infor Software Parent LLC / Infor Software Parent Inc - 144A 7.125% (7.875%) 05/01/2021 | 105,000 | 107,363 | ||
ACI Worldwide Inc - 144A 6.375% 08/15/2020 | 55,000 | 55,963 | ||
CDK Global Inc - 144A 4.875% 06/01/2027 | 15,000 | 15,187 | ||
Cogent Communications Finance Inc - 144A 5.625% 04/15/2021 | 90,000 | 90,900 | ||
Cogent Communications Group Inc - 144A 5.375% 03/01/2022 | 70,000 | 73,500 | ||
CommScope Inc - 144A 5.500% 06/15/2024 | 25,000 | 26,000 | ||
CommScope Technologies Finance LLC - 144A 6.000% 06/15/2025 | 145,000 | 154,063 | ||
Entegris Inc 4.625% 02/10/2026 | 55,000 | 55,825 | ||
First Data Corp - 144A 5.375% 08/15/2023 | 188,000 | 195,689 | ||
First Data Corp - 144A 5.750% 01/15/2024 | 370,000 | 382,950 | ||
Gartner Inc - 144A 5.125% 04/01/2025 | 30,000 | 31,350 | ||
Inception Merger Sub Inc / Rackspace Hosting Inc - 144A 8.625% 11/15/2024 | 75,000 | 80,063 | ||
Informatica LLC - 144A 7.125% 07/15/2023 | 95,000 | 97,138 | ||
Micron Technology Inc - 144A 5.250% 01/15/2024 | 115,000 | 119,456 | ||
Microsemi Corp - 144A 9.125% 04/15/2023 | 90,000 | 101,250 | ||
Plantronics Inc - 144A 5.500% 05/31/2023 | 40,000 | 41,550 | ||
Riverbed Technology Inc - 144A 8.875% 03/01/2023 | 70,000 | 66,062 | ||
Sinclair Television Group Inc - 144A 5.625% 08/01/2024 | 20,000 | 20,625 | ||
Sinclair Television Group Inc - 144A 5.125% 02/15/2027 | 20,000 | 19,825 | ||
Western Digital Corp - 144A 7.375% 04/01/2023 | 125,000 |
| 134,844 | |
| 3,021,196 | |||
Materials (5.3%) | ||||
Ashland LLC 4.750% 08/15/2022 | 155,000 | 161,200 | ||
Chemours Co/The 6.625% 05/15/2023 | 60,000 | 63,450 | ||
Freeport McMoRan Inc 3.875% 03/15/2023 | 85,000 | 84,575 | ||
Freeport McMoRan Inc 4.550% 11/14/2024 | 20,000 | 20,334 | ||
Hexion Inc 6.625% 04/15/2020 | 175,000 | 157,063 | ||
Huntsman International LLC 5.125% 11/15/2022 | 120,000 | 127,950 | ||
Scotts Miracle Gro Co/The 6.000% 10/15/2023 | 75,000 | 79,406 | ||
Scotts Miracle Gro Co/The 5.250% 12/15/2026 | 10,000 | 10,475 | ||
Ardagh Packaging Finance PLC / Ardagh Holdings USA Inc - 144A 7.250% 05/15/2024 | 200,000 | 217,750 | ||
Boise Cascade Co - 144A 5.625% 09/01/2024 | 15,000 | 15,825 | ||
BWAY Holding Co - 144A 5.500% 04/15/2024 | 30,000 | 31,200 | ||
Cheniere Corpus Christi Holdings LLC 5.875% 03/31/2025 | 40,000 | 43,350 | ||
FMG Resources August 2006 Pty Ltd - 144A 9.750% 03/01/2022 | 55,000 | 60,858 | ||
GCP Applied Technologies Inc - 144A 9.500% 02/01/2023 | 65,000 | 72,150 | ||
WR Grace & Co- 144A Conn - 5.625% 10/01/2024 | 10,000 | 10,788 | ||
INEOS Group Holdings SA - 144A 5.625% 08/01/2024 | 200,000 | 208,500 | ||
+(4)(2)Noranda Aluminum Acquisition Corp 11.000% 06/01/2019 | 40,000 | 0 | ||
NOVA Chemicals Corp - 144A 4.875% 06/01/2024 | 30,000 | 29,925 | ||
NOVA Chemicals Corp - 144A 5.250% 06/01/2027 | 25,000 | 24,938 | ||
Novelis Corp - 144A 6.250% 08/15/2024 | 25,000 | 26,188 | ||
Novelis Corp - 144A 5.875% 09/30/2026 | 30,000 | 30,600 | ||
Rain CII Carbon LLC / CII Carbon Corp - 144A 7.250% 04/01/2025 | 65,000 | 70,769 | ||
+(4)(2)Reichhold Industries Inc - 144A 9.000% 05/08/2040 | 103,629 | 0 | ||
Trinseo Materials Operating SCA / Trinseo Materials Finance Inc - 144A 5.375% 09/01/2025 | 45,000 | 46,575 | ||
Venator Finance S.a r.l. / Venator Materials Corp - 144A 5.750% 07/15/2025 | 35,000 | 36,925 | ||
LSB Industries Inc | 93,000 |
| 91,838 | |
| 1,722,632 | |||
Real Estate (1.5%) | ||||
Communications Sales & Leasing Inc / CSL Capital LLC 8.250% 10/15/2023 | 75,000 | 72,093 | ||
Corrections Corp of America 4.625% 05/01/2023 | 113,000 | 115,543 | ||
Corrections Corp of America 5.000% 10/15/2022 | 25,000 | 26,124 | ||
Equinix Inc 5.875% 01/15/2026 | 35,000 | 37,580 | ||
GEO Group Inc/The 5.125% 04/01/2023 | 20,000 | 20,000 | ||
GEO Group Inc/The 5.875% 01/15/2022 | 75,000 | 77,250 | ||
GEO Group Inc/The 5.875% 10/15/2024 | 40,000 | 41,100 | ||
GEO Group Inc/The 6.000% 04/15/2026 | 25,000 | 25,686 | ||
Communications Sales & Leasing Inc / CSL Capital LLC - 144A 6.000% 04/15/2023 | 30,000 | 29,400 | ||
ESH Hospitality Inc - 144A 5.250% 05/01/2025 | 25,000 | 25,250 | ||
Realogy Group LLC / Realogy Co- 144A Issuer Corp - 5.250% 12/01/2021 | 15,000 |
| 15,562 | |
| 485,588 | |||
Telecommunication Services (10.1%) | ||||
AT&T Inc 3.400% 08/14/2024 | 35,000 | 35,180 | ||
CenturyLink Inc 5.800% 03/15/2022 | 45,000 | 44,073 | ||
CenturyLink Inc 6.750% 12/01/2023 | 100,000 | 98,000 | ||
CenturyLink Inc 5.625% 04/01/2025 | 25,000 | 22,750 | ||
EP Energy LLC / Everest Acquisition Finance Inc 9.375% 05/01/2020 | 80,000 | 67,600 | ||
Frontier Communications Corp 6.875% 01/15/2025 | 65,000 | 42,086 | ||
Frontier Communications Corp 11.000% 09/15/2025 | 150,000 | 110,250 | ||
GCI Inc 6.750% 06/01/2021 | 70,000 | 71,225 | ||
*Intelsat Jackson Holdings SA 7.250% 10/15/2020 | 375,000 | 352,500 | ||
Intelsat Jackson Holdings SA 7.500% 04/01/2021 | 35,000 | 31,850 | ||
Intelsat Jackson Holdings SA 5.500% 08/01/2023 | 115,000 | 94,013 | ||
Level 3 Financing Inc 5.375% 05/01/2025 | 55,000 | 54,931 | ||
Level 3 Financing Inc 5.375% 01/15/2024 | 35,000 | 34,956 | ||
Level 3 Communications Inc 5.750% 12/01/2022 | 55,000 | 55,223 | ||
Qwest Capital Funding Inc 7.750% 02/15/2031 | 50,000 | 44,000 | ||
SBA Communications Corp 4.875% 09/01/2024 | 50,000 | 51,374 | ||
*Sprint Capital Corp 8.750% 03/15/2032 | 310,000 | 351,850 | ||
*Sprint Corp 7.875% 09/15/2023 | 565,000 | 601,724 | ||
Sprint Corp 7.625% 02/15/2025 | 130,000 | 136,174 | ||
T Mobile USA Inc 6.500% 01/15/2024 | 130,000 | 137,800 | ||
T Mobile USA Inc 6.375% 03/01/2025 | 50,000 | 53,500 | ||
T Mobile USA Inc 6.500% 01/15/2026 | 115,000 | 125,493 | ||
United States Cellular Corp 6.700% 12/15/2033 | 75,000 | 78,242 | ||
Windstream Services LLC 7.750% 10/15/2020 | 15,000 | 12,675 | ||
Windstream Services LLC 6.375% 08/01/2023 | 5,000 | 3,050 | ||
Intelsat Jackson Holdings SA - 144A 8.000% 02/15/2024 | 20,000 | 21,050 | ||
Intelsat Jackson Holdings SA - 144A 9.750% 07/15/2025 | 90,000 | 86,625 | ||
CSC Holdings LLC - 144A 10.875% 10/15/2025 | 184,000 | 218,960 | ||
Windstream Services LLC / Windstream Finance Corp - 144A 8.750% 12/15/2024 | 356,000 |
| 248,754 | |
| 3,285,908 | |||
Utilities (1.1%) | ||||
AES Corp/VA 4.875% 05/15/2023 | 15,000 | 15,280 | ||
AES Corp/VA 5.500% 03/15/2024 | 10,000 | 10,400 | ||
AES Corp/VA 6.000% 05/15/2026 | 10,000 | 10,800 | ||
AmeriGas Partners LP / AmeriGas Finance Corp 5.875% 08/20/2026 | 70,000 | 72,100 | ||
AmeriGas Partners LP / AmeriGas Finance Corp 5.500% 05/20/2025 | 40,000 | 40,400 | ||
Dynegy Inc 7.375% 11/01/2022 | 45,000 | 47,475 | ||
Dynegy Inc 7.625% 11/01/2024 | 25,000 | 26,813 | ||
NRG Energy Inc 6.250% 07/15/2022 | 40,000 | 41,600 | ||
NRG Energy Inc 6.625% 01/15/2027 | 30,000 | 31,725 | ||
Calpine Corp - 144A 5.250% 06/01/2026 | 30,000 | 29,400 | ||
Dynegy Inc - 144A 8.000% 01/15/2025 | 25,000 |
| 27,064 | |
| 353,057 | |||
| ||||
TOTAL CORPORATE BONDS (COST: $29,306,932) | $ | 29,551,473 | ||
| ||||
COMMON STOCKS (2.1%) | ||||
Energy (0.2%) | Shares | |||
Halcon Resources Corp | 6,520 | $ | 49,356 | |
| ||||
Consumer Discretionary (1.7%) |
|
| ||
Caesars Entertainment Corp | 11,470 | $ | 145,096 | |
^VICI Properties, Inc | 20,727 | 424,904 | ||
|
|
| $ | 570,000 |
Material (0.2%) |
|
|
|
|
^Uci International Holdings Inc |
| 2,633 | $ | 48,052 |
|
|
|
|
|
TOTAL COMMON STOCK (COST: $596,788) | $ | 667,408 | ||
| ||||
PRIVATE EQUITY (0.4%) | ||||
Materials (0.4%) | Shares | |||
+^(4)Reichhold Cayman | 162 | $ | 140,130 | |
| ||||
TOTAL PRIVATE EQUITY (COST: $120,561) | $ | 140,130 | ||
| ||||
WARRANTS (0.0%) | ||||
Industrials (0.0%) | Shares | |||
+Jack Cooper Enterprises Inc | 175 | $ | 0 | |
+Jack Cooper Enterprises Inc | 99 |
| 0 | |
$ | 0 | |||
| ||||
TOTAL WARRANTS (COST:$0) | $ | 0 | ||
| ||||
TOTAL INVESTMENTS IN SECURITIES | $ | 30,359,011 | ||
OTHER ASSETS LESS LIABILITIES (6.9%) |
| 2,264,562 | ||
NET ASSETS (100.0%) | $ | 32,623,573 | ||
| ||||
(1) Interest or dividend is paid-in-kind, when applicable. Rate paid in-kind is shown in parenthesis. | ||||
(2) Issue is in default. | ||||
(3) This security has no contractual maturity date, is not redeemable and contractually pays an indefinite stream of interest. | ||||
(4) Non-income producing security. | ||||
+ The Level 3 assets were a result of unavailable quoted prices from and active market or the unavailability of other significant observable inputs. Total market value of Level 3 securities amount to $140,130, representing 0.4% of net assets as of December 31, 2017. | ||||
* Indicates bonds are segregated by the custodian to cover when-issued or delayed-delivery purchases. | ||||
^ Deemed by management to be illiquid security. See note 2. Total market value of illiquid securities amount to $658,953, representing 2.0% of net assets as of December 31, 2017. | ||||
144A - Security exempt from registration under Rule 144A of the Securities Act of 1933. These securities are deemed to be liquid under procedures approved by the Fund’s Board of Trustees and may normally be sold to qualified institutional buyers in transactions exempt from registration. Total market value of Rule 144A Securities amounts to $12,493,278, representing 38.3% of net assets as of December 31, 2017. | ||||
| ||||
| ||||
The accompanying notes are an integral part of these financial statements. | ||||
WILLISTON BASIN/MID-NORTH AMERICA STOCK FUND
PORTFOLIO MARKET SECTORS December 31, 2017
Energy | 89.0% |
Utilities | 4.1% |
Cash Equivalents and Other | 2.8% |
Industrials | 2.7% |
Materials | 1.4% |
100.0% |
Market sectors are breakdowns of the Fund’s portfolio holdings into specific investment classes.
These percentages are based on net assets.
SCHEDULE OF INVESTMENTS December 31, 2017
Fair | ||||
Shares |
| Value | ||
COMMON STOCKS (97.2%) | ||||
| ||||
Energy (89.0%) | ||||
Anadarko Petroleum Corp | 60,000 | $ | 3,218,400 | |
Andeavor | 160,000 | 18,294,400 | ||
Archrock Inc | 300,000 | 3,150,000 | ||
Baker Hughes a GE Co | 160,000 | 5,062,400 | ||
*Callon Petroleum Co | 950,000 | 11,542,500 | ||
*Cheniere Energy Inc | 50,000 | 2,692,000 | ||
Cimarex Energy Co | 55,000 | 6,710,550 | ||
*Continental Resources Inc/OK | 175,000 | 9,269,750 | ||
*Diamondback Energy Inc | 180,000 | 22,725,000 | ||
EOG Resources Inc | 53,000 | 5,719,230 | ||
Enbridge Inc | 340,000 | 13,297,400 | ||
Exxon Mobil Corp | 130,000 | 10,873,200 | ||
*Fairmount Santrol Holdings Inc | 280,000 | 1,464,400 | ||
*Forum Energy Technologies Inc | 760,000 | 11,818,000 | ||
Halliburton Co | 410,000 | 20,036,700 | ||
Hess Corp | 70,000 | 3,322,900 | ||
*#Independence Contract Drilling Inc | 520,000 | 2,069,600 | ||
*Keane Group Inc | 380,000 | 7,223,800 | ||
Kinder Morgan Inc/DE | 960,000 | 17,347,200 | ||
ONEOK Inc | 435,000 | 23,250,750 | ||
*Parsley Energy Inc | 655,000 | 19,283,200 | ||
Patterson-UTI Energy Inc | 260,000 | 5,982,600 | ||
Phillips 66 | 160,000 | 16,184,000 | ||
Pioneer Natural Resources Co | 115,000 | 19,877,750 | ||
*ProPetro Holding Corp | 1,000,000 | 20,160,000 | ||
RPC Inc | 660,000 | 16,849,800 | ||
*RSP Permian Inc | 180,000 | 7,322,400 | ||
Schlumberger Ltd | 205,000 | 13,814,950 | ||
SemGroup Corp | 230,000 | 6,946,000 | ||
*SMART SAND INC | 120,000 | 1,039,200 | ||
*TETRA Technologies Inc | 60,000 | 256,200 | ||
TransCanada Corp | 180,000 | 8,755,200 | ||
US Silica Holdings Inc | 580,000 | 18,884,800 | ||
Valero Energy Corp | 74,000 | 6,801,340 | ||
Williams Cos Inc/The | 660,000 | 20,123,400 | ||
Core Laboratories NV | 75,000 |
| 8,216,250 | |
| 389,585,270 | |||
Industrials (2.7%) | ||||
Canadian Pacific Railway Ltd | 65,000 |
| 11,879,400 | |
| ||||
Materials (1.4%) | ||||
*Flotek Industries Inc | 380,000 | 1,770,800 | ||
Westlake Chemical Corp | 23,000 | 2,450,190 | ||
LyondellBasell Industries NV | 18,000 |
| 1,985,760 | |
| 6,206,750 | |||
Utilities (4.1%) | ||||
CenterPoint Energy Inc | 340,000 | 9,642,400 | ||
OGE Energy Corp | 250,000 |
| 8,227,500 | |
| 17,869,900 | |||
| ||||
TOTAL COMMON STOCKS (COST: $370,877,940) | $ | 425,541,320 | ||
| ||||
OTHER ASSETS AND LIABILITES (2.8%) | $ | 12,034,351 | ||
| ||||
NET ASSETS (100.0%) | $ | 437,575,671 | ||
| ||||
* Non-income producing | ||||
# Deemed by management to be illiquid security. See Note 2. Total market value of illiquid securities amounts to $2,069,600, representing 0.5% of net asset as of December 31, 2017. | ||||
| ||||
| ||||
The accompanying notes are an integral part of these financial statements. | ||||
FINANCIAL STATEMENTS
Statements of Assets and Liabilities | December 31, 2017 | |||||||||
| |||||||||
Dividend | Energized | Growth | |||||||
Harvest | Dividend | & Income | |||||||
Fund | Fund | Fund | |||||||
ASSETS | |||||||||
Investments in securities, at value (cost: $131,841,551, $4,669,144, and $25,858,401, respectively) | $ | 147,361,415 | $ | 5,096,161 | $ | 34,777,233 | |||
Cash and cash equivalents | 2,628,847 | 414,573 | 696,177 | ||||||
Receivable for Fund shares sold | 140,105 | 25,000 | 50,776 | ||||||
Accrued dividends receivable | 389,075 | 19,801 | 44,958 | ||||||
Accrued interest receivable | 1,036 | 97 | 528 | ||||||
Receivable from affiliate | 0 | 4 | 0 | ||||||
Prepaid expenses | 24,844 | 7,342 | 13,138 | ||||||
Total assets | $ | 150,545,322 | $ | 5,562,978 | $ | 35,582,810 | |||
| |||||||||
LIABILITIES | |||||||||
Payable for Fund shares redeemed | $ | 184,777 | $ | 6,308 | $ | 20,446 | |||
Dividends payable | 162,150 | 1,769 | 0 | ||||||
Trustees’ fees payable | 10,913 | 173 | 2,492 | ||||||
Payable to affiliates | 98,412 | 0 | 33,452 | ||||||
Accrued expenses | 15,452 | 4,149 | 10,666 | ||||||
Total liabilities | $ | 471,704 | $ | 12,399 | $ | 67,056 | |||
| |||||||||
NET ASSETS | $ | 150,073,618 | $ | 5,550,579 | $ | 35,515,754 | |||
| |||||||||
NET ASSETS ARE REPRESENTED BY: | |||||||||
Capital stock outstanding, $.001 par value, unlimited shares authorized | $ | 134,432,749 | $ | 5,123,562 | $ | 26,571,102 | |||
Accumulated undistributed net realized gain (loss) on investments | (4,273) | (426) | 0 | ||||||
Accumulated undistributed net investment income (loss) | 125,278 | 426 | 25,820 | ||||||
Unrealized appreciation (depreciation) on investments | 15,519,864 | 427,017 | 8,918,832 | ||||||
|
|
|
|
|
|
| |||
NET ASSETS | $ | 150,073,618 | $ | 5,550,579 | $ | 35,515,754 | |||
| |||||||||
Net Assets - Class A | $ | 111,695,537 | $ | 2,320,619 | $ | 34,600,272 | |||
Net Assets - Class C | $ | 17,126,344 | $ | 292,301 | $ | 225,302 | |||
Net Assets - Class I | $ | 21,251,737 | $ | 2,937,659 | $ | 690,180 | |||
Shares outstanding - Class A | 7,609,587 | 186,669 | 646,649 | ||||||
Shares outstanding - Class C | 1,173,700 | 23,569 | 4,212 | ||||||
Shares outstanding - Class I | 1,446,959 | 236,290 | 12,903 | ||||||
Net asset value per share - Class A* | $14.68 | $12.43 | $53.51 | ||||||
Net asset value per share - Class C* | $14.59 | $12.40 | $53.49 | ||||||
Net asset value per share - Class I | $14.69 | $12.43 | $53.49 | ||||||
Public offering price per share – Class A (sales charge of 5.00%) | $15.45 | $13.08 | $56.33 | ||||||
* Redemption price per share is equal to net asset value less any applicable contingent deferred sales charge. | |||||||||
The accompanying notes are an integral part of these financial statements. | |||||||||
FINANCIAL STATEMENTS
Statements of Assets and Liabilities | December 31, 2017
High | WB/MNA | |||||
Income | Stock | |||||
Fund | Fund | |||||
ASSETS | ||||||
Investments in securities, at value (cost: $30,024,281 and $370,877,940, respectively) | $ | 30,359,011 | $ | 425,541,320 | ||
Cash and cash equivalents | 1,785,983 | 13,544,921 | ||||
Receivable for Fund shares sold | 57,249 | 66,925 | ||||
Accrued dividends receivable | 1,108 | 243,660 | ||||
Accrued interest receivable | 503,705 | 6,311 | ||||
Prepaid expenses | 10,280 | 63,131 | ||||
Total assets | $ | 32,717,336 | $ | 439,466,268 | ||
| ||||||
LIABILITIES | ||||||
Payable for Fund shares redeemed | $ | 29,087 | $ | 1,142,891 | ||
Dividends payable | 31,289 | 0 | ||||
Trustees’ fees payable | 2,386 | 37,920 | ||||
Payable to affiliates | 22,615 | 554,696 | ||||
Accrued expenses | 8,386 | 155,740 | ||||
Total liabilities | $ | 93,763 | $ | 1,891,247 | ||
| ||||||
NET ASSETS | $ | 32,623,573 | $ | 437,575,021 | ||
| ||||||
NET ASSETS ARE REPRESENTED BY: | ||||||
Capital stock outstanding, $.001 par value, unlimited shares authorized | $ | 34,054,116 | $ | 546,592,033 | ||
Accumulated undistributed net realized gain (loss) on investments | (1,765,273) | (163,916,030) | ||||
Accumulated undistributed net investment income (loss) | 0 | 235,638 | ||||
Unrealized appreciation (depreciation) on investments | 334,730 | 54,663,380 | ||||
|
|
|
|
| ||
NET ASSETS | $ | 32,623,573 | $ | 437,575,021 | ||
| ||||||
Net Assets - Class A | $ | 24,628,294 | $ | 339,384,411 | ||
Net Assets - Class C | $ | 5,397,086 | $ | 37,628,853 | ||
Net Assets - Class I | $ | 2,598,193 | $ | 60,561,757 | ||
Shares outstanding - Class A | 3,155,608 | 61,931,749 | ||||
Shares outstanding - Class C | 690,033 | 6,933,193 | ||||
Shares outstanding - Class I | 333,163 | 11,079,005 | ||||
Net asset value per share - Class A* | $7.80 | $5.48 | ||||
Net asset value per share - Class C* | $7.82 | $5.43 | ||||
Net asset value per share - Class I | $7.80 | $5.47 | ||||
Public offering price per share – Class A (sales charge of 4.25% and 5.00%, respectively) | $8.15 | $5.77 | ||||
|
* Redemption price per share is equal to net asset value less any applicable contingent deferred sales charge. |
|
The accompanying notes are an integral part of these financial statements. |
FINANCIAL STATEMENTS
Statements of Operations | For the Year Ended December 31, 2017 | |||||||||
| |||||||||
Dividend | Energized | Growth | |||||||
Harvest | Dividend | & Income | |||||||
Fund | Fund | Fund | |||||||
INVESTMENT INCOME | |||||||||
Interest | $ | 7,157 | $ | 577 | $ | 3,817 | |||
Dividends (net of foreign withholding taxes of $24,307, $5,946, and $0, respectively) | 5,676,147 | 130,309 | 778,080 | ||||||
Total investment income | $ | 5,683,304 | $ | 130,886 | $ | 781,897 | |||
| |||||||||
EXPENSES | |||||||||
Investment advisory fees | $ | 1,115,027 | $ | 17,321 | $ | 337,391 | |||
Distribution (12b-1) fees - Class A | 295,833 | 3,343 | 82,782 | ||||||
Distribution (12b-1) fees - Class C | 150,779 | 1,306 | 1,777 | ||||||
Transfer agent fees | 279,602 | 16,160 | 72,725 | ||||||
Administrative service fees | 256,116 | 51,101 | 95,212 | ||||||
Professional fees | 28,611 | 3,062 | 9,074 | ||||||
Reports to shareholders | 7,769 | 738 | 6,688 | ||||||
License, fees, and registrations | 77,971 | 1,507 | 22,979 | ||||||
Audit fees | 13,284 | 209 | 2,908 | ||||||
Trustees’ fees | 10,913 | 173 | 2,492 | ||||||
Transfer agent out-of-pockets | 25,944 | 260 | 14,074 | ||||||
Custodian fees | 15,320 | 3,366 | 5,641 | ||||||
Legal fees | 10,395 | 167 | 2,395 | ||||||
Insurance expense | 4,075 | 54 | 1,102 | ||||||
Total expenses | $ | 2,291,639 | $ | 98,767 | $ | 657,240 | |||
Less expenses waived or reimbursed (See Note 7) |
| (805,475) |
| (91,773) |
| (235,224) | |||
Total net expenses | $ | 1,486,164 | $ | 6,994 | $ | 422,016 | |||
|
|
|
|
|
|
| |||
NET INVESTMENT INCOME (LOSS) | $ | 4,197,140 | $ | 123,892 | $ | 359,881 | |||
REALIZED AND UNREALIZED GAIN (LOSS) ON INVESTMENTS | |||||||||
Net realized gain (loss) from investment transactions | $ | 7,371,905 | $ | 138,192 | $ | 1,348,985 | |||
Net change in unrealized appreciation (depreciation) of investments | 3,624,853 | 246,834 | 4,092,657 | ||||||
Net realized and unrealized gain (loss) on investments | $ | 10,996,758 | $ | 385,026 | $ | 5,441,642 | |||
| |||||||||
NET INCREASE (DECREASE) IN NET ASSETS RESULTING FROM OPERATIONS | $ | 15,193,898 | $ | 508,918 | $ | 5,801,523 | |||
| |||||||||
The accompanying notes are an integral part of these financial statements. | |||||||||
FINANCIAL STATEMENTS
Statements of Operations | For the Year Ended December 31, 2017 | ||||||
| ||||||
High | WB/MNA | |||||
Income | Stock | |||||
Fund | Fund | |||||
INVESTMENT INCOME | ||||||
Interest | $ | 1,905,110 | $ | 101,052 | ||
Dividends (net of foreign withholding taxes of $0, and $190,629, respectively) | 0 | 8,232,148 | ||||
Total investment income | $ | 1,905,110 | $ | 8,333,200 | ||
| ||||||
EXPENSES | ||||||
Investment advisory fees | $ | 274,307 | $ | 2,569,616 | ||
Distribution (12b-1) fees - Class A | 62,782 | 2,105,702 | ||||
Distribution (12b-1) fees - Class C | 53,004 | 416,202 | ||||
Transfer agent fees | 50,721 | 842,852 | ||||
Administrative service fees | 93,168 | 736,068 | ||||
Professional fees | 8,642 | 97,969 | ||||
Reports to shareholders | 2,477 | 120,009 | ||||
License, fees, and registrations | 19,317 | 101,890 | ||||
Audit fees | 2,807 | 44,795 | ||||
Trustees’ fees | 2,386 | 37,920 | ||||
Transfer agent out-of-pockets | 5,793 | 297,058 | ||||
Custodian fees | 9,861 | 62,929 | ||||
Legal fees | 2,290 | 38,570 | ||||
Insurance expense | 1,017 | 16,298 | ||||
Total expenses | $ | 588,572 | $ | 7,487,878 | ||
Less expenses waived or reimbursed (See Note 7) |
| (188,884) |
| 0 | ||
Total net expenses | $ | 399,688 | $ | 7,487,878 | ||
|
|
|
|
| ||
NET INVESTMENT INCOME (LOSS) | $ | 1,505,422 | $ | 845,322 | ||
| ||||||
REALIZED AND UNREALIZED GAIN (LOSS) ON INVESTMENTS | ||||||
Net realized gain (loss) from investment transactions | $ | 141,040 | $ | (14,327,931) | ||
Net change in unrealized appreciation (depreciation) of investments | 458,293 | (46,858,694) | ||||
Net realized and unrealized gain (loss) on investments | $ | 599,333 | $ | (61,186,625) | ||
| ||||||
NET INCREASE (DECREASE) IN NET ASSETS RESULTING FROM OPERATIONS | $ | 2,104,755 | $ | (60,341,303) | ||
| ||||||
The accompanying notes are an integral part of these financial statements. | ||||||
FINANCIAL STATEMENTS
Statements of Changes in Net Assets | For the Year Ended December 31, 2017 | |||||||||
| |||||||||
Dividend | Energized | Growth | |||||||
Harvest | Dividend | & Income | |||||||
Fund | Fund | Fund | |||||||
INCREASE (DECREASE) IN NET ASSETS FROM OPERATIONS | |||||||||
Net investment income (loss) | $ | 4,197,140 | $ | 123,892 | $ | 359,881 | |||
Net realized gain (loss) from investment transactions | 7,371,905 | 138,192 | 1,348,985 | ||||||
Net change in unrealized appreciation (depreciation) of investments | 3,624,853 | 246,834 | 4,092,657 | ||||||
Net increase (decrease) in net assets resulting from operations | $ | 15,193,898 | $ | 508,918 | $ | 5,801,523 | |||
| |||||||||
DISTRIBUTIONS TO SHAREHOLDERS FROM | |||||||||
Net investment income - Class A | $ | (3,318,503) | $ | (64,608) | $ | (352,301) | |||
Net investment income - Class C | (340,432) | (6,374) | (547) | ||||||
Net investment income - Class I | (538,205) | (52,910) | (8,200) | ||||||
Net realized gain on investments - Class A | (5,792,431) | (60,024) | (2,029,196) | ||||||
Net realized gain on investments - Class C | (884,466) | (7,236) | (10,839) | ||||||
Net realized gain on investments - Class I | (1,125,623) | (79,472) | (38,245) | ||||||
Total distributions | $ | (11,999,660) | $ | (270,624) | $ | (2,439,328) | |||
| |||||||||
CAPITAL SHARE TRANSACTIONS | |||||||||
Proceeds from sale of shares - Class A | $ | 47,417,556 | $ | 1,817,688 | $ | 2,485,097 | |||
Proceeds from sale of shares - Class C | 8,292,796 | 273,560 | 44,532 | ||||||
Proceeds from sale of shares - Class I | 21,959,709 | 2,299,876 | 474,307 | ||||||
Proceeds from reinvested dividends - Class A | 8,218,352 | 120,152 | 2,257,928 | ||||||
Proceeds from reinvested dividends - Class C | 1,142,557 | 11,489 | 11,184 | ||||||
Proceeds from reinvested dividends - Class I | 1,260,766 | 130,244 | 36,834 | ||||||
Cost of shares redeemed - Class A | (53,902,467) | (909,317) | (6,387,802) | ||||||
Cost of shares redeemed - Class C | (2,982,963) | (119,695) | (29,745) | ||||||
Cost of shares redeemed - Class I | (8,098,852) | (19,151) | (81,337) | ||||||
Net increase (decrease) in net assets resulting from capital share transactions | $ | 23,307,454 | $ | 3,604,846 | $ | (1,189,002) | |||
| |||||||||
TOTAL INCREASE (DECREASE) IN NET ASSETS | $ | 26,501,692 | $ | 3,843,140 | $ | 2,173,193 | |||
NET ASSETS, BEGINNING OF PERIOD | 123,571,926 | 1,707,439 | 33,342,561 | ||||||
NET ASSETS, END OF PERIOD | $ | 150,073,618 | $ | 5,550,579 | $ | 35,515,754 | |||
| |||||||||
Accumulated undistributed net investment income | $ | 125,278 | $ | 426 | $ | 25,820 | |||
| |||||||||
| |||||||||
The accompanying notes are an integral part of these financial statements. | |||||||||
FINANCIAL STATEMENTS
Statements of Changes in Net Assets | For the Year Ended December 31, 2017 | ||||||
| ||||||
High | WB/MNA | |||||
Income | Stock | |||||
Fund | Fund | |||||
INCREASE (DECREASE) IN NET ASSETS FROM OPERATIONS | ||||||
Net investment income (loss) | $ | 1,505,422 | $ | 845,322 | ||
Net realized gain (loss) from investment transactions | 141,040 | (14,327,931) | ||||
Net change in unrealized appreciation (depreciation) of investments | 458,293 | (46,858,694) | ||||
Net increase (decrease) in net assets resulting from operations | $ | 2,104,755 | $ | (60,341,303) | ||
| ||||||
DISTRIBUTIONS TO SHAREHOLDERS FROM | ||||||
Net investment income - Class A | $ | (1,198,070) | $ | (394,224) | ||
Net investment income - Class C | (213,301) | 0 | ||||
Net investment income - Class I | (94,051) | (444,234) | ||||
Total distributions | $ | (1,505,422) | $ | (838,458) | ||
| ||||||
CAPITAL SHARE TRANSACTIONS | ||||||
Proceeds from sale of shares - Class A | $ | 1,939,264 | $ | 34,155,304 | ||
Proceeds from sale of shares - Class C | 933,233 | 4,679,451 | ||||
Proceeds from sale of shares - Class I | 2,508,280 | 68,161,442 | ||||
Proceeds from reinvested dividends - Class A | 936,421 | 360,487 | ||||
Proceeds from reinvested dividends - Class C | 168,562 | 0 | ||||
Proceeds from reinvested dividends - Class I | 46,383 | 413,209 | ||||
Cost of shares redeemed - Class A | (4,250,897) | (232,989,380) | ||||
Cost of shares redeemed - Class C | (1,097,224) | (14,153,074) | ||||
Cost of shares redeemed - Class I | (624,672) | (21,301,549) | ||||
Net increase (decrease) in net assets resulting from capital share transactions | $ | 559,350 | $ | (160,674,110) | ||
| ||||||
TOTAL INCREASE (DECREASE) IN NET ASSETS | $ | 1,158,683 | $ | (221,853,871) | ||
NET ASSETS, BEGINNING OF PERIOD | 31,464,890 | 659,428,892 | ||||
NET ASSETS, END OF PERIOD | $ | 32,623,573 | $ | 437,575,021 | ||
| ||||||
Accumulated undistributed net investment income | $ | 0 | $ | 235,638 | ||
| ||||||
| ||||||
The accompanying notes are an integral part of these financial statements. | ||||||
FINANCIAL STATEMENTS
Statements of Changes in Net Assets | For the Year/Period ended December 30, 2016 |
Dividend | Energized | Growth | |||||||
Harvest | Dividend | & Income | |||||||
Fund | Fund^ | Fund | |||||||
INCREASE (DECREASE) IN NET ASSETS FROM OPERATIONS | |||||||||
Net investment income (loss) | $ | 2,520,121 | $ | 47,603 | $ | 476,169 | |||
Net realized gain (loss) from investment transactions | 1,352,854 | 47,021 | 1,219,205 | ||||||
Net change in unrealized appreciation (depreciation) of investments | 9,899,138 | 180,183 | 1,494,053 | ||||||
Net increase (decrease) in net assets resulting from operations | $ | 13,772,113 | $ | 274,807 | $ | 3,189,427 | |||
| |||||||||
DISTRIBUTIONS TO SHAREHOLDERS FROM | |||||||||
Net investment income - Class A | $ | (2,336,837) | $ | (36,917) | $ | (470,836) | |||
Net investment income - Class C | (128,676) | (2,884) | (1,364) | ||||||
Net investment income - Class I * | (54,608) | (7,802) | (3,691) | ||||||
Net realized gain on investments - Class A | (380,656) | (27,095) | (271,638) | ||||||
Net realized gain on investments - Class C | (35,986) | (2,637) | (1,505) | ||||||
Net realized gain on investments - Class I * | (19,588) | (8,748) | (1,871) | ||||||
Total distributions | $ | (2,956,351) | $ | (86,083) | $ | (750,905) | |||
| |||||||||
CAPITAL SHARE TRANSACTIONS | |||||||||
Proceeds from sale of shares - Class A | $ | 71,646,123 | $ | 1,578,445 | $ | 3,181,552 | |||
Proceeds from sale of shares - Class C | 9,708,184 | 100,000 | 72,717 | ||||||
Proceeds from sale of shares - Class I* | 5,788,433 | 342,802 | 219,569 | ||||||
Proceeds from reinvested dividends - Class A | 2,382,811 | 63,177 | 701,553 | ||||||
Proceeds from reinvested dividends - Class C | 147,178 | 638 | 2,870 | ||||||
Proceeds from reinvested dividends - Class I * | 66,540 | 16,551 | 5,562 | ||||||
Cost of shares redeemed - Class A | (20,375,800) | (582,868) | (9,064,062) | ||||||
Cost of shares redeemed - Class C | (641,667) | 0 | (72,452) | ||||||
Cost of shares redeemed - Class I * | (82,344) | (30) | (15) | ||||||
Net increase (decrease) in net assets resulting from capital share transactions | $ | 68,639,458 | $ | 1,518,715 | $ | (4,952,706) | |||
| |||||||||
TOTAL INCREASE (DECREASE) IN NET ASSETS | $ | 79,455,220 | $ | 1,707,439 | $ | (2,514,184) | |||
NET ASSETS, BEGINNING OF PERIOD | 44,116,706 | 0 | 35,856,745 | ||||||
NET ASSETS, END OF PERIOD | $ | 123,571,926 | $ | 1,707,439 | $ | 33,342,561 | |||
| |||||||||
Accumulated undistributed net investment income | $ | 0 | $ | 0 | $ | 1,672 | |||
|
|
|
|
|
|
|
|
|
|
* All Funds began offering Class I shares August 1, 2016. | |||||||||
| |||||||||
^ Commenced operations on May 2, 2016. | |||||||||
| |||||||||
| |||||||||
The accompanying notes are an integral part of these financial statements. | |||||||||
FINANCIAL STATEMENTS
Statements of Changes in Net Assets | For the Year ended December 30, 2016 | ||||||
| ||||||
High | WB/MNA | |||||
Income | Stock | |||||
Fund | Fund | |||||
INCREASE (DECREASE) IN NET ASSETS FROM OPERATIONS | ||||||
Net investment income (loss) | $ | 1,566,635 | $ | 778,551 | ||
Net realized gain (loss) from investment transactions | (974,804) | (77,646,904) | ||||
Net change in unrealized appreciation (depreciation) of investments | 3,517,886 | 268,699,326 | ||||
Net increase (decrease) in net assets resulting from operations | $ | 4,109,717 | $ | 191,830,973 | ||
| ||||||
DISTRIBUTIONS TO SHAREHOLDERS FROM | ||||||
Net investment income - Class A | $ | (1,310,371) | $ | (715,220) | ||
Net investment income - Class C | (245,630) | 0 | ||||
Net investment income - Class I * | (10,634) | (63,331) | ||||
Return of capital - Class A | 0 | (312,604) | ||||
Return of capital - Class I * | 0 | (27,681) | ||||
Total distributions | $ | (1,566,635) | $ | (1,118,836) | ||
| ||||||
CAPITAL SHARE TRANSACTIONS | ||||||
Proceeds from sale of shares - Class A | $ | 2,970,740 | $ | 84,107,881 | ||
Proceeds from sale of shares - Class C | 332,568 | 9,718,011 | ||||
Proceeds from sale of shares - Class I * | 644,408 | 14,157,242 | ||||
Proceeds from reinvested dividends - Class A | 1,025,633 | 935,083 | ||||
Proceeds from reinvested dividends - Class C | 183,595 | 0 | ||||
Proceeds from reinvested dividends - Class I * | 9,848 | 90,390 | ||||
Cost of shares redeemed - Class A | (4,895,807) | (157,289,805) | ||||
Cost of shares redeemed - Class C | (1,342,341) | (10,920,586) | ||||
Cost of shares redeemed - Class I * | (14,204) | (298,455) | ||||
Net increase (decrease) in net assets resulting from capital share transactions | $ | (1,085,560) | $ | (59,500,239) | ||
| ||||||
TOTAL INCREASE (DECREASE) IN NET ASSETS | $ | 1,457,522 | $ | 131,211,898 | ||
NET ASSETS, BEGINNING OF PERIOD | 30,007,368 | 528,216,994 | ||||
NET ASSETS, END OF PERIOD | $ | 31,464,890 | $ | 659,428,892 | ||
| ||||||
Accumulated undistributed net investment income | $ | 0 | $ | 0 | ||
| ||||||
* All Funds began offering Class I shares on August 1, 2016. | ||||||
| ||||||
| ||||||
The accompanying notes are an integral part of these financial statements. | ||||||
NOTES TO FINANCIAL STATEMENTS (unaudited)
NOTE 1: Organization
The Integrity Funds (the “Trust”) was organized as a Delaware statutory trust on October 31, 1997 and commenced operations on October 31, 1997. The Trust is registered under the Investment Company Act of 1940 as an open-end management investment company, consisting of five series (the “Funds”).
Integrity Dividend Harvest Fund (the “Dividend Harvest Fund”), a non-diversified fund, seeks high current income with long term appreciation as a secondary objective. Integrity Energized Dividend Fund (the “Energized Dividend Fund”), a non-diversified fund, seeks long-term appreciation while providing high current income. Integrity Growth & Income Fund (the “Growth & Income Fund”), a diversified fund, seeks to provide long-term growth of capital with dividend income as a secondary objective. Integrity High Income Fund (the “High Income Fund”), a non-diversified fund, seeks a high level of current income with capital appreciation as a secondary objective. Williston Basin/Mid-North America Stock Fund (the “WB/MNA Stock Fund”), a diversified fund, seeks to provide long-term growth through capital appreciation.
Each Fund in the Trust currently offers Class A, C, and I shares. The Class A shares of Dividend Harvest Fund, Energized Dividend Fund, Growth & Income Fund, High Income Fund, and WB/MNA Stock Fund are sold with an initial sales charge of 5.00%, 5.00%, 5.00%, 4.25%, and 5.00%, respectively, and a distribution fee of up to 0.25% on an annual basis. Class C shares are sold without a sales charge and are subject to a distribution fee of up to 1.00% on an annual basis. Class I shares are sold without a sales charge or distribution fee. The three classes of shares represent interest in each Fund’s same portfolio of investments, have the same rights, and are generally identical in all respects except that each class bears its separate distribution and certain other class expenses and has exclusive voting rights with respect to any matter on which a separate vote of any class is required.
Each Fund is an investment company and, accordingly, follows the investment company accounting and reporting guidance of the Financial Accounting Standards Board (FASB) Accounting Standard Codification Topic 946 Financial Services – Investment Companies.
NOTE 2: Summary of Significant Accounting Policies
Investment security valuation—Securities for which market quotations are available are valued as follows: (a) Listed securities are valued at the closing price obtained from the respective primary exchange on which the security is listed or, if there were no sales on that day, at its last reported current bid price; (b) Unlisted securities are valued at the last current bid price obtained from the National Association of Securities Dealers’ Automated Quotation System. The Funds’ administrative services agent, Integrity Fund Services, LLC (“Integrity Fund Services” or “IFS”) obtains all of these prices from services that collect and disseminate such market prices. Prices provided by an independent pricing service may be determined without exclusive reliance on quoted prices and may take into account appropriate factors such as: institutional-size trading in similar groups of securities, yield, quality, coupon rate, maturity, type of issue, trading characteristics, and other market data. In the absence of an ascertainable market value, assets are valued at their fair value as determined by IFS using methods and procedures reviewed and approved by the Board of Trustees. Refer to Note 3 for further disclosures related to the inputs used to value the Funds’ investments. Shares of a registered investment company, including money market funds, that are not traded on an exchange are valued at the investment company’s net asset value per share.
When-issued securities—The Funds may purchase securities on a when-issued basis. Payment and delivery may take place after the customary settlement period for that security. The price of the underlying securities and the date when the securities will be delivered and paid for are fixed at the time the transaction is negotiated. The values of the securities purchased on a when-issued basis are identified as such in each Fund’s Schedule of Investments. With respect to purchase commitments, the Fund identifies securities as segregated in its custodial records with a value at least equal to the amount of the commitment. Losses may arise due to changes in the value of the underlying securities, if the counterparty does not perform under the contract’s terms, or if the issuer does not issue the securities due to political, economic, or other factors.
Contingent deferred sales charge—Investments in Class A shares of $1 million or more may be subject to a 1.00% contingent deferred sales charge (“CDSC”) if redeemed within 24 months of purchase (excluding shares purchased with reinvested dividends and/or distributions). Investments in Class C shares (in any amount) may be subject to a 1.00% CDSC if redeemed within 12 months of purchase.
Federal and state income taxes—Each Fund is a separate taxpayer for federal income tax purposes. Each Fund’s policy is to comply with the requirements of the Internal Revenue Code that are applicable to regulated investment companies and to distribute substantially all of its net investment income and any net realized gain on investments to its shareholders; therefore, no provision for income taxes is required.
As of and during the year/period ended December 31, 2017, the Funds did not have a liability for any unrecognized tax benefits. The Funds recognize interest and penalties, if any, related to unrecognized tax benefits as income tax expense in the statement of operations. During the year, the Funds did not incur any interest or penalties.
For all open tax years and all major taxing jurisdictions, management of the Funds has concluded that there are no significant uncertain tax positions that would require recognition in the financial statements. Open tax years are those that are open for examination by taxing authorities. Furthermore, management of the Funds is also not aware of any tax positions for which it is reasonably possible that the total amounts of unrecognized tax benefits will significantly change in the next twelve months.
Premiums and discounts—Premiums and discounts on debt securities are accreted and amortized using the effective yield method over the lives of the respective securities for financial statement purposes.
Cash and cash equivalents—The Funds consider investments in an FDIC insured interest bearing savings account to be cash. The Fund maintains cash balances, which, at times, may exceed federally insured limits. The Fund maintains these balances with a high quality financial institution.
Security transactions, investment income, expenses and distributions—Income and expenses are recorded on the accrual basis. Investment transactions are accounted for on the trade date. Realized gains and losses are reported on the specific identification basis. Interest income and estimated expenses are accrued daily. Dividend income is recognized on the ex-dividend date. Withholding taxes on foreign dividends have been provided for in accordance with the Funds’ understanding of the applicable countries’ tax rules and regulations. The Dividend Harvest Fund, Energized Dividend Fund, Growth & Income Fund, and WB/MNA Stock Fund will declare and pay dividends from net investment income at least annually. The High Income Fund declares dividends from net investment income daily and pays such dividends monthly. Dividends are reinvested in additional shares of the Funds at net asset value or paid in cash. Capital gains, when available, are distributed at least annually. Distributions to shareholders are recorded on the ex-dividend date. Income and capital gain distributions are determined in accordance with federal income tax regulations and may differ from net investment income and realized gains determined in accordance with accounting principles generally accepted in the United States of America. These differences are primarily due to differing treatments for capital loss carryforwards and losses due to wash sales. In addition, other amounts have been reclassified within the composition of net assets to more appropriately conform financial accounting to tax basis treatment.
Permanent book and tax basis differences relating to shareholder distributions will result in reclassifications to paid-in capital. Temporary book and tax basis differences will reverse in a subsequent period.
Use of estimates—The financial statements have been prepared with accounting principles generally accepted in the United States of America (“GAAP”), which requires management to make estimates and assumptions that affect the reported amounts of assets and liabilities and disclosure of contingent assets and liabilities at the date of the financial statements and the reported amounts of revenues and expenses during the reporting period. Actual results could differ from those estimates.
Common expenses—Common expenses of the Trust are allocated among the Funds within the Trust based on relative net assets of each Fund or the nature of the services performed and the relative applicability to each Fund.
Multiple class allocations—The High Income Fund simultaneously uses the settled shares method to allocate income and fund-wide expenses and uses the relative net assets method to allocate gains and losses. Dividend Harvest Fund, Energized Dividend Fund, Growth & Income Fund, and WB/MNA Stock Fund use the relative net assets method to allocate income, fund-wide expenses, gains and losses. Class-specific expenses, distribution fees, and any other items that are specifically attributable to a particular class are charged directly to such class.
Illiquid securities—A security may be considered to be illiquid if it has a limited trading market. Securities are generally considered to be liquid if they can be sold or disposed of in the ordinary course of business within seven days at approximately the price at which the security is valued by the Funds. These securities are valued at fair value as described above. Each Fund intends to hold no more than 15% of its net assets in illiquid securities. Of the illiquid securities listed on the Schedule of Investments, the following securities are considered to be restricted as of December 31, 2017:
High Income Fund | Shares | Dates Acquired | Cost Basis | Fair Value |
VICI Properties, Inc – Common Stock | 20,727 | 10/9/17 | 229,642 | 424,904 |
Reichhold Cayman – Private Equity | 162 | 4/1/15 | 120,561 | 140,130 |
NOTE 3: Fair Value Measurements
Various inputs are used in determining the value of the Funds' investments. These inputs are summarized in three broad levels: Level 1 inputs are based on quoted prices in active markets for identical securities. Level 2 inputs are based on significant observable inputs (including quoted prices for similar securities, interest rates, prepayment speeds, credit risk, etc.). Level 3 inputs are based on significant unobservable inputs (including the Funds’ own assumptions in determining the fair value of investments). The following is a summary of the inputs used to value the Funds’ investments as of December 31, 2017:
Dividend Harvest Fund | Level 1 | Level 2 | Level 3 | Total | ||||||||
Common Stocks | $ | 147,361,415 | $ | 0 | $ | 0 | $ | 147,361,415 | ||||
Total | $ | 147,361,415 | $ | 0 | $ | 0 | $ | 147,361,415 | ||||
| ||||||||||||
Energized Dividend Fund | Level 1 | Level 2 | Level 3 | Total | ||||||||
Common Stocks | $ | 5,096,161 | $ | 0 | $ | 0 | $ | 5,096,161 | ||||
Total | $ | 5,096,161 | $ | 0 | $ | 0 | $ | 5,096,161 | ||||
| ||||||||||||
Growth & Income Fund | Level 1 | Level 2 | Level 3 | Total | ||||||||
Common Stocks | $ | 34,777,233 | $ | 0 | $ | 0 | $ | 34,777,233 | ||||
Total | $ | 34,777,233 | $ | 0 | $ | 0 | $ | 34,777,233 | ||||
| ||||||||||||
High Income Fund | Level 1 | Level 2 | Level 3 | Total | ||||||||
Common Stocks | $ | 619,356 | $ | 48,052 | $ | 0 | $ | 667,408 | ||||
Private Equity | 0 | 0 | 140,130 | 140,130 | ||||||||
Corporate Bonds | 0 | 29,551,473 | 0 | 29,551,473 | ||||||||
Warrants |
| 0 |
| 0 |
| 0 |
| 0 | ||||
Total | $ | 619,356 | $ | 29,599,525 | $ | 140,130 | $ | 30,359,011 | ||||
| ||||||||||||
WB/MNA Stock Fund | Level 1 | Level 2 | Level 3 | Total | ||||||||
Common Stocks | $ | 425,541,320 | $ | 0 | $ | 0 | $ | 425,541,320 | ||||
Total | $ | 425,541,320 | $ | 0 | $ | 0 | $ | 425,541,320 | ||||
Please refer to the Schedules of Investments for sector classification. There were no transfers into or out of Level 1 or Level 2 during the year ended December 31, 2017. The Funds consider transfers into or out of Level 1 and Level 2 as of the end of the reporting period. The Funds did not hold any derivative instruments at any time during the year ended December 31, 2017.
A reconciliation of Level 3 investments, including certain disclosures related to significant inputs used in valuing Level 3 investments, is presented when a Fund has a significant amount of Level 3 investments at the beginning and/or end of the period in relation to net assets.
The changes of the fair value of investments during the year ended December 31, 2017 , for which the Funds have used Level 3 inputs to determine the fair value are as follow:
Balance as | Amortization/ | Change in unrealized | Balance as | ||
High Income Fund | of 12/30/16 | Sales | accretion | appreciation/depreciation | of 12/31/17 |
Private Equity | $106,758 | $0 | $0 | $33,372 | $140,130 |
Term Loans | $180,147 | ($180,147) | $0 | $0 | $0 |
Asset Class |
| Fair Value at December 31, 2017 |
| Valuation Technique |
| Unobservable Inputs |
| Multiple |
| Impact to Valuation From Input Increases |
Private Equity |
| $140,130 |
| Market Approach |
| EBITDA Multiple |
| 7.2x |
| Increase |
Unobservable inputs used in the fair value measurement of the Funds’ investments are listed above. Significant changes in any of the unobservable inputs may significantly impact the fair value measurement. Significant increases (decreases) in working capital may increase (decrease) the fair value measurement.
NOTE 4: Investment Transactions
Purchases and sales of investment securities (excluding short-term securities) for the year ended December 31, 2017, were as follows:
Dividend | Energized | Growth & | High | WB/MNA | ||||||
Harvest Fund | Dividend Fund | Income Fund | Income Fund | Stock Fund | ||||||
Purchases | $79,985,106 | $4,406,246 | $10,764,068 | $9,146,090 | $205,838,909 | |||||
Sales | $65,590,599 | $1,396,641 | $14,511,659 | $8,816,478 | $351,981,418 |
NOTE 5: Capital Share Transactions
Transactions in capital shares were as follows:
Year Ended 12/31/17: | Dividend | Energized | Growth & | High | WB/MNA | |||||
| Harvest | Dividend | Income | Income | Stock | |||||
Class A | Fund | Fund | Fund | Fund | Fund | |||||
Shares sold | 3,235,571 | 152,980 | 46,691 | 248,568 | 6,270,079 | |||||
Shares issued from reinvestments | 556,988 | 10,014 | 42,102 | 120,018 | 65,782 | |||||
Shares redeemed | (3,669,437) | (81,700) | (122,899) | (545,362) | (44,411,374) | |||||
Net increase (decrease) | 123,122 | 81,294 | (34,106) | (176,776) | (38,075,513) | |||||
| ||||||||||
Class C | ||||||||||
Shares sold | 570,659 | 22,657 | 832 | 119,496 | 874,007 | |||||
Shares issued from reinvestments | 77,901 | 938 | 209 | 21,546 | 0 | |||||
Shares redeemed | (203,612) | (10,088) | (583) | (140,622) | (2,751,346) | |||||
Net increase (decrease) | 444,948 | 13,507 | 458 | 420 | (1,877,339) | |||||
| ||||||||||
Class I | ||||||||||
Shares sold | 1,497,044 | 192,506 | 9,084 | 322,665 | 12,629,137 | |||||
Shares issued from reinvestments | 85,332 | 10,617 | 687 | 5,942 | �� | 75,541 | ||||
Shares redeemed | (547,196) | (1,607) | (1,574) | (80,068) | (4,141,731) | |||||
Net increase (decrease) | 1,035,180 | 201,516 | 8,197 | 248,539 | 8,562,947 | |||||
| ||||||||||
Year Ended 12/30/16: | Dividend | Energized | Growth & | High | WB/MNA | |||||
| Harvest | Dividend | Income | Income | Stock | |||||
Class A | Fund | Fund | Fund | Fund | Fund | |||||
Shares sold | 5,262,672 | 155,113 | 69,369 | 400,852 | 17,719,326 | |||||
Shares issued from reinvestments | 170,305 | 5,686 | 14,459 | 139,196 | 157,160 | |||||
Shares redeemed | (1,496,270) | (55,424) | (194,834) | (668,318) | (31,657,888) | |||||
Net increase (decrease) | 3,936,707 | 105,375 | (111,006) | (128,270) | (13,781,402) | |||||
| ||||||||||
Class C | ||||||||||
Shares sold | 710,008 | 10,000 | 1,567 | 44,168 | 2,111,198 | |||||
Shares issued from reinvestments | 10,453 | 62 | 59 | 24,895 | 0 | |||||
Shares redeemed | (48,412) | 0 | (1,608) | (183,873) | (2,184,967) | |||||
Net increase (decrease) | 672,049 | 10,062 | 18 | (114,810) | (73,769) | |||||
| ||||||||||
Class I | ||||||||||
Shares sold | 412,967 | 33,313 | 4,591 | 85,189 | 2,552,259 | |||||
Shares issued from reinvestments | 4,647 | 1,464 | 115 | 1,291 | 15,217 | |||||
Shares redeemed | (5,835) | (3) | 0 | (1,856) | (51,418) | |||||
Net increase (decrease) | 411,779 | 34,774 | 4,706 | 84,624 | 2,516,058 |
NOTE 6: Income Tax Information
At December 31, 2017, the unrealized appreciation (depreciation) based on the cost of investments for federal income tax purposes was as follows:
|
| Dividend |
| Energized |
| Growth & |
| High |
| WB/MNA |
Investments at cost |
| $131,720,546 |
| $4,673,847 |
| $25,832,581 |
| $30,025,966 |
| $370,642,302 |
Unrealized appreciation |
| 16,300,648 |
| 450,722 |
| 9,293,612 |
| 1,261,235 |
| 70,184,102 |
Unrealized depreciation |
| (659,779) |
| (28,408) |
| (348,960) |
| (928,190) |
| (15,285,084) |
Net unrealized appreciation (depreciation)* |
| $15,640,869 |
| $422,314 |
| $8,944,652 |
| $333,045 |
| $54,899,018 |
| ||||||||||
*Differences between financial reporting-basis and tax-basis unrealized appreciation/ (depreciation) are due to differing treatment of wash sales.
| ||||||||||
The tax character of distributions paid was as follows:
Year Ended 12/31/17: |
| Dividend Harvest Fund |
| Energized Dividend Fund |
| Growth & Income Fund |
| High |
| WB/MNA Stock Fund |
Ordinary Income |
| $6,843,837 |
| $227,037 |
| $597,288 |
| $1,505,422 |
| $609,684 |
Capital Gain |
| 5,030,545 |
| 43,587 |
| 1,816,724 |
| 0 |
| 0 |
Return of Capital |
| 125,278 |
| 0 |
| 25,316 |
| 0 |
| 228,774 |
Total |
| $11,999,660 |
| $270,624 |
| $2,439,328 |
| $1,505,422 |
| $838,458 |
Year Ended 12/30/16: |
| Dividend Harvest Fund |
| Energized Dividend Fund |
| Growth & Income Fund |
| High |
| WB/MNA Stock Fund |
Ordinary Income |
| $2,956,351 |
| $86,083 |
| $475,891 |
| $1,566,635 |
| $778,551 |
Capital Gain |
| 0 |
| 0 |
| 275,014 |
| 0 |
| 0 |
Return of Capital |
| 0 |
| 0 |
| 0 |
| 0 |
| 340,285 |
Total |
| $2,956,351 |
| $86,083 |
| $750,905 |
| $1,566,635 |
| $1,118,836 |
As of December 31, 2017, the components of accumulated earnings/(deficit) on a tax basis were as follows:
|
| Dividend |
| Energized |
| Growth & |
| High |
| WB/MNA |
Undistributed ordinary |
| $0 |
| $1,097 |
| $0 |
| $0 |
| $0 |
Accumulated capital and |
| $0 |
| $3,606 |
| $0 |
| ($1,763,588) |
| ($163,916,030) |
Unrealized appreciation/ (depreciation)* |
| 15,640,869 |
| 422,314 |
| 8,944,652 |
| 333,045 |
| 54,899,018 |
Total accumulated earnings/ (deficit) |
| $15,640,869 |
| $427,017 |
| $8,944,652 |
| ($1,430,543) |
| ($109,017,012) |
| ||||||||||
*Differences between financial reporting-basis and tax-basis unrealized appreciation/(depreciation) are due to differing treatment of wash sales and temporary return of capital adjustments. | ||||||||||
Net capital losses incurred after October 31 and within the tax year are deemed to arise on the first business day of the Funds’ next taxable year.
Under the Regulated Investment Company Modernization Act of 2010 (“Act”), funds are permitted to carry forward capital losses incurred in taxable years beginning after December 22, 2010, for an unlimited period of time. The short-term and long-term character of such losses are retained rather than being treated as short-term as under previous law. Pre-enactment losses are eligible to be carried forward for a maximum period of eight years. Pursuant to the Act, post-enactment capital losses must be utilized before pre-enactment capital losses. As a result, pre-enactment capital loss carryforwards may be more likely to expire unused. The Funds’ capital loss carryforward amounts as of December 31, 2017, are as follows:
|
| High Income Fund |
| WB/MNA Stock Fund |
Expires in 2018 |
| $794,228 |
| $0 |
Non-expiring short-term losses |
| 0 |
| 85,121,812 |
Non-expiring long-term losses |
| 969,360 |
| 78,794,218 |
Total Capital Loss Carryforwards |
| $1,763,588 |
| $163,916,030 |
For the year ended December 31, 2017, the High Income Fund had expired capital loss carryforwards of $14,842,642, which was reclassified to paid in capital. High Income Fund utilized $93,871 of capital loss carryforwards against current year capital gains. Dividend Harvest Fund reclassified $125,278 of paid in capital to accumulated net investment income and $1 of paid in capital to accumulated gain/loss. Energized Dividend Fund reclassified $426 of accumulated gain/loss to accumulated net investment income. Growth & Income Fund and WB/MNA Stock Fund reclassified paid in capital to accumulated net investment income of $25,316 and $228,774, respectively.
NOTE 7: Investment Advisory Fees and Other Transactions with Affiliates
Viking Fund Management (“VFM”), the Funds’ investment adviser; Integrity Funds Distributor, LLC (“Integrity Funds Distributor” or “IFD”), the Funds’ underwriter and distributor; and Integrity Fund Services, the Funds’ transfer, accounting, and administrative services agent; are subsidiaries of Corridor Investors, LLC (“Corridor Investors” or “Corridor”), the Funds’ sponsor. For Integrity High Income Fund, JPMIM is the sub-adviser. A Trustee of the Funds is also a Governor of Corridor.
VFM provides investment advisory and management services to the Funds. The Investment Advisory Agreement (the “Advisory Agreement”) provides for fees to be computed at an annual rate of each Fund’s average daily net assets. VFM has also contractually agreed to waive its management fee and to reimburse expenses, other than extraordinary or non-recurring expenses, taxes, brokerage fees, commissions and acquired fund fees and expenses, so that the net annual operating expenses do not exceed a certain rate. After April 30, 2018 (April 30, 2019 for High Income Fund), the expense limitations may be terminated or revised.
|
|
| Contractual Waiver % | ||||
| Advisory Fee % |
| Class A |
| Class C |
| Class I |
Dividend Harvest Fund | 0.75% |
| 0.95% |
| 1.70% |
| 0.70% |
Energized Dividend Fund | 0.75% |
| 1.05% |
| 1.80% |
| 0.80% |
Growth & Income Fund | 1.00% |
| 1.25% |
| 2.00% |
| 1.00% |
High Income Fund* | 0.85% |
| 0.89% |
| 1.64% |
| 0.64% |
WB/MNA Stock Fund | 0.50% |
| 1.50% |
| 2.00% |
| 1.00% |
| |||||||
* From January 1, 2017 through November 30, 2017 the contractual waivers were 1.15%, 1.90%, and 0.90% for Class A, C, and I, respectively.
| |||||||
VFM and affiliated service providers may also voluntarily waive fees or reimburse expenses not required under the advisory or other contracts from time to time. Accordingly, after voluntary and contractual fee waivers and reimbursements, the Energized Dividend Fund’s actual total expenses for Class A, C, and I were 0.35%, 1.10%, and 0.10%, respectively, of average daily net assets for the year ended December 31, 2017. VFM and the affiliated service providers agreed to waive the affiliated service provider’s fees before waiving VFM’s management fee for the period January 1, 2017 through May 12, 2017. There are no recoupment provisions in place for waived/reimbursed fees. An expense limitation lowers expense ratios and increases returns to investors. VFM received payment of or credit for advisor related expenses used for the WB/MNA Stock Fund’s benefit. Certain Officers of the Funds are also Officers and Governors of VFM.
Year Ended 12/31/17 | Payable 12/31/17 | ||||||
Advisory Fees* | Advisory Fees Waived | Advisory Fees* | |||||
Dividend Harvest Fund | $ | 391,554 | $ | 723,473 | $ | 24,660 | |
Energized Dividend Fund | $ | 0 | $ | 17,321^ | $ | 0+ | |
Growth & Income Fund | $ | 127,804 | $ | 209,587 | $ | 8,952 | |
High Income Fund | $ | 105,933 | $ | 168,374 | $ | 630 | |
WB/MNA Stock Fund | $ | 2,569,616 | $ | 0 | $ | 172,799 | |
| |||||||
* After waivers and reimbursements, if any. | |||||||
| |||||||
^ Advisor reimbursed $52,958 | |||||||
| |||||||
+ Advisor waived $2,832 in advisory fees payable and reimbursed $6,348 of fees payable to affiliates and other accrued expenses at year-end. | |||||||
IFD serves as the principal underwriter and distributor for the Funds and receives sales charges deducted from Fund share sales proceeds and CDSC from applicable Fund share redemptions. Also, the Funds have adopted a distribution plan for each class of shares as allowed by Rule 12b-1 of the 1940 Act. Distribution plans permit the Funds to reimburse its principal underwriter for costs related to selling shares of the Funds and for various other services. These costs, which consist primarily of commissions and service fees to broker-dealers who sell shares of the Funds, are paid by shareholders through expenses called “Distribution Plan expenses.” The Funds currently pay an annual distribution fee and/or service fee of up to 0.25% (0.50% for WB/MNA Stock Fund) for Class A and 1.00% for Class C of the average daily net assets. Class I shares do not have a 12b-1 plan in place. Certain Officers of the Funds are also Officers and Governors of IFD.
Year Ended 12/31/17 | Payable 12/31/17 | ||||||||||||
Sales |
| Distribution | Sales |
| Distribution | ||||||||
Charges | CDSC | Fees* | Charges | CDSC | Fees* | ||||||||
Dividend Harvest Fund - A | $ | 938,590 | $ | 0 | $ | 295,833 | $ | 0 | $ | 0 | $ | 22,086 | |
Dividend Harvest Fund - C | $ | 0 | $ | 9,347 | $ | 150,779 | $ | 0 | $ | 0 | $ | 13,557 | |
Energized Dividend Fund - A | $ | 45,905 | $ | 0 | $ | 3,343 | $ | 0 | $ | 0 | $ | 378 | |
Energized Dividend Fund - C | $ | 0 | $ | 0 | $ | 1,306 | $ | 0 | $ | 0 | $ | 172 | |
Growth & Income Fund - A | $ | 27,722 | $ | 0 | $ | 82,782 | $ | 0 | $ | 0 | $ | 6,856 | |
Growth & Income Fund - C | $ | 0 | $ | 0 | $ | 1,777 | $ | 0 | $ | 0 | $ | 147 | |
High Income Fund - A | $ | 32,708 | $ | 0 | $ | 62,782 | $ | 0 | $ | 0 | $ | 4,862 | |
High Income Fund - C | $ | 0 | $ | 42 | $ | 53,004 | $ | 0 | $ | 0 | $ | 4,242 | |
WB/MNA Stock Fund - A | $ | 672,203 | $ | 244 | $ | 2,105,702 | $ | 0 | $ | 0 | $ | 133,884 | |
WB/MNA Stock Fund - C | $ | 0 | $ | 10,834 | $ | 416,202 | $ | 0 | $ | 0 | $ | 29,368 | |
IFS acts as the transfer agent for High Income Fund at a monthly variable fee equal to 0.12% on the first $0 to $200 million and at a lower rate in excess of $200 million of the Fund’s average daily net assets on an annual basis and an additional fee of $500 per month for each additional share class plus reimbursement of out-of-pocket expenses and sub-transfer agent out-of-pocket expenses. IFS acts as the transfer agent for Dividend Harvest Fund, Energized Dividend Fund, Growth & Income Fund, and WB/MNA Stock Fund at a monthly variable fee equal to 0.18% on the first $0 to $200 million, 0.15% on the next $200 to $700 million and at a lower rate in excess of $700 million of the Funds’ average daily net assets on an annual basis plus reimbursement of out-of-pocket expenses and sub-transfer agent out-of-pocket expenses. Sub-transfer agent out-of-pocket expenses are included in the transfer agent fees below and in the transfer agent out-of-pocket balance on the Statements of Operations.
IFS also acts as the Funds’ administrative services agent for a monthly fee equal to the sum of a fixed fee of $2,000 and a variable fee equal to 0.14% on the first $0 to $200 million, 0.13% on the next $200 to $700 million and at a lower rate in excess of $700 million of the Funds’ average daily net assets on an annual basis plus reimbursement of out-of-pocket expenses and an additional fee of $1,000 per month for each additional share class. Certain Officers of the Funds are also Officers and Governors of IFS.
Year Ended 12/31/17 | Payable 12/31/17 | ||||||||||||
Transfer | Transfer | Admin. | Admin. | Transfer | Admin. | ||||||||
Agency | Agency | Service | Service | Agency | Service | ||||||||
Fees* | Fees Waived | Fees* | Fees Waived | Fees* | Fees* | ||||||||
Dividend Harvest Fund | $ | 262,888 | $ | 42,658 | $ | 216,772 | $ | 39,344 |
| $ | 17,657 | $ | 20,452 |
Energized Dividend Fund | $ | 11,394 | $ | 5,026 | $ | 34,633 | $ | 16,468 |
| $ | 1,452 | $ | 4,342 |
Growth & Income Fund | $ | 75,701 | $ | 11,098 | $ | 80,673 | $ | 14,539 |
| $ | 9,752 | $ | 7,745 |
High Income Fund | $ | 49,311 | $ | 7,203 | $ | 79,861 | $ | 13,307 |
| $ | 5,471 | $ | 7,410 |
WB/MNA Stock Fund | $ | 1,139,910 | $ | 0 | $ | 736,068 | $ | 0 |
| $ | 168,426 | $ | 50,219 |
| |||||||||||||
* After waivers and reimbursements, if any. | |||||||||||||
NOTE 8: Principal Risks
The High Income Fund may be invested in lower-rated debt securities that have a higher risk of default or loss of value since these securities may be sensitive to economic changes, political changes or adverse developments specific to the issuer.
The WB/MNA Stock Fund invests significantly in relatively few sectors, primarily the energy sector, and has more exposure to the price movement of this sector than funds that diversify their investments among many sectors.
NOTE 9: Subsequent Events
The Funds are required to recognize in the financial statements the effects of all subsequent events that provide additional evidence about conditions that existed at the date of the Statements of Assets and Liabilities. For non-recognized subsequent events that must be disclosed to keep the financial statements from being misleading, the Funds are required to disclose the nature of the event as well as an estimate of its financial effect, or a statement that such an estimate cannot be made. Management has evaluated the impact of all subsequent events on the Funds through the issuance date of these financial statements and has noted no such events requiring disclosure.
INTEGRITY DIVIDEND HARVEST FUND CLASS A
FINANCIAL HIGHLIGHTS
Selected per share data and ratios for the periods indicated
Year | Year | Year | Year | Year | |||||||||||
Ended | Ended | Ended | Ended | Ended | |||||||||||
12/31/17 | 12/30/16 | 12/31/15 | 12/31/14 | 12/31/13 | |||||||||||
NET ASSET VALUE, BEGINNING OF PERIOD | $ | 14.33 | $ | 12.23 | $ | 12.64 | $ | 12.05 | $ | 10.03 | |||||
| |||||||||||||||
Income (loss) from investment operations: | |||||||||||||||
Net investment income (loss) | $ | 0.41 | $ | 0.39 | $ | 0.37 | $ | 0.36 | $ | 0.34 | |||||
Net realized and unrealized gain (loss) on investments 2 | 1.16 | 2.15 | (0.24) | 1.01 | 2.03 | ||||||||||
Total from investment operations | $ | 1.57 | $ | 2.54 | $ | 0.13 | $ | 1.37 | $ | 2.37 | |||||
| |||||||||||||||
Less Distributions: | |||||||||||||||
Dividends from net investment income | $ | (0.41) | $ | (0.39) | $ | (0.37) | $ | (0.36) | $ | (0.34) | |||||
Distributions from net realized gains | (0.81) | (0.05) | (0.17) | (0.42) | (0.01) | ||||||||||
Total distributions | $ | (1.22) | $ | (0.44) | $ | (0.54) | $ | (0.78) | $ | (0.35) | |||||
| |||||||||||||||
NET ASSET VALUE, END OF PERIOD | $ | 14.68 | $ | 14.33 | $ | 12.23 | $ | 12.64 | $ | 12.05 | |||||
| |||||||||||||||
Total Return (excludes any applicable sales charge) | 11.10% | 20.94% | 1.12% | 11.42% | 23.88% | ||||||||||
| |||||||||||||||
RATIOS/SUPPLEMENTAL DATA | |||||||||||||||
Net assets, end of period (in thousands) | $111,696 | $107,275 | $43,425 | $29,645 | $19,581 | ||||||||||
Ratio of expenses to average net assets after waivers 1 | 0.95% | 0.95% | 0.85% | 0.60% | 0.45% | ||||||||||
Ratio of expenses to average net assets before waivers | 1.49% | 1.55% | 1.58% | 1.59% | 1.76% | ||||||||||
Ratio of net investment income to average net assets 1 | 2.88% | 3.26% | 3.18% | 2.98% | 3.29% | ||||||||||
Portfolio turnover rate | 44.89% | 25.56% | 38.38% | 32.99% | 26.44% | ||||||||||
1 | This row reflects the impact, if any, of fee waivers or reimbursements by the Adviser and/or affiliated service providers. |
2 | Realized and unrealized gains and loss per share in this caption are balancing amounts necessary to reconcile the change in net asset value per share for the period, and may not reconcile with the aggregate gains and losses in the statement of operations due to share transactions for the period. |
Total return represents the rate that an investor would have earned or lost on an investment in the Fund assuming reinvestment of all dividends and distributions.
The accompanying notes are an integral part of these financial statements.
INTEGRITY DIVIDEND HARVEST FUND CLASS C
FINANCIAL HIGHLIGHTS
Selected per share data and ratios for the periods indicated
Period | |||||||||
Year | Year | From | |||||||
Ended | Ended | 8/3/15^ to | |||||||
12/31/17 | 12/30/16 | 12/31/15 | |||||||
NET ASSET VALUE, BEGINNING OF PERIOD | $ | 14.26 | $ | 12.20 | $ | 12.54 | |||
| |||||||||
Income (loss) from investment operations: | |||||||||
Net investment income (loss) | $ | 0.31 | $ | 0.31 | $ | 0.18 | |||
Net realized and unrealized gain (loss) on investments 2 | 1.14 | 2.11 | (0.17) | ||||||
Total from investment operations | $ | 1.45 | $ | 2.42 | $ | 0.01 | |||
| |||||||||
Less Distributions: | |||||||||
Dividends from net investment income | $ | (0.31) | $ | (0.31) | $ | (0.18) | |||
Distributions from net realized gains | (0.81) | (0.05) | (0.17) | ||||||
Total distributions | $ | (1.12) | $ | (0.36) | $ | (0.35) | |||
| |||||||||
NET ASSET VALUE, END OF PERIOD | $ | 14.59 | $ | 14.26 | $ | 12.20 | |||
| |||||||||
Total Return (excludes any applicable sales charge) | 10.26% | 20.01% | 0.14%** | ||||||
| |||||||||
RATIOS/SUPPLEMENTAL DATA | |||||||||
Net assets, end of period (in thousands) | $17,126 | $10,392 | $692 | ||||||
Ratio of expenses to average net assets after waivers 1 | 1.70% | 1.70% | 1.70%* | ||||||
Ratio of expenses to average net assets before waivers | 2.24% | 2.30% | 2.39%* | ||||||
Ratio of net investment income to average net assets 1 | 2.14% | 2.40% | 2.48%* | ||||||
Portfolio turnover rate | 44.89% | 25.56% | 38.38%** | ||||||
* | Annualized. |
** | Not Annualized. |
1 | This row reflects the impact, if any, of fee waivers or reimbursements by the Adviser and/or affiliated service providers. |
2 | Realized and unrealized gains and loss per share in this caption are balancing amounts necessary to reconcile the change in net asset value per share for the period, and may not reconcile with the aggregate gains and losses in the statement of operations due to share transactions for the period. |
^ | Commencement of operations. |
Total return represents the rate that an investor would have earned or lost on an investment in the Fund assuming reinvestment of all dividends and distributions.
The accompanying notes are an integral part of these financial statements.
INTEGRITY DIVIDEND HARVEST FUND CLASS I
FINANCIAL HIGHLIGHTS
Selected per share data and ratios for the periods indicated
Period | ||||||
Year | From | |||||
Ended | 8/1/16^ to | |||||
12/31/17 | 12/30/16 | |||||
NET ASSET VALUE, BEGINNING OF PERIOD | $ | 14.34 | $ | 13.96 | ||
| ||||||
Income (loss) from investment operations: | ||||||
Net investment income (loss) | $ | 0.45 | $ | 0.22 | ||
Net realized and unrealized gain (loss) on investments 2 | 1.16 | 0.43 | ||||
Total from investment operations | $ | 1.61 | $ | 0.65 | ||
| ||||||
Less Distributions: | ||||||
Dividends from net investment income | $ | (0.45) | $ | (0.22) | ||
Distributions from net realized gains | (0.81) | (0.05) | ||||
Total distributions | $ | (1.26) | $ | (0.27) | ||
| ||||||
NET ASSET VALUE, END OF PERIOD | $ | 14.69 | $ | 14.34 | ||
| ||||||
Total Return (excludes any applicable sales charge) | 11.37% | 4.67%** | ||||
| ||||||
RATIOS/SUPPLEMENTAL DATA | ||||||
Net assets, end of period (in thousands) | $21,252 | $5,904 | ||||
Ratio of expenses to average net assets after waivers 1 | 0.70% | 0.70%* | ||||
Ratio of expenses to average net assets before waivers | 1.24% | 1.31%* | ||||
Ratio of net investment income to average net assets 1 | 3.14% | 3.22%* | ||||
Portfolio turnover rate | 44.89% | 25.56%** | ||||
* | Annualized. |
** | Not Annualized. |
1 | This row reflects the impact, if any, of fee waivers or reimbursements by the Adviser and/or affiliated service providers. |
2 | Realized and unrealized gains and loss per share in this caption are balancing amounts necessary to reconcile the change in net asset value per share for the period, and may not reconcile with the aggregate gains and losses in the statement of operations due to share transactions for the period. |
^ | Commencement of operations. |
Total return represents the rate that an investor would have earned or lost on an investment in the Fund assuming reinvestment of all dividends and distributions.
The accompanying notes are an integral part of these financial statements.
INTEGRITY ENERGIZED DIVIDEND FUND CLASS A
FINANCIAL HIGHLIGHTS
Selected per share data and ratios for the periods indicated
Period | ||||||
Year | From | |||||
Ended | 5/2/16^ to | |||||
12/31/17 | 12/30/16 | |||||
NET ASSET VALUE, BEGINNING OF PERIOD | $ | 11.37 | $ | 10.00 | ||
| ||||||
Income (loss) from investment operations: | ||||||
Net investment income (loss) | $ | 0.50 | $ | 0.34 | ||
Net realized and unrealized gain (loss) on investments 2 | 1.42 | 1.63 | ||||
Total from investment operations | $ | 1.92 | $ | 1.97 | ||
| ||||||
Less Distributions: | ||||||
Dividends from net investment income | $ | (0.50) | $ | (0.34) | ||
Distributions from net realized gains | (0.36) | (0.26) | ||||
Total distributions | $ | (0.86) | $ | (0.60) | ||
| ||||||
NET ASSET VALUE, END OF PERIOD | $ | 12.43 | $ | 11.37 | ||
| ||||||
Total Return (excludes any applicable sales charge) | 17.47% | 19.96%** | ||||
| ||||||
RATIOS/SUPPLEMENTAL DATA | ||||||
Net assets, end of period (in thousands) | $2,321 | $1,198 | ||||
Ratio of expenses to average net assets after waivers 1,3 | 0.35% | 0.17%* | ||||
Ratio of expenses to average net assets before waivers | 4.49% | 8.39%* | ||||
Ratio of net investment income to average net assets 1,3 | 5.04% | 5.13%* | ||||
Portfolio turnover rate | 60.18% | 30.17%** | ||||
* | Annualized. |
** | Not Annualized. |
1 | This row reflects the impact, if any, of fee waivers or reimbursements by the Adviser and/or affiliated service providers. |
2 | Realized and unrealized gains and loss per share in this caption are balancing amounts necessary to reconcile the change in net asset value per share for the period, and may not reconcile with the aggregate gains and losses in the statement of operations due to share transactions for the period. |
3 | The voluntary waiver, based on average net assets, amounted to 0.88% for the period ended 12/30/16, and 0.70% for the year ended 12/31/17. |
^ | Commencement of operations. |
Total return represents the rate that an investor would have earned or lost on an investment in the Fund assuming reinvestment of all dividends and distributions.
The accompanying notes are an integral part of these financial statements.
INTEGRITY ENERGIZED DIVIDEND FUND CLASS C
FINANCIAL HIGHLIGHTS
Selected per share data and ratios for the periods indicated
Period | ||||||
Year | From | |||||
Ended | 5/2/16^ to | |||||
12/31/17 | 12/30/16 | |||||
NET ASSET VALUE, BEGINNING OF PERIOD | $ | 11.36 | $ | 10.00 | ||
| ||||||
Income (loss) from investment operations: | ||||||
Net investment income (loss) | $ | 0.43 | $ | 0.29 | ||
Net realized and unrealized gain (loss) on investments 2 | 1.40 | 1.62 | ||||
Total from investment operations | $ | 1.83 | $ | 1.91 | ||
| ||||||
Less Distributions: | ||||||
Dividends from net investment income | $ | (0.43) | $ | (0.29) | ||
Distributions from net realized gains | (0.36) | (0.26) | ||||
Total distributions | $ | (0.79) | $ | (0.55) | ||
| ||||||
NET ASSET VALUE, END OF PERIOD | $ | 12.40 | $ | 11.36 | ||
| ||||||
Total Return (excludes any applicable sales charge) | 16.64% | 19.30%** | ||||
| ||||||
RATIOS/SUPPLEMENTAL DATA | ||||||
Net assets, end of period (in thousands) | $292 | $114 | ||||
Ratio of expenses to average net assets after waivers 1,3 | 1.10% | 0.91%* | ||||
Ratio of expenses to average net assets before waivers | 5.17% | 12.55%* | ||||
Ratio of net investment income to average net assets 1,3 | 4.36% | 4.14%* | ||||
Portfolio turnover rate | 60.18% | 30.17%** | ||||
* | Annualized. |
** | Not Annualized. |
1 | This row reflects the impact, if any, of fee waivers or reimbursements by the Adviser and/or affiliated service providers. |
2 | Realized and unrealized gains and loss per share in this caption are balancing amounts necessary to reconcile the change in net asset value per share for the period, and may not reconcile with the aggregate gains and losses in the statement of operations due to share transactions for the period. |
3 | The voluntary waiver, based on average net assets, amounted to 0.89% for the period ended 12/30/16, and 0.70% for the year ended 12/31/17. |
^ | Commencement of operations. |
Total return represents the rate that an investor would have earned or lost on an investment in the Fund assuming reinvestment of all dividends and distributions.
The accompanying notes are an integral part of these financial statements.
INTEGRITY ENERGIZED DIVIDEND FUND CLASS I
FINANCIAL HIGHLIGHTS
Selected per share data and ratios for the periods indicated
Period | ||||||
Year | From | |||||
Ended | 8/1/16^ to | |||||
12/31/17 | 12/30/16 | |||||
NET ASSET VALUE, BEGINNING OF PERIOD | $ | 11.37 | $ | 9.95 | ||
| ||||||
Income (loss) from investment operations: | ||||||
Net investment income (loss) | $ | 0.53 | $ | 0.27 | ||
Net realized and unrealized gain (loss) on investments 2 | 1.42 | 1.68 | ||||
Total from investment operations | $ | 1.95 | $ | 1.95 | ||
| ||||||
Less Distributions: | ||||||
Dividends from net investment income | $ | (0.53) | $ | (0.27) | ||
Distributions from net realized gains | (0.36) | (0.26) | ||||
Total distributions | $ | (0.89) | $ | (0.53) | ||
| ||||||
NET ASSET VALUE, END OF PERIOD | $ | 12.43 | $ | 11.37 | ||
| ||||||
Total Return (excludes any applicable sales charge) | 17.74% | 19.80%** | ||||
| ||||||
RATIOS/SUPPLEMENTAL DATA | ||||||
Net assets, end of period (in thousands) | $2,938 | $395 | ||||
Ratio of expenses to average net assets after waivers 1,3 | 0.10% | 0.00%* | ||||
Ratio of expenses to average net assets before waivers | 3.72% | 5.54%* | ||||
Ratio of net investment income to average net assets 1,3 | 5.96% | 6.90%* | ||||
Portfolio turnover rate | 60.18% | 30.17%** | ||||
* | Annualized. |
** | Not Annualized. |
1 | This row reflects the impact, if any, of fee waivers or reimbursements by the Adviser and/or affiliated service providers. |
2 | Realized and unrealized gains and loss per share in this caption are balancing amounts necessary to reconcile the change in net asset value per share for the period, and may not reconcile with the aggregate gains and losses in the statement of operations due to share transactions for the period. |
3 | The voluntary waiver, based on average net assets, amounted to 0.80% for the period ended 12/30/16, and 0.70% for the year ended 12/31/17. |
^ | Commencement of operations. |
Total return represents the rate that an investor would have earned or lost on an investment in the Fund assuming reinvestment of all dividends and distributions.
The accompanying notes are an integral part of these financial statements.
INTEGRITY GROWTH & INCOME FUND CLASS A
FINANCIAL HIGHLIGHTS
Selected per share data and ratios for the periods indicated
Year | Year | Year | Year | Year | |||||||||||
Ended | Ended | Ended | Ended | Ended | |||||||||||
12/31/17 | 12/30/16 | 12/31/15 | 12/31/14 | 12/31/13 | |||||||||||
NET ASSET VALUE, BEGINNING OF PERIOD | $ | 48.38 | $ | 45.07 | $ | 47.03 | $ | 49.05 | $ | 42.80 | |||||
| |||||||||||||||
Income (loss) from investment operations: | |||||||||||||||
Net investment income (loss) | $ | 0.58 | $ | 0.71 | $ | 0.35 | $ | 0.32 | $ | 0.17 | |||||
Net realized and unrealized gain (loss) on investments 2 | 8.46 | 3.72 | (1.33) | 2.71 | 11.67 | ||||||||||
Total from investment operations | $ | 9.04 | $ | 4.43 | $ | (0.98) | $ | 3.03 | $ | 11.84 | |||||
| |||||||||||||||
Less Distributions: | |||||||||||||||
Dividends from net investment income | $ | (0.58) | $ | (0.71) | $ | (0.35) | $ | (0.32) | $ | (0.18) | |||||
Distributions from net realized gains | (3.33) | (0.41) | (0.63) | (4.73) | (5.41) | ||||||||||
Total distributions | $ | (3.91) | $ | (1.12) | $ | (0.98) | $ | (5.05) | $ | (5.59) | |||||
| |||||||||||||||
NET ASSET VALUE, END OF PERIOD | $ | 53.51 | $ | 48.38 | $ | 45.07 | $ | 47.03 | $ | 49.05 | |||||
| |||||||||||||||
Total Return (excludes any applicable sales charge) | 18.68% | 9.81% | (2.10%) | 6.01% | 27.76% | ||||||||||
| |||||||||||||||
RATIOS/SUPPLEMENTAL DATA | |||||||||||||||
Net assets, end of period (in thousands) | $34,600 | $32,933 | $35,689 | $36,187 | $33,803 | ||||||||||
Ratio of expenses to average net assets after waivers 1 | 1.25% | 1.25% | 1.25% | 1.25% | 1.36% | ||||||||||
Ratio of expenses to average net assets before waivers | 1.95% | 1.92% | 1.84% | 1.80% | 1.82% | ||||||||||
Ratio of net investment income to average net assets 1 | 1.07% | 1.40% | 0.77% | 0.64% | 0.37% | ||||||||||
Portfolio turnover rate | 32.42% | 50.94% | 49.88% | 73.25% | 116.11% | ||||||||||
1 | This row reflects the impact, if any, of fee waivers or reimbursements by the Adviser and/or affiliated service providers. |
2 | Realized and unrealized gains and loss per share in this caption are balancing amounts necessary to reconcile the change in net asset value per share for the period, and may not reconcile with the aggregate gains and losses in the statement of operations due to share transactions for the period. |
Total return represents the rate that an investor would have earned or lost on an investment in the Fund assuming reinvestment of all dividends and distributions.
The accompanying notes are an integral part of these financial statements.
INTEGRITY GROWTH & INCOME FUND CLASS C
FINANCIAL HIGHLIGHTS
Selected per share data and ratios for the periods indicated
Period | |||||||||
Year | Year | From | |||||||
Ended | Ended | 8/3/15^ to | |||||||
12/31/17 | 12/30/16 | 12/31/15 | |||||||
NET ASSET VALUE, BEGINNING OF PERIOD | $ | 48.38 | $ | 45.01 | $ | 49.50 | |||
| |||||||||
Income (loss) from investment operations: | |||||||||
Net investment income (loss) | $ | 0.17 | $ | 0.37 | $ | 0.27 | |||
Net realized and unrealized gain (loss) on investments 2 | 8.44 | 3.78 | (3.86) | ||||||
Total from investment operations | $ | 8.61 | $ | 4.15 | $ | (3.59) | |||
| |||||||||
Less Distributions: | |||||||||
Dividends from net investment income | $ | (0.17) | $ | (0.37) | $ | (0.27) | |||
Distributions from net realized gains | (3.33) | (0.41) | (0.63) | ||||||
Total distributions | $ | (3.50) | $ | (0.78) | $ | (0.90) | |||
| |||||||||
NET ASSET VALUE, END OF PERIOD | $ | 53.49 | $ | 48.38 | $ | 45.01 | |||
| |||||||||
Total Return (excludes any applicable sales charge) | 17.79% | 9.18% | (7.25%)** | ||||||
| |||||||||
RATIOS/SUPPLEMENTAL DATA | |||||||||
Net assets, end of period (in thousands) | $225 | $182 | $168 | ||||||
Ratio of expenses to average net assets after waivers 1 | 2.00% | 2.00% | 2.00%* | ||||||
Ratio of expenses to average net assets before waivers | 2.70% | 2.68% | 2.66%* | ||||||
Ratio of net investment income (loss) to average net assets 1 | 0.33% | 0.64% | (0.01%)* | ||||||
Portfolio turnover rate | 32.42% | 50.94% | 49.88%** | ||||||
* | Annualized. |
** | Not Annualized. |
1 | This row reflects the impact, if any, of fee waivers or reimbursements by the Adviser and/or affiliated service providers. |
2 | Realized and unrealized gains and loss per share in this caption are balancing amounts necessary to reconcile the change in net asset value per share for the period, and may not reconcile with the aggregate gains and losses in the statement of operations due to share transactions for the period. |
^ | Commencement of operations. |
Total return represents the rate that an investor would have earned or lost on an investment in the Fund assuming reinvestment of all dividends and distributions.
The accompanying notes are an integral part of these financial statements.
INTEGRITY GROWTH & INCOME FUND CLASS I
FINANCIAL HIGHLIGHTS
Selected per share data and ratios for the periods indicated
Period | ||||||
Year | From | |||||
Ended | 8/1/16^ to | |||||
12/31/17 | 12/30/16 | |||||
NET ASSET VALUE, BEGINNING OF PERIOD | $ | 48.36 | $ | 48.11 | ||
| ||||||
Income (loss) from investment operations: | ||||||
Net investment income (loss) | $ | 0.72 | $ | 0.80 | ||
Net realized and unrealized gain (loss) on investments 2 | 8.46 | 0.66 | ||||
Total from investment operations | $ | 9.18 | $ | 1.46 | ||
| ||||||
Less Distributions: | ||||||
Dividends from net investment income | $ | (0.72) | $ | (0.80) | ||
Distributions from net realized gains | (3.33) | (0.41) | ||||
Total distributions | $ | (4.05) | $ | (1.21) | ||
| ||||||
NET ASSET VALUE, END OF PERIOD | $ | 53.49 | $ | 48.36 | ||
| ||||||
Total Return (excludes any applicable sales charge) | 18.96% | 3.04%** | ||||
| ||||||
RATIOS/SUPPLEMENTAL DATA | ||||||
Net assets, end of period (in thousands) | $690 | $228 | ||||
Ratio of expenses to average net assets after waivers 1 | 1.00% | 1.00%* | ||||
Ratio of expenses to average net assets before waivers | 1.69% | 1.70%* | ||||
Ratio of net investment income (loss) to average net assets 1 | 1.30% | 1.50%* | ||||
Portfolio turnover rate | 32.42% | 50.94%** | ||||
* | Annualized. |
** | Not Annualized. |
1 | This row reflects the impact, if any, of fee waivers or reimbursements by the Adviser and/or affiliated service providers. |
2 | Realized and unrealized gains and loss per share in this caption are balancing amounts necessary to reconcile the change in net asset value per share for the period, and may not reconcile with the aggregate gains and losses in the statement of operations due to share transactions for the period. |
^ | Commencement of operations. |
Total return represents the rate that an investor would have earned or lost on an investment in the Fund assuming reinvestment of all dividends and distributions.
The accompanying notes are an integral part of these financial statements.
INTEGRITY HIGH INCOME FUND CLASS A
FINANCIAL HIGHLIGHTS
Selected per share data and ratios for the periods indicated
Year | Year | Year | Year | Year | |||||||||||
Ended | Ended | Ended | Ended | Ended | |||||||||||
12/31/17 | 12/30/16 | 12/31/15 | 12/31/14 | 12/31/13 | |||||||||||
NET ASSET VALUE, BEGINNING OF PERIOD | $ | 7.66 | $ | 7.03 | $ | 7.75 | $ | 8.02 | $ | 7.98 | |||||
| |||||||||||||||
Income (loss) from investment operations: | |||||||||||||||
Net investment income (loss) | $ | 0.37 | $ | 0.39 | $ | 0.40 | $ | 0.42 | $ | 0.45 | |||||
Net realized and unrealized gain (loss) on investments 2 | 0.14 | 0.63 | (0.72) | (0.27) | 0.04 | ||||||||||
Total from investment operations | $ | 0.51 | $ | 1.02 | $ | (0.32) | $ | 0.15 | $ | 0.49 | |||||
| |||||||||||||||
Less Distributions: | |||||||||||||||
Dividends from net investment income | $ | (0.37) | $ | (0.39) | $ | (0.40) | $ | (0.42) | $ | (0.45) | |||||
Total distributions | $ | (0.37) | $ | (0.39) | $ | (0.40) | $ | (0.42) | $ | (0.45) | |||||
| |||||||||||||||
NET ASSET VALUE, END OF PERIOD | $ | 7.80 | $ | 7.66 | $ | 7.03 | $ | 7.75 | $ | 8.02 | |||||
| |||||||||||||||
Total Return (excludes any applicable sales charge) | 6.78% | 14.90% | (4.43%) | 1.84% | 6.32% | ||||||||||
| |||||||||||||||
RATIOS/SUPPLEMENTAL DATA | |||||||||||||||
Net assets, end of period (in thousands) | $24,628 | $25,524 | $24,338 | $28,221 | $28,045 | ||||||||||
Ratio of expenses to average net assets after waivers 1 | 1.13% | 1.15% | 1.15% | 1.15% | 1.15% | ||||||||||
Ratio of expenses to average net assets before waivers | 1.71% | 1.72% | 1.66% | 1.63% | 1.65% | ||||||||||
Ratio of net investment income to average net assets 1 | 4.80% | 5.34% | 5.20% | 5.25% | 5.64% | ||||||||||
Portfolio turnover rate | 29.22% | 27.61% | 40.85% | 34.86% | 36.30% | ||||||||||
1 | This row reflects the impact, if any, of fee waivers or reimbursements by the Adviser and/or affiliated service providers. |
2 | Realized and unrealized gains and loss per share in this caption are balancing amounts necessary to reconcile the change in net asset value per share for the period, and may not reconcile with the aggregate gains and losses in the statement of operations due to share transactions for the period. |
Total return represents the rate that an investor would have earned or lost on an investment in the Fund assuming reinvestment of all dividends and distributions.
The accompanying notes are an integral part of these financial statements.
INTEGRITY HIGH INCOME FUND CLASS C
FINANCIAL HIGHLIGHTS
Selected per share data and ratios for the periods indicated
Year | Year | Year | Year | Year | |||||||||||
Ended | Ended | Ended | Ended | Ended | |||||||||||
12/31/17 | 12/30/16 | 12/31/15 | 12/31/14 | 12/31/13 | |||||||||||
NET ASSET VALUE, BEGINNING OF PERIOD | $ | 7.68 | $ | 7.05 | $ | 7.77 | $ | 8.04 | $ | 8.00 | |||||
| |||||||||||||||
Income (loss) from investment operations: | |||||||||||||||
Net investment income (loss) | $ | 0.31 | $ | 0.34 | $ | 0.34 | $ | 0.36 | $ | 0.39 | |||||
Net realized and unrealized gain (loss) on investments 2 | 0.14 | 0.63 | (0.72) | (0.27) | 0.04 | ||||||||||
Total from investment operations | $ | 0.45 | $ | 0.97 | $ | (0.38) | $ | 0.09 | $ | 0.43 | |||||
| |||||||||||||||
Less Distributions: | |||||||||||||||
Dividends from net investment income | $ | (0.31) | $ | (0.34) | $ | (0.34) | $ | (0.36) | $ | (0.39) | |||||
Total distributions | $ | (0.31) | $ | (0.34) | $ | (0.34) | $ | (0.36) | $ | (0.39) | |||||
| |||||||||||||||
NET ASSET VALUE, END OF PERIOD | $ | 7.82 | $ | 7.68 | $ | 7.05 | $ | 7.77 | $ | 8.04 | |||||
| |||||||||||||||
Total Return (excludes any applicable sales charge) | 5.98% | 14.02% | (5.12%) | 1.08% | 5.53% | ||||||||||
| |||||||||||||||
RATIOS/SUPPLEMENTAL DATA | |||||||||||||||
Net assets, end of period (in thousands) | $5,397 | $5,293 | $5,670 | $9,343 | $7,888 | ||||||||||
Ratio of expenses to average net assets after waivers 1 | 1.88% | 1.90% | 1.90% | 1.90% | 1.90% | ||||||||||
Ratio of expenses to average net assets before waivers | 2.46% | 2.47% | 2.40% | 2.38% | 2.40% | ||||||||||
Ratio of net investment income to average net assets 1 | 4.03% | 4.59% | 4.43% | 4.51% | 4.89% | ||||||||||
Portfolio turnover rate | 29.22% | 27.61% | 40.85% | 34.86% | 36.30% | ||||||||||
1 | This row reflects the impact, if any, of fee waivers or reimbursements by the Adviser and/or affiliated service providers. |
2 | Realized and unrealized gains and loss per share in this caption are balancing amounts necessary to reconcile the change in net asset value per share for the period, and may not reconcile with the aggregate gains and losses in the statement of operations due to share transactions for the period. |
Total return represents the rate that an investor would have earned or lost on an investment in the Fund assuming reinvestment of all dividends and distributions.
The accompanying notes are an integral part of these financial statements.
INTEGRITY HIGH INCOME FUND CLASS I
FINANCIAL HIGHLIGHTS
Selected per share data and ratios for the periods indicated
Period | ||||||
Year | From | |||||
Ended | 8/1/16^ to | |||||
12/31/17 | 12/30/16 | |||||
NET ASSET VALUE, BEGINNING OF PERIOD | $ | 7.65 | $ | 7.52 | ||
| ||||||
Income (loss) from investment operations: | ||||||
Net investment income (loss) | $ | 0.39 | $ | 0.16 | ||
Net realized and unrealized gain (loss) on investments 2 | 0.15 | 0.13 | ||||
Total from investment operations |
| 0.54 | $ | 0.29 | ||
| ||||||
Less Distributions: | ||||||
Dividends from net investment income | $ | (0.39) | $ | (0.16) | ||
Total distributions | $ | (0.39) | $ | (0.16) | ||
| ||||||
NET ASSET VALUE, END OF PERIOD | $ | 7.80 | $ | 7.65 | ||
| ||||||
Total Return (excludes any applicable sales charge) | 7.19% | 3.93%** | ||||
| ||||||
RATIOS/SUPPLEMENTAL DATA | ||||||
Net assets, end of period (in thousands) | $2,598 | $648 | ||||
Ratio of expenses to average net assets after waivers 1 | 0.87% | 0.90%* | ||||
Ratio of expenses to average net assets before waivers | 1.46% | 1.49%* | ||||
Ratio of net investment income to average net assets 1 | 5.04% | 5.18%* | ||||
Portfolio turnover rate | 29.22% | 27.61%** | ||||
* | Annualized. |
** | Not Annualized. |
1 | This row reflects the impact, if any, of fee waivers or reimbursements by the Adviser and/or affiliated service providers. |
2 | Realized and unrealized gains and loss per share in this caption are balancing amounts necessary to reconcile the change in net asset value per share for the period, and may not reconcile with the aggregate gains and losses in the statement of operations due to share transactions for the period. |
^ | Commencement of operations. |
Total return represents the rate that an investor would have earned or lost on an investment in the Fund assuming reinvestment of all dividends and distributions.
The accompanying notes are an integral part of these financial statements.
WILLISTON BASIN/MID-NORTH AMERICA STOCK FUND CLASS A
FINANCIAL HIGHLIGHTS
Selected per share data and ratios for the periods indicated
Year | Year | Year | Year | Year | |||||||||||
Ended | Ended | Ended | Ended | Ended | |||||||||||
12/31/17 | 12/30/16 | 12/31/15 | 12/31/14 | 12/31/13 | |||||||||||
NET ASSET VALUE, BEGINNING OF PERIOD | $ | 5.93 | $ | 4.31 | $ | 5.80 | $ | 6.84 | $ | 5.43 | |||||
| |||||||||||||||
Income (loss) from investment operations: | |||||||||||||||
Net investment income (loss) | $ | 0.01 | $ | 0.01 | $ | 0.03 | $ | 0.00 | $ | (0.01) | |||||
Net realized and unrealized gain (loss) on investments 2 | (0.45) | 1.62 | (1.49) | (0.78) | 1.75 | ||||||||||
Total from investment operations | $ | (0.44) | $ | 1.63 | $ | (1.46) | $ | (0.78) | $ | 1.74 | |||||
| |||||||||||||||
Less Distributions: | |||||||||||||||
Dividends from net investment income | $ | (0.01) | $ | (0.01) | $ | (0.03) | $ | 0.00 | $ | 0.00 | |||||
Distributions from net realized gains | 0.00 | 0.00 | 0.00 | (0.26) | (0.33) | ||||||||||
Total distributions | $ | (0.01) | $ | (0.01) | $ | (0.03) | $ | (0.26) | $ | (0.33) | |||||
| |||||||||||||||
NET ASSET VALUE, END OF PERIOD | $ | 5.48 | $ | 5.93 | $ | 4.31 | $ | 5.80 | $ | 6.84 | |||||
|
|
|
|
|
|
|
|
|
|
| |||||
Total Return (excludes any applicable sales charge) | (7.48%) | 37.82% | (25.16%) | (11.43%) | 32.00% | ||||||||||
| |||||||||||||||
RATIOS/SUPPLEMENTAL DATA | |||||||||||||||
Net assets, end of period (in thousands) | $339,385 | $592,629 | $490,052 | $757,507 | $701,872 | ||||||||||
Ratio of expenses to average net assets after waivers 1 | 1.47% | 1.46% | 1.44% | 1.39% | 1.41% | ||||||||||
Ratio of expenses to average net assets before waivers | 1.47% | 1.47% | 1.44% | 1.39% | 1.41% | ||||||||||
Ratio of net investment income (loss) to average net assets 1 | 0.15% | 0.17% | 0.52% | (0.02%) | (0.26%) | ||||||||||
Portfolio turnover rate | 41.31% | 55.17% | 63.76% | 67.68% | 85.63% | ||||||||||
1 | This row reflects the impact, if any, of fee waivers or reimbursements by the Adviser and/or affiliated service providers. |
2 | Realized and unrealized gains and loss per share in this caption are balancing amounts necessary to reconcile the change in net asset value per share for the period, and may not reconcile with the aggregate gains and losses in the statement of operations due to share transactions for the period. |
Total return represents the rate that an investor would have earned or lost on an investment in the Fund assuming reinvestment of all dividends and distributions.
The accompanying notes are an integral part of these financial statements.
WILLISTON BASIN/MID-NORTH AMERICA STOCK FUND CLASS C
FINANCIAL HIGHLIGHTS
Selected per share data and ratios for the periods indicated
Period | ||||||||||||
Year | Year | Year | From | |||||||||
Ended | Ended | Ended | 5/1/14^ to | |||||||||
12/31/17 | 12/30/16 | 12/31/15 | 12/31/14 | |||||||||
NET ASSET VALUE, BEGINNING OF PERIOD | $ | 5.89 | $ | 4.30 | $ | 5.79 | $ | 7.45 | ||||
| ||||||||||||
Income (loss) from investment operations: | ||||||||||||
Net investment income (loss) | $ | (0.02) | $ | (0.02) | $ | 0.01 | $ | (0.01) | ||||
Net realized and unrealized gain (loss) on investments 2 | (0.44) | 1.61 | (1.49) | (1.39) | ||||||||
Total from investment operations | $ | (0.46) | $ | 1.59 | $ | (1.48) | $ | (1.40) | ||||
| ||||||||||||
Less Distributions: | ||||||||||||
Dividends from net investment income | $ | 0.00 | $ | 0.00 | $ | (0.01) | $ | 0.00 | ||||
Distributions from net realized gains | 0.00 | 0.00 | 0.00 | (0.26) | ||||||||
Total distributions | $ | 0.00 | $ | 0.00 | $ | (0.01) | $ | (0.26) | ||||
| ||||||||||||
NET ASSET VALUE, END OF PERIOD | $ | 5.43 | $ | 5.89 | $ | 4.30 | $ | 5.79 | ||||
| ||||||||||||
Total Return (excludes any applicable sales charge) | (7.81%) | 36.98% | (25.52%) | (18.82%)** | ||||||||
| ||||||||||||
RATIOS/SUPPLEMENTAL DATA | ||||||||||||
Net assets, end of period (in thousands) | $37,629 | $51,909 | $38,170 | $30,809 | ||||||||
Ratio of expenses to average net assets after waivers 1 | 1.97% | 1.96% | 1.94% | 1.89%* | ||||||||
Ratio of expenses to average net assets before waivers | 1.97% | 1.97% | 1.94% | 1.89%* | ||||||||
Ratio of net investment income (loss) to average net assets 1 | (0.34%) | (0.33%) | 0.03% | (0.52%)* | ||||||||
Portfolio turnover rate | 41.31% | 55.17% | 63.76% | 67.68%** | ||||||||
* | Annualized. |
** | Not Annualized. |
1 | This row reflects the impact, if any, of fee waivers or reimbursements by the Adviser and/or affiliated service providers. |
2 | Realized and unrealized gains and loss per share in this caption are balancing amounts necessary to reconcile the change in net asset value per share for the period, and may not reconcile with the aggregate gains and losses in the statement of operations due to share transactions for the period. |
^ | Commencement of operations. |
Total return represents the rate that an investor would have earned or lost on an investment in the Fund assuming reinvestment of all dividends and distributions.
The accompanying notes are an integral part of these financial statements.
WILLISTON BASIN/MID-NORTH AMERICA STOCK FUND CLASS I
FINANCIAL HIGHLIGHTS
Selected per share data and ratios for the periods indicated
Period | ||||||
Year | From | |||||
Ended | 8/1/16^ to | |||||
12/31/17 | 12/30/16 | |||||
NET ASSET VALUE, BEGINNING OF PERIOD | $ | 5.92 | $ | 4.74 | ||
| ||||||
Income (loss) from investment operations: | ||||||
Net investment income (loss) | $ | 0.04 | $ | 0.03 | ||
Net realized and unrealized gain (loss) on investments 2 | (0.45) | 1.19 | ||||
Total from investment operations | $ | (0.41) | $ | 1.22 | ||
| ||||||
Less Distributions: | ||||||
Dividends from net investment income | $ | (0.04) | $ | (0.03) | ||
Returns of capital | 0.00 | (0.01) | ||||
Total distributions | $ | (0.04) | $ | (0.04) | ||
| ||||||
NET ASSET VALUE, END OF PERIOD | $ | 5.47 | $ | 5.92 | ||
| ||||||
Total Return (excludes any applicable sales charge) | (6.92%) | 25.66%** | ||||
| ||||||
RATIOS/SUPPLEMENTAL DATA | ||||||
Net assets, end of period (in thousands) | $60,562 | $14,891 | ||||
Ratio of expenses to average net assets after waivers 1 | 0.97% | 0.97%* | ||||
Ratio of expenses to average net assets before waivers | 0.97% | 0.97%* | ||||
Ratio of net investment income (loss) to average net assets 1 | 0.71% | 0.67%* | ||||
Portfolio turnover rate | 41.31% | 55.17%** | ||||
* | Annualized. |
** | Not Annualized. |
1 | This row reflects the impact, if any, of fee waivers or reimbursements by the Adviser and/or affiliated service providers. |
2 | Realized and unrealized gains and loss per share in this caption are balancing amounts necessary to reconcile the change in net asset value per share for the period, and may not reconcile with the aggregate gains and losses in the statement of operations due to share transactions for the period. |
^ | Commencement of operations. |
Total return represents the rate that an investor would have earned or lost on an investment in the Fund assuming reinvestment of all dividends and distributions.
The accompanying notes are an integral part of these financial statements.
REPORT OF INDEPENDENT REGISTERED PUBLIC ACCOUNTING FIRM
To the Shareholders and Board of Trustees
Integrity Funds
Opinion on the Financial Statements
We have audited the accompanying statements of assets and liabilities, including the schedules of investments, of The Integrity Funds, comprising Integrity Dividend Harvest Fund, Integrity Energized Dividend Fund, Integrity Growth & Income Fund, Integrity High Income Fund, and Williston Basin/Mid-North America Stock Fund (the “Funds”), as of December 31, 2017, and the related statements of operations for the year then ended, the statements of changes in net assets for each of the two periods in the period then ended, and the financial highlights for each of the periods indicated in the period then ended, including the related notes, (collectively referred to as the “financial statements”). In our opinion, the financial statements present fairly, in all material respects, the financial position of each of the Funds as of December 31, 2017, the results of their operations for the year then ended, the changes in their net assets for each of the two periods in the period then ended, and the financial highlights for each of the periods indicated in the period then ended, in conformity with accounting principles generally accepted in the United States of America.
Basis for Opinion
These financial statements are the responsibility of the Funds’ management. Our responsibility is to express an opinion on the Funds’ financial statements based on our audits. We are a public accounting firm registered with the Public Company Accounting Oversight Board (United States) (“PCAOB”) and are required to be independent with respect to the Funds in accordance with the U.S. federal securities laws and the applicable rules and regulations of the Securities and Exchange Commission and the PCAOB.
We conducted our audits in accordance with the standards of the PCAOB. Those standards require that we plan and perform the audit to obtain reasonable assurance about whether the financial statements are free of material misstatement, whether due to error or fraud.
Our audits include performing procedures to assess the risks of material misstatement of the financial statements, whether due to error or fraud, and performing procedures that respond to those risks. Such procedures include examining, on a test basis, evidence regarding the amounts and disclosures in the financial statements and confirmation of securities owned as of December 31, 2017, by correspondence with the custodian. Our audits also included evaluating the accounting principles used and significant estimates made by management, as well as evaluating the overall presentation of the financial statements. We believe that our audits provide a reasonable basis for our opinion.
We have served as the Funds’ auditor since 2009.

COHEN & COMPANY, LTD.
Cleveland, Ohio
March 1, 2018
EXPENSE EXAMPLE (unaudited)
As a shareholder of the Funds, you incur two types of costs: (1) transaction costs, including sales charges (loads), redemption fees and exchange fees; and (2) ongoing costs, including management fees, distribution (12b-1) fees and other Funds expenses. This example is intended to help you understand your ongoing costs (in dollars) of investing in the Fund and to compare these costs with the ongoing costs of investing in other mutual funds. The example is based on an investment of $1,000 invested at the beginning of the one-half year period shown below and held for the entire one-half year period.
The section in the table under the heading “Actual” provides information about actual account values and actual expenses. You may use the information in these columns together with the amount you invested to estimate the expenses that you paid over the period. Simply divide your account value by $1,000 (for example, an account value of $8,600 divided by $1,000 equals 8.6), then multiply the result by the number in the appropriate column for your share class in the column entitled “Expenses Paid During Period” to estimate the expenses you paid on your account during this period.
The section in the table under the heading “Hypothetical (5% return before expenses)” provides information about hypothetical account values and hypothetical expenses based on the Funds’ actual expense ratios and an assumed rate of return of 5% per year before expenses, which is not the Funds’ actual returns. The hypothetical account values and expenses may not be used to estimate the actual ending account balance or expenses you paid for the period. You may use this information to compare the ongoing costs of investing in the Funds and other funds. To do so, compare this 5% hypothetical example with the 5% hypothetical examples that appear in the shareholder reports of the other funds.
Please note that the expenses shown in the table are meant to highlight your ongoing costs only and do not reflect any transactional costs, such as sales charges (loads), redemption fees, or exchange fees. Therefore, the section in the table under the heading “Hypothetical (5% return before expenses)” is useful in comparing ongoing costs only, and will not help you determine the relative total costs of owning different funds. In addition, if these transactional costs were included, your costs would have been higher.
Beginning | Ending | Expenses | ||
Account | Account | Paid | Annualized | |
Value | Value | During | Expense | |
| 6/30/17 | 12/31/17 | Period* | Ratio |
Integrity Dividend Harvest Fund | ||||
Actual - Class A | $1,000.00 | $1,083.80 | $4.93 | 0.95% |
Actual - Class C | $1,000.00 | $1,079.80 | $8.82 | 1.70% |
Actual - Class I | $1,000.00 | $1,085.20 | $3.65 | 0.70% |
Hypothetical - Class A (5% return before expenses) | $1,000.00 | $1,020.27 | $4.78 | 0.95% |
Hypothetical - Class C (5% return before expenses) | $1,000.00 | $1,016.52 | $8.55 | 1.70% |
Hypothetical - Class I (5% return before expenses) | $1,000.00 | $1,021.43 | $3.53 | 0.70% |
Integrity Energized Dividend Fund | ||||
Actual - Class A | $1,000.00 | $1,228.80 | $1.95 | 0.35% |
Actual - Class C | $1,000.00 | $1,224.20 | $6.12 | 1.10% |
Actual - Class I | $1,000.00 | $1,230.20 | $0.56 | 0.10% |
Hypothetical - Class A (5% return before expenses) | $1,000.00 | $1,023.25 | $1.77 | 0.35% |
Hypothetical - Class C (5% return before expenses) | $1,000.00 | $1,019.49 | $5.56 | 1.10% |
Hypothetical - Class I (5% return before expenses) | $1,000.00 | $1,024.50 | $0.51 | 0.10% |
Integrity Growth & Income Fund | ||||
Actual - Class A | $1,000.00 | $1,116.60 | $6.60 | 1.25% |
Actual - Class C | $1,000.00 | $1,112.30 | $10.53 | 2.00% |
Actual - Class I | $1,000.00 | $1,117.70 | $5.28 | 1.00% |
Hypothetical - Class A (5% return before expenses) | $1,000.00 | $1,018.77 | $6.29 | 1.25% |
Hypothetical - Class C (5% return before expenses) | $1,000.00 | $1,015.03 | $10.05 | 2.00% |
Hypothetical - Class I (5% return before expenses) | $1,000.00 | $1,020.01 | $5.04 | 1.00% |
Integrity High Income Fund | ||||
Actual - Class A | $1,000.00 | $1,021.81 | $5.59 | 1.11% |
Actual - Class C | $1,000.00 | $1,019.31 | $9.36 | 1.86% |
Actual - Class I | $1,000.00 | $1,024.38 | $4.33 | 0.86% |
Hypothetical - Class A (5% return before expenses) | $1,000.00 | $1,019.47 | $5.59 | 1.11% |
Hypothetical - Class C (5% return before expenses) | $1,000.00 | $1,015.73 | $9.35 | 1.86% |
Hypothetical - Class I (5% return before expenses) | $1,000.00 | $1,020.73 | $4.32 | 0.86% |
Williston Basin/Mid-North America Stock Fund | ||||
Actual - Class A | $1,000.00 | $1,124.30 | $7.88 | 1.49% |
Actual - Class C | $1,000.00 | $1,121.90 | $10.52 | 1.99% |
Actual - Class I | $1,000.00 | $1,126.80 | $5.24 | 0.99% |
Hypothetical - Class A (5% return before expenses) | $1,000.00 | $1,017.58 | $7.48 | 1.49% |
Hypothetical - Class C (5% return before expenses) | $1,000.00 | $1,015.09 | $9.99 | 1.99% |
Hypothetical - Class I (5% return before expenses) | $1,000.00 | $1,020.07 | $4.98 | 0.99% |
| ||||
*Expenses are equal to the annualized expense ratio, multiplied by the average account value over the period, multiplied 183 days in the one-half year period, and divided by 365 days in the fiscal year (to reflect the one-half year period | ||||
BOARD APPROVAL OF INVESTMENT ADVISORY AGREEMENT (unaudited)
Board Approval of Investment Advisory Agreement
Viking Fund Management, LLC (“Viking” or “Adviser”), the Fund’s investment adviser; Integrity Funds Distributor, LLC (“IFD”), the Fund’s underwriter; and Integrity Fund Services, LLC (“IFS”), the Fund’s transfer, accounting, and administrative services agent; are subsidiaries of Corridor Investors, LLC (“Corridor”), the Fund’s sponsor.
The approval and the continuation of a fund’s investment advisory and sub-advisory agreements must be specifically approved at least annually (1) by the vote of the trustees or by a vote of the shareholders of the fund, and (2) by the vote of a majority of the trustees who are not parties to the investment advisory agreement or “Interested Persons” of any party (“Independent Trustees”), cast in person at a meeting called for the purpose of voting on such approval. In preparation for the meeting, the Board requests and reviews a wide variety of materials provided by the Fund’s adviser. The Independent Trustees also received advice from their independent counsel on the issues to focus on during contract renewals. At a meeting held on October 30, 2017, the Board of Trustees, including a majority of the independent Trustees of the Trusts, approved the Management and Investment Advisory Agreement (“Advisory Agreement”), between the Funds and Viking and the Sub-Advisory Agreement, between the Advisor and J.P. Morgan Investment Management Inc. (“JPMIM”).
The Trustees, including a majority of Trustees who are neither party to the Advisory or Sub-Advisory Agreements nor “interested persons” of any such party (as such term is defined for regulatory purposes), unanimously renewed the Advisory and Sub-Advisory Agreements. In determining whether it was appropriate to renew the Advisory and Sub-Advisory Agreements, the Trustees requested information, provided by the Investment Adviser and each Sub-Adviser that it believed to be reasonably necessary to reach its conclusion. In connection with the renewal of the Advisory and Sub-Advisory Agreements, the Board reviewed factors set out in judicial decisions and Securities Exchange Commission (“SEC”) directives relating to the renewal of advisory contracts, which include but are not limited to, the following:
|
|
|
| (a) | the nature and quality of services to be provided by the adviser to the fund; |
|
|
|
| (b) | the various personnel furnishing such services and their duties and qualifications; |
|
|
|
| (c) | the relevant fund’s investment performance as compared to standardized industry performance data; |
|
|
|
| (d) | the adviser’s costs and profitability of furnishing the investment management services to the fund; |
|
|
|
| (e) | the extent to which the adviser realizes economies of scale as the fund grows larger and the sharing thereof with the fund; |
|
|
|
| (f) | an analysis of the rates charged by other investment advisers of similar funds; |
|
|
|
| (g) | the expense ratios of the applicable fund as compared to data for comparable funds; and |
|
|
|
| (h) | information with respect to all benefits to the adviser associated with the fund, including an analysis of so-called “fallout” benefits or indirect profits to the adviser from its relationship to the funds. |
In evaluating the Adviser’s services and its fees, the Trustees reviewed information concerning the performance of each Fund, the recent financial statements of the Adviser and its parent, and the proposed advisory fee and other fund expenses compared to the level of advisory fees and expenses paid by other similar funds. In reviewing the Advisory Agreement with the foregoing Funds, the Trustees considered, among other things, the fees, the Fund’s past performance, the nature and quality of the services provided, the profitability of the Adviser and its parent (estimated costs and estimated profits from furnishing the proposed services to each Fund), and the expense waivers by the Adviser. The Trustees also considered any ancillary benefits to the Adviser and its affiliates for services provided to each Fund. The Trustees did not identify any single factor discussed above as all-important or controlling. The Trustees also considered the Adviser’s commitment to contractually or voluntarily limit Fund expenses, the skills and capabilities of the Adviser, and the representations from the Adviser that the Funds’ portfolio managers will continue to manage each Fund in substantially the same way as it had been managed.
The following paragraphs summarize the material information and factors considered by the Board, including the Independent Trustees, as well as their conclusions relative to such factors in considering the approval of the Advisory Agreement:
Nature, extent and quality of services: The Investment Adviser currently provides services to twelve funds with investment strategies ranging from non-diversified sector funds to broad-based equity funds. The experience and expertise of the Investment Adviser is attributable to the long-term focus on managing investment companies and has the potential to enhance the Funds’ future performance. The Investment Adviser has a strong culture of compliance and provides quality services. The overall nature and quality of the services provided by the Investment Adviser had historically been, and continues to be, adequate and appropriate.
Investment performance: Upon a review of the total return history and category rankings of each Fund, the Trustees deemed the performance of each Fund to be satisfactory. In addition, each of the Funds has been meeting its investment objective.
As of July 31, 2017, the risk for: (1) Integrity Growth & Income Fund was below average for the 3 and 10-year periods, and above average for the 5-year period. (2) Williston Basin/Mid-North America Stock Fund was average for the 3 and 5-year periods, and below average for the 10-year period; (3) Integrity High Income Fund had average risk for the 3 and 5-year periods, and high risk for the 10-year time period; (4) Integrity Dividend Harvest Fund had a low risk rating for the 3 and 5-year periods; and (5) Integrity Energized Dividend Fund had no rating due to opening on May 2, 2016.
As of July 31, 2017, the Fund return rating for: (1) Integrity Growth & Income Fund was low for the 3-year period, and below average for the 5 and 10-year period; (2) Williston Basin/Mid-North America Stock Fund was average for the 3-year period, and high for the 5 and 10-year periods. (3) Integrity High Income Fund was above average for the 3-year time period, average for the 5-year period, and low for the 10-year time period. (4) Integrity Dividend Harvest Fund had a high return rating for the 3-year time period and below average for the 5-year period; and (5) Integrity Energized Dividend Fund had no rating due to opening on May 2, 2016.
As of July 31, 2017, the Fund performance for: (1) Integrity Growth & Income Fund for the 1, 3, 5 and 10-year periods was below its index for its peer group. It was below its median classification for the 1, 3, 5, and 10-year periods; (2) Williston Basin/Mid-North America Stock Fund was below its index for the 3-year period. It was above its index for the 1, 5, and 10-year periods for its peer group. It was above its median classification in the 1, 3, 5, and 10-year periods for its peer group; (3) Integrity High Income Fund was above its index for the 1, 3, and five-year time periods, and below in the 10-year period. It was at or above its median classification for the 1, 3, and 5-year periods and below its median for the 10-year period; (4) Integrity Dividend Harvest Fund was below its index for the 1, 3 and 5-year periods. It was above its median classification for the 3-year period, and below for the 1 and 5-year time periods; and (5) Integrity Energized Dividend Fund was at its index for the 1-year period. It was above its median classification for the 1-year period.
Profitability: In connection with its review of fees, the Board also considered the profitability of Viking for its advisory activities. In this regard, the Board reviewed information regarding the finances of Corridor and Viking. Based on the information provided, the Board concluded that the level of profitability was not unreasonable in light of the services provided.
Economies of scale: The Board discussed the benefits for the Funds as the Adviser could realize economies of scale as each of the Funds grow larger, but the size of the Funds has not reached an asset level to benefit from economies of scale. Discussion regarding Williston Basin/Mid-North America Stock Fund has occurred as it is the largest Fund. The advisory fees are structured appropriately based on the size of the Funds. The Adviser has indicated that a new advisory fee structure may be looked at if the Fund reaches an asset level where the Funds could benefit from economies of scale.
Analysis of the rates charged by other investment advisers of similar funds: A comparison of the management fees charged by the Adviser seemed reasonable to the Trustees when compared to similar funds in objective and size. The adviser is voluntarily waiving advisory fees to a certain degree due to the small size of certain Funds.
Expense ratios of the applicable fund as compared to data for comparable funds: (1) a comparison of the net operating expense for the Integrity High Income Fund to other funds of similar objective and size reflected that its net expense ratio of 0.90% for Class I shares, 1.15% for Class A shares, and 1.90% for Class C shares was comparable to other funds of similar objective and size; (2) the net operating expense of 1.00% for Class I shares, 1.25% for Class A shares, and 2.00% for Class C shares for the Integrity Growth & Income Fund is comparable to other funds of similar objective and size; (3) the net operating expense of 0.70% for Class I shares, 0.95% for Class A shares, and 1.70% for Class C shares for the Integrity Dividend Harvest Fund is comparable to other funds of similar objective and size; (4) the net operating expense of 0.96% for class I shares, 1.46% for Class A shares, and 1.96% for Class A for the Williston Basin/Mid-North America Stock Fund is comparable to other funds of similar objective and size.
Information with respect to all benefits to the adviser associated with the fund, including an analysis of so-called “fallout” benefits or indirect profits to the adviser from its relationship to the funds: The Board noted that the Adviser and its affiliates do not realize material direct benefits from their relationship with the Fund except for fees earned for services provided. In this regard, the Trustees noted that there were soft dollar arrangements involving the Adviser and Integrity Funds, but there were none involving the Sub-adviser in the Fund it manages.
In voting unanimously to renew the Advisory Agreement, the Trustees did not identify any single factor as being of paramount importance. The Trustees noted that their discussion in this regard was premised on numerous factors including the nature, quality and resources of Viking, the strategic plan involving the Funds, and the potential for increased distribution and growth of the Funds. They determined that, after considering all relevant factors, the adoption of the Advisory Agreements would be in the best interest of each of the Funds.
Sub-Advisory Agreement with JPMIM
In determining whether it was appropriate to renew the Sub-Advisory Agreement between the Investment Adviser and JPMIM with respect to the High Income Fund, the Trustees requested information from JPMIM that they believed to be reasonably necessary to reach their conclusion. The following paragraphs summarize the material information and factors considered by the Board, including the Independent Trustees, as well as their conclusions relative to such factors in considering the renewal of the Sub-Advisory Agreement:
Nature, extent and quality of services: In reviewing the Agreement, the Board considered the nature, quality and extent of services to be provided by JPMIM. In this regard, the Board considered the history and investment experience of JPMIM and reviewed the qualifications, background and responsibilities of its portfolio managers and certain other relevant personnel. The Board recognized that JPMIM has significant expertise in managing high yield corporate bond portfolios and its investment style. The Board also recognized the reputation and resources of JPMIM. In light of the information presented and the considerations made, the Board was satisfied that the nature, quality and extent of services provided to the Fund by JPMIM are satisfactory.
Analysis of the rates charged by other investment advisers of similar funds: The Board considered the sub-advisory fees paid to JPMIM fair and reasonable, in light of the investment sub-advisory services provided, the costs of these services and the comparability of the sub-advisory fees to fees paid by comparable mutual funds.
Information with respect to all benefits to the adviser associated with the fund, including an analysis of so-called “fallout” benefits or indirect profits to the adviser from its relationship to the funds: The Board noted, based on information presented by the Adviser, that the Sub-adviser does realize direct benefits from its relationship with the High Income Fund and does not participate in soft dollar arrangements from securities trading in the Fund.
In voting unanimously to renew the Sub-Advisory Agreement, the Trustees did not identify any single factor as being of paramount importance. The Trustees noted that their discussion in this regard was premised on numerous factors including the nature, quality and resources of JPMIM, the strategic plan involving Integrity High Income Fund, and the potential for increased distribution and growth of the Fund. Thus, the Trustees, including a majority of the Independent Trustees, determined that, after considering all relevant factors, the renewal of the Sub-Advisory Agreement would be in the best interest of the Integrity High Income Fund.
BOARD OF TRUSTEES AND OFFICERS (unaudited)
The Board of Trustees (“Board”) of the Funds consists of four Trustees (the “Trustees”). These same individuals, unless otherwise noted, also serve as trustees for the seven series of Viking Mutual Funds. Three Trustees are not “interested persons” (75% of the total) as defined under the 1940 Act (the “Independent Trustees”). The remaining Trustee is “interested” (the “Interested Trustees”) by virtue of his affiliation with Viking Fund Management, LLC and its affiliates.”
For the purposes of this section, the “Fund Complex” consists of the five series of The Integrity Funds and the seven series of Viking Mutual Funds.
Each Trustee serves a Fund until its termination; or until the Trustee’s retirement, resignation, or death; or otherwise as specified in the Funds’ organizational documents. Each Officer serves an annual term. The tables that follow show information for each Trustee and Officer of the Funds.
INDEPENDENT TRUSTEES |
|
Name, Date of Birth, Date Service Began, and Number of Funds Overseen in Fund Complex | Principal Occupations for Past Five Years |
Wade A. Dokken | Principal occupation(s): Member, WealthVest Financial Partners (2009 to present); Co-President, WealthVest Marketing (2009 to present), Trustee: Integrity Managed Portfolios (2016 to 2017), The Integrity Funds (2016 to present), and Viking Mutual Funds (2016 to present) Other Directorships Held: Not Applicable |
R. James Maxson | Principal occupation(s): Attorney: Maxson Law Office P.C. (2002 to present); Director/Trustee: Integrity Fund of Funds, Inc. (1999 to 2012), Integrity Managed Portfolios (1999 to 2017), The Integrity Funds (2003 to present), and Viking Mutual Funds (2009 to present) Other Directorships Held: Peoples State Bank of Velva, St. Joseph’s Community Health Foundation and St. Joseph’s Foundation, Minot Community Land Trust |
Jerry M. Stai | Principal occupation(s): Minot State University (1999 to present); Non-Profit Specialist, Bremer Bank (2006 to 2014); Director/Trustee: Integrity Fund of Funds, Inc. (2006 to 2012), Integrity Managed Portfolios (2006 to 2017), The Integrity Funds (2006 to present), and Viking Mutual Funds (2009 to present) Other Directorships Held: Not Applicable |
The Statement of Additional Information (“SAI”) contains more information about the Funds’ Trustees and is available without charge upon request, by calling Integrity Funds Distributor at 800-276-1262.
INTERESTED TRUSTEE |
|
Name, Position with Trust, Date of Birth, Date Service Began, and Number of Funds Overseen in Fund Complex | Principal Occupations for Past Five Years |
Robert E. Walstad(1) | Principal occupation(s): Governor (2009 to present): Corridor Investors, LLC; Portfolio Manager (2010 to 2013): Viking Fund Management, LLC; Director and Chairman: Integrity Fund of Funds, Inc. (1994 to 2012); Trustee and Chairman: Integrity Managed Portfolios (1996 to 2017), The Integrity Funds (2003 to present), and Viking Mutual Funds (2009 to present) Other Directorships Held: Not Applicable |
(1) Trustee who is an “interested person” of the Funds as defined in the 1940 Act. Mr. Walstad is an interested person by virtue of being an Officer of the Funds and ownership in Corridor Investors, LLC the parent company of Viking Fund Management, Integrity Fund Services, and Integrity Fund Distributors.
The SAI contains more information about the Funds’ Trustees and is available without charge upon request, by calling Integrity Funds Distributor at 800-276-1262.
OTHER OFFICERS |
|
Name, Position with Trust, Date of Birth, and Date Service Began | Principal Occupations for Past Five Years |
Shannon D. Radke | Principal occupation(s): Governor, CEO, and President (2009 to present): Corridor Investors, LLC; Governor and President (1998 to present) and Senior Portfolio Manager (1999 to present): Viking Fund Management, LLC; Governor and President (2009 to present): Integrity Fund Services, LLC and Integrity Funds Distributor, LLC; President: Integrity Fund of Funds, Inc. (2009 to 2012), Integrity Managed Portfolios (2009 to 2017), The Integrity Funds (2009 to present), and Viking Mutual Funds (1999 to present) Other Directorships Held: Not Applicable |
Peter A. Quist | Principal occupation(s): Governor (2009 to present): Corridor Investors, LLC; Attorney (inactive); Vice President (1994 to 2012): Integrity Fund of Funds, Inc.; Vice President: Integrity Managed Portfolios (1996 to 2017); The Integrity Funds (2003 to present); and Viking Mutual Funds (2009 to present) Other Directorships Held: Not Applicable |
Adam C. Forthun | Principal occupation(s): Fund Accounting Manager (2008 to present) and Chief Operating Officer (2013 to present): Integrity Fund Services, LLC; Treasurer: Integrity Fund of Funds, Inc. (2008 to 2012), Integrity Managed Portfolios (2008 to 2017), The Integrity Funds (2008 to present), and Viking Mutual Funds (2009 to present) Other Directorships Held: Not Applicable |
Brent M. Wheeler MF CCO: August 2009 Secretary: October 2009 | Principal occupation(s): Mutual Fund Chief Compliance Officer: Integrity Fund of Funds, Inc. (2005 to 2012), Integrity Managed Portfolios (2005 to 2017), The Integrity Funds, (2005 to present), and Viking Mutual Funds (2009 to present); Secretary: Integrity Fund of Funds, Inc. (2009 to 2012); Integrity Managed Portfolios (2009 to 2017), The Integrity Funds and Viking Mutual Funds (2009 to present) Other Directorships Held: Not Applicable |
The SAI contains more information about the Funds’ Trustees and is available without charge upon request, by calling Integrity Funds Distributor at 800-276-1262.
PRIVACY POLICY
Rev. 11/2017
FACTS | WHAT DOES INTEGRITY VIKING FUNDS DO WITH YOUR PERSONAL INFORMATION? |
|
|
Why? | Financial companies choose how they share your personal information. Federal law gives consumers the right to limit some but not all sharing. Federal law also requires us to tell you how we collect, share, and protect your personal information. Please read this notice carefully to understand what we do. |
What? | The types of personal information we collect and share depend on the product or service you have with us. This information can include:
· Social Security number, name, address · Account balance, transaction history, account transactions · Investment experience, wire transfer instructions
When you are no longer our customer, we continue to share your information as described in this notice. |
How? | All financial companies need to share customers’ personal information to run their everyday business. In the section below, we list the reasons financial companies can share their customers’ personal information; the reasons Integrity Viking Funds chooses to share; and whether you can limit this sharing. |
Reasons we can share your personal information | Does Integrity Viking Funds share? | Can you limit this sharing? |
For our everyday business purposes- such as to process your transactions, maintain your account(s), respond to court orders and legal investigations, or report to credit bureaus | Yes | No |
For our marketing purposes- to offer our products and services to you | Yes | No |
For joint marketing with other financial companies | No | We don’t share |
For our affiliates’ everyday business purposes- information about your transactions and experiences | Yes | No |
For our affiliates’ everyday business purposes- information about your creditworthiness | No | We don’t share |
For non-affiliates to market to you | No | We don’t share |
Questions? | Call 1-800-601-5593 or go to www.integrityvikingfunds.com |
PRIVACY POLICY (continued)
Page 2 |
Who we are | |
Who is providing this notice? | Integrity Viking Funds (a family of investment companies) |
What we do | |
How does Integrity Viking Funds protect my personal information? | To protect your personal information from unauthorized access and use, we use security measures that comply with federal law. These measures include computer safeguards and secured files and buildings. We · train employees on privacy, information security and protection of client information. · limit access to nonpublic personal information to those employees requiring such information in performing their job functions. |
How does Integrity Viking Funds collect my personal information?
| We collect your personal information, for example, when you: · open an account or seek financial or tax advice · provide account information or give us your contact information · make a wire transfer We also collect your personal information from other companies. |
Why can’t I limit all sharing? | Federal law gives you the right to limit only:
· sharing for affiliates’ everyday business purposes-information about your creditworthiness · affiliates from using your information to market to you · sharing for non-affiliates to market to you
State laws and individual companies may give you additional rights to limit sharing. |
Definitions | |
Affiliates | Companies related by common ownership or control. They can be financial and nonfinancial companies · The Integrity Funds · Viking Mutual Funds · Corridor Investors, LLC · Viking Fund Management, LLC · Integrity Funds Distributor, LLC · Integrity Fund Services, LLC |
Non-affiliates | Companies not related by common ownership or control. They can be financial and nonfinancial companies.
Integrity Viking Funds does not share with non-affiliates so they can market to you. |
Joint marketing | A formal agreement between non-affiliated financial companies that together market financial products or services to you.
Integrity Viking Funds doesn’t jointly market. |
Integrity Viking Funds includes:
- The Integrity Funds
- Viking Mutual Funds
PROXY VOTING OF FUND PORTFOLIO SECURITIES
A description of the policies and procedures that the Funds use to determine how to vote proxies relating to securities held in the Funds’ portfolios are available, without charge and upon request, by calling 800-276-1262. A report on Form N-PX of how the Funds voted any such proxies during the most recent 12-month period ended June 30 is available through the Funds’ website at www.integrityvikingfunds.com. The information is also available from the Electronic Data Gathering Analysis and Retrieval (“EDGAR”) database on the website of the Securities and Exchange Commission (“SEC”) at www.sec.gov.
QUARTERLY PORTFOLIO SCHEDULE
Within 60 days of the end of their second and fourth fiscal quarters, the Funds provide a complete schedule of portfolio holdings in their semi-annual and annual reports on the Form N-CSR(S). These reports are filed electronically with the SEC and are delivered to the shareholders of the Funds. The Funds also files its complete schedule of portfolio holdings with the SEC for the first and third quarters of each fiscal year on Form N-Q. The Funds’ Forms N-Q and N-CSR(S) are available on the SEC’s website at www.sec.gov. The Funds’ Forms N-Q and N-CSR(S) may be reviewed and copied at the SEC’s Public Reference Room in Washington, D.C. Information on the operation of the Public Reference Room may be obtained by calling 202-551-8090. You may also access this information from the Funds’ website at www.integrityvikingfunds.com.
SHAREHOLDER INQUIRIES AND MAILINGS
Direct inquiries regarding the Funds to: Integrity Funds Distributor, LLC PO Box 500 Minot, ND 58702 Phone: 800-276-1262 | Direct inquiries regarding account information to: Integrity Fund Services, LLC PO Box 759 Minot, ND 58702 Phone: 800-601-5593 |
To reduce their expenses, the Funds may mail only one copy of their prospectus and each annual and semi-annual report to those addresses shared by two or more accounts. If you wish to receive additional copies of these documents, please call Integrity Funds Distributor at 800-276-1262 or contact your financial institution. Integrity Funds Distributor will begin sending you individual copies 30 days after receiving your request.
Integrity Viking Funds are sold by prospectus only. An investor should consider the investment objectives, risks, and charges and expenses of the investment company carefully before investing. The prospectus contains this and other information about the investment company. You may obtain a prospectus at no cost from your financial adviser or at www.integrityvikingfunds.com. Please read the prospectus carefully before investing.

Equity Funds
Integrity Dividend Harvest Fund
Integrity Energized Dividend Fund
Integrity Growth & Income Fund
Williston Basin/Mid-North America Stock Fund
Corporate Bond Fund
Integrity High Income Fund
State-Specific Tax-Exempt Bond Funds
Viking Tax-Free Fund for North Dakota
Viking Tax-Free Fund for Montana
Kansas Municipal Fund
Maine Municipal Fund
Nebraska Municipal Fund
New Hampshire Municipal Fund
Oklahoma Municipal Fund
Item 2. CODE OF ETHICS.
At the end of the period covered by this report, the registrant has adopted a code of ethics as defined in Item 2 of Form N-CSR that applies to the registrant’s principal executive officer and principal financial officer (herein referred to as the “Code”). There were no amendments to the Code during the period covered by this report. The registrant did not grant any waivers, including implicit waivers, from any provisions of the Code during the period of this report. The Code is available on the Integrity Viking Funds website at http://www.integrityvikingfunds.com. A copy of the Code is also available, without charge, upon request by calling 800-601-5593. The Code is filed herewith pursuant to Item 12(a)(1) as EX-99.CODE ETH.
Item 3. AUDIT COMMITTEE FINANCIAL EXPERT.
The Board of Trustees has determined that Jerry Stai is an audit committee financial expert, as defined in Item 3 of Form N-CSR. Mr. Stai is “independent” for purposes of Item 3 of Form N-CSR.
Item 4. PRINCIPAL ACCOUNTANT FEES AND SERVICES.
| (a) | Audit Fees: The aggregate fees billed for each of the last two fiscal years for professional services rendered by Cohen Fund Audit Services, Ltd. (“Cohen”), the principal accountant for the audit of the registrant’s annual financial statements, for services that are normally provided by the accountant in connection with statutory and regulatory filings or engagements for those fiscal years were $64,600 for the year ended December 31, 2017 and $65,850 for the year ended December 30, 2016. | ||
|
|
| ||
| (b) | Audit-Related Fees: The aggregate fees billed in each of the last two fiscal years for assurance and related services by Cohen that are reasonably related to the performance of the audit of the registrant’s financial statements and are not reported under paragraph (a) of this Item were $0 for the year ended December 31, 2017 and $0 for the year ended December 30, 2016. | ||
|
|
| ||
| (c) | Tax Fees: The aggregate fees billed in each of the last two fiscal years for professional services rendered by Cohen for tax compliance, tax advice, and tax planning were $12,500 for the year ended December 31, 2017 and $12,500 for the year ended December 30, 2016. Such services included review of excise distribution calculations (if applicable), preparation of the Trust’s federal, state, and excise tax returns, tax services related to mergers, and routine counseling. | ||
|
|
| ||
| (d) | All Other Fees: The aggregate fees billed in each of the last two fiscal years for products and services provided by Cohen, other than the services reported in paragraphs (a) through (c) of this Item: None. | ||
|
|
| ||
| (e) | (1) | Audit Committee Pre-Approval Policies and Procedures | |
|
|
|
| |
|
|
|
| The registrant’s audit committee has adopted policies and procedures that require the audit committee to pre-approve all audit and non-audit services provided to the registrant by the principal accountant. |
|
|
|
| |
|
| (2) | Percentage of services referred to in 4(b) through 4(d) that were approved by the audit committee pursuant to paragraph (c)(7)(i)(C) of Rule 2-01 of Regulation S-X | |
|
|
|
| |
|
|
|
| 0% of the services described in paragraphs (b) through (d) of Item 4 were not pre-approved by the audit committee. |
|
|
| ||
| (f) | All services performed on the engagement to audit the registrant’s financial statements for the most recent fiscal year-end were performed by Cohen’s full-time permanent employees. | ||
|
|
| ||
| (g) | Non-Audit Fees: None. | ||
|
|
| ||
| (h) | Principal Accountant’s Independence: The registrant’s auditor did not provide any non-audit services to the registrant’s investment adviser or any entity controlling, controlled by, or controlled with the registrant’s investment adviser that provides ongoing services to the registrant. | ||
Item 5. AUDIT COMMITTEE OF LISTED REGISTRANTS.
Not applicable
Item 6. INVESTMENTS.
The Schedule of Investments is included as part of the report to shareholders filed under Item 1 of this Form.
Item 7. DISCLOSURE OF PROXY VOTING POLICIES AND PROCEDURES FOR CLOSED-END MANAGEMENT INVESTMENT COMPANIES.
Not applicable
Item 8. PORTFOLIO MANAGERS OF CLOSED-END MANAGEMENT INVESTMENT COMPANIES.
Not applicable
Item 9. PURCHASES OF EQUITY SECURITIES BY CLOSED-END MANAGEMENT INVESTMENT COMPANY AND AFFILIATED PURCHASERS.
Not applicable
Item 10. SUBMISSION OF MATTERS TO A VOTE OF SECURITY HOLDERS.
There have been no material changes to the procedures by which shareholders may recommend nominees to the registrant’s board of trustees in the last fiscal half-year.
Item 11. CONTROLS AND PROCEDURES.
| (a) | Based on their evaluation of the registrant’s disclosure controls and procedures as of a date within 90 days of the filing date of this Form N-CSR (the “Report”), the registrant’s principal executive officer and principal financial officer believe that the disclosure controls and procedures (as defined in Rule 30a-3(c) under the Investment Company Act of 1940, as amended) are effectively designed to ensure that information required to be disclosed by the registrant in the Report is recorded, processed, summarized and reported by the filing date, including ensuring that information required to be disclosed in the Report is accumulated and communicated to the registrant’s principal executive officer and principal financial officer who are making certifications in the Report, as appropriate, to allow timely decisions regarding required disclosure. |
|
|
|
| (b) | There were no changes in the registrant’s internal control over financial reporting (as defined in Rule 30a-3(d) under the Investment Company Act of 1940) that occurred during the registrant’s most recent fiscal half-year that have materially affected, or are reasonably likely to materially affect, the registrant's internal control over financial reporting. |
Item 12. EXHIBITS.
| (a) | (1) | Code of ethics pursuant to Item 2 of Form N-CSR is filed and attached hereto as EX-99. CODE ETH. |
|
|
|
|
|
| (2) | A separate certification for each principal executive officer and principal financial officer of the registrant as required by Rule 30a-2 under the 1940 Act (17 CFR 270.30a-2) is filed and attached hereto as EX-99. CERT. |
|
|
|
|
|
| (3) | Not applicable. |
|
|
| |
| (b) | Certifications pursuant to Section 906 of the Sarbanes-Oxley Act of 2002 is filed and attached hereto. | |
Pursuant to the requirements of the Securities Exchange Act of 1934 and the Investment Company Act of 1940, the registrant has duly caused this report to be signed on its behalf by the undersigned, thereunto duly authorized.
The Integrity Funds
By: /s/ Shannon D. Radke
Shannon D. Radke
President
March 7, 2018
Pursuant to the requirements of the Securities Exchange Act of 1934 and the Investment Company Act of 1940, this report has been signed below by the following persons on behalf of the registrant and in the capacities and on the dates indicated.
By: /s/ Shannon D. Radke
Shannon D. Radke
President
March 7, 2018
By: /s/ Adam Forthun
Adam Forthun
Treasurer
March 7, 2018