N-CSR
UNITED STATES
SECURITIES AND EXCHANGE COMMISSION
Washington, D.C. 20549
FORM N-CSR
CERTIFIED SHAREHOLDER REPORT OF REGISTERED
MANAGEMENT INVESTMENT COMPANIES
Investment Company Act file number: 811-07322
The Integrity Funds
(Exact name of registrant as specified in charter)
1 Main Street North, Minot, ND | | 58703 |
(Address of principal offices) | | (Zip code) |
Brent Wheeler and/or Kevin Flagstad, PO Box 500, Minot, ND 58702
(Name and address of agent for service)
Registrant’s telephone number, including area code: 701-852-5292
Date of fiscal year end: July 31st
Date of reporting period: July 31, 2019
Item 1. REPORTS TO STOCKHOLDERS.

THE INTEGRITY FUNDS
Integrity Dividend Harvest Fund
Integrity Energized Dividend Fund
Integrity Growth & Income Fund
Integrity High Income Fund
Williston Basin/Mid-North America Stock Fund
Annual Report | July 31, 2019
Investment Adviser
Viking Fund Management, LLC
PO Box 500
Minot, ND 58702 | Principal Underwriter
Integrity Funds Distributor, LLC*
PO Box 500
Minot, ND 58702 |
Transfer Agent
Integrity Fund Services, LLC
PO Box 759
Minot, ND 58702 | Custodian
Wells Fargo Bank, N.A.
Trust & Custody Solutions
801 Nicollet Mall, Suite 700
Minneapolis, MN 55479 |
Independent Registered Public Accounting Firm
Cohen & Company, Ltd.
151 N. Franklin Street, Suite 575
Chicago, IL 60606 |
*The Funds are distributed through Integrity Funds Distributor, LLC. Member FINRA
IMPORTANT NOTE: Beginning on January 1, 2021, as permitted by regulations adopted by the Securities and Exchange Commission, paper copies of the Integrity Viking Funds’ (the “Funds”) annual and semi-annual shareholder reports will no longer be sent by mail, unless you specifically request paper copies of the shareholder reports from the Funds or from your financial intermediary, such as a broker-dealer or bank. Instead, shareholder reports will be available on the Funds’ website (https://www.integrityvikingfunds.com/Documents), and you will be notified by mail each time a report is posted and provided with a website link to access the report.
If you hold Fund shares through a financial intermediary and you already elected to receive shareholder reports electronically through your financial intermediary, you will not be affected by this change and you need not take any action. You may elect to receive shareholder reports and other communications from the Funds electronically by notifying your financial intermediary.
You may elect to receive all future shareholder reports in paper free of charge. You can inform your financial intermediary that you wish to continue receiving paper copies of your shareholder reports, or if you are a direct investor, by calling the Funds at 800-601-5593. Your election to receive reports in paper will apply to all Funds you hold directly or through your financial intermediary, as applicable.
INTEGRITY DIVIDEND HARVEST FUND
Enclosed is the report of the operations for the Integrity Dividend Harvest Fund (the “Dividend Harvest Fund” or “Fund”) for the year ended July 31, 2019. The Fund’s portfolio and related financial statements are presented within for your review.
The third quarter of 2018 saw the S&P 500 Index (“S&P”) return 7.71%. Headlines continued to focus on the risks of trade wars as the U.S. implemented tariffs affecting multiple industries. However, the market shrugged off these concerns as it ticked higher over the quarter. The companies comprising the S&P reported second quarter earnings that grew approximately 25.0% on revenue growth of 9.5%, year-over-year. Of these companies, 80% beat analyst expectations. The U.S. Bureau of Labor Statistics reported that the unemployment rate fell to 3.7% in September, its lowest level since 1969. As expected, the U.S. Federal Reserve (“Fed”) voted to increase the target range for the federal funds rate by 0.25% at its two-day September meeting of the Federal Open Market Committee. The Fed noted that the labor market had continued to strengthen and that economic activity had been rising at a strong rate. All eleven sectors had positive returns in the third quarter of 2018. Healthcare was the best performing sector returning 14.47% as Pharmaceuticals and Life Sciences Tools were some of the market’s best performing industries. The Materials sector was the worst performing sector with a return of 0.35%.
The S&P had a negative return of -13.52% for the fourth quarter of 2018 as volatility (as measured by the VIX volatility index) jumped higher at the beginning of October and remained at elevated levels throughout the quarter. The VIX spent most of the period between 20 and 30 as fears of trade tensions, slowing global growth, and rising yields caused fear among market participants. Once again, the Fed voted to increase the target range for the federal funds rate by 0.25% at its December meeting. The hawkish tone of the Fed was cited as the likely reason why the market pulled back. After an impressive third quarter where all eleven sectors had positive returns, the fourth quarter disappointed with only one sector ending positively. The Utilities sector was the lone winner, albeit modestly, with a return of 1.36% as investors sought safety amid market volatility. Energy was by far the worst performer with a return of -23.78%. Oil prices dropped dramatically over the quarter as fears of oversupply spread.
During the first quarter of 2019, the S&P returned 13.65%, which marked the highest quarterly return since 2009. The quarterly performance, a stark contrast to the previous quarter, was mostly attributed to the Fed turning dovish in their January meeting. They noted that patience would be applied to both increases in the federal funds rate and balance sheet normalization. The Fed said they would adjust policy as necessary to maintain employment and target inflation. Volatility steadily declined during the quarter. The VIX dropped from the mid-20s to the low teens as the market steadily climbed. The companies comprising the S&P reported fourth quarter earnings that grew approximately 16.9% on revenue growth of 5.1%, year-over-year. Although strong, these rates of growth were lower than all quarters in 2018. The Fed voted to maintain the target range for the federal funds rate at its January and March meetings. The Fed noted that it continues to view sustained expansion of economic activity, strong labor market conditions, and inflation near the 2% objective as the most likely outcomes looking forward. Although, in light of global economic and financial developments and muted inflation pressures, the Fed said it would be patient as it determines what future adjustments to the target range for the federal funds rate may be appropriate to support those outcomes. After a disappointing fourth quarter where only one sector ended positive, the first quarter of 2019 ended with all eleven sectors showing a positive return. The Technology sector led the market with a return of 19.86% as investors felt more confident investing in growth names. Healthcare was the worst performer with a return of 6.62% as an above-average number of healthcare companies had issued negative earnings guidance.
The S&P returned 4.30% over the second quarter of 2019. The market experienced some volatility in returns over the quarter as uncertainty around the effects of tariffs weighed on investors. Volatility remained low early in the period but spiked higher in May, coinciding with a decline in the S&P. The U.S. Bureau of Labor Statistics reported that the unemployment rate declined from 3.8% to 3.6% in April, another low not seen since 1969. The Fed voted to maintain the target range for the federal funds rate at its May and June meetings. They noted that they continued to view sustained expansion of economic activity as the most likely outcome, but uncertainties about this outlook have increased. Expectations were lowered for the 2020 and 2021 median federal funds rates to 2.1% and 2.4%, respectively. Previous expectations were 2.6% and 2.6%. Similar to the first quarter, the second quarter of 2019 ended with all eleven sectors showing a positive return. Also similar to the first quarter, Technology led the market again with a return of 21.40% as investors continued to add to the sector. The Utilities sector was the worst performer with a return of 3.29% as investors appeared to prefer sectors offering higher growth potential.
The S&P returned 1.44% in July of 2019. Minutes from the Fed’s July meeting showed policy makers believed that “it was important to maintain optionality in setting policy.” The Fed voted 8-2 to lower the target range for the federal funds rate by 0.25%, marking its first such rate reduction in more than a decade. Most Fed members who supported the rate cut agreed with Fed Chairman Jerome Powell’s assessment that it was a mid-cycle adjustment and thus not the start of an aggressive monetary easing campaign.
The Fund’s total returns for Class A, C, and I shares were 8.67%*, 7.84%*, and 8.94%*, respectively, for the year ended July 31, 2019 while the S&P gained 7.99%. The Fund is in the Morningstar Large Value category which returned 6.60% over the same time period. The Fund outperformed the S&P, primarily driven by stock selection in Energy, an overweight allocation to Utilities, and stock selection in Consumer Discretionary. Detracting from relative performance was an overweight allocation to Energy and an underweight allocation to Technology.
The Fund seeks to maximize total return by emphasizing high current income with long term appreciation as a secondary objective, consistent with preservation of capital. The Portfolio Management Team (“Team”) considers dividend yield, dividend growth rate, earnings growth, price-to-earnings multiples, and balance sheet strength. The Team emphasizes dividend yield in selecting stocks for the Fund because we believe that, over time, dividend income can contribute significantly to total return and is a more consistent source of investment return than appreciation. If you would like more frequent updates, please visit the Fund’s website at integrityvikingfunds.com for daily prices along with pertinent Fund information.
Sincerely,
The Portfolio Management Team
The views expressed are those of The Portfolio Management Team of Viking Fund Management. The views are subject to change at any time in response to changing circumstances in the market and are not intended to predict or guarantee the future performance of any individual security, market sector, the markets generally, or any of the funds in the Integrity Viking family of funds.
*Performance does not include applicable front-end or contingent deferred sales charges, which would have reduced the performance. The total annual fund operating expense ratio (before expense waivers and reimbursements and including acquired fund fees and expenses) as of the most recent fiscal year-end was 1.51%, 2.26%, and 1.26% for Class A, C, and I, respectively. The net annual fund operating expense ratio (after expense waivers and reimbursements and excluding acquired fund fees and expenses) as of the most recent fiscal year-end was 0.95%, 1.70%, and 0.70% for Class A, C, and I, respectively. The Fund’s investment adviser has contractually agreed to waive fees and reimburse expenses through November 29, 2020 so that total annual fund operating expenses after fee waivers and expense reimbursements (excluding taxes, brokerage fees, commissions, extraordinary and non-recurring expenses, and acquired fund fees and expenses) do not exceed 0.95%, 1.70%, and 0.70% for Class A, C, and I, respectively. This expense limitation agreement may only be terminated or modified prior to November 29, 2020 with the approval of the Fund’s Board of Trustees.
Performance data quoted above is historical. Past performance is no guarantee of future results. Current performance may be higher or lower than the performance data quoted. The principal value and investment return of an investment will fluctuate so that your shares, when redeemed, may be worth more or less than the original cost. You can obtain performance data current to the most recent month end (available within seven business days of the most recent month end) by calling 800-276-1262.
You should consider the Fund’s investment objectives, risks, charges, and expenses carefully before investing. For this and other important information, please obtain a Fund prospectus at no cost from your financial adviser and read it carefully before investing.
INTEGRITY DIVIDEND HARVEST FUND
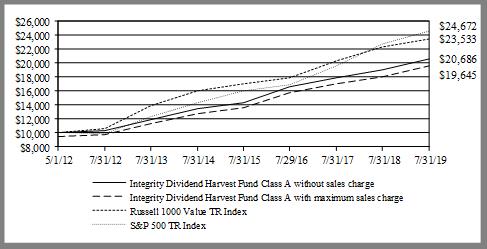
Comparison of change in value of a $10,000 investment
Average Annual Total Returns for the periods ended July 31, 2019
| 1 year | 3 year | 5 year | 10 year | Since Inception* |
Class A Without sales charge | 8.67% | 7.40% | 9.00% | N/A | 10.54% |
Class A With sales charge (5.00%) | 3.24% | 5.58% | 7.89% | N/A | 9.76% |
Class C Without CDSC | 7.84% | 6.60% | N/A | N/A | 8.87% |
Class C With CDSC (1.00%) | 6.86% | 6.60% | N/A | N/A | 8.87% |
Class I Without sales charge | 8.94% | N/A | N/A | N/A | 7.85% |
* May 1, 2012 for Class A; August 3, 2015 for Class C; August 1, 2016 for Class I |
The total annual fund operating expense ratio (before expense waivers and reimbursements and including acquired fund fees and expenses) as of the most recent fiscal year-end was 1.51%, 2.26%, and 1.26% for Class A, C, and I, respectively. The net annual fund operating expense ratio (after expense waivers and reimbursements and excluding acquired fund fees and expenses) as of the most recent fiscal year-end was 0.95%, 1.70%, and 0.70% for Class A, C, and I, respectively. The Fund’s investment adviser has contractually agreed to waive fees and reimburse expenses through November 29, 2020 so that total annual fund operating expenses after fee waivers and expense reimbursements (excluding taxes, brokerage fees, commissions, extraordinary and non-recurring expenses, and acquired fund fees and expenses) do not exceed 0.95%, 1.70%, and 0.70% for Class A, C, and I, respectively. This expense limitation agreement may only be terminated or modified prior to November 29, 2020 with the approval of the Fund’s Board of Trustees.
Performance data quoted above is historical. Past performance is no guarantee of future results. Current performance may be higher or lower than the performance data quoted. The principal value and investment return of an investment will fluctuate so that your shares, when redeemed, may be worth more or less than the original cost. You can obtain performance data current to the most recent month end (available within seven business days of the most recent month end) by calling 800-276-1262.
The table and graph above do not reflect the deduction of taxes that a shareholder would pay on Fund distributions and redemptions of Fund shares. The graph comparing the Fund’s performance to a benchmark index provides you with a general sense of how the Fund performed. To put this information in context, it may be helpful to understand the special differences between the two. The Fund’s total return for the period shown appears with and without sales charges and includes Fund expenses and management fees. A securities index measures the performance of a theoretical portfolio. Unlike a fund, the index is unmanaged; there are no expenses that affect the results. In addition, few investors could purchase all of the securities to match the index. If they could, transaction costs and other expenses would be incurred. All Fund and benchmark returns include reinvested dividends.
INTEGRITY ENERGIZED DIVIDEND FUND
Enclosed is the report of the operations for the Integrity Energized Dividend Fund (the “Energized Dividend Fund” or “Fund”) for the year ended July 31, 2019. The Fund’s portfolio and related financial statements are presented within for your review.
Oil Commentary
Over the third quarter of 2018, oil prices modestly increased as the November deadline for sanctions on Iran began to impact Iranian oil exports. Additionally, OPEC had an unofficial meeting where the cartel decided not to increase production, despite President Trump’s demands. Over the third quarter, every major shale oil basin saw production increase by 5% or more as completion activity accelerated. While production from the Permian Basin increased in line with other basins over the third quarter, the rate of change began to slow as production edged closer to takeaway capacity. The increase in shale production over the third quarter put the oil market into a more balanced scenario.
Over the fourth quarter of 2018, oil prices collapsed as oil production from Saudi Arabia, Russia, and the United States rose rapidly. In September, the crude market was undersupplied and prices were on the rise. U.S. sanctions on Iran were beginning to effect supply as Iranian crude oil exports began to fall. However, Saudi Arabia and Russia began to increase production to offset lost barrels from Iran. Additionally, U.S. shale production surged in the fourth quarter. The result was an estimated one and a half million barrels of oil per day being added to global supply from September to December. This swung the market from being undersupplied to being heavily oversupplied. WTI crude prices fell from $73/barrel to $45/barrel over the fourth quarter. Energy equities followed crude oil down over the quarter, with many energy sub-industries trading down over 30%. The U.S. hit a major milestone in November, becoming the world’s top crude oil producer. Shale oil production rose every month in 2018 and finished the year above eight million barrels per day. While excess supply put downward pressure on crude prices, capital discipline amongst producers has reduced shale production growth expectations for 2019. Investor demands for capital discipline have lead to reduced capital expenditures at the producer level. 2019 will also bring lower production from OPEC+, as the cartel agreed in December to cut oil production beginning in January.
Over the first quarter of 2019, the disconnect between energy equities and crude oil continued to expand. The energy sector traded well below its historical average multiples and the sector continued to represent near a record low as a percentage of the S&P 500 Index (“S&P”). The energy sector’s strong performance over the first quarter was driven by global supply constraints, OPEC policy, capital discipline, and resilient global oil demand. On a fundamental basis, energy equities had strong free cash flows and greatly improved balance sheets.
Over the second quarter of 2019, crude oil and energy equities traded lower due to an unseasonal build in crude inventories and 2020 demand concerns. Energy equities underperformed crude oil over the second quarter, adding to the performance disconnect witnessed over the trailing five years. While the strength of the consumer was strong, trade concerns were the primary driver for the heightened demand concerns as the world’s two largest economies attempted to settle trade disputes. Through most of the second quarter, domestic crude inventories built, however reversed to heavy draws towards to end of June. We expect domestic inventories to draw heavily in the second half of 2019. Three large scale pipelines in the Permian Basin are nearing completion (Gray Oak, Cactus II, and EPIC) and line-fill for those pipelines will commence in the coming months. This will have a temporary impact on crude oil available to refiners and will move barrels from being classified as available to in-transit. On the shale activity front, operator capital discipline is beginning to weigh on oilfield service companies as the rig count fell over the second quarter and completion cadence was relatively stagnant. To adapt to the changing environment, companies across the entire energy value chain will continue to consolidate to build on efficiencies and scale.
Moving to the Middle East, OPEC had a successful meeting in June and extended their production cuts for nine months. The market was expecting a six month extension. OPEC also changed its verbiage of the purpose for the production cut to managing inventories versus managing price. Tensions rose between Saudi Arabia and Iran, as well as the United States and Iran. Iranian aggression, if escalated, will likely bring back a risk premium for crude oil as the potential for a supply disruption would become more likely. Iranian sanctions are having a real impact on crude flows from Iran, witnessed by the significant decline in crude oil exports. We remain constructive on crude oil and energy equities for the second half of 2019 and believe larger capitalized companies with strong balance sheets and free cash flow generation will outperform for the remainder of 2019.
Market Commentary
The third quarter of 2018 saw the S&P return 7.71%. Headlines continued to focus on the risks of trade wars as the U.S. implemented tariffs affecting multiple industries. However, the market shrugged off these concerns as it ticked higher over the quarter. The companies comprising the S&P reported second quarter earnings that grew approximately 25.0% on revenue growth of 9.5%, year-over-year. Of these companies, 80% beat analyst expectations. The U.S. Bureau of Labor Statistics reported that the unemployment rate fell to 3.7% in September, its lowest level since 1969. As expected, the U.S. Federal Reserve (“Fed”) voted to increase the target range for the federal funds rate by 0.25% at its two-day September meeting of the Federal Open Market Committee. The Fed noted that the labor market had continued to strengthen and that economic activity had been rising at a strong rate. All eleven sectors had positive returns in the third quarter of 2018. Healthcare was the best performing sector returning 14.47% as Pharmaceuticals and Life Sciences Tools were some of the market’s best performing industries. The Materials sector was the worst performing sector with a return of 0.35%.
The S&P had a negative return of -13.52% for the fourth quarter of 2018 as volatility (as measured by the VIX volatility index) jumped higher at the beginning of October and remained at elevated levels throughout the quarter. The VIX spent most of the period between 20 and 30 as fears of trade tensions, slowing global growth, and rising yields caused fear among market participants. Once again, the Fed voted to increase the target range for the federal funds rate by 0.25% at its December meeting. The hawkish tone of the Fed was cited as the likely reason why the market pulled back. After an impressive third quarter where all eleven sectors had positive returns, the fourth quarter disappointed with only one sector ending positively. The Utilities sector was the lone winner, albeit modestly, with a return of 1.36% as investors sought safety amid market volatility.
During the first quarter of 2019, the S&P returned 13.65%, which marked the highest quarterly return since 2009. The quarterly performance, a stark contrast to the previous quarter, was mostly attributed to the Fed turning dovish in their January meeting. They noted that patience would be applied to both increases in the federal funds rate and balance sheet normalization. The Fed said they would adjust policy as necessary to maintain employment and target inflation. Volatility steadily declined during the quarter. The VIX dropped from the mid-20s to the low teens as the market steadily climbed. The companies comprising the S&P reported fourth quarter earnings that grew approximately 16.9% on revenue growth of 5.1%, year-over-year. Although strong, these rates of growth were lower than all quarters in 2018. The Fed voted to maintain the target range for the federal funds rate at its January and March meetings. The Fed noted that it continues to view sustained expansion of economic activity, strong labor market conditions, and inflation near the 2% objective as the most likely outcomes looking forward. Although, in light of global economic and financial developments and muted inflation pressures, the Fed said it would be patient as it determines what future adjustments to the target range for the federal funds rate may be appropriate to support those outcomes. After a disappointing fourth quarter where only one sector ended positive, the first quarter of 2019 ended with all eleven sectors showing a positive return. The Technology sector led the market with a return of 19.86% as investors felt more confident investing in growth names. Healthcare was the worst performer with a return of 6.62% as an above-average number of healthcare companies had issued negative earnings guidance.
The S&P returned 4.30% over the second quarter of 2019. The market experienced some volatility in returns over the quarter as uncertainty around the effects of tariffs weighed on investors. Volatility remained low early in the period but spiked higher in May, coinciding with a decline in the S&P. The U.S. Bureau of Labor Statistics reported that the unemployment rate declined from 3.8% to 3.6% in April, another low not seen since 1969. The Fed voted to maintain the target range for the federal funds rate at its May and June meetings. They noted that they continued to view sustained expansion of economic activity as the most likely outcome, but uncertainties about this outlook have increased. Expectations were lowered for the 2020 and 2021 median federal funds rates to 2.1% and 2.4%, respectively. Previous expectations were 2.6% and 2.6%. Similar to the first quarter, the second quarter of 2019 ended with all eleven sectors showing a positive return. Also similar to the first quarter, Technology led the market again with a return of 21.40% as investors continued to add to the sector. The Utilities sector was the worst performer with a return of 3.29% as investors appeared to prefer sectors offering higher growth potential.
The S&P returned 1.44% in July of 2019. Minutes from the Fed’s July meeting showed policy makers believed that “it was important to maintain optionality in setting policy.” The Fed voted 8-2 to lower the target range for the federal funds rate by 0.25%, marking its first such rate reduction in more than a decade. Most Fed members who supported the rate cut agreed with Fed Chairman Jerome Powell’s assessment that it was a mid-cycle adjustment and thus not the start of an aggressive monetary easing campaign.
The Fund’s total returns for Class A, C, and I shares were -7.18%*, -7.94%*, and -7.02%*, respectively, for the year ended July 31, 2019 compared to returns of -20.01% and 5.06% for the S&P Composite 1500 Energy Index and the S&P Composite 1500 Index, respectively. Aiding relative performance was an overweight allocation to Midstream, an underweight allocation to Exploration & Production, and an overweight allocation to Utilities. Detracting from relative performance was stock selection in Integrateds and Midstream.
If you would like more frequent updates, please visit the Fund’s website at integrityvikingfunds.com for daily prices along with pertinent Fund information.
Sincerely,
The Portfolio Management Team
The views expressed are those of The Portfolio Management Team of Viking Fund Management. The views are subject to change at any time in response to changing circumstances in the market and are not intended to predict or guarantee the future performance of any individual security, market sector, the markets generally, or any of the funds in the Integrity Viking family of funds.
*Performance does not include applicable front-end or contingent deferred sales charges, which would have reduced the performance. The total annual fund operating expense ratio (before expense waivers and reimbursements and including acquired fund fees and expenses) as of the most recent fiscal year-end was 2.75%, 3.51%, and 2.46% for Class A, C, and I, respectively. The net annual fund operating expense ratio (after expense waivers and reimbursements and excluding acquired fund fees and expenses) as of the most recent fiscal year-end was 0.67%, 1.42%, and 0.42% for Class A, C, and I, respectively. The Fund’s investment adviser has contractually agreed to waive fees and reimburse expenses through November 29, 2020 so that total annual fund operating expenses after fee waivers and expense reimbursements (excluding taxes, brokerage fees, commissions, extraordinary and non-recurring expenses, and acquired fund fees and expenses) do not exceed 1.05%, 1.80%, and 0.80% for Class A, C, and I, respectively. This expense limitation agreement may only be terminated or modified prior to November 29, 2020 with the approval of the Fund’s Board of Trustees.
Performance data quoted above is historical. Past performance is no guarantee of future results. Current performance may be higher or lower than the performance data quoted. The principal value and investment return of an investment will fluctuate so that your shares, when redeemed, may be worth more or less than the original cost. You can obtain performance data current to the most recent month end (available within seven business days of the most recent month end) by calling 800-276-1262.
You should consider the Fund’s investment objectives, risks, charges, and expenses carefully before investing. For this and other important information, please obtain a Fund prospectus at no cost from your financial adviser and read it carefully before investing.
INTEGRITY ENERGIZED DIVIDEND FUND
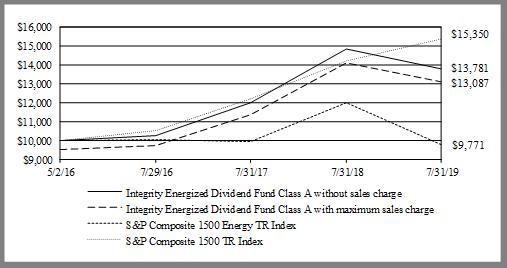
Comparison of change in value of a $10,000 investment
Average Annual Total Returns for the periods ended July 31, 2019
| 1 year | 3 year | 5 year | 10 year | Since Inception* |
Class A Without sales charge | -7.18% | 10.36% | N/A | N/A | 10.37% |
Class A With sales charge (5.00%) | -11.80% | 8.48% | N/A | N/A | 8.63% |
Class C Without CDSC | -7.94% | 9.51% | N/A | N/A | 9.52% |
Class C With CDSC (1.00%) | -8.77% | 9.51% | N/A | N/A | 9.52% |
Class I Without sales charge | -7.02% | N/A | N/A | N/A | 11.45% |
* May 2, 2016 for Class A and C; August 1, 2016 for Class I |
The total annual fund operating expense ratio (before expense waivers and reimbursements and including acquired fund fees and expenses) as of the most recent fiscal year-end was 2.75%, 3.51%, and 2.46% for Class A, C, and I, respectively. The net annual fund operating expense ratio (after expense waivers and reimbursements and excluding acquired fund fees and expenses) as of the most recent fiscal year-end was 0.67%, 1.42%, and 0.42% for Class A, C, and I, respectively. The Fund’s investment adviser has contractually agreed to waive fees and reimburse expenses through November 29, 2020 so that total annual fund operating expenses after fee waivers and expense reimbursements (excluding taxes, brokerage fees, commissions, extraordinary and non-recurring expenses, and acquired fund fees and expenses) do not exceed 1.05%, 1.80%, and 0.80% for Class A, C, and I, respectively. This expense limitation agreement may only be terminated or modified prior to November 29, 2020 with the approval of the Fund’s Board of Trustees.
Performance data quoted above is historical. Past performance is no guarantee of future results. Current performance may be higher or lower than the performance data quoted. The principal value and investment return of an investment will fluctuate so that your shares, when redeemed, may be worth more or less than the original cost. You can obtain performance data current to the most recent month end (available within seven business days of the most recent month end) by calling 800-276-1262.
The table and graph above do not reflect the deduction of taxes that a shareholder would pay on Fund distributions and redemptions of Fund shares. The graph comparing the Fund’s performance to a benchmark index provides you with a general sense of how the Fund performed. To put this information in context, it may be helpful to understand the special differences between the two. The Fund’s total return for the period shown appears with and without sales charges and includes Fund expenses and management fees. A securities index measures the performance of a theoretical portfolio. Unlike a fund, the index is unmanaged; there are no expenses that affect the results. In addition, few investors could purchase all of the securities to match the index. If they could, transaction costs and other expenses would be incurred. All Fund and benchmark returns include reinvested dividends.
INTEGRITY GROWTH & INCOME FUND
Enclosed is the report of the operations for the Integrity Growth & Income Fund (the “Growth & Income Fund” or “Fund”) for the year ended July 31, 2019. The Fund’s portfolio and related financial statements are presented within for your review.
The third quarter of 2018 saw the S&P 500 Index (“S&P”) return 7.71%. Headlines continued to focus on the risks of trade wars as the U.S. implemented tariffs affecting multiple industries. However, the market shrugged off these concerns as it ticked higher over the quarter. The companies comprising the S&P reported second quarter earnings that grew approximately 25.0% on revenue growth of 9.5%, year-over-year. Of these companies, 80% beat analyst expectations. The U.S. Bureau of Labor Statistics reported that the unemployment rate fell to 3.7% in September, its lowest level since 1969. As expected, the U.S. Federal Reserve (“Fed”) voted to increase the target range for the federal funds rate by 0.25% at its two-day September meeting of the Federal Open Market Committee. The Fed noted that the labor market had continued to strengthen and that economic activity had been rising at a strong rate. All eleven sectors had positive returns in the third quarter of 2018. Healthcare was the best performing sector returning 14.47% as Pharmaceuticals and Life Sciences Tools were some of the market’s best performing industries. The Materials sector was the worst performing sector with a return of 0.35%.
The S&P had a negative return of -13.52% for the fourth quarter of 2018 as volatility (as measured by the VIX volatility index) jumped higher at the beginning of October and remained at elevated levels throughout the quarter. The VIX spent most of the period between 20 and 30 as fears of trade tensions, slowing global growth, and rising yields caused fear among market participants. Once again, the Fed voted to increase the target range for the federal funds rate by 0.25% at its December meeting. The hawkish tone of the Fed was cited as the likely reason why the market pulled back. After an impressive third quarter where all eleven sectors had positive returns, the fourth quarter disappointed with only one sector ending positively. The Utilities sector was the lone winner, albeit modestly, with a return of 1.36% as investors sought safety amid market volatility. Energy was by far the worst performer with a return of -23.78%. Oil prices dropped dramatically over the quarter as fears of oversupply spread.
During the first quarter of 2019, the S&P returned 13.65%, which marked the highest quarterly return since 2009. The quarterly performance, a stark contrast to the previous quarter, was mostly attributed to the Fed turning dovish in their January meeting. They noted that patience would be applied to both increases in the federal funds rate and balance sheet normalization. The Fed said they would adjust policy as necessary to maintain employment and target inflation. Volatility steadily declined during the quarter. The VIX dropped from the mid-20s to the low teens as the market steadily climbed. The companies comprising the S&P reported fourth quarter earnings that grew approximately 16.9% on revenue growth of 5.1%, year-over-year. Although strong, these rates of growth were lower than all quarters in 2018. The Fed voted to maintain the target range for the federal funds rate at its January and March meetings. The Fed noted that it continues to view sustained expansion of economic activity, strong labor market conditions, and inflation near the 2% objective as the most likely outcomes looking forward. Although, in light of global economic and financial developments and muted inflation pressures, the Fed said it would be patient as it determines what future adjustments to the target range for the federal funds rate may be appropriate to support those outcomes. After a disappointing fourth quarter where only one sector ended positive, the first quarter of 2019 ended with all eleven sectors showing a positive return. The Technology sector led the market with a return of 19.86% as investors felt more confident investing in growth names. Healthcare was the worst performer with a return of 6.62% as an above-average number of healthcare companies had issued negative earnings guidance.
The S&P returned 4.30% over the second quarter of 2019. The market experienced some volatility in returns over the quarter as uncertainty around the effects of tariffs weighed on investors. Volatility remained low early in the period but spiked higher in May, coinciding with a decline in the S&P. The U.S. Bureau of Labor Statistics reported that the unemployment rate declined from 3.8% to 3.6% in April, another low not seen since 1969. The Fed voted to maintain the target range for the federal funds rate at its May and June meetings. They noted that they continued to view sustained expansion of economic activity as the most likely outcome, but uncertainties about this outlook have increased. Expectations were lowered for the 2020 and 2021 median federal funds rates to 2.1% and 2.4%, respectively. Previous expectations were 2.6% and 2.6%. Similar to the first quarter, the second quarter of 2019 ended with all eleven sectors showing a positive return. Also similar to the first quarter, Technology led the market again with a return of 21.40% as investors continued to add to the sector. The Utilities sector was the worst performer with a return of 3.29% as investors appeared to prefer sectors offering higher growth potential.
The S&P returned 1.44% in July of 2019. Minutes from the Fed’s July meeting showed policy makers believed that “it was important to maintain optionality in setting policy.” The Fed voted 8-2 to lower the target range for the federal funds rate by 0.25%, marking its first such rate reduction in more than a decade. Most Fed members who supported the rate cut agreed with Fed Chairman Jerome Powell’s assessment that it was a mid-cycle adjustment and thus not the start of an aggressive monetary easing campaign.
The Fund’s total returns for Class A, C, and I shares were 12.21%*, 11.74%*, and 12.51%*, respectively, for the year ended July 31, 2019 while the S&P gained 7.99%. The Fund is in the Morningstar Large Blend category which returned 6.50% over the same time period. The Fund outperformed the S&P, primarily driven by stock selection in Consumer Discretionary, an underweight allocation to Energy, and stock selection in Healthcare. Detracting from relative performance was an underweight allocation to Real Estate and stock selection in Utilities.
The Fund is managed using a blended growth and income investment strategy. The Portfolio Management Team (“Team”) seeks to invest primarily in domestic common stocks, balancing investments between growth & dividend paying stocks, depending on where we see the best value. The Team also tries to emphasize companies we believe offer both attractive investment opportunities and demonstrate a positive awareness of their impact on the society in which they operate.
If you would like more frequent updates, please visit the Fund’s website at integrityvikingfunds.com for daily prices along with pertinent Fund information.
Sincerely,
The Portfolio Management Team
The views expressed are those of The Portfolio Management Team of Viking Fund Management. The views are subject to change at any time in response to changing circumstances in the market and are not intended to predict or guarantee the future performance of any individual security, market sector, the markets generally, or any of the funds in the Integrity Viking family of funds.
*Performance does not include applicable front-end or contingent deferred sales charges, which would have reduced the performance. The total annual fund operating expense ratio (before expense waivers and reimbursements and including acquired fund fees and expenses) as of the most recent fiscal year-end was 1.93%, 1.68%, and 1.68% for Class A, C, and I, respectively. The net annual fund operating expense ratio (after expense waivers and reimbursements and excluding acquired fund fees and expenses) as of the most recent fiscal year-end was 1.25%, 1.68%, and 1.00% for Class A, C, and I, respectively. The Fund’s investment adviser has contractually agreed to waive fees and reimburse expenses through November 29, 2020 so that total annual fund operating expenses after fee waivers and expense reimbursements (excluding taxes, brokerage fees, commissions, extraordinary and non-recurring expenses, and acquired fund fees and expenses) do not exceed 1.25%, 2.00%, and 1.00% for Class A, C, and I, respectively. This expense limitation agreement may only be terminated or modified prior to November 29, 2020 with the approval of the Fund’s Board of Trustees.
Performance data quoted above is historical. Past performance is no guarantee of future results. Current performance may be higher or lower than the performance data quoted. The principal value and investment return of an investment will fluctuate so that your shares, when redeemed, may be worth more or less than the original cost. You can obtain performance data current to the most recent month end (available within seven business days of the most recent month end) by calling 800-276-1262.
You should consider the Fund’s investment objectives, risks, charges, and expenses carefully before investing. For this and other important information, please obtain a Fund prospectus at no cost from your financial adviser and read it carefully before investing.
INTEGRITY GROWTH & INCOME FUND
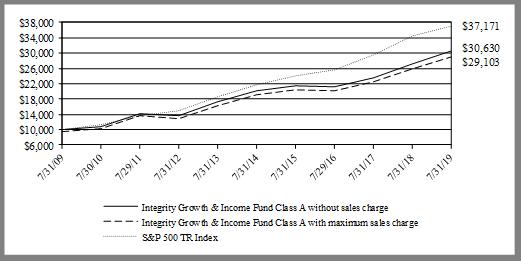
Comparison of change in value of a $10,000 investment
Average Annual Total Returns for the periods ended July 31, 2019
| 1 year | 3 year | 5 year | 10 year | Since Inception* |
Class A Without sales charge | 12.21% | 13.09% | 8.63% | 11.84% | 8.87% |
Class A With sales charge (5.00%) | 6.61% | 11.17% | 7.52% | 11.27% | 8.64% |
Class C Without CDSC | 11.74% | 12.43% | N/A | N/A | 8.91% |
Class C With CDSC (1.00%) | 10.74% | 12.43% | N/A | N/A | 8.91% |
Class I Without sales charge | 12.51% | N/A | N/A | N/A | 13.47% |
* January 3, 1995 for Class A; August 3, 2015 for Class C; August 1, 2016 for Class I |
The total annual fund operating expense ratio (before expense waivers and reimbursements and including acquired fund fees and expenses) as of the most recent fiscal year-end was 1.93%, 1.68%, and 1.68% for Class A, C, and I, respectively. The net annual fund operating expense ratio (after expense waivers and reimbursements and excluding acquired fund fees and expenses) as of the most recent fiscal year-end was 1.25%, 1.68%, and 1.00% for Class A, C, and I, respectively. The Fund’s investment adviser has contractually agreed to waive fees and reimburse expenses through November 29, 2020 so that total annual fund operating expenses after fee waivers and expense reimbursements (excluding taxes, brokerage fees, commissions, extraordinary and non-recurring expenses, and acquired fund fees and expenses) do not exceed 1.25%, 2.00%, and 1.00% for Class A, C, and I, respectively. This expense limitation agreement may only be terminated or modified prior to November 29, 2020 with the approval of the Fund’s Board of Trustees.
Performance data quoted above is historical. Past performance is no guarantee of future results. Current performance may be higher or lower than the performance data quoted. The principal value and investment return of an investment will fluctuate so that your shares, when redeemed, may be worth more or less than the original cost. You can obtain performance data current to the most recent month end (available within seven business days of the most recent month end) by calling 800-276-1262.
The table and graph above do not reflect the deduction of taxes that a shareholder would pay on Fund distributions and redemptions of Fund shares. The graph comparing the Fund’s performance to a benchmark index provides you with a general sense of how the Fund performed. To put this information in context, it may be helpful to understand the special differences between the two. The Fund’s total return for the period shown appears with and without sales charges and includes Fund expenses and management fees. A securities index measures the performance of a theoretical portfolio. Unlike a fund, the index is unmanaged; there are no expenses that affect the results. In addition, few investors could purchase all of the securities to match the index. If they could, transaction costs and other expenses would be incurred. All Fund and benchmark returns include reinvested dividends. The results prior to August 1, 2009 were achieved while the Fund was managed by a different investment adviser. The current investment adviser may produce different investment results than those achieved by the previous investment adviser.
INTEGRITY HIGH INCOME FUND
Enclosed is the report of the operations for the Integrity High Income Fund (the “High Income Fund” or “Fund”) for the year ended July 31, 2019. The Fund’s portfolio and related financial statements are presented within for your review.
Market Environment
The high-yield bond market posted healthy gains over the year ended July 31, 2019, even as volatility re-entered the market on multiple occasions. The fourth quarter sell-off, driven by the energy sector and exacerbated by the Federal Reserve’s (Fed’s) final rate hike, contributed to a negative return for the asset class in 2018. However, risk assets came roaring back in the first quarter, thanks to the Fed’s dovish pivot and better-than-expected fourth quarter earnings. This momentum carried through April, until trade concerns between the U.S. and China emerged again as the newest fear to spark an ever-pending recession. Volatility returned to lower levels during the summer months, and the Fed cut interest rates in July for the first time since September 2008. The 10-year U.S. Treasury note’s yield has fallen over 120 basis points (bps) since it peaked in the fourth quarter as investors have fled to the safe haven amid long-term economic concerns. The high-yield market increased 6.93% for the year ended July 31, 2019 (as measured by the ICE BofAML US High Yield Constrained Index, HUC0), despite spreads widening 50 bps to 407 bps, while yields decreased 34 bps to 6.02% due to the U.S. Treasury rally. Higher quality drastically outperformed lower quality, with BB-rated bonds returning 9.33%; single Bs, 6.33%; and CCCs, -1.41%. The banking, media and utility sectors led the contributors to performance while the energy sector was the only detractor.
Technicals remain strong as continued uncertainty about the health of the global economy and low to negative yields outside the U.S. are driving the demand for U.S. bond funds. However, for the year ended July 31, 2019, high yield saw an outflow of $6.7 billion due to large outflows during the fourth quarter. New issuance finished 2018 at muted levels, with only $187.4 billion pricing (down 43% year over year) but 2019 has been better, with $165.9 billion pricing through July, a 24% increase over the first seven months of 2018. Excluding refinancings (66% of total volume year to date), net volume of $56.8 billion is up 21% over the same period last year. Default activity has slightly increased as July had the greatest default volume since February 2018 with five defaults totaling $10.3 billion. The trailing 12-month par-weighted default rate is now 2.12%, though well below the long-term average of approximately 3.5%.
With a 6.93% return for the year ended July 31, 2019 (HUC0), high yield trailed high-grade credit (C0A0), 10.46%; emerging markets (EMCB), 9.35%; U.S. Aggregate (D0A0), 8.31%; and five-year Treasuries (GA05), 7.46%.
Portfolio Performance and Positioning
For the year ended July 31, 2019, the Integrity High Income Fund returned 6.74%* (A Class Shares, net of fees), 5.81%* (C Class Shares, net of fees) and 6.87%* (I Class Shares, net of fees) compared to its benchmark, the Bloomberg Barclays U.S. High Yield Index, which returned 6.92%, and the Morningstar High Yield category’s period return of 5.71%. The Fund’s A Class Shares underperformed the benchmark for the period due to underweights to banking and finance companies in addition to security selection in the technology sector. The largest detractors resulted from relative weightings in EP Energy, Halcon Resources, Envision Healthcare, High Ridge Brands and Windstream Holdings. Alternatively, contributions from an underweight to oil field services in addition to security selection in the wireless and cable satellite sectors enhanced performance for the period. Specifically, weightings in Softbank Group (Sprint), Weatherford International, DISH Network, PetSmart and Bausch Health Companies aided performance results.
Compared to the benchmark as of July 31, 2019, the Fund was overweight in consumer products, wireless and automotive due to our view of the relative value opportunities within those sectors. The Fund remained underweight in finance companies, metals and mining and home construction because we have not found these sectors attractive due to challenging fundamental outlooks or rich valuations. Relative to the benchmark as of July 31, 2019, the Fund’s yield, spread and duration were all lower.
Market Outlook
While global growth has decelerated, it remains supportive of credit fundamentals. Corporate earnings and cash flows continue to be solid despite moderating from peak levels. Corporate balance sheets remain sound as improved cash flow and modest spending plans keep leverage moderate. Defaults are likely to stay within the 1-2% range until economic activity weakens. We also expect an increase in merger-and-acquisition activity, which should be a net positive for high-yield issuers. Technicals are supportive with low net issuance and fund inflows of $15.5 billion year to date. Although volatility has increased due to concerns surrounding escalating trade tensions and the longevity of the current profit cycle, we believe the credit cycle continues to have significant runway and the asset class represents value relative to current and expected defaults, as well as other financial assets. Our fundamental research, bottom-up security selection style should allow us to continue to capitalize on market opportunities.
If you would like more frequent updates, please visit the Fund’s website at integrityvikingfunds.com for daily prices along with pertinent Fund information.
Sincerely,
Robert L. Cook
Managing Director
J.P. Morgan Investment Management, Inc. | Thomas G. Hauser
Vice President
J.P. Morgan Investment Management, Inc. |
The views expressed are those of Robert L. Cook, Senior Portfolio Manager and Managing Director, and Thomas G. Hauser, Vice President, J.P. Morgan Investment Management, Inc. (“JPMIM”), sub-adviser to the Fund. The views are subject to change at any time in response to changing circumstances in the market and are not intended to predict or guarantee the future performance of any individual security, market sector, the markets generally, or any of the funds in the Integrity Viking family of funds.
*Performance does not include applicable front-end or contingent deferred sales charges, which would have reduced the performance. The total annual fund operating expense ratio (before expense waivers and reimbursements and including acquired fund fees and expenses) as of the most recent fiscal year-end was 1.74%, 2.49%, and 1.49% for Class A, C, and I, respectively. The net annual fund operating expense ratio (after expense waivers and reimbursements and excluding acquired fund fees and expenses) as of the most recent fiscal year-end was 0.89%, 1.64%, and 0.64% for Class A, C, and I, respectively. The Fund’s investment adviser has contractually agreed to waive fees and reimburse expenses through November 29, 2020 so that total annual fund operating expenses after fee waivers and expense reimbursements (excluding taxes, brokerage fees, commissions, extraordinary and non-recurring expenses, and acquired fund fees and expenses) do not exceed 0.89%, 1.64%, and 0.64% for Class A, C, and I, respectively. This expense limitation agreement may only be terminated or modified prior to November 29, 2020 with the approval of the Fund’s Board of Trustees.
Performance data quoted above is historical. Past performance is no guarantee of future results. Current performance may be higher or lower than the performance data quoted. The principal value and investment return of an investment will fluctuate so that your shares, when redeemed, may be worth more or less than the original cost. You can obtain performance data current to the most recent month end (available within seven business days of the most recent month end) by calling 800-276-1262.
You should consider the Fund’s investment objectives, risks, charges, and expenses carefully before investing. For this and other important information, please obtain a Fund prospectus at no cost from your financial adviser and read it carefully before investing.
INTEGRITY HIGH INCOME FUND
Comparison of change in value of a $10,000 investment
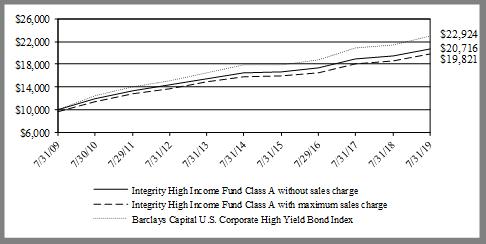
Average Annual Total Returns for the periods ended July 31, 2019
| 1 year | 3 year | 5 year | 10 year | Since Inception* |
Class A Without sales charge | 6.74% | 6.20% | 4.65% | 7.55% | 5.39% |
Class A With sales charge (4.25%) | 2.21% | 4.69% | 3.76% | 7.08% | 5.09% |
Class C Without CDSC | 5.81% | 5.41% | 3.84% | 6.75% | 4.58% |
Class C With CDSC (1.00%) | 4.81% | 5.41% | 3.84% | 6.75% | 4.58% |
Class I Without sales charge | 6.87% | N/A | N/A | N/A | 6.46% |
* April 30, 2004 for Class A and C; August 1, 2016 for Class I |
The total annual fund operating expense ratio (before expense waivers and reimbursements and including acquired fund fees and expenses) as of the most recent fiscal year-end was 1.74%, 2.49%, and 1.49% for Class A, C, and I, respectively. The net annual fund operating expense ratio (after expense waivers and reimbursements and excluding acquired fund fees and expenses) as of the most recent fiscal year-end was 0.89%, 1.64%, and 0.64% for Class A, C, and I, respectively. The Fund’s investment adviser has contractually agreed to waive fees and reimburse expenses through November 29, 2020 so that total annual fund operating expenses after fee waivers and expense reimbursements (excluding taxes, brokerage fees, commissions, extraordinary and non-recurring expenses, and acquired fund fees and expenses) do not exceed 0.89%, 1.64%, and 0.64% for Class A, C, and I, respectively. This expense limitation agreement may only be terminated or modified prior to November 29, 2020 with the approval of the Fund’s Board of Trustees.
Performance data quoted above is historical. Past performance is no guarantee of future results. Current performance may be higher or lower than the performance data quoted. The principal value and investment return of an investment will fluctuate so that your shares, when redeemed, may be worth more or less than the original cost. You can obtain performance data current to the most recent month end (available within seven business days of the most recent month end) by calling 800-276-1262.
The table and graph above do not reflect the deduction of taxes that a shareholder would pay on Fund distributions and redemptions of Fund shares. The graph comparing the Fund’s performance to a benchmark index provides you with a general sense of how the Fund performed. To put this information in context, it may be helpful to understand the special differences between the two. The Fund’s total return for the period shown appears with and without sales charges and includes Fund expenses and management fees. A securities index measures the performance of a theoretical portfolio. Unlike a fund, the index is unmanaged; there are no expenses that affect the results. In addition, few investors could purchase all of the securities to match the index. If they could, transaction costs and other expenses would be incurred. All Fund and benchmark returns include reinvested dividends. The results prior to August 1, 2009 were achieved while the Fund was managed by a different investment adviser. The current investment adviser may produce different investment results than those achieved by the previous investment adviser.
WILLISTON BASIN/MID-NORTH AMERICA STOCK FUND
Enclosed is the report of the operations for the Williston Basin/Mid-North America Stock Fund (the “WB/MNA Stock Fund” or “Fund”) for the year ended July 31, 2019. The Fund’s portfolio and related financial statements are presented within for your review.
The third quarter of 2018 saw the S&P 500 Index (“S&P”) return 7.71%. Headlines continued to focus on the risks of trade wars as the U.S. implemented tariffs affecting multiple industries. However, the market shrugged off these concerns as it ticked higher over the quarter. The companies comprising the S&P reported second quarter earnings that grew approximately 25.0% on revenue growth of 9.5%, year-over-year. Of these companies, 80% beat analyst expectations. The U.S. Bureau of Labor Statistics reported that the unemployment rate fell to 3.7% in September, its lowest level since 1969. As expected, the U.S. Federal Reserve (“Fed”) voted to increase the target range for the federal funds rate by 0.25% at its two-day September meeting of the Federal Open Market Committee. The Fed noted that the labor market had continued to strengthen and that economic activity had been rising at a strong rate. All eleven sectors had positive returns in the third quarter of 2018. Healthcare was the best performing sector returning 14.47% as Pharmaceuticals and Life Sciences Tools were some of the market’s best performing industries. The Materials sector was the worst performing sector with a return of 0.35%.
Over the third quarter of 2018, oil prices modestly increased as the November deadline for sanctions on Iran began to impact Iranian oil exports. Additionally, OPEC had an unofficial meeting where the cartel decided not to increase production, despite President Trump’s demands. Over the third quarter, every major shale oil basin saw production increase by 5% or more as completion activity accelerated. While production from the Permian Basin increased in line with other basins over the third quarter, the rate of change began to slow as production edged closer to takeaway capacity. The increase in shale production over the third quarter put the oil market into a more balanced scenario.
The S&P had a negative return of -13.52% for the fourth quarter of 2018 as volatility (as measured by the VIX volatility index) jumped higher at the beginning of October and remained at elevated levels throughout the quarter. The VIX spent most of the period between 20 and 30 as fears of trade tensions, slowing global growth, and rising yields caused fear among market participants. Once again, the Fed voted to increase the target range for the federal funds rate by 0.25% at its December meeting. The hawkish tone of the Fed was cited as the likely reason why the market pulled back. After an impressive third quarter where all eleven sectors had positive returns, the fourth quarter disappointed with only one sector ending positively. The Utilities sector was the lone winner, albeit modestly, with a return of 1.36% as investors sought safety amid market volatility.
Over the fourth quarter of 2018, oil prices collapsed as oil production from Saudi Arabia, Russia, and the United States rose rapidly. In September, the crude market was undersupplied and prices were on the rise. U.S. sanctions on Iran were beginning to effect supply as Iranian crude oil exports began to fall. However, Saudi Arabia and Russia began to increase production to offset lost barrels from Iran. Additionally, U.S. shale production surged in the fourth quarter. The result was an estimated one and a half million barrels of oil per day being added to global supply from September to December. This swung the market from being undersupplied to being heavily oversupplied. WTI crude prices fell from $73/barrel to $45/barrel over the fourth quarter. Energy equities followed crude oil down over the quarter, with many energy sub-industries trading down over 30%. The U.S. hit a major milestone in November, becoming the world’s top crude oil producer. Shale oil production rose every month in 2018 and finished the year above eight million barrels per day. While excess supply put downward pressure on crude prices, capital discipline amongst producers has reduced shale production growth expectations for 2019. Investor demands for capital discipline have lead to reduced capital expenditures at the producer level. 2019 will also bring lower production from OPEC+, as the cartel agreed in December to cut oil production beginning in January.
During the first quarter of 2019, the S&P returned 13.65%, which marked the highest quarterly return since 2009. The quarterly performance, a stark contrast to the previous quarter, was mostly attributed to the Fed turning dovish in their January meeting. They noted that patience would be applied to both increases in the federal funds rate and balance sheet normalization. The Fed said they would adjust policy as necessary to maintain employment and target inflation. Volatility steadily declined during the quarter. The VIX dropped from the mid-20s to the low teens as the market steadily climbed. The companies comprising the S&P reported fourth quarter earnings that grew approximately 16.9% on revenue growth of 5.1%, year-over-year. Although strong, these rates of growth were lower than all quarters in 2018. The Fed voted to maintain the target range for the federal funds rate at its January and March meetings. The Fed noted that it continues to view sustained expansion of economic activity, strong labor market conditions, and inflation near the 2% objective as the most likely outcomes looking forward. Although, in light of global economic and financial developments and muted inflation pressures, the Fed said it would be patient as it determines what future adjustments to the target range for the federal funds rate may be appropriate to support those outcomes. After a disappointing fourth quarter where only one sector ended positive, the first quarter of 2019 ended with all eleven sectors showing a positive return. The Technology sector led the market with a return of 19.86% as investors felt more confident investing in growth names. Healthcare was the worst performer with a return of 6.62% as an above-average number of healthcare companies had issued negative earnings guidance.
Over the first quarter of 2019, the disconnect between energy equities and crude oil continued to expand. The energy sector traded well below its historical average multiples and the sector continued to represent near a record low as a percentage of the S&P 500 Index. The energy sector’s strong performance over the first quarter was driven by global supply constraints, OPEC policy, capital discipline, and resilient global oil demand. On a fundamental basis, energy equities had strong free cash flows and greatly improved balance sheets.
The S&P returned 4.30% over the second quarter of 2019. The market experienced some volatility in returns over the quarter as uncertainty around the effects of tariffs weighed on investors. Volatility remained low early in the period but spiked higher in May, coinciding with a decline in the S&P. The U.S. Bureau of Labor Statistics reported that the unemployment rate declined from 3.8% to 3.6% in April, another low not seen since 1969. The Fed voted to maintain the target range for the federal funds rate at its May and June meetings. They noted that they continued to view sustained expansion of economic activity as the most likely outcome, but uncertainties about this outlook have increased. Expectations were lowered for the 2020 and 2021 median federal funds rates to 2.1% and 2.4%, respectively. Previous expectations were 2.6% and 2.6%. Similar to the first quarter, the second quarter of 2019 ended with all eleven sectors showing a positive return. Also similar to the first quarter, Technology led the market again with a return of 21.40% as investors continued to add to the sector. The Utilities sector was the worst performer with a return of 3.29% as investors appeared to prefer sectors offering higher growth potential.
Over the second quarter of 2019, crude oil and energy equities traded lower due to an unseasonal build in crude inventories and 2020 demand concerns. Energy equities underperformed crude oil over the second quarter, adding to the performance disconnect witnessed over the trailing five years. While the strength of the consumer was strong, trade concerns were the primary driver for the heightened demand concerns as the world’s two largest economies attempted to settle trade disputes. Through most of the second quarter, domestic crude inventories built, however reversed to heavy draws towards to end of June. We expect domestic inventories to draw heavily in the second half of 2019. Three large scale pipelines in the Permian Basin are nearing completion (Gray Oak, Cactus II, and EPIC) and line-fill for those pipelines will commence in the coming months. This will have a temporary impact on crude oil available to refiners and will move barrels from being classified as available to in-transit. On the shale activity front, operator capital discipline is beginning to weigh on oilfield service companies as the rig count fell over the second quarter and completion cadence was relatively stagnant. To adapt to the changing environment, companies across the entire energy value chain will continue to consolidate to build on efficiencies and scale.
Moving to the Middle East, OPEC had a successful meeting in June and extended their production cuts for nine months. The market was expecting a six month extension. OPEC also changed its verbiage of the purpose for the production cut to managing inventories versus managing price. Tensions rose between Saudi Arabia and Iran, as well as the United States and Iran. Iranian aggression, if escalated, will likely bring back a risk premium for crude oil as the potential for a supply disruption would become more likely. Iranian sanctions are having a real impact on crude flows from Iran, witnessed by the significant decline in crude oil exports. We remain constructive on crude oil and energy equities for the 2H2019 and believe larger capitalized companies with strong balance sheets and free cash flow generation will outperform for the remainder to 2019.
The S&P returned 1.44% in July of 2019. Minutes from the Fed’s July meeting showed policy makers believed that “it was important to maintain optionality in setting policy.” The Fed voted 8-2 to lower the target range for the federal funds rate by 0.25%, marking its first such rate reduction in more than a decade. Most Fed members who supported the rate cut agreed with Fed Chairman Jerome Powell’s assessment that it was a mid-cycle adjustment and thus not the start of an aggressive monetary easing campaign.
The Fund’s total returns for Class A, C, and I shares were -23.11%*, -23.51%*, and -22.84%*, respectively, for the year ended July 31, 2019, compared to returns of -20.01% and 5.06% for the S&P Composite 1500 Energy Index and the S&P Composite 1500 Index, respectively. Aiding relative performance was an overweight allocation to Pipelines and Oilfield Service selection. Detracting from the Fund’s performance relative to the S&P Composite 1500 Energy Index was an overweight allocation to Oilfield Service and an underweight allocation to Integrated Oil companies.
If you would like more frequent updates, please visit the Fund’s website at integrityvikingfunds.com for daily prices along with pertinent Fund information.
Sincerely,
The Portfolio Management Team
The views expressed are those of The Portfolio Management Team of Viking Fund Management, LLC (“Viking Fund Management”, “VFM”, or the “Adviser”). The views are subject to change at any time in response to changing circumstances in the market and are not intended to predict or guarantee the future performance of any individual security, market sector, the markets generally, or any of the funds in the Integrity Viking family of funds.
*Performance does not include applicable front-end or contingent deferred sales charges, which would have reduced the performance. The total annual fund operating expense ratio (before expense waivers and reimbursements and including acquired fund fees and expenses) as of the most recent fiscal year-end was 1.53%, 2.03%, and 1.03% for Class A, C, and I, respectively. The net annual fund operating expense ratio (after expense waivers and reimbursements and excluding acquired fund fees and expenses) as of the most recent fiscal year-end was 1.50%, 2.00%, and 1.00% for Class A, C, and I, respectively. The Fund’s investment adviser has contractually agreed to waive fees and reimburse expenses through November 29, 2020 so that total annual fund operating expenses after fee waivers and expense reimbursements (excluding taxes, brokerage fees, commissions, extraordinary and non-recurring expenses, and acquired fund fees and expenses) do not exceed 1.50%, 2.00%, and 1.00% for Class A, C, and I, respectively. This expense limitation agreement may only be terminated or modified prior to November 29, 2020 with the approval of the Fund’s Board of Trustees.
Performance data quoted above is historical. Past performance is no guarantee of future results. Current performance may be higher or lower than the performance data quoted. The principal value and investment return of an investment will fluctuate so that your shares, when redeemed, may be worth more or less than the original cost. You can obtain performance data current to the most recent month end (available within seven business days of the most recent month end) by calling 800-276-1262.
You should consider the Fund’s investment objectives, risks, charges, and expenses carefully before investing. For this and other important information, please obtain a Fund prospectus at no cost from your financial adviser and read it carefully before investing.
WILLISTON BASIN/MID-NORTH AMERICA STOCK FUND
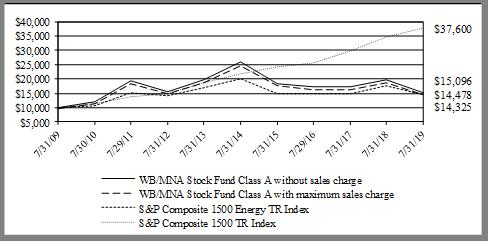
Comparison of change in value of a $10,000 investment
Average Annual Total Returns for the periods ended July 31, 2019
| 1 year | 3 year | 5 year | 10 year | Since Inception* |
Class A Without sales charge | -23.11% | -4.18% | -10.20% | 4.20% | 4.84% |
Class A With sales charge (5.00%) | -26.90% | -5.81% | -11.11% | 3.66% | 4.57% |
Class C Without CDSC | -23.51% | -4.64% | -10.66% | N/A | -9.42% |
Class C With CDSC (1.00%) | -24.27% | -4.64% | -10.66% | N/A | -9.42% |
Class I Without sales charge | -22.84% | N/A | N/A | N/A | -2.60% |
* April 5, 1999 for Class A; May 1, 2014 for Class C; August 1, 2016 for Class I |
The total annual fund operating expense ratio (before expense waivers and reimbursements and including acquired fund fees and expenses) as of the most recent fiscal year-end was 1.53%, 2.03%, and 1.03% for Class A, C, and I, respectively. The net annual fund operating expense ratio (after expense waivers and reimbursements and excluding acquired fund fees and expenses) as of the most recent fiscal year-end was 1.50%, 2.00%, and 1.00% for Class A, C, and I, respectively. The Fund’s investment adviser has contractually agreed to waive fees and reimburse expenses through November 29, 2020 so that total annual fund operating expenses after fee waivers and expense reimbursements (excluding taxes, brokerage fees, commissions, extraordinary and non-recurring expenses, and acquired fund fees and expenses) do not exceed 1.50%, 2.00%, and 1.00% for Class A, C, and I, respectively. This expense limitation agreement may only be terminated or modified prior to November 29, 2020 with the approval of the Fund’s Board of Trustees.
Performance data quoted above is historical. Past performance is no guarantee of future results. Current performance may be higher or lower than the performance data quoted. The principal value and investment return of an investment will fluctuate so that your shares, when redeemed, may be worth more or less than the original cost. You can obtain performance data current to the most recent month end (available within seven business days of the most recent month end) by calling 800-276-1262.
The table and graph above do not reflect the deduction of taxes that a shareholder would pay on Fund distributions and redemptions of Fund shares. The graph comparing the Fund’s performance to a benchmark index provides you with a general sense of how the Fund performed. To put this information in context, it may be helpful to understand the special differences between the two. The Fund’s total return for the period shown appears with and without sales charges and includes Fund expenses and management fees. A securities index measures the performance of a theoretical portfolio. Unlike a fund, the index is unmanaged; there are no expenses that affect the results. In addition, few investors could purchase all of the securities to match the index. If they could, transaction costs and other expenses would be incurred. All Fund and benchmark returns include reinvested dividends. The results prior to August 1, 2009 were achieved while the Fund was managed by a different investment adviser. The current investment adviser may produce different investment results than those achieved by the previous investment adviser. The Fund’s performance prior to November 10, 2008 was achieved under the previous investment strategy, which may have produced different results than the current investment strategy.
INTEGRITY DIVIDEND HARVEST FUND
PORTFOLIO MARKET SECTORS July 31, 2019
Consumer Staples | 20.0% |
Energy | 13.3% |
Utilities | 11.0% |
Health Care | 10.5% |
Communication Services | 10.1% |
Industrials | 9.5% |
Financials | 9.2% |
Information Technology | 8.5% |
Consumer Discretionary | 4.1% |
Materials | 2.8% |
Cash Equivalents and Other | 1.0% |
| | 100.0% |
| | | |
Market sectors are breakdowns of the Fund’s portfolio holdings into specific investment classes.
These percentages are based on net assets.
SCHEDULE OF INVESTMENTS July 31, 2019
| | | | | Fair |
| | | Shares | | Value |
COMMON STOCKS (99.0%) | | | | |
| | | | |
Communication Services (10.1%) | | | | |
AT&T Inc | | 180,000 | $ | 6,129,000 |
BCE Inc | | 60,000 | | 2,706,600 |
Verizon Communications Inc | | 89,000 | | 4,919,030 |
| | | | | 13,754,630 |
Consumer Discretionary (4.1%) | | | | |
Cracker Barrel Old Country Store Inc | | 8,000 | | 1,389,680 |
Genuine Parts Co | | 11,000 | | 1,068,320 |
McDonald's Corp | | 4,000 | | 842,880 |
Target Corp | | 26,000 | | 2,246,400 |
| | | | | 5,547,280 |
Consumer Staples (20.0%) | | | | |
Altria Group Inc | | 106,000 | | 4,989,420 |
Coca Cola Co/The | | 125,000 | | 6,578,750 |
Kimberly Clark Corp | | 36,000 | | 4,883,400 |
PepsiCo Inc | | 20,000 | | 2,556,200 |
Philip Morris International Inc | | 47,000 | | 3,929,670 |
Procter & Gamble Co/The | | 36,000 | | 4,249,440 |
| | | | | 27,186,880 |
Energy (13.3%) | | | | |
BP PLC ADR | | 62,000 | | 2,463,880 |
Royal Dutch Shell PLC ADR | | 42,000 | | 2,665,740 |
Chevron Corp | | 11,000 | | 1,354,210 |
Enbridge Inc | | 30,000 | | 1,001,700 |
Exxon Mobil Corp | | 65,000 | | 4,833,400 |
Kinder Morgan Inc/DE | | 95,000 | | 1,958,900 |
Occidental Petroleum Corp | | 47,000 | | 2,413,920 |
Sempra Energy | | 10,000 | | 1,354,300 |
| | | | | 18,046,050 |
Financials (9.2%) | | | | |
BlackRock Inc | | 6,500 | | 3,039,920 |
CME Group Inc | | 9,000 | | 1,749,780 |
JPMorgan Chase & Co | | 20,000 | | 2,320,000 |
Prudential Financial Inc | | 24,000 | | 2,431,440 |
Wells Fargo & Co | | 62,000 | | 3,001,420 |
| | | | | 12,542,560 |
Health Care (10.5%) | | | | |
AbbVie Inc | | 48,000 | | 3,197,760 |
AMGEN INC | | 10,000 | | 1,865,800 |
Bristol Myers Squibb Co | | 10,000 | | 444,100 |
Cardinal Health Inc | | 33,000 | | 1,509,090 |
Johnson & Johnson | | 34,000 | | 4,427,480 |
Merck & Co Inc | | 20,000 | | 1,659,800 |
Pfizer Inc | | 30,000 | | 1,165,200 |
| | | | | 14,269,230 |
Industrials (9.5%) | | | | |
Illinois Tool Works Inc | | 19,000 | | 2,930,370 |
Lockheed Martin Corp | | 13,700 | | 4,961,729 |
3M Co | | 29,000 | | 5,066,880 |
| | | | | 12,958,979 |
Information Technology (8.5%) | | | | |
Broadcom Inc | | 16,000 | | 4,639,840 |
International Business Machines Corp | | 35,000 | | 5,188,400 |
Texas Instruments Inc | | 14,000 | | 1,750,140 |
| | | | | 11,578,380 |
Materials (2.8%) | | | | |
Dow Inc | | 52,000 | | 2,518,880 |
Nucor Corp | | 24,000 | | 1,305,120 |
| | | | | 3,824,000 |
Utilities (11.0%) | | | | |
CenterPoint Energy Inc | | 84,000 | | 2,436,840 |
Dominion Resources Inc/VA | | 79,000 | | 5,868,910 |
Duke Energy Corp | | 50,000 | | 4,336,000 |
NextEra Energy Inc | | 11,500 | | 2,382,455 |
| | | | | 15,024,205 |
| | | | |
TOTAL COMMON STOCKS (COST: $129,134,463) | | | $ | 134,732,194 |
| | | | |
OTHER ASSETS LESS LIABILITES (1.0%) | | | $ | 1,300,688 |
| | | | |
NET ASSETS (100.0%) | | | $ | 136,032,882 |
| | | | |
ADR - American Depositary Receipt | | | | |
PLC - Public Limited Company | | | | |
|
|
The accompanying notes are an integral part of these financial statements. |
INTEGRITY ENERGIZED DIVIDEND FUND
PORTFOLIO MARKET SECTORS July 31, 2019
Energy | 82.3% |
Materials | 9.5% |
Industrials | 4.2% |
Cash Equivalents and Other | 2.6% |
Utilities | 1.4% |
| | 100.0% |
Market sectors are breakdowns of the Fund’s portfolio holdings into specific investment classes.
These percentages are based on net assets.
SCHEDULE OF INVESTMENTS July 31, 2019
| | | | | Fair |
| | | Shares | | Value |
COMMON STOCKS (97.4%) | | | | |
| | | | |
Energy (82.3%) | | | | |
BP PLC ADR | | 15,500 | $ | 615,970 |
Chevron Corp | | 1,600 | | 196,976 |
Enbridge Inc | | 6,700 | | 223,713 |
Exxon Mobil Corp | | 2,500 | | 185,900 |
Gibson Energy Inc | | 15,500 | | 268,590 |
Helmerich & Payne Inc | | 8,000 | | 397,440 |
Kinder Morgan Inc/DE | | 11,000 | | 226,820 |
Occidental Petroleum Corp | | 9,700 | | 498,192 |
Pembina Pipeline Corp | | 3,700 | | 134,273 |
Royal Dutch Shell PLC ADR | | 10,300 | | 653,741 |
Schlumberger Ltd | | 6,000 | | 239,820 |
TOTAL SA ADR | | 3,900 | | 201,786 |
TransCanada Corp | | 4,500 | | 220,320 |
Valero Energy Corp | | 2,000 | | 170,500 |
Williams Cos Inc/The | | 19,500 | | 480,480 |
| | | | | 4,714,521 |
Industrials (4.2%) | | | | |
Covanta Holding Corp | | 14,000 | | 241,080 |
| | | | | 241,080 |
Materials (9.5%) | | | | |
Compass Minerals International Inc | | 1,900 | | 106,115 |
Dow Inc | | 4,800 | | 232,512 |
LyondellBasell Industries NV | | 2,500 | | 209,225 |
| | | | | 547,852 |
Utilities (1.4%) | | | | |
Southern Co/The | | 1,400 | | 78,680 |
| | | | |
TOTAL COMMON STOCKS (COST: $5,864,719) | | | $ | 5,582,133 |
| | | | |
OTHER ASSETS LESS LIABILITIES (2.6%) | | | $ | 147,262 |
| | | | |
NET ASSETS (100.0%) | | | $ | 5,729,395 |
|
ADR - American Depositary Receipt PLC - Public Limited Company |
|
The accompanying notes are an integral part of these financial statements. |
INTEGRITY GROWTH & INCOME FUND
PORTFOLIO MARKET SECTORS July 31, 2019
Information Technology | 19.6% |
Financials | 14.2% |
Health Care | 14.0% |
Industrials | 13.1% |
Consumer Discretionary | 11.9% |
Communication Services | 9.4% |
Consumer Staples | 7.6% |
Utilities | 4.5% |
Cash Equivalents and Other | 3.7% |
Materials | 2.0% |
| | 100.0% |
| | | |
Market sectors are breakdowns of the Fund’s portfolio holdings into specific investment classes.
These percentages are based on net assets.
SCHEDULE OF INVESTMENTS July 31, 2019
| | | | | Fair |
| | | Shares | | Value |
COMMON STOCKS (96.3%) | | | | |
| | | | |
Communication Services (9.4%) | | | | |
AT&T Inc | | 40,000 | $ | 1,362,000 |
*Alphabet Inc | | 1,000 | | 1,218,200 |
Walt Disney Co/The | | 4,000 | | 572,040 |
Verizon Communications Inc | | 10,000 | | 552,700 |
| | | | | 3,704,940 |
Consumer Discretionary (11.9%) | | | | |
Best Buy Co Inc | | 8,000 | | 612,240 |
Home Depot Inc/The | | 3,500 | | 747,915 |
Lowe's Cos Inc | | 7,200 | | 730,080 |
Starbucks Corp | | 16,000 | | 1,515,040 |
Target Corp | | 6,000 | | 518,400 |
Yum! Brands Inc | | 5,000 | | 562,600 |
| | | | | 4,686,275 |
Consumer Staples (7.6%) | | | | |
Campbell Soup Co | | 21,000 | | 868,140 |
Kimberly Clark Corp | | 6,500 | | 881,725 |
PepsiCo Inc | | 9,500 | | 1,214,195 |
| | | | | 2,964,060 |
Financials (14.2%) | | | | |
Bank of America Corp | | 20,000 | | 613,600 |
BlackRock Inc | | 2,800 | | 1,309,504 |
JPMorgan Chase & Co | | 12,000 | | 1,392,000 |
PNC Financial Services Group Inc/The | | 3,000 | | 428,700 |
S&P Global Inc | | 3,000 | | 734,850 |
US Bancorp | | 19,000 | | 1,085,850 |
| | | | | 5,564,504 |
Health Care (14.0%) | | | | |
Becton Dickinson and Co | | 3,000 | | 758,400 |
*Biogen Inc | | 2,000 | | 475,640 |
*Celgene Corp | | 5,000 | | 459,300 |
*Edwards Lifesciences Corp | | 3,000 | | 638,550 |
Pfizer Inc | | 20,000 | | 776,800 |
Thermo Fisher Scientific Inc | | 5,000 | | 1,388,400 |
UnitedHealth Group Inc | | 4,000 | | 996,040 |
| | | | | 5,493,130 |
Industrials (13.1%) | | | | |
Caterpillar Inc | | 4,500 | | 592,515 |
Covanta Holding Corp | | 47,000 | | 809,340 |
Deere & Co | | 3,800 | | 629,470 |
FedEx Corp | | 3,500 | | 596,855 |
3M Co | | 5,500 | | 960,960 |
Waste Management Inc | | 7,000 | | 819,000 |
Ingersoll Rand PLC | | 6,000 | | 741,960 |
| | | | | 5,150,100 |
Information Technology (19.6%) | | | | |
*Advanced Micro Devices Inc | | 25,000 | | 761,250 |
Apple Inc | | 5,000 | | 1,065,200 |
HP Inc | | 28,000 | | 589,120 |
Intel Corp | | 24,000 | | 1,213,200 |
International Business Machines Corp | | 6,000 | | 889,440 |
NVIDIA Corp | | 4,000 | | 674,880 |
QUALCOMM Inc | | 17,000 | | 1,243,720 |
Visa Inc | | 7,000 | | 1,246,000 |
| | | | | 7,682,810 |
Materials (2.0%) | | | | |
Air Products & Chemicals Inc | | 3,500 | | 798,945 |
| | | | | |
Utilities (4.5%) | | | | |
ALLETE Inc | | 9,500 | | 826,025 |
Exelon Corp | | 21,000 | | 946,260 |
| | | | | 1,772,285 |
| | | | |
TOTAL COMMON STOCKS (COST: $26,972,697) | | | $ | 37,817,049 |
| | | | |
OTHER ASSETS AND LIABILITES (3.7%) | | | $ | 1,438,836 |
| | | | |
NET ASSETS (100.0%) | | | $ | 39,255,885 |
| |
* Non-income producing PLC - Public Limited Company |
|
|
The accompanying notes are an integral part of these financial statements. |
INTEGRITY HIGH INCOMEFUND
PORTFOLIO MARKET SECTORS July 31, 2019
Consumer Discretionary | 25.1% |
Communication Services | 12.7% |
Cash Equivalents and Other | 11.4% |
Health Care | 9.8% |
Industrials | 9.5% |
Energy | 9.2% |
Information Technology | 6.8% |
Materials | 7.3% |
Financials | 3.2% |
Consumer Staples | 2.8% |
Real Estate | 1.6% |
Utilities | 0.6% |
| | 100.0% |
Market sectors are breakdowns of the Fund’s portfolio holdings into specific investment classes.
These percentages are based on net assets.
SCHEDULE OF INVESTMENTS July 31, 2019
| | | Principal | | Fair |
| | | Amount | | Value |
CORPORATE BONDS (86.3%) | | | | |
| | | | |
Communication Services (12.7%) | | | | |
*AMC Entertainment Inc 5.750% 06/15/2025 | $ | 35,000 | $ | 33,064 |
AMC Networks Inc 5.000% 04/01/2024 | | 55,000 | | 56,427 |
CenturyLink Inc 5.625% 04/01/2025 | | 25,000 | | 25,325 |
CenturyLink Inc 5.800% 03/15/2022 | | 40,000 | | 41,600 |
CenturyLink Inc 6.750% 12/01/2023 | | 100,000 | | 107,915 |
CenturyLink Inc 7.500% 04/01/2024 | | 15,000 | | 16,420 |
Cincinnati Bell Inc - 144A 7.000% 07/15/2024 | | 35,000 | | 29,925 |
Cincinnati Bell Inc - 144A 8.000% 10/15/2025 | | 10,000 | | 8,325 |
CSC Holdings LLC - 144A 10.875% 10/15/2025 | | 184,000 | | 209,589 |
Diamond Sports Group LLC / Diamond Sports Finance Co - 144A 5.375% 08/15/2026 | 35,000 | | 35,569 |
DISH Network Corp 3.375% 08/15/2026 | | 50,000 | | 45,817 |
Entercom Media Corp - 144A 6.500% 05/01/2027 | | 25,000 | | 26,438 |
EP Energy LLC / Everest Acquisition Finance Inc - 144A 9.375% 05/01/2024 | | 115,000 | | 24,150 |
Frontier Communications Corp - 144A 8.000% 04/01/2027 | | 55,000 | | 57,475 |
Frontier Communications Corp - 144A 8.500% 04/01/2026 | | 45,000 | | 43,974 |
Frontier Communications Corp 11.000% 09/15/2025 | | 150,000 | | 87,188 |
Frontier Communications Corp 6.875% 01/15/2025 | | 65,000 | | 35,913 |
Gray Escrow Inc - 144A 7.000% 05/15/2027 | | 51,000 | | 55,781 |
iHeartCommunications Inc 6.375% 05/01/2026 | | 10,752 | | 11,421 |
iHeartCommunications Inc 8.375% 05/01/2027 | | 19,489 | | 20,512 |
+^(3)iHeartCommunications Inc 6.375% 05/01/2026 | | 135,000 | | 0 |
+^(3)iHeartCommunications Inc 8.375% 05/01/2027 | | 45,000 | | 0 |
Intelsat Jackson Holdings SA - 144A 8.000% 02/15/2024 | | 70,000 | | 72,720 |
Intelsat Jackson Holdings SA - 144A 8.500% 10/15/2024 | | 150,000 | | 149,640 |
Intelsat Jackson Holdings SA - 144A 9.750% 07/15/2025 | | 90,000 | | 93,038 |
Intelsat Jackson Holdings SA 5.500% 08/01/2023 | | 115,000 | | 105,944 |
Lamar Media Corp 5.750% 02/01/2026 | | 145,000 | | 152,932 |
Level 3 Communications Inc 5.750% 12/01/2022 | | 125,000 | | 125,937 |
Level 3 Financing Inc 5.375% 01/15/2024 | | 35,000 | | 35,477 |
Level 3 Financing Inc 5.375% 05/01/2025 | | 55,000 | | 56,787 |
Live Nation Entertainment Inc - 144A 4.875% 11/01/2024 | | 100,000 | | 103,000 |
Meredith Corp 6.875% 02/01/2026 | | 65,000 | | 68,900 |
Midcontinent Communications / Midcontinent Finance Corp - 144A 5.375% 08/15/2027 | 30,000 | | 30,750 |
Netflix Inc - 144A 5.375% 11/15/2029 | | 35,000 | | 36,838 |
Netflix Inc 4.875% 04/15/2028 | | 65,000 | | 67,153 |
Netflix Inc 5.875% 11/15/2028 | | 56,000 | | 61,460 |
Nexstar Escrow Inc - 144A 5.625% 07/15/2027 | | 40,000 | | 41,550 |
SBA Communications Corp 4.875% 09/01/2024 | | 70,000 | | 72,003 |
Scripps Escrow Inc - 144A 5.875% 07/15/2027 | | 20,000 | | 20,204 |
SFR Group SA - 144A 7.375% 05/01/2026 | | 200,000 | | 213,125 |
Sirius XM Radio Inc - 144A 4.625% 07/15/2024 | | 50,000 | | 51,465 |
Sirius XM Radio Inc - 144A 5.500% 07/01/2029 | | 5,000 | | 5,231 |
*Sprint Capital Corp 8.750% 03/15/2032 | | 470,000 | | 583,387 |
Sprint Corp 7.125% 06/15/2024 | | 30,000 | | 32,850 |
Sprint Corp 7.625% 02/15/2025 | | 315,000 | | 348,872 |
Sprint Corp 7.625% 03/01/2026 | | 110,000 | | 122,928 |
Sprint Corp 7.875% 09/15/2023 | | 230,000 | | 256,450 |
T Mobile USA Inc 4.500% 02/01/2026 | | 30,000 | | 30,562 |
T Mobile USA Inc 4.750% 02/01/2028 | | 100,000 | | 102,750 |
T Mobile USA Inc 6.375% 03/01/2025 | | 130,000 | | 134,712 |
T Mobile USA Inc 6.500% 01/15/2024 | | 100,000 | | 103,625 |
T Mobile USA Inc 6.500% 01/15/2026 | | 115,000 | | 122,440 |
+^(3)T Mobile USA Inc 4.750% 02/01/2028 | | 30,000 | | 0 |
+^(3)T Mobile USA Inc 6.375% 03/01/2025 | | 50,000 | | 0 |
+^(3)T Mobile USA Inc 6.500% 01/15/2024 | | 100,000 | | 0 |
+^(3)T Mobile USA Inc 6.500% 01/15/2026 | | 115,000 | | 0 |
TEGNA Inc - 144A 4.875% 09/15/2021 | | 15,000 | | 15,019 |
TEGNA Inc 6.375% 10/15/2023 | | 65,000 | | 66,716 |
Telecom Italia Capital SA 6.000% 09/30/2034 | | 100,000 | | 101,500 |
Telecom Italia Capital SA 6.375% 11/15/2033 | | 40,000 | | 42,008 |
United States Cellular Corp 6.700% 12/15/2033 | | 90,000 | | 95,202 |
(4)Windstream Services LLC / Windstream Finance Corp - 144A 9.000% 06/30/2025 | | 236,000 | | 154,580 |
| | | | | 4,850,583 |
Consumer Discretionary (23.5%) | | | | |
Adient US LLC - 144A 7.000% 05/15/2026 | | 45,000 | | 45,675 |
Allison Transmission Inc - 144A 5.875% 06/01/2029 | | 30,000 | | 31,875 |
Alpine Finance Merger Sub LLC - 144A 6.875% 08/01/2025 | | 25,000 | | 25,906 |
Altice Luxembourg SA - 144A 10.500% 05/15/2027 | | 200,000 | | 211,750 |
Altice Luxembourg SA - 144A 7.750% 05/15/2022 | | 45,000 | | 45,956 |
American Axle & Manufacturing Inc 6.250% 03/15/2026 | | 100,000 | | 99,625 |
American Axle & Manufacturing Inc 6.250% 04/01/2025 | | 90,000 | | 90,225 |
American Axle & Manufacturing Inc 6.500% 04/01/2027 | | 45,000 | | 45,000 |
American Axle & Manufacturing Inc 6.625% 10/15/2022 | | 6,000 | | 6,075 |
Aramark Services Inc - 144A 5.000% 02/01/2028 | | 75,000 | | 78,188 |
Boyd Gaming Corp 6.000% 08/15/2026 | | 35,000 | | 36,575 |
Boyd Gaming Corp 6.875% 05/15/2023 | | 30,000 | | 31,013 |
Boyne USA Inc - 144A 7.250% 05/01/2025 | | 65,000 | | 70,850 |
CBS Radio Inc - 144A 7.250% 11/01/2024 | | 40,000 | | 41,900 |
CCO Holdings LLC / CCO Holdings Capital Corp - 144A 5.000% 02/01/2028 | | 45,000 | | 46,184 |
CCO Holdings LLC / CCO Holdings Capital Corp - 144A 5.125% 05/01/2027 | | 315,000 | | 324,844 |
CCO Holdings LLC / CCO Holdings Capital Corp - 144A 5.375% 05/01/2025 | | 15,000 | | 15,487 |
CCO Holdings LLC / CCO Holdings Capital Corp - 144A 5.500% 05/01/2026 | | 140,000 | | 146,300 |
CCO Holdings LLC / CCO Holdings Capital Corp - 144A 5.750% 02/15/2026 | | 245,000 | | 258,098 |
*CCO Holdings LLC / CCO Holdings Capital Corp - 144A 5.875% 04/01/2024 | | 325,000 | | 338,000 |
Cedar Fair LP - 144A 5.250% 07/15/2029 | | 10,000 | | 10,350 |
Cinemark USA Inc 4.875% 06/01/2023 | | 85,000 | | 86,073 |
Clear Channel Worldwide Holdings Inc - 144A 9.250% 02/15/2024 | | 170,000 | | 184,450 |
Clear Channel Worldwide Holdings Inc 6.500% 11/15/2022 | | 95,000 | | 96,919 |
*Clear Channel Worldwide Holdings Inc 6.500% 11/15/2022 | | 481,000 | | 491,101 |
Constellation Merger Sub Inc - 144A 8.500% 09/15/2025 | | 55,000 | | 49,500 |
Cooper- 144A Standard Automotive Inc - 5.625% 11/15/2026 | | 120,000 | | 108,900 |
Dana Financing Luxembourg Sarl - 144A 6.500% 06/01/2026 | | 107,000 | | 111,547 |
*Dana Inc 6.000% 09/15/2023 | | 80,000 | | 81,700 |
Delphi Jersey Holdings PLC - 144A 5.000% 10/01/2025 | | 145,000 | | 127,237 |
DISH DBS Corp 5.000% 03/15/2023 | | 375,000 | | 361,875 |
DISH DBS Corp 5.875% 11/15/2024 | | 365,000 | | 339,457 |
DISH DBS Corp 7.750% 07/01/2026 | | 60,000 | | 58,800 |
Gates Global LLC / Gates Global Co - 144A 6.000% 07/15/2022 | | 108,000 | | 108,265 |
*General Motors Co 4.875% 10/02/2023 | | 135,000 | | 143,730 |
GLP Capital LP / GLP Financing II Inc 5.250% 06/01/2025 | | 50,000 | | 53,705 |
GLP Capital LP / GLP Financing II Inc 5.750% 06/01/2028 | | 50,000 | | 55,994 |
Hanesbrands Inc - 144A 4.875% 05/15/2026 | | 35,000 | | 36,575 |
Hilton Domestic Operating Co Inc 5.125% 05/01/2026 | | 73,000 | | 75,837 |
Hilton Grand Vacations Borrower LLC/Hilton Grand Vacations Borrower Inc 6.125% 12/01/2024 | 75,000 | | 80,438 |
Hilton Worldwide Finance LLC / Hilton Worldwide Finance Corp 4.625% 04/01/2025 | 97,000 | | 99,425 |
Hilton Worldwide Finance LLC / Hilton Worldwide Finance Corp 4.875% 04/01/2027 | 13,000 | | 13,471 |
Hughes Satellite Systems Corp 6.625% 08/01/2026 | | 10,000 | | 10,785 |
International Game Technology PLC - 144A 6.500% 02/15/2025 | | 200,000 | | 219,000 |
Jack Ohio Finance LLC / Jack Ohio Finance 1 Corp - 144A 6.750% 11/15/2021 | | 125,000 | | 127,752 |
^JC Penney Corp Inc 6.375% 10/15/2036 | | 55,000 | | 12,650 |
L Brands Inc 6.750% 07/01/2036 | | 50,000 | | 43,875 |
LTF Merger Sub Inc - 144A 8.500% 06/15/2023 | | 80,000 | | 82,040 |
Marriott Ownership Resorts Inc 6.500% 09/15/2026 | | 80,000 | | 85,824 |
Mattel Inc - 144A 6.750% 12/31/2025 | | 155,000 | | 162,947 |
MGM Growth Properties Operating Partnership LP / MGP Finance Co Issuer Inc 4.500% 01/15/2028 | 10,000 | | 9,987 |
MGM Growth Properties Operating Partnership LP / MGP Finance Co Issuer Inc 4.500% 09/01/2026 | 15,000 | | 15,397 |
MGM Growth Properties Operating Partnership LP / MGP Finance Co Issuer Inc 5.625% 05/01/2024 | 30,000 | | 32,025 |
MGM Resorts International 4.625% 09/01/2026 | | 40,000 | | 41,000 |
MGM Resorts International 5.500% 04/15/2027 | | 115,000 | | 121,933 |
MGM Resorts International 5.750% 06/15/2025 | | 225,000 | | 243,214 |
*MGM Resorts International 6.000% 03/15/2023 | | 245,000 | | 265,825 |
(1)Neiman Marcus Group LTD LLC - 144A 8.000% (6.000%) 04/25/2024 | | 95,000 | | 73,625 |
Neiman Marcus Group LTD LLC -144A 8.000% 10/25/2024 | | 70,000 | | 29,750 |
Neiman Marcus Group LTD LLC -144A 8.750% 10/25/2024 | | 142,995 | | 61,860 |
Nexstar Broadcasting Inc - 144A 5.625% 08/01/2024 | | 80,000 | | 83,100 |
Nexstar Broadcasting Inc - 144A 6.125% 02/15/2022 | | 15,000 | | 15,225 |
Nielsen Finance LLC / Nielsen Finance Co - 144A 5.000% 04/15/2022 | | 110,000 | | 109,829 |
Panther BF Aggregator 2 LP / Panther Finance Co Inc - 144A 6.250% 05/15/2026 | | 30,000 | | 31,041 |
PetSmart Inc - 144A 5.875% 06/01/2025 | | 109,000 | | 107,757 |
PetSmart Inc - 144A 8.875% 06/01/2025 | | 50,000 | | 48,000 |
*Quebecor Media Inc 5.750% 01/15/2023 | | 120,000 | | 127,800 |
*RHP Hotel Properties LP / RHP Finance Corp 5.000% 04/15/2021 | | 160,000 | | 160,160 |
Sabre GLBL Inc - 144A 5.250% 11/15/2023 | | 40,000 | | 41,061 |
Sabre GLBL Inc - 144A 5.375% 04/15/2023 | | 65,000 | | 66,468 |
Service Corp International/US 5.125% 06/01/2029 | | 40,000 | | 42,163 |
Service Corp International/US 5.375% 05/15/2024 | | 15,000 | | 15,395 |
Service Corp International/US 7.500% 04/01/2027 | | 135,000 | | 162,337 |
Sirius XM Radio Inc - 144A 5.375% 04/15/2025 | | 150,000 | | 155,812 |
Sirius XM Radio Inc - 144A 5.375% 07/15/2026 | | 65,000 | | 67,925 |
Six Flags Entertainment Corp - 144A 4.875% 07/31/2024 | | 60,000 | | 61,350 |
Staples Inc - 144A 10.750% 04/15/2027 | | 80,000 | | 82,800 |
Staples Inc - 144A 7.500% 04/15/2026 | | 115,000 | | 117,587 |
Stars Group Holdings BV / Stars Group US Co- 144A Borrower LLC - 7.000% 07/15/2026 | 29,000 | | 30,559 |
Tempur Sealy International Inc 5.500% 06/15/2026 | | 80,000 | | 83,901 |
Tempur Sealy International Inc 5.625% 10/15/2023 | | 55,000 | | 56,518 |
Tenneco Inc 5.000% 07/15/2026 | | 53,000 | | 41,075 |
Tenneco Inc 5.375% 12/15/2024 | | 35,000 | | 29,400 |
VICI Properties 1 LLC / VICI FC Inc 8.000% 10/15/2023 | | 109,306 | | 119,521 |
Videotron Ltd - 144A 5.375% 06/15/2024 | | 45,000 | | 48,150 |
Videotron Ltd / Videotron Ltee - 144A 5.125% 04/15/2027 | | 50,000 | | 52,375 |
Vista Outdoor Inc 5.875% 10/01/2023 | | 135,000 | | 130,950 |
William Carter Co/The - 144A 5.625% 03/15/2027 | | 45,000 | | 47,250 |
Wynn Las Vegas LLC / Wynn Las Vegas Capital Corp - 144A 5.500% 03/01/2025 | | 225,000 | | 235,969 |
Zayo Group LLC / Zayo Capital Inc 6.000% 04/01/2023 | | 65,000 | | 66,788 |
Zayo Group LLC / Zayo Capital Inc 6.375% 05/15/2025 | | 95,000 | | 97,389 |
| | | | | 8,940,019 |
Consumer Staples (2.8%) | | | | |
Albertsons Cos LLC / Safeway Inc / New Albertson's Inc / Albertson's LLC 5.750% 03/15/2025 | 60,000 | | 61,200 |
Central Garden & Pet Co 5.125% 02/01/2028 | | 110,000 | | 110,000 |
Central Garden & Pet Co 6.125% 11/15/2023 | | 50,000 | | 51,875 |
Coty Inc - 144A 6.500% 04/15/2026 | | 55,000 | | 52,938 |
Energizer Holdings Inc - 144A 7.750% 01/15/2027 | | 110,000 | | 119,428 |
^High Ridge Brands Co - 144A 8.875% 03/15/2025 | | 60,000 | | 2,400 |
Kronos Acquisition Holdings Inc - 144A 9.000% 08/15/2023 | | 20,000 | | 17,250 |
POST 5 1/2 03/01/25 - 144A 5.500% 03/01/2025 | | 70,000 | | 72,800 |
Post Holdings Inc - 144A 5.625% 01/15/2028 | | 30,000 | | 30,863 |
Post Holdings Inc - 144A 5.750% 03/01/2027 | | 10,000 | | 10,362 |
Reynolds Group Issuer Inc / Reynolds Group Issuer LLC / Reynolds Group Issuer Lu 5.750% 10/15/2020 | 193,822 | | 194,525 |
Rite Aid Corp - 144A 6.125% 04/01/2023 | | 140,000 | | 118,125 |
Spectrum Brands Inc 5.750% 07/15/2025 | | 120,000 | | 124,314 |
Spectrum Brands Inc 6.625% 11/15/2022 | | 28,000 | | 28,560 |
TreeHouse Foods Inc - 144A 6.000% 02/15/2024 | | 75,000 | | 77,625 |
| | | | | 1,072,265 |
Energy (9.2%) | | | | |
Antero Midstream Partners LP / Antero Midstream Finance Corp - 144A 5.750% 01/15/2028 | 60,000 | | 56,025 |
Antero Midstream Partners LP / Antero Midstream Finance Corp 5.375% 09/15/2024 | 30,000 | | 28,875 |
Antero Resources Corp 5.125% 12/01/2022 | | 85,000 | | 81,175 |
Antero Resources Corp 5.625% 06/01/2023 | | 35,000 | | 33,075 |
Archrock Partners LP / Archrock Partners Finance Corp 6.000% 10/01/2022 | | 65,000 | | 65,894 |
Blue Racer Midstream LLC / Blue Racer Finance Corp - 144A 6.125% 11/15/2022 | | 130,000 | | 130,650 |
Blue Racer Midstream LLC / Blue Racer Finance Corp - 144A 6.625% 07/15/2026 | | 25,000 | | 24,969 |
Boardwalk Pipelines LP 5.950% 06/01/2026 | | 40,000 | | 44,359 |
Calfrac Holdings LP - 144A 8.500% 06/15/2026 | | 40,000 | | 27,000 |
Carrizo Oil & Gas Inc 6.250% 04/15/2023 | | 35,000 | | 34,370 |
Carrizo Oil & Gas Inc 8.250% 07/15/2025 | | 20,000 | | 20,000 |
Cheniere Corpus Christi Holdings LLC 5.125% 06/30/2027 | | 35,000 | | 38,103 |
Chesapeake Energy Corp 5.500% 09/15/2026 | | 15,000 | | 10,699 |
Chesapeake Energy Corp 8.000% 01/15/2025 | | 70,000 | | 59,850 |
Chesapeake Energy Corp 8.000% 06/15/2027 | | 40,000 | | 32,000 |
Communications Sales & Leasing Inc / CSL Capital LLC - 144A 7.125% 12/15/2024 | | 55,000 | | 47,300 |
Covey Park Energy LLC / Covey Park Finance Corp - 144A 7.500% 05/15/2025 | | 60,000 | | 42,000 |
Crestwood Midstream Partners LP / Crestwood Midstream Finance Corp - 144A 5.625% 05/01/2027 | 35,000 | | 34,654 |
Crestwood Midstream Partners LP / Crestwood Midstream Finance Corp 6.250% 04/01/2023 | 85,000 | | 86,492 |
DCP Midstream Operating LP 5.375% 07/15/2025 | | 20,000 | | 21,225 |
Denbury Resources Inc - 144A 9.250% 03/31/2022 | | 103,000 | | 90,383 |
EnLink Midstream LLC 5.375% 06/01/2029 | | 16,000 | | 16,495 |
EnLink Midstream Partners LP 4.400% 04/01/2024 | | 75,000 | | 76,241 |
EnLink Midstream Partners LP 4.850% 07/15/2026 | | 25,000 | | 25,375 |
EP Energy LLC / Everest Acquisition Finance Inc - 144A 7.750% 05/15/2026 | | 185,000 | | 165,020 |
EP Energy LLC / Everest Acquisition Finance Inc - 144A 8.000% 02/15/2025 | | 25,000 | | 4,625 |
EP Energy LLC / Everest Acquisition Finance Inc - 144A 8.000% 11/29/2024 | | 40,000 | | 26,500 |
GCI Inc 6.875% 04/15/2025 | | 15,000 | | 15,769 |
GCI LLC - 144A 6.625% 06/15/2024 | | 35,000 | | 37,275 |
Gulfport Energy Corp 6.000% 10/15/2024 | | 35,000 | | 26,947 |
Gulfport Energy Corp 6.375% 01/15/2026 | | 50,000 | | 37,750 |
Gulfport Energy Corp 6.375% 05/15/2025 | | 45,000 | | 34,425 |
Gulfport Energy Corp 6.625% 05/01/2023 | | 10,000 | | 8,375 |
^Halcon Resources Corp 6.750% 02/15/2025 | | 70,000 | | 11,900 |
Hess Infrastructure Partners LP / Hess Infrastructure Partners Finance Corp - 144A 5.625% 02/15/2026 | 25,000 | | 25,992 |
Jagged Peak Energy LLC 5.875% 05/01/2026 | | 30,000 | | 28,500 |
Laredo Petroleum Inc 5.625% 01/15/2022 | | 39,000 | | 36,075 |
MEG Energy Corp - 144A 6.375% 01/30/2023 | | 30,000 | | 28,650 |
MEG Energy Corp - 144A 6.500% 01/15/2025 | | 85,000 | | 85,000 |
MEG Energy Corp - 144A 7.000% 03/31/2024 | | 105,000 | | 100,252 |
MPLX LP 4.875% 06/01/2025 | | 25,000 | | 27,230 |
Nabors Industries Inc 5.750% 02/01/2025 | | 60,000 | | 52,500 |
Newfield Exploration Co 5.750% 01/30/2022 | | 35,000 | | 37,345 |
NGPL PipeCo LLC - 144A 4.375% 08/15/2022 | | 45,000 | | 46,730 |
NGPL PipeCo LLC - 144A 4.875% 08/15/2027 | | 10,000 | | 10,725 |
Oasis Petroleum Inc - 144A 6.250% 05/01/2026 | | 70,000 | | 66,318 |
Oasis Petroleum Inc 6.875% 01/15/2023 | | 80,000 | | 78,700 |
Oasis Petroleum Inc 6.875% 03/15/2022 | | 18,000 | | 17,916 |
Parsley Energy LLC / Parsley Finance Corp - 144A 5.250% 08/15/2025 | | 55,000 | | 55,412 |
Parsley Energy LLC / Parsley Finance Corp - 144A 5.375% 01/15/2025 | | 20,000 | | 20,251 |
Parsley Energy LLC / Parsley Finance Corp -144A 6.250% 06/01/2024 | | 25,000 | | 25,906 |
Precision Drilling Corp - 144A 7.125% 01/15/2026 | | 35,000 | | 33,250 |
Precision Drilling Corp 6.500% 12/15/2021 | | 3,305 | | 3,256 |
Precision Drilling Corp 7.750% 12/15/2023 | | 45,000 | | 45,225 |
Range Resources Corp 4.875% 05/15/2025 | | 80,000 | | 67,200 |
SM Energy Co 5.625% 06/01/2025 | | 30,000 | | 26,025 |
SM Energy Co 6.125% 11/15/2022 | | 53,000 | | 51,807 |
SM Energy Co 6.625% 01/15/2027 | | 34,000 | | 29,622 |
Southwestern Energy Co 6.700% 01/23/2025 | | 67,000 | | 57,787 |
Southwestern Energy Co 7.500% 04/01/2026 | | 25,000 | | 21,875 |
Southwestern Energy Co 7.750% 10/01/2027 | | 20,000 | | 17,500 |
Summit Midstream Holdings LLC / Summit Midstream Finance Corp 5.750% 04/15/2025 | 30,000 | | 25,800 |
Tallgrass Energy Partners LP / Tallgrass Energy Finance Corp - 144A 5.500% 01/15/2028 | 55,000 | | 54,571 |
Targa Resources Partners LP / Targa Resources Partners Finance Corp - 144A 6.500% 07/15/2027 | 93,000 | | 101,256 |
Targa Resources Partners LP / Targa Resources Partners Finance Corp - 144A 6.875% 01/15/2029 | 38,000 | | 41,903 |
Targa Resources Partners LP / Targa Resources Partners Finance Corp 4.250% 11/15/2023 | 10,000 | | 10,009 |
Targa Resources Partners LP / Targa Resources Partners Finance Corp 5.000% 01/15/2028 | 35,000 | | 35,481 |
Targa Resources Partners LP / Targa Resources Partners Finance Corp 5.875% 04/15/2026 | 40,000 | | 42,238 |
Targa Resources Partners LP / Targa Resources Partners Finance Corp 6.750% 03/15/2024 | 120,000 | | 124,200 |
Tesoro Logistics LP / Tesoro Logistics Finance Corp 5.250% 01/15/2025 | | 25,000 | | 26,437 |
Tesoro Logistics LP / Tesoro Logistics Finance Corp 6.250% 10/15/2022 | | 11,000 | | 11,269 |
Tesoro Logistics LP / Tesoro Logistics Finance Corp 6.375% 05/01/2024 | | 25,000 | | 26,187 |
Transocean Guardian Ltd - 144A 5.875% 01/15/2024 | | 33,820 | | 34,496 |
Transocean Inc - 144A 7.250% 11/01/2025 | | 40,000 | | 37,600 |
Transocean Inc - 144A 7.500% 01/15/2026 | | 40,000 | | 37,900 |
Transocean Pontus Ltd - 144A 6.125% 08/01/2025 | | 15,120 | | 15,574 |
Whiting Petroleum Corp 5.750% 03/15/2021 | | 15,000 | | 15,019 |
Whiting Petroleum Corp 6.250% 04/01/2023 | | 40,000 | | 39,104 |
Whiting Petroleum Corp 6.625% 01/15/2026 | | 40,000 | | 37,700 |
WildHorse Resource Development Corp 6.875% 02/01/2025 | | 90,000 | | 83,250 |
WPX Energy Inc 5.750% 06/01/2026 | | 24,000 | | 24,660 |
WPX Energy Inc 6.000% 01/15/2022 | | 9,000 | | 9,326 |
WPX Energy Inc 8.250% 08/01/2023 | | 65,000 | | 73,125 |
| | | | | 3,499,949 |
Financials (3.2%) | | | | |
Adient Global Holdings Ltd - 144A 4.875% 08/15/2026 | | 240,000 | | 183,600 |
Ally Financial Inc 4.125% 02/13/2022 | | 105,000 | | 108,119 |
*Ally Financial Inc 4.625% 05/19/2022 | | 170,000 | | 176,117 |
(2)Citigroup Inc (ICE LIBOR USD 3 Month + 4.093%), 5.800%, 11/15/2019 | | 35,000 | | 35,263 |
(2)Citigroup Inc (ICE LIBOR USD 3 Month + 4.059%), 5.875%, 03/27/2020 | | 30,000 | | 30,413 |
(2)Citigroup Inc (ICE LIBOR USD 3 Month + 3.905%), 5.950%, 05/15/2025 | | 10,000 | | 10,662 |
Diamond 1 Finance Corp / Diamond 2 Finance Corp - 144A 5.450% 06/15/2023 | | 60,000 | | 64,698 |
Diamond 1 Finance Corp / Diamond 2 Finance Corp - 144A 5.875% 06/15/2021 | | 20,000 | | 20,346 |
Diamond 1 Finance Corp / Diamond 2 Finance Corp - 144A 6.020% 06/15/2026 | | 75,000 | | 82,923 |
Financial & Risk US Holdings Inc - 144A 6.250% 05/15/2026 | | 30,000 | | 32,250 |
inVentiv Group Holdings Inc/inVentiv Health Inc/inVentiv Health Clinical Inc - 144A 7.500% 10/01/2024 | 49,000 | | 51,082 |
MSCI Inc - 144A 5.375% 05/15/2027 | | 35,000 | | 37,155 |
Nielsen Co Luxembourg SARL/The - 144A 5.500% 10/01/2021 | | 20,000 | | 20,019 |
PetSmart Inc - 144A 7.125% 03/15/2023 | | 125,000 | | 116,563 |
Springleaf Finance Corp 6.625% 01/15/2028 | | 24,000 | | 25,980 |
Springleaf Finance Corp 7.125% 03/15/2026 | | 20,000 | | 22,462 |
UPCB Finance IV Ltd - 144A 5.375% 01/15/2025 | | 200,000 | | 205,000 |
WMG Acquisition Corp - 144A 4.875% 11/01/2024 | | 10,000 | | 10,275 |
| | | | | 1,232,927 |
Health Care (9.7%) | | | | |
Avantor Inc - 144A 6.000% 10/01/2024 | | 75,000 | | 80,251 |
Bausch Health Cos Inc - 144A 7.000% 01/15/2028 | | 45,000 | | 46,631 |
BCPE Cycle Merger Sub II Inc - 144A 10.625% 07/15/2027 | | 65,000 | | 64,201 |
CHS/Community Health Systems Inc - 144A 8.625% 01/15/2024 | | 40,000 | | 40,000 |
DaVita Inc 5.000% 05/01/2025 | | 120,000 | | 117,602 |
Enterprise Merger Sub Inc - 144A 8.750% 10/15/2026 | | 135,000 | | 93,488 |
HCA Inc 5.250% 06/15/2026 | | 25,000 | | 27,741 |
*HCA Inc 5.375% 02/01/2025 | | 555,000 | | 600,210 |
HCA Inc 5.375% 09/01/2026 | | 76,000 | | 82,270 |
HCA Inc 5.625% 09/01/2028 | | 46,000 | | 50,724 |
HCA Inc 5.875% 02/01/2029 | | 9,000 | | 10,046 |
HCA Inc 5.875% 02/15/2026 | | 190,000 | | 211,375 |
*HCA Inc 7.500% 02/15/2022 | | 180,000 | | 199,296 |
HealthSouth Corp 5.750% 09/15/2025 | | 30,000 | | 31,200 |
HealthSouth Corp 5.750% 11/01/2024 | | 107,000 | | 108,206 |
Hill- 144A Rom Holdings Inc - 5.000% 02/15/2025 | | 10,000 | | 10,338 |
Hill- 144A Rom Holdings Inc - 5.750% 09/01/2023 | | 80,000 | | 82,500 |
Hologic Inc - 144A 4.375% 10/15/2025 | | 35,000 | | 35,148 |
Kinetic Concepts Inc / KCI USA Inc - 144A 7.875% 02/15/2021 | | 75,000 | | 76,652 |
Mallinckrodt International Finance SA / Mallinckrodt CB LLC - 144A 5.500% 04/15/2025 | 45,000 | | 25,988 |
Mallinckrodt International Finance SA / Mallinckrodt CB LLC - 144A 5.625% 10/15/2023 | 60,000 | | 37,932 |
Par Pharmaceutical Inc - 144A 7.500% 04/01/2027 | | 75,000 | | 68,062 |
Prestige Brands Inc - 144A 6.375% 03/01/2024 | | 55,000 | | 57,115 |
^RTSX 10.000% 04/30/2023 | | 44,162 | | 34,888 |
Tenet Healthcare Corp - 144A 6.250% 02/01/2027 | | 102,000 | | 105,876 |
Tenet Healthcare Corp 4.500% 04/01/2021 | | 75,000 | | 76,500 |
*Tenet Healthcare Corp 6.750% 06/15/2023 | | 280,000 | | 287,350 |
*Tenet Healthcare Corp 8.125% 04/01/2022 | | 75,000 | | 80,156 |
Valeant Pharmaceuticals International Inc - 144A 5.500% 11/01/2025 | | 70,000 | | 72,800 |
Valeant Pharmaceuticals International Inc - 144A 5.875% 05/15/2023 | | 42,000 | | 42,302 |
Valeant Pharmaceuticals International Inc - 144A 6.125% 04/15/2025 | | 410,000 | | 421,787 |
Valeant Pharmaceuticals International Inc - 144A 6.500% 03/15/2022 | | 20,000 | | 20,735 |
Valeant Pharmaceuticals International Inc - 144A 7.000% 03/15/2024 | | 55,000 | | 58,025 |
Valeant Pharmaceuticals International Inc - 144A 8.500% 01/31/2027 | | 89,000 | | 98,020 |
Valeant Pharmaceuticals International Inc - 144A 9.000% 12/15/2025 | | 215,000 | | 240,884 |
| | | | | 3,696,299 |
Industrials (9.4%) | | | | |
ACCO BRANDS CORP - 144A 5.250% 12/15/2024 | | 135,000 | | 138,375 |
Air Medical Group Holdings Inc - 144A 6.375% 05/15/2023 | | 85,000 | | 76,500 |
Allison Transmission Inc - 144A 5.000% 10/01/2024 | | 65,000 | | 66,037 |
American Woodmark Corp - 144A 4.875% 03/15/2026 | | 75,000 | | 74,250 |
Arconic Inc 5.900% 02/01/2027 | | 80,000 | | 88,000 |
Ashtead Capital Inc - 144A 4.125% 08/15/2025 | | 200,000 | | 201,500 |
Avis Budget Car Rental LLC / Avis Budget Finance Inc - 144A 5.250% 03/15/2025 | | 45,000 | | 45,450 |
Avis Budget Car Rental LLC / Avis Budget Finance Inc - 144A 6.375% 04/01/2024 | | 160,000 | | 167,200 |
Bombardier Inc - 144A 7.500% 03/15/2025 | | 90,000 | | 91,519 |
BWX Technologies Inc - 144A 5.375% 07/15/2026 | | 50,000 | | 51,750 |
CFX Escrow Corp - 144A 6.000% 02/15/2024 | | 10,000 | | 10,591 |
CFX Escrow Corp - 144A 6.375% 02/15/2026 | | 10,000 | | 10,703 |
Clean Harbors Inc - 144A 4.875% 07/15/2027 | | 20,000 | | 20,575 |
Energizer Holdings Inc - 144A 5.500% 06/15/2025 | | 75,000 | | 76,148 |
EnPro Industries Inc 5.750% 10/15/2026 | | 41,000 | | 42,333 |
Herc Holdings Inc - 144A 5.500% 07/15/2027 | | 125,000 | | 125,156 |
Hertz Corp/The - 144A 5.500% 10/15/2024 | | 165,000 | | 162,113 |
Hertz Corp/The - 144A 7.125% 08/01/2026 | | 70,000 | | 71,491 |
Hertz Corp/The - 144A 7.625% 06/01/2022 | | 115,000 | | 119,211 |
Hertz Corp/The 6.250% 10/15/2022 | | 25,000 | | 25,252 |
Hexion Inc - 144A 7.875% 07/15/2027 | | 20,000 | | 19,800 |
Hillman Group Inc/The - 144A 6.375% 07/15/2022 | | 95,000 | | 87,191 |
Iron Mountain Inc 6.000% 08/15/2023 | | 75,000 | | 76,454 |
Jeld- 144A Wen Inc - 4.625% 12/15/2025 | | 45,000 | | 44,269 |
Jeld- 144A Wen Inc - 4.875% 12/15/2027 | | 35,000 | | 34,256 |
Kratos Defense & Security Solutions Inc - 144A 6.500% 11/30/2025 | | 5,000 | | 5,344 |
Manitowoc Foodservice Inc 9.500% 02/15/2024 | | 50,000 | | 53,750 |
Masonite International Corp - 144A 5.375% 02/01/2028 | | 50,000 | | 51,290 |
Mueller Water Products Inc - 144A 5.500% 06/15/2026 | | 25,000 | | 26,062 |
NXP BV / NXP Funding LLC - 144A 4.625% 06/01/2023 | | 200,000 | | 211,109 |
PGT Escrow Issuer Inc - 144A 6.750% 08/01/2026 | | 45,000 | | 48,544 |
+^(3) Remington Outdoor Com | | 125,000 | | 0 |
RBS Global Inc / Rexnord LLC - 144A 4.875% 12/15/2025 | | 20,000 | | 20,300 |
Sensata Technologies BV - 144A 4.875% 10/15/2023 | | 180,000 | | 187,146 |
SPX FLOW Inc - 144A 5.625% 08/15/2024 | | 20,000 | | 20,825 |
SPX FLOW Inc - 144A 5.875% 08/15/2026 | | 45,000 | | 47,362 |
Standard Industries Inc/NJ - 144A 4.750% 01/15/2028 | | 90,000 | | 88,958 |
Stevens Holding Co Inc - 144A 6.125% 10/01/2026 | | 25,000 | | 26,500 |
Terex Corp - 144A 5.625% 02/01/2025 | | 100,000 | | 99,750 |
TransDigm Inc - 144A 6.250% 03/15/2026 | | 70,000 | | 73,412 |
TriMas Corp - 144A 4.875% 10/15/2025 | | 60,000 | | 60,750 |
Triumph Group Inc 4.875% 04/01/2021 | | 40,000 | | 39,600 |
Triumph Group Inc 7.750% 08/15/2025 | | 40,000 | | 40,100 |
United Rentals North America Inc 4.625% 10/15/2025 | | 70,000 | | 71,050 |
United Rentals North America Inc 4.875% 01/15/2028 | | 55,000 | | 56,094 |
United Rentals North America Inc 5.500% 05/15/2027 | | 115,000 | | 120,894 |
United Rentals North America Inc 5.500% 07/15/2025 | | 35,000 | | 36,400 |
United Rentals North America Inc 5.875% 09/15/2026 | | 35,000 | | 37,231 |
United Rentals North America Inc 6.500% 12/15/2026 | | 75,000 | | 81,540 |
Wabash National Corp - 144A 5.500% 10/01/2025 | | 40,000 | | 38,900 |
XPO Logistics Inc - 144A 6.125% 09/01/2023 | | 20,000 | | 20,600 |
XPO Logistics Inc - 144A 6.500% 06/15/2022 | | 68,000 | | 69,080 |
| | | | | 3,558,715 |
Information Technology (6.8%) | | | | |
ACI Worldwide Inc - 144A 5.750% 08/15/2026 | | 49,000 | | 50,960 |
Anixter Inc 5.500% 03/01/2023 | | 25,000 | | 26,688 |
Anixter Inc 6.000% 12/01/2025 | | 30,000 | | 32,700 |
Ascend Learning LLC - 144A 6.875% 08/01/2025 | | 42,000 | | 43,523 |
CDK Global Inc - 144A 5.250% 05/15/2029 | | 27,000 | | 28,013 |
CDK Global Inc 5.875% 06/15/2026 | | 15,000 | | 15,956 |
CDW LLC / CDW Finance Corp 5.000% 09/01/2025 | | 91,000 | | 94,640 |
Cogent Communications Finance Inc - 144A 5.625% 04/15/2021 | | 90,000 | | 91,125 |
Cogent Communications Group Inc - 144A 5.375% 03/01/2022 | | 70,000 | | 72,975 |
CommScope Finance LLC - 144A 6.000% 03/01/2026 | | 100,000 | | 101,095 |
CommScope Finance LLC - 144A 8.250% 03/01/2027 | | 55,000 | | 54,175 |
CommScope Technologies Finance LLC - 144A 6.000% 06/15/2025 | | 185,000 | | 168,350 |
Entegris Inc - 144A 4.625% 02/10/2026 | | 85,000 | | 86,203 |
Equinix Inc 5.375% 01/01/2022 | | 20,000 | | 20,440 |
Equinix Inc 5.750% 01/01/2025 | | 30,000 | | 31,013 |
Fair Isaac Corp - 144A 5.250% 05/15/2026 | | 23,000 | | 24,236 |
First Data Corp - 144A 5.375% 08/15/2023 | | 188,000 | | 193,020 |
First Data Corp - 144A 5.750% 01/15/2024 | | 370,000 | | 380,656 |
Gartner Inc - 144A 5.125% 04/01/2025 | | 105,000 | | 108,019 |
*Infor US Inc 6.500% 05/15/2022 | | 325,000 | | 330,688 |
Informatica LLC - 144A 7.125% 07/15/2023 | | 95,000 | | 96,781 |
Magnachip Semiconductor Corp 6.625% 07/15/2021 | | 50,000 | | 49,500 |
MTS Systems Corp - 144A 5.750% 08/15/2027 | | 25,000 | | 25,687 |
Plantronics Inc - 144A 5.500% 05/31/2023 | | 60,000 | | 61,050 |
*Sabine Pass Liquefaction LLC 5.750% 05/15/2024 | | 100,000 | | 110,937 |
Sabine Pass Liquefaction LLC 5.875% 06/30/2026 | | 15,000 | | 17,104 |
Sabine Pass Liquefaction LLC 6.250% 03/15/2022 | | 100,000 | | 108,000 |
Sinclair Television Group Inc - 144A 5.125% 02/15/2027 | | 20,000 | | 20,100 |
Sinclair Television Group Inc - 144A 5.625% 08/01/2024 | | 20,000 | | 20,569 |
Sinclair Television Group Inc 6.125% 10/01/2022 | | 105,000 | | 106,837 |
| | | | | 2,571,040 |
Materials (6.8%) | | | | |
Ardagh Packaging Finance PLC / Ardagh Holdings USA Inc - 144A 6.000% 02/15/2025 | 400,000 | | 413,000 |
Ashland LLC 4.750% 08/15/2022 | | 75,000 | | 77,921 |
Axalta Coating Systems LLC - 144A 4.875% 08/15/2024 | | 150,000 | | 154,500 |
Berry Global Escrow Corp - 144A 4.875% 07/15/2026 | | 85,000 | | 88,400 |
Berry Global Escrow Corp - 144A 5.625% 07/15/2027 | | 30,000 | | 31,538 |
BWAY Holding Co - 144A 5.500% 04/15/2024 | | 140,000 | | 139,783 |
Chemours Co/The 6.625% 05/15/2023 | | 65,000 | | 65,285 |
Chemours Co/The 7.000% 05/15/2025 | | 30,000 | | 29,426 |
Cheniere Corpus Christi Holdings LLC 5.875% 03/31/2025 | | 55,000 | | 60,506 |
*Freeport McMoRan Inc 3.875% 03/15/2023 | | 150,000 | | 150,330 |
GCP Applied Technologies Inc - 144A 5.500% 04/15/2026 | | 85,000 | | 87,125 |
Greif Inc - 144A 6.500% 03/01/2027 | | 65,000 | | 67,762 |
Huntsman International LLC 5.125% 11/15/2022 | | 100,000 | | 105,991 |
*INEOS Group Holdings SA - 144A 5.625% 08/01/2024 | | 200,000 | | 199,500 |
LABL Escrow Issuer LLC - 144A 10.500% 07/15/2027 | | 45,000 | | 45,338 |
LABL Escrow Issuer LLC - 144A 6.750% 07/15/2026 | | 60,000 | | 61,200 |
NOVA Chemicals Corp - 144A 4.875% 06/01/2024 | | 30,000 | | 30,906 |
NOVA Chemicals Corp - 144A 5.250% 06/01/2027 | | 70,000 | | 72,994 |
Novelis Corp - 144A 5.875% 09/30/2026 | | 45,000 | | 46,631 |
Novelis Corp - 144A 6.250% 08/15/2024 | | 25,000 | | 26,188 |
Rain CII Carbon LLC / CII Carbon Corp - 144A 7.250% 04/01/2025 | | 75,000 | | 71,062 |
+^(3)(4)Reichhold Industries Inc - 144A .000% 05/08/2040 | | 97,425 | | 0 |
Scotts Miracle Gro Co/The 5.250% 12/15/2026 | | 135,000 | | 138,375 |
Scotts Miracle Gro Co/The 6.000% 10/15/2023 | | 75,000 | | 77,625 |
Trinseo Materials Operating SCA / Trinseo Materials Finance Inc - 144A 5.375% 09/01/2025 | 85,000 | | 80,431 |
Trivium Packaging Finance BV - 144A 5.500% 08/15/2026 | | 200,000 | | 206,250 |
Venator Finance S.a r.l. / Venator Materials Corp - 144A 5.750% 07/15/2025 | | 50,000 | | 44,125 |
WR Grace & Co- 144A Conn - 5.625% 10/01/2024 | | 10,000 | | 10,800 |
| | | | | 2,582,992 |
Real Estate (1.6%) | | | | |
Communications Sales & Leasing Inc / CSL Capital LLC - 144A 6.000% 04/15/2023 | | 30,000 | | 28,613 |
Communications Sales & Leasing Inc / CSL Capital LLC 8.250% 10/15/2023 | | 40,000 | | 36,100 |
Corrections Corp of America 4.625% 05/01/2023 | | 88,000 | | 83,666 |
Corrections Corp of America 5.000% 10/15/2022 | | 25,000 | | 24,500 |
Equinix Inc 5.875% 01/15/2026 | | 100,000 | | 106,220 |
ESH Hospitality Inc - 144A 5.250% 05/01/2025 | | 95,000 | | 97,731 |
GEO Group Inc/The 5.125% 04/01/2023 | | 20,000 | | 17,800 |
GEO Group Inc/The 5.875% 01/15/2022 | | 75,000 | | 71,438 |
GEO Group Inc/The 5.875% 10/15/2024 | | 65,000 | | 54,275 |
Iron Mountain Inc 5.750% 08/15/2024 | | 5,000 | | 5,036 |
MGM Growth Properties Operating Partnership LP / MGP Finance Co- 144A Issuer Inc - 5.750% 02/01/2027 | 27,000 | | 29,133 |
Outfront Media Capital LLC / Outfront Media Capital Corp - 144A 5.000% 08/15/2027 | 40,000 | | 40,600 |
| | | | | 595,112 |
Utilities (0.6%) | | | | |
AES Corp/VA 5.500% 04/15/2025 | | 40,000 | | 41,500 |
AES Corp/VA 6.000% 05/15/2026 | | 10,000 | | 10,653 |
AmeriGas Partners LP / AmeriGas Finance Corp 5.500% 05/20/2025 | | 40,000 | | 42,000 |
AmeriGas Partners LP / AmeriGas Finance Corp 5.875% 08/20/2026 | | 70,000 | | 74,200 |
Calpine Corp - 144A 5.250% 06/01/2026 | | 20,000 | | 20,200 |
NRG Energy Inc 6.625% 01/15/2027 | | 30,000 | | 31,986 |
NRG Energy Inc 7.250% 05/15/2026 | | 20,000 | | 21,593 |
| | | | | 242,132 |
| | | | |
TOTAL CORPORATE BONDS (COST: $32,584,888) | | | $ | 32,842,033 |
| | | | |
COMMON STOCKS (1.8%) | | | | |
Communication Services (0.0%) | | Shares | | |
iHeartMedia Inc | | 223 | $ | 3,336 |
| | | | |
Consumer Discretionary (1.3%) | | | | |
(3)Caesars Entertainment Corp | | 5,031 | $ | 59,567 |
+^(3)Claire's Stores | | 58 | | 38,425 |
Clear Channel Outdoor Holdings Inc | | 4,640 | | 14,059 |
VICI Properties, Inc | | 17,637 | | 376,373 |
| | | | | 488,424 |
Energy (0.0%) | | | �� | |
(3)Halcon Resources Corp | | 6,520 | $ | 737 |
| | | | |
Health Care (0.0%) | | | | |
+^(3)21st Century Oncology Inc | | 165 | $ | 6,470 |
| | | | |
Industrials (0.0%) | | | | |
+^(3)Remington Outdoor Co | | 1,284 | $ | 1,926 |
| | | | |
Material (0.5%) | | | | |
+^(3)Reichhold Cayman | | 162 | $ | 125,226 |
+^(3)UCI International Holdings Inc | | 2,633 | | 60,559 |
| | | | | 185,785 |
| | | | |
TOTAL COMMON STOCK (COST: $869,695) | | | $ | 686,678 |
| | | | |
CONVERTIBLE PREFERRED STOCKS (0.4%) | | | | |
| | | | |
Consumer Discretionary (0.3%) | | Shares | | |
+^Claire's Stores Inc 14.000% | | 35 | $ | 54,250 |
MYT Holding Co -144A | | 43,473 | | 41,082 |
| | | | | 95,332 |
Health Care (0.1%) | | | | |
+^(3)RTSX 15.000% | | 207 | $ | 47,022 |
| | | | |
TOTAL CONVERTIBLE PREFERRED STOCK (COST: $93,360) | | | $ | 142,354 |
| | | | |
WARRANTS (0.1%) | | | | |
| | | | |
Industrials (0.1%) | | Shares | | |
^iHeartMedia Inc | | 1,679 | $ | 26,025 |
+^(3)Jack Cooper Enterprises Inc | | 175 | | 0 |
+^(3)Jack Cooper Enterprises Inc | | 99 | | 0 |
+^(3)Remington Outdoor Co | | 1,295 | | 0 |
| | | | $ | 26,025 |
| | | | |
TOTAL WARRANTS (COST:$39,600) | | | $ | 26,025 |
| | | | |
TOTAL INVESTMENTS IN SECURITIES (COST: $33,587,543) (88.6%) | | | $ | 33,697,090 |
OTHER ASSETS LESS LIABILITIES (11.4%) | | | $ | 4,358,957 |
| | | | |
NET ASSETS (100.0%) | | | $ | 38,056,047 |
|
(1) Interest or dividend is paid-in-kind, when applicable. Rate paid in-kind is shown in parenthesis. |
(2) Security is perpetual and thus, does not have a predetermined maturity date. The coupon rate for this security is fixed for a period of time and may be structured to adjust thereafter. The date shown, if applicable, reflects the next call date. The coupon rate shown is the rate in effect as of July 31, 2019. |
(3) Non-income producing security. |
(4) Issue is in default. |
+ The level 3 assets were a result of unavailable quoted prices from and active market or the unavailability of other significant observable inputs. |
*Indicates all or a portion of bonds are segregated by the custodian to cover when-issued or delayed-delivery purchases when they occur. As of July 31, 2019 there were no such purchases. |
^ Deemed by management to be illiquid security. See note 2. Total market value of illiquid securities amount to $421,741, representing 1.1% of net assets as of July 31, 2019. |
144A - Security exempt from registration under Rule 144A of the Securities Act of 1933. These securities are deemed to be liquid under procedures approved by the Fund’s Board of Trustees and may normally be sold to qualified institutional buyers in transactions exempt from registration. Total market value of Rule 144A Securities amounts to $17,219,524, representing 45.2% of net assets as of July 31, 2019. |
PLC - Public Limited Company |
LIBOR – London InterBank Offered Rate. ICE LIBOR USD 3 Month as of July 31, 2019, was 2.27% |
|
|
The accompanying notes are an integral part of these financial statements. |
WILLISTON BASIN/MID-NORTH AMERICA STOCK FUND
PORTFOLIO MARKET SECTORS July 31, 2019
Energy | 90.2% |
Utilities | 4.3% |
Cash Equivalents and Other | 3.0% |
Materials | 2.5% |
| | 100.0% |
| | | |
Market sectors are breakdowns of the Fund’s portfolio holdings into specific investment classes.
These percentages are based on net assets.
SCHEDULE OF INVESTMENTS July 31, 2019
| | | | | Fair |
| | | Shares | | Value |
COMMON STOCKS (97.0%) | | | | |
| | | | |
Energy (90.2%) | | | | |
*Apergy Corp | | 160,000 | $ | 5,204,800 |
Archrock Inc | | 900,000 | | 9,882,000 |
BP PLC ADR | | 40,000 | | 1,589,600 |
*Cactus Inc | | 185,000 | | 5,433,450 |
*Cheniere Energy Inc | | 135,000 | | 8,795,250 |
Chevron Corp | | 25,000 | | 3,077,750 |
Cimarex Energy Co | | 50,000 | | 2,533,500 |
Concho Resources Inc | | 94,000 | | 9,181,920 |
ConocoPhillips | | 135,000 | | 7,975,800 |
Diamondback Energy Inc | | 90,000 | | 9,308,700 |
EOG Resources Inc | | 130,000 | | 11,160,500 |
Enbridge Inc | | 90,000 | | 3,005,100 |
Exxon Mobil Corp | | 80,000 | | 5,948,800 |
*Forum Energy Technologies Inc | | 300,000 | | 786,000 |
Halliburton Co | | 335,000 | | 7,705,000 |
Helmerich & Payne Inc | | 55,000 | | 2,732,400 |
*Independence Contract Drilling Inc | | 520,000 | | 686,400 |
Kinder Morgan Inc/DE | | 430,000 | | 8,866,600 |
Marathon Petroleum Corp | | 170,000 | | 9,586,300 |
*NCS Multistage Holdings Inc | | 65,000 | | 208,650 |
National Oilwell Varco Inc | | 120,000 | | 2,858,400 |
ONEOK Inc | | 30,000 | | 2,102,400 |
*Parsley Energy Inc | | 160,000 | | 2,654,400 |
Phillips 66 | | 85,000 | | 8,717,600 |
Pioneer Natural Resources Co | | 25,000 | | 3,451,000 |
*ProPetro Holding Corp | | 120,000 | | 2,175,600 |
Royal Dutch Shell PLC ADR | | 55,000 | | 3,490,850 |
*Select Energy Services Inc | | 70,000 | | 711,900 |
SemGroup Corp | | 250,000 | | 3,167,500 |
Targa Resources Corp | | 225,000 | | 8,754,750 |
TC Energy Corp | | 50,000 | | 2,448,000 |
Valero Energy Corp | | 85,000 | | 7,246,250 |
Williams Cos Inc/The | | 180,000 | | 4,435,200 |
TechnipFMC | | 310,000 | | 8,537,400 |
Core Laboratories NV | | 60,000 | | 3,010,200 |
| | | | | 177,429,970 |
Materials (2.5%) | | | | |
Olin Corp | | 70,000 | | 1,404,900 |
Westlake Chemical Corp | | 40,000 | | 2,702,800 |
LyondellBasell Industries NV | | 10,000 | | 836,900 |
| | | | | 4,944,600 |
Utilities (4.3%) | | | | |
CenterPoint Energy Inc | | 145,000 | | 4,206,450 |
MDU Resources Group Inc | | 160,000 | | 4,278,400 |
| | | | | 8,484,850 |
| | | | |
TOTAL COMMON STOCKS (COST: $213,403,573) | | | $ | 190,859,420 |
| | | | |
OTHER ASSETS AND LIABILITES (3.0%) | | | $ | 5,939,463 |
| | | | |
NET ASSETS (100.0%) | | | $ | 196,798,883 |
|
* Non-income producing |
PLC - Public Limited Company |
|
|
The accompanying notes are an integral part of these financial statements. |
Statements of Assets and Liabilities | July 31, 2019
| | Dividend | | Energized | | Growth |
| | Harvest | | Dividend | | & Income |
| | Fund | | Fund | | Fund |
ASSETS | | | | | | | | |
Investments in securities, at cost | $ | 129,134,463 | | $ | 5,864,719 | | $ | 26,972,697 |
| | | | | | | | |
Investments in securities, at value | $ | 134,732,194 | | $ | 5,582,133 | | $ | 37,817,049 |
Cash and cash equivalents | | 924,935 | | | 178,584 | | | 1,426,097 |
Receivable for Fund shares sold | | 185,511 | | | 1,188 | | | 9,394 |
Accrued dividends receivable | | 340,160 | | | 3,230 | | | 45,418 |
Accrued interest receivable | | 595 | | | 205 | | | 1,576 |
Prepaid expenses | | 39,646 | | | 9,853 | | | 12,449 |
Total assets | $ | 136,223,041 | | $ | 5,775,193 | | $ | 39,311,983 |
| | | | | | | | |
LIABILITIES | | | | | | | | |
Payable for Fund shares redeemed | $ | 141,091 | | $ | 40,123 | | $ | 37,788 |
Trustees’ fees payable | | 8,439 | | | 357 | | | 2,371 |
Payable to affiliates | | 9,076 | | | 477 | | | 3,652 |
Accrued expenses | | 31,553 | | | 4,841 | | | 12,287 |
Total liabilities | $ | 190,159 | | $ | 45,798 | | $ | 56,098 |
| | | | | | | | |
NET ASSETS | $ | 136,032,882 | | $ | 5,729,395 | | $ | 39,255,885 |
| | | | | | | | |
NET ASSETS ARE REPRESENTED BY: | | | | | | | | |
Capital stock outstanding, $.001 par value, unlimited shares authorized | $ | 125,803,356 | | $ | 6,336,660 | | $ | 26,024,685 |
Distributable earnings (accumulated losses) | | 10,229,526 | | | (607,265) | | | 13,231,200 |
| | | | | | | | |
NET ASSETS | $ | 136,032,882 | | $ | 5,729,395 | | $ | 39,255,885 |
| | | | | | | | |
Net Assets - Class A | $ | 91,602,083 | | $ | 3,121,280 | | $ | 37,463,990 |
Net Assets - Class C | $ | 13,637,199 | | $ | 310,643 | | $ | 248,123 |
Net Assets - Class I | $ | 30,793,600 | | $ | 2,297,472 | | $ | 1,543,772 |
Shares outstanding - Class A | | 6,517,327 | | | 294,583 | | | 629,080 |
Shares outstanding - Class C | | 977,182 | | | 29,408 | | | 4,209 |
Shares outstanding - Class I | | 2,189,121 | | | 216,710 | | | 25,898 |
Net asset value per share - Class A* | | $14.06 | | | $10.60 | | | $59.55 |
Maximum sales charge - Class A | | 5.00% | | | 5.00% | | | 5.00% |
Public offering price per share - Class A | | $14.80 | | | $11.16 | | | $62.68 |
Net asset value per share - Class C* | | $13.96 | | | $10.56 | | | $58.95 |
Net asset value per share - Class I | | $14.07 | | | $10.60 | | | $59.61 |
|
* Redemption price per share is equal to net asset value less any applicable contingent deferred sales charge. |
| |
The accompanying notes are an integral part of these financial statements. |
Statements of Assets and Liabilities | July 31, 2019
| | High | | WB/MNA |
| | Income | | Stock |
| | Fund | | Fund |
ASSETS | | | | | |
Investments in securities, at cost | $ | 33,587,543 | | $ | 213,403,573 |
| | | | | |
Investments in securities, at value | $ | 33,697,090 | | $ | 190,859,420 |
Cash and cash equivalents | | 4,311,801 | | | 6,017,766 |
Security sales receivable | | 2,760 | | | 0 |
Receivable for Fund shares sold | | 78,570 | | | 7,012 |
Accrued dividends receivable | | 0 | | | 384,900 |
Accrued interest receivable | | 560,770 | | | 10,543 |
Prepaid expenses | | 17,916 | | | 36,416 |
Total assets | $ | 38,668,907 | | $ | 197,316,057 |
| | | | | |
LIABILITIES | | | | | |
Payable for securities purchased | $ | 559,098 | | $ | 0 |
Payable for Fund shares redeemed | | 14,543 | | | 373,813 |
Dividends payable | | 25,835 | | | 0 |
Trustees’ fees payable | | 2,139 | | | 14,118 |
Payable to affiliates | | 1,286 | | | 50,815 |
Accrued expenses | | 9,959 | | | 78,428 |
Total liabilities | $ | 612,860 | | $ | 517,174 |
| | | | | |
NET ASSETS | $ | 38,056,047 | | $ | 196,798,883 |
| | | | | |
NET ASSETS ARE REPRESENTED BY: | | | | | |
Capital stock outstanding, $.001 par value, unlimited shares authorized | $ | 38,841,199 | | $ | 380,324,894 |
Distributable earnings (accumulated losses) | | (785,152) | | | (183,526,011) |
| | | | | |
NET ASSETS | $ | 38,056,047 | | $ | 196,798,883 |
| | | | | |
Net Assets - Class A | $ | 24,704,460 | | $ | 158,438,492 |
Net Assets - Class C | $ | 4,328,958 | | $ | 17,462,762 |
Net Assets - Class I | $ | 9,022,629 | | $ | 20,897,629 |
Shares outstanding - Class A | | 3,180,898 | | | 37,045,405 |
Shares outstanding - Class C | | 556,190 | | | 4,130,515 |
Shares outstanding - Class I | | 1,162,788 | | | 4,900,075 |
Net asset value per share - Class A* | | $7.77 | | | $4.28 |
Maximum sales charge - Class A | | 4.25% | | | 5.00% |
Public offering price per share - Class A | | $8.11 | | | $4.51 |
Net asset value per share - Class C* | | $7.78 | | | $4.23 |
Net asset value per share - Class I | | $7.76 | | | $4.26 |
|
* Redemption price per share is equal to net asset value less any applicable contingent deferred sales charge. |
|
The accompanying notes are an integral part of these financial statements. |
Statements of Operations | For the year ended July 31, 2019
| | Dividend | | Energized | | Growth |
| | Harvest | | Dividend | | & Income |
| | Fund | | Fund | | Fund |
INVESTMENT INCOME | | | | | | | | |
Dividends (net of foreign withholding taxes of $46,093, $16,041, and $0, respectively) | $ | 5,313,332 | | $ | 319,026 | | $ | 836,270 |
Interest | | 14,806 | | | 1,555 | | | 23,916 |
Total investment income | $ | 5,328,138 | | $ | 320,581 | | $ | 860,186 |
| | | | | | | | |
EXPENSES | | | | | | | | |
Investment advisory fees | $ | 969,193 | | $ | 47,111 | | $ | 363,823 |
Distribution (12b-1) fees - Class A | | 225,911 | | | 7,660 | | | 87,260 |
Distribution (12b-1) fees - Class C | | 134,446 | | | 3,258 | | | 0 |
Transfer agent fees | | 244,607 | | | 23,307 | | | 77,489 |
Administrative service fees | | 228,915 | | | 56,793 | | | 98,934 |
Professional fees | | 23,966 | | | 7,820 | | | 14,001 |
Reports to shareholders | | 12,921 | | | 1,280 | | | 6,360 |
License, fees, and registrations | | 47,502 | | | 13,423 | | | 17,918 |
Audit fees | | 21,612 | | | 1,024 | | | 6,080 |
Trustees’ fees | | 13,708 | | | 658 | | | 3,858 |
Transfer agent out-of-pockets | | 30,725 | | | 1,527 | | | 14,549 |
Custodian fees | | 16,672 | | | 1,853 | | | 4,090 |
Legal fees | | 15,766 | | | 717 | | | 4,429 |
Insurance expense | | 2,743 | | | 65 | | | 766 |
Total expenses | $ | 1,988,687 | | $ | 166,496 | | $ | 699,557 |
Less expenses waived or reimbursed (See Note 7) | | (723,392) | | | (129,851) | | | (246,825) |
Total net expenses | $ | 1,265,295 | | $ | 36,645 | | $ | 452,732 |
| | | | | | | | |
NET INVESTMENT INCOME (LOSS) | $ | 4,062,843 | | $ | 283,936 | | $ | 407,454 |
| | | | | | | | |
REALIZED AND UNREALIZED GAIN (LOSS) ON INVESTMENTS | | | | | | | | |
Net realized gain (loss) from investment transactions | $ | 7,078,224 | | $ | (192,636) | | $ | 2,526,203 |
Net change in unrealized appreciation (depreciation) of investments | | (221,884) | | | (784,435) | | | 1,451,218 |
Net realized and unrealized gain (loss) on investments | $ | 6,856,340 | | $ | (977,071) | | $ | 3,977,421 |
| | | | | | | | |
NET INCREASE (DECREASE) IN NET ASSETS RESULTING FROM OPERATIONS | $ | 10,919,183 | | $ | (693,135) | | $ | 4,384,875 |
|
The accompanying notes are an integral part of these financial statements. |
Statements of Operations | For the year ended July 31, 2019
| | High | | WB/MNA |
| | Income | | Stock |
| | Fund | | Fund |
INVESTMENT INCOME | | | | | |
Dividends (net of foreign withholding taxes of $0 and $105,980, respectively) | $ | 22,059 | | $ | 5,549,581 |
Interest | | 1,932,197 | | | 240,171 |
Total investment income | $ | 1,954,256 | | $ | 5,789,752 |
| | | | | |
EXPENSES | | | | | |
Investment advisory fees | $ | 277,160 | | $ | 1,266,027 |
Distribution (12b-1) fees - Class A | | 59,453 | | | 1,011,345 |
Distribution (12b-1) fees - Class C | | 42,445 | | | 225,430 |
Transfer agent fees | | 51,129 | | | 451,762 |
Administrative service fees | | 93,648 | | | 397,150 |
Professional fees | | 14,363 | | | 73,265 |
Reports to shareholders | | 2,397 | | | 62,546 |
License, fees, and registrations | | 20,155 | | | 58,168 |
Audit fees | | 5,461 | | | 41,022 |
Trustees’ fees | | 3,461 | | | 26,470 |
Transfer agent out-of-pockets | | 5,602 | | | 151,023 |
Custodian fees | | 9,475 | | | 32,857 |
Legal fees | | 3,984 | | | 28,611 |
Insurance expense | | 695 | | | 10,986 |
Total expenses | $ | 589,428 | | $ | 3,836,662 |
Less expenses waived or reimbursed (See Note 7) | | (278,712) | | | (69,003) |
Total net expenses | $ | 310,716 | | $ | 3,767,659 |
| | | | | |
NET INVESTMENT INCOME (LOSS) | $ | 1,643,540 | | $ | 2,022,093 |
| | | | | |
REALIZED AND UNREALIZED GAIN (LOSS) ON INVESTMENTS | | | | | |
Net realized gain (loss) from investment transactions | $ | (23,445) | | $ | (33,124,781) |
Net change in unrealized appreciation (depreciation) of investments | | 460,317 | | | (46,710,280) |
Net realized and unrealized gain (loss) on investments | $ | 436,872 | | $ | (79,835,061) |
| | | | | |
NET INCREASE (DECREASE) IN NET ASSETS RESULTING FROM OPERATIONS | $ | 2,080,412 | | $ | (77,812,968) |
|
The accompanying notes are an integral part of these financial statements. |
Statements of Changes in Net Assets* | For the year ended July 31, 2019
| | Dividend | | Energized | | Growth |
| | Harvest | | Dividend | | & Income |
| | Fund | | Fund | | Fund |
INCREASE (DECREASE) IN NET ASSETS FROM OPERATIONS | | | | | | | | |
Net investment income (loss) | $ | 4,062,843 | | $ | 283,936 | | $ | 407,454 |
Net realized gain (loss) from investment transactions | | 7,078,224 | | | (192,636) | | | 2,526,203 |
Net change in unrealized appreciation (depreciation) of investments | | (221,884) | | | (784,435) | | | 1,451,218 |
Net increase (decrease) in net assets resulting from operations | $ | 10,919,183 | | $ | (693,135) | | $ | 4,384,875 |
| | | | | | | | |
DISTRIBUTIONS TO SHAREHOLDERS | | | | | | | | |
Distributions - Class A | $ | (8,035,053) | | $ | (277,465) | | $ | (1,974,252) |
Distributions - Class C | | (1,104,589) | | | (28,413) | | | (13,303) |
Distributions - Class I | | (2,354,447) | | | (258,089) | | | (74,168) |
Return of capital - Class A | | 0 | | | (21,183) | | | 0 |
Return of capital - Class C | | 0 | | | (2,388) | | | 0 |
Return of capital - Class I | | 0 | | | (17,914) | | | 0 |
Total distributions | $ | (11,494,089) | | $ | (605,452) | | $ | (2,061,723) |
| | | | | | | | |
CAPITAL SHARE TRANSACTIONS | | | | | | | | |
Proceeds from sale of shares - Class A | $ | 15,545,073 | | $ | 1,323,406 | | $ | 2,802,407 |
Proceeds from sale of shares - Class C | | 2,237,437 | | | 93,781 | | | 131,951 |
Proceeds from sale of shares - Class I | | 19,223,866 | | | 1,479,319 | | | 1,098,199 |
Proceeds from reinvested dividends - Class A | | 7,564,375 | | | 272,907 | | | 1,890,178 |
Proceeds from reinvested dividends - Class C | | 1,034,497 | | | 30,801 | | | 13,167 |
Proceeds from reinvested dividends - Class I | | 1,764,417 | | | 258,022 | | | 48,421 |
Cost of shares redeemed - Class A | | (26,454,352) | | | (1,187,454) | | | (4,367,719) |
Cost of shares redeemed - Class C | | (3,548,537) | | | (128,806) | | | (109,598) |
Cost of shares redeemed - Class I | | (11,677,405) | | | (2,430,693) | | | (457,983) |
Net increase (decrease) in net assets resulting from capital share transactions | $ | 5,689,371 | | $ | (288,717) | | $ | 1,049,023 |
| | | | | | | | |
TOTAL INCREASE (DECREASE) IN NET ASSETS | $ | 5,114,465 | | $ | (1,587,304) | | $ | 3,372,175 |
NET ASSETS, BEGINNING OF PERIOD | | 130,918,417 | | | 7,316,699 | | | 35,883,710 |
NET ASSETS, END OF PERIOD | $ | 136,032,882 | | $ | 5,729,395 | | $ | 39,255,885 |
| | | | | | | | |
* Distributions to shareholders have been reclassified and Accumulated undistributed net investment income has been removed to conform with the amended GAAP presentation under Regulation S-X (See Note 10 in the Notes to Financial Statements). |
|
The accompanying notes are an integral part of these financial statements. |
Statements of Changes in Net Assets* | For the year ended July 31, 2019
| | High | | WB/MNA |
| | Income | | Stock |
| | Fund | | Fund |
INCREASE (DECREASE) IN NET ASSETS FROM OPERATIONS | | | | | |
Net investment income (loss) | $ | 1,643,540 | | $ | 2,022,093 |
Net realized gain (loss) from investment transactions | | (23,445) | | | (33,124,781) |
Net change in unrealized appreciation (depreciation) of investments | | 460,317 | | | (46,710,280) |
Net increase (decrease) in net assets resulting from operations | $ | 2,080,412 | | $ | (77,812,968) |
| | | | | |
DISTRIBUTIONS TO SHAREHOLDERS | | | | | |
Distributions - Class A | $ | (1,214,775) | | $ | (998,223) |
Distributions - Class C | | (184,685) | | | 0 |
Distributions - Class I | | (244,091) | | | (343,060) |
Total distributions | $ | (1,643,551) | | $ | (1,341,283) |
| | | | | |
CAPITAL SHARE TRANSACTIONS | | | | | |
Proceeds from sale of shares - Class A | $ | 4,456,809 | | $ | 6,277,586 |
Proceeds from sale of shares - Class C | | 604,418 | | | 681,858 |
Proceeds from sale of shares - Class I | | 8,262,991 | | | 8,178,124 |
Proceeds from reinvested dividends - Class A | | 1,001,031 | | | 950,217 |
Proceeds from reinvested dividends - Class C | | 152,584 | | | 0 |
Proceeds from reinvested dividends - Class I | | 165,637 | | | 298,412 |
Cost of shares redeemed - Class A | | (5,160,756) | | | (68,972,345) |
Cost of shares redeemed - Class C | | (1,287,186) | | | (8,154,217) |
Cost of shares redeemed - Class I | | (2,197,115) | | | (22,755,480) |
Net increase (decrease) in net assets resulting from capital share transactions | $ | 5,998,413 | | $ | (83,495,845) |
| | | | | |
TOTAL INCREASE (DECREASE) IN NET ASSETS | $ | 6,435,274 | | $ | (162,650,096) |
NET ASSETS, BEGINNING OF PERIOD | | 31,620,773 | | | 359,448,979 |
NET ASSETS, END OF PERIOD | $ | 38,056,047 | | $ | 196,798,883 |
| | | | | |
* Distributions to shareholders have been reclassified and Accumulated undistributed net investment income has been removed to conform with the amended GAAP presentation under Regulation S-X (See Note 10 in the Notes to Financial Statements). |
|
The accompanying notes are an integral part of these financial statements. |
Statements of Changes in Net Assets | For the seven month period ended July 31, 2018
| | Dividend | | Energized | | Growth |
| | Harvest | | Dividend | | & Income |
| | Fund | | Fund | | Fund |
INCREASE (DECREASE) IN NET ASSETS FROM OPERATIONS | | | | | | | | |
Net investment income (loss) | $ | 2,294,053 | | $ | 143,481 | | $ | 173,837 |
Net realized gain (loss) from investment transactions | | 4,841,503 | | | 143,364 | | | 1,341,077 |
Net change in unrealized appreciation (depreciation) of investments | | (9,825,527) | | | 74,406 | | | 448,482 |
Net increase (decrease) in net assets resulting from operations | $ | (2,689,971) | | $ | 361,251 | | $ | 1,963,396 |
| | | | | | | | |
DISTRIBUTIONS TO SHAREHOLDERS FROM | | | | | | | | |
Net investment income - Class A | $ | (1,597,686) | | $ | (59,346) | | $ | 0 |
Net investment income - Class C | | (186,832) | | | (6,034) | | | 0 |
Net investment income - Class I | | (361,948) | | | (73,051) | | | 0 |
Total distributions | $ | (2,146,466) | | $ | (138,431) | | $ | 0 |
| | | | | | | | |
CAPITAL SHARE TRANSACTIONS | | | | | | | | |
Proceeds from sale of shares - Class A | $ | 8,645,601 | | $ | 1,292,753 | | $ | 1,373,154 |
Proceeds from sale of shares - Class C | | 1,493,058 | | | 74,667 | | | 18,630 |
Proceeds from sale of shares - Class I | | 8,677,481 | | | 695,596 | | | 204,619 |
Proceeds from reinvested dividends - Class A | | 1,489,511 | | | 53,840 | | | 0 |
Proceeds from reinvested dividends - Class C | | 165,772 | | | 6,034 | | | 0 |
Proceeds from reinvested dividends - Class I | | 238,028 | | | 70,728 | | | 0 |
Cost of shares redeemed - Class A | | (22,864,105) | | | (471,777) | | | (2,940,040) |
Cost of shares redeemed - Class C | | (4,212,201) | | | (6,530) | | | (60,555) |
Cost of shares redeemed - Class I | | (7,951,909) | | | (172,011) | | | (191,248) |
Net increase (decrease) in net assets resulting from capital share transactions | $ | (14,318,764) | | $ | 1,543,300 | | $ | (1,595,440) |
| | | | | | | | |
TOTAL INCREASE (DECREASE) IN NET ASSETS | $ | (19,155,201) | | $ | 1,766,120 | | $ | 367,956 |
NET ASSETS, BEGINNING OF PERIOD | | 150,073,618 | | | 5,550,579 | | | 35,515,754 |
NET ASSETS, END OF PERIOD | $ | 130,918,417 | | $ | 7,316,699 | | $ | 35,883,710 |
| | | | | | | | |
Accumulated undistributed net investment income | $ | 147,587 | | $ | 5,050 | | $ | 173,836 |
|
The accompanying notes are an integral part of these financial statements. |
Statements of Changes in Net Assets | For the seven month period ended July 31, 2018
| | High | | WB/MNA |
| | Income | | Stock |
| | Fund | | Fund |
INCREASE (DECREASE) IN NET ASSETS FROM OPERATIONS | | | | | |
Net investment income (loss) | $ | 923,830 | | $ | 458,756 |
Net realized gain (loss) from investment transactions | | 99,791 | | | 34,919,386 |
Net change in unrealized appreciation (depreciation) of investments | | (685,500) | | | (30,732,891) |
Net increase (decrease) in net assets resulting from operations | $ | 338,121 | | $ | 4,645,251 |
| | | | | |
DISTRIBUTIONS TO SHAREHOLDERS FROM | | | | | |
Net investment income - Class A | $ | (714,035) | | $ | 0 |
Net investment income - Class C | | (129,018) | | | 0 |
Net investment income - Class I | | (80,765) | | | 0 |
Total distributions | $ | (923,818) | | $ | 0 |
| | | | | |
CAPITAL SHARE TRANSACTIONS | | | | | |
Proceeds from sale of shares - Class A | $ | 1,502,414 | | $ | 6,502,358 |
Proceeds from sale of shares - Class C | | 167,767 | | | 1,182,131 |
Proceeds from sale of shares - Class I | | 794,636 | | | 14,859,450 |
Proceeds from reinvested dividends - Class A | | 578,590 | | | 0 |
Proceeds from reinvested dividends - Class C | | 97,358 | | | 0 |
Proceeds from reinvested dividends - Class I | | 41,339 | | | 0 |
Cost of shares redeemed - Class A | | (2,171,172) | | | (67,364,312) |
Cost of shares redeemed - Class C | | (753,110) | | | (7,390,462) |
Cost of shares redeemed - Class I | | (674,925) | | | (30,560,458) |
Net increase (decrease) in net assets resulting from capital share transactions | $ | (417,103) | | $ | (82,771,293) |
| | | | | |
TOTAL INCREASE (DECREASE) IN NET ASSETS | $ | (1,002,800) | | $ | (78,126,042) |
NET ASSETS, BEGINNING OF PERIOD | | 32,623,573 | | | 437,575,021 |
NET ASSETS, END OF PERIOD | $ | 31,620,773 | | $ | 359,448,979 |
| | | | | |
Accumulated undistributed net investment income | $ | 12 | | $ | 458,756 |
|
The accompanying notes are an integral part of these financial statements. |
Statements of Changes in Net Assets | For the Year Ended December 31, 2017
| | Dividend | | Energized | | Growth |
| | Harvest | | Dividend | | & Income |
| | Fund | | Fund | | Fund |
INCREASE (DECREASE) IN NET ASSETS FROM OPERATIONS | | | | | | | | | |
Net investment income (loss) | | $ | 4,197,140 | | $ | 123,892 | | $ | 359,881 |
Net realized gain (loss) from investment transactions | | | 7,371,905 | | | 138,192 | | | 1,348,985 |
Net change in unrealized appreciation (depreciation) of investments | | | 3,624,853 | | | 246,834 | | | 4,092,657 |
Net increase (decrease) in net assets resulting from operations | | $ | 15,193,898 | | $ | 508,918 | | $ | 5,801,523 |
| | | | | | | | | |
DISTRIBUTIONS TO SHAREHOLDERS FROM | | | | | | | | | |
Net investment income - Class A | | $ | (3,318,503) | | $ | (64,608) | | $ | (352,301) |
Net investment income - Class C | | | (340,432) | | | (6,374) | | | (547) |
Net investment income - Class I | | | (538,205) | | | (52,910) | | | (8,200) |
Net realized gain on investments - Class A | | | (5,792,431) | | | (60,024) | | | (2,029,196) |
Net realized gain on investments - Class C | | | (884,466) | | | (7,236) | | | (10,839) |
Net realized gain on investments - Class I | | | (1,125,623) | | | (79,472) | | | (38,245) |
Total distributions | | $ | (11,999,660) | | $ | (270,624) | | $ | (2,439,328) |
| | | | | | | | | |
CAPITAL SHARE TRANSACTIONS | | | | | | | | | |
Proceeds from sale of shares - Class A | | $ | 47,417,556 | | $ | 1,817,688 | | $ | 2,485,097 |
Proceeds from sale of shares - Class C | | | 8,292,796 | | | 273,560 | | | 44,532 |
Proceeds from sale of shares - Class I | | | 21,959,709 | | | 2,299,876 | | | 474,307 |
Proceeds from reinvested dividends - Class A | | | 8,218,352 | | | 120,152 | | | 2,257,928 |
Proceeds from reinvested dividends - Class C | | | 1,142,557 | | | 11,489 | | | 11,184 |
Proceeds from reinvested dividends - Class I | | | 1,260,766 | | | 130,244 | | | 36,834 |
Cost of shares redeemed - Class A | | | (53,902,467) | | | (909,317) | | | (6,387,802) |
Cost of shares redeemed - Class C | | | (2,982,963) | | | (119,695) | | | (29,745) |
Cost of shares redeemed - Class I | | | (8,098,852) | | | (19,151) | | | (81,337) |
Net increase (decrease) in net assets resulting from capital share transactions | | $ | 23,307,454 | | $ | 3,604,846 | | $ | (1,189,002) |
| | | | | | | | | |
TOTAL INCREASE (DECREASE) IN NET ASSETS | | $ | 26,501,692 | | $ | 3,843,140 | | $ | 2,173,193 |
NET ASSETS, BEGINNING OF PERIOD | | | 123,571,926 | | | 1,707,439 | | | 33,342,561 |
NET ASSETS, END OF PERIOD | | $ | 150,073,618 | | $ | 5,550,579 | | $ | 35,515,754 |
| | | | | | | | | |
Accumulated undistributed net investment income | | $ | 125,278 | | $ | 426 | | $ | 25,820 |
|
The accompanying notes are an integral part of these financial statements. |
Statements of Changes in Net Assets | For the Year Ended December 31, 2017
| | High | | WB/MNA |
| | Income | | Stock |
| | Fund | | Fund |
INCREASE (DECREASE) IN NET ASSETS FROM OPERATIONS | | | | | | |
Net investment income (loss) | | $ | 1,505,422 | | $ | 845,322 |
Net realized gain (loss) from investment transactions | | | 141,040 | | | (14,327,931) |
Net change in unrealized appreciation (depreciation) of investments | | | 458,293 | | | (46,858,694) |
Net increase (decrease) in net assets resulting from operations | | $ | 2,104,755 | | $ | (60,341,303) |
| | | | | | |
DISTRIBUTIONS TO SHAREHOLDERS FROM | | | | | | |
Net investment income - Class A | | $ | (1,198,070) | | $ | (394,224) |
Net investment income - Class C | | | (213,301) | | | 0 |
Net investment income - Class I | | | (94,051) | | | (444,234) |
Total distributions | | $ | (1,505,422) | | $ | (838,458) |
| | | | | | |
CAPITAL SHARE TRANSACTIONS | | | | | | |
Proceeds from sale of shares - Class A | | $ | 1,939,264 | | $ | 34,155,304 |
Proceeds from sale of shares - Class C | | | 933,233 | | | 4,679,451 |
Proceeds from sale of shares - Class I | | | 2,508,280 | | | 68,161,442 |
Proceeds from reinvested dividends - Class A | | | 936,421 | | | 360,487 |
Proceeds from reinvested dividends - Class C | | | 168,562 | | | 0 |
Proceeds from reinvested dividends - Class I | | | 46,383 | | | 413,209 |
Cost of shares redeemed - Class A | | | (4,250,897) | | | (232,989,380) |
Cost of shares redeemed - Class C | | | (1,097,224) | | | (14,153,074) |
Cost of shares redeemed - Class I | | | (624,672) | | | (21,301,549) |
Net increase (decrease) in net assets resulting from capital share transactions | | $ | 559,350 | | $ | (160,674,110) |
| | | | | | |
TOTAL INCREASE (DECREASE) IN NET ASSETS | | $ | 1,158,683 | | $ | (221,853,871) |
NET ASSETS, BEGINNING OF PERIOD | | | 31,464,890 | | | 659,428,892 |
NET ASSETS, END OF PERIOD | | $ | 32,623,573 | | $ | 437,575,021 |
| | | | | | |
Accumulated undistributed net investment income | | $ | 0 | | $ | 235,638 |
|
The accompanying notes are an integral part of these financial statements. |
NOTES TO FINANCIAL STATEMENTS
NOTE 1: Organization
The Integrity Funds (the “Trust”) was organized as a Delaware statutory trust on October 31, 1997 and commenced operations on October 31, 1997. The Trust is registered under the Investment Company Act of 1940 as an open-end management investment company, consisting of five series (the “Funds”).
Integrity Dividend Harvest Fund (the “Dividend Harvest Fund”), a non-diversified fund, seeks high current income with long term appreciation as a secondary objective. Integrity Energized Dividend Fund (the “Energized Dividend Fund”), a non-diversified fund, seeks long-term appreciation while providing high current income. Integrity Growth & Income Fund (the “Growth & Income Fund”), a diversified fund, seeks to provide long-term growth of capital with dividend income as a secondary objective. Integrity High Income Fund (the “High Income Fund”), a non-diversified fund, seeks a high level of current income with capital appreciation as a secondary objective. Williston Basin/Mid-North America Stock Fund (the “WB/MNA Stock Fund”), a diversified fund, seeks to provide long-term growth through capital appreciation.
Each Fund in the Trust currently offers Class A, C, and I shares. The Class A shares of Dividend Harvest Fund, Energized Dividend Fund, Growth & Income Fund, High Income Fund, and WB/MNA Stock Fund are sold with an initial sales charge of 5.00%, 5.00%, 5.00%, 4.25%, and 5.00%, respectively, and a distribution fee of up to 0.25% on an annual basis. Class C shares are sold without a sales charge and are subject to a distribution fee of up to 1.00% on an annual basis. Class I shares are sold without a sales charge or distribution fee. The three classes of shares represent interest in each Fund’s same portfolio of investments, have the same rights, and are generally identical in all respects except that each class bears its separate distribution and certain other class expenses and has exclusive voting rights with respect to any matter on which a separate vote of any class is required.
Each Fund is an investment company and, accordingly, follows the investment company accounting and reporting guidance of the Financial Accounting Standards Board (FASB) Accounting Standard Codification Topic 946 Financial Services – Investment Companies.
NOTE 2: Summary of Significant Accounting Policies
Investment security valuation—Securities for which market quotations are available are valued as follows: (a) Listed securities are valued at the closing price obtained from the respective primary exchange on which the security is listed or, if there were no sales on that day, at its last reported current bid price; (b) Unlisted securities are valued at the last current bid price obtained from the National Association of Securities Dealers’ Automated Quotation System. The Funds’ administrative services agent, Integrity Fund Services, LLC (“Integrity Fund Services” or “IFS”) obtains all of these prices from services that collect and disseminate such market prices. Prices provided by an independent pricing service may be determined without exclusive reliance on quoted prices and may take into account appropriate factors such as: institutional-size trading in similar groups of securities, yield, quality, coupon rate, maturity, type of issue, trading characteristics, and other market data. In the absence of an ascertainable market value, assets are valued at their fair value as determined by IFS using methods and procedures reviewed and approved by the Board of Trustees. Refer to Note 3 for further disclosures related to the inputs used to value the Funds’ investments. Shares of a registered investment company, including money market funds, that are not traded on an exchange are valued at the investment company’s net asset value per share.
When-issued securities—The Funds may purchase securities on a when-issued basis. Payment and delivery may take place after the customary settlement period for that security. The price of the underlying securities and the date when the securities will be delivered and paid for are fixed at the time the transaction is negotiated. The values of the securities purchased on a when-issued basis are identified as such in each Fund’s Schedule of Investments. With respect to purchase commitments, the Fund identifies securities as segregated in its custodial records with a value at least equal to the amount of the commitment. Losses may arise due to changes in the value of the underlying securities, if the counterparty does not perform under the contract’s terms, or if the issuer does not issue the securities due to political, economic, or other factors.
Contingent deferred sales charge—Class A shares of $1 million or more may be subject to a 1.00% contingent deferred sales charge (“CDSC”) if redeemed within 24 months of purchase (excluding shares purchased with reinvested dividends and/or distributions). Investments in Class C shares (in any amount) may be subject to a 1.00% CDSC if redeemed within 12 months of purchase.
Federal and state income taxes—Each Fund is a separate taxpayer for federal income tax purposes. Each Fund’s policy is to comply with the requirements of the Internal Revenue Code that are applicable to regulated investment companies and to distribute substantially all of its net investment income and any net realized gain on investments to its shareholders; therefore, no provision for income taxes is required.
As of and during the year ended July 31, 2019, the Funds did not have a liability for any unrecognized tax benefits. The Funds recognize interest and penalties, if any, related to unrecognized tax benefits as income tax expense in the statement of operations. During the year ended, the Funds did not incur any interest or penalties.
For all open tax years and all major taxing jurisdictions, management of the Funds has concluded that there are no significant uncertain tax positions that would require recognition in the financial statements. Open tax years, which include the current and prior three tax years, are open for examination by taxing authorities. Furthermore, management of the Funds is also not aware of any tax positions for which it is reasonably possible that the total amounts of unrecognized tax benefits will significantly change in the next twelve months.
Premiums and discounts—Premiums and discounts on debt securities are accreted and amortized using the effective yield method over the lives of the respective securities.
Cash and cash equivalents—The Funds consider investments in an FDIC insured interest bearing savings account to be cash. The Fund maintains balances, which, at times, may exceed federally insured limits. The Fund maintains these balances with a high quality financial institution.
Security transactions, investment income, expenses and distributions—Income and expenses are recorded on the accrual basis. Investment transactions are accounted for on the trade date. Realized gains and losses are reported on the specific identification basis. Interest income and estimated expenses are accrued daily. Dividend income is recognized on the ex-dividend date. Withholding taxes on foreign dividends have been provided for in accordance with the Funds’ understanding of the applicable countries’ tax rules and regulations. The Dividend Harvest Fund, Energized Dividend Fund, Growth & Income Fund, and WB/MNA Stock Fund will declare and pay dividends from net investment income at least annually. The High Income Fund declares dividends from net investment income daily and pays such dividends monthly. Dividends are reinvested in additional shares of the Funds at net asset value or paid in cash. Capital gains, when available, are distributed at least annually. Distributions to shareholders are recorded on the ex-dividend date. Income and capital gain distributions are determined in accordance with federal income tax regulations and may differ from net investment income and realized gains determined in accordance with accounting principles generally accepted in the United States of America (“GAAP”). These differences are primarily due to differing treatments for capital loss carryforwards and losses due to wash sales. In addition, other amounts have been reclassified within the composition of net assets to more appropriately conform financial accounting to tax basis treatment.
Permanent book and tax basis differences relating to shareholder distributions will result in reclassifications to paid-in capital. Temporary book and tax basis differences will reverse in a subsequent period.
Use of estimates—The financial statements have been prepared in accordance with GAAP, which requires management to make estimates and assumptions that affect the reported amounts of assets and liabilities and disclosure of contingent assets and liabilities at the date of the financial statements and the reported amounts of revenues and expenses during the reporting period. Actual results could differ from those estimates.
Common expenses—Common expenses of the Trust are allocated among the Funds within the Trust based on relative net assets of each Fund or the nature of the services performed and the relative applicability to each Fund.
Multiple class allocations—The High Income Fund simultaneously uses the settled shares method to allocate income and fund-wide expenses and uses the relative net assets method to allocate gains and losses. Dividend Harvest Fund, Energized Dividend Fund, Growth & Income Fund, and WB/MNA Stock Fund use the relative net assets method to allocate income, fund-wide expenses, gains and losses. Class-specific expenses, distribution fees, and any other items that are specifically attributable to a particular class are charged directly to such class.
Illiquid securities—A security may be considered to be illiquid if it has a limited trading market. Securities are generally considered to be liquid if they can be sold or disposed of in the ordinary course of business within seven days at approximately the price at which the security is valued by the Funds. These securities are valued at fair value as described above. Each Fund intends to hold no more than 15% of its net assets in illiquid securities. Of the illiquid securities listed on the Schedule of Investments, the following security securities are considered to be restricted as of July 31, 2019:
High Income Fund | Shares/
Principal | Dates Acquired | Cost Basis | Fair Value |
21st Century Oncology Inc - Common Stock | 165 | 2/22/18 | $66,476 | $6,470 |
RTSX - Convertible Preferred Stock | 207 | 1/12/18 | 14,025 | 47,022 |
RTSX - Corporate Bond | 44,162 | 1/12/18 | 44,163 | 34,888 |
UCI International - Common Stock | 2,633 | 6/8/17 | 119,389 | 60,559 |
NOTE 3: Fair Value Measurements
Various inputs are used in determining the value of the Funds' investments. These inputs are summarized in three broad levels: Level 1 inputs are based on quoted prices in active markets for identical securities. Level 2 inputs are based on significant observable inputs (including quoted prices for similar securities, interest rates, prepayment speeds, credit risk, etc.). Level 3 inputs are based on significant unobservable inputs (including the Funds’ own assumptions in determining the fair value of investments). The following is a summary of the inputs used to value the Funds’ investments as of July 31, 2019:
Dividend Harvest Fund | | Level 1 | | Level 2 | | Level 3 | | Total |
Common Stocks | | $ | 134,732,194 | | $ | 0 | | $ | 0 | | $ | 134,732,194 |
Total | | $ | 134,732,194 | | $ | 0 | | $ | 0 | | $ | 134,732,194 |
| | | | | | | | | | | | |
Energized Dividend Fund | | Level 1 | | Level 2 | | Level 3 | | Total |
Common Stocks | | $ | 5,582,133 | | $ | 0 | | $ | 0 | | $ | 5,582,133 |
Total | | $ | 5,582,133 | | $ | 0 | | $ | 0 | | $ | 5,582,133 |
| | | | | | | | | | | | |
Growth & Income Fund | | Level 1 | | Level 2 | | Level 3 | | Total |
Common Stocks | | $ | 37,817,049 | | $ | 0 | | $ | 0 | | $ | 37,817,049 |
Total | | $ | 37,817,049 | | $ | 0 | | $ | 0 | | $ | 37,817,049 |
| | | | | | | | | | | | |
High Income Fund | | Level 1 | | Level 2 | | Level 3 | | Total |
Corporate Bonds | | $ | 0 | | $ | 32,842,033 | | $ | 0 | | $ | 32,842,033 |
Common Stocks | | | 454,072 | | | 0 | | | 232,606 | | | 686,678 |
Convertible Preferred Stock | | | 0 | | | 41,082 | | | 101,272 | | | 142,354 |
Warrants | | | 0 | | | 0 | | | 26,025 | | | 26,025 |
Total | | $ | 454,072 | | $ | 32,883,115 | | $ | 359,903 | | $ | 33,697,090 |
| | | | | | | | | | | | |
WB/MNA Stock Fund | | Level 1 | | Level 2 | | Level 3 | | Total |
Common Stocks | | $ | 190,859,420 | | $ | 0 | | $ | 0 | | | 190,859,420 |
Total | | $ | 190,859,420 | | $ | 0 | | $ | 0 | | $ | 190,859,420 |
The changes of the fair value of investments during the year ended July 31, 2019, for which the Funds have used Level 3 inputs to determine the fair value are as follow:
| | Balance as | | | Realized | Change in unrealized
appreciation/ | Balance as |
High Income Fund | of 7/31/18 | Purchases | Sales | gain/(loss) | depreciation | of 7/31/19 |
Common Stock | $223,144 | $99,976 | $0 | $0 | ($90,514) | $232,606 |
Convertible
Preferred Stock | $56,925 | $19,375 | $0 | $0 | $24,972 | $101,272 |
Corporate Bonds | $0 | $0 | ($72) | ($39,928) | $40,000 | $0 |
Warrants | $0 | $39,600 | $0 | $0 | ($13,575) | $26,025 |
| | | | | | Impact to |
| | | | | | Valuation |
| | Fair Value | | Unobservable | Range/ | From Input |
Asset Class | at 7/31/19 | Valuation Technique | Inputs | Input | Increases |
Common Stock | $125,226 | Market Comparable Companies | EBITDA Multiple | 6.0x | Increase |
$6,470 | Market Comparable Companies | EBITDA Multiple | 8.1x | Increase |
$60,559 | Market Comparable Transaction | Transaction Price | $23.00 | Increase |
$1,926 | Market Comparable Transaction | Broker Quote | $1.50 | Increase |
$38,425 | Market Comparable Transaction | Broker Quote | $662.50 | Increase |
$232,606 | | | | |
Convertible
Preferred Stock | $54,250 | Market Comparable Transaction | Broker Quote | $1,550.00 | Increase |
$47,022 | Market Comparable Companies | EBITDA Multiple | 8.1x | Increase |
$101,272 | | | | |
Warrants | $26,025 | Market Comparable Transaction | Broker Quote | $15.50 | Increase |
Unobservable inputs used in the fair value measurement of the Funds’ investments are listed above. Significant changes in any of the unobservable inputs may significantly impact the fair value measurement. Significant increases (decreases) in working capital may increase (decrease) the fair value measurement.
NOTE 4: Investment Transactions
Purchases and sales of investment securities (excluding short-term securities) for the year ended July 31, 2019, were as follows:
| | | Dividend | | Energized | | Growth & | | High | | WB/MNA |
| | | Harvest Fund | | Dividend Fund | | Income Fund | | Income Fund | | Stock Fund |
Purchases | | $61,021,036 | | $3,171,439 | | $4,906,214 | | $12,875,071 | | $175,383,225 |
Sales | | $62,877,992 | | $3,834,278 | | $6,283,925 | | $8,571,342 | | $256,558,443 |
NOTE 5: Capital Share Transactions
Transactions in capital shares were as follows:
Year Ended 7/31/19: | | Dividend | | Energized | | Growth & | | High | | WB/MNA |
| | Harvest | | Dividend | | Income | | Income | | Stock |
Class A | | Fund | | Fund | | Fund | | Fund | | Fund |
Shares sold | | 1,130,076 | | 117,896 | | 51,836 | | 584,923 | | 1,401,241 |
Shares issued from reinvestments | | 581,758 | | 26,967 | | 38,765 | | 131,527 | | 254,068 |
Shares redeemed | | (1,889,047) | | (106,746) | | (78,806) | | (680,562) | | (15,087,323) |
Net increase (decrease) | | (177,213) | | 38,117 | | 11,795 | | 35,888 | | (13,432,014) |
| | | | | | | | | | |
Class C | | | | | | | | | | |
Shares sold | | 162,865 | | 8,408 | | 2,467 | | 78,227 | | 162,320 |
Shares issued from reinvestments | | 80,552 | | 3,081 | | 272 | | 20,011 | | 0 |
Shares redeemed | | (256,673) | | (11,763) | | (1,985) | | (168,763) | | (1,797,839) |
Net increase (decrease) | | (13,256) | | (274) | | 754 | | (70,525) | | (1,635,519) |
| | | | | | | | | | |
Class I | | | | | | | | | | |
Shares sold | | 1,375,479 | | 123,881 | | 19,844 | | 1,075,811 | | 1,814,121 |
Shares issued from reinvestments | | 135,523 | | 25,200 | | 994 | | 21,666 | | 80,218 |
Shares redeemed | | (834,981) | | (217,250) | | (8,012) | | (288,457) | | (4,979,800) |
Net increase (decrease) | | 676,021 | | (68,169) | | 12,826 | | 809,020 | | (3,085,461) |
| | | | | | | | | | |
Period Ended 7/31/18: | | Dividend | | Energized | | Growth & | | High | | WB/MNA |
| | Harvest | | Dividend | | Income | | Income | | Stock |
Class A | | Fund | | Fund | | Fund | | Fund | | Fund |
Shares sold | | 615,954 | | 104,610 | | 25,057 | | 196,232 | | 1,200,919 |
Shares issued from reinvestments | | 108,521 | | 4,560 | | 0 | | 75,478 | | 0 |
Shares redeemed | | (1,639,522) | | (39,373) | | (54,421) | | (282,308) | | (12,655,249) |
Net increase (decrease) | | (915,047) | | 69,797 | | (29,364) | | (10,598) | | (11,454,330) |
| | | | | | | | | | |
Class C | | | | | | | | | | |
Shares sold | | 105,864 | | 6,147 | | 339 | | 21,759 | | 219,137 |
Shares issued from reinvestments | | 12,148 | | 510 | | 0 | | 12,665 | | 0 |
Shares redeemed | | (301,274) | | (544) | | (1,096) | | (97,742) | | (1,386,296) |
Net increase (decrease) | | (183,262) | | 6,113 | | (757) | | (63,318) | | (1,167,159) |
| | | | | | | | | | |
Class I | | | | | | | | | | |
Shares sold | | 616,152 | | 56,713 | | 3,729 | | 103,377 | | 2,734,738 |
Shares issued from reinvestments | | 17,330 | | 5,976 | | 0 | | 5,395 | | 0 |
Shares redeemed | | (567,341) | | (14,100) | | (3,560) | | (88,167) | | (5,828,207) |
Net increase (decrease) | | 66,141 | | 48,589 | | 169 | | 20,605 | | (3,093,469) |
Year Ended 12/31/17: | | Dividend | | Energized | | Growth & | | High | | WB/MNA |
| | Harvest | | Dividend | | Income | | Income | | Stock |
Class A | | Fund | | Fund | | Fund | | Fund | | Fund |
Shares sold | | 3,235,571 | | 152,980 | | 46,691 | | 248,568 | | 6,270,079 |
Shares issued from reinvestments | | 556,988 | | 10,014 | | 42,102 | | 120,018 | | 65,782 |
Shares redeemed | | (3,669,437) | | (81,700) | | (122,899) | | (545,362) | | (44,411,374) |
Net increase (decrease) | | 123,122 | | 81,294 | | (34,106) | | (176,776) | | (38,075,513) |
| | | | | | | | | | |
Class C | | | | | | | | | | |
Shares sold | | 570,659 | | 22,657 | | 832 | | 119,496 | | 874,007 |
Shares issued from reinvestments | | 77,901 | | 938 | | 209 | | 21,546 | | 0 |
Shares redeemed | | (203,612) | | (10,088) | | (583) | | (140,622) | | (2,751,346) |
Net increase (decrease) | | 444,948 | | 13,507 | | 458 | | 420 | | (1,877,339) |
| | | | | | | | | | |
Class I | | | | | | | | | | |
Shares sold | | 1,497,044 | | 192,506 | | 9,084 | | 322,665 | | 12,629,137 |
Shares issued from reinvestments | | 85,332 | | 10,617 | | 687 | | 5,942 | | 75,541 |
Shares redeemed | | (547,196) | | (1,607) | | (1,574) | | (80,068) | | (4,141,731) |
Net increase (decrease) | | 1,035,180 | | 201,516 | | 8,197 | | 248,539 | | 8,562,947 |
NOTE 6: Income Tax Information
At July 31, 2019, the unrealized appreciation (depreciation) based on the cost of investments for federal income tax purposes was as follows:
| | Dividend | | Energized | | Growth & | | High | | WB/MNA |
| | Harvest | | Dividend | | Income | | Income | | Stock |
| | Fund | | Fund | | Fund | | Fund | | Fund |
Investments at cost | $ | 129,243,041 | | $ | 5,871,994 | | $ | 26,972,697 | | $ | 33,589,671 | | $ | 213,403,573 |
Unrealized appreciation | $ | 11,168,604 | | $ | 153,900 | | $ | 11,284,793 | | $ | 1,492,055 | | $ | 5,821,860 |
Unrealized depreciation | | (5,679,451) | | | (443,761) | | | (440,441) | | | (1,384,636) | | | (28,366,013) |
Net unrealized appreciation* | $ | 5,489,153 | | $ | (289,861) | | $ | 10,844,352 | | $ | 107,419 | | $ | (22,544,153) |
*Differences between financial reporting-basis and tax-basis unrealized appreciation/ (depreciation) are due to tax deferral of losses on wash sales. |
The tax character of distributions paid was as follows:
| | Dividend | | Energized | | Growth & | | High | | WB/MNA |
| | Harvest | | Dividend | | Income | | Income | | Stock |
Year ended 7/31/19: | Fund | | Fund | | Fund | | Fund | | Fund |
Ordinary Income | $ | 4,813,575 | | $ | 465,611 | | $ | 334,469 | | $ | 1,643,551 | | $ | 1,341,283 |
Capital Gain | | 6,680,514 | | | 98,356 | | | 1,727,254 | | | 0 | | | 0 |
Return of Capital | | 0 | | | 41,485 | | | 0 | | | 0 | | | 0 |
Total | $ | 11,494,089 | | $ | 605,452 | | $ | 2,061,723 | | $ | 1,643,551 | | $ | 1,341,283 |
| | | | | | | | | | | | | | |
Period ended 7/31/18: | | | | | | | | | | | | | | |
Ordinary Income | $ | 2,146,466 | | $ | 138,431 | | $ | 0 | | $ | 923,818 | | $ | 0 |
| | | | | | | | | | | | | | |
Year ended 12/31/17: | | | | | | | | | | | | | | |
Ordinary Income | $ | 6,843,837 | | $ | 227,037 | | $ | 597,288 | | $ | 1,505,422 | | $ | 609,684 |
Capital Gain | | 5,030,545 | | | 43,587 | | | 1,816,724 | | | 0 | | | 0 |
Return of Capital | | 125,278 | | | 0 | | | 25,316 | | | 0 | | | 228,774 |
Total | $ | 11,999,660 | | $ | 270,624 | | $ | 2,439,328 | | $ | 1,505,422 | | $ | 838,458 |
As of July 31, 2019, the components of accumulated earnings/(deficit) on a tax basis were as follows:
| | Dividend | | Energized | | Growth & | | High | | WB/MNA |
| | Harvest | | Dividend | | Income | | Income | | Stock |
| | Fund | | Fund | | Fund | | Fund | | Fund |
Undistributed ordinary
income | $ | 95,378 | | $ | 0 | | $ | 373,817 | | $ | 25,835 | | $ | 1,139,567 |
Undistributed capital
gain | | 4,644,995 | | | 0 | | | 2,013,031 | | | 0 | | | 0 |
Capital loss carryforward | | 0 | | | 0 | | | 0 | | | (892,571) | | | (162,121,425) |
Post-October losses
deferred^ | | 0 | | | (317,404) | | | 0 | | | 0 | | | 0 |
Unrealized appreciation/
(depreciation)* | | 5,489,153 | | | (289,861) | | | 10,844,352 | | | 107,419 | | | (22,544,153) |
Total accumulated earnings/(deficit) | $ | 10,229,526 | | $ | (607,265) | | $ | 13,231,200 | | $ | (759,317) | | $ | (183,526,011) |
*Differences between financial reporting-basis and tax-basis unrealized appreciation/(depreciation) are due to tax deferral of losses on wash sales. |
^When a Fund elects to do so, capital losses incurred after October 31 within the fiscal year are deemed to arise on the first business day of the following fiscal year for tax purposes. |
The Funds’ capital loss carryforward amounts as of July 31, 2019 are as follows:
| | | High Income Fund | | WB/MNA Stock Fund |
Non-expiring S-T losses | | $ | 0 | | $ | 91,290,157 |
Non-expiring L-T losses | | | 892,571 | | | 70,831,268 |
Total | | $ | 892,571 | | $ | 162,121,425 |
NOTE 7: Investment Advisory Fees and Other Transactions with Affiliates
Viking Fund Management (“VFM”), the Funds’ investment adviser; Integrity Funds Distributor, LLC (“Integrity Funds Distributor” or “IFD”), the Funds’ underwriter and distributor; and Integrity Fund Services, the Funds’ transfer, accounting, and administrative services agent; are subsidiaries of Corridor Investors, LLC (“Corridor Investors” or “Corridor”), the Funds’ sponsor. For Integrity High Income Fund, JPMIM is the sub-adviser. A Trustee of the Funds is also a Governor of Corridor. VFM provides investment advisory and management services to the Funds. The Investment Advisory Agreement (the “Advisory Agreement”) provides for fees to be computed at an annual rate of each Fund’s average daily net assets. VFM has also contractually agreed to waive its management fee and to reimburse expenses, other than extraordinary or non-recurring expenses, taxes, brokerage fees, commissions and acquired fund fees and expenses, so that the net annual operating expenses do not exceed a certain rate. After November 29, 2020, the expense limitations may be terminated or revised.
| | | Contractual Waiver % |
| Advisory Fee % | | Class A | | Class C | | Class I |
Dividend Harvest Fund | 0.75% | | 0.95% | | 1.70% | | 0.70% |
Energized Dividend Fund | 0.75% | | 1.05% | | 1.80% | | 0.80% |
Growth & Income Fund | 1.00% | | 1.25% | | 2.00% | | 1.00% |
High Income Fund | 0.85% | | 0.89% | | 1.64% | | 0.64% |
WB/MNA Stock Fund | 0.50% | | 1.50% | | 2.00% | | 1.00% |
VFM and affiliated service providers may also voluntarily waive fees or reimburse expenses not required under the advisory or other contracts from time to time. Accordingly, after voluntary and contractual fee waivers and reimbursements, the Energized Dividend Fund’s actual total expenses for Class A, C, and I were 0.67%, 1.42, and 0.42%, respectively, of average daily net assets for the year ended July 31, 2019. VFM and the affiliated service providers have agreed to voluntarily waive the affiliated service provider’s fees before voluntarily or contractually waiving VFM’s management fee. There are no recoupment provisions in place for waived/reimbursed fees. An expense limitation lowers expense ratios and increases returns to investors. Certain Officers of the Funds are also Officers and Governors of VFM.
| Year Ended 7/31/19 | | Payable 7/31/19 |
| Advisory | | Waived | | Reimb. | | Advisory |
Dividend Harvest Fund | $ | 969,193 | | $ | 723,392 | | $ | 0 | | $ | 0 |
Energized Dividend Fund | $ | 47,111 | | $ | 47,111 | | $ | 82,740 | | $ | 0 |
Growth & Income Fund | $ | 363,823 | | $ | 246,825 | | $ | 0 | | $ | 0 |
High Income Fund | $ | 277,160 | | $ | 277,160 | | $ | 1,552 | | $ | 0 |
WB/MNA Stock Fund | $ | 1,266,027 | | $ | 69,003 | | $ | 0 | | $ | 448 |
IFD serves as the principal underwriter and distributor for the Funds and receives sales charges deducted from Fund share sales proceeds and CDSC from applicable Fund share redemptions. Also, the Funds have adopted a distribution plan for each class of shares as allowed by Rule 12b-1 of the 1940 Act. Distribution plans permit the Funds to reimburse its principal underwriter for costs related to selling shares of the Funds and for various other services. These costs, which consist primarily of commissions and service fees to broker-dealers who sell shares of the Funds, are paid by shareholders through expenses called “Distribution Plan expenses.” The Funds currently pay an annual distribution fee and/or service fee of up to 0.25% (0.50% for WB/MNA Stock Fund) for Class A and 1.00% for Class C of the average daily net assets. Class I shares do not have a 12b-1 plan in place. Certain Officers of the Funds are also Officers and Governors of IFD.
| | Year Ended 7/31/19 | |
| | Sales Charges | | CDSC | | Distribution Fees | |
Dividend Harvest Fund - A | $ | 373,512 | | $ | 202 | | $ | 225,911 | |
Dividend Harvest Fund - C | $ | 0 | | $ | 2,133 | | $ | 134,446 | |
Energized Dividend Fund - A | $ | 43,736 | | $ | 0 | | $ | 7,660 | |
Energized Dividend Fund - C | $ | 0 | | $ | 0 | | $ | 3,258 | |
Growth & Income Fund - A | $ | 24,844 | | $ | 0 | | $ | 87,260 | |
Growth & Income Fund - C | $ | 0 | | $ | 15 | | $ | 0 | |
High Income Fund - A | $ | 65,857 | | $ | 0 | | $ | 59,453 | |
High Income Fund - C | $ | 0 | | $ | 0 | | $ | 42,445 | |
WB/MNA Stock Fund - A | $ | 159,460 | | $ | 446 | | $ | 1,011,345 | |
WB/MNA Stock Fund - C | $ | 0 | | $ | 1,647 | | $ | 225,430 | |
IFS acts as the transfer agent for High Income Fund at a monthly variable fee equal to 0.12% on the first $0 to $200 million and at a lower rate in excess of $200 million of the Fund’s average daily net assets on an annual basis and an additional fee of $500 per month for each additional share class plus reimbursement of out-of-pocket expenses and sub-transfer agent out-of-pocket expenses. IFS acts as the transfer agent for Dividend Harvest Fund, Energized Dividend Fund, Growth & Income Fund, and WB/MNA Stock Fund at a monthly variable fee equal to 0.18% on the first $0 to $200 million, 0.15% on the next $200 to $700 million and at a lower rate in excess of $700 million of the Funds’ average daily net assets on an annual basis and an additional fee of $500 per month for each additional share class plus reimbursement of out-of-pocket expenses and sub-transfer agent out-of-pocket expenses. Sub-transfer agent out-of-pocket expenses are included in the transfer agent fees below and in the transfer agent out-of-pocket balance on the Statements of Operations.
IFS also acts as the Funds’ administrative services agent for a monthly fee equal to the sum of a fixed fee of $2,000 and a variable fee equal to 0.14% on the first $0 to $200 million, 0.13% on the next $200 to $700 million and at a lower rate in excess of $700 million of the Funds’ average daily net assets on an annual basis and an additional fee of $1,000 per month for each additional share class plus reimbursement of out-of-pocket expenses. Certain Officers of the Funds are also Officers and Governors of IFS.
| | Year Ended 7/31/19 | | Payable 7/31/19 |
| | Transfer | | Admin. | | Transfer | | Admin. |
| | Agency Fees | | Service Fees | | Agency Fees | | Service Fees |
Dividend Harvest Fund | $ | 275,332 | | $ | 228,915 | | $ | 9,076 | | $ | 0 |
Energized Dividend Fund | $ | 24,834 | | $ | 56,793 | | $ | 477 | | $ | 0 |
Growth & Income Fund | $ | 92,038 | | $ | 98,934 | | $ | 3,652 | | $ | 0 |
High Income Fund | $ | 56,731 | | $ | 93,648 | | $ | 1,286 | | $ | 0 |
WB/MNA Stock Fund | $ | 602,785 | | $ | 397,150 | | $ | 50,367 | | $ | 0 |
NOTE 8: Principal Risks
The High Income Fund may be invested in lower-rated debt securities that have a higher risk of default or loss of value since these securities may be sensitive to economic changes, political changes or adverse developments specific to the issuer.
The WB/MNA Stock Fund invests significantly in relatively few sectors, primarily the energy sector, and has more exposure to the price movement of this sector than funds that diversify their investments among many sectors.
NOTE 9: Subsequent Events
The Board, at a meeting held on August 2, 2019, approved Agreements and Plans of Reorganization (each a “Plan of Reorganization”) and other items relating to action that may take place in the Integrity Funds. A merger with certain funds of the Trust for Professional Managers, including the M.D. Sass Equity Income Plus Fund and the M.D. Sass Short Term U.S. Government Agency Income Fund will be voted on by shareholders of those Funds in the near term. The Plan of Reorganization for the M.D. Sass Equity Income Plus Fund provides for the reorganization of the M.D. Sass Equity Income Plus Fund into the Integrity Dividend Harvest Fund, an existing series of The Integrity Funds, an open-end registered investment management company. The Plan of Reorganization for the M.D. Sass Short Term U.S. Government Agency Income Fund provides for the reorganization of the M.D. Sass Short Term U.S. Government Agency Income Fund into a newly created series of The Integrity Funds.
NOTE 10. Recent Accounting Pronouncements:
In March 2017, the Financial Accounting Standards Board ("FASB") issued Accounting Standards ("ASU") Update No. 2017-08 "Premium Amortization on Purchased Callable Debt Securities" ("ASU 2017-08"), which shortens the premium amortization period for purchased non-contingently callable debt securities. ASU 2017-08 specifies that the premium amortization period ends at the earliest call date, for purchased non-contingently callable debt securities. ASU 2017-08 is effective for fiscal years, and interim periods within those fiscal years, beginning after December 15, 2018. Management does not believe that adoption of ASU 2017-08 will materially impact the Funds' financial statements.
In August 2018, the FASB issued ASU No. 2018-13, "Fair Value Measurements" ("ASU 2018-13"). This update makes certain removals from, changes to and additions to existing disclosure requirements for fair value measurements. ASU 2018-13 does not change fair value measurements already required or permitted by existing standards. ASU 2018-13 is effective for financial statements issued for fiscal years beginning after December 15, 2019, and interim periods within those fiscal years. As permitted, the Funds have early adopted ASU 2018-13 with the financial statements prepared as of July 31, 2019.
In August 2018, the SEC adopted amendments to certain financial statement disclosure requirements to conform them to GAAP for investment companies. These amendments made certain disclosure requirements effective under Regulation S-X. The Funds' adoption of these amendments, effective with the financial statements prepared as of July 31, 2019 had no effect on the Funds' net assets or results of operations.
INTEGRITY DIVIDEND HARVEST FUND CLASS A
Selected per share data and ratios for the periods indicated
| | | | Seven | | | | | | | | |
| | Year | | Months | | Year | | Year | | Year | | Year |
| | Ended | | Ended | | Ended | | Ended | | Ended | | Ended |
| | 7/31/19 | | 7/31/18 | | 12/31/17 | | 12/30/16 | | 12/31/15 | | 12/31/14 |
NET ASSET VALUE, BEGINNING OF PERIOD | $ | 14.24 | | $ | 14.68 | | $ | 14.33 | | $ | 12.23 | | $ | 12.64 | | $ | 12.05 |
| | | | | | | | | | | | | | | | | |
Income (loss) from investment operations: | | | | | | | | | | | | | | | | | |
Net investment income (loss) | $ | 0.44 | | $ | 0.24 | | $ | 0.41 | | $ | 0.39 | | $ | 0.37 | | $ | 0.36 |
Net realized and unrealized gain (loss) on investments (1) | | 0.66 | | | (0.45) | | | 1.16 | | | 2.15 | | | (0.24) | | | 1.01 |
Total from investment operations | $ | 1.10 | | $ | (0.21) | | $ | 1.57 | | $ | 2.54 | | $ | 0.13 | | $ | 1.37 |
| | | | | | | | | | | | | | | | | |
Less Distributions: | | | | | | | | | | | | | | | | | |
Dividends from net investment income | $ | (0.43) | | $ | (0.23) | | $ | (0.41) | | $ | (0.39) | | $ | (0.37) | | $ | (0.36) |
Distributions from net realized gains | | (0.85) | | | 0.00 | | | (0.81) | | | (0.05) | | | (0.17) | | | (0.42) |
Total distributions | $ | (1.28) | | $ | (0.23) | | $ | (1.22) | | $ | (0.44) | | $ | (0.54) | | $ | (0.78) |
| �� | | | | | | | | | | | | | | | | |
NET ASSET VALUE, END OF PERIOD | $ | 14.06 | | $ | 14.24 | | $ | 14.68 | | $ | 14.33 | | $ | 12.23 | | $ | 12.64 |
| | | | | | | | | | | | | | | | | |
Total Return (excludes any applicable sales charge) # | 8.75% | | (1.39%) | | 11.10% | | 20.94% | | 1.12% | | 11.42% |
| | | | | | | | | | | | | | | | | |
RATIOS/SUPPLEMENTAL DATA | | | | | | | | | | | | | | | | | |
Net assets, end of period (in thousands) | $91,602 | | $95,340 | | $111,696 | | $107,275 | | $43,425 | | $29,645 |
Ratio of expenses to average net assets after waivers ^ (2) | 0.95% | | 0.95% | | 0.95% | | 0.95% | | 0.85% | | 0.60% |
Ratio of expenses to average net assets before waivers ^ | 1.51% | | 1.53% | | 1.49% | | 1.55% | | 1.58% | | 1.59% |
Ratio of net investment income to average net assets ^ (2) | 3.17% | | 2.92% | | 2.88% | | 3.26% | | 3.18% | | 2.98% |
Portfolio turnover rate # | 47.71% | | 23.05% | | 44.89% | | 25.56% | | 38.38% | | 32.99% |
(1) | Net realized and unrealized gain/(loss) per share are balancing amounts necessary to reconcile the change in net asset value per share for the period, and may not reconcile with the aggregate gains and losses in the statement of operations due to share transactions for the period. |
(2) | This row reflects the impact, if any, of fee waivers or reimbursements by the Adviser and/or affiliated service providers. |
^ | Annualized for periods less than one year. |
# | Not annualized for periods less than one year. |
|
Total return represents the rate that an investor would have earned or lost on an investment in the Fund assuming reinvestment of all dividends and distributions. |
|
The accompanying notes are an integral part of these financial statements. |
INTEGRITY DIVIDEND HARVEST FUND CLASS C
Selected per share data and ratios for the periods indicated
| | | | Seven | | | | | | Period |
| | Year | | Months | | Year | | Year | | From |
| | Ended | | Ended | | Ended | | Ended | | 8/3/15* to |
| | 7/31/19 | | 7/31/18 | | 12/31/17 | | 12/30/16 | | 12/31/15 |
NET ASSET VALUE, BEGINNING OF PERIOD | $ | 14.15 | | $ | 14.59 | | $ | 14.26 | | $ | 12.20 | | $ | 12.54 |
| | | | | | | | | | | | | | |
Income (loss) from investment operations: | | | | | | | | | | | | | | |
Net investment income (loss) | $ | 0.34 | | $ | 0.17 | | $ | 0.31 | | $ | 0.31 | | $ | 0.18 |
Net realized and unrealized gain (loss) on investments (1) | | 0.65 | | | (0.44) | | | 1.14 | | | 2.11 | | | (0.17) |
Total from investment operations | $ | 0.99 | | $ | (0.27) | | $ | 1.45 | | $ | 2.42 | | $ | 0.01 |
| | | | | | | | | | | | | | |
Less Distributions: | | | | | | | | | | | | | | |
Dividends from net investment income | $ | (0.33) | | $ | (0.17) | | $ | (0.31) | | $ | (0.31) | | $ | (0.18) |
Distributions from net realized gains | | (0.85) | | | 0.00 | | | (0.81) | | | (0.05) | | | (0.17) |
Total distributions | $ | (1.18) | | $ | (0.17) | | $ | (1.12) | | $ | (0.36) | | $ | (0.35) |
| | | | | | | | | | | | | | |
NET ASSET VALUE, END OF PERIOD | $ | 13.96 | | $ | 14.15 | | $ | 14.59 | | $ | 14.26 | | $ | 12.20 |
| | | | | | | | | | | | | | |
Total Return (excludes any applicable sales charge) # | 7.92% | | (1.78%) | | 10.26% | | 20.01% | | 0.14% |
| | | | | | | | | | | | | | |
RATIOS/SUPPLEMENTAL DATA | | | | | | | | | | | | | | |
Net assets, end of period (in thousands) | $13,637 | | $14,014 | | $17,126 | | $10,392 | | $692 |
Ratio of expenses to average net assets after waivers ^ (2) | 1.70% | | 1.70% | | 1.70% | | 1.70% | | 1.70% |
Ratio of expenses to average net assets before waivers ^ | 2.26% | | 2.28% | | 2.24% | | 2.30% | | 2.39% |
Ratio of net investment income to average net assets ^ (2) | 2.42% | | 2.17% | | 2.14% | | 2.40% | | 2.48% |
Portfolio turnover rate # | 47.71% | | 23.05% | | 44.89% | | 25.56% | | 38.38% |
(1) | Net realized and unrealized gain/(loss) per share are balancing amounts necessary to reconcile the change in net asset value per share for the period, and may not reconcile with the aggregate gains and losses in the statement of operations due to share transactions for the period. |
(2) | This row reflects the impact, if any, of fee waivers or reimbursements by the Adviser and/or affiliated service providers. |
^ | Annualized for periods less than one year. |
# | Not annualized for periods less than one year. |
* | Commencement of operations. |
|
Total return represents the rate that an investor would have earned or lost on an investment in the Fund assuming reinvestment of all dividends and distributions. |
|
The accompanying notes are an integral part of these financial statements. |
INTEGRITY DIVIDEND HARVEST FUND CLASS I
Selected per share data and ratios for the periods indicated
| | | | | Seven | | | | Period |
| | | Year | | Months | | Year | | From |
| | | Ended | | Ended | | Ended | | 8/1/16* to |
| | | 7/31/19 | | 7/31/18 | | 12/31/17 | | 12/30/16 |
NET ASSET VALUE, BEGINNING OF PERIOD | | $ | 14.25 | | $ | 14.69 | | $ | 14.34 | | $ | 13.96 |
| | | | | | | | | | | | |
Income (loss) from investment operations: | | | | | | | | | | | | |
Net investment income (loss) | | $ | 0.48 | | $ | 0.26 | | $ | 0.45 | | $ | 0.22 |
Net realized and unrealized gain (loss) on investments (1) | | | 0.66 | | | (0.46) | | | 1.16 | | | 0.43 |
Total from investment operations | | $ | 1.14 | | $ | (0.20) | | $ | 1.61 | | $ | 0.65 |
| | | | | | | | | | | | |
Less Distributions: | | | | | | | | | | | | |
Dividends from net investment income | | $ | (0.47) | | $ | (0.24) | | $ | (0.45) | | $ | (0.22) |
Distributions from net realized gains | | | (0.85) | | | 0.00 | | | (0.81) | | | (0.05) |
Total distributions | | $ | (1.32) | | $ | (0.24) | | $ | (1.26) | | $ | (0.27) |
| | | | | | | | | | | | |
NET ASSET VALUE, END OF PERIOD | | $ | 14.07 | | $ | 14.25 | | $ | 14.69 | | $ | 14.34 |
| | | | | | | | | | | | |
Total Return (excludes any applicable sales charge) # | | 9.01% | | (1.26%) | | 11.37% | | 4.67% |
| | | | | | | | | | | | |
RATIOS/SUPPLEMENTAL DATA | | | | | | | | | | | | |
Net assets, end of period (in thousands) | | $30,794 | | $21,565 | | $21,252 | | $5,904 |
Ratio of expenses to average net assets after waivers ^ (2) | | 0.70% | | 0.70% | | 0.70% | | 0.70% |
Ratio of expenses to average net assets before waivers ^ | | 1.26% | | 1.28% | | 1.24% | | 1.31% |
Ratio of net investment income to average net assets ^ (2) | | 3.42% | | 3.18% | | 3.14% | | 3.22% |
Portfolio turnover rate # | | 47.71% | | 23.05% | | 44.89% | | 25.56% |
(1) | Net realized and unrealized gain/(loss) per share are balancing amounts necessary to reconcile the change in net asset value per share for the period, and may not reconcile with the aggregate gains and losses in the statement of operations due to share transactions for the period. |
(2) | This row reflects the impact, if any, of fee waivers or reimbursements by the Adviser and/or affiliated service providers. |
^ | Annualized for periods less than one year. |
# | Not annualized for periods less than one year. |
* | Commencement of operations. |
|
Total return represents the rate that an investor would have earned or lost on an investment in the Fund assuming reinvestment of all dividends and distributions. |
|
The accompanying notes are an integral part of these financial statements. |
INTEGRITY ENERGIZED DIVIDEND FUND CLASS A
Selected per share data and ratios for the periods indicated
| | | | | Seven | | | | Period |
| | | Year | | Months | | Year | | From |
| | | Ended | | Ended | | Ended | | 5/2/16* to |
| | | 7/31/19 | | 7/31/18 | | 12/31/17 | | 12/30/16 |
NET ASSET VALUE, BEGINNING OF PERIOD | | $ | 12.81 | | $ | 12.43 | | $ | 11.37 | | $ | 10.00 |
| | | | | | | | | | | | |
Income (loss) from investment operations: | | | | | | | | | | | | |
Net investment income (loss) | | $ | 0.50 | | $ | 0.27 | | $ | 0.50 | | $ | 0.34 |
Net realized and unrealized gain (loss) on investments (1) | | | (1.53) | | | 0.37 | | | 1.42 | | | 1.63 |
Total from investment operations | | $ | (1.03) | | $ | 0.64 | | $ | 1.92 | | $ | 1.97 |
| | | | | | | | | | | | |
Less Distributions: | | | | | | | | | | | | |
Dividends from net investment income | | $ | (0.52) | | $ | (0.26) | | $ | (0.50) | | $ | (0.34) |
Distributions from net realized gains | | | (0.57) | | | 0.00 | | | (0.36) | | | (0.26) |
Return of capital | | | (0.09) | | | 0.00 | | | 0.00 | | | 0.00 |
Total distributions | | $ | (1.18) | | $ | (0.26) | | $ | (0.86) | | $ | (0.60) |
| | | | | | | | | | | | |
NET ASSET VALUE, END OF PERIOD | | $ | 10.60 | | $ | 12.81 | | $ | 12.43 | | $ | 11.37 |
| | | | | | | | | | | | |
Total Return (excludes any applicable sales charge) # | | (7.18%) | | 5.36% | | 17.47% | | 19.96% |
| | | | | | | | | | | | |
RATIOS/SUPPLEMENTAL DATA | | | | | | | | | | | | |
Net assets, end of period (in thousands) | | $3,121 | | $3,286 | | $2,321 | | $1,198 |
Ratio of expenses to average net assets after waivers ^ (2) | | 0.67% | | 0.51% | | 0.35% | | 0.17% |
Ratio of expenses to average net assets before waivers ^ | | 2.75% | | 2.48% | | 4.49% | | 8.39% |
Ratio of net investment income to average net assets ^ (2)(3) | | 4.45% | | 3.89% | | 5.12% | | 5.13% |
Portfolio turnover rate # | | 52.37% | | 13.33% | | 60.18% | | 30.17% |
(1) | Net realized and unrealized gain/(loss) per share are balancing amounts necessary to reconcile the change in net asset value per share for the period, and may not reconcile with the aggregate gains and losses in the statement of operations due to share transactions for the period. |
(2) | This row reflects the impact, if any, of fee waivers or reimbursements by the Adviser and/or affiliated service providers. |
^ | Annualized for periods less than one year. |
# | Not annualized for periods less than one year. |
* | Commencement of operations. |
(3) | The voluntary waiver, based on average net assets, amounted to 0.88%, 0.70%, 0.55%, and 0.38% for the periods ended 12/30/16, 12/31/17, 7/31/18, and 7/31/19, respectively. |
|
Total return represents the rate that an investor would have earned or lost on an investment in the Fund assuming reinvestment of all dividends and distributions. |
|
The accompanying notes are an integral part of these financial statements. |
INTEGRITY ENERGIZED DIVIDEND FUND CLASS C
Selected per share data and ratios for the periods indicated
| | | | Seven | | | | Period |
| | Year | | Months | | Year | | From |
| | Ended | | Ended | | Ended | | 5/2/16* to |
| | 7/31/19 | | 7/31/18 | | 12/31/17 | | 12/30/16 |
NET ASSET VALUE, BEGINNING OF PERIOD | $ | 12.77 | | $ | 12.40 | | $ | 11.36 | | $ | 10.00 |
| | | | | | | | | | | |
Income (loss) from investment operations: | | | | | | | | | | | |
Net investment income (loss) | $ | 0.42 | | $ | 0.22 | | $ | 0.43 | | $ | 0.29 |
Net realized and unrealized gain (loss) on investments (1) | | (1.53) | | | 0.37 | | | 1.40 | | | 1.62 |
Total from investment operations | $ | (1.11) | | $ | 0.59 | | $ | 1.83 | | $ | 1.91 |
| | | | | | | | | | | |
Less Distributions: | | | | | | | | | | | |
Dividends from net investment income | $ | (0.44) | | $ | (0.22) | | $ | (0.43) | | $ | (0.29) |
Distributions from net realized gains | | (0.57) | | | 0.00 | | | (0.36) | | | (0.26) |
Return of capital | | (0.09) | | | 0.00 | | | 0.00 | | | 0.00 |
Total distributions | $ | (1.10) | | $ | (0.22) | | $ | (0.79) | | $ | (0.55) |
| | | | | | | | | | | |
NET ASSET VALUE, END OF PERIOD | $ | 10.56 | | $ | 12.77 | | $ | 12.40 | | $ | 11.36 |
| | | | | | | | | | | |
Total Return (excludes any applicable sales charge) # | (7.94%) | | 4.90% | | 16.64% | | 19.300% |
| | | | | | | | | | | |
RATIOS/SUPPLEMENTAL DATA | | | | | | | | | | | |
Net assets, end of period (in thousands) | $311 | | $379 | | $292 | | $114 |
Ratio of expenses to average net assets after waivers ^ (2) | 1.42% | | 1.25% | | 1.10% | | 0.91% |
Ratio of expenses to average net assets before waivers ^ | 3.51% | | 3.22% | | 5.17% | | 12.55% |
Ratio of net investment income to average net assets ^ (2)(3) | 3.70% | | 3.16% | | 5.03% | | 4.14% |
Portfolio turnover rate # | 52.37% | | 13.33% | | 60.18% | | 30.17% |
(1) | Net realized and unrealized gain/(loss) per share are balancing amounts necessary to reconcile the change in net asset value per share for the period, and may not reconcile with the aggregate gains and losses in the statement of operations due to share transactions for the period. |
(2) | This row reflects the impact, if any, of fee waivers or reimbursements by the Adviser and/or affiliated service providers. |
^ | Annualized for periods less than one year. |
# | Not annualized for periods less than one year. |
* | Commencement of operations. |
(3) | The voluntary waiver, based on average net assets, amounted to 0.88%, 0.70%, 0.55%, and 0.38% for the periods ended 12/30/16, 12/31/17, 7/31/18, and 7/31/19, respectively. |
|
Total return represents the rate that an investor would have earned or lost on an investment in the Fund assuming reinvestment of all dividends and distributions. |
|
The accompanying notes are an integral part of these financial statements. |
INTEGRITY ENERGIZED DIVIDEND FUND CLASS I
Selected per share data and ratios for the periods indicated
| | | | | Seven | | | | Period |
| | | Year | | Months | | Year | | From |
| | | Ended | | Ended | | Ended | | 8/1/16* to |
| | | 7/31/19 | | 7/31/18 | | 12/31/17 | | 12/30/16 |
NET ASSET VALUE, BEGINNING OF PERIOD | | $ | 12.82 | | $ | 12.43 | | $ | 11.37 | | $ | 9.95 |
| | | | | | | | | | | | |
Income (loss) from investment operations: | | | | | | | | | | | | |
Net investment income (loss) | | $ | 0.54 | | $ | 0.29 | | $ | 0.53 | | $ | 0.27 |
Net realized and unrealized gain (loss) on investments (1) | | | (1.55) | | | 0.38 | | | 1.42 | | | 1.68 |
Total from investment operations | | $ | (1.01) | | $ | 0.67 | | $ | 1.95 | | $ | 1.95 |
| | | | | | | | | | | | |
Less Distributions: | | | | | | | | | | | | |
Dividends from net investment income | | $ | (0.55) | | $ | (0.28) | | $ | (0.53) | | $ | (0.27) |
Distributions from net realized gains | | | (0.57) | | | 0.00 | | | (0.36) | | | (0.26) |
Return of capital | | | (0.09) | | | 0.00 | | | 0.00 | | | 0.00 |
Total distributions | | $ | (1.21) | | $ | (0.28) | | $ | (0.89) | | $ | (0.53) |
| | | | | | | | | | | | |
NET ASSET VALUE, END OF PERIOD | | $ | 10.60 | | $ | 12.82 | | $ | 12.43 | | $ | 11.37 |
| | | | | | | | | | | | |
Total Return (excludes any applicable sales charge) # | | (7.02%) | | 5.57% | | 17.74% | | 19.80% |
| | | | | | | | | | | | |
RATIOS/SUPPLEMENTAL DATA | | | | | | | | | | | | |
Net assets, end of period (in thousands) | | $2,297 | | $3,651 | | $2,938 | | $395 |
Ratio of expenses to average net assets after waivers ^ (2) | | 0.42% | | 0.25% | | 0.10% | | 0.00% |
Ratio of expenses to average net assets before waivers ^ | | 2.46% | | 2.23% | | 3.72% | | 5.54% |
Ratio of net investment income to average net assets ^ (2)(3) | | 4.70% | | 4.16% | | 11.66% | | 6.90% |
Portfolio turnover rate # | | 52.37% | | 13.33% | | 60.18% | | 30.17% |
(1) | Net realized and unrealized gain/(loss) per share are balancing amounts necessary to reconcile the change in net asset value per share for the period, and may not reconcile with the aggregate gains and losses in the statement of operations due to share transactions for the period. |
(2) | This row reflects the impact, if any, of fee waivers or reimbursements by the Adviser and/or affiliated service providers. |
^ | Annualized for periods less than one year. |
# | Not annualized for periods less than one year. |
* | Commencement of operations. |
(3) | The voluntary waiver, based on average net assets, amounted to 0.88%, 0.70%, 0.55%, and 0.38% for the periods ended 12/30/16, 12/31/17, 7/31/18, and 7/31/19, respectively. |
|
Total return represents the rate that an investor would have earned or lost on an investment in the Fund assuming reinvestment of all dividends and distributions. |
|
The accompanying notes are an integral part of these financial statements. |
INTEGRITY GROWTH & INCOME FUND CLASS A
Selected per share data and ratios for the periods indicated
| | | | Seven | | | | | | | | |
| | Year | | Months | | Year | | Year | | Year | | Year |
| | Ended | | Ended | | Ended | | Ended | | Ended | | Ended |
| | 7/31/19 | | 7/31/18 | | 12/31/17 | | 12/30/16 | | 12/31/15 | | 12/31/14 |
NET ASSET VALUE, BEGINNING OF PERIOD | $ | 56.62 | | $ | 53.51 | | $ | 48.38 | | $ | 45.07 | | $ | 47.03 | | $ | 49.05 |
| | | | | | | | | | | | | | | | | |
Income (loss) from investment operations: | | | | | | | | | | | | | | | | | |
Net investment income (loss) | $ | 0.62 | | $ | 0.27 | | $ | 0.58 | | $ | 0.71 | | $ | 0.35 | | $ | 0.32 |
Net realized and unrealized gain (loss) on investments (1) | | 5.57 | | | 2.84 | | | 8.46 | | | 3.72 | | | (1.33) | | | 2.71 |
Total from investment operations | $ | 6.19 | | $ | 3.11 | | $ | 9.04 | | $ | 4.43 | | $ | (0.98) | | $ | 3.03 |
| | | | | | | | | | | | | | | | | |
Less Distributions: | | | | | | | | | | | | | | | | | |
Dividends from net investment income | $ | (0.32) | | $ | 0.00 | | $ | (0.58) | | $ | (0.71) | | $ | (0.35) | | $ | (0.32) |
Distributions from net realized gains | | (2.94) | | | 0.00 | | | (3.33) | | | (0.41) | | | (0.63) | | | (4.73) |
Total distributions | $ | (3.26) | | $ | 0.00 | | $ | (3.91) | | $ | (1.12) | | $ | (0.98) | | $ | (5.05) |
| | | | | | | | | | | | | | | | | |
NET ASSET VALUE, END OF PERIOD | $ | 59.55 | | $ | 56.62 | | $ | 53.51 | | $ | 48.38 | | $ | 45.07 | | $ | 47.03 |
| | | | | | | | | | | | | | | | | |
Total Return (excludes any applicable sales charge) # | 12.21% | | 5.81% | | 18.68% | | 9.81% | | (2.10%) | | 6.01% |
| | | | | | | | | | | | | | | | | |
RATIOS/SUPPLEMENTAL DATA | | | | | | | | | | | | | | | | | |
Net assets, end of period (in thousands) | $37,464 | | $34,948 | | $34,600 | | $32,933 | | $35,689 | | $36,187 |
Ratio of expenses to average net assets after waivers ^ (2) | 1.25% | | 1.25% | | 1.25% | | 1.25% | | 1.25% | | 1.25% |
Ratio of expenses to average net assets before waivers ^ | 1.93% | | 1.93% | | 1.95% | | 1.92% | | 1.84% | | 1.80% |
Ratio of net investment income to average net assets ^ (2) | 1.11% | | 0.85% | | 1.07% | | 1.40% | | 0.77% | | 0.64% |
Portfolio turnover rate # | 14.11% | | 5.99% | | 32.42% | | 50.94% | | 49.88% | | 73.25% |
(1) | Net realized and unrealized gain/(loss) per share are balancing amounts necessary to reconcile the change in net asset value per share for the period, and may not reconcile with the aggregate gains and losses in the statement of operations due to share transactions for the period. |
(2) | This row reflects the impact, if any, of fee waivers or reimbursements by the Adviser and/or affiliated service providers. |
^ | Annualized for periods less than one year. |
# | Not annualized for periods less than one year. |
|
Total return represents the rate that an investor would have earned or lost on an investment in the Fund assuming reinvestment of all dividends and distributions. |
|
The accompanying notes are an integral part of these financial statements. |
INTEGRITY GROWTH & INCOME FUND CLASS C
Selected per share data and ratios for the periods indicated
| | | | | Seven | | | | | | Period |
| | | Year | | Months | | Year | | Year | | From |
| | | Ended | | Ended | | Ended | | Ended | | 8/3/15* to |
| | | 7/31/19 | | 7/31/18 | | 12/31/17 | | 12/30/16 | | 12/31/15 |
NET ASSET VALUE, BEGINNING OF PERIOD | | $ | 56.45 | | $ | 53.49 | | $ | 48.38 | | $ | 45.01 | | $ | 49.50 |
| | | | | | | | | | | | | | | |
Income (loss) from investment operations: | | | | | | | | | | | | | | | |
Net investment income (loss) | | $ | 0.75 | | $ | 0.12 | | $ | 0.17 | | $ | 0.37 | | $ | 0.27 |
Net realized and unrealized gain (loss) on investments (1) | | | 5.14 | | | 2.84 | | | 8.44 | | | 3.78 | | | (3.86) |
Total from investment operations | | $ | 5.89 | | $ | 2.96 | | $ | 8.61 | | $ | 4.15 | | $ | (3.59) |
| | | | | | | | | | | | | | | |
Less Distributions: | | | | | | | | | | | | | | | |
Dividends from net investment income | | $ | (0.45) | | $ | 0.00 | | $ | (0.17) | | $ | (0.37) | | $ | (0.27) |
Distributions from net realized gains | | | (2.94) | | | 0.00 | | | (3.33) | | | (0.41) | | | (0.63) |
Total distributions | | $ | (3.39) | | $ | 0.00 | | $ | (3.50) | | $ | (0.78) | | $ | (0.90) |
| | | | | | | | | | | | | | | |
NET ASSET VALUE, END OF PERIOD | | $ | 58.95 | | $ | 56.45 | | $ | 53.49 | | $ | 48.38 | | $ | 45.01 |
| | | | | | | | | | | | | | | |
Total Return (excludes any applicable sales charge) # | | 11.74% | | 5.53% | | 17.79% | | 9.18% | | (7.25%) |
| | | | | | | | | | | | | | | |
RATIOS/SUPPLEMENTAL DATA | | | | | | | | | | | | | | | |
Net assets, end of period (in thousands) | | $248 | | $195 | | $225 | | $182 | | $168 |
Ratio of expenses to average net assets after waivers ^ (2) | | 1.68% | | 1.70% | | 2.00% | | 2.00% | | 2.00% |
Ratio of expenses to average net assets before waivers ^ | | 1.68% | | 1.74% | | 2.70% | | 2.68% | | 2.66% |
Ratio of net investment income (loss) to average net assets ^ (2) | | 1.36% | | 0.39% | | 0.33% | | 0.64% | | (0.01%) |
Portfolio turnover rate # | | 14.11% | | 5.99% | | 32.42% | | 50.94% | | 49.88% |
(1) | Net realized and unrealized gain/(loss) per share are balancing amounts necessary to reconcile the change in net asset value per share for the period, and may not reconcile with the aggregate gains and losses in the statement of operations due to share transactions for the period. |
(2) | This row reflects the impact, if any, of fee waivers or reimbursements by the Adviser and/or affiliated service providers. |
^ | Annualized for periods less than one year. |
# | Not annualized for periods less than one year. |
* | Commencement of operations. |
| |
Total return represents the rate that an investor would have earned or lost on an investment in the Fund assuming reinvestment of all dividends and distributions. |
|
The accompanying notes are an integral part of these financial statements. |
INTEGRITY GROWTH & INCOME FUND CLASS I
Selected per share data and ratios for the periods indicated
| | | | | Seven | | | | Period |
| | | Year | | Months | | Year | | From |
| | | Ended | | Ended | | Ended | | 8/1/16* to |
| | | 7/31/19 | | 7/31/18 | | 12/31/17 | | 12/30/16 |
NET ASSET VALUE, BEGINNING OF PERIOD | | $ | 56.68 | | $ | 53.49 | | $ | 48.36 | | $ | 48.11 |
| | | | | | | | | | | | |
Income (loss) from investment operations: | | | | | | | | | | | | |
Net investment income (loss) | | $ | 0.76 | | $ | 0.34 | | $ | 0.72 | | $ | 0.80 |
Net realized and unrealized gain (loss) on investments (1) | | | 5.58 | | | 2.85 | | | 8.46 | | | 0.66 |
Total from investment operations | | $ | 6.34 | | $ | 3.19 | | $ | 9.18 | | $ | 1.46 |
| | | | | | | | | | | | |
Less Distributions: | | | | | | | | | | | | |
Dividends from net investment income | | $ | (0.47) | | $ | 0.00 | | $ | (0.72) | | $ | (0.80) |
Distributions from net realized gains | | | (2.94) | | | 0.00 | | | (3.33) | | | (0.41) |
Total distributions | | $ | (3.41) | | $ | 0.00 | | $ | (4.05) | | $ | (1.21) |
| | | | | | | | | | | | |
NET ASSET VALUE, END OF PERIOD | | $ | 59.61 | | $ | 56.68 | | $ | 53.49 | | $ | 48.36 |
| | | | | | | | | | | | |
Total Return (excludes any applicable sales charge) # | | 12.51% | | 5.96% | | 18.96% | | 3.04% |
| | | | | | | | | | | | |
RATIOS/SUPPLEMENTAL DATA | | | | | | | | | | | | |
Net assets, end of period (in thousands) | | $1,544 | | $741 | | $690 | | $228 |
Ratio of expenses to average net assets after waivers ^ (2) | | 1.00% | | 1.00% | | 1.00% | | 1.00% |
Ratio of expenses to average net assets before waivers ^ | | 1.68% | | 1.68% | | 1.69% | | 1.70% |
Ratio of net investment income to average net assets ^ (2) | | 1.36% | | 1.08% | | 1.30% | | 1.50% |
Portfolio turnover rate # | | 14.11% | | 5.99% | | 32.42% | | 50.94% |
(1) | Net realized and unrealized gain/(loss) per share are balancing amounts necessary to reconcile the change in net asset value per share for the period, and may not reconcile with the aggregate gains and losses in the statement of operations due to share transactions for the period. |
(2) | This row reflects the impact, if any, of fee waivers or reimbursements by the Adviser and/or affiliated service providers. |
^ | Annualized for periods less than one year. |
# | Not annualized for periods less than one year. |
* | Commencement of operations. |
|
Total return represents the rate that an investor would have earned or lost on an investment in the Fund assuming reinvestment of all dividends and distributions. |
|
The accompanying notes are an integral part of these financial statements. |
INTEGRITY HIGH INCOME FUND CLASS A
Selected per share data and ratios for the periods indicated
| | | | Seven | | | | | | | | |
| | Year | | Months | | Year | | Year | | Year | | Year |
| | Ended | | Ended | | Ended | | Ended | | Ended | | Ended |
| | 7/31/19 | | 7/31/18 | | 12/31/17 | | 12/30/16 | | 12/31/15 | | 12/31/14 |
NET ASSET VALUE, BEGINNING OF PERIOD | $ | 7.66 | | $ | 7.80 | | $ | 7.66 | | $ | 7.03 | | $ | 7.75 | | $ | 8.02 |
| | | | | | | | | | | | | | | | | |
Income (loss) from investment operations: | | | | | | | | | | | | | | | | | |
Net investment income (loss) | $ | 0.39 | | $ | 0.23 | | $ | 0.37 | | $ | 0.39 | | $ | 0.40 | | $ | 0.42 |
Net realized and unrealized gain (loss) on investments (1) | | 0.11 | | | (0.14) | | | 0.14 | | | 0.63 | | | (0.72) | | | (0.27) |
Total from investment operations | $ | 0.50 | | $ | 0.09 | | $ | 0.51 | | $ | 1.02 | | $ | (0.32) | | $ | 0.15 |
| | | | | | | | | | | | | | | | | |
Less Distributions: | | | | | | | | | | | | | | | | | |
Dividends from net investment income | $ | (0.39) | | $ | (0.23) | | $ | (0.37) | | $ | (0.39) | | $ | (0.40) | | $ | (0.42) |
Total distributions | $ | (0.39) | | $ | (0.23) | | $ | (0.37) | | $ | (0.39) | | $ | (0.40) | | $ | (0.42) |
| | | | | | | | | | | | | | | | | |
NET ASSET VALUE, END OF PERIOD | $ | 7.77 | | $ | 7.66 | | $ | 7.80 | | $ | 7.66 | | $ | 7.03 | | $ | 7.75 |
| | | | | | | | | | | | | | | | | |
Total Return (excludes any applicable sales charge) # | 6.74% | | 1.21% | | 6.78% | | 14.90% | | (4.43%) | | 1.84% |
| | | | | | | | | | | | | | | | | |
RATIOS/SUPPLEMENTAL DATA | | | | | | | | | | | | | | | | | |
Net assets, end of period (in thousands) | $24,704 | | $24,099 | | $24,628 | | $25,524 | | $24,338 | | $28,221 |
Ratio of expenses to average net assets after waivers ^ (2) | 0.89% | | 0.89% | | 1.13% | | 1.15% | | 1.15% | | 1.15% |
Ratio of expenses to average net assets before waivers ^ | 1.74% | | 1.73% | | 1.71% | | 1.72% | | 1.66% | | 1.63% |
Ratio of net investment income to average net assets ^ (2) | 5.10% | | 5.18% | | 4.80% | | 5.34% | | 5.20% | | 5.25% |
Portfolio turnover rate # | 28.24% | | 16.50% | | 29.22% | | 27.61% | | 40.85% | | 34.86% |
(1) | Net realized and unrealized gain/(loss) per share are balancing amounts necessary to reconcile the change in net asset value per share for the period, and may not reconcile with the aggregate gains and losses in the statement of operations due to share transactions for the period. |
(2) | This row reflects the impact, if any, of fee waivers or reimbursements by the Adviser and/or affiliated service providers. |
^ | Annualized for periods less than one year. |
# | Not annualized for periods less than one year. |
|
Total return represents the rate that an investor would have earned or lost on an investment in the Fund assuming reinvestment of all dividends and distributions. |
|
The accompanying notes are an integral part of these financial statements. |
INTEGRITY HIGH INCOME FUND CLASS C
Selected per share data and ratios for the periods indicated
| | | | Seven | | | | | | | | |
| | Year | | Months | | Year | | Year | | Year | | Year |
| | Ended | | Ended | | Ended | | Ended | | Ended | | Ended |
| | 7/31/19 | | 7/31/18 | | 12/31/17 | | 12/30/16 | | 12/31/15 | | 12/31/14 |
NET ASSET VALUE, BEGINNING OF PERIOD | $ | 7.68 | | $ | 7.82 | | $ | 7.68 | | $ | 7.05 | | $ | 7.77 | | $ | 8.04 |
| | | | | | | | | | | | | | | | | |
Income (loss) from investment operations: | | | | | | | | | | | | | | | | | |
Net investment income (loss) | $ | 0.33 | | $ | 0.20 | | $ | 0.31 | | $ | 0.34 | | $ | 0.34 | | $ | 0.36 |
Net realized and unrealized gain (loss) on investments (1) | | 0.10 | | | (0.14) | | | 0.14 | | | 0.63 | | | (0.72) | | | (0.27) |
Total from investment operations | $ | 0.43 | | $ | 0.06 | | $ | 0.45 | | $ | 0.97 | | $ | (0.38) | | $ | 0.09 |
| | | | | | | | | | | | | | | | | |
Less Distributions: | | | | | | | | | | | | | | | | | |
Dividends from net investment income | $ | (0.33) | | $ | (0.20) | | $ | (0.31) | | $ | (0.34) | | $ | (0.34) | | $ | (0.36) |
Total distributions | $ | (0.33) | | $ | (0.20) | | $ | (0.31) | | $ | (0.34) | | $ | (0.34) | | $ | (0.36) |
| | | | | | | | | | | | | | | | | |
NET ASSET VALUE, END OF PERIOD | $ | 7.78 | | $ | 7.68 | | $ | 7.82 | | $ | 7.68 | | $ | 7.05 | | $ | 7.77 |
| | | | | | | | | | | | | | | | | |
Total Return (excludes any applicable sales charge) # | 5.81% | | 0.78% | | 5.98% | | 14.02% | | (5.12%) | | 1.08% |
| | | | | | | | | | | | | | | | | |
RATIOS/SUPPLEMENTAL DATA | | | | | | | | | | | | | | | | | |
Net assets, end of period (in thousands) | $4,329 | | $4,813 | | $5,397 | | $5,293 | | $5,670 | | $9,343 |
Ratio of expenses to average net assets after waivers ^ (2) | 1.64% | | 1.64% | | 1.88% | | 1.90% | | 1.90% | | 1.90% |
Ratio of expenses to average net assets before waivers ^ | 2.49% | | 2.48% | | 2.46% | | 2.47% | | 2.40% | | 2.38% |
Ratio of net investment income to average net assets ^ (2) | 4.35% | | 4.43% | | 4.03% | | 4.59% | | 4.43% | | 4.51% |
Portfolio turnover rate # | 28.24% | | 16.50% | | 29.22% | | 27.61% | | 40.85% | | 34.86% |
(1) | Net realized and unrealized gain/(loss) per share are balancing amounts necessary to reconcile the change in net asset value per share for the period, and may not reconcile with the aggregate gains and losses in the statement of operations due to share transactions for the period. |
(2) | This row reflects the impact, if any, of fee waivers or reimbursements by the Adviser and/or affiliated service providers. |
^ | Annualized for periods less than one year. |
# | Not annualized for periods less than one year. |
|
Total return represents the rate that an investor would have earned or lost on an investment in the Fund assuming reinvestment of all dividends and distributions. |
|
The accompanying notes are an integral part of these financial statements. |
INTEGRITY HIGH INCOME FUND CLASS I
Selected per share data and ratios for the periods indicated
| | | | | Seven | | | | Period |
| | | Year | | Months | | Year | | From |
| | | Ended | | Ended | | Ended | | 8/1/16* to |
| | | 7/31/19 | | 7/31/18 | | 12/31/17 | | 12/30/16 |
NET ASSET VALUE, BEGINNING OF PERIOD | | $ | 7.66 | | $ | 7.80 | | $ | 7.65 | | $ | 7.52 |
| | | | | | | | | | | | |
Income (loss) from investment operations: | | | | | | | | | | | | |
Net investment income (loss) | | $ | 0.41 | | $ | 0.24 | | $ | 0.39 | | $ | 0.16 |
Net realized and unrealized gain (loss) on investments (1) | | | 0.10 | | | (0.14) | | | 0.15 | | | 0.13 |
Total from investment operations | | $ | 0.51 | | $ | 0.10 | | $ | 0.54 | | $ | 0.29 |
| | | | | | | | | | | | |
Less Distributions: | | | | | | | | | | | | |
Dividends from net investment income | | $ | (0.41) | | $ | (0.24) | | $ | (0.39) | | $ | (0.16) |
Total distributions | | $ | (0.41) | | $ | (0.24) | | $ | (0.39) | | $ | (0.16) |
| | | | | | | | | | | | |
NET ASSET VALUE, END OF PERIOD | | $ | 7.76 | | $ | 7.66 | | $ | 7.80 | | $ | 7.65 |
| | | | | | | | | | | | |
Total Return (excludes any applicable sales charge) # | | 6.87% | | 1.36% | | 7.19% | | 3.93% |
| | | | | | | | | | | | |
RATIOS/SUPPLEMENTAL DATA | | | | | | | | | | | | |
Net assets, end of period (in thousands) | | $9,023 | | $2,709 | | $2,598 | | $648 |
Ratio of expenses to average net assets after waivers ^ (2) | | 0.64% | | 0.64% | | 0.87% | | 0.90% |
Ratio of expenses to average net assets before waivers ^ | | 1.49% | | 1.48% | | 1.46% | | 1.49% |
Ratio of net investment income to average net assets ^ (2) | | 5.35% | | 5.43% | | 5.04% | | 5.18% |
Portfolio turnover rate # | | 28.24% | | 16.50% | | 29.22% | | 27.61% |
(1) | Net realized and unrealized gain/(loss) per share are balancing amounts necessary to reconcile the change in net asset value per share for the period, and may not reconcile with the aggregate gains and losses in the statement of operations due to share transactions for the period. |
(2) | This row reflects the impact, if any, of fee waivers or reimbursements by the Adviser and/or affiliated service providers. |
^ | Annualized for periods less than one year. |
# | Not annualized for periods less than one year. |
* | Commencement of operations. |
| |
Total return represents the rate that an investor would have earned or lost on an investment in the Fund assuming reinvestment of all dividends and distributions. |
|
The accompanying notes are an integral part of these financial statements. |
WILLISTON BASIN/MID-NORTH AMERICA STOCK FUND CLASS A
Selected per share data and ratios for the periods indicated
| | | | Seven | | | | | | | | |
| | Year | | Months | | Year | | Year | | Year | | Year |
| | Ended | | Ended | | Ended | | Ended | | Ended | | Ended |
| | 7/31/19 | | 7/31/18 | | 12/31/17 | | 12/30/16 | | 12/31/15 | | 12/31/14 |
NET ASSET VALUE, BEGINNING OF PERIOD | $ | 5.60 | | $ | 5.48 | | $ | 5.93 | | $ | 4.31 | | $ | 5.80 | | $ | 6.84 |
| | | | | | | | | | | | | | | | | |
Income (loss) from investment operations: | | | | | | | | | | | | | | | | | |
Net investment income (loss) | $ | 0.04 | | $ | 0.01 | | $ | 0.01 | | $ | 0.01 | | $ | 0.03 | | $ | 0.00 |
Net realized and unrealized gain (loss) on investments (1) | | (1.34) | | | 0.11 | | | (0.45) | | | 1.62 | | | (1.49) | | | (0.78) |
Total from investment operations | $ | (1.30) | | $ | 0.12 | | $ | (0.44) | | $ | 1.63 | | $ | (1.46) | | $ | (0.78) |
| | | | | | | | | | | | | | | | | |
Less Distributions: | | | | | | | | | | | | | | | | | |
Dividends from net investment income | $ | (0.02) | | $ | 0.00 | | $ | (0.01) | | $ | (0.01) | | $ | (0.03) | | $ | 0.00 |
Distributions from net realized gains | | 0.00 | | | 0.00 | | | 0.00 | | | 0.00 | | | 0.00 | | | (0.26) |
Total distributions | $ | (0.02) | | $ | 0.00 | | $ | (0.01) | | $ | (0.01) | | $ | (0.03) | | $ | (0.26) |
| | | | | | | | | | | | | | | | | |
NET ASSET VALUE, END OF PERIOD | $ | 4.28 | | $ | 5.60 | | $ | 5.48 | | $ | 5.93 | | $ | 4.31 | | $ | 5.80 |
| | | | | | | | | | | | | | | | | |
Total Return (excludes any applicable sales charge) # | (23.11%) | | 2.19% | | (7.48%) | | 37.82% | | (25.16%) | | (11.43%) |
| | | | | | | | | | | | | | | | | |
RATIOS/SUPPLEMENTAL DATA | | | | | | | | | | | | | | | | | |
Net assets, end of period (in thousands) | $158,438 | | $282,793 | | $339,385 | | $592,629 | | $490,052 | | $757,507 |
Ratio of expenses to average net assets after waivers ^ (2) | 1.50% | | 1.49% | | 1.47% | | 1.46% | | 1.44% | | 1.39% |
Ratio of expenses to average net assets before waivers ^ | 1.53% | | 1.49% | | 1.47% | | 1.47% | | 1.44% | | 1.39% |
Ratio of net investment income (loss) to average net assets ^ (2) | 0.79% | | 0.19% | | 0.15% | | 0.17% | | 0.52% | | (0.02%) |
Portfolio turnover rate # | 70.73% | | 43.01% | | 41.31% | | 55.17% | | 63.76% | | 67.68% |
(1) | Net realized and unrealized gain/(loss) per share are balancing amounts necessary to reconcile the change in net asset value per share for the period, and may not reconcile with the aggregate gains and losses in the statement of operations due to share transactions for the period. |
(2) | This row reflects the impact, if any, of fee waivers or reimbursements by the Adviser and/or affiliated service providers. |
^ | Annualized for periods less than one year. |
# | Not annualized for periods less than one year. |
| |
Total return represents the rate that an investor would have earned or lost on an investment in the Fund assuming reinvestment of all dividends and distributions. |
|
The accompanying notes are an integral part of these financial statements. |
WILLISTON BASIN/MID-NORTH AMERICA STOCK FUND CLASS C
Selected per share data and ratios for the periods indicated
| | | | Seven | | | | | | | | Period |
| | Year | | Months | | Year | | Year | | Year | | From |
| | Ended | | Ended | | Ended | | Ended | | Ended | | 5/1/14* to |
| | 7/31/19 | | 7/31/18 | | 12/31/17 | | 12/30/16 | | 12/31/15 | | 12/31/14 |
NET ASSET VALUE, BEGINNING OF PERIOD | $ | 5.53 | | $ | 5.43 | | $ | 5.89 | | $ | 4.30 | | $ | 5.79 | | $ | 7.45 |
| | | | | | | | | | | | | | | | | |
Income (loss) from investment operations: | | | | | | | | | | | | | | | | | |
Net investment income (loss) | | 0.01 | | $ | (0.01) | | $ | (0.02) | | $ | (0.02) | | $ | 0.01 | | $ | (0.01) |
Net realized and unrealized gain (loss) on investments(1) | | (1.31) | | | 0.11 | | | (0.44) | | | 1.61 | | | (1.49) | | | (1.39) |
Total from investment operations | $ | (1.30) | | $ | 0.10 | | $ | (0.46) | | $ | 1.59 | | $ | (1.48) | | $ | (1.40) |
| | | | | | | | | | | | | | | | | |
Less Distributions: | | | | | | | | | | | | | | | | | |
Dividends from net investment income | | 0.00 | | $ | 0.00 | | $ | 0.00 | | $ | 0.00 | | $ | (0.01) | | $ | 0.00 |
Distributions from net realized gains | | 0.00 | | | 0.00 | | | 0.00 | | | 0.00 | | | 0.00 | | | (0.26) |
Total distributions | $ | 0.00 | | $ | 0.00 | | $ | 0.00 | | $ | 0.00 | | $ | (0.01) | | $ | (0.26) |
| | | | | | | | | | | | | | | | | |
NET ASSET VALUE, END OF PERIOD | $ | 4.23 | | $ | 5.53 | | $ | 5.43 | | $ | 5.89 | | $ | 4.30 | | $ | 5.79 |
| | | | | | | | | | | | | | | | | |
Total Return (excludes any applicable sales charge) # | (23.51%) | | 1.84% | | (7.81%) | | 36.98% | | (25.52%) | | (18.82%) |
| | | | | | | | | | | | | | | | | |
RATIOS/SUPPLEMENTAL DATA | | | | | | | | | | | | | | | | | |
Net assets, end of period (in thousands) | $17,463 | | $31,899 | | $37,629 | | $51,909 | | $38,170 | | $30,809 |
Ratio of expenses to average net assets after waivers ^(2) | 2.00% | | 1.99% | | 1.97% | | 1.96% | | 1.94% | | 1.89% |
Ratio of expenses to average net assets before waivers ^ | 2.03% | | 1.99% | | 1.97% | | 1.97% | | 1.94% | | 1.89% |
Ratio of net investment income (loss) to average net assets ^ (2) | 0.29% | | (0.32%) | | (0.34%) | | (0.33%) | | 0.03% | | (0.52%) |
Portfolio turnover rate # | 70.73% | | 43.01% | | 41.31% | | 55.17% | | 63.76% | | 67.68% |
(1) | Net realized and unrealized gain/(loss) per share are balancing amounts necessary to reconcile the change in net asset value per share for the period, and may not reconcile with the aggregate gains and losses in the statement of operations due to share transactions for the period. |
(2) | This row reflects the impact, if any, of fee waivers or reimbursements by the Adviser and/or affiliated service providers. |
^ | Annualized for periods less than one year. |
# | Not annualized for periods less than one year. |
* | Commencement of operations. |
|
Total return represents the rate that an investor would have earned or lost on an investment in the Fund assuming reinvestment of all dividends and distributions. |
|
The accompanying notes are an integral part of these financial statements. |
WILLISTON BASIN/MID-NORTH AMERICA STOCK FUND CLASS I
Selected per share data and ratios for the periods indicated
| | | | | Seven | | | | Period |
| | | Year | | Months | | Year | | From |
| | | Ended | | Ended | | Ended | | 8/1/16* to |
| | | 7/31/19 | | 7/31/18 | | 12/31/17 | | 12/30/16 |
NET ASSET VALUE, BEGINNING OF PERIOD | | $ | 5.60 | | $ | 5.47 | | $ | 5.92 | | $ | 4.74 |
| | | | | | | | | | | | |
Income (loss) from investment operations: | | | | | | | | | | | | |
Net investment income (loss) | | $ | 0.06 | | $ | 0.02 | | $ | 0.04 | | $ | 0.03 |
Net realized and unrealized gain (loss) on investments(1) | | | (1.35) | | | 0.11 | | | (0.45) | | | 1.19 |
Total from investment operations | | $ | (1.29) | | $ | 0.13 | | $ | (0.41) | | $ | 1.22 |
| | | | | | | | | | | | |
Less Distributions: | | | | | | | | | | | | |
Dividends from net investment income | | $ | (0.05) | | $ | 0.00 | | $ | (0.04) | | $ | (0.03) |
Returns of capital | | | 0.00 | | | 0.00 | | | 0.00 | | | (0.01) |
Total distributions | | $ | (0.05) | | $ | 0.00 | | $ | (0.04) | | $ | (0.04) |
| | | | | | | | | | | | |
NET ASSET VALUE, END OF PERIOD | | $ | 4.26 | | $ | 5.60 | | $ | 5.47 | | $ | 5.92 |
| | | | | | | | | | | | |
Total Return (excludes any applicable sales charge) # | | (22.84%) | | 2.38% | | (6.92%) | | 25.66% |
| | | | | | | | | | | | |
RATIOS/SUPPLEMENTAL DATA | | | | | | | | | | | | |
Net assets, end of period (in thousands) | | $20,898 | | $44,757 | | $60,562 | | $14,891 |
Ratio of expenses to average net assets after waivers ^ (2) | | 1.00% | | 0.99% | | 0.97% | | 0.97% |
Ratio of expenses to average net assets before waivers ^ | | 1.03% | | 0.99% | | 0.97% | | 0.97% |
Ratio of net investment income to average net assets ^ (2) | | 1.29% | | 0.69% | | 0.71% | | 0.67% |
Portfolio turnover rate # | | 70.73% | | 43.01% | | 41.31% | | 55.17% |
(1) | Net realized and unrealized gain/(loss) per share are balancing amounts necessary to reconcile the change in net asset value per share for the period, and may not reconcile with the aggregate gains and losses in the statement of operations due to share transactions for the period. |
(2) | This row reflects the impact, if any, of fee waivers or reimbursements by the Adviser and/or affiliated service providers. |
^ | Annualized for periods less than one year. |
# | Not annualized for periods less than one year. |
* | Commencement of operations. |
|
Total return represents the rate that an investor would have earned or lost on an investment in the Fund assuming reinvestment of all dividends and distributions. |
|
The accompanying notes are an integral part of these financial statements. |
REPORT OF INDEPENDENT REGISTERED PUBLIC ACCOUNTING FIRM
To the Shareholders and Board of Trustees of
The Integrity Funds
Opinion on the Financial Statements
We have audited the accompanying statements of assets and liabilities, including the schedules of investments, of The Integrity Funds, comprising Integrity Dividend Harvest Fund, Integrity Energized Dividend Fund, Integrity Growth & Income Fund, Integrity High Income Fund, and Williston Basin/Mid- North America Stock Fund (the “Funds”), as of July 31, 2019, and the related statements of operations for the year then ended, the statements of changes in net assets for the year ended July 31, 2019, the seven months ended July 31, 2018, and the year ended December 31, 2017, including the related notes, and the financial highlights for each of the six periods in the period then ended (collectively referred to as the “financial statements”). In our opinion, the financial statements present fairly, in all material respects, the financial position of each of the Funds as of July 31, 2019, the results of their operations for the year then ended and the changes in their net assets and the financial highlights for each of the periods indicated in the period then ended, in conformity with accounting principles generally accepted in the United States of America.
Basis for Opinion
These financial statements are the responsibility of the Funds’ management. Our responsibility is to express an opinion on the Funds’ financial statements based on our audits. We are a public accounting firm registered with the Public Company Accounting Oversight Board (United States) (“PCAOB”) and are required to be independent with respect to the Funds in accordance with the U.S. federal securities laws and the applicable rules and regulations of the Securities and Exchange Commission and the PCAOB.
We conducted our audits in accordance with the standards of the PCAOB. Those standards require that we plan and perform the audit to obtain reasonable assurance about whether the financial statements are free of material misstatement, whether due to error or fraud.
Our audits included performing procedures to assess the risks of material misstatement of the financial statements, whether due to error or fraud, and performing procedures that respond to those risks. Such procedures included examining, on a test basis, evidence regarding the amounts and disclosures in the financial statements. Our procedures included confirmation of securities owned as of July 31, 2019, by correspondence with the custodian and brokers or by other appropriate auditing procedures where replies from brokers were not received. Our audits also included evaluating the accounting principles used and significant estimates made by management, as well as evaluating the overall presentation of the financial statements. We believe that our audits provide a reasonable basis for our opinion.
We have served as the auditor of one or more investment companies advised by Viking Fund Management since 2009.

COHEN & COMPANY, LTD.
Chicago, Illinois
September 30, 2019
EXPENSE EXAMPLE (unaudited)
As a shareholder of the Funds, you incur two types of costs: (1) transaction costs, including sales charges (loads), redemption fees and exchange fees; and (2) ongoing costs, including management fees, distribution (12b-1) fees and other Funds expenses. This example is intended to help you understand your ongoing costs (in dollars) of investing in the Fund and to compare these costs with the ongoing costs of investing in other mutual funds. The example is based on an investment of $1,000 invested at the beginning of the one-half year period shown below and held for the entire one-half year period.
The section in the table under the heading “Actual” provides information about actual account values and actual expenses. You may use the information in these columns together with the amount you invested to estimate the expenses that you paid over the period. Simply divide your account value by $1,000 (for example, an account value of $8,600 divided by $1,000 equals 8.6), then multiply the result by the number in the appropriate column for your share class in the column entitled “Expenses Paid During Period” to estimate the expenses you paid on your account during this period.
The section in the table under the heading “Hypothetical (5% return before expenses)” provides information about hypothetical account values and hypothetical expenses based on the Funds’ actual expense ratios and an assumed rate of return of 5% per year before expenses, which is not the Funds’ actual returns. The hypothetical account values and expenses may not be used to estimate the actual ending account balance or expenses you paid for the period. You may use this information to compare the ongoing costs of investing in the Funds and other funds. To do so, compare this 5% hypothetical example with the 5% hypothetical examples that appear in the shareholder reports of the other funds.
Please note that the expenses shown in the table are meant to highlight your ongoing costs only and do not reflect any transactional costs, such as sales charges (loads), redemption fees, or exchange fees. Therefore, the section in the table under the heading “Hypothetical (5% return before expenses)” is useful in comparing ongoing costs only, and will not help you determine the relative total costs of owning different funds. In addition, if these transactional costs were included, your costs would have been higher.
| | | Beginning | Ending | Expenses | |
| | | Account | Account | Paid | Annualized |
| | | Value | Value | During | Expense |
| | 1/31/19 | 7/31/19 | Period* | Ratio |
Integrity Dividend
Harvest Fund | Actual - Class A | $1,000.00 | $1,000.79 | $4.71 | 0.95% |
Actual - Class C | $1,000.00 | $1,000.75 | $8.43 | 1.70% |
Actual - Class I | $1,000.00 | $1,000.80 | $3.47 | 0.70% |
Hypothetical - Class A | $1,000.00 | $1,020.08 | $4.76 | 0.95% |
Hypothetical - Class C | $1,000.00 | $1,016.36 | $8.50 | 1.70% |
Hypothetical - Class I | $1,000.00 | $1,021.32 | $3.51 | 0.70% |
Integrity Energized
Dividend Fund | Actual - Class A | $1,000.00 | $1,000.17 | $3.32 | 0.67% |
Actual - Class C | $1,000.00 | $1,000.12 | $7.04 | 1.42% |
Actual - Class I | $1,000.00 | $1,000.18 | $2.08 | 0.42% |
Hypothetical - Class A | $1,000.00 | $1,021.47 | $3.36 | 0.67% |
Hypothetical - Class C | $1,000.00 | $1,017.75 | $7.10 | 1.42% |
Hypothetical - Class I | $1,000.00 | $1,022.71 | $2.11 | 0.42% |
Integrity Growth &
Income Fund | Actual - Class A | $1,000.00 | $1,001.39 | $6.20 | 1.25% |
Actual - Class C | $1,000.00 | $1,001.36 | $8.34 | 1.68% |
Actual - Class I | $1,000.00 | $1,001.40 | $4.96 | 1.00% |
Hypothetical - Class A | $1,000.00 | $1,018.60 | $6.26 | 1.25% |
Hypothetical - Class C | $1,000.00 | $1,016.46 | $8.40 | 1.68% |
Hypothetical - Class I | $1,000.00 | $1,019.84 | $5.01 | 1.00% |
Integrity High
Income Fund | Actual - Class A | $1,000.00 | $1,000.54 | $4.41 | 0.89% |
Actual - Class C | $1,000.00 | $1,000.50 | $8.13 | 1.64% |
Actual - Class I | $1,000.00 | $1,000.55 | $3.17 | 0.64% |
Hypothetical - Class A | $1,000.00 | $1,020.38 | $4.46 | 0.89% |
Hypothetical - Class C | $1,000.00 | $1,016.66 | $8.20 | 1.64% |
Hypothetical - Class I | $1,000.00 | $1,021.62 | $3.21 | 0.64% |
Williston Basin/Mid-
North America
Stock Fund | Actual - Class A | $1,000.00 | $999.84 | $7.44 | 1.50% |
Actual - Class C | $1,000.00 | $999.81 | $9.92 | 2.00% |
Actual - Class I | $1,000.00 | $999.84 | $4.96 | 1.00% |
Hypothetical - Class A | $1,000.00 | $1,017.36 | $7.50 | 1.50% |
Hypothetical - Class C | $1,000.00 | $1,014.88 | $9.99 | 2.00% |
Hypothetical - Class I | $1,000.00 | $1,019.84 | $5.01 | 1.00% |
*Expenses are equal to the annualized expense ratio, multiplied by the average account value over the period, multiplied 181 days in the one-half year period, and divided by 365 days in the fiscal year (to reflect the one-half year period). |
BOARD OF TRUSTEES AND OFFICERS (unaudited)
The Board of Trustees (“Board”) of the Funds consists of four Trustees (the “Trustees”). These same individuals, unless otherwise noted, also serve as trustees for the six series of Viking Mutual Funds. Three Trustees are not “interested persons” (75% of the total) as defined under the 1940 Act (the “Independent Trustees”). The remaining Trustee is “interested” (the “Interested Trustees”) by virtue of his affiliation with Viking Fund Management, LLC and its affiliates.”
For the purposes of this section, the “Fund Complex” consists of the five series of The Integrity Funds and the six series of Viking Mutual Funds.
Each Trustee serves a Fund until its termination; or until the Trustee’s retirement, resignation, or death; or otherwise as specified in the Funds’ organizational documents. Each Officer serves an annual term. The tables that follow show information for each Trustee and Officer of the Funds.
INDEPENDENT TRUSTEES | |
Name, Date of Birth, Date Service Began, and Number of Funds Overseen in Fund Complex | Principal Occupations for Past Five Years
and Directorships Held During Past Five Years |
Wade A. Dokken
Birth date: March 3, 1960
Began serving: February 2016
Funds overseen: 11 funds | Principal occupation(s): Member, WealthVest Financial Partners (2009 to present); Co-President, WealthVest Marketing (2009 to present), Trustee: Integrity Managed Portfolios (2016 to 2018), The Integrity Funds (2016 to present), and Viking Mutual Funds (2016 to present) Other Directorships Held: Not Applicable |
R. James Maxson
Birth date: December 12, 1947
Began serving: June 2003
Funds overseen: 11 funds | Principal occupation(s): Attorney: Maxson Law Office P.C. (2002 to present); Trustee: Integrity Managed Portfolios (1999 to 2018), The Integrity Funds (2003 to present), and Viking Mutual Funds (2009 to present) Other Directorships Held: Peoples State Bank of Velva, Minot Community Land Trust |
Jerry M. Stai
Birth date: March 31, 1952
Began serving: January 2006
Funds overseen: 11 funds | Principal occupation(s): Minot State University (1999 to present); Non-Profit Specialist, Bremer Bank (2006 to 2014); Trustee: Integrity Managed Portfolios (2006 to 2018), The Integrity Funds (2006 to present), and Viking Mutual Funds (2009 to present) Other Directorships Held: Not Applicable |
The Statement of Additional Information (“SAI”) contains more information about the Funds’ Trustees and is available without charge upon request, by calling Integrity Funds Distributor at 800-276-1262.
INTERESTED TRUSTEE | |
Name, Position with Trust, Date of Birth, Date Service Began, and Number of Funds Overseen in Fund Complex | Principal Occupations for Past Five Years
and Directorships Held During Past Five Years |
Robert E. Walstad(1)
Chairman
Birth date: August 16, 1944
Began serving: June 2003
Funds overseen: 11 funds | Principal occupation(s): Governor (2009 to present): Corridor Investors, LLC; Trustee and Chairman: Integrity Managed Portfolios (1996 to 2018), The Integrity Funds (2003 to present), and Viking Mutual Funds (2009 to present) Other Directorships Held: Not Applicable |
(1) Trustee who is an “interested person” of the Funds as defined in the 1940 Act. Mr. Walstad is an interested person by virtue of being an Officer of the Funds and ownership in Corridor Investors, LLC the parent company of Viking Fund Management, Integrity Fund Services, and Integrity Fund Distributors.
OTHER OFFICERS | |
Name, Position with Trust, Date of Birth, and Date Service Began | Principal Occupations for Past Five Years
and Directorships Held During Past Five Years |
Shannon D. Radke
President
Birth date: September 7, 1966
Began serving: August 1999 | Principal occupation(s): Governor, CEO, and President (2009 to present): Corridor Investors, LLC; Governor and President (1998 to present) and Senior Portfolio Manager (1999 to present): Viking Fund Management, LLC; Governor and President (2009 to present): Integrity Fund Services, LLC and Integrity Funds Distributor, LLC; President: Integrity Managed Portfolios (2009 to 2018), The Integrity Funds (2009 to present), and Viking Mutual Funds (1999 to present) Other Directorships Held: Not Applicable |
Peter A. Quist
Vice President
Birth date: February 23, 1934
Began serving: June 2003 | Principal occupation(s): Governor (2009 to present): Corridor Investors, LLC; Attorney (inactive); Vice President: Integrity Managed Portfolios (1996 to 2018); The Integrity Funds (2003 to present); and Viking Mutual Funds (2009 to present) Other Directorships Held: Not Applicable |
Adam C. Forthun
Treasurer
Birth date: June 30, 1976
Began serving: May 2008 | Principal occupation(s): Fund Accounting Manager (2008 to 2017) and Chief Operating Officer (2013 to present): Integrity Fund Services, LLC; Treasurer: Integrity Managed Portfolios (2008 to 2018), The Integrity Funds (2008 to present), and Viking Mutual Funds (2009 to present) Other Directorships Held: Not Applicable |
Brent M. Wheeler
Secretary and Mutual Fund
Chief Compliance Officer
Birth date: October 9, 1970
Began serving: MF CCO: October 2005 Secretary: October 2009 | Principal occupation(s): Mutual Fund Chief Compliance Officer: Integrity Managed Portfolios (2005 to 2018), The Integrity Funds, (2005 to present), and Viking Mutual Funds (2009 to present); Secretary: Integrity Managed Portfolios (2009 to 2018), The Integrity Funds and Viking Mutual Funds (2009 to present) Other Directorships Held: Not Applicable |
The SAI contains more information about the Funds’ Trustees and is available without charge upon request, by calling Integrity Funds Distributor at 800-276-1262.
Rev. 11/2017
FACTS | WHAT DOES INTEGRITY VIKING FUNDS DO WITH YOUR PERSONAL INFORMATION? |
| |
Why? | Financial companies choose how they share your personal information. Federal law gives consumers the right to limit some but not all sharing. Federal law also requires us to tell you how we collect, share, and protect your personal information. Please read this notice carefully to understand what we do. |
What? | The types of personal information we collect and share depend on the product or service you have with us. This information can include: · Social Security number, name, address · Account balance, transaction history, account transactions · Investment experience, wire transfer instructions When you are no longer our customer, we continue to share your information as described in this notice. |
How? | All financial companies need to share customers’ personal information to run their everyday business. In the section below, we list the reasons financial companies can share their customers’ personal information; the reasons Integrity Viking Funds chooses to share; and whether you can limit this sharing. |
Reasons we can share your personal information | Does Integrity Viking Funds share? | Can you limit this sharing? |
For our everyday business purposes- such as to process your transactions, maintain your account(s), respond to court orders and legal investigations, or report to credit bureaus | Yes | No |
For our marketing purposes- to offer our products and services to you | Yes | No |
For joint marketing with other financial companies | No | We don’t share |
For our affiliates’ everyday business purposes- information about your transactions and experiences | Yes | No |
For our affiliates’ everyday business purposes- information about your creditworthiness | No | We don’t share |
For non-affiliates to market to you | No | We don’t share |
Questions? | Call 1-800-601-5593 or go to www.integrityvikingfunds.com |
PRIVACY POLICY (Continued)
Who we are |
Who is providing this notice? | Integrity Viking Funds (a family of investment companies) |
What we do |
How does Integrity Viking Funds protect my personal information? | To protect your personal information from unauthorized access and use, we use security measures that comply with federal law. These measures include computer safeguards and secured files and buildings. We · train employees on privacy, information security and protection of client information. · limit access to nonpublic personal information to those employees requiring such information in performing their job functions. |
How does Integrity Viking Funds collect my personal information? | We collect your personal information, for example, when you: · open an account or seek financial or tax advice · provide account information or give us your contact information · make a wire transfer · We also collect your personal information from other companies. |
Why can’t I limit all sharing? | Federal law gives you the right to limit only: · sharing for affiliates’ everyday business purposes-information about your creditworthiness · affiliates from using your information to market to you · sharing for non-affiliates to market to you State laws and individual companies may give you additional rights to limit sharing. |
Definitions |
Affiliates | Companies related by common ownership or control. They can be financial and nonfinancial companies · The Integrity Funds · Viking Mutual Funds · Corridor Investors, LLC · Viking Fund Management, LLC · Integrity Funds Distributor, LLC · Integrity Fund Services, LLC |
Non-affiliates | Companies not related by common ownership or control. They can be financial and nonfinancial companies. Integrity Viking Funds does not share with non-affiliates so they can market to you. |
Joint marketing | A formal agreement between non-affiliated financial companies that together market financial products or services to you. Integrity Viking Funds doesn’t jointly market. |
Integrity Viking Funds includes:
· The Integrity Funds
· Viking Mutual Funds
PROXY VOTING OF FUND PORTFOLIO SECURITIES
A description of the policies and procedures that the Funds use to determine how to vote proxies relating to securities held in the Funds’ portfolios are available, without charge and upon request, by calling 800-276-1262. A report on Form N-PX of how the Funds voted any such proxies during the most recent 12-month period ended June 30 is available through the Funds’ website at www.integrityvikingfunds.com. The information is also available from the Electronic Data Gathering Analysis and Retrieval (“EDGAR”) database on the website of the Securities and Exchange Commission (“SEC”) at www.sec.gov.
QUARTERLY PORTFOLIO SCHEDULE
Within 60 days of the end of their second and fourth fiscal quarters, the Funds provide a complete schedule of portfolio holdings in their semi-annual and annual reports on the Form N-CSR(S). These reports are filed electronically with the SEC and are delivered to the shareholders of the Funds. The Funds also files its complete schedule of portfolio holdings with the SEC for the first and third quarters of each fiscal year on Form N-Q. The Funds’ Forms N-Q and N-CSR(S) are available on the SEC’s website at www.sec.gov. The Funds’ Forms N-Q and N-CSR(S) may be reviewed and copied at the SEC’s Public Reference Room in Washington, D.C. Information on the operation of the Public Reference Room may be obtained by calling 202-551-8090. You may also access this information from the Funds’ website at www.integrityvikingfunds.com.
SHAREHOLDER INQUIRIES AND MAILINGS
Direct inquiries regarding the Funds to: Integrity Funds Distributor, LLC PO Box 500 Minot, ND 58702 Phone: 800-276-1262 | Direct inquiries regarding account information to: Integrity Fund Services, LLC PO Box 759 Minot, ND 58702 Phone: 800-601-5593 |
To reduce their expenses, the Funds may mail only one copy of their prospectus and each annual and semi-annual report to those addresses shared by two or more accounts. If you wish to receive additional copies of these documents, please call Integrity Funds Distributor at 800-276-1262 or contact your financial institution. Integrity Funds Distributor will begin sending you individual copies 30 days after receiving your request.
Integrity Viking Funds are sold by prospectus only. An investor should consider the investment objectives, risks, and charges and expenses of the investment company carefully before investing. The prospectus contains this and other information about the investment company. You may obtain a prospectus at no cost from your financial adviser or at www.integrityvikingfunds.com. Please read the prospectus carefully before investing.

Equity Funds
Integrity Dividend Harvest Fund
Integrity Energized Dividend Fund
Integrity Growth & Income Fund
Williston Basin/Mid-North America Stock Fund
Corporate Bond Fund
Integrity High Income Fund
State-Specific Tax-Exempt Bond Funds
Viking Tax-Free Fund for North Dakota
Viking Tax-Free Fund for Montana
Kansas Municipal Fund
Maine Municipal Fund
Nebraska Municipal Fund
Oklahoma Municipal Fund
Item 2. CODE OF ETHICS.
At the end of the period covered by this report, the registrant has adopted a code of ethics as defined in Item 2 of Form N-CSR that applies to the registrant’s principal executive officer and principal financial officer (herein referred to as the “Code”). There were no amendments to the Code during the period covered by this report. The registrant did not grant any waivers, including implicit waivers, from any provisions of the Code during the period of this report. The Code is available on the Integrity Viking Funds website at http://www.integrityvikingfunds.com. A copy of the Code is also available, without charge, upon request by calling 800-601-5593. The Code is filed herewith pursuant to Item 12(a)(1) as EX-99.CODE ETH.
Item 3. AUDIT COMMITTEE FINANCIAL EXPERT.
The Board of Trustees has determined that Jerry Stai is an audit committee financial expert, as defined in Item 3 of Form N-CSR. Mr. Stai is “independent” for purposes of Item 3 of Form N-CSR.
Item 4. PRINCIPAL ACCOUNTANT FEES AND SERVICES.
| (a) | Audit Fees: The aggregate fees billed for each of the last two fiscal years for professional services rendered by Cohen Fund Audit Services, Ltd. (“Cohen”), the principal accountant for the audit of the registrant’s annual financial statements, for services that are normally provided by the accountant in connection with statutory and regulatory filings or engagements for those fiscal years were $71,546 for the year ended July 31, 2019, $37,306 for the seven months ended July 31, 2018, and $64,600 for the year ended December 31, 2017. |
| | |
| (b) | Audit-Related Fees: The aggregate fees billed in each of the last two fiscal years for assurance and related services by Cohen that are reasonably related to the performance of the audit of the registrant’s financial statements and are not reported under paragraph (a) of this Item were $0 for the year ended July 31, 2019, $0 for the seven months ended July 31, 2018, and $0 for the year ended December 31, 2017. |
| | |
| (c) | Tax Fees: The aggregate fees billed in each of the last two fiscal years for professional services rendered by Cohen for tax compliance, tax advice, and tax planning were $12,500 for the year ended July 31, 2019, $12,500 for the seven months ended July 31, 2018, and $12,500 for the year ended December 31, 2017. Such services included review of excise distribution calculations (if applicable), preparation of the Trust’s federal, state, and excise tax returns, tax services related to mergers, and routine counseling. |
| | |
| (d) | All Other Fees: The aggregate fees billed in each of the last two fiscal years for products and services provided by Cohen, other than the services reported in paragraphs (a) through (c) of this Item: None. |
| | |
| (e) | (1) | Audit Committee Pre-Approval Policies and Procedures |
| | | |
| | | | The registrant’s audit committee has adopted policies and procedures that require the audit committee to pre-approve all audit and non-audit services provided to the registrant by the principal accountant. |
| | | |
| | (2) | Percentage of services referred to in 4(b) through 4(d) that were approved by the audit committee pursuant to paragraph (c)(7)(i)(C) of Rule 2-01 of Regulation S-X |
| | | |
| | | | 0% of the services described in paragraphs (b) through (d) of Item 4 were not pre-approved by the audit committee. |
| | |
| (f) | All services performed on the engagement to audit the registrant’s financial statements for the most recent fiscal year-end were performed by Cohen’s full-time permanent employees. |
| | |
| (g) | Non-Audit Fees: None. |
| | |
| (h) | Principal Accountant’s Independence: The registrant’s auditor did not provide any non-audit services to the registrant’s investment adviser or any entity controlling, controlled by, or controlled with the registrant’s investment adviser that provides ongoing services to the registrant. |
Item 5. AUDIT COMMITTEE OF LISTED REGISTRANTS.
Not applicable
Item 6. INVESTMENTS.
The Schedule of Investments is included as part of the report to shareholders filed under Item 1 of this Form.
Item 7. DISCLOSURE OF PROXY VOTING POLICIES AND PROCEDURES FOR CLOSED-END MANAGEMENT INVESTMENT COMPANIES.
Not applicable
Item 8. PORTFOLIO MANAGERS OF CLOSED-END MANAGEMENT INVESTMENT COMPANIES.
Not applicable
Item 9. PURCHASES OF EQUITY SECURITIES BY CLOSED-END MANAGEMENT INVESTMENT COMPANY AND AFFILIATED PURCHASERS.
Not applicable
Item 10. SUBMISSION OF MATTERS TO A VOTE OF SECURITY HOLDERS.
There have been no material changes to the procedures by which shareholders may recommend nominees to the registrant’s board of trustees in the last fiscal half-year.
Item 11. CONTROLS AND PROCEDURES.
| (a) | Based on their evaluation of the registrant’s disclosure controls and procedures as of a date within 90 days of the filing date of this Form N-CSR (the “Report”), the registrant’s principal executive officer and principal financial officer believe that the disclosure controls and procedures (as defined in Rule 30a-3(c) under the Investment Company Act of 1940, as amended) are effectively designed to ensure that information required to be disclosed by the registrant in the Report is recorded, processed, summarized and reported by the filing date, including ensuring that information required to be disclosed in the Report is accumulated and communicated to the registrant’s principal executive officer and principal financial officer who are making certifications in the Report, as appropriate, to allow timely decisions regarding required disclosure. |
| | |
| (b) | There were no changes in the registrant’s internal control over financial reporting (as defined in Rule 30a-3(d) under the Investment Company Act of 1940) that occurred during the registrant’s most recent fiscal half-year that have materially affected, or are reasonably likely to materially affect, the registrant's internal control over financial reporting. |
Item 12. EXHIBITS.
| (a) | (1) | Code of ethics pursuant to Item 2 of Form N-CSR is filed and attached hereto as EX-99. CODE ETH. |
| | | |
| | (2) | A separate certification for each principal executive officer and principal financial officer of the registrant as required by Rule 30a-2 under the 1940 Act (17 CFR 270.30a-2) is filed and attached hereto as EX-99. CERT. |
| | | |
| | (3) | Not applicable. |
| | |
| (b) | Certifications pursuant to Section 906 of the Sarbanes-Oxley Act of 2002 is filed and attached hereto. |
Pursuant to the requirements of the Securities Exchange Act of 1934 and the Investment Company Act of 1940, the registrant has duly caused this report to be signed on its behalf by the undersigned, thereunto duly authorized.
The Integrity Funds
By: /s/ Shannon D. Radke
Shannon D. Radke
President
October 3, 2019
Pursuant to the requirements of the Securities Exchange Act of 1934 and the Investment Company Act of 1940, this report has been signed below by the following persons on behalf of the registrant and in the capacities and on the dates indicated.
By: /s/ Shannon D. Radke
Shannon D. Radke
President
October 3, 2019
By: /s/ Adam Forthun
Adam Forthun
Treasurer
October 3, 2019