UNITED STATES
SECURITIES AND EXCHANGE COMMISSION
WASHINGTON, D. C. 20549
Form 10-Q
x QUARTERLY REPORT PURSUANT TO SECTION 13 OR 15(d) OF THE SECURITIES EXCHANGE ACT OF 1934
For the quarterly period ended March 31, 2008
o TRANSITION REPORT PURSUANT TO SECTION 13 OR 15(d) OF THE SECURITIES EXCHANGE ACT OF 1934
For the transition period from ____________ to _____________
Commission file number: 0-11576
| HARRIS & HARRIS GROUP, INC. | |
| (Exact Name of Registrant as Specified in Its Charter) | |
| New York | 13-3119827 |
| (State or Other Jurisdiction of | (I.R.S. Employer Identification No.) |
| Incorporation or Organization) | |
111 West 57th Street, New York, New York | 10019 |
| (Address of Principal Executive Offices) | (Zip Code) |
| (212) 582-0900 | |
| (Registrant's Telephone Number, Including Area Code) | |
Indicate by check mark whether the registrant: (1) has filed all reports required to be filed by Section 13 or 15(d) of the Securities Exchange Act of 1934 during the preceding 12 months (or for such shorter period that the registrant was required to file such reports), and (2) has been subject to such filing requirements for the past 90 days.
Yes x No o
Indicate by check mark whether the registrant is a large accelerated filer, an accelerated filer, a non-accelerated filer, or a smaller reporting company. See the definitions of "large accelerated filer," "accelerated filer" and "smaller reporting company" in Rule 12b-2 of the Exchange Act. (Check one):
Large accelerated filer o | Accelerated filer x |
Non-accelerated filer o | Smaller reporting company o |
(Do not check if a smaller reporting company)
Indicate by check mark whether the registrant is a shell company (as defined in Rule 12b-2 of the Exchange Act).
Yes o No x
Indicate the number of shares outstanding of each of the issuer's classes of common stock, as of the latest practicable date.
| Class | Outstanding at May 8, 2008 | |
| Common Stock, $0.01 par value per share | 23,314,573 shares |
Harris & Harris Group, Inc.
Form 10-Q, March 31, 2008
| Page Number | |
| PART I. FINANCIAL INFORMATION | |
| Item 1. Consolidated Financial Statements | 1 |
| Consolidated Statements of Assets and Liabilities | 2 |
| Consolidated Statements of Operations | 3 |
| Consolidated Statements of Cash Flows | 4 |
| Consolidated Statements of Changes in Net Assets | 5 |
| Consolidated Schedule of Investments | 6 |
| Notes to Consolidated Financial Statements | 21 |
| Financial Highlights | 30 |
Item 2. Management's Discussion and Analysis of Financial Condition | |
and Results of Operations | 31 |
| Background and Overview | 31 |
| Results of Operations | 34 |
| Financial Condition | 36 |
| Liquidity | 38 |
| Capital Resources | 38 |
| Critical Accounting Policies | 38 |
| Recent Developments - Portfolio Companies | 40 |
| Forward-Looking Statements | 40 |
Item 3. Quantitative and Qualitative Disclosures About Market Risk | 41 |
Item 4. Controls and Procedures | 42 |
PART II. OTHER INFORMATION | |
Item 1A. Risk Factors | 43 |
Item 6. Exhibits | 43 |
Signatures | 44 |
Exhibit Index | 45 |
2
PART I. FINANCIAL INFORMATION
Item 1. Consolidated Financial Statements
The information furnished in the accompanying consolidated financial statements reflects all adjustments that are, in the opinion of management, necessary for a fair statement of the results for the interim period presented.
Harris & Harris Group, Inc.® (the "Company," "us," "our" and "we"), is an internally managed venture capital company that has elected to operate as a business development company under the Investment Company Act of 1940 (the "1940 Act"). Certain information and disclosures normally included in the consolidated financial statements in accordance with Generally Accepted Accounting Principles have been condensed or omitted as permitted by Regulation S-X and Regulation S-K. The accompanying consolidated financial statements should be read in conjunction with the audited consolidated financial statements and notes thereto for the year ended December 31, 2007, contained in our Annual Report on Form 10-K for the year ended December 31, 2007.
On September 25, 1997, our Board of Directors approved a proposal to seek qualification as a regulated investment company ("RIC") under Subchapter M of the Internal Revenue Code (the "Code"). At that time, we were taxable under Subchapter C of the Code (a "C Corporation"). We filed for the 1999 tax year to elect treatment as a RIC. In order to qualify as a RIC, we must, in general, (1) annually, derive at least 90 percent of our gross income from dividends, interest, gains from the sale of securities and similar sources; (2) quarterly, meet certain investment diversification requirements; and (3) annually, distribute at least 90 percent of our investment company taxable income as a dividend. In addition to the requirement that we must annually distribute at least 90 percent of our investment company taxable income, we may either distribute or retain our taxable net capital gains from investments, but any net capital gains not distributed could be subject to corporate level tax. Further, we could be subject to a four percent excise tax to the extent we fail to distribute at least 98 percent of our annual investment company taxable income and would be subject to income tax to the extent we fail to distribute 100 percent of our investment company taxable income.
Because of the specialized nature of our investment portfolio, we generally can satisfy the diversification requirements under Subchapter M of the Code if we receive a certification from the Securities and Exchange Commission (“SEC”) that we are "principally engaged in the furnishing of capital to other corporations which are principally engaged in the development or exploitation of inventions, technological improvements, new processes, or products not previously generally available."
On June 20, 2007, we received SEC certification for 2006, permitting us to qualify for RIC treatment for 2006 (as we had for the years 1999 through 2005) pursuant to Section 851(e) of the Code. Although the SEC certification for 2006 was issued, there can be no assurance that we will qualify for or receive such certification for subsequent years (to the extent we need additional certification as a result of changes in our portfolio) or that we will actually qualify for Subchapter M treatment in subsequent years. In 2007, we qualified for RIC treatment even without certification. In addition, under certain circumstances, even if we qualified for Subchapter M treatment in a given year, we might take action in a subsequent year to ensure that we would be taxed in that subsequent year as a C Corporation, rather than as a RIC. Because Subchapter M does not permit deduction of operating expenses against long-term capital gains, it is not clear that the Company and its shareholders have paid less taxes since 1999 than they would have paid had the Company remained a C Corporation.
1
HARRIS & HARRIS GROUP, INC. CONSOLIDATED STATEMENTS OF ASSETS AND LIABILITIES |
ASSETS
March 31, 2008(Unaudited) | December 31, 2007 | ||||||
| Investments, in portfolio securities at value | |||||||
| (cost: $84,013,804 and $82,677,528, respectively) | $ | 83,097,863 | $ | 78,110,384 | |||
| Investments, in U.S. Treasury obligations at value | |||||||
| (cost: $52,346,992 and $59,552,933, respectively) | 53,589,100 | 60,193,593 | |||||
| Cash and cash equivalents | 210,154 | 330,009 | |||||
| Restricted funds | 2,520,310 | 2,667,020 | |||||
| Receivable from portfolio company | 0 | 524 | |||||
| Interest receivable | 497,488 | 647,337 | |||||
| Prepaid expenses | 412,589 | 488,667 | |||||
| Other assets | 445,135 | 455,798 | |||||
| Total assets | $ | 140,772,639 | $ | 142,893,332 | |||
LIABILITIES & NET ASSETS
| Accounts payable and accrued liabilities | $ | 4,218,484 | $ | 4,515,463 | |||
| Deferred rent | 12,866 | 14,525 | |||||
| Total liabilities | 4,231,350 | 4,529,988 | |||||
| Net assets | $ | 136,541,289 | $ | 138,363,344 | |||
| Net assets are comprised of: | |||||||
| Preferred stock, $0.10 par value, | |||||||
| 2,000,000 shares authorized; none issued | $ | 0 | $ | 0 | |||
| Common stock, $0.01 par value, 45,000,000 shares authorized at | |||||||
| 3/31/08 and 12/31/07; 25,143,313 issued at | |||||||
| 3/31/08 and 12/31/07 | 251,434 | 251,434 | |||||
| Additional paid in capital (Note 5) | 162,394,671 | 160,927,691 | |||||
| Accumulated net realized loss | (23,025,452 | ) | (15,483,766 | ) | |||
| Accumulated unrealized appreciation (depreciation) | |||||||
| of investments | 326,167 | (3,926,484 | ) | ||||
| Treasury stock, at cost (1,828,740 shares at 3/31/08 and | |||||||
| 12/31/07) | (3,405,531 | ) | (3,405,531 | ) | |||
| Net assets | $ | 136,541,289 | $ | 138,363,344 | |||
| Shares outstanding | 23,314,573 | 23,314,573 | |||||
| Net asset value per outstanding share | $ | 5.86 | $ | 5.93 |
The accompanying notes are an integral part of these consolidated financial statements.
2
HARRIS & HARRIS GROUP, INC. CONSOLIDATED STATEMENTS OF OPERATIONS (Unaudited) |
Three Months Ended | Three Months Ended | ||||||
March 31, 2008 | March 31, 2007 | ||||||
| Investment income: | |||||||
| Interest from: | |||||||
| Fixed income securities | $ | 576,302 | $ | 652,498 | |||
| Total investment income | 576,302 | 652,498 | |||||
| Expenses: | |||||||
| Salaries, benefits and stock-based | |||||||
| compensation (Note 5) | 2,433,295 | 2,534,766 | |||||
| Administration and operations | 301,855 | 380,865 | |||||
| Professional fees | 138,232 | 182,195 | |||||
| Rent | 57,854 | 59,507 | |||||
| Directors' fees and expenses | 105,146 | 141,196 | |||||
| Depreciation | 13,985 | 15,313 | |||||
| Custodian fees | 6,553 | 5,774 | |||||
| Total expenses | 3,056,920 | 3,319,616 | |||||
| Net operating loss | (2,480,618 | ) | (2,667,118 | ) | |||
| Net realized loss from investments: | |||||||
| Realized (loss) from investments | (5,014,870 | ) | (674 | ) | |||
| Income tax expense (Note 6) | 46,198 | 84,905 | |||||
| Net realized (loss) from investments | (5,061,068 | ) | (85,579 | ) | |||
| Net decrease (increase) in unrealized | |||||||
| depreciation on investments: | |||||||
| Change as a result of investment sales | 5,014,653 | 0 | |||||
| Change on investments held | (762,002 | ) | (3,637,463 | ) | |||
| Change in unrealized depreciation on investments | 4,252,651 | (3,637,463 | ) | ||||
| Net decrease (increase) in unrealized | |||||||
| depreciation on investments | 4,252,651 | (3,637,463 | ) | ||||
| Net decrease in net assets resulting from operations: | |||||||
| Total | $ | (3,289,035 | ) | $ | (6,390,160 | ) | |
| Per average basic and diluted outstanding share | $ | (0.14 | ) | $ | (0.30 | ) | |
| Average outstanding shares | 23,314,573 | 21,277,576 | |||||
The accompanying notes are an integral part of these consolidated financial statements.
3
HARRIS & HARRIS GROUP, INC. CONSOLIDATED STATEMENTS OF OPERATIONS (Unaudited) |
Three Months Ended | Three Months Ended | ||||||
March 31, 2008 | March 31, 2007 | ||||||
Cash flows used in operating activities: | |||||||
| Net decrease in net assets resulting from operations | $ | (3,289,035 | ) | $ | (6,390,160 | ) | |
| Adjustments to reconcile net decrease in net assets | |||||||
| resulting from operations to net cash used in | |||||||
| operating activities: | |||||||
| Net realized and unrealized loss on investments | 762,219 | 3,638,137 | |||||
| Depreciation and amortization | (454,332 | ) | (65,730 | ) | |||
| Stock-based compensation expense | 1,466,980 | 1,690,181 | |||||
| Changes in assets and liabilities: | |||||||
| Restricted funds | 146,710 | (108,880 | ) | ||||
| Receivable from portfolio company | 524 | 0 | |||||
| Interest receivable | 149,849 | 61,997 | |||||
| Receivable from broker | 0 | 819,905 | |||||
| Prepaid expenses | 76,078 | (416,635 | ) | ||||
| Other assets | (2,492 | ) | (10,191 | ) | |||
| Accounts payable and accrued liabilities | (296,978 | ) | (209,292 | ) | |||
| Accrued profit sharing | 0 | (261,661 | ) | ||||
| Deferred rent | (1,659 | ) | (1,700 | ) | |||
| Current income tax liability | 541 | 80,795 | |||||
| Net cash used in operating activities | (1,441,595 | ) | (1,173,234 | ) | |||
Cash flows from investing activities: | |||||||
| Purchase of short-term investments | |||||||
| and marketable securities | (21,230,754 | ) | (10,952,109 | ) | |||
| Sale of short-term investments and marketable securities | 28,883,642 | 12,165,656 | |||||
| Investment in private placements and loans | (6,435,274 | ) | (4,857,357 | ) | |||
| Proceeds from sale of investments | 105,714 | 0 | |||||
| Purchase of fixed assets | (1,588 | ) | (270 | ) | |||
| Net cash provided by (used in) investing activities | 1,321,740 | (3,644,080 | ) | ||||
Cash flows from financing activities: | |||||||
| Proceeds from stock option exercises (Note 5) | 0 | 3,295,978 | |||||
| Net cash provided by financing activities | 0 | 3,295,978 | |||||
Net decrease in cash and cash equivalents: | |||||||
| Cash and cash equivalents at beginning of the period | 330,009 | 2,071,788 | |||||
| Cash and cash equivalents at end of the period | 210,154 | 550,452 | |||||
| Net decrease in cash and cash equivalents | $ | (119,855 | ) | $ | (1,521,336 | ) | |
Supplemental disclosures of cash flow information: | |||||||
| Income taxes paid | $ | 45,657 | $ | 10,252 | |||
The accompanying notes are an integral part of these consolidated financial statements.
4
HARRIS & HARRIS GROUP, INC. CONSOLIDATED STATEMENTS OF CHANGES IN NET ASSETS |
Three Months Ended | Year Ended | ||||||
March 31, 2008 | December 31, 2007 | ||||||
(Unaudited) | |||||||
Changes in net assets from operations: | |||||||
| Net operating loss | $ | (2,480,618 | ) | $ | (11,827,543 | ) | |
| Net realized (loss) gain on investments | (5,061,068 | ) | 30,162 | ||||
| Net decrease in unrealized | |||||||
| depreciation on investments sold | 5,014,653 | 0 | |||||
| Net (increase) decrease in unrealized | |||||||
| depreciation on investments held | (762,002 | ) | 5,080,936 | ||||
| Net decrease in net assets resulting | |||||||
| from operations | (3,289,035 | ) | (6,716,445 | ) | |||
Changes in net assets from capital | |||||||
stock transactions: | |||||||
| Issuance of common stock upon the | |||||||
| exercise of stock options | 0 | 9,996 | |||||
| Issuance of common stock on offering | 0 | 13,000 | |||||
| Additional paid-in capital on common | |||||||
| stock issued | 0 | 23,075,683 | |||||
| Stock-based compensation expense | 1,466,980 | 8,050,807 | |||||
| Net increase in net assets resulting from | |||||||
| capital stock transactions | 1,466,980 | 31,149,486 | |||||
| Net (decrease) increase in net assets | (1,822,055 | ) | 24,433,041 | ||||
Net assets: | |||||||
| Beginning of the period | 138,363,344 | 113,930,303 | |||||
| End of the period | $ | 136,541,289 | $ | 138,363,344 | |||
The accompanying notes are an integral part of these consolidated financial statements.
5
HARRIS & HARRIS GROUP, INC. CONSOLIDATED SCHEDULE OF INVESTMENTS AS OF MARCH 31, 2008 |
Method of | Shares/ | |||||||||
Valuation (1) | Principal | Value | ||||||||
Investments in Unaffiliated Companies (2)(3) - 15.64% of net assets at value | ||||||||||
Private Placement Portfolio (Illiquid) - 15.64% of net assets at value | ||||||||||
| BioVex Group, Inc. (4)(5)(6)(7) -- Developing novel biologics | ||||||||||
| for treatment of cancer and infectious disease | ||||||||||
| Series E Convertible Preferred Stock | (M | ) | 2,799,552 | $ | 2,500,000 | |||||
| Exponential Business Development Company (4)(5) -- Venture | ||||||||||
| capital partnership focused on early stage companies | ||||||||||
| Limited Partnership Interest | (M | ) | 1 | 2,219 | ||||||
| Molecular Imprints, Inc. (4)(5) -- Manufacturing nanoimprint | ||||||||||
| lithography capital equipment | ||||||||||
| Series B Convertible Preferred Stock | (M | ) | 1,333,333 | 2,000,000 | ||||||
| Series C Convertible Preferred Stock | (M | ) | 1,250,000 | 2,399,875 | ||||||
| Warrants at $2.00 expiring 12/31/11 | ( I | ) | 125,000 | 100,125 | ||||||
| 4,500,000 | ||||||||||
| Nanosys, Inc. (4)(5)(6) -- Developing zero and one-dimensional | ||||||||||
| inorganic nanometer-scale materials and devices | ||||||||||
| Series C Convertible Preferred Stock | (M | ) | 803,428 | 2,370,113 | ||||||
| Series D Convertible Preferred Stock | (M | ) | 1,016,950 | 3,000,003 | ||||||
| 5,370,116 | ||||||||||
| Nantero, Inc. (4)(5)(6) -- Developing a high-density, nonvolatile, | ||||||||||
| random access memory chip, enabled by carbon nanotubes | ||||||||||
| Series A Convertible Preferred Stock | (M | ) | 345,070 | 1,046,908 | ||||||
| Series B Convertible Preferred Stock | (M | ) | 207,051 | 628,172 | ||||||
| Series C Convertible Preferred Stock | (M | ) | 188,315 | 571,329 | ||||||
| 2,246,409 | ||||||||||
The accompanying notes are an integral part of these consolidated financial statements.
6
HARRIS & HARRIS GROUP, INC. CONSOLIDATED SCHEDULE OF INVESTMENTS AS OF MARCH 31, 2008 |
Method of | Shares/ | |||||||||
Valuation (1) | Principal | Value | ||||||||
Investments in Unaffiliated Companies (2)(3) - 15.64% of | ||||||||||
net assets at value (cont.) | ||||||||||
Private Placement Portfolio (Illiquid) - 15.64% of net assets | ||||||||||
at value (cont.) | ||||||||||
| NeoPhotonics Corporation (4)(5) -- Developing and manufacturing | ||||||||||
| optical devices and components | ||||||||||
| Common Stock | (M | ) | 716,195 | $ | 133,141 | |||||
| Series 1 Convertible Preferred Stock | (M | ) | 1,831,256 | 1,831,256 | ||||||
| Series 2 Convertible Preferred Stock | (M | ) | 741,898 | 741,898 | ||||||
| Series 3 Convertible Preferred Stock | (M | ) | 2,750,000 | 2,750,000 | ||||||
| Warrants at $0.15 expiring 01/26/10 | ( I | ) | 16,364 | 1,571 | ||||||
| Warrants at $0.15 expiring 12/05/10 | ( I | ) | 14,063 | 1,350 | ||||||
| 5,459,216 | ||||||||||
| Polatis, Inc. (4)(5)(6)(8) -- Developing MEMS-based optical | ||||||||||
| networking components | ||||||||||
| Series A-1 Convertible Preferred Stock | (M | ) | 16,775 | 0 | ||||||
| Series A-2 Convertible Preferred Stock | (M | ) | 71,611 | 132,653 | ||||||
| Series A-4 Convertible Preferred Stock | (M | ) | 4,774 | 8,768 | ||||||
| Series A-5 Convertible Preferred Stock | (M | ) | 16,438 | 135,105 | ||||||
| 276,526 | ||||||||||
| PolyRemedy, Inc. (4)(5)(6)(9) --Developing a robotic | ||||||||||
| manufacturing platform for wound treatment patches | ||||||||||
| Series B-1 Convertible Preferred Stock | (M | ) | 287,647 | 244,500 | ||||||
| Starfire Systems, Inc. (4)(5)(6) -- Producing ceramic-forming polymers | ||||||||||
| Common Stock | (M | ) | 375,000 | 150,000 | ||||||
| Series A-1 Convertible Preferred Stock | (M | ) | 600,000 | 600,000 | ||||||
| 750,000 | ||||||||||
Total Unaffiliated Private Placement Portfolio (cost: $21,679,892) | $ | 21,348,986 | ||||||||
Total Investments in Unaffiliated Companies (cost: $21,679,892) | $ | 21,348,986 | ||||||||
The accompanying notes are an integral part of these consolidated financial statements.
7
HARRIS & HARRIS GROUP, INC. CONSOLIDATED SCHEDULE OF INVESTMENTS AS OF MARCH 31, 2008 |
Method of | Shares/ | |||||||||
Valuation (1) | Principal | Value | ||||||||
Investments in Non-Controlled Affiliated Companies (2)(10) - | ||||||||||
42.01% of net assets at value | ||||||||||
Private Placement Portfolio (Illiquid) - 42.01% of net assets | ||||||||||
at value | ||||||||||
Adesto Technologies Corporation (4)(5)(6) -- Developing | ||||||||||
| semiconductor-related products enabled at the nanoscale | ||||||||||
| Series A Convertible Preferred Stock | (M | ) | 6,547,619 | $ | 2,200,000 | |||||
| Ancora Pharmaceuticals, Inc. (4)(5)(6) -- Developing synthetic | ||||||||||
| carbohydrates for pharmaceutical applications | ||||||||||
| Series B Convertible Preferred Stock | (M | ) | 909,091 | 639,062 | ||||||
| Warrants at $1.06 expiring 05/01/08 | ( I | ) | 754,717 | 8,302 | ||||||
| 647,364 | ||||||||||
| BridgeLux, Inc. (4)(5)(11) -- Manufacturing high-power light | ||||||||||
| emitting diodes | ||||||||||
| Series B Convertible Preferred Stock | (M | ) | 1,861,504 | 2,792,256 | ||||||
| Series C Convertible Preferred Stock | (M | ) | 2,130,699 | 3,196,050 | ||||||
| Series D Convertible Preferred Stock | (M | ) | 666,667 | 1,000,001 | ||||||
| Warrants at $0.7136 expiring 02/02/17 | ( I | ) | 98,340 | 137,971 | ||||||
| Warrants at $0.7136 expiring 04/26/17 | ( I | ) | 65,560 | 92,374 | ||||||
| 7,218,652 | ||||||||||
| Cambrios Technologies Corporation (4)(5)(6) -- Developing | ||||||||||
| nanowire-enabled electronic materials for the display industry | ||||||||||
| Series B Convertible Preferred Stock | (M | ) | 1,294,025 | 1,294,025 | ||||||
| Series C Convertible Preferred Stock | (M | ) | 1,300,000 | 1,300,000 | ||||||
| 2,594,025 | ||||||||||
CFX Battery, Inc. (4)(5)(6)(12) -- Developing batteries using | ||||||||||
| nanostructured materials | ||||||||||
| Series A Convertible Preferred Stock | (M | ) | 1,208,262 | 946,528 | ||||||
The accompanying notes are an integral part of these consolidated financial statements.
8
HARRIS & HARRIS GROUP, INC. CONSOLIDATED SCHEDULE OF INVESTMENTS AS OF MARCH 31, 2008 |
Method of | Shares/ | |||||||||
Valuation (1) | Principal | Value | ||||||||
Investments in Non-Controlled Affiliated Companies (2)(10) - | ||||||||||
42.01% of net assets at value (cont.) | ||||||||||
Private Placement Portfolio (Illiquid) - 42.01% of net assets | ||||||||||
at value (cont.) | ||||||||||
| Crystal IS, Inc. (4)(5)(6) -- Developing single-crystal | ||||||||||
| aluminum nitride substrates for optoelectronic devices | ||||||||||
| Series A Convertible Preferred Stock | (M | ) | 391,571 | $ | 305,425 | |||||
| Series A-1 Convertible Preferred Stock | (M | ) | 1,300,376 | 1,014,294 | ||||||
| Warrants at $0.78 expiring 05/05/13 | ( I | ) | 15,231 | 9,352 | ||||||
| Warrants at $0.78 expiring 05/12/13 | ( I | ) | 2,350 | 1,445 | ||||||
| Warrants at $0.78 expiring 08/08/13 | ( I | ) | 4,396 | 2,739 | ||||||
| 1,333,255 | ||||||||||
| CSwitch Corporation (4)(5)(6)(13) -- Developing next-generation, system- | ||||||||||
| on-a-chip solutions for communications-based platforms | ||||||||||
| Series A-1 Convertible Preferred Stock | (M | ) | 6,863,118 | 3,431,559 | ||||||
| Unsecured Convertible Bridge Note (including interest) | (M | ) | $ | 529,852 | 552,149 | |||||
| 3,983,708 | ||||||||||
| D-Wave Systems, Inc. (4)(5)(6)(14) -- Developing high- | ||||||||||
| performance quantum computing systems | ||||||||||
| Series B Convertible Preferred Stock | (M | ) | 2,000,000 | 2,160,584 | ||||||
| Series C Convertible Preferred Stock | (M | ) | 678,264 | 732,724 | ||||||
| 2,893,308 | ||||||||||
Ensemble Discovery Corporation (4)(5)(6) -- Developing DNA | ||||||||||
| Programmed Chemistry for the discovery of new classes of | ||||||||||
| therapeutics and bioassays | ||||||||||
| Series B Convertible Preferred Stock | (M | ) | 1,449,275 | 2,000,000 | ||||||
| Innovalight, Inc. (4)(5)(6) -- Developing solar power | ||||||||||
| products enabled by silicon-based nanomaterials | ||||||||||
| Series B Convertible Preferred Stock | (M | ) | 16,666,666 | 5,718,216 | ||||||
| Series C Convertible Preferred Stock | (M | ) | 5,810,577 | 1,993,568 | ||||||
| 7,711,784 | ||||||||||
The accompanying notes are an integral part of these consolidated financial statements.
9
HARRIS & HARRIS GROUP, INC. CONSOLIDATED SCHEDULE OF INVESTMENTS AS OF MARCH 31, 2008 |
Method of | Shares/ | |||||||||
Valuation (1) | Principal | Value | ||||||||
Investments in Non-Controlled Affiliated Companies (2)(10) - | ||||||||||
42.01% of net assets at value (cont.) | ||||||||||
Private Placement Portfolio (Illiquid) - 42.01% of net assets | ||||||||||
at value (cont.) | ||||||||||
| Kereos, Inc. (4)(5)(6) -- Developing emulsion-based imaging | ||||||||||
| agents and targeted therapeutics to image and treat cancer | ||||||||||
| and cardiovascular disease | ||||||||||
| Series B Convertible Preferred Stock | (M | ) | 545,456 | $ | 120,850 | |||||
| Kovio, Inc. (4)(5)(6) -- Developing semiconductor products | ||||||||||
| using printed electronics and thin-film technologies | ||||||||||
| Series C Convertible Preferred Stock | (M | ) | 2,500,000 | 3,125,000 | ||||||
| Series D Convertible Preferred Stock | (M | ) | 800,000 | 1,000,000 | ||||||
| 4,125,000 | ||||||||||
| Mersana Therapeutics, Inc. (4)(5)(6)(15) -- Developing advanced | ||||||||||
| polymers for drug delivery | ||||||||||
| Series A Convertible Preferred Stock | (M | ) | 68,451 | 136,902 | ||||||
| Series B Convertible Preferred Stock | (M | ) | 866,500 | 1,733,000 | ||||||
| Warrants at $2.00 expiring 10/21/10 | ( I | ) | 91,625 | 112,974 | ||||||
| 1,982,876 | ||||||||||
| Metabolon, Inc. (4)(5)(6) -- Discovering biomarkers through | ||||||||||
| the use of metabolomics | ||||||||||
| Series B Convertible Preferred Stock | (M | ) | 2,173,913 | 1,765,535 | ||||||
| Series B-1 Convertible Preferred Stock | (M | ) | 869,565 | 706,214 | ||||||
| Warrants at $1.15 expiring 3/25/15 | ( I | ) | 434,783 | 293,786 | ||||||
| 2,765,535 | ||||||||||
| NanoGram Corporation (4)(5)(6) -- Developing a broad suite of intellectual | ||||||||||
| property utilizing nanoscale materials | ||||||||||
| Series I Convertible Preferred Stock | (M | ) | 63,210 | 124,524 | ||||||
| Series II Convertible Preferred Stock | (M | ) | 1,250,904 | 2,464,281 | ||||||
| Series III Convertible Preferred Stock | (M | ) | 1,242,144 | 2,447,024 | ||||||
| Series IV Convertible Preferred Stock | (M | ) | 432,179 | 851,393 | ||||||
| 5,887,222 | ||||||||||
The accompanying notes are an integral part of these consolidated financial statements.
10
HARRIS & HARRIS GROUP, INC. CONSOLIDATED SCHEDULE OF INVESTMENTS AS OF MARCH 31, 2008 |
Method of | Shares/ | |||||||||
Valuation (1) | Principal | Value | ||||||||
Investments in Non-Controlled Affiliated Companies (2)(10) - | ||||||||||
42.01% of net assets at value (cont.) | ||||||||||
Private Placement Portfolio (Illiquid) - 42.01% of net assets | ||||||||||
at value (cont.) | ||||||||||
| Nanomix, Inc. (4)(5)(6) -- Producing nanoelectronic sensors that | ||||||||||
| integrate carbon nanotube electronics with silicon microstructures | ||||||||||
| Series C Convertible Preferred Stock | (M | ) | 977,917 | $ | 330,228 | |||||
| Series D Convertible Preferred Stock | (M | ) | 6,802,397 | 680,240 | ||||||
| 1,010,468 | ||||||||||
| Nextreme Thermal Solutions, Inc. (4)(5)(6) -- Developing thin-film | ||||||||||
| thermoelectric devices for cooling and energy conversion | ||||||||||
| Series A Convertible Preferred Stock | (M | ) | 1,750,000 | 1,750,000 | ||||||
| Unsecured Convertible Bridge Note | (M | ) | $ | 377,580 | 377,580 | |||||
| 2,127,580 | ||||||||||
| Questech Corporation (4)(5) -- Manufacturing and marketing | ||||||||||
| proprietary metal and stone decorative tiles | ||||||||||
| Common Stock | (M | ) | 655,454 | 129,717 | ||||||
| Warrants at $1.50 expiring 11/19/08 | ( I | ) | 5,000 | 5 | ||||||
| Warrants at $1.50 expiring 11/19/09 | ( I | ) | 5,000 | 95 | ||||||
| 129,817 | ||||||||||
| Siluria Technologies, Inc. (4)(5)(6) -- Developing next-generation | ||||||||||
| nanomaterials | ||||||||||
| Series S-2 Convertible Preferred Stock | (M | ) | 482,218 | 160,723 | ||||||
| Solazyme, Inc. (4)(5)(6) -- Developing algal biodiesel, industrial | ||||||||||
| chemicals and special ingredients based on synthetic biology | ||||||||||
| Series A Convertible Preferred Stock | (M | ) | 988,204 | 997,691 | ||||||
| Series B Convertible Preferred Stock | (M | ) | 495,246 | 500,000 | ||||||
| Unsecured Convertible Bridge Note (including interest) | (M | ) | $ | 2,000,000 | 2,009,534 | |||||
| 3,507,225 | ||||||||||
The accompanying notes are an integral part of these consolidated financial statements.
11
HARRIS & HARRIS GROUP, INC. CONSOLIDATED SCHEDULE OF INVESTMENTS AS OF MARCH 31, 2008 |
Method of | Shares/ | |||||||||
Valuation (1) | Principal | Value | ||||||||
Investments in Non-Controlled Affiliated Companies (2)(10) - | ||||||||||
42.01% of net assets at value (cont.) | ||||||||||
Private Placement Portfolio (Illiquid) - 42.01% of net assets | ||||||||||
at value (cont.) | ||||||||||
| Xradia, Inc. (4)(5) -- Designing, manufacturing and selling ultra-high | ||||||||||
| resolution 3D x-ray microscopes and fluorescence imaging systems | ||||||||||
| Series D Convertible Preferred Stock | (M | ) | 3,121,099 | $ | 4,000,000 | |||||
| Zia Laser, Inc. (4)(5)(16) -- Developed quantum dot semiconductor lasers | ||||||||||
| Series C Convertible Preferred Stock | (M | ) | 1,500,000 | 21,330 | ||||||
Total Non-Controlled Private Placement Portfolio (cost: $55,371,901) | $ | 57,367,250 | ||||||||
Total Investments in Non-Controlled Affiliated Companies (cost: $55,371,901) | $ | 57,367,250 | ||||||||
The accompanying notes are an integral part of these consolidated financial statements.
12
HARRIS & HARRIS GROUP, INC. CONSOLIDATED SCHEDULE OF INVESTMENTS AS OF MARCH 31, 2008 |
Method of | Shares/ | |||||||||
Valuation (1) | Principal | Value | ||||||||
Investments in Controlled Affiliated Companies (2)(17) - | ||||||||||
3.21% of net assets at value | ||||||||||
Private Placement Portfolio (Illiquid) - 3.21% of | ||||||||||
net assets at value | ||||||||||
| Evolved Nanomaterial Sciences, Inc. (4)(5)(18) -- Developed | ||||||||||
| nanoscale-enhanced approaches for the resolution of | ||||||||||
| chiral molecules | ||||||||||
| Series A Convertible Preferred Stock | (M | ) | 5,870,021 | $ | 0 | |||||
| Phoenix Molecular Corporation (4)(5)(6) -- Developing technology to | ||||||||||
| enable the separation of difficult-to-separate materials. | ||||||||||
| Common Stock | (M | ) | 1,000 | 10 | ||||||
| Unsecured Convertible Bridge Note (including interest) | (M | ) | $ | 75,000 | 77,001 | |||||
| 77,011 | ||||||||||
| SiOnyx, Inc. (4)(5)(6) -- Developing silicon-based optoelectronic | ||||||||||
| products enabled by its proprietary "Black Silicon" | ||||||||||
| Series A Convertible Preferred Stock | (M | ) | 233,499 | 135,686 | ||||||
| Series A-1 Convertible Preferred Stock | (M | ) | 2,966,667 | 1,723,930 | ||||||
| Series A-2 Convertible Preferred Stock | (M | ) | 4,207,537 | 2,445,000 | ||||||
| 4,304,616 | ||||||||||
Total Controlled Private Placement Portfolio (cost: $6,962,011) | $ | 4,381,627 | ||||||||
Total Investments in Controlled Affiliated Companies (cost: $6,962,011) | $ | 4,381,627 | ||||||||
Total Private Placement Portfolio (cost: $84,013,804) | $ | 83,097,863 | ||||||||
The accompanying notes are an integral part of these consolidated financial statements.
13
HARRIS & HARRIS GROUP, INC. CONSOLIDATED SCHEDULE OF INVESTMENTS AS OF MARCH 31, 2008 |
U.S. Government and Agency Securities - 39.25% of net assets at value
| U.S. Treasury Bill -- due date 04/17/08 | (M | ) | $ | 3,050,000 | $ | 3,048,384 | ||||
| U.S. Treasury Notes -- due date 05/15/08, coupon 3.75% | (M | ) | 9,000,000 | 9,026,010 | ||||||
| U.S. Treasury Notes -- due date 09/15/08, coupon 3.125% | (M | ) | 5,000,000 | 5,039,850 | ||||||
| U.S. Treasury Notes -- due date 01/15/09, coupon 3.25% | (M | ) | 3,000,000 | 3,041,490 | ||||||
| U.S. Treasury Notes -- due date 02/15/09, coupon 4.50% | (M | ) | 5,100,000 | 5,228,316 | ||||||
| U.S. Treasury Notes -- due date 04/15/09, coupon 3.125% | (M | ) | 3,000,000 | 3,050,160 | ||||||
| U.S. Treasury Notes -- due date 07/15/09, coupon 3.625% | (M | ) | 3,000,000 | 3,079,440 | ||||||
| U.S. Treasury Notes -- due date 10/15/09, coupon 3.375% | (M | ) | 3,000,000 | 3,081,330 | ||||||
| U.S. Treasury Notes -- due date 01/15/10, coupon 3.625% | (M | ) | 3,000,000 | 3,105,690 | ||||||
| U.S. Treasury Notes -- due date 04/15/10, coupon 4.00% | (M | ) | 3,000,000 | 3,142,020 | ||||||
| U.S. Treasury Notes -- due date 07/15/10, coupon 3.875% | (M | ) | 3,000,000 | 3,155,160 | ||||||
| U.S. Treasury Notes -- due date 10/15/10, coupon 4.25% | (M | ) | 2,000,000 | 2,130,000 | ||||||
| U.S. Treasury Notes -- due date 10/31/12, coupon 3.875% | (M | ) | 2,000,000 | 2,126,100 | ||||||
| U.S. Treasury Notes -- due date 02/15/13, coupon 3.875% | (M | ) | 5,000,000 | 5,335,150 | ||||||
Total Investments in U.S. Government and Agency Securities (cost: $52,346,992) | $ | 53,589,100 | ||||||||
Total Investments (cost: $136,360,796) | $ | 136,686,963 |
The accompanying notes are an integral part of these consolidated financial statements.
14
HARRIS & HARRIS GROUP, INC. CONSOLIDATED SCHEDULE OF INVESTMENTS AS OF MARCH 31, 2008 |
Notes to Consolidated Schedule of Investments
| (1) | See Footnote to Consolidated Schedule of Investments on page 17 for a description of the Valuation Procedures. |
| (2) | Investments in unaffiliated companies consist of investments in which we own less than five percent of the voting shares of the portfolio company. Investments in non-controlled affiliated companies consist of investments in which we own five percent or more, but less than 25 percent, of the voting shares of the portfolio company, or where we hold one or more seats on the portfolio company’s Board of Directors but do not control the company. Investments in controlled affiliated companies consist of investments in which we own 25 percent or more of the voting shares of the portfolio company or otherwise control the company. |
| (3) | The aggregate cost for federal income tax purposes of investments in unaffiliated companies is $21,679,892. The gross unrealized appreciation based on the tax cost for these securities is $1,732,194. The gross unrealized depreciation based on the tax cost for these securities is $2,063,100. |
| (4) | Legal restrictions on sale of investment. |
| (5) | Represents a non-income producing security. Equity investments that have not paid dividends within the last 12 months are considered to be non-income producing. |
| (6) | These investments are development stage companies. A development stage company is defined as a company that is devoting substantially all of its efforts to establishing a new business, and either it has not yet commenced its planned principal operations, or it has commenced such operations but has not realized significant revenue from them. |
| (7) | With our purchase of Series E Convertible Preferred Stock of BioVex, we received a warrant to purchase a number of shares of common stock of BioVex as determined by dividing 624,999.99 by the price per share at which the common stock is offered and sold to the public in connection with the initial public offering. The ability to exercise this warrant is therefore contingent on BioVex completing successfully an initial public offering before the expiration date of the warrant on September 27, 2012. The exercise price of this warrant shall be 110 percent of the initial public offering price. |
| (8) | Continuum Photonics, Inc., merged with Polatis, Ltd., to form Polatis, Inc. |
| (9) | Initial investment was made during 2008. |
The accompanying notes are an integral part of this consolidated schedule.
15
HARRIS & HARRIS GROUP, INC. CONSOLIDATED SCHEDULE OF INVESTMENTS AS OF MARCH 31, 2008 |
| (10) | The aggregate cost for federal income tax purposes of investments in non-controlled affiliated companies is $55,371,901. The gross unrealized appreciation based on the tax cost for these securities is $10,844,376. The gross unrealized depreciation based on the tax cost for these securities is $8,849,027. |
| (11) | BridgeLux, Inc., was previously named eLite Optoelectronics, Inc. |
| (12) | On February 28, 2008, Lifco, Inc., merged with CFX Battery, Inc. The surviving entity is CFX Battery, Inc. |
| (13) | With our investment in a secured convertible bridge note issued by CSwitch, we received a warrant to purchase a number of shares of the class of stock sold in the next financing of CSwitch equal to $529,322, the principal of the note, divided by the lowest price per share of the class of stock sold in the next financing of CSwitch. The ability to exercise this warrant is therefore contingent on CSwitch completing successfully a subsequent round of financing. The warrant will expire five years from the date of the close of the next round of financing. The cost basis of this warrant is $529. |
| (14) | D-Wave Systems, Inc., is located and is doing business primarily in Canada. We invested in D-Wave Systems, Inc., through D-Wave USA, a Delaware company. Our investment is denominated in Canadian dollars and is subject to foreign currency translation. See "Note 3. Summary of Significant Accounting Policies." |
| (15) | Mersana Therapeutics, Inc., was previously named Nanopharma Corp. |
| (16) | On November 30, 2006, the assets of Zia Laser, Inc., were acquired by Innolume Inc. |
| (17) | The aggregate cost for federal income tax purposes of investments in controlled affiliated companies is $6,962,011. The gross unrealized appreciation based on the tax cost for these securities is $219,616. The gross unrealized depreciation based on the tax cost for these securities is $2,800,000. |
| (18) | On September 30, 2007, Evolved Nanomaterial Sciences, Inc., filed for Chapter 7 bankruptcy. |
The accompanying notes are an integral part of this consolidated schedule.
16
HARRIS & HARRIS GROUP, INC. FOOTNOTE TO CONSOLIDATED SCHEDULE OF INVESTMENTS (Unaudited) |
VALUATION PROCEDURES
I. Determination of Net Asset Value
The 1940 Act requires periodic valuation of each investment in the portfolio of the Company to determine its net asset value. Under the 1940 Act, unrestricted securities with readily available market quotations are to be valued at the current market value; all other assets must be valued at fair value as determined in good faith by or under the direction of the Board of Directors.
The Board of Directors is responsible for (1) determining overall valuation guidelines and (2) ensuring that the investments of the Company are valued within the prescribed guidelines.
The Valuation Committee, comprised of all of the independent Board members, is responsible for reviewing and approving the valuation of the Company’s assets within the guidelines established by the Board of Directors. The Valuation Committee receives information and recommendations from management.
The values assigned to these investments are based on available information and do not necessarily represent amounts that might ultimately be realized, as such amounts depend on future circumstances and cannot reasonably be determined until the individual investments are actually liquidated or become readily marketable.
II. Approaches to Determining Fair Value
Statement of Financial Accounting Standards No. 157, "Fair Value Measurements," ("SFAS No. 157") defines fair value as the price that would be received to sell an asset or paid to transfer a liability in an orderly transaction between market participants at the measurement date (exit price).
The main approaches to measuring fair value utilized are the market approach and the income approach.
| · | Market Approach (M): The market approach uses prices and other relevant information generated by market transactions involving identical or comparable assets or liabilities. For example, the market approach often uses market multiples derived from a set of comparables. Multiples might lie in ranges with a different multiple for each comparable. The selection of where within the range each appropriate multiple falls requires judgment considering factors specific to the measurement (qualitative and quantitative). |
17
| · | Income Approach (I): The income approach uses valuation techniques to convert future amounts (for example, cash flows or earnings) to a single present value amount (discounted). The measurement is based on the value indicated by current market expectations about those future amounts. Those valuation techniques include present value techniques; option-pricing models, such as the Black-Scholes-Merton formula (a closed-form model) and a binomial model (a lattice model), which incorporate present value techniques; and the multi-period excess earnings method, which is used to measure the fair value of certain assets. |
SFAS No. 157 classifies the inputs used to measure fair value by these approaches into the following hierarchy:
| · | Level 1: Unadjusted quoted prices in active markets for identical assets or liabilities. |
| · | Level 2: Quoted prices in active markets for similar assets or liabilities, or quoted prices for identical or similar assets or liabilities in markets that are not active, or inputs other than quoted prices that are observable for the asset or liability. |
| · | Level 3: Unobservable inputs for the asset or liability. |
Financial assets and liabilities are classified in their entirety based on the lowest level of input that is significant to the fair value measurement.
III. Investment Categories
The Company’s investments can be classified into five broad categories for valuation purposes:
| · | Equity-related securities; |
| · | Investments in intellectual property, patents, research and development in technology or product development; |
| · | Long-term fixed-income securities; |
| · | Short-term fixed-income securities; and |
| · | All other securities. |
The Company applies the methods for determining fair value discussed above to the valuation of investments in each of these five broad categories as follows:
A. EQUITY-RELATED SECURITIES
Equity-related securities, including warrants, are fair valued using the market or income approaches. The following factors may be considered when the market approach is used to fair value these types of securities:
| · | Readily available public market quotations; |
| · | The cost of the Company’s investment; |
18
| · | Transactions in a company's securities or unconditional firm offers by responsible parties as a factor in determining valuation; |
| · | The financial condition and operating results of the company; |
| · | The long-term potential of the business and technology of the company; |
| · | The values of similar securities issued by companies in similar businesses; |
| · | Multiples to revenue, net income or EBITDA that similar securities issued by companies in similar businesses receive; |
| · | The proportion of the company's securities we own and the nature of any rights to require the company to register restricted securities under applicable securities laws; and |
| · | The rights and preferences of the class of securities we own as compared to other classes of securities the portfolio company has issued. |
When the income approach is used to value warrants, the Company uses the Black-Scholes-Merton formula.
B. INVESTMENTS IN INTELLECTUAL PROPERTY, PATENTS, RESEARCH AND DEVELOPMENT IN TECHNOLOGY OR PRODUCT DEVELOPMENT
Such investments are fair valued using the market approach. The Company may consider factors specific to these types of investments when using the market approach including:
| · | The cost of the Company’s investment; |
| · | Investments in the same or substantially similar intellectual property or patents or research and development in technology or product development or offers by responsible third parties; |
| · | The results of research and development; |
| · | Product development progress; |
| · | Commercial prospects; |
| · | Term of patent; |
| · | Projected markets; and |
| · | Other subjective factors. |
19
C. LONG-TERM FIXED-INCOME SECURITIES
1. Readily Marketable: Long-term fixed-income securities for which market quotations are readily available are valued using the most recent bid quotations when available.
2. Not Readily Marketable: Long-term fixed-income securities for which market quotations are not readily available are fair valued using the market approach. The factors that may be considered when valuing these types of securities by the market approach include:
| · | Credit quality; |
| · | Interest rate analysis; |
| · | Quotations from broker-dealers; |
| · | Prices from independent pricing services that the Board believes are reasonably reliable; and |
| · | Reasonable price discovery procedures and data from other sources. |
D. SHORT-TERM FIXED-INCOME SECURITIES
Short-term fixed-income securities are valued using the market approach in the same manner as long-term fixed-income securities until the remaining maturity is 60 days or less, after which time such securities may be valued at amortized cost if there is no concern over payment at maturity.
E. | ALL OTHER SECURITIES |
All other securities are reported at fair value as determined in good faith by the Valuation Committee using the approaches for determining valuation as described above.
For all other securities, the reported values shall reflect the Valuation Committee's judgment of fair values as of the valuation date using the outlined basic approaches of valuation discussed in Section II. They do not necessarily represent an amount of money that would be realized if we had to sell such assets in an immediate liquidation. Thus, valuations as of any particular date are not necessarily indicative of amounts that we may ultimately realize as a result of future sales or other dispositions of investments we hold.
20
NOTES TO CONSOLIDATED FINANCIAL STATEMENTS (Unaudited) |
NOTE 1. THE COMPANY
Harris & Harris Group, Inc. (the "Company," "us," "our" and "we"), is a venture capital company operating as a business development company ("BDC") under the Investment Company Act of 1940 ("1940 Act"). We operate as an internally managed company whereby our officers and employees, under the general supervision of our Board of Directors, conduct our operations.
We elected to become a BDC on July 26, 1995, after receiving the necessary shareholder approvals. From September 30, 1992, until the election of BDC status, we operated as a closed-end, non-diversified investment company under the 1940 Act. Upon commencement of operations as an investment company, we revalued all of our assets and liabilities in accordance with the 1940 Act. Prior to September 30, 1992, we were registered and filed under the reporting requirements of the Securities Exchange Act of 1934 (the "1934 Act") as an operating company and, while an operating company, operated directly and through subsidiaries.
Harris & Harris Enterprises, Inc.,SM is a 100 percent wholly owned subsidiary of the Company. Harris & Harris Enterprises, Inc., is a partner in Harris Partners I, L.P.,SM and is taxed under Subchapter C of the Code (a “C Corporation”). Harris Partners I, L.P, is a limited partnership and is used to hold certain interests in portfolio companies. The partners of Harris Partners I, L.P., are Harris & Harris Enterprises, Inc., (sole general partner) and Harris & Harris Group, Inc., (sole limited partner). Harris & Harris Enterprises, Inc., pays taxes on any non-passive investment income generated by Harris Partners I, L.P. For the period ended March 31, 2008, there was no non-passive investment income. The Company consolidates the results of its subsidiaries for financial reporting purposes.
NOTE 2. INTERIM FINANCIAL STATEMENTS
Our interim financial statements have been prepared in accordance with the instructions to Form 10-Q and Article 10 of Regulation S-X and in conformity with generally accepted accounting principles applicable to interim financial information. Accordingly, they do not include all information and disclosures necessary for a presentation of our financial position, results of operations and cash flows in conformity with generally accepted accounting principles in the United States of America. In the opinion of management, these financial statements reflect all adjustments, consisting only of normal recurring accruals, necessary for a fair presentation of our financial position, results of operations and cash flows for such periods. The results of operations for any interim period are not necessarily indicative of the results for the full year. These financial statements should be read in conjunction with the financial statements and notes thereto contained in our Annual Report on Form 10-K for the fiscal year ended December 31, 2007.
21
NOTE 3. SUMMARY OF SIGNIFICANT ACCOUNTING POLICIES
The following is a summary of significant accounting policies followed in the preparation of the consolidated financial statements:
Principles of Consolidation. The consolidated financial statements have been prepared in accordance with accounting principles generally accepted in the United States of America for investment companies and include the accounts of the Company and its wholly owned subsidiaries. All significant inter-company accounts and transactions have been eliminated in consolidation.
Use of Estimates. The preparation of the consolidated financial statements in conformity with accounting principles generally accepted in the United States of America requires management to make estimates and assumptions that affect the reported amounts of assets and liabilities and contingent assets and liabilities as of March 31, 2008, and December 31, 2007, and the reported amounts of revenues and expenses for the three months ended March 31, 2008, and 2007. Actual results could differ from these estimates, and the differences could be material. The most significant estimates relate to the fair valuations of certain of our investments.
Cash and Cash Equivalents. Cash and cash equivalents includes demand deposits and money market instruments with maturities of less than three months. Cash and cash equivalents are carried at cost which approximates value.
Portfolio Investment Valuations. Investments are stated at "value" as defined in the 1940 Act and in the applicable regulations of the SEC. Value, as defined in Section 2(a)(41) of the 1940 Act, is (i) the market price for those securities for which a market quotation is readily available and (ii) the fair value as determined in good faith by, or under the direction of, the Board of Directors for all other assets. (See "Valuation Procedures" in the "Footnote to Consolidated Schedule of Investments.") At March 31, 2008, our financial statements include private venture capital investments valued at $83,097,863, the fair values of which were determined in good faith by, or under the direction, of the Board of Directors. Upon sale of investments, the values that are ultimately realized may be different from what is presently estimated. The difference could be material. Effective January 1, 2008, the Company adopted SFAS No. 157, "Fair Value Measurements," which defines fair value, establishes a framework for measuring fair value and expands disclosures about fair value measurements. The adoption of SFAS No. 157 did not have a material impact on the fair value measurements of the Company's investments.
Foreign Currency Translation. The accounting records of the Company are maintained in U.S. dollars. All assets and liabilities denominated in foreign currencies are translated into U.S. dollars based on the rate of exchange of such currencies against U.S. dollars on the date of valuation. For the three months ended March 31, 2008, included in the net decrease in unrealized depreciation on investments was an $80,903 loss resulting from foreign currency translation.
Securities Transactions. Securities transactions are accounted for on the date the securities are purchased or sold (trade date).
Interest Income Recognition. Interest income, adjusted for amortization of premium and accretion of discount, is recorded on accrual basis. The Company ceases accruing interest when securities are determined to be non-income producing and writes off any previously accrued interest.
22
Realized Gain or Loss and Unrealized Appreciation or Depreciation of Portfolio Investments. Realized gain or loss is recognized when an investment is disposed of and is computed as the difference between the Company’s cost basis in the investment at the disposition date and the net proceeds received from such disposition. Realized gains and losses on investment transactions are determined by specific identification. Unrealized appreciation or depreciation is computed as the difference between the fair value of the investment and the cost basis of such investment.
Stock-Based Compensation. The Company has a stock-based employee compensation plan. The Company accounts for the plan in accordance with the provisions of Statement of Financial Accounting Standards No. 123(R), "Share-Based Payment," ("SFAS No. 123(R)"). See “Note 5. Stock-Based Compensation” for further discussion.
Income Taxes. As we intend to qualify as a RIC under Subchapter M of the Internal Revenue Code, the Company does not provide for income taxes. Our taxes are accounted for in accordance with Statement of Financial Accounting Standards No. 109, "Accounting for Income Taxes," and FIN 48, "Accounting for Uncertainty in Income Taxes." The Company recognizes interest and penalties in income tax expense.
We pay federal, state and local income taxes on behalf of our wholly owned subsidiary, Harris & Harris Enterprises, Inc., which is a C corporation. See “Note 6. Income Taxes."
Restricted Funds. The Company maintains a rabbi trust for the purposes of accumulating funds to satisfy the obligations incurred by us for the Supplemental Executive Retirement Plan ("SERP") under the employment agreement with Charles E. Harris.
Property and Equipment. Property and equipment are included in "Other Assets" and are carried at cost, less accumulated depreciation of $350,333. Depreciation is provided using the straight-line method over the estimated useful lives of the premises and equipment.
Concentration of Credit Risk. The Company places its cash and cash equivalents with financial institutions and, at times, cash held in checking accounts may exceed the Federal Deposit Insurance Corporation insured limit.
NOTE 4. FAIR VALUE MEASUREMENTS
At March 31, 2008, our financial assets were categorized as follows in the fair value hierarchy for SFAS No. 157 purposes:
23
Fair Value Measurement at Reporting Date Using: | |||||||||||||
Description | March 31, 2008 | Quoted Prices in Active Markets for Identical Assets (Level 1) | Significant Other Observable Inputs (Level 2) | Significant Unobservable Inputs (Level 3) | |||||||||
| U.S. Government Securities | $ | 53,589,100 | $ | 53,589,100 | $ | 0 | $ | 0 | |||||
| Portfolio Companies | $ | 83,097,863 | $ | 0 | $ | 0 | $ | 83,097,863 | |||||
| Total | $ | 136,686,963 | $ | 53,589,100 | $ | 0 | $ | 83,097,863 | |||||
The Company recognized no gain or loss at January 1, 2008 as a result of the adoption of SFAS No. 157. The following chart shows the components of change in the financial assets categorized as Level 3, for the three months ended March 31, 2008.
Fair Value Measurements Using Significant | ||||
Unobservable Inputs (Level 3) | ||||
Portfolio Companies | ||||
| Beginning Balance, January 1, 2008 | $ | 78,110,384 | ||
| Total realized losses included in changes in net assets | (5,014,653 | ) | ||
| Total unrealized gains included in changes in net assets | 3,651,203 | |||
| Purchases and interest on bridge notes | 6,456,643 | |||
| Disposals | (105,714 | ) | ||
| Ending Balance, March 31, 2008 | $ | 83,097,863 | ||
| The amount of total losses for the period | ||||
| included in changes in net assets attributable to the | ||||
| change in unrealized gains or losses relating to | ||||
| assets still held at the reporting date | $ | 1,363,452 |
NOTE 5. STOCK-BASED COMPENSATION
On March 23, 2006, the Board of Directors of the Company voted to terminate the Employee Profit-Sharing Plan and to establish the Stock Plan, subject to shareholder approval. This proposal was approved at the May 4, 2006, Annual Meeting of Shareholders. The Stock Plan provides for the grant of equity-based awards of stock options to our officers, employees and directors (subject to receipt of an exemptive order described below) and restricted stock (subject to receipt of an exemptive order described below) to our officers and employees who are selected by our Compensation Committee for participation in the plan and subject to compliance with the 1940 Act.
On July 11, 2006, the Company filed an application with the SEC regarding certain provisions of the Stock Plan, and on June 29, 2007, the Company responded to comments from the SEC on the application. In the event that the SEC provides the exemptive relief requested by the application, and we receive any additional stockholder approval required by the SEC, the Compensation Committee may, in the future, authorize awards of stock options under the Stock Plan to non-employee directors of the Company and authorize grants of restricted stock to employees.
24
A maximum of 20 percent of our total shares of our common stock issued and outstanding are available for awards under the Stock Plan. Under the Stock Plan, no more than 25 percent of the shares of stock reserved for the grant of the awards under the Stock Plan may be restricted stock awards at any time during the term of the Stock Plan. If any shares of restricted stock are awarded, such awards will reduce on a percentage basis the total number of shares of stock for which options may be awarded. If the Company does not receive exemptive relief from the SEC to issue restricted stock, all shares granted under the Stock Plan may be subject to stock options. No more than 1,000,000 shares of our common stock may be made subject to awards under the Stock Plan to any individual in any year.
On March 19, 2008, the Compensation Committee of the Board of Directors and the full Board of Directors of the Company approved a new grant of individual Non-Qualified Stock Option ("NQSO") awards for certain officers and employees of the Company. The terms and conditions of the stock options granted were set forth in award agreements between the Company and each award recipient entered into on that date. Options to purchase a total of 348,032 shares of stock were granted with vesting periods ranging from March 2009 to March 2012 and with an exercise price of $6.18, which was the closing volume weighted average price of our shares of common stock on March 19, 2008. Upon exercise, the shares would be issued from our previously authorized but unissued shares.
The Company accounts for the Stock Plan in accordance with the provisions of SFAS No. 123(R), which requires that we determine the fair value of all share-based payments to employees, including the fair value of grants of employee stock options, and record these amounts as an expense in the Statement of Operations over the vesting period with a corresponding increase to our additional paid-in capital. At March 31, 2008 and December 31, 2007, the increase to our operating expenses was offset by the increase to our additional paid-in capital, resulting in no net impact to our net asset value. Additionally, the Company does not record the tax benefits associated with the expensing of stock options, because the Company currently intends to qualify as a RIC under Subchapter M of the Code.
An option's expected term is the estimated period between the grant date and the exercise date of the option. As the expected term period increases, the fair value of the option and the non-cash compensation cost will also increase. The expected term assumption is generally calculated using historical stock option exercise data. The Company does not have historical exercise data to develop such an assumption. In cases where companies do not have historical data and where the options meet certain criteria, SEC Staff Accounting Bulletin 107 ("SAB 107") provides the use of a simplified expected term calculation. Accordingly, the Company calculated the expected terms using the SAB 107 simplified method.
Expected volatility is the measure of how the stock's price is expected to fluctuate over a period of time. An increase in the expected volatility assumption yields a higher fair value of the stock option. Expected volatility factors for the stock options were based on the historical fluctuations in the Company’s stock price over a period commensurate with the expected term of the option, adjusted for stock splits and dividends.
25
The expected dividend yield assumption is traditionally calculated based on a company's historical dividend yield. An increase to the expected dividend yield results in a decrease in the fair value of option and resulting compensation cost. Although the Company has declared deemed dividends in previous years, most recently in 2005, the amounts and timing of any future dividends cannot be reasonably estimated. Therefore, for purposes of calculating fair value, the Company has assumed an expected dividend yield of 0 percent.
The risk-free interest rate assumptions are based on the annual yield on the measurement date of a zero-coupon U.S. Treasury bond the maturity of which equals the option’s expected term. Higher assumed interest rates yield higher fair values.
The amount of non-cash, stock-based compensation expense recognized in the Consolidated Statements of Operations is based on the fair value of the awards the Company expects to vest, recognized over the vesting period on a straight-line basis for each award, and adjusted for actual forfeitures that occur before vesting. The forfeiture rate is estimated at the time of grant and revised, if necessary, in subsequent periods if the actual forfeiture rate differs from the estimated rate and is accounted for in the current period and prospectively.
The fair value of each stock option award is estimated on the date of grant using the Black-Scholes-Merton option pricing model as permitted by SFAS No. 123(R). The assumptions used in the calculation of fair value of the stock options granted on March 19, 2008, using the Black-Scholes-Merton model for the contract term was as follows:
Weighted | ||||||||||||||||||||||
Average | ||||||||||||||||||||||
Number | Expected | Expected | Expected | Risk-free | Fair | |||||||||||||||||
of Options | Term | Volatility | Dividend | Interest | Value | |||||||||||||||||
Type of Award | Term | Granted | in Yrs | Factor | Yield | Rates | Per Share | |||||||||||||||
| Non-qualified stock options | 9.78 Years | 348,032 | 6.14 | 57.1% | 0% | 2.62% | $ | 3.45 | ||||||||||||||
| Total | 348,032 | $ | 3.45 | |||||||||||||||||||
For the three months ended March 31, 2008, the Company recognized $1,466,980 of compensation expense in the Consolidated Statements of Operations. As of March 31, 2008, there was approximately $7,852,320 of unrecognized compensation cost related to unvested stock option awards. This cost is expected to be recognized over a weighted-average period of approximately 1.9 years.
For the three months ended March 31, 2008, no stock options were exercised.
For the three months ended March 31, 2008, the calculation of the net decrease in net assets resulting from operations per share excludes the stock options because such options were anti-dilutive. The options may be dilutive in future periods in which there is a net increase in net assets resulting from operations, in the event that there is a significant increase in the average stock price in the stock market or in the event of significant decreases in the amount of unrecognized compensation cost.
26
A summary of the changes in outstanding stock options is as follows:
Weighted | ||||||||||||||||
Weighted | Weighted | Average | ||||||||||||||
Average | Average | Remaining | Aggregate | |||||||||||||
Exercise | Grant Date | Contractual | Intrinsic | |||||||||||||
Shares | Price | Fair Value | Term (Yrs) | Value | ||||||||||||
Options Outstanding at January 1, 2008 | 3,967,744 | $ | 10.54 | $ | 4.77 | |||||||||||
Granted | 348,032 | $ | 6.18 | $ | 3.45 | 9.75 | ||||||||||
| Exercised | 0 | $ | 0 | $ | 0 | |||||||||||
Forfeited or Expired | - . | |||||||||||||||
Options Outstanding at March 31, 2008 | 4,315,776 | $ | 10.19 | $ | 4.67 | 4.77 | $ | 330,630 | ||||||||
Options Exercisable at March 31, 2008 | 1,717,125 | $ | 10.43 | $ | 4.45 | 3.93 | $ | 0 | ||||||||
Options Exercisable and Expected to be Exercisable at March 31, 2008 | 4,233,180 | $ | 10.19 | $ | 4.61 | 4.70 | $ | 330,630 | ||||||||
The aggregate intrinsic value in the table above with respect to options outstanding, exercisable and expected to be exercisable, is calculated as the difference between the Company's closing stock price of $7.13 on the last trading day of the first quarter of 2008 and the exercise price, multiplied by the number of in-the-money options. This represents the total pre-tax intrinsic value that would have been received by the option holders had all options been fully vested and all option holders exercised their awards on March 31, 2008.
Unless earlier terminated by our Board of Directors, the Stock Plan will expire on May 4, 2016. The expiration of the Stock Plan will not by itself adversely affect the rights of plan participants under awards that are outstanding at the time the Stock Plan expires. Our Board of Directors may terminate, modify or suspend the plan at any time, provided that no modification of the plan will be effective unless and until any required shareholder approval has been obtained. The Compensation Committee may terminate, modify or amend any outstanding award under the Stock Plan at any time, provided that in such event, the award holder may exercise any vested options prior to such termination of the Stock Plan or award.
NOTE 6. INCOME TAXES
We filed for the 1999 tax year to elect treatment as a regulated investment company ("RIC") under Subchapter M of the Internal Revenue Code of 1986 (the "Code") and qualified for the same treatment for the years 2000 through 2007. However, there can be no assurance that we will qualify as a RIC for 2008 or subsequent years.
27
In the case of a RIC which furnishes capital to development corporations, there is an exception to the rule relating to the diversification of investments required to qualify for RIC treatment. This exception is available only to registered management investment companies which the SEC determines to be principally engaged in the furnishing of capital to other corporations which are principally engaged in the development or exploitation of inventions, technological improvements, new processes, or products not previously generally available ("SEC Certification"). We have received SEC Certification since 1999, including for 2006, but it is possible that we may not receive SEC Certification in future years.
In addition, under certain circumstances, even if we qualified for Subchapter M treatment for a given year, we might take action in a subsequent year to ensure that we would be taxed in that subsequent year as a C Corporation, rather than as a RIC. As a RIC, we must, among other things, distribute at least 90 percent of our investment company taxable income and may either distribute or retain our realized net capital gains on investments.
Provided that a proper election is made, a corporation taxable under Subchapter C of the Code or a C Corporation that elects to qualify as a RIC continues to be taxable as a C Corporation on any gains realized within 10 years of its qualification as a RIC (the "Inclusion Period") from sales of assets that were held by the corporation on the effective date of the RIC election ("C Corporation Assets"), to the extent of any gain built into the assets on such date ("Built-In Gain"). If the corporation fails to make a proper election, it is taxable on its Built-In Gain as of the effective date of its RIC election. We had Built-In Gains at the time of our qualification as a RIC and made the election to be taxed on any Built-In Gain realized during the Inclusion Period.
For federal tax purposes, the Company’s 2004 through 2007 tax years remain open for examination by the tax authorities under the normal three year statute of limitations. Generally, for state tax purposes, the Company’s 2003 through 2007 tax years remain open for examination by the tax authorities under a four year statute of limitations.
During the first quarter of 2008, we paid $15,798 in federal, state and local income taxes. At March 31, 2008, we had $0 accrued for federal, state and local taxes payable by the Company.
We pay federal, state and local taxes on behalf of our wholly owned subsidiary, Harris & Harris Enterprises, Inc., which is taxed as a C Corporation. For the three months ended March 31, 2008, and 2007, our income tax expense (benefit) for Harris & Harris Enterprises, Inc., was $30,400 and $0, respectively.
Continued qualification as a RIC requires us to satisfy certain investment asset diversification requirements in future years. Our ability to satisfy those requirements may not be controllable by us. There can be no assurance that we will qualify as a RIC in subsequent years.
NOTE 7. CAPITAL TRANSACTIONS
On June 25, 2007, we completed the sale of 1,300,000 shares of our common stock for gross proceeds of $14,027,000; net proceeds of this offering, after placement agent fees and offering costs of $1,033,832, were $12,993,168.
28
On April 4, 2008, we filed a Post-Effective Amendment to our registration statement with the SEC on Form N-2 to update our existing shelf registration statement and register an additional 1,300,000 shares of our common stock. After the effective date, the common stock may be sold at prices and on terms to be set forth in one or more supplements to the prospectus from time to time.
NOTE 8. CHANGE IN NET ASSETS PER SHARE
The following table sets forth the computation of basic and diluted per share net increases in net assets resulting from operations for the three months ended March 31, 2008, and March 31, 2007.
For the Three Months Ended March 31 | |||||||
2008 | 2007 | ||||||
| Numerator for decrease in net assets per share | $ | (3,289,035 | ) | $ | (6,390,160 | ) | |
| Denominator for basic and diluted weighted average shares | 23,314,573 | 21,277,576 | |||||
Basic and diluted net decrease in net assets per share resulting from operations | $ | (0.14 | ) | $ | (0.30 | ) | |
NOTE 9. SUBSEQUENT EVENTS
On May 1, 2008, we exercised our warrants to purchase shares of Ancora Pharmaceuticals, Inc., for $800,000.
On May 6, 2008, we made a $2,000,000 new investment in a privately held tiny technology portfolio company.
29
HARRIS & HARRIS GROUP, INC. FINANCIAL HIGHLIGHTS (Unaudited) |
Three Months Ended March 31 | |||||||
2008 | 2007 | ||||||
| Per Share Operating Performance | |||||||
| Net asset value per share, beginning of period | $ | 5.93 | $ | 5.42 | |||
| Net operating loss* | (0.11 | ) | (0.13 | ) | |||
| Net realized loss on investments* | (0.22 | ) | 0 | ||||
| Net decrease in unrealized | |||||||
| depreciation as a result of sales* | 0.22 | 0 | |||||
| Net increase in unrealized | |||||||
| depreciation on investments held* | (0.03 | ) | (0.17 | ) | |||
| Total from investment operations* | (0.14 | ) | (.30 | ) | |||
| Net increase as a result of stock-based | |||||||
| compensation expense | 0.07 | 0.08 | |||||
| Net increase as a result of proceeds from exercise | |||||||
| of options | 0.00 | 0.07 | |||||
| Total increase from capital stock transactions | 0.07 | 0.15 | |||||
| Net asset value per share, end of period | $ | 5.86 | $ | 5.27 | |||
| Stock price per share, end of period | $ | 7.13 | $ | 12.92 | |||
Total return based on stock price (1) | (18.89 | )% | 6.87 | % | |||
Supplemental Data: | |||||||
| Net assets, end of period | $ | 136,541,289 | $ | 112,526,302 | |||
Ratio of expenses to average net assets (1) | 2.2 | % | 2.9 | % | |||
Ratio of net operating loss to average net assets (1) | (1.8 | )% | (2.4 | )% | |||
| Cash dividends paid per share | $ | 0 | $ | 0 | |||
| Tax payable on behalf of shareholders on | |||||||
| the deemed dividend per share | $ | 0 | $ | 0 | |||
| Number of shares outstanding, end of period | 23,314,573 | 21,341,029 | |||||
*Based on Average Shares Outstanding.
(1) Not Annualized
The accompanying notes are an integral part of this schedule.
30
Item 2. Management's Discussion and Analysis of Financial Condition
and Results of Operations
The information contained in this section should be read in conjunction with the Company's unaudited March 31, 2008 Consolidated Financial Statements and the Company's audited 2007 Consolidated Financial Statements and notes thereto.
Background and Overview
We incorporated under the laws of the state of New York in August 1981. In 1983, we completed an initial public offering and invested $406,936 in Otisville BioTech, Inc., which also completed an initial public offering later that year. In 1984, Charles E. Harris purchased a controlling interest in us which also made him the control person of Otisville. We then divested our other assets and became a financial services company, with the investment in Otisville as the initial focus of our business activity.
In 1992, we registered as an investment company under the 1940 Act, commencing operations as a closed-end, non-diversified investment company. In 1995, we elected to become a business development company subject to the provisions of Sections 55 through 65 of the 1940 Act.
Throughout our corporate history, we have made early stage venture capital investments in a variety of industries. We define venture capital investments as investments in start-up firms and small businesses with exceptional growth potential. We have invested a substantial portion of our assets in venture capital investments of private, development stage or start-up companies. These private businesses tend to be thinly capitalized, unproven, small companies that lack management depth, have little or no history of operations and are developing unproven technologies. At March 31, 2008, $83,097,863, or 60.86 percent, of our net assets at fair value consisted of private venture capital investments, net of unrealized depreciation of $915,941. At December 31, 2007, $78,110,384, or 56.5 percent, of our net assets at fair value consisted of private venture capital investments, net of unrealized depreciation of $4,567,144.
Since our investment in Otisville in 1983 through March 31, 2008, we have made a total of 81 venture capital investments, including four private placement investments in securities of publicly traded companies. We have exited 47 of these 81 investments, realizing total proceeds of $143,895,288 on our invested capital of $56,349,559. As measured from first dollar in to last dollar out, the average and median holding periods for these 47 investments were 3.77 years and 3.20 years, respectively. As measured by the 165 separate rounds of investment within these 47 investments, the average and median holding periods for the 165 separate rounds of investment were 2.93 years and 2.64 years, respectively.
In 1994, we made our first tiny technology investment. From August 2001 through March 31, 2008, all 39 of our initial investments have been in tiny technology. From August 2001 through March 31, 2008, we have invested a total (before any subsequent write-ups, write-downs or dispositions) of $93,070,524 in tiny technology.
We currently have 31 active tiny technology companies in our portfolio, including one tiny technology investment made prior to 2001. At March 31, 2008, from first dollar in, the average and median holding periods for these 31 active tiny technology investments were 3.16 years and 2.87 years, respectively.
31
Two of our portfolio companies have been considering with their advisors the possibility of filing for initial public offerings (IPOs) in 2008. There can be no assurance that either of them will file for an IPO in 2008, and a variety of factors, including stock market and general business conditions, could lead either or both of them to terminate such considerations.
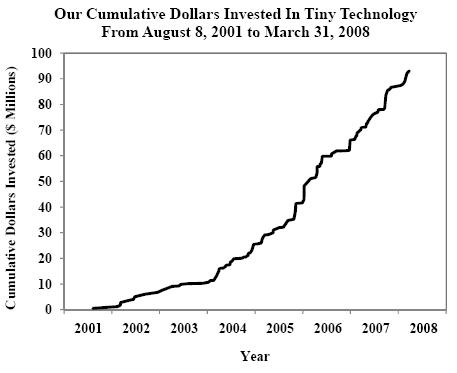
The following is a summary of our initial and follow-on investments in tiny technology from 2001 to the present. We consider a "round led" to be a round where we were the new investor or the leader of a set of new investors in an investee company. Typically, but not always, the lead investor negotiates the price and terms of a deal with the investee company.
2001 | 2002 | 2003 | 2004 | 2005 | 2006 | 2007 | YTD 3/31/08 | ||||||||||||||||||
| Total Incremental Investments | $ | 489,999 | $ | 6,240,118 | $ | 3,812,600 | $ | 14,837,846 | $ | 16,251,339 | $ | 24,408,187 | $ | 20,595,161 | $ | 6,435,274 | |||||||||
No. of New Investments | 1 | 7 | 5 | 8 | 4 | 6 | 7 | 1 | |||||||||||||||||
No. of Follow-On Investment Rounds | 0 | 1 | 5 | 21 | 13 | 14 | 20 | 7 | |||||||||||||||||
No. of Rounds Led | 0 | 1 | 0 | 2 | 0 | 7 | 3 | 2 | |||||||||||||||||
Average Dollar Amount - Initial | $ | 489,999 | $ | 784,303 | $ | 437,156 | $ | 911,625 | $ | 1,575,000 | $ | 2,383,424 | $ | 1,086,441 | $ | 244,500 | |||||||||
Average Dollar Amount - Follow-On | N/A | $ | 750,000 | $ | 325,364 | $ | 359,278 | $ | 765,488 | $ | 721,974 | $ | 649,504 | $ | 884,396 | ||||||||||
32
We value our private venture capital investments each quarter as determined in good faith by our Valuation Committee, a committee of independent directors, within guidelines established by our Board of Directors in accordance with the 1940 Act. (See "Footnote to Consolidated Schedule of Investments" contained in "Consolidated Financial Statements.")
In the years 2001 through March 31, 2008, the Company recorded the following gross write-ups in privately held securities as a percentage of net assets at the beginning of the year ("BOY"), gross write-downs in privately held securities as a percentage of net assets at the beginning of the year, and net write-ups/(write-downs) in privately held securities as a percentage of net assets at the beginning of the year.
2001 | 2002 | 2003 | 2004 | 2005 | 2006 | 2007 | YTD 3/31/08 | ||||||||||||||||||
Net Asset Value, BOY | $ | 31,833,475 | $ | 24,334,770 | $ | 27,256,046 | $ | 40,682,738 | $ | 74,744,799 | $ | 117,987,742 | $ | 113,930,303 | $ | 138,363,344 | |||||||||
Gross Write-Downs During Year | $ | (2,532,730 | ) | $ | (5,400,005 | ) | $ | (1,256,102 | ) | $ | (5,711,229 | ) | $ | (3,450,236 | ) | $ | (4,211,323 | ) | $ | (7,810,794 | ) | $ | (1,364,103 | ) | |
Gross Write-Ups During Year | $ | 1,528,866 | $ | 285 | $ | 847,578 | $ | 6,288,397 | $ | 23,485,176 | $ | 279,363 | $ | 11,694,618 | $ | 651 | |||||||||
Gross Write-Downs as a Percentage of Net Asset Value, BOY | -7.96% | -22.19% | -4.61% | -14.04% | -4.62% | -3.57% | -6.86% | -0.99% | |||||||||||||||||
Gross Write-Ups as a Percentage of Net Asset Value, BOY | 4.80% | 0.00% | 3.11% | 15.46% | 31.42% | 0.24% | 10.26% | 0.00% | |||||||||||||||||
Net Write-Downs/Write-Ups as a Percentage of Net Asset Value, BOY | -3.15% | -22.19% | -1.49% | 1.42% | 26.8% | -3.33% | 3.40% | -0.99% | |||||||||||||||||
We have discretion in the investment of our capital. However, we invest primarily in illiquid equity securities of private companies. Generally, these investments take the form of preferred stock, are subject to restrictions on resale and have no established trading market. Our principal objective is to achieve long-term capital appreciation. Therefore, a significant portion of our investment portfolio provides little or no income in the form of dividends or interest. We earn interest income from fixed-income securities, including U.S. government and agency securities. The amount of interest income we earn varies with the average balance of our fixed-income portfolio and the average yield on this portfolio. Interest income is secondary to capital gains and losses in our results of operations.
33
We present the financial results of our operations utilizing accounting principles generally accepted in the United States for investment companies. On this basis, the principal measure of our financial performance during any period is the net increase/(decrease) in our net assets resulting from our operating activities, which is the sum of the following three elements:
Net Operating Income / (Loss) - the difference between our income from interest, dividends, and fees and our operating expenses.
Net Realized Income / (Loss) on Investments - the difference between the net proceeds of sales of portfolio securities and their stated cost, plus income from interests in limited liability companies.
Net Increase / (Decrease) in Unrealized Appreciation or Depreciation on Investments - the net unrealized change in the value of our investment portfolio.
Owing to the structure and objectives of our business, we generally expect to experience net operating losses and seek to generate increases in our net assets from operations through the long term appreciation of our venture capital investments. We have relied, and continue to rely, on proceeds from sales of investments, rather than on investment income, to defray a significant portion of our operating expenses. Because such sales are unpredictable, we attempt to maintain adequate working capital to provide for fiscal periods when there are no such sales.
Results of Operations
Three months ended March 31, 2008, as compared to the three months ended March 31, 2007
In the three months ended March 31, 2008, and March 31, 2007, we had net decreases in net assets resulting from operations of $3,289,035 and 6,390,160, respectively.
Investment Income and Expenses:
We had net operating losses of $2,480,618 and $2,667,118 for the three months ended March 31, 2008, and March 31, 2007, respectively. The variation in these results is primarily owing to the changes in investment income and operating expenses, including non-cash expenses of $1,466,980 in 2008 and $1,690,181 in 2007 associated with the granting of stock options. During the three months ended March 31, 2008, and 2007, total investment income was $576,302 and $652,498, respectively. During the three months ended March 31, 2008, and 2007, total operating expenses were $3,056,920 and $3,319,616, respectively.
During the three months ended March 31, 2008, as compared with the same period in 2007, investment income decreased owing to a decrease in our average holdings of U.S. government and agency securities. During the three months ended March 31, 2008, our average holdings of such securities were $57,481,316, as compared with $59,727,657 during the three months ended March 31, 2007.
34
Operating expenses, including non-cash, stock-based compensation expense, were $3,056,920 and $3,319,616 for the three months ended March 31, 2008, and March 31, 2007, respectively. The decrease in operating expenses for the three months ended March 31, 2008, as compared to the three months ended March 31, 2007, was primarily owing to decreases in salaries, benefits and stock-based compensation expense and to decreases in administration and operations expense, professional fees and directors' fees and expenses. Salaries, benefits and stock-based compensation expense decreased by $101,471, or four percent, through March 31, 2008, as compared to March 31, 2007, primarily as a result of a decrease in non-cash expense of $223,201 associated with the Harris & Harris Group, Inc. 2006 Equity Incentive Plan (the "Stock Plan"), offset by an increase in salaries and benefits owing to an increase in our head count as compared with that of the same period in 2007. At March 31, 2008, we had 13 full-time employees, as compared with 10 full-time employees and one part-time employee at March 31, 2007. While the non-cash, stock-based compensation expense for the Stock Plan increased our operating expenses by $1,466,980, this increase was offset by a corresponding increase to our additional paid-in capital, resulting in no net impact to our net asset value. The non-cash, stock-based compensation expense and corresponding increase to our additional paid-in capital may increase in future quarters. Administration and operations expense decreased by $79,010, or 20.7 percent, through March 31, 2008, as compared to March 31, 2007, primarily as a result of a decrease in our directors' and officers' liability insurance expense and decreases in the cost of the annual report and proxy-related expenses. Professional fees decreased by $43,963, or 24.1 percent, for the three months ended March 31, 2008, as compared with the same period in 2007, primarily as a result of a reduction in the cost of our annual compliance program audit and a reduction in certain accounting fees.
Realized Income and Losses from Investments:
During the three months ended March 31, 2008, we realized net losses on investments of $5,014,870, as compared with realized net losses on investments of $674 during the three months ended March 31, 2007.
During the three months ended March 31, 2008, we realized net losses of $5,014,870, consisting primarily of a realized loss of $1,326,072 on our investment in Chlorogen, Inc., and a realized loss of $3,688,581 on our investment in NanoOpto Corporation. During the first of quarter of 2008, we received a payment of $105,714 from the NanoOpto Corporation bridge note.
During the three months ended March 31, 2007, we realized net losses of $674, consisting primarily of losses in Exponential Business Development Company, partially offset by income from our investment in AlphaSimplex Group, LLC.
Net Unrealized Appreciation and Depreciation of Portfolio Securities:
During the three months ended March 31, 2008, net unrealized depreciation on total investments decreased by $4,252,651, or 108.3 percent, from net unrealized depreciation of $3,926,484 at December 31, 2007, to net unrealized appreciation of $326,167 at March 31, 2008. Net unrealized depreciation on total investments increased by $3,637,463, or 40.4 percent, during the three months ended March 31, 2007, from net unrealized depreciation of $9,007,420 at December 31, 2006, to net unrealized depreciation of $12,644,883 at March 31, 2007.
35
During the three months ended March 31, 2008, net unrealized depreciation on our venture capital investments decreased by $3,651,203, from $4,567,144 to $915,941, owing primarily to net realized losses of $1,326,072 and $3,688,581 on our investments in Chlorogen, Inc., and NanoOpto Corporation, respectively, and increases in the valuations of our investments in D-Wave Systems, Inc., of $11,704, Exponential Business Development Company of $193 and NeoPhotonics Corporation of $457, offset by decreases in the valuations of our investments in Ancora Pharmaceuticals, Inc., of $52,075, BridgeLux, Inc., of $1,345, Crystal-IS, Inc., of $283, Kereos, Inc., of $38,893, Mersana Therapeutics, Inc., of $5,406, Metabolon, Inc., of $734,465 and Questech Corporation of $462,437. We also had a decrease owing to foreign currency translation of $80,903 on our investment in D-Wave Systems, Inc. Unrealized appreciation on our U.S. government securities portfolio increased from $640,660 at December 31, 2007, to $1,242,108 at March 31, 2008.
During the three months ended March 31, 2007, net unrealized depreciation on our venture capital investments increased by $3,833,052, from $8,450,969 to $12,284,021, owing primarily to decreases in the valuations of our investments in Chlorogen, Inc., of $1,370,699, Evolved Nanomaterial Sciences, Inc., of $1,228,281, Nanomix, Inc., of $459,772, NanoOpto Corporation of $892,409 and Questech Corporation of $91,916, and an increase in the valuation of our investment in Polatis, Inc., of $190,680. We also had an increase owing to foreign currency translation of $18,156 on our investment in D-Wave Systems, Inc. Unrealized depreciation on our U.S. government securities portfolio decreased from $556,451 at December 31, 2006, to $360,862 at March 31, 2007.
Financial Condition
March 31, 2007
At March 31, 2008, our total assets and net assets were $140,772,639 and $136,541,289, respectively. At December 31, 2007, they were $142,893,332 and $138,363,344, respectively.
At March 31, 2008, net asset value per share ("NAV") was $5.86, as compared with $5.93 at December 31, 2007. At March 31, 2008, and December 31, 2007, our shares outstanding were 23,314,573.
Significant developments in the three months ended March 31, 2008, included an increase in the value of our venture capital investments of $4,987,479 and a decrease in the value of our investment in U.S. government obligations of $6,604,493. The increase in the value of our venture capital investments, from $78,110,384 at December 31, 2007, to $83,097,863 at March 31, 2008, resulted primarily from one new and seven follow-on investments and by a net increase of $3,651,203 in the net value of our previous venture capital investments. The decrease in the value of our U.S. government obligations, from $60,193,593 at December 31, 2007, to $53,589,100 at March 31, 2008, is primarily owing to the use of funds for investments totaling $6,435,274 and net operating expenses.
36
The following table is a summary of additions to our portfolio of venture capital investments made during the three months ended March 31, 2008:
New Investment | Amount | |||
| PolyRemedy, Inc. | $ | 244,500 | ||
Follow-on Investment | ||||
| Adesto Technologies Corporation | $ | 1,052,174 | ||
| BridgeLux, Inc. | $ | 1,000,001 | ||
| D-Wave Systems, Inc. | $ | 736,019 | ||
| Metabolon, Inc. | $ | 1,000,000 | ||
| Nextreme Thermal Solutions, Inc. | $ | 377,580 | ||
| Phoenix Molecular Corporation | $ | 25,000 | ||
| Solazyme, Inc. | $ | 2,000,000 | ||
| Total | $ | 6,435,274 | ||
The following tables summarize the values of our portfolios of venture capital investments and U.S. government obligations, as compared with their cost, at March 31, 2008, and December 31, 2007:
March 31, 2008 | December 31, 2007 | ||||||
| Venture capital investments, | |||||||
| at cost | $ | 84,013,804 | $ | 82,677,528 | |||
Net unrealized depreciation(1) | 915,941 | 4,567,144 | |||||
Venture capital investments, | $ | 83,097,863 | $ | 78,110,384 | |||
at fair value | |||||||
March 31, 2008 | December 31, 2007 | ||||||
| U.S. government | |||||||
| obligations, at cost | $ | 52,346,992 | $ | 59,552,933 | |||
Net unrealized appreciation(1) | 1,242,108 | 640,660 | |||||
U.S. government | |||||||
obligations, at value | $ | 53,589,100 | $ | 60,193,593 | |||
(1)At March 31, 2008, and December 31, 2007, the net accumulated unrealized appreciation (depreciation) on investments was $326,167 and $(3,926,484), respectively.
The following table summarizes the fair value composition of our venture capital investment portfolio at March 31, 2008, and December 31, 2007.
37
March 31, 2008 | December 31, 2007 | ||||||
Category | |||||||
| Tiny Technology | 99.9 | % | 99.9 | % | |||
| Other Venture Capital Investments | 0.1 | % | 0.1 | % | |||
Total Venture Capital Investments | 100.0 | % | 100.0 | % | |||
Liquidity
Our primary sources of liquidity are cash, receivables and freely marketable securities, net of short-term indebtedness. Our secondary sources of liquidity are restricted securities of companies that are publicly traded.
At March 31, 2008, and December 31, 2007, our total net primary liquidity was $54,309,215 and $61,183,136, respectively, and our secondary liquidity was $0 and $0, respectively.
The decrease in our primary liquidity from December 31, 2007, to March 31, 2008, is primarily owing to the use of funds for investments and payment of net operating expenses.
Capital Resources
On June 25, 2007, we completed the sale of 1,300,000 shares of our common stock from our shelf registration statement for gross proceeds of $14,027,000; net proceeds of this offering, after placement agent fees and offering costs of $1,033,832, were $12,993,168. We used the net proceeds of this offering to make new investments in tiny technology, as well as for follow-on investments in our existing venture capital investments and for working capital. Through March 31, 2008, we have used all of the net proceeds from this offering for these purposes.
On April 4, 2008, we filed a Post-Effective Amendment to our registration statement with the SEC on Form N-2 to update our existing shelf registration statement and register an additional 1,300,000 shares of our common stock. After the effective date, the common stock may be sold at prices and on terms to be set forth in one or more supplements to the prospectus from time to time.
Critical Accounting Policies
The Company's significant accounting policies are described in Note 3 to the Consolidated Financial Statements and in the Footnote to the Consolidated Schedule of Investments. Critical accounting policies are those that are both important to the presentation of our financial condition and results of operations and those that require management’s most difficult, complex or subjective judgments. The Company considers the following accounting policies and related estimates to be critical:
38
Stock-Based Compensation
Determining the appropriate fair-value model and calculating the fair value of share-based awards at the date of grant requires judgment. We use the Black-Scholes-Merton option pricing model to estimate the fair value of employee stock options, consistent with the provisions of SFAS No. 123(R). Management uses the Black-Scholes-Merton option pricing model because of the lack of the historical option data that is required for use in other, more complex models. Other models may yield fair values that are significantly different from those calculated by the Black-Scholes-Merton option pricing model.
Option pricing models, including the Black-Scholes-Merton model, require the use of subjective input assumptions, including expected volatility, expected life, expected dividend rate, and expected risk-free rate of return. In the Black-Scholes-Merton model, variations in the expected volatility or expected term assumptions have a significant impact on fair value. As the volatility or expected term assumptions increase, the fair value of the stock option increases. In the Black-Scholes-Merton model, the expected dividend rate and expected risk-free rate of return are not as significant to the calculation of fair value. A higher assumed dividend rate yields a lower fair value, whereas higher assumed interest rates yield higher fair values for stock options.
We use the simplified calculation of expected life described in the SEC’s Staff Accounting Bulletin 107 because of the lack of historical information about option exercise patterns. Future exercise behavior could be materially different than that which is assumed by the model.
Expected volatility is based on the historical fluctuations in the Company's stock. The Company's stock has historically been volatile, which increases the fair value.
SFAS No. 123(R) requires us to develop an estimate of the number of share-based awards that will be forfeited owing to employee turnover. Quarterly changes in the estimated forfeiture rate can have a significant effect on reported share-based compensation, as the effect of adjusting the rate for all expense amortization after the grant date is recognized in the period the forfeiture estimate is changed. If the actual forfeiture rate proves to be higher than the estimated forfeiture rate, then an adjustment will be made to increase the estimated forfeiture rate, which would result in a decrease to the expense recognized in the financial statements. If the actual forfeiture rate proves to be lower than the estimated forfeiture rate, then an adjustment will be made to decrease the estimated forfeiture rate, which would result in an increase to the expense recognized in the financial statements. Such adjustments would affect our operating expenses and additional paid-in capital, but would have no effect on our net asset value.
Valuation of Portfolio Investments
Our Valuation Committee, comprised of all of our independent Board members, is responsible for reviewing and approving the valuation of our assets within the guidelines established by the Board of Directors.
SFAS No. 157 defines fair value as the price at which an asset would be sold or a liability transferred in its principal market (or most advantageous market) from the perspective of the reporting entity.
39
The values assigned to these investments are based on available information and do not necessarily represent amounts that might ultimately be realized, as these amounts depend on future circumstances and cannot reasonably be determined until the individual investments are actually liquidated or become readily marketable.
Upon sale of investments, the values that are ultimately realized may be different from what is presently estimated. This difference could be material.
Pension and Post-Retirement Benefit Plan Assumptions
The Company provides a Retiree Medical Benefit Plan for employees who meet certain eligibility requirements. Several statistical and other factors that attempt to anticipate future events are used in calculating the expense and liability values related to our post-retirement benefit plans. These factors include assumptions we make about the discount rate, the rate of increase in healthcare costs, and mortality, among others.
The discount rate reflects the current rate at which the post-retirement benefit liabilities could be effectively settled considering the timing of expected payments for plan participants. In estimating this rate, we consider rates of return on high quality fixed-income investments included in published bond indexes. We consider the Moody’s Aa Corporate Bond Index and the Citigroup Pension Liability Index in the determination of the appropriate discount rate assumptions. The weighted average rate we utilized to measure our post retirement benefit obligation as of December 31, 2007, and to calculate our 2008 expense was 6.55 percent, which is an increase from the 5.75 percent rate used in determining the 2007 expense.
Recent Developments — Portfolio Companies
On May 1, 2008, we exercised our warrants to purchase shares of Ancora Pharmaceuticals, Inc., for $800,000.
On May 6, 2008, we made a $2,000,000 new investment in a privately held tiny technology portfolio company.
Forward-Looking Statements
The information contained herein may contain "forward-looking statements" based on our current expectations, assumptions and estimates about us and our industry. These forward-looking statements involve risks and uncertainties. Words such as "believe," "anticipate," "estimate," "expect," "intend," "plan," "will," "may," "might," "could," "continue" and other similar expressions identify forward-looking statements. In addition, any statements that refer to expectations, projections or other characterizations of future events or circumstances are forward-looking statements. Our actual results could differ materially from those anticipated in the forward-looking statements as a result of several factors more fully described in "Risk Factors" and elsewhere in this Form 10-Q, and in our Form 10-K for the year ended December 31, 2007. The forward-looking statements made in this Form 10-Q relate only to events as of the date on which the statements are made. We undertake no obligation to update publicly any forward-looking statements for any reason, even if new information becomes available or other events occur in the future.
40
Item 3. Quantitative and Qualitative Disclosures About Market Risk
Our business activities contain elements of risk. We consider the principal types of market risk to be valuation risk and the risk associated with fluctuations in interest rates. Although we are risk-seeking rather than risk-averse in our investments, we consider the management of risk to be essential to our business.
Value, as defined in Section 2(a)(41) of the 1940 Act, is (i) the market price for those securities for which market quotations are readily available and (ii) fair value as determined in good faith by, or under the direction of, the Board of Directors for all other assets. (See the "Valuation Procedures" in the "Footnote to Consolidated Schedule of Investments" contained in "Item 1. Consolidated Financial Statements.")
Neither our investments nor an investment in us is intended to constitute a balanced investment program.
We have invested a substantial portion of our assets in private development stage or start-up companies. These private businesses tend to be based on new technology and to be thinly capitalized, unproven, small companies that lack management depth and have not attained profitability or have no history of operations. Because of the speculative nature and the lack of a public market for these investments, there is significantly greater risk of loss than is the case with traditional investment securities. We expect that some of our venture capital investments will be a complete loss or will be unprofitable and that some will appear to be likely to become successful but never realize their potential. Even when our private equity investments complete initial public offerings (IPOs), we are normally subject to lock-up agreements for a period of time, and thereafter, the market for the unseasoned publicly traded securities may be relatively illiquid.
Because there is typically no public market for our interests in the small privately held companies in which we invest, the valuation of the equity interests in that portion of our portfolio is determined in good faith by our Valuation Committee, comprised of the independent members of our Board of Directors, in accordance with our Valuation Procedures. In the absence of a readily ascertainable market value, the determined value of our portfolio of equity interests may differ significantly from the values that would be placed on the portfolio if a ready market for the equity interests existed. Any changes in valuation are recorded in our consolidated statements of operations as "Net increase (decrease) in unrealized appreciation on investments." Changes in valuation of any of our investments in privately held companies from one period to another may be volatile.
We also invest in short-term money market instruments, and both short and long-term U.S. government and agency securities. To the extent that we invest in short and long-term U.S. government and agency securities, changes in interest rates result in changes in the value of these obligations which result in an increase or decrease of our net asset value. The level of interest rate risk exposure at any given point in time depends on the market environment, the expectations of future price and market movements, and the quantity and duration of both the short and long-term U.S. government and agency securities held by the Company, and it will vary from period to period. If the average interest rate on U.S. government securities at March 31, 2008, were to increase by 25, 75 and 150 basis points, the weighted average value of these securities held by us at March 31, 2008, would decrease by approximately $197,384, $592,153 and $1,184,305, respectively, and our net asset value would decrease correspondingly.
41
Most of our investments are denominated in U.S. dollars. We currently have one investment denominated in Canadian dollars. We are exposed to foreign currency risk related to potential changes in foreign currency exchange rates. The potential loss in fair value on this investment resulting from a 10 percent adverse change in quoted foreign currency exchange rates is $267,920 at March 31, 2008.
In addition, in the future, we may from time to time opt to borrow money to make investments. Our net investment income will be dependent upon the difference between the rate at which we borrow funds and the rate at which we invest such funds. As a result, there can be no assurance that a significant change in market interest rates will not have a material adverse effect on our net investment income in the event we choose to borrow funds for investing purposes.
Item 4. Controls and Procedures
(a) Disclosure Controls and Procedures. As of the end of the period covered by this report, the Company’s management, under the supervision and with the participation of our chief executive officer and chief financial officer, conducted an evaluation of the effectiveness of the design and operation of our disclosure controls and procedures (as required by Rules 13a-15 of the 1934 Act). Disclosure controls and procedures means controls and other procedures of an issuer that are designed to ensure that information required to be disclosed by the issuer in the reports that it files or submits under the 1934 Act is recorded, processed, summarized and reported, within time periods specified in the SEC's rules and forms, and that such information is accumulated and communicated to the issuer's management, as appropriate, to allow timely decisions regarding required disclosures. As of March 31, 2008, based upon this evaluation of our disclosure controls and procedures, our chief executive officer and chief financial officer concluded that our disclosure controls and procedures were effective.
(b) Changes in Internal Control Over Financial Reporting. There have not been any changes in the Company's internal control over financial reporting (as such term is defined in Rules 13a-15(f) and 15d-15(f) under the Exchange Act) during the first quarter of 2008 to which this report relates that have materially affected, or are reasonably likely to materially affect, the Company’s internal control over financial reporting.
42
PART II. OTHER INFORMATION
Item 1A. Risk Factors
Investing in our common stock involves significant risks relating to our business and investment objective. You should carefully consider the risks and uncertainties described in our Annual Report on Form 10-K for the year ended December 31, 2007, before you purchase any of our common stock. The risks described in our Annual Report on Form 10-K are not the only risks facing our Company. Unknown additional risks and uncertainties, or ones that we currently consider immaterial, may also impair our business. If any of these risks or uncertainties materialize, our business, financial condition or results of operations could be materially adversely affected. In this event, the trading price of our common stock could decline, and you could lose all or part of your investment.
Unstable credit markets could adversely affect our portfolio companies.
Although our portfolio companies rely primarily on equity financing, some of them borrow funds as well. Given the current credit environment, there can be no assurance that portfolio companies will be able to borrow money on a timely basis or on reasonable terms, which could have a negative impact on their operating performance, raise their cost of capital, or even jeopardize their existence. Furthermore, certain of our portfolio companies manage their cash positions by investing in money-market funds, auction-rate securities, or other short-term securities that are vulnerable to current credit conditions. Lack of liquidity in such investments, or even defaults by issuers of such securities, could restrict the amount of cash available to such portfolio companies. These events could lead to financial losses in our portfolio.
Item 6. | Exhibits | |
| 31.01* | Certification of CEO pursuant to Section 302 of the Sarbanes-Oxley Act of 2002. | |
| 31.02* | Certification of CFO pursuant to Section 302 of the Sarbanes-Oxley Act of 2002. | |
| 32* | Certification of CEO and CFO pursuant to 18 U.S.C. Section 1350, as adopted pursuant to Section 906 of the Sarbanes-Oxley Act of 2002. | |
*filed herewith
43
SIGNATURES
Pursuant to the requirements of the Securities Exchange Act of 1934, the Registrant has caused this report to be signed on its behalf by the undersigned thereunto duly authorized.
Harris & Harris Group, Inc.
/s/ Daniel B. Wolfe
By: Daniel B. Wolfe
Chief Financial Officer
/s/ Patricia N. Egan
By: Patricia N. Egan
Chief Accounting Officer
and Vice President
Date: May 8, 2008
44
EXHIBIT INDEX
Exhibit No. | Description |
| 31.01 | Certification of CEO pursuant to Section 302 of the Sarbanes-Oxley Act of 2002. |
| 31.02 | Certification of CFO pursuant to Section 302 of the Sarbanes-Oxley Act of 2002. |
| 32 | Certification of CEO and CFO pursuant to 18 U.S.C. Section 1350, as adopted |
| pursuant to Section 906 of the Sarbanes-Oxley Act of 2002. |
45