UNITED STATES
SECURITIES AND EXCHANGE COMMISSION
Washington, D.C. 20549
FORM N-CSR
CERTIFIED SHAREHOLDER REPORT OF REGISTERED
MANAGEMENT INVESTMENT COMPANIES
| | |
Investment Company Act file number | | 811-07358 |
Duff & Phelps Utility and Corporate Bond Trust Inc.
|
| (Exact name of registrant as specified in charter) |
| | |
| 55 East Monroe Street, Suite 3600, Chicago, Illinois | | 60603 |
| (Address of principal executive offices) | | (Zip code) |
| | |
| Alan M. Meder | | Lawrence R. Hamilton |
| Duff & Phelps Utility and Corporate Bond Trust Inc | | Mayer Brown LLP |
| 55 East Monroe Street, Suite 3600 | | 71 South Wacker Drive |
| Chicago, Illinois 60603 | | Chicago, Illinois 60606 |
| (Name and address of agents for service) |
Registrant’s telephone number, including area code: (312) 263-2610
Date of fiscal year end: December 31
Date of reporting period: June 30, 2008
| ITEM 1. | REPORTS TO STOCKHOLDERS. |
The Semi-Annual Report to Stockholders follows.
August 15, 2008
Dear Fellow Shareholders:
Your Fund’s Performance
During the first half of 2008, the performance of leveraged bond funds, including Duff & Phelps Utility and Corporate Bond Trust Inc. (the “DUC Fund”), was influenced by turbulence in the credit markets and ensuing doubts about the sustainability of the U.S. economic expansion. Turbulence in the credit markets was in part the result of problems engulfing the investment banking industry and a fear that those problems would spread throughout the broader markets. Questions about the sustainability of the U.S. economic expansion were fueled by speculation surrounding the extent to which a deteriorating housing market and the relentless rise in energy prices would restrain economic growth. As a result, the higher quality sectors of the bond market, including the DUC Fund, posted solid returns as many investors sought refuge from market volatility, while the equity markets struggled.
The following table compares the performance of the DUC Fund to various market benchmarks.
| | | | | | | | | | | | | | | |
For the period indicated
through June 30, 2008 | | DUC Fund (Per share
performance
with dividends
reinvested in
Fund plan) | | | DUC Fund (NAV-based
performance) | | | Lehman
Aggregate
Bond Index | | | Dow Jones
Industrial
Index (dividends
reinvested) | | | S&P 500
Index (dividends
reinvested) | |
| | | | | |
Six Months | | 6.86 | % | | 3.02 | % | | 1.13 | % | | (13.38 | %) | | (11.91 | %) |
One Year | | 3.51 | % | | 6.66 | % | | 7.12 | % | | (13.27 | %) | | (13.12 | %) |
5 Years (annualized) | | 0.28 | % | | 3.25 | % | | 3.86 | % | | 7.20 | % | | 7.58 | % |
Performance returns for the Dow Jones Industrial Index, the S&P 500 Index and the Lehman Aggregate Bond Index were obtained from Confluence Technologies Inc. DUC Fund per share-based returns and DUC Fund NAV-based returns were obtained from the Administrator of the DUC Fund. Past performance is not indicative of future results.
Based on the June 30, 2008 closing price of $10.65 and a monthly dividend of $0.065 per share, the DUC Fund common stock had an annualized dividend yield of 7.32%. The DUC Fund’s yield compares favorably with the 2.17% dividend yield of the S&P 500 Index and the 5.07% yield of the Lehman Aggregate Bond Index.
Market Overview and Outlook
After ending 2007 on a weak note, growth in U.S. gross domestic product remained sub-par during the first half of 2008. Weak consumer spending and declining business investment contributed to the slow domestic growth. In addition to falling home prices and slumping equity markets, the U.S. consumer was weighed down by surging food and energy costs. Consumer sentiment was also eroded by continuing declines in payroll employment. Turmoil in the financial markets, in part caused by sub-prime lending related write-downs in the banking industry, caused credit conditions to worsen. Businesses also appeared to become more cautious, as higher input prices and rising costs of capital brought future profitability into question. To some extent, solid growth outside the United States offset the slowdown in U.S. economic growth.
After more than a year of stable monetary policy, the Federal Open Market Committee (“FOMC”) began reducing the target federal funds in the third quarter of 2007. The FOMC noted that the reduction was intended to “forestall some of the adverse effects on the broader economy that might otherwise arise from the disruptions in financial markets and to promote moderate growth over time”. Beginning in September 2007, the FOMC reduced the target federal funds rate seven times for a total of 325 basis points. The last reduction came in April 2008 and brought the target federal funds rate down to 2.00%. The FOMC held the target federal funds rate steady at its June meeting, citing that “in light of the continued increases in the prices of energy and some other commodities and the elevated state of some indicators of inflation expectations, uncertainty about the inflation outlook remains high”.
While the target federal funds rate was being reduced, the shorter end of the U.S. Treasury yield curve shifted downward, making the entire yield curve more positively sloped (i.e., long-term rates higher than short-term rates). During the first half of 2008, yields decreased by 43 basis points on two-year maturities and by 5 basis points on ten-year maturities, while yields
1
increased by 7 basis points on thirty-year maturities. Helping drive short-term interest rates lower was a “flight to quality” trend that led many investors to seek refuge in the U.S. Treasury market. At the same time, the more credit sensitive areas of the bond market were the victim of contagion from problems that surfaced in the investment banking industry, and valuations often declined, even as fundamentals remained strong and defaults remained low. As a result, the broader fixed income markets posted solid returns for the first half of 2008, while the returns on credit sensitive investments were restrained.
Looking ahead to the second half of 2008, tight credit conditions, continuing contraction in the housing market, elevated energy prices and a softening labor market are expected to restrain U.S. economic growth. Headline inflation will likely reflect the unpredictability of energy and commodity prices, leading to an increase in inflation expectations. The FOMC continues to walk the fine line between a slower economy and rising inflation, having recently acknowledged that “although downside risks to growth remain, they appear to have diminished, while the upside risks to inflation have increased”. The need to strike the balance between growth and inflation is expected to pave the way for stable monetary policy in the near term. Stable monetary policy, at a time when inflationary expectations are rising, could set the stage for upward pressure on long-term interest rates. At the same time, volatility in the financial markets is expected to remain high, as the impact of further write-downs works its way through the financial system. Under this scenario, the returns of leveraged bond funds would be restrained, by both negative pressure on bond valuations due to increased volatility and the potential for rising long-term interest rates.
About Your Fund
The use of leverage enables the DUC Fund to borrow at short-term rates and invest at long-term rates. As of June 30, 2008, the DUC Fund’s leverage consists of Auction Market Preferred Shares (“AMPS”) in the amount of $190 million. On that date, the amount of leverage represented by the AMPS constituted approximately 38% of the DUC Fund’s total assets. The amount and type of leverage used is determined by the Board of Directors based on the DUC Fund’s expected earnings relative to the anticipated costs (including fees and expenses) associated with the leverage. In addition, the longer term expected benefits of leverage are carefully weighed against the potential effect of increasing the volatility of both the DUC Fund’s net asset value and the market value of its common stock. Since the costs associated with discontinuing or initiating a leverage program based on short-term trends can be substantial, the Board takes a longer-term view when evaluating the merits of using leverage. Historically, the tendency of the U.S. yield curve to exhibit a positive slope (i.e., long-term rates higher than short-term rates) fosters an environment in which leverage can add incremental income.
In February, disruptions in the short-term fixed income market resulted in failures in the periodic auction of preferred stock issued by many closed-end funds, including the AMPS issued by the DUC Fund. An auction fails when there are insufficient clearing bids to purchase all the shares that current holders wish to sell. A failed auction is not an event of default of the issuer and does not impair the issuer’s ability to pay timely dividends to preferred shareholders. A failed auction means that the current holders retain their shares until the next periodic auction, and the dividend rate for the next dividend period is automatically set to the maximum rate permitted. One implication of the auction failures for common shareholders of the DUC Fund is that the cost of financing the leverage likely will be higher than it would have been if the rate was determined through a successful auction. This means that earnings available for common shareholders likely will be marginally lower as a result of the failed auctions. Currently, leverage remains beneficial to the DUC Fund common shareholders. However, there is no assurance that this will continue to be the case in the future. If the use of leverage were to cease being beneficial, the amount and type of leverage employed by the DUC Fund could potentially be modified or eliminated.
At its August 14, 2008 meeting, the Board took note of the August 7, 2008 announcement by the SEC’s Division of Enforcement that a preliminary settlement had been reached with a major broker-dealer that had marketed auction rate securities (ARS) to its customers. The terms of the settlement included an undertaking by the broker-dealer to purchase ARS at full face value from its retail customers within three months and to provide no-cost loans to those customers until the ARS are purchased. The broker-dealer also agreed to use its best efforts to liquidate preferred shares from its institutional customers by the end of 2009. On August 8, 2008, the SEC’s Division of Enforcement announced that a similar preliminary settlement had been reached with a second major broker-dealer. In the days following these announcements, several other major broker-dealers announced voluntary undertakings to purchase ARS from their customers. The DUC Fund’s management believes that many holders of the AMPS are customers of these major broker-dealers, and that additional broker-dealers are likely to announce similar undertakings in the future. The Board views the steps that broker-dealers are taking to provide liquidity to their customers who are holders of ARS as a positive development. Because it appears that these steps may lead to a resolution of the illiquidity that the holders of AMPS have experienced since February of this year, the Board has accepted management’s recommendation to suspend the efforts to obtain a credit facility from commercial banks that had been envisioned as a way of funding a redemption by the DUC Fund of some or all of its AMPS. The Board and management of the DUC Fund will continue to monitor developments affecting the liquidity of the AMPS.
2
The DUC Fund has no direct investments in sub-prime loans, collateralized debt obligations or structured investment vehicles (“SIVs”). In addition, the portfolio has no exposure to financial intermediaries that focus exclusively on either the sub-prime industry or SIVs. The DUC Fund’s exposure is indirect and is limited to financial institutions with diversified revenue streams. However, due to the inherent complexity of many SIVs, investors in the SIV market are often faced with a lack of transparency regarding their investments. The potential unwinding of troubled SIVs can cause the underlying assets to be sold at distressed prices that are significantly below the valuations previously recorded for those assets. Therefore, disruptions in the SIV market could weigh heavily on the valuations of leveraged bond funds, including the DUC Fund, as the lack of transparency causes investors to indiscriminately paint all funds with the same broad brush. Although it is impossible for the DUC Fund to be completely insulated from the sub-prime lending turmoil, management believes the diversification of the portfolio across sectors and issuers, should serve to limit volatility.
The DUC Fund seeks to provide investors with a stable monthly dividend that is primarily derived from current fiscal year net investment income. At times, a portion of the monthly distribution could be derived from realized capital gains and, to the extent necessary, paid-in-capital, in which case the DUC Fund is required to inform shareholders of the sources of the distribution based on U.S. generally accepted accounting principles (“GAAP”). A return of capital distribution does not necessarily reflect the DUC Fund’s investment performance and should not be confused with “yield” or “income”. Based on GAAP, for the six month period ended June 30, 2008, 79% of the total distributions were attributable to current year net investment income and 21% was in excess of current year net investment income and was therefore attributable to paid-in-capital. The characterization of the distributions for GAAP purposes and federal income tax purposes may differ, primarily because of a difference in the tax and GAAP accounting treatment of amortization for premiums on fixed income securities. As of the date of this letter, for federal income tax purposes, the Fund estimates that its current year distributions will be derived entirely from net investment income. In January 2009, a Form 1099-DIV will be sent to shareholders, which will state the amount and tax characterization of the DUC Fund’s 2008 distributions.
About Your Adviser
Since 1995, the Fund’s investment adviser, Duff & Phelps Investment Management Co. (the “Adviser”) has been a subsidiary of Phoenix Investment Partners, Ltd. (“PXP”). On February 7, 2008, PXP’s parent company, The Phoenix Companies, Inc., announced its intention to spin off PXP to its shareholders in the third quarter of 2008. On July 31, 2008, PXP announced that it will be renamed Virtus Investment Partners, Inc. following the spin-off.
Dividend Reinvestment and Cash Purchase Plan and Direct Deposit
To those of you receiving dividends in cash, you may want to consider taking advantage of the dividend reinvestment and cash purchase plan (the “Plan”) available to all registered shareholders of the DUC Fund. Under the Plan, the DUC Fund absorbs all administrative costs (except brokerage commissions, if any) so that the total amount of your dividends and other distributions may be reinvested in additional shares of the DUC Fund. Also, the cash purchase option permits participants to purchase shares in the open market through the Plan Agent. Additional information about the Plan is available from the Plan Agent, The Bank of New York, at 1-866-221-1681, or for more details, please refer to page 14.
For those shareholders receiving dividend checks, you may want to consider having your monthly dividends deposited, free of charge, directly into your bank account through electronic funds transfer. Direct deposit provides the convenience of automatic and immediate access to your funds, while eliminating the possibility of mail delays and lost, stolen or destroyed checks. Additional information about direct deposit is available from The Bank of New York, at 1-800-432-8224.
For more information about the DUC Fund, shareholders can access www.dpimc.com.
We appreciate your investment in Duff & Phelps Utility and Corporate Bond Trust Inc. and look forward to continuing our service to you.
Sincerely,
| | |
 | |  |
| Francis E. Jeffries, CFA | | Nathan I. Partain, CFA |
| Chairman of the Board | | Director, President & CEO |
3
DUFF & PHELPS UTILITY AND CORPORATE BOND TRUST INC.
Portfolio of Investments
June 30, 2008 (Unaudited)
| | | | | | |
Principal
Amount
(000) | | Description | | Value
(Note 1) |
| | | | | | | |
| | | | LONG-TERM INVESTMENTS—151.1% | | | |
| | | | U.S. Government and Agency Obligations—8.8% | | | |
| | | | Federal Home Loan Bank, | | | |
| $ | 10,000 | | 7.125%, 1/15/10 | | $ | 10,240,300 |
| | | | Federal National Mortgage Association, | | | |
| | 10,000 | | 7.25%, 1/15/10 | | | 10,639,460 |
| | 5,000 | | 6.00%, 5/15/11 | | | 5,327,750 |
| | 282 | | 8.00%, 10/01/30 | | | 304,765 |
| | 1,005 | | 7.00%, 12/01/31 | | | 1,062,628 |
| | | | Government National Mortgage
Association Pass-Through Certificates, | | | |
| | 15 | | 7.00%, 3/15/26 | | | 15,800 |
| | 93 | | 8.00%, 11/15/30 | | | 101,932 |
| | 35 | | 8.00%, 2/15/31 | | | 37,932 |
| | | | | |
|
|
| | | | Total U.S. Government and
Agency Obligations
(Cost $27,635,301) | | | 27,730,567 |
| | | | | |
|
|
| | | | Corporate Bonds—135.9% | | | |
| | | | Financial—32.7% | | | |
| | | | Bank United, | | | |
| | 4,910 | | 8.00%, 3/15/09 | | | 4,775,893 |
| | | | Bear Stearns & Co. Inc., | | | |
| | 7,000 | | 7.625%, 12/07/09 | | | 7,238,553 |
| | | | Boeing Capital Corp., | | | |
| | 5,000 | | 6.50%, 2/15/12 | | | 5,310,875 |
| | | | Duke Realty Corp, L.P., | | | |
| | 6,000 | | 6.80%, 2/12/09 | | | 6,036,012 |
| | | | ERP Operating Limited Partnership, | | | |
| | 5,000 | | 6.625%, 3/15/12 | | | 5,082,010 |
| | | | Firstar Bank, N.A., | | | |
| | 7,000 | | 7.125%, 12/01/09 | | | 7,265,279 |
| | | | Household Finance Corp., | | | |
| | 10,000 | | 8.00%, 7/15/10 | | | 10,461,900 |
| | | | JPMorgan Chase & Co., | | | |
| | 10,000 | | 7.875%, 6/15/10 | | | 10,470,450 |
| | | | Keybank, N.A., | | | |
| | 3,200 | | 7.30%, 5/01/11 | | | 3,133,424 |
| | | | Mack-Cali Realty, L.P., | | | |
| | 7,000 | | 7.75%, 2/15/11 | | | 7,261,261 |
| | | | Merrill Lynch & Co., | | | |
| | 5,000 | | 6.50%, 7/15/18 | | | 4,656,615 |
| | 5,000 | | 6.875%, 11/15/18 | | | 4,782,130 |
| | | | NationsBank Capital Trust IV, | | | |
| | 10,000 | | 8.25%, 4/15/27 | | | 10,036,290 |
| | | | PNC Funding Corp., | | | |
| | 6,000 | | 7.50%, 11/01/09 | | | 6,208,362 |
See Notes to Financial Statements.
| | | | | | |
Principal
Amount
(000) | | Description | | Value
(Note 1) |
| | | | | | | |
| | | | Simon Property Group, L.P., | | | |
| $ | 5,000 | | 7.125%, 2/09/09 | | $ | 5,026,415 |
| | 5,000 | | 7.00%, 7/15/09 | | | 5,036,845 |
| | | | | |
|
|
| | | | | | | 102,782,314 |
| | | | | |
|
|
| | | | Industrial—28.7% | | | |
| | | | Archer-Daniels-Midland Company, | | | |
| | 4,000 | | 7.125%, 3/01/13 | | | 4,381,324 |
| | | | Coca-Cola Enterprises, Inc., | | | |
| | 5,000 | | 8.50%, 2/01/12 | | | 5,612,595 |
| | | | DaimlerChrysler NA Holdings, | | | |
| | 10,000 | | 7.20%, 9/01/09 | | | 10,288,460 |
| | | | Dow Chemical Company, | | | |
| | 7,000 | | 9.00%, 4/01/21 | | | 8,825,957 |
| | | | Potash Corporation of Saskatchewan, Inc., | | | |
| | 6,578 | | 7.75%, 5/31/11 . | | | 7,077,967 |
| | | | Sun Company, Inc., | | | |
| | 5,000 | | 9.00%, 11/01/24 | | | 6,015,415 |
| | | | Tele-Communications, Inc., | | | |
| | 5,275 | | 10.125%, 4/15/22. | | | 6,547,414 |
| | 3,200 | | 9.875%, 6/15/22 | | | 3,908,566 |
| | | | Time Warner Entertainment Company, L.P., | | | |
| | 5,000 | | 8.875%, 10/01/12 | | | 5,470,045 |
| | | | Time Warner, Inc., | | | |
| | 5,000 | | 9.15%, 2/01/23. | | | 5,748,560 |
| | | | Union Pacific Corp., | | | |
| | 9,258 | | 7.375%, 9/15/09 . | | | 9,487,219 |
| | | | USX Corporation, | | | |
| | 10,000 | | 9.125%, 1/15/13 . | | | 11,387,400 |
| | | | Wal-Mart Stores, Inc., | | | |
| | 5,000 | | 6.875%, 8/10/09. | | | 5,185,185 |
| | | | | |
|
|
| | | | | | | 89,936,107 |
| | | | | |
|
|
| | | | Telephone—20.4% | | | |
| | | | British Telecommunications PLC, | | | |
| | 7,000 | | 8.625%, 12/15/10 | | | 7,520,401 |
| | | | Deutsche Telekom International Finance, | | | |
| | 12,000 | | 8.00%, 6/15/10 | | | 12,700,380 |
| | | | France Telecom SA, | | | |
| | 5,000 | | 7.75%, 3/01/11. | | | 5,298,400 |
| | | | Koninklijke (Royal) KPN NV, | | | |
| | 5,000 | | 8.00%, 10/01/10 | | | 5,292,905 |
| | | | New Cingular Wireless Services, Inc., | | | |
| | 9,000 | | 8.125%, 5/01/12 | | | 9,865,818 |
| | | | New York Telephone Co., | | | |
| | 5,000 | | 8.625%, 11/15/10 | | | 5,434,845 |
| | | | Sprint Corp., | | | |
| | 10,125 | | 9.25%, 4/15/22 | | | 9,738,428 |
4
| | | | | | |
Principal
Amount
(000) | | Description | | Value
(Note 1) |
| | | | | | | |
| | | | Verizon Global Funding Corp., | | | |
| $ | 7,500 | | 7.375%, 9/01/12 | | $ | 8,099,393 |
| | | | | |
|
|
| | | | | | | 63,950,570 |
| | | | | |
|
|
| | | | Utilities—54.1% | | | |
| | | | AGL Capital Corp., | | | |
| | 10,000 | | 7.125%, 1/14/11 | | | 10,464,920 |
| | | | CalEnergy Company, Inc., | | | |
| | 10,000 | | 8.48%, 9/15/28 | | | 11,696,710 |
| | | | CenterPoint Energy Resources Corp., | | | |
| | 10,000 | | 7.75%, 2/15/11 | | | 10,550,220 |
| | | | Duke Energy Corporation, | | | |
| | 10,000 | | 7.375%, 3/01/10 | | | 10,512,540 |
| | | | FPL Group Capital, Inc., | | | |
| | 5,050 | | 7.375%, 6/01/09 | | | 5,221,675 |
| | | | Hydro-Quebec, | | | |
| | 10,000 | | 7.50%, 4/01/16 | | | 11,868,340 |
| | | | Illinois Power Co., | | | |
| | 8,485 | | 7.50%, 6/15/09 | | | 8,632,155 |
| | | | KeySpan Gas East Corporation, | | | |
| | 10,088 | | 7.875%, 2/01/10 | | | 10,609,086 |
| | | | NSTAR, | | | |
| | 7,020 | | 8.00%, 2/15/10 | | | 7,449,792 |
| | | | ONEOK Partners, L.P., | | | |
| | 6,040 | | 8.875%, 6/15/10 | | | 6,475,852 |
| | | | Progress Energy, Inc., | | | |
| | 6,000 | | 7.10%, 3/01/11 | | | 6,317,244 |
| | | | PSE&G Power, LLC., | | | |
| | 7,195 | | 7.75%, 4/15/11 | | | 7,671,381 |
| | | | Sempra Energy, | | | |
| | 10,000 | | 7.95%, 3/01/10 | | | 10,546,150 |
| | | | South Carolina Electric & Gas Co., | | | |
| | 6,000 | | 6.125%, 3/01/09 | | | 6,078,246 |
| | | | Southern California Edison Company, | | | |
| | 5,512 | | 7.625%, 1/15/10 | | | 5,763,915 |
| | | | Spectra Energy Capital LLC., | | | |
| | 10,000 | | 7.50%, 10/01/09 | | | 10,201,340 |
| | | | Trans-Canada Pipelines Limited, | | | |
| | 10,000 | | 9.875%, 1/01/21 | | | 13,006,050 |
| | | | Wisconsin Energy Corp., | | | |
| | 6,000 | | 6.50%, 4/01/11 | | | 6,264,918 |
| | | | Xcel Energy, Inc., | | | |
| | 10,131 | | 7.00%, 12/01/10 | | | 10,574,748 |
| | | | | |
|
|
| | | | | | | 169,905,282 |
| | | | | |
|
|
| | | | Total Corporate Bonds
(Cost $426,880,529) | | | 426,574,273 |
| | | | | |
|
|
| | | | | | |
Principal
Amount
(000)/
Shares | | Description | | Value
(Note 1) |
| | | | | | | |
| | | | Asset-Backed Securities—1.7% | | | |
| | | | Detroit Edison Securitization Funding
LLC 2001-1 A6, | | | |
| $ | 5,000 | | 6.62%, 3/01/16 | | $ | 5,356,177 |
| | | | | |
|
|
| | | | Total Asset-Backed Securities
(Cost $5,925,000) | | | 5,356,177 |
| | | | | |
|
|
| | | | | | | |
| | | | Non-Convertible Preferred Stock—4.7% | |
| | | | Financial—4.7% | | | | |
| | | | Duke Realty Corp., Series M, | | | | |
| | 100,000 | | 6.95% | | | 2,002,000 | |
| | | | Duke Realty Corp., Series N, | | | | |
| | 100,000 | | 7.25% | | | 2,113,000 | |
| | | | Kimco Realty Corp., Series G, | | | | |
| | 100,000 | | 7.75% | | | 2,377,000 | |
| | | | Public Storage, Inc., Series I, | | | | |
| | 120,000 | | 7.25% | | | 2,688,000 | |
| | | | Realty Income Corp., Series D, | | | | |
| | 100,000 | | 7.375% | | | 2,390,000 | |
| | | | UDR, Inc., Series G, | | | | |
| | 100,000 | | 6.75% | | | 2,183,000 | |
| | | | Vornado Realty Trust, Series I, | | | | |
| | 50,000 | | 6.625% | | | 970,500 | |
| | | | | |
|
|
|
| | | | Total Non-Convertible Preferred Stock
(Cost $16,713,000) | | | 14,723,500 | |
| | | | | |
|
|
|
| | | | Total Long-Term Investments
(Cost $477,153,830) | | | 474,384,517 | |
| | | | | |
|
|
|
| | | | SHORT-TERM INVESTMENTS—4.3% | | | | |
| | | | U.S. Treasury Bills, | | | | |
| $ | 1,800 | | 1.74%, 7/31/08 | | | 1,797,405 | |
| | 1,800 | | 1.88%, 8/28/08 | | | 1,794,978 | |
| | 1,800 | | 1.87%, 9/25/08 | | | 1,792,582 | |
| | | | | |
|
|
|
| | | | | | | 5,384,965 | |
| | 8,000 | | U.S. Treasury Note, | | | | |
| | | | 4.875%, 10/31/08 | | | 8,077,813 | |
| | | | | |
|
|
|
| | | | Total Short-Term Investments
(Cost $13,461,623) | | | 13,462,778 | |
| | | | | |
|
|
|
| | | | Total Investments—155.4%
(Cost $490,615,453) | | | 487,847,295 | |
| | | | Other Assets in Excess of
Liabilities—5.1% | | | 16,009,758 | |
| | | | Liquidation Value of Preferred
Shares—(60.5)% | | | (190,000,000 | ) |
| | | | | |
|
|
|
| | | | Net Assets Applicable to Common
Stock—100% | | $ | 313,857,053 | |
| | | | | |
|
|
|
See Notes to Financial Statements.
5
Notes
The Fund implemented Financial Accounting Standards Board Statement of Financial Accounting Standards No. 157, Fair Value Measurements (“FAS 157”), effective January 1, 2008. In accordance with FAS 157, fair value is defined as the price that the Fund would receive upon selling an investment in a timely transaction to an independent buyer in the principal or most advantageous market of the investment. FAS 157 establishes a three-tier hierarchy to classify fair value measurements for disclosure purposes. The three tier hierarchy of inputs is summarized in the three broad levels listed below.
Level 1—quoted prices in active markets for identical securities
Level 2—other significant observable inputs (including quoted prices for similar securities, interest rates, prepayment speeds, credit risks, etc.)
Level 3—significant unobservable inputs (including the Fund’s own assumptions in determining fair value of investments)
The inputs or methodology used for valuing securities are not necessarily an indication of the risk associated with investing in these securities. The following is a summary of the inputs used to value each of the Fund’s investments as of June 30, 2008.
Level 1—$ 14,723,500
Level 2—$473,123,795
Total— $487,847,295
The Fund has not held any Level 3 securities (valued using unobservable inputs) or other financial instruments at any time during the six month period ended June 30, 2008.
Summary of Ratings as a Percentage of Long-Term Investments
as of June 30, 2008
(Unaudited)
| | |
Rating *
| | %
|
AAA | | 7.0 |
AA | | 4.8 |
A | | 36.2 |
BBB | | 49.9 |
BB | | 2.1 |
| | |
|
| | | 100.0 |
| | |
|
| * | Based on the lowest rating of Standard & Poor’s Ratings Services or Moody's Investors Service, Inc. |
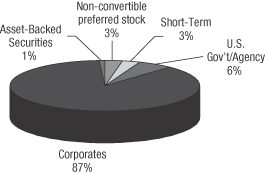
Sector Allocation as a Percentage of Total Investments
as of June 30, 2008
(Unaudited)
See Notes to Financial Statements.
6
DUFF & PHELPS UTILITY AND CORPORATE BOND TRUST INC.
Statement of Assets and Liabilities
June 30, 2008
(Unaudited)
| | | | |
| |
| Assets | | | | |
| |
Investments, at value (cost $490,615,453) | | $ | 487,847,295 | |
| |
Cash | | | 7,137,701 | |
| |
Interest receivable | | | 9,415,687 | |
| |
Dividends receivable | | | 84,505 | |
| |
Other assets (Note 7) | | | 59,990 | |
| | |
|
|
|
| |
Total assets | | | 504,545,178 | |
| | |
|
|
|
| |
| Liabilities | | | | |
| |
Investment advisory fee payable (Note 2) | | | 213,406 | |
| |
Dividends payable on common shares | | | 130,115 | |
| |
Dividends payable on Auction Market Preferred Shares | | | 106,280 | |
| |
Deferred compensation payable (Note 7) | | | 55,250 | |
| |
Administrative fee payable (Note 2) | | | 39,884 | |
| |
Accrued expenses | | | 143,190 | |
| | |
|
|
|
| |
Total liabilities | | | 688,125 | |
| | |
|
|
|
| |
Auction Market Preferred Shares, 7,600 shares issued and outstanding, liquidation preference $25,000 per share (Note 6) | | | 190,000,000 | |
| | |
|
|
|
| |
Net Assets Applicable to
Common Stock | | $ | 313,857,053 | |
| | |
|
|
|
| |
| Capital | | | | |
| |
Common stock, $.01 par value, 599,992,400 shares authorized, 27,076,161 shares issued and outstanding (Note 5) | | $ | 270,761 | |
| |
Additional paid-in capital | | | 367,524,132 | |
| |
Distributions in excess of net investment income | | | (17,776,086 | ) |
| |
Accumulated net realized loss on investment transactions | | | (33,393,596 | ) |
| |
Net unrealized depreciation on investments | | | (2,768,158 | ) |
| | |
|
|
|
| |
Net Assets Applicable to
Common Stock | | $ | 313,857,053 | |
| | |
|
|
|
Net asset value per share of common stock: ($313,857,053 ÷ 27,076,161 shares of common stock issued and outstanding) | | $ | 11.59 | |
| | |
|
|
|
DUFF & PHELPS UTILITY AND CORPORATE
BOND TRUST INC.
Statement of Operations
For the Six Months Ended June 30, 2008
(Unaudited)
| | | | |
| |
| Investment Income | | | | |
| |
Interest income | | $ | 13,203,069 | |
| |
Dividend income | | | 601,094 | |
| | |
|
|
|
| |
Total Investment income | | | 13,804,163 | |
| | |
|
|
|
| |
Expenses | | | | |
| |
Investment advisory fees (Note 2) | | | 1,267,203 | |
| |
Commissions expense—Auction Market Preferred Shares | | | 238,556 | |
| |
Administrative fees (Note 2) | | | 238,435 | |
| |
Directors’ fees and expenses | | | 138,159 | |
| |
Professional fees | | | 70,678 | |
| |
Reports to shareholders | | | 44,795 | |
| |
Custodian fees and expenses | | | 25,496 | |
| |
Transfer agent fees and expenses | | | 24,243 | |
| |
Registration fees | | | 11,928 | |
| |
Leverage fees and expenses | | | 6,980 | |
| |
Other | | | 16,821 | |
| | |
|
|
|
| |
Total expenses | | | 2,083,294 | |
| | |
|
|
|
| |
Net investment income | | | 11,720,869 | |
| | |
|
|
|
| |
| Realized and Unrealized Gain/(Loss) On Investments | | | | |
| |
Net realized gain on investment transactions | | | 8,426,330 | |
| |
Net change in unrealized appreciation/depreciation on investments | | | (7,141,060 | ) |
| | |
|
|
|
| |
Net realized and unrealized gain on investments | | | 1,285,270 | |
| | |
|
|
|
| |
| Dividends and Distributions On Auction Market Preferred Shares from Net Investment Income | | | (4,028,049 | ) |
| | |
|
|
|
| |
| Net Increase In Net Assets Applicable to Common Stock Resulting From Operations | | $ | 8,978,090 | |
| | |
|
|
|
See Notes to Financial Statements.
7
DUFF & PHELPS UTILITY AND CORPORATE
BOND TRUST INC.
Statements of Changes in Net Assets
| | | | | | | | |
| | |
| | | For the Six
Months Ended
June 30, 2008
(Unaudited)
| | | For the
Year Ended
December 31,
2007
| |
| | |
Operations | | | | | | | | |
| | |
Net investment income | | $ | 11,720,869 | | | $ | 25,117,504 | |
| | |
Net realized gain/(loss) on investment transactions | | | 8,426,330 | | | | (2,506,618 | ) |
| | |
Net change in unrealized appreciation/depreciation on investments | | | (7,141,060 | ) | | | 144,995 | |
| | |
Dividends and distributions on Auction Market Preferred Shares from net investment income | | | (4,028,049 | ) | | | (10,269,256 | ) |
| | |
|
|
| |
|
|
|
| | |
Net increase in net assets resulting from operations | | | 8,978,090 | | | | 12,486,625 | |
| | |
|
|
| |
|
|
|
| | |
Dividends and Distributions on Common Stock
from and in excess of net investment income | | | (10,559,704 | ) | | | (21,119,428 | ) |
| | |
|
|
| |
|
|
|
| | |
Capital Stock Transactions | | | | | | | | |
| | |
Offering costs—Auction Market Preferred Shares | | | — | | | | 15,845 | |
| | |
|
|
| |
|
|
|
| | |
Net increase in net assets resulting from capital stock transactions | | | — | | | | 15,845 | |
| | |
|
|
| |
|
|
|
| | |
Total decrease in net assets | | | (1,581,614 | ) | | | (8,616,958 | ) |
| | |
| Net Assets | | | | | | | | |
| | |
Beginning of period | | | 315,438,667 | | | | 324,055,625 | |
| | |
|
|
| |
|
|
|
| | |
End of period(a) | | $ | 313,857,053 | | | $ | 315,438,667 | |
| | |
|
|
| |
|
|
|
(a) includes distributions in excess of net investment income of | | $ | (17,776,086 | ) | | $ | (14,909,202 | ) |
| | |
|
|
| |
|
|
|
See Notes to Financial Statements.
8
DUFF & PHELPS UTILITY AND CORPORATE BOND TRUST INC.
Financial Highlights
| | | | | | | | | | | | | | | | | | | | | | | | |
| | | For the
Six Months
Ended
June 30, 2008
(Unaudited)
| | | For the Year Ended December 31,
| |
| PER SHARE OPERATING PERFORMANCE | | | 2007
| | | 2006
| | | 2005
| | | 2004
| | | 2003
| |
Net asset value, beginning of year | | $ | 11.65 | | | $ | 11.97 | | | $ | 12.50 | | | $ | 13.51 | | | $ | 13.85 | | | $ | 13.03 | |
| | |
|
|
| |
|
|
| |
|
|
| |
|
|
| |
|
|
| |
|
|
|
Net investment income(1) | | | 0.43 | | | | 0.93 | | | | 0.71 | | | | 0.73 | | | | 0.86 | | | | 0.93 | |
Net realized and unrealized gain/(loss) on investment transactions | | | 0.05 | | | | (0.09 | ) | | | (0.25 | ) | | | (0.72 | ) | | | (0.18 | ) | | | 0.91 | |
Dividends and distributions on Auction Market Preferred Shares from net investment income | | | (0.15 | ) | | | (0.38 | ) | | | (0.07 | ) | | | — | | | | — | | | | — | |
| | |
|
|
| |
|
|
| |
|
|
| |
|
|
| |
|
|
| |
|
|
|
Net increase from investment operations | | | 0.33 | | | | 0.46 | | | | 0.39 | | | | 0.01 | | | | 0.68 | | | | 1.84 | |
| | |
|
|
| |
|
|
| |
|
|
| |
|
|
| |
|
|
| |
|
|
|
Dividends and distributions on common stock from and in excess of net investment income | | | (0.39 | ) | | | (0.78 | ) | | | (0.84 | ) | | | (1.02 | ) | | | (1.02 | ) | | | (1.02 | ) |
| | |
|
|
| |
|
|
| |
|
|
| |
|
|
| |
|
|
| |
|
|
|
Offering costs-Auction Market Preferred Shares | | | — | | | | — | | | | (0.08 | ) | | | — | | | | — | | | | — | |
| | |
|
|
| |
|
|
| |
|
|
| |
|
|
| |
|
|
| |
|
|
|
Net asset value, end of period | | $ | 11.59 | | | $ | 11.65 | | | $ | 11.97 | | | $ | 12.50 | | | $ | 13.51 | | | $ | 13.85 | |
| | |
|
|
| |
|
|
| |
|
|
| |
|
|
| |
|
|
| |
|
|
|
Per share market value, end of period . | | $ | 10.65 | | | $ | 10.32 | | | $ | 11.62 | | | $ | 13.10 | | | $ | 14.69 | | | $ | 14.99 | |
| | |
|
|
| |
|
|
| |
|
|
| |
|
|
| |
|
|
| |
|
|
|
| TOTAL INVESTMENT RETURN ON COMMON STOCK(2) | | | 6.86 | % | | | (4.71 | )% | | | (4.82 | )% | | | (3.84 | )% | | | 5.55 | % | | | 22.64 | % |
| RATIOS TO AVERAGE NET ASSETS APPLICABLE TO COMMON STOCK(3) | | | | | | | | | | | | | | | | | | | | | | | | |
Total expenses | | | 1.31 | %(6) | | | 1.34 | % | | | 2.98 | % | | | 2.55 | % | | | 1.78 | % | | | 1.79 | % |
Operating expenses(4) | | | 1.31 | %(6) | | | 1.34 | % | | | 1.12 | % | | | 1.05 | % | | | 1.06 | % | | | 1.08 | % |
Net investment income(5) | | | 7.37 | %(6) | | | 7.88 | % | | | 5.87 | % | | | 5.64 | % | | | 6.34 | % | | | 6.81 | % |
| SUPPLEMENTAL DATA | | | | | | | | | | | | | | | | | | | | | | | | |
Portfolio turnover | | | 8 | % | | | 19 | % | | | 15 | % | | | 15 | % | | | 17 | % | | | 10 | % |
Net assets applicable to common stock, end of period (000) | | $ | 313,857 | | | $ | 315,439 | | | $ | 324,056 | | | $ | 337,952 | | | $ | 362,600 | | | $ | 369,624 | |
Preferred stock outstanding (000) | | $ | 190,000 | | | $ | 190,000 | | | $ | 190,000 | | | $ | — | | | $ | — | | | $ | — | |
Asset coverage per share of preferred stock, end of the period | | $ | 66,297 | | | $ | 66,505 | | | $ | 67,639 | | | $ | — | | | $ | — | | | $ | — | |
| COMMERCIAL PAPER INFORMATION | | | | | | | | | | | | | | | | | | | | | | | | |
Aggregate amount outstanding at end of period (000) | | $ | — | | | $ | — | | | $ | — | | | $ | 143,000 | | | $ | 143,000 | | | $ | 143,000 | |
Average daily amortized cost of commercial paper outstanding (000) | | $ | — | | | $ | — | | | $ | — | | | $ | 142,295 | | | $ | 142,557 | | | $ | 142,115 | |
Asset coverage per $1,000 at end of period | | $ | — | | | $ | — | | | $ | — | | | $ | 3,363 | | | $ | 3,537 | | | $ | 3,585 | |
| (1) | Based on average shares outstanding. |
| (2) | Total investment return is calculated assuming a purchase of common stock on the opening of the first day and a sale on the closing of the last day of each year reported. Dividends and distributions are assumed, for purposes of this calculation, to be reinvested at prices obtained under the Fund’s dividend reinvestment plan. Brokerage commissions are not reflected. |
| (3) | As a percentage of average weekly net assets which includes any liabilities or senior securities constituting indebtedness in connection with financial leverage. |
| (4) | Ratio from 2003 through 2006 excluded interest and other commercial paper expenses. Commercial paper program was terminated on October 25, 2006. Ratios at June 30, 2008 and December 31, 2007 include Commissions expense—Auction Market Preferred Shares. |
| (5) | Ratios do not reflect dividends paid on the preferred stock. Accordingly, the ratio of net investment income after preferred stock dividends to average net assets to common stock is 4.84%, 4.66%, 5.31%, 5.64%, 6.34% and 6.81%, respectively. |
See Notes to Financial Statements.
9
DUFF & PHELPS UTILITY AND CORPORATE BOND TRUST INC.
Notes to Financial Statements
June 30, 2008 (Unaudited)
Duff & Phelps Utility and Corporate Bond Trust Inc. (the “Fund”) was incorporated in Maryland on November 23, 1992 as a diversified, closed-end management investment company with operations commencing on January 29, 1993.
The Fund’s investment objective is to seek high current income consistent with investing in securities of investment-grade quality. The Fund seeks to achieve its investment objective by investing substantially all of its assets in a diversified portfolio of Utility Income Securities, Corporate Income Securities, Mortgage-Backed Securities and Asset-Backed Securities. The ability of the issuers of the securities held by the Fund to meet their obligations may be affected by economic developments in a specific state, industry or region.
Note 1. Significant Accounting Policies | The following is a summary of significant accounting policies followed by the Fund in the preparation of its financial statements. |
Securities Valuation: Equity securities traded on a national or foreign securities exchange or traded over-the-counter and quoted on the NASDAQ System are valued at the last reported sale price or, if there was no sale on the pricing date, then the security is valued at the mean of the bid and ask prices as obtained on that day from one or more dealers regularly making a market in that security. Fixed income securities are valued at the mean of bid and ask prices provided by an independent pricing service when such prices are believed to reflect the fair market value of such securities. Such bid and ask prices are determined taking into account securities prices, yields, maturities, call features, ratings, and institutional size trading in similar securities and developments related to specific securities. Any securities for which it is determined that market prices are unavailable or inappropriate are valued at a fair value using a procedure determined in good faith by the Board of Directors. Short-term investments having a maturity of 60 days or less at date of purchase are valued on an amortized cost basis, which approximates market value.
Securities Transactions and Investment Income: Securities transactions are recorded on the trade date. Realized gains and losses on sales of securities are calculated on the identified cost basis. Interest income is recorded on the accrual basis. The Fund amortizes premiums and accretes discounts on securities using the effective interest method.
Federal Income Taxes: It is the Fund’s intention to meet the requirements of Subchapter M of the Internal Revenue Code applicable to regulated investment companies and to distribute sufficient net taxable income and capital gains to shareholders to qualify as a regulated investment company. Therefore, no provision for federal income or excise tax is required. Management of the Fund has concluded that there are no significant uncertain tax positions that would require recognition in the financial statements. Generally, the tax authorities can examine all tax returns filed for the last three years.
Dividends and Distributions: The Fund will declare and pay dividends on its common stock monthly from net investment income. Net long-term capital gains, if any, in excess of loss carryforwards are expected to be distributed annually. The Fund will make a determination at the end of its fiscal year as to whether to retain or distribute such gains. Dividends and distributions are recorded on the ex-dividend date. Dividends and distributions on preferred shares are accrued on a daily basis and are determined as described in Note 6.
Income distributions and capital gain distributions are determined in accordance with income tax regulations, which may differ from investment income and capital gains recorded in accordance with U.S. generally accepted accounting principles.
Recent Accounting Pronouncement: In March 2008, Statement of Financial Accounting Standards No. 161, Disclosures about Derivative Instruments and Hedging Activities (“FAS 161”) was issued and is effective for fiscal years beginning after November 15, 2008. FAS 161 is intended to improve financial reporting for derivative instruments by requiring enhanced disclosure that enables investors to understand how and why an entity uses derivatives, how derivatives are accounted for, and how derivative instruments affect an entity’s results of operations and financial position. Management is currently evaluating the implications of FAS 161. The impact on the Fund’s financial statement disclosures, if any, is currently being assessed.
Use of Estimates: The preparation of financial statements in conformity with U.S. generally accepted accounting principles requires management to make estimates and assumptions that affect the amounts reported in the financial statements and accompanying notes. Actual results could differ from those estimates.
Note 2. Agreements | The Fund has an Advisory Agreement with Duff & Phelps Investment Management Co. (the “Adviser”), a subsidiary of Phoenix Investment Partners, Ltd. (“Phoenix” or “PXP”), and an Administration Agreement with Princeton Administrators, LLC (“Princeton”). |
10
The investment advisory fee paid to the Adviser is computed weekly and payable monthly at an annual rate of 0.50% of the Fund’s average weekly managed assets, which is defined as the average weekly value of the total assets of the Fund minus the sum of all accrued liabilities of the Fund (other than the aggregate amount of any outstanding borrowings or other indebtedness constituting financial leverage).
The administration fee paid to Princeton is computed weekly and payable monthly at an annual rate of 0.15% of the Fund’s average weekly net assets, which is defined as the average weekly value of the total assets of the Fund minus the sum of all accrued liabilities of the Fund (including the aggregate amount of any outstanding borrowings or other indebtedness constituting financial leverage), subject to a monthly minimum of $12,500.
Pursuant to the Advisory Agreement, the Adviser provides continuous supervision of the investment portfolio and pays the compensation of officers of the Fund who are affiliated persons of the Adviser. Pursuant to the Administration Agreement, Princeton provides administration services that include oversight of the Fund’s books and records and preparation of financial statements and other regulatory filings. The Fund bears all other costs and expenses.
Note 3. Portfolio Securities Purchases and sales of investment securities, other than U.S. Government securities and short-term investments, for the six months ended June 30, 2008 aggregated $42,770,062 and $40,240,004, respectively. |
The United States federal income tax basis of the Fund’s investments and the net unrealized depreciation as of June 30, 2008 was as follows:
| | | | | | | | | |
Tax Basis of
Investments
| | Appreciation
| | Depreciation
| | Net
Unrealized
Depreciation
|
| $509,862,938 | | $ | 2,228,148 | | $ | 24,243,791 | | $ | 22,015,643 |
Note 4. Distributions to Stockholders The tax character of distributions paid during the year ending December 31, 2008 will be determined at the end of the current fiscal year. The tax character of distributions paid during the fiscal year ended December 31, 2007 was as follows: |
| | | |
| | | 12/31/2007
|
Distributions paid from: | | | |
Ordinary income | | $ | 31,388,684 |
| | |
|
|
Total taxable distributions* | | $ | 31,388,684 |
| | |
|
|
| * | The distributions presented above include distributions payable to preferred shareholders at December 31, 2007. |
As of December 31, 2007, the components of accumulated earnings on a tax basis were as follows:
| | | | |
Undistributed ordinary income—net | | $ | 2,739,289 | |
Undistributed long-term capital gains—net | | | — | |
| | |
|
|
|
Total undistributed earnings | | | 2,739,289 | |
Capital loss carryforward | | | (41,819,926 | )* |
Unrealized gains/(losses)—net | | | (13,275,589 | )** |
| | |
|
|
|
Total accumulated earnings/(losses) | | $ | (52,356,226 | ) |
| | |
|
|
|
| * | On December 31, 2007, the Fund had a net capital loss carryforward of $41,819,926, of which $17,513,106 expires in 2011, $3,731,126 expires in 2012, $3,265,594 expires in 2013, $4,213,979 expires in 2014 and $13,096,121 expires in 2015. This amount will be available to offset amounts of any future taxable gains. |
| ** | The difference between book-basis and tax-basis unrealized gains / (losses) is attributable primarily to the difference between book and tax amortization methods for premiums and discounts on fixed income securities. The above amount also includes book-to-tax temporary differences, which primarily consists of deferred expenses related to the directors deferred compensation plan. |
Note 5. Capital | There are 600 million shares of stock, $0.01 par value per share, authorized. For the six months June 30, 2008 and the year ended December 31, 2007, the Fund did not issue any shares of common stock, respectively, in connection with the reinvestment of dividends. |
Note 6. Auction Market Preferred Shares | The Fund’s Charter grants the authority to the Board of Directors to authorize the creation and issuance of one or more series of preferred stock out of the authorized and unissued stock of the Fund. Accordingly, on October 25, 2006, the Fund issued 7,600 shares of Auction Market Preferred Shares (“AMPS”) in two series of 3,800 shares each at a public offering price of $25,000 per share. The underwriting discount and other offering costs incurred in connection with the issuance of the AMPS were recorded as a reduction of paid-in capital on common stock. Dividends on shares of AMPS are cumulative from their date of original issue and payable on each dividend payment date. Dividend rates ranged from 3.55% to 5.60% for the six months ended June 30, 2008. |
Under the Investment Company Act of 1940, the Fund may not declare dividends or make other distributions on shares of common stock or purchase any such shares if, at the time of the declaration, distribution or purchase, asset coverage with respect to the outstanding preferred stock would be less than 200%.
The AMPS are redeemable at the option of the Fund, in whole or in part, on any dividend payment date at $25,000 per share plus any accumulated or unpaid dividends, whether or not declared. The AMPS are also subject to a mandatory redemption at $25,000 per share plus any accumulated or unpaid dividends, whether or not declared, if certain requirements relating to the composition of the assets and liabilities of the Fund as set forth in the Fund’s Charter are not satisfied.
11
The holders of AMPS have voting rights equal to the holders of common stock (one vote per share) and will vote together with holders of common stock as a single class. However, holders of AMPS, voting separately as a class, are also entitled to elect two of the Fund’s directors. In addition, the Investment Company Act of 1940 requires that along with any approval by shareholders that might otherwise be required, the approval of the holders of a majority of any outstanding shares of preferred stock, voting separately as a class, would be required to (a) adopt any plan of reorganization that would adversely affect the preferred stock, and (b) take certain actions requiring a vote of security holders, including, among other things, changes in the Fund’s subclassification as a closed-end investment company or changes in its fundamental investment restrictions.
Since February 2008, the AMPS market has been ineffective at matching buyers with sellers. This has impacted the Fund’s AMPS. The AMPS dividend rate was reset to the maximum applicable rate which ranged from 3.55% to 4.40% between February 14, 2008 and the date of this report. A failed auction is not an event of default for the Fund, but it is a liquidity problem for the holders of its AMPS. Recent dislocations in the auction rate securities markets have triggered numerous failed auctions for many closed-end funds. A failed auction occurs when there are more sellers of AMPS than buyers. It is impossible to predict how long this imbalance will last. A successful auction of the Fund’s AMPS may not occur for a long period of time, if ever. Even if the AMPS market becomes more liquid, the holders of the Fund’s AMPS may not have the amount of liquidity they desire or the ability to sell the AMPS at par.
Note 7. Deferred Compensation Plan Effective on January 1, 2000, the Fund established a deferred compensation program for its independent directors. Any director who was not an “interested person” of the Fund and who elected to participate in the program (a “participating director”) was eligible to defer receipt of all or a portion of his or her compensation from the Fund. Any amounts deferred by a participating director were credited to a deferred compensation ledger account (a “deferral account”) established for such director. From January 1, 2000 through December 31, 2004, the deferred compensation program was administered by the Fund’s transfer agent on behalf of the Fund, and all amounts credited to each participating director’s deferral account were deemed to be invested in common stock of the Fund. Participating directors do not have an ownership interest in those shares. Contributions to the deferral account and increases in value of the measuring shares caused the account balance to increase accordingly, while withdrawals from the deferral account and decreases in value of the measuring shares caused the account balance to decrease accordingly. When a participating director retires, the director may elect to receive payments under the plan in a lump sum or in equal installments over a period of up to ten years. If a participating director dies, any |
amount payable under the plan will be paid to the director’s beneficiaries. Effective on January 1, 2005, administration of new contributions under the deferred compensation program was transferred to Fidelity Investments, which administers similar programs for other investment companies advised by affiliates of Phoenix. The Fidelity Investments program gave participating directors the ability to allocate amounts in their deferral accounts among various investment options, one of which was common stock of the Fund. The acceptance of new contributions under the Fund’s deferred compensation program was discontinued, effective on December 31, 2006. However, the obligation to make payouts to directors with respect to compensation deferred between January 1, 2000 and December 31, 2006 remains a general obligation of the Fund. For this reason, the Fund’s Statement of Assets and Liabilities at June 30, 2008 includes “Deferred compensation payable” in the amount of $55,250, and the $55,250 in deferred compensation investments that support that obligation are included in “Other assets.”
Note 8. Indemnifications | Under the Fund’s organizational documents, its Officers and Directors are indemnified against certain liabilities arising out of the performance of their duties to the Fund. In addition, in the normal course of business, the Fund enters into contracts that provide general indemnifications to other parties. The Fund’s maximum exposure under these arrangements is unknown as this would involve future claims that may be made against the Fund that have not yet occurred. However, the Fund has not had prior claims or losses pursuant to these contracts and believes the risk of loss to be remote. |
Note 9. Other Matters | On February 21, 2008, the Fund recorded a $7.2 million gain upon receiving that amount from the WorldCom Litigation Trust (a settlement fund created in response to class action lawsuits that were filed subsequent to the bankruptcy of WorldCom Inc.), representing its final and complete share of distributions expected from that trust. In February, the Fund also received $950,000 from the Adviser, representing the amount that the Fund could have received from the WorldCom Victim Trust (a settlement fund created in response to the SEC’s litigation on behalf of WorldCom investors) and other related expenses incurred by the Fund. |
Note 10. Subsequent Events | Subsequent to June 30, 2008, dividends declared and paid on preferred stock totaled $961,742 through August 15, 2008. On July 1, 2008, the Board of Directors of the Fund declared a dividend of $0.065 per share of common stock payable on July 31, 2008 to shareholders of record on July 15, 2008. On August 1, 2008 the Board of Directors of the Fund declared a dividend of $0.065 per share of common stock payable on August 29, 2008 to shareholders of record on August 15, 2008. |
12
REPORT ON ANNUAL MEETING OF SHAREHOLDERS (Unaudited)
The Annual Meeting of Shareholders of the Fund was held on May 8, 2008. The description of each matter voted upon and number of shares voted were as follows:
| | | | |
| | | Shares
Voted For
| | Shares
Withheld
|
1. To elect four directors to serve until the Annual Meeting in the year indicated below or until their successors are duly elected and qualified: | | | | |
Francis E. Jeffries (2009) | | 24,279,929 | | 315,249 |
Geraldine M. McNamara (2011) | | 24,303,464 | | 291,714 |
Christian H. Poindexter (2011) | | 24,286,466 | | 308,712 |
Carl F. Pollard (2009)* | | 5,963 | | 383 |
| * | Elected by the holders of the Fund’s preferred stock voting as a separate class. |
Directors whose term of office continued beyond this meeting are as follows: Nancy Lampton, Philip R. McLoughlin, Eileen A. Moran, Nathan I. Partain and David J. Vitale.
ADDITIONAL INFORMATION (Unaudited)
Notice is hereby given in accordance with Section 23(c) of the Investment Company Act of 1940 that the Fund may from time to time purchase its shares of common stock in the open market.
PROXY VOTING POLICY AND PROCEDURES (Unaudited)
Although the Fund does not typically hold voting securities, the Fund’s Board of Directors has adopted proxy voting procedures whereby Duff & Phelps Investment Management Co., the Fund’s investment adviser (the “Adviser”), would review any proxy solicitation materials on a case-by-case basis and would vote any such securities in accordance with the Adviser’s good faith belief as to the best interests of the Fund and its shareholders. These proxy voting procedures may be changed at any time or from time to time by the Fund’s Board of Directors. A description of the policies and procedures that the Fund uses to determine how to vote proxies relating to portfolio securities during the most recent 12-month period ended June 30 are available without charge, upon request, by calling the Adviser toll free at (800) 338-8214 and on the Securities Exchange Commission’s (SEC) website at http://www.sec.gov.
AVAILABILITY OF QUARTERLY SCHEDULE OF INVESTMENTS (Unaudited)
The Fund files its complete schedule of portfolio holdings with the SEC for the first and third quarters of each fiscal year on Form N-Q. The Fund’s Forms N-Q are available on the SEC’s website at http://www.sec.gov. The Fund’s Forms N-Q may also be reviewed and copied at the SEC’s Public Reference Room in Washington, DC. Information on the operation of the Public Reference Room may be obtained by calling (202) 551-8090. The Fund’s Form N-Q is also available, without charge, upon request, by calling the Adviser toll free at (800) 338-8214.
13
DIVIDEND REINVESTMENT AND CASH PURCHASE PLAN (Unaudited)
Common shareholders are automatically enrolled in the Fund’s Dividend Reinvestment and Cash Purchase Plan (the “Plan”). Under the Plan, all distributions to common shareholders of dividends and capital gains will automatically be reinvested by The Bank of New York Mellon Corporation (the “Plan Agent”) in additional shares of common stock of the Fund unless an election is made to receive distributions in cash. Shareholders who elect not to participate in the Plan will receive all distributions in cash via direct deposit or paid by check in U.S. dollars mailed directly to the shareholder of record (or if the shares are held in street or other nominee name, then to the nominee) by the Plan Agent.
The Plan Agent serves as agent for the common shareholders in administering the Plan. After the Fund declares a dividend or determines to make a capital gains distribution, if (1) the market price of shares on the valuation date equals or exceeds the net asset value of these shares, the Fund will issue new shares at net asset value, provided that the Fund will not issue new shares at a discount of more than 5% from the then current market price; or if (2) the market price is lower than the net asset value, or if dividends or capital gains distributions are declared and payable only in cash, then the Plan Agent will, as agent for the participants, receive the cash payment and use it to buy shares of common stock in the open market, on the New York Stock Exchange or elsewhere, for the participants’ accounts. If, before the Plan Agent has completed its purchases, the market price exceeds the net asset value per share of the common stock, the average per share purchase price paid by the Plan Agent may exceed the net asset value of the Fund’s common stock, resulting in the acquisition of fewer shares of common stock than if the dividend or distribution had been paid in common stock issued by the Fund. As described below, the Plan was amended, effective December 1, 1999, whereby the Fund will issue new shares in circumstances in which it will be beneficial to plan participants.
The Plan Agent’s fees for the handling of the reinvestment of dividends and distributions will be paid by the Fund. However, each participant will pay a pro rata share of brokerage commissions (or equivalent purchase costs) incurred with respect to the Plan Agent’s open market purchases in connection with the reinvestment of dividends and distributions and with voluntary additional share investments. There are no other charges to participants for reinvesting dividends or capital gains distributions, except for certain brokerage commissions (or equivalent purchase costs) as described above.
The Plan also permits Plan participants to periodically purchase additional shares of common stock through the Plan by delivering to the Plan Agent a check for at least $100, but not more than $5,000 in any month. The Plan Agent will use the funds to purchase shares in the open market or in private transactions. The Fund will not issue any new shares in connection with voluntary additional share investments. Purchases made pursuant to the Plan will be made commencing at the time of the first dividend or distribution payment following the second business day after receipt of the funds for additional purchases, and may be aggregated with purchases of shares for reinvestment of the dividends and distributions. Shares will be allocated to the accounts of participants purchasing additional shares at the average price per share, plus a service charge imposed by the Plan Agent and brokerage commissions (or equivalent purchase costs) paid by the Plan Agent for all shares purchased by it, including for reinvestment of dividends and distributions. Checks drawn on a foreign bank are subject to collection and collection fees, and will be invested at the time of the next distribution after funds are collected by the Plan Agent.
The Plan Agent will make every effort to invest funds promptly, and in no event more than 30 days after the Plan Agent receives a dividend or distribution, except where postponement is deemed necessary to comply with applicable provisions of the federal securities laws.
Funds sent to the Plan Agent for voluntary additional share investment may be recalled by the participant by written notice received by the Plan Agent not later than two business days before the next distribution payment date. If for any reason a regular monthly distribution is not paid by the Fund, funds for voluntary additional share investment will be returned to the participant, unless the participant specifically directs that they continue to be held by the Plan Agent for subsequent investment.
Participants in the Plan may withdraw from the Plan upon written notice to the Plan Agent. When a participant withdraws from the Plan or upon termination of the Plan as provided below, certificates for whole shares credited to his or her account under the Plan will be issued and a cash payment will be made for any fraction of a share credited to such account. An election to withdraw from the Plan will, until such election is changed, be deemed to be an election by a common shareholder to take all subsequent dividends and distributions in cash. Elections will only be effective for dividends and distributions declared after, and with a record date of at least ten days after, such elections are received by the Plan Agent. There is no penalty for non-participation in or with-
14
drawal from the Plan, and shareholders who have withdrawn from the Plan may rejoin it at any time. The Plan Agent imposes charges on participants for selling participants shares on termination of participation (currently a base fee of $5.00 plus $.04 per share). The Fund reserves the right to amend the Plan to institute a service charge to participants.
The Plan Agent maintains each shareholder’s account in the Plan and furnishes monthly written confirmations of all transactions in the accounts, including information needed by shareholders for personal and tax records. Shares in the account of each Plan participant will be held by the Plan Agent in non-certificated form in the name of the participant, and each shareholder’s proxy will include those shares purchased pursuant to the Plan.
Common shareholders whose common stock is held in the name of a broker or nominee should contact such broker or nominee to determine whether or how they may participate in the Plan.
In the case of shareholders, such as banks, brokers or nominees, that hold shares for others who are the beneficial owners, the Plan Agent will administer the Plan on the basis of the number of shares certified from time to time by the record shareholder as representing the total amount registered in the record shareholder’s name and held for the account of beneficial owners who are participants in the Plan.
The automatic reinvestment of dividends and distributions will not relieve participants of any federal income tax that may be payable or required to be withheld on such dividends or distributions.
The Fund reserves the right to amend or terminate the Plan as applied to any dividend or distribution paid subsequent to written notice of the change sent to all participants in the Plan at least 90 days before the record date for the dividend or distribution. The Plan may also be amended or terminated by the Plan Agent by at least 90 days’ written notice to all participants in the Plan. All questions concerning the Plan should be directed to the Plan Agent by calling (866) 221-1681.
15
Directors
Francis E. Jeffries, CFA, Chairman
Nancy Lampton, Vice Chairman
Philip R. McLoughlin
Geraldine M. McNamara
Eileen A. Moran
Nathan I. Partain, CFA
Christian H. Poindexter
Carl F. Pollard
David J. Vitale
Officers
Nathan I. Partain, CFA
President & Chief Executive Officer
Daniel J. Petrisko, CFA
Vice President & Chief Investment Officer
T. Brooks Beittel, CFA
Secretary
Alan M. Meder, CFA, CPA
Treasurer & Assistant Secretary
Joyce B. Riegel,
Chief Compliance Officer
Investment Adviser
Duff & Phelps Investment Management Co.
55 East Monroe Street, Suite 3600
Chicago, IL 60603
Effective October 1, 2008
200 South Wacker Drive, Suite 500
Chicago, Illinois 60606
(800) 338-8214
www.dpimc.com
Administrator
Princeton Administrators, LLC
P.O. Box 9095
Princeton, NJ 08543-9095
Custodian
The Bank of New York Mellon Corporation
BNY Mellon Asset Services
100 Colonial Center Parkway, Suite 200
Lake Mary, FL 32746
Transfer Agent
The Bank of New York Mellon Corporation
BNY Mellon Shareowner Services
P.O. Box 358015
Pittsburgh, PA 15252
(866) 221-1681
Independent Registered Public Accounting Firm
Ernst & Young LLP
233 South Wacker Drive
Chicago, IL 60606
Legal Counsel
Mayer Brown LLP
71 South Wacker Drive
Chicago, IL 60606
This report is for stockholder information. This is not a prospectus intended for use in the purchase or sale of Fund shares. Information contained in this report is dated and subject to change. Past performance is no guarantee of future results.
Duff & Phelps
Utility and
Corporate
Bond Trust Inc.

SEMI-ANNUAL REPORT
JUNE 30, 2008
Not required as this is not an annual filing.
| ITEM 3. | AUDIT COMMITTEE FINANCIAL EXPERT. |
Not required as this is not an annual filing.
| ITEM 4. | PRINCIPAL ACCOUNTANT FEES AND SERVICES. |
Not required as this is not an annual filing.
| ITEM 5. | AUDIT COMMITTEE OF LISTED REGISTRANTS. |
Not required as this is not an annual filing.
| ITEM 6. | SCHEDULE OF INVESTMENTS |
Included as part of the report to shareholders filed under Item 1 of this Form.
| ITEM 7. | DISCLOSURE OF PROXY VOTING POLICIES AND PROCEDURES FOR CLOSED-END MANAGEMENT INVESTMENT COMPANIES. |
Not required as this is not an annual filing.
| ITEM 8. | PORTFOLIO MANAGERS OF CLOSED-END MANAGEMENT INVESTMENT COMPANIES. |
Not required as this is not an annual filing.
| ITEM 9. | PURCHASES OF EQUITY SECURITIES BY CLOSED-END MANAGEMENT INVESTMENT COMPANY AND AFFILIATED PURCHASERS. |
During the period covered by this report, no purchases were made by or on behalf of the registrant or any “affiliated purchaser” (as defined in Rule 10b-18(a)(3) under the Securities Exchange Act of 1934 (the “Exchange Act”) of shares or other units of any class of the registrant’s equity securities that is registered by the registrant pursuant to Section 12 of the Exchange Act.
| ITEM 10. | SUBMISSION OF MATTERS TO A VOTE OF SECURITY HOLDERS. |
No changes to the procedures by which shareholders may recommend nominees to the registrant’s board of directors have been implemented after the registrant last provided disclosure in response to the requirements of Item 22(b)(15) of Schedule 14A (i.e., in the registrant’s Proxy Statement dated April 8, 2008) or this Item.
| ITEM 11. | CONTROLS AND PROCEDURES. |
(a) The registrant’s principal executive officer and principal financial officer have concluded that the registrant’s disclosure controls and procedures (as defined in Rule 30a-3(c) under the Investment Company Act of 1940 (the “1940 Act”)) are effective, based on an evaluation of those controls and procedures made as of a date within 90 days of the filing date of this report as required by Rule 30a-3(b) under the 1940 Act and Rule 13a-15(b) under the Exchange Act.
(b) There has been no change in the registrant’s internal control over financial reporting (as defined in Rule 30a-3(d) under the 1940 Act) that occurred during the most recent fiscal quarter covered by this report that has materially affected, or is reasonably likely to materially affect, the registrant’s internal control over financial reporting.
| | | | |
| (a) | | Exhibit 99.CERT | | Certifications pursuant to Section 302 of the Sarbanes-Oxley Act of 2002 |
| | |
| (b) | | Exhibit 99.906CERT | | Certifications pursuant to Section 906 of the Sarbanes-Oxley Act of 2002 |
SIGNATURES
Pursuant to the requirements of the Securities Exchange Act of 1934 and the Investment Company Act of 1940, the registrant has duly caused this report to be signed on its behalf by the undersigned, thereunto duly authorized.
| | | | |
| (Registrant) | | DUFF & PHELPS UTILITY AND CORPORATE BOND TRUST INC. | | |
| | |
| By (Signature and Title) | | /s/ ALAN M. MEDER | | |
| | Alan M. Meder | | |
| | Treasurer (Principal Financial and Accounting Officer) | | |
| Date | | August 27, 2008 | | |
Pursuant to the requirements of the Securities Exchange Act of 1934 and the Investment Company Act of 1940, this report has been signed below by the following persons on behalf of the registrant and in the capacities and on the dates indicated.
| | | | |
| By (Signature and Title) | | /s/ NATHAN I. PARTAIN | | |
| | Nathan I. Partain | | |
| | President and Chief Executive Officer | | |
| Date | | August 27, 2008 | | |
| | |
| By (Signature and Title) | | /s/ ALAN M. MEDER | | |
| | Alan M. Meder | | |
| | Treasurer (Principal Financial and Accounting Officer) | | |
| Date | | August 27, 2008 | | |