UNITED STATES
SECURITIES AND EXCHANGE COMMISSION
Washington, D.C. 20549
SECURITIES AND EXCHANGE COMMISSION
Washington, D.C. 20549
FORM N-CSR
CERTIFIED SHAREHOLDER REPORT OF REGISTERED
MANAGEMENT INVESTMENT COMPANIES
Investment Company Act file number 811-07360
Monetta Trust
(Exact name of Registrant as specified in charter)
(Exact name of Registrant as specified in charter)
1776-A S. Naperville Road, Suite 100
Wheaton, IL 60189-5831
(Address of principal executive offices) (Zip code)
(Address of principal executive offices) (Zip code)
Robert S. Bacarella
1776-A S. Naperville Road, Suite 100
Wheaton, IL 60189-5831
(Name and address of agent for service)
(Name and address of agent for service)
(630) 462-9800
Registrant's telephone number, including area code
Date of fiscal year end: December 31, 2020
Date of reporting period: June 30, 2020
Item 1. Reports to Stockholders.
Semi-Annual Report
June 30, 2020
| Monetta Mutual Funds (No-Load) | ||
| Monetta Trust: | ||
| ■ Monetta Fund | ||
| ■ Monetta Core Growth Fund |
Beginning on January 1, 2021, as permitted by regulations adopted by the SEC, paper copies of the Funds’ shareholder reports will no longer be sent by mail, unless you specifically request paper copies of the reports from the Fund (defined herein) or from your financial intermediary, such as a broker-dealer or bank. Instead, the reports will be made available on the Funds’ website (www.monetta.com), and you will be notified by mail each time a report is posted and provided with a website link to access the report.
If you already elected to receive shareholder reports electronically, you will not be affected by this change and you need not take any action. You may elect to receive shareholder reports and other communications from the Funds by contacting your financial intermediary (such as a broker-dealer or bank) or, if you are a direct investor, by calling 1-800-MONETTA or by sending an e-mail request to info@monetta.com.
You may elect to receive all future reports in paper free of charge. If you invest through a financial intermediary, you can contact your financial intermediary to request that you continue to receive paper copies of your shareholder reports. If you invest directly with the Funds, you can call 1-800-MONETTA or send an e-mail request to info@monetta.com to let the Funds know you wish to continue receiving paper copies of your shareholder reports. Your election to receive reports in paper will apply to all funds held in your account if you invest through your financial intermediary.
| 1-800-MONETTA | www.monetta.com |
(This Page Intentionally Left Blank.)
Page 2
TABLE OF CONTENTS
| Letter to Shareholders | 5 |
| Performance Highlights | |
| Monetta Fund | 6 |
| Monetta Core Growth Fund | 7 |
| Disclosure of Fund Expenses | 8 |
| Schedules of Investments | |
| Monetta Fund | 9 |
| Monetta Core Growth Fund | 11 |
| Financial Statements | |
| Statements of Assets and Liabilities | 12 |
| Statements of Operations | 13 |
| Statements of Changes in Net Assets | 14 |
| Financial Highlights | 15 |
| Notes to Financial Statements | 17 |
| Notice to Shareholders | 22 |
Page 3
Principal Risks:
Mutual fund investing involves risk. Principal loss is possible. The Funds may make short-term investments, without limitation, for defensive purposes, which may provide lower returns than other types of investments. The portion of the Monetta Core Growth Fund that invests in underlying ETFs that track the S&P 500® Index (the “Index”) will be subject to certain risks which are unique to tracking the Index. By investing in ETFs, you will indirectly bear your share of any fees and expenses charged by the underlying funds, in addition to indirectly bearing the principal risks of the funds. The Monetta Core Growth Fund will invest approximately 50% of its net assets in funds that track the Index or other broad-based market indices that primarily include stocks of large capitalization U.S. companies, and your cost of investing will generally be higher than the cost of investing directly in the shares of the mutual funds that track an index, which will be subject to certain risks which are unique to tracking the Index. Growth stocks typically are more volatile than value stocks; however, value stocks have a lower expected growth rate in earnings and sales. Investments in smaller companies involve additional risks such as limited liquidity and greater volatility than larger companies. Please refer to the Funds’ prospectus for further details.
While the Funds are no-load, management and other expenses still apply.
Past performance is not a guarantee of future results.
Monetta Financial Services, Inc. (“MFSI” or the “Adviser”) is the investment adviser to the Monetta Funds. References to individual securities are the views of the Adviser at the date of this report and are subject to change. References are not a recommendation to buy or sell any security. Fund holdings and compositions are subject to change. MFSI and its affiliated officers, trustees and employees may, from time to time, have long or short positions in, and buy or sell, the securities of companies held, purchased or sold by the Monetta Funds. Current and future portfolio holdings are subject to risk. Please refer to the Schedules of Investments in this report for a complete list of Fund holdings.
Diversification does not assure a profit, nor does it protect against a loss in a declining market.
The S&P 500® Index is a broad based unmanaged index of 500 stocks, which is widely recognized as representative of the equity market in general. It is not possible to invest directly in an index.
VIX, or Volatility Index, created by the Chicago Board Options Exchange, estimates how volatile the market will be over the next 30 days. It is based on the midpoints of real-time S&P 500 option bid and ask prices with more than 23 days and less than 37 days to expiration. The VIX Index rises when put option buying increases- a right to sell a security for a specified price by a certain time; and falls when call option buying activity increases- a right to buy a security for a specified price by a certain time. Generally, the higher the VIX Index the greater the perceived market risk. On average the VIX Index ranges between a 18-35 range.
Earnings growth is not a measure of the Funds’ future performance.
Must be preceded or accompanied by a prospectus.
Opinions expressed are those of the fund managers and are not intended to be a forecast of future events, a guarantee of future results, nor investment advice.
Distributor: Quasar Distributors, LLC.
Page 4
| Letter to Shareholders (Unaudited) |
July 31, 2020
Dear Fellow Shareholders:
I am pleased to enclose your Fund’s semi-annual report for the six-month period ending June 30, 2020.
When this year began, no one could have predicted that the 11-year bull market would end in such a quick and dramatic way. We are now experiencing a period in history that none of us will ever forget. The coronavirus has temporarily changed our lives and our economy in ways we never thought possible just a few months ago. The Covid-19 pandemic led to the unprecedented shutdown of many businesses and schools and changed our social distancing standards. Everyone became concerned about how the virus will spread, how fatal it will be, and how long it will be until a vaccine is available.
The impact on the financial markets was to basically rewrite the record books. This was a period that reminds me of the saying, “If you can’t say anything nice, don’t say anything at all.”
The stock market, as measured by the S&P 500 Index, peaked on February 19 as concerns over the growing health risk from the coronavirus intensified. Since this market peak until its trough, on March 23 the market plummeted 33.79%, ending the first quarter down 19.60%. This market decline was one of the worst and shortest drops in history, propelling the market into bear market territory in only 22 days!
Market volatility also proved to be historic, with the VIX Index posting a 140 volatility reading, the third-highest in history. Only in October 1987 and the Great Depression was this volatility index higher, at 190 and 179 respectively.
What is notable is that with all Covid-19 related fear and panic, the market, as measured by the S&P 500 Index, was down only 3.08% for the six-month period ending June 30, 2020. The market rallied in the second quarter, offsetting most of the first quarter decline of 19.60%, as growth expectations moderately improved. However, investment returns among sectors varied significantly, as the consumer staples, healthcare, grocery and technology sector held up relatively well while the travel related, energy, financial and restaurant sectors declined significantly.
Where do we go from here?
In the face of pandemic concerns, policy makers acted swiftly to dampen the economic disruptions. The Federal Reserve implemented two emergency rate cuts, pushing its target rate to near-zero percent and signaling rates will remain low indefinitely. In addition, the Fed restarted its quantitative easing program to support both market liquidity and fiscal stimulus. In addition, Congress and the White House passed a $2 trillion+ stimulus aid package to support small businesses, provide direct payments to lower- and middle-income families and expand unemployment benefits.
At this point, it is uncertain what effect the stimulus programs will have on longer-term economic growth and how quickly businesses can recover, based on the uncertainties around effective solutions in the areas of containment, treatment and vaccines to this pandemic.
I equate the economy to a heavyweight champion prize fighter that was flattened to the mat by a sucker punch from a rookie fighter, Covid-19. The knock-out count has started, “One…two…three!” The key will be how quickly the champ will recover from this blow, shake it off and regain his footing. We don’t believe Covid-19 will be an economic knock-out punch, but rather a setback as the champ sets up for a quick recovery and an impressive come-back.
Will the world be different after the virus?
Unlike past economic slowdowns, this crisis is “virus contained”. Although experts have warned us for years that we were unprepared for a pandemic, we now finally believe. We are all taking actions to minimize the spread of this virus by changing our social distancing standards, wearing masks and increasing handwashing, which should help us deal and react to future pandemics without shutting down parts of the economy.
Will people fly on planes, go on cruises, visit Las Vegas, dine at restaurants or attend sporting events? Absolutely, but it may look different! The virus has revealed our fragility—but it is a comma, not a period, when it comes to long-term economic growth. As history shows, this too shall pass.
For now, please follow the CDC guidelines and stay safe and healthy.
Thank you for being a valued shareholder.
Respectfully,

Robert S. Bacarella
President, Founder and Portfolio Manager
Page 5
| Performance Highlights (Unaudited) |
| Monetta Fund | Period ended June 30, 2020 | |
Investment Objective: | Average Market Capitalization: | Total Net Assets: |
| Long-Term Capital Growth | $482.6 billion | $61.66 million |
PERFORMANCE: | Average Annual Total Return | |||
1 Year | 3 Year | 5 Year | 10 Year | |
| Monetta Fund | 11.16% | 11.53% | 9.69% | 11.66% |
S&P 500® Index | 7.51% | 10.73% | 10.73% | 13.99% |
| Total Annual Operating Expenses* | 1.41% | |||
| * | Source Prospectus dated April 30, 2020. Expense Ratio of 1.41% includes Acquired Fund Fees and Expenses of 0.01%. For the Fund’s current Expense Ratio, please refer to Page 15 of this Semi-Annual Report. |
Performance data quoted represents past performance; past performance does not guarantee future results. The investment return and principal value of an investment will fluctuate so that an investor’s shares, when redeemed, may be worth more or less than their original cost. The total returns do not reflect the deduction of taxes that a shareholder would pay on Fund distributions or the redemption of Fund shares. Current performance of the Fund may be lower or higher than the performance quoted. Performance data current to the most recent month end may be obtained by calling 1-800-MONETTA or visiting www.Monetta.com.
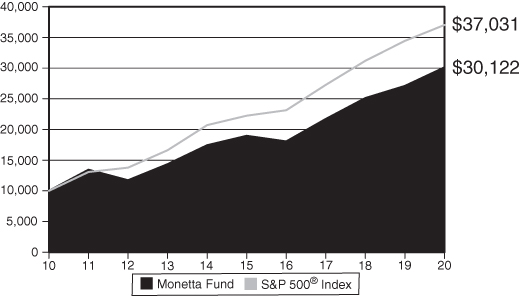
The hypothetical graph above compares the change in value of a $10,000 investment in the Monetta Fund and the S&P 500® Index, for the 10-year period ending June 30, 2020, with dividend and capital gains reinvested.
Portfolio Weightings(a): |
Technology | 28.6% |
Financial | 20.0% |
Retail | 17.3% |
Consumer Cyclical | 16.4% |
Transportation | 6.2% |
Healthcare | 3.3% |
Capital Equipment | 2.4% |
Energy | 1.9% |
Other(b) | 3.9% |
| Top 5 Equity Holdings: |
% of Net Assets | |
Amazon.com, Inc. | 12.1% |
Alphabet, Inc. - CL C | 6.9% |
MasterCard, Inc. - CL A | 6.7% |
Microsoft Corp. | 5.0% |
Apple, Inc. | 4.7% |
| Total Top 5 Equity Holdings: | 35.4% |
(a) | Portfolio weightings are subject to change daily and are calculated as a percentage of net assets. |
(b) | Includes Money Market Funds and liabilities in excess of other assets. |
| Commentary |
During the first half of 2020, the Monetta Fund generated a total return of 1.53%. The Fund return compared favorably to its benchmark index, the S&P 500 Index, which declined 3.08% over the same period. The Fund’s positive performance variance was primarily due to its overweighting in the technology and consumer related sectors, which outperformed the index. In addition, the Fund’s concentration in the large-capitalization growth stock area helped performance, as the growth category outperformed the value category and large-cap companies generally outperformed both mid- and small-cap stocks.
In terms of individual security holdings, the largest contributors to performance were Amazon.com Inc., NVIDIA Corp. and Tesla, Inc., representing 12.08%, 3.70% and 2.63% respectively of the June 30, 2020 net asset value. Detracting from Fund performance were those securities in the financial sector, which included Bank of America Corp. and JPMorgan Chase & Co., representing 1.16% and 2.29% respectively of the June 30, 2020 net asset value. Also negatively impacting performance was Boeing Co., which was sold due to the added financial pressures from the COVID-19 pandemic.
Since year-end, the heightened market volatility afforded us the opportunity to rebalance the portfolio by trimming a few existing positions and adding new positions that we believe offer compelling risk-reward potential. We shifted into a few beaten-down sectors, by establishing new positions in Delta Air Lines, Inc., Las Vegas Sands Corp. and TJX Companies, Inc. representing 2.73%, 1.77% and 1.23% of June 30, 2020 net asset value.
As we enter the second half of the year, we expect the markets to remain sensitive to pandemic concerns. Stocks are down, but they’re not out. We expect corporate profits to rebound as the year progresses, offering key fundamental support for higher stock prices.
Page 6
| Performance Highlights (Unaudited) |
| Monetta Core Growth Fund | Period ended June 30, 2020 | |
Investment Objective: | Average Market Capitalization: | Total Net Assets: |
| Long Term Capital Growth | $762.8 billion | $56.32 million |
PERFORMANCE: | Average Annual Total Return | |||
1 Year | 3 Year | 5 Year | 10 Year | |
| Monetta Core Growth Fund | 9.77% | 11.73% | 10.77% | 13.99% |
S&P 500® Index | 7.51% | 10.73% | 10.73% | 13.99% |
| Total Annual Operating Expenses* | 1.29% | |||
| * | Source Prospectus dated April 30, 2020. Expense Ratio of 1.29% includes Acquired Fund Fees and Expenses of 0.03%. For the Fund’s current Expense Ratio, please refer to Page 16 of this Semi-Annual Report. |

Performance data quoted represents past performance; past performance does not guarantee future results. The investment return and principal value of an investment will fluctuate so that an investor’s shares, when redeemed, may be worth more or less than their original cost. The total returns do not reflect the deduction of taxes that a shareholder would pay on Fund distributions or the redemption of Fund shares. Current performance of the Fund may be lower or higher than the performance quoted. Performance data current to the most recent month end may be obtained by calling 1-800-MONETTA or visiting www.Monetta.com.
The hypothetical graph above compares the change in value of a $10,000 investment in the Monetta Core Growth Fund and the S&P 500® Index, for the 10-year period ending June 30, 2020, with dividend and capital gains reinvested.
Portfolio Weightings(a): |
Exchange Traded Funds | 47.7% |
Technology | 18.8% |
Financial | 13.8% |
Retail | 10.2% |
Healthcare | 3.7% |
Consumer Cyclical | 2.0% |
Transportation | 0.7% |
Other(c) | 3.1% |
Top 5 Equity Holdings(b): |
% of Net Assets | |
Amazon.com, Inc. | 8.3% |
Microsoft Corp. | 7.2% |
Alphabet, Inc. - CL C | 5.0% |
MasterCard, Inc. - CL A | 4.7% |
Apple, Inc. | 4.5% |
| Total Top 5 Equity Holdings: | 29.7% |
(a) | Portfolio weightings are subject to change daily and are calculated as a percentage of net assets. |
(b) | Excludes Exchange Traded Funds. |
(c) | Includes Money Market Funds and liabilities in excess of other assets. |
| Commentary |
The Monetta Core Growth Fund declined 1.35% for the six-month period ending June 30, 2020. This return compares favorably to its benchmark index, the S&P 500 Index, which was down 3.08%. As of June 30, 2020, approximately 47.7% of the Fund’s net asset value was invested in ETFs that generally track the performance of the S&P 500 Index. The Fund’s relative outperformance was due to its concentration in large capitalization growth stocks, especially those securities in the technology sector.
Specific holdings that enhanced Fund performance included Amazon.com Inc., Microsoft Corp. and Apple, Inc. representing 8.33%, 7.23% and 4.53% respectively of the June 30, 2020 net asset value. Detracting from performance were investments in the financial sector, which included Bank of America Corp. and JPMorgan Chase & Co., representing 2.11% and 2.50% of the June 30, 2020 net portfolio value, respectively. Both of these securities were trimmed during the first half.
Since year-end, portfolio turnover was minimal, but the Fund did experience net cash outflows. As a result, both ETF and individual securities holdings were trimmed to match the outflows. We also used market volatility to rebalance the portfolio by adding new securities to the portfolio which included Walt Disney Co., Southwest Airlines Co. and Advance Micro Devices, Inc., representing 1.98%, 0.70% and 2.05% respectively of the June 30, 2020 net asset value.
As we enter the second half we are focused on looking for opportunities to purchase quality growth companies at discounted prices. As opportunities occur, we intend to adjust the mix between the Fund’s ETF investments and individual stock holdings to potentially take advantage of oversold stock prices. We will get through this crisis, with the key variable being “time.”
Page 7
| Disclosure of Fund Expenses (Unaudited) | Period Ended June 30, 2020 |
As a shareholder of a mutual fund, you incur ongoing costs, including investment advisory fees; distribution expense (Monetta Core Growth Fund); and other Fund expenses. This Example is intended to help you understand your ongoing costs (in dollars) of investing in the Funds and to compare these costs with the ongoing costs of investing in other mutual funds. The Example is based on an investment of $1,000 invested at the beginning of the period and held for the most recent semiannual period, January 1, 2020 - June 30, 2020.
ACTUAL EXPENSES
The table below provides information about actual account values and actual expenses. The Example below includes, but is not limited to, investment advisory fees, distribution expense, accounting, custodian and transfer agent fees. However, the Example below does not include portfolio trading commissions and related expenses. You may use the information in this table, together with the amount you invested, to estimate the expenses that you paid over the period. Simply divide your account value by $1,000 (for example, an $8,600 account value divided by $1,000 = 8.6), then multiply the result by the number in the table under the heading entitled “Actual Expenses Paid During Period” to estimate the expenses you paid on your account during this period.
HYPOTHETICAL EXAMPLE FOR COMPARISON PURPOSES
The table below also provides information about hypothetical account values and hypothetical expenses based on the Funds’ actual expense ratio and an assumed rate of return of 5% per year before expenses, which is not the Fund’s actual return. The hypothetical account values and expenses may not be used to estimate the actual ending account balance or expenses you paid for the period. You may use this information to compare the ongoing costs of investing in the Funds and other funds. To do so, compare this 5% hypothetical example with the 5% hypothetical examples that appear in the shareholder reports of the other funds.
Please note that the expenses shown in the table are meant to highlight your ongoing costs only and do not reflect any transactional costs. Therefore, the hypothetical information is useful in comparing ongoing costs only, and will not help you determine the relative total costs of owning different funds. In addition, if these transactional costs were included, your costs may have been higher.
| BEGINNING | ACCOUNT | EXPENSES PAID | ||
| ACCOUNT VALUE | ENDING VALUE | DURING PERIOD(a) | ANNUALIZED | |
| 1/1/20 | 6/30/20 | 1/1/20-6/30/20 | EXPENSE RATIO | |
| ACTUAL | ||||
| Monetta Fund | $1,000.00 | $1,015.30 | $6.96 | 1.39% |
| Monetta Core Growth Fund | 1,000.00 | 986.50 | 6.87 | 1.39% |
| HYPOTHETICAL (5% ANNUAL RETURN BEFORE EXPENSES) | ||||
| Monetta Fund | $1,000.00 | $1,017.95 | $6.97 | 1.39% |
| Monetta Core Growth Fund | 1,000.00 | 1,017.95 | 6.97 | 1.39% |
| (a) | Expenses are equal to each Fund’s annualized expense ratio, multiplied by the average account value over the period, multiplied by 182/366 (to reflect the one-half year period). |
Page 8
| Schedule of Investments (Unaudited) | June 30, 2020 |
Monetta Fund
| COMMON STOCKS - 96.1% | |||||||
| NUMBER OF SHARES | VALUE | ||||||
| Capital Equipment - 2.4% | |||||||
| Aerospace & Defense-2.4% | |||||||
4,000 | Lockheed Martin Corp. | $ | 1,459,680 | ||||
| Consumer Cyclical - 16.4% | |||||||
| Apparel Manufacturing-2.4% | |||||||
11,000 | NIKE, Inc. - CL B | 1,078,550 | |||||
8,500 | PVH Corp. | 408,425 | |||||
| 1,486,975 | |||||||
| Automobile-3.7% | |||||||
25,000 | General Motors Co. | 632,500 | |||||
1,500 | Tesla, Inc. * | 1,619,715 | |||||
| 2,252,215 | |||||||
| Housing-2.0% | |||||||
20,000 | Lennar Corp. - CL A | 1,232,400 | |||||
| Leisure Service-5.6% | |||||||
15,000 | DraftKings, Inc. * | 498,900 | |||||
24,000 | Las Vegas Sands Corp. | 1,092,960 | |||||
2,500 | Netflix, Inc. * | 1,137,600 | |||||
10,000 | Wynn Resorts Ltd. | 744,900 | |||||
| 3,474,360 | |||||||
| Media-Radio/TV-2.7% | |||||||
15,000 | Walt Disney Co. | 1,672,650 | |||||
| Energy - 1.9% | |||||||
| Oil & Gas-Exploration | |||||||
| & Production-1.0% | |||||||
12,000 | EOG Resources, Inc. | 607,920 | |||||
| Oil & Gas-Integrated-0.9% | |||||||
12,000 | Exxon Mobil Corp. | 536,640 | |||||
| Financial - 20.0% | |||||||
| Bank-Money Center-6.7% | |||||||
30,000 | Bank of America Corp. | 712,500 | |||||
10,000 | Goldman Sachs | ||||||
Group, Inc. | 1,976,200 | ||||||
15,000 | JPMorgan Chase & Co. | 1,410,900 | |||||
| 4,099,600 | |||||||
| Finance-Miscellaneous-13.3% | |||||||
12,000 | Fiserv, Inc. * | 1,171,440 | |||||
14,000 | MasterCard, Inc. - CL A | 4,139,800 | |||||
15,000 | Visa, Inc. - CL A | 2,897,550 | |||||
| 8,208,790 | |||||||
| Healthcare - 3.3% | |||||||
| Healthcare-Biomedical/Genetic-1.4% | |||||||
125,000 | Amarin Corp. - ADR * | 865,000 | |||||
| Healthcare-Patient Care-1.9% | |||||||
4,000 | UnitedHealth Group, Inc. | 1,179,800 | |||||
| Retail - 17.3% | |||||||
| Retail-Major Chain-2.5% | |||||||
5,000 | Costco Wholesale Corp. | 1,516,050 | |||||
| Retail-Restaurant-1.5% | |||||||
5,000 | McDonald’s Corp. | 922,350 | |||||
| Retail-Specialty-13.3% | |||||||
2,700 | Amazon.com, Inc. * | 7,448,814 | |||||
15,000 | TJX Companies, Inc. | 758,400 | |||||
| 8,207,214 | |||||||
| Technology - 28.6% # | |||||||
| Computer Data Storage-4.7% | |||||||
8,000 | Apple, Inc. | 2,918,400 | |||||
| Computer-Software-6.2% | |||||||
15,000 | Microsoft Corp. | 3,052,650 | |||||
3,000 | Spotify Technology SA * | 774,570 | |||||
| 3,827,220 | |||||||
| Electronic-Semiconductor-5.8% | |||||||
25,000 | Advanced Micro | ||||||
Devices, Inc. * | 1,315,250 | ||||||
6,000 | NVIDIA Corp. | 2,279,460 | |||||
| 3,594,710 | |||||||
The accompanying notes are an integral part of these financial statements.
Page 9
| Schedule of Investments (Unaudited) | June 30, 2020 |
Monetta Fund (Continued)
| NUMBER OF SHARES | VALUE | ||||||
| Technology - 28.6% # (Cont’d) | |||||||
| Internet-11.9% | |||||||
8,000 | Akamai | ||||||
Technologies, Inc. * | $ | 856,720 | |||||
3,000 | Alphabet, Inc. - CL C * | 4,240,830 | |||||
10,000 | Facebook, Inc. - CL A * | 2,270,700 | |||||
| 7,368,250 | |||||||
| Transportation - 6.2% | |||||||
| Airline-6.2% | |||||||
60,000 | Delta Air Lines, Inc. | 1,683,000 | |||||
62,000 | Southwest Airlines Co. | 2,119,160 | |||||
| 3,802,160 | |||||||
| Total Common Stocks | |||||||
| (Cost $35,848,573) | 59,232,384 | ||||||
| MONEY MARKET FUNDS - 4.1% | |||||||
First American | |||||||
Government | |||||||
Obligations Fund - | |||||||
2,523,424 | Class X, 0.09% ^ | 2,523,424 | |||||
| Total Money Market Funds | |||||||
| (Cost $2,523,424) | 2,523,424 | ||||||
| Total Investments | |||||||
| (Cost $38,371,997) - 100.2% | 61,755,808 | ||||||
| Liabilities in Excess of | |||||||
| Other Assets - (0.2)% | (91,038 | ) | |||||
| TOTAL NET ASSETS - 100.00% | $ | 61,664,770 | |||||
ADR - American Depositary Receipt
| * | Non-Income Producing. |
| # | As of June 30, 2020, the Monetta Fund had a significant portion of its assets invested in this sector and therefore is subject to additional risk. See Note 6 in Notes to Financial Statements. |
| ^ | Rate shown is the seven day effective yield at June 30, 2020. |
Industry classification provided by William O’Neil & Co., Inc.
The accompanying notes are an integral part of these financial statements.
Page 10
| Schedule of Investments (Unaudited) | June 30, 2020 |
Monetta Core Growth Fund
| COMMON STOCKS - 49.2% | |||||||
| NUMBER OF SHARES | VALUE | ||||||
| Consumer Cyclical - 2.0% | |||||||
| Media-Radio/TV-2.0% | |||||||
10,000 | Walt Disney Co. | $ | 1,115,100 | ||||
| Financial - 13.8% | |||||||
| Bank-Money Center-4.6% | |||||||
50,000 | Bank of America Corp. | 1,187,500 | |||||
15,000 | JPMorgan Chase & Co. | 1,410,900 | |||||
| 2,598,400 | |||||||
| Finance-Miscellaneous-9.2% | |||||||
9,000 | MasterCard, Inc. - CL A | 2,661,300 | |||||
13,000 | Visa, Inc. - CL A | 2,511,210 | |||||
| 5,172,510 | |||||||
| Healthcare - 3.7% | |||||||
| Healthcare-Biomedical/Genetic-1.6% | |||||||
130,000 | Amarin Corp. - ADR * | 899,600 | |||||
| Healthcare-Patient Care-2.1% | |||||||
4,000 | UnitedHealth Group, Inc. | 1,179,800 | |||||
| Retail - 10.2% | |||||||
| Retail-Major Chain-1.9% | |||||||
3,500 | Costco Wholesale Corp. | 1,061,235 | |||||
| Retail-Specialty-8.3% | |||||||
1,700 | Amazon.com, Inc. * | 4,689,994 | |||||
| Technology - 18.8% | |||||||
| Computer Data Storage-4.5% | |||||||
7,000 | Apple, Inc. | 2,553,600 | |||||
| Computer-Software-7.2% | |||||||
20,000 | Microsoft Corp. | 4,070,200 | |||||
| Electronic-Semiconductor-2.1% | |||||||
22,000 | Advanced Micro | ||||||
Devices, Inc. * | 1,157,420 | ||||||
| Internet-5.0% | |||||||
2,000 | Alphabet, Inc. - CL C * | 2,827,220 | |||||
| Transportation - 0.7% | |||||||
| Airline-0.7% | |||||||
11,500 | Southwest Airlines Co. | 393,070 | |||||
| Total Common Stocks | |||||||
| (Cost $12,693,043) | 27,718,149 | ||||||
| EXCHANGE TRADED FUNDS - 47.7% | |||||||
55,000 | SPDR S&P 500 Trust | 16,959,800 | |||||
35,000 | Vanguard S&P 500 | 9,920,050 | |||||
| Total Exchange Traded Funds | |||||||
| (Cost $14,378,828) | 26,879,850 | ||||||
| MONEY MARKET FUNDS - 3.2% | |||||||
First American | |||||||
Government | |||||||
Obligations Fund - | |||||||
1,815,893 | Class X, 0.09%^ | 1,815,893 | |||||
| Total Money Market Funds | |||||||
| (Cost $1,815,893) | 1,815,893 | ||||||
| Total Investments | |||||||
| (Cost $28,887,764) - 100.1% | 56,413,892 | ||||||
| Liabilities in Excess | |||||||
| of Other Assets - (0.1)% | (90,332 | ) | |||||
| TOTAL NET ASSETS - 100.0% | $ | 56,323,560 | |||||
ADR - American Depositary Receipt
| * | Non-Income Producing. |
| ^ | Rate shown is the seven day effective yield at June 30, 2020. |
Industry classification provided by William O’Neil & Co., Inc.
The accompanying notes are an integral part of these financial statements.
Page 11
| Statements of Assets and Liabilities (Unaudited) | June 30, 2020 |
| Monetta Core | ||||||||
| Monetta Fund | Growth Fund | |||||||
| Assets: | ||||||||
Investments at value(a) | $ | 61,755,808 | $ | 56,413,892 | ||||
Receivables: | ||||||||
| Interest and dividends | 2,922 | 125,357 | ||||||
| Fund shares sold | 275 | 12,705 | ||||||
Prepaid expenses | 17,946 | 17,988 | ||||||
Total Assets | 61,776,951 | 56,569,942 | ||||||
| Liabilities: | ||||||||
Payables: | ||||||||
| Investment advisory fees (Note 2) | 48,177 | 25,878 | ||||||
| Distribution fees (Note 5) | — | 45,577 | ||||||
| Fund shares redeemed | 20,000 | 92,345 | ||||||
| Accrued trustee fees | 4,680 | 8,504 | ||||||
| Accrued compliance fees | 668 | 2,851 | ||||||
| Accrued transfer agent fees | 13,001 | 37,155 | ||||||
| Accrued fund administration fees | 6,156 | 7,766 | ||||||
| Accrued audit fees | 7,652 | 8,579 | ||||||
| Accrued other expenses | 11,847 | 17,727 | ||||||
Total Liabilities | 112,181 | 246,382 | ||||||
| Net Assets | $ | 61,664,770 | $ | 56,323,560 | ||||
| Analysis of net assets: | ||||||||
Paid-in capital | 36,428,727 | 12,748,743 | ||||||
Total distributable earnings | 25,236,043 | 43,574,817 | ||||||
| Net Assets | $ | 61,664,770 | $ | 56,323,560 | ||||
(a) Investments at cost | $ | 38,371,997 | $ | 28,887,764 | ||||
Shares of beneficial interest issued outstanding | 2,814,087 | 2,486,365 | ||||||
| Net asset value, offering price and redemption price per share | $ | 21.91 | $ | 22.65 | ||||
The accompanying notes are an integral part of these financial statements.
Page 12
| Statements of Operations (Unaudited) | For The Six Month Period Ended |
| June 30, 2020 |
| Monetta Core | ||||||||
| Monetta Fund | Growth Fund | |||||||
| Investment income and expenses: | ||||||||
Investment income: | ||||||||
| Interest | $ | 9,967 | $ | 2,787 | ||||
| Dividends | 267,518 | 384,932 | ||||||
Total investment income | 277,485 | 387,719 | ||||||
Expenses: | ||||||||
| Investment advisory fees (Note 2) | 278,950 | 169,291 | ||||||
| Distribution expense (Note 5) | — | 76,950 | ||||||
| Transfer agent fees | 43,573 | 74,901 | ||||||
| Administration fees | 18,829 | 19,523 | ||||||
| Accounting fees | 14,528 | 14,429 | ||||||
| State registration fees | 11,399 | 15,205 | ||||||
| Compliance fees | 9,477 | 11,919 | ||||||
| Trustee fees | 8,709 | 11,662 | ||||||
| Audit fees | 7,652 | 8,075 | ||||||
| Legal fees | 5,318 | 7,529 | ||||||
| Custodian fees | 4,020 | 6,057 | ||||||
| Printing and postage fees | 3,271 | 6,320 | ||||||
| Other expenses | 2,449 | 2,920 | ||||||
| Insurance fees | 1,365 | 2,061 | ||||||
Total expenses | 409,540 | 426,842 | ||||||
| Net investment loss | (132,055 | ) | (39,123 | ) | ||||
| Realized and unrealized gain (loss) on investments: | ||||||||
Net realized gain on investments | 1,607,804 | 9,734,488 | ||||||
Net change in unrealized appreciation/depreciation of investments | (616,335 | ) | (11,765,868 | ) | ||||
| Net realized and unrealized gain (loss) on investments | 991,469 | (2,031,380 | ) | |||||
| Net increase (decrease) in net assets from operations | $ | 859,414 | $ | (2,070,503 | ) | |||
The accompanying notes are an integral part of these financial statements.
Page 13
| Statements of Changes in Net Assets | For The Six Month Period Ended June 30, 2020 |
| and Year Ended December 31, 2019 |
| Monetta Core | ||||||||||||||||
| Monetta Fund | Growth Fund | |||||||||||||||
| 2020 | 2019 | 2020 | 2019 | |||||||||||||
| (Unaudited) | (Unaudited) | |||||||||||||||
| Operations: | ||||||||||||||||
Net investment income (loss) | $ | (132,055 | ) | $ | (116,653 | ) | $ | (39,123 | ) | $ | 195,689 | |||||
Net realized gain on investments | 1,607,804 | 755,987 | 9,734,488 | 12,477,350 | ||||||||||||
Net change in unrealized appreciation/ | ||||||||||||||||
depreciation of investments | (616,335 | ) | 13,870,834 | (11,765,868 | ) | 10,781,716 | ||||||||||
Net increase (decrease) in | ||||||||||||||||
net assets from operations | 859,414 | 14,510,168 | (2,070,503 | ) | 23,454,755 | |||||||||||
| Distributions: | ||||||||||||||||
Total distributions to shareholders | — | — | — | (5,425,713 | ) | |||||||||||
| Capital transactions (Note 3): | ||||||||||||||||
Proceeds from shares sold | 224,370 | 458,989 | 1,672,400 | 12,473,959 | ||||||||||||
Net asset value of shares issued | ||||||||||||||||
through dividend reinvestment | — | — | — | 5,127,582 | ||||||||||||
Cost of shares redeemed | (1,767,483 | ) | (5,431,784 | ) | (18,932,503 | ) | (37,616,197 | ) | ||||||||
Decrease in net assets | ||||||||||||||||
from capital transactions | (1,543,113 | ) | (4,972,795 | ) | (17,260,103 | ) | (20,014,656 | ) | ||||||||
| Total increase (decrease) | ||||||||||||||||
| in net assets | (683,699 | ) | 9,537,373 | (19,330,606 | ) | (1,985,614 | ) | |||||||||
Net assets at beginning of period | $ | 62,348,469 | $ | 52,811,096 | $ | 75,654,166 | $ | 77,639,780 | ||||||||
| Net assets at end of period | $ | 61,664,770 | $ | 62,348,469 | $ | 56,323,560 | $ | 75,654,166 | ||||||||
The accompanying notes are an integral part of these financial statements.
Page 14
| Financial Highlights |
| Monetta Fund | ||||||||||||||||||||||||
| Six Months | ||||||||||||||||||||||||
| Ended | Year Ended | Year Ended | Year Ended | Year Ended | Year Ended | |||||||||||||||||||
For a share outstanding | June 30, 2020 | December 31, | December 31, | December 31, | December 31, | December 31, | ||||||||||||||||||
throughout the periods: | (Unaudited) | 2019 | 2018 | 2017 | 2016 | 2015 | ||||||||||||||||||
Net asset value at | ||||||||||||||||||||||||
beginning of period | $ | 21.58 | $ | 16.82 | $ | 18.89 | $ | 16.93 | $ | 16.28 | $ | 17.68 | ||||||||||||
Investment Operations: | ||||||||||||||||||||||||
Net investment income (loss)(a) | (0.05 | ) | (0.04 | ) | (0.06 | ) | (0.06 | ) | 0.00 | (b) | (0.02 | ) | ||||||||||||
Net realized and unrealized | ||||||||||||||||||||||||
gain (loss) on investments | 0.38 | 4.80 | (0.44 | ) | 3.28 | 1.13 | 0.64 | |||||||||||||||||
Total from | ||||||||||||||||||||||||
investment operations | 0.33 | 4.76 | (0.50 | ) | 3.22 | 1.13 | 0.62 | |||||||||||||||||
Less Distributions: | ||||||||||||||||||||||||
From net investment income | — | — | — | — | (0.00 | )(b) | — | |||||||||||||||||
From net realized gains | — | — | (1.57 | ) | (1.26 | ) | (0.48 | ) | (2.02 | ) | ||||||||||||||
Total distributions | — | — | (1.57 | ) | (1.26 | ) | (0.48 | ) | (2.02 | ) | ||||||||||||||
Net asset value at | ||||||||||||||||||||||||
end of period | $ | 21.91 | $ | 21.58 | $ | 16.82 | $ | 18.89 | $ | 16.93 | $ | 16.28 | ||||||||||||
Total return | 1.53 | %(c) | 28.30 | % | -3.36 | % | 19.19 | % | 6.98 | % | 3.19 | % | ||||||||||||
Ratios to average net assets: | ||||||||||||||||||||||||
| Expenses - Net | 1.39 | %(d) | 1.40 | % | 1.37 | % | 1.40 | % | 1.45 | % | 1.40 | % | ||||||||||||
| Expenses - Gross | 1.39 | %(d) | 1.40 | % | 1.37 | % | 1.40 | % | 1.45 | % | 1.40 | % | ||||||||||||
| Net investment | ||||||||||||||||||||||||
| income (loss) | (0.45 | )%(d) | (0.20 | )% | (0.31 | )% | (0.33 | )% | 0.01 | % | (0.11 | )% | ||||||||||||
| Portfolio turnover | 42.8 | %(c) | 61.8 | % | 128.8 | % | 122.9 | % | 120.2 | % | 146.2 | % | ||||||||||||
Net assets (in thousands) | $ | 61,665 | $ | 62,348 | $ | 52,811 | $ | 57,963 | $ | 54,497 | $ | 53,709 | ||||||||||||
(a) The per share amounts are calculated using the weighted average number of shares outstanding during the period.
(b) Rounds to zero.
(c) Not annualized.
(d) Annualized.
The accompanying notes are an integral part of these financial statements.
Page 15
| Financial Highlights |
| Monetta Core Growth Fund | ||||||||||||||||||||||||
| Six Months | ||||||||||||||||||||||||
| Ended | Year Ended | Year Ended | Year Ended | Year Ended | Year Ended | |||||||||||||||||||
For a share outstanding | June 30, 2020 | December 31, | December 31, | December 31, | December 31, | December 31, | ||||||||||||||||||
throughout the periods: | (Unaudited) | 2019 | 2018 | 2017 | 2016 | 2015 | ||||||||||||||||||
Net asset value at | ||||||||||||||||||||||||
beginning of period | $ | 22.96 | $ | 18.64 | $ | 24.00 | $ | 20.26 | $ | 18.99 | $ | 20.65 | ||||||||||||
Investment Operations: | ||||||||||||||||||||||||
Net investment (loss) income(a) | (0.01 | ) | 0.05 | 0.06 | 0.07 | 0.11 | 0.09 | |||||||||||||||||
Net realized and unrealized | ||||||||||||||||||||||||
gain (loss) on investments | (0.30 | ) | 5.96 | (0.94 | )(f) | 4.58 | 1.81 | 0.25 | ||||||||||||||||
Total from | ||||||||||||||||||||||||
investment operations | (0.31 | ) | 6.01 | (0.88 | ) | 4.65 | 1.92 | 0.34 | ||||||||||||||||
Less Distributions: | ||||||||||||||||||||||||
From net investment income | — | (0.06 | ) | (0.07 | ) | (0.07 | ) | (0.12 | ) | (0.09 | ) | |||||||||||||
From net realized gains | — | (1.63 | ) | (4.41 | ) | (0.84 | ) | (0.53 | ) | (1.91 | ) | |||||||||||||
Total distributions | — | (1.69 | ) | (4.48 | ) | (0.91 | ) | (0.65 | ) | (2.00 | ) | |||||||||||||
Net asset value at | ||||||||||||||||||||||||
end of period | $ | 22.65 | $ | 22.96 | $ | 18.64 | $ | 24.00 | $ | 20.26 | $ | 18.99 | ||||||||||||
Total return | -1.35 | %(d) | 32.58 | % | -5.30 | % | 23.10 | % | 10.16 | % | 1.40 | % | ||||||||||||
Ratios to average net assets: | ||||||||||||||||||||||||
Expenses - Net(b) | 1.39 | %(e) | 1.26 | % | 1.17 | % | 1.16 | % | 1.22 | % | 1.18 | % | ||||||||||||
Expenses - Gross(b) | 1.39 | %(e) | 1.26 | % | 1.17 | % | 1.16 | % | 1.22 | % | 1.18 | % | ||||||||||||
| Net investment | ||||||||||||||||||||||||
income (loss)(b)(c) | (0.13 | )%(e) | 0.23 | % | 0.23 | % | 0.33 | % | 0.58 | % | 0.42 | % | ||||||||||||
| Portfolio turnover | 7.5 | %(d) | 6.7 | % | 28.1 | % | 36.1 | % | 41.9 | % | 51.1 | % | ||||||||||||
Net assets (in thousands) | $ | 56,324 | $ | 75,654 | $ | 77,640 | $ | 145,845 | $ | 116,972 | $ | 120,150 | ||||||||||||
| (a) | The per shares amounts are calculated using the weighted average number of shares outstanding during the period. |
| (b) | The ratios of expenses and net investment income do not include the Fund’s proportionate share of expense and income of the underlying investment companies in which it invests. |
| (c) | Recognition of net investment income by the Fund is affected by the timing of the declaration of dividends by the underlying investment companies in which it invests. |
| (d) | Not annualized. |
| (e) | Annualized. |
| (f) | Realized and unrealized gains and losses per share in this caption are balancing amounts necessary to reconcile the change in net asset value per share for the period, and may not reconcile with the aggregate gains and losses in the Statements of Operations due to share transactions for the period. |
The accompanying notes are an integral part of these financial statements.
Page 16
| Notes to Financial Statements (Unaudited) | June 30, 2020 |
| 1. | SIGNIFICANT ACCOUNTING POLICIES: |
| Monetta Trust (the “Trust”) is an open-end diversified management investment company registered under the Investment Company Act of 1940, as amended (the “1940 Act”). The following funds, collectively referred to as the Funds, are series of the Trust: | |
Monetta Fund. The primary objective of this Fund is long-term capital growth. The Fund seeks this objective by investing primarily in equity securities believed to have growth potential. The Fund presently invests primarily in large capitalization growth companies. | |
Monetta Core Growth Fund. The objective of this Fund is long-term capital growth. The Fund seeks this objective by investing approximately 50% of its assets in exchange traded funds (“ETFs”) and other funds seeking to track the S&P 500® Index or other broad-based market indices that primarily include stocks of large capitalization U.S. companies and the remainder of its assets in common stocks of individual companies that Monetta Financial Services, Inc., (the “Adviser”) considers to be high quality well-known companies that produce products or provide services that are recognized by many investors. | |
The Funds are investment companies and accordingly follow the investment company accounting and reporting guidance of the Financial Accounting Standards Board (“FASB”) Accounting Standards Codification Topic 946 Financial Services – Investment Companies. | |
| The following is a summary of significant accounting policies followed by the Funds in the preparation of their financial statements in accordance with accounting principles generally accepted in the United States of America (“U.S. GAAP”). | |
| (a) Securities Valuation | |
| Equity securities, including American Depositary Receipts (“ADR”s) and ETFs are stated at fair value, based on the official closing price as of the time of valuation. If there is no official closing price of a security on the valuation date, the security is valued at the mean between the most recent bid and ask quotation, in each case on the principal exchange or market on which that security is traded. If there are no reported sales and no reported bid quotations for a security on a valuation date, or it is not traded on an exchange, the securities are “fair valued” in accordance with the Funds’ Fair Value Procedures. To the extent these securities are actively traded, and valuation adjustments are not applied, they are categorized in Level 1 of the fair value hierarchy. Other securities traded over-the-counter shall be valued at the official closing price. If there is no official closing price, the security is valued at the most recent mean quotation. Investments in registered open-end management companies, including money market funds, will be valued based on the net asset value (“NAV”) of such investments and are categorized as Level 1 of the fair value hierarchy. | |
| Securities for which market quotations are not readily available or are deemed unreliable are valued at their fair value in accordance with procedures established by the Board of Trustees (“Board”). In determining the fair value of a security, the Adviser and the Board shall take into account the relevant factors and surrounding circumstances, which may include: (i) the nature and duration of restrictions, if any, on the disposition of the security; (ii) fundamental analytical data relating to the security; (iii) evaluation of the forces that influence the market in which the security is traded; (iv) information as to any transactions in or offers for the security; (v) the existence of any merger proposal, tender offer or other extraordinary events relating to the security; (vi) the price and extent of public trading in similar securities of the issuer or of comparable companies; and (vii) any other methodologies and factors that they consider appropriate. | |
| (b) Use of Estimates | |
| The preparation of financial statements, in conformity with U.S. GAAP, requires the Funds’ management to make estimates and assumptions that affect reported amounts of assets and liabilities and disclosures of contingent assets and liabilities at the date of the financial statements and the results of operations during the reporting period. Actual results could differ from those estimates. | |
| (c) General | |
| Security transactions are accounted for on a trade date basis. Daily realized gains and losses from security transactions are reported on the specific lot identification basis. Interest income is recorded daily on the accrual basis and dividend income on the ex-dividend date. Withholding taxes on foreign dividends have been provided for in accordance with the Funds’ understanding of the applicable country’s tax rules and regulations. Any distributions received from investments in ETFs which represent long-term capital gains are recorded by the Funds as a realized gain. |
Page 17
| Notes to Financial Statements (Unaudited) (continued) | June 30, 2020 |
| (d) Expenses | |
| Expenses that are directly related to one of the Funds are charged directly to that Fund. Other operating expenses are allocated to the Funds on several bases, including relative net assets of all the Funds within the Monetta Trust. | |
| (e) Federal Income Taxes | |
| It is each Fund’s policy to comply with the requirements of the Internal Revenue Code applicable to regulated investment companies and to distribute substantially all of its taxable income to its shareholders. Accordingly, no provision for federal income taxes is required. As of and during the period ended June 30, 2020, the Funds did not have any tax positions that did not meet the “more-likely-than-not” threshold of being sustained by the applicable tax authority. As of and during the period ended June 30, 2020, the Funds did not have any liabilities for any unrecognized tax benefits. The Funds recognize interest and penalties, if any, related to unrecognized tax benefits on uncertain tax positions as income tax expense in the Statement of Operations. As of and during the period ended June 30, 2020, the Funds did not incur any interest and penalties. The Funds are not subject to examination by U.S. tax authorities for tax years prior to the fiscal year ended December 31, 2016. | |
| The Funds will utilize capital loss carry forwards as allowable, to minimize certain distributions of capital gains. The Funds intend to utilize provisions of the federal income tax laws which allow them to carry a realized loss forward indefinitely and retain their character as either short-term or long-term capital losses. At December 31, 2019, there were no loss carryforwards. | |
| Net realized gains or losses differ for financial reporting and tax purposes as a result of losses from wash sales. At December 31, 2019, the Funds had no short-term post-October capital losses which were realized after October 31, 2019 and deferred for tax purposes to January 1, 2020. | |
| (f) Distributions of Incomes and Gains | |
| Distributions to shareholders are recorded by the Funds on the ex-dividend date. Due to inherent differences in the characterization of short-term capital gains under U.S. GAAP, and for federal income tax purposes, the amount of distributable net investment income for book and federal income tax purposes may differ. | |
| As of December 31, 2019, the components of distributable earnings on a tax basis were as follows: |
| Monetta | Monetta Core | ||||||||
| Fund | Growth Fund | ||||||||
| Undistributed Ordinary Income | $ | — | $ | 427 | |||||
| Undistributed Long-Term Capital Gain | 464,804 | 6,352,897 | |||||||
| Net Unrealized Appreciation | 23,911,825 | 39,291,996 | |||||||
| Total Distributable Earnings | $ | 24,376,629 | $ | 45,645,320 | |||||
| The tax character of distributions paid during the periods ended June 30, 2020 and the calendar year ended December 31, 2019 were as follows: |
| Monetta | Monetta Core | ||||||||
| 2020 | Fund | Growth Fund | |||||||
| Ordinary Income* | $ | — | $ | — | |||||
| Long-Term Capital Gain | — | — | |||||||
| Total Distributions to Shareholders | $ | — | $ | — | |||||
| Monetta | Monetta Core | ||||||||
| 2019 | Fund | Growth Fund | |||||||
| Ordinary Income* | $ | — | $ | 629,204 | |||||
| Long-Term Capital Gain | — | 4,796,509 | |||||||
| Total Distributions to Shareholders | $ | — | $ | 5,425,713 | |||||
| * For Federal income tax purposes, distributions of short-term capital gains are treated as ordinary income distributions. | |||||||||
Page 18
| Notes to Financial Statements (Unaudited) (continued) | June 30, 2020 |
| (g) Fair Value Measurements | |
| In accordance with ASC 820-10, fair value is defined as the price that a Fund would receive to sell an investment or pay to transfer a liability in an orderly transaction with an independent buyer in the principal market or, in the absence of a principal market, the most advantageous market for the investment or liability. ASC 820-10 establishes a three-tier hierarchy to distinguish between (1) inputs that reflect the assumptions market participants would use in pricing an asset or liability developed based on market data obtained from sources independent of the reporting entity (observable inputs) and (2) inputs that reflect the reporting entity’s own assumptions about the assumptions market participants would use in pricing an asset or liability developed based on the best information available in the circumstances (unobservable inputs) and to establish classification of fair value measurements for disclosure purposes. Various inputs are used in determining the value of each Fund’s investments. The inputs are summarized in the three broad Levels listed below. |
| • Level 1 - | quoted prices in active markets for identical investments; | |
| • Level 2 - | other significant observable inputs (including quoted prices for similar investments, interest rates, prepayment speeds, credit risk, etc.); | |
| • Level 3 - | significant unobservable inputs (including each Fund’s own assumptions in determining the fair value of investments). |
| The inputs or methodology used for valuing securities are not necessarily an indication of the risk associated with investing in those securities. | |
| The following table summarizes each respective Fund’s investments at June 30, 2020, based on the inputs used to value them: |
| INVESTMENTS IN SECURITIES | |||||||||||||||||
| Type of Investments | Level 1 | Level 2 | Level 3 | Total | |||||||||||||
| Monetta Fund | |||||||||||||||||
| Common Stocks | $ | 59,232,384 | $ | — | $ | — | $ | 59,232,384 | |||||||||
| Money Market Funds | $ | 2,523,424 | $ | — | $ | — | $ | 2,523,424 | |||||||||
| FUND TOTAL | $ | 61,755,808 | $ | — | $ | — | $ | 61,755,808 | |||||||||
| Monetta Core Growth Fund | |||||||||||||||||
| Common Stocks | $ | 27,718,149 | $ | — | $ | — | $ | 27,718,149 | |||||||||
| Exchange Traded Funds | $ | 26,879,850 | $ | — | $ | — | $ | 26,879,850 | |||||||||
| Money Market Funds | $ | 1,815,893 | $ | — | $ | — | $ | 1,815,893 | |||||||||
| FUND TOTAL | $ | 56,413,892 | $ | — | $ | — | $ | 56,413,892 | |||||||||
| Refer to each Fund’s Schedule of Investments for further information on the classification of investments. | |
| 2. | RELATED PARTIES: |
| Robert S. Bacarella is an officer and trustee of the Funds and also an officer, director and majority shareholder of the Adviser. Robert J. Bacarella is an officer of the Funds and also an officer of the Adviser. As of and for the period ended June 30, 2020, remunerations required to be paid to all interested trustees have been directly paid by the Adviser. Fees paid to independent trustees have been directly paid by the Funds. | |
| Each Fund pays the Adviser a monthly investment advisory fee, based upon the average net assets of each Fund, which is calculated and accrued daily. | |
| The Monetta Fund pays the Adviser based on an annual rate of 0.95% for the first $300 million in net assets, 0.90% for the next $200 million in net assets, and 0.85% for net assets over $500 million. The Monetta Core Growth Fund pays the Adviser based on an annual rate of 0.55% on all net assets. From these fees the Adviser pays for all necessary office facilities, equipment and personnel for managing the assets of each Fund. |
Page 19
| Notes to Financial Statements (Unaudited) (continued) | June 30, 2020 |
| 3. | CAPITAL STOCK AND SHARE UNITS: |
| There is an unlimited number of “no par value” shares of beneficial interest authorized for each series of the Trust. |
| Monetta | Monetta Core | ||||||||
| Fund | Growth Fund | ||||||||
| 2019 Beginning Shares | 3,139,804 | 4,164,873 | |||||||
| Shares sold | 23,498 | 580,986 | |||||||
| Shares issued upon dividend reinvestment | — | 231,520 | |||||||
| Shares redeemed | (274,731 | ) | (1,682,764 | ) | |||||
| Net decrease in shares outstanding | (251,233 | ) | (870,258 | ) | |||||
| 2020 Beginning Shares | 2,888,571 | 3,294,615 | |||||||
| Shares sold | 11,062 | 77,488 | |||||||
| Shares issued upon dividend reinvestment | — | — | |||||||
| Shares redeemed | (85,546 | ) | (885,738 | ) | |||||
| Net decrease in shares outstanding | (74,484 | ) | (808,250 | ) | |||||
| 2020 Ending Shares | 2,814,087 | 2,486,365 | |||||||
| 4. | PURCHASES AND SALES OF INVESTMENT SECURITIES: |
| The cost of purchases and proceeds from sales of securities for the six month period ended June 30, 2020, excluding short-term securities were: |
| U.S. Government | Other Investment | ||||||||||||||||
| Securities | Securities | ||||||||||||||||
| Purchases | Sales | Purchases | Sales | ||||||||||||||
| Monetta Fund | $ | — | $ | — | $ | 24,015,386 | $ | 25,335,527 | |||||||||
| Monetta Core Growth Fund | — | — | 4,579,160 | 22,472,610 | |||||||||||||
| 5. | DISTRIBUTION PLAN: |
| The Trust and its shareholders have adopted a service and distribution plan (the “Plan”) pursuant to Rule 12b-1 under the 1940 Act. The Plan permits the participating Fund to pay certain expenses associated with the distribution of its shares. Annual fees under the Plan up to 0.25% for the Monetta Core Growth Fund are accrued daily. | |
| Quasar Distributors, LLC (“Quasar”) acts as the Fund’s distributor and principal underwriter in a continuous public offering of the Fund’s shares. Effective March 31, 2020, Foreside Financial Group, LLC (“Foreside”) acquired Quasar from U.S. Bancorp. As a result of the acquisition, Quasar became a wholly-owned broker-dealer subsidiary of Foreside and is no longer affiliated with U.S. Bancorp. The Board has approved a new Distribution Agreement to enable Quasar to continue serving as the Fund’s distributor. | |
| 6. | SECTOR RISK: |
| As of June 30, 2020, the Monetta Fund had a significant portion of their assets invested in the technology sector. The technology sector may be more sensitive to changes in domestic and international competition, economic cycles, financial resources, personnel availability, rapid innovation and intellectual property issues. | |
| 7. | ETF RISK: |
| As of June 30, 2020, the Monetta Core Growth Fund had a significant portion of its assets invested in ETFs. ETFs are a type of index fund bought and sold on a securities exchange. An ETF trades like a common stock and represents a fixed portfolio of securities designed to track the performance and dividend yield of a particular domestic or foreign market index. The Fund may purchase an ETF to gain exposure to a portion of the U.S. or a foreign market. The risks of owning an ETF generally reflect the risks of owning the underlying securities they are designed to track, although the lack of liquidity on an ETF could result in it being more volatile. Additionally, ETFs have fees and expenses that reduce their value. |
Page 20
| Notes to Financial Statements (Unaudited) (continued) | June 30, 2020 |
| 8. | CONTROL OWNERSHIP: |
| The beneficial ownership, either directly or indirectly, of more than 25% of the voting securities of a fund creates a presumption of control of the fund, under Section 2(a)(9) of the 1940 Act. As of June 30, 2020, Charles Schwab & Co., for the benefit of its customers, owned 37.57% of the outstanding shares of the Monetta Core Growth Fund. |
Page 21
| Notice to Shareholders (Unaudited) | June 30, 2020 |
Proxy Voting Policies and Proxy Voting Record
The Funds’ proxy voting policies and procedures, as well as its proxy voting record for the most recent 12-month period ended June 30, are available without charge, upon request, by contacting the Adviser at 1-800-MONETTA, or by writing to Monetta Financial Services, Inc., 1776-A South Naperville Rd., Suite 100, Wheaton, IL 60189. The Funds’ proxy voting record is also available on the U.S. Securities and Exchange Commission’s website at www.sec.gov.
Availability of Fund Portfolio Information
Each Fund files complete schedules of portfolio holdings with the SEC for the first and third quarters of each fiscal year on Form N-Q or Part F of Form N-PORT (beginning with filings after March 31,2020). The Funds’ Form N-Q or Part F of N-PORT are available on the SEC’s website at www.sec.gov and may be reviewed and copied at the SEC’s Public Reference Room in Washington D.C. For more information on the Public Reference Room call 1-800-SEC-0330. In addition, each Fund’s Form N-Q or Part F of Form N-PORT is available without charge upon request by calling 1-866-964-4683.
Householding
In an effort to decrease costs, the Funds intend to reduce the number of duplicate prospectuses and annual and semi-annual reports you receive by sending only one copy of each to those addresses shared by two or more accounts and to shareholders we reasonably believe are from the same family or household (“householding”). If you would like to opt out of householding or, once implemented, if you would like to discontinue householding for your accounts, please call toll-free at 1-800-241-9772 to request individual copies of these documents. Once the Funds receive notice to stop householding, we will begin sending individual copies 30 days after receiving your request. This policy does not apply to account statements.
Information about the Funds’ Trustees
The Statement of Additional Information (“SAI”) includes information about the Funds’ Trustees and is available without charge, upon request, by calling 1-800-MONETTA.
Page 22
(This Page Intentionally Left Blank.)
Monetta Mutual Funds
1776-A South Naperville Road
Suite 100
Wheaton, IL 60189-5831
Item 2. Code of Ethics.
Not applicable for semi-annual reports.
Item 3. Audit Committee Financial Expert.
Not applicable for semi-annual reports.
Item 4. Principal Accountant Fees and Services.
Not applicable for semi-annual reports.
Item 5. Audit Committee of Listed Registrants.
Not applicable to Registrant’s who are not listed issuers (as defined in Rule 10A-3 under the Securities Exchange Act of 1934).
Item 6. Schedule of Investments.
(a) Schedule of Investments is included as part of the report to shareholders filed under Item 1 of this form.
(b) Not applicable
Item 7. Disclosure of Proxy Voting Policies and Procedures for Closed-End Management Investment Companies.
Not applicable to open-end investment companies.
Item 8. Portfolio Managers of Closed-End Management Investment Companies.
Not applicable to open-end investment companies.
Item 9. Purchases of Equity Securities by Closed‑End Management Investment Company and Affiliated Purchasers.
Not applicable to open-end investment companies.
Item 10. Submission of Matters to a Vote of Security Holders.
There have been no material changes to the procedures by which shareholders may recommend nominees to the Registrant’s board of trustees.
Item 11. Controls and Procedures.
(a) | The Registrant’s President and Treasurer have reviewed the Registrant's disclosure controls and procedures (as defined in Rule 30a-3(c) under the Investment Company Act of 1940 (the “Act”)) as of a date within 90 days of the filing of this report, as required by Rule 30a-3(b) under the Act and Rules 13a-15(b) or 15d‑15(b) under the Securities Exchange Act of 1934. Based on their review, such officers have concluded that the disclosure controls and procedures are effective in ensuring that information required to be disclosed in this report is appropriately recorded, processed, summarized and reported and made known to them by others within the Registrant and by the Registrant’s service provider. |
(b) | There were no significant changes in the Registrant's internal control over financial reporting (as defined in Rule 30a-3(d) under the Act) that occurred during the period covered by this report that has materially affected, or is reasonably likely to materially affect, the Registrant's internal control over financial reporting. |
Item 12. Disclosure of Securities Lending Activities for Closed-End Management Investment Companies
Not applicable to open-end investment companies.
Item 13. Exhibits.
| (a) | (1) Any code of ethics or amendment thereto, that is the subject of the disclosure required by Item 2, to the extent that the Registrant intends to satisfy Item 2 requirements through filing an exhibit. 1) Not applicable for semi-annual reports. |
(3) Any written solicitation to purchase securities under Rule 23c‑1 under the Act sent or given during the period covered by the report by or on behalf of the Registrant to 10 or more persons. Not applicable to open-end investment companies.
(4) Change in the Registrant’s independent public accountant. There was no change in the Registrant’s independent public accountant for the period covered by this report.
SIGNATURES
Pursuant to the requirements of the Securities Exchange Act of 1934 and the Investment Company Act of 1940, the Registrant has duly caused this report to be signed on its behalf by the undersigned, thereunto duly authorized.
(Registrant) Monetta Trust
By (Signature and Title) /s/Robert S. Bacarella
Robert S. Bacarella, Chief Executive Officer
Date September 4, 2020
Pursuant to the requirements of the Securities Exchange Act of 1934 and the Investment Company Act of 1940, this report has been signed below by the following persons on behalf of the Registrant and in the capacities and on the dates indicated.
By (Signature and Title) /s/Robert S. Bacarella
Robert S. Bacarella, Chief Executive Officer
Date September 4, 2020
By (Signature and Title) /s/Robert J. Bacarella
Robert J. Bacarella, Chief Financial Officer
Date September 4, 2020