Semi-Annual Report
June 30, 2022
Monetta Mutual Funds (No-Load)
| | Monetta Trust: | |
| | ■ Monetta Fund | |
| | ■ Monetta Young Investor Growth Fund | |
| 1-800-MONETTA | www.monetta.com |
(This Page Intentionally Left Blank.)
TABLE OF CONTENTS
| Letter to Shareholders | 5 |
| | | |
| Performance Highlights | |
| | Monetta Fund | 6 |
| | Monetta Young Investor Growth Fund | 7 |
| | | |
| Disclosure of Fund Expenses | 8 |
| | | |
| Schedules of Investments | |
| | Monetta Fund | 9 |
| | Monetta Young Investor Growth Fund | 12 |
| | | |
| Financial Statements | |
| | Statements of Assets and Liabilities | 13 |
| | Statements of Operations | 14 |
| | Statements of Changes in Net Assets | 15 |
| | Financial Highlights | 16 |
| | Notes to Financial Statements | 18 |
| | | |
| Notice to Shareholders | 23 |
| | | |
| Privacy Policy | 24 |
Principal Risks:
Mutual fund investing involves risk. Principal loss is possible. The Funds may make short-term investments, without limitation, for defensive purposes, which may provide lower returns than other types of investments. The portion of the Monetta Young Investor Growth Fund that invests in underlying ETFs that track the S&P 500® Index (the “Index”) will be subject to certain risks which are unique to tracking the Index. By investing in ETFs, you will indirectly bear your share of any fees and expenses charged by the underlying funds, in addition to indirectly bearing the principal risks of the funds. The Monetta Young Investor Growth Fund will invest approximately 50% of its net assets in funds that track the Index or other broad-based market indices that primarily include stocks of large capitalization U.S. companies, and your cost of investing will generally be higher than the cost of investing directly in the shares of the mutual funds that track an index, which will be subject to certain risks which are unique to tracking the Index. Growth stocks typically are more volatile than value stocks; however, value stocks have a lower expected growth rate in earnings and sales. Investments in smaller companies involve additional risks such as limited liquidity and greater volatility than larger companies. Please refer to the Funds’ prospectus for further details.
While the Funds are no-load, management and other expenses still apply.
Past performance is not a guarantee of future results.
Monetta Financial Services, Inc. (“MFSI” or the “Adviser”) is the investment adviser to the Monetta Funds. References to individual securities are the views of the Adviser at the date of this report and are subject to change. References are not a recommendation to buy or sell any security. Fund holdings and compositions are subject to change. MFSI and its affiliated officers, trustees and employees may, from time to time, have long or short positions in, and buy or sell, the securities of companies held, purchased or sold by the Monetta Funds. Current and future portfolio holdings are subject to risk. Please refer to the Schedules of Investments in this report for a complete list of Fund holdings.
Diversification does not assure a profit, nor does it protect against a loss in a declining market.
The S&P 500® Index is a broad based unmanaged index of 500 stocks, which is widely recognized as representative of the equity market in general. It is not possible to invest directly in an index.
The Russell 2500® Value Index measures the performance of the small to mid-cap value segment of the U.S. equity securities market. It includes those Russell 2500® Index companies with lower price-to-book ratios and lower forecasted growth values. It is not possible to invest directly in an index.
The Russell 2500® Growth Index measures the performance of the small to mid-cap growth segment of the U.S. equity securities market. It includes those Russell 2500® Index companies with higher price-to-book ratios and higher forecasted growth values. It is not possible to invest directly in an index.
ADR – American Depositary Receipt
Earnings growth is not a measure of the Funds’ future performance.
The Funds’ investment objectives, risks, charges and expenses must be considered carefully before investing. The summary and statutory prospectuses contains this and other important information about the investment company, and may be obtained by calling 1-866-964-4683, or visiting www.monetta.com. Read it carefully before investing.
Opinions expressed are those of the fund managers and are not intended to be a forecast of future events, a guarantee of future results, nor investment advice.
Distributor: Quasar Distributors, LLC.
| Letter to Shareholders (Unaudited) |
2022 Semi-Annual Report
Dear Fellow Shareholders:
I am pleased to enclose your Fund’s semiannual report for the six-month period ended June 30, 2022.
There’s no way around it: The first half of the year was painful. Nearly all asset classes suffered losses, and there were few places to hide. Driving the markets lower were the unusually high levels of inflation, slowing economic growth and a more aggressive Fed monetary policy. Although interest rate hikes may ease inflationary pressure, their effects could also quash economic growth. Think of the rate hikes like removing a splinter from your finger: despite the short-term fear and pain, it must be done to avoid a more serious problem—a massive infection or, in economic terms, a severe recession.
Stocks’ worst half year in over 50 years
The stock market, as measured by the S&P 500® Index, declined 19.96% over the first half. It was the worst start to a year in over 50 years! The market officially tumbled into “bear market” territory, declining over 20% from its January peak. NASDAQ stocks posted their worst start to a year ever, and bond returns were the worst since George Washington was president in 1788! The Crypto markets also crashed. Bitcoin sank from $69,000 in November to below $20,000, suggesting it may not be a good hedge against inflation or a safe haven when the stock market slumps.
The only thing that rose in the first half was commodity prices. Oil surged above $100 a barrel, gas prices hit record highs and the cost of just about everything increased primarily due to supply chain disruptions and rising labor costs.
As the economy gradually reopened from the pandemic, consumer spending patterns were impacted –especially by the soaring gas prices at the pump and higher food prices. Gas prices rocketed due to a combination of government regulation, the Russia/Ukraine war and lack of refinery capacity to process oil. Food prices were impacted by supply chain disruptions. As a result, consumer spending fell, suggesting an economy that is on weaker footing than previously thought.
The economy appears to have entered a period of “stagflation” where inflation remains stubbornly high while the economy grows at a tepid pace. The concern is that this stagflation could be a precursor to a more severe economic slowdown, resulting in rising unemployment rates and lower corporate earnings prospects.
Second Half Outlook: Slower growth? Yes. Deep recession? No.
As the effects of the pandemic fade, the economy is gradually returning to pre-Covid norms. But the varying pace at which different sectors are recovering contribute to uncertainty and market volatility.
Historically, there has been little or no correlation between market performance in the first and second half of the year. Markets typically react to changing future expectations, ignoring past volatility and performance. Similar to golf, the market is focused on its next shot, not dwelling on past performance.
We believe the markets have already priced in the probability of a mild recession and the possibility of lower corporate earnings. Although we can’t predict when the market will bottom, we do know that stock prices today are a lot cheaper than they were a year ago. Some quality growth companies have declined 40%, 50% and some over 70% from their highs.
Could there be further downside? Absolutely! But historically, these bear market corrections have usually been the best times to add to stocks as the stock market has always recovered from prior recessionary periods. In fact, over the 10- and 30-year periods ending in 2021, the S&P 500® Index generated an average annualized return of 14.79% and 9.89% respectively.
We believe the biggest mistake someone could make is to panic out of the market during significant market corrections, when many stocks might be on sale. When it comes to shopping for a good deal, most consumers will be on lookout for when an item goes on sale. Why is this any different in the stock market? The period after any market correction or crash has historically been a great time for investors to buy stocks at bargain prices, not sell them! Great buying opportunities come infrequently. When they do, this is usually your best chance to buy quality growth stocks at discounted prices.
Looking for less pain, more gain
Concerns about the impact of inflation on consumer spending and whether the Fed will be able to navigate a soft landing are likely the key factors that will determine future market direction. We see some potentially better news ahead, including an easing of inflationary pressure, a less aggressive Fed monetary policy and a reacceleration of economic growth. This could bode well for second half market performance.
We believe what matters most is investing for the long term. The key is not being obsessed with short-term price movements or a decline in asset values. These depressed values should be viewed as temporary buying opportunities, with the emphasis on capturing the upside when things do turnaround.
Thank you for being a valued shareholder,
Robert S. Bacarella
President, Founder and Portfolio Manager
| Performance Highlights (Unaudited) |
| Monetta Fund | | Period ended June 30, 2022 |
Investment Objective: | Average Market Capitalization: | Total Net Assets: |
| Long-Term Capital Growth | $473.2 billion | $61.51 million |
PERFORMANCE: | Average Annual Total Return |
| | 1 Year | 3 Year | 5 Year | 10 Year |
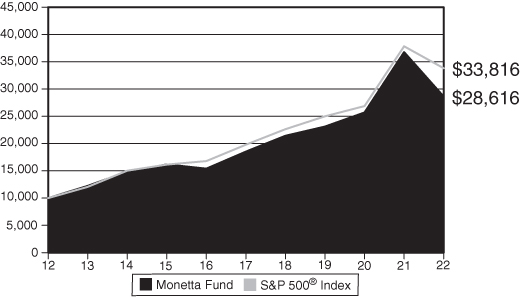
| Monetta Fund | -22.16% | 7.38% | 9.09% | 11.09% |
S&P 500® Index | -10.62% | 10.60% | 11.31% | 12.96% |
| Total Annual Operating Expenses* | 1.33% | | | |
* Source Prospectus dated April 30, 2022. For the Fund’s current Expense Ratio, please refer to Page 16 of this Semi-Annual Report.
Performance data quoted represents past performance; past performance does not guarantee future results. The investment return and principal value of an investment will fluctuate so that an investor’s shares, when redeemed, may be worth more or less than their original cost. The total returns do not reflect the deduction of taxes that a shareholder would pay on Fund distributions or the redemption of Fund shares. Current performance of the fund may be lower or higher than the performance quoted. Performance data current to the most recent month end may be obtained by calling 1-800-MONETTA or visiting www.Monetta.com.
The hypothetical graph above compares the change in value of a $10,000 investment in the Monetta Fund and S&P 500® Index, for the 10-year period ended June 30, 2022, with dividend and capital gains reinvested.
| Technology | 30.6% |
| Financial | 13.2% |
| Retail | 13.0% |
| Healthcare | 11.8% |
| Transportation | 8.0% |
| Basic Material | 6.2% |
| Energy | 5.4% |
| Consumer Cyclical | 5.1% |
| Consumer Staple | 4.1% |
| Capital Equipment | 0.8% |
Other(b) | 1.8% |
| | % of Net Assets |
| Alphabet, Inc. - CL C | 7.5% |
| Apple, Inc. | 7.1% |
| Amazon.com, Inc. | 5.9% |
| Microsoft Corp. | 5.0% |
| Goldman Sachs Group, Inc. | 4.8% |
| Total Top 5 Equity Holdings: | 30.3% |
(a) | Portfolio weightings are subject to change daily and are calculated as a percentage of net assets. |
(b) | Includes Money Market Funds and liabilities in excess of other assets. |
Stocks just had one of their worst starts in history. Equities crumbled on soaring inflation, the war in Ukraine, rising interest rates and a slowing economy. The Fund’s benchmark index, the S&P 500® index, declined 19.96% for the six-month period ending June 30, 2022. Fund performance lagged that of its benchmark index, declining 25.85%, primarily due to its large capitalization weightings in the technology sector.
The individual holdings that had the largest negative impact on fund performance included; Amazon.com, Inc., NVIDIA Corp., Alphabet, Inc. Class C and Apple, Inc. representing 5.87%, 2.46% 7.47% and 7.11% respectively, of the June 30, 2022 net asset value. Due to supply issue concerns, we trimmed the fund’s Nvidia position, but continue to hold the most prominent companies in the tech sector. We believe these premier growth companies will exit this crisis as major beneficiaries, due to their strong growth prospects, competitive position and solid financial condition. The Fund’s largest contributors to performance included; Occidental Petroleum Corp., Vertex Pharmaceuticals, Inc. and Merck & Co., Inc., representing 1.91%, 1.83% and 2.08% respectively, of the Fund’s June 30, 2022 net asset value.
As we enter the second half, we believe the case for strong market returns hinges on avoiding a severe recession, lower inflationary pressure and the Federal Reserve slowing its rate hiking cycle. We believe the focus should be on maintaining a diversified portfolio of high-quality investments with solid growth prospects and a widening competitive moat. As opportunities occur, we intend to adjust portfolio weightings to reflect those companies that demonstrate strong money inflows, improving relative strength to the market and solid growth prospects. We believe that many growth stock valuations have declined to P/E multiples that are more in line with their anticipated growth rates. We are cautiously optimistic that as the year progresses we will begin to experience less pain and more gain as evidence that inflation is moderating.
| Performance Highlights (Unaudited) |
| Monetta Young Investor Growth Fund | | Period ended June 30, 2022 |
Investment Objective: | Average Market Capitalization: | Total Net Assets: |
| Long-Term Capital Growth | $840.8 billion | $35.56 million |
PERFORMANCE: | Average Annual Total Return |
| | 1 Year | 3 Year | 5 Year | 10 Year |
| Monetta Young Investor | | | | |
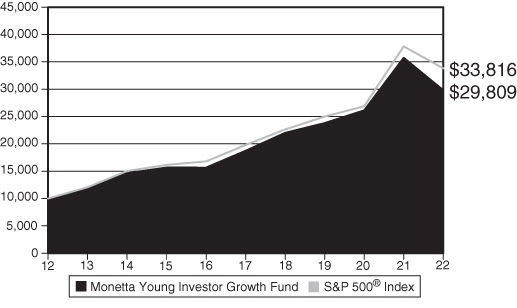
| Growth Fund | -16.55% | 7.81% | 9.74% | 11.54% |
S&P 500® Index | -10.62% | 10.60% | 11.31% | 12.96% |
| Total Annual Operating Expenses* | 1.37% | | | |
* Source Prospectus dated April 30, 2022. Expense ratio of 1.37% includes Acquired Fund Fees and Expenses of 0.04%. For the Fund’s current Expense Ratio, please refer to Page 17 of this Semi-Annual Report.
Performance data quoted represents past performance; past performance does not guarantee future results. The investment return and principal value of an investment will fluctuate so that an investor’s shares, when redeemed, may be worth more or less than their original cost. The total returns do not reflect the deduction of taxes that a shareholder would pay on Fund distributions or the redemption of Fund shares. Current performance of the fund may be lower or higher than the performance quoted. Performance data current to the most recent month end may be obtained by calling 1-800-Monetta or visiting www.Monetta.com.
The hypothetical graph above compares the change in value of a $10,000 investment in the Monetta Young Investor Growth Fund and the S&P 500® Index, for the period ended June 30, 2022, with dividend and capital gains reinvested.
| Exchange Traded Funds | 51.0% |
| Technology | 19.7% |
| Retail | 10.0% |
| Financial | 8.6% |
| Energy | 3.0% |
| Healthcare | 2.9% |
| Transportation | 2.0% |
| Consumer Cyclical | 1.6% |
Other(c) | 1.2% |
Top 5 Equity Holdings(b): |
| | % of Net Assets |
| Apple, Inc. | 7.7% |
| Alphabet, Inc. - CL C | 6.2% |
| Amazon.com, Inc. | 6.0% |
| JPMorgan Chase & Co. | 4.7% |
| Costco Wholesale Corp. | 4.0% |
| Total Top 5 Equity Holdings: | 28.6% |
(a) | Portfolio weightings are subject to change daily and are calculated as a percentage of net assets. |
(b) | Excludes Exchange Traded Funds. |
(c) | Includes Money Market Funds and liabilities in excess of other assets. |
It was a rout for the history books, with the benchmark, S&P 500® index, down 19.96% in the first six months of 2022.The Monetta Young Investor Growth Fund could not avoid the market freefall, declining 23.93% for the six-month period ended June 30, 2022. The Fund’s negative performance variance to its benchmark, was narrowed by its approximately 50% weighting in ETFs that tracked the performance of the S&P 500® index. In spite of this ETF weighting, relative fund performance could not overcome the negative performance in the large capitalization growth stock sector.
The largest detractors from Fund performance were Amazon.Com, Inc. and Advance Micro Devices, Inc. representing 5.97% and 2.15% respectively, of the June 30, 2022 net asset value. Enhancing the Fund’s relative performance were its holdings in EOG Resources, Inc., APA Corp. and UnitedHealth Group, Inc. representing 1.55%, 1.47% and 2.89% of the Fund’s June 30th net asset value.
During the first half, the Fund turnover rate was minimal. Positions were trimmed in the SPDR S&P 500® Trust ETF to keep it in line with the investment strategy to maintain a 50% exposure to the S&P 500® Index. In addition, technology sector exposure was reduced by trimming positions in Microsoft Corp. and Advance Micro Devices, Inc. representing 3.61% and 2.15% respectively, of the June 30 portfolio.
As we enter the second half, the Fund has a broad-based diversified portfolio coupled with a concentrated number of high quality, growth-oriented companies. Our focus is to own high quality businesses that provide earnings stability and visibility. We are closely monitoring technical indicators, such as money flows and a stock’s relative price movement to the market, to help identify possible trend changes. No one knows for certain how long and deep this bear market may be, but the key is to own quality companies when the market does turn.
| Disclosure of Fund Expenses (Unaudited) | Period Ended June 30, 2022
|
As a shareholder of a mutual fund, you incur ongoing costs, including investment advisory fees; distribution expense (Monetta Young Investor Growth Fund); and other Fund expenses. This Example is intended to help you understand your ongoing costs (in dollars) of investing in the Funds and to compare these costs with the ongoing costs of investing in other mutual funds. The Example is based on an investment of $1,000 invested at the beginning of the period and held for the most recent semi-annual period, January 1, 2022 - June 30, 2022.
ACTUAL EXPENSES
The table below provides information about actual account values and actual expenses. The Example below includes, but is not limited to, investment advisory fees, distribution expense, accounting, custodian, and transfer agent fees. However, the Example below does not include portfolio trading commissions and related expenses. You may use the information in this table, together with the amount you invested, to estimate the expenses that you paid over the period. Simply divide your account value by $1,000 (for example, an $8,600 account value divided by $1,000 = 8.6), then multiply the result by the number in the table under the heading entitled “Actual Expenses Paid During Period” to estimate the expenses you paid on your account during this period.
HYPOTHETICAL EXAMPLE FOR COMPARISON PURPOSES
The table below also provides information about hypothetical account values and hypothetical expenses based on each Fund’s actual expense ratio and an assumed rate of return of 5% per year before expenses, which is not each Fund’s actual return. The hypothetical account values and expenses may not be used to estimate the actual ending account balance or expenses you paid for the period. You may use this information to compare the ongoing costs of investing in the Funds and other funds. To do so, compare the 5% hypothetical examples with the 5% hypothetical examples that appear in the shareholder reports of the other funds.
Please note that the expenses shown in the table are meant to highlight your ongoing costs only and do not reflect any transactional costs. Therefore, the hypothetical information is useful in comparing ongoing costs only, and will not help you determine the relative total costs of owning different funds. In addition, if these transactional costs were included, your costs may have been higher.
| | BEGINNING | ENDING | EXPENSES PAID | |
| | ACCOUNT VALUE | ACCOUNT VALUE | DURING PERIOD(a) | ANNUALIZED |
| | 1/1/22 | 6/30/22 | 1/1/22-6/30/22 | EXPENSE RATIO |
| ACTUAL | | | | |
| Monetta Fund | $1,000.00 | $741.50 | $5.96 | 1.38% |
| Monetta Young Investor Growth Fund | 1,000.00 | 760.70 | 6.20 | 1.42% |
| |
| HYPOTHETICAL (5% ANNUAL RETURN BEFORE EXPENSES) |
| Monetta Fund | $1,000.00 | $1,017.95 | $6.90 | 1.38% |
| Monetta Young Investor Growth Fund | 1,000.00 | 1,017.75 | 7.10 | 1.42% |
(a) Expenses are equal to each Fund’s annualized expense ratio, multiplied by the average account value over the period, multiplied by 181/365 (to reflect the one-half year period).
| Schedule of Investments (Unaudited) | June 30, 2022
|
Monetta Fund
| COMMON STOCKS - 98.2% | | | |
| NUMBER OF SHARES | | VALUE
| |
| Basic Material - 6.2% |
| Chemical-2.3% | |
| | 10,000 | | Dow, Inc. | | $ | 516,100 | |
| | 5,000 | | LyondellBasell | | | | |
| | | | Industries - CL A | | | 437,300 | |
| | 9,500 | | Mosaic Co. | | | 448,685 | |
| | | | | | | 1,402,085 | |
| Chemical-Specialty-1.6% | |
| | 3,000 | | Albemarle Corp. | | | 626,940 | |
| | 16,000 | | Livent Corp. * | | | 363,040 | |
| | | | | | | 989,980 | |
| Mining-0.6% | |
| | 25,000 | | Cleveland-Cliffs, Inc. * | | | 384,250 | |
| | |
| Paper & Forest Product-1.7% | |
| | 14,000 | | International Paper Co. | | | 585,620 | |
| | 12,000 | | Westrock Co. | | | 478,080 | |
| | | | | | | 1,063,700 | |
| | | | | | | | |
| Capital Equipment - 0.8% | |
| Machinery-Miscellaneous-0.8% | |
| | 12,000 | | Ingersoll Rand, Inc. | | | 504,960 | |
| | | | | | | | |
| Consumer Cyclical - 5.1% | |
| Automobile-2.0% | |
| | 50,000 | | Ford Motor Co. | | | 556,500 | |
| | 1,000 | | Tesla, Inc. * | | | 673,420 | |
| | | | | | | 1,229,920 | |
| Household Appliance & Furnishings-0.8% | |
| | 3,000 | | Whirlpool Corp. | | | 464,610 | |
| | |
| Housing Related-0.8% | |
| | 4,000 | | Mohawk Industries, Inc. * | | | 496,360 | |
| | |
| Leisure Service-1.5% | |
| | 3,000 | | Marriott International, Inc. | | | 408,030 | |
| | 3,000 | | Netflix, Inc. * | | | 524,610 | |
| | | | | | | 932,640 | |
| | | | | | | | |
| Consumer Staple - 4.1% | |
| Beverage-Alcoholic-1.7% | |
| | 2,200 | | Constellation | | | | |
| | | | Brands, Inc. - CL A | | | 512,732 | |
| | 10,000 | | Molson Coors | | | | |
| | | | Beverage Co. | | | 545,100 | |
| | | | | | | 1,057,832 | |
| Beverage-Non-Alcoholic-0.8% | |
| | 5,000 | | Monster Beverage Corp. * | | | 463,500 | |
| | |
| Cosmetic & Personal Care-0.8% | |
| | 4,000 | | International Flavors & | | | | |
| | | | Fragrances, Inc. | | | 476,480 | |
| | |
| Food-0.8% | |
| | 7,000 | | Lamb Weston | | | | |
| | | | Holdings, Inc. | | | 500,220 | |
| | | | | | | | |
| Energy - 5.4% | |
| Oil & Gas-Equipment & Services-1.2% | |
| | 20,000 | | Schlumberger Ltd. | | | 715,200 | |
| | |
| Oil & Gas-Exploration & Production-4.2% | |
| | 22,000 | | APA Corp. | | | 767,800 | |
| | 6,000 | | EOG Resources, Inc. | | | 662,640 | |
| | 20,000 | | Occidental | | | | |
| | | | Petroleum Corp. | | | 1,177,600 | |
| | | | | | | 2,608,040 | |
| | | | | | | | |
| Financial - 13.2% | |
| Bank-Money Center-7.6% | |
| | 10,000 | | Goldman Sachs | | | | |
| | | | Group, Inc. | | | 2,970,200 | |
| | 15,000 | | JPMorgan Chase & Co. | | | 1,689,150 | |
| | | | | | | 4,659,350 | |
| Finance-Miscellaneous-5.6% | |
| | 4,000 | | American Express Co. | | | 554,480 | |
| | 6,000 | | Global Payments, Inc. | | | 663,840 | |
| | 7,000 | | MasterCard, Inc. - CL A | | | 2,208,360 | |
| | | | | | | 3,426,680 | |
The accompanying notes are an integral part of these financial statements.
| Schedule of Investments (Unaudited) | June 30, 2022
|
Monetta Fund (Continued)
| NUMBER OF SHARES | | VALUE | |
| | | | |
| Healthcare - 11.8% | |
| Healthcare-Biomedical/Genetic-4.6% | | | |
| | 3,200 | | Amgen, Inc. | | $ | 778,560 | |
| | 12,000 | | Incyte Corp. * | | | 911,640 | |
| | 4,000 | | Vertex | | | | |
| | | | Pharmaceuticals, Inc. * | | | 1,127,160 | |
| | | | | | | 2,817,360 | |
| Healthcare-Drug/Diversified-3.1% | | | | |
| | 4,000 | | AbbVie, Inc. | | | 612,640 | |
| | 14,000 | | Merck & Co., Inc. | | | 1,276,380 | |
| | | | | | | 1,889,020 | |
| Healthcare-Patient Care-4.1% | | | | |
| | 1,100 | | Humana, Inc. | | | 514,877 | |
| | 4,000 | | UnitedHealth Group, Inc. | | | 2,054,520 | |
| | | | | | | 2,569,397 | |
| | | | | | | | |
| Retail - 13.0% | |
| Retail-Food Chain-1.0% | | | | |
| | 7,000 | | Sysco Corp. | | | 592,970 | |
| | | | | |
| Retail-Major Chain-4.5% | | | | |
| | 5,000 | | Costco Wholesale Corp. | | | 2,396,400 | |
| | 2,500 | | Target Corp. | | | 353,075 | |
| | | | | | | 2,749,475 | |
| Retail-Specialty-7.5% | | | | |
| | 34,000 | | Amazon.com, Inc. * | | | 3,611,140 | |
| | 4,000 | | Genuine Parts Co. | | | 532,000 | |
| | 1,300 | | Ulta Beauty, Inc. * | | | 501,124 | |
| | | | | | | 4,644,264 | |
| | | | | | | | |
| Technology - 30.6% # | |
| Computer Data Storage-8.2% | | | | |
| | 32,000 | | Apple, Inc. | | | 4,375,040 | |
| | 20,000 | | HP, Inc. | | | 655,600 | |
| | | | | | | 5,030,640 | |
| Computer-Service-1.1% | | | | |
| | 5,000 | | International Business | | | | |
| | | | Machines Corp. | | | 705,950 | |
| | | | | |
| Computer-Software-6.0% | | | | |
| | 12,000 | | Microsoft Corp. | | | 3,081,960 | |
| | 6,000 | | PTC, Inc. * | | | 638,040 | |
| | | | | | | 3,720,000 | |
| Electronic-Semiconductor-5.2% | | | | |
| | 15,000 | | Advanced Micro | | | | |
| | | | Devices, Inc. * | | | 1,147,050 | |
| | 10,000 | | NVIDIA Corp. | | | 1,515,900 | |
| | 4,000 | | QUALCOMM, Inc. | | | 510,960 | |
| | | | | | | 3,173,910 | |
| Internet-7.5% | | | | |
| | 2,100 | | Alphabet, Inc. - CL C * | | | 4,593,645 | |
| | | | | |
| Office-Equipment-1.1% | | | | |
| | 4,000 | | Avery Dennison Corp. | | | 647,480 | |
| | | | | |
| Telecommunication Service-1.5% | | | | |
| | 7,000 | | T-Mobile US, Inc. * | | | 941,780 | |
| | | | | | | | |
| Transportation - 8.0% | |
| Airline-7.2% | | | | |
| | 60,000 | | Delta Air Lines, Inc. * | | | 1,738,200 | |
| | 2,000 | | FedEx Corp. | | | 453,420 | |
| | 62,000 | | Southwest Airlines Co. * | | | 2,239,440 | |
| | | | | | | 4,431,060 | |
| Transportation Service-0.8% | | | | |
| | 5,200 | | Expeditors International | | | | |
| | | | of Washington, Inc. | | | 506,792 | |
| | | | | | | | |
| Total Common Stocks | | | | |
| (Cost $41,119,255) | | | 60,389,550 | |
The accompanying notes are an integral part of these financial statements.
| Schedule of Investments (Unaudited) | June 30, 2022
|
Monetta Fund (Continued)
| NUMBER OF SHARES | | VALUE | |
| | | | |
| MONEY MARKET FUNDS - 1.9% | |
| | | First American | | | |
| | | Government | | | |
| | | Obligations Fund - | | | |
| | 1,205,948 | | Class X, 1.29%^ | | $ | 1,205,948 | |
| | | | | | | | |
| Total Money Market Funds | | | | |
| (Cost $1,205,948) | | | 1,205,948 | |
| | | | | | | | |
| Total Investments | | | | |
| (Cost $42,325,203) - 100.1% | | | 61,595,498 | |
| | | | | | | | |
| Liabilities in Excess of | | | | |
| Other Assets - (0.1)% | | | (87,217 | ) |
| | | | | | | | |
| TOTAL NET ASSETS - 100.0% | | $ | 61,508,281 | |
* Non-Income Producing.
# As of June 30, 2022, the Fund had a significant portion of its assets invested in this sector. See Note 6 in Notes to Financial Statements.
^ Rate shown is the seven day effective yield at June 30, 2022.
Industry classification provided by William O’Neil & Co., Inc.
The accompanying notes are an integral part of these financial statements.
| Schedule of Investments (Unaudited) | June 30, 2022
|
Monetta Young Investor Growth Fund
| COMMON STOCKS - 47.8% | | | |
| NUMBER OF SHARES | | VALUE | |
| | | | |
| Consumer Cyclical - 1.6% | |
| Automobile-0.6% | | | |
| | 20,000 | | Ford Motor Co. | | $ | 222,600 | |
| | | | | |
| Leisure Service-1.0% | | | | |
| | 2,000 | | Netflix, Inc. * | | | 349,740 | |
| | | | | | | | |
| Energy - 3.0% | |
| Oil & Gas-Exploration & Production-3.0% | | | | |
| | 15,000 | | APA Corp. | | | 523,500 | |
| | 5,000 | | EOG Resources, Inc. | | | 552,200 | |
| | | | | | | 1,075,700 | |
| | | | | | | | |
| Financial - 8.6% | |
| Bank-Money Center-4.8% | | | | |
| | 15,000 | | JPMorgan Chase & Co. | | | 1,689,150 | |
| | | | | |
| Finance-Miscellaneous-3.8% | | | | |
| | 4,300 | | MasterCard, Inc. - CL A | | | 1,356,564 | |
| | | | | | | | |
| Healthcare - 2.9% | |
| Healthcare-Patient Care-2.9% | | | | |
| | 2,000 | | UnitedHealth Group, Inc. | | | 1,027,260 | |
| | | | | | | | |
| Retail - 10.0% | |
| Retail-Major Chain-4.0% | | | | |
| | 3,000 | | Costco Wholesale Corp. | | | 1,437,840 | |
| | | | | | | | |
| Retail-Specialty-6.0% | | | | |
| | 20,000 | | Amazon.com, Inc. * | | | 2,124,200 | |
| | | | | | | | |
| Technology - 19.7% | |
| Computer Data Storage-7.7% | | | | |
| | 20,000 | | Apple, Inc. | | | 2,734,400 | |
| | | | | | | | |
| Computer-Software-3.6% | | | | |
| | 5,000 | | Microsoft Corp. | | | 1,284,150 | |
| | | | | | | | |
| Electronic-Semiconductor-2.2% | | | | |
| | 10,000 | | Advanced Micro | | | | |
| | | | Devices, Inc. * | | | 764,700 | |
| | | | | | | | |
| Internet-6.2% | | | | |
| | 1,000 | | Alphabet, Inc. - CL C * | | | 2,187,450 | |
| | | | | | | | |
| Transportation - 2.0% | |
| Airline-2.0% | | | | |
| | 20,000 | | Southwest Airlines Co. * | | | 722,400 | |
| | | | | | | | |
| Total Common Stocks | | | | |
| (Cost $6,517,781) | | | 16,976,154 | |
| | | | | | | | |
| EXCHANGE TRADED FUNDS - 51.0% | |
| | 34,300 | | SPDR S&P 500 Trust (a) | | | 12,939,675 | |
| | 15,000 | | Vanguard S&P 500 | | | 5,203,200 | |
| | | | | | | | |
| Total Exchange Traded Funds | | | | |
| (Cost $8,564,432) | | | 18,142,875 | |
| | | | | | | | |
| MONEY MARKET FUNDS - 1.5% | |
| | | | First American | | | | |
| | | | Government | | | | |
| | | | Obligations Fund - | | | | |
| | 538,430 | | Class X, 1.29% ^ | | | 538,430 | |
| | | | | | | | |
| Total Money Market Funds | | | | |
| (Cost $538,430) | | | 538,430 | |
| | | | | | | | |
| Total Investments | | | | |
| (Cost $15,620,643) - 100.3% | | | 35,657,459 | |
| | | | | | | | |
| Liabilities in Excess of | | | | |
| Other Assets - (0.3)% | | | (98,867 | ) |
| | | | | | | | |
| TOTAL NET ASSETS - 100.0% | | $ | 35,558,592 | |
* Non-Income Producing.
(a) Fair value of this security exceeds 25% of the Fund’s net assets. Additional information of this security, including the financial statements, is available from the SEC’s EDGAR database at www.sec.gov.
^ Rate shown is the seven day effective yield at June 30, 2022.
Industry classification provided by William O’Neil & Co., Inc.
The accompanying notes are an integral part of these financial statements.
| Statements of Assets and Liabilities (Unaudited) | June 30, 2022
|
| | | | | | Monetta Young | |
| | | | | | Investor Growth | |
| | | Monetta Fund | | | Fund | |
| Assets: | | | | | | |
Investments at value(a) | | $ | 61,595,498 | | | $ | 35,657,459 | |
| Receivables: | | | | | | | | |
| Interest and dividends | | | 39,244 | | | | 77,988 | |
| Fund shares sold | | | 2,950 | | | | 1,688 | |
| Prepaid expenses | | | 22,083 | | | | 9,195 | |
| Total Assets | | | 61,659,775 | | | | 35,746,330 | |
| | | | | | | | | |
| Liabilities: | | | | | | | | |
| Payables: | | | | | | | | |
| Investment advisory fees (Note 2) | | | 50,341 | | | | 16,846 | |
| Distribution fees (Note 5) | | | — | | | | 47,710 | |
| Fund shares redeemed | | | — | | | | 25,101 | |
| Accrued trustee fees | | | 6,637 | | | | 4,365 | |
| Accrued compliance fees | | | 1,882 | | | | 1,477 | |
| Accrued transfer agent fees | | | 37,323 | | | | 41,021 | |
| Accrued fund administration fees | | | 17,571 | | | | 15,813 | |
| Accrued audit fees | | | 9,508 | | | | 8,867 | |
| Accrued other expenses | | | 28,232 | | | | 26,538 | |
| Total Liabilities | | | 151,494 | | | | 187,738 | |
| Net Assets | | $ | 61,508,281 | | | $ | 35,558,592 | |
| | | | | | | | | |
| Analysis of net assets: | | | | | | | | |
| Paid-in capital | | | 40,028,626 | | | | 13,419,881 | |
| Total distributable earnings | | | 21,479,655 | | | | 22,138,711 | |
| Net Assets | | $ | 61,508,281 | | | $ | 35,558,592 | |
| | | | | | | | | |
| (a) Investments at cost | | $ | 42,325,203 | | | $ | 15,620,643 | |
| | | | | | | | | |
| Shares of beneficial interest issued outstanding | | | 2,952,235 | | | | 2,325,509 | |
| | | | | | | | | |
| Net asset value, offering price and redemption price per share | | $ | 20.83 | | | $ | 15.29 | |
The accompanying notes are an integral part of these financial statements.
| Statements of Operations (Unaudited) | For The Six Month Period Ended
|
| | June 30, 2022
|
| | | | | | Monetta Young | |
| | | | | | Investor Growth | |
| | | Monetta Fund | | | Fund | |
| Investment income and expenses: | | | | | | |
| Investment income: | | | | | | |
| Interest | | $ | 4,682 | | | $ | 1,333 | |
| Dividends | | | 409,361 | | | | 248,708 | |
| Total investment income | | | 414,043 | | | | 250,041 | |
| | | | | | | | | |
| Expenses: | | | | | | | | |
| Investment advisory fees (Note 2) | | | 345,325 | | | | 118,843 | |
| Distribution expense (Note 5) | | | — | | | | 54,020 | |
| Transfer agent fees | | | 47,872 | | | | 51,435 | |
| Administration fees | | | 21,813 | | | | 19,278 | |
| State registration fees | | | 16,978 | | | | 8,757 | |
| Accounting fees | | | 15,209 | | | | 14,845 | |
| Compliance fees | | | 12,848 | | | | 8,030 | |
| Trustee fees | | | 11,681 | | | | 7,318 | |
| Audit fees | | | 8,513 | | | | 8,871 | |
| Legal fees | | | 6,786 | | | | 4,426 | |
| Custodian fees | | | 5,518 | | | | 3,710 | |
| Printing and postage fees | | | 3,590 | | | | 2,962 | |
| Other fees | | | 2,707 | | | | 2,532 | |
| Insurance fees | | | 1,810 | | | | 1,086 | |
| Total expenses | | | 500,650 | | | | 306,113 | |
| Net investment loss | | | (86,607 | ) | | | (56,072 | ) |
| | | | | | | | | |
| Realized and unrealized loss on investments: | | | | | | | | |
| Net realized loss on investments | | | (2,112,650 | ) | | | (384,248 | ) |
| Net change in unrealized appreciation/depreciation of investments | | | (19,413,991 | ) | | | (11,307,286 | ) |
| Net realized and unrealized loss on investments | | | (21,526,641 | ) | | | (11,691,534 | ) |
| Net decrease in net assets from operations | | $ | (21,613,248 | ) | | $ | (11,747,606 | ) |
The accompanying notes are an integral part of these financial statements.
| Statements of Changes in Net Assets | For The Six Month Period Ended June 30, 2022
|
| | and Year Ended December 31, 2021
|
| | | | | | | | | Monetta Young | |
| | | Monetta Fund | | | Investor Growth Fund | |
| | | 2022 | | | 2021 | | | 2022 | | | 2021 | |
| | | (Unaudited) | | | | | | (Unaudited) | | | | |
| Operations: | | | | | | | | | | | | |
| Net investment loss | | $ | (86,607 | ) | | $ | (756,514 | ) | | $ | (56,072 | ) | | $ | (228,708 | ) |
| Net realized gain (loss) on investments | | | (2,112,650 | ) | | | 12,031,349 | | | | (384,248 | ) | | | 9,411,338 | |
| Net change in unrealized appreciation/ | | | | | | | | | | | | | | | | |
| depreciation of investments | | | (19,413,991 | ) | | | 2,008,702 | | | | (11,307,286 | ) | | | 1,516,087 | |
| Net increase (decrease) | | | | | | | | | | | | | | | | |
| in net assets from operations | | | (21,613,248 | ) | | | 13,283,537 | | | | (11,747,606 | ) | | | 10,698,717 | |
| | | | | | | | | | | | | | | | | |
| Distributions: | | | | | | | | | | | | | | | | |
| Total distributions to shareholders | | | — | | | | (9,702,085 | ) | | | — | | | | (9,442,879 | ) |
| | | | | | | | | | | | | | | | | |
| Capital transactions (Note 3): | | | | | | | | | | | | | | | | |
| Proceeds from shares sold | | | 210,476 | | | | 563,509 | | | | 663,638 | | | | 2,018,156 | |
| Net asset value of shares issued | | | | | | | | | | | | | | | | |
| through dividend reinvestment | | | — | | | | 9,212,357 | | | | — | | | | 9,094,095 | |
| Cost of shares redeemed | | | (1,383,279 | ) | | | (4,903,355 | ) | | | (4,831,354 | ) | | | (16,205,091 | ) |
| | | | | | | | | | | | | | | | | |
| Increase (Decrease) in net assets | | | | | | | | | | | | | | | | |
| from capital transactions | | | (1,172,803 | ) | | | 4,872,511 | | | | (4,167,716 | ) | | | (5,092,840 | ) |
| Total increase (decrease) | | | | | | | | | | | | | | | | |
| in net assets | | | (22,786,051 | ) | | | 8,453,963 | | | | (15,915,322 | ) | | | (3,837,002 | ) |
| | | | | | | | | | | | | | | | | |
| Net assets at beginning of period | | $ | 84,294,332 | | | $ | 75,840,369 | | | $ | 51,473,914 | | | $ | 55,310,916 | |
| | | | | | | | | | | | | | | | | |
| Net assets at end of period | | $ | 61,508,281 | | | $ | 84,294,332 | | | $ | 35,558,592 | | | $ | 51,473,914 | |
| | | | | | | | | | | | | | | | | |
The accompanying notes are an integral part of these financial statements.
| Monetta Fund | | |
| | | | | | | | | | | | | | | | | | | | |
| | | Six Months | | | | | | | | | | | | | | | | | |
| | | Ended | | | Year Ended | | | Year Ended | | | Year Ended | | | Year Ended | | | Year Ended | | |
| For a share outstanding | | June 30, 2022 | | | December 31, | | | December 31, | | | December 31, | | | December 31, | | | December 31, | | |
| throughout the periods: | | (Unaudited) | | | 2021 | | | 2020 | | | 2019 | | | 2018 | | | 2017 | | |
| | | | | | | | | | | | | | | | | | | | |
| Net asset value at | | | | | | | | | | | | | | | | | | | |
| beginning of period | | $ | 28.09 | | | $ | 26.77 | | | $ | 21.58 | | | $ | 16.82 | | | $ | 18.89 | | | $ | 16.93 | | |
| | | | | | | | | | | | | | | | | | | | | | | | | | |
| Investment Operations: | | | | | | | | | | | | | | | | | | | | | | | | | |
Net investment loss(a) | | | (0.03 | ) | | | (0.27 | ) | | | (0.13 | ) | | | (0.04 | ) | | | (0.06 | ) | | | (0.06 | ) | |
| Net realized and unrealized | | | | | | | | | | | | | | | | | | | | | | | | | |
| gain (loss) on investments | | | (7.23 | ) | | | 5.18 | | | | 6.41 | | | | 4.80 | | | | (0.44 | ) | | | 3.28 | | |
| | | | | | | | | | | | | | | | | | | | | | | | | | |
| Total from | | | | | | | | | | | | | | | | | | | | | | | | | |
| investment operations | | | (7.26 | ) | | | 4.91 | | | | 6.28 | | | | 4.76 | | | | (0.50 | ) | | | 3.22 | | |
| | | | | | | | | | | | | | | | | | | | | | | | | | |
| Less Distributions: | | | | | | | | | | | | | | | | | | | | | | | | | |
| From net investment income | | | — | | | | — | | | | — | | | | — | | | | — | | | | — | | |
| From net realized gains | | | — | | | | (3.59 | ) | | | (1.09 | ) | | | — | | | | (1.57 | ) | | | (1.26 | ) | |
| | | | | | | | | | | | | | | | | | | | | | | | | | |
| Total distributions | | | — | | | | (3.59 | ) | | | (1.09 | ) | | | — | | | | (1.57 | ) | | | (1.26 | ) | |
| | | | | | | | | | | | | | | | | | | | | | | | | | |
| Net asset value at | | | | | | | | | | | | | | | | | | | | | | | | | |
| end of period | | $ | 20.83 | | | $ | 28.09 | | | $ | 26.77 | | | $ | 21.58 | | | $ | 16.82 | | | $ | 18.89 | | |
| | | | | | | | | | | | | | | | | | | | | | | | | | |
| Total return | | | -25.85 | %(b) | | | 17.83 | % | | | 29.41 | % | | | 28.30 | % | | | -3.36 | % | | | 19.19 | % | |
| Ratios to average net assets: | | | | | | | | | | | | | | | | | | | | | | | | | |
| Expense Ratio | | | 1.38 | %(c) | | | 1.33 | % | | | 1.37 | % | | | 1.40 | % | | | 1.37 | % | | | 1.40 | % | |
| Net investment loss | | | (0.24 | )%(c) | | | (0.93 | )% | | | (0.58 | )% | | | (0.20 | )% | | | (0.31 | )% | | | (0.33 | )% | |
| Portfolio turnover | | | 43.3 | %(b) | | | 55.2 | % | | | 60.5 | % | | | 61.8 | % | | | 128.8 | % | | | 122.9 | % | |
| Net assets (in thousands) | | $ | 61,508 | | | $ | 84,294 | | | $ | 75,840 | | | $ | 62,348 | | | $ | 52,811 | | | $ | 57,963 | | |
| (a) | The per share amounts are calculated using the weighted average number of shares outstanding during the period. |
| (b) | Not annualized. |
| (c) | Annualized. |
The accompanying notes are an integral part of these financial statements.
| Monetta Young Investor Growth Fund | | |
| | | | | | | | | | | | | | | | | | | | |
| | | Six Months | | | | | | | | | | | | | | | | | |
| | | Ended | | | Year Ended | | | Year Ended | | | Year Ended | | | Year Ended | | | Year Ended | | |
| For a share outstanding | | June 30, 2022 | | | December 31, | | | December 31, | | | December 31, | | | December 31, | | | December 31, | | |
| throughout the periods: | | (Unaudited) | | | 2021 | | | 2020 | | | 2019 | | | 2018 | | | 2017 | | |
| | | | | | | | | | | | | | | | | | | | |
| Net asset value at | | | | | | | | | | | | | | | | | | | |
| beginning of period | | $ | 20.10 | | | $ | 19.90 | | | $ | 22.96 | | | $ | 18.64 | | | $ | 24.00 | | | $ | 20.26 | | |
| | | | | | | | | | | | | | | | | | | | | | | | | | |
| Investment Operations: | | | | | | | | | | | | | | | | | | | | | | | | | |
| Net investment | | | | | | | | | | | | | | | | | | | | | | | | | |
income (loss)(a)(c) | | | (0.02 | ) | | | (0.10 | ) | | | (0.01 | ) | | | 0.05 | | | | 0.06 | | | | 0.07 | | |
| Net realized and unrealized | | | | | | | | | | | | | | | | | | | | | | | | | |
| gain (loss) on investments | | | (4.79 | ) | | | 4.67 | | | | 4.33 | | | | 5.96 | | | | (0.94 | )(g) | | | 4.58 | | |
| | | | | | | | | | | | | | | | | | | | | | | | | | |
| Total from | | | | | | | | | | | | | | | | | | | | | | | | | |
| investment operations | | | (4.81 | ) | | | 4.57 | | | | 4.32 | | | | 6.01 | | | | (0.88 | ) | | | 4.65 | | |
| | | | | | | | | | | | | | | | | | | | | | | | | | |
| Less Distributions: | | | | | | | | | | | | | | | | | | | | | | | | | |
| From net investment income | | | — | | | | — | | | | (0.00 | )(f) | | | (0.06 | ) | | | (0.07 | ) | | | (0.07 | ) | |
| From net realized gains | | | — | | | | (4.37 | ) | | | (7.38 | ) | | | (1.63 | ) | | | (4.41 | ) | | | (0.84 | ) | |
| | | | | | | | | | | | | | | | | | | | | | | | | | |
| Total distributions | | | — | | | | (4.37 | ) | | | (7.38 | ) | | | (1.69 | ) | | | (4.48 | ) | | | (0.91 | ) | |
| | | | | | | | | | | | | | | | | | | | | | | | | | |
| Net asset value at | | | | | | | | | | | | | | | | | | | | | | | | | |
| end of period | | $ | 15.29 | | | $ | 20.10 | | | $ | 19.90 | | | $ | 22.96 | | | $ | 18.64 | | | $ | 24.00 | | |
| | | | | | | | | | | | | | | | | | | | | | | | | | |
| Total return | | | -23.93 | %(d) | | | 22.87 | % | | | 20.47 | % | | | 32.58 | % | | | -5.30 | % | | | 23.10 | % | |
| Ratios to average net assets: | | | | | | | | | | | | | | | | | | | | | | | | | |
Expense Ratio(b) | | | 1.42 | %(e) | | | 1.33 | % | | | 1.31 | % | | | 1.26 | % | | | 1.17 | % | | | 1.16 | % | |
| Net investment | | | | | | | | | | | | | | | | | | | | | | | | | |
income (loss)(b)(c) | | | (0.26 | )%(e) | | | (0.44 | )% | | | (0.06 | )% | | | 0.23 | % | | | 0.23 | % | | | 0.33 | % | |
| Portfolio turnover | | | 4.7 | %(d) | | | 6.8 | % | | | 13.1 | % | | | 6.7 | % | | | 28.1 | % | | | 36.1 | % | |
| Net assets (in thousands) | | $ | 35,559 | | | $ | 51,474 | | | $ | 55,311 | | | $ | 75,654 | | | $ | 77,640 | | | $ | 145,845 | | |
| (a) | The per share amounts are calculated using the weighted average number of shares outstanding during the period. |
| (b) | The ratios of expenses and net investment income do not include the Fund’s proportionate share of expense and income of the underlying investment companies in which it invests. |
| (c) | Recognition of net investment income by the Fund is affected by the timing of the declaration of dividends by the underlying investment companies in which it invests. |
| (g) | Realized and unrealized gains and losses per share in this caption are balancing amounts necessary to reconcile the change in net asset value per share for the period, and may not reconcile with the aggregate gains and losses in the Statements of Operations due to share transactions for the period. |
The accompanying notes are an integral part of these financial statements.
| Notes to Financial Statements (Unaudited) | June 30, 2022
|
| 1. | SIGNIFICANT ACCOUNTING POLICIES: |
| | Monetta Trust (the “Trust”) is an open-end diversified management investment company registered under the Investment Company Act of 1940, as amended (the “1940 Act”). The following funds, collectively referred to as the Funds, are series of the Trust: |
| | |
| | Monetta Fund. The primary objective of this Fund is long-term capital growth. The Fund seeks this objective by investing primarily in equity securities believed to have growth potential. The Fund presently invests primarily in large capitalization growth companies. |
| | |
| | Monetta Young Investor Growth Fund. The objective of this Fund is long-term capital growth. The Fund seeks this objective by investing approximately 50% of its assets in exchange traded funds (“ETFs”) and other funds seeking to track the S&P 500® Index or other broad-based market indices that primarily include stocks of large capitalization U.S. companies and the remainder of its assets in common stocks of individual companies that Monetta Financial Services, Inc., (the “Adviser”) considers to be high quality well-known companies that produce products or provide services that are recognized by many investors. |
| | |
| | The Funds are investment companies and accordingly follow the investment company accounting and reporting guidance of the Financial Accounting Standards Board (“FASB”) Accounting Standards Codification Topic 946, Financial Services – Investment Companies. |
| | |
| | The Monetta Fund and Monetta Young Investor Growth Fund are each a diversified series with their own investment objectives and policies within the Trust. |
| | |
| | The following is a summary of significant accounting policies followed by the Funds in the preparation of their financial statements in accordance with accounting principles generally accepted in the United States of America (“U.S. GAAP”). |
| | |
| | (a) Securities Valuation |
| | Equity securities, including American Depositary Receipts (“ADR”s) and ETFs are stated at fair value, based on the official closing price as of the time of valuation. If there is no official closing price of a security on the valuation date, the security is valued at the mean between the most recent bid and ask quotation, in each case on the principal exchange or market on which that security is traded. If there are no reported sales and no reported bid quotations for a security on a valuation date, or it is not traded on an exchange, the securities are “fair valued” in accordance with the Funds’ Fair Value Procedures. To the extent these securities are actively traded, and valuation adjustments are not applied, they are categorized in Level 1 of the fair value hierarchy. Other securities traded over-the-counter shall be valued at the official closing price. If there is no official closing price, the security is valued at the most recent mean quotation. Investments in registered open-end management companies, including money market funds, will be valued based on the net asset value (“NAV”) of such investments and are categorized as Level 1 of the fair value hierarchy. |
| | |
| | Securities for which market quotations are not readily available or are deemed unreliable are valued at their fair value in accordance with procedures established by the Board of Trustees (“Board”). In determining the fair value of a security, the Adviser and the Board shall take into account the relevant factors and surrounding circumstances, which may include: (i) the nature and duration of restrictions, if any, on the disposition of the security; (ii) fundamental analytical data relating to the security; (iii) evaluation of the forces that influence the market in which the security is traded; (iv) information as to any transactions in or offers for the security; (v) the existence of any merger proposal, tender offer or other extraordinary events relating to the security; (vi) the price and extent of public trading in similar securities of the issuer or of comparable companies; and (vii) any other methodologies and factors that they consider appropriate. |
| | |
| | (b) Use of Estimates |
| | The preparation of financial statements, in conformity with U.S. GAAP, requires the Funds’ management to make estimates and assumptions that affect reported amounts of assets and liabilities and disclosures of contingent assets and liabilities at the date of the financial statements and the results of operations during the reporting period. Actual results could differ from those estimates. |
| | |
| | (c) General |
| | Security transactions are accounted for on a trade date basis. Daily realized gains and losses from security transactions are reported on the specific lot identification basis. Interest income is recorded daily on the accrual basis and dividend |
| Notes to Financial Statements (Unaudited) (continued) | June 30, 2022
|
| | income on the ex-dividend date. Withholding taxes on foreign dividends have been provided for in accordance with the Funds’ understanding of the applicable country’s tax rules and regulations. Any distributions received from investments in ETFs which represent long-term capital gains are recorded by the Funds as a realized gain. |
| | |
| | (d) Expenses |
| | Expenses that are directly related to one of the Funds are charged directly to that Fund. Other operating expenses are allocated to the Funds using several methods, including relative net assets of all the Funds within the Monetta Trust. |
| | |
| | (e) Federal Income Taxes |
| | It is each Fund’s policy to comply with the requirements of the Internal Revenue Code applicable to regulated investment companies and to distribute substantially all of its taxable income to its shareholders. Accordingly, no provision for federal income taxes is required. As of and during the period ended June 30, 2022, the Funds did not have any tax positions that did not meet the “more-likely-than-not” threshold of being sustained by the applicable tax authority. As of and during the period ended June 30, 2022, the Funds did not have any liabilities for any unrecognized tax benefits. The Funds recognize interest and penalties, if any, related to unrecognized tax benefits on uncertain tax positions as income tax expense in the Statement of Operations. As of and during the period ended June 30, 2022, the Funds did not incur any interest and penalties. The Funds are not subject to examination by U.S. tax authorities for tax years prior to the fiscal year ended December 31, 2018. |
| | |
| | The Funds will utilize capital loss carry forwards as allowable, to minimize certain distributions of capital gains. The Funds intend to utilize provisions of the federal income tax laws which allow them to carry a realized loss forward indefinitely and retain their character as either short-term or long-term capital losses. At December 31, 2021, the Funds’ last completed fiscal year, there were no loss carryforwards. |
| | |
| | Net realized gains or losses differ for financial reporting and tax purposes as a result of losses from wash sales. At December 31, 2021, the Funds had no short-term post-October capital losses which were realized after October 31, 2021 and deferred for tax purposes to January 1, 2022. |
| | |
| | (f) Distributions of Incomes and Gains |
| | Distributions to shareholders are recorded by the Funds on the ex-dividend date. Due to inherent differences in the characterization of short-term capital gains under U.S. GAAP, and for federal income tax purposes, the amount of distributable net investment income for book and federal income tax purposes may differ. |
| | |
| | As of December 31, 2021, the Funds’ last completed fiscal year, the components of distributable earnings on a tax basis were as follows: |
| | | | | | | Monetta Young | |
| | | | Monetta Fund | | | Investor Growth Fund | |
| | Undistributed Ordinary Income | | $ | — | | | $ | — | |
| | Undistributed Long-Term Capital Gain | | | 4,496,938 | | | | 2,542,215 | |
| | Net Unrealized Appreciation | | | 38,595,965 | | | | 31,344,102 | |
| | Total Distributable Earnings | | $ | 43,092,903 | | | $ | 33,886,317 | |
| | The tax character of distributions paid during the periods ended June 30, 2022 and the calendar year ended December 31, 2021 were as follows: |
| | | | | | | Monetta Young | |
| | 2022 | | Monetta Fund | | | Investor Growth Fund | |
| | Ordinary Income* | | $ | — | | | $ | — | |
| | Long-Term Capital Gain | | | — | | | | — | |
| | Total Distributions to Shareholders | | $ | — | | | $ | — | |
| | | |
| | | | Monetta Young | |
| | 2021 | | Monetta Fund | | | Investor Growth Fund | |
| | Ordinary Income* | | $ | 671,071 | | | $ | 62,590 | |
| | Long-Term Capital Gain | | | 9,031,014 | | | | 9,380,289 | |
| | Total Distributions to Shareholders | | $ | 9,702,085 | | | $ | 9,442,879 | |
| | * For Federal income tax purposes, distributions of short-term capital gains are treated as ordinary income distributions. | |
| Notes to Financial Statements (Unaudited) (continued) | June 30, 2022
|
| | (g) Fair Value Measurements |
| | In accordance with ASC 820-10, fair value is defined as the price that a Fund would receive to sell an investment or pay to transfer a liability in an orderly transaction with an independent buyer in the principal market or, in the absence of a principal market, the most advantageous market for the investment or liability. ASC 820-10 establishes a three-tier hierarchy to distinguish between (1) inputs that reflect the assumptions market participants would use in pricing an asset or liability developed based on market data obtained from sources independent of the reporting entity (observable inputs) and (2) inputs that reflect the reporting entity’s own assumptions about the assumptions market participants would use in pricing an asset or liability developed based on the best information available in the circumstances (unobservable inputs) and to establish classification of fair value measurements for disclosure purposes. Various inputs are used in determining the value of each Fund’s investments. The inputs are summarized in the three broad Levels listed below. |
| | |
| | • Level 1 - quoted prices in active markets for identical investments; |
| | |
| | • Level 2 - other significant observable inputs (including quoted prices for similar investments, interest rates, prepayment speeds, credit risk, etc.); |
| | |
| | • Level 3 - significant unobservable inputs (including each Fund’s own assumptions in determining the fair value of investments). |
| | |
| | The inputs or methodology used for valuing securities are not necessarily an indication of the risk associated with investing in those securities. |
| | |
| | The following table summarizes each respective Fund’s investments at June 30, 2022, based on the inputs used to value them: |
| | INVESTMENTS IN SECURITIES | |
| | Type of Investments | | Level 1 | | | Level 2 | | | Level 3 | | | Total | |
| | Monetta Fund | | | | | | | | | | | | |
| | Common Stocks | | $ | 60,389,550 | | | $ | — | | | $ | — | | | $ | 60,389,550 | |
| | Money Market Funds | | $ | 1,205,948 | | | $ | — | | | $ | — | | | $ | 1,205,948 | |
| | FUND TOTAL | | $ | 61,595,498 | | | $ | — | | | $ | — | | | $ | 61,595,498 | |
| | Monetta Young Investor Growth Fund | | | | | | | | | | | | | | | | |
| | Common Stocks | | $ | 16,976,154 | | | $ | — | | | $ | — | | | $ | 16,976,154 | |
| | Exchange Traded Funds | | $ | 18,142,875 | | | $ | — | | | $ | — | | | $ | 18,142,875 | |
| | Money Market Funds | | $ | 538,430 | | | $ | — | | | $ | — | | | $ | 538,430 | |
| | FUND TOTAL | | $ | 35,657,459 | | | $ | — | | | $ | — | | | $ | 35,657,459 | |
| | | |
| | Refer to each Fund’s Schedule of Investments for further information on the classification of investments. | |
| 2. | RELATED PARTIES: |
| | Robert S. Bacarella is an officer and trustee of the Funds and also an officer, director and majority shareholder of the Adviser. Robert J. Bacarella is an officer of the Funds and also an officer of the Adviser. As of and for the period ended June 30, 2022, remunerations required to be paid to all interested trustees have been directly paid by the Adviser. Fees paid to independent trustees have been directly paid by the Funds. |
| | |
| | Each Fund pays the Adviser a monthly investment advisory fee, based upon the average net assets of each Fund, which is calculated and accrued daily. |
| | |
| | The Monetta Fund pays the Adviser based on an annual rate of 0.95% for the first $300 million in net assets, 0.90% for the next $200 million in net assets, and 0.85% for net assets over $500 million. The Monetta Young Investor Growth Fund pays the Adviser based on an annual rate of 0.55% on all net assets. From these fees the Adviser pays for all necessary office facilities, equipment and personnel for managing the assets of each Fund. |
| Notes to Financial Statements (Unaudited) (continued) | June 30, 2022
|
| 3. | CAPITAL STOCK AND SHARE UNITS: |
| | There is an unlimited number of “no par value” shares of beneficial interest authorized for each series of the Trust. |
| | | | Monetta | | | Monetta Young | |
| | | | Fund | | | Investor Growth Fund | |
| | 2021 Beginning Shares | | | 2,833,436 | | | | 2,779,176 | |
| | Shares sold | | | 19,390 | | | | 92,645 | |
| | Shares issued upon dividend reinvestment | | | 315,925 | | | | 450,426 | |
| | Shares redeemed | | | (168,203 | ) | | | (761,131 | ) |
| | Net increase (decrease) in shares outstanding | | | 167,112 | | | | (218,060 | ) |
| | 2022 Beginning Shares | | | 3,000,548 | | | | 2,561,116 | |
| | Shares sold | | | 8,460 | | | | 36,998 | |
| | Shares issued upon dividend reinvestment | | | — | | | | — | |
| | Shares redeemed | | | (56,773 | ) | | | (272,605 | ) |
| | Net decrease in shares outstanding | | | (48,313 | ) | | | (235,607 | ) |
| | 2022 Ending Shares | | | 2,952,235 | | | | 2,325,509 | |
| 4. | PURCHASES AND SALES OF INVESTMENT SECURITIES: |
| | The cost of purchases and proceeds from sales of securities for the six months ended June 30, 2022, excluding short-term securities were: |
| | | | U.S. Government Securities | | | Other Investment Securities | |
| | | | Purchases | | | Sales | | | Purchases | | | Sales | |
| | Monetta Fund | | $ | — | | | $ | — | | | $ | 32,937,202 | | | $ | 30,496,417 | |
| | Monetta Young Investor Growth Fund | | | — | | | | — | | | | 2,007,775 | | | | 5,068,615 | |
| 5. | DISTRIBUTION PLAN: |
| | The Trust and its shareholders have adopted a service and distribution plan (the “Plan”) pursuant to Rule 12b-1 under the 1940 Act. The Plan permits the participating Fund to pay certain expenses associated with the distribution of its shares. Annual fees under the Plan up to 0.25% of the average daily net assets for the Monetta Young Investor Growth Fund are accrued daily. |
| | |
| 6. | SECTOR RISK: |
| | As of June 30, 2022, the Monetta Fund had a significant portion of its assets invested in the technology sector. The technology sector may be more sensitive to changes in domestic and international competition, economic cycles, financial resources, personnel availability, rapid innovation and intellectual property issues. |
| | |
| 7. | ETF RISK: |
| | As of June 30, 2022, the Monetta Young Investor Growth Fund had a significant portion of its assets invested in ETFs. ETFs are bought and sold on a securities exchange. An ETF trades like a common stock and often represents a fixed portfolio of securities designed to track the performance and dividend yield of a particular domestic or foreign market index. The Fund may purchase an ETF to gain exposure to a portion of the U.S. or a foreign market. The risks of owning an ETF generally reflect the risks of owning the underlying securities they are designed to track, although the lack of liquidity on an ETF could result in it being more volatile. Additionally, ETFs have fees and expenses that reduce their value. |
| | |
| 8. | CONTROL OWNERSHIP: |
| | The beneficial ownership, either directly or indirectly, of more than 25% of the voting securities of a fund creates a presumption of control of the fund, under Section 2(a)(9) of the 1940 Act. As of June 30, 2022, there were no shareholders owning more than 25% of the voting securities of either Fund. |
| Notes to Financial Statements (Unaudited) (continued) | June 30, 2022
|
| 9. | GENERAL RISK: |
| | The global outbreak of COVID-19 has disrupted economic markets and the prolonged economic impact is uncertain. The operational and financial performance of the issuers of securities in which the Funds invest depends on future developments, including the duration and spread of the outbreak, and such uncertainty may in turn impact the value of the Funds' investments. |
| | |
| | On February 24, 2022, Russia commenced a military attack on Ukraine. The outbreak of hostilities between the two countries could result in more widespread conflict and could have a severe adverse effect on the region and the markets. In addition, sanctions imposed on Russia by the United States and other countries, and any sanctions imposed in the future could have a significant adverse impact on the Russian economy and related markets. The price and liquidity of investments may fluctuate widely as a result of the conflict and related events. How long such conflict and related events will last and whether it will escalate further cannot be predicted, nor its effect on the Funds. |
| | |
| 10. | REGULATORY UPDATE: |
| | In December 2020, the SEC adopted a new rule providing a framework for fund valuation practices (“Rule 2a-5”). Rule 2a-5 establishes requirements for determining fair value in good faith for purposes of the 1940 Act. Rule 2a-5 will permit fund boards to designate certain parties to perform fair value determinations, subject to board oversight and certain other conditions. Rule 2a-5 also defines when market quotations are “readily available” for purposes of the 1940 Act and the threshold for determining whether a fund must fair value a security. In connection with Rule 2a-5, the SEC also adopted related recordkeeping requirements and is rescinding previously issued guidance, including with respect to the role of a board in determining fair value and the accounting and auditing of fund investments. The Funds will be required to comply with the rules by September 8, 2022. Management is currently assessing the potential impact of the new rules on the Funds’ financial statements. |
| Notice to Shareholders (Unaudited) | June 30, 2022
|
Proxy Voting Policies and Proxy Voting Record
The Funds’ proxy voting policies and procedures, as well as its proxy voting record for the most recent 12-month period ended June 30, are available without charge, upon request, by contacting the Adviser at 1-800-MONETTA, or by writing to Monetta Financial Services, Inc., 1776-A South Naperville Rd., Suite 100, Wheaton, IL 60189. The Funds’ proxy voting record is also available on the U.S. Securities and Exchange Commission’s website at www.sec.gov.
Availability of Fund Portfolio Information
Each Fund files complete schedules of portfolio holdings with the SEC for the first and third quarters of each fiscal year on Part F of Form N-PORT. The Funds’ Part F of Form N-PORT are available on the SEC’s website at www.sec.gov and may be reviewed and copied at the SEC’s Public Reference Room in Washington D.C. For more information on the Public Reference Room call 1-800-SEC-0330. In addition, each Fund’s Part F of Form N-PORT is available without charge upon request by calling 1-800-MONETTA.
Householding
In an effort to decrease costs, the Funds intend to reduce the number of duplicate prospectuses and annual and semi-annual reports you receive by sending only one copy of each to those addresses shared by two or more accounts and to shareholders we reasonably believe are from the same family or household (“householding”). If you would like to opt out of householding or, once implemented, if you would like to discontinue householding for your accounts, please call toll-free at 1-800-241-9772 to request individual copies of these documents. Once the Funds receive notice to stop householding, we will begin sending individual copies 30 days after receiving your request. This policy does not apply to account statements.
Information about the Funds’ Trustees
The Statement of Additional Information (“SAI”) includes information about the Funds’ Trustees and is available without charge, upon request, by calling 1-800-MONETTA.
PRIVACY POLICY (Unaudited)
In order to provide the products and services of the Funds, we may collect nonpublic, personal information from you. We consider such information to be private and confidential and are committed to respecting your privacy and protecting your information.
We may collect nonpublic, personal information about you from the following sources:
| | • information that you provide us on applications and other forms; |
| | • information that we generate to service your account, such as account statements; and |
| | • information that we may receive from third parties. |
We do not disclose nonpublic, personal information about you without your authorization, except as permitted by law or in response to inquiries from governmental authorities. We may share information with affiliated and unaffiliated third parties with whom we have contracts for servicing the Funds, including transfer agents and mailing services. We will provide unaffiliated third parties with only the information necessary to carry out their assigned responsibilities and require third parties to treat your non-public personal information with the same high degree of confidentiality.
We restrict access to your nonpublic, personal information to those employees who need to know such information to provide products or services to you. We maintain certain physical, electronic and procedural safeguards that are designed to protect your nonpublic, personal information.
In the event that you hold shares of the Funds through a financial intermediary, including, but not limited to, a broker-dealer, bank, or trust company, the privacy policy of your financial intermediary would govern how your non-public personal information would be shared with non-affiliated third parties.
(This Page Intentionally Left Blank.)
Monetta Mutual Funds
1776-A South Naperville Road
Suite 100
Wheaton, IL 60189-5831
(b) Not applicable.
Item 2. Code of Ethics.
Not applicable for semi-annual reports.
Item 3. Audit Committee Financial Expert.
Not applicable for semi-annual reports.
Item 4. Principal Accountant Fees and Services.
Not applicable for semi-annual reports.
Item 5. Audit Committee of Listed Registrants.
Not applicable to Registrant’s who are not listed issuers (as defined in Rule 10A-3 under the Securities Exchange Act of 1934).
Item 6. Schedule of Investments.
(a) Schedule of Investments is included as part of the report to shareholders filed under Item 1 of this form.
(b) Not applicable
Item 7. Disclosure of Proxy Voting Policies and Procedures for Closed-End Management Investment Companies.
Not applicable to open-end investment companies.
Item 8. Portfolio Managers of Closed-End Management Investment Companies.
Not applicable to open-end investment companies.
Item 9. Purchases of Equity Securities by Closed‑End Management Investment Company and Affiliated Purchasers.
Not applicable to open-end investment companies.
Item 10. Submission of Matters to a Vote of Security Holders.
There have been no material changes to the procedures by which shareholders may recommend nominees to the Registrant’s board of trustees.
Item 11. Controls and Procedures.
(a) | The Registrant’s President and Treasurer have reviewed the Registrant's disclosure controls and procedures (as defined in Rule 30a-3(c) under the Investment Company Act of 1940 (the “Act”)) as of a date within 90 days of the filing of this report, as required by Rule 30a-3(b) under the Act and Rules 13a-15(b) or 15d‑15(b) under the Securities Exchange Act of 1934. Based on their review, such officers have concluded that the disclosure controls and procedures are effective in ensuring that information required to be disclosed in this report is appropriately recorded, processed, summarized and reported and made known to them by others within the Registrant and by the Registrant’s service provider. |
(b) | There were no significant changes in the Registrant's internal control over financial reporting (as defined in Rule 30a-3(d) under the Act) that occurred during the period covered by this report that has materially affected, or is reasonably likely to materially affect, the Registrant's internal control over financial reporting. |
Item 12. Disclosure of Securities Lending Activities for Closed-End Management Investment Companies
Not applicable to open-end investment companies.
Item 13. Exhibits.
| (a) | (1) Any code of ethics or amendment thereto, that is the subject of the disclosure required by Item 2, to the extent that the Registrant intends to satisfy Item 2 requirements through filing an exhibit. 1) Not applicable for semi-annual reports. |
(3) Any written solicitation to purchase securities under Rule 23c‑1 under the Act sent or given during the period covered by the report by or on behalf of the Registrant to 10 or more persons. Not applicable to open-end investment companies.
(4) Change in the Registrant’s independent public accountant. There was no change in the Registrant’s independent public accountant for the period covered by this report.
SIGNATURES
Pursuant to the requirements of the Securities Exchange Act of 1934 and the Investment Company Act of 1940, the Registrant has duly caused this report to be signed on its behalf by the undersigned, thereunto duly authorized.
(Registrant) Monetta Trust
By (Signature and Title) /s/Robert S. Bacarella
Robert S. Bacarella, Chief Executive Officer
Date September 7, 2022
Pursuant to the requirements of the Securities Exchange Act of 1934 and the Investment Company Act of 1940, this report has been signed below by the following persons on behalf of the Registrant and in the capacities and on the dates indicated.
By (Signature and Title) /s/Robert S. Bacarella
Robert S. Bacarella, Chief Executive Officer
Date September 7, 2022
By (Signature and Title) /s/Robert J. Bacarella
Robert J. Bacarella, Chief Financial Officer
Date September 7, 2022