Ohio Valley Banc Corp.
The management of Ohio Valley Banc Corp. (the Company) is responsible for establishing and maintaining adequate internal control over financial reporting as defined in Rules 13a-15(f) and 15d-15(f) under the Securities Exchange Act of 1934. The Company's internal control over financial reporting is designed to provide reasonable assurance regarding the reliability of financial reporting and the preparation of financial statements for external purposes in accordance with generally accepted accounting principles. The Company's internal control over financial reporting includes those policies and procedures that: (i) pertain to the maintenance of records that, in reasonable detail, accurately and fairly reflect the transactions and dispositions of the assets of the Company; (ii) provide reasonable assurance that transactions are recorded as necessary to permit preparation of financial statements in accordance with generally accepted accounting principles, and that receipts and expenditures of the Company are being made only in accordance with authorizations of management and directors of the Company; and (iii) provide reasonable assurance regarding prevention or timely detection of unauthorized acquisition, use or disposition of the Company's assets that could have a material effect on the financial statements.
The system of internal control over financial reporting as it relates to the consolidated financial statements is evaluated for effectiveness by management. Because of its inherent limitations, internal control over financial reporting may not prevent or detect misstatements. Also, projections of any evaluation of effectiveness to future periods are subject to the risk that controls may become inadequate because of changes in conditions, or that the degree of compliance with the policies or procedures may deteriorate.
Management assessed Ohio Valley Banc Corp.’s system of internal control over financial reporting as of December 31, 2022, in relation to criteria for effective internal control over financial reporting as described in the 2013 “Internal Control Integrated Framework,” issued by the Committee of Sponsoring Organizations of the Treadway Commission (COSO). Based on this assessment, management concluded that, as of December 31, 2022, its system of internal control over financial reporting is effective and meets the criteria of the “Internal Control Integrated Framework.”
Ohio Valley Banc Corp.
FORWARD LOOKING STATEMENTS
Certain statements contained in this report and other publicly available documents incorporated herein by reference constitute "forward looking statements" within the meaning of Section 27A of the Securities Act of 1933, as amended, and Section 21E of the Securities Act of 1934, as amended (the “Exchange Act”), and as defined in the Private Securities Litigation Reform Act of 1995. Such statements are often, but not always, identified by the use of such words as “believes,” “anticipates,” “expects,” “intends,” “plan,” “goal,” “seek,” “project,” “estimate,” “strategy,” “future,” “likely,” “may,” “should,” “will,” and other similar expressions. Such statements involve various important assumptions, risks, uncertainties, and other factors, many of which are beyond our control and which could cause actual results to differ materially from those expressed in such forward looking statements. These factors include, but are not limited to: the effects of COVID-19 and recovery therefrom on our business, operations, customers and capital position; unexpected changes in interest rates or disruptions in the mortgage market; changes in political, economic or other factors, such as inflation rates, recessionary or expansive trends, taxes, the effects of implementation of legislation and the continuing economic uncertainty in various parts of the world; competitive pressures; fluctuations in interest rates; the level of defaults and prepayment on loans made by Ohio Valley Banc Corp. (“Ohio Valley”) and its direct and indirect subsidiaries (collectively, the “Company”); unanticipated litigation, claims, or assessments; fluctuations in the cost of obtaining funds to make loans; and regulatory changes. Additional detailed information concerning such factors is available in the Company’s filings with the Securities and Exchange Commission, under the Exchange Act, including the disclosure under the heading “Item 1A. Risk Factors” of Part I of the Company’s Annual Report on Form 10-K for the fiscal year ended December 31, 2022. Readers are cautioned not to place undue reliance on such forward looking statements, which speak only as of the date hereof. The Company undertakes no obligation and disclaims any intention to republish revised or updated forward looking statements, whether as a result of new information, unanticipated future events or otherwise.
ANALYSIS OF FINANCIAL CONDITION AND RESULTS OF OPERATIONS
The purpose of this discussion is to provide an analysis of the financial condition and results of operations of the Company that is not otherwise apparent from the audited consolidated financial statements included in this report. The accompanying consolidated financial information has been prepared by management in conformity with U.S. generally accepted accounting principles (“US GAAP”) and is consistent with that reported in the consolidated financial statements. Reference should be made to those statements and the selected financial data presented elsewhere in this report for an understanding of the following tables and related discussion. All dollars are reported in thousands, except share and per share data.
BUSINESS OVERVIEW:
The following discussion on consolidated financial statements include the accounts of Ohio Valley and its wholly-owned subsidiaries, The Ohio Valley Bank Company (the “Bank”), Loan Central, Inc., a consumer finance company (“Loan Central”), Ohio Valley Financial Services Agency, LLC, an insurance agency, and OVBC Captive, Inc., a limited purpose property and casualty insurance company (the “Captive”). The Bank has two wholly-owned subsidiaries, Race Day Mortgage, Inc., an Ohio corporation that provides online consumer mortgages (“Race Day”), and Ohio Valley REO, LLC, an Ohio limited liability company.In February 2023, Ohio Valley announced that it was taking steps toward closing Race Day. The decision to start this process was made due to low loan demand, issues retaining personnel, and lack of profitability. Ohio Valley plans to see current loan applications in progress to completion. An exact date of closing is anticipated to be set once existing loan applications have been processed. Ohio Valley and its subsidiaries are collectively referred to as the “Company.”
The Company is primarily engaged in commercial and retail banking, offering a blend of commercial and consumer banking services within southeastern Ohio as well as western West Virginia. The banking services offered by the Bank include the acceptance of deposits in checking, savings, time and money market accounts; the making and servicing of personal, commercial, floor plan and student loans; the making of construction and real estate loans; and credit card services. The Bank also offers individual retirement accounts, safe deposit boxes, wire transfers and other standard banking products and services. Furthermore, the Bank offers Tax Refund Advance Loans (“TALs”) to Loan Central tax customers. A TAL represents a short-term loan offered by the Bank to tax preparation customers of Loan Central.
CUSTOMER SUPPORT DURING THE PANDEMIC:
On March 27, 2020, the Coronavirus Aid, Relief, and Economic Security Act ("CARES Act") was signed into law. The CARES Act provided assistance to small businesses through the establishment of the Paycheck Protection Program ("PPP"). The PPP provided small businesses with funds to use for payroll and certain other expenses. The funds were provided in the form of loans that would be fully forgiven if certain criteria were met. In 2021, Congress amended the PPP by extending the authority of the Small Business Administration (“SBA”) to guarantee loans and the ability of PPP lenders to disburse PPP loans until May 31, 2021. The Company supported its clients who experienced financial hardship due to COVID-19 through participation in the PPP, assistance with expedited deposits of CARES Act stimulus payments, and loan modifications, as needed.
RESULTS OF OPERATIONS:
SUMMARY
2022 v. 2021
Ohio Valley generated net income of $13,338 for 2022, an increase of $1,606, or 13.7%, from 2021. Earnings per share were $2.80 for 2022, an increase of 14.3% from 2021. The increase in net income and earnings per share for 2022 was impacted by higher net interest income and noninterest income, partially offset by increases in both provision expense and noninterest expense. For 2022, net interest income was positively impacted by the aggressive rate increases initiated by the Federal Reserve Bank (“FRB”), elevating prime rate from 3.25% to 7.50% during 2022. The rate increases were in response to rising inflationary concerns. This had a corresponding impact on higher asset yields that generated growth in interest income, while interest expenses remained less sensitive to higher market rates during most of 2022. As a result, net interest income increased $3,765, while the Company’s fully tax-equivalent net interest income as a percentage of average earning assets (“net interest margin”) increased 28 basis points to 3.89% at December 31, 2022. Average earnings assets also increased 1.3% coming from growth in investment securities and loans, partially offset by a decrease in interest-bearing deposits with banks. Earnings growth in 2022 also came from noninterest income, which increased $298 over 2021. Noninterest income was mostly impacted by increases in service charges on deposit accounts and interchange income on debit and credit card transactions, which were collectively up $797 over 2021. Partially offsetting these positive factors within noninterest income was a $471 increase in realized losses from the sales of lower-yielding securities during 2022 compared to 2021. The positive contributions from higher net interest income and noninterest income were partially offset by increases in both provision expense and noninterest expense, which were collectively up $2,147 over 2021. Provision expense increased $387 over 2021 in large part to higher net charge offs. Noninterest expense increased $1,760 over 2021 mostly from higher marketing, data processing, and software costs, as well as various other overhead costs from Race Day.
The Company’s net interest income in 2022 was $44,778, representing an increase of $3,765, or 9.2%, from 2021. Impacting net interest income growth was the increase in net interest margin in relation to the increase in market rates. During 2022, the FRB took unprecedented action to restrain inflation and improve the stability of the economy. The FRB raised market rates seven consecutive times ranging from 25 basis points in the beginning of the year to 75 basis points toward the end of the year and brought the prime lending rate up to 7.50% at year-end 2022, an increase of 425 basis points from year-end 2021. This action contributed to higher earning asset yields during 2022. Partially offsetting these positive effects on earning assets were lower PPP loan fees during 2022. The Company had participated in the PPP to assist various businesses in our market areas during the pandemic. The fees earned on PPP loans decreased $1,169 for the year ended December 31, 2022, as compared to the same period in 2021, which had a negative impact to net interest income. While rising market rates during 2022 had a direct impact to higher earning asset yields, the impact was less immediate to interest-bearing costs primarily due to a lagging effect associated with time deposits and certain other interest-bearing deposits. As a result, the Company’s net interest margin finished at 3.89% during the year ended December 31, 2022, an increase of 28 basis points from a 3.61% net interest margin during the same period in 2021.
Also having a positive impact to net interest income was growth in average earning assets, which were up $15,090 during 2022, as compared to 2021. The growth came largely from increases in investment securities, which were up $36,317 over 2021. The Company utilized a portion of its interest-bearing FRB deposit balances to fund new security purchases in 2022 and account for the runoff in time deposit balances in 2022. As a result, average interest-bearing balances with banks decreased $23,959 from 2021. Average loans during 2022 were limited to a $2,732 increase over 2021, largely due to the repayment of all PPP loans as of the first quarter of 2022. As a result of these repayments, the average balance of PPP loans decreased $14,260 from 2021.
The Company benefited from recording negative provision expense of $32 and $419 during both the years ending 2022 and 2021, respectively. The factors that limited provision expense the most during 2022 include a decrease in classified loans, as well as a partial release of the COVID-19 reserve. Partially offsetting these positive effects was a $924 increase in net charge-offs during 2022, primarily from the commercial and industrial loan portfolio.
The Company’s noninterest income increased $298, or 3.0%, from 2021. The year-to-date increase in noninterest income was largely impacted by a $579 increase in service charges on deposit accounts, which included a higher volume of overdraft transactions during 2022. Further contributing to the increase in noninterest income for 2022 was debit / credit card interchange income, which was up $218 and impacted by higher consumer spending during 2022. Partially offsetting these positive effects within noninterest income was an increase of $471 in realized losses on the sale of lower-yielding securities. During the fourth quarter of 2022, the Company sold $12,500 in securities at a loss of $1,537, as compared to $1,066 in losses during the fourth quarter of 2021. The proceeds from the sales of securities were reinvested into similar higher-yielding securities to increase interest earnings.
The Company’s noninterest expenses during 2022 increased $1,760, or 4.7%, from 2021. This increase was mostly impacted by marketing expense, which was up $602 during 2022. This surge in marketing costs was primarily related to specific donations made during the fourth quarter of 2022 to support the communities we serve. Data processing expense increased $355 due to higher debit and credit card transaction volume impacted by elevated consumer spending. Software expense increased $339 in relation to software platforms utilized by Race Day, as well as various software purchases and enhancements to further enhance operating efficiencies at the Bank. Other noninterest expense increased $315 due to various other overhead costs from Race Day, which included the purchase of mortgage loan marketing leads.
The Company’s provision for income taxes increased $310 during 2022, largely due to the changes in taxable income affected by the factors mentioned above.
NET INTEREST INCOME
The most significant portion of the Company's revenue, net interest income, results from properly managing the spread between interest income on earning assets and interest expense incurred on interest-bearing liabilities. The Company earns interest and dividend income from loans, investment securities and short-term investments while incurring interest expense on interest-bearing deposits and short- and long-term borrowings. Net interest income is affected by changes in both the average volume and mix of assets and liabilities and the level of interest rates for financial instruments. Changes in net interest income are measured by net interest margin and net interest spread. Net interest margin is expressed as the percentage of net interest income to average interest-earning assets. Net interest spread is the difference between the average yield earned on interest-earning assets and the average rate paid on interest-bearing liabilities. Both of these are reported on a fully tax-equivalent (“FTE”) basis. Net interest margin exceeds the net interest rate spread because noninterest-bearing sources of funds, principally noninterest-bearing demand deposits and stockholders' equity, also support interest-earning assets. The following is a discussion of changes in interest-earning assets, interest-bearing liabilities and the associated impact on interest income and interest expense for the two years ended December 31, 2022 and 2021. Tables I and II have been prepared to summarize the significant changes outlined in this analysis.
Net interest income in 2022 totaled $45,264 on an FTE basis, up $3,773, or 9.1%, from 2021. This increase reflects positive contributions from a 20 basis point increase in earning asset yield, an 11 basis point decrease in average interest-bearing liability cost, and a 1.3% increase in average earning assets. The average earning asset yield during 2022 was impacted by the FRB’s action to increase rates by 425 basis points beginning in March 2022. Conversely, the Company was able to maintain its average cost of deposits at the lower levels it was experiencing prior to the series of aggressive market rate increases. This was largely due to a heightened liquidity position of core interest- and noninterest-bearing demand deposit balances, as well as savings and money market account balances. With average rates on deposits remaining low and higher core deposit balances on hand, this extended the continued maturity runoff of time deposits during 2022 that the Company had experienced during 2021. As a result, the net interest margin increased from 3.61% in 2021 to 3.89% in 2022. The net interest margin increase of 28 basis points reflects the benefits of both a 20 basis point increase from the mix and yield on earning assets and an 11 basis point decrease in funding costs, partially offset by a 3 basis point decreasing impact from the use of noninterest-bearing funding (i.e., demand deposits and shareholders’ equity). The increase in average earning assets came mostly from a 21.2% increase in securities, partially offset by a 17.6% decrease in interest-bearing balances with banks during 2022, as compared to the same period in 2021. Average loans also increased 0.3% over the same time period.
Net interest income increased in 2022 primarily due to the increase in average yield and volume of earning assets combined with the decrease in average cost and volume of interest-bearing liabilities. The yield increase in average earning assets was responsible for increasing FTE interest income by $2,269 during 2022 compared to 2021, while the volume increase in average earning assets contributed to a $643 increase in FTE interest income during the same period. These positive impacts were further enhanced by a decrease in average interest-bearing liability costs that contributed to a $525 reduction in interest expense during 2022 compared to 2021, while a volume decrease in average interest-bearing liabilities contributed to a $336 reduction in interest expense during the same period. The increase in average earning asset yield for 2022 was largely impacted by interest-bearing balances with other banks. The action of the FRB to aggressively increase rates during 2022 had an immediate effect on increasing the interest income generated by the Company’s FRB clearing account. The clearing account interest rate was adjusted up from 0.25% in March 2022 to 4.50% at December 2022. Prior to this, the rate had been fluctuating at or below 0.25% since March 2020. As a result, the average yield factor on interest-bearing balances with other banks had a positive impact on earnings in 2022, increasing interest income by $1,352, as compared to a $215 decrease in interest income during 2021. Conversely, the average volume on interest-bearing balances with other banks contributed to $40 decrease in interest income during 2022, as compared to a $136 increase to interest income during 2021. The change was impacted by the utilization of excess deposits within the FRB clearing account during 2022. The Company utilizes its interest-bearing FRB clearing account to manage excess funds, as well as to assist in funding earning asset growth. Entering 2022 and prior to the FRB actions of increasing rates, the impact of COVID-19 had generated higher levels of excess funds within the clearing account. The Company used these balances in 2022 to help fund a portion of the growth in loans and investment security purchases, while also facilitating the maturity runoff of time deposits. The volume decrease in the Bank’s FRB clearing account during 2022 led to a $23,959, or 17.6%, decrease in average interest-bearing balances with other banks during 2022 compared to 2021, and also led to a lower composition of average interest-bearing balances with other banks, finishing at 9.6% of average earning assets in 2022, as compared to 11.8% in 2021.
Average securities of $207,474 at year-end 2022 represented a 21.2% increase from the $171,157 in average securities at year-end 2021. The significant surge in deposits during 2021 that carried over into 2022 was a result of various government stimulus programs that produced heightened levels of excess liquidity. The Company utilized a portion of these excess funds to purchase investment securities. Average taxable securities in 2022 increased 22.7% over the prior year, particularly from purchases of U.S. Government and Agency mortgage-backed securities. As a result, the composition of average taxable securities grew to 17.1% of average earning assets at year-end 2022, as compared to 14.1% at year-end 2021, and contributed to a $565 increase in interest income during 2022, as compared to a $912 increase in interest income during 2021. The rising rate environment had a positive impact on the average yields on taxable securities during 2022, as the new purchases were being booked at higher interest rate yields. Furthermore, the Company took opportunities to sell some of its lower-yielding taxable securities in December of 2021 and 2022, and use the proceeds to reinvest into higher-yielding securities. The resulting realized losses from both sales are expected to be offset by increases in future interest income. As a result, the average yield factor for taxable securities contributed to a $912 increase in interest income during 2022, as compared to a $974 decrease in interest income during 2021. Average tax exempt securities were down 7.1% from the prior year, largely related to maturities of state and municipal investments. As a result, the composition of average state and municipal investments trended down to 0.7% of average earning assets at year-end 2022, as compared to 0.8% at year-end 2021. Management continues to focus on generating loan growth as loans provide the greatest return to the Company. Management also maintains securities at a dollar level adequate enough to provide ample liquidity and cover pledging requirements.
Loans also had a positive, but limited, impact to net interest income from both volume and yield factors. Total loans experienced a $2,732, or 0.3%, increase in average loans, which contributed to $138 in additional FTE interest income during 2022 compared to 2021. This growth came predominantly from the commercial real estate, commercial and industrial and consumer loan segments. However, the Company’s government-guaranteed PPP loans that were originated from 2020 and early 2021 began to fully payoff during the second half of 2021. The payoffs of those loans caused an average balance decrease of $14,260 in PPP loans in 2022 compared to 2021, which limited average loan growth in 2022. While average loans increased in 2022, investment securities experienced more accelerated growth in 2022. As a result, the Company’s average loan composition decreased to 72.5% of average earning assets at year-end 2022, as compared to 73.3% for 2021. The increase in short-term rates during 2022 had a direct impact on the repricing of a portion of the Company’s loan portfolio that contributed to higher earnings in 2022. Partially offsetting the effects of market rate repricings were lower loan fees, primarily from a $1,169 decrease in fees from the payoffs of PPP loans in 2021. As a result, the average loan yield finished at 5.06% at year-end 2022, as compared to 5.05% at year-end 2021, which contributed to a $55 increase in FTE interest income during 2022.
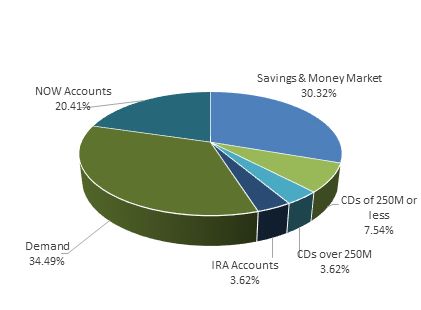
Net interest income was positively impacted by a decline in the average cost of interest-bearing liabilities, particularly with the Company’s time deposits, during 2022. Prior to 2022, the Company was already benefiting from lower interest costs on its CD portfolio from the short-term rate decreases in 2020 that had a lagging effect into 2021. The Company entered 2022 with CD rates still adjusting downward, but also experiencing a large increase in excess deposits carried over from 2021 resulting from various government stimulus programs. As the FRB began moving short-term rates up in March 2022, the Company still maintained heightened levels of liquidity, which allowed deposit rates to remain unadjusted for most of 2022. This extended the downward rate repricings on CDs as they matured or renewed at lower rates. Rate offerings on CDs began adjusting up in the second half of 2022, but was not impactful in generating significant increases to interest expense during that period. As a result, the average cost of time deposits decreased 36 basis points from 1.01% in 2021 to 0.65% in 2022, which contributed to a $643 decrease in interest expense for the year. This is compared to a $1,483 decrease in interest expense during 2021. Lower CD rates have also generated less consumer demand for CD products. As a result, the average time deposit segment decreased $30,890, or 15.4%, during 2022. This led to a decrease in the composition of average time deposits from 26.9% of interest-bearing liabilities at year-end 2021 to 22.7% at year-end 2022, which contributed to a $279 decrease in interest expense for the year, as compared to a $189 decrease in interest expense during 2021.
Lower interest rates also had a significant impact on core deposit segments that include negotiable order of withdrawal (“NOW��), savings and money market accounts. Interest expense on these accounts was largely unaffected by the rising rate environment in 2022 due to a lagging effect on deposit rate adjustments. These repricing efforts to limit the magnitude of deposit rate increases in a higher rate environment contributed to a minimal impact to interest expense during 2022. As a result, the Company’s average cost of savings and money market accounts decreased from 0.09% in 2021 to 0.08% in 2022, while the average cost of NOW accounts increased slightly from 0.32% in 2021 to 0.34% in 2022. Collectively, this contributed to just a $5 increase to interest expense during 2022, as compared to an $846 decrease in 2021. Customer deposits continued to increase during 2022 within these core deposit segments impacted by excess deposits carried over from 2021 that had been impacted by stimulus relief monies and a consumer preference to preserve these customer deposit proceeds during the pandemic. As a result, average balances during 2022 increased 7.1% within NOW accounts and 7.7% within savings and money market accounts, altogether representing 73.5% of average interest-bearing liabilities in 2022, as compared to 68.5% in 2021.
Conversely, the Company’s average other borrowings and subordinated debentures collectively decreased $6,110, or 17.7%, during 2022. The decrease was related to the principal repayments applied to various FHLB advances. Borrowings and subordinated debentures continue to represent the smallest composition of average interest-bearing liabilities, finishing at 3.8% and 4.6% at the end of 2022 and 2021, respectively.
Total interest and fee income on average earning assets increased $2,912, or 6.4%, during 2022, but decreased $1,423, or 3.1%, during 2021. The converse relationship between 2022 and 2021 was the change in rate environments, transitioning from a low rate environment in 2021 to a rising rate environment in 2022. The Company’s interest and fees from its consumer loan portfolio increased $629, or 6.3%, during 2022. The increase was primarily the result of higher consumer loan yields and an increase in average consumer capital line and unsecured loan balances. As a result, consumer loan interest increased $534 and consumer loan fees increased $95 during 2022. During 2021, consumer loan interest and fees decreased $376, or 3.6%. The decrease was primarily the result of lower consumer loan yields and a decrease in average automobile loans. As a result, consumer loan interest decreased $358 and consumer loan fees decreased $18 during 2021.
The Company’s interest and fees from its commercial loan portfolio decreased $368, or 1.7%, during 2022. The decrease came primarily from lower commercial loan fees, which decreased $1,295, or 60.4%, during 2022, as compared to 2021. The Company had participated in the PPP since 2020 as part of the government’s relief program for businesses impacted by COVID-19. These originations began in the second quarter of 2020, with another round added during the first quarter of 2021. The majority of PPP loan originations from both rounds had paid off during 2021. This resulted in the income recognition of $1,184 in PPP loan fees from the SBA during 2021, as compared to $15 in PPP loan fees in 2022. This $1,169 decrease in PPP loan fees completely offset an increase in commercial interest income in 2022, which was up $927 over 2021. The interest income increase was impacted by higher average yields and increases in average commercial loan balances within the commercial real estate and commercial and industrial portfolios. During 2021, the Company’s commercial loan interest and fees increased $1,387, or 7.0%, during 2021. The increase was impacted by higher average commercial loan balances that completely offset the negative impact of lower commercial loan yields. Commercial loan demand was successful in generating an average balance increase of 14.0% within the Company’s commercial real estate and commercial and industrial portfolios. Balance increases were driven by a $48,035 increase in average commercial loans from the Company’s Pike and Athens county markets in Ohio and Cabell County market in West Virginia. Further impacting commercial revenue during 2021 was a $728 increase in loan fees, which came from the payoffs of PPP loans discussed above that impacted 2021. This resulted in income recognition of $1,184 in PPP loan fees from the SBA during 2021, an increase of $479 in PPP fees over 2020.
The Company’s interest and fees from its residential real estate loan portfolio decreased $90, or 0.8%, during 2022. This was impacted by a decrease in average residential real estate loan balances caused by principal repayments and payoffs, and a lower volume of new loan originations during 2022. The demand for residential real estate loans declined as mortgage rates continued to increase during 2022, causing potential home buyers to hold back and wait for affordability to improve. As a result, interest income decreased $51 and fee income decreased $39 within the residential real estate portfolio during 2022. During 2021, the Company’s interest and fees from its residential real estate loan portfolio decreased $2,113, or 16.2%, during 2021. The decrease was impacted by lower average balances, yields and fees on the residential real estate loan portfolio during 2021. Residential real estate loan yields were negatively impacted by a sustained low rate environment in 2021. Lower average residential real estate loan balances in 2021 came mostly from the Bank’s warehouse lending volume. Warehouse lending consists of a line of credit provided by the Bank to another mortgage lender that makes loans for the purchase of one- to four-family residential real estate properties. The mortgage lender eventually sells the loans and repays the Bank. As mortgage refinancings reached their peak during the second half of 2020, the volume of warehouse lending balances decreased to zero at June 30, 2021. As a result, average warehouse lending balances decreased from $25,110 in 2020 to $7,214 in 2021. The sustained low rate environment combined with less mortgage refinancings also contributed to a shift into more long-term fixed-rate mortgages (up $4,284) and less short-term adjustable-rate mortgages (down $11,044) during 2021. Lower real estate loan fees were the result of fewer loan modifications during 2021.
CONSOLIDATED AVERAGE BALANCE SHEET & ANALYSIS OF NET INTEREST INCOME
| | December 31 | |
Table I | | 2022 | | | 2021 | |
| (dollars in thousands) | | Average Balance | | | Income/ Expense | | | Yield/ Average | | | Average Balance | | | Income/ Expense | | | Yield/ Average | |
| Assets | | | | | | | | | | | | | | | | | | |
| Interest-earning assets: | | | | | | | | | | | | | | | | | | |
| Interest-bearing balances with banks | | $ | 112,112 | | | $ | 1,507 | | | | 1.34 | % | | $ | 136,071 | | | $ | 195 | | | | 0.14 | % |
| Securities: | | | | | | | | | | | | | | | | | | | | | | | | |
Taxable | | | 199,446 | | | | 3,656 | | | | 1.83 | | | | 162,511 | | | | 2,179 | | | | 1.34 | |
Tax exempt | | | 8,028 | | | | 227 | | | | 2.83 | | | | 8,646 | | | | 297 | | | | 3.44 | |
Loans | | | 844,413 | | | | 42,712 | | | | 5.06 | | | | 841,681 | | | | 42,519 | | | | 5.05 | |
| Total interest-earning assets | | | 1,163,999 | | | | 48,102 | | | | 4.13 | % | | | 1,148,909 | | | | 45,190 | | | | 3.93 | % |
| | | | | | | | | | | | | | | | | | | | | | | | | |
| Noninterest-earning assets: | | | | | | | | | | | | | | | | | | | | | | | | |
| Cash and due from banks | | | 14,767 | | | | | | | | | | | | 14,739 | | | | | | | | | |
| Other nonearning assets | | | 81,303 | | | | | | | | | | | | 77,254 | | | | | | | | | |
| Allowance for loan losses | | | (5,417 | ) | | | | | | | | | | | (7,101 | ) | | | | | | | | |
Total noninterest-earning assets
| | | 90,653 | | | | | | | | | | | | 84,892 | | | | | | | | | |
Total assets | | $ | 1,254,652 | | | | | | | | | | | $ | 1,233,801 | | | | | | | | | |
| | | | | | | | | | | | | | | | | | | | | | | | | |
| Liabilities and Shareholders’ Equity | | | | | | | | | | | | | | | | | | | | | | | | |
| Interest-bearing liabilities: | | | | | | | | | | | | | | | | | | | | | | | | |
NOW accounts | | $ | 226,709 | | | $ | 778 | | | | 0.34 | % | | $ | 211,636 | | | $ | 680 | | | | 0.32 | % |
| Savings and money market | | | 322,272 | | | | 242 | | | | 0.08 | | | | 299,129 | | | | 265 | | | | 0.09 | |
Time deposits | | | 169,682 | | | | 1,110 | | | | 0.65 | | | | 200,572 | | | | 2,032 | | | | 1.01 | |
| Other borrowed money | | | 19,954 | | | | 412 | | | | 2.06 | | | | 26,064 | | | | 564 | | | | 2.16 | |
| Subordinated debentures | | | 8,500 | | | | 296 | | | | 3.48 | | | | 8,500 | | | | 158 | | | | 1.86 | |
| Total int.-bearing liabilities | | | 747,117 | | | | 2,838 | | | | 0.38 | % | | | 745,901 | | | | 3,699 | | | | 0.49 | % |
| | | | | | | | | | | | | | | | | | | | | | | | | |
| Noninterest-bearing liabilities: | | | | | | | | | | | | | | | | | | | | | | | | |
| Demand deposit accounts | | | 353,019 | | | | | | | | | | | | 331,027 | | | | | | | | | |
Other liabilities | | | 19,295 | | | | | | | | | | | | 18,042 | | | | | | | | | |
| Total noninterest-bearing liabilities | | | 372,314 | | | | | | | | | | | | 349,069 | | | | | | | | | |
| | | | | | | | | | | | | | | | | | | | | | | | | |
| Shareholders’ equity | | | 135,221 | | | | | | | | | | | | 138,831 | | | | | | | | | |
| Total liabilities and shareholders’ equity | | $ | 1,254,652 | | | | | | | | | | | $ | 1,233,801 | | | | | | | | | |
| | | | | | | | | | | | | | | | | | | | | | | | | |
| Net interest earnings | | | | | | $ | 45,264 | | | | | | | | | | | $ | 41,491 | | | | | |
| Net interest margin | | | | | | | | | | | 3.89 | % | | | | | | | | | | | 3.61 | % |
| Net interest rate spread | | | | | | | | | | | 3.75 | % | | | | | | | | | | | 3.44 | % |
| Average interest-bearing liabilities to average earning assets | | | | | | | | | | | 64.19 | % | | | | | | | | | | | 64.92 | % |
Fully taxable equivalent yields are reported for tax exempt securities and loans and calculated assuming a 21% tax rate, net of nondeductible interest expense. Tax-equivalent adjustments for securities during the years ended December 31, 2022 and 2021 totaled $47 and $61, respectively. Tax-equivalent adjustments for loans during the years ended December 31, 2022 and 2021 totaled $439 and $417, respectively. Average balances are computed on an average daily basis. The average balance for available for sale securities includes the market value adjustment. However, the calculated yield is based on the securities’ amortized cost. Average loan balances include nonaccruing loans. Loan income includes cash received on nonaccruing loans.
RATE VOLUME ANALYSIS OF CHANGES IN INTEREST INCOME & EXPENSE Table II
|
(dollars in thousands) | | 2022 | | | 2021 | |
| | Increase (Decrease) From Previous Year Due to | | | Increase (Decrease) From Previous Year Due to | |
| | Volume | | | Yield/Rate | | | Total | | | Volume | | | Yield/Rate | | | Total | |
| Interest income | | | | | | | | | | | | | | | | | | |
Interest-bearing balances with banks | | $ | (40 | ) | | $ | 1,352 | | | $ | 1,312 | | | $ | 136 | | | $ | (215 | ) | | $ | (79 | ) |
Securities: | | | | | | | | | | | | | | | | | | | | | | | | |
Taxable | | | 565 | | | | 912 | | | | 1,477 | | | | 744 | | | | (974 | ) | | | (230 | ) |
Tax exempt | | | (20 | ) | | | (50 | ) | | | (70 | ) | | | (22 | ) | | | (40 | ) | | | (62 | ) |
Loans | | | 138 | | | | 55 | | | | 193 | | | | 1,587 | | | | (2,639 | ) | | | (1,052 | ) |
Total interest income | | | 643 | | | | 2,269 | | | | 2,912 | | | | 2,445 | | | | (3,868 | ) | | | (1,423 | ) |
| | | | | | | | | | | | | | | | | | | | | | | | | |
| Interest expense | | | | | | | | | | | | | | | | | | | | | | | | |
NOW accounts | | | 50 | | | | 48 | | | | 98 | | | | 114 | | | | (52 | ) | | | 62 | |
Savings and money market | | | 20 | | | | (43 | ) | | | (23 | ) | | | 127 | | | | (794 | ) | | | (667 | ) |
Time deposits | | | (279 | ) | | | (643 | ) | | | (922 | ) | | | (189 | ) | | | (1,483 | ) | | | (1,672 | ) |
Other borrowed money | | | (127 | ) | | | (25 | ) | | | (152 | ) | | | (128 | ) | | | (37 | ) | | | (165 | ) |
Subordinated debentures | | | ---- | | | | 138 | | | | 138 | | | | ---- | | | | (50 | ) | | | (50 | ) |
Total interest expense | | | (336 | ) | | | (525 | ) | | | (861 | ) | | | (76 | ) | | | (2,416 | ) | | | (2,492 | ) |
Net interest earnings | | $ | 979 | | | $ | 2,794 | | | $ | 3,773 | | | $ | 2,521 | | | $ | (1,452 | ) | | $ | 1,069 | |
The change in interest due to volume and rate is determined as follows: Volume Variance - change in volume multiplied by the previous year's rate; Yield/Rate Variance - change in rate multiplied by the previous year's volume; Total Variance –change in volume multiplied by the change in rate. The change in interest due to both volume and rate has been allocated to volume and rate changes in proportion to the relationship of the absolute dollar amounts of the change in each. The tax exempt securities and loan income is presented on an FTE basis. FTE yield assumes a 21% tax rate, net of related nondeductible interest expense.
The Company’s interest income from taxable investment securities increased $1,477, or 67.8%, in 2022. This was primarily due to investment purchases and reinvestment of maturities at market rates higher than the average portfolio yield. During 2022, the Company took opportunities to reinvest a portion of excess deposits into new U.S. Government and Agency mortgage-backed securities, which contributed to a $42,806 increase in average taxable securities. Additionally, the Company sold $12,500 of lower-yielding taxable securities at the end of 2022, and $48,732 of lower-yielding taxable securities at the end of 2021. The proceeds from both sales were used to reinvest in similar higher-yielding securities that impacted higher asset yields in 2022. These factors had a positive impact on increasing the yield on taxable securities, which increased from 1.34% in 2021 to 1.83% in 2022. During 2021, interest income from taxable investment securities decreased $230, or 9.6%. The Company took opportunities to reinvest a portion of excess deposits into new U.S. Government, U.S. Government sponsored entity and Agency mortgage-backed securities, which contributed to a $44,421 increase in average taxable securities. However, the positive impacts from higher average taxable securities was completely offset by a 70 basis point decline in taxable securities yield from 2.04% to 1.34%. This was primarily due to investment purchases and reinvestment of maturities at market rates lower than the average portfolio yield.
Total interest expense incurred on the Company’s interest-bearing liabilities decreased $861, or 23.3%, during 2022, and $2,492, or 40.3%, during 2021. The decrease in interest expense during 2022 was largely the result of a lagging effect to deposit rate increases during the time that the FRB took action to aggressively move short-term rates up to combat inflationary pressures in 2022. At that time, the Company was able to maintain a large amount of excess deposit balances within its core segment of interest-bearing NOW, savings and money market accounts with little to no change to their respective deposit product rates. With deposit rates resistant to increase, this caused continued maturity runoff of higher-cost CD balances, some of which were reinvested back into other Bank products. Given the Company’s asset-sensitivity, the increases in short-term interest rates had a positive impact on net interest income in that interest-earning assets repriced faster than interest-bearing liabilities. By experiencing minimal change in deposit rates, this delayed the negative impact that higher market rates had on increasing deposit expense during most of 2022. As a result, the weighted average cost on interest-bearing liabilities decreased from 0.49% in 2021 to 0.38% in 2022. The decrease in interest expense during 2021 was largely the result of a decline in market rates from March 2020, which impacted 2021. The Company’s strategy continues to focus on funding earning asset growth with lower cost, core deposit funding sources to further reduce, or limit growth in, interest expense. With the FRB’s action to reduce short-term rates in 2020, the Bank saw many of its interest-bearing deposit products reprice downward. This led to a decrease in the Company’s weighted average costs from 0.90% at year-end 2020 to 0.49% at year-end 2021. This caused the interest cost on most deposit products to decrease during 2021. However, the pace of interest expense savings was slowed during 2020 due to a lag in repricing on deposits. The Company can only benefit from lower CD interest expense to the extent that new CDs at lower rates could be issued. As CD rates continued to reprice downward, the Company experienced more of an interest expense savings in 2021 than in 2020. The Company’s repricing efforts continued in 2021 with a rate reduction to the Company’s prime investment deposit account, which had a significant impact in lowering money market expense during 2021. Lower rates on deposits also contributed to less of a consumer demand for CDs in 2021, which caused a shift into more NOW, savings and money market balances. This composition shift from higher-cost CDs to lower-cost NOW, savings and money market accounts helped to reduce the Company’s interest expense during 2021.
The Company’s interest expenses were also impacted by other borrowed money and subordinated debentures, which were down collectively by $14, or 1.9%, during the year ended 2022, and $215, or 22.9% during the year ended 2021. The decreases were primarily from the average balance decrease in FHLB borrowings caused by principal repayments during both 2021 and 2022. Partially offsetting the decreases from FHLB borrowings was an increase in the average cost of subordinated debentures, which grew from 1.86% in 2021 to 3.48% in 2022. The impact came from the rise in market rates during 2022 that had a corresponding effect to the rate tied to the subordinated debt.
During 2022, the Company’s net interest margin was positively impacted by the increasing market rates that contributed to higher earning asset yields. The positive impact from 2022’s interest rate increases by the FRB materially elevated interest income on earning assets during 2022. The margin was also positively impacted by a decrease in interest costs in 2022 due to the lagging effect in deposit rates, mostly from CDs, that significantly delayed upward cost adjustments in 2022. These factors contributed to an increase in the net interest margin from 3.61% in 2021 to 3.89% in 2022. The Company’s primary focus is to invest its funds into higher-yielding assets, particularly loans, as opportunities arise. However, if loan balances do not continue to expand and remain a larger component of overall earning assets, the Company will face pressure within its net interest income and margin improvement.
PROVISION EXPENSE
Credit risk is inherent in the business of originating loans. The Company sets aside an allowance for loan losses through charges to income, which are reflected in the consolidated statement of income as the provision for loan losses. Provision for loan loss is recorded to achieve an allowance for loan losses that is adequate to absorb losses in the Company’s loan portfolio. Management performs, on a quarterly basis, a detailed analysis of the allowance for loan losses that encompasses loan portfolio composition, loan quality, loan loss experience and other relevant economic factors.
During 2022, the Company recorded negative provision expense of $32, as compared to $419 in negative provision expense in 2021. The factors contributing most to the Company’s net recovery of provision expense during both years include decreases in certain economic risk factors, such as the level of classified loans, and the partial release of the COVID-19 reserve. These improvements contributed to lower general reserves during both 2022 and 2021. Partially offsetting these improvements were increases in net charge-offs, which were more impactful in reducing the net recovery of provision expense in 2022 compared to 2021.
During 2022, the Company experienced a $645 decrease in its COVID-19 reserve allocation. This risk factor was added in March 2020 and was necessary to account for the negative outlook of the pandemic, including increases in unemployment that could produce higher anticipated losses. Based on positive asset quality trends and lower net charge-offs, management released $645 of the reserve related to the COVID-19 risk factor in the first quarter of 2022, resulting in a corresponding decrease to both provision expense and the allowance for loan losses.
Excluding the impact from the COVID-19 risk factor, the Company also decreased its general allocations from $3,840 at December 31, 2021 to $3,071 at December 31, 2022, which resulted in lower provision expense during 2022. The Company’s general allocation evaluates several factors that include: loan volume, average historical loan loss trends, credit risk, regional unemployment conditions, asset quality, and changes in classified and criticized assets. Provision expense decreases arising from general allocations were impacted by a decrease in classified assets, as well as lower nonperforming loans that yielded less general allocations. Classified assets within the commercial loan portfolio decreased $6,548, or 70.6%, from year-end 2021 to year-end 2022. Furthermore, the Company’s nonperforming loans to total loans were 0.43% at year-end 2022, as compared to 0.56% at year-end 2021, while nonperforming assets to total assets were 0.31% at year-end 2022 and 0.37% at year-end 2021. Partially offsetting these factors was a negative impact to general allocations in 2022 associated with the Company’s historical loan loss factor. This was due to a normalizing effect on the average historical loan loss factor, which decreased by 6 basis points in 2021 compared to just a 1 basis point decrease in 2022. This resulted in less general reserves being released in 2022 compared to 2021, effectively causing the reduction in provision expense to be less impactful in 2022.
Further generating lower provision expense was a decrease in specific allocations. Specific allocations of the allowance for loan losses identify loan impairment by measuring fair value of the underlying collateral and the present value of estimated future cash flows. There was no net impact to provision expense in 2022 related to specific allocations, as compared to $10 in provision expense in 2021.
Partially offsetting the decreasing effects to provision expense mentioned above was a $924, or 358.1%, increase in net-charge offs on loans. The increase in net charge offs came mostly from the charge offs of two commercial and industrial loans totaling $613 in the second quarter of 2022 as part of a single borrower relationship. This required a corresponding increase to provision expense.
Also contributing to higher provision expense were increases in loan balances generally allocated for at December 31, 2022 compared to December 31, 2021. The risk associated with the increase in loans generated higher general reserves and a corresponding increase to provision expense.
Management believes that the allowance for loan losses was adequate at December 31, 2022, and reflected probable incurred losses in the portfolio. The allowance for loan losses was 0.60% of total loans at December 31, 2022, as compared to 0.78% at December 31, 2021. There can be no assurance, however, that adjustments to the allowance for loan losses will not be required in the future. Changes in the circumstances of particular borrowers, as well as adverse developments in the economy, could cause further increases in the required allowance for loan losses and require additional provision expense. Asset quality will continue to remain a key focus, as management continues to stress not just loan growth, but quality in loan underwriting as well. Future provisions to the allowance for loan losses will continue to be based on management’s quarterly in-depth evaluation that is discussed in further detail below under the caption “Critical Accounting Policies - Allowance for Loan Losses” within this Management’s Discussion and Analysis.
NONINTEREST INCOME
During 2022, total noninterest income increased $298, or 3.0%, as compared to 2021. The increase in noninterest revenue was primarily impacted by higher service charges on deposit accounts, which were up $579, or 31.1%, during 2022 over 2021. This was primarily from an increase in the volume of overdraft transactions during 2022.
Noninterest income was positively impacted by an increase in debit and credit card interchange income, which was up $218, or 4.7%, during 2022, as compared to 2021. Higher interchange income was impacted by an increase in consumer spending that led to a higher volume of transactions associated with the Company’s debit and credit card products.
Other noninterest income also increased $121, or 12.7%, during 2022, as compared to 2021. This was primarily impacted by a $186 increase in broker fees at Race Day for their portion of mortgage loan sales during 2022. Increases in other noninterest income also came from higher earnings on compensating balances as part of processing tax refunds, which increased $95 in 2022. Further increases also came from commercial loan servicing fees, which were up $44 during 2022. These increases were partially offset by the sale of bank owned property during 2021. The property sales from 2021 resulted in a $194 non-recurring gain, which included the sales of vacant land in Lawrence County, Ohio and a branch building in Jackson, Ohio, that had been acquired as part of the merger with the Milton Banking Company in 2016.
Partially offsetting the increases to noninterest income mentioned above were higher losses associated with the sales of investment securities. During the fourth quarter of 2022, the Company received proceeds of $10,963 from the sale of three securities totaling $12,500 at a weighted average yield of 1.22%. The lower-yielding securities were replaced with similar securities with a higher weighted average yield of 4.09%. The Company had repeated this strategy a year earlier during the fourth quarter of 2021, receiving proceeds of $47,666 from the sale of thirteen securities totaling $48,732 at a weighted average yield of 0.89%. The lower-yielding securities were replaced with similar securities with a higher weighted average yield of 1.30%. As a result, realized losses on the sale of securities totaled $1,537 in 2022, as compared to $1,066 in losses in 2021, lowering noninterest income by $471. While realized losses were incurred, the transactions are expected to increase future income and have a positive impact to the margin.
Noninterest income was also negatively impacted by a $157, or 18.4%, decrease in mortgage banking income affected by a lower volume of real estate loans sold to the secondary market in 2022. To help manage consumer demand for longer-term, fixed-rate real estate mortgages during a low interest rate environment, the Company will sell a portion of the real estate loan volume it originates during that period. The decision to sell long-term fixed-rate mortgages at lower rates would also help to minimize the interest rate risk exposure to rising rates. The large volume of mortgage refinancing experienced during the pandemic of 2020 began to normalize in 2021. As market rates increased in 2022, this had a negative effect on further lowering mortgage refinancing volume. As a result, the Bank’s mortgage banking income decreased $443 in 2022. Partially offsetting this decrease was Race Day’s growth in mortgage banking income, which increased $286 in 2022 due to an increase in volume of loan sales.
The Company’s remaining noninterest income categories increased $8, or 0.3%, during the year ended 2022, as compared to 2021. This was in large part due to higher trust income partially offset by lower earnings on bank owned life insurance and tax preparation fees.
NONINTEREST EXPENSE
Management continues to work diligently to minimize noninterest expense. For 2022, total noninterest expense increased $1,760, or 4.7%, as compared to 2021. The Company’s largest noninterest expense item, salaries and employee benefits, was limited to a $34, or 0.2%, decrease during 2022. Contributing most to this cost savings was the reevaluation of nonqualified benefit plan liabilities at year-end 2022. Based on higher market interest rates, the benefit plan liabilities were reduced, leading to a lump sum decrease in benefit expense in December 2022. As a result, the expense associated with the nonqualified benefit plans decreased $978 during 2022, as compared to 2021. Partially offsetting the decrease in benefit plan expense were higher salary expense, which was primarily related to the staffing of Race Day employees and to annual merit increases associated with the improved financial performance achieved in 2022.
Completely offsetting the decrease in salaries and employee benefit costs were higher marketing costs, increasing $602, or 72.9%, during 2022 compared to 2021. Marketing costs were largely impacted by specific donations made during the fourth quarter of 2022 to support the communities that we serve and reflective of our Community First mission. As a result, donation expenses increased $562 during 2022, while advertising and public relation expenses increased $40.
Data processing expense also increased $355, or 14.8%, during 2022. Higher costs in this category were the direct result of the volume increase in debit and credit card transactions, which increased processing costs.
The Company also experienced an increase in software expense during 2022, which was up $339, or 18.3%, over the year ended 2021. The increase was largely impacted by the associated software costs from Race Day, which included various software platforms and resources necessary to conduct business. Further increases came from various software purchases and enhancements at the Bank to further improve operational efficiencies in 2022.
Other noninterest expense increased $315, or 5.6%, during 2022 compared to 2021. This was primarily impacted by various other overhead costs from Race Day, which increased $467 during 2022. These costs include the expense associated with purchasing mortgage loan marketing leads and employee recruiting costs. Partially offsetting additional Race Day overhead expense was a nonrecurring prepayment penalty expense incurred from the prior year. During the fourth quarter of 2021, the Company redeemed $3,187 in long-term FHLB advances that had been used to fund fixed rate loans. The specific loans being funded were paid off, which permitted the Company to redeem the advances. By redeeming the advances, a prepayment penalty of $186 was incurred, which contributed to the increase in other noninterest expense during 2021.
The Company’s occupancy, furniture and equipment expenses were also up $148, or 5.1%, during 2022, as compared to 2021. This was primarily related to building repair and maintenance costs, as well as utility costs.
The remaining noninterest expense categories increased $35, or 1.7%, during the year-ended 2022, as compared to 2021.
The Company's efficiency ratio is defined as noninterest expense as a percentage of fully tax-equivalent net interest income plus noninterest income. The effects from provision expense are excluded from the efficiency ratio. Management continues to place emphasis on managing its balance sheet mix and interest rate sensitivity as well as developing more innovative ways to generate noninterest revenue. During 2022, the Company has benefited from an increase in earning asset yields and a decrease in the average costs on interest-bearing liabilities. The actions of the FRB to increase market rates have contributed to the asset yield improvement. Furthermore, the composition shift from lower yielding Federal Reserve Bank balances to higher yielding loans and securities has also had a positive impact to the net interest margin. These factors more than offset the decrease in PPP loan fees that were more impactful during 2021 than 2022. As a result, net interest income during the year ended 2022 has outperformed the net interest income results during the year ended 2021. Increases in overhead costs associated with Race Day, along with higher marketing, data processing and software costs have contributed to higher noninterest expense, which have increased 4.7% during the year ended 2022, compared to the year ended 2021. However, the increases in overhead expense, net of noninterest revenue, during the year ended 2022 are only partially offsetting the benefits of higher net interest earnings. As a result, the Company’s efficiency number decreased (improved) to 70.44% at December 31, 2022, from 72.59% at December 31, 2021.
PROVISION FOR INCOME TAXES
The provision for income taxes during 2022 totaled $2,594, compared to $2,284 in 2021. The effective tax rate for both 2022 and 2021 was 16.3%. The effective tax rate was unchanged in 2022 as a result of a lump sum adjustment that reduced costs associated with certain nondeductible retirement benefit plans during 2022, which lowered tax expense.
FINANCIAL CONDITION:
CASH AND CASH EQUIVALENTS
The Company’s cash and cash equivalents consist of cash, as well as interest- and non-interest bearing balances due from other banks. The amounts of cash and cash equivalents fluctuate on a daily basis due to customer activity and liquidity needs. At December 31, 2022, cash and cash equivalents decreased $106,044 to $45,990, compared to $152,034 at December 31, 2021. The decrease in cash and cash equivalents came mostly from lower interest-bearing deposits on hand with correspondent banks. At December 31, 2022, the Company’s interest-bearing FRB clearing account represented over 66% of cash and cash equivalents. The Company utilizes its interest-bearing FRB clearing account to manage excess funds, as well as to assist in funding earning asset growth. During 2022, the Company utilized a portion of its clearing account balances to reinvest in higher-yielding loans and investment securities. The interest rate paid on both the required and excess reserve balances of the FRB account is based on the targeted federal funds rate established by the Federal Open Market Committee. During 2022, the rate associated with the Company’s FRB clearing account increased 425 basis points due to rising inflationary concerns, resulting in a target federal funds rate range of 4.25% to 4.50%. The interest-bearing deposit balances in the FRB are 100% secured by the U.S. Government.
As liquidity levels continuously vary based on consumer activities, amounts of cash and cash equivalents can vary widely at any given point in time. The Company’s focus during periods of heightened liquidity will be to invest excess funds into longer-term, higher-yielding assets, primarily loans, when the opportunities arise. Further information regarding the Company’s liquidity can be found below under the caption “Liquidity” in this Management’s Discussion and Analysis.
CERTIFICATES OF DEPOSIT IN FINANCIAL INSTITUTIONS
At December 31, 2022, the Company had $1,862 in CDs owned by the Captive, down $467, or 20.1%, from year-end 2021. The deposits on hand at December 31, 2022, consist of eight certificates with remaining maturity terms ranging from less than four months up to nine months.
SECURITIES
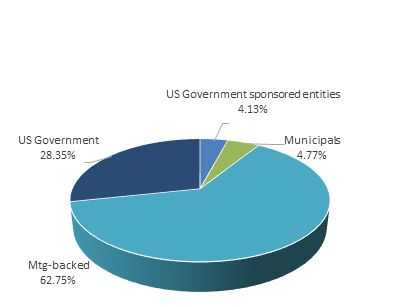
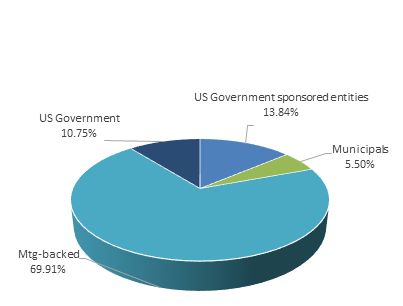
Management's goal in structuring its investment securities portfolio is to maintain a prudent level of liquidity and to provide an acceptable rate of return without sacrificing asset quality. During 2022, the balance of total securities increased $6,006, or 3.2%, compared to year-end 2021. The Company’s investment securities portfolio is made up mostly of Agency mortgage-backed securities, representing 62.8% of total investments at December 31, 2022. During the year ended 2022, the Company utilized a portion of its heightened excess deposits to purchase investment securities with the intent of minimizing the amount of funds being maintained within the lower-yielding interest-bearing FRB clearing account. This resulted in $29,470 of new Agency mortgage-backed securities, while receiving principal repayments of $22,891. The monthly repayment of principal has been the primary advantage of Agency mortgage-backed securities as compared to other types of investment securities, which deliver proceeds upon maturity or at a specified call date. The Company also used excess deposits to purchase $37,351 in U.S. Government securities, net of maturities.
Furthermore, during the fourth quarter of 2022, the Company received proceeds of $10,963 from the sale of three securities totaling $12,500. These securities carrying a weighted average yield of 1.22% were replaced with similar securities at a higher weighted average yield of 4.09%. While this sale and repurchase of securities resulted in a realized loss of $1,537 with little change to the balance of earning assets, the Company will benefit from the shift to higher-yielding securities that is expected to increase future income and have a positive impact to the margin.
In addition, the continued increases in long-term reinvestment rates during 2022 led to a $19,647 decrease in the fair value associated with the Company’s available for sale securities at December 31, 2022. The fair value of an investment security moves inversely to interest rates, so as reinvestment rates increased, the unrealized gain in the portfolio decreased. These changes in rates are typical and do not impact earnings of the Company as long as the securities are held to full maturity.
Investment Portfolio Composition
| |
at December 31, 2022
| at December 31, 2021
|
| |
| MATURING | |
As of December 31, 2022 | Within One Year | | After One but Within Five Years | | After Five but Within Ten Years | | After Ten Years | |
(dollars in thousands) | Amount | | Yield | | Amount | | Yield | | Amount | | Yield | | Amount | | Yield | |
| | | | | | | | | | | | | | | | |
U.S. Government securities | | $ | 4,928 | | | | 2.37 | % | | $ | 49,864 | | | | 2.30 | % | | $ | ---- | | | | ---- | | | $ | ---- | | | | ---- | |
U.S. Government sponsored entity securities | | | 1,993 | | | | 2.73 | % | | | 1,676 | | | | 1.89 | % | | | 4,314 | | | | 1.50 | % | | | ---- | | | | ---- | |
Obligations of states and political subdivisions | | | 787 | | | | 4.89 | % | | | 3,735 | | | | 3.02 | % | | | 1,976 | | | | 2.53 | % | | | 1,961 | | | | 2.81 | % |
Agency mortgage-backed securities, residential | | | 119 | | | | 3.37 | % | | | 62,658 | | | | 2.08 | % | | | 58,523 | | | | 1.47 | % | | | ---- | | | | ---- | |
Total securities | | $ | 7,827 | | | | 2.73 | % | | $ | 117,933 | | | | 2.20 | % | | $ | 64,813 | | | | 1.50 | % | | $ | 1,961 | | | | 2.81 | % |
Tax-equivalent adjustments of $47 have been made in calculating yields on obligations of states and political subdivisions using a 21% rate. Weighted average yields are calculated on the basis of the cost and effective yields weighted for the scheduled maturity of each security. Mortgage-backed securities, which have prepayment provisions, are assigned to a maturity category based on estimated average lives. Securities are shown at their fair values, which include the market value adjustments for available for sale securities.
Maturing securities provided the Company with sufficient liquidity in 2021 and 2022 so as to obviate the need for other sources of fundraising, such as debt offerings.
The Company’s focus will be to generate interest revenue primarily through loan growth, as loans generate the highest yields of total earning assets. Table III provides a summary of the securities portfolio by category and remaining contractual maturity. Issues classified as equity securities have no stated maturity date and are not included in Table III.
LOANS
In 2022, the Company's primary category of earning assets and most significant source of interest income, total loans, increased $53,858, or 6.5%, to $885,049. The increase in loan balances from year-end 2021 came primarily from the residential real estate and commercial and industrial loan portfolios, with other increases coming from the commercial real estate and consumer loan portfolios.
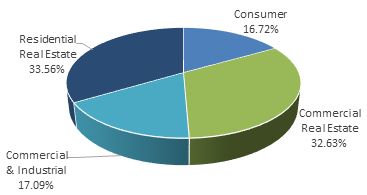
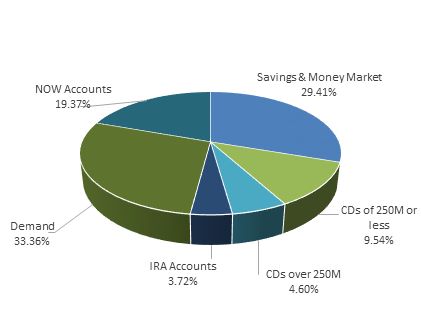
Generating residential real estate loans remains a significant focus of the Company’s lending efforts. The residential real estate loan portfolio represents the largest class of the Company's overall loan portfolio at 33.6% and consists primarily of one-to-four family residential mortgages and carries many of the same customer and industry risks as the commercial loan portfolio. The Company’s mortgage loan balances experienced significant declines during the previous year of 2021 after the mortgage refinancing period reached its peak in 2020. A larger volume of loan prepayments and payoffs in 2021 completely offset new mortgage loan originations during that time. These prepayments and payoffs of real estate loans continued in 2022, but were not as impactful as in 2021. Due to the rise in market rates in 2022, the Company experienced less opportunities to sell long-term fixed-rate residential mortgages to the Federal Home Loan Mortgage Corporation, which generated more loan origination opportunities for the Bank in 2022. As a result, residential real estate loans increased $22,611, or 8.2%, during 2022 as compared to year-end 2021. The increase in residential real estate loans was primarily from the Bank's warehouse lending volume. Warehouse lending consists of a line of credit provided by the Bank to another mortgage lender that makes loans for the purchase of one-to-four family residential real estate properties. The mortgage lender eventually sells the loans and repays the Bank. Warehouse lending increased from no balances at year-end 2021 to $19,158 at year-end 2022. The increase in market rates during 2022 had an impact on lowering loan volume within the long-term fixed-rate loan portfolio. This contributed to a shift into more short-term adjustable-rate mortgages (up $9,501) and less long-term fixed-rate mortgages (down $5,937) at year-end 2022.
Loan Portfolio Composition
| |
at December 31, 2022
| at December 31,2021
|
| |
Management continues to place emphasis on its commercial lending, which generally yields a higher return on investment as compared to other types of loans. The commercial lending segment increased $16,665, or 3.9%, from year-end 2021, which came mostly from commercial and industrial loans. Commercial and industrial loans consist of loans to corporate borrowers primarily in small to mid-sized industrial and commercial companies that include service, retail and wholesale merchants. Collateral securing these loans includes equipment, inventory, and stock. The commercial and industrial loan segment also included PPP loan balances that had a significant impact on average earning asset growth in 2021. The Company’s remaining PPP loans of $446 that were outstanding at year-end 2021 were paid off during the first quarter of 2022. During 2022, the commercial and industrial loan portfolio increased $9,707, or 6.9%, from year-end 2021. The growth was impacted by an increase in larger loan originations during the year.
The commercial real estate loan segment comprised the largest portion of the Company's total commercial loan portfolio at December 31, 2021, representing 65.6% of such portfolio. Commercial real estate consists of owner-occupied, nonowner-occupied and construction loans. Owner-occupied loans consist of nonfarm, nonresidential properties. A commercial owner-occupied loan is a borrower purchased building or space for which the repayment of principal is dependent upon cash flows from the ongoing operations conducted by the party, or an affiliate of the party, who owns the property. Owner-occupied loans of the Company include loans secured by hospitals, churches, and hardware and convenience stores. Nonowner-occupied loans are property loans for which the repayment of principal is dependent upon rental income associated with the property or the subsequent sale of the property, such as apartment buildings, condominiums, hotels and motels. These loans are primarily impacted by local economic conditions, which dictate occupancy rates and the amount of rent charged. Commercial construction loans are extended to individuals as well as corporations for the construction of an individual property or multiple properties and are secured by raw land and the subsequent improvements. Commercial real estate also includes loan participations with other banks outside the Company’s primary market area. Although the Company is not actively seeking to participate in loans originated outside its primary market area, it has taken advantage of the relationships it has with certain lenders in those areas where the Company believes it can profitably participate with an acceptable level of risk. Commercial real estate loans totaled $288,755 at December 31, 2022, an increase of $6,958, or 2.5%, over the balance of commercial real estate loans at year-end 2021. Most of this growth came from nonowner-occupied loan originations, with balances increasing $6,731, or 3.8%, from year-end 2021. Larger originations during 2022 also contributed to growth in the owner-occupied commercial loan portfolio, increasing $740, or 1.0%, from year-end 2021. Partially offsetting these increases were larger payoffs from construction loans related to one-to-four family residential homes, which decreased $513, or 1.5%, from year-end 2021.
While management believes lending opportunities exist in the Company's markets, future commercial lending activities will depend upon economic and related conditions, such as general demand for loans in the Company's primary markets, interest rates offered by the Company, the effects of competitive pressure and normal underwriting considerations.
| MATURITY AND REPRICING DATA OF LOANS | | | | | | | | | | | | | | | |
| As of December 31, 2022 | | | | | | | | | | | | | | | |
| Table IV | | | | | | | | | | | | | | | |
| | | | | | | | | | | | | | | | |
(dollars in thousands) | | | | | | | | | | | | | | | |
| | Within One Year | | | After One but Within Five Years | | | After Five but Within Fifteen Years | | | After Fifteen Years | | | Total | |
Residential real estate loans | | $ | 64,248 | | | $ | 168,505 | | | $ | 58,327 | | | $ | 5,956 | | | $ | 297,036 | |
Commercial real estate loans | | | 68,327 | | | | 194,484 | | | | 25,017 | | | | 927 | | | | 288,755 | |
Commercial and industrial loans | | | 44,346 | | | | 41,741 | | | | 41,024 | | | | 24,121 | | | | 151,232 | |
Consumer loans(1) | | | 48,682 | | | | 59,838 | | | | 39,506 | | | | ---- | | | | 148,026 | |
Total loans | | $ | 225,603 | | | $ | 464,568 | | | $ | 163,874 | | | $ | 31,004 | | | $ | 885,049 | |
Loans maturing or repricing after one year with: | | Variable Interest Rates | | | Fixed Interest Rates | | | Total | |
Residential real estate loans
| | $ | 178,211 | | | $ | 54,577 | | | $ | 232,788 | |
Commercial real estate loans
| | | 201,334 | | | | 19,094 | | | | 220,428 | |
Commercial and industrial loans
| | | 29,082 | | | | 77,804 | | | | 106,886 | |
Consumer loans(1) | | | 94 | | | | 99,250 | | | | 99,344 | |
Total loans
| | $ | 408,721 | | | $ | 250,725 | | | $ | 659,446 | |
(1) Includes automobile, home equity and other consumer loans.
The Company’s loan balances were also impacted by an increase in the consumer loan portfolio, which was up $14,582, or 10.9%, from year-end 2021. The Company’s consumer loans are primarily secured by automobiles, mobile homes, recreational vehicles and other personal property. Personal loans and unsecured credit card receivables are also included as consumer loans. Leading the growth in consumer loans was an increase in automobile loan balances of $6,631, or 13.8%, from year-end 2021. Automobile loans represent the Company’s largest consumer loan segment at 37.1% of total consumer loans. Automobile loans increased primarily due to a resurgence in consumer spending during 2022 that had been significantly impacted by the pandemic environment. During that time, automobile sales had been limited due to the lingering health concerns of COVID-19, as well as a reduction in available car inventory impacted by a chip shortage. As those situations have improved, the demand for auto loans has picked up in 2022. Consumer loans were also impacted by an increase of $5,416, or 24.2%, in home equity lines of credit during 2022. This was due in large part to the Company offering a new home equity line product with no closing costs beginning in the second quarter of 2022. Furthermore, as part of the Company’s efforts to invest the heightened levels of excess deposits, the Company purchased multiple pools of loans issued to healthcare professionals during the third quarter of 2022. In relation to the purchase of these loans, the other consumer loan segment increased $2,535, or 4.0%, from year-end 2021. The Company will continue to attempt to increase its auto lending segment while maintaining strict loan underwriting processes to limit future loss exposure. However, the Company will place more emphasis on loan portfolios (i.e. commercial and, to a smaller extent, residential real estate) with higher returns than auto loans. Indirect automobile loans bear additional costs from dealers that partially offset interest revenue and lower the rate of return.
The Company will continue to sell a portion of its long-term fixed-rate loans to the secondary market even though there is no significant demand for such loans under the current rising rate environment. Furthermore, the Company will continue to monitor the pace of its loan volume and will remain consistent in its approach to sound underwriting practices with a focus on asset quality.
ALLOWANCE FOR LOAN LOSSES
Tables V and VI have been provided to enhance the understanding of the loan portfolio and the allowance for loan losses. Management evaluates the adequacy of the allowance for loan losses quarterly based on several factors, including, but not limited to, general economic conditions, loan portfolio composition, prior loan loss experience, and management's estimate of probable incurred losses. Management continually monitors the loan portfolio to identify potential portfolio risks and to detect potential credit deterioration in the early stages, and then establishes reserves based upon its evaluation of these inherent risks. Actual losses on loans are reflected as reductions in the reserve and are referred to as charge-offs. The amount of the provision for loan losses charged to operating expenses is the amount necessary, in management's opinion, to maintain the allowance for loan losses at an adequate level that is reflective of probable and inherent loss. The allowance required is primarily a function of the relative quality of the loans in the loan portfolio, the mix of loans in the portfolio and the rate of growth of outstanding loans. Impaired loans, which include loans classified as TDRs, are considered in the determination of the overall adequacy of the allowance for loan losses.
ALLOCATION OF THE ALLOWANCE FOR LOAN LOSSES
Table V
| (dollars in thousands) | | | | | | |
| | | Years Ended December 31 | |
| | | 2022 | | | 2021 | |
Residential real estate loans | | $ | 681 | | | $ | 980 | |
Percentage of loans to total loans | | | 33.56 | % | | | 33.02 | % |
| Percentage of net charge-offs to average loans | | | -.01 | % | | | -.04 | % |
| | | | | | | | | |
Commercial real estate loans | | | 2,038 | | | | 2,548 | |
Percentage of loans to total loans | | | 32.63 | % | | | 33.90 | % |
| Percentage of net charge-offs to average loans | | | -.02 | % | | | -.07 | % |
| | | | | | | | | |
Commercial and industrial loans | | | 1,293 | | | | 1,571 | |
Percentage of loans to total loans | | | 17.09 | % | | | 17.03 | % |
| Percentage of net charge-offs to average loans | | | .38 | % | | | -.04 | % |
| | | | | | | | | |
Consumer loans(1) | | | 1,257 | | | | 1,384 | |
Percentage of loans to total loans | | | 16.73 | % | | | 16.05 | % |
| Percentage of net charge-offs to average loans | | | .50 | % | | | .45 | % |
| | | | | | | | | |
Allowance for loan losses | | $ | 5,269 | | | $ | 6,483 | |
Total loans percentage | | | 100.00 | % | | | 100.00 | % |
Net charge-offs to average loans | | | .14 | % | | | .03 | % |
The above allocation is based on estimates and subjective judgments and is not necessarily indicative of the specific amounts or loan categories in which losses may ultimately occur.
(1) Includes automobile, home equity and other consumer loans.
CREDIT RATIOS
Table VI
| (dollars in thousands) | | | | | | |
| | | Years Ended December 31 | |
| | | 2022 | | | 2021 | |
Loans | | $ | 885,049 | | | $ | 831,191 | |
Allowance for loan losses | | | 5,269 | | | | 6,483 | |
| Past due 90 days or more and still accruing | | | 538 | | | | 290 | |
Nonaccrual | | | 3,233 | | | | 4,346 | |
Allowance for loan losses to total loans | | | .60 | % | | | .78 | % |
Nonaccrual loans to total loans | | | .37 | % | | | .52 | % |
| Allowance for loan losses to nonaccrual loans | | | 162.98 | % | | | 149.17 | % |
Management formally considers placing a loan on nonaccrual status when collection of principal or interest has become doubtful. Furthermore, generally, a loan is not returned to accrual status unless either all delinquent principal or interest has been brought current or the loan becomes well secured and is in the process of collection.
Management continues to focus on improving asset quality and lowering credit risk while working to maintain its relationships with its borrowers. During 2022, the Company’s allowance for loan losses decreased $1,214, or 18.7%, to $5,269, compared to $6,483 at year-end 2021. As part of the Company’s quarterly analysis of the allowance for loan losses, management reviewed various factors that directly impact the general allocation needs of the allowance, which include: historical loan losses, loan delinquency levels, local economic conditions and unemployment rates, criticized/classified asset coverage levels and loan loss recoveries. During 2022, the Company experienced a $1,204 decrease in its general allocations of the allowance for loan losses. Contributing to this decrease were lower reserves associated with the COVID-19 risk factor. The Company added a COVID-19 risk factor in 2020 due to the negative economic outlook of the pandemic. Based on positive asset quality trends and lower net charge offs, management released $645 of the reserve related to the COVID-19 risk factor during the first quarter of 2022, resulting in a corresponding decrease in both provision expense and general allocations of the allowance for loan loss. Excluding the impact from the COVID-19 risk factor, the Company experienced a $559 decrease in general allocations of the allowance for loan losses. A lower historical loan loss factor and lower classified assets were the key factors to the year-to-date drop in general allocations. The historical loan loss factor decreased from 0.18% at year-end 2021 to 0.17% at year-end 2022, while the classified risk factor decreased as a result of various commercial loan upgrades from improvements in the financial performance of certain borrowers’ ability to repay their loans. During the second and third quarters of 2022, the Company experienced payoffs on two commercial loan relationships that had $8,019 in loans and committed balances, which reduced classified assets and released general reserves during 2022. Furthermore, the Company upgraded a single commercial loan relationship during the first quarter of 2022 totaling $2,232 from a classified to a criticized loan status, which also contributed to the release of general reserves during 2022. This contributed to lower classified assets from year-end 2021, particularly within the commercial real estate and commercial and industrial segments. Additionally, the Company’s delinquency levels decreased from year-end 2021, with nonperforming loans to total loans of 0.43% at December 31, 2022 compared to 0.56% at December 31, 2021, and lower nonperforming assets to total assets of 0.31% at December 31, 2022 compared to 0.37% at year-end 2021.
Specific allocations of the allowance for loan losses identify loan impairment by measuring fair value of the underlying collateral and the present value of estimated future cash flows. At year-end 2022, the Company identified no impairment on loans being specifically evaluated, as compared to $10 in impairment at year-end 2021. The change in specific reserves was related to the payoff on one commercial borrower during the third quarter of 2022 that led to the release of specific reserves.
At December 31, 2022, the ratio of the allowance for loan losses decreased to 0.60%, compared to 0.78% at December 31, 2021. Management believes that the allowance for loan losses at December 31, 2022, was adequate and reflected probable incurred losses in the loan portfolio. There can be no assurance, however, that adjustments to the allowance for loan losses will not be required in the future. Changes in the circumstances of particular borrowers, as well as adverse developments in the economy, are factors that could change, and management will make adjustments to the allowance for loan losses as needed. Asset quality will continue to remain a key focus of the Company, as management continues to stress not just loan growth, but also quality in loan underwriting. Future provisions to the allowance for loan losses will continue to be based on management’s quarterly in-depth evaluation that is discussed in further detail below under the caption “Critical Accounting Policies - Allowance for Loan Losses” within this Management’s Discussion and Analysis.
ASU No. 2016-13, “Financial Instruments-Credit Losses” is required to be adopted by smaller reporting companies by the fiscal year and interim periods beginning after December 15, 2022. The Company meets the requirements to be considered a smaller reporting company under SEC Regulation S-K and SEC Rule 405, and will adopt ASU 2016-13 effective January 1, 2023. ASU 2016-13 requires entities to replace the current “incurred loss” model with an “expected loss” model, which is referred to as the current expected credit loss (“CECL”) model. To implement the new standard, the Company established a cross-discipline governance structure, which included a dedicated working group and a CECL Committee consisting of members from different functions including Finance, Credit, Lending and Executive, who provided implementation oversight and reviewed policy elections, key assumptions, processes, and model results. The working group is responsible for the implementation process that includes developing the loan segmentation, data sourcing and validation, loss driver inputs, qualitative factors, parallel model runs, scenario testing and back testing.
The Company used a third-party vendor to assist in the implementation process of its new model to calculate credit losses over the estimated life of the applicable financial assets. The Company elected to use the discounted cash flow (“DCF”) methodology for the quantitative analysis for the majority of its loan segments. Management’s estimate of the allowance balance is using relevant and reliable available information, from internal and external sources, relating to past events, current condition, and reasonable and supportable forecasts of economic conditions. Forecast of economic conditions are based on forecasted unemployment and gross domestic product. Model assumptions include developing historical loss rates, prepayment rates and curtailment rates. In defining these model assumptions, the use of regional and national peer data was utilized. The development and validation of credit models also included determining the length of the reasonable and supportable forecast and regression period. The Company does not expect to record an allowance for credit losses for its available for sale securities at the date of adoption because it has not identified credit losses in that portfolio. However, a nominal allowance for credit losses will be established for held to maturity securities based on national historical loss rates for respective credit ratings for municipal securities as calculated by the major credit rating agencies.
The Company has completed parallel model runs, and continues to test and refine the credit loss models in parallel with the existing incurred loss approach. In addition, the Company is in process of finalizing the review of the most recent model run and certain assumptions, completing policies, procedures and control enhancements, and including model validation by another third-party vendor. The status of the Company's implementation has been periodically presented to the CECL Committee. The Company expects to recognize a one-time cumulative-effect adjustment to the allowance for credit losses as of the January 1, 2023 date of adoption of the new standard, which is estimated to be between $1.7 million and $2.5 million. The Company does not expect to record a material amount for off balance sheet commitments. The Company will be electing the three-year phase in option of the day-one impact of this standard to regulatory capital.
DEPOSITS
Deposits are used as part of the Company’s liquidity management strategy to meet obligations for depositor withdrawals, to fund the borrowing needs of loan customers, and to fund ongoing operations. Deposits, both interest- and noninterest-bearing, continue to be the most significant source of funds used by the Company to support earning assets. Deposits are attractive sources of funding because of their stability and general low cost as compared to other funding sources. The Company seeks to maintain a proper balance of core deposit relationships on hand while also utilizing various wholesale deposit sources, such as brokered and internet CD balances, as an alternative funding source to manage efficiently the net interest margin. Deposits are influenced by changes in interest rates, economic conditions and competition from other banks.
Total deposits consist mostly of “core” deposits, which include noninterest-bearing deposits, as well as interest-bearing demand, savings, and money market deposits. The Bank focuses on core deposit relationships with consumers from local markets who can maintain multiple accounts and services at the Bank. The Company believes such core deposits are more stable and less sensitive to changing interest rates and other economic factors. Total deposits decreased $32,253, or 3.0%, from year-end 2021 to $1,027,655 at December 31, 2022. The decrease was largely related to lower interest-bearing deposit balances, which were down $33,088, or 4.7%, from year-end 2021.
The decrease in interest-bearing deposits came primarily from lower time deposits, which include CDs and individual retirement accounts. Total time deposits decreased $37,363, or 19.7%, from year-end 2021. This decrease came largely from the Company’s retail time deposits, which decreased $22,465, or 13.4%, from year-end 2021 due to the consumer shift to savings products. While the the FRB increased short-term rates by 425 basis points due to inflationary concerns, there was a lagging effect to the repricings of CD rate offerings, which contributed to the decrease in consumer demand for CDs during 2022. Futher decreasing time deposit balances were lower wholesale time deposits. While the Company's preference is to fund earning asset demand with retail core deposits, wholesale deposits are utilized to help satisfy earning asset growth. Due to the heightened liquidity position from year-end 2021, brokered and internet CD issuances decreased $14,898, or 67.3%. The Company will continue to evaluate its use of wholesale deposits to manage the Company’s liquidity position and interest rate risk associated with longer-term, fixed-rate asset loan demand.
Decreases in interest-bearing time deposit balances were partially offset by a $7,713, or 5.3%, increase in the Company’s other savings accounts. Growth in these balances came primarily from higher statement savings account balances impacted by the lagging effect to deposit repricings that produced maturity runoff of CDs during 2022. NOW account balances were also up $4,396, or 2.1%, from year-end 2021, largely driven by higher municipal NOW product balances within the Gallia County, Ohio, and Mason County, West Virginia, market areas. These increases to interest-bearing deposits were partially offset by lower money market account balances, which were down $7,833, or 4.8%, from year-end 2021. The deposit rate on the Company’s Prime Investment money market account had been reduced during 2021 in response to decreasing market rates in 2020, and the rate remained flat in 2022 during the rise in market rates. This contributed to a consumer shift from money market deposits into more savings and noninterest-bearing deposit accounts.
Composition of Total Deposits
| |
at December 31, 2022
| at December 31, 2021
|
| |
Total deposits during 2022 benefited from higher noninterest-bearing balances, which increased $835, or 0.2%, from year-end 2021. The increase came mostly from the Company’s business and incentive-based checking account balances.
The Company expects to continue to experience increased competition for deposits in its market areas, which could challenge its net growth. The Company will continue to emphasize growth and retention within its core deposit relationships during 2023, reflecting the Company’s efforts to reduce its reliance on higher cost funding and improving net interest income.
OTHER BORROWED FUNDS
The Company also accesses other funding sources, including short-term and long-term borrowings, to fund potential asset growth and satisfy short-term liquidity needs. Other borrowed funds consist primarily of FHLB advances and promissory notes. During 2022, other borrowed funds were down $1,669, or 8.5%, from year-end 2021. The decrease was related primarily to the principal repayments applied to various FHLB advances during the first quarter of 2022. While deposits continue to be the primary source of funding for growth in earning assets, management will continue to utilize FHLB advances and promissory notes to help manage interest rate sensitivity and liquidity.
SUBORDINATED DEBENTURES
The Company received proceeds from the issuance of one trust preferred security on March 22, 2007, totaling $8,500 at a fixed rate of 6.58%. The trust preferred security is now at an adjustable rate equal to the 3-month LIBOR plus 1.68%. The Company does not report the securities issued by the trust as a liability, but instead, reports as a liability the subordinated debenture issued by the Company and held by the trust.
OFF-BALANCE SHEET ARRANGEMENTS
As discussed in Notes I and L to the financial statements at December 31, 2022 and 2021, the Company engages in certain off-balance sheet credit-related activities, including commitments to extend credit and standby letters of credit, which could require the Company to make cash payments in the event that specified future events occur. Commitments to extend credit are agreements to lend to a customer as long as there is no violation of any condition established in the contract. Commitments generally have fixed expiration dates or other termination clauses and may require payment of a fee. Standby letters of credit are conditional commitments to guarantee the performance of a customer to a third party. While these commitments are necessary to meet the financing needs of the Company’s customers, many of these commitments are expected to expire without being drawn upon. Therefore, the total amount of commitments does not necessarily represent future cash requirements. Management does not anticipate that the Company’s current off-balance sheet activities will have a material impact on the results of operations or financial condition.
CAPITAL RESOURCES
Federal regulators have classified and defined capital into the following components: (i) Tier 1 capital, which includes tangible shareholders’ equity for common stock, qualifying preferred stock and certain qualifying hybrid instruments, and (ii) Tier 2 capital, which includes a portion of the allowance for loan losses, certain qualifying long-term debt, preferred stock and hybrid instruments which do not qualify as Tier 1 capital.
In September 2019, consistent with Section 201 of the Economic Growth, Regulatory Relief, and Consumer Protection Act, the federal banking agencies issued a final rule providing simplified capital requirements for certain community banking organizations (banks and holding companies). Under the rule, a qualifying community banking organization (“QCBO”) is eligible to opt into the Community Bank Leverage Ratio (“CBLR”) framework in lieu of the Basel III capital requirements if it has less than $10 billion in total consolidated assets, limited amounts of certain trading assets and liabilities, limited amounts of off-balance sheet exposure and a leverage ratio greater than 9.0%. The new rule took effect January 1, 2020, and QCBOs were allowed to opt into the new CBLR framework in their Call Report beginning the first quarter of 2020.
A QCBO opting into the CBLR framework must maintain a CBLR of 9.0%, subject to a two quarter grace period to come back into compliance, provided that the QCBO maintains a leverage ratio of more than 8.0% during the grace period. A QCBO failing to satisfy these requirements must comply with the existing Basel III capital requirements as implemented by the banking regulators in July 2013.
The numerator of the CBLR is Tier 1 capital, as calculated under present rules. The denominator of the CBLR is the QCBO’s average assets, calculated in accordance with the QCBO’s Call Report instructions and less assets deducted from Tier 1 capital.
The Bank opted into the CBLR, and will, therefore, not be required to comply with the Basel III capital requirements. As of December 31, 2022, the Bank’s CBLR was 11.0%.
Pursuant to the CARES Act, the federal banking regulators in April 2020 issued interim final rules to set the CBLR at 8% beginning in the second quarter of 2020 through the end of 2020. Beginning in 2021, the CBLR increased to 8.5% for the calendar year. Community banks had until January 1, 2022 before the CBLR requirement returned to 9%.
As detailed in Note P to the financial statements at December 31, 2022, the Bank was deemed to be “well capitalized” under applicable prompt corrective action regulations. The Company's total shareholders' equity at December 31, 2022 of $135,028 decreased $6,328, or 4.5%, as compared to $141,356 at December 31, 2021. Capital grew during 2022 primarily from year-to-date net income of $13,338, less dividends paid of $4,720. This net growth was more than offset by a $15,521 after-tax decrease in net unrealized gains on available for sale securities from year-end 2021, as long-term reinvestment rates increased during most of 2022 causing a decrease in the fair value of the Company’s available for sale investment portfolio.
LIQUIDITY
Liquidity relates to the Company's ability to meet the cash demands and credit needs of its customers and is provided by the ability to readily convert assets to cash and raise funds in the market place. Total cash and cash equivalents, held to maturity securities maturing within one year, and available for sale securities, which totaled $230,853, represented 19.1% of total assets at December 31, 2022 compared to $329,264 and 26.3% of total assets at December 31, 2021. The COVID-19 pandemic had a significant impact on higher levels of excess funds during 2021 and 2022, which included customer deposits of stimulus monies from various government relief programs. To further enhance the Bank’s ability to meet liquidity demands, the FHLB offers advances to the Bank. At December 31, 2022, the Bank could borrow an additional $92,254 from the FHLB. Furthermore, the Bank has established a borrowing line with the Federal Reserve. At December 31, 2022, this line had total availability of $56,332. Lastly, the Bank also has the ability to purchase federal funds from a correspondent bank. For further cash flow information, see the condensed consolidated statement of cash flows above. Management does not rely on any single source of liquidity and monitors the level of liquidity based on many factors affecting the Company’s financial condition.
INFLATION
Consolidated financial data included herein has been prepared in accordance with US GAAP. Presently, US GAAP requires the Company to measure financial position and operating results in terms of historical dollars with the exception of securities available for sale, which are carried at fair value. Changes in the relative value of money due to inflation or deflation are generally not considered.
In management's opinion, changes in interest rates affect the financial institution to a far greater degree than changes in the inflation rate. While interest rates are greatly influenced by changes in the inflation rate, they do not change at the same rate or in the same manner as the inflation rate. Rather, interest rate volatility is based on changes in the expected rate of inflation, as well as monetary and fiscal policies. A financial institution's ability to be relatively unaffected by changes in interest rates is a good indicator of its capability to perform in today's volatile economic environment. The Company seeks to insulate itself from interest rate volatility by ensuring that rate sensitive assets and rate sensitive liabilities respond to changes in interest rates in a similar time frame and to a similar degree.
CRITICAL ACCOUNTING POLICIES
The most significant accounting policies followed by the Company are presented in Note A to the consolidated financial statements. These policies, along with the disclosures presented in the other financial statement notes, provide information on how significant assets and liabilities are valued in the financial statements and how those values are determined. Management views critical accounting policies to be those that are highly dependent on subjective or complex judgments, estimates, and assumptions, and where changes in those estimates and assumptions could have a significant impact on the financial statements. Management currently views the adequacy of the allowance for loan losses and goodwill to be critical accounting policies.
Allowance for Loan Losses:
The allowance for loan losses is a valuation allowance for probable incurred credit losses. Loan losses are charged against the allowance when management believes the uncollectibility of a loan balance is confirmed. Subsequent recoveries, if any, are credited to the allowance. Management estimates the allowance balance required using past loan loss experience, the nature and volume of the portfolio, information about specific borrower situations and estimated collateral values, economic conditions, and other factors. Allocations of the allowance may be made for specific loans, but the entire allowance is available for any loan that, in management’s judgment, should be charged off.
The allowance consists of specific and general components. The specific component relates to loans that are individually classified as impaired. A loan is impaired when, based on current information and events, it is probable that the Company will be unable to collect all amounts due according to the contractual terms of the loan agreement. Impaired loans generally consist of loans with balances of $200 or more on nonaccrual status or nonperforming in nature. Loans for which the terms have been modified, and for which the borrower is experiencing financial difficulties, are considered troubled debt restructurings and classified as impaired.
Factors considered by management in determining impairment include payment status, collateral value, and the probability of collecting scheduled principal and interest payments when due. Loans that experience insignificant payment delays and payment shortfalls generally are not classified as impaired. Management determines the significance of payment delays and payment shortfalls on a case-by-case basis, taking into consideration all of the circumstances surrounding the loan and the borrower, including the length and reasons for the delay, the borrower’s prior payment record, and the amount of shortfall in relation to the principal and interest owed.
Commercial and commercial real estate loans are individually evaluated for impairment. If a loan is impaired, a portion of the allowance is allocated so that the loan is reported, net, at the present value of estimated future cash flows using the loan’s existing rate or at the fair value of collateral if repayment is expected solely from the collateral. Smaller balance homogeneous loans, such as consumer and most residential real estate, are collectively evaluated for impairment, and accordingly, they are not separately identified for impairment disclosure. Troubled debt restructurings are measured at the present value of estimated future cash flows using the loan’s effective rate at inception. If a troubled debt restructuring is considered to be a collateral dependent loan, the loan is reported, net, at the fair value of the collateral. For troubled debt restructurings that subsequently default, the Company determines the amount of reserve in accordance with the accounting policy for the allowance for loan losses.
The general component covers non-impaired loans and impaired loans that are not individually reviewed for impairment and is based on historical loss experience adjusted for current factors. The historical loss experience is determined by portfolio segment and is based on the actual loss history experienced by the Company over the most recent 3 years for the consumer and real estate portfolio segment and 5 years for the commercial portfolio segment. The total loan portfolio's actual loss experience is supplemented with other economic factors based on the risks present for each portfolio segment. These economic factors include consideration of the following: levels of and trends in delinquencies and impaired loans; levels of and trends in charge-offs and recoveries; trends in volume and terms of loans; effects of any changes in risk selection and underwriting standards; other changes in lending policies, procedures, and practices; experience, ability, and depth of lending management and other relevant staff; national and local economic trends and conditions; industry conditions; and effects of changes in credit concentrations. During the second quarter of 2022, the Company established a new economic risk factor for certain risks that may impact the loan portfolio, such as elevated inflation, increasing interest rates, slowing housing starts, declining GDP, and negative employment trends. The following portfolio segments have been identified: Commercial Real Estate, Commercial and Industrial, Residential Real Estate, and Consumer.
Commercial and industrial loans consist of borrowings for commercial purposes to individuals, corporations, partnerships, sole proprietorships, and other business enterprises. Commercial and industrial loans are generally secured by business assets such as equipment, accounts receivable, inventory, or any other asset excluding real estate and generally made to finance capital expenditures or operations. The Company’s risk exposure is related to deterioration in the value of collateral securing the loan should foreclosure become necessary. Generally, business assets used or produced in operations do not maintain their value upon foreclosure, which may require the Company to write-down the value significantly to sell.
Commercial real estate consists of nonfarm, nonresidential loans secured by owner-occupied and nonowner-occupied commercial real estate as well as commercial construction loans. An owner-occupied loan relates to a borrower purchased building or space for which the repayment of principal is dependent upon cash flows from the ongoing business operations conducted by the party, or an affiliate of the party, who owns the property. Owner-occupied loans that are dependent on cash flows from operations can be adversely affected by current market conditions for their product or service. A nonowner-occupied loan is a property loan for which the repayment of principal is dependent upon rental income associated with the property or the subsequent sale of the property. Nonowner-occupied loans that are dependent upon rental income are primarily impacted by local economic conditions which dictate occupancy rates and the amount of rent charged. Commercial construction loans consist of borrowings to purchase and develop raw land into one-to-four family residential properties. Construction loans are extended to individuals as well as corporations for the construction of an individual or multiple properties and are secured by raw land and the subsequent improvements. Repayment of the loans to real estate developers is dependent upon the sale of properties to third parties in a timely fashion upon completion. Should there be delays in construction or a downturn in the market for those properties, there may be significant erosion in value which may be absorbed by the Company.
| | 2022 | | | 2021 | | | 2020 | | | 2019 | | | 2018 | |
| | | | | | | | | | | | | | | | |
Return on average assets | | | 1.06 | % | | | .95 | % | | | .94 | % | | | .96 | % | | | 1.12 | % |
Return on average equity | | | 9.86 | % | | | 8.45 | % | | | 7.83 | % | | | 8.10 | % | | | 10.63 | % |
Dividend payout ratio | | | 35.39 | % | | | 34.25 | % | | | 39.20 | % | | | 40.37 | % | | | 33.20 | % |
Average equity to average assets | | | 10.78 | % | | | 11.25 | % | | | 11.95 | % | | | 11.82 | % | | | 10.57 | % |
Residential real estate loans consist of loans to individuals for the purchase of one-to-four family primary residences with repayment primarily through wage or other income sources of the individual borrower. The Company’s loss exposure to these loans is dependent on local market conditions for residential properties as loan amounts are determined, in part, by the fair value of the property at origination.
Consumer loans are comprised of loans to individuals secured by automobiles, open-end home equity loans and other loans to individuals for household, family, and other personal expenditures, both secured and unsecured. These loans typically have maturities of 6 years or less with repayment dependent on individual wages and income. The risk of loss on consumer loans is elevated as the collateral securing these loans, if any, rapidly depreciate in value or may be worthless and/or difficult to locate if repossession is necessary. During the last several years, one of the most significant portions of the Company’s net loan charge-offs have been from consumer loans. Nevertheless, the Company has allocated the highest percentage of its allowance for loan losses as a percentage of loans to the other identified loan portfolio segments due to the larger dollar balances associated with such portfolios.
CONCENTRATIONS OF CREDIT RISK
The Company maintains a diversified credit portfolio, with residential real estate loans currently comprising the most significant portion. Credit risk is primarily subject to loans made to businesses and individuals in southeastern Ohio and western West Virginia. Management believes this risk to be general in nature, as there are no material concentrations of loans to any industry or consumer group. To the extent possible, the Company diversifies its loan portfolio to limit credit risk by avoiding industry concentrations.