To the Shareholders and Board of Directors
Ohio Valley Banc Corp.
Gallipolis, Ohio
Opinion on the Financial Statements
We have audited the accompanying consolidated statements of condition of Ohio Valley Banc Corp. (the “Company”) as of December 31, 2023 and 2022, the related consolidated statements of income, comprehensive income, change in shareholders’ equity, and cash flows for the years then ended, and the related notes (collectively referred to as the “financial statements”). In our opinion, the financial statements present fairly, in all material respects, the financial position of the Company as of December 31, 2023 and 2022, and the results of its operations and its cash flows for the years then ended in conformity with accounting principles generally accepted in the United States of America.
Change in Accounting Principle
As discussed in Note A to the financial statements, the Company has changed its method of accounting for credit losses effective January 1, 2023, due to the adoption of ASU 2016-13 Financial Instruments – Credit Losses (Topic 326): Measurement of Credit Losses on Financial Instruments. The Company adopted the new credit loss standard using the modified retrospective method such that prior period amounts are not adjusted and continue to be reported in accordance with previously applicable generally accepted accounting principles. The adoption of the new credit loss standard and its subsequent application is also communicated as a critical audit matter below.
Basis for Opinion
These financial statements are the responsibility of the Company’s management. Our responsibility is to express an opinion on the Company’s financial statements based on our audits. We are a public accounting firm registered with the Public Company Accounting Oversight Board (United States) (“PCAOB”) and are required to be independent with respect to the Company in accordance with the U.S. federal securities laws and the applicable rules and regulations of the Securities and Exchange Commission and the PCAOB.
We conducted our audits in accordance with the standards of the PCAOB. Those standards require that we plan and perform the audit to obtain reasonable assurance about whether the financial statements are free of material misstatement, whether due to error or fraud. Our audits included performing procedures to assess the risks of material misstatement of the financial statements, whether due to error or fraud, and performing procedures that respond to those risks. Such procedures included examining, on a test basis, evidence regarding the amounts and disclosures in the financial statements. Our audits also included evaluating the accounting principles used and significant estimates made by management, as well as evaluating the overall presentation of the financial statements. We believe that our audits provide a reasonable basis for our opinion.
Critical Audit Matter
The critical audit matter communicated below is a matter arising from the current period audit of the financial statements that was communicated or required to be communicated to the audit committee and that: (1) relates to accounts or disclosures that are material to the financial statements and (2) involved our especially challenging, subjective, or complex judgments. The communication of the critical audit matter does not alter in any way our opinion on the financial statements, taken as a whole, and we are not, by communicating the critical audit matter below, providing a separate opinion on the critical audit matter or on the accounts or disclosures to which it relates.
Allowance for Credit Losses on Loans – Initial Adoption of Allowance for Credit Losses Model
In accordance with Accounting Standards Update 2016-13, Financial Instruments —Credit Losses (Topic 326): Measurement of Credit Losses on Financial Instruments (the “ASU”), the Company adopted Accounting Standards Codification (“ASC”) 326 as of January 1, 2023, as described in Note A and C of the consolidated financial statements. See also the change in accounting principle explanatory paragraph above. The ASU requires credit losses on loans to be measured using an expected credit loss model (referred to as the current expected credit loss (CECL) model) which estimates credit losses over the expected life of the loan. Estimates of expected credit losses are based on historical experience, adjusted for management's evaluation of current conditions and reasonable and supportable forecasts. As it relates to the allowance for credit losses for loans, the impact of adoption of this standard on January 1, 2023, was a $2.2 million increase to the allowance for credit losses, with a net decrease of $2.2 million to retained earnings for the cumulative effect adjustment recorded upon adoption.
The Company measures the ACL on a collective (pool) basis when similar risk characteristics exist using a Cumulative Undiscounted Expected Loss model. Historical credit loss experience is the basis for the estimation of expected credit losses. The Company applies historical loss rates to pools of loans with similar risk characteristics. In defining historical loss rates, prepayment rates and curtailment rates used to determine the expected life of loans, the use of regional and national peer data was used. After consideration of the historic loss calculation, management applied qualitative adjustments to reflect the current conditions and reasonable and supportable forecasts not already reflected in the historical loss information at the balance sheet date. The Company’s reasonable and supportable forecast adjustment is based on the national unemployment rate and the national gross domestic product forecast for the first year. For periods beyond the reasonable and supportable forecast, the Company deploys reversion to historical loss rates utilizing a straight-line method over a two-year period.
Auditing the initial adoption of the Cumulative Undiscounted Expected Loss model was identified by us as a critical audit matter because of the significant auditor judgment and effort needed to evaluate the complex judgments made by management related to the appropriateness of the model, including the reasonable and supportable forecast adjustments, with the need to use our valuation specialists.
The primary procedures performed to address the critical audit matter included:
| • | With the assistance of our valuation specialists, evaluating the appropriateness and conceptual design of the Cumulative Undiscounted Expected Loss model including the evaluation of the reasonable and supportable forecast adjustments and the mathematical accuracy of the model. |
| • | Evaluating of the relevance and reliability of data used in the model development and the determination of reasonable and supportable forecast adjustments
|
| | /s/Crowe LLP
|
| | Crowe LLP
|
| | |
We have served as the Company’s auditor since 1992. | | |
| | |
Cleveland, Ohio | | |
March 15, 2024 | | |
Board of Directors and Shareholders
Ohio Valley Banc Corp.
The management of Ohio Valley Banc Corp. (the Company) is responsible for establishing and maintaining adequate internal control over financial reporting as defined in Rules 13a-15(f) and 15d-15(f) under the Securities Exchange Act of 1934. The Company’s internal control over financial reporting is designed to provide reasonable assurance regarding the reliability of financial reporting and the preparation of financial statements for external purposes in accordance with generally accepted accounting principles. The Company’s internal control over financial reporting includes those policies and procedures that: (i) pertain to the maintenance of records that, in reasonable detail, accurately and fairly reflect the transactions and dispositions of the assets of the Company; (ii) provide reasonable assurance that transactions are recorded as necessary to permit preparation of financial statements in accordance with generally accepted accounting principles, and that receipts and expenditures of the Company are being made only in accordance with authorizations of management and directors of the Company; and (iii) provide reasonable assurance regarding prevention or timely detection of unauthorized acquisition, use or disposition of the Company’s assets that could have a material effect on the financial statements.
The system of internal control over financial reporting as it relates to the consolidated financial statements is evaluated for effectiveness by management. Because of its inherent limitations, internal control over financial reporting may not prevent or detect misstatements. Also, projections of any evaluation of effectiveness to future periods are subject to the risk that controls may become inadequate because of changes in conditions, or that the degree of compliance with the policies or procedures may deteriorate.
Management assessed the Company’s system of internal control over financial reporting as of December 31, 2023, in relation to criteria for effective internal control over financial reporting as described in the 2013 “Internal Control Integrated Framework,” issued by the Committee of Sponsoring Organizations of the Treadway Commission (COSO). Based on this assessment, management concluded that, as of December 31, 2023, its system of internal control over financial reporting is effective and meets the criteria of the “Internal Control Integrated Framework.”
Ohio Valley Banc Corp.
| |
Larry E. Miller, II President and Chief Executive Officer | Scott W. Shockey Senior Vice President, CFO |
| | |
| March 15, 2024 | |
FORWARD LOOKING STATEMENTS
Certain statements contained in this report and other publicly available documents incorporated herein by reference constitute “forward looking statements” within the meaning of Section 27A of the Securities Act of 1933, as amended, and Section 21E of the Securities Act of 1934, as amended (the “Exchange Act”), and as defined in the Private Securities Litigation Reform Act of 1995. Such statements are often, but not always, identified by the use of such words as “believes,” “anticipates,” “expects,” “intends,” “plan,” “goal,” “seek,” “project,” “estimate,” “strategy,” “future,” “likely,” “may,” “should,” “will,” and other similar expressions. Such statements involve various important assumptions, risks, uncertainties, and other factors, many of which are beyond our control, and which could cause actual results to differ materially from those expressed in such forward looking statements. These factors include, but are not limited to: unexpected changes in interest rates or disruptions in the mortgage market; changes in political, economic or other factors, such as inflation rates, recessionary or expansive trends, taxes, the effects of implementation of legislation and the continuing economic uncertainty in various parts of the world; competitive pressures; fluctuations in interest rates; the level of defaults and prepayment on loans made by Ohio Valley Banc Corp. (“Ohio Valley”) and its direct and indirect subsidiaries (collectively, the “Company”); unanticipated litigation, claims, or assessments; fluctuations in the cost of obtaining funds to make loans; and regulatory changes. Additional detailed information concerning such factors is available in the Company’s filings with the Securities and Exchange Commission, under the Exchange Act, including the disclosure under the heading “Item 1A. Risk Factors” of Part I of the Company’s Annual Report on Form 10-K for the fiscal year ended December 31, 2023. Readers are cautioned not to place undue reliance on such forward looking statements, which speak only as of the date hereof. The Company undertakes no obligation and disclaims any intention to republish revised or updated forward looking statements, whether as a result of new information, unanticipated future events or otherwise.
ANALYSIS OF FINANCIAL CONDITION AND RESULTS OF OPERATIONS
The purpose of this discussion is to provide an analysis of the financial condition and results of operations of the Company that is not otherwise apparent from the audited consolidated financial statements included in this report. The accompanying consolidated financial information has been prepared by management in conformity with U.S. generally accepted accounting principles (“US GAAP”) and is consistent with that reported in the consolidated financial statements. Reference should be made to those statements and the selected financial data presented elsewhere in this report for an understanding of the following tables and related discussion. All dollars are reported in thousands, except share and per share data.
BUSINESS OVERVIEW:
The following discussion on consolidated financial statements include the accounts of Ohio Valley and its wholly-owned subsidiaries, The Ohio Valley Bank Company (the “Bank”), Loan Central, Inc., a consumer finance company (“Loan Central”), and Ohio Valley Financial Services Agency, LLC, an insurance agency. The Bank has one wholly-owned subsidiary, Ohio Valley REO, LLC, an Ohio limited liability company. In December 2023, Ohio Valley ceased operating Race Day Mortgage, Inc. (“Race Day”), which had been a wholly-owned subsidiary of the Bank since April 2021. The decision to cease operating Race Day was made due to low loan demand, poor employee retention, and lack of profitability. In December 2023, Ohio Valley also ceased operating OVBC Captive, Inc. (the “Captive”), which had been a subsidiary of Ohio Valley since July 2014. The decision to cease operating the Captive was the result of proposed IRS regulations that adversely impacted the taxation of small captives and severely limited the Captive’s ability to operate. Ohio Valley and its subsidiaries are collectively referred to herein as the “Company.”
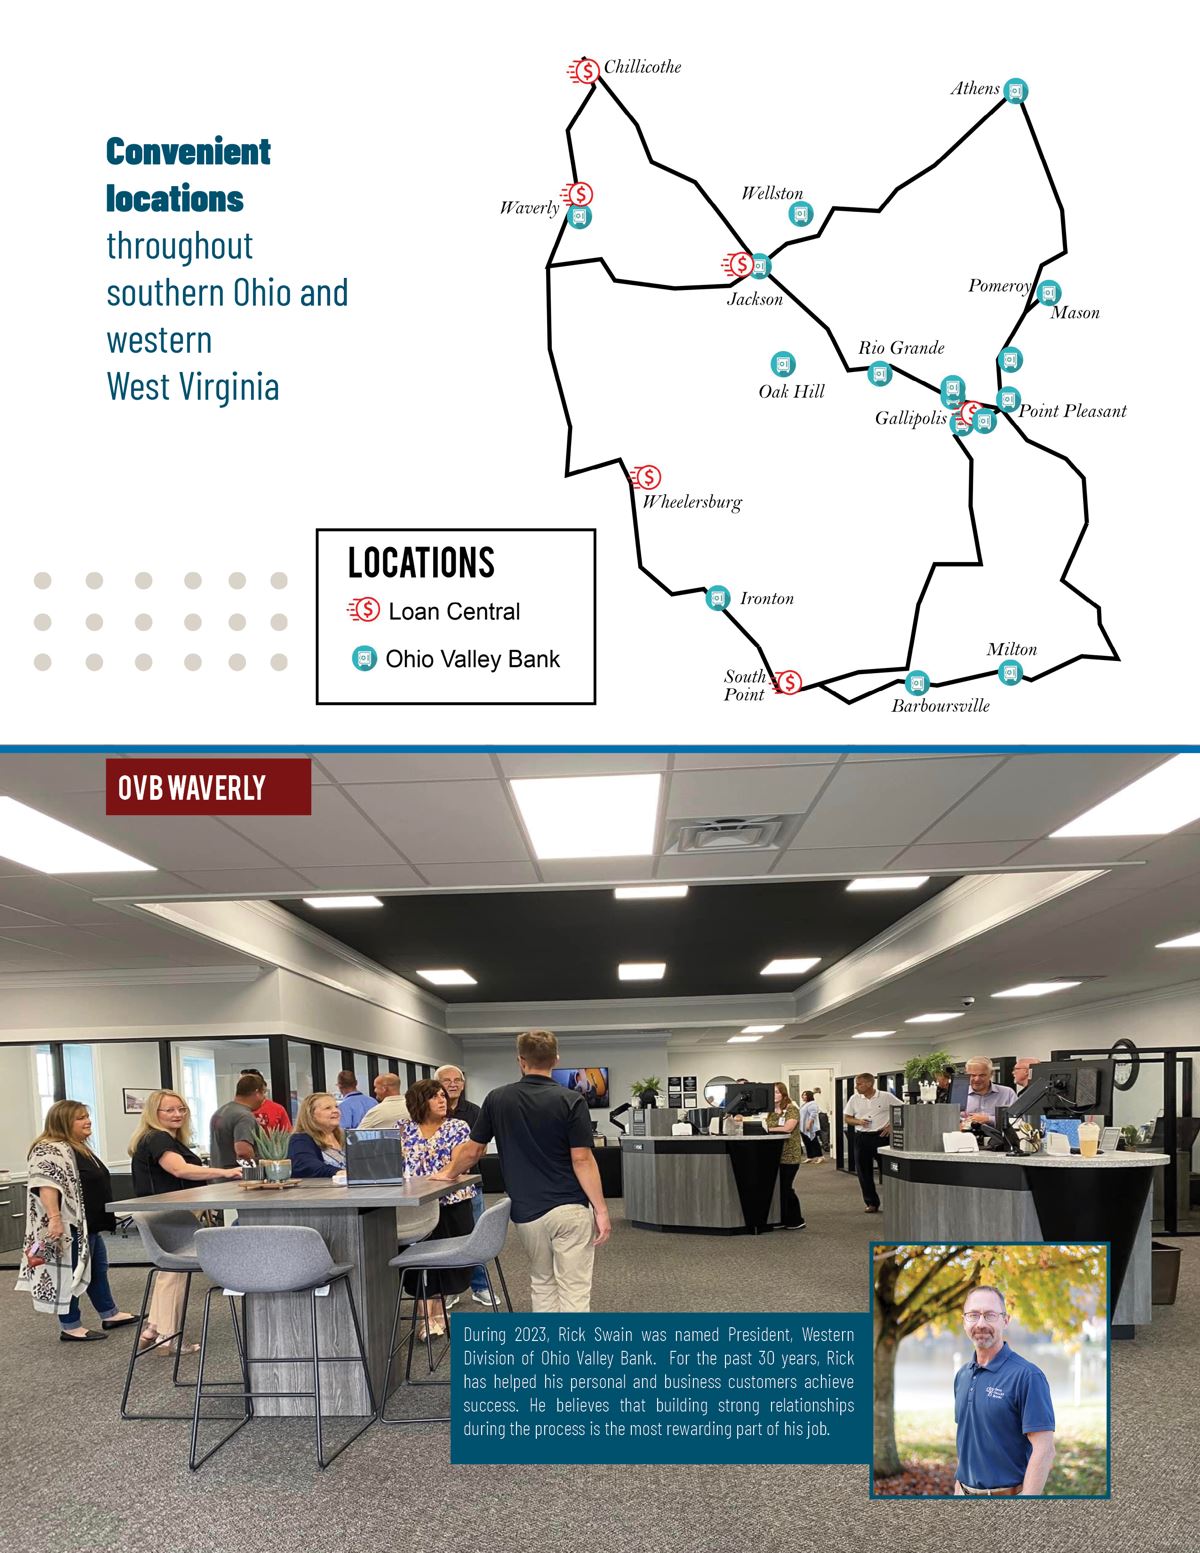
The Company is primarily engaged in commercial and retail banking, offering a blend of commercial and consumer banking services within southeastern Ohio as well as western West Virginia. The banking services offered by the Bank include the acceptance of deposits in checking, savings, time and money market accounts; the making and servicing of personal, commercial, floor plan and student loans; the making of construction and real estate loans; and credit card services. The Bank also offers individual retirement accounts, safe deposit boxes, wire transfers and other standard banking products and services. Furthermore, the Bank offers Tax Refund Advance Loans (“TALs”) to Loan Central tax customers. A TAL represents a short-term loan offered by the Bank to tax preparation customers of Loan Central.
IMPACT OF ADOPTING NEW ACCOUNTING GUIDANCE:
Effective January 1, 2023, the Company adopted ASU No. 2016-13 Financial Instruments - Credit Losses (Topic 326): Measurement of Credit Losses on Financial Instruments, (“ASU 2016-13”) (“ASC 326”), as amended. The new accounting guidance replaces the “incurred loss” model with an “expected loss” model, which is referred to as the current expected credit loss (“CECL”) model. The measurement of expected credit losses under the CECL model is applicable to financial assets measured at amortized cost, including loan receivables and held to maturity debt securities. It also applies to off-balance sheet credit exposures not accounted for as insurance (loan commitments, standby letters of credit, financial guarantees, and other similar instruments). Upon adoption of ASC 326, the Company increased the allowance for credit losses (“ACL”) by $2,162. In addition, a reserve for unfunded commitments and held to maturity securities was established totaling $631 and $3, respectively. The Company recorded a net charge to retained earnings of $2,209 as of January 1, 2023, for the cumulative effect of adopting ASC 326. The adoption of ASC 326 did not have an effect to net earnings on January 1, 2023.
RESULTS OF OPERATIONS:
SUMMARY
2023 v. 2022
Ohio Valley generated net income of $12,631 for 2023, a decrease of $707, or 5.3%, from 2022. Earnings per share were $2.65 for 2023, a decrease of 5.4% from 2022. The decrease in net income and earnings per share for 2023 was largely impacted by increases in provision for credit losses and noninterest expense, partially offset by higher net interest and noninterest income.
The Company’s net interest income in 2023 was $46,027, representing an increase of $1,249, or 2.8%, from 2022. Net interest income during 2023 was positively impacted by a year-to-date increase in the Company’s fully tax-equivalent net interest income as a percentage of average earning assets (“net interest margin”), which increased 5 basis points to 3.94% at December 31, 2023. During 2022, the Company experienced an increasing trend in the net interest margin in relation to the significant increase in market rates based on actions taken by the Federal Reserve Bank (“FRB”), which contributed to the yield on earning assets increasing more than the cost of interest-bearing liabilities. Net interest income during 2023 also benefited from an $18,156 increase in average earning assets, with higher relative balances being maintained in loans, as opposed to interest-bearing deposits with banks or securities, which generally yield less than loans. This led to a $91,359 increase in average loans while average interest-bearing deposits with banks and securities both decreased $52,637 and $20,566, respectively, from year-end 2022.
Although 2023’s net interest income increased compared to 2022, the pace of growth within net interest income began to compress during 2023. The aggressive rate increases initiated by the FRB in March 2022 had a significant impact on increasing asset yields in that year, while interest expenses remained less sensitive to higher market rates for most of 2022. However, the improvements in 2022’s net interest margin peaked in the fourth quarter of 2022. As a result, the Company began to experience margin compression during 2023 due to the Company’s actions of increasing rates on deposit accounts to attract deposits as market competition increased. This led to a composition shift to higher-cost certificate of deposit (“CD”) accounts during 2023. Furthermore, the higher utilization of wholesale funding sources to fund asset growth contributed to a higher cost of funds. This composition shift to higher-cost CDs and wholesale borrowings led to a $13,000 increase in interest expense during 2023, which limited the amount of increase in net interest income for the year. Compared to the prior quarterly periods in 2023, the Company’s year-to-date net interest margin of 3.94% at December 31, 2023 had decreased from the year-to-date margin results of 4.03%, 4.12%, and 4.21% at September 30, June 30, and March 31, 2023, respectively.
Provision for credit losses during 2023 finished higher than 2022 primarily due to the fact that there was negative provision for loan loss expense experienced during 2022 as a result of a decrease in certain economic risk factors, such as the level of classified and criticized loans and the partial release of the COVID reserve. Provision expense during 2023 was largely related to net charge-offs, increases in certain qualitative risk factors, and a general growth in loan balances. On January 1, 2023, the Company adopted new accounting guidance for measuring the credit losses on financial instruments. Under this guidance, the Company established a CECL model to estimate future credit losses, which replaced the former incurred loss methodology
The Company’s noninterest income increased $2,467, or 24.3%, from 2022. The year-to-date increase in noninterest income was largely impacted by a $1,514 decrease in the loss on sale of securities from the prior year. During the fourth quarter of 2022, the Company sold $12,500 in securities at a loss of $1,537. The proceeds from the sales of securities were reinvested into similar higher-yielding securities to increase future interest earnings. Further contributing to the increase in noninterest income was revenue recognized during the fourth quarter of 2023 as part of the Company’s settlement agreement with a tax refund processor, which increased $726 from the same period in 2022. The increase was related to the impact of the higher interest rate environment on the revenue earned under such agreement. Noninterest income in 2023 was also positively impacted by a $257 increase in service charges on deposit accounts. This was largely the result of a higher volume of overdraft transactions during 2023. Other increases in noninterest income came from interest rate swap revenue (+$211) and lower loss reserves related to the closing of the Captive (+$223). These increases were partially offset by a $522 decrease in mortgage banking income from selling loans to the secondary market. This decrease was related to the closing of Race Day and to elevated mortgage rates, which contributed to mortgage customers selecting in-house variable rate mortgage products instead of long-term fixed rate products that are sold to the secondary market.
The Company’s noninterest expenses during 2023 increased $2,328, or 6.0%, from 2022. The increase was primarily related to a $1,776 increase in salaries and employee benefit costs impacted by annual merit increases and nonqualified benefit plan expense. During the fourth quarter of 2022, the nonqualified benefit plan liabilities were evaluated and based on higher market interest rates, the benefit plan liabilities were reduced, leading to a lump sum decrease in expense. A comparable adjustment was not required in 2023, resulting in an increase of $1,099 in nonqualified benefit plan expense during 2023. However, this growth in salary and employee benefit expense was reduced due to the elimination of staffing for Race Day by April 2023. As a result, a savings in salary and employee benefit expense was realized totaling $699 during 2023. Further contributing to higher noninterest expense in 2023 were increases in software expense and FDIC insurance premiums. Software expense increased $452 in relation to investments in loan processing platforms to enhance efficiency and to termination fees for software agreements for Race Day. FDIC premiums increased $234 in relation to higher assessment rates on all depository institutions. These increases were partially offset by a $418 decrease in marketing expense, which was primarily attributable to select donations made during the fourth quarter of 2022 to support the communities that we serve and is reflective of our Community First mission.
The Company’s provision for income taxes decreased $27 during 2023, largely due to the changes in taxable income affected by the factors mentioned above.
NET INTEREST INCOME
The most significant portion of the Company’s revenue, net interest income, results from properly managing the spread between interest income on earning assets and interest expense incurred on interest-bearing liabilities. The Company earns interest and dividend income from loans, investment securities and short-term investments while incurring interest expense on interest-bearing deposits and short- and long-term borrowings. Net interest income is affected by changes in both the average volume and mix of assets and liabilities and the level of interest rates for financial instruments. Changes in net interest income are measured by net interest margin and net interest spread. Net interest margin is expressed as the percentage of net interest income to average interest-earning assets. Net interest spread is the difference between the average yield earned on interest-earning assets and the average rate paid on interest-bearing liabilities. Both of these are reported on a fully tax-equivalent (“FTE”) basis. Net interest margin exceeds the net interest rate spread because noninterest-bearing sources of funds, principally noninterest-bearing demand deposits and stockholders’ equity, also support interest-earning assets. The following is a discussion of changes in interest-earning assets, interest-bearing liabilities and the associated impact on interest income and interest expense for the two years ended December 31, 2023 and 2022. Tables I and II have been prepared to summarize the significant changes outlined in this analysis.
Net interest income in 2023 totaled $46,618 on an FTE basis, up $1,354, or 3.0%, from 2022. This increase reflects positive contributions from a 115 basis point increase in earning asset yield and a 1.6% increase in average earning assets. The average earning asset yield during 2023 was positively impacted by the FRB’s action to increase short-term rates by 525 basis points beginning in March 2022. During 2022, the Company’s average rates on deposits remained low, even during this series of aggressive market rate increases, due to a heightened liquidity position of core deposits. However, in order to attract deposits as market competition continued to increase, the Company increased its deposit rates during the end of 2022 and into 2023. This, along with a composition shift to higher-cost CD products and utilization of more wholesale funding sources to fund earning asset growth, increased the Company’s average interest-bearing liability costs by +163 basis points during 2023. As a result, the net interest margin was limited to just a 5 basis point increase from 3.89% in 2022 to 3.94% in 2023. The net interest margin increase of 5 basis points reflects the benefits of both a 115 basis point increase from the mix and yield on earning assets and a 53 basis point increase from the use of noninterest-bearing funding (i.e., demand deposits and shareholders’ equity). These positive effects were partially offset by a 163 basis point increase in funding costs impacted by market rate increases and a composition shift to a greater number of higher-costing deposits and wholesale funding sources. The increase in average earning assets came mostly from a 10.8% increase in loans, partially offset by a 47.0% decrease in interest-bearing balances with banks, and a 9.9% decrease in securities during 2023, as compared to the same period in 2022.
Net interest income increased in 2023 primarily due to the increase in both the average yield and volume of earning assets partially offset by the increase in both the average cost and volume of interest-bearing liabilities. The yield increase in average earning assets was responsible for increasing FTE interest income by $10,824 during 2023 compared to 2022, while the volume increase in average earning assets contributed to a $3,530 increase in FTE interest income during the same period. These positive impacts were partially offset by an increase in average interest-bearing liability costs that contributed to an $11,719 increase in interest expense during 2023 compared to 2022, and a volume increase in average interest-bearing liabilities that contributed to a $1,281 increase in interest expense during the same period. The increase in average earning asset yield for 2023 was largely impacted by loans. The action of the FRB to aggressively increase short-term rates had a direct impact on the repricing of a portion of the Company’s loan portfolio throughout 2022 and 2023, while also increasing the market rates on loan product offerings. As a result, the average loan yield grew to 5.92% at year-end 2023, as compared to 5.06% at year-end 2022, which contributed to $7,735 in additional FTE interest income during 2023 compared to 2022. The Company also experienced a $91,359, or 10.8%, increase in average loan balances during 2023, which contributed to $4,927 in additional FTE interest income during 2023 compared to 2022. Average balance growth occurred within all of the Company’s loan portfolio segments in residential real estate, commercial real estate, commercial and industrial, and consumer loans. To assist in funding the growth in average loans, the Company utilized more funds from its interest-bearing deposits with banks and maturity proceeds from securities. As a result, the Company’s average loan composition increased to 79.2% of average earning assets at year-end 2023, as compared to 72.5% for 2022.
Interest-bearing balances with banks also had a positive impact on net interest income, particularly from the yield factor. The majority of these balances consist of the Company’s interest-bearing FRB clearing account. The aggressive short-term rate increases had an immediate effect on increasing the interest income generated by the Company’s FRB clearing account. During 2023, the rate associated with the FRB clearing account increased 100 basis points due to continued rising inflationary concerns, resulting in an increase in the target federal funds rate of 5.25% to 5.50%. During 2022, this rate had increased 425 basis points. As a result, the average yield factor on interest-bearing balances with other banks increased interest income by $2,362 during 2023, as compared to a $1,352 increase in interest income during 2022. Conversely, the average volume on interest-bearing balances with other banks contributed to a $989 decrease to interest income during 2023, as compared to a $40 decrease to interest income during 2022. The change was impacted by the utilization of excess deposits within the FRB clearing account during 2023. The Company utilizes its interest-bearing FRB clearing account to manage excess funds, as well as to assist in funding earning asset growth. During 2023, excess funds from the FRB account were used to fund the growth in loans, which led to a $52,637, or 47.0%, decrease in average interest-bearing balances with other banks, and led to a lower composition of average interest-bearing balances with other banks, finishing at 5.0% of average earning assets in 2023 compared to 9.6% in 2022.
Average securities of $186,908 at year-end 2023 represented a 9.9% decrease from the $207,474 in average securities at year-end 2022. During 2022, the Company utilized excess funds from previous government stimulus programs to purchase taxable investment securities, expanding its composition of earning assets and contributing to a $565 increase in FTE interest income in 2022. During 2023, the Company placed more emphasis on growing its higher-yielding loan portfolio and utilized proceeds from various maturities and repayments of securities to help fund this growth. Average taxable securities in 2023 decreased 10.0% from the prior year, particularly from various maturities and repayments of U.S. Government and Agency mortgage-backed securities. As a result, the composition of average taxable securities decreased to 15.2% of average earning assets at year-end 2023, as compared to 17.1% at year-end 2022, and contributed to a $391 decrease in interest income during 2023. Rising interest rates continued to have a positive impact on the average yields on taxable securities during 2023. Furthermore, the Company took opportunities to sell some of its lower-yielding taxable securities in December of 2022, and used the proceeds to reinvest into higher-yielding securities that benefited earnings growth in 2023. The realized loss from the year-end 2022 sale will continue to be offset by increases in future interest income. As a result, the average yield factor for taxable securities contributed to a $737 increase in interest income during 2023, as compared to a $912 increase in interest income during 2022. Average tax exempt securities were down 7.7% from the prior year, largely related to maturities of state and municipal investments. As a result, the composition of average state and municipal investments trended down to 0.6% of average earning assets at year-end 2023, as compared to 0.7% at year-end 2022. Management continues to focus on generating loan growth as loans provide the greatest return to the Company. Management also maintains securities at a dollar level adequate enough to provide ample liquidity and cover pledging requirements.
Net interest income was negatively impacted by an increase in the average cost of interest-bearing liabilities, particularly with the Company’s time deposits, during 2023. The Company entered 2022 having experienced a large increase in excess deposits that had carried over from 2021 resulting from various government stimulus programs. As the FRB began moving short-term rates up in March 2022, the Company still maintained heightened levels of liquidity, which allowed deposit rates to remain unadjusted for most of 2022. As market competition continued to increase, rate offerings on CDs began adjusting up in the second half of 2022 but was not impactful in generating significant increases to interest expense during that period through the end of 2022. As a result, the average cost of time deposits decreased 36 basis points during 2022, which contributed to a $643 decrease in interest expense on time deposits for the year. Conversely, the Company continued to increase CD rates in 2023 to attract and retain deposits, which had a negative impact in growing interest costs. The Company also utilized higher-cost wholesale time deposits (brokered CDs) to help fund earning asset growth in 2023. These factors contributed to a $7,742 increase in interest expense on time deposits during 2023. Furthermore, the increase in rates on retail CD offerings compared to 2022 led to more consumer demand to reinvest lower cost NOW, savings, and money market deposit products and into more time deposit products such as CDs. This contributed to an increase in the composition of average time deposits from 22.7% at year-end 2022 to 35.4% at year-end 2023 and increased the average cost of time deposits from 0.65% at year-end 2022 to 3.57% at year-end 2023.
This trend of higher market rates and a growing consumer preference for higher cost retail deposits also had a significant impact on core deposit segments that include negotiable order of withdrawal (“NOW”), savings and money market accounts. Interest expense on these accounts was largely unaffected by the rising rate environment in 2022 due to a lagging effect on deposit rate adjustments. These repricing efforts to limit the magnitude of deposit rate increases in a higher rate environment contributed to a minimal impact on interest expense during 2022. However, rates on deposits steadily increased at the end of 2022 and leading into 2023, particularly with higher rates on NOW accounts and a new tiered money market product that offered competitive rates. As a result, the Company’s average cost of savings and money market accounts increased from 0.08% in 2022 to 0.81% in 2023, while the average cost of NOW accounts increased from 0.34% in 2022 to 1.01% in 2023. Collectively, this contributed to a $3,342 increase to interest expense during 2023, as compared to just a $5 increase in 2022. While customer deposits continued to increase during 2023 within these core deposit segments, the consumer preference was largely weighted towards time deposits, which generated a composition shift to a greater number of higher-priced retail CD products. As a result, average balances during 2023 decreased 13.5% within NOW accounts and decreased 15.5% within savings and money market accounts, altogether representing 59.4% of average interest-bearing liabilities in 2023, as compared to 73.5% in 2022.
The Company’s average other borrowings and subordinated debentures collectively increased $11,911, or 41.9%, during 2023. The increase was related to the issuance of new FHLB advances that were used to help fund earning asset growth. Borrowings and subordinated debentures continue to represent the smallest composition of average interest-bearing liabilities, finishing at 5.1% and 3.8% at the end of 2023 and 2022, respectively. The elevated rate environment also impacted the average costs on other borrowings, which increased from 2.06% at year-end 2022 to 3.35% at year-end 2023, and subordinated debentures, which increased from 3.48% at year-end 2022 to 7.03% at year-end 2023.
Total interest and fee income on average earning assets increased $14,354, or 29.8%, during 2023, and $2,912, or 6.4%, during 2022. The increase was primarily due to average net loan growth and the benefits of a rising interest rate environment that had a significant impact on loan offerings/repricings and the rate tied to the Company’s interest-bearing FRB clearing account.
The Company’s interest income from its interest-bearing balances with banks increased $1,373 and $1,312 during 2023 and 2022, respectively. Higher earnings were impacted by the aggressive increase in market rates initiated by the FRB beginning in March of 2022, which caused the rate associated with the interest-bearing FRB clearing account to increase, as well. The positive impact from higher rates were partially offset by a decline in average interest-bearing deposits with banks, decreasing 47.0% and 17.6% during 2023 and 2022, respectively.
The Company’s interest and fees from its commercial loan portfolio increased $5,938, or 28.5%, during 2023. The increase came primarily from commercial loan interest, which was positively impacted by elevated market rate adjustments during 2023. Also contributing to higher interest income was commercial loan demand, which was successful in generating an 8.6% increase in average balances within the Company’s commercial real estate and commercial and industrial portfolios. During 2022, the Company’s interest and fees from its commercial loan portfolio decreased $368, or 1.7%. The decrease came primarily from lower commercial loan fees, which decreased $1,295, or 60.4%, as result of less Paycheck Protection Program loan fees earned in 2022. The decrease in fees completely offset a $927 increase in commercial interest income in 2022, impacted by higher average yields and increases in average commercial loan balances within the commercial real estate and commercial and industrial portfolios.
The Company’s interest and fees from its consumer loan portfolio increased $4,109, or 38.8%, during 2023. The increase was primarily the result of higher consumer loan yields and a 19.8% increase in average consumer loan balances. Average consumer loans were largely impacted by the purchase of a pool of unsecured loans in January 2023 that carried an average balance of $12,322 for the year. Other contributions to higher consumer loans in 2023 came from increases in average automobile and consumer capital line loan balances. As a result, consumer loan interest increased $4,092 and consumer loan fees increased $17 during 2023. During 2022, consumer loan interest and fees increased $629, or 6.3%. The increase was primarily the result of higher consumer loan yields and an increase in average consumer capital line and unsecured loan balances. As a result, consumer loan interest increased $534 and consumer loan fees increased $95 during 2022.
The Company’s interest and fees from its residential real estate loan portfolio increased $2,501, or 23.1%, during 2023. This was impacted by higher yields and a 9.8% increase in average residential real estate loans. With mortgage rates continuing to increase in 2023, the demand for in-house variable rate mortgage products increased while long-term fixed rate products decreased. As a result, interest income increased $2,526 while fee income decreased $25 within the residential real estate portfolio during 2023. Conversely, the Company’s interest and fees from its residential real estate loan portfolio decreased $90, or 0.8%, during 2022. This was impacted by a decrease in average residential real estate loan balances caused by principal repayments and payoffs, and a lower volume of new loan originations during 2022. As a result, interest income decreased $51 and fee income decreased $39 within the residential real estate portfolio during 2022.
The Company’s interest income from taxable investment securities increased $346, or 9.5%, in 2023. This was primarily due to the reinvestment of maturities at market rates higher than the average portfolio yield. The average securities yield was also positively impacted by the Company’s decision to sell $12,500 of lower-yielding taxable securities at the end of 2022 and reinvest them in similar higher-yielding securities. These factors had a positive impact on increasing the yield on taxable securities, which increased from 1.83% in 2022 to 2.23% in 2023. However, with the Company’s focus on reinvesting excess funds into a greater number of higher-yielding loans, average taxable security balances decreased 10.0% during 2023, partially offsetting the benefits of increasing yields. During 2022, the Company’s interest income from taxable investment securities increased $1,477, or 67.8%. This was primarily due to investment purchases and reinvestment of maturities at market rates higher than the average portfolio yield. During 2022, the Company took opportunities to reinvest a portion of excess deposits into new U.S. Government and Agency mortgage-backed securities, which contributed $42,806 to the total increase in average taxable securities. Additionally, the Company sold $48,732 of lower-yielding taxable securities at the end of 2021 and reinvested them in similar higher-yielding securities that impacted higher asset yields in 2022, resulting in a yield on taxable securities of 1.83% in 2022.
Total interest expense incurred on the Company’s interest-bearing liabilities totaled $15,838 during 2023, an increase of $13,000 compared to $2,838 in interest expense during 2022. The increase in interest expense during 2023 was largely the result of a lagging effect to deposit rate increases during the time that the FRB took action to aggressively move short-term rates up in 2022. At that time, the Company was able to maintain a large amount of excess deposit balances within its core segment of interest-bearing NOW, savings, and money market accounts with little to no change to their respective deposit product rates during 2022. Competition for deposits began to increase during the end of 2022 and continued into 2023, leading to an increase in the rates on several of the Company’s deposit products, such as CDs, NOW and money market accounts. In addition, deposit customers were looking to reinvest their funds into a greater number of higher-costing products such as CDs instead of lower-costing products such as savings, NOW and money market accounts. Furthermore, the Company utilized a greater number of higher-costing brokered CDs to assist in funding the growth in earning assets. This combination of higher CD volume, upward repricing of CD rates, and utilization of higher-cost wholesale funding had a negative effect on earnings by elevating interest expenses in 2023. As a result, the weighted average cost on interest-bearing liabilities increased from 0.38% in 2022 to 2.01% in 2023. During 2022, total interest expense incurred on the Company’s interest-bearing liabilities decreased $861, or 23.3%, primarily due to the lagging effect of deposit rate increases initiated by the FRB. During 2022, the Company was able to maintain a large amount of excess core deposit balances with little to no change to their respective deposit product rates. With deposit rates to increase, this caused continued maturity runoff of higher-cost CD balances, some of which were reinvested back into other Bank products. Given the Company’s asset-sensitivity, the increases in short-term interest rates had a positive impact on net interest income in that interest-earning assets repriced faster than interest-bearing liabilities. By experiencing minimal change in deposit rates, this delayed the negative impact that higher market rates had on increasing deposit expense during most of 2022.
CONSOLIDATED AVERAGE BALANCE SHEET & ANALYSIS OF NET INTEREST INCOME
| | December 31 | |
Table I | | 2023 | | | 2022 | |
| (dollars in thousands) | | Average Balance | | | Income/ Expense | | | Yield/ Average | | | Average Balance | | | Income/ Expense | | | Yield/ Average | |
| Assets | | | | | | | | | | | | | | | | | | |
| Interest-earning assets: | | | | | | | | | | | | | | | | | | |
| Interest-bearing balances with banks | | $ | 59,475 | | | $ | 2,880 | | | | 4.84 | % | | $ | 112,112 | | | $ | 1,507 | | | | 1.34 | % |
| Securities: | | | | | | | | | | | | | | | | | | | | | | | | |
Taxable | | | 179,501 | | | | 4,002 | | | | 2.23 | | | | 199,446 | | | | 3,656 | | | | 1.83 | |
Tax exempt | | | 7,407 | | | | 200 | | | | 2.70 | | | | 8,028 | | | | 227 | | | | 2.83 | |
Loans | | | 935,772 | | | | 55,374 | | | | 5.92 | | | | 844,413 | | | | 42,712 | | | | 5.06 | |
| Total interest-earning assets | | | 1,182,155 | | | | 62,456 | | | | 5.28 | % | | | 1,163,999 | | | | 48,102 | | | | 4.13 | % |
| | | | | | | | | | | | | | | | | | | | | | | | | |
| Noninterest-earning assets: | | | | | | | | | | | | | | | | | | | | | | | | |
| Cash and due from banks | | | 15,024 | | | | | | | | | | | | 14,767 | | | | | | | | | |
| Other nonearning assets | | | 86,077 | | | | | | | | | | | | 81,303 | | | | | | | | | |
| Allowance for loan losses | | | (7,749 | ) | | | | | | | | | | | (5,417 | ) | | | | | | | | |
Total noninterest-earning assets
| | | 93,352 | | | | | | | | | | | | 90,653 | | | | | | | | | |
Total assets | | $ | 1,275,507 | | | | | | | | | | | $ | 1,254,652 | | | | | | | | | |
| | | | | | | | | | | | | | | | | | | | | | | | | |
| Liabilities and Shareholders’ Equity | | | | | | | | | | | | | | | | | | | | | | | | |
| Interest-bearing liabilities: | | | | | | | | | | | | | | | | | | | | | | | | |
NOW accounts | | $ | 196,086 | | | $ | 1,988 | | | | 1.01 | % | | $ | 226,709 | | | $ | 778 | | | | 0.34 | % |
| Savings and money market | | | 272,217 | | | | 2,213 | | | | 0.81 | | | | 322,272 | | | | 242 | | | | 0.08 | |
Time deposits | | | 279,260 | | | | 9,973 | | | | 3.57 | | | | 169,682 | | | | 1,110 | | | | 0.65 | |
| Other borrowed money | | | 31,865 | | | | 1,067 | | | | 3.35 | | | | 19,954 | | | | 412 | | | | 2.06 | |
| Subordinated debentures | | | 8,500 | | | | 597 | | | | 7.03 | | | | 8,500 | | | | 296 | | | | 3.48 | |
| Total int.-bearing liabilities | | | 787,928 | | | | 15,838 | | | | 2.01 | % | | | 747,117 | | | | 2,838 | | | | 0.38 | % |
| | | | | | | | | | | | | | | | | | | | | | | | | |
| Noninterest-bearing liabilities: | | | | | | | | | | | | | | | | | | | | | | | | |
| Demand deposit accounts | | | 328,573 | | | | | | | | | | | | 353,019 | | | | | | | | | |
Other liabilities | | | 22,237 | | | | | | | | | | | | 19,295 | | | | | | | | | |
| Total noninterest-bearing liabilities | | | 350,810 | | | | | | | | | | | | 372,314 | | | | | | | | | |
| | | | | | | | | | | | | | | | | | | | | | | | | |
| Shareholders’ equity | | | 136,769 | | | | | | | | | | | | 135,221 | | | | | | | | | |
| Total liabilities and shareholders’ equity | | $ | 1,275,507 | | | | | | | | | | | $ | 1,254,652 | | | | | | | | | |
| | | | | | | | | | | | | | | | | | | | | | | | | |
| Net interest earnings | | | | | | $ | 46,618 | | | | | | | | | | | $ | 45,264 | | | | | |
| Net interest margin | | | | | | | | | | | 3.94 | % | | | | | | | | | | | 3.89 | % |
| Net interest rate spread | | | | | | | | | | | 3.27 | % | | | | | | | | | | | 3.75 | % |
| Average interest-bearing liabilities to average earning assets | | | | | | | | | | | 66.65 | % | | | | | | | | | | | 64.19 | % |
| | | | | | | | | | | | | | | | | | | | | | | | | |
Fully taxable equivalent yields are reported for tax exempt securities and loans and calculated assuming a 21% tax rate, net of nondeductible interest expense. Tax-equivalent adjustments for securities during the years ended December 31, 2023 and 2022 totaled $38 and $47, respectively. Tax-equivalent adjustments for loans during the years ended December 31, 2023 and 2022 totaled $553 and $439, respectively. Average balances are computed on an average daily basis. The average balance for available for sale securities includes the market value adjustment. However, the calculated yield is based on the securities’ amortized cost. Average loan balances include nonaccruing loans. Loan income includes cash received on nonaccruing loans.
RATE VOLUME ANALYSIS OF CHANGES IN INTEREST INCOME & EXPENSE Table II |
(dollars in thousands) | | 2023 | | | 2022 | |
| | Increase (Decrease) From Previous Year Due to | | | Increase (Decrease) From Previous Year Due to | |
| | Volume | | | Yield/Rate | | | Total | | | Volume | | | Yield/Rate | | | Total | |
| Interest income | | | | | | | | | | | | | | | | | | |
Interest-bearing balances with banks | | $ | (989 | ) | | $ | 2,362 | | | $ | 1,373 | | | $ | (40 | ) | | $ | 1,352 | | | $ | 1,312 | |
Securities: | | | | | | | | | | | | | | | | | | | | | | | | |
Taxable | | | (391 | ) | | | 737 | | | | 346 | | | | 565 | | | | 912 | | | | 1,477 | |
Tax exempt | | | (17 | ) | | | (10 | ) | | | (27 | ) | | | (20 | ) | | | (50 | ) | | | (70 | ) |
Loans | | | 4,927 | | | | 7,735 | | | | 12,662 | | | | 138 | | | | 55 | | | | 193 | |
Total interest income | | | 3,530 | | | | 10,824 | | | | 14,354 | | | | 643 | | | | 2,269 | | | | 2,912 | |
| | | | | | | | | | | | | | | | | | | | | | | | | |
| Interest expense | | | | | | | | | | | | | | | | | | | | | | | | |
NOW accounts | | | (118 | ) | | | 1,328 | | | | 1,210 | | | | 50 | | | | 48 | | | | 98 | |
Savings and money market | | | (43 | ) | | | 2,014 | | | | 1,971 | | | | 20 | | | | (43 | ) | | | (23 | ) |
Time deposits | | | 1,121 | | | | 7,742 | | | | 8,863 | | | | (279 | ) | | | (643 | ) | | | (922 | ) |
Other borrowed money | | | 321 | | | | 334 | | | | 655 | | | | (127 | ) | | | (25 | ) | | | (152 | ) |
Subordinated debentures | | | ---- | | | | 301 | | | | 301 | | | | ---- | | | | 138 | | | | 138 | |
Total interest expense | | | 1,281 | | | | 11,719 | | | | 13,000 | | | | (336 | ) | | | (525 | ) | | | (861 | ) |
Net interest earnings | | $ | 2,249 | | | $ | (895 | ) | | $ | 1,354 | | | $ | 979 | | | $ | (2,794 | ) | | $ | 3,773 | |
The change in interest due to volume and rate is determined as follows: Volume Variance change in volume multiplied by the previous year’s rate; Yield/Rate Variance - change in rate multiplied by the previous year’s volume; Total Variance change in volume multiplied by the change in rate. The change in interest due to both volume and rate has been allocated to volume and rate changes in proportion to the relationship of the absolute dollar amounts of the change in each. The tax exempt securities and loan income is presented on an FTE basis. FTE yield assumes a 21% tax rate, net of related nondeductible interest expense.
The Company’s interest expenses were also impacted by other borrowed money and subordinated debentures, which were up collectively by $956 during the year ended 2023. The increase was primarily the result of the increase in market rates that had a corresponding effect to the rates tied to FHLB borrowings and subordinated debentures. Interest expense was also impacted by an average balance increase in FHLB borrowings to assist in funding earning asset growth during 2023. As a result, the average cost of other borrowed money and subordinated debentures collectively increased from 2.48% in 2022 to 4.12% in 2023. During 2022, interest expenses from other borrowed money and subordinated debentures were down collectively by $14. The decrease was primarily from the average balance decrease in FHLB borrowings caused by principal repayments during 2022. Partially offsetting the decrease from FHLB borrowings was an increase in the average cost of subordinated debentures, which grew to 3.48% in 2022. This impact came primarily from the rise in market rates during 2022 that had a corresponding effect to the rate tied to the subordinated debt.
During 2023, the Company’s net interest margin was positively impacted by the increasing market rates that contributed to higher earning asset yields. The positive impact of interest rate increases by the FRB and a composition shift to higher-yielding loan balances elevated interest income on earning assets during 2023. Partially offsetting the positive effects to the margin was an increase in interest costs during 2023 due to customer pricing pressures, deposit competition, and a higher utilization of wholesale funding sources. This, along with a continued deposit composition shift to a greater number of higher-costing retail CDs led to margin compression during each of the quarterly periods in 2023. These factors limited the growth in the Company’s net interest margin from 3.89% in 2022 to 3.94% in 2023. The Company’s primary focus is to invest its funds into higher-yielding assets, particularly loans, as opportunities arise. However, if loan balances do not continue to expand and remain a larger component of overall earning assets, the Company will face pressure within its net interest income and margin improvement.
PROVISION EXPENSE
The Company sets aside an ACL through charges to income, which are reflected in the consolidated statement of income as the provision for credit losses. Provision for credit loss is recorded to achieve an ACL that is adequate to absorb estimated losses inherent in the Company’s loan portfolio, unfunded loans, and held to maturity debt securities. Management performs, on a quarterly basis, a detailed analysis of the ACL that encompasses asset portfolio composition, asset quality, loss experience and other relevant economic factors.
During 2023, the Company recorded $2,090 in provision expense, as compared to $32 in negative provision expense in 2022. This increase in credit loss expense came primarily from loans, which increased $2,062 during 2023. Provision for loan loss expense during 2023 was partially related to additional reserves associated with certain qualitative risk factors that incorporated a national trend of higher loan delinquencies and charge offs, particularly within commercial real estate and construction loans. This contributed to $710 in additional provision expense during the year ended 2023.
Partially offsetting the increasing effects to provision expense mentioned above was a $488, or 41.3%, decrease in net-charge offs on loans. The decrease in net charge offs came mostly from the charge offs of two commercial and industrial loans in the second quarter of 2022 totaling $613 as part of a single borrower relationship. This required a corresponding increase to provision expense during 2022 that was less impactful in 2023.
Provision expense on loans during 2023 was also impacted by increases in loan balances generally allocated at December 31, 2023 compared to December 31, 2022. The risk associated with the $86,851 increase in loans generated higher general reserves and a corresponding increase to provision expense.
Credit loss expense during 2023 also came from unfunded commitments on off-balance sheet liabilities. Upon adoption of ASC 326, the Company established $631 in reserves for unfunded commitments within total liabilities on the consolidated balance sheet. This transition adjustment was included as a charge to retained earnings on January 1, 2023. The Company re-evaluated its unfunded commitments to extend credit at December 31, 2023 and determined a reserve of $692 was required, which resulted in provision expense of $61 during the year ended 2023.
Credit loss expense during 2023 was further impacted by held to maturity debt securities. Upon adoption of ASC 326, the Company established $3 in reserves for held to maturity debt securities on the consolidated balance sheet. This transition adjustment was included as a charge to retained earnings on January 1, 2023. The Company re-evaluated its reserve for held to maturity debt securities at December 31, 2023 and determined a reserve of $2 was required, which resulted in a $1 recovery of provision expense during the year ended 2023.
The ACL was 0.90% of total loans at December 31, 2023, as compared to 0.60% at December 31, 2022. The increase in the ACL from December 31, 2022, to December 31, 2023, was partly related to the Company adopting the new CECL model on January 1, 2023 that estimates future credit losses and replaced the former incurred loss methodology. Management believes that the ACL was adequate at December 31, 2023, and reflected current expected credit losses in the portfolio. There can be no assurance, however, that adjustments to the ACL will not be required in the future. Changes in the circumstances of particular borrowers, as well as adverse developments in the economy, could cause further increases in the required ACL and require additional provision expense. Asset quality will continue to remain a key focus, as management continues to stress not just loan growth, but quality in loan underwriting as well. Future provisions to the ACL will continue to be based on management’s quarterly in-depth evaluation that is discussed in further detail below under the caption “Critical Accounting Policies - Allowance for Credit Losses” within this Management’s Discussion and Analysis.
During 2022, the Company experienced a $645 decrease in its COVID-19 reserve allocation, which contributed to negative provision expense during the year ended 2022. Based on positive asset quality trends and lower net charge-offs, management released $645 of the reserve related to the COVID-19 risk factor in the first quarter of 2022, resulting in a corresponding decrease to both provision expense and the allowance for loan losses. This decrease in lower reserves during 2022 had no impact in reducing reserves in 2023.
Further contributing to negative provision expense during 2022 was the release of $848 in other general reserves based on various credit quality improvements within the economic risk factor calculation that included: lower criticized and classified assets, lower delinquency levels, and higher annualized level of loan recoveries. Classified assets within the commercial loan portfolio decreased $6,548, or 70.6%, during 2022, while nonperforming loans to total loans decreased 13 basis points to finish at 0.43% at year-end 2022.
NONINTEREST INCOME
During 2023, total noninterest income increased $2,467, or 24.3%, as compared to 2022. The increase in noninterest revenue was primarily impacted by lower losses associated with the sales of securities, which decreased $1,514, or 98.5%, during 2023. During the fourth quarter of 2022, the Company received proceeds of $10,963 from the sale of three securities totaling $12,500 at a weighted average yield of 1.22%. The lower-yielding securities were replaced with similar securities with a higher weighted average yield of 4.09%. As a result, the realized losses on this sale of securities from 2022 totaled $1,537, and reduced noninterest income, but was less impactful in reducing noninterest income during 2023. While realized losses were incurred, the transactions are expected to increase future income and to have a positive impact on the margin.
Other noninterest income also increased $1,316, or 122.9%, from 2022 to 2023. This was primarily attributable to higher earnings on compensating balances as part of processing tax refunds, which increased $726 from the same period in 2022. These earnings are part of the Company’s settlement agreement with a tax refund processor. The increase was related to the impact of the higher interest rate environment on the revenue earned under the applicable settlement agreement. Increases in other noninterest income also came from interest rate swap revenue (+$211), lower loss reserves related to the closing of the Captive (+$223), and an increase in broker fees at Race Day for their portion of mortgage loan sales during 2023 (+$62).
Further contributing to the increase in noninterest income was service charges on deposit accounts, which increased $257, or 10.5%, during 2023. This was primarily from an increase in the volume of overdraft transactions during 2023.
These increases in noninterest income were partially offset by a $522, or 74.9%, decrease in mortgage banking income. The decrease was largely impacted by the closing of Race Day in December 2023, which resulted in a $331 decrease in mortgage banking income. The decrease in mortgage banking income was also affected by a lower volume of real estate loans sold by the Bank to the secondary market in 2023. During periods of heavy refinancing due to lower market rates, the Company will take opportunities to sell a portion of its fixed-rate real estate volume to the secondary market to satisfy consumer demand and help minimize the interest rate risk exposure to rising rates. However, market rates have continued to shift upward in 2023, causing long-term mortgage rates to increase and slow down the consumer demand for long-term, fixed-rate real estate mortgages. As a result, the Bank’s mortgage banking income decreased $191 in 2023.
The Company’s remaining noninterest income categories decreased $98, or 1.3%, during the year ended 2023, as compared to 2022. This was in large part due to lower earnings on annuity assets and tax preparation fees.
NONINTEREST EXPENSE
Management continues to work diligently to minimize noninterest expense. For 2023, total noninterest expense increased $2,328, or 6.0%, as compared to 2022. The Company’s largest noninterest expense item, salaries and employee benefits, increased $1,776, or 8.2%, during 2023. These higher costs were mostly impacted by annual merit increases and the reevaluation of nonqualified benefit plan liabilities during the fourth quarter of 2022. Based on higher market interest rates, the benefit plan liabilities were reduced, leading to a lump sum decrease in benefit expense in December 2022. A comparable adjustment was not required in 2023. As a result, the expense associated with the nonqualified benefit plans increased $1,099 during 2023, as compared to 2022. Partially offsetting these increases were lower salary and employee benefit expenses related to the elimination of staffing for Race Day by April 2023. Race Day was officially closed in December 2023, which resulted in a $699 savings in salary and employee benefit expense.
The Company also experienced an increase in software expense during 2023, which was up $452, or 20.6%, over the year ended 2022. The increase was largely impacted by various investments in loan processing platforms at the Bank to further improve operational efficiencies in 2023. Further increases in expenses came from the termination fees for software agreements for Race Day as part of its closing in December 2023.
Further impacting higher noninterest expense was FDIC premium costs, which increased $234, or 69.9%, during 2023. During the fourth quarter of 2022, the FDIC announced it was going to increase initial base deposit insurance assessment rate schedules uniformly by 2 basis points beginning in the first quarterly assessment period of 2023. This action by the FDIC responded to the Deposit Insurance Fund reserve falling below the 1.35% minimum level in the second quarter of 2020 following outsized growth in insured deposits in the first half of 2020. The Bank adjusted its premium expense accrual in anticipation of the 2-basis point adjustment increase to all quarterly assessments during 2023.
The Company’s occupancy, furniture and equipment expenses were also up $144, or 4.7%, during 2023, as compared to 2022. This was primarily related to building repair and maintenance costs, as well as asset depreciation costs.
Partially offsetting these increases were lower marketing costs, which decreased $418, or 29.3%, during 2023 compared to 2022. Marketing costs were largely impacted by select donations made during the fourth quarter of 2022 to support the communities that we serve and reflective of our Community First mission. As a result, donation expenses decreased $534 during 2023, while advertising and public relation expenses increased $116.
The remaining noninterest expense categories increased $140, or 1.4%, during the year-ended 2023, as compared to 2022. These changes came primarily from other noninterest expense, which increased $107 during the year ended 2023. These increases were impacted primarily by higher interest rate swap expense, loan expenses, and stationery, supplies and postage costs, which were partially offset by decreases in various overhead expenses associated with Race Day resulting from the unwinding of business operations mentioned above.
The Company’s efficiency ratio is defined as noninterest expense as a percentage of fully tax-equivalent net interest income plus noninterest income. The effects from provision expense are excluded from the efficiency ratio. Management continues to place emphasis on managing its balance sheet mix and interest rate sensitivity as well as developing more innovative ways to generate noninterest revenue. During 2023, the Company experienced a trend of increasing deposit rates, a deposit composition shift to higher-cost time deposit balances, and an increased use of higher-cost wholesale funding sources, which led to margin compression during each of the quarterly periods in 2023. However, these negative effects were completely offset by the benefits from an increase in earning asset yields due to market rate increases by the FRB, and a higher composition of higher-yielding loans. This led to a 2.8% increase in net interest income during the year ended 2023 over the year ended 2022. Furthermore, a late surge in noninterest income during the fourth quarter of 2023 was vital in generating a $2,467 year-to-date increase in noninterest income during 2023, which was enough to offset a $2,328 year-to-date increase in noninterest expense during 2023. As a result, the Company’s efficiency number decreased (improved) to 69.82% at December 31, 2023, from 70.44% at December 31, 2022.
PROVISION FOR INCOME TAXES
The provision for income taxes during 2023 totaled $2,567, compared to $2,594 in 2022. The effective tax rate for 2023 was 16.9%, compared to 16.3% in 2022. The effective tax rate for 2022 was below 2023’s effective tax rate as a result of a lump sum adjustment that reduced costs associated with certain nondeductible retirement benefit plans during 2022, which lowered tax expense.
FINANCIAL CONDITION:
CASH AND CASH EQUIVALENTS
The Company’s cash and cash equivalents consist of cash, as well as interest- and noninterest- bearing balances due from other banks. The amounts of cash and cash equivalents fluctuate on a daily basis due to customer activity and liquidity needs. At December 31, 2023, cash and cash equivalents increased $82,136 to $128,126, compared to $45,990 at December 31, 2022. The increase in cash and cash equivalents came mostly from higher interest-bearing deposits on hand with correspondent banks. At December 31, 2023, the Company’s interest-bearing FRB clearing account represented over 88% of cash and cash equivalents. The Company utilizes its interest-bearing FRB clearing account to manage excess funds, as well as to assist in funding earning asset growth. During 2023, the Company experience increases in funds from Bank deposits, primarily time deposits, which were maintained in the FRB account. Other funds also came from maturities and paydowns of securities available for sale (“AFS”) and proceeds from FHLB borrowings. The Company utilized a portion of these clearing account funds to reinvest in higher-yielding loans, and also to help cover runoff in noninterest-bearing and other interest-bearing deposit balances in NOW, savings, and money market accounts. The interest rate paid on both the required and excess reserve balances of the FRB account is based on the targeted federal funds rate established by the Federal Open Market Committee. During 2023, the rate associated with the Company’s FRB clearing account increased 100 basis points due to continued rising inflationary concerns, resulting in a target federal funds rate range of 5.25% to 5.50%. The interest-bearing deposit balances in the FRB are 100% secured by the U.S. Government.
As liquidity levels continuously vary based on consumer activities, amounts of cash and cash equivalents can vary widely at any given point in time. The Company’s focus during periods of heightened liquidity will be to invest excess funds into longer-term, higher-yielding assets, primarily loans, when the opportunities arise. Further information regarding the Company’s liquidity can be found below under the caption “Liquidity” in this Management’s Discussion and Analysis.
CERTIFICATES OF DEPOSIT IN FINANCIAL INSTITUTIONS
At December 31, 2023, the Company had no balances classified as CDs owned by the Captive, compared to $1,862 at December 31, 2022. This was due to the Captive ceasing operations in December 2023.
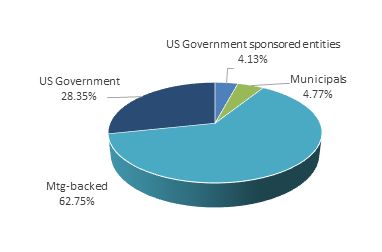
SECURITIES
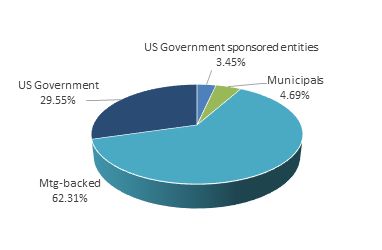
Management’s goal in structuring its investment securities portfolio is to maintain a prudent level of liquidity and to provide an acceptable rate of return without sacrificing asset quality. During 2023, the balance of total securities decreased $23,056, or 11.9%, compared to year-end 2022. The Company’s investment securities portfolio is made up mostly of Agency mortgage-backed securities, representing 62.3% of total investments at December 31, 2023. During the year ended 2023, the Company utilized a portion of its proceeds from maturities and principal repayments of securities to fund the growth in higher-yielding loans. This resulted in a $15,215, or 12.5%, decrease in Agency mortgage-backed securities, largely from principal repayments of $17,984 combined with no new purchases during 2023. The monthly repayment of principal has been the primary advantage of Agency mortgage-backed securities as compared to other types of investment securities, which deliver proceeds upon maturity or at a specified call date. The Company also received proceeds of $7,600 in maturities from its U.S. Government and U.S. Government sponsored entity securities during 2023, which were used to help fund the growth in loans during 2023.
Investment Portfolio Composition
| |
at December 31, 2023
| at December 31, 2022
|
| |
| MATURING | |
As of December 31, 2023 | Within One Year | | After One but Within Five Years | | After Five but Within Ten Years | | After Ten Years | |
(dollars in thousands) | Amount | | Yield | | Amount | | Yield | | Amount | | Yield | | Amount | | Yield | |
| | | | | | | | | | | | | | | | |
U.S. Government securities | | $ | 17,257 | | | | 2.88 | % | | $ | 33,040 | | | | 2.01 | % | | $ | ---- | | | | ---- | | | $ | ---- | | | | ---- | |
U.S. Government sponsored entity securities | | | ---- | | | | ---- | | | | 5,877 | | | | 1.57 | % | | | ---- | | | | ---- | | | | ---- | | | | ---- | |
Obligations of states and political subdivisions | | | 392 | | | | 2.94 | % | | | 3,780 | | | | 2.87 | % | | | 1,298 | | | | 2.57 | % | | | 1,920 | | | | 2.81 | % |
Agency mortgage-backed securities, residential | | | 21 | | | | 3.99 | % | | | 4,003 | | | | 2.48 | % | | | 36,842 | | | | 2.05 | % | | | 65,218 | | | | 1.60 | % |
Total securities | | $ | 17,670 | | | | 2.88 | % | | $ | 46,700 | | | | 2.06 | % | | $ | 38,140 | | | | 2.07 | % | | $ | 67,138 | | | | 1.68 | % |
Tax-equivalent adjustments of $38 have been made in calculating yields on obligations of states and political subdivisions using a 21% rate. Weighted average yields are calculated on the basis of the cost and effective yields weighted for the scheduled maturity of each security. Mortgage-backed securities, which have prepayment provisions, are assigned to a maturity category based on estimated average lives. Securities are shown at their fair values, which include the market value adjustments for AFS securities.
|
Furthermore, during the fourth quarter of 2023, the Company received proceeds of $1,067 from the sale of four U.S. Government securities totaling $1,090. This was the result of unwinding the Captive, which ceased operations in December 2023.
In addition, a decrease in long-term reinvestment rates during the fourth quarter of 2023 led to a $4,090 increase in the fair value associated with the Company’s AFS securities at December 31, 2023. The fair value of an investment security moves inversely to interest rates, so as rates decreased, the unrealized loss in the portfolio was decreased causing the fair value to increase. These changes in rates are typical and do not impact earnings of the Company as long as the securities are held to full maturity.
The Company’s focus will be to continue generating interest revenue primarily through loan growth, as loans generate the highest yields of total earning assets. Table III provides a summary of the securities portfolio by category and remaining contractual maturity. Issues classified as equity securities have no stated maturity date and are not included in Table III.
LOANS
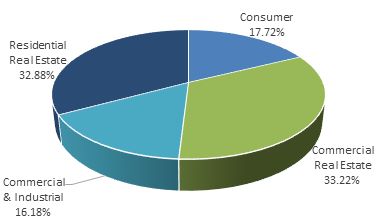
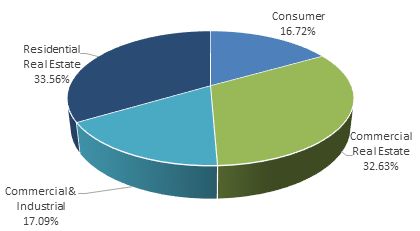
In 2023, the Company’s primary category of earning assets and most significant source of interest income, total loans, increased $86,851, or 9.8%, to $971,900. The increase in loan balances came from all of the Company’s loan segments.
Loan Portfolio Composition
| |
at December 31, 2023
| at December 31, 2022
|
| |
Management continues to place emphasis on its commercial lending, which generally yields a higher return on investment as compared to other types of loans. The commercial lending segment increased $40,205, or 9.1%, from year-end 2022, which came mostly from commercial real estate loans. The commercial real estate loan segment comprised the largest portion of the Company’s total loan portfolio at December 31, 2023, representing 33.2% of such portfolio. Commercial real estate consists of owner-occupied, nonowner-occupied and construction loans. Owner-occupied loans consist of nonfarm, nonresidential properties. A commercial owner-occupied loan is a borrower purchased building or space for which the repayment of principal is dependent upon cash flows from the ongoing operations conducted by the party, or an affiliate of the party, who owns the property. Owner-occupied loans of the Company include loans secured by hospitals, churches, and hardware and convenience stores. Nonowner-occupied loans are property loans for which the repayment of principal is dependent upon rental income associated with the property or the subsequent sale of the property, such as apartment buildings, condominiums, hotels, and motels. These loans are primarily impacted the level of interest rates associated with the debt and to local economic conditions, which dictate occupancy rates and the amount of rent charged. The increase in debt service due to higher interest rates may not be able to be passed on to tenants. As part of the origination process, loan interest rates and occupancy rates are stressed to determine the impact on the borrower’s ability to maintain adequate debt service under different economic conditions. Furthermore, the Company monitors the concentration in any one industry and has established limits relative to capital. In addition, credit quality trends are monitored by industry to determine if a change in the risk exposure to a certain industry may warrant a change in our underwriting standards. Table IV has been provided to illustrate the industry composition of the commercial real estate portfolio. Commercial construction loans are extended to individuals as well as corporations for the construction of an individual property or multiple properties and are secured by raw land and the subsequent improvements. Commercial real estate also includes loan participations with other banks outside the Company’s primary market area. Although the Company is not actively seeking to participate in loans originated outside its primary market area, it has taken advantage of the relationships it has with certain lenders in those areas where the Company believes it can profitably participate with an acceptable level of risk. Commercial real estate loans totaled $322,894 at December 31, 2023, an increase of $34,139, or 11.8%, over the balance of commercial real estate loans at year-end 2022. Most of this growth came from larger originations from construction loans, with balances increasing $29,132, or 87.7%, from year-end 2022. New originations during 2023 also contributed to growth in the owner-occupied commercial loan portfolio, increasing $9,637, or 13.3%, from year-end 2022. Partially offsetting these increases were larger payoffs from nonowner-occupied loan originations, which decreased $4,630, or 2.5%, from year-end 2022.
COMMERCIAL REAL ESTATE BY INDUSTRY
As of December 31, 2023
Table IV
The following table provides the composition of commercial real estate loans by industry classification (as defined by the North American Industry Classification System).
(dollars in thousands) | | | | | | |
| | Amount | | | % of Total | |
Real Estate Rental and Leasing | | $ | 145,302 | | | | 45.00 | % |
Accommodation and Food Services | | | 50,421 | | | | 15.61 | % |
Health Care and Social Assistance | | | 24,628 | | | | 7.63 | % |
Construction | | | 22,490 | | | | 6.96 | % |
Manufacturing | | | 20,688 | | | | 6.41 | % |
Retail Trade | | | 17,714 | | | | 5.49 | % |
All Other | | | 41,651 | | | | 12.90 | % |
Total | | $ | 322,894 | | | | 100.00 | % |
Commercial loans were also positively impacted by growth in commercial and industrial loans. Commercial and industrial loans consist of loans to corporate borrowers primarily in small to mid-sized industrial and commercial companies that include service, retail, and wholesale merchants. Collateral securing these loans includes equipment, inventory, and stock. During 2023, the commercial and industrial loan portfolio increased $6,066, or 4.0%, from year-end 2022. The growth was impacted by an increase in larger loan originations during the year.
The Company’s loan balances were also impacted by an increase in the consumer loan portfolio, which was up $24,178, or 16.3%, from year-end 2022. The Company’s consumer loans are primarily secured by automobiles, mobile homes, recreational vehicles, and other personal property. Personal loans and unsecured credit card receivables are also included as consumer loans. Leading the growth in consumer loans was an increase in other consumer loans of $9,452, or 14.5%, from year-end 2022. This growth came largely from the purchase of a pool of unsecured loans in January 2023 that had a carrying amount of $ 11,377 at December 31, 2023. Growth in consumer loans also resulted from an $8,102, or 29.2%, increase in home equity lines of credit, specifically from the impact of a new home equity line product with no closing costs that was introduced in 2022, and continued to grow during 2023. Also impacting growth in consumer loans were higher automobile loan balances of $6,624, or 12.1%, from year-end 2022. Automobile loans increased primarily due to a resurgence in consumer spending during 2022 that continued to carry over into 2023, in large part from the indirect auto lending portfolio. Going forward, the Company will place more emphasis on loan portfolios (i.e. commercial and, to a smaller extent, residential real estate) with higher returns than auto loans. Indirect automobile loans bear additional costs from dealers that partially offset interest revenue and lower the rate of return.
MATURITY AND REPRICING DATA OF LOANS
As of December 31, 2023
Table V
| (dollars in thousands) | | | | | | | | | | | | | | |
| | Within One Year | | | After One but Within Five Years | | | After Five but Within Fifteen Years | | | After Fifteen Years | | | Total |
Residential real estate loans | | $ | 63,948 | | | $ | 197,328 | | | $ | 53,954 | | | $ | 4,274 | | | $ | 319,504 |
Commercial real estate loans | | | 89,420 | | | | 199,993 | | | | 32,836 | | | | 645 | | | | 322,894 |
Commercial and industrial loans | | | 50,170 | | | | 41,792 | | | | 39,773 | | | | 25,563 | | | | 157,298 |
Consumer loans(1) | | | 66,593 | | | | 70,595 | | | | 35,016 | | | | ---- | | | | 172,204 |
Total loans | | $ | 270,131 | | | $ | 509,708 | | | $ | 161,579 | | | $ | 30,482 | | | $ | 971,900 |
Loans maturing or repricing after one year with: | | Variable Interest Rates | | | Fixed Interest Rates | | | Total | |
Residential real estate loans | | $ | 207,515 | | | $ | 48,041 | | | $ | 255,556 | |
Commercial real estate loans | | | 198,873 | | | | 34,601 | | | | 233,474 | |
Commercial and industrial loans | | | 27,730 | | | | 79,398 | | | | 107,128 | |
Consumer loans(1) | | | 84 | | | | 105,527 | | | | 105,611 | |
| Total loans | | $ | 434,202 | | | $ | 267,567 | | | $ | 701,769 | |
(1) Includes automobile, home equity and other consumer loans.
Generating residential real estate loans remains a significant focus of the Company’s lending efforts. The residential real estate loan portfolio represents the second largest class of the Company’s overall loan portfolio at 32.9% and consists primarily of one- to four-family residential mortgages and carries many of the same customer and industry risks as the commercial loan portfolio. During 2023, mortgage rates continued to increase as a result of an elevated interest rate environment. This provided the Company with less opportunities to sell long-term fixed-rate residential mortgages to the Federal Home Loan Mortgage Corporation, which generated more loan origination opportunities for the Bank in 2023. As a result, residential real estate loans increased $22,468, or 7.6%, during 2023 as compared to year-end 2022. With elevated mortgage rates, mortgage customers were selecting more in-house variable rate mortgage products instead of long-term fixed rate products. This had a direct impact on lowering loan volume within the long-term fixed-rate loan portfolio (down $6,161) and contributed to a shift into more short-term adjustable-rate mortgages (up $29,443) at year-end 2023.
While management believes lending opportunities exist in the Company’s markets, future commercial lending activities will depend upon economic and related conditions, such as general demand for loans in the Company’s primary markets, interest rates offered by the Company, and the effects of competitive pressure and normal underwriting considerations. Management will continue to place emphasis on its commercial lending, which generally yields a higher return on investment as compared to other types of loans.
The Company will continue to sell a portion of its long-term fixed-rate loans to the secondary market even though there is no significant demand for such loans under the current rising rate environment. Furthermore, the Company will continue to monitor the pace of its loan volume and will remain consistent in its approach to sound underwriting practices with a focus on asset quality.
ALLOWANCE FOR CREDIT LOSSES
Tables VI and VII have been provided to enhance the understanding of the loan portfolio and the ACL. The Company maintains an ACL that represents management’s best estimate of the appropriate level of losses and risks inherent in our applicable financial assets under the CECL model. The amount of the ACL should not be interpreted as an indication that charge-offs in future periods will necessarily occur in those amounts, or at all. The determination of the ACL involves a high degree of judgement and subjectivity. Please refer to Note A – Summary of Significant Accounting Policies of the notes to the financial statements for discussion regarding our ACL methodologies for securities and loans.
For AFS debt securities, the Company evaluates the securities at each measurement date to determine whether the decline in the fair value below the amortized costs basis is due to credit-related factors or noncredit-related factors. Upon adoption of ASC 326 on January 1, 2023, and as of December 31, 2023, the Company determined that all AFS securities that experienced a decline in fair value below the amortized cost basis were due to non-credit related factors. Therefore, no ACL was recorded, and no provision expense was recognized during the year ended December 31, 2023.
For held to maturity (“HTM”) debt securities, the Company evaluates the securities collectively by major security type at each measurement date to determine expected credit losses based on issuer’s bond rating, historical loss, financial condition, and timely principal and interest payments. Upon adoption of ASC 326 on January 1, 2023, a $3 ACL was recognized based on a .03% cumulative default rate taken from the S&P and Moody’s bond rating index. At December 31, 2023, the ACL for HTM debt securities was reduced to $2 based on a decrease in the cumulative default rate from .03% to .02%. This resulted in a $1 recovery of provision expense during the year ended December 31, 2023.
For loans, the Company’s ACL is management’s estimate of expected lifetime credit losses, measured over the contractual life of a loan, that considers historical loss experience, current conditions, and forecasts of future economic conditions. The ACL on loans is established through a provision for credit losses recognized in earnings. The ACL on loans is reduced by charge-offs on loans and is increased by recoveries of amounts previously charged off. Management employs a process and methodology to estimate the ACL on loans that evaluates both quantitative and qualitative factors within two main components. The first component involves pooling loans into portfolio segments for loans that share similar risk characteristics. The second component involves individually analyzed loans that do no share similar risk characteristics with loans that are pooled into portfolio segments. The ACL for loans with similar risk characteristics are collectively evaluated for expected credit losses based on certain quantitative information that include historical loss rates, prepayment rates, and curtailment rates. Expected credit losses on loans with similar characteristics are also determined by certain qualitative factors that include national unemployment rates, national gross domestic product forecasts, changes in lending policy, quality of loan review, and delinquency status. The ACL for loans that do not share similar risk characteristics are individually evaluated for expected credit losses primarily based on foreclosure status and whether a loan is collateral-dependent. Expected credit losses on individually evaluated loans are then determined using the present value of expected future cash flows based upon the loan’s original effective interest rate, at the loan’s observable market price, or if the loan was collateral dependent, at the fair value of the collateral.
ALLOCATION OF THE ALLOWANCE FOR LOAN LOSSES
Table VI
| (dollars in thousands) | | | | | | |
| | | Years Ended December 31 | |
| | | 2023 | | | 2022 | |
Residential real estate loans | | $ | 2,213 | | | $ | 681 | |
Percentage of loans to total loans | | | 32.87 | % | | | 33.56 | % |
| Percentage of net charge-offs to average loans | | | .02 | % | | | -.01 | % |
| | | | | | | | | |
Commercial real estate loans | | | 3,047 | | | | 2,038 | |
Percentage of loans to total loans | | | 33.22 | % | | | 32.63 | % |
| Percentage of net charge-offs to average loans | | | -.01 | % | | | -.02 | % |
| | | | | | | | | |
Commercial and industrial loans | | | 1,275 | | | | 1,293 | |
Percentage of loans to total loans | | | 16.18 | % | | | 17.09 | % |
| Percentage of net charge-offs to average loans | | | -.12 | % | | | .38 | % |
| | | | | | | | | |
Consumer loans(1) | | | 2,232 | | | | 1,257 | |
Percentage of loans to total loans | | | 17.72 | % | | | 16.73 | % |
| Percentage of net charge-offs to average loans | | | .51 | % | | | .50 | % |
| | | | | | | | | |
Allowance for loan losses | | $ | 8,767 | | | $ | 5,269 | |
Total loans percentage | | | 100.00 | % | | | 100.00 | % |
Net charge-offs to average loans | | | .07 | % | | | .14 | % |
The above allocation is based on estimates and subjective judgments and is not necessarily indicative of the specific amounts or loan categories in which losses may ultimately occur.
(1) Includes automobile, home equity and other consumer loans.
CREDIT RATIOS
Table VII
| (dollars in thousands) | | | | | | |
| | | Years Ended December 31 | |
| | | 2023 | | | 2022 | |
Loans | | $ | 971,900 | | | $ | 885,049 | |
Allowance for loan losses | | | 8,767 | | | | 5,269 | |
| Past due 90 days or more and still accruing | | | 119 | | | | 538 | |
Nonaccrual | | | 2,392 | | | | 3,233 | |
Allowance for loan losses to total loans | | | .90 | % | | | .60 | % |
Nonaccrual loans to total loans | | | .25 | % | | | .37 | % |
| Allowance for loan losses to nonaccrual loans | | | 366.51 | % | | | 162.98 | % |
Management formally considers placing a loan on nonaccrual status when collection of principal or interest has become doubtful. Furthermore, generally, a loan is not returned to accrual status unless either all delinquent principal or interest has been brought current or the loan becomes well secured and is in the process of collection.
As of December 31, 2023, the ACL for loans totaled $8,767, or 0.90%, of total loans. As of December 31, 2022, the ACL for loans totaled $5,269, or 0.60%, of total loans. The increase in the ACL of $3,498, or 66.4%, was primarily due to the $2,162 impact of adopting ASC 326 on January 1, 2023, affected mostly by the residential real estate and consumer loan portfolio segments. Upon transition to the CECL model, the Company’s ACL increased another $1,336 to finish with $8,767 in reserves, all from loans collectively evaluated. This increase was mostly impacted by additional reserves associated with certain qualitative risk factors incorporating the national trend of higher loan delinquencies and charge offs. Higher ACL reserves were also impacted by an $86,109 increase in collectively evaluated loan balances during 2023, primarily from the commercial real estate and consumer loan segments. These factors were partially offset by lower expected loss rates in relation to an improved unemployment and gross domestic product forecast.
The Company experienced lower delinquency levels from year-end 2022. Nonperforming loans to total loans decreased to 0.26% at December 31, 2023, compared to 0.43% at December 31, 2022, and nonperforming assets to total assets decreased to 0.19% at December 31, 2023, compared to 0.31% at December 31, 2022.
During 2023, the Company individually evaluated several loans associated with three borrower relationships for expected credit loss. The fair value of the loans’ collateral was measured to the loans’ recorded investment and no expected losses were identified as part of that review. As a result, there were no specific reserves recorded during the year ended December 31, 2023.
Management believes that the ACL at December 31, 2023, was appropriate to absorb expected losses in the loan portfolio. Changes in the circumstances of particular borrowers, as well as adverse developments in the economy, are factors that could change, and management will make adjustments to the ACL as needed. Asset quality will continue to remain a key focus of the Company as management continues to stress not just loan growth, but quality in loan underwriting.
DEPOSITS
Deposits are used as part of the Company’s liquidity management strategy to meet obligations for depositor withdrawals, to fund the borrowing needs of loan customers, and to fund ongoing operations. Deposits, both interest- and noninterest-bearing, continue to be the most significant source of funds used by the Company to support earning assets. Deposits are attractive sources of funding because of their stability and general low cost as compared to other funding sources. The Company seeks to maintain a proper balance of core deposit relationships on hand while also utilizing various wholesale deposit sources, such as brokered and internet CD balances, as an alternative funding source to manage efficiently the net interest margin. Deposits are influenced by changes in interest rates, economic conditions, and competition from other banks.
Total deposits consist mostly of “core” deposits, which include noninterest-bearing deposits, as well as interest-bearing demand, savings, and money market deposits. The Bank focuses on core deposit relationships with consumers from local markets who can maintain multiple accounts and services at the Bank. The Company believes such core deposits are more stable and less sensitive to changing interest rates and other economic factors. Total deposits increased $99,481, or 9.7%, from year-end 2022 to $1,127,136 at December 31, 2023. The increase was largely related to higher interest-bearing deposit balances, which were up $131,672, or 19.6%, from year-end 2022.
The increase in interest-bearing deposits came primarily from time deposits, which include CDs and individual retirement accounts. Total time deposits increased $227,204, or 149.6%, from year-end 2022. This increase came largely from the Company’s retail time deposits, which increased $156,876, or 108.4%, from year-end 2022 largely due to the elevated market rate environment. While the FRB increased short-term rates by 425 basis points during 2022, there was a lagging effect to the repricings of CD rate offerings during that time. This was primarily due to a heightened liquidity position that allowed for limited effects to deposit repricing during most of 2022. As deposit competition increased later in 2022 and into 2023, prices on the Company’s retail CDs adjusted upward and influenced a consumer shift away from lower-cost savings and money market products and into a greater number of higher-cost time deposit products, such as CDs. Further increasing time deposit balances were increases in wholesale time deposits. While the Company’s preference is to fund earning asset demand with retail core deposits, wholesale deposits are utilized to help satisfy earning asset growth. Due to the successful consumer demand for loans during 2023, brokered and internet CD issuances increased from $7,220 at year-end 2022 to $77,548 at year-end 2023. The Company will continue to evaluate its use of wholesale deposits to manage the Company’s liquidity position and interest rate risk associated with longer-term, fixed-rate asset loan demand.
Increases in interest-bearing time deposit balances were partially offset by a $39,336, or 18.8%, decrease in NOW account balances from year-end 2022, largely driven by lower municipal NOW product balances within the Gallia County, Ohio, and Mason County, West Virginia, market areas. Other decreases came from lower savings account balances, which decreased $30,638, or 19.9%, from year-end 2022. Declines in these balances came primarily from lower statement savings account balances impacted by a consumer demand for time deposits. The Company also experienced a $25,558, or 16.3%, decrease in its money market accounts from year-end 2022. In response to the elevated rate environment, the Company introduced a new tiered money market product in January 2023 (Money Fund) that offered higher rates on tiered deposit balances. While this new deposit product increased $80,828 during 2023, this was completely offset by a $106,386 decrease in the remaining money market products that did not reprice to higher rates. In general, the elevated rates on CD products and deposit rate competition contributed to a consumer shift away from NOW, savings and money market accounts.
Composition of Total Deposits
| |
at December 31, 2023
| at December 31, 2022
|
| |
The Company also experienced declines in its noninterest-bearing balances, which decreased $32,191, or 9.1%, from year-end 2022. The decrease was primarily the result of deposit competition and consumer demand for CDs and came mostly from the Company’s business and incentive-based checking account balances.
The Company expects to continue to experience increased competition for deposits in its market areas, which could challenge its net growth. The Company will continue to emphasize growth and retention within its core deposit relationships during 2024, reflecting the Company’s efforts to reduce its reliance on higher cost funding and improving net interest income.
OTHER BORROWED FUNDS
The Company also accesses other funding sources, including short-term and long-term borrowings, to fund potential asset growth and satisfy short-term liquidity needs. Other borrowed funds consist primarily of FHLB advances and promissory notes. During 2023, other borrowed funds increased from $17,945 at year-end 2022 to $44,593, an increase of $26,648. The increase was primarily related to a $10,000 FHLB fixed-rate advance from the second quarter of 2023 and $20,000 in FHLB fixed-rate advances from the third quarter of 2023 that were used to help fund earning asset growth. While deposits continue to be the primary source of funding for growth in earning assets, management will continue to utilize FHLB advances and promissory notes to help manage interest rate sensitivity and liquidity.
SUBORDINATED DEBENTURES
The Company received proceeds from the issuance of one trust preferred security on March 22, 2007, totaling $8,500 at a fixed rate of 6.58%. The trust preferred security is now at an adjustable rate equal to the 3-month CME Term SOFR index plus a spread adjustment of 0.26% and a margin of 1.68%. The Company does not report the securities issued by the trust as a liability, but instead, reports as a liability the subordinated debenture issued by the Company and held by the trust.
OFF-BALANCE SHEET ARRANGEMENTS
As discussed in Notes I and L to the financial statements at December 31, 2023 and 2022, the Company engages in certain off-balance sheet credit-related activities, including commitments to extend credit and standby letters of credit, which could require the Company to make cash payments in the event that specified future events occur. Commitments to extend credit are agreements to lend to a customer as long as there is no violation of any condition established in the contract. Commitments generally have fixed expiration dates or other termination clauses and may require payment of a fee. Standby letters of credit are conditional commitments to guarantee the performance of a customer to a third party. While these commitments are necessary to meet the financing needs of the Company’s customers, many of these commitments are expected to expire without being drawn upon. Therefore, the total amount of commitments does not necessarily represent future cash requirements. Management does not anticipate that the Company’s current off-balance sheet activities will have a material impact on the results of operations or financial condition. The Bank estimates expected credit losses over the contractual period in which the Bank is exposed to credit risk via a contractual obligation to extend credit. At December 31, 2023, the estimated ACL related to off-balance sheet commitments was $692, which included $61 in provision expense during the year ended December 31, 2023. The Bank uses the same credit policies in making commitments and conditional obligations as it does for instruments recorded on the balance sheet.
CAPITAL RESOURCES
Federal regulators have classified and defined capital into the following components: (i) Tier 1 capital, which includes tangible shareholders’ equity for common stock, qualifying preferred stock and certain qualifying hybrid instruments, and (ii) Tier 2 capital, which includes a portion of the allowance for loan losses, certain qualifying long-term debt, preferred stock and hybrid instruments which do not qualify as Tier 1 capital.
In September 2019, consistent with Section 201 of the Economic Growth, Regulatory Relief, and Consumer Protection Act, the federal banking agencies issued a final rule providing simplified capital requirements for certain community banking organizations (banks and holding companies). Under the rule, a qualifying community banking organization (“QCBO”) is eligible to opt into the Community Bank Leverage Ratio (“CBLR”) framework in lieu of the Basel III capital requirements if it has less than $10 billion in total consolidated assets, limited amounts of certain trading assets and liabilities, limited amounts of off-balance sheet exposure and a leverage ratio greater than 9.0%. The new rule took effect January 1, 2020, and QCBOs were allowed to opt into the new CBLR framework in their Call Report beginning the first quarter of 2020.
A QCBO opting into the CBLR framework must maintain a CBLR of 9.0%, subject to a two quarter grace period to come back into compliance, provided that the QCBO maintains a leverage ratio of more than 8.0% during the grace period. A QCBO failing to satisfy these requirements must comply with the existing Basel III capital requirements as implemented by the banking regulators in July 2013.
The Bank opted into the CBLR, and therefore, is not required to comply with the Basel III capital requirements. The numerator of the CBLR is Tier 1 capital, as calculated under present rules. The denominator of the CBLR is the QCBO’s average assets, calculated in accordance with the QCBO’s Call Report instructions and less assets deducted from Tier 1 capital. The current rules and Call Report instructions were impacted by the Company’s adoption of ASC 326 and its election to apply the 3-year CECL transition provision on January 1, 2023. By making this election, the Bank, in accordance with Section 301 of the regulatory capital rules, will increase it retained earnings (Tier 1 Capital) and average assets by 75% of its CECL transition amount during the first year of the transition period, 50% of its CECL transition amount during the second year, and 25% of its CECL transitional amount during the third year of the transition period. The Bank’s transition amount from the adoption of CECL totaled $2,276, which resulted in the add-back of $1,707 to both Tier 1 capital and average assets as part of the CBLR calculation for December 31, 2023. As of December 31, 2023, the Bank’s CBLR was 10.8%.
Pursuant to the CARES Act, the federal banking regulators in April 2020 issued interim final rules to set the CBLR at 8% beginning in the second quarter of 2020 through the end of 2020. Beginning in 2021, the CBLR increased to 8.5% for the calendar year. Community banks had until January 1, 2022 before the CBLR requirement returned to 9%.
As detailed in Note P to the financial statements at December 31, 2023, the Bank was deemed to be “well capitalized” under applicable prompt corrective action regulations. The Company’s total shareholders’ equity at December 31, 2023 of $144,007 increased $8,979, or 6.7%, as compared to $135,028 at December 31, 2022. Capital grew during 2023 primarily from year-to-date net income of $12,631, less dividends paid of $4,871. This net growth was further impacted by a $3,385 after-tax increase in net unrealized gains on AFS securities from year-end 2022, as long-term reinvestment rates decreased during the fourth quarter of 2023 causing an increase in the fair value of the Company’s available for s ale investment portfolio. Partially offsetting these growth factors was a transition adjustment related to the adoption of ASC 326. The after-tax impact from the adoption of ASC 326 totaled $2,209 and was applied against retained earnings effective January 1, 2023.
LIQUIDITY
Liquidity relates to the Company’s ability to meet the cash demands and credit needs of its customers and is provided by the ability to readily convert assets to cash and raise funds in the marketplace. The Company manages funding and liquidity based on point-in-time metrics as well as forward-looking projections, which incorporate different sources and uses of funds under base and stress scenarios. Liquidity risk is monitored and managed by the Asset Liability Committee using a series of policy limits and key risk indicators are established to ensure risks are managed within the Company’s risk tolerance. The Company maintains a contingency funding plan that provides for liquidity stress testing, which assesses the liquidity needs under varying market conditions, time horizons and other events. The stress testing provides for ongoing monitoring of unused borrowing capacity and available sources of contingent liquidity to prepare for unexpected liquidity needs and to cover unanticipated events that could affect liquidity.
Total cash and cash equivalents, HTM securities maturing within one year, and AFS securities, which totaled $290,781, represented 21.5% of total assets at December 31, 2023 compared to $230,853 and 19.1% of total assets at December 31, 2022. This growth in liquid funds came primarily from increases in deposits, as well as increases in borrowings and net proceeds from maturities and paydowns of securities. A large portion of these dollars were used to fund the 9.8% growth in loans. Increases in deposits were largely impacted by growth in time deposits, which increased 149.6% from year-end 2022.
In addition to the on-balance sheet liquidity discussed above, the Bank has established multiple sources of funding to further enhance the Bank’s ability to meet liquidity demands. The Bank has pledged collateral to the FHLB and the FRB to establish committed borrowing lines. At December 31, 2023, the Bank could borrow an additional $88,183 from the FHLB and the borrowing line with the FRB had availability of $62,371. For each of these sources, the Bank has established an internal limit of 85% of our borrowing capacity. In addition to the committed borrowing lines, the Bank has access to several wholesale funding sources, such as, brokered CDs, a $20 million federal funds purchase limit with a correspondent bank, and the ability to bid on available funds from select deposit placement services. The Bank has established limits for each respective funding source and a collective limit on all wholesale funding sources. During 2023, the Bank mostly utilized brokered CDs and the FHLB to assist with funding loan growth. The Bank’s internal limit on brokered CDs is 10% of total assets. At December 31, 2023, the amount of brokered CDs outstanding was 4.86% of total assets, as compared to .33% at December 31, 2022. At December 31, 2023, the Bank had utilized 51.74% of our FHLB capacity, an increase from 49.58% at December 31, 2022. The collective internal limit on all wholesale funding sources is 40% of total assets. At December 31, 2023, the Bank’s total wholesale funding sources represented 14.02% of total assets. Based on the collective internal wholesale funding limit, the Bank had the capacity to borrow an additional $347 million in wholesale funds and the available funding from the respective wholesale funding sources exceeded this amount, which provides the flexibility to utilize one source more than another due to pricing or availability.
As part of performing liquidity stress tests, the Bank monitors and evaluates the exposure to uninsured deposits. Of the Company’s $1,127,136 in total deposit balances at December 31, 2023, only 32.5%, or $366,649, were deemed uninsured as per the $250 FDIC threshold. A portion of these deposits would be related to public entities, which require the Bank to pledge securities or FHLB letters of credit to cover the amount of the deposit balance that is deemed uninsured. To the extent these deposits left the Bank, the level of unpledged securities and the borrowing capacity at the FHLB would increase or could be utilized to fund the deposit outflow. The sum of current on-balance sheet liquidity and available wholesale funding sources exceeded the balance of uninsured deposits at December 31, 2023. Included in on-balance sheet liquidity are AFS securities in an unrealized loss position. Although management does not intend to sell the securities before the recovery of its cost basis, they are a contingent resource from a liquidity perspective.
| | 2023 | | | 2022 | | | 2021 | | | 2020 | | | 2019 | |
| | | | | | | | | | | | | | | | |
Return on average assets | | | .99 | % | | | 1.06 | % | | | .95 | % | | | .94 | % | | | .96 | % |
Return on average equity | | | 9.24 | % | | | 9.86 | % | | | 8.45 | % | | | 7.83 | % | | | 8.10 | % |
Dividend payout ratio | | | 38.56 | % | | | 35.39 | % | | | 34.25 | % | | | 39.20 | % | | | 40.37 | % |
Average equity to average assets | | | 10.72 | % | | | 10.78 | % | | | 11.25 | % | | | 11.95 | % | | | 11.82 | % |
As our liquidity position dictates, the preceding funding sources may be utilized to supplement our liquidity position. If the utilization of wholesale funding increases to fund asset growth or for liquidity management purposes, the net interest margin may be negatively impacted due to the higher relative cost of these sources as compared to core deposits. For further cash flow information, see the condensed consolidated statement of cash flows. Management does not rely on any single source of liquidity and monitors the level of liquidity based on many factors affecting the Company’s financial condition.
INFLATION
Consolidated financial data included herein has been prepared in accordance with US GAAP. Presently, US GAAP requires the Company to measure financial position and operating results in terms of historical dollars with the exception of securities AFS, which are carried at fair value. Changes in the relative value of money due to inflation or deflation are generally not considered.
In management’s opinion, changes in interest rates affect the financial institution to a far greater degree than changes in the inflation rate. While interest rates are greatly influenced by changes in the inflation rate, they do not change at the same rate or in the same manner as the inflation rate. Rather, interest rate volatility is based on changes in the expected rate of inflation, as well as monetary and fiscal policies. A financial institution’s ability to be relatively unaffected by changes in interest rates is a good indicator of its capability to perform in today’s volatile economic environment. The Company seeks to insulate itself from interest rate volatility by ensuring that rate sensitive assets and rate sensitive liabilities respond to changes in interest rates in a similar time frame and to a similar degree.
CRITICAL ACCOUNTING POLICIES
The Company believes the determination of the ACL involves a higher degree of judgment and complexity than its other significant accounting policies. The ACL is calculated with the objective of maintaining a reserve level believed by management to be sufficient to absorb estimated credit losses over the life of an asset or off-balance sheet credit exposure. Management’s determination of the adequacy of the ACL is based on periodic evaluations of past events, including historical credit loss experience on financial assets with similar risk characteristics, current conditions, and reasonable and supportable forecasts that affect the collectability of the remaining cash flows over the contractual term of the financial assets. However, this evaluation has subjective components requiring material estimates, including expected default probabilities, the expected loss given default, the amounts and timing of expected future cash flows on impaired loans, and estimated losses based on historical loss experience and forecasted economic conditions. All of these factors may be susceptible to significant change. To the extent that actual results differ from management estimates, additional provisions for credit losses may be required that would adversely impact earnings in future periods. Refer to “Allowance for Credit Losses” and “Provision for Credit Losses” sections within this MD&A for additional discussion.
CONCENTRATIONS OF CREDIT RISK
The Company maintains a diversified credit portfolio, with residential real estate loans currently comprising the most significant portion. Credit risk is primarily subject to loans made to businesses and individuals in southeastern Ohio and western West Virginia. Management believes this risk to be general in nature, as there are no material concentrations of loans to any industry or consumer group. To the extent possible, the Company diversifies its loan portfolio to limit credit risk by avoiding industry concentrations.