UNITED STATES
SECURITIES AND EXCHANGE COMMISSION
WASHINGTON, D.C. 20549
FORM N-CSR
CERTIFIED SHAREHOLDER REPORT OF REGISTERED
MANAGEMENT INVESTMENT COMPANIES
Investment Company Act file number: 811-07384
NICHOLAS-APPLEGATE INSTITUTIONAL FUNDS
(Exact name of registrant as specified in charter)
600 WEST BROADWAY, 30TH FLOOR, SAN DIEGO, CA 92101
(Address of principal executive offices) (Zip Code)
Charles H. Field, Jr.
c/o Nicholas-Applegate Capital Management
600 West Broadway, 30th Floor
San Diego, CA 92101
(Name and address of agent for service)
Copy to:
Deborah A. Wussow
c/o Nicholas-Applegate Capital Management
600 West Broadway, 30th Floor
San Diego, CA 92101
Registrant's telephone number, including area code: (619) 687-2988
Date of fiscal year end: March 31
Date of reporting period: March 31, 2008
ITEM 1. REPORTS TO STOCKHOLDERS.
March 31, 2008 Annual Report
Class I, II, III & IV Shares
U.S. Micro Cap
U.S. Emerging Growth
U.S. Ultra Micro Cap
U.S. Systematic Large Cap Growth
U.S. Small to Mid Cap Growth
U.S. Convertible
Global Select
International Growth
International Growth Opportunities
Emerging Markets
International Systematic
International All Cap Growth
U.S. High Yield Bond
LETTER TO SHAREHOLDERS
Dear Fellow Shareholder,
The fiscal year ended March 31, 2008 was an eventful time in the global financial markets. Rising defaults on U.S. subprime mortgages ignited a credit crisis in the United States that reverberated around the world. Stock prices became volatile as the crisis unfolded, and equity markets in most developed countries ended the period with losses in local currency terms.
In this annual report, we review the performance of the financial markets and our mutual funds from April 1, 2007 through March 31, 2008. We also highlight some of the key themes that drove investment returns and share our outlook for the future.
The broad U.S. equity market, as measured by the S&P 500 Index, fell 5.1% during the fiscal year. After hitting a record high in July 2007, the index retreated over the summer as problems in the credit markets began to develop. Losses on mortgage-backed securities made lenders and investors less willing to assume risk, and financial institutions holding the securities were flooded with margin calls and redemption requests. To reduce leverage and raise cash, they sold their most liquid assets, including stocks. Monetary easing from the Federal Reserve helped send the S&P 500 Index to another peak in October, but the rally was short lived amid further deterioration in the housing and credit markets and weak economic data. In early 2008, the Fed stepped up its efforts to bolster the financial system and economy, which sparked an equity rally near the end of the period.
Stock markets in developed countries outside the United States also were weak, with the MSCI EAFE Index falling 14.4% in local currencies and 2.3% in U.S. dollars. Similar to their U.S. counterparts, European financial institutions reported a staggering amount of credit-related writedowns. Japanese banks had relatively limited U.S. mortgage exposure; however, worries that currency strength would slow exports weighed on equity prices in Japan, as well as in Europe. The yen rose 15.4% and the euro gained 18.2% versus the U.S. dollar, which was weakened by six interest rate cuts from the Fed and concerns about a potential U.S. recession.
Other central banks, including the European Central Bank, did not lower rates, since they were more focused on controlling inflation against a backdrop of rising commodity prices. The Commodity Research Bureau (CRB) Index increased 22.1% during the period and contributed to the 21.7% gain in the MSCI Emerging Markets Index (U.S. dollars). In addition to buoyant commodity prices, many developing countries benefited from robust domestic consumption, including China and India.
We are proud of how our family of mutual funds performed in the volatile environment. Eight of the ten funds that we manage using traditional investment processes outpaced their benchmarks. The two that trailed were the U.S. Ultra Micro Cap Fund, launched in January 2008, and the U.S. Small to Mid Cap Growth Fund, launched in July 2007. Both are growth-oriented funds whose short track records were impacted by the fact that smaller U.S. companies with high expected earnings growth rates turned in the weakest stock price performance in early 2008. Of the three funds that we manage using systematic approaches, one performed in line with its benchmark and two lagged. The unprecedented housing-induced credit crisis led to unusual moves in stock prices, particularly in August and January. These market dislocations were inherently difficult to model and, thus, a challenge for systematic strategies in general.
We are pleased to report that our Global Select Fund celebrated its ten-year anniversary during the fiscal year. The Fund gained 14.49% (annualized) from its September 30, 1997 inception through March 31, 2008, outperforming the 6.23% increase in the MSCI All Country World Index. We also are pleased to report the recent launch of 130/30 strategies, which seek to deliver more alpha than long-only approaches without a corresponding increase in risk. Beginning April 1, 2008, we will offer Global Equity 130/30 as a mutual fund. The new fund will capitalize on several of our primary strengths, including fundamental research, quantitative analysis and short selling.
From an organizational perspective, we continued to enhance our business infrastructure throughout the period. For example, we completed a firmwide upgrade to our desktop computers and tested a state-of-the art trading system, which will be implemented in 2008. In addition, we strengthened our human resources by welcoming a number of talented professionals to the company, including a senior portfolio manager, several analysts, a compliance officer and an equity trader. The qualities of the firm that help us attract exceptional people were formally recognized in February when Nicholas-Applegate was named a winner in the “California’s Best Places to Work Program.” The award was the result of an in-depth evaluation process that included an assessment of our culture and a survey of more than half of our employees.
Looking ahead, we believe that the world’s equity markets will remain volatile. In the United States, the housing slump, credit crisis and high inflation should continue to suppress economic growth, necessitating additional interest rate cuts from the Federal Reserve. We also expect economic growth to slow outside the United States in both developed and emerging countries and for most central banks to lower interest rates despite elevated price levels. Corporate profit growth will likely be flat, with continued compression in price-to-earnings multiples until current estimates reflect an earnings slowdown.
We believe our mutual funds remain well positioned for the dynamic market environment. We are confident that our focus on making timely investments in companies exhibiting positive, sustainable change will benefit shareholders over the long term.
On behalf of everyone at Nicholas-Applegate, thank you for your participation in the Nicholas-Applegate Institutional Funds. We appreciate the trust you have placed in us.
Best Regards,
/s/ Horacio A. Valeiras
Horacio A. Valeiras, CFA
President and Chief Investment Officer
March 31, 2008
TABLE OF CONTENTS
The Funds’ Review and Outlook, Performance and Schedule of Investments: | |
| U.S. Micro Cap | 1 |
| U.S. Emerging Growth | 5 |
| U.S. Ultra Micro Cap | 9 |
| U.S. Systematic Large Cap Growth | 12 |
| U.S. Small to Mid Cap Growth | 16 |
| U.S. Convertible | 20 |
| Global Select | 25 |
| International Growth | 29 |
| International Growth Opportunities | 33 |
| Emerging Markets | 37 |
| International Systematic | 41 |
| International All Cap Growth | 45 |
| U.S. High Yield Bond | 48 |
The Funds’: | |
| Financial Highlights | 52 |
| Statements of Assets and Liabilities | 60 |
| Statements of Operations | 62 |
| Statements of Changes in Net Assets | 64 |
| Notes to Financial Statements | 68 |
| Report of Independent Registered Public Accounting Firm | 75 |
| Shareholder Expense Example | 76 |
| Supplementary Information | 78 |
This report is authorized for distribution to shareholders and to others only when preceded or accompanied by a currently effective prospectus for Nicholas-Applegate Institutional Funds Class I, II, III & IV Shares. Distributor: Nicholas-Applegate Securities.
U.S. MICRO CAP FUND
Management Team: John C. McCraw, Portfolio Manager; Robert S. Marren, Portfolio Manager; Blake H. Burdine, Analyst; K. Mathew Axline, CFA, Analyst; Stephen W. Lyford, Analyst Chief Investment Officer: Horacio A. Valeiras, CFA
Goal: The U.S. Micro Cap Fund seeks to maximize long-term capital appreciation by investing primarily in U.S. companies with market capitalizations similar to the Russell Microcap Growth Index at time of purchase.
Market Overview: Prices of U.S. micro-cap growth stocks fell sharply from April 1, 2007 through March 31, 2008 in what was a generally weak environment for U.S. equities. Stocks were pressured by a number of factors, such as:
| • | Rapid acceleration in residential mortgage defaults that led to huge writedowns on mortgage-linked securities |
| • | Turbulence in the credit markets, as concerns about default risk prompted banks to slow lending and hoard cash — or dramatically increase lending rates |
| • | Slowdown in the economy, with GDP growth falling from an annual rate of 4.9% in the third quarter of 2007 to 0.6% in the fourth quarter |
Weak corporate earnings further dampened investor sentiment. The fourth quarter of 2007 was the worst reporting season for small companies in six years, driven by poor results from the financials sector, which was hurt by the credit crisis, and the consumer discretionary sector, which struggled as consumers reined in spending.
Equities regained their footing in late March as a series of innovative policy actions from the Federal Reserve helped calm investors’ nerves, including an offer to lend up to $200 billion to primary dealers. The central bank also cut the target funds rate 3% between September and March, its fastest pace of rate cuts in two decades.
Performance: The Fund’s Class I shares lost 13.25% during the fiscal year ended March 31, 2008. The Fund outperformed the Russell Microcap Growth Index, which was down 19.75%.
Portfolio Specifics: Consistent with our bottom-up investment approach, the Fund’s outperformance was driven by stock selection. Stock selection was strongest in the industrials, consumer staples and consumer discretionary sectors, where Lindsay Corp., Darling International and Capella Education were top performers. Lindsay, a manufacturer of irrigation systems, benefited from the favorable price environment for agricultural commodities. Darling International, a recycler of cooking grease, also benefited from commodity-price inflation, which allows it to sell its finished products at higher prices. Capella Education, an online university, reported its seventh consecutive quarter of 20%+ annual enrollment growth.
While stock selection was the main reason for the Fund’s outperformance, sector weightings were another source of relative strength. For example, an underweight in financials was a plus, as financials was one of the market’s worst-performing sectors amid the credit market turmoil. On the negative side, stock selection in the information technology sector detracted due to positions in a variety of industries, including software and semiconductors.
Market Outlook: Weakness in the economy and corporate earnings may continue to weigh on investor sentiment in the months ahead. However, valuations have become more attractive following the recent sell-off in equities, and, on March 31, it was widely expected that the Fed would cut interest rates at least one more time. Easier monetary policy bodes particularly well for smaller stocks, since small companies tend to depend more on bank loans to fund operations than larger firms.
By consistently applying our investment process in all environments, we believe that we will continue to find micro-cap stocks for the Fund that are poised to outperform.
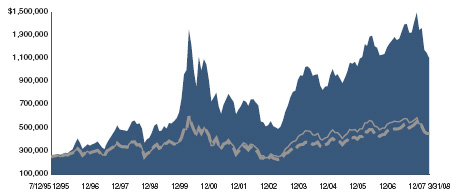
Comparison of Change in Value of a $250,000 Investment in U.S. Micro Cap Fund Class I Shares with the Russell 2000 Growth/Russell Microcap Growth Blend Index and Russell 2000 Growth Index.
| Annualized Total Returns As of 3/31/08 | |||
1 Year | 5 Years | 10 Years | |
| U.S. Micro Cap Fund Class I | -13.25% | 16.60% | 7.10% |
| Russell 2000 Growth Index | -8.94% | 14.24% | 1.75% |
| Russell 2000 Growth/Russell | |||
| Microcap Growth Blend Index | -19.75% | 11.53% | 1.57% |
The graph above shows the value of a hypothetical $250,000 investment in the Fund's Class I shares compared with the Russell 2000 Growth Index and a blended index comprised of the Russell 2000 Growth Index/Russell Microcap Growth Index. The Fund’s Class I shares calculate their performance based upon the historical performance of their corresponding series of Nicholas-Applegate Mutual Funds (renamed ING Mutual Funds), adjusted to reflect all fees and expenses applicable to Class I shares. The Nicholas-Applegate Institutional Funds’ Class I shares were first available on May 7, 1999. Average annual total return figures include changes in principal value, reinvestment dividends, and capital gain distributions. The total returns shown above do not show the effects of income taxes on an individual’s investment. In most cases, taxes may reduce your actual investment returns on income or gains paid by the Fund or any gains you may realize if you sell your shares. Past performance cannot guarantee future results.
The Russell 2000 Growth Index is an unmanaged index comprised of those Russell 2000 companies with higher price-to-book ratios and higher forecasted growth values. The Russell 2000 Growth Index is an unmanaged index generally representative of the 2,000 smallest companies in the Russell 3000 Index, which represents approximately 10% of the total market capitalization of the Russell 3000 Index.
The Russell Microcap Index isolates the smallest 1,000 securities in the Russell 2000 Index plus the next 1,000 securities. The Russell Microcap Growth Index isolates the securities in the Russell Microcap Index with purely growth characteristics. The Russell 2000 Growth/Russell Microcap Growth Blend Index is a combination of the Russell 2000 Growth Index and the Russell Microcap Growth Index. The blended index exhibits Russell 2000 Growth performance from the inception of the Fund until August 2000, and Russell Microcap Growth performance thereafter. The Fund created the blended index because Russell Microcap Growth performance incepts in August 2000.
The Indexes differ from the Fund in composition, do not pay management fees or expenses and includes reinvested dividends. One cannot invest directly in an index. Since markets can go down as well as up, investment return and principal value will fluctuate with market conditions. You may have a gain or loss when you sell your shares.
1
U.S. MICRO CAP FUND
SCHEDULE OF INVESTMENTS
As of March 31, 2008
Number of Shares | Value | ||||||
Common Stock - 98.3% | |||||||
Aerospace/Defense-Equipment - 0.9% | |||||||
| Ducommun, Inc.* | 18,600 | $ | 514,662 | ||||
Alternative Waste Tech - 2.1% | |||||||
Calgon Carbon Corp.*,## | 51,960 | 781,998 | |||||
| Darling International, Inc.* | 36,680 | 475,006 | |||||
| 1,257,004 | |||||||
Applications Software - 0.9% | |||||||
| EPIQ Systems, Inc.* | 35,870 | 556,702 | |||||
Auto/Truck Parts & Equipment-Original - 2.4% | |||||||
| Wonder Auto Technology, Inc.* | 42,700 | 351,421 | |||||
| Amerigon, Inc.* | 23,200 | 343,360 | |||||
| Titan International, Inc. | 24,334 | 744,864 | |||||
| 1,439,645 | |||||||
Batteries/Battery Systems - 0.7% | |||||||
| Ultralife Batteries, Inc.* | 37,400 | 441,694 | |||||
Broadcast Services/Programming - 1.0% | |||||||
| DG FastChannel, Inc.* | 32,340 | 620,281 | |||||
Chemicals-Plastics - 1.0% | |||||||
| Landec Corp.* | 43,420 | 366,031 | |||||
| Metabolix, Inc.* | 24,000 | 262,800 | |||||
| 628,831 | |||||||
Coffee - 0.9% | |||||||
| Green Mountain Coffee Roasters, Inc.* | 16,600 | 525,390 | |||||
Commercial Services - 3.2% | |||||||
| HMS Holdings Corp.* | 27,061 | 772,591 | |||||
| Team, Inc.* | 24,006 | 655,364 | |||||
| The Providence Service Corp.* | 16,300 | 489,000 | |||||
| 1,916,955 | |||||||
Commercial Services-Finance - 0.7% | |||||||
| CBIZ, Inc.* | 50,600 | 410,872 | |||||
Computer Services - 1.2% | |||||||
| BluePhoenix Solutions, Ltd.* | 38,100 | 318,135 | |||||
| Furmanite Corp.* | 46,300 | 393,550 | |||||
| 711,685 | |||||||
Computer Software - 0.5% | |||||||
| Double-Take Software, Inc.* | 27,300 | 318,864 | |||||
Computers-Integrated Systems - 1.3% | |||||||
| Netscout Systems, Inc.* | 47,900 | 445,470 | |||||
Stratasys, Inc.*,## | 17,904 | 318,691 | |||||
| 764,161 | |||||||
Computers-Voice Recognition - 0.8% | |||||||
| InterVoice, Inc.* | 61,600 | 490,336 | |||||
Consulting Services - 1.1% | |||||||
| Hill International, Inc.* | 50,300 | 629,253 | |||||
Data Processing/Management - 0.7% | |||||||
| FalconStor Software, Inc.* | 57,220 | 435,444 | |||||
Decision Support Software - 0.6% | |||||||
| GSE Systems, Inc.* | 46,100 | 375,254 | |||||
Diagnostic Kits - 1.3% | |||||||
| Medtox Scientific, Inc.* | 29,400 | 387,786 | |||||
| Quidel Corp.* | 23,500 | 377,410 | |||||
| 765,196 | |||||||
Distribution/Wholesale - 0.9% | |||||||
| MWI Veterinary Supply, Inc.* | 16,100 | 567,686 | |||||
Diversified Manufacturing Operations - 1.7% | |||||||
AZZ, Inc.*,## | 16,760 | 596,321 | |||||
LSB Industries, Inc.*,## | 29,400 | 433,356 | |||||
| 1,029,677 | |||||||
E-Commerce/Products - 0.9% | |||||||
| 1-800-FLOWERS.COM, Inc.* | 61,600 | 524,216 | |||||
Electric Products-Miscellaneous - 0.5% | |||||||
Harbin Electric, Inc.*,## | 23,900 | 313,090 | |||||
Electronic Components-Semiconductors - 2.3% | |||||||
| Advanced Analogic Technologies, Inc.* | 62,500 | 351,250 | |||||
| Ceva, Inc.* | 37,500 | 286,875 | |||||
Emcore Corp.*,## | 44,400 | 255,744 | |||||
| Monolithic Power Systems, Inc.* | 28,100 | 495,403 | |||||
| 1,389,272 | |||||||
Electronic Design Automation - 0.6% | |||||||
| Magma Design Automation, Inc.* | 40,040 | 383,183 | |||||
Electronic Measure Instruments - 2.7% | |||||||
| Axsys Technologies, Inc.* | 16,758 | 835,889 | |||||
| FARO Technologies, Inc.* | 16,430 | 512,287 | |||||
| Measurement Specialties, Inc.* | 16,200 | 283,014 | |||||
| 1,631,190 | |||||||
Energy-Alternate Sources - 1.2% | |||||||
Canadian Solar, Inc.*,## | 34,400 | 718,960 | |||||
Engineering/R & D Services - 1.1% | |||||||
| Stanley, Inc.* | 23,400 | 689,364 | |||||
Enterprise Software/Services - 2.5% | |||||||
| Omnicell, Inc.* | 25,400 | 510,540 | |||||
| PROS Holdings, Inc.* | 32,700 | 410,385 | |||||
| Taleo Corp.* | 28,448 | 551,891 | |||||
| 1,472,816 | |||||||
Food-Miscellaneous/Diversified - 0.8% | |||||||
| Calavo Growers, Inc. | 29,200 | 507,496 | |||||
Food-Wholesale/Distribution - 1.1% | |||||||
| Spartan Stores, Inc. | 31,070 | 647,809 | |||||
Funeral Services & Related Items - 0.7% | |||||||
| Carriage Services, Inc.* | 52,500 | 410,025 | |||||
Hazardous Waste Disposal - 0.5% | |||||||
| Heritage-Crystal Clean, Inc.* | 19,400 | 303,998 | |||||
Instruments-Controls - 0.4% | |||||||
| Spectrum Control, Inc.* | 31,500 | 266,490 | |||||
Insurance Brokers - 0.6% | |||||||
Life Partners Holdings, Inc.## | 20,500 | 378,225 | |||||
Internet Applications Software - 3.8% | |||||||
| Cybersource Corp.* | 37,370 | 545,976 | |||||
| eResearchTechnology, Inc.* | 45,900 | 570,078 | |||||
| S1 Corp.* | 79,770 | 567,165 | |||||
| Vocus, Inc.* | 22,260 | 587,664 | |||||
| 2,270,883 | |||||||
Internet Infrastructure Software - 1.2% | |||||||
| AsiaInfo Holdings, Inc.* | 68,600 | 744,996 | |||||
Machinery-Farm - 1.6% | |||||||
Lindsay Corp.## | 9,419 | 965,165 | |||||
Machinery-General Industry - 2.2% | |||||||
| Chart Industries, Inc.* | 26,370 | 892,361 | |||||
| DXP Enterprises, Inc.* | 11,600 | 455,706 | |||||
| 1,348,067 | |||||||
See Accompanying Notes to Financial Statements.
2
SCHEDULE OF INVESTMENTS
As of March 31, 2008
Number of Shares | Value | ||||||
Machinery-Material Handling - 0.8% | |||||||
| Key Technology, Inc.* | 15,600 | $ | 464,724 | ||||
Medical Imaging Systems - 0.5% | |||||||
| IRIS International, Inc.* | 23,600 | 313,172 | |||||
Medical Information Systems - 0.6% | |||||||
| Phase Forward, Inc.* | 21,000 | 358,680 | |||||
Medical Instruments - 1.6% | |||||||
| Natus Medical, Inc.* | 28,100 | 510,015 | |||||
| Symmetry Medical, Inc.* | 25,700 | 426,620 | |||||
| 936,635 | |||||||
Medical Labs &Testing Services - 2.2% | |||||||
| Bio-Imaging Technologies, Inc.* | 39,700 | 278,297 | |||||
| Bio-Reference Labs, Inc.* | 21,560 | 569,831 | |||||
| Life Sciences Research, Inc.* | 17,000 | 476,000 | |||||
| 1,324,128 | |||||||
Medical Laser Systems - 0.9% | |||||||
| Cynosure, Inc.* | 24,010 | 511,413 | |||||
Medical Products - 2.2% | |||||||
| Exactech, Inc.* | 25,700 | 647,383 | |||||
| Synovis Life Technologies, Inc.* | 43,160 | 676,749 | |||||
| 1,324,132 | |||||||
Medical-Biomedical/Genetics - 4.7% | |||||||
| AMAG Pharmaceuticals, Inc.* | 3,900 | 157,677 | |||||
| CryoLife, Inc.* | 67,400 | 633,560 | |||||
Omrix Biopharmaceuticals, Inc.*,## | 15,700 | 219,800 | |||||
| RTI Biologics, Inc.* | 98,221 | 928,188 | |||||
Sangamo Biosciences, Inc.*,## | 35,300 | 358,648 | |||||
| Seattle Genetics, Inc.* | 56,400 | 513,240 | |||||
| 2,811,113 | |||||||
Medical-Drugs - 0.4% | |||||||
Akorn, Inc.*,## | 51,200 | 242,176 | |||||
Medical-Nursing Homes - 1.0% | |||||||
| Sun Healthcare Group, Inc.* | 43,900 | 576,846 | |||||
Medical-Outpatient/Home Medical Care - 0.8% | |||||||
| Air Methods Corp.* | 10,200 | 493,374 | |||||
Metal Processors & Fabrication - 1.4% | |||||||
| CIRCOR International, Inc. | 9,340 | 431,975 | |||||
| Dynamic Materials Corp. | 9,000 | 388,800 | |||||
| 820,775 | |||||||
MRI/Medical Diagnostic Imaging Centers - 1.3% | |||||||
| Alliance Imaging, Inc.* | 58,800 | 505,680 | |||||
| RadNet, Inc.* | 39,500 | 278,080 | |||||
| 783,760 | |||||||
Oil Companies-Exploration & Production - 1.1% | |||||||
| Arena Resources, Inc.* | 17,400 | 673,554 | |||||
Oil Field Machinery & Equipment - 2.6% | |||||||
| Bolt Technology Corp.* | 20,435 | 376,617 | |||||
| Mitcham Industries, Inc.* | 30,900 | 550,638 | |||||
| T-3 Energy Services, Inc.* | 15,300 | 651,168 | |||||
| 1,578,423 | |||||||
Oil-Field Services - 0.8% | |||||||
| Matrix Service Co.* | 26,640 | 457,675 | |||||
Pharmacy Services - 0.7% | |||||||
| BioScrip, Inc.* | 63,600 | 429,936 | |||||
Power Conversion/Supply Equipment - 1.1% | |||||||
| Powell Industries, Inc.* | 16,200 | 637,794 | |||||
Private Corrections - 1.2% | |||||||
| Cornell Cos., Inc.* | 31,900 | 716,474 | |||||
Racetracks - 1.0% | |||||||
| Churchill Downs, Inc. | 12,200 | 576,328 | |||||
Recycling - 1.0% | |||||||
Metalico, Inc.*,## | 59,510 | 583,793 | |||||
Research & Development - 2.6% | |||||||
| Exponent, Inc.* | 28,200 | 926,088 | |||||
Kendle International, Inc.*,## | 13,600 | 610,912 | |||||
| 1,537,000 | |||||||
Retail-Apparel/Shoe - 3.4% | |||||||
| Cache, Inc.* | 45,300 | 511,437 | |||||
| Charlotte Russe Holding, Inc.* | 31,900 | 553,146 | |||||
JOS A Bank Clothiers, Inc.*,## | 18,100 | 371,050 | |||||
| The Wet Seal, Inc.* | 177,400 | 601,386 | |||||
| 2,037,019 | |||||||
Retail-Arts & Crafts - 0.4% | |||||||
| AC Moore Arts & Crafts, Inc.* | 38,000 | 259,160 | |||||
Retail-Computer Equipment - 0.7% | |||||||
PC Mall, Inc.*,## | 37,600 | 399,688 | |||||
Retail-Miscellaneous/Diversified - 1.0% | |||||||
| Titan Machinery, Inc.* | 31,800 | 594,660 | |||||
Retail-Restaurants - 1.3% | |||||||
Buffalo Wild Wings, Inc.*,## | 19,600 | 480,200 | |||||
| Red Robin Gourmet Burgers, Inc.* | 8,400 | 315,588 | |||||
| 795,788 | |||||||
Retail-Sporting Goods - 0.6% | |||||||
Zumiez, Inc.*,## | 23,800 | 373,422 | |||||
Satellite Telecommunications - 0.9% | |||||||
| GeoEye, Inc.* | 20,500 | 532,795 | |||||
Schools - 0.6% | |||||||
| Capella Education Co.* | 6,200 | 338,520 | |||||
Seismic Data Collection - 1.1% | |||||||
| Dawson Geophysical Co.* | 10,140 | 684,450 | |||||
Semiconductor Components- | |||||||
Integrated Circuits - 1.3% | |||||||
| O2Micro International, Ltd. - ADR* | 49,670 | 383,949 | |||||
| Pericom Semiconductor Corp.* | 26,200 | 384,616 | |||||
| 768,565 | |||||||
Semiconductor Equipment - 0.8% | |||||||
| Amtech Systems, Inc.* | 40,200 | 484,008 | |||||
Telecommunications Equipment - 0.7% | |||||||
| Network Equipment Technologies, Inc.* | 63,440 | 416,801 | |||||
Textile-Apparel - 0.9% | |||||||
| Perry Ellis International, Inc.* | 25,500 | 556,665 | |||||
Therapeutics - 0.5% | |||||||
| Anika Therapeutics, Inc.* | 34,472 | 292,323 | |||||
Transport-Services - 0.8% | |||||||
| Pacer International, Inc. | 28,700 | 471,541 | |||||
Transport-Truck - 0.8% | |||||||
| Saia, Inc.* | 30,100 | 477,386 | |||||
Veterinary Diagnostics - 0.9% | |||||||
| Neogen Corp.* | 21,900 | 549,690 | |||||
Vitamins & Nutrition Products - 0.7% | |||||||
| Omega Protein Corp.* | 31,400 | 428,610 | |||||
See Accompanying Notes to Financial Statements.
3
U.S. MICRO CAP FUND
SCHEDULE OF INVESTMENTS
As of March 31, 2008
Number of Shares | Value | ||||||
Web Hosting/Design - 0.2% | |||||||
| NaviSite, Inc.* | 66,800 | $ | 147,628 | ||||
Wire & Cable Products - 0.6% | |||||||
| Fushi Copperweld, Inc.* | 25,200 | 379,008 | |||||
Wireless Equipment - 0.6% | |||||||
| Globecomm Systems, Inc.* | 39,050 | 339,735 | |||||
Wound, Burn & Skin Care - 0.4% | |||||||
| Obagi Medical Products, Inc.* | 28,513 | 247,493 | |||||
| Total Common Stock (Cost: $60,768,567) | 59,091,697 | ||||||
Principal Amount | |||||||
Short Term Investments - 12.8% | |||||||
Repurchase Agreement - 11.1% | |||||||
| Lehman Brothers, Inc., 1.600% | |||||||
| dated 3/31/08, to be repurchased | |||||||
| at $6,714,804 on 4/1/08 | |||||||
| (collateralized by U.S. Treasury | |||||||
| Note, 4.625% due 11/15/09)** | $ | 6,714,510 | 6,714,510 | ||||
Time Deposit - 1.7% | |||||||
| Wachovia Bank London | |||||||
| 1.700%, 04/01/08 | 998,948 | 998,948 | |||||
| Total Short Term Investments (Cost: $7,713,458) | 7,713,458 | ||||||
| Total Investments - 111.1% (Cost: $68,482,025) | 66,805,155 | ||||||
| Liabilities in Excess of Other Assets - (11.1%) | (6,682,759 | ) | |||||
| Net Assets - 100.0% | $ | 60,122,396 | |||||
| * | Non-income producing securities. |
| ** | All of the security is purchased with cash collateral proceeds from securities loans. |
| ## | All or a portion of the Fund’s holdings in this security was on loan as of 03/31/08. |
SCHEDULE OF INVESTMENTS BY SECTOR
as of March 31, 2008
| Sector | Percent of Net Assets | |||
| Consumer, Non-cyclical | 31.9 | % | ||
| Industrial | 22.0 | |||
| Technology | 13.2 | |||
| Consumer, Cyclical | 12.6 | |||
| Communications | 10.1 | |||
| Energy | 6.8 | |||
| Basic Materials | 1.1 | |||
| Financial | 0.6 | |||
| Short Term Investments | 12.8 | |||
| Total Investments | 111.1 | |||
| Liabilities in excess of other assets | (11.1 | ) | ||
| Net Assets | 100.0 | % | ||
See Accompanying Notes to Financial Statements.
4
U.S. EMERGING GROWTH FUND
Management Team: John C. McCraw, Portfolio Manager; Robert S. Marren, Portfolio Manager; Blake H. Burdine, Analyst; K. Mathew Axline, CFA, Analyst; Stephen W. Lyford, Analyst
Chief Investment Officer: Horacio A. Valeiras, CFA
Goal: The U.S. Emerging Growth Fund seeks to maximize long-term capital appreciation through investments primarily in U.S. companies with market capitalizations similar to the Russell 2000 Growth Index at time of purchase.
Market Overview: Prices of U.S. small-cap growth stocks, as measured by the Russell 2000 Growth Index, declined between April 1, 2007 and March 31, 2008. The period started on a strong note, with the index advancing on brisk merger and acquisition activity, signs of improvement in the economy and better-than-expected first quarter earnings. However, the following strong headwinds led to weak performance in the latter part of the fiscal year:
| • | A series of blows to the U.S. financial system, including losses on mortgage-backed securities, concerns about bond insurers’ credit quality and a seizing up in the short- term funding markets |
| • | Weak corporate earnings, with profits among small-cap companies falling roughly 13%, year over year, in the fourth quarter of 2007 |
| • | Downbeat news on the economy, including the largest drop in consumer confidence in 35 years |
Policymakers were quick to respond to deterioration in the financial markets and economy, helping to lift investor sentiment toward the end of the period. The Federal Reserve injected extra liquidity into the banking system and cut the funds rate a total of 3% on six separate occasions. President Bush and Congress agreed to a $170 billion economic stimulus package with tax rebates for individuals and tax incentives for businesses.
Performance: During the twelve months ended March 31, 2008, the Fund’s Class I shares declined 7.01%, outperforming the Russell 2000 Growth Index, which fell 8.94%.
Portfolio Specifics: Outperformance of the index was due to stock selection, which was especially strong in the industrials sector. Two of the Fund’s best-performing holdings were dry bulk shipping companies Excel Maritime Carriers and DryShips. Both benefited from a favorable pricing environment, as global demand for commodities such as iron ore and coal grew faster than the supply of vessels available to transport them. Chart Industries, a manufacturer of equipment used to produce and store various gases, was another top performer in industrials. The company is experiencing rapid growth in its liquefied natural gas business, as the geographic dislocation between natural gas supply sources and end users drives the need for liquefaction.
Stock selection was also particularly strong in the financials and information technology sectors, led by gains from AmTrust Financial Services, a property and casualty insurer, and Concur Technologies, a supplier of expense management software. Areas of relative weakness included stock selection in the consumer discretionary sector and an underweight in health care. In the volatile market environment, health care lived up to its reputation as a defensive sector.
Market Outlook: Weakness in the economy and corporate earnings may continue to weigh on investor sentiment in the months ahead. However, valuations have become more attractive following the recent sell-off in equities, and, on March 31, it was widely expected that the Fed would cut interest rates at least one more time. Easier monetary policy bodes particularly well for smaller stocks, since small companies tend to depend more on bank loans to fund operations than larger firms.
As always, we remain focused on identifying fundamentally strong companies for the Fund that are poised to exceed earnings expectations.
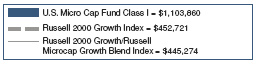
Comparison of Change in Value of a $250,000 Investment in U.S. Emerging Growth Fund Class I Shares with the Russell 2000 Growth Index.

| Annualized Total Returns As of 3/31/08 | |||
1 Year | 5 Years | 10 Years | |
| U.S. Emerging Growth Fund Class I | -7.01% | 15.68% | 3.58% |
| Russell 2000 Growth Index | -8.94% | 14.24% | 1.75% |
The graph above shows the value of a hypothetical $250,000 investment in the Fund’s Class I shares compared with the Russell 2000 Growth Index for the periods indicated. The Fund calculates performance based upon the historical performance of a corresponding series of Nicholas-Applegate Mutual Funds (renamed ING Mutual Funds), adjusted to reflect all fees and expenses applicable to Class I shares. The Nicholas-Applegate Institutional Funds’ Class I shares were first available on May 7, 1999. Average annual total return figures include changes in principal value, reinvested dividends, and capital gain distributions. The total returns shown above do not show the effects of income taxes on an individual’s investment. In most cases, taxes may reduce your actual investment returns on income or gains paid by the Fund or any gains you may realize if you sell your shares. Past performance cannot guarantee future results.
The Russell 2000 Growth Index is an unmanaged index comprised of those Russell 2000 companies with higher price-to-book ratios and higher forecasted growth values. The Russell 2000 Index is an unmanaged index generally representative of the 2,000 smallest companies in the Russell 3000 Index, which represents approximately 10% of the total market capitalization of the Russell 3000 Index. The unmanaged Index differs from the Fund in composition, does not pay management fees or expenses and includes reinvested dividends. One cannot invest directly in an index.
Since markets can go down as well as up, investment return and principal value will fluctuate with market conditions. You may have a gain or loss when you sell your shares.
5
U.S. EMERGING GROWTH FUND
SCHEDULE OF INVESTMENTS
As of March 31, 2008
Number of Shares | Value | ||||||
Common Stock - 98.2% | |||||||
Advertising Services - 0.7% | |||||||
| inVentiv Health, Inc.* | 2,500 | $ | 72,025 | ||||
Aerospace/Defense-Equipment - 3.8% | |||||||
| AAR Corp.* | 2,400 | 65,448 | |||||
| BE Aerospace, Inc.* | 1,900 | 66,405 | |||||
| Curtiss-Wright Corp. | 1,200 | 49,776 | |||||
| Ducommun, Inc.* | 2,100 | 58,107 | |||||
| Moog, Inc. Cl. A* | 1,600 | 67,536 | |||||
| Orbital Sciences Corp.* | 3,800 | 91,580 | |||||
| 398,852 | |||||||
Airlines - 1.3% | |||||||
| Allegiant Travel Co.* | 2,200 | 58,124 | |||||
| Republic Airways Holdings, Inc.* | 3,300 | 71,478 | |||||
| 129,602 | |||||||
Alternative Waste Tech - 0.6% | |||||||
| Darling International, Inc.* | 5,100 | 66,045 | |||||
Apparel Manufacturers - 0.6% | |||||||
| G-III Apparel Group, Ltd.* | 4,700 | 63,074 | |||||
Auto/Truck Parts & Equipment-Original - 0.7% | |||||||
| Titan International, Inc. | 2,300 | 70,403 | |||||
Batteries/Battery Systems - 0.8% | |||||||
| EnerSys* | 3,400 | 81,328 | |||||
Beverages-Wine/Spirits - 1.1% | |||||||
| Central European Distribution Corp.* | 1,900 | 110,561 | |||||
Broadcast Services/Programming - 0.6% | |||||||
| DG FastChannel, Inc.* | 3,400 | 65,212 | |||||
Casino Services - 0.5% | |||||||
| Bally Technologies, Inc.* | 1,600 | 54,944 | |||||
Chemicals-Fibers - 0.4% | |||||||
Zoltek Cos., Inc.*,## | 1,700 | 45,084 | |||||
Chemicals-Plastics - 0.4% | |||||||
| Metabolix, Inc.* | 3,700 | 40,515 | |||||
Coal - 0.7% | |||||||
| Walter Industries, Inc. | 1,200 | 75,156 | |||||
Coffee - 0.7% | |||||||
| Green Mountain Coffee Roasters, Inc.* | 2,200 | 69,630 | |||||
Commercial Services - 2.0% | |||||||
| Healthcare Services Group | 3,300 | 68,112 | |||||
| Team, Inc.* | 2,500 | 68,250 | |||||
| TeleTech Holdings, Inc.* | 3,200 | 71,872 | |||||
| 208,234 | |||||||
Computer Services - 0.4% | |||||||
| BluePhoenix Solutions, Ltd.* | 5,500 | 45,925 | |||||
Computer Software - 1.2% | |||||||
| Double-Take Software, Inc.* | 4,100 | 47,888 | |||||
| Omniture, Inc.* | 3,100 | 71,951 | |||||
| 119,839 | |||||||
Computers-Integrated Systems - 1.3% | |||||||
| Micros Systems, Inc.* | 2,200 | 74,052 | |||||
| Radiant Systems, Inc.* | 4,300 | 60,071 | |||||
| 134,123 | |||||||
Computers-Peripheral Equipment - 0.3% | |||||||
| Synaptics, Inc.* | 1,300 | 31,044 | |||||
Consulting Services - 2.2% | |||||||
| FTI Consulting, Inc.* | 900 | 63,936 | |||||
| Gartner, Inc. Cl. A* | 3,400 | 65,756 | |||||
| Watson Wyatt Worldwide, Inc. Cl. A | 1,800 | 102,150 | |||||
| 231,842 | |||||||
Consumer Products-Miscellaneous - 1.6% | |||||||
| Jarden Corp.* | 3,200 | 69,568 | |||||
| Tupperware Brands Corp. | 2,500 | 96,700 | |||||
| 166,268 | |||||||
Cosmetics & Toiletries - 0.7% | |||||||
| Elizabeth Arden, Inc.* | 3,600 | 71,820 | |||||
Data Processing/Management - 0.5% | |||||||
FalconStor Software, Inc.*,## | 6,800 | 51,748 | |||||
Distribution/Wholesale - 0.9% | |||||||
| Brightpoint, Inc.* | 5,000 | 41,800 | |||||
| Fossil, Inc.* | 1,700 | 51,918 | |||||
| 93,718 | |||||||
Diversified Manufacturing Operations - 0.4% | |||||||
LSB Industries, Inc.*,## | 2,900 | 42,746 | |||||
Electronic Components-Semiconductors - 3.2% | |||||||
| Advanced Analogic Technologies, Inc.* | 9,700 | 54,514 | |||||
Emcore Corp.*,## | 6,000 | 34,560 | |||||
| Monolithic Power Systems, Inc.* | 4,100 | 72,283 | |||||
| PMC - Sierra, Inc.* | 13,100 | 74,670 | |||||
| Semtech Corp.* | 4,300 | 61,619 | |||||
| Skyworks Solutions, Inc.* | 5,100 | 37,128 | |||||
| 334,774 | |||||||
Electronic Design Automation - 0.6% | |||||||
| Magma Design Automation, Inc.* | 6,900 | 66,033 | |||||
Electronic Measure Instruments - 0.7% | |||||||
Itron, Inc.*,## | 800 | 72,184 | |||||
E-Marketing/Information - 0.4% | |||||||
| Valueclick, Inc.* | 2,300 | 39,675 | |||||
Energy-Alternate Sources - 1.0% | |||||||
Canadian Solar, Inc.*,## | 4,700 | 98,230 | |||||
Engineering/R & D Services - 0.5% | |||||||
| EMCOR Group, Inc.* | 2,200 | 48,862 | |||||
Enterprise Software/Services - 2.6% | |||||||
| Concur Technologies, Inc.* | 2,300 | 71,415 | |||||
Lawson Software, Inc.*,## | 9,300 | 70,029 | |||||
| Mantech International Corp. Cl. A* | 1,700 | 77,112 | |||||
PROS Holdings, Inc.*,## | 4,300 | 53,965 | |||||
| 272,521 | |||||||
Finance-Investment Bankers/Brokers - 0.6% | |||||||
| Knight Capital Group, Inc. Cl. A* | 4,000 | 64,960 | |||||
Food-Wholesale/Distribution - 0.7% | |||||||
| Spartan Stores, Inc. | 3,300 | 68,805 | |||||
Footwear & Related Apparel - 0.5% | |||||||
| Skechers U.S.A., Inc. Cl. A* | 2,600 | 52,546 | |||||
Hazardous Waste Disposal - 0.8% | |||||||
| EnergySolutions, Inc. | 3,800 | 87,172 | |||||
Internet Applications Software - 1.6% | |||||||
| Cybersource Corp.* | 5,800 | 84,738 | |||||
| eResearchTechnology, Inc.* | 6,500 | 80,730 | |||||
| 165,468 | |||||||
See Accompanying Notes to Financial Statements.
6
SCHEDULE OF INVESTMENTS
As of March 31, 2008
Number of Shares | Value | ||||||
Internet Security - 0.6% | |||||||
| Blue Coat Systems, Inc.* | 2,600 | $ | 57,304 | ||||
Leisure & Recreational Products - 0.8% | |||||||
| WMS Industries, Inc.* | 2,300 | 82,731 | |||||
Machinery-General Industry - 4.0% | |||||||
| Altra Holdings, Inc.* | 4,400 | 59,180 | |||||
| Chart Industries, Inc.* | 2,600 | 87,984 | |||||
| DXP Enterprises, Inc.* | 2,000 | 78,570 | |||||
| Kadant, Inc.* | 2,400 | 70,512 | |||||
| Middleby Corp.* | 900 | 56,151 | |||||
| Robbins & Myers, Inc. | 2,000 | 65,300 | |||||
| 417,697 | |||||||
Medical Information Systems - 0.6% | |||||||
| Phase Forward, Inc.* | 3,600 | 61,488 | |||||
Medical Instruments - 2.3% | |||||||
Arthrocare Corp.*,## | 1,600 | 53,360 | |||||
| Natus Medical, Inc.* | 3,700 | 67,155 | |||||
| NuVasive, Inc.* | 1,600 | 55,216 | |||||
| Symmetry Medical, Inc.* | 3,900 | 64,740 | |||||
| 240,471 | |||||||
Medical Labs &Testing Services - 0.7% | |||||||
| Icon PLC - ADR* | 1,100 | 71,379 | |||||
Medical Laser Systems - 0.6% | |||||||
Cynosure, Inc. Cl. A*,## | 2,900 | 61,770 | |||||
Medical Products - 1.9% | |||||||
China Medical Technologies, Inc. - ADR## | 1,500 | 61,635 | |||||
| Haemonetics Corp.* | 1,200 | 71,496 | |||||
| Wright Medical Group, Inc.* | 2,600 | 62,764 | |||||
| 195,895 | |||||||
Medical-Biomedical/Genetics - 3.2% | |||||||
| Alexion Pharmaceuticals, Inc.* | 1,500 | 88,950 | |||||
| AMAG Pharmaceuticals, Inc.* | 700 | 28,301 | |||||
| Regeneron Pharmaceuticals, Inc.* | 4,100 | 78,679 | |||||
| Sangamo Biosciences, Inc.* | 5,700 | 57,912 | |||||
Savient Pharmaceuticals, Inc.*,## | 3,700 | 74,000 | |||||
| 327,842 | |||||||
Medical-Drugs - 0.4% | |||||||
| Indevus Pharmaceuticals, Inc.* | 9,000 | 42,930 | |||||
Medical-Nursing Homes - 0.6% | |||||||
| Sun Healthcare Group, Inc.* | 4,500 | 59,130 | |||||
Medical-Outpatient/Home Medical Care - 0.9% | |||||||
| Air Methods Corp.* | 1,900 | 91,903 | |||||
Metal Processors & Fabrication - 0.5% | |||||||
| CIRCOR International, Inc. | 1,100 | 50,875 | |||||
Oil Companies-Exploration & Production - 2.7% | |||||||
| Carrizo Oil & Gas, Inc.* | 1,600 | 94,832 | |||||
| Penn Virginia Corp. | 1,700 | 74,953 | |||||
| Venoco, Inc.* | 3,700 | 42,994 | |||||
| Warren Resources, Inc.* | 5,800 | 68,846 | |||||
| 281,625 | |||||||
Oil Field Machinery & Equipment - 1.2% | |||||||
| NATCO Group, Inc.* | 1,200 | 56,100 | |||||
| T-3 Energy Services, Inc.* | 1,600 | 68,096 | |||||
| 124,196 | |||||||
Oil-Field Services - 3.1% | |||||||
| Cal Dive International, Inc.* | 6,600 | 68,508 | |||||
| Hercules Offshore, Inc.* | 2,500 | 62,800 | |||||
| Hornbeck Offshore Services, Inc.* | 1,400 | 63,938 | |||||
| Matrix Service Co.* | 3,300 | 56,694 | |||||
Willbros Group, Inc.*,## | 2,200 | 67,320 | |||||
| 319,260 | |||||||
Pharmacy Services - 0.7% | |||||||
| HealthExtras, Inc.* | 2,900 | 72,036 | |||||
Physical Practice Management - 0.7% | |||||||
| Pediatrix Medical Group, Inc.* | 1,100 | 74,140 | |||||
Private Corrections - 1.7% | |||||||
| Cornell Cos., Inc.* | 3,800 | 85,348 | |||||
| The Geo Group, Inc.* | 3,100 | 88,164 | |||||
| 173,512 | |||||||
Property/Casualty Insurance - 2.0% | |||||||
| Amtrust Financial Services, Inc. | 5,600 | 90,776 | |||||
| Navigators Group, Inc.* | 1,300 | 70,720 | |||||
| Tower Group, Inc. | 2,000 | 50,340 | |||||
| 211,836 | |||||||
Research & Development - 1.6% | |||||||
Kendle International, Inc.*,## | 2,000 | 89,840 | |||||
| Parexel International Corp.* | 3,000 | 78,300 | |||||
| 168,140 | |||||||
Retail-Apparel/Shoe - 7.4% | |||||||
| Aeropostale, Inc.* | 3,100 | 84,041 | |||||
| AnnTaylor Stores Corp.* | 3,100 | 74,958 | |||||
| Bebe Stores, Inc. | 6,000 | 64,500 | |||||
| Brown Shoe Co., Inc. | 4,700 | 70,829 | |||||
| Charlotte Russe Holding, Inc.* | 4,300 | 74,562 | |||||
| Chico’s FAS, Inc.* | 7,000 | 49,770 | |||||
| Dress Barn, Inc.* | 4,200 | 54,348 | |||||
JOS A Bank Clothiers, Inc.*,## | 3,000 | 61,500 | |||||
| Men’s Wearhouse, Inc. | 3,200 | 74,464 | |||||
| Pacific Sunwear Of California* | 6,600 | 83,226 | |||||
| Phillips-Van Heusen Corp. | 1,900 | 72,048 | |||||
| 764,246 | |||||||
Retail-Miscellaneous/Diversified - 1.0% | |||||||
Pricesmart, Inc.## | 3,700 | 102,527 | |||||
Retail-Restaurants - 2.5% | |||||||
| Brinker International, Inc. | 3,700 | 68,635 | |||||
Buffalo Wild Wings, Inc.*,## | 2,900 | 71,050 | |||||
| CBRL Group, Inc. | 1,900 | 67,963 | |||||
| Red Robin Gourmet Burgers, Inc.* | 1,400 | 52,598 | |||||
| 260,246 | |||||||
Retail-Sporting Goods - 0.4% | |||||||
| Zumiez, Inc.* | 2,900 | 45,501 | |||||
Satellite Telecommunications - 0.8% | |||||||
| GeoEye, Inc.* | 3,100 | 80,569 | |||||
Schools - 1.6% | |||||||
| Capella Education Co.* | 1,100 | 60,060 | |||||
| DeVry, Inc. | 1,200 | 50,208 | |||||
INVESTools, Inc.*,## | 5,500 | 60,445 | |||||
| 170,713 | |||||||
Seismic Data Collection - 0.6% | |||||||
| ION Geophysical Corp.* | 4,400 | 60,720 | |||||
See Accompanying Notes to Financial Statements.
7
U.S. EMERGING GROWTH FUND
SCHEDULE OF INVESTMENTS
As of March 31, 2008
Number of Shares | Value | ||||||
Semiconductor Components- | |||||||
Integrated Circuits - 1.7% | |||||||
O2Micro International, Ltd. - ADR*,## | 7,200 | $ | 55,656 | ||||
| Pericom Semiconductor Corp.* | 5,400 | 79,272 | |||||
| Sigma Designs, Inc.* | 2,000 | 45,340 | |||||
| 180,268 | |||||||
Semiconductor Equipment - 0.6% | |||||||
| Teradyne, Inc.* | 5,300 | 65,826 | |||||
Telecommunications Equipment - 0.4% | |||||||
Network Equipment Technologies, Inc.*,## | 5,900 | 38,763 | |||||
Telecommunications Equipment Fiber Optics - 0.9% | |||||||
| JDS Uniphase Corp.* | 6,600 | 88,374 | |||||
Telecommunications Services - 1.9% | |||||||
| NTELOS Holdings Corp. | 3,500 | 84,700 | |||||
PAETEC Holding Corp.*,## | 5,400 | 35,964 | |||||
| Premiere Global Services, Inc.* | 5,300 | 76,002 | |||||
| 196,666 | |||||||
Textile-Apparel - 0.7% | |||||||
| Perry Ellis International, Inc.* | 3,500 | 76,405 | |||||
Therapeutics - 2.2% | |||||||
Alnylam Pharmaceuticals, Inc.*,## | 2,000 | 48,800 | |||||
| BioMarin Pharmaceutical, Inc.* | 1,900 | 67,203 | |||||
Isis Pharmaceuticals, Inc.*,## | 5,600 | 79,016 | |||||
| Onyx Pharmaceuticals, Inc.* | 1,300 | 37,739 | |||||
| 232,758 | |||||||
Transport-Air Freight - 0.7% | |||||||
| Atlas Air Worldwide Holdings, Inc.* | 1,300 | 71,500 | |||||
Transport-Rail - 0.8% | |||||||
| Genesee & Wyoming, Inc. Cl. A* | 2,400 | 82,560 | |||||
Transport-Services - 0.7% | |||||||
| Pacer International, Inc. | 4,400 | 72,292 | |||||
Transport-Truck - 0.6% | |||||||
| Saia, Inc.* | 4,000 | 63,440 | |||||
Ultra Sound Imaging Systems - 0.6% | |||||||
| SonoSite, Inc.* | 2,000 | 56,860 | |||||
Vitamins & Nutrition Products - 1.3% | |||||||
| Herbalife, Ltd. | 1,400 | 66,500 | |||||
| Omega Protein Corp.* | 4,600 | 62,790 | |||||
| 129,290 | |||||||
Web Portals/ISP - 0.9% | |||||||
| Trizetto Group* | 5,400 | 90,126 | |||||
Wire & Cable Products - 0.5% | |||||||
Fushi Copperweld, Inc.*,## | 3,700 | 55,648 | |||||
Wound, Burn & Skin Care - 0.4% | |||||||
| Obagi Medical Products, Inc.* | 4,800 | 41,664 | |||||
X-Ray Equipment - 0.6% | |||||||
| Hologic, Inc.* | 1,100 | 61,160 | |||||
| Total Common Stock (Cost: $10,655,061) | 10,185,250 | ||||||
Principal Amount | Value | ||||||
Short Term Investments - 14.3% | |||||||
Money Market Funds - 12.8% | |||||||
| Boston Global Investment Trust - | |||||||
| Enhanced Portfolio, 3.017%** | $ | 1,328,506 | $ | 1,328,506 | |||
Time Deposit - 1.5% | |||||||
| Wachovia Bank London | |||||||
| 1.700%, 04/01/08 | 151,064 | 151,064 | |||||
| Total Short Term Investments (Cost: $1,479,570) | 1,479,570 | ||||||
| Total Investments - 112.5% (Cost: $12,134,631) | 11,664,820 | ||||||
| Liabilities in Excess of Other Assets - (12.5%) | (1,295,554 | ) | |||||
| Net Assets - 100.0% | $ | 10,369,266 | |||||
| * | Non-income producing securities. |
** | All of the security is purchased with cash collateral proceeds from securities loans. |
| ## | All or a portion of the Fund’s holdings in this security was on loan as of 3/31/08. |
ADR - American Depository Receipt
SCHEDULE OF INVESTMENTS BY SECTOR
as of March 31, 2008
| Sector | Percent of Net Assets | |||
| Consumer, Non-cyclical | 30.8 | % | ||
| Consumer, Cyclical | 16.8 | |||
| Industrial | 16.7 | |||
| Technology | 12.5 | |||
| Energy | 9.3 | |||
| Communications | 8.6 | |||
| Financial | 2.7 | |||
| Basic Materials | 0.8 | |||
| Short Term Investments | 14.3 | |||
| Total Investments | 112.5 | |||
| Other assets in excess of liabilities | (12.5 | ) | ||
| Net Assets | 100.0 | % | ||
See Accompanying Notes to Financial Statements.
8
U.S. ULTRA MICRO CAP FUND
Management Team: John C. McCraw, Portfolio Manager; Robert S. Marren, Portfolio Manager; Blake H. Burdine, Analyst; K. Mathew Axline, CFA, Analyst; Stephen W. Lyford, Analyst
Chief Investment Officer: Horacio A. Valeiras, CFA
Goal: The U.S. Ultra Micro Cap Fund seeks to maximize long-term capital appreciation by investing primarily in U.S. companies with market capitalizations below the median of the Russell Microcap Growth Index at time of purchase.
Market Overview: The period from January 28 (the inception date of the Fund) through March 31, 2008 was a volatile and uncertain time in the U.S. equity market. Stocks traded lower in response to a host of concerns, including:
| • | A deepening in the housing-induced credit crisis, which pushed the fifth-largest U.S. securities firm to the brink of collapse |
| • | Signs the U.S. economy was headed for — or already — in a recession, including the worst job losses in five years |
| • | Disappointing fourth quarter earnings reports, particularly from the financials and consumer discretionary sectors |
Weakness in the U.S. dollar and record oil prices contributed to the stock market’s decline. The dollar fell over 6% versus the euro and yen amid fears of a U.S. recession. This, in turn, drove demand for oil futures, which offer a hedge against a falling dollar.
In the last two weeks of the period, equities regained some of the ground that they had lost, supported by aggressive action from the Federal Reserve. The Fed established two new lending initiatives aimed at providing extra liquidity to the financial system and lowered the target funds rate another 0.75%. While the size of the cut was less than investors had hoped for, the combined effect of the policy moves boosted investor confidence.
Performance: The Fund’s Class I shares lost 7.20% from its January 28, 2008 inception through March 31, 2008. During the same time, the Russell Microcap Growth Index fell 6.56%.
Portfolio Specifics: Stock selection in the health care sector had the largest positive impact on results versus the index, helped by strong gains from VNUS Medical Technologies and Chindex International. VNUS develops medical devices that treat varicose veins and is experiencing robust demand for the next-generation system that it launched in 2007. Chindex sells health care services and medical equipment in China and is benefiting from the modernization of China’s health care system. Stock selection in the consumer discretionary sector was another key source of value added. Within consumer discretionary, top-performing holdings included Perry Ellis International, a sportswear design firm, and PC Mall, a computer hardware and software distributor.
Stock selection in the industrials and materials sectors subtracted the most from performance versus the index. A battery manufacturer with supply chain issues was a major detractor in industrials, while a chemical and climate control firm that reported slower-than-expected orders lagged in materials. An underweight in energy, the only sector in the benchmark to advance, also was unfavorable.
Market Outlook: Weakness in the economy and corporate earnings may continue to weigh on investor sentiment in the months ahead. However, valuations have become more attractive following the recent sell-off in equities, and, on March 31, it was widely expected that the Fed would cut interest rates at least one more time. Easier monetary policy bodes particularly well for smaller stocks, since small companies tend to depend more on bank loans to fund operations than larger firms.
Regardless of how macro events unfold, we are confident that our research-intensive investment process will identify companies with exceptional long-term growth prospects for the Fund.
The total returns shown above do not show the effects of income taxes on an individual’s investment. In most cases, taxes may reduce your actual investment returns on income or gains paid by the Fund or any gains you may realize if you sell your shares. Past performance cannot guarantee future results.
The Russell Microcap Index isolates the smallest 1,000 securities in the Russell 2000 Index plus the next 1,000 securities. The Russell Microcap Growth Index isolates the securities in the Russell Microcap Index with purely growth characteristics. The Index differs from the Fund in composition, do not pay management fees or expenses and includes reinvested dividends. One cannot invest directly in an index.
Since markets can go down as well as up, investment return and principal value will fluctuate with market conditions. You may have a gain or loss when you sell your shares.
9
U.S. ULTRA MICRO CAP FUND
SCHEDULE OF INVESTMENTS
As of March 31, 2008
Number of Shares | Value | ||||||
Common Stock - 98.9% | |||||||
Aerospace/Defense-Equipment - 1.2% | |||||||
| Ducommun, Inc.* | 372 | $ | 10,293 | ||||
Agricultural Biotechnology - 1.0% | |||||||
| Strategic Diagnostics, Inc. | 2,292 | 8,549 | |||||
Apparel Manufacturers - 1.3% | |||||||
| G-III Apparel Group, Ltd. | 853 | 11,447 | |||||
Applications Software - 2.0% | |||||||
| Ebix, Inc. | 240 | 17,760 | |||||
Auto/Truck Parts & Equipment-Original - 1.3% | |||||||
| Amerigon, Inc. | 753 | 11,144 | |||||
Batteries/Battery Systems - 0.9% | |||||||
| Ultralife Batteries, Inc. | 670 | 7,913 | |||||
Broadcast Services/Programming - 1.4% | |||||||
| DG FastChannel, Inc. | 640 | 12,275 | |||||
Chemicals-Plastics - 1.0% | |||||||
| Landec Corp. | 1,029 | 8,674 | |||||
Chemicals-Specialty - 1.4% | |||||||
| American Pacific Corp.* | 780 | 12,457 | |||||
Computer Services - 1.6% | |||||||
| BluePhoenix Solutions, Ltd. | 488 | 4,075 | |||||
| Furmanite Corp.* | 1,174 | 9,979 | |||||
| 14,054 | |||||||
Computer Software - 1.0% | |||||||
| Double-Take Software, Inc. | 800 | 9,344 | |||||
Computers-Integrated Systems - 1.6% | |||||||
| NCI, Inc. Cl. A | 767 | 14,435 | |||||
Computers-Voice Recognition - 1.3% | |||||||
| InterVoice, Inc. | 1,505 | 11,980 | |||||
Consulting Services - 2.1% | |||||||
| Hill International, Inc. | 1,458 | 18,240 | |||||
Data Processing/Management - 4.6% | |||||||
| CAM Commerce Solutions, Inc. | 361 | 13,368 | |||||
| Innodata Isogen, Inc. | 3,110 | 13,280 | |||||
| Versant Corp. | 566 | 14,207 | |||||
| 40,855 | |||||||
Decision Support Software - 1.4% | |||||||
| GSE Systems, Inc. | 1,545 | 12,576 | |||||
Distribution/Wholesale - 2.9% | |||||||
| BMP Sunstone Corp. | 1,176 | 9,008 | |||||
| Chindex International, Inc. | 433 | 16,341 | |||||
| 25,349 | |||||||
Diversified Manufacturing Operations - 3.5% | |||||||
| AZZ, Inc.* | 318 | 11,314 | |||||
| GP Strategies Corp.* | 1,058 | 10,051 | |||||
| LSB Industries, Inc.* | 630 | 9,286 | |||||
| 30,651 | |||||||
Electric Products-Miscellaneous - 1.5% | |||||||
| Graham Corp. | 156 | 5,552 | |||||
| Harbin Electric, Inc. | 616 | 8,070 | |||||
| 13,622 | |||||||
Electronic Components-Semiconductors - 1.3% | |||||||
| Advanced Analogic Technologies, Inc. | 700 | 3,934 | |||||
| Ceva, Inc. | 952 | 7,283 | |||||
| 11,217 | |||||||
Electronic Measure Instruments - 1.0% | |||||||
| LeCroy Corp. | 1,047 | 9,067 | |||||
Enterprise Software/Services - 0.5% | |||||||
| Salary.com, Inc. | 722 | 4,758 | |||||
Food-Miscellaneous/Diversified - 2.2% | |||||||
| Calavo Growers, Inc. | 456 | 7,925 | |||||
| Overhill Farms, Inc. | 2,400 | 12,000 | |||||
| 19,925 | |||||||
Funeral Services & Related Items - 1.3% | |||||||
| Carriage Services, Inc.* | 1,534 | 11,980 | |||||
Hazardous Waste Disposal - 0.9% | |||||||
| Heritage-Crystal Clean, Inc. | 500 | 7,835 | |||||
Human Resources - 1.0% | |||||||
| On Assignment, Inc. | 1,400 | 8,890 | |||||
Instruments-Controls - 0.8% | |||||||
| Spectrum Control, Inc.* | 831 | 7,030 | |||||
Insurance Brokers - 0.6% | |||||||
| Life Partners Holdings, Inc. | 267 | 4,926 | |||||
Internet Content-Info/News - 1.2% | |||||||
| ADAM, Inc. | 1,482 | 10,300 | |||||
Internet Financial Services - 1.1% | |||||||
| Insweb Corp. | 890 | 9,550 | |||||
Machinery Tools & Related Products - 1.1% | |||||||
| K-Tron International, Inc. | 83 | 9,969 | |||||
Machinery-General Industry - 1.5% | |||||||
| DXP Enterprises, Inc. | 329 | 12,925 | |||||
Machinery-Material Handling - 1.5% | |||||||
| Key Technology, Inc. | 459 | 13,674 | |||||
Medical Instruments - 2.4% | |||||||
| AtriCure, Inc. | 865 | 11,020 | |||||
| SenoRx, Inc. | 1,599 | 10,314 | |||||
| 21,334 | |||||||
Medical Labs &Testing Services - 2.0% | |||||||
| Bio-Imaging Technologies, Inc. | 1,214 | 8,510 | |||||
| Bio-Reference Labs, Inc. | 355 | 9,383 | |||||
| 17,893 | |||||||
Medical Laser Systems - 0.9% | |||||||
| Cynosure, Inc. Cl. A | 386 | 8,222 | |||||
Medical Products - 8.0% | |||||||
| Alphatec Holdings, Inc. | 1,778 | 8,926 | |||||
| Atrion Corp. | 107 | 10,694 | |||||
| Exactech, Inc. | 641 | 16,147 | |||||
| MTS Medication Technologies, Inc. | 507 | 6,185 | |||||
| Synovis Life Technologies, Inc. | 655 | 10,270 | |||||
| Vnus Medical Technologies, Inc. | 1,015 | 18,463 | |||||
| 70,685 | |||||||
Medical-Biomedical/Genetics - 2.8% | |||||||
| CryoLife, Inc. | 1,215 | 11,421 | |||||
| RTI Biologics, Inc. | 1,439 | 13,599 | |||||
| 25,020 | |||||||
MRI/Medical Diagnostic Imaging Centers - 0.7% | |||||||
| RadNet, Inc. | 930 | 6,547 | |||||
Oil Companies-Exploration & Production - 1.6% | |||||||
| Cano Petroleum, Inc. | 863 | 4,039 | |||||
| Evolution Petroleum Corp. | 2,175 | 9,896 | |||||
| 13,935 | |||||||
See Accompanying Notes to Financial Statements.
10
SCHEDULE OF INVESTMENTS
As of March 31, 2008
Number of Shares | Value | ||||||
Oil Field Machinery & Equipment - 2.3% | |||||||
| Bolt Technology Corp. | 437 | $ | 8,054 | ||||
| Mitcham Industries, Inc. | 700 | 12,474 | |||||
| 20,528 | |||||||
Pharmacy Services - 1.4% | |||||||
| BioScrip, Inc. | 1,886 | 12,749 | |||||
Power Conversion/Supply Equipment - 2.5% | |||||||
| C&D Technologies, Inc.* | 1,748 | 8,775 | |||||
| SL Industries, Inc.* | 666 | 13,253 | |||||
| 22,028 | |||||||
Private Corrections - 1.7% | |||||||
| Cornell Cos., Inc. | 657 | 14,756 | |||||
Recycling - 1.2% | |||||||
| Metalico, Inc. | 1,056 | 10,359 | |||||
Research & Development - 1.7% | |||||||
| Exponent, Inc. | 459 | 15,074 | |||||
Retail-Apparel/Shoe - 4.3% | |||||||
| Cache, Inc. | 853 | 9,630 | |||||
| HOT Topic, Inc. | 1,470 | 6,336 | |||||
| Shoe Carnival, Inc. | 718 | 9,715 | |||||
| The Wet Seal, Inc. Cl. A | 3,747 | 12,702 | |||||
| 38,383 | |||||||
Retail-Arts & Crafts - 0.7% | |||||||
| AC Moore Arts & Crafts, Inc. | 855 | 5,831 | |||||
Retail-Automobile - 1.0% | |||||||
| America’s Car-Mart, Inc. | 700 | 8,813 | |||||
Retail-Computer Equipment - 1.0% | |||||||
| PC Mall, Inc. | 821 | 8,727 | |||||
Retail-Discount - 1.2% | |||||||
| Citi Trends, Inc. | 600 | 11,070 | |||||
Retail-Miscellaneous/Diversified - 1.8% | |||||||
| Titan Machinery, Inc. | 864 | 16,157 | |||||
Schools - 0.8% | |||||||
| Learning Tree International, Inc. | 478 | 6,702 | |||||
Semiconductor Equipment - 1.1% | |||||||
| Amtech Systems, Inc. | 822 | 9,897 | |||||
Textile-Apparel - 1.5% | |||||||
| Perry Ellis International, Inc. | 600 | 13,098 | |||||
Therapeutics - 0.7% | |||||||
| Anika Therapeutics, Inc. | 778 | 6,597 | |||||
Transactional Software - 2.0% | |||||||
| Yucheng Technologies, Ltd. | 1,048 | 17,344 | |||||
Transport-Truck - 1.3% | |||||||
| Saia, Inc. | 746 | 11,832 | |||||
Veterinary Diagnostics - 1.0% | |||||||
| Animal Health International, Inc. | 781 | 8,544 | |||||
Vitamins & Nutrition Products - 1.1% | |||||||
| Omega Protein Corp. | 700 | 9,555 | |||||
Web Hosting/Design - 0.2% | |||||||
| NaviSite, Inc. | 963 | 2,128 | |||||
Wireless Equipment - 1.0% | |||||||
| Globecomm Systems, Inc. | 1,001 | 8,709 | |||||
| Total Common Stock (Cost: $920,352) | 876,181 | ||||||
Principal Amoount | Value | ||||||
Short Term Investments - 1.1% | |||||||
Time Deposit - 1.1% | |||||||
| Brown Brothers Harriman & Co. | |||||||
| 1.700%, 04/01/08 (Cost: $9,802) | $ | 9,802 | $ | 9,802 | |||
| Total Investments - 100.0% (Cost: $930,154) | 885,983 | ||||||
| Other Assets In Excess Of Liabilities - 0.0% | 165 | ||||||
| Net Assets - 100.0% | $ | 886,148 | |||||
| * | Non-income producing securities. |
SCHEDULE OF INVESTMENTS BY SECTOR
as of March 31, 2008
| Sector | Percent of Net Assets | |||
| Consumer, Non-cyclical | 30.8 | % | ||
| Consumer, Cyclical | 19.0 | |||
| Technology | 18.1 | |||
| Industrial | 17.9 | |||
| Communications | 6.2 | |||
| Energy | 3.9 | |||
| Basic Materials | 2.4 | |||
| Financial | 0.6 | |||
| Short Term Investments | 1.1 | |||
| Total Investments | 100.0 | |||
| Other assets in excess of liabilities | 0.0 | |||
| Net Assets | 100.0 | % | ||
See Accompanying Notes to Financial Statements.
11
U.S. SYSTEMATIC LARGE CAP GROWTH FUND
Management Team: James Li, Ph.D., CFA, Portfolio Manager; Jane Edmondson, Portfolio Manager; Lu Yu, CFA, CIPM, Analyst
Chief Investment Officer: Horacio A. Valeiras, CFA
Goal: The U.S. Systematic Large Cap Growth Fund seeks to maximize long-term capital appreciation by investing primarily in stocks from a universe of large U.S. companies with market capitalizations similar to the Russell 1000 Growth Index at time of purchase.
Market Overview: U.S. large-cap growth stocks finished the twelve months ended March 31, 2008 almost exactly where they had started. However, the flat returns obscured what was a volatile and eventful year in the equity market.
During the first half of the period, large-cap growth stocks posted healthy gains. The Russell 1000 Growth Index was lifted by robust merger and acquisition activity, better-than-expected corporate profits and signs the economy had rebounded from tepid growth in the first quarter of 2007. In addition, the core personal consumption expenditures (PCE) index — the Federal Reserve’s preferred measure of inflation — fell to its lowest level since 2004.
Stocks retreated in the fall and winter as problems in the subprime mortgage market spilled over into the broader credit markets and clouded the economic outlook. Financial institutions took huge writedowns on mortgage-related securities, causing lenders to worry about the value of all but the safest collateral. Short-term financing dried up, and the lack of liquidity necessitated the rescue of a major U.S. securities firm in a transaction facilitated by the Fed. The central bank’s role in the transaction was just one in a series of emergency steps that it took to shore up the financial system. Investors reacted favorably to the aggressive policy actions, and the Russell 1000 Growth Index gained more than 2% in the last two weeks of March.
Performance: The Fund’s Class I shares lost 1.92% between April 1, 2007 and March 31, 2008, and the Russell 1000 Growth Index declined 0.75%.
Portfolio Specifics: The Fund modestly trailed the index in the volatile market, as positive stock selection was overshadowed by sector allocations, which are a byproduct of our bottom-up investment process. Stock selection added the most value in the health care sector, led by a significant gain from Intuitive Surgical. The company makes products used in minimally invasive surgeries and is benefiting from the growing popularity of these types of procedures, which reduce the trauma, time and cost of surgery. Stock selection in the materials sector was another key area of relative strength, where mining company Freeport-McMoran Copper & Gold was a top contributor amid high metals prices. In terms of sector allocations, an overweight in consumer discretionary stocks was particularly unfavorable. The U.S. consumer faced a number of headwinds during the period, including falling home prices and rising food and energy costs.
Holdings remained well-diversified throughout the fiscal year, consistent with our risk-controlled approach to portfolio construction. On March 31, the Fund’s largest overweights versus the Russell 1000 Growth Index were in the health care (+5.0%) and information technology (+4.4%) sectors. The largest underweights were in consumer staples (-5.0%) and financials (-3.7%).
Market Outlook: Our process evaluates investment opportunities on a relative basis and is required to remain fully invested. As such, the process neither utilizes nor results in a forecast or outlook on the overall market, but expects to perform equally well versus the Russell 1000 Growth Index in both up and down markets.
By consistently applying this process in all market environments, we believe we will identify companies with excellent growth potential for the Fund.
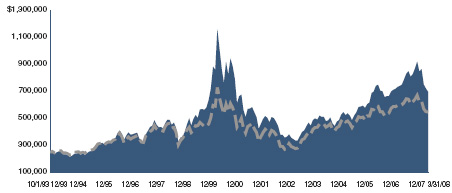
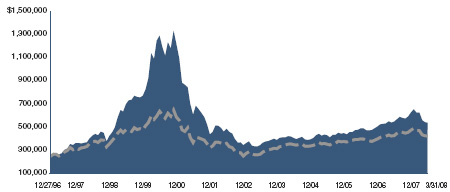
Comparison of Change in Value of a $250,000 Investment in U.S. Systematic Large Cap Growth Fund Class I and II Shares with the Russell 1000 Growth Index.

| Annualized Total Returns As of 3/31/08 | |||
1 Year | 5 Years | 10 Years | |
| U.S. Systematic Large Cap Growth | |||
| Fund Class I | -1.92% | 8.77% | 2.02% |
| Russell 1000 Growth Index | -0.75% | 9.96% | 1.28% |
12
U.S. SYSTEMATIC LARGE CAP GROWTH FUND

| Annualized Total Returns As of 3/31/08 | |||
1 Year | 5 Years | 10 Years | |
| U.S. Systematic Large Cap Growth | |||
| Fund Class II | -1.81% | 9.56% | 2.38% |
| Russell 1000 Growth Index | -0.75% | 9.96% | 1.28% |
The graphs above show the value of a hypothetical $250,000 investment in the Fund’s Class I and II shares compared with the Russell 1000 Growth Index for the periods indicated. The Fund’s Class I and II shares calculate their performance based upon the historical performance of a corresponding series of Nicholas-Applegate Mutual Funds (renamed ING Mutual Funds), adjusted to reflect all fees and expenses applicable to the Fund’s Class I and II shares. The Nicholas-Applegate Institutional Funds’ Class I shares were first available on May 7, 1999 and Class II shares on September 30, 2005. The historical performance of Class II shares includes the performance of Class I shares for periods prior to the inception of Class II. Average annual total return figures include changes in principal value, reinvested dividends, and capital gain distributions. The total returns shown above do not show the effects of income taxes on an individual’s investment. In most cases, taxes may reduce your actual investment returns on income or gains paid by the Fund or any gains you may realize if you sell your shares. Past performance cannot guarantee future results.
Russell 1000 Growth Index measures the performance of those Russell 1000 companies with higher price-to-book ratios and higher forecasted growth values. The Russell 1000 Index consists of the 1,000 largest securities in the Russell 3000 Index, which represents approximately 90% of the total market capitalization of the Russell 3000 Index. It is a large-cap, market-oriented index and is highly correlated with the S&P 500 Index. The unmanaged Index differs from the Fund in composition, does not pay management fees or expenses and includes reinvested dividends. One cannot invest directly in an index.
Since markets can go down as well as up, investment return and principal value will fluctuate with market conditions. You may have a gain or loss when you sell your shares.
13
U.S. SYSTEMATIC LARGE CAP GROWTH FUND
SCHEDULE OF INVESTMENTS
As of March 31, 2008
Number of Shares | Value | ||||||
Common Stock - 97.6% | |||||||
Aerospace/Defense - 2.3% | |||||||
| Lockheed Martin Corp. | 2,800 | $ | 278,040 | ||||
| Raytheon Co. | 1,900 | 122,759 | |||||
| 400,799 | |||||||
Agricultural Chemicals - 1.9% | |||||||
| Monsanto Co. | 2,900 | 323,350 | |||||
Applications Software - 4.9% | |||||||
| Microsoft Corp. | 29,500 | 837,210 | |||||
Athletic Footwear - 1.7% | |||||||
| Nike, Inc. Cl. B | 4,400 | 299,200 | |||||
Beverages-non-Alcoholic - 3.3% | |||||||
| PepsiCo, Inc. | 4,200 | 303,240 | |||||
| The Coca-Cola Co. | 4,400 | 267,828 | |||||
| 571,068 | |||||||
Cable TV - 0.9% | |||||||
| DISH Network Corp. Cl. A* | 5,400 | 155,142 | |||||
Chemicals-Diversified - 1.3% | |||||||
| Celanese Corp. Cl. A | 5,500 | 214,775 | |||||
Coal - 0.5% | |||||||
| Foundation Coal Holdings, Inc. | 1,600 | 80,528 | |||||
Computers - 8.5% | |||||||
| Apple, Inc.** | 2,600 | 373,100 | |||||
| Hewlett-Packard Co. | 12,700 | 579,882 | |||||
| International Business Machines Corp. | 4,400 | 506,616 | |||||
| 1,459,598 | |||||||
Computers-Memory Devices - 0.7% | |||||||
| Seagate Technology | 5,500 | 115,170 | |||||
Cosmetics & Toiletries - 1.2% | |||||||
| Procter & Gamble Co. | 2,975 | 208,458 | |||||
Diversified Manufacturing Operations - 1.6% | |||||||
| Tyco International, Ltd. | 6,300 | 277,515 | |||||
Electronic Components-Miscellaneous - 2.2% | |||||||
Garmin, Ltd.## | 3,600 | 194,436 | |||||
| Tyco Electronics, Ltd. | 5,500 | 188,760 | |||||
| 383,196 | |||||||
Electronic Components-Semiconductors - 4.8% | |||||||
| Intel Corp. | 31,300 | 662,934 | |||||
| MEMC Electronic Materials, Inc.** | 2,200 | 155,980 | |||||
| 818,914 | |||||||
Electronics-Military - 1.0% | |||||||
| L-3 Communications Holdings, Inc. | 1,600 | 174,944 | |||||
Engineering/R & D Services - 1.3% | |||||||
| Jacobs Engineering Group, Inc.* | 2,100 | 154,539 | |||||
| The Shaw Group, Inc.* | 1,500 | 70,710 | |||||
| 225,249 | |||||||
Engines-Internal Combust - 0.9% | |||||||
| Cummins, Inc. | 3,400 | 159,188 | |||||
Enterprise Software/Services - 2.8% | |||||||
| BMC Software, Inc.* | 5,900 | 191,868 | |||||
| Oracle Corp.* | 14,400 | 281,664 | |||||
| 473,532 | |||||||
Internet Security - 1.8% | |||||||
| Symantec Corp.* | 19,000 | 315,780 | |||||
Linen Supply & Related Items - 1.1% | |||||||
| Cintas Corp. | 6,900 | 196,926 | |||||
Machinery-Farm - 2.1% | |||||||
| AGCO Corp.* | 6,100 | 365,268 | |||||
Medical Instruments - 2.7% | |||||||
| Intuitive Surgical, Inc.* | 600 | 194,610 | |||||
| Medtronic, Inc. | 5,400 | 261,198 | |||||
| 455,808 | |||||||
Medical Products - 1.5% | |||||||
| Johnson & Johnson | 3,900 | 252,993 | |||||
Medical-Biomedical/Genetics - 2.0% | |||||||
| Amgen, Inc.* | 6,000 | 250,680 | |||||
| Millennium Pharmaceuticals, Inc.* | 6,000 | 92,760 | |||||
| 343,440 | |||||||
Medical-Drugs - 8.3% | |||||||
| Abbott Laboratories | 11,100 | 612,165 | |||||
| Forest Laboratories, Inc.* | 9,200 | 368,092 | |||||
| Merck & Co., Inc. | 4,500 | 170,775 | |||||
| Wyeth | 6,500 | 271,440 | |||||
| 1,422,472 | |||||||
Medical-HMO - 3.6% | |||||||
| Aetna, Inc. | 8,400 | 353,556 | |||||
| UnitedHealth Group, Inc. | 7,700 | 264,572 | |||||
| 618,128 | |||||||
Metal Processors & Fabrication - 1.2% | |||||||
| Precision Castparts Corp. | 2,000 | 204,160 | |||||
Metal-Diversified - 2.5% | |||||||
| Freeport-McMoRan Copper & Gold, Inc. | 4,500 | 432,990 | |||||
Networking Products - 4.8% | |||||||
| Cisco Systems, Inc.* | 29,400 | 708,246 | |||||
| Juniper Networks, Inc.* | 4,700 | 117,500 | |||||
| 825,746 | |||||||
Oil & Gas Drilling - 2.1% | |||||||
| Diamond Offshore Drilling, Inc. | 3,100 | 360,840 | |||||
Oil Companies-Exploration & Production - 1.1% | |||||||
| Occidental Petroleum Corp. | 2,600 | 190,242 | |||||
Oil Field Machinery & Equipment - 2.6% | |||||||
| National Oilwell Varco, Inc.* | 7,700 | 449,526 | |||||
Oil-Field Services - 1.2% | |||||||
| Smith International, Inc.* | 1,600 | 102,768 | |||||
| Transocean, Inc.* | 769 | 103,969 | |||||
| 206,737 | |||||||
Pharmacy Services - 2.5% | |||||||
| Medco Health Solutions, Inc.* | 10,000 | 437,900 | |||||
Publishing-Newspapers - 1.1% | |||||||
| Gannett Co., Inc. | 6,300 | 183,015 | |||||
Retail-Computer Equipment - 1.4% | |||||||
| GameStop Corp. Cl. A* | 4,700 | 243,037 | |||||
Retail-Discount - 2.7% | |||||||
| Dollar Tree, Inc.* | 5,800 | 160,022 | |||||
| Wal-Mart Stores, Inc. | 5,800 | 305,544 | |||||
| 465,566 | |||||||
Retail-Restaurants - 1.4% | |||||||
| McDonald’s Corp. | 4,400 | 245,388 | |||||
See Accompanying Notes to Financial Statements.
14
SCHEDULE OF INVESTMENTS
As of March 31, 2008
Number of Shares | Value | ||||||
Schools - 0.3% | |||||||
| Apollo Group, Inc. Cl. A* | 1,300 | $ | 56,160 | ||||
Super-Regional Banks-US - 2.9% | |||||||
| Capital One Financial Corp. | 3,800 | 187,036 | |||||
| Fifth Third BanCorp. | 14,700 | 307,524 | |||||
| 494,560 | |||||||
Telecommunications Equipment Fiber Optics - 0.9% | |||||||
| Ciena Corp.* | 4,800 | 147,984 | |||||
Telephone-Integrated - 0.9% | |||||||
| Verizon Communications, Inc. | 4,400 | 160,380 | |||||
Television - 1.8% | |||||||
| CBS Corp. Cl. B | 14,300 | 315,744 | |||||
Web Portals/ISP - 1.3% | |||||||
| Google, Inc. Cl. A* | 500 | 220,235 | |||||
| Total Common Stock (Cost: $16,308,736) | 16,788,861 | ||||||
Principal Amount | |||||||
Short Term Investments - 2.7% | |||||||
Repurchase Agreement - 0.3% | |||||||
| Lehman Brothers, Inc., 1.600% | |||||||
| dated 3/31/08, to be repurchased | |||||||
| at $57,253 on 4/1/08 (collateralized | |||||||
| by U.S. Treasury Note, 4.625% | |||||||
| due 11/15/09)** | $ | 57,250 | 57,250 | ||||
Time Deposit - 2.4% | |||||||
| Wachovia Bank London | |||||||
| 1.700%, 04/01/08 | 414,653 | 414,653 | |||||
| Total Short Term Investments (Cost: $471,903) | 471,903 | ||||||
| Total Investments - 100.3% (Cost: $16,780,639) | 17,260,764 | ||||||
| Liabilities In Excess of Other Assets - (0.3%) | (54,363 | ) | |||||
| Net Assets - 100.0% | $ | 17,206,401 | |||||
* | Non-income producing securities. |
** | All of the security is purchased with cash collateral proceeds from securities loans. |
| ## | All or a portion of the Fund’s holdings in this security was on loan as of 03/31/08. |
SCHEDULE OF INVESTMENTS BY SECTOR
as of March 31, 2008
| Sector | Percent of Net Assets | |||
| Consumer, Non-cyclical | 25.4 | % | ||
| Technology | 21.5 | |||
| Communications | 13.5 | |||
| Industrial | 12.7 | |||
| Consumer, Cyclical | 8.4 | |||
| Energy | 7.5 | |||
| Basic Materials | 5.7 | |||
| Financial | 2.9 | |||
| Short Term Investments | 2.7 | |||
| Total Investments | 100.3 | |||
| Liabilities in excess of other assets | (0.3 | ) | ||
| Net Assets | 100.0 | % | ||
See Accompanying Notes to Financial Statements.
15
U.S. SMALL TO MID CAP GROWTH FUND
Management Team: John C. McCraw, Portfolio Manager; Robert S. Marren, Portfolio Manager; Blake H. Burdine, Analyst; K. Mathew Axline, CFA, Analyst; Stephen W. Lyford, Analyst
Chief Investment Officer: Horacio A. Valeiras, CFA
Goal: The U.S. Small to Mid Cap Growth Fund seeks to maximize long-term capital appreciation by investing primarily in stocks from a universe of U.S. companies with small to mid (SMID) market capitalizations similar to the Russell 2500 Growth Index at time of purchase.
Market Overview: The small- to mid-cap growth segment of the U.S. equity market, as measured by the Russell 2500 Growth Index, posted a loss between July 31, 2007 (the inception date of the Fund) and March 31, 2008. The decline was part of a broad sell-off in equities that pressured stock prices across styles and capitalization ranges.
The period began on a strong note, with the index rising in August, September and October amid a new easing cycle from the Federal Reserve. In August, the Fed cut the discount rate to help stem the global liquidity crisis that had been triggered by rising defaults on residential mortgages. Concerned that the housing correction and liquidity crunch might tip the economy into a recession, the central bank cut the key funds rate in September and October — its first such reductions since June 2003.
Over the remainder of the period, the Russell 2500 Growth Index gave back all of its prior gains and then some, as investors confronted a wave of bad news. Economic indicators were weak, corporate earnings were disappointing and deterioration in the credit markets left the fifth-largest U.S. securities firm on the verge of bankruptcy. The Fed took a series of emergency actions aimed at avoiding a systemic financial failure, including opening the discount window to securities dealers for overnight loans. Its efforts helped calm the markets, and the index advanced during the last two weeks of March.
Performance: The Fund’s Class I shares declined 9.80% from its July 31, 2007 inception through March 31, 2008. The Russell 2500 Growth Index lost 8.54% during the same period.
Portfolio Specifics: Stock selection in the industrials and materials sectors had the largest positive impact on results versus the index. Two of the Fund’s best-performing holdings were Flowserve, a manufacturer of industrial flow equipment such as pumps and valves, and CF Industries, a fertilizer producer. Flowserve experienced a surge in orders and backlog growth, driven by strong global demand for energy and water infrastructure. CF Industries is benefiting from increased corn acreage, as U.S. farmers planted more acres of corn in 2007 than they had in over 60 years. Relative performance also received a boost from an underweight in consumer discretionary stocks. The consumer discretionary sector was one of the worst-performing groups in the index due to record-high gasoline prices, falling home values and thinning job prospects.
Areas of relative weakness included stock selection in the energy and information technology sectors, as well as an underweight in health care. Investors tend to favor the stable demand characteristics of health care stocks when economic growth is slowing, and this period was no exception.
Market Outlook: Weakness in the economy and corporate earnings may continue to weigh on investor sentiment in the months ahead. However, valuations have become more attractive following the recent sell-off in equities, and, on March 31, it was widely expected that the Fed would cut interest rates at least one more time. Easier monetary policy bodes particularly well for smaller stocks, since small companies tend to depend more on bank loans to fund operations than larger firms.
In this dynamic market environment, we believe that our focus on small- and mid-cap stocks exhibiting positive and sustainable change will benefit the Fund.
The total returns shown above do not show the effects of income taxes on an individual’s investment. In most cases, taxes may reduce your actual investment returns on income or gains paid by the Fund or any gains you may realize if you sell your shares. Past performance cannot guarantee future results.
The Russell 2500 Index measures the performance of the 2,500 smallest companies in the Russell 3000 Index, which represents approximately 22% of the total market capitalization of the Russell 3000 Index. The Russell 2500 Growth Index isolates the securities in the Russell 2500 Index with purely growth characteristics. The Index differs from the Fund in composition, do not pay management fees or expenses and includes reinvested dividends. One cannot invest directly in an index.
Since markets can go down as well as up, investment return and principal value will fluctuate with market conditions. You may have a gain or loss when you sell your shares.
16
U.S. SMALL TO MID CAP GROWTH FUND
SCHEDULE OF INVESTMENTS
As of March 31, 2008
Number of Shares | Value | ||||||
Common Stock - 97.3% | |||||||
Aerospace/Defense-Equipment - 3.4% | |||||||
| AAR Corp.* | 1,300 | $ | 35,451 | ||||
| BE Aerospace, Inc.* | 1,100 | 38,445 | |||||
| DRS Technologies, Inc. | 800 | 46,624 | |||||
| Orbital Sciences Corp.* | 1,800 | 43,380 | |||||
| 163,900 | |||||||
Agricultural Chemicals - 0.6% | |||||||
| CF Industries Holdings, Inc. | 300 | 31,086 | |||||
Alternative Waste Tech - 0.9% | |||||||
| Darling International, Inc.* | 3,500 | 45,325 | |||||
Applications Software - 0.8% | |||||||
| Salesforce.com, Inc.* | 700 | 40,509 | |||||
Auto/Truck Parts & Equipment-Original - 1.4% | |||||||
| BorgWarner, Inc. | 700 | 30,121 | |||||
| Titan International, Inc. | 1,200 | 36,732 | |||||
| 66,853 | |||||||
Batteries/Battery Systems - 0.7% | |||||||
| EnerSys* | 1,400 | 33,488 | |||||
Beverages-Wine/Spirits - 1.2% | |||||||
| Central European Distribution Corp.* | 1,000 | 58,190 | |||||
Building-Heavy Construction - 0.7% | |||||||
| Chicago Bridge & Iron Co. NV | 900 | 35,316 | |||||
Chemicals-Diversified - 1.7% | |||||||
| Celanese Corp. Cl. A | 1,100 | 42,955 | |||||
| FMC Corp. | 700 | 38,843 | |||||
| 81,798 | |||||||
Chemicals-Specialty - 0.8% | |||||||
| Ecolab, Inc. | 900 | 39,087 | |||||
Coffee - 0.6% | |||||||
| Green Mountain Coffee Roasters, Inc.* | 900 | 28,485 | |||||
Commercial Services - 1.6% | |||||||
| Quanta Services, Inc.* | 1,600 | 37,072 | |||||
| TeleTech Holdings, Inc.* | 1,800 | 40,428 | |||||
| 77,500 | |||||||
Computer Services - 0.5% | |||||||
| BluePhoenix Solutions, Ltd.* | 3,100 | 25,885 | |||||
Computer Software - 0.6% | |||||||
| Omniture, Inc.* | 1,300 | 30,173 | |||||
Computers-Integrated Systems - 1.0% | |||||||
| Micros Systems, Inc.* | 1,400 | 47,124 | |||||
Computers-Memory Devices - 0.9% | |||||||
| Western Digital Corp.* | 1,600 | 43,264 | |||||
Consulting Services - 2.7% | |||||||
| FTI Consulting, Inc.* | 400 | 28,416 | |||||
| Gartner, Inc. Cl. A* | 2,100 | 40,614 | |||||
| Watson Wyatt Worldwide, Inc. Cl. A | 1,100 | 62,425 | |||||
| 131,455 | |||||||
Consumer Products-Miscellaneous - 1.9% | |||||||
| Jarden Corp.* | 1,800 | 39,132 | |||||
| Tupperware Brands Corp. | 1,400 | 54,152 | |||||
| 93,284 | |||||||
Containers-Metal/Glass - 1.0% | |||||||
| Owens-Illinois, Inc.* | 900 | 50,787 | |||||
Data Processing/Management - 0.6% | |||||||
| FalconStor Software, Inc.* | 3,600 | 27,396 | |||||
Diversified Manufacturing Operations - 1.8% | |||||||
| Harsco Corp. | 800 | 44,304 | |||||
| SPX Corp. | 400 | 41,960 | |||||
| 86,264 | |||||||
E-Commerce/Services - 1.3% | |||||||
| Expedia, Inc.* | 1,300 | 28,457 | |||||
| priceline.com, Inc.* | 300 | 36,258 | |||||
| 64,715 | |||||||
Electronic Components-Semiconductors - 2.5% | |||||||
| Emcore Corp.* | 3,000 | 17,280 | |||||
| MEMC Electronic Materials, Inc.* | 500 | 35,450 | |||||
| Monolithic Power Systems, Inc.* | 1,800 | 31,734 | |||||
| PMC - Sierra, Inc.* | 6,100 | 34,770 | |||||
| 119,234 | |||||||
Electronic Measure Instruments - 1.4% | |||||||
| Itron, Inc.* | 400 | 36,092 | |||||
| Trimble Navigation, Ltd.* | 1,200 | 34,308 | |||||
| 70,400 | |||||||
E-Marketing/Information - 0.4% | |||||||
| Valueclick, Inc.* | 1,100 | 18,975 | |||||
Energy-Alternate Sources - 1.0% | |||||||
| Canadian Solar, Inc.* | 2,300 | 48,070 | |||||
Engineering/R & D Services - 1.4% | |||||||
| Foster Wheeler, Ltd.* | 500 | 28,310 | |||||
| Stanley, Inc.* | 1,400 | 41,244 | |||||
| 69,554 | |||||||
Enterprise Software/Services - 1.4% | |||||||
| Concur Technologies, Inc.* | 1,200 | 37,260 | |||||
| PROS Holdings, Inc.* | 2,300 | 28,865 | |||||
| 66,125 | |||||||
Entertainment Software - 0.8% | |||||||
| Activision, Inc.* | 1,500 | 40,965 | |||||
Finance-Other Services - 0.9% | |||||||
| The Nasdaq OMX Group | 1,100 | 42,526 | |||||
Food-Wholesale/Distribution - 0.9% | |||||||
| Spartan Stores, Inc. | 2,000 | 41,700 | |||||
Industrial Gases - 0.6% | |||||||
| Airgas, Inc. | 600 | 27,282 | |||||
Instruments-Controls - 1.0% | |||||||
| Mettler Toledo International, Inc.* | 500 | 48,560 | |||||
Internet Applications Software - 1.8% | |||||||
| eResearchTechnology, Inc.* | 3,700 | 45,954 | |||||
| Vocus, Inc.* | 1,500 | 39,600 | |||||
| 85,554 | |||||||
Internet Security - 0.7% | |||||||
| Blue Coat Systems, Inc.* | 1,500 | 33,060 | |||||
Leisure & Recreational Products - 1.0% | |||||||
| WMS Industries, Inc.* | 1,350 | 48,559 | |||||
Machinery-General Industry - 3.3% | |||||||
| Chart Industries, Inc.* | 1,500 | 50,760 | |||||
| Robbins & Myers, Inc. | 1,200 | 39,180 | |||||
| Roper Industries, Inc. | 500 | 29,720 | |||||
| The Manitowoc Co., Inc. | 1,000 | 40,800 | |||||
| 160,460 | |||||||
See Accompanying Notes to Financial Statements.
17
U.S. SMALL TO MID CAP GROWTH FUND
SCHEDULE OF INVESTMENTS
As of March 31, 2008
Number of Shares | Value | ||||||
Machinery-Pumps - 1.1% | |||||||
| Flowserve Corp. | 500 | $ | 52,190 | ||||
Medical Information Systems - 0.6% | |||||||
| Phase Forward, Inc.* | 1,700 | 29,036 | |||||
Medical Instruments - 3.1% | |||||||
| Arthrocare Corp.* | 900 | 30,015 | |||||
| Intuitive Surgical, Inc.* | 200 | 64,870 | |||||
| NuVasive, Inc.* | 900 | 31,059 | |||||
| Symmetry Medical, Inc.* | 1,600 | 26,560 | |||||
| 152,504 | |||||||
Medical Labs &Testing Services - 1.1% | |||||||
| Icon PLC - ADR* | 800 | 51,912 | |||||
Medical Laser Systems - 0.7% | |||||||
| Cynosure, Inc. Cl. A* | 1,500 | 31,950 | |||||
Medical Products - 2.7% | |||||||
| China Medical Technologies, Inc. - ADR | 900 | 36,981 | |||||
| Haemonetics Corp.* | 900 | 53,622 | |||||
| Wright Medical Group, Inc.* | 1,700 | 41,038 | |||||
| 131,641 | |||||||
Medical-Biomedical/Genetics - 2.3% | |||||||
| Qiagen NV* | 2,200 | 45,760 | |||||
| Alexion Pharmaceuticals, Inc.* | 600 | 35,580 | |||||
| Savient Pharmaceuticals, Inc.* | 1,500 | 30,000 | |||||
| 111,340 | |||||||
Medical-Nursing Homes - 0.7% | |||||||
| Sun Healthcare Group, Inc.* | 2,500 | 32,850 | |||||
Medical-Outpatient/Home Medical Care - 0.8% | |||||||
| Air Methods Corp.* | 800 | 38,696 | |||||
Non-Hazardous Waste Disposal - 0.8% | |||||||
| Allied Waste Industries, Inc.* | 3,800 | 41,078 | |||||
Oil Companies-Exploration & Production - 2.7% | |||||||
| Carrizo Oil & Gas, Inc.* | 800 | 47,416 | |||||
| Penn Virginia Corp. | 900 | 39,681 | |||||
| Plains Exploration & Production Co.* | 800 | 42,512 | |||||
| 129,609 | |||||||
Oil Field Machinery & Equipment - 0.7% | |||||||
| T-3 Energy Services, Inc.* | 800 | 34,048 | |||||
Oil-Field Services - 3.5% | |||||||
| Willbros Group, Inc.* | 1,300 | 39,780 | |||||
| Helix Energy Solutions Group, Inc.* | 1,100 | 34,650 | |||||
| Hercules Offshore, Inc.* | 1,200 | 30,144 | |||||
| Hornbeck Offshore Services, Inc.* | 800 | 36,536 | |||||
| Matrix Service Co.* | 1,800 | 30,924 | |||||
| 172,034 | |||||||
Pharmacy Services - 0.7% | |||||||
| HealthExtras, Inc.* | 1,400 | 34,776 | |||||
Physical Practice Management - 0.8% | |||||||
| Pediatrix Medical Group, Inc.* | 600 | 40,440 | |||||
Private Corrections - 2.0% | |||||||
| Corrections Corp. of America* | 2,100 | 57,792 | |||||
| The Geo Group, Inc.* | 1,400 | 39,816 | |||||
| 97,608 | |||||||
Property/Casualty Insurance - 0.9% | |||||||
| Amtrust Financial Services, Inc. | 2,600 | 42,146 | |||||
Research & Development - 1.7% | |||||||
| Parexel International Corp.* | 1,600 | 41,760 | |||||
| Pharmaceutical Product Development, Inc. | 1,000 | 41,900 | |||||
| 83,660 | |||||||
Retail-Apparel/Shoe - 7.4% | |||||||
| American Eagle Outfitters, Inc. | 2,100 | 36,771 | |||||
| AnnTaylor Stores Corp.* | 1,700 | 41,106 | |||||
| Bebe Stores, Inc. | 3,100 | 33,325 | |||||
| Brown Shoe Co., Inc. | 2,200 | 33,154 | |||||
| Chico’s FAS, Inc.* | 3,800 | 27,018 | |||||
| Dress Barn, Inc.* | 2,900 | 37,526 | |||||
| Liz Claiborne, Inc. | 1,700 | 30,855 | |||||
| Nordstrom, Inc. | 1,100 | 35,860 | |||||
| Phillips-Van Heusen Corp. | 1,200 | 45,504 | |||||
| Polo Ralph Lauren Corp. Cl. A | 700 | 40,803 | |||||
| 361,922 | |||||||
Retail-Automobile - 0.6% | |||||||
| Copart, Inc.* | 800 | 31,008 | |||||
Retail-Miscellaneous/Diversified - 1.0% | |||||||
| Pricesmart, Inc. | 1,800 | 49,878 | |||||
Retail-Restaurants - 1.5% | |||||||
| Brinker International, Inc. | 2,000 | 37,100 | |||||
| CBRL Group, Inc. | 1,000 | 35,770 | |||||
| 72,870 | |||||||
Retail-Sporting Goods - 0.6% | |||||||
| Zumiez, Inc.* | 1,900 | 29,811 | |||||
Schools - 0.5% | |||||||
| DeVry, Inc. | 600 | 25,104 | |||||
Seismic Data Collection - 0.6% | |||||||
| ION Geophysical Corp.* | 2,200 | 30,360 | |||||
Semiconductor Components- | |||||||
Integrated Circuits - 0.5% | |||||||
| Sigma Designs, Inc.* | 1,000 | 22,670 | |||||
Semiconductor Equipment - 0.6% | |||||||
| Teradyne, Inc.* | 2,400 | 29,808 | |||||
Telecommunications Equipment Fiber Optics - 0.9% | |||||||
| JDS Uniphase Corp.* | 3,400 | 45,526 | |||||
Telecommunications Services - 1.7% | |||||||
| NTELOS Holdings Corp. | 1,500 | 36,300 | |||||
| Premiere Global Services, Inc.* | 3,100 | 44,454 | |||||
| 80,754 | |||||||
Therapeutics - 1.2% | |||||||
| Alnylam Pharmaceuticals, Inc.* | 1,000 | 24,400 | |||||
| BioMarin Pharmaceutical, Inc.* | 900 | 31,833 | |||||
| 56,233 | |||||||
Transport-Rail - 1.1% | |||||||
| Genesee & Wyoming, Inc. Cl. A* | 1,500 | 51,600 | |||||
Transport-Services - 0.9% | |||||||
| Pacer International, Inc. | 2,600 | 42,718 | |||||
Veterinary Diagnostics - 0.7% | |||||||
| Neogen Corp.* | 1,400 | 35,140 | |||||
Vitamins & Nutrition Products - 1.5% | |||||||
| Herbalife, Ltd. | 800 | 38,000 | |||||
| Omega Protein Corp.* | 2,600 | 35,490 | |||||
| 73,490 | |||||||
Web Portals/ISP - 1.5% | |||||||
| Sohu.com, Inc.* | 700 | 31,591 | |||||
| Trizetto Group* | 2,500 | 41,725 | |||||
| 73,316 | |||||||
Wire & Cable Products - 0.6% | |||||||
| Fushi Copperweld, Inc.* | 2,100 | 31,584 | |||||
See Accompanying Notes to Financial Statements.
18
SCHEDULE OF INVESTMENTS
As of March 31, 2008
Number of Shares | Value | ||||||
Wound, Burn & Skin Care - 0.4% | |||||||
| Obagi Medical Products, Inc.* | 2,200 | $ | 19,096 | ||||
X-Ray Equipment - 0.8% | |||||||
| Hologic, Inc.* | 700 | 38,920 | |||||
| Total Common Stock (Cost: $4,915,483) | 4,732,234 | ||||||
Principal Amount | |||||||
Short Term Investments - 2.7% | |||||||
Time Deposit - 2.7% | |||||||
| Wachovia Bank London | |||||||
| 1.700%, 04/01/08 (Cost: $132,530) | $ | 132,530 | 132,530 | ||||
| Total Investments - 100.0% (Cost: $5,048,013) | 4,864,764 | ||||||
| Liabilities in Excess of Other Assets - (0.0%) | (2,758 | ) | |||||
| Net Assets - 100.0% | $ | 4,862,006 | |||||
| * | Non-income producing securities. |
ADR - American Depository Receipt
SCHEDULE OF INVESTMENTS BY SECTOR
as of March 31, 2008
| Sector | Percent of Net Assets | |||
| Consumer, Non-cyclical | 30.6 | % | ||
| Industrial | 20.8 | |||
| Consumer, Cyclical | 13.6 | |||
| Technology | 10.1 | |||
| Energy | 8.5 | |||
| Communications | 8.3 | |||
| Basic Materials | 3.7 | |||
| Financial | 1.7 | |||
| Short Term Investments | 2.7 | |||
| Total Investments | 100.0 | |||
| Liabilities in excess of other assets | (0.0 | ) | ||
| Net Assets | 100.0 | % | ||
See Accompanying Notes to Financial Statements.
19
U.S. CONVERTIBLE FUND
Management Team: Douglas G. Forsyth, CFA, Portfolio Manager; William L. Stickney, Portfolio Manager; Justin Kass, CFA, Portfolio Manager; Michael E. Yee, Portfolio Manager; Elizabeth Lemesevski, Analyst; David A. Foster, CPA, CFA, Analyst; Joanna H. Willars, Analyst; Nicole D. Larrabee, Fixed Income Trading Assistant
Chief Investment Officer: Horacio A. Valeiras, CFA
Goal: The U.S. Convertible Fund seeks to maximize total return consisting of capital appreciation and current income by investing primarily in convertible securities of U.S. companies across all market capitalizations.
Market Overview: The Merrill Lynch All Convertibles All Qualities Index fell 3.74% during the twelve months ended March 31, 2008. By way of comparison, the S&P 500 Index lost 5.08% and the NASDAQ Composite Index declined 6.09%.
Like U.S. equities, the convertible market began the period on a strong note, generating healthy gains in the spring. However, several events came together over the summer that roiled the credit markets and continued to weigh on convertible and equity performance for the rest of the fiscal year. Rising delinquencies on mortgages led to rapid quality and price declines in collateralized mortgage obligations (CMOs). Price declines in the CMO market led to price declines in all collateralized debt obligations (CDOs) which, in turn, cut off demand for loans. The lack of demand for loans ultimately put pressure on all bond and stock prices. 2007 ended with many unanswered questions about the fate of the financial markets, and the news flow in early 2008 was downbeat. After cutting interest rates 1% in the fall, the Federal Reserve became more aggressive and lowered rates 2% in the first quarter of 2008.
Consistent with the volatile conditions, larger-cap, investment-grade convertibles outperformed. Industry returns were mixed. Materials and energy posted strong gains, while telecommunications and transportation were especially weak.
Performance: The Fund’s Class I shares gained 3.84% during the twelve months ended March 31, 2008, outperforming the Merrill Lynch All Convertibles All Qualities Index, which lost 3.74%.
Portfolio Specifics: Security selection was the key driver of absolute and relative results, and the top performers were those companies that improved their operating statistics and exceeded profit expectations. Issuers from diverse industries contributed to the Fund’s positive return, including several energy companies that advanced on solid corporate earnings, attractive valuations and higher energy prices. Select consumer staples names benefited from investor rotation into defensive industries, and a consulting firm moved higher on record profits. Lastly, several of our portfolio holdings were acquired at large premiums. Issuers that negatively impacted performance included two automotive manufacturers that declined as weak consumer spending hurt auto sales.
On March 31, the Fund’s conversion premium was 26% versus the market’s premium of 48%. The Fund continues to be well positioned to participate in the upside of the market, while not sacrificing downside protection.
Market Outlook: The outlook for the U.S. convertible market remains clouded. Economic statistics are weak, commodity prices are high and earnings estimates are trending lower. However, many issuers remain fundamentally sound, valuations are less expensive and the Fed’s rate cuts are starting to favorably impact market psychology. Against the uncertain backdrop, we believe that our focus on companies that are differentiating themselves by exceeding expectations and improving their credit statistics will be rewarded.
We continue to build the Fund one security at a time by finding companies that are opportunistically capitalizing on change. We are also maintaining our discipline of identifying the best convertibles with the optimal risk/reward profile: 70-80% of the upside and 40-50% of the downside.
Comparison of Change in Value of a $250,000 Investment in U.S. Convertible Fund Class I, II and IV Shares with the Merrill Lynch All Convertibles, All Qualities Index.
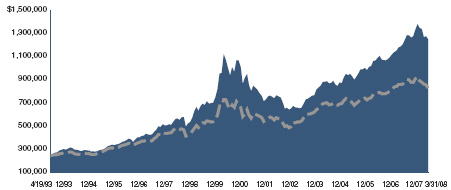
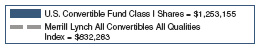
| Annualized Total Returns As of 3/31/08 | |||
1 Year | 5 Years | 10 Years | |
| U.S. Convertible Fund Class I | 3.84% | 13.58% | 8.34% |
| Merrill Lynch All Convertibles | |||
| All Qualities Index | -3.74% | 8.66% | 5.60% |
20
U.S. CONVERTIBLE FUND
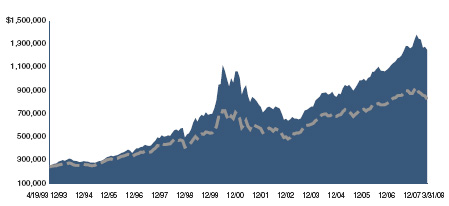
| Annualized Total Returns As of 3/31/08 | |||
1 Year | 5 Years | 10 Years | |
| U.S. Convertible Fund Class II | 3.91% | 13.66% | 8.38% |
| Merrill Lynch All Convertibles | |||
| All Qualities Index | -3.74% | 8.66% | 5.60% |
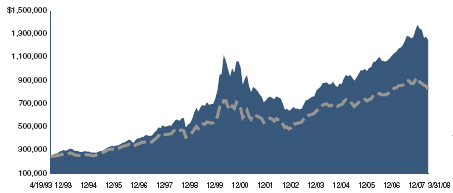

| Annualized Total Returns As of 3/31/08 | |||
1 Year | 5 Years | 10 Years | |
| U.S. Convertible Fund Class IV | 4.07% | 13.66% | 8.38% |
| Merrill Lynch All Convertibles | |||
| All Qualities Index | -3.74% | 8.66% | 5.60% |
The graphs above show the value of a hypothetical $250,000 investment in the Fund’s Class I, II and IV shares compared with the Merrill Lynch All Convertibles, All Qualities Index for the periods indicated. The Fund’s Class I, II and IV shares calculate their performance based upon the historical performance of their corresponding series of Nicholas-Applegate Mutual Funds (renamed ING Mutual Funds), adjusted to reflect all fees and expenses applicable to the Fund’s Class I, II and IV shares. The Nicholas- Applegate Institutional Funds’ Class I shares were first available on May 7, 1999, Class II shares on September 30, 2005 and Class IV shares on December 30, 2006. The historical performance of Class I, II and IV shares includes the performance of Class I shares for periods prior to the inception of Class II. Average annual total return figures include changes in principal value, reinvested dividends, and capital gain distributions. The total returns shown above do not show the effects of income taxes on an individual’s investment. In most cases, taxes may reduce your actual investment returns on income or gains paid by the Fund or any gains you may realize if you sell your shares. Past performance cannot guarantee future results.
The Merrill Lynch All Convertible All Quality Index represents convertible securities spanning all corporate sectors and having a par amount outstanding of $25 Mil+. Maturities must be at least one year. The coupon range must be equal to or greater than zero and all qualities of bonds are included. Preferred equity redemption stocks are not included nor are component bonds once they are converted into corporate stock.
The unmanaged indexes differ from the Fund in composition, do not pay management fees or expenses and include reinvested dividends. One cannot invest directly in an index.
Since markets can go down as well as up, investment return and principal value will fluctuate with market conditions. You may have a gain or loss when you sell your shares.
21
U.S. CONVERTIBLE FUND
SCHEDULE OF INVESTMENTS
As of March 31, 2008
Principal Amount | Value | ||||||
Convertible Corporate Bond - 81.9% | |||||||
Aerospace/Defense - 1.5% | |||||||
Lockheed Martin Corp.++ | |||||||
| 2.815%, 08/15/33 | $ | 3,350,000 | $ | 4,604,910 | |||
Aerospace/Defense-Equipment - 3.2% | |||||||
| Orbital Sciences Corp. | |||||||
| 2.438%, 01/15/27 | 4,305,000 | 5,241,337 | |||||
| Triumph Group, Inc. | |||||||
| 2.625%, 10/01/26 | 3,645,000 | 4,556,250 | |||||
| 9,797,587 | |||||||
Agricultural Operations - 1.7% | |||||||
| Archer-Daniels-Midland Co. | |||||||
| 0.875%, 02/15/14 | 4,475,000 | 5,218,969 | |||||
Applications Software - 1.4% | |||||||
| Nuance Communications, Inc. | |||||||
| 2.750%, 08/15/27 | 845,000 | 975,975 | |||||
Nuance Communications, Inc. 144A# | |||||||
| 2.750%, 08/15/27 | 2,845,000 | 3,285,975 | |||||
| 4,261,950 | |||||||
Auto-Cars/Light Trucks - 1.3% | |||||||
| Ford Motor Co. | |||||||
| 4.250%, 12/15/36 | 4,610,000 | 3,976,125 | |||||
Brewery - 1.6% | |||||||
| Molson Coors Brewing Co. | |||||||
| 2.500%, 07/30/13 | 4,110,000 | 5,070,712 | |||||
Broadcast Services/Programming - 1.5% | |||||||
| Liberty Media LLC | |||||||
| 0.750%, 03/30/23 | 4,600,000 | 4,577,000 | |||||
Casino Services - 1.7% | |||||||
| International Game Technology | |||||||
| 2.600%, 12/15/36 | 5,120,000 | 5,184,000 | |||||
Commercial Services - 1.3% | |||||||
| Quanta Services, Inc. | |||||||
| 3.750%, 04/30/26 | 2,395,000 | 3,032,669 | |||||
Quanta Services, Inc. 144A# | |||||||
| 3.750%, 04/30/26 | 870,000 | 1,101,638 | |||||
| 4,134,307 | |||||||
Computer Services - 2.9% | |||||||
| DST Systems, Inc. | |||||||
| 4.125%, 08/15/23 | 2,995,000 | 4,376,444 | |||||
| Electronic Data Systems Corp. | |||||||
| 3.875%, 07/15/23 | 4,665,000 | 4,565,869 | |||||
| 8,942,313 | |||||||
Computers-Memory Devices - 1.2% | |||||||
| EMC Corp. | |||||||
| 1.750%, 12/01/11 | 1,335,000 | 1,576,969 | |||||
EMC Corp. 144A# | |||||||
| 1.750%, 12/01/11 | 1,885,000 | 2,226,656 | |||||
| 3,803,625 | |||||||
Consulting Services - 1.8% | |||||||
| FTI Consulting, Inc. | |||||||
| 3.750%, 07/15/12 | 2,305,000 | 5,560,812 | |||||
Diagnostic Kits - 0.5% | |||||||
| Inverness Medical Innovations, Inc. | |||||||
| 3.000%, 05/15/16 | 245,000 | 230,913 | |||||
Inverness Medical Innovations, Inc. 144A# | |||||||
| 3.000%, 05/15/16 | 1,290,000 | 1,215,825 | |||||
| 1,446,738 | |||||||
E-Commerce/Products - 1.7% | |||||||
| Amazon.Com, Inc. | |||||||
| 4.750%, 02/01/09 | 4,910,000 | 5,192,325 | |||||
E-Commerce/Services - 1.5% | |||||||
| priceline.com, Inc. | |||||||
| 2.250%, 01/15/25 | 1,435,000 | 4,579,444 | |||||
Electronic Components-Semiconductors - 2.4% | |||||||
| Intel Corp. | |||||||
| 2.950%, 12/15/35 | 4,460,000 | 4,398,675 | |||||
| Skyworks Solutions, Inc. | |||||||
| 1.250%, 03/01/10 | 2,145,000 | 2,217,394 | |||||
| Skyworks Solutions, Inc. | |||||||
| 1.500%, 03/01/12 | 970,000 | 966,363 | |||||
| 7,582,432 | |||||||
Electronic Measure Instruments - 1.5% | |||||||
| Itron, Inc. | |||||||
| 2.500%, 08/01/26 | 2,995,000 | 4,679,687 | |||||
Electronics-Military - 1.8% | |||||||
| Level-3 Communications Holdings, Inc. | |||||||
| 3.000%, 08/01/35 | 3,285,000 | 4,118,569 | |||||
Level-3 Communications Holdings, Inc. 144A# | |||||||
| 3.000%, 08/01/35 | 1,065,000 | 1,335,244 | |||||
| 5,453,813 | |||||||
Energy-Alternate Sources - 1.7% | |||||||
| Covanta Holding Corp. | |||||||
| 1.000%, 02/01/27 | 4,875,000 | 5,423,437 | |||||
Enterprise Software/Services - 2.7% | |||||||
| Lawson Software, Inc. | |||||||
| 2.500%, 04/15/12 | 3,070,000 | 2,843,587 | |||||
Lawson Software, Inc. 144A# | |||||||
| 2.500%, 04/15/12 | 1,145,000 | 1,060,556 | |||||
| Sybase, Inc. | |||||||
| 1.750%, 02/22/25 | 3,795,000 | 4,454,381 | |||||
| 8,358,524 | |||||||
Finance-Other Services - 1.0% | |||||||
The Nasdaq OMX Group 144A# | |||||||
| 2.500%, 08/15/13 | 2,930,000 | 3,028,887 | |||||
Footwear & Related Apparel - 1.3% | |||||||
| Iconix Brand Group, Inc. | |||||||
| 1.875%, 06/30/12 | 2,800,000 | 2,551,500 | |||||
Iconix Brand Group, Inc. 144A# | |||||||
| 1.875%, 06/30/12 | 1,800,000 | 1,640,250 | |||||
| 4,191,750 | |||||||
Instruments-Scientific - 1.8% | |||||||
| Fisher Scientific International, Inc. | |||||||
| 3.250%, 03/01/24 | 3,575,000 | 5,563,594 | |||||
Life/Health Insurance - 1.5% | |||||||
Prudential Financial, Inc.++ | |||||||
| 0.501%, 12/12/36 | 4,635,000 | 4,510,782 | |||||
Machinery-Farm - 1.7% | |||||||
| AGCO Corp. | |||||||
| 1.250%, 12/15/36 | 3,170,000 | 5,254,275 | |||||
Machinery-General Industry - 1.5% | |||||||
| Roper Industries, Inc. | |||||||
| 1.481%, 01/15/34 | 6,200,000 | 4,657,750 | |||||
Medical Instruments - 1.8% | |||||||
| St Jude Medical, Inc. | |||||||
| 1.220%, 12/15/08 | 3,200,000 | 3,260,000 | |||||
St Jude Medical, Inc. 144A# | |||||||
| 1.220%, 12/15/08 | 2,290,000 | 2,332,937 | |||||
| 5,592,937 | |||||||
See Accompanying Notes to Financial Statements.
22
SCHEDULE OF INVESTMENTS
As of March 31, 2008
Principal Amount | Value | ||||||
Medical-Biomedical/Genetics - 3.4% | |||||||
| Genzyme Corp. | |||||||
| 1.250%, 12/01/23 | $ | 4,680,000 | $ | 5,446,350 | |||
| Invitrogen Corp. | |||||||
| 2.000%, 08/01/23 | 3,855,000 | 5,218,706 | |||||
| 10,665,056 | |||||||
Medical-Drugs - 6.4% | |||||||
| Allergan, Inc. | |||||||
| 1.500%, 04/01/26 | 2,530,000 | 2,801,975 | |||||
Allergan, Inc. 144A# | |||||||
| 1.500%, 04/01/26 | 1,800,000 | 1,993,500 | |||||
Bristol-Myers Squibb Co.++ | |||||||
| 2.300%, 09/15/23 | 4,795,000 | 4,777,258 | |||||
| Teva Pharmaceutical Finance LLC | |||||||
| 0.500%, 02/01/24 | 4,150,000 | 5,171,938 | |||||
Wyeth++ | |||||||
| 3.581%, 01/15/24 | 5,060,000 | 5,100,328 | |||||
| 19,844,999 | |||||||
Multimedia - 1.3% | |||||||
| The Walt Disney Co. | |||||||
| 2.125%, 04/15/23 | 3,660,000 | 3,925,350 | |||||
Networking Products - 1.0% | |||||||
Juniper Networks, Inc.+ | |||||||
| 0.000%, 06/15/08 | 2,370,000 | 3,001,012 | |||||
Oil & Gas Drilling - 1.8% | |||||||
| Transocean, Inc. | |||||||
| 1.500%, 12/15/37 | 5,065,000 | 5,584,163 | |||||
Oil Companies-Exploration & Production - 2.2% | |||||||
| Chesapeake Energy Corp. | |||||||
| 2.500%, 05/15/37 | 1,835,000 | 2,321,275 | |||||
| Devon Energy Corp. | |||||||
| 4.950%, 08/15/08 | 2,860,000 | 4,576,000 | |||||
| 6,897,275 | |||||||
Oil Field Machinery & Equipment - 1.2% | |||||||
| Cameron International Corp. | |||||||
| 2.500%, 06/15/26 | 2,705,000 | 3,803,906 | |||||
Oil-Field Services - 1.6% | |||||||
| Schlumberger, Ltd. | |||||||
| 1.500%, 06/01/23 | 2,030,000 | 4,884,688 | |||||
REITS-Diversified - 1.5% | |||||||
Digital Realty Trust LP 144A# | |||||||
| 4.125%, 08/15/26 | 3,825,000 | 4,616,775 | |||||
REITS-Office Property - 1.4% | |||||||
| Boston Properties LP | |||||||
| 3.750%, 05/15/36 | 3,925,000 | 4,489,219 | |||||
Research & Development - 0.5% | |||||||
| PharmaNet Development Group, Inc. | |||||||
| 2.250%, 08/15/24 | 1,505,000 | 1,442,919 | |||||
Retail-Discount - 1.6% | |||||||
TJX Cos., Inc.+ | |||||||
| 0.000%, 02/13/21 | 4,525,000 | 5,056,688 | |||||
Semiconductor Components- | |||||||
Integrated Circuits - 0.3% | |||||||
| Cypress Semiconductor Corp. | |||||||
| 1.000%, 09/15/09 | 665,000 | 792,181 | |||||
Super-Regional Banks-US - 2.6% | |||||||
US BanCorp.++ | |||||||
| 0.792%, 09/20/36 | 3,435,000 | 3,447,023 | |||||
Wells Fargo & Co.++ | |||||||
| 2.989%, 05/01/33 | 4,760,000 | 4,737,914 | |||||
| 8,184,937 | |||||||
Telecommunications Services - 1.5% | |||||||
| Amdocs, Ltd. | |||||||
| 0.500%, 03/15/24 | 4,820,000 | 4,795,900 | |||||
Therapeutics - 1.9% | |||||||
| Gilead Sciences, Inc. | |||||||
| 0.625%, 05/01/13 | 2,085,000 | 3,077,981 | |||||
Gilead Sciences, Inc. 144A# | |||||||
| 0.625%, 05/01/13 | 1,905,000 | 2,812,256 | |||||
| 5,890,237 | |||||||
Toys - 1.4% | |||||||
| Hasbro, Inc. | |||||||
| 2.750%, 12/01/21 | 3,259,000 | 4,436,314 | |||||
Web Hosting/Design - 0.8% | |||||||
| Equinix, Inc. | |||||||
| 2.500%, 04/15/12 | 2,660,000 | 2,397,325 | |||||
Wire & Cable Products - 1.2% | |||||||
| General Cable Corp. | |||||||
| 0.875%, 11/15/13 | 2,830,000 | 3,852,337 | |||||
Wireless Equipment - 1.4% | |||||||
| American Tower Corp. | |||||||
| 3.000%, 08/15/12 | 2,220,000 | 4,376,175 | |||||
X-Ray Equipment - 1.4% | |||||||
| Hologic, Inc. | |||||||
| 2.000%, 12/15/37 | 4,635,000 | 4,478,569 | |||||
| Total Convertible Corporate Bond (Cost: $251,682,444) | 254,064,710 | ||||||
Number of Shares | |||||||
Convertible Preferred Stock - 11.5% | |||||||
Agricultural Operations - 0.7% | |||||||
| Bunge, Ltd. | |||||||
| 4.875%, 12/31/49 | 20,460 | 2,327,325 | |||||
Auto-Cars/Light Trucks - 1.0% | |||||||
| General Motors Corp. | |||||||
| 6.250%, 07/15/33 | 189,315 | 3,123,698 | |||||
Electric-Generation - 1.5% | |||||||
| AES Trust III | |||||||
| 6.750%, 10/15/29 | 99,243 | 4,614,799 | |||||
Electric-Integrated - 1.6% | |||||||
| Entergy Corp. | |||||||
| 7.625%, 02/17/09 | 75,555 | 4,930,719 | |||||
Independent Power Producer - 1.5% | |||||||
| NRG Energy, Inc. | |||||||
| 5.750%, 03/16/09 | 13,955 | 4,722,895 | |||||
Metal-Diversified - 1.7% | |||||||
| Freeport-McMoRan Copper & Gold, Inc. | |||||||
| 6.750%, 05/01/10 | 37,615 | 5,283,027 | |||||
Multi-line Insurance - 1.5% | |||||||
| MetLife, Inc. | |||||||
| 6.375%, 08/15/08 | 151,500 | 4,499,550 | |||||
See Accompanying Notes to Financial Statements.
23
U.S. CONVERTIBLE FUND
SCHEDULE OF INVESTMENTS
As of March 31, 2008
Number of Shares | Value | ||||||
Super-Regional Banks-US - 2.0% | |||||||
| Bank of America Corp. | |||||||
| 7.250%, 12/31/49 | 5,900 | $ | 6,069,625 | ||||
| Total Convertible Preferred Stock (Cost: $35,961,007) | 35,571,638 | ||||||
Common Stock - 3.5% | |||||||
Containers-Metal/Glass - 1.6% | |||||||
| Owens-Illinois, Inc. * | 86,957 | 4,906,958 | |||||
Multi-line Insurance - 1.0% | |||||||
| Assurant, Inc. | 50,743 | 3,088,219 | |||||
Non-Hazardous Waste Disposal - 0.9% | |||||||
| Allied Waste Industries, Inc. * | 269,620 | 2,914,592 | |||||
| Total Common Stock (Cost: $11,604,624) | 10,909,769 | ||||||
Principal Amount | |||||||
Short Term Investments - 3.5% | |||||||
Time Deposit - 3.5% | |||||||
| Wachovia Bank London | |||||||
| 1.700%, 04/01/08 | |||||||
| (Cost: $10,806,045) | $ | 10,806,045 | 10,806,045 | ||||
| Total Investments - 100.4% (Cost: $310,054,120) | 311,352,162 | ||||||
| Liabilities In Excess Of Other Assets - (0.4%) | (1,248,240 | ) | |||||
| Net Assets - 100.0% | $ | 310,103,922 | |||||
| * | Non-income producing securities. |
| # | 144A Security. Certain condition for public sale may exist. The total market value of 144A securities owned at March 31, 2008 was $24,650,499 or 7.95% of net assets. |
| ++ | The coupon rate shown on floating rate securities represents the rate at March 31, 2008. |
| + | Zero coupon bond. |
SCHEDULE OF INVESTMENTS BY SECTOR
as of March 31, 2008
| Sector | Percent of Net Assets | |||
| Consumer, Non-cyclical | 23.1 | % | ||
| Industrial | 16.6 | |||
| Financial | 12.4 | |||
| Technology | 10.9 | |||
| Communications | 10.6 | |||
| Energy | 8.6 | |||
| Consumer, Cyclical | 8.4 | |||
| Utilities | 4.6 | |||
| Basic Materials | 1.7 | |||
| Short Term Investments | 3.5 | |||
| Total Investments | 100.4 | |||
| Liabilities in excess of other assets | (0.4 | ) | ||
| Net Assets | 100.0 | % | ||
See Accompanying Notes to Financial Statements.
24
GLOBAL SELECT FUND
Management Team: Christopher A. Herrera, Portfolio Manager; Nelson W. Shing, Portfolio Manager; Todd R. Buechs, Analyst; Gregory Ise, Analyst; Lucrecia Tam, Analyst; Alan Trice, Analyst
Chief Investment Officer: Horacio A. Valeiras, CFA
Goal: The Global Select Fund seeks to maximize long-term capital appreciation by investing in companies that, in the opinion of the Investment Adviser, represent the “best of the best” globally.
Market Overview: The global stock market registered flat performance between April 1, 2007 and March 31, 2008. While finishing the twelve months close to where it had started, the market was extremely volatile throughout the fiscal year.
During the first half of the period, the MSCI All Country World Index delivered a healthy gain. Stocks advanced on record merger and acquisition activity that was fueled by strong inflows into private equity funds, cash on corporate balance sheets and easy access to credit. Buoyant growth in many economies, especially those in Asia and emerging markets, contributed to the rise in equities.
Stocks weakened in the second half of the period, as a number of concerns dampened investor sentiment. A sharp acceleration in defaults on U.S. residential mortgages set off a chain of events that culminated in a global liquidity crisis. Prices of oil and other commodities hit all-time highs amid rising demand from developing countries, tight supplies and speculation of further price gains. Inflationary pressures kept most central banks from reducing interest rates, although the Federal Reserve cut the funds rate three percentage points. The rate cuts, along with fears of a U.S. recession, sent the dollar to a record low versus the euro and a twelve-year low versus the yen.
Within the major segments of the global equity market, the S&P 500 Index turned in the weakest results, losing 5.08%. The MSCI EAFE Index fell 2.27%, while the MSCI Emerging Markets Index gained an impressive 21.65%.
Performance: The Fund’s Class I shares gained 1.34% during the fiscal year ended March 31, 2008, outperforming the MSCI All Country World Index, which declined 0.68%.
Portfolio Specifics: The Fund’s outperformance was driven by positive stock selection at both the country and sector level. Stock selection was especially strong in the United States, the United Kingdom and the energy, financials and telecommunication services sectors. High oil prices benefited exploration and production companies, as well as their suppliers, and the Fund’s best-performing holdings included U.S.-based Hess, an integrated energy company, and U.K.-based Wellstream, an energy pipeline producer. China Mobile, a provider of wireless communications services, was another top performer. The company’s 2007 net profit rose a better-than-expected 32%, driven by strong subscriber growth and economies of scale that led to margin expansion.
On the negative side, stock selection in Germany, Japan and the information technology sector subtracted the most from relative results. An underweight in materials also was unfavorable, since materials was the best-performing sector in the index on high commodity prices.
Market Outlook: Strength in the euro and yen is starting to have a negative impact on European and Japanese exporters, and the likelihood of a U.S. recession has risen as consumer spending, manufacturing and hiring slow. However, some emerging countries are still experiencing solid economic growth, and central banks outside the United States may begin to lower interest rates in the near term as risks to growth increase. In addition, we believe that the aggressive intervention by the Federal Reserve should ease the liquidity crisis in the United States.
Regardless of how macro developments unfold, we are confident that our bottom-up investment process will identify the “best of the best” globally for the Fund.
Comparison of Change in Value of a $250,000 Investment in Global Select Fund Class I and II Shares with the MSCI All Country World Index.


| Annualized Total Returns As of 3/31/08 | |||
1 Year | 5 Years | 10 Years | |
| Global Select Fund Class I | 1.34% | 18.51% | 13.31% |
| MSCI All Country World Index | -0.68% | 17.73% | 5.52% |
25
GLOBAL SELECT FUND
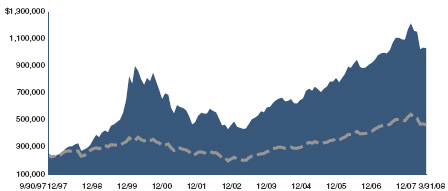

| Annualized Total Returns As of 3/31/08 | |||
1 Year | 5 Years | 10 Years | |
| Global Select Fund Class II | 1.46% | 18.58% | 13.35% |
| MSCI All Country World Index | -0.68% | 17.73% | 5.52% |
The graphs above show the value of a hypothetical $250,000 investment in the Fund’s Class I and II shares compared with the Morgan Stanley Capital International All Country World Index (“MSCI ACWI”) over the periods indicated. The Fund’s Class I and II shares calculate their performance based upon the historical performance of their corresponding series of Nicholas-Applegate Mutual Funds (renamed ING Mutual Funds), adjusted to reflect all fees and expenses applicable to the Fund’s Class I and II shares. The Nicholas-Applegate Institutional Funds’ Class I shares were first available on May 7, 1999 and Class II shares on June 30, 2003. The historical performance of Class II shares includes the performance of Class I shares for periods prior to the inception of Class II. Average annual total return figures include changes in principal value, reinvested dividends, and capital gain distributions. The total returns shown above do not show the effects of income taxes on an individual’s investment. In most cases, taxes may reduce your actual investment returns on income or gains paid by the Fund or any gains you may realize if you sell your shares. Past performance cannot guarantee future results.
The MSCI ACWI is a market capitalization weighted index composed of over 2000 companies. The MSCI ACWI is representative of the market structure of 21 countries in North America, Europe, and the Pacific Rim, excluding closed markets and those shares in otherwise free markets that are not purchasable by foreigners.
The unmanaged Index differs from the Fund in composition, does not pay management fees or expenses and includes reinvested dividends. One cannot invest directly in an index.
Since markets can go down as well as up, investment return and principal value will fluctuate with market conditions, currency volatility and the social, economic and political climates of countries where the Fund invests. You may have a gain or loss when you sell your shares.
26
GLOBAL SELECT FUND
SCHEDULE OF INVESTMENTS
As of March 31, 2008
Number of Shares | Value | ||||||
Common Stock - 93.3% | |||||||
Australia - 1.9% | |||||||
| BHP Billiton, Ltd. | 23,584 | $ | 770,941 | ||||
Belgium - 0.5% | |||||||
| Fortis | 8,634 | 218,075 | |||||
Finland - 1.3% | |||||||
Outotec OYJ## | 9,746 | 520,430 | |||||
France - 3.8% | |||||||
| Total SA | 9,514 | 709,147 | |||||
| Veolia Environnement | 12,162 | 851,020 | |||||
| 1,560,167 | |||||||
Germany - 7.7% | |||||||
| Commerzbank AG | 9,639 | 302,415 | |||||
| Continental AG | 5,730 | 586,443 | |||||
| Henkel KGaA | 16,200 | 690,002 | |||||
| Linde AG | 3,828 | 542,816 | |||||
| Siemens AG | 4,926 | 535,847 | |||||
| Tognum AG* | 24,060 | 529,546 | |||||
| 3,187,069 | |||||||
Hong Kong - 3.8% | |||||||
| Jardine Matheson Holdings, Ltd. | 28,400 | 896,872 | |||||
| Kowloon Development Co., Ltd. | 226,000 | 426,281 | |||||
Melco International Development## | 181,000 | 248,377 | |||||
| 1,571,530 | |||||||
Indonesia - 1.8% | |||||||
| Indosat Tbk PT | 973,000 | 750,494 | |||||
Ireland - 2.4% | |||||||
| Anglo Irish Bank Corp. PLC | 30,586 | 409,530 | |||||
| Icon PLC - ADR* | 9,100 | 590,499 | |||||
| 1,000,029 | |||||||
Israel - 2.4% | |||||||
| Israel Chemicals, Ltd. | 70,692 | 986,824 | |||||
Italy - 3.5% | |||||||
| Finmeccanica SpA | 28,181 | 961,851 | |||||
Geox SpA## | 14,493 | 224,826 | |||||
| UniCredit SpA | 37,370 | 251,070 | |||||
| 1,437,747 | |||||||
Japan - 2.5% | |||||||
| Asics Corp. | 52,000 | 598,704 | |||||
| Nitori Co., Ltd. | 8,000 | 453,308 | |||||
| 1,052,012 | |||||||
Republic Of China - 1.9% | |||||||
| AAC Acoustic Technologies | |||||||
Holdings, Inc.*,## | 306,000 | 246,912 | |||||
| China Mobile, Ltd. | 37,500 | 557,958 | |||||
| 804,870 | |||||||
Spain - 6.6% | |||||||
| Banco Santander SA | 46,698 | 933,821 | |||||
Tecnicas Reunidas SA*,## | 9,718 | 738,982 | |||||
| Telefonica SA | 36,410 | 1,050,021 | |||||
| 2,722,824 | |||||||
Switzerland - 4.0% | |||||||
| Nestle SA | 2,071 | 1,039,112 | |||||
| Roche Holding AG | 3,140 | 593,363 | |||||
| 1,632,475 | |||||||
United Kingdom - 6.5% | |||||||
| ARM Holdings PLC | 154,242 | 269,769 | |||||
| IG Group Holdings PLC | 97,677 | 635,300 | |||||
| International Power PLC | 23,842 | 188,596 | |||||
| Standard Chartered PLC | 23,443 | 802,331 | |||||
| Wellstream Holdings PLC* | 30,814 | 805,343 | |||||
| 2,701,339 | |||||||
United States - 42.7% | |||||||
Affiliated Managers Group, Inc.*,## | 2,700 | 244,998 | |||||
| Aflac, Inc. | 11,600 | 753,420 | |||||
| Ansys, Inc.* | 15,800 | 545,416 | |||||
| Apple, Inc.* | 5,100 | 731,850 | |||||
| Corning, Inc. | 36,400 | 875,056 | |||||
| Devon Energy Corp. | 8,100 | 845,073 | |||||
| Energizer Holdings, Inc.* | 7,100 | 642,408 | |||||
| General Dynamics Corp. | 6,700 | 558,579 | |||||
| Genzyme Corp.* | 9,100 | 678,314 | |||||
| Guess ?, Inc. | 13,500 | 546,345 | |||||
| Helmerich & Payne, Inc. | 17,300 | 810,851 | |||||
| Hess Corp. | 7,000 | 617,260 | |||||
| HJ Heinz Co. | 16,000 | 751,520 | |||||
| ITT Corp. | 10,400 | 538,824 | |||||
| Marathon Oil Corp. | 14,700 | 670,320 | |||||
| Merck & Co., Inc. | 16,000 | 607,200 | |||||
| Oracle Corp.* | 47,700 | 933,012 | |||||
| Praxair, Inc. | 10,200 | 859,146 | |||||
| Procter & Gamble Co. | 14,000 | 980,980 | |||||
| Spansion, Inc. Cl. A* | 42,500 | 116,875 | |||||
| Target Corp. | 15,100 | 765,268 | |||||
| The Bank of New York Mellon Corp. | 13,700 | 571,701 | |||||
| The Coca-Cola Co. | 13,800 | 840,006 | |||||
| The Goldman Sachs Group, Inc. | 3,700 | 611,943 | |||||
| Thermo Fisher Scientific, Inc.* | 11,800 | 670,712 | |||||
| XTO Energy, Inc. | 13,700 | 847,482 | |||||
| 17,614,559 | |||||||
| Total Common Stock (Cost: $32,604,593) | 38,531,385 | ||||||
Equity-Linked Securities - 1.2% | |||||||
Taiwan - 1.2% | |||||||
| Credit Suisse FB Hon Hai Precision | |||||||
| Industry Co., Ltd. - 11/05/10 | |||||||
| (Cost: $410,824) | 89,442 | 512,324 | |||||
See Accompanying Notes to Financial Statements.
27
GLOBAL SELECT FUND
SCHEDULE OF INVESTMENTS
As of March 31, 2008
Principal Amount | Value | ||||||
Short Term Investments - 8.5% | |||||||
Money Market Funds - 5.4% | |||||||
| Boston Global Investment Trust - | |||||||
| Enhanced Portfolio, 3.017%** | $ | 2,205,728 | $ | 2,205,728 | |||
Time Deposits - 3.1% | |||||||
| Wachovia Bank London | |||||||
| 1.700%, 04/01/08 | 1,289,886 | 1,289,886 | |||||
| Total Short Term Investments (Cost: $3,495,614) | 3,495,614 | ||||||
| Total Investments - 103.0% (Cost: $36,511,031) | 42,539,323 | ||||||
| Liabilities in Excess of Other Assets - (3.0%) | (1,253,552 | ) | |||||
| Net Assets - 100.0% | $ | 41,285,771 | |||||
| * | Non-income producing securities. |
| ** | All of the security is purchased with cash collateral proceeds from securities loans. |
| ## | All or a portion of the Fund’s holdings in this security was on loan as of 3/31/08. |
ADR - American Depository Receipt
SCHEDULE OF INVESTMENTS BY SECTOR
as of March 31, 2008
| Sector | Percent of Net Assets | |||
| Consumer, Non-cyclical | 16.4 | % | ||
| Industrial | 15.6 | |||
| Financial | 13.4 | |||
| Energy | 12.8 | |||
| Consumer, Cyclical | 9.2 | |||
| Communications | 7.8 | |||
| Basic Materials | 7.7 | |||
| Technology | 6.3 | |||
| Diversified | 2.8 | |||
| Utilities | 2.5 | |||
| Short Term Investments | 8.5 | |||
| Total Investments | 103.0 | |||
| Liabilities in excess of other assets | (3.0 | ) | ||
| Net Assets | 100.0 | % | ||
See Accompanying Notes to Financial Statements.
28
INTERNATIONAL GROWTH FUND
Management Team: Horacio A. Valeiras, CFA, Portfolio Manager and Chief Investment Officer; Pedro V. Marcal, Portfolio Manager; Yuka Marosek, Analyst
Goal: The International Growth Fund seeks to maximize long-term capital appreciation through investments primarily in companies with above average earnings growth and positioned in strong growth areas.
Market Overview: Equity markets in developed non-U.S. countries posted losses during the fiscal year ended March 31, 2008. Weakness in the U.S. dollar versus a basket of currencies substantially cushioned the decline for U.S.-based investors.
The MSCI EAFE Index started the period with gains, driven by positive economic trends in Europe, evidence the U.S. economy was improving after a weak start to 2007 and a brisk pace of mergers and acquisitions. During the first half of 2007, the combined value of deal activity in Europe surpassed U.S. totals for the first time in four years.
Equities retreated later in the period, as the worst global liquidity crunch in a decade began to unfold. The crisis was triggered by huge losses on securities linked to U.S. mortgages and culminated in runs on a U.K. bank and a U.S. securities firm. To try to unfreeze the credit markets, central bankers worldwide pumped extra liquidity into the financial system. The European Central Bank announced that it would offer six-month loans to financial institutions for the first time but kept interest rates on hold after a June increase. The Bank of England, which also had been hiking earlier in the year, cut rates 0.50% between December and March. Japan’s central bank held rates steady throughout the period.
Returns in most EAFE markets were negative in local currencies. Europe outperformed the Pacific region due to weakness in Japan, where there was political uncertainty and signs of slowing growth. Broadly speaking, growth stocks delivered modest gains and outpaced value stocks, which declined.
Performance: During the twelve months ended March 31, 2008, the Fund’s Class I shares gained 11.37% and outperformed the MSCI EAFE Index, which lost 2.27%.
Portfolio Specifics: The Fund’s outperformance was driven by stock selection, which was positive in the majority of countries and sectors. Stock selection was especially strong in Australia and among industrials and materials companies. Overall, the Fund’s sector exposures, which are a byproduct of our bottom-up investment decisions, also were a source of value added. For example, an underweight in financials was a plus, since financials was the worst-performing sector in the benchmark given the liquidity challenges in the market. Areas of relative weakness included stock selection in Germany and Singapore and an underweight in energy, one of the index’s stronger sectors on record oil prices.
At the individual stock level, some of our best-performing holdings were Australia-based CSL Limited, a biotechnology firm; Japan Steel Works, a manufacturer of industrial machinery; and Australia-based Incitec Pivot, a fertilizer producer.
Market Outlook: Developed non-U.S. economies are feeling the effects of the U.S. slowdown, and recent readings on consumer confidence in Europe and Japan suggest a softening in domestic demand. That said, a number of positive factors may lend support to equity prices, including:
| • | Potential for many central banks to cut interest rates to boost growth, despite stubborn inflation |
| • | Attractive equity valuations, particularly in Japan, amid poor stock market performance and a lack of earnings acceleration |
| • | Robust labor markets, which should help mitigate flagging consumer confidence |
In the changing environment, we are confident that our bottom-up investment process will continue to lead us to companies with outstanding growth potential for the Fund.
Comparison of Change in Value of a $250,000 Investment in International Growth Fund Class I and II Shares with the MSCI EAFE Index.
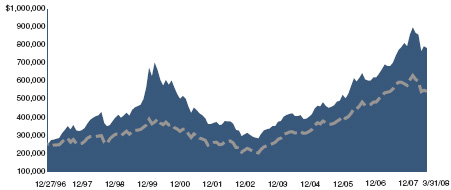

| Annualized Total Returns As of 3/31/08 | |||
1 Year | 5 Years | 10 Years | |
| International Growth Fund Class I | 11.37% | 22.54% | 7.36% |
| MSCI EAFE Index | -2.27% | 21.90% | 6.56% |
29
INTERNATIONAL GROWTH FUND
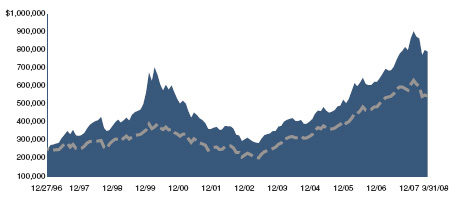

| Annualized Total Returns As of 3/31/08 | |||
1 Year | 5 Years | 10 Years | |
| International Growth Fund Class II | 11.82% | 22.77% | 7.45% |
| MSCI EAFE Index | -2.27% | 21.90% | 6.56% |
The graphs above show the value of a hypothetical $250,000 investment in the Fund’s Class I and II shares compared with the Morgan Stanley Capital International Europe, Australasia, Far East Index (“MSCI EAFE”) over the periods indicated. The Fund’s Class I and II shares calculate their performance based upon the historical performance of their corresponding series of Nicholas-Applegate Mutual Funds (renamed ING Mutual Funds), adjusted to reflect all fees and expenses applicable to the Fund’s Class I and II shares. The Nicholas-Applegate Institutional Funds’ Class I shares were first available on May 7, 1999 and Class II shares on January 23, 2006. The historical performance of Class II shares includes the performance of Class I shares for periods prior to the inception of Class II shares. Average annual total return figures include changes in principal value, reinvested dividends, and capital gain distributions. The total returns shown above do not show the effects of income taxes on an individual’s investment. In most cases, taxes may reduce your actual investment returns on income or gains paid by the Fund or any gains you may realize if you sell your shares. Past performance cannot guarantee future results.
The MSCI EAFE Index is an unmanaged index of over 900 companies, and is a generally accepted benchmark for major overseas markets. Index weightings represent the relative capitalizations of the major overseas markets included in the index on a U.S. dollar adjusted basis. The unmanaged Index differs from the Fund in composition, does not pay management fees or expenses and includes reinvested dividends. One cannot invest directly in an index.
Since markets can go down as well as up, investment return and principal value will fluctuate with market conditions, currency volatility and the social, economic and political climates of countries where the Fund invests. You may have a gain or loss when you sell your shares.
30
INTERNATIONAL GROWTH FUND
SCHEDULE OF INVESTMENTS
As of March 31, 2008
Number of Shares | Value | ||||||
Common Stock - 94.3% | |||||||
Australia - 5.3% | |||||||
| AMP, Ltd. | 23,896 | $ | 171,236 | ||||
| CSL, Ltd. | 16,468 | 554,861 | |||||
Incitec Pivot, Ltd.## | 2,575 | 331,786 | |||||
| Rio Tinto, Ltd. | 1,705 | 190,660 | |||||
| 1,248,543 | |||||||
Belgium - 1.2% | |||||||
| InBev NV | 3,337 | 294,733 | |||||
Brazil - 1.8% | |||||||
| Bolsa de Mercadorias e Futuros - BM&F | 8,700 | 79,611 | |||||
Cia Vale do Rio Doce - ADR## | 7,700 | 266,728 | |||||
| Unibanco - Uniao de | |||||||
| Bancos Brasileiros SA - GDR | 700 | 81,648 | |||||
| 427,987 | |||||||
Canada - 2.2% | |||||||
| Potash Corp. of Saskatchewan | 700 | 108,647 | |||||
| Rogers Communications, Inc. Cl. B | 5,500 | 197,905 | |||||
| Teck Cominco, Ltd. Cl. B | 5,300 | 217,413 | |||||
| 523,965 | |||||||
Denmark - 2.3% | |||||||
| FLSmidth & Co. AS Cl. B | 3,950 | 392,377 | |||||
| Novo Nordisk AS Cl. B | 2,150 | 147,559 | |||||
| 539,936 | |||||||
Egypt - 0.5% | |||||||
| Orascom Construction Industries - GDR | 790 | 117,824 | |||||
Finland - 2.7% | |||||||
| Nokia OYJ | 7,258 | 230,473 | |||||
Outotec OYJ## | 5,369 | 286,701 | |||||
| Wartsila OYJ | 1,628 | 110,280 | |||||
| 627,454 | |||||||
France - 8.9% | |||||||
| Alstom | 1,639 | 356,631 | |||||
| BNP Paribas | 1,348 | 136,467 | |||||
| Cie Generale de Geophysique-Veritas* | 926 | 231,363 | |||||
| Electricite de France | 2,110 | 184,255 | |||||
| Gaz de France SA | 4,112 | 249,159 | |||||
| Suez SA | 3,586 | 236,209 | |||||
| Total SA | 3,135 | 233,674 | |||||
| Veolia Environnement | 6,820 | 477,221 | |||||
| 2,104,979 | |||||||
Germany - 9.6% | |||||||
| Deutsche Telekom AG | 8,085 | 135,157 | |||||
| E.ON AG | 2,741 | 509,290 | |||||
| Rhoen Klinikum AG | 4,014 | 119,384 | |||||
| RWE AG | 2,118 | 261,304 | |||||
| SAP AG | 4,329 | 215,938 | |||||
| Siemens AG | 1,438 | 156,425 | |||||
| Solarworld AG | 3,920 | 187,399 | |||||
| Stada Arzneimittel AG | 4,081 | 297,526 | |||||
| Tognum AG* | 5,194 | 114,317 | |||||
| United Internet AG | 11,897 | 256,944 | |||||
| 2,253,684 | |||||||
Greece - 1.7% | |||||||
| National Bank of Greece SA | 3,642 | 192,865 | |||||
| Piraeus Bank SA | 6,550 | 202,179 | |||||
| 395,044 | |||||||
Hong Kong - 2.3% | |||||||
| CLP Holdings, Ltd. | 35,000 | 288,037 | |||||
| HongKong Electric Holdings | 27,500 | 173,667 | |||||
| Kerry Properties, Ltd. | 15,063 | 90,964 | |||||
| 552,668 | |||||||
Ireland - 1.0% | |||||||
| Anglo Irish Bank Corp. PLC | 9,512 | 127,360 | |||||
| Icon PLC - ADR* | 1,800 | 116,802 | |||||
| 244,162 | |||||||
Israel - 1.0% | |||||||
| Teva Pharmaceutical Industries, Ltd. - ADR | 5,100 | 235,569 | |||||
Italy - 2.6% | |||||||
| Saipem SpA | 8,268 | 335,911 | |||||
| UniCredit SpA | 42,130 | 283,050 | |||||
| 618,961 | |||||||
Japan - 19.9% | |||||||
| Chugai Pharmaceutical Co., Ltd. | 19,800 | 224,188 | |||||
| East Japan Railway Co. | 49 | 408,108 | |||||
| Honda Motor Co., Ltd. | 4,800 | 137,198 | |||||
| Japan Tobacco, Inc. | 104 | 521,384 | |||||
| KDDI Corp. | 42 | 256,975 | |||||
| Kirin Holdings Co., Ltd. | 10,000 | 189,381 | |||||
| Mitsubishi Corp. | 9,600 | 290,310 | |||||
| Mitsubishi Electric Corp. | 14,300 | 123,842 | |||||
| Mitsubishi Estate Co., Ltd. | 3,300 | 80,233 | |||||
| Mitsubishi UFJ Financial Group, Inc. | 20,300 | 175,396 | |||||
| Nintendo Co., Ltd. | 900 | 464,761 | |||||
| Nitori Co., Ltd. | 2,400 | 135,992 | |||||
| Nomura Holdings, Inc. | 15,000 | 224,544 | |||||
| Secom Co., Ltd. | 5,900 | 286,894 | �� | ||||
| Sumitomo Heavy Industries, Ltd. | 13,000 | 84,111 | |||||
| The Japan Steel Works, Ltd. | 25,000 | 426,734 | |||||
| Toyo Tanso Co., Ltd. | 4,100 | 384,317 | |||||
| Toyota Motor Corp. | 3,100 | 154,790 | |||||
| Unicharm Corp. | 1,600 | 117,185 | |||||
| 4,686,343 | |||||||
Mexico - 0.4% | |||||||
America Movil SAB de CV - ADR## | 1,300 | 82,797 | |||||
Netherlands - 2.3% | |||||||
| Koninklijke BAM Groep NV | 8,167 | 193,209 | |||||
| Royal KPN NV | 10,266 | 174,057 | |||||
| SBM Offshore NV | 5,697 | 184,425 | |||||
| 551,691 | |||||||
Peru - 0.3% | |||||||
| CrediCorp., Ltd. | 1,000 | 71,740 | |||||
Republic Of China - 0.3% | |||||||
| China Communications Construction | |||||||
| Co., Ltd. | 34,000 | 75,402 | |||||
Russian Federation - 1.2% | |||||||
| Evraz Group SA - GDR | 3,172 | 273,744 | |||||
Singapore - 2.4% | |||||||
| City Developments, Ltd. | 29,600 | 236,688 | |||||
| DBS Group Holdings, Ltd. | 25,100 | 327,831 | |||||
| 564,519 | |||||||
See Accompanying Notes to Financial Statements.
31
INTERNATIONAL GROWTH FUND
SCHEDULE OF INVESTMENTS
As of March 31, 2008
Number of Shares | Value | ||||||
Spain - 3.0% | |||||||
| Banco Santander SA | 19,502 | $ | 389,982 | ||||
| Iberdrola SA | 7,773 | 120,950 | |||||
| Telefonica SA | 6,809 | 196,363 | |||||
| 707,295 | |||||||
Switzerland - 6.0% | |||||||
| Julius Baer Holding AG | 2,805 | 207,599 | |||||
| Nestle SA | 1,116 | 559,946 | |||||
| Roche Holding AG | 1,582 | 298,949 | |||||
| Swatch Group AG | 3,754 | 193,574 | |||||
| Syngenta AG | 545 | 160,351 | |||||
| 1,420,419 | |||||||
United Kingdom - 15.4% | |||||||
| Barclays PLC | 14,577 | 131,242 | |||||
| BP PLC | 19,829 | 201,780 | |||||
| British American Tobacco PLC | 15,026 | 564,732 | |||||
| BT Group PLC | 36,462 | 157,437 | |||||
| Burberry Group PLC | 14,262 | 127,697 | |||||
| Diageo PLC | 14,631 | 295,444 | |||||
| HSBC Holdings PLC | 15,200 | 247,642 | |||||
| Imperial Tobacco Group PLC | 6,342 | 292,178 | |||||
| International Power PLC | 35,939 | 284,286 | |||||
| Reckitt Benckiser Group PLC | 4,039 | 224,048 | |||||
| Royal Dutch Shell PLC | 5,666 | 195,607 | |||||
| Southern Cross Healthcare, Ltd. | 23,453 | 174,798 | |||||
| SSL International PLC | 15,615 | 140,743 | |||||
| Unilever PLC | 10,190 | 344,092 | |||||
| Vodafone Group PLC | 84,988 | 254,891 | |||||
| 3,636,617 | |||||||
| Total Common Stock (Cost: $20,614,197) | 22,256,076 | ||||||
Preferred Stock - 3.7% | |||||||
Brazil - 1.0% | |||||||
| Usinas Siderurgicas de Minas Gerais SA | 4,200 | 236,363 | |||||
Germany - 2.7% | |||||||
| Fresenius SE | 4,594 | 383,990 | |||||
| Henkel KGaA | 5,794 | 268,816 | |||||
| 652,806 | |||||||
| Total Preferred Stock (Cost: $829,188) | 889,169 | ||||||
Principal Amount | Value | ||||||
Short Term Investments - 4.4% | |||||||
Money Market Funds - 2.9% | |||||||
| Boston Global Investment Trust - | |||||||
| Enhanced Portfolio, 3.017%** | $ | 690,354 | $ | 690,354 | |||
Time Deposits - 1.5% | |||||||
| Wachovia Bank London | |||||||
| 1.700%, 04/01/08 | 347,968 | 347,968 | |||||
| Total Short Term Investments (Cost: $1,038,322) | 1,038,322 | ||||||
| Total Investments - 102.4% (Cost: $22,481,707) | 24,183,567 | ||||||
| Liabilities in Excess of Other Assets - (2.4%) | (574,117 | ) | |||||
| Net Assets - 100.0% | $ | 23,609,450 | |||||
* | Non-income producing securities. |
** | All of the security is purchased with cash collateral proceeds from securities loans. |
## | All or a portion of the Fund’s holdings in this security was on loan as of 3/31/08. |
ADR - American Depository Receipt
GDR - Global Depository Receipt
SCHEDULE OF INVESTMENTS BY SECTOR
as of March 31, 2008
| Sector | Percent of Net Assets | |||
| Consumer, Non-cyclical | 28.2 | % | ||
| Financial | 15.2 | |||
| Industrial | 13.7 | |||
| Utilities | 11.8 | |||
| Communications | 7.6 | |||
| Basic Materials | 7.6 | |||
| Energy | 6.6 | |||
| Consumer, Cyclical | 6.4 | |||
| Technology | 0.9 | |||
| Short Term Investments | 4.4 | |||
| Total Investments | 102.4 | |||
| Liabilities in excess of other assets | (2.4 | ) | ||
| Net Assets | 100.0 | % | ||
See Accompanying Notes to Financial Statements.
32
INTERNATIONAL GROWTH OPPORTUNITIES FUND
Management Team: Christopher A. Herrera, Portfolio Manager; Nelson W. Shing, Portfolio Manager; Todd R. Buechs, Analyst; Gregory Ise, Analyst; Lucrecia Tam, Analyst; Alan Trice, Analyst
Chief Investment Officer: Horacio A. Valeiras, CFA
Goal: The International Growth Opportunities Fund seeks to maximize long-term capital appreciation through investments primarily in companies located outside the United States with market capitalizations predominantly in the bottom 20% of publicly traded companies as measured by the market capitalization in the Citigroup World BMI xUS.
Market Overview: The Citigroup World EMI xUS, a barometer of international small-cap stocks, posted a loss during the fiscal year ended March 31, 2008. Broad-based depreciation of the U.S. dollar substantially improved performance for U.S.-based investors. Key themes characterizing the volatile market environment were:
| • | Gains in small-cap equities in the spring, driven by strong economic data out of Europe and a robust pace of mergers and buyouts |
| • | Progressively weak stock price performance, as deterioration in the U.S. housing market sparked turmoil in the credit markets and clouded the outlook for the global economy |
| • | Escalating commodity prices and a sharp decline in the U.S. dollar due to concerns about the U.S. economy and six interest rate cuts from the Federal Reserve totaling 3% |
Returns in the majority of countries within the Citigroup World EMI xUS were negative in local currencies. Japan was one of the weakest markets due to political turmoil and signs the country’s four-year recovery was losing steam. On the other hand, small-cap stocks in South Korea posted sharp gains, supported by the election of a pro-reform president.
Performance: The Fund’s Class I shares gained 2.74% between April 1, 2007 and March 31, 2008. This compared favorably to the 6.57% decline in the Citigroup World EMI xUS Growth, the Fund’s primary benchmark, and the 6.39% loss in the Citigroup World EMI xUS.
Portfolio Specifics: Consistent with our bottom-up investment approach, the Fund’s outperformance of the indexes was driven by stock selection. Stock selection was positive in most countries and sectors and particularly strong in Australia, China and among industrials, consumer discretionary and materials companies. Two of the Fund’s best-performing holdings were China Hongxing Sports, a manufacturer of athletic apparel, and Japan Steel Works, a producer of industrial machinery. China Hongxing Sports was recognized for its consistently strong sales growth and improving margins. Japan Steel Works benefited from steady demand for energy-related products, such as rotor shafts for thermal power plants in China.
Areas of relative weakness included stock selection in Italy, Germany and the financials sector. An underweight in utilities also detracted, as investors gravitated toward this defensive sector in the volatile market conditions.
Market Outlook: Strength in the euro and yen is starting to have a negative impact on European and Japanese exporters, and the likelihood of a U.S. recession has risen as consumer spending, manufacturing and hiring slow. However, some emerging countries are still experiencing solid economic growth, and central banks outside the United States may begin to lower interest rates in the near term as risks to growth increase. In addition, we believe that the aggressive intervention by the Federal Reserve should ease the liquidity crisis in the United States.
Regardless of the direction the broad market takes, we believe that our in-depth, company-specific research will identify exciting growth opportunities for the Fund.
Comparison of Change in Value of a $250,000 Investment in International Growth Opportunities Fund Class I, II, and III Shares with the Citigroup World EMI xUS Growth Index and the Citigroup World EMI xUS Index.
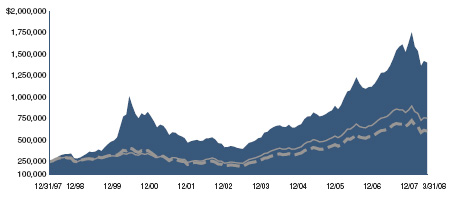
| Annualized Total Returns As of 3/31/08 | |||
1 Year | 5 Years | 10 Years | |
| International Growth Opportunities | |||
| Fund Class I | 2.74% | 28.65% | 16.23% |
| Citigroup World EMI xUS Growth Index | -6.57% | 25.29% | 7.62% |
| Citigroup World EMI xUS Index | -6.39% | 26.77% | 9.97% |
33
INTERNATIONAL GROWTH OPPORTUNITIES FUND
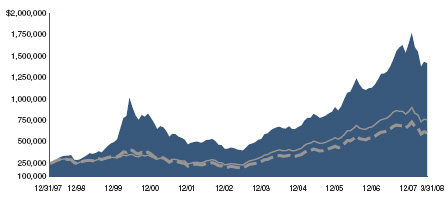
| Annualized Total Returns As of 3/31/08 | |||
1 Year | 5 Years | 10 Years | |
| International Growth Opportunities | |||
| Fund Class II | 2.90% | 28.86% | 16.32% |
| Citigroup World EMI xUS Growth Index | -6.57% | 25.29% | 7.62% |
| Citigroup World EMI xUS Index | -6.39% | 26.77% | 9.97% |
The graphs above show the value of a hypothetical $250,000 investment in the Fund’s Class I through III shares compared with the Citigroup World EMI xUS Growth Index and Citigroup World EMI xUS Index for the periods indicated. The Fund’s Class I through III shares calculate their performance based upon the historical performance of their corresponding series of Nicholas-Applegate Mutual Funds (renamed ING Mutual Funds), adjusted to reflect all fees and expenses applicable to the Fund’s Class I through III shares. The Nicholas-Applegate Institutional Funds’ Class I shares were first available on May 7, 1999, Class II shares commenced operations on June 5, 2003 and Class III shares on September 30, 2005. The historical performance of Class II and III shares includes the performance of Class I shares for periods prior to the inception of the relevant class. Average annual total return figures include changes in principal value, reinvested dividends, and capital gain distributions. The total returns shown above do not show the effects of income taxes on an individual’s investment. In most cases, taxes may reduce your actual investment returns on income or gains paid by the Fund or any gains you may realize if you sell your shares. Past performance cannot guarantee future results.
The Citigroup World EMI xUS Index ("EMI") is a world market capitalization weighted index measuring capital appreciation excluding the U.S. The EMI index is comprised of companies in the bottom 20% of any given country’s available market capitalization. Major corporate events such as extraordinary dividends, spin-offs, scrip issues in other securities, and shares repurchased via tender offers are accounted for in the calculation. The Citigroup World EMI xUS Growth Index covers only those companies in each country that exhibit growth characteristics relative to other companies in the same country according to a multivariable formula. The Indexes are unmanaged and do not include non-extraordinary dividends. The unmanaged indexes differ from the Fund in composition, do not pay management fees or expenses, and include reinvested dividends. One can not invest directly in an index.
Since markets can go down as well as up, investment return and principal value will fluctuate with market conditions, currency volatility and the social, economic and political climates of countries where the Fund invests. You may have a gain or loss when you sell your shares.
34
INTERNATIONAL GROWTH OPPORTUNITIES FUND
SCHEDULE OF INVESTMENTS
As of March 31, 2008
Number of Shares | Value | ||||||
Common Stock - 96.4% | |||||||
Australia - 3.9% | |||||||
| Incitec Pivot, Ltd. | 11,351 | $ | 1,462,562 | ||||
Murchison Metals, Ltd.*,## | 277,597 | 990,811 | |||||
| Nufarm, Ltd. | 97,928 | 1,531,312 | |||||
| Western Areas NL* | 138,302 | 744,869 | |||||
| 4,729,554 | |||||||
Belgium - 4.6% | |||||||
| EVS Broadcast Equipment SA | 27,607 | 2,976,825 | |||||
| Umicore | 49,205 | 2,569,818 | |||||
| 5,546,643 | |||||||
Canada - 2.0% | |||||||
| Canadian Western Bank | 52,200 | 1,310,533 | |||||
| Inmet Mining Corp. | 15,700 | 1,147,605 | |||||
| 2,458,138 | |||||||
Finland - 1.8% | |||||||
Outotec OYJ## | 41,477 | 2,214,844 | |||||
France - 7.2% | |||||||
Cie Generale de Geophysique-Veritas*,## | 7,869 | 1,966,084 | |||||
| Neopost SA* | 19,380 | 2,183,073 | |||||
| Nexans SA | 19,906 | 2,356,191 | |||||
| Sechilienne-Sidec | 28,945 | 2,245,082 | |||||
| 8,750,430 | |||||||
Germany - 11.7% | |||||||
| Bauer AG | 24,114 | 1,591,440 | |||||
| Comdirect Bank AG | 169,097 | 2,156,938 | |||||
| IVG Immobilien AG | 60,885 | 1,709,543 | |||||
| Roth & Rau AG* | 4,705 | 983,653 | |||||
| SGL Carbon AG** | 48,411 | 3,068,386 | |||||
Stada Arzneimittel AG## | 43,382 | 3,162,771 | |||||
| Tognum AG* | 73,319 | 1,613,707 | |||||
| 14,286,438 | |||||||
Greece - 1.3% | |||||||
| JUMBO SA | 53,126 | 1,599,435 | |||||
Hong Kong - 3.3% | |||||||
| Kowloon Development Co., Ltd. | 710,800 | 1,340,710 | |||||
Melco International Development## | 1,369,500 | 1,879,294 | |||||
| Tian An China Investment | 979,360 | 861,974 | |||||
| 4,081,978 | |||||||
Indonesia - 0.9% | |||||||
| Bakrie Sumatera Plantations Tbk PT | 5,667,900 | 1,096,020 | |||||
Ireland - 4.2% | |||||||
| Iaws Group PLC | 68,460 | 1,615,242 | |||||
| Paddy Power PLC | 95,148 | 3,469,143 | |||||
| 5,084,385 | |||||||
Italy - 6.1% | |||||||
| ACEA SpA | 117,588 | 2,310,418 | |||||
| Azimut Holding SpA | 169,095 | 1,760,362 | |||||
| Brembo SpA | 123,102 | 1,786,761 | |||||
Geox SpA## | 97,961 | 1,519,644 | |||||
| 7,377,185 | |||||||
Japan - 11.2% | |||||||
| Asics Corp. | 164,600 | 1,895,128 | |||||
| Nitori Co., Ltd. | 25,000 | 1,416,587 | |||||
| Parco Co., Ltd. | 79,200 | 1,128,303 | |||||
The Japan Steel Works, Ltd.## | 160,300 | 2,736,221 | |||||
| Tokyu Land Corp. | 141,400 | 887,879 | |||||
Torishima Pump Manufacturing Co., Ltd.## | 134,000 | 2,246,908 | |||||
Towa Pharmaceutical Co., Ltd.## | 34,900 | 1,483,167 | |||||
| Unicharm Petcare Corp. | 58,100 | 1,827,026 | |||||
| 13,621,219 | |||||||
Mexico - 1.0% | |||||||
| Banco Compartamos SA de CV* | 264,100 | 1,169,888 | |||||
Netherlands - 4.4% | |||||||
| Koninklijke BAM Groep NV | 75,219 | 1,779,481 | |||||
| SBM Offshore NV | 55,425 | 1,794,238 | |||||
| Unit 4 Agresso NV* | 61,898 | 1,746,813 | |||||
| 5,320,532 | |||||||
Norway - 3.1% | |||||||
| Pronova BioPharma AS* | 566,500 | 1,543,961 | |||||
| Songa Offshore ASA* | 164,576 | 2,202,227 | |||||
| 3,746,188 | |||||||
Republic Of China - 4.0% | |||||||
| AAC Acoustic Technologies | |||||||
Holdings, Inc.*,## | 1,486,000 | 1,199,057 | |||||
| China Green Holdings, Ltd. | 2,154,000 | 2,382,924 | |||||
| Peace Mark Holdings, Ltd. | 1,374,000 | 1,239,325 | |||||
| 4,821,306 | |||||||
Singapore - 5.2% | |||||||
| Ausgroup, Ltd. | 3,260,000 | 2,199,906 | |||||
| StarHub, Ltd. | 1,154,500 | 2,546,660 | |||||
| UOL Group, Ltd. | 564,200 | 1,580,243 | |||||
| 6,326,809 | |||||||
South Korea - 0.6% | |||||||
| Osstem Implant Co., Ltd.* | 27,320 | 685,517 | |||||
Spain - 3.3% | |||||||
| Grifols SA | 151,034 | 3,989,480 | |||||
Sweden - 0.6% | |||||||
Rezidor Hotel Group AB## | 135,800 | 794,654 | |||||
United Arab Emirates - 1.9% | |||||||
| Lamprell PLC | 286,039 | 2,274,010 | |||||
United Kingdom - 14.1% | |||||||
| ARM Holdings PLC | 232,609 | 406,833 | |||||
| Babcock International Group | 244,810 | 2,780,690 | |||||
| De La Rue PLC | 146,219 | 2,576,260 | |||||
| Henderson Group PLC | 356,233 | 748,724 | |||||
| IG Group Holdings PLC | 333,948 | 2,172,029 | |||||
| RPS Group PLC | 272,831 | 1,748,762 | |||||
| Southern Cross Healthcare, Ltd. | 223,831 | 1,668,240 | |||||
| SSL International PLC | 214,459 | 1,932,986 | |||||
| Wellstream Holdings PLC* | 117,020 | 3,058,391 | |||||
| 17,092,915 | |||||||
| Total Common Stock (Cost: $101,821,400) | 117,067,568 | ||||||
See Accompanying Notes to Financial Statements.
35
INTERNATIONAL GROWTH OPPORTUNITIES FUND
SCHEDULE OF INVESTMENTS
As of March 31, 2008
Number of Shares | Value | ||||||
Preferred Stock - 0.8% | |||||||
Brazil - 0.9% | |||||||
| Banco do Estado do Rio Grande | |||||||
| do Sul Cl. B (Cost: $1,249,019) | 195,700 | $ | 1,029,705 | ||||
Principal Amount | |||||||
Short Term Investments - 17.7% | |||||||
Money Market Funds - 13.8% | |||||||
| Boston Global Investment Trust - | |||||||
| Enhanced Portfolio, 3.017%** | $ | 16,717,327 | 16,717,327 | ||||
Time Deposits - 3.9% | |||||||
| Wachovia Bank London | |||||||
| 1.700%, 04/01/08 | 4,773,281 | 4,773,281 | |||||
| Total Short Term Investments (Cost: $21,490,608) | 21,490,608 | ||||||
| Total Investments - 114.9% (Cost: $124,561,027) | 139,587,881 | ||||||
| Liabilities in Excess of Other Assets - (14.9%) | (18,135,473 | ) | |||||
| Net Assets - 100.0% | $ | 121,452,408 | |||||
| * | Non-income producing securities. |
| ** | All of the security is purchased with cash collateral proceeds from securities loans. |
| ## | All or a portion of the Fund’s holdings in this security was on loan as of 3/31/08. |
SCHEDULE OF INVESTMENTS BY SECTOR
as of March 31, 2008
| Sector | Percent of Net Assets | |||
| Consumer, Non-cyclical | 23.4 | % | ||
| Industrial | 20.9 | |||
| Consumer, Cyclical | 13.0 | |||
| Financial | 10.2 | |||
| Basic Materials | 9.5 | |||
| Energy | 9.3 | |||
| Communications | 3.9 | |||
| Technology | 3.6 | |||
| Utilities | 1.9 | |||
| Diversified | 1.5 | |||
| Short Term Investments | 17.7 | |||
| Total Investments | 114.9 | |||
| Liabilities in excess of other assets | (14.9 | ) | ||
| Net Assets | 100.0 | % | ||
See Accompanying Notes to Financial Statements.
36
EMERGING MARKETS FUND
Management Team: Kunal Ghosh, Portfolio Manager; Steven Tael, Ph.D., CFA, Portfolio Manager; Sherry Zhang, Analyst
Chief Investment Officer: Horacio A. Valeiras, CFA
Goal: The Emerging Markets Fund seeks to maximize long-term capital appreciation primarily through investments in countries with emerging securities markets. These markets have yet to reach a level of maturity associated with the developed foreign stock markets and are, in the opinion of the Investment Adviser, less sophisticated than more developed markets in terms of par ticipation, analyst coverage, liquidity and regulation.
Market Overview: Emerging market equities posted significant gains during the twelve months ended March 31, 2008, supported by strong growth in many developing economies and buoyant commodity prices. Returns in most markets were positive in local currencies, and depreciation in the U.S. dollar boosted results for U.S.-based investors. Some of the top-performing countries were:
| • | Brazil, whose stock market is weighted toward commodity-oriented companies, such as producers of oil, metals and food products |
| • | China, where GDP grew 11.9% in 2007 despite six interest rate hikes from the central bank aimed at controlling inflation |
| • | Indonesia, which benefited from high coal and cocoa prices that spurred the fastest pace of private consumption in nearly four years |
After many national benchmarks hit record highs in the final months of 2007, emerging market equities gave back some of their gains in the first quarter of 2008. The weakness was caused by a deepening in the U.S.-induced credit crisis that ignited a global sell-off in equities. Stocks rallied near the end of the period, however, lifted by optimism that monetary easing from the Federal Reserve would ease the credit market turmoil.
Performance: From April 1, 2007 to March 31, 2008, the Fund’s Class I shares gained 21.19% and the MSCI Emerging Markets Index rose 21.65%.
Portfolio Specifics: The Fund kept pace in the rapidly rising market, performing in line with the benchmark. Major areas of relative strength included stock selection in South Korea, Russia and the materials and consumer discretionary sectors. Top-performing holdings included South Korea-based STX Pan Ocean, a global shipping company that benefited from a strong freight environment; South Korea-based LG Electronics, a consumer electronics manufacturer with expanding margins in its handset business; and Russia-based Mechel, a steel and mining company that was recognized for the value of its growing mining franchise.
An overweight in industrials was another plus, as industrials was one of the better-performing sectors in the index amid an unprecedented global economic expansion in 2007. Areas of relative weakness included stock selection in China, India and the financials sector. An underweight in India also was unfavorable, as India outperformed against a backdrop of robust economic growth.
As the result of our risk-controlled approach to portfolio construction, the Fund’s holdings were broadly diversified throughout the period. On March 31, the largest overweights versus the index were in South Korea (+2.4%) and the materials sector (+5.2%). The largest underweights were in China (-3.4%) and industrials (-3.6%).
Market Outlook: Our process evaluates investment opportunities on a relative basis and is required to remain fully invested. As such, the process neither utilizes nor results in a forecast or outlook on the overall market, but expects to perform equally well versus the MSCI Emerging Markets Index in both up and down markets.
Through consistent application of our systematic, model-driven process, we believe that the Fund will continue to deliver strong performance.
Comparison of Change in Value of a $250,000 Investment in Emerging Markets Fund Class I and II Shares with the MSCI EM Index.
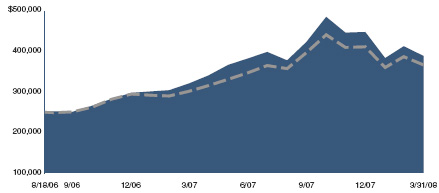

| Annualized Total Returns As of 3/31/08 | ||
1 Year | Since Inception | |
| Emerging Markets Fund Class I | 21.19% | 31.56% |
| MSCI EM Index | 21.65% | 26.92% |
37
EMERGING MARKETS FUND
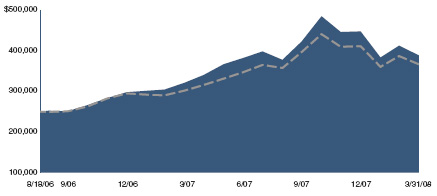

| Annualized Total Returns As of 3/31/08 | ||
1 Year | Since Inception | |
| Emerging Markets Fund Class II | 21.18% | 31.57% |
| MSCI EM Index | 21.65% | 26.92% |
The graphs above show the value of a hypothetical $250,000 investment in the Fund's Class I and II shares compared with the Morgan Stanley Capital International Emerging Markets Index ("MSCI EM") over the periods indicated. Average annual total return figures include changes in principal value, reinvested dividends, and capital gain distributions. The total returns shown above do not show the effects of income taxes on an individual's investment. In most cases, taxes may reduce your actual investment returns on income or gains paid by the Fund or any gains you may realize if you sell your shares. Past performance cannot guarantee future results.
The MSCI EM Index is a market capitalization weighted index composed of over 800 companies representative of the market structure of emerging countries in Europe, Latin America, Africa, Middle East and Asia. The MSCI EM Index excludes closed markets and those shares in otherwise free markets that are not purchasable by foreigners. Index weightings represent the relative capitalizations of the major overseas markets included in the index on a U.S. dollar adjusted basis.
The unmanaged Index differs from the Fund in composition, does not pay management fees or expenses and includes reinvested dividends. One cannot invest directly in an index. Since markets can go down as well as up, investment return and principal value will fluctuate with market conditions, currency volatility and the social, economic and political climates of countries where the Fund invests. You may have a gain or loss when you sell your shares.
38
EMERGING MARKETS FUND
SCHEDULE OF INVESTMENTS
As of March 31, 2008
Number of Shares | Value | ||||||
Common Stock - 83.0% | |||||||
Argentina - 0.2% | |||||||
| Telecom Argentina SA - ADR* | 1,600 | $ | 33,888 | ||||
Brazil - 10.0% | |||||||
| Banco Bradesco SA - ADR | 4,700 | 130,472 | |||||
Banco Itau Holding Financeira SA - ADR## | 4,700 | 106,972 | |||||
| Brasil Telecom Participacoes SA - ADR | 1,800 | 117,828 | |||||
| Cia de Saneamento Basico | |||||||
| do Estado de Sao Paulo - ADR | 3,000 | 132,990 | |||||
| Cia Vale do Rio Doce - ADR | 7,800 | 227,370 | |||||
| Petroleo Brasileiro SA - ADR | 2,200 | 186,318 | |||||
| Petroleo Brasileiro SA - ADR | 3,900 | 398,229 | |||||
| Tele Norte Leste Participacoes SA - ADR | 4,600 | 122,084 | |||||
| Telemig Celular Participacoes SA - ADR | 600 | 33,996 | |||||
| Unibanco - Uniao de Bancos | |||||||
| Brasileiros SA | 18,100 | 212,625 | |||||
Vivo Participacoes SA - ADR*,## | 7,300 | 43,508 | |||||
| 1,712,392 | |||||||
Chile - 0.3% | |||||||
| Enersis SA - ADR | 2,500 | 44,200 | |||||
Colombia - 0.2% | |||||||
| BanColombia SA | 5,132 | 41,351 | |||||
Czech Republic - 0.8% | |||||||
| Unipetrol* | 8,500 | 138,910 | |||||
Egypt - 1.3% | |||||||
| Commercial International Bank* | 3,478 | 58,653 | |||||
| Egyptian Financial Group-Hermes Holding | 4,876 | 50,136 | |||||
| Orascom Construction Industries | 1,070 | 80,521 | |||||
| Telecom Egypt | 9,012 | 33,248 | |||||
| 222,558 | |||||||
India - 2.6% | |||||||
| ICICI Bank, Ltd. - ADR | 2,000 | 76,380 | |||||
| iShares MSCI India* | 30,400 | 219,792 | |||||
Reliance Industries, Ltd. - GDR 144A#,* | 1,313 | 150,995 | |||||
| 447,167 | |||||||
Indonesia - 2.2% | |||||||
| Bumi Resources Tbk PT | 109,000 | 73,417 | |||||
| Energi Mega Persada Tbk PT* | 720,000 | 88,387 | |||||
| PT Astra International Tbk | 67,000 | 176,507 | |||||
| Timah Tbk PT | 13,000 | 40,885 | |||||
| 379,196 | |||||||
Israel - 3.3% | |||||||
| Bezeq Israeli Telecommunication | |||||||
| Corp., Ltd. | 40,684 | 76,031 | |||||
| Israel Discount Bank, Ltd. Cl. A* | 13,623 | 32,981 | |||||
| Mizrahi Tefahot Bank, Ltd. | 4,119 | 32,167 | |||||
| Oil Refineries, Ltd. | 97,267 | 86,480 | |||||
| Teva Pharmaceutical Industries, Ltd. - ADR | 7,400 | 341,806 | |||||
| 569,465 | |||||||
Malaysia - 1.9% | |||||||
| Berjaya Corp. Berhad | 107,400 | 37,943 | |||||
| Bumiputra-Commerce Holdings Berhad | 11,700 | 36,397 | |||||
| IOI Corp. Berhad | 34,900 | 77,471 | |||||
| PPB Group Berhad | 54,100 | 172,525 | |||||
| 324,336 | |||||||
Mexico - 2.3% | |||||||
| Alfa SAB de CV Cl. A | 14,200 | 94,786 | |||||
| Grupo Mexico SAB de CV Cl. B | 45,300 | 300,044 | |||||
| 394,830 | |||||||
Poland - 0.9% | |||||||
| Polski Koncern Naftowy Orlen* | 8,240 | 146,868 | |||||
Republic of China - 10.7% | |||||||
| Bank of Communications Co., Ltd. | 61,000 | 71,088 | |||||
| Chaoda Modern Agriculture | 68,000 | 77,761 | |||||
| China Coal Energy Co. | 16,000 | 27,877 | |||||
| China Construction Bank Corp. | 44,000 | 32,620 | |||||
| China COSCO Holdings Co., Ltd. | 30,500 | 74,067 | |||||
| China Life Insurance Co., Ltd. | 31,000 | 106,548 | |||||
| China Mobile, Ltd. | 30,000 | 446,366 | |||||
| China Petroleum & Chemical Corp. | 150,000 | 128,166 | |||||
| China Shenhua Energy Co., Ltd. | 30,000 | 119,686 | |||||
| China Telecom Corp., Ltd. | 102,000 | 64,087 | |||||
| China Unicom, Ltd. | 48,000 | 101,022 | |||||
| Chongqing Iron & Steel Co., Ltd. | 78,000 | 26,959 | |||||
| Citic Pacific, Ltd. | 8,000 | 33,407 | |||||
| CNOOC, Ltd. | 103,000 | 151,929 | |||||
| Cnpc Hong Kong, Ltd. | 290,000 | 133,023 | |||||
| Industrial & Commercial Bank of China | 165,300 | 115,115 | |||||
| Lenovo Group, Ltd. | 130,000 | 83,517 | |||||
| Shougang Concord International | |||||||
| Enterprises Co., Ltd. | 176,000 | 41,383 | |||||
| 1,834,621 | |||||||
Russian Federation - 9.2% | |||||||
| Evraz Group SA - GDR | 3,996 | 344,855 | |||||
| Gazprom OAO - ADR | 822 | 41,922 | |||||
| LUKOIL - ADR | 300 | 25,500 | |||||
| Mechel - ADR | 4,300 | 489,297 | |||||
| MMC Norilsk Nickel - ADR | 7,510 | 208,403 | |||||
| Mobile Telesystems OJSC - ADR | 2,200 | 166,870 | |||||
| Novolipetsk Steel OJSC - GDR | 1,900 | 81,605 | |||||
| Vimpel-Communications - ADR | 7,000 | 209,230 | |||||
| 1,567,682 | |||||||
South Africa - 5.4% | |||||||
| Aveng, Ltd. | 17,049 | 121,681 | |||||
| Barloworld, Ltd. | 2,381 | 31,587 | |||||
| Impala Platinum Holdings, Ltd. | 1,495 | 57,581 | |||||
| Remgro, Ltd. | 6,486 | 156,378 | |||||
| Sanlam, Ltd. | 52,013 | 122,248 | |||||
| Sasol, Ltd. | 4,814 | 230,182 | |||||
| Standard Bank Group, Ltd. | 18,992 | 206,127 | |||||
| 925,784 | |||||||
South Korea - 16.4% | |||||||
| Dongkuk Steel Mill Co., Ltd. | 1,860 | 72,777 | |||||
| Hyosung Corp. | 660 | 44,584 | |||||
| Hyundai Marine & Fire Insurance Co., Ltd.*. | 6,350 | 134,008 | |||||
| Hyundai Motor Co. | 4,747 | 378,188 | |||||
| Korea Gas Corp. | 1,727 | 128,171 | |||||
| LG Chem, Ltd. | 1,943 | 145,183 | |||||
| LG Corp. | 1,640 | 123,702 | |||||
| LG Display Co., Ltd. | 6,480 | 290,843 | |||||
| LG Electronics, Inc. | 5,430 | 696,330 | |||||
| Namhae Chemical | 6,790 | 177,232 | |||||
| POSCO | 325 | 156,207 | |||||
| Samsung Electronics Co., Ltd. | 474 | 298,179 | |||||
| Shinhan Financial Group Co., Ltd. | 1,500 | 79,214 | |||||
| SK Holdings Co., Ltd. | 633 | 90,762 | |||||
| 2,815,380 | |||||||
See Accompanying Notes to Financial Statements.
39
EMERGING MARKETS FUND
SCHEDULE OF INVESTMENTS
As of March 31, 2008
Number of Shares | Value | ||||||
Taiwan - 10.5% | |||||||
| Advanced Semiconductor | |||||||
| Engineering, Inc. - ADR | 1 | $ | 5 | ||||
| Asustek Computer, Inc. - GDR | 0.4 | 6 | |||||
| AU Optronics Corp. | 252,000 | 437,150 | |||||
| Chi Mei Optoelectronics Corp. | 219,000 | 288,352 | |||||
| China Development Financial | |||||||
| Holding Corp. | 145,000 | 66,821 | |||||
| Chunghwa Telecom Co., Ltd. - ADR | 1,781 | 46,342 | |||||
| Far Eastern Department Stores Co., Ltd.* | 32,000 | 53,088 | |||||
| First Steamship Co., Ltd.* | 47,000 | 119,281 | |||||
| HannStar Display Corp.* | 275,372 | 118,744 | |||||
| KGI Securities Co., Ltd. | 367,000 | 274,832 | |||||
| Nan Ya Plastics Corp.* | 71,000 | 176,451 | |||||
| U-Ming Marine Transport Corp.* | 20,000 | 60,370 | |||||
| USI Corp.* | 58,000 | 38,661 | |||||
| WPG Holdings Co., Ltd. | 90,000 | 125,315 | |||||
| 1,805,418 | |||||||
Thailand - 2.1% | |||||||
| Bangkok Bank PCL | 24,300 | 104,192 | |||||
| PTT PCL | 25,100 | 251,917 | |||||
| 356,109 | |||||||
Turkey - 2.7% | |||||||
| Aygaz AS | 9,270 | 31,224 | |||||
| Bagfas Bandirma Gubre Fabrik | 395 | 34,888 | |||||
| Eczacibasi Ilac Sanayi* | 9,545 | 25,863 | |||||
| Gubre Fabrikalari TAS | 2,043 | 38,612 | |||||
| Tupras Turkiye Petrol Rafine | 7,149 | 157,856 | |||||
| Turk Hava Yollari* | 14,163 | 66,257 | |||||
| Turkiye Garanti Bankasi AS | 24,093 | 108,202 | |||||
| 462,902 | |||||||
| Total Common Stock (Cost: $13,833,131) | 14,223,057 | ||||||
Equity-Linked Securities - 4.9% | |||||||
India - 4.5% | |||||||
| Merrill Lynch Axis Bank, Ltd. - 04/21/10 | 1,471 | 28,640 | |||||
| Merrill Lynch Bank of India - 05/02/11 | 6,952 | 43,825 | |||||
| Merrill Lynch Indiabulls | |||||||
| Financial Services, Ltd. - 01/08/13 | 10,913 | 66,646 | |||||
| Merrill Lynch Indiabulls | |||||||
| Financial Services, Ltd. - 09/24/09 | 2,575 | 26,584 | |||||
| Merrill Lynch Kotak | |||||||
| Mahindra Bank, Ltd. - 04/20/12 | 4,190 | 65,645 | |||||
| Merrill Lynch Sesa GOA, Ltd. - 01/21/10 | 656 | 51,184 | |||||
| Merrill Lynch Tata Steel, Ltd. - 10/18/11 | 1,850 | 31,963 | |||||
| UBS AG Gujarat | |||||||
| NRE Coke, Ltd. - 12/11/10 | 12,083 | 41,952 | |||||
| UBS AG London DLF, Ltd. - 06/22/10 | 5,250 | 84,536 | |||||
| UBS AG London Hindalco | |||||||
| Industries, Ltd. - 11/12/10 | 11,513 | 47,272 | |||||
| UBS Industrial Development - 02/15/11 | 31,721 | 70,421 | |||||
| UBS Reliance Capital, Ltd. - 02/15/10 | 7,145 | 218,966 | |||||
| 777,634 | |||||||
United Arab Emirates - 0.4% | |||||||
| Merrill Lynch Aldar Properties | |||||||
| PJSC - 01/12/10 | 23,355 | 65,511 | |||||
| Total Equity-Linked Securities (Cost: $1,122,388) | 843,145 | ||||||
Preferred Stock - 4.8% | |||||||
Brazil - 4.8% | |||||||
| Braskem S.A. Cl. A | 17,200 | 146,571 | |||||
| Eletropaulo Metropolitana S.A. Cl. B | 2,660,000 | 209,940 | |||||
| Metalurgica Gerdau SA | 3,900 | 163,048 | |||||
| Usinas Siderurgicas de Minas Gerais SA | 5,400 | 303,895 | |||||
| 823,454 | |||||||
| Total Preferred Stock (Cost: $631,387) | 823,454 |
Principal Amount | |||||||
Short Term Investments - 2.9% | |||||||
Money Market Funds - 0.9% | |||||||
| Boston Global Investment Trust - | |||||||
| Enhanced Portfolio, 3.017%** | $ | 150,800 | 150,800 | ||||
Time Deposits - 2.0% | |||||||
| Wells Fargo Bank - Grand Cayman | |||||||
| 1.700%, 04/01/08 | 353,711 | 353,711 | |||||
| Total Short Term Investments (Cost: $504,511) | 504,511 | ||||||
| Total Investments - 95.6% (Cost: $16,091,417) | 16,394,167 | ||||||
| Other Assets in Excess of Liabilities - 4.4% | 752,962 | ||||||
| Net Assets - 100.0% | $ | 17,147,129 | |||||
| * | Non-income producing securities. |
| ** | All of the security is purchased with cash collateral proceeds from securities loans. |
| # | 144A Security. Certain condition for public sale may exist. The total market value of 144A securities owned at March 31, 2008 was $150,995 or 0.09% of net assets. |
| ## | All or a portion of the Fund’s holdings in this security was on loan as of 3/31/08. |
ADR - American Depository Receipt
GDR - Global Depository Receipt
SCHEDULE OF INVESTMENTS BY SECTOR
as of March 31, 2008
| Sector | Percent of Net Assets | |||
| Basic Materials | 18.1 | % | ||
| Financial | 16.3 | |||
| Energy | 15.6 | |||
| Industrial | 14.8 | |||
| Communications | 8.7 | |||
| Consumer, Non-cyclical | 5.5 | |||
| Consumer, Cyclical | 4.4 | |||
| Utilities | 3.0 | |||
| Diversified | 2.8 | |||
| Technology | 2.2 | |||
| Funds | 1.3 | |||
| Short Term Investments | 2.9 | |||
| Total Investments | 95.6 | |||
| Other assets in excess of liabilities | 4.4 | |||
| Net Assets | 100.0 | % | ||
See Accompanying Notes to Financial Statements.
40
INTERNATIONAL SYSTEMATIC FUND
Management Team: Kunal Ghosh, Portfolio Manager; Steven Tael, Ph.D., CFA, Portfolio Manager; Sherry Zhang, Analyst
Chief Investment Officer: Horacio A. Valeiras, CFA
Goal: The International Systematic Fund seeks to maximize long-term capital appreciation through investments primarily in companies located in the developed countries represented in the MSCI EAFE Index. The Investment Adviser identifies investment opportunities using a quantitative model that integrates stock, sector, country and currency selection decisions.
Market Overview: Developed non-U.S. stock markets declined in local currencies from April 1, 2007 through March 31, 2008. While broad-based weakness in the U.S. dollar led to a substantial performance enhancement for U.S.-based investors, the MSCI EAFE Index still fell in dollar terms.
The period began on a strong note, with the index completing a ninth consecutive quarter of gains in September — the longest unbroken stretch of positive returns in more than twenty years. Equities rose on brisk merger activity, favorable economic trends in Europe and signs that the U.S. economy might be picking up after a slow start to 2007.
However, declines in the second half of the period left the MSCI EAFE Index in negative territory for the full fiscal year. Stocks sold off in response to turmoil in the global credit markets, fears of a housing-induced U.S. recession and rising inflationary pressures. In addition, the drop in the value of the U.S. dollar clouded the earnings outlook for European and Japanese companies doing business with the United States. For example, a major Japanese auto maker reported that the decline in the U.S. currency erased nearly $200 million from its fourth quarter 2007 operating profit.
Most EAFE markets fell in local currencies. Hong Kong was one of the few bright spots, rising on signs that China would soon open up the Hong Kong market to mainland Chinese investors.
Performance: The Fund’s Class I shares posted a 9.87% loss during the fiscal year ended March 31, 2008, and the MSCI EAFE Index declined 2.27%.
Portfolio Specifics: The primary reason the Fund lagged the index was stock selection, which was particularly weak in the United Kingdom, Hong Kong and the financials and materials sectors. The portfolio’s worst-performing holdings included two U.K. banks that fell sharply due to uncertainty about their U.S. subprime exposure and the ensuing credit crisis in the second half of 2007.
Stock selection in Norway, France and the information technology sector had a major positive effect on relative results. Top-performing holdings included France Telecom, a telecommunication services provider that saw good performance in its wireless business, and Nintendo, a Japanese video game company that benefited from strong sales of its Wii and DS game consoles. An underweight in financials was another key source of value added, as financials was the worst-performing sector in the index due to credit-related writedowns.
The Fund remained broadly diversified across countries and sectors throughout the period. Based on our model’s bottom-up stock selection recommendations, on March 31, the Fund’s largest overweights versus the MSCI EAFE Index were in the United Kingdom (+4.6%) and the telecommunication services sector (+3.0%). The largest underweights were in Japan (-4.8%) and financials (-9.1%).
Market Outlook: The Fund’s investment process evaluates opportunities on a relative basis and is required to remain fully invested. The Fund’s investment process neither utilizes, nor results in, a forecast or outlook on the overall market. Rather, the Fund expects to outperform the MSCI EAFE Index in both up and down markets.
We are confident that the Fund’s proprietary stock-selection model, in conjunction with its risk-controlled approach to portfolio construction, will add value above the index over time.
Comparison of Change in Value of a $250,000 Investment in International Systematic Fund Class I, II and III Shares with the MSCI EAFE Index.
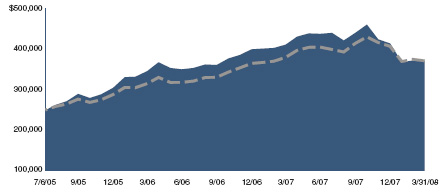

| Annualized Total Returns | As of 3/31/08 | |
1 Year | Since Inception | |
| International Systematic Fund Class I | -9.87% | 15.70% |
| MSCI EAFE Index | -2.27% | 15.66% |
41
INTERNATIONAL SYSTEMATIC FUND
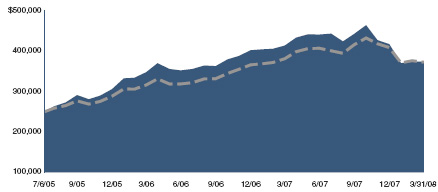

| Annualized Total Returns As of 3/31/08 | ||
1 Year | Since Inception | |
| International Systematic Fund | ||
| Class II | -9.68% | 15.76% |
| MSCI EAFE Index | -2.27% | 15.66% |
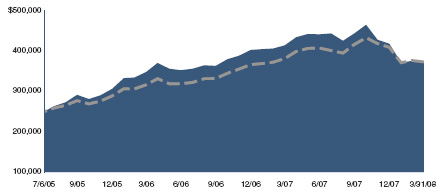

| Annualized Total Returns As of 3/31/08 | ||
1 Year | Since Inception | |
| International Systematic Fund | ||
| Class III | -9.57% | 15.83% |
| MSCI EAFE Index | -2.27% | 15.66% |
The graphs above show the value of a hypothetical $250,000 investment in the Fund’s Class I , II and III shares with the MSCI EAFE Index for the periods indicated. Average annual total return figures include changes in principal value, reinvested dividends, and capital gain distributions. The Class I shares commenced operations on July 6, 2005 and Class II and III shares on December 22, 2006. The historical performance of Class II and III shares includes the performance of Class I shares for the periods prior to the inception of Class II and III shares. The total returns shown above do not show the effects of income taxes on an individuals’ investment. In most cases, taxes may reduce your actual investment returns on income or gains paid by the Fund or any gains you may realize if you sell your shares. Past performance cannot guarantee future results.
The MSCI EAFE Index is an unmanaged index comprised of over 900 companies and is a generally accepted benchmark for major overseas markets. Index weightings represent the relative capitalizations of the major overseas markets included in the Index on a U.S. dollar adjusted basis. The unmanaged Index differs from the Fund in composition, does not pay management fees or expenses and includes reinvestment dividends. One cannot invest directly in an index.
Since markets can go down as well as up, investment return and principal value will fluctuate with market conditions, currency volatility and the social, economic and political climates of countries where the Fund invests. You may have a gain or loss when you sell your shares.
42
INTERNATIONAL SYSTEMATIC FUND
SCHEDULE OF INVESTMENTS
As of March 31, 2008
Number of Shares | Value | ||||||
Common Stock - 95.1% | |||||||
Australia - 5.4% | |||||||
| BHP Billiton, Ltd. | 27,337 | $ | 893,623 | ||||
| Commonwealth Bank of Australia | 18,911 | 721,762 | |||||
| CSL, Ltd. | 59,855 | 2,016,712 | |||||
Leighton Holdings, Ltd.## | 12,673 | 495,134 | |||||
| Newcrest Mining, Ltd. | 8,833 | 269,069 | |||||
| Rio Tinto, Ltd. | 4,880 | 545,702 | |||||
| Woolworths, Ltd. | 17,292 | 457,765 | |||||
| 5,399,767 | |||||||
Belgium - 1.1% | |||||||
| Euronav NV* | 13,306 | 507,282 | |||||
| Tessenderlo Chemie NV | 13,369 | 609,883 | |||||
| 1,117,165 | |||||||
Denmark - 2.5% | |||||||
| FLSmidth & Co. AS Cl. B | 11,650 | 1,157,264 | |||||
| Novo Nordisk AS Cl. B | 15,825 | 1,086,104 | |||||
| Vestas Wind Systems AS* | 2,300 | 252,175 | |||||
| 2,495,543 | |||||||
Finland - 2.3% | |||||||
| Nokia OYJ | 71,833 | 2,281,012 | |||||
France - 7.0% | |||||||
| Alstom | 4,845 | 1,054,226 | |||||
| BNP Paribas | 14,281 | 1,445,764 | |||||
| France Telecom SA | 58,957 | 1,989,853 | |||||
| Peugeot SA | 7,036 | 547,522 | |||||
| Total SA | 26,670 | 1,987,908 | |||||
| 7,025,273 | |||||||
Germany - 10.7% | |||||||
| BASF SE | 11,986 | 1,620,243 | |||||
| Bayer AG | 20,842 | 1,676,359 | |||||
| Daimler AG | 10,726 | 920,327 | |||||
| Deutsche Boerse AG | 7,455 | 1,205,262 | |||||
| E.ON AG | 8,612 | 1,600,147 | |||||
| K+S AG | 901 | 295,972 | |||||
| RWE AG | 9,096 | 1,122,201 | |||||
| Volkswagen AG | 8,152 | 2,372,124 | |||||
| 10,812,635 | |||||||
Greece - 0.7% | |||||||
| National Bank of Greece SA | 14,015 | 742,174 | |||||
Hong Kong - 1.6% | |||||||
| Hang Lung Group, Ltd. | 102,000 | 481,636 | |||||
| Kerry Properties, Ltd. | 77,000 | 464,997 | |||||
| New World Development, Ltd. | 295,000 | 714,867 | |||||
| 1,661,500 | |||||||
Italy - 2.6% | |||||||
| Enel SpA | 135,229 | 1,439,942 | |||||
| ENI SpA | 33,299 | 1,139,701 | |||||
| 2,579,643 | |||||||
Japan - 15.2% | |||||||
| Aisin Seiki Co., Ltd. | 15,700 | 586,768 | |||||
| Astellas Pharma, Inc. | 5,600 | 217,170 | |||||
| Daiichi Sankyo Co., Ltd. | 9,500 | 281,082 | |||||
| Daikin Industries, Ltd. | 14,900 | 642,196 | |||||
| East Japan Railway Co. | 44 | 366,464 | |||||
| Hino Motors, Ltd. | 145,000 | 958,557 | |||||
| Japan Tobacco, Inc. | 40 | 200,532 | |||||
| Jupiter Telecommunications Co., Ltd.* | 361 | 338,024 | |||||
| KDDI Corp. | 68 | 416,055 | |||||
| Mitsui & Co., Ltd. | 53,400 | 1,083,719 | |||||
| Mitsui OSK Lines, Ltd. | 76,000 | 920,078 | |||||
| Mitsumi Electric Co., Ltd. | 13,700 | 433,566 | |||||
| Nikon Corp. | 12,000 | 320,088 | |||||
| Nintendo Co., Ltd. | 3,100 | 1,600,844 | |||||
| Nippon Telegraph & Telephone Corp. | 239 | 1,032,501 | |||||
| NTT DoCoMo, Inc. | 144 | 218,456 | |||||
| Shima Seiki Manufacturing, Ltd. | 18,600 | 870,809 | |||||
| Sojitz Corp. | 268,700 | 890,852 | |||||
| Sumitomo Corp. | 91,700 | 1,209,646 | |||||
| Suzuken Co., Ltd. | 11,700 | 481,941 | |||||
| Tokai Rika Co., Ltd. | 14,500 | 379,490 | |||||
| Toyoda Gosei Co., Ltd. | 18,100 | 681,921 | |||||
| Toyota Motor Corp. | 24,800 | 1,238,318 | |||||
| 15,369,077 | |||||||
Norway - 3.4% | |||||||
| DnB NOR ASA | 123,200 | 1,874,032 | |||||
| Yara International ASA | 27,700 | 1,605,284 | |||||
| 3,479,316 | |||||||
Singapore - 1.2% | |||||||
| Oversea-Chinese Banking Corp. | 91,000 | 534,847 | |||||
| Singapore Airlines, Ltd. | 24,600 | 278,460 | |||||
| Singapore Petroleum Co., Ltd. | 79,000 | 387,505 | |||||
| 1,200,812 | |||||||
Spain - 6.6% | |||||||
| ACS Actividades de Construccion y | |||||||
Servicios SA## | 4,416 | 252,395 | |||||
| Banco Santander SA | 129,585 | 2,591,314 | |||||
| Iberdrola SA | 80,769 | 1,256,788 | |||||
| Telefonica SA | 90,089 | 2,598,060 | |||||
| 6,698,557 | |||||||
Sweden - 2.2% | |||||||
| Millicom International Cellular SA - SDR* | 1,800 | 171,806 | |||||
| Nordea Bank AB | 47,400 | 769,757 | |||||
| Oriflame Cosmetics SA - SDR | 9,850 | 655,288 | |||||
| Swedish Match AB | 26,200 | 572,163 | |||||
| 2,169,014 | |||||||
Switzerland - 6.3% | |||||||
| ABB, Ltd. | 9,976 | 268,905 | |||||
| Nestle SA | 4,005 | 2,009,485 | |||||
| Roche Holding AG | 6,554 | 1,238,504 | |||||
| Swatch Group AG Cl. B | 1,631 | 437,825 | |||||
| Zurich Financial Services AG | 7,674 | 2,426,615 | |||||
| 6,381,334 | |||||||
United Kingdom - 26.3% | |||||||
| Aggreko PLC | 33,857 | 434,362 | |||||
| AMEC PLC | 38,982 | 560,544 | |||||
| Anglo American PLC | 15,961 | 960,557 | |||||
| AstraZeneca PLC | 7,205 | 269,788 | |||||
| BG Group PLC | 35,815 | 830,698 | |||||
| BHP Billiton PLC | 33,268 | 988,496 | |||||
| BP PLC | 147,035 | 1,496,228 | |||||
| British American Tobacco PLC | 29,695 | 1,116,046 | |||||
| Charter PLC* | 44,530 | 752,279 | |||||
| De La Rue PLC | 37,780 | 665,653 | |||||
| Diageo PLC | 66,829 | 1,349,478 | |||||
| Game Group PLC | 41,443 | 174,826 | |||||
| GlaxoSmithKline PLC | 13,149 | 278,585 | |||||
| ICAP PLC | 26,282 | 297,220 | |||||
| Imperial Tobacco Group PLC | 13,893 | 640,054 | |||||
See Accompanying Notes to Financial Statements.
43
INTERNATIONAL SYSTEMATIC FUND
SCHEDULE OF INVESTMENTS
As of March 31, 2008
Number of Shares | Value | ||||||
| Old Mutual PLC | 396,247 | $ | 870,233 | ||||
| Rio Tinto PLC | 10,987 | 1,142,713 | |||||
| Royal Bank of Scotland Group PLC | 65,373 | 438,185 | |||||
| Royal Dutch Shell PLC Cl. A | 40,290 | 1,390,927 | |||||
| Royal Dutch Shell PLC Cl. B | 52,817 | 1,780,355 | |||||
| SSL International PLC | 61,028 | 550,064 | |||||
| Stagecoach Group PLC | 172,699 | 830,639 | |||||
| Standard Chartered PLC | 43,837 | 1,500,310 | |||||
| Standard Life PLC | 113,023 | 553,159 | |||||
| Unilever PLC | 68,138 | 2,300,858 | |||||
| Vodafone Group PLC | 764,107 | 2,291,662 | |||||
| WM Morrison Supermarkets PLC | 230,014 | 1,253,742 | |||||
| Xstrata PLC | 11,262 | 789,456 | |||||
| 26,507,117 | |||||||
| Total Common Stock (Cost: $99,070,971) | 95,919,939 | ||||||
Principal Amount | |||||||
Short Term Investments - 5.7% | |||||||
Money Market Funds - 0.7% | |||||||
| Boston Global Investment Trust - | |||||||
| Enhanced Portfolio, 3.017%** | $ | 688,169 | 688,169 | ||||
Time Deposits - 5.0% | |||||||
| Wells Fargo Bank - Grand Cayman | |||||||
| 1.700%, 04/01/08 | 5,079,325 | 5,079,325 | |||||
| Total Short Term Investments (Cost: $5,767,494) | 5,767,494 | ||||||
| Total Investments - 100.8% (Cost: $104,838,465) | 101,687,433 | ||||||
| Liabilities in Excess of Other Assets - (0.8%) | (855,893 | ) | |||||
| Net Assets - 100.0% | $ | 100,831,540 | |||||
| * | Non-income producing securities. |
| ** | All of the security is purchased with cash collateral proceeds from securities loans. |
| ## | All or a portion of the Fund’s holdings in this security was on loan as of 3/31/08. |
SDR - Swedish Depository Receipts
SCHEDULE OF INVESTMENTS BY SECTOR
as of March 31, 2008
| Sector | Percent of Net Assets | |||
| Financial | 17.9 | % | ||
| Consumer, Non-cyclical | 17.5 | |||
| Consumer, Cyclical | 13.2 | |||
| Basic Materials | 11.3 | |||
| Communications | 11.2 | |||
| Industrial | 9.4 | |||
| Energy | 9.2 | |||
| Utilities | 5.4 | |||
| Short Term Investments | 5.7 | |||
| Total Investments | 100.8 | |||
| Liabilities in excess of other assets | (0.8 | ) | ||
| Net Assets | 100.0 | % | ||
See Accompanying Notes to Financial Statements.
44
INTERNATIONAL ALL CAP GROWTH FUND
Management Team: Horacio A. Valeiras, CFA, Portfolio Manager and Chief Investment Officer; Pedro V. Marcal, Portfolio Manager; Yuka Marosek, Analyst
Goal: The International All Cap Growth Fund seeks to maximize long-term capital appreciation. In pursuing this goal, the Fund invests in a diversified portfolio of equity securities of companies primarily located in developed non-U.S. markets.
Market Overview: Equities in developed non-U.S. markets, as measured by the MSCI EAFE Index, registered negative returns from April 1, 2007 through March 31, 2008. A decline in the U.S. dollar versus a basket of currencies helped minimize losses for U.S.-based investors. The environment was characterized by:
| • | Turmoil in the global credit markets, as losses on securities backed by U.S. mortgages made banks wary of lending to one another |
| • | Concerns that the credit crisis and U.S. housing slump would tip the world’s largest economy into a recession |
| • | Global flight to safe-haven investments and volatile swings in stock prices |
As evidence of the market’s volatility, Japanese stocks posted their biggest one-day gain since 2002 just days after incurring their biggest two-day loss since 1991, and European shares rose out of a bear market on the largest one-day rally since 2003.
In efforts to unfreeze the credit markets and calm investors, central banks worldwide added extra liquidity to the financial system. However, soaring food and energy prices made it difficult for some central banks to lower interest rates, including the European Central Bank. Annual inflation in the euro zone rose at its fastest pace in twelve years.
As measured by various MSCI indexes, international growth stocks outperformed value stocks by approximately 9%. Large caps outpaced small caps by more than 8%, consistent with investors’ diminished appetites for risk.
Performance: During the twelve months ended March 31, 2008, the Fund’s Class I shares gained 12.58%. The MSCI EAFE Growth Index, the Fund’s primary benchmark, rose 2.27%, and the MSCI EAFE Index declined 2.27%.
Portfolio Specifics: The Fund’s outperformance was due to stock selection, which was especially strong in Australia and France. Top-performing holdings included Australia-based Incitec Pivot, a fertilizer producer that benefited from a favorable pricing environment, and France-based Alstom, a transport and energy infrastructure firm whose strong order backlog provided good earnings visibility. The Fund’s exposure to emerging markets was another plus since, overall, emerging market equities outperformed their developed market counterparts by a wide margin.
Areas of relative weakness included stock selection in Germany and an underweight in Australia, one of the best-performing countries in the indexes. Australia is a top producer of mined commodities, such as coal and nickel, and benefited from the ongoing rally in commodity prices.
Market Outlook: Developed non-U.S. economies are feeling the effects of the U.S. slowdown, and recent readings on consumer confidence in Europe and Japan suggest a softening in domestic demand. That said, a number of positive factors may lend support to equity prices, including:
| • | Potential for many central banks to cut interest rates to boost growth, despite stubborn inflation |
| • | Attractive equity valuations, particularly in Japan, amid poor stock market performance and a lack of earnings acceleration |
| • | Robust labor markets, which should help mitigate flagging consumer confidence |
We believe that the Fund is well positioned for the dynamic environment given our focus on investing in companies poised to benefit from positive, sustainable change.
Comparison of Change in Value of a $250,000 Investment in International All Cap Growth Fund Class I Shares with the MSCI EAFE Growth Index and MSCI EAFE Index.
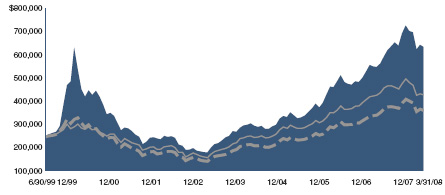

| Annualized Total Returns As of 3/31/08 | |||
1 Year | 5 Years | Since Inception | |
| International All Cap Growth | |||
| Fund Class I | 12.58% | 28.57% | 11.19% |
| MSCI EAFE Growth Index | 2.27% | 20.20% | 4.38% |
| MSCI EAFE Index | -2.27% | 21.90% | 6.42% |
The graph above shows the value of a hypothetical $250,000 investment in the Fund’s Class I shares compared with the MSCI EAFE Growth Index and MSCI EAFE Index for the periods indicated. Average annual total return figures include changes in principal value, reinvested dividends, and capital gain distributions. The total returns shown above do not show the effects of income taxes on an individual’s investment. In most cases, taxes may reduce your actual investment returns on income or gains paid by the Fund or any gains you may realize if you sell your shares. Past performance cannot guarantee future results.
On November 18, 2005, the Fund became the successor entity to the Nicholas-Applegate International All Cap Growth Fund, a series of the Professionally Managed Portfolios (“Acquired Fund”). The Acquired Fund transferred all of its assets and liabilities in exchange for shares of the Fund, and the investment objectives, policies and limitations of the Fund are substantially similar to those of the Acquired Fund. The performance shown above includes the historical performance of the Acquired Fund from June 30, 1999 to November 18, 2005.
The MSCI EAFE Growth Index is an unmanaged index that is a generally accepted benchmark for major overseas markets. It consists of the top 50% of the MSCI EAFE, those companies with the highest Price/Book Value ratio. The MSCI EAFE Index consists of approximately 900 companies with average market capitalization of U.S. $8.7 billion. Its weightings represent the relative capitalization of the major overseas markets included in the index on a U.S. dollar adjusted basis. The unmanaged indexes differ from the Fund in composition, do not pay management fees or expenses and include reinvested dividends. One cannot invest directly into an index.
Since markets can go down as well as up, investment return and principal value will fluctuate with market conditions, currency volatility and the social, economic and political climates of countries where the Fund invests. You may have a gain or loss when you sell your shares.
45
INTERNATIONAL ALL CAP GROWTH FUND
SCHEDULE OF INVESTMENTS
As of March 31, 2008
Number of Shares | Value | ||||||
Common Stock - 92.9% | |||||||
Australia - 5.5% | |||||||
| AMP, Ltd. | 7,269 | $ | 52,089 | ||||
| CSL, Ltd. | 5,513 | 185,751 | |||||
| Incitec Pivot, Ltd. | 838 | 107,975 | |||||
| Rio Tinto, Ltd. | 512 | 57,254 | |||||
| 403,069 | |||||||
Belgium - 1.2% | |||||||
| InBev NV | 957 | 84,525 | |||||
Bermuda - 0.2% | |||||||
| CrediCorp., Ltd. | 200 | 14,348 | |||||
Brazil - 1.7% | |||||||
| Bolsa de Mercadorias e Futuros - BM&F | 2,300 | 21,047 | |||||
| Cia Vale do Rio Doce - ADR | 2,400 | 83,136 | |||||
| Unibanco - Uniao de Bancos | |||||||
| Brasileiros SA - GDR | 200 | 23,328 | |||||
| 127,511 | |||||||
Canada - 2.0% | |||||||
| Potash Corp. of Saskatchewan | 200 | 31,042 | |||||
| Rogers Communications, Inc. Cl. B | 1,600 | 57,572 | |||||
| Teck Cominco, Ltd. Cl. B | 1,500 | 61,532 | |||||
| 150,146 | |||||||
Denmark - 2.4% | |||||||
| FLSmidth & Co. AS Cl. B | 1,450 | 144,037 | |||||
Novo Nordisk AS Cl. B## | 500 | 34,316 | |||||
| 178,353 | |||||||
Egypt - 0.4% | |||||||
| Orascom Construction Industries - GDR | 199 | 29,750 | |||||
Finland - 2.5% | |||||||
| Nokia OYJ | 2,111 | 67,034 | |||||
Outotec OYJ## | 1,674 | 89,390 | |||||
| Wartsila OYJ | 432 | 29,263 | |||||
| 185,687 | |||||||
France - 8.8% | |||||||
| Alstom | 504 | 109,666 | |||||
| BNP Paribas | 413 | 41,811 | |||||
| Cie Generale de Geophysique-Veritas* | 290 | 72,457 | |||||
| Electricite de France | 633 | 55,276 | |||||
| Gaz de France SA | 1,254 | 75,984 | |||||
| Suez SA | 1,239 | 81,613 | |||||
| Total SA - ADR | 560 | 41,446 | |||||
| Veolia Environnement | 2,409 | 168,567 | |||||
| 646,820 | |||||||
Germany - 8.7% | |||||||
| Deutsche Telekom AG | 2,465 | 41,207 | |||||
| E.ON AG | 762 | 141,583 | |||||
| Rhoen Klinikum AG | 1,414 | 42,055 | |||||
| RWE AG | 336 | 41,453 | |||||
| SAP AG | 1,301 | 64,896 | |||||
| Siemens AG | 518 | 56,348 | |||||
| Solarworld AG | 1,197 | 57,224 | |||||
| Stada Arzneimittel AG | 1,005 | 73,270 | |||||
| Tognum AG* | 1,868 | 41,114 | |||||
| United Internet AG | 3,828 | 82,675 | |||||
| 641,825 | |||||||
Greece - 1.8% | |||||||
| National Bank of Greece SA | 1,168 | 61,852 | |||||
| Piraeus Bank SA | 2,162 | 66,735 | |||||
| 128,587 | |||||||
Hong Kong - 2.4% | |||||||
| CLP Holdings, Ltd. | 11,000 | 90,526 | |||||
| HongKong Electric Holdings | 8,500 | 53,679 | |||||
| Kerry Properties, Ltd. | 5,086 | 30,714 | |||||
| 174,919 | |||||||
Ireland - 0.9% | |||||||
| Anglo Irish Bank Corp. PLC | 2,638 | 35,321 | |||||
| Icon PLC - ADR* | 500 | 32,445 | |||||
| 67,766 | |||||||
Israel - 1.0% | |||||||
| Teva Pharmaceutical Industries, | |||||||
| Ltd. - ADR | 1,510 | 69,747 | |||||
Italy - 2.6% | |||||||
| Saipem SpA | 2,472 | 100,432 | |||||
| UniCredit SpA | 12,905 | 86,702 | |||||
| 187,134 | |||||||
Japan - 17.1% | |||||||
| Chugai Pharmaceutical Co., Ltd. | 4,600 | 52,084 | |||||
| East Japan Railway Co. | 18 | 149,917 | |||||
| Honda Motor Co., Ltd. | 1,500 | 42,874 | |||||
| Japan Tobacco, Inc. | 32 | 160,426 | |||||
| KDDI Corp. | 11 | 67,303 | |||||
| Kirin Holdings Co., Ltd. | 2,000 | 37,876 | |||||
| Mitsubishi Corp. | 2,000 | 60,481 | |||||
| Mitsubishi Electric Corp. | 4,200 | 36,373 | |||||
| Mitsubishi UFJ Financial Group, Inc. | 6,200 | 53,569 | |||||
| Nintendo Co., Ltd. | 200 | 103,280 | |||||
Nitori Co., Ltd.## | 750 | 42,498 | |||||
| Nomura Holdings, Inc. | 4,600 | 68,860 | |||||
| Secom Co., Ltd. | 1,400 | 68,077 | |||||
| Sumitomo Heavy Industries, Ltd. | 4,000 | 25,880 | |||||
| The Japan Steel Works, Ltd. | 6,700 | 114,365 | |||||
| Toyo Tanso Co., Ltd. | 900 | 84,362 | |||||
| Toyota Motor Corp. | 1,000 | 49,932 | |||||
| Unicharm Corp. | 500 | 36,620 | |||||
| 1,254,777 | |||||||
Mexico - 0.3% | |||||||
| America Movil SAB de CV - ADR | 400 | 25,476 | |||||
Netherlands - 1.7% | |||||||
| Koninklijke BAM Groep NV | 2,662 | 62,976 | |||||
| SBM Offshore NV | 1,829 | 59,209 | |||||
| 122,185 | |||||||
Republic of China - 0.3% | |||||||
| China Communications | |||||||
| Construction Co., Ltd. | 10,000 | 22,177 | |||||
Russian Federation - 1.1% | |||||||
| Evraz Group SA - GDR | 944 | 81,467 | |||||
Singapore - 2.3% | |||||||
| City Developments, Ltd. | 9,300 | 74,365 | |||||
| DBS Group Holdings, Ltd. | 7,000 | 91,427 | |||||
| 165,792 | |||||||
Spain - 3.1% | |||||||
| Banco Santander SA | 5,974 | 119,462 | |||||
| Iberdrola SA | 3,024 | 47,054 | |||||
| Telefonica SA | 2,144 | 61,830 | |||||
| 228,346 | |||||||
Switzerland - 5.9% | |||||||
| Julius Baer Holding AG | 896 | 66,313 | |||||
| Nestle SA | 312 | 156,544 | |||||
See Accompanying Notes to Financial Statements.
46
SCHEDULE OF INVESTMENTS
As of March 31, 2008
Number of Shares | Value | ||||||
| Roche Holding AG | 507 | $ | 95,807 | ||||
| Swatch Group AG | 1,202 | 61,981 | |||||
| Syngenta AG | 174 | 51,195 | |||||
| 431,840 | |||||||
United Kingdom - 15.0% | |||||||
| Barclays PLC | 4,465 | 40,200 | |||||
| BP PLC | 6,242 | 63,518 | |||||
| British American Tobacco PLC | 4,628 | 173,937 | |||||
| BT Group PLC | 11,521 | 49,746 | |||||
| Burberry Group PLC | 3,970 | 35,546 | |||||
| Diageo PLC | 4,423 | 89,314 | |||||
| HSBC Holdings PLC | 4,800 | 78,203 | |||||
| Imperial Tobacco Group PLC | 1,854 | 85,414 | |||||
| International Power PLC | 10,957 | 86,673 | |||||
| Reckitt Benckiser Group PLC | 1,275 | 70,726 | |||||
| Royal Dutch Shell PLC Cl. A | 1,923 | 66,387 | |||||
| Southern Cross Healthcare, Ltd. | 4,321 | 32,205 | |||||
| SSL International PLC | 4,672 | 42,110 | |||||
| Unilever PLC | 3,106 | 104,882 | |||||
| Vodafone Group PLC | 26,993 | 80,956 | |||||
| 1,099,817 | |||||||
United States/Europe - 4.0% | |||||||
| iShares MSCI EAFE Index Fund | 4,100 | 294,790 | |||||
| Total Common Stock (Cost: $6,200,790) | 6,816,854 | ||||||
Preferred Stock - 3.2% | |||||||
Brazil - 1.0% | |||||||
| Usinas Siderurgicas de Minas Gerais SA | 1,300 | 73,160 | |||||
Germany - 2.2% | |||||||
| Fresenius SE | 1,066 | 89,102 | |||||
| Henkel KGaA | 1,647 | 76,414 | |||||
| 165,516 | |||||||
| Total Preferred Stock (Cost: $215,257) | 238,676 | ||||||
Equity-Linked Securities - 0.8% | |||||||
India - 0.8% | |||||||
| Merrill Lynch Reliance Communications, | |||||||
| Ltd. - 01/25/11 (Cost: $42,938) | 4,548 | 57,619 | |||||
Principal Amount | |||||||
Short Term Investments - 5.0% | |||||||
Money Market Funds - 1.9% | |||||||
| Boston Global Investment Trust - | |||||||
| Enhanced Portfolio, 3.017%** | $ | 136,888 | 136,888 | ||||
Time Deposits - 3.1% | |||||||
| Wachovia Bank London | |||||||
| 1.700%, 04/01/08 | 229,485 | 229,485 | |||||
| Total Short Term Investments (Cost: $366,373) | 366,373 | ||||||
| Total Investments - 101.9% (Cost: $6,825,358) | 7,479,522 | ||||||
| Liabilities in Excess of Other Assets - (1.9%) | (139,251 | ) | |||||
| Net Assets - 100.0% | $ | 7,340,271 | |||||
| * | Non-income producing securities. |
| ** | All of the security is purchased with cash collateral proceeds from securities loans. |
| ## | All or a portion of the Fund’s holdings in this security was on loan as of 3/31/08. |
ADR - American Depository Receipt
GDR - Global Depository Receipt
SCHEDULE OF INVESTMENTS BY SECTOR
as of March 31, 2008
| Sector | Percent of Net Assets | |||
| Consumer, Non-cyclical | 25.8 | % | ||
| Financial | 14.5 | |||
| Industrial | 13.6 | |||
| Utilities | 11.5 | |||
| Communications | 7.5 | |||
| Basic Materials | 7.4 | |||
| Energy | 6.3 | |||
| Consumer, Cyclical | 5.4 | |||
| Funds | 4.0 | |||
| Technology | 0.9 | |||
| Short Term Investments | 5.0 | |||
| Total Investments | 101.9 | |||
| Liabilities in excess of other assets | (1.9 | ) | ||
| Net Assets | 100.0 | % | ||
See Accompanying Notes to Financial Statements.
47
U.S. HIGH YIELD BOND FUND
Management Team: Douglas G. Forsyth, CFA, Portfolio Manager; William L. Stickney, Portfolio Manager; Justin Kass, CFA, Portfolio Manager; Michael E. Yee, Portfolio Manager; Elizabeth Lemesevski, Analyst; David A. Foster, CPA, CFA, Analyst; Joanna H. Willars, Analyst; Nicole D. Larrabee, Fixed Income Trading Assistant
Chief Investment Officer: Horacio A. Valeiras, CFA
Goal: The U.S. High Yield Bond Fund seeks to deliver total return via high current income and capital growth from a diversified portfolio consisting primarily of lower-rated U.S. corporate fixed-income securities.
Market Overview: The high-yield market, as measured by the Merrill Lynch High Yield Master II Index, posted a 3.51% loss during the twelve months ended March 31, 2008. By way of comparison, the high-yield market outperformed the S&P 500 Index, which fell 5.08%, but trailed the ten-year Treasury, which gained 14.39%.
Following positive high-yield returns in the spring, the convergence of several events over the summer shook up the credit markets and continued to weigh on the high-yield market for the rest of the period. Mortgage delinquencies led to rapid quality and price declines in collateralized mortgage obligations (CMOs). Price declines in the CMO market led to price declines in all collateralized debt obligations (CDOs). This, in turn, cut off demand for loans, and the lack of demand for loans ultimately put pressure on all bond prices. Despite all of the financial chaos and headlines, the fundamentals of the majority of high-yield issuers remained intact. The price change in the bonds greatly exceeded the relative change in credit statistics, and the trailing twelve-month default rate was only 1.74% at March 31, 2008.
The majority of industries within the high-yield market posted negative returns, with financials and restaurants among the worst performers. Utilities, health care and energy generated solid gains and were some of the best-performing groups.
Performance: From April 1, 2007 through March 31, 2008, the Fund’s Class I shares lost 1.06%, outperforming the Merrill Lynch High Yield Master II Index, which fell 3.51%.
Portfolio Specifics: While the Fund was not immune to the price declines seen in the market, our risk control tools had a positive impact. Maintaining our discipline regarding credit selection has once again proven to be the primary driver of our strong results versus the benchmark. Positive performers included a supplier of mobile office units that was acquired for a large premium, as well as an energy company that reported better-than-expected operating results and issued a favorable outlook for 2008. Negative performers included a media company that gave a weaker-than-expected 2008 growth forecast and a capital markets firm that was affected by the financial contagion and was sold. Our credit research was rewarded by the rating agencies during the fiscal year, as the number of upgrades in the Fund was considerably higher than the number of downgrades. The “sell-only” mindset that dominated the secondary market later in the period allowed us to add some strong credits to the portfolio. For example, we purchased a steel manufacturer with a healthy balance sheet and positive outlook.
Market Outlook: High-yield bonds now offer a compelling total return, as spreads versus Treasuries have widened and prices have been cut. While there are risks facing the market, such as continued low demand for bank loans or a prolonged recession, many high-yield issuers remain fundamentally sound. In addition, the Federal Reserve has aggressively eased monetary policy, which is beginning to favorably impact investor sentiment.
At Nicholas-Applegate, we recognize that the long-term driver of total return in a high-yield portfolio is company fundamentals. As such, we continue to build the Fund one security at a time, by performing rigorous credit analysis to identify companies that are capitalizing on change.
Comparison of Change in Value of a $250,000 Investment in U.S. High Yield Bond Fund Class I Shares with the Merrill Lynch High Yield Master II Index.
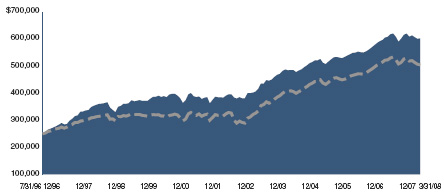

| Annualized Total Returns As of 3/31/08 | |||
1 Year | 5 Years | 10 Years | |
| U.S. High Yield Bond Fund Class I | -1.06% | 7.66% | 5.36% |
| Merrill Lynch High Yield | |||
| Master II Index | -3.51% | 8.57% | 4.89% |
The graph above shows the value of a hypothetical $250,000 investment in the Fund’s Class I shares compared with the Merrill Lynch High Yield Master II Index for the periods indicated. The Fund’s Class I shares calculate their performance based upon the historical performance of their corresponding series of Nicholas-Applegate Mutual Funds (renamed ING Mutual Funds), adjusted to reflect all fees and expenses applicable to the Fund’s Class I shares. The Nicholas-Applegate Institutional Funds’ Class I shares were first available on May 7, 1999. Average annual total return figures include changes in principal value, reinvested dividends, and capital gain distributions. The total returns shown above do not show the effects of income taxes on an individual’s investment. In most cases, taxes may reduce your actual investment returns on income or gains paid by the Fund or any gains you may realize if you sell your shares. Past performance cannot guarantee future results.
The Merrill Lynch High Yield Master II Index is an unmanaged index consisting of U.S. dollar denominated bonds that are issued in countries having a BBB3 or higher debt rating with at least one year remaining until maturity. All bonds must have a credit rating below investment grade but not in default.
The unmanaged Index differs from the Fund in composition, does not pay management fees or expenses and includes reinvested income and dividends. One cannot invest directly in an index.
Bond prices, and thus the Fund’s share price, generally move in the opposite direction from interest rates. Since markets can go down as well as up, investment return and principal value will fluctuate with market conditions. You may have a gain or loss when you sell your shares.
48
U.S. HIGH YIELD BOND FUND
SCHEDULE OF INVESTMENTS
As of March 31, 2008
Principal Amount | Value | ||||||
Corporate Bonds - 93.2% | |||||||
Advertising Sales - 1.5% | |||||||
| Lamar Media Corp. | |||||||
| 6.625%, 08/15/15 | $ | 855,000 | $ | 756,675 | |||
Aerospace/Defense-Equipment - 1.7% | |||||||
| TransDigm, Inc. | |||||||
| 7.750%, 07/15/14 | 835,000 | 839,175 | |||||
Agricultural Chemicals - 1.4% | |||||||
The Mosaic Co. 144A# | |||||||
| 7.625%, 12/01/16 | 675,000 | 729,000 | |||||
Apparel Manufacturers - 3.0% | |||||||
| Levi Strauss & Co. | |||||||
| 9.750%, 01/15/15 | 810,000 | 811,013 | |||||
| Oxford Industries, Inc. | |||||||
| 8.875%, 06/01/11 | 705,000 | 673,275 | |||||
| 1,484,288 | |||||||
Auto/Truck Parts & Equipment-Original - 4.1% | |||||||
| Accuride Corp. | |||||||
| 8.500%, 02/01/15 | 910,000 | 746,200 | |||||
| American Axle & Manufacturing, Inc. | |||||||
| 7.875%, 03/01/17 | 610,000 | 520,025 | |||||
| Tenneco, Inc. | |||||||
| 8.625%, 11/15/14 | 820,000 | 809,750 | |||||
| 2,075,975 | |||||||
Cable TV - 3.0% | |||||||
| DirecTV Holdings LLC/DirecTV | |||||||
| Financing Co. 8.375%, 03/15/13 | 870,000 | 886,312 | |||||
| Mediacom Broadband LLC | |||||||
| 8.500%, 10/15/15 | 300,000 | 253,500 | |||||
| Mediacom LLC/Mediacom | |||||||
| Capital Corp. 9.500%, 01/15/13 | 375,000 | 346,875 | |||||
| 1,486,687 | |||||||
Casino Hotels - 1.5% | |||||||
| Wynn Las Vegas Capital Corp. | |||||||
| 6.625%, 12/01/14 | 785,000 | 759,488 | |||||
Cellular Telecommunications - 3.0% | |||||||
| Centennial Cellular Operating | |||||||
| Co./Centennial Communications Corp. | |||||||
| 10.125%, 06/15/13 | 750,000 | 744,375 | |||||
| Centennial Communications Corp. | |||||||
| 10.000%, 01/01/13 | 260,000 | 243,100 | |||||
| Cricket Communications, Inc. | |||||||
| 9.375%, 11/01/14 | 560,000 | 533,400 | |||||
| 1,520,875 | |||||||
Commercial Services - 1.7% | |||||||
| ARAMARK Corp. | |||||||
| 8.500%, 02/01/15 | 835,000 | 841,262 | |||||
Commercial Services-Finance - 1.5% | |||||||
| Deluxe Corp. | |||||||
| 7.375%, 06/01/15 | 790,000 | 740,625 | |||||
Computer Services - 1.4% | |||||||
| Unisys Corp. | |||||||
| 8.000%, 10/15/12 | 835,000 | 722,275 | |||||
Consumer Products-Miscellaneous - 1.7% | |||||||
| Jarden Corp. | |||||||
| 7.500%, 05/01/17 | 970,000 | 853,600 | |||||
Containers-Metal/Glass - 1.9% | |||||||
| Crown Americas LLC/Crown | |||||||
| Americas Capital Corp. | |||||||
| 7.750%, 11/15/15 | 905,000 | 934,412 | |||||
Containers-Paper/Plastic - 1.0% | |||||||
| Smurfit-Stone Container Enterprises, Inc. | |||||||
| 8.000%, 03/15/17 | 615,000 | 519,675 | |||||
Data Processing/Management - 0.4% | |||||||
First Data Corp. 144A# | |||||||
| 9.875%, 09/24/15 | 250,000 | 205,937 | |||||
Diversified Manufacturing Operations - 2.1% | |||||||
| Harland Clarke Holdings Corp. | |||||||
| 9.500%, 05/15/15 | 880,000 | 651,200 | |||||
| Park-Ohio Industries, Inc. | |||||||
| 8.375%, 11/15/14 | 495,000 | 393,525 | |||||
| 1,044,725 | |||||||
Electric-Generation - 2.6% | |||||||
| Edison Mission Energy | |||||||
| 7.000%, 05/15/17 | 770,000 | 770,000 | |||||
| The AES Corp. | |||||||
| 9.500%, 06/01/09 | 500,000 | 518,500 | |||||
| 1,288,500 | |||||||
Electric-Integrated - 1.2% | |||||||
Energy Future Holdings Corp. 144A# | |||||||
| 10.875%, 11/01/17 | 605,000 | 614,075 | |||||
Electronic Components-Semiconductors - 0.8% | |||||||
| Amkor Technology, Inc. | |||||||
| 9.250%, 06/01/16 | 410,000 | 396,675 | |||||
Electronic Measure Instruments - 1.4% | |||||||
| Itron, Inc. | |||||||
| 7.750%, 05/15/12 | 735,000 | 709,275 | |||||
Finance-Auto Loans - 3.1% | |||||||
| Ford Motor Credit Co. LLC | |||||||
| 9.875%, 08/10/11 | 670,000 | 597,881 | |||||
| Ford Motor Credit Co. LLC | |||||||
| 7.000%, 10/01/13 | 375,000 | 292,818 | |||||
| GMAC LLC | |||||||
| 6.750%, 12/01/14 | 965,000 | 683,765 | |||||
| 1,574,464 | |||||||
Finance-Mortgage Loan/Banker - 0.5% | |||||||
| Residential Capital LLC | |||||||
| 6.375%, 06/30/10 | 495,000 | 251,213 | |||||
Independent Power Producer - 1.5% | |||||||
| NRG Energy, Inc. | |||||||
| 7.375%, 01/15/17 | 790,000 | 770,250 | |||||
Machinery-Construction & Mining - 1.0% | |||||||
| Terex Corp. | |||||||
| 7.375%, 01/15/14 | 490,000 | 487,550 | |||||
Medical-HMO - 0.4% | |||||||
| Health Net, Inc. | |||||||
| 6.375%, 06/01/17 | 215,000 | 202,906 | |||||
Medical-Hospitals - 2.6% | |||||||
| Community Health Systems, Inc. | |||||||
| 8.875%, 07/15/15 | 840,000 | 847,350 | |||||
| HCA, Inc. | |||||||
| 9.250%, 11/15/16 | 445,000 | 462,800 | |||||
| 1,310,150 | |||||||
Medical-Nursing Homes - 0.9% | |||||||
| Sun Healthcare Group, Inc. | |||||||
| 9.125%, 04/15/15 | 460,000 | 446,200 | |||||
Medical-Outpatient/Home Medical Care - 1.5% | |||||||
| Res-Care, Inc. | |||||||
| 7.750%, 10/15/13 | 770,000 | 735,350 | |||||
See Accompanying Notes to Financial Statements.
49
U.S. HIGH YIELD BOND FUND
SCHEDULE OF INVESTMENTS
As of March 31, 2008
Principal Amount | Value | ||||||
Metal-Diversified - 1.5% | |||||||
| Freeport-McMoRan Copper & Gold, Inc. | |||||||
| 8.375%, 04/01/17 | $ | 700,000 | $ | 744,625 | |||
Non-Ferrous Metals - 0.7% | |||||||
| PNA Group, Inc. | |||||||
| 10.750%, 09/01/16 | 410,000 | 358,750 | |||||
Non-Hazardous Waste Disposal - 0.4% | |||||||
| Allied Waste North America, Inc. | |||||||
| 5.750%, 02/15/11 | 230,000 | 225,975 | |||||
Oil Companies-Exploration & Production - 0.9% | |||||||
Southwestern Energy Co. 144A# | |||||||
| 7.500%, 02/01/18 | 445,000 | 462,800 | |||||
Oil Field Machinery & Equipment - 1.4% | |||||||
| Complete Production Services, Inc. | |||||||
| 8.000%, 12/15/16 | 750,000 | 723,750 | |||||
Oil-Field Services - 1.1% | |||||||
Helix Energy Solutions Group, Inc. 144A# | |||||||
| 9.500%, 01/15/16 | 545,000 | 547,725 | |||||
Paper & Related Products - 2.6% | |||||||
| Domtar Corp. | |||||||
| 7.125%, 08/15/15 | 625,000 | 592,187 | |||||
| Neenah Paper, Inc. | |||||||
| 7.375%, 11/15/14 | 790,000 | 695,200 | |||||
| 1,287,387 | |||||||
Physical Therapy/Rehabilitation Centers - 1.7% | |||||||
| Psychiatric Solutions, Inc. | |||||||
| 7.750%, 07/15/15 | 865,000 | 865,000 | |||||
Pipelines - 3.1% | |||||||
| Copano Energy LLC | |||||||
| 8.125%, 03/01/16 | 895,000 | 930,800 | |||||
| Dynegy Holdings, Inc. | |||||||
| 7.750%, 06/01/19 | 680,000 | 639,200 | |||||
| 1,570,000 | |||||||
Printing-Commercial - 1.1% | |||||||
| Cenveo Corp. | |||||||
| 7.875%, 12/01/13 | 670,000 | 546,050 | |||||
Publishing-Periodicals - 0.8% | |||||||
| RH Donnelley Corp. | |||||||
| 8.875%, 01/15/16 | 595,000 | 379,313 | |||||
Rental Auto/Equipment - 1.0% | |||||||
| The Hertz Corp. | |||||||
| 10.500%, 01/01/16 | 535,000 | 503,569 | |||||
Retail-Apparel/Shoe - 2.8% | |||||||
| Brown Shoe Co., Inc. | |||||||
| 8.750%, 05/01/12 | 555,000 | 552,225 | |||||
| Phillips-Van Heusen Corp. | |||||||
| 8.125%, 05/01/13 | 830,000 | 846,600 | |||||
| 1,398,825 | |||||||
Retail-Computer Equipment - 1.5% | |||||||
| GameStop Corp./GameStop, Inc. | |||||||
| 8.000%, 10/01/12 | 720,000 | 765,000 | |||||
Retail-Drug Store - 1.2% | |||||||
| Rite Aid Corp. | |||||||
| 7.500%, 03/01/17 | 665,000 | 601,825 | |||||
Retail-Propane Distrib - 2.8% | |||||||
| Inergy LP/Inergy Finance Corp. | |||||||
| 8.250%, 03/01/16 | 845,000 | 868,238 | |||||
| Star Gas Partners LP/Star Gas Finance Co. | |||||||
| 10.250%, 02/15/13 | 525,000 | 527,625 | |||||
| 1,395,863 | |||||||
Retail-Regional Department Stores - 1.4% | |||||||
| Neiman-Marcus Group, Inc. | |||||||
| 10.375%, 10/15/15 | $ | 705,000 | 708,525 | ||||
Special Purpose Entity - 4.4% | |||||||
| AMR HoldCo, Inc./EmCare HoldCo, Inc. | |||||||
| 10.000%, 02/15/15 | 810,000 | 864,675 | |||||
| Hughes Network Systems LLC/HNS | |||||||
| Finance Corp. 9.500%, 04/15/14 | 740,000 | 740,000 | |||||
| KAR Holdings, Inc. | |||||||
| 8.750%, 05/01/14 | 300,000 | 268,500 | |||||
| MedCath Holdings Corp. | |||||||
| 9.875%, 07/15/12 | 338,000 | 354,900 | |||||
| 2,228,075 | |||||||
Steel-Producers - 2.3% | |||||||
| AK Steel Corp. | |||||||
| 7.750%, 06/15/12 | 240,000 | 243,300 | |||||
Steel Dynamics, Inc. 144A# | |||||||
| 7.375%, 11/01/12 | 895,000 | 908,425 | |||||
| 1,151,725 | |||||||
Telecommunications Services - 4.7% | |||||||
| MasTec, Inc. | |||||||
| 7.625%, 02/01/17 | 1,155,000 | 1,010,625 | |||||
| Time Warner Telecom Holdings, Inc. | |||||||
| 9.250%, 02/15/14 | 625,000 | 634,375 | |||||
| West Corp. | |||||||
| 11.000%, 10/15/16 | 860,000 | 731,000 | |||||
| 2,376,000 | |||||||
Telephone-Integrated - 3.8% | |||||||
| Cincinnati Bell, Inc. | |||||||
| 8.375%, 01/15/14 | 880,000 | 829,400 | |||||
| Qwest Capital Funding, Inc. | |||||||
| 7.250%, 02/15/11 | 815,000 | 778,325 | |||||
| Windstream Corp. | |||||||
| 8.625%, 08/01/16 | 320,000 | 316,000 | |||||
| 1,923,725 | |||||||
Wire & Cable Products - 2.9% | |||||||
| Anixter, Inc. | |||||||
| 5.950%, 03/01/15 | 750,000 | 665,685 | |||||
| General Cable Corp. | |||||||
| 7.125%, 04/01/17 | 815,000 | 782,400 | |||||
| 1,448,085 | |||||||
Wireless Equipment - 0.7% | |||||||
American Tower Corp. 144A# | |||||||
| 7.000%, 10/15/17 | 345,000 | 346,725 | |||||
| Total US Corporate Bonds (Cost: $49,050,400) | 46,860,599 | ||||||
Foreign Corporate Bonds - 3.3% | |||||||
Cellular Telecommunications - 1.8% | |||||||
| Rogers Wireless, Inc. | |||||||
| 8.000%, 12/15/12 | 235,000 | 244,400 | |||||
| Millicom International Cellular SA | |||||||
| 10.000%, 12/01/13 | 605,000 | 644,325 | |||||
| 888,725 | |||||||
Electronic Components-Miscellaneous - 0.6% | |||||||
| Flextronics International, Ltd. | |||||||
| 6.250%, 11/15/14 | 350,000 | 323,750 | |||||
Oil Companies-Exploration & Production - 0.9% | |||||||
| OPTI Canada, Inc. | |||||||
| 8.250%, 12/15/14 | 450,000 | 447,750 | |||||
| Total Foreign Corporate Bonds (Cost: $1,628,728) | 1,660,225 | ||||||
See Accompanying Notes to Financial Statements.
50
SCHEDULE OF INVESTMENTS
As of March 31, 2008
Principal Amount | Value | ||||||
Short Term Investments - 1.9% | |||||||
Time Deposit - 1.9% | |||||||
| Wachovia Bank London | |||||||
| 1.700%, 04/01/08 (Cost: $930,104) | $ | 930,104 | $ | 930,104 | |||
| Total Investments - 98.4% (Cost: $51,609,232) | 49,450,928 | ||||||
| Other Assets in Excess of Liabilities - 1.6% | 819,786 | ||||||
| Net Assets - 100.0% | $ | 50,270,714 | |||||
| # | 144A Security. Certain condition for public sale may exist. The total market value of 144A securities owned at March 31, 2008 was $3,814,687 or 7.59% of net assets |
SCHEDULE OF INVESTMENTS BY SECTOR
as of March 31, 2008
| Sector | Percent of Net Assets | |||
| Communications | 20.6 | % | ||
| Consumer, Cyclical | 18.3 | |||
| Consumer, Non-cyclical | 14.0 | |||
| Industrial | 11.7 | |||
| Basic Materials | 8.5 | |||
| Financial | 8.0 | |||
| Energy | 7.5 | |||
| Utilities | 5.3 | |||
| Technology | 2.6 | |||
| Short Term Investments | 1.9 | |||
| Total Investments | 98.4 | |||
| Other assets in excess of liabilities | 1.6 | |||
| Net Assets | 100.0 | % | ||
See Accompanying Notes to Financial Statements.
51
NICHOLAS-APPLEGATE INSTITUTIONAL FUNDS
FINANCIAL HIGHLIGHTS
For a Class I share outstanding during the period indicated
| Distributions from: | |||||||||||||||||||||||||
Net Asset Value, Beginning | Net Investment Income (Loss) (1) | Net Realized and Unrealized Gains (Loss) | Total from Investment Operations | Net Investment Income | Net Realized Capital Gains | Total Distributions | Net Asset Value, Ending | ||||||||||||||||||
U.S. EQUITY FUNDS | |||||||||||||||||||||||||
U.S. MICRO CAP | |||||||||||||||||||||||||
For the year ended 03/31/08 | $ | 15.33 | $ | (0.18 | ) | $ | (1.49 | ) | $ | (1.67 | ) | $ | — | $ | (2.06 | ) | $ | (2.06 | ) | $ | 11.60 | ||||
For the year ended 03/31/07 | 17.43 | (0.12 | ) | (0.19 | ) | (0.31 | ) | — | (1.79 | ) | (1.79 | ) | 15.33 | ||||||||||||
For the year ended 03/31/06 | 12.83 | (0.11 | ) | 5.06 | 4.95 | — | (0.35 | ) | (0.35 | ) | 17.43 | ||||||||||||||
For the year ended 03/31/05 | 14.69 | (0.09 | ) | (1.09 | ) | (1.18 | ) | — | (0.68 | ) | (0.68 | ) | 12.83 | ||||||||||||
For the year ended 03/31/04 | 7.44 | (0.13 | ) | 7.38 | 7.25 | — | — | — | 14.69 | ||||||||||||||||
U.S. EMERGING GROWTH | |||||||||||||||||||||||||
For the year ended 03/31/08 | $ | 13.09 | $ | (0.06 | ) | $ | (0.70) | (5) | $ | (0.76 | ) | $ | — | $ | (0.88 | ) | $ | (0.88 | ) | $ | 11.45 | ||||
For the year ended 03/31/07 | 13.90 | (0.07 | ) | 0.19 | (6) | 0.12 | — | (0.93 | ) | (0.93 | ) | 13.09 | |||||||||||||
For the year ended 03/31/06 | 9.77 | (0.11 | ) | 4.25 | 4.14 | — | (0.01 | ) | (0.01 | ) | 13.90 | ||||||||||||||
For the year ended 03/31/05 | 9.61 | (0.07 | ) | 0.23 | 0.16 | — | — | — | 9.77 | ||||||||||||||||
For the year ended 03/31/04 | 6.32 | (0.09 | ) | 3.38 | 3.29 | — | — | — | 9.61 | ||||||||||||||||
U.S. ULTRA MICRO CAP | |||||||||||||||||||||||||
1/28/08 (Commenced) to 03/31/08 | $ | 10.00 | $ | (0.03 | ) | $ | (0.69 | ) | $ | (0.72 | ) | $ | — | $ | — | $ | — | $ | 9.28 | ||||||
U.S. SYSTEMATIC LARGE CAP GROWTH | |||||||||||||||||||||||||
For the year ended 03/31/08 | $ | 19.77 | $ | (0.02 | ) | $ | (0.36) | (5) | $ | (0.38 | ) | $ | — | $ | — | $ | — | $ | 19.39 | ||||||
For the year ended 03/31/07 | 17.86 | 0.02 | 1.89 | 1.91 | — | — | — | 19.77 | |||||||||||||||||
For the year ended 03/31/06 | 15.67 | 0.03 | 2.16 | 2.19 | — | — | — | 17.86 | |||||||||||||||||
For the year ended 03/31/05 | 15.06 | 0.07 | 0.54 | 0.61 | — | — | — | 15.67 | |||||||||||||||||
For the year ended 03/31/04 | 12.73 | (0.02 | ) | 2.35 | 2.33 | — | — | — | 15.06 | ||||||||||||||||
U.S. SMALL TO MID CAP GROWTH | |||||||||||||||||||||||||
7/31/07 (Commenced) to 03/31/08 | $ | 10.00 | $ | (0.03 | ) | $ | (0.95 | ) | $ | (0.98 | ) | $ | — | $ | — | $ | — | $ | 9.02 | ||||||
U.S. CONVERTIBLE | |||||||||||||||||||||||||
For the year ended 03/31/08 | $ | 24.35 | $ | 0.37 | $ | 0.58 | $ | 0.95 | $ | (0.32 | ) | $ | (0.10 | ) | $ | (0.42 | ) | $ | 24.88 | ||||||
For the year ended 03/31/07 | 24.57 | 0.45 | 2.03 | 2.48 | (0.47 | ) | (2.23 | ) | (2.70 | ) | 24.35 | ||||||||||||||
For the year ended 03/31/06 | 22.44 | 0.27 | 3.45 | 3.72 | (0.55 | ) | (1.04 | ) | (1.59 | ) | 24.57 | ||||||||||||||
For the year ended 03/31/05 | 23.11 | 0.39 | 0.66 | 1.05 | (0.45 | ) | (1.27 | ) | (1.72 | ) | 22.44 | ||||||||||||||
For the year ended 03/31/04 | 17.72 | 0.55 | 5.43 | 5.98 | (0.59 | ) | — | (0.59 | ) | 23.11 | |||||||||||||||
| Ratios to Average Net Assets (3) | |||||||||||||||||||||||||
| Total Return (2) | Net Assets, Ending (in 000’s) | Net Investment Income (Loss) | Total Expenses | Expense (Reimbursements)/ Recoupment | Expenses Net of Reimbursement/ Recoupment | Expenses Net of Reimbursement/ Recoupment Offset (4) | Fund’s Portfolio Turnover Rate | ||||||||||||||||||
U.S. EQUITY FUNDS | |||||||||||||||||||||||||
U.S. MICRO CAP | |||||||||||||||||||||||||
For the year ended 03/31/08 | (13.25 | %) | $ | 60,122 | (1.19 | %) | 1.58 | % | — | 1.58 | % | 1.38 | % | 139 | % | ||||||||||
For the year ended 03/31/07 | (1.35 | %) | 84,405 | (0.75 | %) | 1.58 | % | — | 1.58 | % | 1.19 | % | 165 | % | |||||||||||
For the year ended 03/31/06 | 39.04 | % | 78,058 | (0.78 | %) | 1.64 | % | (0.07 | %) | 1.57 | % | 1.10 | % | 180 | % | ||||||||||
For the year ended 03/31/05 | (8.17 | %) | 69,246 | (0.72 | %) | 1.63 | % | (0.07 | %) | 1.56 | % | 1.12 | % | 266 | % | ||||||||||
For the year ended 03/31/04 | 97.45 | % | 68,876 | (1.08 | %) | 1.64 | % | (0.07 | %) | 1.57 | % | 1.19 | % | 298 | % | ||||||||||
U.S. EMERGING GROWTH | |||||||||||||||||||||||||
For the year ended 03/31/08 | (7.01 | %) | $ | 7,499 | (0.46 | %) | 1.21 | % | — | 1.21 | % | 0.72 | % | 129 | % | ||||||||||
For the year ended 03/31/07 | 1.30 | % | 7,409 | (0.54 | %) | 1.21 | % | — | 1.21 | % | 0.72 | % | 148 | % | |||||||||||
For the year ended 03/31/06 | 42.38 | % | 6,721 | (1.04 | %) | 1.89 | % | (0.39 | %) | 1.50 | % | 1.17 | % | 128 | % | ||||||||||
For the year ended 03/31/05 | 1.66 | % | 12,043 | (0.75 | %) | 1.63 | % | (0.17 | %) | 1.46 | % | 1.06 | % | 142 | % | ||||||||||
For the year ended 03/31/04 | 52.06 | % | 32,095 | (1.04 | %) | 1.48 | % | (0.00 | %) | 1.48 | % | 1.26 | % | 166 | % | ||||||||||
U.S. ULTRA MICRO CAP | |||||||||||||||||||||||||
1/28/08 (Commenced) to 03/31/08 | (7.20 | %)(7) | $ | 886 | (2.10 | %) | 2.31 | % | — | 2.31 | % | 2.15 | % | 19 | % | ||||||||||
U.S. SYSTEMATIC LARGE CAP GROWTH | |||||||||||||||||||||||||
For the year ended 03/31/08 | (1.92 | %) | $ | 791 | (0.10 | %) | 1.14 | % | — | 1.14 | % | 1.10 | % | 106 | % | ||||||||||
For the year ended 03/31/07 | 10.69 | % | 945 | (0.09 | %) | 1.13 | % | — | 1.13 | % | 1.05 | % | 100 | % | |||||||||||
For the year ended 03/31/06 | 13.98 | % | 667 | 0.19 | % | 1.67 | % | (0.53 | %) | 1.14 | % | 1.04 | % | 147 | % | ||||||||||
For the year ended 03/31/05 | 4.05 | % | 780 | 0.45 | % | 1.66 | % | (0.54 | %) | 1.12 | % | 1.00 | % | 197 | % | ||||||||||
For the year ended 03/31/04 | 18.30 | % | 3,518 | (0.16 | %) | 1.33 | % | (0.20 | %) | 1.13 | % | 0.93 | % | 172 | % | ||||||||||
U.S. SMALL TO MID CAP GROWTH | |||||||||||||||||||||||||
7/31/07 (Commenced) to 03/31/08 | (9.80 | %)(7) | $ | 4,862 | (0.50 | %) | 0.95 | % | — | 0.95 | % | 0.80 | % | 105 | % | ||||||||||
U.S. CONVERTIBLE | |||||||||||||||||||||||||
For the year ended 03/31/08 | 3.84 | % | $ | 47,773 | 1.45 | % | 1.03 | % | — | 1.03 | % | 0.89 | % | 98 | % | ||||||||||
For the year ended 03/31/07 | 10.79 | % | 39,022 | 1.89 | % | 1.02 | % | — | 1.02 | % | 0.85 | % | 92 | % | |||||||||||
For the year ended 03/31/06 | 17.15 | % | 31,627 | 1.02 | % | 1.14 | % | (0.11 | %) | 1.03 | % | 0.87 | % | 92 | % | ||||||||||
For the year ended 03/31/05 | 4.62 | % | 35,397 | 1.68 | % | 1.10 | % | (0.08 | %) | 1.02 | % | 0.85 | % | 102 | % | ||||||||||
For the year ended 03/31/04 | 34.15 | % | 50,103 | 2.57 | % | 1.10 | % | (0.06 | %) | 1.04 | % | 1.00 | % | 103 | % | ||||||||||
| (1) | Net investment income per share is calculated by dividing net investment income for the period by the average shares outstanding during the period. |
| (2) | Total returns are not annualized for periods less than one year. |
| (3) | Ratios are annualized for periods of less than one year. Expense reimbursements reflect voluntary reductions to total expenses. Such amounts would increase net investment income (loss) ratios had such reductions not occurred. |
| (4) | Net expenses include certain items not subject to expense reimbursement for periods prior to January 23, 2006. |
| (5) | Includes litigation proceeds of approximately $0.07 per share for the U.S. Emerging Growth Fund and $0.09 per share for the U.S. Systematic Large Cap Growth Fund. |
| (6) | The fund received $28,454 from a security litigation settlement during the year which is reflected in realized gains. This event had a $0.05 per share impact to the fund. |
| (7) | Inception to date Return. |
See Accompanying Notes to Financial Statements.
52 & 53
NICHOLAS-APPLEGATE INSTITUTIONAL FUNDS
FINANCIAL HIGHLIGHTS
| Distributions from: | |||||||||||||||||||||||||
Net Asset Value, Beginning | Net Investment Income (Loss) (1) | Net Realized and Unrealized Gains (Loss) | Total from Investment Operations | Net Investment Income | Net Realized Capital Gains | Total Distributions | Net Asset Value, Ending | ||||||||||||||||||
GLOBAL EQUITY FUNDS | |||||||||||||||||||||||||
GLOBAL SELECT | |||||||||||||||||||||||||
For the year ended 03/31/08 | $ | 18.60 | $ | 0.11 | $ | 0.92 | $ | 1.03 | $ | (0.28 | ) | $ | (6.69 | ) | $ | (6.98 | ) | $ | 12.65 | ||||||
For the year ended 03/31/07 | 18.96 | 0.06 | 1.85 | 1.91 | — | (2.27 | ) | (2.27 | ) | 18.60 | |||||||||||||||
For the year ended 03/31/06 | 16.09 | 0.03 | 3.97 | 4.00 | (0.03 | ) | (1.10 | ) | (1.13 | ) | 18.96 | ||||||||||||||
For the year ended 03/31/05 | 15.58 | 0.06 | 1.37 | 1.43 | — | (0.92 | ) | (0.92 | ) | 16.09 | |||||||||||||||
For the year ended 03/31/04 | 10.26 | (0.01 | ) | 5.33 | 5.32 | — | — | — | 15.58 | ||||||||||||||||
INTERNATIONAL GROWTH | |||||||||||||||||||||||||
For the year ended 03/31/08 | $ | 22.35 | $ | 0.17 | $ | 3.82 | $ | 3.99 | $ | (0.29 | ) | $ | (17.59 | ) | $ | (17.88 | ) | $ | 8.46 | ||||||
For the year ended 03/31/07 | 22.69 | 0.07 | 2.86 | 2.93 | (0.07 | ) | (3.20 | ) | (3.27 | ) | 22.35 | ||||||||||||||
For the year ended 03/31/06 | 20.47 | 0.16 | 6.05 | 6.21 | — | (3.99 | ) | (3.99 | ) | 22.69 | |||||||||||||||
For the year ended 03/31/05 | 19.09 | 0.08 | 1.72 | 1.80 | — | (0.42 | ) | (0.42 | ) | 20.47 | |||||||||||||||
For the year ended 03/31/04 | 12.83 | 0.30 | 6.00 | 6.30 | (0.04 | ) | — | (0.04 | ) | 19.09 | |||||||||||||||
INTERNATIONAL GROWTH OPPORTUNITIES | |||||||||||||||||||||||||
For the year ended 03/31/08 | $ | 57.36 | $ | 0.14 | $ | 3.43 | $ | 3.57 | $ | (1.26 | ) | $ | (19.56 | ) | $ | (20.83 | ) | $ | 40.10 | ||||||
For the year ended 03/31/07 | 49.86 | 0.05 | 9.07 | 9.12 | — | (1.62 | ) | (1.62 | ) | 57.36 | |||||||||||||||
For the year ended 03/31/06 | 35.01 | (0.01 | ) | 15.10 | 15.09 | (0.24 | ) | — | (0.24 | ) | 49.86 | ||||||||||||||
For the year ended 03/31/05 | 29.43 | 0.32 | 5.35 | 5.67 | (0.09 | ) | — | (0.09 | ) | 35.01 | |||||||||||||||
For the year ended 03/31/04 | 17.39 | 0.18 | 11.86 | 12.04 | — | — | — | 29.43 | |||||||||||||||||
EMERGING MARKETS | |||||||||||||||||||||||||
For the year ended 03/31/08 | $ | 12.79 | $ | 0.19 | $ | 2.80 | $ | 2.99 | $ | (0.10 | ) | $ | (2.16 | ) | $ | (2.26 | ) | $ | 13.52 | ||||||
8/21/06 (Commenced) to 03/31/07 | 10.00 | 0.02 | 2.84 | 2.86 | (0.07 | ) | — | (0.07 | ) | 12.79 | |||||||||||||||
INTERNATIONAL SYSTEMATIC | |||||||||||||||||||||||||
For the year ended 03/31/08 | $ | 16.02 | $ | 0.16 | $ | (1.64 | ) | $ | (1.48 | ) | $ | (0.20 | ) | $ | (0.77 | ) | $ | (0.97 | ) | $ | 13.57 | ||||
For the year ended 03/31/07 | 13.70 | 0.09 | 2.50 | 2.59 | (0.02 | ) | (0.25 | ) | (0.27 | ) | 16.02 | ||||||||||||||
7/06/05 (Commenced) to 03/31/06 | 10.00 | 0.06 | 3.81 | 3.87 | (0.01 | ) | (0.16 | ) | (0.17 | ) | 13.70 | ||||||||||||||
INTERNATIONAL ALL CAP GROWTH | |||||||||||||||||||||||||
For the year ended 03/31/08 | $ | 14.41 | $ | 0.19 | $ | 2.02 | $ | 2.21 | $ | (0.76 | ) | $ | (3.85 | ) | $ | (4.61 | ) | $ | 12.01 | ||||||
For the year ended 03/31/07 | 13.00 | 0.07 | 1.93 | 2.00 | (0.08 | ) | (0.51 | ) | (0.59 | ) | 14.41 | ||||||||||||||
For the year ended 03/31/06 | 9.08 | 0.01 | 3.92 | 3.93 | (0.01 | ) | — | (0.01 | ) | 13.00 | |||||||||||||||
For the year ended 03/31/05 | 8.19 | 0.01 | 0.92 | 0.93 | — | (0.04 | ) | (0.04 | ) | 9.08 | |||||||||||||||
For the year ended 03/31/04 | 4.84 | (0.01 | ) | 3.36 | 3.35 | — | — | — | 8.19 | ||||||||||||||||
FIXED INCOME FUNDS | |||||||||||||||||||||||||
U.S. HIGH YIELD BOND | |||||||||||||||||||||||||
For the year ended 03/31/08 | $ | 10.27 | $ | 0.76 | $ | (0.86 | ) | $ | (0.10 | ) | $ | (0.81 | ) | $ | — | $ | (0.81 | ) | $ | 9.36 | |||||
For the year ended 03/31/07 | 10.00 | 0.73 | 0.30 | 1.03 | (0.76 | ) | — | (0.76 | ) | 10.27 | |||||||||||||||
For the year ended 03/31/06 | 10.04 | 0.70 | 0.02 | 0.72 | (0.76 | ) | — | (0.76 | ) | 10.00 | |||||||||||||||
For the year ended 03/31/05 | 10.34 | 0.85 | (0.31 | ) | 0.54 | (0.84 | ) | (0.00) | (6) | (0.84 | ) | 10.04 | |||||||||||||
For the year ended 03/31/04 | 9.65 | 0.86 | 0.63 | 1.49 | (0.80 | ) | — | (0.80 | ) | 10.34 | |||||||||||||||
| Ratios to Average Net Assets (3) | |||||||||||||||||||||||||
Total Return (2) | Net Assets, Ending (in 000’s) | Net Investment Income (Loss) | Total Expenses | Expense (Reimbursements)/ Recoupment | Expenses Net of Reimbursement/ Recoupment | Expenses Net of Reimbursement/ Recoupment Offset (4) | Fund’s Portfolio Turnover Rate | ||||||||||||||||||
GLOBAL EQUITY FUNDS | |||||||||||||||||||||||||
GLOBAL SELECT | |||||||||||||||||||||||||
For the year ended 03/31/08 | 1.34 | % | $ | 32,669 | 0.60 | % | 1.18 | % | — | 1.18 | % | 1.03 | % | 80 | % | ||||||||||
For the year ended 03/31/07 | 10.64 | % | 78,550 | (0.35 | %) | 1.16 | % | — | 1.16 | % | 1.00 | % | 105 | % | |||||||||||
For the year ended 03/31/06 | 25.76 | % | 77,225 | 0.16 | % | 1.13 | % | (0.00 | %) | 1.13 | % | 0.88 | % | 139 | % | ||||||||||
For the year ended 03/31/05 | 9.27 | % | 66,115 | 0.41 | % | 1.15 | % | (0.01 | %) | 1.14 | % | 0.95 | % | 164 | % | ||||||||||
For the year ended 03/31/04 | 51.85 | % | 78,327 | (0.05 | %) | 1.28 | % | (0.10 | %) | 1.18 | % | 1.01 | % | 226 | % | ||||||||||
INTERNATIONAL GROWTH | |||||||||||||||||||||||||
For the year ended 03/31/08 | 11.37 | % | $ | 9,496 | 1.02 | % | 1.38 | % | — | 1.38 | % | 0.99 | % | 113 | % | ||||||||||
For the year ended 03/31/07 | 13.80 | % | 15,000 | (0.30 | %) | 1.41 | % | — | 1.41 | % | 1.14 | % | 119 | % | |||||||||||
For the year ended 03/31/06 | 33.63 | % | 45,889 | 0.73 | % | 1.37 | % | (0.00 | %) | 1.37 | % | 0.99 | % | 167 | % | ||||||||||
For the year ended 03/31/05 | 9.49 | % | 41,394 | 0.42 | % | 1.39 | % | (0.00 | %) | 1.39 | % | 1.08 | % | 203 | % | ||||||||||
For the year ended 03/31/04 | 49.17 | % | 51,450 | 1.35 | % | 1.49 | % | (0.04 | %) | 1.45 | % | 1.19 | % | 186 | % | ||||||||||
INTERNATIONAL GROWTH OPPORTUNITIES | |||||||||||||||||||||||||
For the year ended 03/31/08 | 2.74 | % | $ | 113,239 | 0.26 | % | 1.44 | % | — | 1.44 | % | 1.13 | % | 86 | % | ||||||||||
For the year ended 03/31/07 | 18.71 | % | 104,003 | 0.09 | % | 1.43 | % | — | 1.43 | % | 1.18 | % | 127 | % | |||||||||||
For the year ended 03/31/06 | 43.34 | % | 107,749 | (0.02 | %) | 1.38 | % | (0.00 | %) | 1.38 | % | 1.07 | % | 168 | % | ||||||||||
For the year ended 03/31/05 | 19.28 | % | 55,462 | 1.05 | % | 1.42 | % | (0.00 | %) | 1.42 | % | 1.11 | % | 110 | % | ||||||||||
For the year ended 03/31/04 | 69.24 | % | 54,015 | 0.74 | % | 1.47 | % | (0.00 | %) | 1.47 | % | 1.28 | % | 124 | % | ||||||||||
EMERGING MARKETS | |||||||||||||||||||||||||
For the year ended 03/31/08 | 21.19 | % | $ | 2,491 | 1.32 | % | 1.45 | % | — | 1.45 | % | 1.16 | % | 183 | % | ||||||||||
8/21/06 (Commenced) to 03/31/07 | 28.65% | (5) | 94 | (0.23 | %) | 1.63 | % | — | 1.63 | % | 1.52 | % | 22 | % | |||||||||||
INTERNATIONAL SYSTEMATIC | |||||||||||||||||||||||||
For the year ended 03/31/08 | (9.87 | %) | $ | 24,534 | 1.13 | % | 1.04 | % | — | 1.04 | % | 0.74 | % | 202 | % | ||||||||||
For the year ended 03/31/07 | 19.04 | % | 4,623 | (0.70 | %) | 0.93% | (8) | — | 0.93 | % | 0.70 | % | 210 | % | |||||||||||
7/06/05 (Commenced) to 03/31/06 | 38.92% | (5) | 4,662 | 0.78 | % | 2.94 | % | (1.69 | %) | 1.25 | % | 1.11 | % | 103 | % | ||||||||||
INTERNATIONAL ALL CAP GROWTH | |||||||||||||||||||||||||
For the year ended 03/31/08 | 12.58 | % | $ | 7,340 | 1.09 | % | 1.16 | % | — | 1.16 | % | 0.90 | % | 113 | % | ||||||||||
For the year ended 03/31/07 | 15.75 | % | 23,827 | 0.49 | % | 1.18 | % | — | 1.18 | % | 1.04 | % | 118 | % | |||||||||||
For the year ended 03/31/06 | 43.28 | % | 20,562 | 0.08 | % | 1.89 | % | (0.47 | %) | 1.42 | % | 1.39 | % | 196 | % | ||||||||||
For the year ended 03/31/05 | 11.34 | % | 33,900 | (0.42 | %) | 2.07 | % | (0.59 | %) | 1.48 | % | 1.48 | % | 166 | % | ||||||||||
For the year ended 03/31/04 | 69.21 | % | 28,700 | (0.87 | %) | 2.25 | % | (0.77 | %) | 1.48 | % | 1.48 | % | 153 | % | ||||||||||
FIXED INCOME FUNDS | |||||||||||||||||||||||||
U.S. HIGH YIELD BOND | |||||||||||||||||||||||||
For the year ended 03/31/08 | (1.06 | %) | $ | 50,271 | 7.66 | % | 0.63 | % | — | 0.63 | % | 0.57 | % | 81 | % | ||||||||||
For the year ended 03/31/07 | 10.76 | % | 63,925 | 7.21 | % | 0.64 | % | — | 0.64 | % | 0.52% | (7) | 92 | % | |||||||||||
For the year ended 03/31/06 | 7.40 | % | 81,187 | 6.70 | % | 0.82 | % | (0.18 | %) | 0.64 | % | 0.56 | % | 112 | % | ||||||||||
For the year ended 03/31/05 | 5.40 | % | 131,677 | 7.82 | % | 0.82 | % | (0.19 | %) | 0.63 | % | 0.60 | % | 123 | % | ||||||||||
For the year ended 03/31/04 | 16.67 | % | 102,110 | 8.43 | % | 0.87 | % | (0.23 | %) | 0.64 | % | 0.61 | % | 134 | % | ||||||||||
| (1) | Net investment income per share is calculated by dividing net investment income for the period by the average shares outstanding during the period. |
| (2) | Total returns are not annualized for periods less than one year. |
| (3) | Ratios are annualized for periods of less than one year. Expense reimbursements reflect voluntary reductions to total expenses, as discussed in the notes to financial statements. Such amounts would increase net investment income (loss) ratios had such reductions not occurred. |
| (4) | Net expenses include certain items not subject to expense reimbursement for periods prior to January 23, 2006. |
| (5) | Inception to date Return. |
| (6) | Less than one penny per share. |
| (7) | For the year ended March 31, 2007 ratios do not include one time expense credit. Had this credit been included, the expense ratios would have been decreased by 0.07%. |
| (8) | For the period from 11/28/06 to 12/21/06 the unitary fees for International Systematic Fund Class I were reduced from 0.48% to 0.23%. The Unitary fees were resumed to 0.48% through March 31, 2007. |
See Accompanying Notes to Financial Statements.
54 & 55
NICHOLAS-APPLEGATE INSTITUTIONAL FUNDS
FINANCIAL HIGHLIGHTS
For a Class II share outstanding during the period indicated
| Distributions from: | |||||||||||||||||||||||||
Net Asset Value, Beginning | Net Investment Income (Loss) (1) | Net Realized and Unrealized Gains (Loss) | Total from Investment Operations | Net Investment Income | Net Realized Capital Gains | Total Distributions | Net Asset Value, Ending | ||||||||||||||||||
U.S. EQUITY FUNDS | |||||||||||||||||||||||||
U.S. SYSTEMATIC LARGE CAP GROWTH | |||||||||||||||||||||||||
For the year ended 03/31/08 | $ | 19.67 | $ | 0.01 | (5) | $ | (0.28 | ) | $ | (0.27 | ) | $ | (0.03 | ) | $ | — | $ | (0.03 | ) | $ | 19.29 | ||||
For the year ended 03/31/07 | 17.75 | 0.05 | 1.87 | 1.92 | 0.00 | (7) | — | — | 19.67 | ||||||||||||||||
09/30/05 (Commenced) to 03/31/06 | 16.35 | 0.02 | 1.51 | 1.53 | (0.13 | ) | — | (0.13 | ) | 17.75 | |||||||||||||||
U.S. CONVERTIBLE | |||||||||||||||||||||||||
For the year ended 03/31/08 | $ | 24.36 | $ | 0.41 | $ | 0.56 | $ | 0.97 | $ | (0.35 | ) | $ | (0.10 | ) | $ | (0.45 | ) | $ | 24.88 | ||||||
For the year ended 03/31/07 | 24.58 | 0.47 | 2.04 | 2.51 | (0.50 | ) | (2.23 | ) | (2.73 | ) | 24.36 | ||||||||||||||
09/30/05 (Commenced) to 03/31/06 | 23.97 | 0.30 | 1.63 | 1.93 | (0.28 | ) | (1.04 | ) | (1.32 | ) | 24.58 | ||||||||||||||
GLOBAL FUNDS | |||||||||||||||||||||||||
GLOBAL SELECT | |||||||||||||||||||||||||
For the year ended 03/31/08 | $ | 18.61 | $ | 0.14 | $ | 6.87 | $ | 7.01 | $ | (0.00) | (7) | $ | (6.69 | ) | $ | (6.69 | ) | $ | 12.92 | ||||||
For the year ended 03/31/07 | 18.97 | 0.08 | 1.84 | 1.92 | (0.01 | ) | (2.27 | ) | (2.28 | ) | 18.61 | ||||||||||||||
For the year ended 03/31/06 | 16.09 | 0.04 | 3.98 | 4.02 | (0.04 | ) | (1.10 | ) | (1.14 | ) | 18.97 | ||||||||||||||
For the year ended 03/31/05 | 15.58 | 0.07 | 1.36 | 1.43 | — | (0.92 | ) | (0.92 | ) | 16.09 | |||||||||||||||
6/30/03 (Commenced) to 03/31/04 | 12.12 | (0.01 | ) | 3.47 | 3.46 | — | — | — | 15.58 | ||||||||||||||||
INTERNATIONAL GROWTH | |||||||||||||||||||||||||
For the year ended 03/31/08 | $ | 22.36 | $ | 0.33 | $ | 3.24 | $ | 3.57 | $ | (0.63 | ) | $ | (17.59 | ) | $ | (18.22 | ) | $ | 7.71 | ||||||
For the year ended 03/31/07 | 22.71 | 0.14 | 2.86 | 3.00 | (0.15 | ) | (3.20 | ) | (3.35 | ) | 22.36 | ||||||||||||||
1/23/06 (Commenced) to 03/31/06 | 21.64 | 1.85 | (0.78 | ) | 1.07 | — | — | — | 22.71 | ||||||||||||||||
INTERNATIONAL GROWTH OPPORTUNITIES | |||||||||||||||||||||||||
For the year ended 03/31/08 | $ | 57.63 | $ | 0.39 | $ | 3.17 | $ | 3.56 | $ | (0.35 | ) | $ | (19.56 | ) | $ | (19.91 | ) | $ | 41.28 | ||||||
For the year ended 03/31/07 | 50.01 | 0.02 | 9.22 | 9.24 | — | (1.62 | ) | (1.62 | ) | 57.63 | |||||||||||||||
For the year ended 03/31/06 | 35.02 | 0.13 | 15.06 | 15.19 | (0.20 | ) | — | (0.20 | ) | 50.01 | |||||||||||||||
For the year ended 03/31/05 | 29.47 | 0.38 | 5.32 | 5.70 | (0.15 | ) | — | (0.15 | ) | 35.02 | |||||||||||||||
6/05/03 (Commenced) to 03/31/04 | 20.85 | 0.14 | 8.48 | 8.62 | — | — | — | 29.47 | |||||||||||||||||
EMERGING MARKETS | |||||||||||||||||||||||||
For the year ended 03/31/08 | $ | 12.78 | $ | 0.11 | $ | 2.90 | $ | 3.01 | $ | (0.09 | ) | $ | (2.16 | ) | $ | (2.25 | ) | $ | 13.54 | ||||||
03/27/07 (Commenced) to 03/31/07 | 12.61 | 0.00 | (6) | 0.17 | 0.17 | — | — | — | 12.78 | ||||||||||||||||
INTERNATIONAL SYSTEMATIC | |||||||||||||||||||||||||
For the year ended 03/31/08 | $ | 16.00 | $ | 0.06 | $ | (1.51 | ) | $ | (1.45 | ) | $ | (0.19 | ) | $ | (0.77 | ) | $ | (0.96 | ) | $ | 13.59 | ||||
12/22/06 (Commenced) to 03/31/07 | 15.48 | 0.07 | 0.45 | 0.52 | — | — | — | 16.00 | |||||||||||||||||
| Ratios to Average Net Assets (3) | |||||||||||||||||||||||||
| Total Return (2) | Net Assets, Ending (in 000’s) | Net Investment Income (Loss) | Total Expenses | Expense (Reimbursements)/ Recoupment | Expenses Net of Reimbursement/ Recoupment | Expenses Net of Reimbursement/ Recoupment Offset (4) | Fund’s Portfolio Turnover Rate | ||||||||||||||||||
U.S. EQUITY FUNDS | |||||||||||||||||||||||||
U.S. SYSTEMATIC LARGE CAP GROWTH | |||||||||||||||||||||||||
For the year ended 03/31/08 | (1.81 | %) | $ | 10,594 | 0.05 | % | 0.99 | % | — | 0.99 | % | 0.96 | % | 106 | % | ||||||||||
For the year ended 03/31/07 | 10.83 | % | 10,040 | 0.28 | % | 0.98 | % | — | 0.98 | % | 0.91 | % | 100 | % | |||||||||||
09/30/05 (Commenced) to 03/31/06 | 9.43% | (6) | 3,743 | 0.27 | % | 1.37 | % | (0.37 | %) | 1.00 | % | 0.94 | % | 147 | % | ||||||||||
U.S. CONVERTIBLE | |||||||||||||||||||||||||
For the year ended 03/31/08 | 3.91 | % | $ | 9,103 | 1.58 | % | 0.93 | % | — | 0.93 | % | 0.79 | % | 98 | % | ||||||||||
For the year ended 03/31/07 | 10.92 | % | 7,880 | 2.05 | % | 0.92 | % | — | 0.92 | % | 0.75 | % | 92 | % | |||||||||||
09/30/05 (Commenced) to 03/31/06 | 8.47% | (6) | 3,634 | 2.26 | % | 1.01 | % | (0.09 | %) | 0.92 | % | 0.77 | % | 92 | % | ||||||||||
GLOBAL FUNDS | |||||||||||||||||||||||||
GLOBAL SELECT | |||||||||||||||||||||||||
For the year ended 03/31/08 | 1.40 | % | $ | 8,617 | 0.67 | % | 1.13 | % | — | 1.13 | % | 0.97 | % | 80 | % | ||||||||||
For the year ended 03/31/07 | 10.67 | % | 90,871 | 0.44 | % | 1.11 | % | — | 1.11 | % | 0.95 | % | 105 | % | |||||||||||
For the year ended 03/31/06 | 25.90 | % | 100,610 | 0.21 | % | 1.08 | % | — | 1.08 | % | 0.83 | % | 139 | % | |||||||||||
For the year ended 03/31/05 | 9.27 | % | 69,548 | 0.44 | % | 1.10 | % | (0.01 | %) | 1.09 | % | 0.90 | % | 164 | % | ||||||||||
6/30/03 (Commenced) to 03/31/04 | 28.55% | (6) | 35,817 | (0.08 | %) | 1.24 | % | (0.12 | %) | 1.12 | % | 0.94 | % | 226 | % | ||||||||||
INTERNATIONAL GROWTH | |||||||||||||||||||||||||
For the year ended 03/31/08 | 9.52 | % | $ | 11,518 | 1.56 | % | 0.99 | % | — | 0.99 | % | 0.72 | % | 113 | % | ||||||||||
For the year ended 03/31/07 | 14.12 | % | 52,420 | 0.64 | % | 1.02 | % | — | 1.02 | % | 0.75 | % | 119 | % | |||||||||||
1/23/06 (Commenced) to 03/31/06 | 4.94% | (6) | 56,501 | 1.21 | % | 0.99 | % | (0.00 | %) | 0.99 | % | 0.73 | % | 167 | % | ||||||||||
INTERNATIONAL GROWTH OPPORTUNITIES | |||||||||||||||||||||||||
For the year ended 03/31/08 | 2.90 | % | $ | 8,213 | 0.57 | % | 1.27 | % | — | 1.27 | % | 1.00 | % | 86 | % | ||||||||||
For the year ended 03/31/07 | 18.90 | % | 73,640 | 0.05 | % | 1.28 | % | — | 1.28 | % | 1.03 | % | 127 | % | |||||||||||
For the year ended 03/31/06 | 43.55 | % | 32,565 | 0.36 | % | 1.22 | % | (0.00 | %) | 1.22 | % | 0.91 | % | 168 | % | ||||||||||
For the year ended 03/31/05 | 19.40 | % | 35,233 | 1.19 | % | 1.27 | % | (0.00 | %) | 1.27 | % | 0.97 | % | 110 | % | ||||||||||
6/05/03 (Commenced) to 03/31/04 | 41.34% | (6) | 60,394 | 0.66 | % | 1.29 | % | — | 1.29 | % | 1.11 | % | 124 | % | |||||||||||
EMERGING MARKETS | |||||||||||||||||||||||||
For the year ended 03/31/08 | 21.18 | % | $ | 14,656 | 0.70 | % | 1.32 | % | — | 1.32 | % | 1.13 | % | 183 | % | ||||||||||
03/27/07 (Commenced) to 03/31/07 | 1.35% | (6) | 39,081 | 1.28 | % | 1.18 | % | — | 1.18 | % | 1.18 | % | 22 | % | |||||||||||
INTERNATIONAL SYSTEMATIC | |||||||||||||||||||||||||
For the year ended 03/31/08 | (9.68 | %) | $ | 26,976 | 1.44 | % | 0.88 | % | — | 0.88 | % | 0.64 | % | 202 | % | ||||||||||
12/22/06 (Commenced) to 03/31/07 | 3.36% | (6) | 12,722 | 1.33 | % | 0.85 | % | — | 0.85 | % | 0.55 | % | 210 | % | |||||||||||
| (1) | Net investment income per share is calculated by dividing net investment income for the period by the average shares outstanding during the period. |
| (2) | Total returns are not annualized for periods less than one year. |
| (3) | Ratios are annualized for periods of less than one year. Expense reimbursements reflect voluntary reductions to total expenses, as discussed in the notes to financial statements. Such amounts would increase net investment income (loss) ratios had such reductions not occurred. |
| (4) | Net expenses include certain items not subject to expense reimbursement for periods prior to January 23, 2006. |
| (5) | The net investment income per share includes litigation proceeds of approximately $0.07 per share for the U.S. Emerging Growth Fund and $0.09 per share for the U.S. Systematic Large Cap Growth Fund. |
| (6) | Inception to date Return. |
| (7) | Less than one penny per share. |
See Accompanying Notes to Financial Statements.
56 & 57
NICHOLAS-APPLEGATE INSTITUTIONAL FUNDS
FINANCIAL HIGHLIGHTS
For a Class III share outstanding during the period indicated
| Distributions from: | |||||||||||||||||||||||||
Net Asset Value, Beginning | Net Investment Income (Loss) (1) | Net Realized and Unrealized Gains (Loss) | Total from Investment Operations | Net Investment Income | Net Realized Capital Gains | Total Distributions | Net Asset Value, Ending | ||||||||||||||||||
GLOBAL FUNDS | |||||||||||||||||||||||||
INTERNATIONAL SYSTEMATIC | |||||||||||||||||||||||||
| For the year ended 03/31/08 | $ | 16.01 | $ | 0.08 | $ | (1.51 | ) | $ | (1.43 | ) | $ | (0.20 | ) | $ | (0.77 | ) | $ | (0.97 | ) | $ | 13.61 | ||||
| 12/21/06 (Commenced) to 03/31/07 | 15.36 | 0.09 | 0.56 | 0.65 | — | — | — | 16.01 | |||||||||||||||||
| Ratios to Average Net Assets (3) | |||||||||||||||||||||||||
Total Return (2) | Net Assets, Ending (in 000’s) | Net Investment Income (Loss) | Total Expenses | Expense (Reimbursements)/ Recoupment | Expenses Net of Reimbursement/ Recoupment | Expenses Net of Reimbursement/ Recoupment Offset (4) | Fund’s Portfolio Turnover Rate | ||||||||||||||||||
GLOBAL FUNDS | |||||||||||||||||||||||||
INTERNATIONAL SYSTEMATIC | |||||||||||||||||||||||||
| For the year ended 03/31/08 | (9.57 | %) | $ | 49,322 | 1.79 | % | 0.79 | % | — | (6) | 0.79 | % | 0.55 | % | 202 | % | |||||||||
| 12/21/06 (Commenced) to 03/31/07 | 4.23% | (5) | 54,604 | 1.95 | % | 0.76 | % | — | (6) | 0.76 | % | 0.46 | % | 210 | % | ||||||||||
For a Class IV share outstanding during the period indicated
| Distributions from: | |||||||||||||||||||||||||
Net Asset Value, Beginning | Net Investment Income (Loss) (1) | Net Realized and Unrealized Gains (Loss) | Total from Investment Operations | Net Investment Income | Net Realized Capital Gains | Total Distributions | Net Asset Value, Ending | ||||||||||||||||||
U.S. EQUITY FUNDS | |||||||||||||||||||||||||
U.S. CONVERTIBLE | |||||||||||||||||||||||||
| For the year ended 03/31/08 | $ | 24.37 | $ | 0.11 | $ | 0.91 | $ | 1.02 | $ | (0.39 | ) | $ | (0.10 | ) | $ | (0.50 | ) | $ | 24.89 | ||||||
| 12/30/06 (Commenced) to 03/31/07 | 23.47 | 0.12 | 0.91 | 1.03 | (0.13 | ) | — | (0.13 | ) | 24.37 | |||||||||||||||
| Ratios to Average Net Assets (3) | |||||||||||||||||||||||||
Total Return (2) | Net Assets, Ending (in 000’s) | Net Investment Income (Loss) | Total Expenses | Expense (Reimbursements)/ Recoupment | Expenses Net of Reimbursement/ Recoupment | Expenses Net of Reimbursement/ Recoupment Offset (4) | Fund’s Portfolio Turnover Rate | ||||||||||||||||||
U.S. EQUITY FUNDS | |||||||||||||||||||||||||
U.S. CONVERTIBLE | |||||||||||||||||||||||||
| For the year ended 03/31/08 | 4.07 | % | $ | 253,227 | 1.70 | % | 0.78 | % | — | (6) | 0.78 | % | 0.64 | % | 98 | % | |||||||||
| 12/30/06 (Commenced) to 03/31/07 | 4.39% | (5) | 97,007 | 1.97 | % | 0.77 | % | — | (6) | 0.77 | % | 0.60 | % | 92 | % | ||||||||||
| (1) | Net investment income per share is calculated by dividing net investment income for the period by the average shares outstanding during the period. |
| (2) | Total returns are not annualized for periods less than one year. |
| (3) | Ratios are annualized for periods of less than one year. Expense reimbursements reflect voluntary reductions to total expenses, as discussed in the notes to financial statements. Such amounts would increase net investment income (loss) ratios had such reductions not occurred. |
| (4) | Net expenses include certain items not subject to expense reimbursement. |
| (5) | Inception to date Return had rate of 0.92% since inception 09.30.05. |
| (6) | The expense reimbursement was terminated on January 23, 2006. |
See Accompanying Notes to Financial Statements.
58 & 59
NICHOLAS-APPLEGATE INSTITUTIONAL FUNDS
STATEMENTS OF ASSETS AND LIABILITIES
| March 31, 2008 | U.S. Micro Cap | U.S. Emerging Growth | U.S. Ultra Micro Cap | U.S. Systematic Large Cap Growth | U.S. Small to Mid Cap Growth | U.S. Convertible | Global Select | |||||||||||||||
Assets | ||||||||||||||||||||||
Investments, at value*, a | $ | 66,805,155 | $ | 11,664,820 | $ | 885,983 | $ | 17,260,764 | $ | 4,864,764 | $ | 311,352,162 | $ | 42,539,323 | ||||||||
Foreign currencies, at value** | — | — | — | — | — | — | 1 | |||||||||||||||
Cash | — | — | — | — | — | — | 1,873 | |||||||||||||||
Receivables: | ||||||||||||||||||||||
Investment securities sold | 314,393 | 43,440 | 10,707 | — | — | 2,702,658 | 917,028 | |||||||||||||||
Capital shares sold | 21,895 | — | 50 | 2,614 | — | 40,000 | — | |||||||||||||||
Dividends | 3,179 | 2,645 | 5 | 22,045 | 2,020 | 108,126 | 76,851 | |||||||||||||||
Foreign taxes receivable | — | — | — | — | — | — | 78,123 | |||||||||||||||
Interest | — | — | — | — | — | 1,110,931 | — | |||||||||||||||
Other | 12,987 | 3,842 | — | — | — | — | 8,210 | |||||||||||||||
Total assets | 67,157,609 | 11,714,747 | 896,745 | 17,285,423 | 4,866,784 | 315,313,877 | 43,621,409 | |||||||||||||||
Liabilities | ||||||||||||||||||||||
Payables: | ||||||||||||||||||||||
Bank overdraft | $ | — | $ | — | $ | — | $ | — | $ | — | $ | 33,028 | $ | — | ||||||||
Investments purchased | 180,317 | — | 8,825 | — | — | 4,930,915 | 932 | |||||||||||||||
Capital shares redeemed | 49,699 | 4,550 | — | 2,214 | — | 304 | 78,323 | |||||||||||||||
Collateral on securities loaned | 6,714,510 | 1,328,506 | — | 57,250 | — | — | 2,205,728 | |||||||||||||||
Distributions fee | — | — | — | — | — | — | — | |||||||||||||||
To investment advisor | 53,043 | 6,575 | 1,118 | 6,553 | 2,041 | 145,034 | 23,061 | |||||||||||||||
Other Liabilites | 37,644 | 5,850 | 654 | 13,005 | 2,737 | 100,674 | 27,594 | |||||||||||||||
Total Liabilities | 7,035,213 | 1,345,481 | 10,597 | 79,022 | 4,778 | 5,209,955 | 2,335,638 | |||||||||||||||
NET ASSETS | 60,122,396 | 10,369,266 | 886,148 | 17,206,401 | 4,862,006 | 310,103,922 | 41,285,771 | |||||||||||||||
* Investments, at cost | 68,482,025 | 12,134,631 | 930,154 | 16,780,639 | 5,048,013 | 310,054,120 | 36,511,031 | |||||||||||||||
** Foreign currencies, at cost | — | — | — | — | — | — | 1 | |||||||||||||||
Net Assets Consist of: | ||||||||||||||||||||||
Paid-in capital | $ | 62,990,943 | $ | 15,808,225 | $ | 947,947 | $ | 23,508,191 | $ | 5,365,859 | $ | 313,594,498 | $ | 5,738,273 | ||||||||
Undistributed net investment income (loss) | — | — | — | — | — | 41,918 | 1,041,786 | |||||||||||||||
Accumulated net realized gain (loss) on | ||||||||||||||||||||||
| investments and foreign currencies | (1,191,677 | ) | (4,969,148 | ) | (17,628 | ) | (6,781,915 | ) | (320,604 | ) | (4,830,536 | ) | 28,463,480 | |||||||||
Net unrealized appreciation (depreciation) of | ||||||||||||||||||||||
| investments and of other assets and | ||||||||||||||||||||||
| liabilities denominated in foreign currencies | (1,676,870 | ) | (469,811 | ) | (44,171 | ) | 480,125 | (183,249 | ) | 1,298,042 | 6,042,232 | |||||||||||
| Net Assets applicable to all shares outstanding | $ | 60,122,396 | $ | 10,369,266 | $ | 886,148 | $ | 17,206,401 | $ | 4,862,006 | $ | 310,103,922 | $ | 41,285,771 | ||||||||
Net Assets of Class I shares | $ | 60,122,396 | $ | 7,499,071 | $ | 886,148 | $ | 790,563 | $ | 4,862,006 | $ | 47,773,184 | $ | 32,668,585 | ||||||||
Net Assets of Class II shares | — | — | — | 10,594,102 | — | 9,103,371 | 8,617,186 | |||||||||||||||
Net Assets of Class III shares | — | — | — | — | — | — | — | |||||||||||||||
Net Assets of Class IV shares | — | — | — | — | — | 253,227,367 | — | |||||||||||||||
Net Assets of Class R shares | — | 2,870,195 | — | 5,821,736 | — | — | — | |||||||||||||||
Class I Shares outstanding | 5,184,838 | 654,706 | 95,521 | 40,782 | 539,027 | 1,920,373 | 2,582,919 | |||||||||||||||
Class II Shares outstanding | — | — | — | 549,223 | — | 365,862 | 667,031 | |||||||||||||||
Class III Shares outstanding | — | — | — | — | — | — | — | |||||||||||||||
Class IV Shares outstanding | — | — | — | — | — | 10,173,312 | — | |||||||||||||||
Class R Shares outstanding | — | 256,326 | — | 306,500 | — | — | — | |||||||||||||||
Net Asset Value — Class I Share | $ | 11.60 | $ | 11.45 | $ | 9.28 | $ | 19.39 | $ | 9.02 | $ | 24.88 | $ | 12.65 | ||||||||
Net Asset Value — Class II Share | $ | — | $ | — | $ | — | $ | 19.29 | $ | — | $ | 24.88 | $ | 12.92 | ||||||||
Net Asset Value — Class III Share | $ | — | $ | — | $ | — | $ | — | $ | — | $ | — | $ | — | ||||||||
Net Asset Value — Class IV Share | $ | — | $ | — | $ | — | $ | — | $ | — | $ | 24.89 | $ | — | ||||||||
Net Asset Value — Class R Share | $ | — | $ | 11.20 | $ | — | $ | 18.99 | $ | — | $ | — | $ | — | ||||||||
| (a) Including securities on loan with a values of: | $ | 6,463,304 | $ | 1,294,828 | $ | — | $ | 56,080 | $ | — | $ | — | $ | 2,091,524 | ||||||||
| March 31, 2008 | International Growth | International Growth Opportunities | Emerging Markets | International Systematic | International All Cap Growth | U.S. High Yield Bond | |||||||||||||
Assets | |||||||||||||||||||
Investments, at value*, a | $ | 24,183,567 | $ | 139,587,881 | $ | 16,394,167 | $ | 101,687,433 | $ | 7,479,522 | $ | 49,450,928 | |||||||
Foreign currencies, at value** | 10,155 | 836,100 | 633,238 | — | 4 | — | |||||||||||||
Cash | 2,297 | 8,457 | 17,319 | 8,371 | 587 | — | |||||||||||||
Receivables: | |||||||||||||||||||
Investment securities sold | 122 | 1,593,696 | 115,642 | 595,933 | — | — | |||||||||||||
Capital shares sold | — | 100,151 | 25 | 10,263 | 25 | 22,591 | |||||||||||||
Dividends | 154,175 | 188,755 | 157,487 | 378,291 | 44,220 | — | |||||||||||||
Foreign taxes receivable | 37,022 | 29,886 | — | 50,919 | 18,038 | — | |||||||||||||
Interest | — | — | — | — | — | 1,230,176 | |||||||||||||
Other | 5,094 | 31,321 | 4,170 | 2,122 | 2,040 | — | |||||||||||||
Total assets | 24,392,432 | 142,376,247 | 17,322,048 | 102,733,332 | 7,544,436 | 50,703,695 | |||||||||||||
Liabilities | |||||||||||||||||||
Payables: | |||||||||||||||||||
Bank overdraft | $ | — | $ | — | $ | — | $ | 597,270 | $ | — | $ | — | |||||||
Investments purchased | 66,400 | 4,030,269 | — | 525,365 | — | 246,751 | |||||||||||||
Capital shares redeemed | 978 | 21,186 | 2,422 | 11,072 | 59,549 | 151,459 | |||||||||||||
Collateral on securities loaned | 690,354 | 16,717,327 | 150,800 | 688,169 | 136,888 | — | |||||||||||||
Distributions fee | — | — | — | — | — | — | |||||||||||||
To investment advisor | 9,598 | 71,463 | 13,239 | 42,399 | 5,218 | 17,105 | |||||||||||||
Other Liabilites | 15,652 | 83,594 | 8,458 | 37,517 | 2,510 | 17,666 | |||||||||||||
Total Liabilities | 782,982 | 20,923,839 | 174,919 | 1,901,792 | 204,165 | 432,981 | |||||||||||||
NET ASSETS | 23,609,450 | 121,452,408 | 17,147,129 | 100,831,540 | 7,340,271 | 50,270,714 | |||||||||||||
* Investments, at cost | 22,481,707 | 124,561,027 | 16,091,417 | 104,838,465 | 6,825,358 | 51,609,232 | |||||||||||||
** Foreign currencies, at cost | 9,990 | 831,511 | 591,692 | (597,270 | ) | 4 | — | ||||||||||||
Net Assets Consist of: | |||||||||||||||||||
Paid-in capital | $ | 30,560,925 | $ | 112,567,221 | $ | 13,433,777 | $ | 114,308,940 | $ | 9,620,079 | $ | 56,513,214 | |||||||
Undistributed net investment income (loss) | 460,556 | (863,873 | ) | 78,571 | 413,930 | 89,535 | 243,250 | ||||||||||||
Accumulated net realized gain (loss) on | |||||||||||||||||||
| investments and foreign currencies | (9,121,395 | ) | (5,276,625 | ) | 3,295,657 | (10,605,837 | ) | (3,026,790 | ) | (4,327,446 | ) | ||||||||
Net unrealized appreciation (depreciation) of | |||||||||||||||||||
| investments and of other assets and | |||||||||||||||||||
| liabilities denominated in foreign currencies | 1,709,364 | 15,025,685 | 339,124 | (3,285,493 | ) | 657,447 | (2,158,304 | ) | |||||||||||
| Net Assets applicable to all shares outstanding | $ | 23,609,450 | $ | 121,452,408 | $ | 17,147,129 | $ | 100,831,540 | $ | 7,340,271 | $ | 50,270,714 | |||||||
Net Assets of Class I shares | $ | 9,496,169 | $ | 113,239,350 | $ | 2,490,887 | $ | 24,533,660 | $ | 7,340,271 | $ | 50,270,714 | |||||||
Net Assets of Class II shares | 11,518,114 | 8,213,058 | 14,656,242 | 26,975,891 | — | — | |||||||||||||
Net Assets of Class III shares | — | — | — | 49,321,989 | — | — | |||||||||||||
Net Assets of Class IV shares | — | — | — | — | — | — | |||||||||||||
Net Assets of Class R shares | 2,595,167 | — | — | — | — | — | |||||||||||||
Class I Shares outstanding | 1,122,747 | 2,824,045 | 184,219 | 1,808,168 | 611,038 | 5,371,990 | |||||||||||||
Class II Shares outstanding | 1,493,350 | 198,953 | 1,082,826 | 1,985,017 | — | — | |||||||||||||
Class III Shares outstanding | — | — | — | 3,625,251 | — | — | |||||||||||||
Class IV Shares outstanding | — | — | — | — | — | — | |||||||||||||
Class R Shares outstanding | 366,363 | — | — | — | — | — | |||||||||||||
Net Asset Value — Class I Share | $ | 8.46 | $ | 40.10 | $ | 13.52 | $ | 13.57 | $ | 12.01 | $ | 9.36 | |||||||
Net Asset Value — Class II Share | $ | 7.71 | $ | 41.28 | $ | 13.54 | $ | 13.59 | $ | — | $ | — | |||||||
Net Asset Value — Class III Share | $ | — | $ | — | $ | — | $ | 13.61 | $ | — | $ | — | |||||||
Net Asset Value — Class IV Share | $ | — | $ | — | $ | — | $ | — | $ | — | $ | — | |||||||
Net Asset Value — Class R Share | $ | 7.08 | $ | — | $ | — | $ | — | $ | — | $ | — | |||||||
| (a) Including securities on loan with a values of: | $ | 668,577 | $ | 15,715,526 | $ | 147,608 | $ | 653,061 | $ | 130,253 | $ | — | |||||||
See Accompanying Notes to Financial Statements.
60 & 61
NICHOLAS-APPLEGATE INSTITUTIONAL FUNDS
STATEMENTS OF OPERATIONS
Year Ended March 31, 2008 | U.S. Micro Cap | U.S. Emerging Growth | U.S. Ultra Micro Cap | U.S. Systematic Large Cap Growth | U.S. Small to Mid Cap Growth | U.S. Convertible | Global Select | |||||||||||||||
Investment Income | ||||||||||||||||||||||
Dividends, net of foreign taxes* | $ | 156,015 | $ | 29,974 | $ | 71 | $ | 193,683 | $ | 10,843 | $ | 1,577,702 | $ | 1,936,152 | ||||||||
Interest | 4 | — | 5 | — | — | 3,133,855 | 5 | |||||||||||||||
Total Income | 156,019 | 29,974 | 76 | 193,683 | 10,843 | 4,711,557 | 1,936,157 | |||||||||||||||
Expenses | ||||||||||||||||||||||
Advisory fee | 821,379 | 88,469 | 2,059 | 86,685 | 18,030 | 1,107,212 | 769,012 | |||||||||||||||
Administration fees | 438,931 | 48,363 | 1,002 | 105,451 | 14,424 | 498,241 | 525,079 | |||||||||||||||
Shareholder servicing fees | — | 8,635 | — | 16,094 | — | — | — | |||||||||||||||
Professional fees | 7,776 | 1,535 | 61 | 2,949 | 953 | 20,315 | 8,987 | |||||||||||||||
Trustees’ fees and expenses | 17,234 | 2,443 | 34 | 3,943 | 658 | 41,572 | 24,140 | |||||||||||||||
Interest and credit facility fee | 2,727 | 164 | — | 427 | 1 | — | 19,764 | |||||||||||||||
Miscellaneous | 5,498 | 1,414 | 9 | 1,687 | 161 | 8,743 | 15,820 | |||||||||||||||
Total Expenses | 1,293,545 | 151,023 | 3,165 | 217,236 | 34,227 | 1,676,083 | 1,362,802 | |||||||||||||||
Expense offset | (165,727 | ) | (57,887 | ) | (209 | ) | (5,965 | ) | (5,530 | ) | (271,772 | ) | (179,941 | ) | ||||||||
Net Expenses | 1,127,818 | 93,136 | 2,956 | 211,271 | 28,697 | 1,404,311 | 1,182,861 | |||||||||||||||
Net Investment Income (Loss) | (971,799 | ) | (63,162 | ) | (2,880 | ) | (17,588 | ) | (17,854 | ) | 3,307,246 | 753,296 | ||||||||||
Net Realized and Unrealized | ||||||||||||||||||||||
Gain (Loss) on Investments | ||||||||||||||||||||||
Realized gain from: | ||||||||||||||||||||||
Securities | 5,666,026 | 1,109,622 | (17,628 | ) | 1,142,381 | (320,604 | ) | 2,428,013 | 32,181,235 | |||||||||||||
Foreign currency transactions | — | — | — | — | — | |||||||||||||||||
Net realized gain (loss) | 5,666,026 | 1,109,622 | (17,628 | ) | 1,142,381 | (320,604 | ) | — | 14,550 | |||||||||||||
Change in unrealized appreciation of: | 2,428,013 | 32,195,785 | ||||||||||||||||||||
Investments | (13,753,967 | ) | (1,932,344 | ) | (44,171 | ) | (1,503,590 | ) | (183,249 | ) | (8,015,589 | ) | (15,321,243 | ) | ||||||||
Other assets and liabilities denominated in | ||||||||||||||||||||||
foreign currencies | — | — | — | — | — | — | 180,663 | |||||||||||||||
Net unrealized appreciation | (13,753,967 | ) | (1,932,344 | ) | (44,171 | ) | (1,503,590 | ) | (183,249 | ) | (8,015,589 | ) | (15,140,580 | ) | ||||||||
Net Gain (Loss) on Investments | (8,087,941 | ) | (822,722 | ) | (61,799 | ) | (361,209 | ) | (503,853 | ) | (5,587,576 | ) | 17,055,205 | |||||||||
Assets Resulting From Operations | $ | (9,059,740 | ) | $ | (885,884 | ) | $ | (64,679 | ) | $ | (378,797 | ) | $ | (521,707 | ) | $ | (2,280,330 | ) | $ | 17,808,501 | ||
* Foreign taxes withheld | $ | — | $ | — | $ | — | $ | — | $ | — | $ | — | $ | 162,470 | ||||||||
Year Ended March 31, 2008 | International Growth | International Growth Opportunities | Emerging Markets | International Systematic | International All Cap Growth | U.S. High Yield Bond | |||||||||||||
Investment Income | |||||||||||||||||||
Dividends, net of foreign taxes* | $ | 844,235 | $ | 3,003,742 | $ | 670,046 | $ | 2,156,702 | $ | 328,649 | $ | — | |||||||
Interest | 384 | 1,657 | 7,700 | — | 1,428 | 5,494,754 | |||||||||||||
Total Income | 844,619 | 3,005,399 | 677,746 | 2,156,702 | 330,077 | 5,494,754 | |||||||||||||
Expenses | |||||||||||||||||||
Advisory fee | 194,196 | 1,410,596 | 327,967 | 493,107 | 140,139 | 274,242 | |||||||||||||
Administration fees | 239,041 | 1,242,068 | 118,345 | 295,150 | 44,515 | 131,420 | |||||||||||||
Shareholder servicing fees | 6,769 | — | — | — | — | — | |||||||||||||
Professional fees | — | 11,808 | 4,661 | 13,998 | 570 | 4,340 | |||||||||||||
Trustees’ fees and expenses | 8,364 | 41,377 | 8,073 | 20,702 | 3,032 | 13,971 | |||||||||||||
Interest and credit facility fee | 893 | 15,238 | 11,638 | 12,336 | 2,136 | — | |||||||||||||
Miscellaneous | 902 | 10,842 | 12,321 | 6,590 | 2,128 | 4,210 | |||||||||||||
Total Expenses | 450,165 | 2,731,929 | 483,005 | 841,883 | 192,520 | 428,183 | |||||||||||||
Expense offset | (121,261 | ) | (565,870 | ) | (72,225 | ) | (243,365 | ) | (43,524 | ) | (54,186 | ) | |||||||
Net Expenses | 328,904 | 2,166,059 | 410,780 | 598,518 | 148,996 | 373,997 | |||||||||||||
Net Investment Income (Loss) | 515,715 | 839,340 | 266,966 | 1,558,184 | 181,081 | 5,120,757 | |||||||||||||
Net Realized and Unrealized | |||||||||||||||||||
Gain (Loss) on Investments | |||||||||||||||||||
Realized gain from: | |||||||||||||||||||
Securities | 22,050,147 | 68,277,741 | 7,701,862 | (6,602,030 | ) | 9,348,468 | (36,608 | ) | |||||||||||
Foreign currency transactions | |||||||||||||||||||
Net realized gain (loss) | (17,466 | ) | 46,859 | 565 | 6,481 | (3,812 | ) | — | |||||||||||
Change in unrealized appreciation of: | 22,032,681 | 68,324,600 | 7,702,427 | (6,595,549 | ) | 9,344,656 | (36,608 | ) | |||||||||||
Investments | |||||||||||||||||||
Other assets and liabilities denominated in | (11,503,281 | ) | (50,489,387 | ) | (440,273 | ) | (13,800,712 | ) | (4,819,036 | ) | (6,230,507 | ) | |||||||
foreign currencies | 1,286,337 | 3,713,397 | 20,545 | 6,219,370 | 212,745 | — | |||||||||||||
Net unrealized appreciation | (10,216,944 | ) | (46,775,990 | ) | (419,728 | ) | (7,581,342 | ) | (4,606,291 | ) | (6,230,507 | ) | |||||||
Net Gain (Loss) on Investments | 11,815,737 | 21,548,610 | 7,282,699 | (14,176,891 | ) | 4,738,365 | (6,267,115 | ) | |||||||||||
Assets Resulting From Operations | $ | 12,331,452 | $ | 22,387,950 | $ | 7,549,665 | $ | (12,618,707 | ) | $ | 4,919,446 | $ | (1,146,358 | ) | |||||
* Foreign taxes withheld | $ | 82,306 | $ | 285,058 | $ | 62,072 | $ | 191,434 | $ | 30,026 | $ | — | |||||||
See Accompanying Notes to Financial Statements.
62 & 63
NICHOLAS-APPLEGATE INSTITUTIONAL FUNDS
STATEMENTS OF CHANGES IN NET ASSETS
| U.S. Micro Cap | U.S. Emerging Growth | U.S. Ultra Micro Cap | U.S. Systematic Large Cap Growth | ||||||||||||||||
| Years Ended March 31 | 2008 | 2007 | 2008 | 2007 | 2008 | 2008 | |||||||||||||
| Increase (Decrease) In Net Assets From Investment Operations: | |||||||||||||||||||
Net investment income (loss) | $ | (971,799 | ) | $ | (615,012 | ) | $ | (63,162 | ) | $ | (62,920 | ) | $ | (2,880 | ) | $ | (17,588 | ) | |
Net realized gain (loss) | 5,666,026 | 5,021,292 | 1,109,622 | 1,305,006 | (17,628 | ) | 1,142,381 | ||||||||||||
Net unrealized appreciation (depreciation) | (13,753,967 | ) | (5,804,396 | ) | (1,932,344 | ) | (1,129,950 | ) | (44,171 | ) | (1,503,590 | ) | |||||||
Investment operations | (9,059,740 | ) | (1,398,116 | ) | (885,884 | ) | 112,136 | (64,679 | ) | (378,797 | ) | ||||||||
Distributions to Shareholders: | |||||||||||||||||||
From net investment income | |||||||||||||||||||
Class I | — | — | — | — | — | — | |||||||||||||
Class II | — | — | — | — | — | (16,091 | ) | ||||||||||||
Class IV | |||||||||||||||||||
From net realized gains | |||||||||||||||||||
Class I | (9,796,779 | ) | (9,264,776 | ) | (527,551 | ) | (739,964 | ) | — | — | |||||||||
Class II | (98,864 | ) | — | — | — | — | — | ||||||||||||
Class IV | |||||||||||||||||||
Class R | — | — | (217,858 | ) | — | — | — | ||||||||||||
Total distributions | (9,895,643 | ) | (9,264,776 | ) | (745,409 | ) | (739,964 | ) | — | (16,091 | ) | ||||||||
From Capital Share Transactions: | |||||||||||||||||||
Proceeds from shares sold | |||||||||||||||||||
Class I | 17,361,071 | 17,798,669 | 2,539,292 | 2,347,555 | 950,827 | 106,984 | |||||||||||||
Class II | 110,838 | 490,444 | — | — | — | 2,468,812 | |||||||||||||
Class IV | |||||||||||||||||||
Class R | — | — | 1,124,520 | 1,241,746 | — | 486,815 | |||||||||||||
Distributions reinvested | |||||||||||||||||||
Class I | 9,746,287 | 8,668,832 | 526,107 | 513,359 | — | — | |||||||||||||
Class II | 98,864 | 399,499 | — | — | — | 16,091 | |||||||||||||
Class IV | |||||||||||||||||||
Class R | — | — | 217,859 | 226,606 | — | — | |||||||||||||
Cost of shares redeemed | |||||||||||||||||||
Class I | (32,282,224 | ) | (10,288,572 | ) | (1,777,085 | ) | (1,775,938 | ) | — | (262,579 | ) | ||||||||
Class II | (3,054,309 | ) | (3,241,659 | ) | — | — | — | (1,650,704 | ) | ||||||||||
Class IV | |||||||||||||||||||
Class R | — | — | (1,216,005 | ) | (1,234,060 | ) | — | (571,686 | ) | ||||||||||
| Net increase (decrease) in net assets from share transactions | (8,019,473 | ) | 13,827,213 | 1,414,688 | 1,319,268 | 950,827 | 593,733 | ||||||||||||
Net Increase (Decrease) in Net Assets | (26,974,856 | ) | 3,164,321 | (216,605 | ) | 691,440 | 886,148 | 198,845 | |||||||||||
| Net Assets | |||||||||||||||||||
Beginning | 87,097,252 | 83,932,931 | 10,585,871 | 9,894,431 | — | 17,007,556 | |||||||||||||
Ending | $ | 60,122,396 | $ | 87,097,252 | $ | 10,369,266 | $ | 10,585,871 | $ | 886,148 | $ | 17,206,401 | |||||||
Undistributed net investment income (loss), ending | $ | — | $ | — | $ | — | $ | — | $ | — | $ | — | |||||||
Class I — Capital Share Activity | |||||||||||||||||||
Shares sold | 1,152,958 | 1,099,483 | 182,466 | 179,774 | 95,521 | 5,151 | |||||||||||||
Distributions reinvested | 692,700 | 588,116 | 37,552 | 41,601 | — | — | |||||||||||||
Shares redeemed | (2,167,801 | ) | (659,422 | ) | (131,451 | ) | (138,889 | ) | — | (12,161 | ) | ||||||||
Net Class I Share Activity | (322,143 | ) | 1,028,177 | 88,567 | 82,486 | 95,521 | (7,010 | ) | |||||||||||
Class II — Capital Share Activity | |||||||||||||||||||
Shares sold | 6,464 | 31,699 | — | — | — | 113,463 | |||||||||||||
Distributions reinvested | 6,952 | 26,938 | — | — | — | 704 | |||||||||||||
Shares redeemed | (187,792 | ) | (219,977 | ) | — | — | — | (75,329 | ) | ||||||||||
Net Class II Share Activity | (174,376 | ) | (161,340 | ) | — | — | — | 38,838 | |||||||||||
Class IV — Capital Share Activity | |||||||||||||||||||
Shares sold | — | — | — | — | — | — | |||||||||||||
Distributions reinvested | — | — | — | — | — | — | |||||||||||||
Shares redeemed | — | — | — | — | — | — | |||||||||||||
Net Class IV Share Activity | — | — | — | — | — | — | |||||||||||||
Class R — Capital Share Activity | |||||||||||||||||||
Shares sold | — | — | 79,606 | 95,674 | — | 23,608 | |||||||||||||
Distributions reinvested | — | — | 15,891 | 18,696 | — | — | |||||||||||||
Shares redeemed | — | — | (86,526 | ) | (98,725 | ) | — | (27,157 | ) | ||||||||||
Net Class R Share Activity | — | — | 8,971 | 15,645 | — | (3,549 | ) | ||||||||||||
U.S. Systematic Large Cap Growth | U.S. Small to Mid Cap Growth | U.S. Convertible | |||||||||||
| Years Ended March 31 | 2007 | 2008 | 2008 | 2007 | |||||||||
| Increase (Decrease) In Net Assets From Investment Operations: | |||||||||||||
Net investment income (loss) | $ | 16,091 | $ | (17,854 | ) | $ | 3,307,246 | $ | 1,202,627 | ||||
Net realized gain (loss) | 1,136,149 | (320,604 | ) | 2,428,013 | 2,692,425 | ||||||||
Net unrealized appreciation (depreciation) | 565,057 | (183,249 | ) | (8,015,589 | ) | 4,354,669 | |||||||
Investment operations | 1,717,297 | (521,707 | ) | (2,280,330 | ) | 8,249,721 | |||||||
Distributions to Shareholders: | |||||||||||||
From net investment income | |||||||||||||
Class I | (1,377 | ) | — | (514,906 | ) | (1,305,908 | ) | ||||||
Class II | — | — | (122,122 | ) | — | ||||||||
Class IV | (2,605,259 | ) | |||||||||||
From net realized gains | |||||||||||||
Class I | — | — | (150,355 | ) | (3,345,184 | ) | |||||||
Class II | — | — | (38,002 | ) | — | ||||||||
Class IV | (710,833 | ) | |||||||||||
Class R | — | — | — | — | |||||||||
Total distributions | (1,377 | ) | — | (4,141,477 | ) | (4,651,092 | ) | ||||||
From Capital Share Transactions: | |||||||||||||
Proceeds from shares sold | |||||||||||||
Class I | 747,760 | 5,383,713 | 15,784,572 | 7,520,973 | |||||||||
Class II | 5,251,286 | — | 965,357 | 4,002,514 | |||||||||
Class IV | 164,185,347 | ||||||||||||
Class R | 577,773 | — | — | — | |||||||||
Distributions reinvested | |||||||||||||
Class I | — | — | 654,378 | 3,631,531 | |||||||||
Class II | 1,377 | — | 160,124 | 426,080 | |||||||||
Class IV | 4,685 | ||||||||||||
Class R | — | — | — | — | |||||||||
Cost of shares redeemed | |||||||||||||
Class I | (556,909 | ) | — | (9,010,639 | ) | (3,772,860 | ) | ||||||
Class II | (4,013 | ) | — | — | (195,251 | ) | |||||||
Class IV | (127,582 | ) | |||||||||||
Class R | (1,190,968 | ) | — | — | — | ||||||||
| Net increase (decrease) in net assets from share transactions | 4,826,306 | 5,383,713 | 172,616,242 | 105,050,078 | |||||||||
Net Increase (Decrease) in Net Assets | 6,542,226 | 4,862,006 | 166,194,435 | 108,648,707 | |||||||||
Net Assets | |||||||||||||
Beginning | |||||||||||||
Ending | 10,465,330 | — | 143,909,487 | 35,260,780 | |||||||||
Undistributed net investment income (loss), ending | $ | 17,007,556 | $ | 4,862,006 | $ | 310,103,922 | $ | 143,909,487 | |||||
Class I — Capital Share Activity | $ | 16,091 | $ | — | $ | 41,918 | $ | 25,853 | |||||
Shares sold | |||||||||||||
Distributions reinvested | 38,919 | 539,027 | 630,900 | 318,723 | |||||||||
Shares redeemed | — | — | 25,119 | 155,568 | |||||||||
Net Class I Share Activity | (28,488 | ) | — | (338,123 | ) | (159,075 | ) | ||||||
Class II — Capital Share Activity | 10,431 | 539,027 | 317,896 | 315,216 | |||||||||
Shares sold | |||||||||||||
Distributions reinvested | 299,668 | — | 36,196 | 165,539 | |||||||||
Shares redeemed | 73 | — | 6,118 | 18,203 | |||||||||
Net Class II Share Activity | (222 | ) | — | — | (8,058 | ) | |||||||
Class IV — Capital Share Activity | 299,519 | — | 42,314 | 175,684 | |||||||||
Shares sold | — | — | 6,197,172 | 3,980,754 | |||||||||
Distributions reinvested | — | — | 180 | — | |||||||||
Shares redeemed | — | — | (4,794 | ) | — | ||||||||
Net Class IV Share Activity | — | — | 6,192,558 | 3,980,754 | |||||||||
Class R — Capital Share Activity | |||||||||||||
Shares sold | 31,541 | — | — | — | |||||||||
Distributions reinvested | — | — | — | — | |||||||||
Shares redeemed | (65,681 | ) | — | — | — | ||||||||
Net Class R Share Activity | (34,140 | ) | — | — | — | ||||||||
See Accompanying Notes to Financial Statements.
64 & 65
NICHOLAS-APPLEGATE INSTITUTIONAL FUNDS
STATEMENTS OF CHANGES IN NET ASSETS
| Global Select | International Growth | International Growth Opportunities | Emerging Markets | ||||||||||||||||||||||
| Year Ended March 31 | 2008 | 2007 | 2008 | 2007 | 2008 | 2007 | 2008 | 2007 | |||||||||||||||||
Increase (Decrease) In Net Assets | |||||||||||||||||||||||||
From Investment Operations: | |||||||||||||||||||||||||
Net investment income | $ | 753,296 | $ | 644,504 | $ | 515,715 | $ | 461,096 | $ | 839,340 | $ | 214,508 | $ | 266,966 | $ | 8,013 | |||||||||
Net realized gain (loss) | 32,195,785 | 23,421,528 | 22,032,681 | 19,578,811 | 68,324,600 | 22,318,005 | 7,702,427 | 4,406 | |||||||||||||||||
Net unrealized appreciation (depreciation) | (15,140,580 | ) | (8,352,881 | ) | (10,216,944 | ) | (7,320,021 | ) | (46,775,990 | ) | 17,888,482 | (419,728 | ) | 758,852 | |||||||||||
| Net unrealized appreciation (depreciation) | |||||||||||||||||||||||||
in net assets from investment operations | 17,808,501 | 15,713,151 | 12,331,452 | 12,719,886 | 22,387,950 | 40,420,995 | 7,549,665 | 771,271 | |||||||||||||||||
Distributions to Shareholders: | |||||||||||||||||||||||||
From net investment income | |||||||||||||||||||||||||
Class I | (612,353 | ) | (53,126 | ) | (102,579 | ) | (455,849 | ) | (2,374,268 | ) | — | (14,063 | ) | (6,966 | ) | ||||||||||
Class II | (2,152 | ) | — | (264,648 | ) | — | (69,543 | ) | — | (174,362 | ) | — | |||||||||||||
Class III | — | — | — | — | — | — | — | — | |||||||||||||||||
Class R | — | — | (122,626 | ) | — | — | — | — | — | ||||||||||||||||
From net realized gains | |||||||||||||||||||||||||
Class I | (14,408,538 | ) | (18,653,269 | ) | (6,119,767 | ) | (13,553,285 | ) | (36,837,182 | ) | (7,183,710 | ) | (291,347 | ) | — | ||||||||||
Class II | (5,564,143 | ) | — | (7,384,655 | ) | — | (3,939,300 | ) | — | (4,120,846 | ) | — | |||||||||||||
Class III | — | — | — | — | (12,535 | ) | — | — | — | ||||||||||||||||
Class R | — | — | (2,036,861 | ) | — | — | — | — | — | ||||||||||||||||
Total distributions | (20,587,186 | ) | (18,706,395 | ) | (16,031,136 | ) | (14,009,134 | ) | (43,232,828 | ) | (7,183,710 | ) | (4,600,618 | ) | (6,966 | ) | |||||||||
From Capital Share Transactions: | |||||||||||||||||||||||||
Proceeds from shares sold | |||||||||||||||||||||||||
Class I | 3,385,644 | 4,229,593 | 4,506,739 | 3,016,780 | 60,762,777 | 26,262,922 | 2,500,423 | 1,012,755 | |||||||||||||||||
Class II | 2,410,773 | 1,644,792 | 12,456,347 | 50,000 | 1,218,257 | 31,161,698 | 115,682 | 38,573,618 | |||||||||||||||||
Class III | — | — | — | — | 45,968 | 13,150 | — | — | |||||||||||||||||
Class IV | — | — | — | — | 26,893 | 37,314,972 | — | — | |||||||||||||||||
Class R | — | — | 952,934 | 995,312 | — | — | — | — | |||||||||||||||||
Distributions reinvested | |||||||||||||||||||||||||
Class I | 11,901,041 | 7,842,519 | 6,217,911 | 6,370,440 | 37,309,080 | 3,129,833 | 305,410 | 6,966 | |||||||||||||||||
Class II | 5,566,296 | 9,653,425 | 7,649,303 | 7,369,591 | — | 1,392,423 | 4,295,207 | — | |||||||||||||||||
Class III | — | — | — | — | 12,534 | 188,795 | — | — | |||||||||||||||||
Class IV | — | — | — | — | — | 2,008,361 | — | — | |||||||||||||||||
Class R | — | — | 2,159,486 | 269,106 | — | — | — | — | |||||||||||||||||
Cost of shares redeemed | |||||||||||||||||||||||||
Class I | (51,776,128 | ) | (9,686,380 | ) | (11,550,042 | ) | (39,097,481 | ) | (52,627,289 | ) | (47,558,129 | ) | (54,413 | ) | (1,182,489 | ) | |||||||||
Class II | (96,844,060 | ) | (19,104,263 | ) | (63,923,305 | ) | (11,428,000 | ) | (75,339,925 | ) | (342,687 | ) | (32,139,382 | ) | — | ||||||||||
Class III | — | — | — | — | (5,460,800 | ) | (3,000,000 | ) | — | — | |||||||||||||||
Class IV | — | — | — | — | (75,746,255 | ) | (13,052,589 | ) | — | — | |||||||||||||||
Class R | — | — | (873,729 | ) | (709,385 | ) | — | — | — | — | |||||||||||||||
Net increase (decrease) in net assets | |||||||||||||||||||||||||
from share transactions | (125,356,434 | ) | (5,420,314 | ) | (42,404,356 | ) | (33,163,637 | ) | (109,798,760 | ) | 37,518,749 | (24,977,073 | ) | 38,410,850 | |||||||||||
| Net Increase (Decrease) in Net Assets | (128,135,119 | ) | (8,413,558 | ) | (46,104,040 | ) | (34,452,885 | ) | (130,643,638 | ) | 70,756,034 | (22,028,026 | ) | 39,175,155 | |||||||||||
Net Assets | |||||||||||||||||||||||||
Beginning | 169,420,890 | 177,834,448 | 69,713,490 | 104,166,375 | 252,096,046 | 181,340,012 | 39,175,155 | — | |||||||||||||||||
Ending | $ | 41,285,771 | $ | 169,420,890 | $ | 23,609,450 | $ | 69,713,490 | $ | 121,452,408 | $ | 252,096,046 | $ | 17,147,129 | $ | 39,175,155 | |||||||||
| Undistributed net investment income, ending | $ | 1,041,786 | $ | 605,808 | $ | 460,556 | $ | 3,363,093 | $ | (863,873 | ) | $ | 4,161,906 | $ | 78,571 | $ | (8,916 | ) | |||||||
Shares sold | 192,981 | 229,759 | 318,579 | 134,231 | 1,089,540 | 511,290 | 160,501 | 101,715 | |||||||||||||||||
Distributions reinvested | 835,747 | 441,086 | 675,126 | 302,921 | 841,432 | 61,891 | 19,806 | — | |||||||||||||||||
Shares redeemed | (2,669,279 | ) | (519,507 | ) | (542,226 | ) | (1,787,977 | ) | (920,041 | ) | (921,085 | ) | (3,445 | ) | (94,358 | ) | |||||||||
Net Class I Share Activity | (1,640,551 | ) | 151,338 | 451,479 | (1,350,825 | ) | 1,010,931 | (347,904 | ) | 176,862 | 7,357 | ||||||||||||||
Shares sold | 114,030 | 82,682 | 615,162 | 2,199 | 20,169 | 605,599 | 7,699 | 3,057,987 | |||||||||||||||||
Distributions reinvested | 382,826 | 542,632 | 911,717 | 350,266 | — | 27,421 | 278,367 | — | |||||||||||||||||
Shares redeemed | (4,713,094 | ) | (1,045,918 | ) | (2,377,559 | ) | (496,447 | ) | (1,099,006 | ) | (6,439 | ) | (2,261,227 | ) | — | ||||||||||
Net Class II Share Activity | (4,216,238 | ) | (420,604 | ) | (850,680 | ) | (143,982 | ) | (1,078,837 | ) | 626,581 | (1,975,161 | ) | 3,057,987 | |||||||||||
Shares sold | — | — | — | — | 669 | 270 | — | — | |||||||||||||||||
Distributions reinvested | — | — | — | — | 273 | 3,727 | — | — | |||||||||||||||||
Shares redeemed | — | — | — | — | (82,580 | ) | (58,121 | ) | — | — | |||||||||||||||
Net Class III Share Activity | — | — | — | — | (81,638 | ) | (54,124 | ) | — | — | |||||||||||||||
Shares sold | — | — | — | — | 402 | 741,231 | — | — | |||||||||||||||||
Distributions reinvested | — | — | — | — | — | 39,620 | — | — | |||||||||||||||||
Shares redeemed | — | — | — | — | (1,212,404 | ) | (255,292 | ) | — | — | |||||||||||||||
Net IV Share Activity | — | — | — | — | (1,212,002 | ) | 525,559 | — | — | ||||||||||||||||
Shares sold | — | — | 48,877 | 45,495 | — | — | — | — | |||||||||||||||||
Distributions reinvested | — | — | 279,726 | 13,108 | — | — | — | — | |||||||||||||||||
Shares redeemed | — | — | (67,553 | ) | (33,088 | ) | — | — | — | — | |||||||||||||||
Net Class R Share Activity | — | — | 261,050 | 25,515 | — | — | — | — | |||||||||||||||||
| International Systematic | International All Cap Growth | U.S. High Yield Bond | |||||||||||||||||
| Year Ended March 31 | 2008 | 2007 | 2008 | 2007 | 2008 | 2007 | |||||||||||||
Increase (Decrease) In Net Assets | |||||||||||||||||||
From Investment Operations: | |||||||||||||||||||
Net investment income | $ | 1,558,184 | $ | 438,885 | $ | 181,081 | $ | 106,129 | $ | 5,120,757 | $ | 8,216,721 | |||||||
Net realized gain (loss) | (6,595,549 | ) | 2,117,989 | 9,344,656 | 3,010,452 | (36,608 | ) | 646,077 | |||||||||||
Net unrealized appreciation (depreciation) | (7,581,342 | ) | 3,504,485 | (4,606,291 | ) | 157,864 | (6,230,507 | ) | 2,536,959 | ||||||||||
| Net unrealized appreciation (depreciation) | |||||||||||||||||||
in net assets from investment operations | (12,618,707 | ) | 6,061,359 | 4,919,446 | 3,274,445 | (1,146,358 | ) | 11,399,757 | |||||||||||
Distributions to Shareholders: | |||||||||||||||||||
From net investment income | |||||||||||||||||||
Class I | (362,782 | ) | (69,846 | ) | (289,056 | ) | (120,976 | ) | (4,645,370 | ) | (8,509,740 | ) | |||||||
Class II | (344,624 | ) | — | — | — | (708,781 | ) | — | |||||||||||
Class III | (685,445 | ) | — | — | — | — | — | ||||||||||||
Class R | — | — | — | — | — | — | |||||||||||||
From net realized gains | |||||||||||||||||||
Class I | (1,381,086 | ) | (815,593 | ) | (1,461,993 | ) | (814,495 | ) | — | — | |||||||||
Class II | (1,380,699 | ) | — | — | — | — | — | ||||||||||||
Class III | (2,628,903 | ) | — | — | — | — | — | ||||||||||||
Class R | — | — | — | — | — | — | |||||||||||||
Total distributions | (6,783,539 | ) | (885,439 | ) | (1,751,049 | ) | (935,471 | ) | (5,354,151 | ) | (8,509,740 | ) | |||||||
From Capital Share Transactions: | |||||||||||||||||||
Proceeds from shares sold | |||||||||||||||||||
Class I | 28,313,307 | 50,370,893 | 3,445,406 | 687,166 | 15,112,012 | 17,430,335 | |||||||||||||
Class II | 26,458,558 | 28,284,448 | — | — | 57,244 | 9,007 | |||||||||||||
Class III | 29,728 | 52,389,299 | — | — | — | — | |||||||||||||
Class IV | — | — | — | — | — | — | |||||||||||||
Class R | — | — | — | — | — | — | |||||||||||||
Distributions reinvested | |||||||||||||||||||
Class I | 1,681,704 | 885,438 | 1,751,051 | 935,471 | 4,260,974 | 4,747,362 | |||||||||||||
Class II | 1,725,322 | — | — | — | 5,404 | 14,060 | |||||||||||||
Class III | 3,314,349 | — | — | — | — | — | |||||||||||||
Class IV | — | — | — | — | — | — | |||||||||||||
Class R | — | — | — | — | — | — | |||||||||||||
Cost of shares redeemed | |||||||||||||||||||
Class I | (4,245,485 | ) | (53,280,511 | ) | (24,851,609 | ) | (696,616 | ) | (27,693,992 | ) | (41,154,418 | ) | |||||||
Class II | (8,925,925 | ) | (16,538,521 | ) | — | — | (32,698,711 | ) | (10,043,336 | ) | |||||||||
Class III | (66,872 | ) | — | — | — | — | — | ||||||||||||
Class IV | — | — | — | — | — | — | |||||||||||||
Class R | — | — | — | — | — | — | |||||||||||||
Net increase (decrease) in net assets | |||||||||||||||||||
from share transactions | 48,284,686 | 62,111,046 | (19,655,152 | ) | 926,021 | (40,957,069 | ) | (28,996,990 | ) | ||||||||||
| Net Increase (Decrease) in Net Assets | 28,882,440 | 67,286,966 | (16,486,755 | ) | 3,264,995 | (47,457,578 | ) | (26,106,973 | ) | ||||||||||
Net Assets | |||||||||||||||||||
Beginning | 71,949,100 | 4,662,134 | 23,827,026 | 20,562,031 | 97,728,292 | 123,835,265 | |||||||||||||
Ending | $ | 100,831,540 | $ | 71,949,100 | $ | 7,340,271 | $ | 23,827,026 | $ | 50,270,714 | $ | 97,728,292 | |||||||
| Undistributed net investment income, ending | $ | 413,930 | $ | 232,004 | $ | 89,535 | $ | 230,581 | $ | 243,250 | $ | 379,859 | |||||||
Shares sold | 1,688,592 | 3,359,152 | 244,259 | 50,330 | 1,521,238 | 1,746,153 | |||||||||||||
Distributions reinvested | 110,493 | 59,385 | 133,363 | 69,811 | 433,889 | 474,222 | |||||||||||||
Shares redeemed | (279,597 | ) | (3,470,050 | ) | (1,419,579 | ) | (49,417 | ) | (2,806,757 | ) | (4,113,220 | ) | |||||||
Net Class I Share Activity | 1,519,488 | (51,513 | ) | (1,041,957 | ) | 70,724 | (851,630 | ) | (1,892,845 | ) | |||||||||
Shares sold | 1,621,046 | 1,826,780 | — | — | 5,705 | 899 | |||||||||||||
Distributions reinvested | 113,210 | — | — | — | 386 | 1,407 | |||||||||||||
Shares redeemed | (544,129 | ) | (1,031,890 | ) | — | — | (3,305,489 | ) | (976,681 | ) | |||||||||
Net Class II Share Activity | 1,190,127 | 794,890 | — | — | (3,299,398 | ) | (974,375 | ) | |||||||||||
Shares sold | 1,938 | 3,409,885 | — | — | — | — | |||||||||||||
Distributions reinvested | 217,334 | — | — | — | — | — | |||||||||||||
Shares redeemed | (3,906 | ) | — | — | — | — | — | ||||||||||||
Net Class III Share Activity | 215,366 | 3,409,885 | — | — | — | — | |||||||||||||
Shares sold | — | — | — | — | — | — | |||||||||||||
Distributions reinvested | — | — | — | — | — | — | |||||||||||||
Shares redeemed | — | — | — | — | — | — | |||||||||||||
Net IV Share Activity | — | — | — | — | — | — | |||||||||||||
Shares sold | — | — | — | — | — | — | |||||||||||||
Distributions reinvested | — | — | — | — | — | — | |||||||||||||
Shares redeemed | — | — | — | — | — | — | |||||||||||||
Net Class R Share Activity | — | — | — | — | — | — | |||||||||||||
See Accompanying Notes to Financial Statements.
66 & 67
NICHOLAS-APPLEGATE INSTITUTIONAL FUNDS
NOTES TO FINANCIAL STATEMENTS
NOTE A — ORGANIZATION
Nicholas-Applegate Institutional Funds (the “Trust”) is an open-end investment management company. The Trust was established as a Delaware business trust on December 17, 1992 and consists of thirteen separate portfolios (collectively, the “Funds” and each, a “Fund”). Each Fund’s investment objectives, strategies and risks are discussed in the Funds’ current prospectuses. All of the Funds have issued Class I shares (“Class I”), seven Funds have issued Class II shares (“Class II”), one Fund has issued Class III shares (“Class III”), one Fund has issued Class IV shares (“Class IV”) and three Funds have issued Retirement shares (“Class R”). No shares have a sales charge. Class R shares are charged a distribution fee. The Funds offering Class I, Class II, Class III and Class IV shares are covered in this report.
NOTE B — SIGNIFICANT ACCOUNTING POLICIES
Significant accounting policies consistently followed by the Funds in preparing these financial statements are described below. The policies conform with accounting principles generally accepted in the United States.
Security Valuations
Equity securities, including ADRs, SDRs and GDRs, that are traded on a stock exchange or on the NASDAQ National Market System are valued at the last sale price as of the close of business on the New York Stock Exchange (normally 4:00 p.m. New York time) on the day the securities are being valued, or lacking any sales, at the mean between the closing bid and asked prices. Securities listed or traded on certain non- U.S. exchanges whose operations are similar to the United States over-the-counter market are valued at the price within the limits of the latest available current bid and asked prices deemed by the Adviser to best reflect fair value. A security that is listed or traded on more than one exchange is valued at the quotation on the exchange determined to be the primary market for such security by the Adviser. The Adviser has determined the Xetra is the primary market in Germany. Equity Linked Notes (“ELN’s) are valued by using the closing local price for the underlying security and are translated into U.S. dollars at the exchange rate struck at the close of the London Stock Exchange.
The Funds value long-term debt obligations, including high quality and high yield corporate securities, municipal securities, asset-backed securities, collateralized mortgage obligations and US Government and Agency issues, at the quoted bid price provided by an approved bond pricing service. Convertible securities are normally priced at the mean between the bid and ask prices. Short-term debt instruments, (e.g., commercial paper, bankers acceptances, U.S. Treasury Bills, etc.) having a maturity of less than 60 days will be valued at amortized cost. If a fixed income security has a maturity of greater than 60 days, it will be valued at market price.
Securities or other assets for which reliable market quotations are not readily available or for which the pricing agent or principal market maker does not provide a valuation or methodology or provides a valuation or methodology that, in the judgment of the Adviser does not represent fair value (Fair Value Securities), are valued by the Pricing Committee overseen by the Board of Trustees in consultation as applicable, with the Adviser’s portfolio managers, traders, and research and credit analysts and legal and compliance personnel. Fair Value Securities may include, but are not limited to, the following: certain private placements and restricted securities that do not have an active trading market; securities whose trading has been suspended or for which there is no current market; securities whose prices are stale; securities denominated in currencies that are restricted, untraded, or for which exchange rates are disrupted; securities affected by significant events; and securities that the Adviser or Pricing Committee believe were priced incorrectly. A “significant event” (which includes, but is not limited to, an extraordinarily political or market event) is an event that the Adviser or Pricing Committee believes with a reasonably high degree of certainty has caused the closing market prices of a Fund’s portfolio securities to no longer reflect their value at the time of the Fund’s NAV calculation.
Security Transactions and Investment Income
Security transactions are accounted for as of trade date. Realized gains and losses from security transactions are determined on an identified-cost basis.
Dividend income is recorded on the ex-dividend date or, for certain non-U.S. securities, when the information becomes available to the Funds. Interest income is recorded on an accrual basis. Discounts and premiums on debt securities are accreted and amortized on the yield to maturity basis.
Non-U.S. Currency Transactions
At each net asset valuation date, the value of assets and liabilities denominated in non-U.S. currencies are translated into U.S. dollars using the current exchange rate at the spot rate at 11:00 a.m. Eastern Time against the U.S. dollar, as provided by an approved pricing service. Security transactions, income and expenses are converted at the prevailing exchange rate on the day of the event. The effect of changes in exchange rates on securities denominated in a non-U.S. currency is included with the net realized and unrealized gain or loss of the associated security. Other Non- U.S. currency gains or losses are reported separately.
Certain Funds may use forward non-U.S. currency contracts to reduce their exposure to currency fluctuations of their non- U.S. securities. These contracts are commitments to purchase or sell a non-U.S. currency at a specified rate on a future date. When the contract is fulfilled or closed, gains or losses are realized. Until then, the gain or loss is included in unrealized appreciation or depreciation of investments. The contract commitment is fully collateralized by cash or securities of the Fund. Non-U.S. denominated assets and forward currency contracts may involve more risks than U.S. transactions, including currency risk, political and economic risk, regulatory and market risk. Evaluating and monitoring such risk exposure is a part of the Funds’ management strategy. There were no such forward non-U.S. currency contracts at March 31, 2008.
68
Futures Contracts
Each Fund may enter into futures contracts involving non-U.S. currency, interest rates, securities, and securities indices, for hedging purposes only. A futures contract obligates the seller of the contract to deliver and the purchaser of the contract to take delivery of the type of non-U.S. currency, financial instrument or security called for in the contract at a specified future time for a specified price. Upon entering into such a contract, a Fund is required to deposit and maintain as collateral such initial margin as required by the exchange on which the contract is traded. Pursuant to the contract, a Fund agrees to receive from or pay to the broker an amount equal to the daily fluctuations in the value of the contract. Such receipts or payments are known as variation margin and are recorded as unrealized gains or losses by the Fund. When the contract is closed, the Fund records a realized gain or loss equal to the difference between the value of the contract at the time it was opened and the value at the time it was closed. There were no such futures contracts at March 31, 2008.
Options Contracts
The Funds may: (a) buy call options on non-U.S. currency in anticipation of an increase in the value of the underlying asset; (b) buy put options on non-U.S. currency, portfolio securities, and futures in anticipation of a decrease in the value of the underlying asset; and (c) write call options on portfolio securities and futures to generate income from premiums, and in anticipation of a decrease or only limited increase in the value of the underlying asset. If a call written by a Fund is exercised, the Fund foregoes any possible profit from an increase in the market price of the underlying asset over the exercise price plus the premium received. When a Fund writes options on futures contracts, it will be subject to margin requirements similar to those applied to futures contracts. There were no such options contracts at March 31, 2008.
Equity-Linked Securities
Certain Funds may purchase equity-linked securities, also known as participation notes, equity swaps, and zero strike calls and warrants. Equity-linked securities are primarily used by a Fund as an alternative means to more efficiently and effectively access the securities market of what is generally an emerging securities market. The Fund deposits an amount of cash with its custodian (or broker, if legally permitted) in an amount near or equal to the selling price of the underlying security in exchange for an equity linked security. Upon sale, the Fund receives cash from the broker or custodian equal to the value of the underlying security. Aside from market risk of the underlying securities, there is a risk of default by the counterparty to the transaction. In the event of insolvency of the counterparty, the Fund might be unable to obtain its expected benefit. In addition, while a Fund will seek to enter into such transactions only with parties which are capable of entering into closing transactions with the Fund, there can be no assurance that the Fund will be able to close out such a transaction with the counterparty or obtain an offsetting position with any counterparty, at any time prior to the end of the term of the underlying agreement. This may impair the Fund’s ability to enter into other transactions at a time when doing so might be advantageous.
Securities Lending
In order to generate expense offset credits, each of the Funds may lend portfolio securities, on a short-term or a long-term basis, up to 30% of a Fund’s total assets. The loans are secured by collateral in the form of cash, cash equivalents, U.S. government and agency securities equal to at least 102% of the market value of securities loaned on U.S. securities and 105% of the market value loaned on non-U.S. securities. During the term of the loan, the Funds will continue to receive any interest, dividends or amounts equivalent thereto, on the loaned securities while receiving a fee from the borrower and/or earning interest on the investment of the cash collateral. Upon termination of the loan, the borrower will return to the lender securities identical to the loaned securities. The Funds may pay reasonable finders’, administration and custodial fees in connection with a loan of its securities and may share the interest earned on the collateral with the borrower.
The Funds bear the risk of delay in recovery of, or even loss of rights in, the securities loaned should the borrower of the securities fail financially. The Funds also bear the risk of loss in the event the securities purchased with cash collateral depreciate in value. Loans are subject to termination at the option of the borrower or the Fund. The market value of securities on loan and the related collateral at March 31, 2008 were:
Fund | Market Value | Collateral | |||||
| U.S. Micro Cap | $ | 6,463,304 | $ | 6,714,510 | |||
| U.S. Emerging Growth | 1,294,828 | 1,328,506 | |||||
| U.S. Systematic Large Cap Growth | 56,080 | 57,250 | |||||
| Global Select | 2,091,524 | 2,205,728 | |||||
| International Growth | 668,577 | 690,354 | |||||
| International Growth Opportunities | 15,715,526 | 16,717,327 | |||||
| Emerging Markets | 147,608 | 150,800 | |||||
| International Systematic | 653,061 | 688,169 | |||||
| International All Cap Growth | 130,253 | 136,888 | |||||
Credit Facility
The Trust has a $15 million credit facility available to fund temporary or emergency borrowing expiring in March 2009. Each Fund pays its pro-rata share of an annual commitment fee plus interest on its specific borrowings. For the period ended March 31, 2008, the Funds did not borrow against the line of credit.
Commitments and Contingencies
In the normal course of business, the Funds may enter into contracts and agreements that contain a variety of representations and warranties which provide general indemnifications. The maximum exposure to the Funds under these arrangements is unknown, as this would involve future claims that may be made against the Funds that have not yet occurred. However, based on experience, the Funds expect the risks of loss to be remote.
69
NICHOLAS-APPLEGATE INSTITUTIONAL FUNDS
NOTES TO FINANCIAL STATEMENTS — Continued
Fund Expenses and Multi-Class Allocations
Each Fund bears expenses incurred specifically on its behalf plus an allocation of its share of Trust level expenses. Each share offered by a Fund has equal rights to assets but incurs certain Class specific expenses. The Funds allocate income, gains and losses, both realized and unrealized, and expenses, except for Class specific expenses, based on the relative net assets of each share class.
During the year ended March 31, 2008, many of the brokers with whom the Adviser places trades on behalf of the Funds provided services to the Funds in addition to trade execution. These services included payments of certain expenses on behalf of the Funds. In addition, through arrangements with the Funds’ custodian, credits realized as a result of uninvested cash balances were used to reduce the Funds’ expenses. During the period ended March 31, 2008, the credits used to reduce the Funds’ expenses were:
Fund | Credit Interest Offset | Direct Brokerage Offset | Security Lending Offset | |||||||
| U.S. Micro Cap | 35,952 | 14,122 | 115,653 | |||||||
| U.S. Emerging Growth | 11,585 | 493 | 45,809 | |||||||
| U.S. Ultra Micro Cap | 209 | — | — | |||||||
| U.S. Systematic Large Cap Growth | 9,235 | (1,769 | ) | (1,501 | ) | |||||
| U.S. Small to Mid Cap Growth | 2,587 | 2,943 | — | |||||||
| U.S. Convertible | 268,326 | — | 3,446 | |||||||
| Global Select | 69,791 | 3,746 | 106,404 | |||||||
| International Growth | 21,879 | (8,668 | ) | 108,050 | ||||||
| International Growth Opportunities | 123,996 | 47,138 | 394,736 | |||||||
| Emerging Markets | 34,723 | 835 | 36,667 | |||||||
| International Systematic | 122,656 | 54,043 | 66,666 | |||||||
| International All Cap Growth | 14,927 | 7,430 | 21,167 | |||||||
| U.S. High Yield Bond | 54,186 | — | — | |||||||
Use of Estimates
The preparation of financial statements in conformity with accounting principles generally accepted in the United States requires management to make estimates and assumptions that affect the amounts reported in the financial statements and accompanying notes. Actual results could differ from these estimates.
NOTE C — FEDERAL INCOME TAXES
The Funds intend to comply with the requirements of the Internal Revenue Code applicable to regulated investment companies and to distribute substantially all of their taxable income to shareholders. Accordingly, no provision for federal income taxes is required.
The Financial Accounting Standards Board (“FASB”) has recently issued Interpretation No. 48, Accounting for Uncertainty in Income Taxes — an Interpretation of FASB Statement No.109 (“FIN 48”), which applies to all registered investment companies and clarifies the accounting for uncertain tax positions. FIN 48 requires the evaluation of tax positions taken, or expected to be taken, in the course of preparing the Funds’ tax returns to determine whether the tax positions are “more-likely-than-not” of being sustained by the applicable tax authority. To the extent that a tax benefit of a position is not deemed to meet the more-likely-than-not threshold, the Funds would report an income tax expense in the statement of operations. Management has reviewed the tax positions for each of the three open tax years as of March 31, 2008 and has determined that the implementation of FIN 48 did not have a material impact on the Funds’ financial statements. Each Fund’s federal tax returns for the prior three fiscal years remains subject to examination by the Internal Revenue Service.
A Fund investing in foreign securities records any foreign taxes on income and gains on such investments in accordance with the applicable tax rules. The Funds’ tax accounting treatment of loss deferrals, accretion, passive foreign investment companies and expiration of capital loss carryforwards are different from the financial statement recognition of income and gains.
Capital loss carryforwards may be used to offset current or future capital gains until expiration.
Distributions to Shareholders
The Funds record distributions to shareholders on the ex-dividend date. Distributions are determined in accordance with income tax regulations that may differ from generally accepted accounting principles. Accordingly, the Funds’ capital accounts are periodically reclassified to reflect income and gains available for distribution under income tax regulations. The Funds make income and capital gain distributions at least annually. Funds with income objectives make distributions either quarterly or monthly in accordance with the prospectuses.
70
The tax characters of distributions paid during the fiscal year ended March 31, 2008 were as follows:
Distribution paid from: | ||||||||||||||||
Fund | Ordinary Income | Net long term capital gain | Total taxable distributions | Tax return of capital | Total distributions paid(1) | |||||||||||
| U.S. Micro Cap | 2,775,867 | 7,119,776 | 9,895,643 | — | 9,895,643 | |||||||||||
| U.S. Emerging Growth | — | 745,409 | 745,409 | — | 745,409 | |||||||||||
| U.S. Ultra Micro Cap | — | — | — | — | — | |||||||||||
| U.S. Systematic Large Cap Growth | 16,091 | — | 16,091 | — | 16,091 | |||||||||||
| U.S. Small to Mid Cap Growth | — | — | — | — | — | |||||||||||
| U.S. Convertible | 3,242,287 | 899,190 | 4,141,477 | — | 4,141,477 | |||||||||||
| Global Select | 7,863,884 | 12,723,302 | 20,587,186 | — | 20,587,186 | |||||||||||
| International Growth | 3,113,776 | 12,917,360 | 16,031,136 | — | 16,031,136 | |||||||||||
| International Growth Opportunities | 18,430,532 | 24,802,296 | 43,232,828 | — | 43,232,828 | |||||||||||
| Emerging Markets | 4,535,495 | 65,123 | 4,600,618 | — | 4,600,618 | |||||||||||
| International Systematic | 6,301,754 | 481,785 | 6,783,539 | — | 6,783,539 | |||||||||||
| International All Cap Growth | 289,056 | 1,461,993 | 1,751,049 | — | 1,751,049 | |||||||||||
| U.S. High Yield Bond | 5,354,151 | — | 5,354,151 | — | 5,354,151 | |||||||||||
The tax characters of distributions paid during the fiscal year ended March 31, 2007 were as follows:
Distribution paid from: | ||||||||||||||||
Fund | Ordinary Income | Net long term capital gain | Total taxable distributions | Tax return of capital | Total distributions paid(1) | |||||||||||
| U.S. Micro Cap | 5,602,977 | 3,661,799 | 9,264,776 | — | 9,264,776 | |||||||||||
| U.S. Emerging Growth | — | 739,964 | 739,964 | — | 739,964 | |||||||||||
| U.S. Systematic Large Cap Growth | 1,377 | — | 1,377 | — | 1,377 | |||||||||||
| U.S. Convertible | 1,305,908 | 3,345,184 | 4,651,092 | — | 4,651,092 | |||||||||||
| Global Select | 8,281,420 | 10,424,975 | 18,706,395 | — | 18,706,395 | |||||||||||
| International Growth | 6,638,836 | 7,370,298 | 14,009,134 | — | 14,009,134 | |||||||||||
| International Growth Opportunities | — | 7,183,710 | 7,183,710 | — | 7,183,710 | |||||||||||
| Emerging Markets | 6,966 | — | 6,966 | — | 6,966 | |||||||||||
| International Systematic | 747,001 | 138,438 | 885,439 | — | 885,439 | |||||||||||
| International All Cap Growth | 120,976 | 814,495 | 935,471 | — | 935,471 | |||||||||||
| U.S. High Yield Bond | 8,509,740 | — | 8,509,740 | — | 8,509,740 | |||||||||||
71
NICHOLAS-APPLEGATE INSTITUTIONAL FUNDS
NOTES TO FINANCIAL STATEMENTS — Continued
As of March 31, 2008, the components of accumulated earnings/(deficit) on a tax basis were as follows:
Components of accumulated earnings/(deficit): | |||||||||||||||||||
Fund | Undistributed ordinary income | Undistributed long-term capital gains | Accumulated earnings | Accumulated capital and other losses | Unrealized appreciation/ (depreciation) | Total accumulated earning/(deficit) | |||||||||||||
| U.S. Micro Cap | — | — | — | (950,767)(2 | ) | (1,917,780)(3 | ) | (2,868,547 | ) | ||||||||||
| U.S. Emerging Growth | — | — | — | (4,963,910)(2 | ) | (475,049)(3 | ) | (5,438,959 | ) | ||||||||||
| U.S. Ultra Micro Cap | — | — | — | (12,315)(2 | ) | (49,484)(3 | ) | (61,799 | ) | ||||||||||
| U.S. Systematic Large Cap Growth | — | — | — | (6,739,996)(2 | ) | 438,206(3 | ) | (6,301,790 | ) | ||||||||||
| U.S. Small to Mid Cap Growth | — | — | — | (320,425)(2 | ) | (183,428)(3 | ) | (503,853 | ) | ||||||||||
| U.S. Convertible | 849,262 | 1,052,403 | 1,901,665 | (6,287,114)(2 | ) | 894,873(3 | ) | (3,490,576 | ) | ||||||||||
| Global Select | 11,417,868 | 20,545,145 | 31,963,013 | (2,158,980)(2 | ) | 5,743,465(4 | ) | 35,547,498 | |||||||||||
| International Growth | 460,556 | 3,212,580 | 3,673,136 | (12,311,906)(2 | ) | 1,687,295(3 | ) | (6,951,475 | ) | ||||||||||
| International Growth Opportunities | 5,778,192 | 8,811,650 | 14,589,843 | (19,734,285)(2 | ) | 14,029,630(4 | ) | 8,885,187 | |||||||||||
| Emerging Markets | 3,315,108 | 183,454 | 3,498,561 | — | 214,790(3 | ) | 3,713,352 | ||||||||||||
| International Systematic | 425,455 | — | 425,455 | (10,031,494)(2 | ) | (3,871,361)(3 | ) | (13,477,400 | ) | ||||||||||
| International All Cap Growth | 224,682 | 1,426,788 | 1,651,470 | (4,580,346)(2 | ) | 649,068(3 | ) | (2,279,808 | ) | ||||||||||
| U.S. High Yield Bond | 243,250 | — | 243,251 | (4,161,345)(2 | ) | (2,377,445)(3 | ) | (6,295,540 | ) | ||||||||||
| (1) | Total distributions paid differ from the Statement of Changes in Net Assets because for tax purposes, dividends are recognized when actually paid. |
| (2) | The following Funds had net capital loss carryforwards of approximately: |
Fund | Net Capital Loss CarryForward (in 000’s) | Expiration | Post October Losses (in 000’s) | |||||||
| U.S. Micro Cap | 951 | |||||||||
| U.S. Emerging Growth | 1,030 | March 31, 2011 | 110 | |||||||
| 3,824 | March 31, 2010 | |||||||||
| U.S. Ultra Micro Cap | 12 | |||||||||
| U.S. Systematic Large Cap Growth | 321 | March 31, 2012 | ||||||||
| 2,665 | March 31, 2011 | |||||||||
| 3,754 | March 31, 2010 | |||||||||
| U.S. Small to Mid Cap Growth | 99 | March 31, 2016 | 221 | |||||||
| U.S. Convertible | 5,427 | March 31, 2011 | 860 | |||||||
| Global Select | 1,079 | March 31, 2010 | ||||||||
| 1,079 | March 31, 2009 | |||||||||
| International Growth | 10,739 | March 31, 2011 | ||||||||
| 1,573 | March 31, 2010 | |||||||||
| International Growth Opportunities | 19,734 | March 31, 2011 | ||||||||
| International Systematic | 10,031 | |||||||||
| International All Cap Growth | 1,527 | March 31, 2011 | ||||||||
| 3,053 | March 31, 2010 | |||||||||
| U.S. High Yield Bond | 2,948 | March 31, 2011 | 604 | |||||||
| 609 | March 31, 2010 | |||||||||
72
To the extent future capital gains are offset by capital loss carryforwards, such gains will not be distributed. The availability of loss carryforwards to any future years may be substantially limited as a result of past or future ownership changes as determined under Internal Revenue Code Section 382.
Net capital losses incurred after October 31, and within the taxable year are deemed to arise on the first business day of the Fund’s next taxable year. For the year ended March 31, 2008, the Fund deferred to April 1, 2008 , post October capital and currency losses.
| (3) | The difference between book-basis and tax-basis unrealized appreciation/(depreciation) is attributable primarily to the tax deferral of losses on wash sales |
| (4) | The difference between book-basis and tax-basis unrealized appreciation/(depreciation) is attributable primarily to the tax deferral of losses on wash sales and mark to market on PFICs |
NOTE D — TRANSACTIONS WITH AFFILIATES
Investment Advisory Fee
The Adviser receives a monthly fee at an annual rate based on the average daily net assets of the Funds. The investment Advisory Fee rates for each of the Funds are listed in the table below.
Administrative & Shareholder Services Fee
On January 24, 2006, the Funds entered into an Administration Agreement whereby the Funds pay for the administrative services they require under what is essentially an all-in fee structure. Class I, II, III & IV shareholders of the Funds pay an administrative fee to the Adviser computed as a percentage of the Funds’ average net assets attributable in the aggregate to Class I, II, III & IV shares. The Adviser, in turn, provides or procures administrative and shareholder services for Class I, II, III & IV shareholders and also bears the costs of most third-party administrative services required by the Funds, including audit, custodial, portfolio accounting, legal, transfer agency and printing costs. The administrative fees paid to the Adviser may exceed the related costs. Generally, this may not be the case for relatively small funds. The Funds do bear other expenses which are not covered under the administrative fee which may vary and affect the total level of expenses paid by Class I, II, III & IV shareholders, such as brokerage fees, taxes, commissions and other transaction expenses, costs of borrowing money, including interest expenses, extraordinary expenses (such as litigation and indemnification expenses) and fees and expenses of one interested Trustee and the Independent Trustees of the Trust and their counsel.
The investment advisory and administrative services fees are charged at the following annual rates:
Advisory Fee | Administration Fee* | ||||
Fund | Class I | Class II | Class III | Class IV | |
| U.S. Micro Cap | 1.00% | 0.54% | — | — | — |
| U.S. Emerging Growth | 0.75% | 0.41% | — | — | — |
| U.S. Ultra Micro Cap (1) | 1.50% | 0.73% | — | — | — |
| U.S. Systematic Large Cap Growth | 0.45% | 0.64% | 0.49% | — | — |
| U.S. Small to Mid Cap Growth | 0.50% | 0.40% | — | — | — |
| U.S. Convertible | 0.55% | 0.44% | 0.34% | — | 0.19% |
| Global Select | 0.65% | 0.47% | 0.42% | — | — |
| International Growth | 0.50% | 0.86% | 0.46% | — | — |
| International Growth Opportunities | 0.70% | 0.69% | 0.54% | — | — |
| Emerging Markets | 0.90% | 0.42% | 0.32% | — | — |
| International Systematic | 0.50% | 0.48% | 0.33% | 0.23% | — |
| International All Cap Growth | 0.85% | 0.27% | — | — | — |
| U.S. High Yield Bond | 0.40% | 0.20% | — | — | — |
(1) | Commenced 1/28/08 |
* | Excludes trustees’ fees and expenses, tax, brokerage and interest expenses, and extraordinary expenses. |
Securities Lending Fees
The U.S. Micro Cap and U.S. Systematic Large Cap Growth Fund participate in an agency securities lending program with an affiliated agent, Dresdner Bank AG a direct subsidiary to Allianz AG and affiliate to the Trust (“Dresdner Program”). Income generated from the investment of cash collateral, less negotiated rebate fees paid to borrowers and transaction costs, is divided pursuant to the Dresdner Program Agency Agreement between the Funds and Dresdner Bank AG. The amount paid to Dresdner Bank AG for the year ended March 31, 2008 was $13,576. Cash collateral received for securities on loan is invested in securities identified in the Schedules of Investments and the corresponding liability is recognized as such in the Statements of Assets and Liabilities.
73
NICHOLAS-APPLEGATE INSTITUTIONAL FUNDS
NOTES TO FINANCIAL STATEMENTS — Continued
Trustee Compensation
Certain officers of the Trust are also officers of the Investment Adviser and the Distributor. During the period ended March 31, 2008, the Trustees who were not affiliated with the Investment Adviser received aggregate annual compensation of $185,546 from the Trust. Effective February 2008, the Trustees who are not affiliated with the Investment Adviser will receive annual compensation of approximately $34,000 each from the Trust, except for the chairman of the Board of Trustees of the Trust and the chairman of the Audit Committee, who will receive annual compensation of approximately $40,000 and $39,000, respectively, from the Trust.
NOTE E — INVESTMENT TRANSACTIONS
The following table presents purchases and sales of securities, excluding short-term investments, during the period ended March 31, 2008, to indicate the volume of transactions in each Fund. The tax cost of securities held at March 31, 2008, and the related gross and net unrealized appreciation and depreciation, provide aggregate information on a tax basis against which future gains and losses on these investments are measured for distribution purposes.
Fund | Purchases (in 000’s) | Sales (in 000’s) | Tax Cost (in 000’s) | Gross Unrealized Appreciation (in 000’s) | Gross Unrealized Depreciation (in 000’s) | Net Unrealized Appreciation (Depreciation) (in 000’s) | |||||||||||||
| U.S. Micro Cap | $ | 112,739 | $ | 132,126 | $ | 68,723 | $ | 7,161 | $ | (9,079 | ) | $ | (1,918 | ) | |||||
| U.S. Emerging Growth | 14,995 | 14,399 | 12,140 | 866 | (1,341 | ) | (475 | ) | |||||||||||
| U.S. Ultra Micro Cap | 1,055 | 117 | 935 | 40 | (89 | ) | (49 | ) | |||||||||||
| U.S. Systematic Large Cap Growth | 20,086 | 20,064 | 16,823 | 1,921 | (1,483 | ) | 438 | ||||||||||||
| U.S. Small to Mid Cap Growth | 10,254 | 5,018 | 5,048 | 293 | (476 | ) | (183 | ) | |||||||||||
| U.S. Convertible | 351,027 | 180,388 | 310,457 | 11,669 | (10,774 | ) | 895 | ||||||||||||
| Global Select | 91,373 | 234,718 | 36,810 | 8,324 | (2,595 | ) | 5,729 | ||||||||||||
| International Growth | 42,177 | 98,590 | 22,504 | 4,004 | (2,324 | ) | 1,680 | ||||||||||||
| International Growth Opportunities | 169,410 | 328,427 | 125,557 | 25,102 | (11,071 | ) | 14,031 | ||||||||||||
| Emerging Markets | 62,918 | 92,214 | 16,216 | 2,017 | (1,839 | ) | 178 | ||||||||||||
| International Systematic | 231,826 | 191,922 | 105,424 | 8,789 | (12,526 | ) | (3,737 | ) | |||||||||||
| International All Cap Growth | 17,225 | 38,868 | 6,834 | 1,197 | (551 | ) | 646 | ||||||||||||
| U.S. High Yield Bond | 52,841 | 85,271 | 51,828 | 493 | (2,870 | ) | (2,377 | ) | |||||||||||
Gains and losses resulting from the subscriptions-in-kind and redemptions-in-kind are included in the realized gain/loss from securities and non-U.S. currency transactions. During the year ended March 31, 2008, the U.S. Micro Cap, U.S. Small to Mid Cap Growth, and Emerging Markets Funds had subscriptions-in-kind valued at $4,689,112, $5,325,073, and $1,600,545, respectively. The International Growth, International Growth Opportunities, and International All Cap Growth Funds had redemptions-in-kind valued at $62,922,703, $91,358,169 and $23,642,996, respectively. In addition to the redemptions-in-kind the International Growth, International Growth Opportunities, and International All Cap Growth Funds had realized gains of $14,673,319, $16,714,438 and $6,011,641, respectively.
NOTE F — FINANCIAL INSTRUMENTS
The Funds may be party to financial instruments with off-balance sheet risks, including forward non-U.S. currency contracts, primarily in an attempt to minimize the risk to the Fund, in respect of its portfolio transactions. These instruments involve market and/or credit risk in excess of the amount recognized in the Statement of Assets and Liabilities. Risks arise from the possible inability of counterparties to meet the terms of their contracts and from unexpected movement in currencies, securities values and interest rates.
The contract amounts indicate the extent of the Funds’ involvement in such contracts. For the year ended March 31, 2008 the Funds were not party to any such agreements.
NOTE G — NEW ACCOUNTING PRONOUNCEMENTS
In September 2006, FASB issued FASB Statement No. 157, “Fair Value Measurement” (“SFAS 157”), which defines fair value, establishes a framework for measuring fair value, and expands disclosures about fair value measurements. SFAS 157 is effective for fiscal years beginning after November 15, 2007, and interim periods within those fiscal years. Management is currently evaluating the impact the adoption of FAS 157 will have on the Trust’s financial statement disclosure.
In March 2008, Statement of Financial Accounting Standards No. 161, Disclosures about Derivative Instruments and Hedging Activities (SFAS 161), was issued and is effective for fiscal years beginning after November 15, 2008. SFAS 161 requires enhanced disclosures to provide information about the reasons the Fund invests in derivative instruments, the accounting treatment and the effect derivatives have on financial performance. Management is currently evaluating the impact the adoption of SFAS 161 will have on the Fund’s financial statement disclosures.
74
NICHOLAS-APPLEGATE INSTITUTIONAL FUNDS
REPORT OF INDEPENDENT REGISTERED PUBLIC ACCOUNTING FIRM
To the Shareholders and Board of Trustees of
Nicholas-Applegate Institutional Funds
In our opinion, the accompanying statements of assets and liabilities, including the schedules of investments, and the related statements of operations and changes in net assets and the financial highlights present fairly, in all material respects, the financial position of each of the portfolios comprising the Nicholas-Applegate Institutional Funds (collectively, the "Funds") at March 31, 2008, and the results of each of their operations for the year then ended, the changes in each of their net assets for the two years in the period then ended and each of their financial highlights for the five years in the period then ended (for the Nicholas-Applegate International All-Cap Growth Fund, for the three years in the period ended March 31, 2008), in conformity with accounting principles generally accepted in the United States of America. These financial statements and financial highlights (hereafter referred to as "financial statements") are the responsibility of the Funds' management; our responsibility is to express an opinion on these financial statements based on our audits. We conducted our audits of these financial statements in accordance the standards of the Public Company Accounting Oversight Board (United States). Those standards require that we plan and perform the audit to obtain reasonable assurance about whether the financial statements are free of material misstatement. An audit includes examining, on a test basis, evidence supporting the amounts and disclosures in the financial statements, assessing the accounting principles used and significant estimates made by management, and evaluating the overall financial statement presentation. We believe that our audits, which included confirmation of securities owned at March 31, 2008 by correspondence with the custodian and brokers, provide a reasonable basis for our opinion. The financial highlights of the Nicholas-Applegate International All-Cap Growth Fund for the two years in the period ended March 31, 2005 were audited by another independent registered public accounting firm whose report dated April 22, 2005 expressed an unqualified opinion thereon.
PricewaterhouseCoopers LLP
Los Angeles, California
May 27, 2008
75
SHAREHOLDER EXPENSE EXAMPLE — (Unaudited)
As a shareholder of a Fund, you incur two types of costs: (1) transaction costs, including redemption fees, and (2) ongoing costs, including management fees and other Fund expenses. This example is intended to help you understand your ongoing costs (in dollars) of investing in the Funds and to compare these costs with the ongoing costs of investing in other mutual funds.
The example is based on an investment of $1,000 invested at the beginning of the period and held for the entire period (October 1, 2007 to March 31, 2008).
ACTUAL EXPENSES
The first line of the table below for each Fund provides information about actual account values and actual expenses. You may use the information in this line, together with the amount you invested, to estimate the expenses that you paid over the period. Simply divide your account value by $1,000 (for example, an $8,600 account value divided by $1,000 = 8.6), then multiply the result by the number in the first line for a Fund under the heading “Expenses Paid During Period” to estimate the expenses you paid on your account during this period.
HYPOTHETICAL EXAMPLE FOR COMPARISON PURPOSES
The second line of the table below for each Fund provides information about hypothetical account values and hypothetical expenses based on a Fund’s actual expense ratio and an assumed rate of return if 5% per year before expenses, which is not the Fund’s actual return. The hypothetical account values and expenses may not be used to estimate the actual ending account balance or expenses you paid for the period. You may use this information to compare the ongoing costs of investing in a Fund and other funds. To do so, compare this 5% hypothetical example with the 5% hypothetical examples that appear in the shareholder reports of the other funds.
Please note that the expenses shown in the table are meant to highlight your ongoing costs only and do not reflect any transaction costs. Therefore, the second line of the table is useful in comparing ongoing costs only, and will not help you determine the relative total costs of owning different funds. In addition, if these transactional costs were included, your costs would have been higher.
Beginning Account Value October 1, 2007 | Ending Account Value March 31, 2008 | Expenses Paid During the Period* October 1, 2007 to March 31, 2008 | Annualized Expense Ratio | |
U.S. Micro Cap Growth — Class I | ||||
| Actual | $1,000.00 | $ 780.50 | $7.48 | 1.68% |
| Hypothetical (5% return before expenses) | $1,000.00 | $1,016.60 | $8.47 | 1.68% |
U.S. Emerging Growth — Class I | ||||
| Actual | $1,000.00 | $ 802.40 | $5.50 | 1.22% |
| Hypothetical (5% return before expenses) | $1,000.00 | $1,018.90 | $6.16 | 1.22% |
U.S. Ultra Micro Cap — Class I (1) | ||||
| Actual | $1,000.00 | $ 928.00 | $11.13 | 2.31% |
| Hypothetical (5% return before expenses) | $1,000.00 | $1,013.45 | $11.63 | 2.31% |
U.S. Systematic Large Cap Growth — Class I | ||||
| Actual | $1,000.00 | $ 856.80 | $5.34 | 1.15% |
| Hypothetical (5% return before expenses) | $1,000.00 | $1,019.25 | $5.81 | 1.15% |
U.S. Systematic Large Cap Growth — Class II | ||||
| Actual | $1,000.00 | $ 857.30 | $4.64 | 1.00% |
| Hypothetical (5% return before expenses) | $1,000.00 | $1,020.00 | $5.05 | 1.00% |
U.S. Small to Mid Cap Growth — Class I | ||||
| Actual | $1,000.00 | $ 839.10 | $1.44 | 0.97% |
| Hypothetical (5% return before expenses) | $1,000.00 | $1,020.15 | $1.58 | 0.97% |
U.S. Convertible — Class I | ||||
| Actual | $1,000.00 | $ 939.50 | $5.04 | 1.04% |
| Hypothetical (5% return before expenses) | $1,000.00 | $1,019.80 | $5.25 | 1.04% |
U.S. Convertible — Class II | ||||
| Actual | $1,000.00 | $ 939.70 | $4.56 | 0.94% |
| Hypothetical (5% return before expenses) | $1,000.00 | $1,020.30 | $4.75 | 0.94% |
U.S. Convertible — Class IV | ||||
| Actual | $1,000.00 | $ 940.60 | $3.78 | 0.78% |
| Hypothetical (5% return before expenses) | $1,000.00 | $1,021.10 | $3.94 | 0.78% |
Global Select — Class I | ||||
| Actual | $1,000.00 | $ 882.10 | $5.69 | 1.21% |
| Hypothetical (5% return before expenses) | $1,000.00 | $1,018.95 | $6.11 | 1.21% |
76
Beginning Account Value October 1, 2007 | Ending Account Value March 31, 2008 | Expenses Paid During the Period* October 1, 2007 to March 31, 2008 | Annualized Expense Ratio | |
Global Select — Class II | ||||
| Actual | $1,000.00 | $ 882.20 | $5.51 | 1.17% |
| Hypothetical (5% return before expenses) | $1,000.00 | $1,019.15 | $5.91 | 1.17% |
International Growth — Class I | ||||
| Actual | $1,000.00 | $ 914.10 | $6.60 | 1.38% |
| Hypothetical (5% return before expenses) | $1,000.00 | $1,018.10 | $6.96 | 1.38% |
International Growth — Class II | ||||
| Actual | $1,000.00 | $ 915.30 | $4.74 | 0.99% |
| Hypothetical (5% return before expenses) | $1,000.00 | $1,020.05 | $5.00 | 0.99% |
International Growth Opportunities — Class I | ||||
| Actual | $1,000.00 | $ 860.60 | $6.79 | 1.46% |
| Hypothetical (5% return before expenses) | $1,000.00 | $1,017.70 | $7.36 | 1.46% |
International Growth Opportunities — Class II | ||||
| Actual | $1,000.00 | $ 861.20 | $4.00 | 0.86% |
| Hypothetical (5% return before expenses) | $1,000.00 | $1,020.70 | $4.34 | 0.86% |
Emerging Markets Fund — Class I | ||||
| Actual | $1,000.00 | $ 918.30 | $7.05 | 1.47% |
| Hypothetical (5% return before expenses) | $1,000.00 | $1,017.65 | $7.41 | 1.47% |
Emerging Markets Fund — Class II | ||||
| Actual | $1,000.00 | $ 918.90 | $6.52 | 1.36% |
| Hypothetical (5% return before expenses) | $1,000.00 | $1,018.20 | $6.86 | 1.36% |
International Systematic Fund — Class I | ||||
| Actual | $1,000.00 | $ 842.90 | $4.79 | 1.04% |
| Hypothetical (5% return before expenses) | $1,000.00 | $1,019.80 | $5.25 | 1.04% |
International Systematic Fund — Class II | ||||
| Actual | $1,000.00 | $ 843.50 | $4.15 | 0.90% |
| Hypothetical (5% return before expenses) | $1,000.00 | $1,020.50 | $4.55 | 0.90% |
International Systematic Fund — Class III | ||||
| Actual | $1,000.00 | $ 844.20 | $3.83 | 0.83% |
| Hypothetical (5% return before expenses) | $1,000.00 | $1,020.85 | $4.19 | 0.83% |
International All Cap Growth — Class I | ||||
| Actual | $1,000.00 | $ 916.50 | $5.70 | 1.19% |
| Hypothetical (5% return before expenses) | $1,000.00 | $1,019.05 | $6.01 | 1.19% |
U.S. High Yield Bond — Class I | ||||
| Actual | $1,000.00 | $ 978.40 | $3.17 | 0.64% |
| Hypothetical (5% return before expenses) | $1,000.00 | $1,021.80 | $3.23 | 0.64% |
(1) | U.S. Ultra Micro Cap Fund’s Class I beginning account value on 01/28/08 (Class inception date) |
* | Expenses are equal to the Fund’s annualized expense ratio; multiplied by the average account value over the period. |
77
SUPPLEMENTARY INFORMATION — (Unaudited)
PROXY VOTING — (UNAUDITED)
The Adviser votes proxies on behalf of the Funds pursuant to written policies and procedures adopted by the Funds. To obtain free information on how your Funds’ securities were voted, please call the Funds at 1-800-551-8043 or visit the Funds’ website at www.nacm.com. You may also view how the Fund’s securities were voted by visiting the Securities & Exchange Commission’s website at www.sec.gov. Additionally, information regarding each Fund’s proxy voting record for the most recent twelve month period ended June 30 is also available, free of charge, by calling the Funds at 1-800-551-8043 and from the SEC’s website at www.sec.gov.
ADDITIONAL FEDERAL TAX INFORMATION (UNAUDITED)
The Jobs and Growth Tax Relief Reconciliation Act of 2003 allows a fund to distribute certain dividends paid to its eligible shareholders as qualified dividend income. Of the ordinary income (including short-term capital gain) distributions made by the Funds during the fiscal year ended March 31, 2008, the following percentages represent the amount of qualified income within each Fund:
| U.S. Micro Cap | 9.38 | % | ||
| U.S. Systematic Large Cap Growth | 100.00 | |||
| U.S. Convertible | 26.69 | |||
| Global Select | 26.06 | |||
| International Growth | 43.87 | |||
| International Growth Opportunities | 17.10 | |||
| Emerging Markets | 8.11 | |||
| International Systematic | 32.68 | |||
| International All Cap Growth | 96.10 |
The amounts which represent income derived from sources within, and taxes paid to non-U.S. countries or possessions of the United States are as follows:
Fund | Foreign Source Income | FTC Total: | |||||
| Global Select | $ | 1,631,550 | $ | 86,112 | |||
| International Growth | 926,541 | 55,560 | |||||
| International Growth Opportunities | 3,288,800 | 160,385 | |||||
| Emerging Markets | 714,338 | 53,613 | |||||
| International Systematic | 2,348,136 | 143,061 | |||||
| International All Cap Growth | 358,660 | 20,579 | |||||
The percentage of ordinary dividends paid by the Funds during the year ended March 31, 2008, which qualify for the Dividends Received Deduction available to corporate shareholders was:
Fund | Percentage: | |||
| U.S. Micro Cap | 4.54 | % | ||
| U.S. Systematic Large Cap Growth | 100.00 | |||
| U.S. Convertible | 21.73 | |||
| Global Select | 5.71 | |||
| Emerging Markets | 0.21 | |||
The Funds hereby designate the following approximate amounts as capital gains distributions for the purpose of the Dividends Paid Deduction:
Fund | Amounts: | |||
| U.S. Micro Cap | $ | 7,119,776 | ||
| U.S. Emerging Growth | 745,409 | |||
| U.S. Convertible | 899,190 | |||
| Global Select | 12,723,302 | |||
| International Growth | 12,917,360 | |||
| International Growth Opportunities | 24,802,296 | |||
| Emerging Markets | 65,123 | |||
| International Systematic | 481,785 | |||
| International All Cap Growth | 1,461,993 | |||
78
SUPPLEMENTARY INFORMATION — (Unaudited) — Continued
QUARTERLY FILING
The Funds provide a complete list of portfolio holdings four times in each fiscal year, at the end of each calendar quarter. For the second and fourth quarters, the portfolio holdings appear in the Funds’ semiannual and annual reports to shareholders. For the first and third quarters, the Funds file their portfolio holdings with the Securities and Exchange Commission on Form N-Q. Shareholders can look up the Funds’ Form N-Q on the SEC’s website at www.sec.gov. Forms N-Q may also be reviewed and copied at the SEC’s Public Reference Room in Washington, DC. To find out more about this public service, call the SEC at 1-202-942-8090.
TRUSTEE APPROVAL OF INVESTMENT ADVISORY AGREEMENT
Based upon the recommendation of the Contract Committee of the Board of Trustees, a Committee comprised of all of the Independent Trustees of the Trust (“Funds”), the Trustees unanimously approved the continuance of the Investment Advisory Agreement between the Funds and Nicholas-Applegate Capital Management (“Nicholas-Applegate”) at a meeting held November 14, 2007. In approving the Investment Advisory Agreement, the Board of Trustees, through its Contract Committee, evaluated a comprehensive package of materials, including performance and expense data for other funds with similar asset sizes, investment objectives and policies that had been provided by Lipper Inc. (“Lipper”). Prior to making its recommendation, the Contract Committee reviewed the proposed continuance of the Investment Advisory Agreement with representatives of Nicholas-Applegate and with independent legal counsel to the independent Trustees of the Trust. Members of the Contract Committee also met privately with independent legal counsel to discuss the factors they felt were relevant. The factors included: (1) comparative performance data for each of the Funds and other funds with similar investment objectives/policies and to a relevant index; (2) the nature, extent and quality of investment advisory services rendered by Nicholas-Applegate; (3) marketing and sales efforts dedicated to the Funds; (4) compensation paid to Nicholas-Applegate; (5) costs borne by Nicholas-Applegate; (6) comparative fee and expense data for each of the Funds and other funds with similar investment objectives/policies; (7) Nicholas-Applegate’s policies and practices regarding allocation of portfolio transactions, best price and execution of portfolio transactions, and soft dollar arrangements; (8) fair valuation policy and procedures; (9) expense off-set arrangements; (10) portfolio turnover rates; (11) fall-out benefits, such as research received pursuant to Section 28(e) of the Securities Exchange Act of 1934; (12) fees that Nicholas-Applegate charges its other clients with similar investment objectives/policies; (13) experience and qualifications of each of the members of the portfolio management teams; (14) material changes in personnel managing the Funds; (15) the time dedicated by Nicholas-Applegate’s President and its Chief Investment Officer to the Funds; and (16) Allianz’s commitment to Nicholas-Applegate.
The Contract Committee also considered their confidence in Nicholas-Applegate’s integrity and competence, and Nicholas-Applegate’s responsiveness to questions and issues raised by the Trustees, including its willingness to consider and implement changes designed to improve investment and operational results. In their deliberations, the Contract Committee did not identify any particular information that was controlling, and each member of the Contract Committee attributed different weights to the various factors. The Contract Committee determined that the fees of the Investment Advisory Agreement between each of the Funds and Nicholas-Applegate were fair and reasonable in light of the services performed, expenses incurred and such other matters as the Contract Committee considered relevant in the exercise of their reasonable judgment. The Contract Committee also separately discussed the material factors and conclusions that formed the basis for the Contract Committee to recommend to the Board of Trustees to approve the Investment Advisory Agreement for each of the Funds.
SERVICES PROVIDED BY NICHOLAS-APPLEGATE
The Contract Committee noted that Nicholas-Applegate manages the portfolios of each of the Funds under the direction of the Board of Trustees. Nicholas-Applegate manages each Fund consistent with each Fund’s investment objectives and policies. Nicholas-Applegate provides each Fund with office space and such other services and personnel as are necessary for its operations. The Contract Committee considered the scope and quality of services provided by Nicholas-Applegate under the Investment Advisory Agreement. The Contract Committee considered the quality of the investment research capabilities of Nicholas-Applegate and the other services to be provided to the Funds by Nicholas-Applegate, such as selecting broker-dealers for executing portfolio transactions, serving as the Funds’ administrator, monitoring adherence to the Funds’ investment restrictions, producing shareholder reports, providing support services for the Trustees and Board Committees and overseeing the activities of other service providers, including monitoring compliance with various Fund policies and procedures and with applicable securities laws and regulations. The Contract Committee concluded that the nature, extent and quality of the services provided by Nicholas-Applegate to the Funds were appropriate and consistent with the terms of the Investment Advisory Agreement and that the Funds’ will continue to benefit from services provided under the Investment Advisory Agreement with Nicholas-Applegate.
COST OF SERVICES & FUND EXPENSES
The Contract Committee examined the fee information and expenses for each of the Funds in comparison to information from other comparable funds as provided by Lipper. The Contract Committee agreed that overall the Funds’ management fees and expense ratios were reasonable in relation to the management fees and expense ratios of the Funds’ peer groups selected by Lipper. The Contract Committee also reviewed Nicholas-Applegate’s management fees charged to its institutional separate account clients and for sub-advised funds (funds for which the Nicholas-Applegate
79
SUPPLEMENTARY INFORMATION — (Unaudited) — Continued
provides portfolio management services only). The Committee found that in almost all instances sub-advisory and institutional separate account fees are in line with the Funds’ management fee. The Contract Committee reviewed the profitability analysis for each Fund and discussed the methodology used by Nicholas-Applegate to assess profitability. They noted that only 4 of the Funds were profitable and found the level of profitability was fair and reasonable as compared to similar separate accounts and sub-advised funds managed by Nicholas-Applegate.
The Contract Committee concluded that the management fees and other compensation to be paid by the Funds to Nicholas-Applegate were reasonable in relation to the nature and quality of the services to be provided, taking into account (1) the fees charged by other advisers for managing comparable mutual funds with similar strategies and assets; (2) the fees that Nicholas-Applegate charges to other clients; (3) the estimated overall expense ratio of the Funds, taking into account the Funds’ expense offset arrangements with brokers, custodians and third party services providers. The Committee concluded that compensation paid to Nicholas-Applegate was comparable to the mean or median expense ratios of their peers.
INVESTMENT RESULTS
The Contract Committee considered the investment results of each of the Funds as compared to funds with similar investment objectives and policies as determined by Lipper and with relevant securities indices. In addition to the information received by the Contract Committee for their meeting, Nicholas-Applegate provides detailed performance information for each Fund at each regular meeting of the Board of Trustees. The Contract Committee reviewed information showing absolute and relative performance of each Fund over 1-year, 3-year, 5-year and 10-year periods as applicable.
U.S. Micro Cap Fund.
The Contract Committee reviewed the information reporting performance of the US Micro Cap Fund compared to its Lipper peer group and the Russell 2000 Growth Index and the Russell Micro Cap Growth Index. The comparative information showed the Fund had performed strongly relative to its peers and outperformed the Indexes for the 1-year, 3-year and 5-year periods. The Committee concluded that based on their review the Fund had performed very well relative to its peers and benchmarks.
U.S. Emerging Growth Fund.
The Contract Committee reviewed information showing performance of the Fund compared to its Lipper peer group and the Russell 2000 Growth Index. The comparative information showed the Fund outperformed its peer group and outperformed the Russell 2000 Growth Index for the 1-year, 5-year and 10-year periods. The Contract Committee concluded that the Fund’s relative performance over time had been very good.
U.S. Ultra Micro Cap Fund.
The Contract Committee reviewed Fund peer group information in connection with the approval of this new Fund that commenced investment operations on January 28, 2008. The Committee compared the Fund’s proposed fee structure to that of three relevant peers given similar institutional target market and projected assets. The Contract Committee concluded that the Fund was priced in line with peers and to attract assets.
U.S. Systematic Large Cap Growth Fund.
The Contract Committee reviewed information showing performance of the Fund compared to its Lipper peer group, the Russell 1000 Index and the Russell 1000 Growth Index. The comparative information showed that the Fund outperformed many of its peers over the 1, 5 and 10-year periods. The Fund outperformed the Russell 1000 Index over the 1-year and underperformed for the 10-year period. The Fund outperformed the Russell 1000 Growth Index for the 1-year and 10-year period and underperformed over the 5-year period. Based on their review, the Contract Committee concluded that the Fund’s relative performance over time had been very good.
U.S. Systematic Small to Mid Cap Growth Fund
The Fund incepted on July 31, 2007 and therefore had little performance information for the Contract Committee to evaluate. Inception to date performance showed that the Fund had outperformed the Russell 2500 Growth Index. Based on their review, the Contract Committee concluded the Fund’s performance was off to a good start.
U.S. Convertible Fund.
The Contract Committee reviewed information showing performance of the Fund compared to its Lipper peer group and the Merrill Lynch All Convertibles All Qualities Index. The comparative information showed that the Fund performed in the top deciles of its peer group and outperformed the Index for the 1-year, 5-year and 10-year periods. Based on their review, the Contract Committee concluded that the Fund’s relative performance over time had been exceptional.
Global Select Fund.
The Contract Committee reviewed information showing performance of the Fund compared to its Lipper peer group and the MSCI ACWI Index and the MSCI ACWI Growth Index. The comparative information showed the Fund had outperformed both Indexes in the 1-year, 5-year and 10-year periods. The Fund’s performance relative to its peers was above median over the 1, 5 and 10-year periods. Based on this review, the Contract Committee concluded the Fund’s relative investment performance over time had been very good.
International Growth Fund.
The Contract Committee reviewed information showing performance of the Fund compared to its Lipper peer group and the MSCI EAFE Index and MSCI EAFE Growth Index. The comparative information showed the Fund had outperformed all its peers in the 1-year period and performed above the peer group median in the 5 and 10-year periods. The Fund outperformed the MSCI EAFE Growth Index in all periods and outperformed the MSCI EAFE Index in the 1 and 10-year periods with slight underperformance over the 5-year period. The Contract Committee considered the changes in the Fund’s portfolio management team and ongoing enhancement to its investment process. Based on their review, the Contract
80
SUPPLEMENTARY INFORMATION — (Unaudited) — Continued
Committee concluded that Fund’s relative investment performance had improved considerably.
International Growth Opportunities Fund.
The Contract Committed reviewed information showing performance of the Fund compared to its Lipper peer group and the Citigroup World Ex U.S. EMI Growth and Citigroup World Ex U.S. EMI Indexes. The comparative information showed that the Fund had outperformed the Indexes in the 1-year, 3-year and 5-year periods and performed in the 1st percentile relative to its peers over the 1-year, 3-year and 5-year periods. Based on their review, the Contract Committee concluded that the Fund’s performance was exceptional.
Emerging Markets Fund.
The Fund has been in operation for 1-year and therefore no long term performance comparisons were available for the Contract Committee to review. The Fund compares its performance to the MSCI EM Index and the MSCI EM Growth Index. For the 1-year period, the Fund outperformed both Indexes and outperformed all of its Lipper peers. Based on their review, the Contract Committee concluded that the Fund’s first year performance had been exceptional.
International Systematic Fund.
The Fund has been in operations for just over a year and accordingly there was little performance information for the Committee to evaluate. The Fund’s 1-year performance was compared to the MSCI EAFE Index and the MSCI EAFE Growth Index and its Lipper peers. The Fund underperformed both Indexes over the 1-year period yet outperformed over the period from its inception on July 5, 2006 to September 30, 2007. The Fund’s performance relative to its peers was below median. Based on their review, the Contract Committee concluded that the Fund’s performance was improving.
International All Cap Growth Fund.
The Contract Committed reviewed information showing performance of the Fund compared to its Lipper peer group and the MSCI EAFE Growth Index and MSCI EAFE Index. The comparative information showed that the Fund had outperformed all of its group peers and both of the Indexes over the 1-year, 3-year and 5-year periods. Based on their review, the Contract Committee concluded that the Fund’s performance had been exceptional.
US High Yield Bond Fund.
The Contract Committee reviewed information showing performance of the Fund compared to its Lipper peer group and the Merrill Lynch High Yield Master II and the Merrill Lynch High Yield BB-B Rated Indexes. The comparative information showed that the Fund had outperformed its peer group median in the 1-year period, slightly underperformed in the 5-year period and performed in line with the median over the 10-year period. The Fund outperformed the Merrill Lynch High Yield Master II and Merrill Lynch High Yield BB-B Rated Index over the 1-year period, slightly underperformed over the 5-year and outperformed both Indexes over the 10-year period. The Contract Committee considered the Fund’s relative performance to the credit market environment and that Nicholas-Applegate’s decision to avoid the risk of investing in distressed and lower rated high yield bonds (CCC or below) had contributed to the Fund’s positive performance. Based on their review, the Contact Committee concluded that the Fund’s relative performance over time was good.
INVESTMENT ADVISORY FEE AND OTHER EXPENSES
The Contract Committee considered the investment advisory fee paid by each Fund. The Contract Committee recognized that it is difficult to make comparisons of investment advisory fees because there are variations in the services that are included in the fees paid by other funds. The Contract Committee also considered the fees that Nicholas-Applegate charges other clients with similar investment objectives/policies. Nicholas-Applegate acts as sub-adviser to several open-end and closed-end registered investment companies, non-U.S. investment companies, and investment adviser to separately managed institutional accounts. For funds where Nicholas-Applegate acts as sub-adviser, the Investment advisory fee is generally lower. For separately managed accounts where Nicholas- Applegate acts solely as investment adviser, the investment advisory fee is comparable and in some cases higher. Representatives of Nicholas-Applegate reviewed with the Contract Committee the significant differences in the scope of services provided and financial commitments and risks involved in managing the various types of accounts. The Contract Committee also considered the total expense ratio for each Fund in comparison to their respective peers. (The U.S. Ultra Micro Cap and U.S. Systematic Small to Mid Cap Growth Fund commenced investment operations in early 2008 and therefore were not covered by the Lipper report)
U.S. Micro Cap Fund.
The Lipper peer group consisted of 16 funds with average net assets ranging between $49 million and $150 million compared to $84 million for the Fund. The Lipper peer group fee and expense data showed that the Fund’s total expenses were lower than half of its peers some with asset sizes significantly higher than the Funds. The Contract Committee concluded that the Fund’s expense ratio was acceptable in light of the quality of services offered and other factors considered.
U.S. Emerging Growth Fund.
The Lipper peer group consisted of 10 funds with average net assets ranging between $10 million and $100 million with the Fund having the smallest asset size. The Lipper peer group fee and expense data showed that the Fund’s total expenses were the lowest of all funds in the peer group. The Contract Committee concluded that the Fund’s expense ratio was acceptable in light of quality of services and other factors considered.
U.S. Systematic Large Cap Growth Fund.
The Lipper peer group consisted of 12 funds with average net assets ranging between $3 million and $100 million compared to $15 million for the Fund. The Lipper peer group fee and expense data showed that the Fund’s total expenses were higher than the peer median. The Contract Committee considered the size of the Fund relative to its peers and concluded that the Fund’s expense ratio was acceptable in light of the quality of services and other factors considered.
81
SUPPLEMENTARY INFORMATION — (Unaudited) — Continued
U.S. Convertible Fund.
The Lipper peer group consisted of seven funds with average net assets ranging between $38.7 million and $345 with the Fund having the smallest net assets of $38.7. The Lipper peer group fee and expense data showed that the Fund’s total expenses after expense offsets were above the median yet lower than peers with significantly larger average net assets. The Contract Committee considered the relative small size of the Fund and concluded that the Fund’s expense ratio was acceptable in light of the quality of services and other factors considered.
Global Select Fund.
The Lipper peer group consisted of nine funds with average net assets ranging between $15 million and $500 million compared to $162 million for the Fund. The Lipper peer group fee and expense data showed that the Fund’s total expenses were the lowest of its peers and the Contract Committee concluded that the Fund’s expense ratio was acceptable in light of the quality of services and other factors considered.
International Growth Fund.
The Lipper peer group consisted of 16 funds with average net assets ranging between $25 million and $390 million compared to $94 million for the Fund. The Lipper peer group fee and expense data showed that the Fund’s total expenses were slightly below the median and lower than peers with significantly larger average net assets. The Contract Committee concluded that the Fund’s expense ratio was acceptable in light of the quality of services offered and other factors considered.
International Growth Opportunities Fund.
The Lipper peer group consisted of nine funds with average net assets ranging between $111 million and $476 million compared to $157 million for the Fund. The Lipper peer group fee and expense data showed that the Fund’s total expenses were second to the lowest after expense offsets. The Contract Committee concluded that the Fund’s expense ratio was acceptable in light of the quality of services offered and other factors considered.
Emerging Markets Fund
The Lipper peer group consisted of 10 funds with average net assets ranging between $900,000 and $112 million with the Fund having the smallest average net assets. The Lipper peer group fee and expense data showed that the Fund’s total expenses were slightly higher than the median and lower than peers with significantly larger average net assets. The Contract Committee considered the relative small size of the Fund and concluded that the Fund’s expense ratio was acceptable in light of the quality of services offered and other factors considered.
International Systematic Fund
The Lipper peer group consisted of 12 funds with average net assets ranging between $5 million and $112 million with the Fund having the smallest average net assets. The Lipper peer group fee and expense data showed that the Fund’s total expenses were the lowest after expense offsets The Contract Committee concluded that the Fund’s expense ratio was acceptable in light of the quality of services offered and other factors considered.
International All Cap Growth Fund
The Lipper peer group consisted of nine funds with average net assets ranging between $21 million and $129 million with the Fund having the smallest average net assets. The Lipper peer group fee and expense data showed that the Fund’s total expenses were lower than the median and lower than peers with larger average net assets. The Contract Committee considered the relative small size of the Fund and concluded that the Fund’s expense ratio was acceptable in light of the quality of services offered and other factors considered.
High Yield Bond Fund.
The peer group consisted of 16 funds with average net assets ranging between $33 million and $194 million compared to $71.8 for the Fund. The Lipper peer group fee and expense data showed that the Fund’s total expenses were second to the lowest. The Contract Committee considered the relative small size of the Fund and concluded that the Fund’s expense ratio was acceptable in light of the quality of services offered and other factors considered.
ECONOMIES OF SCALE
The Contract Committee noted that the investment advisory and unitary fee schedules for the Funds do not contain breakpoints that reduce the fee rate on assets above specified levels. However, the Contract Committee did note that overall fees paid to Nicholas-Applegate (investment advisory, administration, and shareholder service) contain the functional equivalent of breakpoints through the offering of four to five different share classes that reduce the fees paid to Nicholas-Applegate based on the asset level of the account. The Contract Committee recognized that the existing fee structure is consistent with the institutional nature of the Funds shareholder base and of Nicholas-Applegate’s business, which caters to large institutional investors (e.g., pension plans, endowments and public funds). Having taken these factors into consideration, the Contract Committee concluded that the Funds’ current multiple share class fee structure establishes a reasonable basis for realizing economies of scale for the Funds which may exist when assets increase. At current asset levels, the Contract Committee also noted that the most of the Funds have not realized optimal economies of scale in respect to other expenses and that many expenses continue to be paid by the Adviser.
82
SUPPLEMENTARY INFORMATION — (Unaudited) — Continued
CORPORATE GOVERNANCE
| Name, Address (1) | |
| Age | Principal Occupation(s) during Past 5 Years |
| Position(s) Held with Fund | Other Directorship Held by Trustee |
| Length of Time Served (2) | Number of Portfolios in Fund complex Overseen by Trustee |
Independent Trustees: | |
Darlene T. DeRemer 11/27/1955 Chairperson of the Board Since August 2007 & Trustee Since May 1999 | Principal Occupations: Partner, Grail Partners LLC (since 2005); Managing Director, Putnam Lovell NBF Private Equity (since 2004-2005); Managing Director, NewRiver E-Business Advisory Services Division (2000-2003); Prior to, President and Founder, DeRemer Associates, a strategic and marketing consulting firm for the financial services industry (since 1987); Vice President and Director, Asset Management Division, State Street Bank and Trust Company, now referred to as State Street Global Advisers (1982-1987); Vice President, T. Rowe Price & Associates (1979-1982); Member, Boston Club (since 1998); Member, Financial Women’s Association Advisory Board (since 1995); Founder, Mutual Fund Cafe Website. |
Other Directorships Held: Founding Member and Director, National Defined Contribution Council (since 1997); Trustee, Boston Alzheimer’s Association (since 1998); Director, King’s Wood Montessori School (since 1995); Editorial Board, National Association of Variable Annuities (since 1997); Director, Nicholas-Applegate Strategic Opportunities, Ltd. (1994-1997); Trustee, Nicholas-Applegate Mutual Funds (1994-1999); Director, Jurika & Voyles Fund Group (since 1994-2000); Trustee, Bramwell Funds (2003-2005); Director, Independent Director Council (since 2004); Mutual Fund Director’s Council-Advisory Board; Board Member-Chatman Partners; Board Member-X-Shares LLC. | |
Number of Portfolios Overseen by Trustee: 13 | |
John J. Murphy 4/8/1944 Trustee Since September 2005 | Principal Occupations: Founder and senior principal, Murphy Capital Management. Other Directorships Held: Director, Smith Barney Multiple Discipline Trust; Director, Barclays International Funds Group Ltd. and affiliated companies; Smith Barney Consulting Group; Legg Mason Equity Funds. |
Number of Portfolios Overseen by Trustee: 13 | |
Bradford K. Gallagher 2/24/1944 Trustee Since August 2007 | Principal Occupations: Founder, Spyglass Investments LLC (a private investment vehicle) (since 2001); Founder, President and CEO of CypressTree Investment Management Company and Annuity Company; Managing Director, Fidelity Investments. Other Directorships Held: Trustee, The Common Fund (since 2005); Director, Anchor Point Inc. (since 1995); Chairman and Trustee, Atlantic Maritime Heritage Foundation (since 2007); Director, Shielding Technology Inc. (since 2006); Director, United Way of Eastern Massachusetts (1988-1990); Director, Ouimet Scholarship Fund (1993-2005); Director, Emerson Hospital (1995-2005). |
Number of Portfolios Overseen by Trustee: 13 | |
Steven Grenadier 12/14/1964 Trustee Since August 2007 | Principal Occupations: William F. Sharpe Professor of Financial Economics, Stanford University Graduate School of Business; Research Associate, National Bureau of Economic Research (since 2002); Chairman of the Finance Department, Stanford University Graduate School of Business (2004-2006). Other Directorships Held: Independent Trustee, E Trade Funds. |
Number of Portfolios Overseen by Trustee: 13 | |
Interested Trustees: | |
Horacio A. Valeiras 1/8/1959 President & Trustee Since August 2004 | Principal Occupations: Managing Director (since 2004) and Chief Investment Officer, Nicholas-Applegate Capital Management, Nicholas-Applegate Securities (since 2002); Managing Director of Morgan Stanley Investment Management, London (1997-2002); Head of International Equity and Asset Allocation, Miller Anderson & Sherred; Director and Chief of Investment Strategies, Credit Suisse First Boston. |
Other Directorships Held: Trustee, The Bishops School (since 2002); Trustee, San Diego Rowing Club (since 2002). | |
Number of Portfolios Overseen by Trustee: 13 | |
Arthur B. Laffer 8/14/1940 Trustee Since August 2007 | Principal Occupations: Chairman, Laffer Associates (economic consulting) (since 1979); Chairman, Laffer Advisors Inc. (registered broker-dealer) (since 1981); Chairman, Laffer Investments (asset management) (since 2000); Member, Congressional Policy Advisory Board (since 1998); Distinguished University Professor and Director, Pepperdine University (1985-1988); Professor of Business Economics, University of Southern California (1976-1984); Associate Professor of Business Economics, University of Chicago (1967-1976). |
Other Directorships Held: Director of MPS Group, Inc. (NYSE:MPS) (since 2003); Director, Petco Animal Supplies, Inc. (NASDAQ:PETC) (2002-2005); Director, Oxigene Inc. (NASDAQ:OXGN), biopharmaceutical company (since 1998); Director of Provide Commerce (NASDAQ: PRVD) (since 1998); Director, Veolia Environmental Corporation (successor to U.S. Filter Corporation) (water purification) (1991-2006); Director, Nicholas-Applegate Fund, Inc. (1987-2007). | |
Number of Portfolios Overseen by Trustee: 13 |
83
SUPPLEMENTARY INFORMATION — (Unaudited) — Continued
CORPORATE GOVERNANCE
| Name, Address (1) | |
| Age | Principal Occupation(s) during Past 5 Years |
| Position(s) Held with Fund | Other Directorship Held by Trustee |
| Length of Time Served (2) | Number of Portfolios in Fund complex Overseen by Trustee |
Officers: | |
Charles H. Field, Jr. 7/24/1955 Secretary and Chief Compliance Officer Since May 2002 | Principal Occupations: Managing Director and General Counsel, Nicholas-Applegate Capital Management, Nicholas-Applegate Securities, Nicholas-Applegate Holdings LLC (since February 2004); Deputy General Counsel, Nicholas-Applegate Capital Management (1996-2004). Other Directorships Held: NA |
Number of Portfolios Overseen by Officer: 13 | |
Deborah A. Wussow 1/31/1960 Treasurer and Assistant Secretary Since August 2006 | Principal Occupations: Senior Vice President and Chief Compliance Officer, Nicholas-Applegate Capital Management (since 2008), and previously Vice President and Director, Legal and Compliance, Nicholas-Applegate Capital Management (since 2005-2007) and Manager, Legal and Compliance, Nicholas-Applegate Capital Management (1995-2004). |
Other Directorships Held: NA | |
Number of Portfolios Overseen by Officer: 13 |
| (1) | Unless otherwise noted, the address of the Trustees and Officers is c/o: Nicholas-Applegate Capital Management, 600 West Broadway, 32nd Floor, San Diego, California 92101. |
| (2) | Each Trustee serves for an indefinite term, until her or his successor is elected. |
84
(This page intentionally left blank)
(This page intentionally left blank)
TRUSTEES OF NICHOLAS - APPLEGATE INSTITUTIONAL FUNDS
Darlene T. DeRemer, Chairperson
Horacio A. Valeiras
John J. Murphy
Bradford K. Gallagher
Steven Grenadier
Arthur B. Laffer
OFFICERS
Horacio A. Valeiras, President
Charles H. Field, Jr., Secretary & Chief Compliance Officer
Deborah A. Wussow, Treasurer & Assistant Secretary
INVESTMENT ADVISER
Nicholas-Applegate Capital Management
DISTRIBUTOR
Nicholas-Applegate Securities
CUSTODIAN
Brown Brothers Harriman & Co., Private Bankers
TRANSFER AGENT
UMB Fund Services Group, Inc.
INDEPENDENT REGISTERED PUBLIC ACCOUNTING FIRM
PricewaterhouseCoopers LLP
 | AR0308INST |
600 West Broadway San Diego, California 92101 800.551.8043 |
March 31, 2008 Annual Report
Class R Shares
U.S. Emerging Growth
U.S. Systematic Large Cap Growth
International Growth
LETTER TO SHAREHOLDERS
Dear Fellow Shareholder,
The fiscal year ended March 31, 2008 was an eventful time in the global financial markets. Rising defaults on U.S. subprime mortgages ignited a credit crisis in the United States that reverberated around the world. Stock prices became volatile as the crisis unfolded, and equity markets in most developed countries ended the period with losses in local currency terms.
In this annual report, we review the performance of the financial markets and our mutual funds from April 1, 2007 through March 31, 2008. We also highlight some of the key themes that drove investment returns and share our outlook for the future.
The broad U.S. equity market, as measured by the S&P 500 Index, fell 5.1% during the fiscal year. After hitting a record high in July 2007, the index retreated over the summer as problems in the credit markets began to develop. Losses on mortgage-backed securities made lenders and investors less willing to assume risk, and financial institutions holding the securities were flooded with margin calls and redemption requests. To reduce leverage and raise cash, they sold their most liquid assets, including stocks. Monetary easing from the Federal Reserve helped send the S&P 500 Index to another peak in October, but the rally was short lived amid further deterioration in the housing and credit markets and weak economic data. In early 2008, the Fed stepped up its efforts to bolster the financial system and economy, which sparked an equity rally near the end of the period.
Stock markets in developed countries outside the United States also were weak, with the MSCI EAFE Index falling 14.4% in local currencies and 2.3% in U.S. dollars. Similar to their U.S. counterparts, European financial institutions reported a staggering amount of credit-related writedowns. Japanese banks had relatively limited U.S. mor tgage exposure; however, worries that currency strength would slow exports weighed on equity prices in Japan, as well as in Europe. The yen rose 15.4% and the euro gained 18.2% versus the U.S. dollar, which was weakened by six interest rate cuts from the Fed and concerns about a potential U.S. recession.
Other central banks, including the European Central Bank, did not lower rates, since they were more focused on controlling inflation against a backdrop of rising commodity prices. The Commodity Research Bureau (CRB) Index increased 22.1% during the period and contributed to the 21.7% gain in the MSCI Emerging Markets Index (U.S. dollars). In addition to buoyant commodity prices, many developing countries benefited from robust domestic consumption, including China and India.
We are proud of how our mutual funds performed in the volatile environment. We manage two of the funds using traditional investment processes, and both of them outpaced their benchmarks. The one fund that we manage using a systematic approach lagged, but only by a modest amount. The unprecedented housing-induced credit crisis led to unusual moves in stock prices, particularly in August and January. These market dislocations were inherently difficult to model and, thus, a challenge for systematic strategies in general.
Nicholas-Applegate is intensely focused on producing strong results in our existing funds and in finding new ways to deliver excess returns to investors. As part of those efforts, we recently launched 130/30 strategies. By incorporating short selling, these strategies seek to generate more alpha than long-only approaches without a corresponding increase in risk. Beginning April 1, 2008, we will offer Global Equity 130/30 as a mutual fund. The new fund will capitalize on several of our primary strengths, including fundamental research, quantitative analysis and short selling.
From an organizational perspective, we continued to enhance our business infrastructure throughout the period. For example, we completed a firmwide upgrade to our desktop computers and tested a state-of-the art trading system, which will be implemented in 2008. In addition, we strengthened our human resources by welcoming a number of talented professionals to the company, including a senior portfolio manager, several analysts, a compliance officer and an equity trader. The qualities of the firm that help us attract exceptional people were formally recognized in February when Nicholas-Applegate was named a winner in the “California’s Best Places to Work Program.” The award was the result of an in-depth evaluation process that included an assessment of our culture and a survey of more than half of our employees.
Looking ahead, we believe that the world’s equity markets will remain volatile. In the United States, the housing slump, credit crisis and high inflation should continue to suppress economic growth, necessitating additional interest rate cuts from the Federal Reserve. We also expect economic growth to slow outside the United States in both developed and emerging countries and for most central banks to lower interest rates despite elevated price levels. Corporate profit growth will likely be flat, with continued compression in price-to-earnings multiples until current estimates reflect an earnings slowdown.
We believe our mutual funds remain well positioned for the dynamic market environment. We are confident that our focus on making timely investments in companies exhibiting positive, sustainable change will benefit shareholders over the long term.
On behalf of everyone at Nicholas-Applegate, thank you for your participation in the Nicholas-Applegate Institutional Funds. We appreciate the trust you have placed in us.
Best Regards,
/s/ Horacio A. Valeiras
Horacio A. Valeiras, CFA
President and Chief Investment Officer
March 31, 2008
TABLE OF CONTENTS
The Funds’ Review and Outlook, Performance and
Schedule of Investments:
| U.S. Emerging Growth | 1 |
| U.S. Systematic Large Cap Growth | 5 |
| International Growth | 9 |
The Funds’:
| Financial Highlights | 14 |
| Statements of Assets and Liabilities | 16 |
| Statements of Operations | 17 |
| Statements of Changes in Net Assets | 18 |
| Notes to Financial Statements | 20 |
| Report of Independent Registered Public Accounting Firm | 25 |
| Shareholder Expense Example | 26 |
| Supplementary Information | 27 |
This report is authorized for distribution to shareholders and to others only when preceded or accompanied by a currently effective prospectus for Nicholas-Applegate Institutional Funds Class R Shares. Distributor: Nicholas-Applegate Securities.
U.S. EMERGING GROWTH FUND
Management Team: John C. McCraw, Portfolio Manager; Robert S. Marren, Portfolio Manager; Blake H. Burdine, Analyst; K. Mathew Axline, CFA, Analyst; Stephen W. Lyford, Analyst
Chief Investment Officer: Horacio A. Valeiras, CFA
Goal: The U.S. Emerging Growth Fund seeks to maximize long-term capital appreciation through investments primarily in U.S. companies with market capitalizations similar to the Russell 2000 Growth Index at time of purchase.
Market Overview: Prices of U.S. small-cap growth stocks, as measured by the Russell 2000 Growth Index, declined between April 1, 2007 and March 31, 2008. The period started on a strong note, with the index advancing on brisk merger and acquisition activity, signs of improvement in the economy and better-than-expected first quarter earnings. However, the following strong headwinds led to weak performance in the latter part of the fiscal year:
| • | A series of blows to the U.S. financial system, including losses on mortgage-backed securities, concerns about bond insurers’ credit quality and a seizing up in the short-term funding markets |
| • | Weak corporate earnings, with profits among small-cap companies falling roughly 13%, year over year, in the fourth quarter of 2007 |
| • | Downbeat news on the economy, including the largest drop in consumer confidence in 35 years |
Policymakers were quick to respond to deterioration in the financial markets and economy, helping to lift investor sentiment toward the end of the period. The Federal Reserve injected extra liquidity into the banking system and cut the funds rate a total of 3% on six separate occasions. President Bush and Congress agreed to a $170 billion economic stimulus package with tax rebates for individuals and tax incentives for businesses.
Performance: During the twelve months ended March 31, 2008, the Fund’s Class R shares declined 7.15%, outperforming the Russell 2000 Growth Index, which fell 8.94%
Portfolio Specifics: Outperformance of the index was due to stock selection, which was especially strong in the industrials sector. Two of the Fund’s best-performing holdings were dry bulk shipping companies Excel Maritime Carriers and DryShips. Both benefited from a favorable pricing environment, as global demand for commodities such as iron ore and coal grew faster than the supply of vessels available to transport them. Chart Industries, a manufacturer of equipment used to produce and store various gases, was another top performer in industrials. The company is experiencing rapid growth in its liquefied natural gas business, as the geographic dislocation between natural gas supply sources and end users drives the need for liquefaction.
Stock selection was also particularly strong in the financials and information technology sectors, led by gains from AmTrust Financial Services, a property and casualty insurer, and Concur Technologies, a supplier of expense management software. Areas of relative weakness included stock selection in the consumer discretionary sector and an underweight in health care. In the volatile market environment, health care lived up to its reputation as a defensive sector.
Market Outlook: Weakness in the economy and corporate earnings may continue to weigh on investor sentiment in the months ahead. However, valuations have become more attractive following the recent sell-off in equities, and, on March 31, it was widely expected that the Fed would cut interest rates at least one more time. Easier monetary policy bodes particularly well for smaller stocks, since small companies tend to depend more on bank loans to fund operations than larger firms.
As always, we remain focused on identifying fundamentally strong companies for the Fund that are poised to exceed earnings expectations.
Comparison of Change in Value of a $250,000 Investment in U.S. Emerging Growth Fund Class R Shares with the Russell 2000 Growth Index.
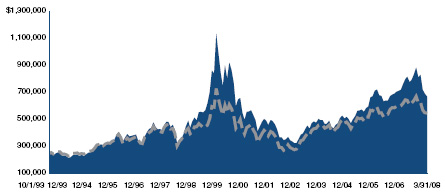

| Annualized Total Returns As of 3/31/08 | |||
1 Year | 5 Years | 10 Years | |
| U.S. Emerging Growth Fund Class R | -7.15% | 15.43% | 3.33% |
| Russell 2000 Growth Index | -8.94% | 14.24% | 1.75% |
The graph above shows the value of a hypothetical $250,000 investment in the Fund compared with the Russell 2000 Growth Index for the periods indicated. The Fund’s Class R shares were first available on May 21, 1999. Performance prior to the introduction of Class R shares reflects the historical performance of the Fund’s Class I Shares. This performance has been restated to reflect shareholder services fees of 0.25% applicable to Class R shares, but not Class I shares of the Fund. The Fund’s Class I shares calculate their performance based upon the historical performance of a corresponding series of Nicholas-Applegate Mutual Funds (renamed ING Mutual Funds), adjusted to reflect all fees and expenses applicable to the Fund’s Class I shares. Average annual total return figures include changes in principal value, reinvested dividends, and capital gain distributions. The total returns shown above do not show the effects of income taxes on an individual’s investment. In most cases, taxes may reduce your actual investment returns on income or gains paid by the Fund or any gains you may realize if you sell your shares. Past performance cannot guarantee future results.
The Russell 2000 Growth Index is an unmanaged index comprised of those Russell 2000 companies with higher price-to-book ratios and higher forecasted growth values. The Russell 2000 Index is an unmanaged index generally representative of the 2,000 smallest companies in the Russell 3000 Index, which represents approximately 10% of the total market capitalization of the Russell 3000 Index. The unmanaged Index differs from the Fund in composition, does not pay management fees or expenses and includes reinvested dividends. One cannot invest directly in an index.
Since markets can go down as well as up, investment return and principal value will fluctuate with market conditions.You may have a gain or loss when you sell your shares.
1
U.S. EMERGING GROWTH FUND
SCHEDULE OF INVESTMENTS
As of March 31, 2008
Number of Shares | Value | ||||||
Common Stock - 98.2% | |||||||
Advertising Services - 0.7% | |||||||
inVentiv Health, Inc.* | 2,500 | $ | 72,025 | ||||
Aerospace/Defense-Equipment - 3.8% | |||||||
AAR Corp.* | 2,400 | 65,448 | |||||
BE Aerospace, Inc.* | 1,900 | 66,405 | |||||
Curtiss-Wright Corp. | 1,200 | 49,776 | |||||
Ducommun, Inc.* | 2,100 | 58,107 | |||||
Moog, Inc. Cl. A* | 1,600 | 67,536 | |||||
Orbital Sciences Corp.* | 3,800 | 91,580 | |||||
| 398,852 | |||||||
Airlines - 1.3% | |||||||
Allegiant Travel Co.* | 2,200 | 58,124 | |||||
Republic Airways Holdings, Inc.* | 3,300 | 71,478 | |||||
| 129,602 | |||||||
Alternative Waste Tech - 0.6% | |||||||
Darling International, Inc.* | 5,100 | 66,045 | |||||
Apparel Manufacturers - 0.6% | |||||||
G-III Apparel Group, Ltd.* | 4,700 | 63,074 | |||||
Auto/Truck Parts & Equipment-Original - 0.7% | |||||||
Titan International, Inc. | 2,300 | 70,403 | |||||
Batteries/Battery Systems - 0.8% | |||||||
EnerSys* | 3,400 | 81,328 | |||||
Beverages-Wine/Spirits - 1.1% | |||||||
Central European Distribution Corp.* | 1,900 | 110,561 | |||||
Broadcast Services/Programming - 0.6% | |||||||
DG FastChannel, Inc.* | 3,400 | 65,212 | |||||
Casino Services - 0.5% | |||||||
Bally Technologies, Inc.* | 1,600 | 54,944 | |||||
Chemicals-Fibers - 0.4% | |||||||
Zoltek Cos., Inc.*,## | 1,700 | 45,084 | |||||
Chemicals-Plastics - 0.4% | |||||||
Metabolix, Inc.* | 3,700 | 40,515 | |||||
Coal - 0.7% | |||||||
Walter Industries, Inc. | 1,200 | 75,156 | |||||
Coffee - 0.7% | |||||||
Green Mountain Coffee Roasters, Inc.* | 2,200 | 69,630 | |||||
Commercial Services - 2.0% | |||||||
Healthcare Services Group | 3,300 | 68,112 | |||||
Team, Inc.* | 2,500 | 68,250 | |||||
TeleTech Holdings, Inc.* | 3,200 | 71,872 | |||||
| 208,234 | |||||||
Computer Services - 0.4% | |||||||
BluePhoenix Solutions, Ltd.* | 5,500 | 45,925 | |||||
Computer Software - 1.2% | |||||||
Double-Take Software, Inc.* | 4,100 | 47,888 | |||||
Omniture, Inc.* | 3,100 | 71,951 | |||||
| 119,839 | |||||||
Computers-Integrated Systems - 1.3% | |||||||
Micros Systems, Inc.* | 2,200 | 74,052 | |||||
Radiant Systems, Inc.* | 4,300 | 60,071 | |||||
| 134,123 | |||||||
Computers-Peripheral Equipment - 0.3% | |||||||
Synaptics, Inc.* | 1,300 | 31,044 | |||||
Consulting Services - 2.2% | |||||||
FTI Consulting, Inc.* | 900 | 63,936 | |||||
Gartner, Inc. Cl. A* | 3,400 | 65,756 | |||||
Watson Wyatt Worldwide, Inc. Cl. A | 1,800 | 102,150 | |||||
| 231,842 | |||||||
Consumer Products-Miscellaneous - 1.6% | |||||||
Jarden Corp.* | 3,200 | 69,568 | |||||
Tupperware Brands Corp. | 2,500 | 96,700 | |||||
| 166,268 | |||||||
Cosmetics & Toiletries - 0.7% | |||||||
Elizabeth Arden, Inc.* | 3,600 | 71,820 | |||||
Data Processing/Management - 0.5% | |||||||
FalconStor Software, Inc.*,## | 6,800 | 51,748 | |||||
Distribution/Wholesale - 0.9% | |||||||
Brightpoint, Inc.* | 5,000 | 41,800 | |||||
Fossil, Inc.* | 1,700 | 51,918 | |||||
| 93,718 | |||||||
Diversified Manufacturing Operations - 0.4% | |||||||
LSB Industries, Inc.*,## | 2,900 | 42,746 | |||||
Electronic Components-Semiconductors - 3.2% | |||||||
Advanced Analogic Technologies, Inc.* | 9,700 | 54,514 | |||||
Emcore Corp.*,## | 6,000 | 34,560 | |||||
Monolithic Power Systems, Inc.* | 4,100 | 72,283 | |||||
PMC - Sierra, Inc.* | 13,100 | 74,670 | |||||
Semtech Corp.* | 4,300 | 61,619 | |||||
Skyworks Solutions, Inc.* | 5,100 | 37,128 | |||||
| 334,774 | |||||||
Electronic Design Automation - 0.6% | |||||||
Magma Design Automation, Inc.* | 6,900 | 66,033 | |||||
Electronic Measure Instruments - 0.7% | |||||||
Itron, Inc.*,## | 800 | 72,184 | |||||
E-Marketing/Information - 0.4% | |||||||
Valueclick, Inc.* | 2,300 | 39,675 | |||||
Energy-Alternate Sources - 1.0% | |||||||
Canadian Solar, Inc.*,## | 4,700 | 98,230 | |||||
Engineering/R & D Services - 0.5% | |||||||
EMCOR Group, Inc.* | 2,200 | 48,862 | |||||
Enterprise Software/Services - 2.6% | |||||||
Concur Technologies, Inc.* | 2,300 | 71,415 | |||||
Lawson Software, Inc.*,## | 9,300 | 70,029 | |||||
Mantech International Corp. Cl. A* | 1,700 | 77,112 | |||||
PROS Holdings, Inc.*,## | 4,300 | 53,965 | |||||
| 272,521 | |||||||
Finance-Investment Bankers/Brokers - 0.6% | |||||||
Knight Capital Group, Inc. Cl. A* | 4,000 | 64,960 | |||||
Food-Wholesale/Distribution - 0.7% | |||||||
Spartan Stores, Inc. | 3,300 | 68,805 | |||||
Footwear & Related Apparel - 0.5% | |||||||
Skechers U.S.A., Inc. Cl. A* | 2,600 | 52,546 | |||||
Hazardous Waste Disposal - 0.8% | |||||||
EnergySolutions, Inc. | 3,800 | 87,172 | |||||
Internet Applications Software - 1.6% | |||||||
Cybersource Corp.* | 5,800 | 84,738 | |||||
eResearchTechnology, Inc.* | 6,500 | 80,730 | |||||
| 165,468 | |||||||
See Accompanying Notes to Financial Statements.
2
SCHEDULE OF INVESTMENTS
As of March 31, 2008
Number of Shares | Value | ||||||
Internet Security - 0.6% | |||||||
Blue Coat Systems, Inc.* | 2,600 | $ | 57,304 | ||||
Leisure & Recreational Products - 0.8% | |||||||
WMS Industries, Inc.* | 2,300 | 82,731 | |||||
Machinery-General Industry - 4.0% | |||||||
Altra Holdings, Inc.* | 4,400 | 59,180 | |||||
Chart Industries, Inc.* | 2,600 | 87,984 | |||||
DXP Enterprises, Inc.* | 2,000 | 78,570 | |||||
Kadant, Inc.* | 2,400 | 70,512 | |||||
Middleby Corp.* | 900 | 56,151 | |||||
Robbins & Myers, Inc. | 2,000 | 65,300 | |||||
| 417,697 | |||||||
Medical Information Systems - 0.6% | |||||||
Phase Forward, Inc.* | 3,600 | 61,488 | |||||
Medical Instruments - 2.3% | |||||||
Arthrocare Corp.*,## | 1,600 | 53,360 | |||||
Natus Medical, Inc.* | 3,700 | 67,155 | |||||
NuVasive, Inc.* | 1,600 | 55,216 | |||||
Symmetry Medical, Inc.* | 3,900 | 64,740 | |||||
| 240,471 | |||||||
Medical Labs &Testing Services - 0.7% | |||||||
Icon PLC - ADR* | 1,100 | 71,379 | |||||
Medical Laser Systems - 0.6% | |||||||
Cynosure, Inc. Cl. A*,## | 2,900 | 61,770 | |||||
Medical Products - 1.9% | |||||||
China Medical Technologies, Inc. - ADR## | 1,500 | 61,635 | |||||
Haemonetics Corp.* | 1,200 | 71,496 | |||||
Wright Medical Group, Inc.* | 2,600 | 62,764 | |||||
| 195,895 | |||||||
Medical-Biomedical/Genetics - 3.2% | |||||||
Alexion Pharmaceuticals, Inc.* | 1,500 | 88,950 | |||||
AMAG Pharmaceuticals, Inc.* | 700 | 28,301 | |||||
Regeneron Pharmaceuticals, Inc.* | 4,100 | 78,679 | |||||
Sangamo Biosciences, Inc.* | 5,700 | 57,912 | |||||
Savient Pharmaceuticals, Inc.*,## | 3,700 | 74,000 | |||||
| 327,842 | |||||||
Medical-Drugs - 0.4% | |||||||
Indevus Pharmaceuticals, Inc.* | 9,000 | 42,930 | |||||
Medical-Nursing Homes - 0.6% | |||||||
Sun Healthcare Group, Inc.* | 4,500 | 59,130 | |||||
Medical-Outpatient/Home Medical Care - 0.9% | |||||||
Air Methods Corp.* | 1,900 | 91,903 | |||||
Metal Processors & Fabrication - 0.5% | |||||||
CIRCOR International, Inc. | 1,100 | 50,875 | |||||
Oil Companies-Exploration & Production - 2.7% | |||||||
Carrizo Oil & Gas, Inc.* | 1,600 | 94,832 | |||||
Penn Virginia Corp. | 1,700 | 74,953 | |||||
Venoco, Inc.* | 3,700 | 42,994 | |||||
Warren Resources, Inc.* | 5,800 | 68,846 | |||||
| 281,625 | |||||||
Oil Field Machinery & Equipment - 1.2% | |||||||
NATCO Group, Inc.* | 1,200 | 56,100 | |||||
T-3 Energy Services, Inc.* | 1,600 | 68,096 | |||||
| 124,196 | |||||||
Oil-Field Services - 3.1% | |||||||
Cal Dive International, Inc.* | 6,600 | 68,508 | |||||
Hercules Offshore, Inc.* | 2,500 | 62,800 | |||||
Hornbeck Offshore Services, Inc.* | 1,400 | 63,938 | |||||
Matrix Service Co.* | 3,300 | 56,694 | |||||
Willbros Group, Inc.*,## | 2,200 | 67,320 | |||||
| 319,260 | |||||||
Pharmacy Services - 0.7% | |||||||
HealthExtras, Inc.* | 2,900 | 72,036 | |||||
Physical Practice Management - 0.7% | |||||||
Pediatrix Medical Group, Inc.* | 1,100 | 74,140 | |||||
Private Corrections - 1.7% | |||||||
Cornell Cos., Inc.* | 3,800 | 85,348 | |||||
The Geo Group, Inc.* | 3,100 | 88,164 | |||||
| 173,512 | |||||||
Property/Casualty Insurance - 2.0% | |||||||
Amtrust Financial Services, Inc. | 5,600 | 90,776 | |||||
Navigators Group, Inc.* | 1,300 | 70,720 | |||||
Tower Group, Inc. | 2,000 | 50,340 | |||||
| 211,836 | |||||||
Research & Development - 1.6% | |||||||
Kendle International, Inc.*,## | 2,000 | 89,840 | |||||
Parexel International Corp.* | 3,000 | 78,300 | |||||
| 168,140 | |||||||
Retail-Apparel/Shoe - 7.4% | |||||||
Aeropostale, Inc.* | 3,100 | 84,041 | |||||
AnnTaylor Stores Corp.* | 3,100 | 74,958 | |||||
Bebe Stores, Inc. | 6,000 | 64,500 | |||||
Brown Shoe Co., Inc. | 4,700 | 70,829 | |||||
Charlotte Russe Holding, Inc.* | 4,300 | 74,562 | |||||
Chico’s FAS, Inc.* | 7,000 | 49,770 | |||||
Dress Barn, Inc.* | 4,200 | 54,348 | |||||
JOS A Bank Clothiers, Inc.*,## | 3,000 | 61,500 | |||||
Men’s Wearhouse, Inc. | 3,200 | 74,464 | |||||
Pacific Sunwear Of California* | 6,600 | 83,226 | |||||
Phillips-Van Heusen Corp. | 1,900 | 72,048 | |||||
| 764,246 | |||||||
Retail-Miscellaneous/Diversified - 1.0% | |||||||
Pricesmart, Inc.## | 3,700 | 102,527 | |||||
Retail-Restaurants - 2.5% | |||||||
Brinker International, Inc. | 3,700 | 68,635 | |||||
Buffalo Wild Wings, Inc.*,## | 2,900 | 71,050 | |||||
CBRL Group, Inc. | 1,900 | 67,963 | |||||
Red Robin Gourmet Burgers, Inc.* | 1,400 | 52,598 | |||||
| 260,246 | |||||||
Retail-Sporting Goods - 0.4% | |||||||
Zumiez, Inc.* | 2,900 | 45,501 | |||||
Satellite Telecommunications - 0.8% | |||||||
GeoEye, Inc.* | 3,100 | 80,569 | |||||
Schools - 1.6% | |||||||
Capella Education Co.* | 1,100 | 60,060 | |||||
DeVry, Inc. | 1,200 | 50,208 | |||||
INVESTools, Inc.*,## | 5,500 | 60,445 | |||||
| 170,713 | |||||||
Seismic Data Collection - 0.6% | |||||||
ION Geophysical Corp.* | 4,400 | 60,720 | |||||
See Accompanying Notes to Financial Statements.
3
U.S. EMERGING GROWTH FUND
SCHEDULE OF INVESTMENTS
As of March 31, 2008
Number of Shares | Value | ||||||
Semiconductor Components- | |||||||
Integrated Circuits - 1.7% | |||||||
O2Micro International, Ltd. - ADR*,## | 7,200 | $ | 55,656 | ||||
Pericom Semiconductor Corp.* | 5,400 | 79,272 | |||||
Sigma Designs, Inc.* | 2,000 | 45,340 | |||||
| 180,268 | |||||||
Semiconductor Equipment - 0.6% | |||||||
Teradyne, Inc.* | 5,300 | 65,826 | |||||
Telecommunications Equipment - 0.4% | |||||||
Network Equipment Technologies, Inc.*,## | 5,900 | 38,763 | |||||
Telecommunications Equipment Fiber Optics - 0.9% | |||||||
JDS Uniphase Corp.* | 6,600 | 88,374 | |||||
Telecommunications Services - 1.9% | |||||||
NTELOS Holdings Corp. | 3,500 | 84,700 | |||||
PAETEC Holding Corp.*,## | 5,400 | 35,964 | |||||
Premiere Global Services, Inc.* | 5,300 | 76,002 | |||||
| 196,666 | |||||||
Textile-Apparel - 0.7% | |||||||
Perry Ellis International, Inc.* | 3,500 | 76,405 | |||||
Therapeutics - 2.2% | |||||||
Alnylam Pharmaceuticals, Inc.*,## | 2,000 | 48,800 | |||||
BioMarin Pharmaceutical, Inc.* | 1,900 | 67,203 | |||||
Isis Pharmaceuticals, Inc.*,## | 5,600 | 79,016 | |||||
Onyx Pharmaceuticals, Inc.* | 1,300 | 37,739 | |||||
| 232,758 | |||||||
Transport-Air Freight - 0.7% | |||||||
Atlas Air Worldwide Holdings, Inc.* | 1,300 | 71,500 | |||||
Transport-Rail - 0.8% | |||||||
Genesee & Wyoming, Inc. Cl. A* | 2,400 | 82,560 | |||||
Transport-Services - 0.7% | |||||||
Pacer International, Inc. | 4,400 | 72,292 | |||||
Transport-Truck - 0.6% | |||||||
Saia, Inc.* | 4,000 | 63,440 | |||||
Ultra Sound Imaging Systems - 0.6% | |||||||
SonoSite, Inc.* | 2,000 | 56,860 | |||||
Vitamins & Nutrition Products - 1.3% | |||||||
Herbalife, Ltd. | 1,400 | 66,500 | |||||
Omega Protein Corp.* | 4,600 | 62,790 | |||||
| 129,290 | |||||||
Web Portals/ISP - 0.9% | |||||||
Trizetto Group* | 5,400 | 90,126 | |||||
Wire & Cable Products - 0.5% | |||||||
Fushi Copperweld, Inc.*,## | 3,700 | 55,648 | |||||
Wound, Burn & Skin Care - 0.4% | |||||||
Obagi Medical Products, Inc.* | 4,800 | 41,664 | |||||
X-Ray Equipment - 0.6% | |||||||
Hologic, Inc.* | 1,100 | 61,160 | |||||
| Total Common Stock (Cost: $10,655,061) | 10,185,250 | ||||||
Principal Amount | Value | ||||||
Short Term Investments - 14.3% | |||||||
Money Market Funds - 12.8% | |||||||
Boston Global Investment Trust - | |||||||
| Enhanced Portfolio, 3.017%** | $ | 1,328,506 | $ | 1,328,506 | |||
Time Deposit - 1.5% | |||||||
Wachovia Bank London | |||||||
1.700%, 04/01/08 | 151,064 | 151,064 | |||||
| Total Short Term Investments (Cost: $1,479,570) | 1,479,570 | ||||||
| Total Investments - 112.5% (Cost: $12,134,631) | 11,664,820 | ||||||
| Liabilities in Excess of Other Assets - (12.5%) | (1,295,554 | ) | |||||
| Net Assets - 100.0% | $ | 10,369,266 | |||||
| * | Non-income producing securities. |
| ** | All of the security is purchased with cash collateral proceeds from securities loans. |
| ## | All or a portion of the Fund’s holdings in this security was on loan as of 3/31/08. |
ADR - American Depository Receipt
SCHEDULE OF INVESTMENTS BY SECTOR
as of March 31, 2008
| Sector | Percent of Net Assets | |||
| Consumer, Non-cyclical | 30.8 | % | ||
| Consumer, Cyclical | 16.8 | |||
| Industrial | 16.7 | |||
| Technology | 12.5 | |||
| Energy | 9.3 | |||
| Communications | 8.6 | |||
| Financial | 2.7 | |||
| Basic Materials | 0.8 | |||
| Short Term Investments | 14.3 | |||
| Total Investments | 112.5 | |||
| Other assets in excess of liabilities | (12.5 | ) | ||
| Net Assets | 100.0 | % | ||
See Accompanying Notes to Financial Statements.
4
U.S. SYSTEMATIC LARGE CAP GROWTH FUND
Management Team: James Li, Ph.D., CFA, Portfolio Manager; Jane Edmondson, Portfolio Manager; Lu Yu, CFA, CIPM, Analyst
Chief Investment Officer: Horacio A. Valeiras, CFA
Goal: The U.S. Systematic Large Cap Growth Fund seeks to maximize long-term capital appreciation by investing primarily in stocks from a universe of large U.S. companies with market capitalizations similar to the Russell 1000 Growth Index at time of purchase.
Market Overview: U.S. large-cap growth stocks finished the twelve months ended March 31, 2008 almost exactly where they had started. However, the flat returns obscured what was a volatile and eventful year in the equity market.
During the first half of the period, large-cap growth stocks posted healthy gains. The Russell 1000 Growth Index was lifted by robust merger and acquisition activity, better-than-expected corporate profits and signs the economy had rebounded from tepid growth in the first quarter of 2007. In addition, the core personal consumption expenditures (PCE) index — the Federal Reserve’s preferred measure of inflation — fell to its lowest level since 2004.
Stocks retreated in the fall and winter as problems in the subprime mortgage market spilled over into the broader credit markets and clouded the economic outlook. Financial institutions took huge writedowns on mortgage-related securities, causing lenders to worry about the value of all but the safest collateral. Short-term financing dried up, and the lack of liquidity necessitated the rescue of a major U.S. securities firm in a transaction facilitated by the Fed. The central bank’s role in the transaction was just one in a series of emergency steps that it took to shore up the financial system. Investors reacted favorably to the aggressive policy actions, and the Russell 1000 Growth Index gained more than 2% in the last two weeks of March.
Performance: The Fund’s Class R shares lost 2.21% between April 1, 2007 and March 31, 2008, and the Russell 1000 Growth Index declined 0.75%.
Portfolio Specifics: The Fund modestly trailed the index in the volatile market, as positive stock selection was overshadowed by sector allocations, which are a byproduct of our bottom-up investment process. Stock selection added the most value in the health care sector, led by a significant gain from Intuitive Surgical. The company makes products used in minimally invasive surgeries and is benefiting from the growing popularity of these types of procedures, which reduce the trauma, time and cost of surgery. Stock selection in the materials sector was another key area of relative strength, where mining company Freeport-McMoran Copper & Gold was a top contributor amid high metals prices. In terms of sector allocations, an overweight in consumer discretionary stocks was particularly unfavorable. The U.S. consumer faced a number of headwinds during the period, including falling home prices and rising food and energy costs.
Holdings remained well-diversified throughout the fiscal year, consistent with our risk-controlled approach to portfolio construction. On March 31, the Fund’s largest overweights versus the Russell 1000 Growth Index were in the health care (+5.0%) and information technology (+4.4%) sectors. The largest underweights were in consumer staples (-5.0%) and financials (-3.7%).
Market Outlook: Our process evaluates investment opportunities on a relative basis and is required to remain fully invested. As such, the process neither utilizes nor results in a forecast or outlook on the overall market, but expects to perform equally well versus the Russell 1000 Growth Index in both up and down markets.
By consistently applying this process in all market environments, we believe we will identify companies with excellent growth potential for the Fund.
Comparison of Change in Value of a $250,000 Investment in U.S. Systematic Large Cap Growth Fund Class R Shares with the Russell 1000 Growth Index.
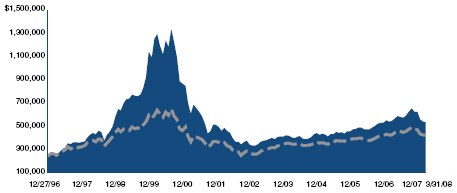

| Annualized Total Returns As of 3/31/08 | |||
1 Year | 5 Years | 10 Years | |
| U.S. Systematic Large Cap Growth | |||
| Fund Class R | -2.21% | 9.37% | 2.29% |
| Russell 1000 Growth Index | -0.75% | 9.96% | 1.28% |
The graph above shows the value of a hypothetical $250,000 investment in the Fund compared with the Russell 1000 Growth Index for the periods indicated. The Fund’s Class R shares were first available on May 21, 1999. Performance prior to the introduction of Class R shares reflects the historical performance of the Fund’s Class I Shares. This performance has been restated to reflect shareholder services fees of 0.25% applicable to Class R shares, but not Class I shares of the Fund. The Fund’s Class I Shares calculate their performance based upon the historical performance of a corresponding series of Nicholas-Applegate Mutual Funds (renamed ING Mutual Funds). Average annual total return figures include changes in principal value, reinvested dividends, and capital gain
5
U.S. SYSTEMATIC LARGE CAP GROWTH FUND
distributions. Absent expense limitations, total returns would have been slightly lower. The total returns shown above do not show the effects of income taxes on an individual’s investment. In most cases, taxes may reduce your actual investment returns on income or gains paid by the Fund or any gains you may realize if you sell your shares. Past performance cannot guarantee future results.
The Russell 1000 Growth Index measures the performance of those Russell 1000 companies with lower price-to-book ratios and lower forecasted growth values. The unmanaged index differs from the Fund in composition, does not pay management fees or expenses and includes reinvested dividends. One cannot invest directly in an index.
Since markets can go down as well as up, investment return and principal value will fluctuate with market conditions. You may have a gain or loss when you sell your shares.
6
U.S. SYSTEMATIC LARGE CAP GROWTH FUND
SCHEDULE OF INVESTMENTS
As of March 31, 2008
Number of Shares | Value | ||||||
Common Stock - 97.6% | |||||||
Aerospace/Defense - 2.3% | |||||||
Lockheed Martin Corp. | 2,800 | $ | 278,040 | ||||
Raytheon Co. | 1,900 | 122,759 | |||||
| 400,799 | |||||||
Agricultural Chemicals - 1.9% | |||||||
Monsanto Co. | 2,900 | 323,350 | |||||
Applications Software - 4.9% | |||||||
Microsoft Corp. | 29,500 | 837,210 | |||||
Athletic Footwear - 1.7% | |||||||
Nike, Inc. Cl. B | 4,400 | 299,200 | |||||
Beverages-non-Alcoholic - 3.3% | |||||||
PepsiCo, Inc. | 4,200 | 303,240 | |||||
The Coca-Cola Co. | 4,400 | 267,828 | |||||
| 571,068 | |||||||
Cable TV - 0.9% | |||||||
DISH Network Corp. Cl. A* | 5,400 | 155,142 | |||||
Chemicals-Diversified - 1.3% | |||||||
Celanese Corp. Cl. A | 5,500 | 214,775 | |||||
Coal - 0.5% | |||||||
Foundation Coal Holdings, Inc. | 1,600 | 80,528 | |||||
Computers - 8.5% | |||||||
Apple, Inc.** | 2,600 | 373,100 | |||||
Hewlett-Packard Co. | 12,700 | 579,882 | |||||
International Business Machines Corp. | 4,400 | 506,616 | |||||
| 1,459,598 | |||||||
Computers-Memory Devices - 0.7% | |||||||
Seagate Technology | 5,500 | 115,170 | |||||
Cosmetics & Toiletries - 1.2% | |||||||
Procter & Gamble Co. | 2,975 | 208,458 | |||||
Diversified Manufacturing Operations - 1.6% | |||||||
Tyco International, Ltd. | 6,300 | 277,515 | |||||
Electronic Components-Miscellaneous - 2.2% | |||||||
Garmin, Ltd.## | 3,600 | 194,436 | |||||
Tyco Electronics, Ltd. | 5,500 | 188,760 | |||||
| 383,196 | |||||||
Electronic Components-Semiconductors - 4.8% | |||||||
Intel Corp. | 31,300 | 662,934 | |||||
MEMC Electronic Materials, Inc.** | 2,200 | 155,980 | |||||
| 818,914 | |||||||
Electronics-Military - 1.0% | |||||||
L-3 Communications Holdings, Inc. | 1,600 | 174,944 | |||||
Engineering/R & D Services - 1.3% | |||||||
Jacobs Engineering Group, Inc.* | 2,100 | 154,539 | |||||
The Shaw Group, Inc.* | 1,500 | 70,710 | |||||
| 225,249 | |||||||
Engines-Internal Combust - 0.9% | |||||||
Cummins, Inc. | 3,400 | 159,188 | |||||
Enterprise Software/Services - 2.8% | |||||||
BMC Software, Inc.* | 5,900 | 191,868 | |||||
Oracle Corp.* | 14,400 | 281,664 | |||||
| 473,532 | |||||||
Internet Security - 1.8% | |||||||
Symantec Corp.* | 19,000 | 315,780 | |||||
Linen Supply & Related Items - 1.1% | |||||||
Cintas Corp. | 6,900 | 196,926 | |||||
Machinery-Farm - 2.1% | |||||||
AGCO Corp.* | 6,100 | 365,268 | |||||
Medical Instruments - 2.7% | |||||||
Intuitive Surgical, Inc.* | 600 | 194,610 | |||||
Medtronic, Inc. | 5,400 | 261,198 | |||||
| 455,808 | |||||||
Medical Products - 1.5% | |||||||
Johnson & Johnson | 3,900 | 252,993 | |||||
Medical-Biomedical/Genetics - 2.0% | |||||||
Amgen, Inc.* | 6,000 | 250,680 | |||||
Millennium Pharmaceuticals, Inc.* | 6,000 | 92,760 | |||||
| 343,440 | |||||||
Medical-Drugs - 8.3% | |||||||
Abbott Laboratories | 11,100 | 612,165 | |||||
Forest Laboratories, Inc.* | 9,200 | 368,092 | |||||
Merck & Co., Inc. | 4,500 | 170,775 | |||||
Wyeth | 6,500 | 271,440 | |||||
| 1,422,472 | |||||||
Medical-HMO - 3.6% | |||||||
Aetna, Inc. | 8,400 | 353,556 | |||||
UnitedHealth Group, Inc. | 7,700 | 264,572 | |||||
| 618,128 | |||||||
Metal Processors & Fabrication - 1.2% | |||||||
Precision Castparts Corp. | 2,000 | 204,160 | |||||
Metal-Diversified - 2.5% | |||||||
Freeport-McMoRan Copper & Gold, Inc. | 4,500 | 432,990 | |||||
Networking Products - 4.8% | |||||||
Cisco Systems, Inc.* | 29,400 | 708,246 | |||||
Juniper Networks, Inc.* | 4,700 | 117,500 | |||||
| 825,746 | |||||||
Oil & Gas Drilling - 2.1% | |||||||
Diamond Offshore Drilling, Inc. | 3,100 | 360,840 | |||||
Oil Companies-Exploration & Production - 1.1% | |||||||
Occidental Petroleum Corp. | 2,600 | 190,242 | |||||
Oil Field Machinery & Equipment - 2.6% | |||||||
National Oilwell Varco, Inc.* | 7,700 | 449,526 | |||||
Oil-Field Services - 1.2% | |||||||
Smith International, Inc.* | 1,600 | 102,768 | |||||
Transocean, Inc.* | 769 | 103,969 | |||||
| 206,737 | |||||||
Pharmacy Services - 2.5% | |||||||
Medco Health Solutions, Inc.* | 10,000 | 437,900 | |||||
Publishing-Newspapers - 1.1% | |||||||
Gannett Co., Inc. | 6,300 | 183,015 | |||||
Retail-Computer Equipment - 1.4% | |||||||
GameStop Corp. Cl. A* | 4,700 | 243,037 | |||||
Retail-Discount - 2.7% | |||||||
Dollar Tree, Inc.* | 5,800 | 160,022 | |||||
Wal-Mart Stores, Inc. | 5,800 | 305,544 | |||||
| 465,566 | |||||||
Retail-Restaurants - 1.4% | |||||||
McDonald’s Corp. | 4,400 | 245,388 | |||||
See Accompanying Notes to Financial Statements.
7
U.S. SYSTEMATIC LARGE CAP GROWTH FUND
SCHEDULE OF INVESTMENTS
As of March 31, 2008
Number of Shares | Value | ||||||
Schools - 0.3% | |||||||
Apollo Group, Inc. Cl. A* | 1,300 | $ | 56,160 | ||||
Super-Regional Banks-US - 2.9% | |||||||
Capital One Financial Corp. | 3,800 | 187,036 | |||||
Fifth Third BanCorp. | 14,700 | 307,524 | |||||
| 494,560 | |||||||
Telecommunications Equipment Fiber Optics - 0.9% | |||||||
Ciena Corp.* | 4,800 | 147,984 | |||||
Telephone-Integrated - 0.9% | |||||||
Verizon Communications, Inc. | 4,400 | 160,380 | |||||
Television - 1.8% | |||||||
CBS Corp. Cl. B | 14,300 | 315,744 | |||||
Web Portals/ISP - 1.3% | |||||||
Google, Inc. Cl. A* | 500 | 220,235 | |||||
| Total Common Stock (Cost: $16,308,736) | 16,788,861 | ||||||
Principal Amount | |||||||
Short Term Investments - 2.7% | |||||||
Money Market Funds - 0.3% | |||||||
Lehman Brothers, Inc., 1.600%** | $ | 57,250 | 57,250 | ||||
Time Deposit - 2.4% | |||||||
Wachovia Bank London | |||||||
1.700%, 04/01/08 | 414,653 | 414,653 | |||||
| Total Short Term Investments (Cost: $471,903) | 471,903 | ||||||
| Total Investments - 100.3% (Cost: $16,780,639) | 17,260,764 | ||||||
| Liabilities In Excess of Other Assets - (0.3%) | (54,363 | ) | |||||
| Net Assets - 100.0% | $ | 17,206,401 | |||||
| * | Non-income producing securities. |
| ** | All of the security is purchased with cash collateral proceeds from securities loans. |
| ## | All or a portion of the Fund’s holdings in this security was on loan as of 03/31/08. |
SCHEDULE OF INVESTMENTS BY SECTOR
as of March 31, 2008
| Sector | Percent of Net Assets | |||
| Consumer, Non-cyclical | 25.4 | % | ||
| Technology | 21.5 | |||
| Communications | 13.5 | |||
| Industrial | 12.7 | |||
| Consumer, Cyclical | 8.4 | |||
| Energy | 7.5 | |||
| Basic Materials | 5.7 | |||
| Financial | 2.9 | |||
| Short Term Investments | 2.7 | |||
| Total Investments | 100.3 | |||
| Liabilities in excess of other assets | (0.3 | ) | ||
| Net Assets | 100.0 | % | ||
See Accompanying Notes to Financial Statements.
8
INTERNATIONAL GROWTH FUND
Management Team: Horacio A. Valeiras, CFA, Portfolio Manager and Chief Investment Officer; Pedro V. Marcal, Portfolio Manager; Yuka Marosek, Analyst
Goal: The International Growth Fund seeks to maximize long-term capital appreciation through investments primarily in companies with above average earnings growth and positioned in strong growth areas.
Market Overview: Equity markets in developed non-U.S. countries posted losses during the fiscal year ended March 31, 2008. Weakness in the U.S. dollar versus a basket of currencies substantially cushioned the decline for U.S.-based investors.
The MSCI EAFE Index started the period with gains, driven by positive economic trends in Europe, evidence the U.S. economy was improving after a weak start to 2007 and a brisk pace of mergers and acquisitions. During the first half of 2007, the combined value of deal activity in Europe surpassed U.S. totals for the first time in four years.
Equities retreated later in the period, as the worst global liquidity crunch in a decade began to unfold. The crisis was triggered by huge losses on securities linked to U.S. mortgages and culminated in runs on a U.K. bank and a U.S. securities firm. To try to unfreeze the credit markets, central bankers worldwide pumped extra liquidity into the financial system. The European Central Bank announced that it would offer six-month loans to financial institutions for the first time but kept interest rates on hold after a June increase. The Bank of England, which also had been hiking earlier in the year, cut rates 0.50% between December and March. Japan’s central bank held rates steady throughout the period.
Returns in most EAFE markets were negative in local currencies. Europe outperformed the Pacific region due to weakness in Japan, where there was political uncertainty and signs of slowing growth. Broadly speaking, growth stocks delivered modest gains and outpaced value stocks, which declined.
Performance: During the twelve months ended March 31, 2008, the Fund’s Class R shares gained 11.21% and outperformed the MSCI EAFE Index, which lost 2.27%.
Portfolio Specifics: The Fund’s outperformance was driven by stock selection, which was positive in the majority of countries and sectors. Stock selection was especially strong in Australia and among industrials and materials companies. Overall, the Fund’s sector exposures, which are a byproduct of our bottom-up investment decisions, also were a source of value added. For example, an underweight in financials was a plus, since financials was the worst-performing sector in the benchmark given the liquidity challenges in the market. Areas of relative weakness included stock selection in Germany and Singapore and an underweight in energy, one of the index’s stronger sectors on record oil prices.
At the individual stock level, some of our best-performing holdings were Australia-based CSL Limited, a biotechnology firm; Japan Steel Works, a manufacturer of industrial machinery; and Australia-based Incitec Pivot, a fertilizer producer.
Market Outlook: Developed non-U.S. economies are feeling the effects of the U.S. slowdown, and recent readings on consumer confidence in Europe and Japan suggest a softening in domestic demand. That said, a number of positive factors may lend support to equity prices, including:
| • | Potential for many central banks to cut interest rates to boost growth, despite stubborn inflation |
| • | Attractive equity valuations, particularly in Japan amid poor stock market performance and a lack of earnings acceleration |
| • | Robust labor markets, which should help mitigate flagging consumer confidence |
In the changing environment, we are confident that our bottom-up investment process will continue to lead us to companies with outstanding growth potential for the Fund.
Comparison of Change in Value of a $250,000 Investment in International Growth Fund Class R Shares with the MSCI EAFE Index.
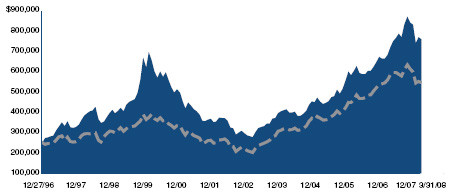

| Annualized Total Returns As of 3/31/08 | |||
1 Year | 5 Years | 10 Years | |
| International Growth Fund Class R | 11.21% | 22.21% | 7.06% |
| MSCI EAFE Index | -2.27% | 21.90% | 6.56% |
The graph above shows the value of a hypothetical $250,000 investment in the Fund’s Class R shares compared with the Morgan Stanley Capital International Europe, Australasia, Far East Index (“MSCI EAFE”) over the periods indicated. The Fund’s Class R shares were first available on May 21, 1999. Performance prior to the introduction of Class R shares reflects the historical performance of the Fund’s Class I Shares.
This performance has been restated to reflect shareholder services fees of 0.25% applicable to Class R shares, but not Class I shares of the Fund. The Fund’s Class I Shares calculate their performance
9
INTERNATIONAL GROWTH FUND
based upon the historical performance of a corresponding series of Nicholas-Applegate Mutual Funds (renamed ING Mutual Funds), adjusted to reflect all fees and expenses applicable to the Fund’s Class I shares. Average annual total return figures include changes in principal value, reinvested dividends, and capital gain distributions.
The total returns shown above do not show the effects of income taxes on an individual’s investment. In most cases, taxes may reduce your actual investment returns on income or gains paid by the Fund or any gains you may realize if you sell your shares. Past performance cannot guarantee future results.
The MSCI EAFE Index is an unmanaged index of over 900 companies, and is a generally accepted benchmark for major overseas markets. Index weightings represent the relative capitalizations of the major overseas markets included in the index on a U.S. dollar adjusted basis. The unmanaged Index differs from the Fund in composition, does not pay management fees or expenses and includes reinvested dividends.
One cannot invest directly in an index.
Since markets can go down as well as up, investment return and principal value will fluctuate with market conditions, currency volatility and the social, economic and political climates of countries where the Fund invests. You may have a gain or loss when you sell your shares.
10
INTERNATIONAL GROWTH FUND
SCHEDULE OF INVESTMENTS
As of March 31, 2008
Number of Shares | Value | ||||||
Common Stock - 94.3% | |||||||
Australia - 5.3% | |||||||
AMP, Ltd. | 23,896 | $ | 171,236 | ||||
CSL, Ltd. | 16,468 | 554,861 | |||||
Incitec Pivot, Ltd.## | 2,575 | 331,786 | |||||
Rio Tinto, Ltd. | 1,705 | 190,660 | |||||
| 1,248,543 | |||||||
Belgium - 1.2% | |||||||
InBev NV | 3,337 | 294,733 | |||||
Brazil - 1.8% | |||||||
Bolsa de Mercadorias e Futuros - BM&F | 8,700 | 79,611 | |||||
Cia Vale do Rio Doce - ADR## | 7,700 | 266,728 | |||||
Unibanco - Uniao de Bancos Brasileiros SA - GDR | 700 | 81,648 | |||||
| 427,987 | |||||||
Canada - 2.2% | |||||||
Potash Corp. of Saskatchewan | 700 | 108,647 | |||||
Rogers Communications, Inc. Cl. B | 5,500 | 197,905 | |||||
Teck Cominco, Ltd. Cl. B | 5,300 | 217,413 | |||||
| 523,965 | |||||||
Denmark - 2.3% | |||||||
FLSmidth & Co. AS Cl. B | 3,950 | 392,377 | |||||
Novo Nordisk AS Cl. B | 2,150 | 147,559 | |||||
| 539,936 | |||||||
Egypt - 0.5% | |||||||
Orascom Construction Industries - GDR | 790 | 117,824 | |||||
Finland - 2.7% | |||||||
Nokia OYJ | 7,258 | 230,473 | |||||
Outotec OYJ## | 5,369 | 286,701 | |||||
Wartsila OYJ | 1,628 | 110,280 | |||||
| 627,454 | |||||||
France - 8.9% | |||||||
Alstom | 1,639 | 356,631 | |||||
BNP Paribas | 1,348 | 136,467 | |||||
Cie Generale de Geophysique-Veritas* | 926 | 231,363 | |||||
Electricite de France | 2,110 | 184,255 | |||||
Gaz de France SA | 4,112 | 249,159 | |||||
Suez SA | 3,586 | 236,209 | |||||
Total SA | 3,135 | 233,674 | |||||
Veolia Environnement | 6,820 | 477,221 | |||||
| 2,104,979 | |||||||
Germany - 9.6% | |||||||
Deutsche Telekom AG | 8,085 | 135,157 | |||||
E.ON AG | 2,741 | 509,290 | |||||
Rhoen Klinikum AG | 4,014 | 119,384 | |||||
RWE AG | 2,118 | 261,304 | |||||
SAP AG | 4,329 | 215,938 | |||||
Siemens AG | 1,438 | 156,425 | |||||
Solarworld AG | 3,920 | 187,399 | |||||
Stada Arzneimittel AG | 4,081 | 297,526 | |||||
Tognum AG* | 5,194 | 114,317 | |||||
United Internet AG | 11,897 | 256,944 | |||||
| 2,253,684 | |||||||
Greece - 1.7% | |||||||
National Bank of Greece SA | 3,642 | 192,865 | |||||
Piraeus Bank SA | 6,550 | 202,179 | |||||
| 395,044 | |||||||
Hong Kong - 2.3% | |||||||
CLP Holdings, Ltd. | 35,000 | 288,037 | |||||
HongKong Electric Holdings | 27,500 | 173,667 | |||||
Kerry Properties, Ltd. | 15,063 | 90,964 | |||||
| 552,668 | |||||||
Ireland - 1.0% | |||||||
Anglo Irish Bank Corp. PLC | 9,512 | 127,360 | |||||
Icon PLC - ADR* | 1,800 | 116,802 | |||||
| 244,162 | |||||||
Israel - 1.0% | |||||||
Teva Pharmaceutical Industries, Ltd. - ADR | 5,100 | 235,569 | |||||
Italy - 2.6% | |||||||
Saipem SpA | 8,268 | 335,911 | |||||
UniCredit SpA | 42,130 | 283,050 | |||||
| 618,961 | |||||||
Japan - 19.9% | |||||||
Chugai Pharmaceutical Co., Ltd. | 19,800 | 224,188 | |||||
East Japan Railway Co. | 49 | 408,108 | |||||
Honda Motor Co., Ltd. | 4,800 | 137,198 | |||||
Japan Tobacco, Inc. | 104 | 521,384 | |||||
KDDI Corp. | 42 | 256,975 | |||||
Kirin Holdings Co., Ltd. | 10,000 | 189,381 | |||||
Mitsubishi Corp. | 9,600 | 290,310 | |||||
Mitsubishi Electric Corp. | 14,300 | 123,842 | |||||
Mitsubishi Estate Co., Ltd. | 3,300 | 80,233 | |||||
Mitsubishi UFJ Financial Group, Inc. | 20,300 | 175,396 | |||||
Nintendo Co., Ltd. | 900 | 464,761 | |||||
Nitori Co., Ltd. | 2,400 | 135,992 | |||||
Nomura Holdings, Inc. | 15,000 | 224,544 | |||||
Secom Co., Ltd. | 5,900 | 286,894 | |||||
Sumitomo Heavy Industries, Ltd. | 13,000 | 84,111 | |||||
The Japan Steel Works, Ltd. | 25,000 | 426,734 | |||||
Toyo Tanso Co., Ltd. | 4,100 | 384,317 | |||||
Toyota Motor Corp. | 3,100 | 154,790 | |||||
Unicharm Corp. | 1,600 | 117,185 | |||||
| 4,686,343 | |||||||
Mexico - 0.4% | |||||||
America Movil SAB de CV - ADR## | 1,300 | 82,797 | |||||
Netherlands - 2.3% | |||||||
Koninklijke BAM Groep NV | 8,167 | 193,209 | |||||
Royal KPN NV | 10,266 | 174,057 | |||||
SBM Offshore NV | 5,697 | 184,425 | |||||
| 551,691 | |||||||
Peru - 0.3% | |||||||
CrediCorp., Ltd. | 1,000 | 71,740 | |||||
Republic Of China - 0.3% | |||||||
China Communications Construction Co., Ltd. | 34,000 | 75,402 | |||||
Russian Federation - 1.2% | |||||||
Evraz Group SA - GDR | 3,172 | 273,744 | |||||
Singapore - 2.4% | |||||||
City Developments, Ltd. | 29,600 | 236,688 | |||||
DBS Group Holdings, Ltd. | 25,100 | 327,831 | |||||
| 564,519 | |||||||
See Accompanying Notes to Financial Statements.
11
INTERNATIONAL GROWTH FUND
SCHEDULE OF INVESTMENTS
As of March 31, 2008
Number of Shares | Value | ||||||
Spain - 3.0% | |||||||
Banco Santander SA | 19,502 | $ | 389,982 | ||||
Iberdrola SA | 7,773 | 120,950 | |||||
Telefonica SA | 6,809 | 196,363 | |||||
| 707,295 | |||||||
Switzerland - 6.0% | |||||||
Julius Baer Holding AG | 2,805 | 207,599 | |||||
Nestle SA | 1,116 | 559,946 | |||||
Roche Holding AG | 1,582 | 298,949 | |||||
Swatch Group AG | 3,754 | 193,574 | |||||
Syngenta AG | 545 | 160,351 | |||||
| 1,420,419 | |||||||
United Kingdom - 15.4% | |||||||
Barclays PLC | 14,577 | 131,242 | |||||
BP PLC | 19,829 | 201,780 | |||||
British American Tobacco PLC | 15,026 | 564,732 | |||||
BT Group PLC | 36,462 | 157,437 | |||||
Burberry Group PLC | 14,262 | 127,697 | |||||
Diageo PLC | 14,631 | 295,444 | |||||
HSBC Holdings PLC | 15,200 | 247,642 | |||||
Imperial Tobacco Group PLC | 6,342 | 292,178 | |||||
International Power PLC | 35,939 | 284,286 | |||||
Reckitt Benckiser Group PLC | 4,039 | 224,048 | |||||
Royal Dutch Shell PLC | 5,666 | 195,607 | |||||
Southern Cross Healthcare, Ltd. | 23,453 | 174,798 | |||||
SSL International PLC | 15,615 | 140,743 | |||||
Unilever PLC | 10,190 | 344,092 | |||||
Vodafone Group PLC | 84,988 | 254,891 | |||||
| 3,636,617 | |||||||
| Total Common Stock (Cost: $20,614,197) | 22,256,076 | ||||||
Preferred Stock - 3.7% | |||||||
Brazil - 1.0% | |||||||
Usinas Siderurgicas de Minas Gerais SA | 4,200 | 236,363 | |||||
Germany - 2.7% | |||||||
Fresenius SE | 4,594 | 383,990 | |||||
Henkel KGaA | 5,794 | 268,816 | |||||
| 652,806 | |||||||
| Total Preferred Stock (Cost: $829,188) | 889,169 | ||||||
Principal Amount | Value | ||||||
Short Term Investments - 4.4% | |||||||
Money Market Funds - 2.9% | |||||||
Boston Global Investment Trust - | |||||||
| Enhanced Portfolio, 3.017%** | $ | 690,354 | $ | 690,354 | |||
Time Deposits - 1.5% | |||||||
Wachovia Bank London | |||||||
1.700%, 04/01/08 | 347,968 | 347,968 | |||||
| Total Short Term Investments (Cost: $1,038,322) | 1,038,322 | ||||||
| Total Investments - 102.4% (Cost: $22,481,707) | 24,183,567 | ||||||
| Liabilities in Excess of Other Assets - (2.4%) | (574,117 | ) | |||||
| Net Assets - 100.0% | $ | 23,609,450 | |||||
| * | Non-income producing securities. |
| ** | All of the security is purchased with cash collateral proceeds from securities loans. |
| ## | All or a portion of the Fund’s holdings in this security was on loan as of 3/31/08. |
ADR - American Depository Receipt
GDR - Global Depository Receipt
SCHEDULE OF INVESTMENTS BY SECTOR
as of March 31, 2008
| Sector | Percent of Net Assets | |||
| Consumer, Non-cyclical | 28.2 | % | ||
| Financial | 15.2 | |||
| Industrial | 13.7 | |||
| Utilities | 11.8 | |||
| Communications | 7.6 | |||
| Basic Materials | 7.6 | |||
| Energy | 6.6 | |||
| Consumer, Cyclical | 6.4 | |||
| Technology | 0.9 | |||
| Short Term Investments | 4.4 | |||
| Total Investments | 102.4 | |||
| Liabilities in excess of other assets | (2.4 | ) | ||
| Net Assets | 100.0 | % | ||
See Accompanying Notes to Financial Statements.
12
(This page intentionally left blank)
13
NICHOLAS-APPLEGATE INSTITUTIONAL FUNDS
FINANCIAL HIGHLIGHTS
For a Class R share outstanding during the period indicated
| Distributions from: | |||||||||||||||||||||||||
Net Asset Value, Beginning | Net Investment Income (Loss) (1) | Net Realized and Unrealized Gains (Loss) | Total from Investment Operations | Net Investment Income | Net Realized Capital Gains | Total Distributions | Net Asset Value, Ending | ||||||||||||||||||
U.S. EQUITY FUNDS | |||||||||||||||||||||||||
U.S. EMERGING GROWTH | |||||||||||||||||||||||||
| For the year ended 03/31/08 | $ | 12.84 | $ | (0.10 | ) | $ | (0.66) | (5) | $ | (0.76 | ) | $ | — | $ | (0.88 | ) | $ | (0.88 | ) | $ | 11.20 | ||||
| For the year ended 03/31/07 | 13.69 | (0.10 | ) | 0.18 | (6) | 0.08 | — | (0.93 | ) | (0.93 | ) | 12.84 | |||||||||||||
| For the year ended 03/31/06 | 9.65 | (0.14 | ) | 4.18 | 4.04 | — | — | — | 13.69 | ||||||||||||||||
| For the year ended 03/31/05 | 9.52 | (0.10 | ) | 0.23 | 0.13 | — | — | — | 9.65 | ||||||||||||||||
| For the year ended 03/31/04 | 6.27 | (0.11 | ) | 3.36 | 3.25 | — | — | — | 9.52 | ||||||||||||||||
U.S. SYSTEMATIC LARGE CAP GROWTH | |||||||||||||||||||||||||
| For the year ended 03/31/08 | $ | 19.42 | $ | (0.07 | ) | $ | (0.36) | (5) | $ | (0.43 | ) | $ | — | $ | — | $ | — | $ | 18.99 | ||||||
| For the year ended 03/31/07 | 17.59 | (0.02 | ) | 1.85 | 1.83 | — | — | — | 19.42 | ||||||||||||||||
| For the year ended 03/31/06 | 15.46 | (0.02 | ) | 2.15 | 2.13 | — | — | — | 17.59 | ||||||||||||||||
| For the year ended 03/31/05 | 14.90 | 0.02 | 0.54 | 0.56 | — | — | — | 15.46 | |||||||||||||||||
| For the year ended 03/31/04 | 12.61 | (0.06 | ) | 2.35 | 2.29 | — | — | — | 14.90 | ||||||||||||||||
GLOBAL EQUITY FUND | |||||||||||||||||||||||||
INTERNATIONAL GROWTH | |||||||||||||||||||||||||
| For the year ended 03/31/08 | $ | 21.78 | $ | 0.10 | $ | 3.85 | $ | 3.95 | $ | (1.06 | ) | $ | (17.59 | ) | $ | (18.65 | ) | $ | 7.08 | ||||||
| For the year ended 03/31/07 | 22.26 | (0.01 | ) | 2.79 | 2.78 | (0.06 | ) | (3.20 | ) | (3.26 | ) | 21.78 | |||||||||||||
| For the year ended 03/31/06 | 20.19 | 0.12 | 5.94 | 6.06 | — | (3.99 | ) | (3.99 | ) | 22.26 | |||||||||||||||
| For the year ended 03/31/05 | 18.93 | 0.15 | 1.53 | 1.68 | — | (0.42 | ) | (0.42 | ) | 20.19 | |||||||||||||||
| For the year ended 03/31/04 | 12.72 | 0.12 | 6.10 | 6.22 | (0.01 | ) | — | (0.01 | ) | 18.93 | |||||||||||||||
| Ratios to Average Net Assets (3) | |||||||||||||||||||||||||
| Total Return (2) | Net Assets, Ending(in 000’s) | Net Investment Income (Loss) | Total Expenses | Expense(Reimbursements)/ Recoupment | Expenses Net of Reimbursement/ Recoupment | Expenses Net of Reimbursement/ Recoupment Offset (4) | Fund’s Portfolio Turnover Rate | ||||||||||||||||||
U.S. EQUITY FUNDS | |||||||||||||||||||||||||
U.S. EMERGING GROWTH | |||||||||||||||||||||||||
| For the year ended 03/31/08 | (7.15 | %) | $ | 2,870 | (0.71 | %) | 1.46 | % | — | 1.46 | % | 0.96 | % | 129 | % | ||||||||||
| For the year ended 03/31/07 | 1.02 | % | 3,177 | (0.78 | %) | 1.46 | % | — | 1.46 | % | 0.97 | % | 148 | % | |||||||||||
| For the year ended 03/31/06 | 41.98 | % | 3,173 | (1.27 | %) | 2.09 | % | (0.36 | %) | 1.73 | % | 1.42 | % | 128 | % | ||||||||||
| For the year ended 03/31/05 | 1.37 | % | 3,681 | (1.06 | %) | 1.89 | % | (0.20 | %) | 1.69 | % | 1.26 | % | 142 | % | ||||||||||
| For the year ended 03/31/04 | 51.83 | % | 3,948 | (1.28 | %) | 1.73 | % | — | 1.73 | % | 1.51 | % | 166 | % | |||||||||||
U.S. SYSTEMATIC LARGE CAP GROWTH | |||||||||||||||||||||||||
| For the year ended 03/31/08 | (2.21 | %) | $ | 5,822 | (0.35 | %) | 1.39 | % | — | 1.39 | % | 1.36 | % | 106 | % | ||||||||||
| For the year ended 03/31/07 | 10.40 | % | 6,022 | (0.13 | %) | 1.38 | % | — | 1.38 | % | 1.30 | % | 100 | % | |||||||||||
| For the year ended 03/31/06 | 13.78 | % | 6,055 | (0.11 | %) | 1.86 | % | (0.48 | %) | 1.38 | % | 1.29 | % | 147 | % | ||||||||||
| For the year ended 03/31/05 | 3.76 | % | 9,318 | 0.14 | % | 1.94 | % | (0.57 | %) | 1.37 | % | 1.29 | % | 197 | % | ||||||||||
| For the year ended 03/31/04 | 18.16 | % | 10,229 | (0.41 | %) | 1.58 | % | (0.20 | %) | 1.38 | % | 1.18 | % | 172 | % | ||||||||||
GLOBAL EQUITY FUND | |||||||||||||||||||||||||
INTERNATIONAL GROWTH | |||||||||||||||||||||||||
| For the year ended 03/31/08 | 11.05 | % | $ | 2,595 | 0.74 | % | 1.64 | % | — | 1.64 | % | 1.24 | % | 113 | % | ||||||||||
| For the year ended 03/31/07 | 13.36 | % | 2,294 | (0.05 | %) | 1.67 | % | — | 1.67 | % | 1.41 | % | 119 | % | |||||||||||
| For the year ended 03/31/06 | 33.34 | % | 1,776 | 0.57 | % | 1.62 | % | (0.00 | %) | 1.62 | % | 1.24 | % | 167 | % | ||||||||||
| For the year ended 03/31/05 | 8.94 | % | 1,749 | 0.80 | % | 1.66 | % | (0.02 | %) | 1.64 | % | 1.32 | % | 203 | % | ||||||||||
| For the year ended 03/31/04 | 48.86 | % | 9,236 | 0.71 | % | 1.74 | % | (0.04 | %) | 1.70 | % | 1.44 | % | 186 | % | ||||||||||
| (1) | Net investment income per share is calculated by dividing net investment income for the period by the average shares outstanding during the period. |
| (2) | Total returns are not annualized for periods less than one year. |
(3) | Ratios are annualized for periods of less than one year. Expense reimbursements reflect voluntary reductions to total expenses. Such amounts would increase net investment income (loss) ratios had such reductions not occurred. |
| (4) | Net expenses include certain items not subject to expense reimbursement for periods prior to January 23, 2006. |
| (5) | Includes litigation proceeds of approximately $0.07 per share for the U.S. Emerging Growth Fund and $0.09 per share for the U.S. Systematic Large Cap Growth Fund. |
| (6) | The fund received $12,373 from a security litigation settlement during the year which is reflected in realized gains. This event had a $0.05 per share impact to the fund. |
See Accompanying Notes to Financial Statements.
14 & 15
NICHOLAS-APPLEGATE INSTITUTIONAL FUNDS
STATEMENTS OF ASSETS AND LIABILITIES
| March 31, 2008 | U.S. Emerging Growth | U.S. Systematic Large Cap Growth | International Growth | |||||||
Assets | ||||||||||
Investments, at value*, a | $ | 11,664,820 | $ | 17,260,764 | $ | 24,183,567 | ||||
Foreign currencies, at value** | — | — | 10,155 | |||||||
Cash | — | — | 2,297 | |||||||
Receivables: | ||||||||||
Investment securities sold | 43,440 | — | 122 | |||||||
Capital shares sold | — | 2,614 | — | |||||||
Dividends | 2,645 | 22,045 | 154,175 | |||||||
Foreign taxes receivable | — | — | 37,022 | |||||||
Interest | — | — | — | |||||||
Other | 3,842 | — | 5,094 | |||||||
Total assets | 11,714,747 | 17,285,423 | 24,392,432 | |||||||
Liabilities | ||||||||||
Payables: | ||||||||||
Bank overdraft | $ | — | $ | — | $ | — | ||||
Investments purchased | — | — | 66,400 | |||||||
Capital shares redeemed | 4,550 | 2,214 | 978 | |||||||
Collateral on securities loaned | 1,328,506 | 57,250 | 690,354 | |||||||
Distributions fee | — | — | — | |||||||
To investment advisor | 6,575 | 6,553 | 9,598 | |||||||
Other Liabilites | 5,850 | 13,005 | 15,652 | |||||||
Total Liabilities | 1,345,481 | 79,022 | 782,982 | |||||||
NET ASSETS | 10,369,266 | 17,206,401 | 23,609,450 | |||||||
* Investments, at cost | 12,134,631 | 16,780,639 | 22,481,707 | |||||||
** Foreign currencies, at cost | — | — | 9,990 | |||||||
Net Assets Consist of: | ||||||||||
Paid-in capital | $ | 15,808,225 | $ | 23,508,191 | $ | 30,560,925 | ||||
Undistributed net investment income (loss) | — | — | 460,556 | |||||||
Accumulated net realized gain (loss) on | ||||||||||
| investments and foreign currencies | (4,969,148 | ) | (6,781,915 | ) | (9,121,395 | ) | ||||
Net unrealized appreciation (depreciation) of | ||||||||||
| investments and of other assets and | ||||||||||
| liabilities denominated in foreign currencies | (469,811 | ) | 480,125 | 1,709,364 | ||||||
| Net Assets applicable to all shares outstanding | $ | 10,369,266 | $ | 17,206,401 | $ | 23,609,450 | ||||
Net Assets of Class I shares | $ | 7,499,071 | $ | 790,563 | $ | 9,496,169 | ||||
Net Assets of Class II shares | — | 10,594,102 | 11,518,114 | |||||||
Net Assets of Class III shares | — | — | — | |||||||
Net Assets of Class IV shares | — | — | — | |||||||
Net Assets of Class R shares | 2,870,195 | 5,821,736 | 2,595,167 | |||||||
Class I Shares outstanding | 654,706 | 40,782 | 1,122,747 | |||||||
Class II Shares outstanding | — | 549,223 | 1,493,350 | |||||||
Class III Shares outstanding | — | — | — | |||||||
Class IV Shares outstanding | — | — | — | |||||||
Class R Shares outstanding | 256,326 | 306,500 | 366,363 | |||||||
Net Asset Value — Class I Share | $ | 11.45 | $ | 19.39 | $ | 8.46 | ||||
Net Asset Value — Class II Share | $ | — | $ | 19.29 | $ | 7.71 | ||||
Net Asset Value — Class III Share | $ | — | $ | — | $ | — | ||||
Net Asset Value — Class IV Share | $ | — | $ | — | $ | — | ||||
Net Asset Value — Class R Share | $ | 11.20 | $ | 18.99 | $ | 7.08 | ||||
| (a) Including securities on loan with a values of: | $ | 1,294,828 | $ | 56,080 | $ | 668,577 | ||||
See Accompanying Notes to Financial Statements.
16
NICHOLAS-APPLEGATE INSTITUTIONAL FUNDS
STATEMENTS OF OPERATIONS
Year Ended March 31, 2008 | U.S. Emerging Growth | U.S. Systematic Large Cap Growth | International Growth | |||||||
Investment Income | ||||||||||
Dividends, net of foreign taxes* | $ | 29,974 | $ | 193,683 | $ | 844,235 | ||||
Interest | — | — | 384 | |||||||
Total Income | 29,974 | 193,683 | 844,619 | |||||||
Expenses | ||||||||||
Advisory fee | 88,469 | 86,685 | 194,196 | |||||||
Administration fees | 48,363 | 105,451 | 239,041 | |||||||
Shareholder servicing fees | 8,635 | 16,094 | 6,769 | |||||||
Professional fees | 1,535 | 2,949 | — | |||||||
Trustees’ fees and expenses | 2,443 | 3,943 | 8,364 | |||||||
Interest and credit facility fee | 164 | 427 | 893 | |||||||
Miscellaneous | 1,414 | 1,687 | 902 | |||||||
Total Expenses | 151,023 | 217,236 | 450,165 | |||||||
Expense offset | (57,887 | ) | (5,965 | ) | (121,261 | ) | ||||
Net Expenses | 93,136 | 211,271 | 328,904 | |||||||
Net Investment Income (Loss) | (63,162 | ) | (17,588 | ) | 515,715 | |||||
Net Realized and Unrealized | ||||||||||
Gain (Loss) on Investments | ||||||||||
Realized gain from: | ||||||||||
Securities | 1,109,622 | 1,142,381 | 22,050,147 | |||||||
Foreign currency transactions | — | — | (17,466 | ) | ||||||
Net realized gain (loss) | 1,109,622 | 1,142,381 | 22,032,681 | |||||||
Change in unrealized appreciation of: | ||||||||||
Investments | (1,932,344 | ) | (1,503,590 | ) | (11,503,281 | ) | ||||
Other assets and liabilities denominated in | ||||||||||
foreign currencies | — | — | 1,286,337 | |||||||
Net unrealized appreciation | (1,932,344 | ) | (1,503,590 | ) | (10,216,944 | ) | ||||
Net Gain (Loss) on Investments | (822,722 | ) | (361,209 | ) | 11,815,737 | |||||
Assets Resulting From Operations | $ | (885,884 | ) | $ | (378,797 | ) | $ | 12,331,452 | ||
* Foreign taxes withheld | $ | — | $ | — | $ | 82,306 | ||||
See Accompanying Notes to Financial Statements.
17
NICHOLAS-APPLEGATE INSTITUTIONAL FUNDS
STATEMENTS OF CHANGES IN NET ASSETS
| U.S. Emerging Growth | U.S. Systematic Large Cap Growth | ||||||||||||
| Years Ended March 31 | 2008 | 2007 | 2008 | 2007 | |||||||||
| Increase (Decrease) In Net Assets From Investment Operations: | |||||||||||||
Net investment income (loss) | $ | (63,162 | ) | $ | (62,920 | ) | $ | (17,588 | ) | $ | 16,091 | ||
Net realized gain (loss) | 1,109,622 | 1,305,006 | 1,142,381 | 1,136,149 | |||||||||
Net unrealized appreciation (depreciation) | (1,932,344 | ) | (1,129,950 | ) | (1,503,590 | ) | 565,057 | ||||||
Investment operations | (885,884 | ) | 112,136 | (378,797 | ) | 1,717,297 | |||||||
Distributions to Shareholders: | |||||||||||||
From net investment income | |||||||||||||
Class I | — | — | — | (1,377 | ) | ||||||||
Class II | — | — | (16,091 | ) | — | ||||||||
Class IV | |||||||||||||
From net realized gains | |||||||||||||
Class I | (527,551 | ) | (739,964 | ) | — | — | |||||||
Class II | — | — | — | — | |||||||||
Class IV | |||||||||||||
Class R | (217,858 | ) | — | — | — | ||||||||
Total distributions | (745,409 | ) | (739,964 | ) | (16,091 | ) | (1,377 | ) | |||||
From Capital Share Transactions: | |||||||||||||
Proceeds from shares sold | |||||||||||||
Class I | 2,539,292 | 2,347,555 | 106,984 | 747,760 | |||||||||
Class II | — | — | 2,468,812 | 5,251,286 | |||||||||
Class IV | |||||||||||||
Class R | 1,124,520 | 1,241,746 | 486,815 | 577,773 | |||||||||
Distributions reinvested | |||||||||||||
Class I | 526,107 | 513,359 | — | — | |||||||||
Class II | — | — | 16,091 | 1,377 | |||||||||
Class IV | |||||||||||||
Class R | 217,859 | 226,606 | — | — | |||||||||
Cost of shares redeemed | |||||||||||||
Class I | (1,777,085 | ) | (1,775,938 | ) | (262,579 | ) | (556,909 | ) | |||||
Class II | — | — | (1,650,704 | ) | (4,013 | ) | |||||||
Class IV | |||||||||||||
Class R | (1,216,005 | ) | (1,234,060 | ) | (571,686 | ) | (1,190,968 | ) | |||||
| Net increase (decrease) in net assets from share transactions | 1,414,688 | 1,319,268 | 593,733 | 4,826,306 | |||||||||
Net Increase (Decrease) in Net Assets | (216,605 | ) | 691,440 | 198,845 | 6,542,226 | ||||||||
Net Assets | |||||||||||||
Beginning | 10,585,871 | 9,894,431 | 17,007,556 | 10,465,330 | |||||||||
Ending | $ | 10,369,266 | $ | 10,585,871 | $ | 17,206,401 | $ | 17,007,556 | |||||
Undistributed net investment income (loss), ending | $ | — | $ | — | $ | — | $ | 16,091 | |||||
Class I — Capital Share Activity | |||||||||||||
Shares sold | 182,466 | 179,774 | 5,151 | 38,919 | |||||||||
Distributions reinvested | 37,552 | 41,601 | — | — | |||||||||
Shares redeemed | (131,451 | ) | (138,889 | ) | (12,161 | ) | (28,488 | ) | |||||
Net Class I Share Activity | 88,567 | 82,486 | (7,010 | ) | 10,431 | ||||||||
Class II — Capital Share Activity | |||||||||||||
Shares sold | — | — | 113,463 | 299,668 | |||||||||
Distributions reinvested | — | — | 704 | 73 | |||||||||
Shares redeemed | — | — | (75,329 | ) | (222 | ) | |||||||
Net Class II Share Activity | — | — | 38,838 | 299,519 | |||||||||
Class IV — Capital Share Activity | |||||||||||||
Shares sold | — | — | — | — | |||||||||
Distributions reinvested | — | — | — | — | |||||||||
Shares redeemed | — | — | — | — | |||||||||
Net Class IV Share Activity | — | — | — | — | |||||||||
Class R — Capital Share Activity | |||||||||||||
Shares sold | 79,606 | 95,674 | 23,608 | 31,541 | |||||||||
Distributions reinvested | 15,891 | 18,696 | — | — | |||||||||
Shares redeemed | (86,526 | ) | (98,725 | ) | (27,157 | ) | (65,681 | ) | |||||
Net Class R Share Activity | 8,971 | 15,645 | (3,549 | ) | (34,140 | ) | |||||||
See Accompanying Notes to Financial Statements.
18
NICHOLAS-APPLEGATE INSTITUTIONAL FUNDS
STATEMENTS OF CHANGES IN NET ASSETS
| International Growth | |||||||
| Year Ended March 31 | 2008 | 2007 | |||||
Increase (Decrease) In Net Assets From Investment Operations: | |||||||
Net investment income | $ | 515,715 | $ | 461,096 | |||
Net realized gain (loss) | 22,032,681 | 19,578,811 | |||||
Net unrealized appreciation (depreciation) | (10,216,944 | ) | (7,320,021 | ) | |||
| Net unrealized appreciation (depreciation) in net assets from investment operations | 12,331,452 | 12,719,886 | |||||
| Distributions to Shareholders: | |||||||
From net investment income | |||||||
Class I | (102,579 | ) | (455,849 | ) | |||
Class II | (264,648 | ) | — | ||||
Class III | — | — | |||||
Class R | (122,626 | ) | — | ||||
From net realized gains | |||||||
Class I | (6,119,767 | ) | (13,553,285 | ) | |||
Class II | (7,384,655 | ) | — | ||||
Class III | — | — | |||||
Class R | (2,036,861 | ) | — | ||||
Total distributions | (16,031,136 | ) | (14,009,134 | ) | |||
From Capital Share Transactions: | |||||||
Proceeds from shares sold | |||||||
Class I | 4,506,739 | 3,016,780 | |||||
Class II | 12,456,347 | 50,000 | |||||
Class III | — | — | |||||
Class IV | — | — | |||||
Class R | 952,934 | 995,312 | |||||
Distributions reinvested | |||||||
Class I | 6,217,911 | 6,370,440 | |||||
Class II | 7,649,303 | 7,369,591 | |||||
Class III | — | — | |||||
Class IV | — | — | |||||
Class R | 2,159,486 | 269,106 | |||||
Cost of shares redeemed | |||||||
Class I | (11,550,042 | ) | (39,097,481 | ) | |||
Class II | (63,923,305 | ) | (11,428,000 | ) | |||
Class III | — | — | |||||
Class IV | — | — | |||||
Class R | (873,729 | ) | (709,385 | ) | |||
Net increase (decrease) in net assets from share transactions | (42,404,356 | ) | (33,163,637 | ) | |||
Net Increase (Decrease) in Net Assets | (46,104,040 | ) | (34,452,885 | ) | |||
Net Assets | |||||||
Beginning | 69,713,490 | 104,166,375 | |||||
Ending | $ | 23,609,450 | $ | 69,713,490 | |||
Undistributed net investment income, ending | $ | 460,556 | $ | 3,363,093 | |||
Shares sold | 318,579 | 134,231 | |||||
Distributions reinvested | 675,126 | 302,921 | |||||
Shares redeemed | (542,226 | ) | (1,787,977 | ) | |||
Net Class I Share Activity | 451,479 | (1,350,825 | ) | ||||
Shares sold | 615,162 | 2,199 | |||||
Distributions reinvested | 911,717 | 350,266 | |||||
Shares redeemed | (2,377,559 | ) | (496,447 | ) | |||
Net Class II Share Activity | (850,680 | ) | (143,982 | ) | |||
Shares sold | — | — | |||||
Distributions reinvested | — | — | |||||
Shares redeemed | — | — | |||||
Net Class III Share Activity | — | — | |||||
Shares sold | — | — | |||||
Distributions reinvested | — | — | |||||
Shares redeemed | — | — | |||||
Net IV Share Activity | — | — | |||||
Shares sold | 48,877 | 45,495 | |||||
Distributions reinvested | 279,726 | 13,108 | |||||
Shares redeemed | (67,553 | ) | (33,088 | ) | |||
Net Class R Share Activity | 261,050 | 25,515 | |||||
See Accompanying Notes to Financial Statements.
19
NICHOLAS-APPLEGATE INSTITUTIONAL FUNDS
NOTES TO FINANCIAL STATEMENTS
NOTE A — ORGANIZATION
Nicholas-Applegate Institutional Funds (the “Trust”) is an open-end investment management company. The Trust was established as a Delaware business trust on December 17, 1992 and consists of thirteen separate portfolios (collectively, the “Funds” and each, a “Fund”). Each Fund’s investment objectives, strategies and risks are discussed in the Funds’ current prospectuses. All of the Funds have issued Class I shares (“Class I”), seven Funds have issued Class II shares (“Class II”), one Fund has issued Class III shares (“Class III”), one Fund has issued Class IV shares (“Class IV”) and three Funds have issued Retirement shares (“Class R”). No shares have a sales charge. Class R has a distribution fee. The Funds offering Class R shares are covered in this report.
NOTE B — SIGNIFICANT ACCOUNTING POLICIES
Significant accounting policies consistently followed by the Funds in preparing these financial statements are described below. The policies conform with accounting principles generally accepted in the United States.
Security Valuations
Equity securities, including ADRs, SDRs and GDRs, that are traded on a stock exchange or on the NASDAQ National Market System are valued at the last sale price as of the close of business on the New York Stock Exchange (normally 4:00 p.m. New York time) on the day the securities are being valued, or lacking any sales, at the mean between the closing bid and asked prices. Securities listed or traded on certain non-U.S. exchanges whose operations are similar to the United States over-the-counter market are valued at the price within the limits of the latest available current bid and asked prices deemed by the Adviser to best reflect fair value. A security that is listed or traded on more than one exchange is valued at the quotation on the exchange determined to be the primary market for such security by the Adviser. The Adviser has determined the Xetra is the primary market in Germany. Equity Linked Notes (“ELN’s) are valued by using the closing local price for the underlying security and are translated into U.S. dollars at the exchange rate struck at the close of the London Stock Exchange.
The Funds value long-term debt obligations, including high quality and high yield corporate securities, municipal securities, asset-backed securities, collateralized mortgage obligations and US Government and Agency issues, at the quoted bid price provided by an approved bond pricing service. Convertible securities are normally priced at the mean between the bids and ask prices. Short-term debt instruments, (e.g., commercial paper, bankers acceptances, U.S. Treasury Bills, etc.) having a maturity of less than 60 days will be valued at amortized cost. If a fixed income security has a maturity of greater than 60 days, it will be valued at market price.
Securities or other assets for which reliable market quotations are not readily available or for which the pricing agent or principal market maker does not provide a valuation or methodology or provides a valuation or methodology that, in the judgment of the Investment Adviser does not represent fair value (Fair Value Securities), are valued by the Pricing Committee overseen by the Board of Trustees in consultation as applicable, with the Investment Adviser’s portfolio managers, traders, and research and credit analysts and legal and compliance personnel. Fair Value Securities may include, but are not limited to, the following: certain private placements and restricted securities that do not have an active trading market; securities whose trading has been suspended or for which there is no current market; securities whose prices are stale; securities denominated in currencies that are restricted, untraded, or for which exchange rates are disrupted; securities affected by significant events; and securities that the Investment Adviser or Pricing Committee believe were priced incorrectly. A “significant event” (which includes, but is not limited to, an extraordinarily political or market event) is an event that the Investment Adviser or Pricing Committee believes with a reasonably high degree of certainty has caused the closing market prices of a Fund’s portfolio securities to no longer reflect their value at the time of the Fund’s NAV calculation.
Security Transactions and Investment Income
Security transactions are accounted for as of trade date. Realized gains and losses from security transactions are determined on an identified-cost basis.
Dividend income is recorded on the ex-dividend date or, for certain non-U.S. securities, when the information becomes available to the Funds. Interest income is recorded on an accrual basis. Discounts and premiums on debt securities are accreted and amortized on the yield to maturity basis.
Non-U.S. Currency Transactions
At each net asset valuation date, the value of assets and liabilities denominated in non-U.S. currencies are translated into U.S. dollars using the current exchange rate at the spot rate at 11:00 a.m. Eastern Time against the U.S. dollar, as provided by an approved pricing service. Security transactions, income and expenses are converted at the prevailing exchange rate on the day of the event. The effect of changes in exchange rates on securities denominated in a non-U.S. currency is included with the net realized and unrealized gain or loss of the associated security. Other Non-U.S. currency gains or losses are reported separately.
Certain Funds may use forward non-U.S. currency contracts to reduce their exposure to currency fluctuations of their non-U.S. securities. These contracts are commitments to purchase or sell a non-U.S. currency at a specified rate on a future date. When the contract is fulfilled or closed, gains or losses are realized. Until then, the gain or loss is included in unrealized appreciation or depreciation of investments. The contract commitment is fully collateralized by cash or securities of the Fund. Non-U.S. denominated assets and forward currency contracts may involve more risks than U.S. transactions, including currency risk, political and economic risk, regulatory and market risk. Evaluating and monitoring such risk exposure is a part of the Funds’ management strategy. There were no such forward non-U.S. currency contracts at March 31, 2008.
20
Futures Contracts
Each Fund may enter into futures contracts involving non-U.S. currency, interest rates, securities, and securities indices, for hedging purposes only. A futures contract obligates the seller of the contract to deliver and the purchaser of the contract to take delivery of the type of non-U.S. currency, financial instrument or security called for in the contract at a specified future time for a specified price. Upon entering into such a contract, a Fund is required to deposit and maintain as collateral such initial margin as required by the exchange on which the contract is traded. Pursuant to the contract, a Fund agrees to receive from or pay to the broker an amount equal to the daily fluctuations in the value of the contract. Such receipts or payments are known as variation margin and are recorded as unrealized gains or losses by the Fund. When the contract is closed, the Fund records a realized gain or loss equal to the difference between the value of the contract at the time it was opened and the value at the time it was closed. There were no such futures contracts at March 31, 2008.
Options Contracts
The Funds may: (a) buy call options on non-U.S. currency in anticipation of an increase in the value of the underlying asset; (b) buy put options on non-U.S. currency, portfolio securities, and futures in anticipation of a decrease in the value of the underlying asset; and (c) write call options on portfolio securities and futures to generate income from premiums, and in anticipation of a decrease or only limited increase in the value of the underlying asset. If a call written by a Fund is exercised, the Fund foregoes any possible profit from an increase in the market price of the underlying asset over the exercise price plus the premium received. When a Fund writes options on futures contracts, it will be subject to margin requirements similar to those applied to futures contracts. There were no such options contracts at March 31, 2008.
Equity-Linked Securities
Certain Funds may purchase equity-linked securities, also known as participation notes, equity swaps, and zero strike calls and warrants. Equity-linked securities are primarily used by a Fund as an alternative means to more efficiently and effectively access the securities market of what is generally an emerging securities market. The Fund deposits an amount of cash with its custodian (or broker, if legally permitted) in an amount near or equal to the selling price of the underlying security in exchange for an equity linked security. Upon sale, the Fund receives cash from the broker or custodian equal to the value of the underlying security. Aside from market risk of the underlying securities, there is a risk of default by the counterparty to the transaction. In the event of insolvency of the counterparty, the Fund might be unable to obtain its expected benefit. In addition, while a Fund will seek to enter into such transactions only with parties which are capable of entering into closing transactions with the Fund, there can be no assurance that the Fund will be able to close out such a transaction with the counterparty or obtain an offsetting position with any counterparty, at any time prior to the end of the term of the underlying agreement. This may impair the Fund’s ability to enter into other transactions at a time when doing so might be advantageous.
Securities Lending
In order to generate expense offset credits, each of the Funds may lend portfolio securities, on a short-term or a long-term basis, up to 30% of a Fund’s total assets. The loans are secured by collateral in the form of cash, cash equivalents, U.S. government and agency securities equal to at least 102% of the market value of securities loaned on U.S. securities and 105% of the market value loaned on non-U.S. securities. During the term of the loan, the Funds will continue to receive any interest, dividends or amounts equivalent thereto, on the loaned securities while receiving a fee from the borrower and/or earning interest on the investment of the cash collateral. Upon termination of the loan, the borrower will return to the lender securities identical to the loaned securities. The Funds may pay reasonable finders’, administration and custodial fees in connection with a loan of its securities and may share the interest earned on the collateral with the borrower.
The Funds bear the risk of delay in recovery of, or even loss of rights in, the securities loaned should the borrower of the securities fail financially. The Funds also bear the risk of loss in the event the securities purchased with cash collateral depreciate in value. Loans are subject to termination at the option of the borrower or the Fund. The market value of securities on loan and the related collateral at March 31, 2008 were:
Fund | Market Value | Collateral | |||||
| U.S. Emerging Growth | $ | 1,294,828 | $ | 1,328,506 | |||
| U.S. Systematic Large Cap Growth | 56,080 | 57,250 | |||||
| International Growth | 668,577 | 690,354 | |||||
Credit Facility
The Trust has a $15 million credit facility available to fund temporary or emergency borrowing expiring in March 2009. Each Fund pays its pro-rata share of an annual commitment fee plus interest on its specific borrowings. For the period ended March 31, 2008, the Funds did not borrow against the line of credit.
Commitments and Contingencies
In the normal course of business, the Funds may enter into contracts and agreements that contain a variety of representations and warranties which provide general indemnifications. The maximum exposure to the Funds under these arrangements is unknown, as this would involve future claims that may be made against the Funds that have not yet occurred. However, based on experience, the Funds expect the risks of loss to be remote.
Fund Expenses and Multi-Class Allocations
Each Fund bears expenses incurred specifically on its behalf plus an allocation of its share of Trust level expenses. Each share offered by a Fund has equal rights to assets but incurs certain Class specific expenses. The Funds allocate income, gains and losses, both realized and unrealized, and expenses, except for Class specific expenses, based on the relative net assets of each share class.
21
NICHOLAS-APPLEGATE INSTITUTIONAL FUNDS
NOTES TO FINANCIAL STATEMENTS — Continued
During the year ended March 31, 2008, many of the brokers with whom the Adviser places trades on behalf of the Funds provided services to the Funds in addition to trade execution. These services included payments of certain expenses on behalf of the Funds. In addition, through arrangements with the Funds’ custodian, credits realized as a result of uninvested cash balances were used to reduce the Funds’ expenses. During the period ended March 31, 2008, the credits used to reduce the Funds’ expenses were:
Fund | Credit Interest Offset | Direct Brokerage Offset | Security Lending Offset | |||||||
| U.S. Emerging Growth | 11,585 | 493 | 45,809 | |||||||
| U.S. Systematic Large Cap Growth | 9,235 | (1,769 | ) | (1,501 | ) | |||||
| International Growth | 21,879 | (8,668 | ) | 108,050 | ||||||
Use of Estimates
The preparation of financial statements in conformity with accounting principles generally accepted in the United States requires management to make estimates and assumptions that affect the amounts reported in the financial statements and accompanying notes. Actual results could differ from these estimates.
NOTE C — FEDERAL INCOME TAXES
The Funds intend to comply with the requirements of the Internal Revenue Code applicable to regulated investment companies and to distribute substantially all of their taxable income to shareholders. Accordingly, no provision for federal income taxes is required.
The Financial Accounting Standards Board (“FASB”) has recently issued Interpretation No. 48, Accounting for Uncertainty in Income Taxes — an Interpretation of FASB Statement No.109 (“FIN 48”), which applies to all registered investment companies and clarifies the accounting for uncertain tax positions. FIN 48 requires the evaluation of tax positions taken, or expected to be taken, in the course of preparing the Funds’ tax returns to determine whether the tax positions are “more-likely-than-not” of being sustained by the applicable tax authority. To the extent that a tax benefit of a position is not deemed to meet the more-likely-than-not threshold, the Funds would report an income tax expense in the statement of operations. Management has reviewed the tax positions for each of the three open tax years as of March 31, 2008 and has determined that the implementation of FIN 48 did not have a material impact on the Funds’ financial statements. Each Fund’s federal tax returns for the prior three fiscal years remains subject to examination by the Internal Revenue Service.
A Fund investing in foreign securities records any foreign taxes on income and gains on such investments in accordance with the applicable tax rules. The Funds’ tax accounting treatment of loss deferrals, accretion, passive foreign investment companies and expiration of capital loss carryforwards are different from the financial statement recognition of income and gains.
Capital loss carryforwards may be used to offset current or future capital gains until expiration.
Distributions to Shareholders
The Funds record distributions to shareholders on the ex-dividend date. Distributions are determined in accordance with income tax regulations that may differ from generally accepted accounting principles. Accordingly, the Funds’ capital accounts are periodically reclassified to reflect income and gains available for distribution under income tax regulations. The Funds make income and capital gain distributions at least annually. Funds with income objectives make distributions either quarterly or monthly in accordance with the prospectuses.
The tax characters of distributions paid during the fiscal year ended March 31, 2008 were as follows:
Distribution paid from: | ||||||||||||||||
Fund | Ordinary Income | Net long term capital gain | Total taxable distributions | Tax return of capital | Total distributions paid(1) | |||||||||||
| U.S. Emerging Growth | — | 745,409 | 745,409 | — | 745,409 | |||||||||||
| U.S. Systematic Large Cap Growth | 16,091 | — | 16,091 | — | 16,091 | |||||||||||
| International Growth | 3,113,776 | 12,917,360 | 16,031,136 | — | 16,031,136 | |||||||||||
The tax characters of distributions paid during the fiscal year ended March 31, 2007 were as follows:
Distribution paid from: | ||||||||||||||||
Fund | Ordinary Income | Net long term capital gain | Total taxable distributions | Tax return of capital | Total distributions paid(1) | |||||||||||
| U.S. Emerging Growth | — | 739,964 | 739,964 | — | 739,964 | |||||||||||
| U.S. Systematic Large Cap Growth | 1,377 | — | 1,377 | — | 1,377 | |||||||||||
| International Growth | 6,638,836 | 7,370,298 | 14,009,134 | — | 14,009,134 | |||||||||||
22
As of March 31, 2008, the components of accumulated earnings/(deficit) on a tax basis were as follows:
Components of accumulated earnings/(deficit): | |||||||||||||||||||
Fund | Undistributed ordinary income | Undistributed long-term capital gains | Accumulated earnings | Accumulated capital and other losses | Unrealized appreciation/ (depreciation) | Total accumulated earning/(deficit) | |||||||||||||
| U.S. Emerging Growth | — | — | — | (4,963,910) | (2) | (475,049) | (3) | (5,438,959 | ) | ||||||||||
| U.S. Systematic Large Cap Growth | — | — | — | (6,739,996) | (2) | 438,206 | (3) | (6,301,790 | ) | ||||||||||
| International Growth | 460,556 | 3,212,580 | 3,673,136 | (12,311,906) | (2) | 1,687,295 | (3) | (6,951,475 | ) | ||||||||||
| (1) | Total distributions paid differ from the Statement of Changes in Net Assets because for the tax purposes dividends are recognized when ctually paid. |
| (2) | The following Funds had net capital loss carryforwards of approximately: |
Fund | Net Capital Loss CarryForward (in 000’s) | Expiration | Post October Losses (in 000’s) |
| U.S. Emerging Growth | 1,030 | March 31, 2011 | 110 |
| 3,824 | March 31, 2010 | ||
| U.S. Systematic Large Cap Growth | 321 | March 31, 2012 | |
| 2,665 | March 31, 2011 | ||
| 3,754 | March 31, 2010 | ||
| International Growth | 10,739 | March 31, 2011 | |
| 1,573 | March 31, 2010 |
To the extent future capital gains are offset by capital loss carryforwards, such gains will not be distributed. The availability of loss carryforwards to any future years may be substantially limited as a result of past or future ownership changes as determined under Internal Revenue Code Section 382.
Net capital losses incurred after October 31, and within the taxable year are deemed to arise on the first business day of the Fund’s next taxable year. For the year ended March 31, 2008, the Fund deferred to April 1, 2008 , post October capital and currency losses.
| (3) | The difference between book-basis and tax-basis unrealized appreciation/(depreciation) is attributable primarily to the tax deferral of losses on wash sales |
NOTE D — TRANSACTIONS WITH AFFILIATES
Investment Advisory Fee
The Adviser receives a monthly fee at an annual rate based on the average daily net assets of the Funds. The investment Advisory Fee rates for each of the Funds are listed in the table below.
Administrative and Shareholder Services Fee
On January 24, 2006, the Funds entered into an Administration Agreement whereby the Funds pay for the administrative services they require under what is essentially an all-in fee structure. Class R shareholders of the Funds pay an administrative fee to the Adviser computed as a percentage of the Funds’ average net assets attributable in the aggregate to Class R shares, The Adviser, in turn, provides or procures administrative and shareholder services for Class R shareholders and also bears the costs of most third-party administrative services required by the Funds, including audit, custodial, portfolio accounting, legal, transfer agency and printing costs. The administrative fees paid to the Adviser may exceed the related costs. Generally, this may not be the case for relatively small funds.
The investment advisory and administrative services fees are charged at the following annual rates:
Fund | Advisory Fee | Administration Fee* Class R |
| U.S. Emerging Growth | 0.75% | 0.41% |
| U.S. Systematic Large Cap Growth | 0.45% | 0.64% |
| International Growth | 0.50% | 0.86% |
| * | Excludes trustees’ fees and expenses, tax, brokerage and interest expenses, and extraordinary expenses. |
23
NICHOLAS-APPLEGATE INSTITUTIONAL FUNDS
NOTES TO FINANCIAL STATEMENTS — Continued
The shareholder servicing fees are charged at the following rates:
Fund | |
| U.S. Emerging Growth | 0.25% |
| U.S. Systematic Large Cap Growth | 0.25% |
| International Growth | 0.25% |
Securities Lending Fees
The U.S. Systematic Large Cap Growth Fund participates in an agency securities lending program with an affiliated agent, Dresdner Bank AG a direct subsidiary to Allianz AG and affiliate to the Trust (“Dresdner Program”). Income generated from the investment of cash collateral, less negotiated rebate fees paid to borrowers and transaction costs, is divided pursuant to the Dresdner Program Agency Agreement between the Funds and Dresdner Bank AG. The amount paid to Dresdner Bank AG for the year ended March 31, 2008 was $13,576. Cash collateral received for securities on loan is invested in securities identified in the Schedules of Investments and the corresponding liability is recognized as such in the Statements of Assets and Liabilities.
Trustee Compensation
Certain officers of the Trust are also officers of the Investment Adviser and the Distributor. During the period ended March 31, 2008, the Trustees who were not affiliated with the Investment Adviser received aggregate annual compensation of $185,546 from the Trust. Effective February 2008, the Trustees who are not affiliated with the Investment Adviser will receive annual compensation of approximately $34,000 each from the Trust, except for the chairman of the Board of Trustees of the Trust and the chairman of the Audit Committee, who will receive annual compensation of approximately $40,000 and $39,000, respectively, from the Trust.
NOTE E — INVESTMENT TRANSACTIONS
The following table presents purchases and sales of securities, excluding short-term investments, during the period ended March 31, 2008, to indicate the volume of transactions in each Fund. The tax cost of securities held at March 31, 2008, and the related gross and net unrealized appreciation and depreciation, provide aggregate information on a tax basis against which future gains and losses on these investments are measured for distribution purposes.
Fund | Purchases (in 000’s) | Sales (in 000’s) | Tax Cost (in 000’s) | Gross Unrealized Appreciation (in 000’s) | Gross Unrealized Depreciation (in 000’s) | Net Unrealized Appreciation (Depreciation) (in 000’s) | |||||||||||||
| U.S. Emerging Growth | $ | 14,995 | $ | 14,399 | $ | 12,140 | $ | 866 | $ | (1,341 | ) | $ | (475 | ) | |||||
| U.S. Systematic Large Cap Growth | 20,086 | 20,064 | 16,823 | 1,921 | (1,483 | ) | 438 | ||||||||||||
| International Growth | 42,177 | 98,590 | 22,504 | 4,004 | (2,324 | ) | 1,680 | ||||||||||||
Gains and losses resulting from the subscriptions-in-kind and redemptions-in-kind are included in the realized gain/loss from securities and non-U.S. currency transactions. During the year ended March 31, 2008, the Funds did not have any subscriptions-in-kind. The International Growth Fund did have a redemption-in-kind valued at $62,922,703 with a realized gain of $14,673,319.
NOTE F — FINANCIAL INSTRUMENTS
The Funds may be party to financial instruments with off-balance sheet risks, including forward non-U.S. currency contracts, primarily in an attempt to minimize the risk to the Fund, in respect of its portfolio transactions. These instruments involve market and/or credit risk in excess of the amount recognized in the Statement of Assets and Liabilities. Risks arise from the possible inability of counterparties to meet the terms of their contracts and from unexpected movement in currencies, securities values and interest rates. The contract amounts indicate the extent of the Funds’ involvement in such contracts. For the year ended March 31, 2008 the Funds were not party to any such agreements.
NOTE G — NEW ACCOUNTING PRONOUNCEMENTS
In September 2006, FASB issued FASB Statement No. 157, “Fair Value Measurement” (“SFAS 157”), which defines fair value, establishes a framework for measuring fair value, and expands disclosures about fair value measurements. SFAS 157 is effective for fiscal years beginning after November 15, 2007, and interim periods within those fiscal years. Management is currently evaluating the impact the adoption of FAS 157 will have on the Trust’s financial statement disclosure.
In March 2008, Statement of Financial Accounting Standards No. 161, Disclosures about Derivative Instruments and Hedging Activities (SFAS 161), was issued and is effective for fiscal years beginning after November 15, 2008. SFAS 161 requires enhanced disclosures to provide information about the reasons the Fund invests in derivative instruments, the accounting treatment and the effect derivatives have on financial performance. Management is currently evaluating the impact the adoption of SFAS 161 will have on the Fund’s financial statement disclosures.
24
NICHOLAS-APPLEGATE INSTITUTIONAL FUNDS
REPORT OF INDEPENDENT REGISTERED PUBLIC ACCOUNTING FIRM
To the Shareholders and Board of Trustees of
Nicholas-Applegate Institutional Funds
In our opinion, the accompanying statements of assets and liabilities, including the schedules of investments, and the related statements of operations and changes in net assets and the financial highlights present fairly, in all material respects, the financial position of each of the portfolios comprising the Nicholas-Applegate Institutional Funds (collectively, the “Funds”) at March 31, 2008, and the results of each of their operations for the year then ended, the changes in each of their net assets for the two years in the period then ended and each of their financial highlights for the five years in the period then ended, in conformity with accounting principles generally accepted in the United States of America. These financial statements and financial highlights (hereafter referred to as “financial statements”) are the responsibility of the Funds’ management; our responsibility is to express an opinion on these financial statements based on our audits. We conducted our audits of these financial statements in accordance the standards of the Public Company Accounting Oversight Board (United States). Those standards require that we plan and perform the audit to obtain reasonable assurance about whether the financial statements are free of material misstatement. An audit includes examining, on a test basis, evidence supporting the amounts and disclosures in the financial statements, assessing the accounting principles used and significant estimates made by management, and evaluating the overall financial statement presentation. We believe that our audits, which included confirmation of securities at March 31, 2008 by correspondence with the custodian and brokers, provide a reasonable basis for our opinion.
PricewaterhouseCoopers LLP
Los Angeles, California
May 27, 2008
25
SHAREHOLDER EXPENSE EXAMPLE — (Unaudited)
As a shareholder of a Fund, you incur two types of costs: (1) transaction costs, including redemption fees, and (2) ongoing costs, including management fees and other Fund expenses. This example is intended to help you understand your ongoing costs (in dollars) of investing in the Funds and to compare these costs with the ongoing costs of investing in other mutual funds.
The example is based on an investment of $1,000 invested at the beginning of the period and held for the entire period (October 1, 2007 to March 31, 2008).
ACTUAL EXPENSES
The first line of the table below for each Fund provides information about actual account values and actual expenses. You may use the information in this line, together with the amount you invested, to estimate the expenses that you paid over the period. Simply divide your account value by $1,000 (for example, an $8,600 account value divided by $1,000 = 8.6), then multiply the result by the number in the first line for a Fund under the heading “Expenses Paid During Period” to estimate the expenses you paid on your account during this period.
HYPOTHETICAL EXAMPLE FOR COMPARISON PURPOSES
The second line of the table below for each Fund provides information about hypothetical account values and hypothetical expenses based on a Fund’s actual expense ratio and an assumed rate of return if 5% per year before expenses, which is not the Fund’s actual return. The hypothetical account values and expenses may not be used to estimate the actual ending account balance or expenses you paid for the period. You may use this information to compare the ongoing costs of investing in a Fund and other funds. To do so, compare this 5% hypothetical example with the 5% hypothetical examples that appear in the shareholder reports of the other funds.
Please note that the expenses shown in the table are meant to highlight your ongoing costs only and do not reflect any transaction costs. Therefore, the second line of the table is useful in comparing ongoing costs only, and will not help you determine the relative total costs of owning different funds. In addition, if these transactional costs were included, your costs would have been higher.
Beginning Account Value October 1, 2007 | Ending Account Value March 31, 2008 | Expenses Paid During the Period* October 1, 2007 to March 31, 2008 | Annualized Expense Ratio | |
U.S. Emerging Growth — Class R | ||||
| Actual | $1,000.00 | $ 801.70 | $6.67 | 1.48% |
| Hypothetical (5% return before expenses) | $1,000.00 | $1,017.60 | $7.47 | 1.48% |
U.S. Systematic Large Cap Growth — Class R | ||||
| Actual | $1,000.00 | $ 855.40 | $6.54 | 1.41% |
| Hypothetical (5% return before expenses) | $1,000.00 | $1,017.95 | $7.11 | 1.41% |
International Growth — Class R | ||||
| Actual | $1,000.00 | $ 912.40 | $7.89 | 1.65% |
| Hypothetical (5% return before expenses) | $1,000.00 | $1,016.75 | $8.32 | 1.65% |
| * | Expenses are equal to the Fund’s annualized expense ratio; multiplied by the average account value over the period. |
26
SUPPLEMENTARY INFORMATION — (Unaudited)
PROXY VOTING — (UNAUDITED)
The Adviser votes proxies on behalf of the Funds pursuant to written policies and procedures adopted by the Funds. To obtain free information on how your Funds’ securities were voted, please call the Funds at 1-800-551-8043 or visit the Funds’ website at www.nacm.com. You may also view how the Fund’s securities were voted by visiting the Securities & Exchange Commission’s website at www.sec.gov. Additionally, information regarding each Fund’s proxy voting record for the most recent twelve month period ended June 30 is also available, free of charge, by calling the Funds at 1-800-551-8043 and from the SEC’s website at http:///www.sec.gov.
ADDITIONAL FEDERAL TAX INFORMATION (UNAUDITED)
The Jobs and Growth Tax Relief Reconciliation Act of 2003 allows a fund to distribute certain dividends paid to its eligible shareholders as qualified dividend income. Of the ordinary income (including short-term capital gain) distributions made by the Funds during the fiscal year ended March 31, 2008 the following percentages represent the amount of qualified income within each Fund:
| U.S. Systematic Large Cap Growth | 100.00 | % | ||
| International Growth | 43.87 |
The amounts which represent income derived from sources within, and taxes paid to non-U.S. countries or possessions of the United States are as follows:
Fund | Foreign Source Income | FTC Total: | |||||
| International Growth | $ | 926,541 | $ | 55,560 | |||
The percentage of ordinary dividends paid by the Funds during the year ended March 31, 2008, which qualify for the Dividends Received Deduction available to corporate shareholders was:
Fund | Percentage: | |||
| U.S. Systematic Large Cap Growth | 100.00 | % | ||
The Funds hereby designate the following approximate amounts as capital gains distributions for the purpose of the Dividends Paid Deduction:
Fund | Amounts: | |||
| U.S. Emerging Growth | $ | 745,409 | ||
| International Growth | 12,917,360 | |||
27
SUPPLEMENTARY INFORMATION — (Unaudited) — Continued
QUARTERLY FILING
The Funds provide a complete list of portfolio holdings four times in each fiscal year, at the end of each calendar quarter. For the second and fourth quarters, the portfolio holdings appear in the Funds’ semiannual and annual reports to shareholders. For the first and third quarters, the Funds file their portfolio holdings with the Securities and Exchange Commission on Form N-Q. Shareholders can look up the Funds’ Form N-Q on the SEC’s website at www.sec.gov. Forms N-Q may also be reviewed and copied at the SEC’s Public Reference Room in Washington, DC. To find out more about this public service, call the SEC at 1-202-942-8090.
TRUSTEE APPROVAL OF INVESTMENT ADVISORY AGREEMENT
Based upon the recommendation of the Contract Committee of the Board of Trustees, a Committee comprised of all of the Independent Trustees of the Trust (“Funds”), the Trustees unanimously approved the continuance of the Investment Advisor y Agreement between the Funds and Nicholas-Applegate Capital Management (“Nicholas-Applegate”) at a meeting held November 14, 2007. In approving the Investment Advisory Agreement, the Board of Trustees, through its Contract Committee, evaluated a comprehensive package of materials, including performance and expense data for other funds with similar asset sizes, investment objectives and policies that had been provided by Lipper Inc. (“Lipper”). Prior to making its recommendation, the Contract Committee reviewed the proposed continuance of the Investment Advisory Agreement with representatives of Nicholas-Applegate and with independent legal counsel to the independent Trustees of the Trust. Members of the Contract Committee also met privately with independent legal counsel to discuss the factors they felt were relevant. The factors included: (1) comparative performance data for each of the Funds and other funds with similar investment objectives/policies and to a relevant index; (2) the nature, extent and quality of investment advisory services rendered by Nicholas-Applegate; (3) marketing and sales efforts dedicated to the Funds; (4) compensation paid to Nicholas-Applegate; (5) costs borne by Nicholas-Applegate; (6) comparative fee and expense data for each of the Funds and other funds with similar investment objectives/policies; (7) Nicholas-Applegate’s policies and practices regarding allocation of portfolio transactions, best price and execution of portfolio transactions, and soft dollar arrangements; (8) fair valuation policy and procedures; (9) expense off-set arrangements; (10) portfolio turnover rates; (11) fall-out benefits, such as research received pursuant to Section 28(e) of the Securities Exchange Act of 1934; (12) fees that Nicholas-Applegate charges its other clients with similar investment objectives/policies; (13) experience and qualifications of each of the members of the portfolio management teams; (14) material changes in personnel managing the Funds; (15) the time dedicated by Nicholas-Applegate’s President and its Chief Investment Officer to the Funds; and (16) Allianz’s commitment to Nicholas-Applegate.
The Contract Committee also considered their confidence in Nicholas-Applegate’s integrity and competence, and Nicholas-Applegate’s responsiveness to questions and issues raised by the Trustees, including its willingness to consider and implement changes designed to improve investment and operational results. In their deliberations, the Contract Committee did not identify any particular information that was controlling, and each member of the Contract Committee attributed different weights to the various factors. The Contract Committee determined that the fees of the Investment Advisory Agreement between each of the Funds and Nicholas-Applegate were fair and reasonable in light of the services performed, expenses incurred and such other matters as the Contract Committee considered relevant in the exercise of their reasonable judgment. The Contract Committee also separately discussed the material factors and conclusions that formed the basis for the Contract Committee to recommend to the Board of Trustees to approve the Investment Advisory Agreement for each of the Funds.
SERVICES PROVIDED BY NICHOLAS-APPLEGATE
The Contract Committee noted that Nicholas-Applegate manages the portfolios of each of the Funds under the direction of the Board of Trustees. Nicholas-Applegate manages each Fund consistent with each Fund’s investment objectives and policies. Nicholas-Applegate provides each Fund with office space and such other services and personnel as are necessary for its operations. The Contract Committee considered the scope and quality of services provided by Nicholas-Applegate under the Investment Advisory Agreement. The Contract Committee considered the quality of the investment research capabilities of Nicholas-Applegate and the other services to be provided to the Funds by Nicholas-Applegate, such as selecting broker-dealers for executing portfolio transactions, serving as the Funds’ administrator, monitoring adherence to the Funds’ investment restrictions, producing shareholder reports, providing support services for the Trustees and Board Committees and overseeing the activities of other service providers, including monitoring compliance with various Fund policies and procedures and with applicable securities laws and regulations. The Contract Committee concluded that the nature, extent and quality of the services provided by Nicholas-Applegate to the Funds were appropriate and consistent with the terms of the Investment Advisory Agreement and that the Funds’ will continue to benefit from services provided under the Investment Advisory Agreement with Nicholas-Applegate.
COST OF SERVICES & FUND EXPENSES
The Contract Committee examined the fee information and expenses for each of the Funds in comparison to information from other comparable funds as provided by Lipper. The Contract Committee agreed that overall the Funds’ management fees and expense ratios were reasonable in relation to the management fees and expense ratios of the Funds’ peer groups selected by Lipper. The Contract Committee also reviewed Nicholas-Applegate’s management
28
SUPPLEMENTARY INFORMATION — (Unaudited) — Continued
fees charged to its institutional separate account clients and for sub-advised funds (funds for which the Nicholas-Applegate provides portfolio management services only). The Committee found that in almost all instances sub-advisory and institutional separate account fees are in line with the Funds’ management fee. The Contract Committee reviewed the profitability analysis for each Fund and discussed the methodology used by Nicholas-Applegate to assess profitability. They noted that only 4 of the Funds were profitable and found the level of profitability was fair and reasonable as compared to similar separate accounts and sub-advised funds managed by Nicholas-Applegate.
The Contract Committee concluded that the management fees and other compensation to be paid by the Funds to Nicholas-Applegate were reasonable in relation to the nature and quality of the services to be provided, taking into account (1) the fees charged by other advisers for managing comparable mutual funds with similar strategies and assets; (2) the fees that Nicholas-Applegate charges to other clients; (3) the estimated overall expense ratio of the Funds, taking into account the Funds’ expense offset arrangements with brokers, custodians and third party services providers. The Committee concluded that compensation paid to Nicholas-Applegate was comparable to the mean or median expense ratios of their peers.
INVESTMENT RESULTS
The Contract Committee considered the investment results of each of the Funds as compared to funds with similar investment objectives and policies as determined by Lipper and with relevant securities indices. In addition to the information received by the Contract Committee for their meeting, Nicholas-Applegate provides detailed performance information for each Fund at each regular meeting of the Board of Trustees. The Contract Committee reviewed information showing absolute and relative performance of each Fund’s Class I shares over 1-year, 3-year, 5-year and 10-year periods as applicable.
U.S. Emerging Growth Fund.
The Contract Committee reviewed information showing performance of the Fund compared to its Lipper peer group and the Russell 2000 Growth Index. The comparative information showed the Fund outperformed its peer group and outperformed the Russell 2000 Growth Index for the 1-year, 5-year and 10-year periods. The Contract Committee concluded that the Fund’s relative performance over time had been very good.
U.S. Systematic Large Cap Growth Fund.
The Contract Committee reviewed information showing performance of the Fund compared to its peer group, the Russell 1000 Index and the Russell 1000 Growth Index. The comparative information showed the Fund outperformed many of its peers over the 1, 5 and 10-year periods. The Fund outperformed the Russell 1000 Index over the 1-year and underperformed for the 10-year period. The Fund outperformed the Russell 1000 Growth Index for the 1-year and 10-year period and underperformed over the 10 year period. Based on their review, the Contract Committee concluded that the Fund’s relative performance over time had been very good.
International Growth Fund.
The Contract Committee reviewed information showing performance of the Fund compared to its Lipper peer group and the MSCI EAFE Index and MSCI EAFE Growth Index. The comparative information showed the Fund had outperformed all its peers in the 1-year period and performed above the peer group median in the 5 and 10-year periods. The Fund outperformed the MSCI EAFE Growth Index in all periods and outperformed the MSCI EAFE Index in the 1 and 10-year periods with slight underperformance over the 5-year period. The Contract Committee considered the changes in the Fund’s portfolio management team and ongoing enhancement to its investment process. Based on their review, the Contract Committee concluded that Fund’s relative investment performance had improved considerably.
INVESTMENT ADVISORY FEE AND OTHER EXPENSES
The Contract Committee considered the investment advisory fee paid by each Fund. The Contract Committee recognized that it is difficult to make comparisons of investment advisory fees because there are variations in the services that are included in the fees paid by other funds. The Contract Committee also considered the fees that Nicholas-Applegate charges other clients with similar investment objectives/policies. Nicholas-Applegate acts as sub-adviser to several open-end and closed-end registered investment companies, non-US investment companies, and investment adviser for separately managed institutional investor accounts. For funds where Nicholas-Applegate acts as sub-adviser, the Investment advisory fee is generally lower. For separately managed accounts where Nicholas-Applegate acts as investment adviser, the investment advisory fee is comparable and in some cases higher. Representatives of Nicholas-Applegate reviewed with the Contract Committee the significant differences in the scope of services provided and financial commitments and risks involved in managing the various types of accounts. The Contract Committee also considered the total expense ratio for each Fund in comparison to their respective peers.
US Emerging Growth Fund.
The Lipper peer group consisted of 10 funds with average net assets ranging between $10 million and $100 million with the Fund having the smallest asset size. The Lipper peer group fee and expense data showed that the Fund’s total expenses were the lowest of all funds in the peer group. The Contract Committee concluded that the Fund’s expense ratio was acceptable in light of quality of services and other factors considered.
US Systematic Large Cap Growth Fund.
The Lipper peer group consisted of 12 funds with average net assets ranging between $3 million and $100 million compared to $15 million for the Fund. The Lipper peer group fee and expense data showed that the Fund’s total expenses were
29
SUPPLEMENTARY INFORMATION — (Unaudited) — Continued
higher than the peer median. The Contract Committee considered the size of the Fund relative to its peers and concluded that the Fund’s expense ratio was acceptable in light of the quality of services and other factors considered.
International Growth Fund.
The Lipper peer group consisted of 16 funds with average net assets ranging between $25 million and $390 million compared to $94 million for the Fund. The Lipper peer group fee and expense data showed that the Fund’s total expenses were slightly below the median and lower than peers with significantly larger average net assets. The Contract Committee concluded that the Fund’s expense ratio was acceptable in light of the quality of services offered and other factors considered.
ECONOMIES OF SCALE
The Contract Committee noted that the investment advisory fee schedules for the Funds do not contain breakpoints that reduce the fee rate on assets above specified levels. However, the Contract Committee did note that overall fees paid to Nicholas-Applegate (investment advisory, administration, and shareholder service) contain the functional equivalent of breakpoints through the offering of four to five different share classes that reduce the fees paid to Nicholas-Applegate based on the asset level of the account. The Contract Committee recognized that the existing fee structure is consistent with the institutional nature of the Funds and of Nicholas-Applegate’s business, which caters to large institutional investors (e.g., pension plans, endowments and public funds). Having taken these factors into consideration, the Contract Committee concluded that the Funds’ current multiple share class fee structure establishes a reasonable basis for realizing economies of scale for the Funds which may exist when assets increase. At current asset levels, the Contract Committee also noted that the most of the Funds have not realized optimal economies of scale in respect to other expenses.
30
SUPPLEMENTARY INFORMATION — (Unaudited) — Continued
CORPORATE GOVERNANCE
Name, Address (1) Age Position(s) Held with Fund Length of Time Served (2) | Principal Occupation(s) during Past 5 Years Other Directorship Held by Trustee Number of Portfolios in Fund complex Overseen by Trustee | |
Independent Trustees: | ||
Darlene T. DeRemer 11/27/1955 Chairperson of the Board Since August 2007 & Trustee Since May 1999 | Principal Occupations: Partner, Grail Partners LLC (since 2005); Managing Director, Putnam Lovell NBF Private Equity (since 2004-2005); Managing Director, NewRiver E-Business Advisory Services Division (2000-2003); Prior to, President and Founder, DeRemer Associates, a strategic and marketing consulting firm for the financial services industry (since 1987); Vice President and Director, Asset Management Division, State Street Bank and Trust Company, now referred to as State Street Global Advisers (1982-1987); Vice President, T. Rowe Price & Associates (1979-1982); Member, Boston Club (since 1998); Member, Financial Women’s Association Advisory Board (since 1995); Founder, Mutual Fund Cafe Website. Other Directorships Held: Founding Member and Director, National Defined Contribution Council (since 1997); Trustee, Boston Alzheimer’s Association (since 1998); Director, King’s Wood Montessori School (since 1995); Editorial Board, National Association of Variable Annuities (since 1997); Director, Nicholas-Applegate Strategic Opportunities, Ltd. (1994-1997); Trustee, Nicholas-Applegate Mutual Funds (1994-1999); Director, Jurika & Voyles Fund Group (since 1994-2000); Trustee, Bramwell Funds (2003-2005); Director, Independent Director Council (since 2004); Mutual Fund Director’s Council-Advisory Board; Board Member-Chatman Partners; Board Member X-Shares LLC. Number of Portfolios Overseen by Trustee: 13 | |
John J. Murphy 4/8/1944 Trustee Since September 2005 | Principal Occupations: Founder and senior principal, Murphy Capital Management. Other Directorships Held: Director, Smith Barney Multiple Discipline Trust; Director, Barclays International Funds Group Ltd. and affiliated companies; Smith Barney Consulting Group; Legg Mason Equity Funds. Number of Portfolios Overseen by Trustee: 13 | |
Bradford K. Gallagher 2/24/1944 Trustee Since August 2007 | Principal Occupations: Founder, Spyglass Investments LLC (a private investment vehicle) (since 2001); Founder, President and CEO of CypressTree Investment Management Company and Annuity Company; Managing Director, Fidelity Investments. Other Directorships Held: Trustee, The Common Fund (since 2005); Director, Anchor Point Inc. (since 1995); Chairman and Trustee, Atlantic Maritime Heritage Foundation (since 2007); Director, Shielding Technology Inc. (since 2006); Director, United Way of Eastern Massachusetts (1988-1990); Director, Ouimet Scholarship Fund (1993-2005); Director, Emerson Hospital (1995-2005). Number of Portfolios Overseen by Trustee: 13 | |
Steven Grenadier 12/14/1964 Trustee Since August 2007 | Principal Occupations: William F. Sharpe Professor of Financial Economics, Stanford University Graduate School of Business; Research Associate, National Bureau of Economic Research (since 2002); Chairman of the Finance Department, Stanford University Graduate School of Business (2004-2006). Other Directorships Held: Independent Trustee, E Trade Funds. Number of Portfolios Overseen by Trustee: 13 | |
Interested Trustees: | ||
Horacio A. Valeiras 1/8/1959 President & Trustee Since August 2004 | Principal Occupations: Managing Director (since 2004) and Chief Investment Officer, Nicholas-Applegate Capital Management, Nicholas-Applegate Securities (since 2002); Managing Director of Morgan Stanley Investment Management, London (1997-2002); Head of International Equity and Asset Allocation, Miller Anderson & Sherred; Director and Chief of Investment Strategies, Credit Suisse First Boston. Other Directorships Held: Trustee, The Bishops School (since 2002); Trustee, San Diego Rowing Club (since 2002). Number of Portfolios Overseen by Trustee: 13 | |
Arthur B. Laffer 8/14/1940 Trustee Since August 2007 | Principal Occupations: Chairman, Laffer Associates (economic consulting) (since 1979); Chairman, Laffer Advisors Inc. (registered broker-dealer) (since 1981); Chairman, Laffer Investments (asset management) (since 2000); Member, Congressional Policy Advisory Board (since 1998); Distinguished University Professor and Director, Pepperdine University (1985-1988); Professor of Business Economics, University of Southern California (1976-1984); Associate Professor of Business Economics, University of Chicago (1967-1976). Other Directorships Held: Director of MPS Group, Inc. (NYSE:MPS) (since 2003); Director, Petco Animal Supplies, Inc. (NASDAQ:PETC) (2002-2005); Director, Oxigene Inc. (NASDAQ:OXGN), biopharmaceutical company (since 1998); Director of Provide Commerce (NASDAQ: PRVD) (since 1998); Director, Veolia Environmental Corporation (successor to U.S. Filter Corporation) (water purification) (1991-2006); Director, Nicholas-Applegate Fund, Inc. (1987-2007). Number of Portfolios Overseen by Trustee: 13 |
31
SUPPLEMENTARY INFORMATION — (Unaudited) — Continued
CORPORATE GOVERNANCE
Name, Address (1) Age Position(s) Held with Fund Length of Time Served (2) | Principal Occupation(s) during Past 5 Years Other Directorship Held by Trustee Number of Portfolios in Fund complex Overseen by Trustee | |
Officers: | ||
Charles H. Field, Jr. 7/24/1955 Secretary and Chief Compliance Officer Since May 2002 | Principal Occupations: Managing Director and General Counsel, Nicholas-Applegate Capital Management, Nicholas- Applegate Securities, Nicholas-Applegate Holdings LLC (since February 2004); Deputy General Counsel, Nicholas- Applegate Capital Management (1996-2004). Other Directorships Held: NA Number of Portfolios Overseen by Officer: 13 | |
Deborah A. Wussow 1/31/1960 Treasurer and Assistant Secretary Since August 2006 | Principal Occupations: Senior Vice President and Chief Compliance Officer, Nicholas-Applegate Capital Management (since 2008), and previously Vice President and Director, Legal and Compliance, Nicholas-Applegate Capital Management (since 2005-2007) and Manager, Legal and Compliance, Nicholas-Applegate Capital Management (1995-2004). Other Directorships Held: NA Number of Portfolios Overseen by Officer: 13 |
| (1) | Unless otherwise noted, the address of the Trustees and Officers is c/o: Nicholas-Applegate Capital Management, 600 West Broadway, 32nd Floor, San Diego, California 92101. |
| (2) | Each Trustee serves for an indefinite term, until her or his successor is elected. |
32
TRUSTEES OF NICHOLAS - APPLEGATE INSTITUTIONAL FUNDS
Darlene T. DeRemer, Chairperson
Horacio A. Valeiras
John J. Murphy
Bradford K. Gallagher
Steven Grenadier
Arthur B. Laffer
OFFICERS
Horacio A. Valeiras, President
Charles H. Field, Jr., Secretary & Chief Compliance Officer
Deborah A. Wussow, Treasurer & Assistant Secretary
INVESTMENT ADVISER
Nicholas-Applegate Capital Management
DISTRIBUTOR
Nicholas-Applegate Securities
CUSTODIAN
Brown Brothers Harriman & Co., Private Bankers
TRANSFER AGENT
UMB Fund Services Group, Inc.
INDEPENDENT REGISTERED PUBLIC ACCOUNTING FIRM
PricewaterhouseCoopers LLP
AR0308RET
600 West Broadway San Diego, California 92101 800.551.8043 | |
ITEM 2. CODE OF ETHICS.
| (a) | The registrant has adopted a code of ethics that applies to the registrant’s principal executive officer, principal financial officer, principal accounting officer or controller or persons performing similar functions. |
| (b) | The registrant has adopted a code of ethics that is reasonably designed to deter wrongdoing and to promote: |
| (1) | Honest and ethical conduct, including the ethical handling of actual or apparent conflicts of interest between personal and professional relationships; |
| (2) | Full, fair, accurate, timely, and understandable disclosure in reports and documents that a registrant files with, or submits to, the Commission and in other public communications made by the registrant; |
| (3) | Compliance with applicable governmental laws, rules, and regulations; |
| (4) | The prompt internal reporting of violations of the code to an appropriate person or persons identified in the code; and |
| (5) | Accountability for adherence to the code. |
| (c) | There have been no amendments, during the period covered by this Form N-CSR, to a provision of the code of ethics that applies to the registrant’s principal executive officer, principal financial officer, principal accounting officer or controller, or persons performing similar functions, regardless of whether these individuals are employed by the registrant or a third party, and that relates to any element of the code of ethics description in Item 2(b) of this Form N-CSR. |
| (d) | The registrant has not, during the period covered by this Form N-CSR, granted any waivers, including an implicit waiver, from a provision of the code of ethics that applies to the registrant’s principal executive officer, principal financial officer, principal accounting officer or controller, or persons performing similar functions, regardless of whether these individuals are employed by the registrant or a third party that relates to one or more of the items set forth in Item 2(b) of this Form N-CSR. |
| (e) | Not applicable. |
| (f) | (1) A copy of the code of ethics referenced in Item 2(a) of this Form N-CSR is filed as Exhibit 12(a)(1) to this Form N-CSR. |
ITEM 3. AUDIT COMMITTEE FINANCIAL EXPERT.
| (a) | (1) The registrant’s Board of Trustees has determined that the registrant has at least one audit committee financial expert serving on its audit committee. |
(2) The following Independent Trustees have been designated as audit committee financial experts by the Board of Trustees: Darlene T. DeRemer and John J. Murphy. Ms. DeRemer and Mr. Murphy are “independent” as defined in Item 3(a)(2) of Form N-CSR.
ITEM 4. PRINCIPAL ACCOUNTANT FEES AND SERVICES.
| (a) | AUDIT FEES |
The aggregate fees billed for each of the last two fiscal years for professional services rendered by the principal accountant for the audit of the registrant’s annual financial statements or services that are normally provided by the accountant in connection with statutory and regulatory filings or engagements for those fiscal years are $267,000 for 2008 and $290,145 for 2007.
| (b) | AUDIT-RELATED FEES |
Not applicable.
| (c) | TAX FEES |
The aggregate fees billed in each of the last two fiscal years for professional services rendered by the principal accountant for tax compliance, tax advice and tax planning are $87,250 for 2008 and $137,500 for 2007. These services consisted of (i) review or preparation of U.S. federal, state, local and excise tax returns; (ii) U.S. federal, state, local and Mauritius entity tax planning, advice and assistance regarding statutory, regulatory or administrative developments, and (iii) tax advice regarding tax qualification.
| (d) | ALL OTHER FEES |
Not applicable.
| (e) | (1) The registrant has adopted pre-approval policies and procedures consistent with Rule 2-01(c)(7) of services: consultations on GAAP and/or financial statement disclosure matters not exceeding $25,000/year; consultations on tax accounting matters not exceeding $25,000/year; review of annual excise distribution provisions not exceeding $15,000/year; and various regulatory and tax filings in foreign jurisdictions (such as India, Taiwan and Venezuela) not exceeding $25,000/year. The policies and procedures require quarterly reporting to the Audit Committee of all such services performed and related fees billed pursuant to the policies and procedures. |
(2) The percentage of services described in each of paragraphs (b) through (d) of this Item that were approved by the Audit Committee pursuant to paragraph (c)(7)(i)(c) of Rule 2-01 of Regulation S-X are as follows:
(b) Not applicable.
(c) 100%
(d) Not applicable.
| (f) | Not applicable. |
| (g) | The aggregate non-audit fees billed by the registrant's accountant for services rendered to the registrant, and rendered to the registrant's investment adviser (not including any sub-adviser whose role is primarily portfolio management and is subcontracted with or overseen by another investment adviser), and any entity controlling, controlled by, or under common control with the investment adviser that provides ongoing services to the registrant for each of the last two fiscal years of the registrant are $2,994,218 for 2008 and $2,388,500 for 2007. |
| (h) | The registrant’s Audit Committee has considered whether the provision of non-audit services that were rendered to the registrant’s investment adviser (not including any subadviser whose role is primarily portfolio management and is subcontracted with or overseen by another investment adviser), and any entity controlling, controlled by, or under common control with the investment adviser that provides ongoing services to the registrant that were not pre-approved pursuant to paragraph (c)(7)(ii) of Rule 2-01 of Regulation S-X is compatible with maintaining the principal accountant’s independence. |
ITEM 5. AUDIT COMMITTEE OF LISTED REGISTRANTS.
Not applicable.
ITEM 6. INVESTMENTS.
This schedule is included as part of the report to shareholders filed under Item 1 of this Form N-CSR.
ITEM 7. DISCLOSURE OF PROXY VOTING POLICIES AND PROCEDURES FOR CLOSED-END
MANAGEMENT INVESTMENT COMPANIES.
Not applicable.
ITEM 8. PORTFOLIO MANAGERS OF CLOSED-END MANAGEMENT INVESTMENT COMPANIES.
Not applicable.
ITEM 9. PURCHASES OF EQUITY SECURITIES BY CLOSED-END MANAGEMENT INVESTMENT COMPANY AND AFFILIATED PURCHASERS.
Not applicable.
ITEM 10. SUBMISSION OF MATTERS TO A VOTE OF SECURITY HOLDERS.
There have been no material changes to the procedures by which the shareholders may recommend nominees to the registrant’s board of trustees, where those changes were implemented after the registrant last provided disclosure in response to the requirements of Item 407(c)(2)(iv) of Regulation S-K (as required by Item 22(b)(15) of Schedule 14A), or this Item.
ITEM 11. CONTROLS AND PROCEDURES.
(a) The registrant’s principal executive and financial officers have concluded that the registrant's disclosure controls and procedures (as defined in Rule 30a-3(c) under the Investment Company Act of 1940, as amended (the “1940 Act”) are effective, as of a date within 90 days of the filing date of this Form N-CSR, based on their evaluation of these controls and procedures required by Rule 30a-3(b) under the 1940 Act and Rules 13a-15(b) or 15d-15(b) under the Securities Exchange Act of 1934, as amended, (the “Exchange Act”).
(b) There were no changes in the registrant's internal control over financial reporting (as defined in Rule 30a-3(d) under the 1940 Act) that occurred during the registrant's last fiscal half-year that have materially affected, or are reasonably likely to materially affect, the registrant's internal control over financial reporting.
ITEM 12. EXHIBITS.
(a)(1) The registrant’s code of ethics that is the subject of the disclosure required by Item 2 of this Form N-CSR is filed as Exhibit 12(a)(1) to this Form N-CSR.
(a)(2) A separate certification for each principal executive officer and principal financial officer of the registrant as required by Rule 30a-2(a) under the 1940 Act is filed as Exhibit 12(a)(2) to this Form N-CSR.
(a)(3) Not applicable.
(b) The certifications required by Rule 30a-2(b) under the 1940 Act, Rule 13a-14(b) or Rule 15d-14(b) under the Exchange Act, and Section 1350 of Chapter 63 of Title 18 of the United States Code are furnished as Exhibit 12(b) to this Form N-CSR.
SIGNATURES
Pursuant to the requirements of the Securities Exchange Act of 1934 and the Investment Company Act of 1940, the registrant has duly caused this report to be signed on its behalf by the undersigned, thereunto duly authorized.
(Registrant)
Nicholas-Applegate Institutional Funds
By (Signature and Title)
/s/ Horacio A. Valeiras
Horacio A. Valeiras
Title: President (Principal Executive Officer) and Trustee
Date: June 9, 2008
Pursuant to the requirements of the Securities Exchange Act of 1934 and the Investment Company Act of 1940, this report has been signed below by the following persons on behalf of the registrant and in the capacities and on the dates indicated.
By (Signature and Title)
/s/ Horacio A. Valeiras
Horacio A. Valeiras
Title: President (Principal Executive Officer) and Trustee
Date: June 9, 2008
By (Signature and Title)
/s/ Deborah A. Wussow
Deborah A. Wussow
Title: Treasurer (Principal Financial Officer and Principal Accounting Officer)
Date: June 9, 2008