UNITED STATES
SECURITIES AND EXCHANGE COMMISSION
WASHINGTON, D.C. 20549
FORM N-CSR
CERTIFIED SHAREHOLDER REPORT OF REGISTERED
MANAGEMENT INVESTMENT COMPANIES
Investment Company Act file number: 811-07384
U.S. Ultra Micro Cap Fund
U.S. Micro Cap Fund
U.S. Emerging Growth Fund
U.S. Small to Mid Cap Growth Fund
U.S. Convertible Fund
International Growth Opportunities Fund
U.S. High Yield Bond Fund
Each a Series of
NICHOLAS-APPLEGATE INSTITUTIONAL FUNDS
(Exact name of registrant as specified in charter)
600 WEST BROADWAY, 30th FLOOR, SAN DIEGO, CA 92101
(Address of principal executive offices) (Zip Code)
Charles H. Field, Jr.
c/o Nicholas-Applegate Capital Management, LLC
600 West Broadway, 30th Floor
San Diego, CA 92101
(Name and address of agent for service)
Copy to:
Deborah A. Wussow-Hammalian
c/o Nicholas-Applegate Capital Management, LLC
600 West Broadway, 30th Floor
San Diego, CA 92101
Registrant's telephone number, including area code: (619) 687-2988
Date of fiscal year end: November 30
Date of reporting period: November 30, 2009
Item 1. Reports to Stockholders.
November 30, 2009 Annual Report
Class I, II, III & IV Shares
U.S. Ultra Micro Cap
U.S. Micro Cap
U.S. Emerging Growth
U.S. Small to Mid Cap Growth
U.S. Convertible
International Growth Opportunities
U.S. High Yield Bond

Letter to Shareholders
Dear Fellow Shareholder,
Stock markets around the world delivered impressive gains during the eight months ended November 30, 2009. In contrast to the panic coursing through the markets a year ago, the period was characterized by rising confidence in the global economy.
In this report, we review the performance of the financial markets and our mutual funds from April 1, 2009 through November 30, 2009. We also highlight some of the key factors that drove investment returns and share our outlook for the future.
In the United States, the S&P 500 Index gained 39.4% in response to encouraging economic and earnings reports. While GDP fell at a 0.7% annual rate in the second quarter, this was a big improvement over the 6.4% first-quarter drop. The news got progressively better, with GDP rising 2.2% in the third quarter, boosted by government stimulus dollars. Throughout the period, the Federal Reserve held interest rates at 0.0% to 0.25% and used its balance sheet to provide extra liquidity to the financial system. The credit markets opened up, and corporate bond issuance for 2009 surpassed $1 trillion in October — the fastest pace on record. Corporate earnings remained under pressure, with S&P 500 companies posting their ninth consecutive quarter of profit declines. That said, earnings exceeded consensus estimates, aided by cost-cutting initiatives.
Stock markets outside the United States also performed well, lifted by mounting evidence that the global recession was ending. In local currencies, the MSCI EAFE Index, a barometer of developed non-U.S. markets, rose 32.0%, and the MSCI Emerging Markets Index rose 49.9%. The gains were even greater in U.S. dollar terms, with the MSCI EAFE and MSCI Emerging Markets indexes advancing 51.6% and 70.5%, respectively. The dollar declined against most foreign currencies, largely due to expectations that the Fed would keep interest rates low for longer than other central banks.
Central banks in a handful of countries, including Australia, did raise interest rates towards the end of the period. Australia’s mineral exports helped keep its economy out of recession amid a 31% jump in the Reuters/Jefferies CRB Index of nineteen commodities since March 1. With their economies just returning to growth, euro-zone and Japanese central bankers held rates steady, although the European Central Bank scaled back one of its stimulus programs. Japanese GDP grew at an annual pace of 2.3% in the second quarter and 1.3% in the third quarter. The euro region emerged from recession in the third quarter, with GDP rising 1.5% on an annual basis. The United Kingdom was a notable laggard, where the Bank of England kept interest rates at a record low of 0.5% and expanded its quantitative easing policy. The U.K. economy contracted in the third quarter — the sixth straight decline — but more recent data hinted at recovery.
The relatively strong performance of developing economies, combined with investors’ rising risk appetites, drove the extraordinary gains in emerging market equities. Stocks in the BRIC nations of Brazil, Russia, India and China turned in some of the best results in local currencies. Brazil and Russia, which have large energy industries, benefited from a 56% increase in oil prices during the period. In India and China — economies that had slowed but not entered recession — growth rebounded as government stimulus measures boosted domestic demand.
The improvement in the global economy created a powerful tailwind for the Nicholas-Applegate Institutional Funds, all of which posted substantial gains. In addition, the majority of our equity funds outperformed their benchmark indexes in the rapidly rising market. The U.S. Convertible Fund and the High Yield Bond Fund trailed their benchmarks, mainly because they had less exposure to distressed issuers, which generally outperformed higher-quality names. However, our focus on company fundamentals has been rewarded in the past, and both funds have outperformed over longer time periods.
Looking ahead, we expect the U.S. economic recovery to be subdued relative to past recoveries, and real growth in other developed countries to also remain subpar. The Fed has stated its intentions to keep interest rates low for “an extended period,” but we believe short-term rates will start to rise next year as inflation returns to the U.S. economy. Foreign central banks have already embarked on post-crisis monetary tightening, and we expect this trend to continue. Against a backdrop of low growth and rising rates, we think that individual security selection will be especially important. This makes us confident in our outlook for the funds, given our bottom-up investment approach and commitment to in-depth fundamental research.
On behalf of everyone at the firm, thank you for your participation in the Nicholas-Applegate Institutional Funds. We appreciate the trust you have placed in us.
Best Regards,

Horacio A. Valeiras, CFA
President and Chief Investment Officer
November 30, 2009
Table of Contents
| The Funds’ Review and Outlook, Performance and Schedules of Investments: | |
| U.S. Ultra Micro Cap | 1 |
| U.S. Micro Cap | 5 |
| U.S. Emerging Growth | 10 |
| U.S. Small to Mid Cap Growth | 15 |
| U.S. Convertible | 20 |
| International Growth Opportunities | 25 |
| U.S. High Yield Bond | 29 |
| The Funds’: | |
| Financial Highlights | 36 |
| Statements of Assets and Liabilities | 45 |
| Statements of Operations | 46 |
| Statements of Changes in Net Assets | 48 |
| Notes to Financial Statements | 51 |
| Report of Independent Registered Public Accounting Firm | 62 |
| Shareholder Expense Example | 63 |
| Supplementary Information | 65 |
This report is authorized for distribution to shareholders and to others only when preceded or accompanied by a currently effective prospectus for Nicholas-Applegate Institutional Funds Class I, II, III & IV Shares. Distributor: Nicholas-Applegate Securities.
U.S. Ultra Micro Cap Fund
Management Team: John C. McCraw, Portfolio Manager; Robert S. Marren, Portfolio Manager
Chief Investment Officer: Horacio A. Valeiras, CFA
Goal: The U.S. Ultra Micro Cap Fund seeks to maximize long-term capital appreciation by investing primarily in U.S. companies with market capitalizations below the weighted average of the Russell Microcap Growth Index at time of purchase.
Market Overview: U.S. equities posted significant gains during the eight months ended November 30, 2009. The rally — one of the steepest in Wall Street history — lifted stock prices higher across all major styles and capitalization segments of the market.
During the period, the Federal Reserve held short-term interest rates steady, after having lowered them to near zero at the height of the credit crisis. The central bank also pumped massive amounts of liquidity into the financial system by making loans and asset purchases. On the fiscal front, some of the $787 billion stimulus package worked its way into the economy via tax credits, the “cash for clunkers” auto trade-in program and other spending initiatives.
The government’s aggressive policies helped thaw the credit markets and jump-start the economy. Following a 6.4% annual drop in the first quarter of 2009, GDP fell just 0.7% in the second quarter and rose 2.8% in the third quarter. Moreover, existing homes sales spiked to their highest level since early 2007, a key home-price index advanced for five straight months and manufacturing activity hit a three and a-half year high. That said, several indicators suggested that the recovery would be gradual, including the unemployment rate which reached 10.2% in October 2009.
In addition to improvement in the economy, better-than-expected corporate profits — albeit off low expectations — also boosted investor sentiment. As November 2009 drew to a close, small-cap companies that had reported third quarter earnings were beating estimates by about 4%, on average, and mid caps were ahead by about 9%.
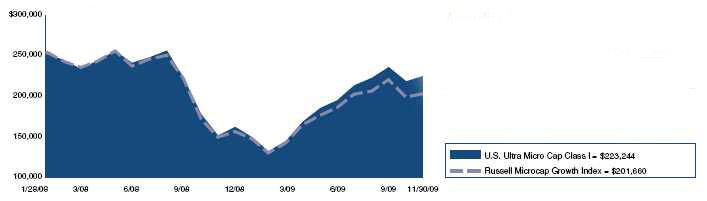
Performance: During the eight months ended November 30, 2009, the Fund’s Class I shares gained 54.50%, outperforming the Russell Microcap Growth Index, which rose 44.33%.
Portfolio Specifics: Consistent with our bottom-up investment process, the Fund’s outperformance was due to stock selection. Stock selection added the most value in the materials sector, where paper manufacturer Boise was a top contributor. The market rewarded Boise for its attractive valuation, newly restructured balance sheet and significant cash flow generation. Stock selection was also especially strong in the information technology, energy and consumer discretionary sectors. Three of our best-performing names were Xyratex, a supplier of data storage solutions that saw a pickup in demand; Gulfport Energy, an oil and gas producer recognized for the potential of its Canadian oil sands assets; and Perry Ellis International, an apparel wholesaler/retailer that is benefiting from a cost reduction program implemented in 2008.
The main source of relative weakness in the Fund was stock selection in the health care sector. One of our worst-performing holdings was a pharmaceutical firm whose lead drug candidate met with delays in receiving approval from U.S. health regulators. Stock selection in the financials and telecommunication services sectors also detracted.
Market Outlook: The economy continues to face meaningful headwinds, including the weak job market and tepid bank lending. However, several positive factors could drive additional equity market gains in the coming months. For example, the Fed has resolved to keep interest rates low for an extended period of time, and corporate earnings are expected to show strong growth in 2010. Additionally, companies have large amounts of cash on their balance sheets, which could fuel an increase in merger and acquisition activity.
We believe the Fund is well-positioned for this dynamic market environment given the long-term growth prospects of our portfolio companies.
| Comparison of Change in Value of a $250,000 Investment in U.S. Ultra Micro Cap Fund Class I Shares with the Russell Microcap Growth Index. |
Annualized Total Returns As of 11/30/09 | ||
| 1 Year | Since Inception | |
| U.S. Ultra Micro Cap Class I | 47.85% | –5.96% |
| Russell Microcap Growth Index | 35.44% | –11.03% |
The graph above shows the value of a hypothetical $250,000 investment in the Fund’s Class I shares with the Russell Microcap Growth Index for the periods indicated. Average annual total return figures include changes in principal value, reinvested dividends, and capital gain distributions. The Class I shares commenced operations on January 28, 2008 . The total returns shown above do not show the effects of income taxes on an individuals’ investment. In most cases, taxes may reduce your actual investment returns on income or gains paid by the Fund or any gains you may realize if you sell your shares. Past performance cannot guarantee future results.
1
U.S. Ultra Micro Cap Fund
The Russell Microcap Index measures performance of the microcap segment, representing less than 3% of the U.S. equity market. The Russell Microcap Index includes the smallest 1,000 securities in the small-cap Russell 2000 Index plus the next 1,000 securities. The Russell Microcap Growth Index isolates the securities in the Russell Microcap Index with purely growth characteristics. Unless otherwise noted, index returns reflect the reinvestment of income dividends and capital gains, if any, but do not reflect fees, brokerage commissions or other expenses of investing. Investors may not make direct investments into any index. Since markets can go down as well as up, investment return and principal value will fluctuate with market conditions. You may have a gain or loss when you sell shares. Further information relating to fund performance, including expense reimbursements, if applicable, is contained in the Financial Highlights section of the prospectus and elsewhere in this report.
2
U.S. Ultra Micro Cap Fund
Schedule of Investments
As of November 30, 2009
| Number of | ||||||||
| Shares | Value | |||||||
| Common Stock - 96.2% | ||||||||
| Airlines - 0.7% | ||||||||
| ExpressJet Holdings, Inc. Cl. A* | 3,600 | $ | 13,284 | |||||
| Applications Software - 2.8% | ||||||||
| China TransInfo Technology Corp.* | 2,900 | 21,518 | ||||||
| Evolving Systems, Inc.* | 2,400 | 13,944 | ||||||
| inContact, Inc.* | 5,950 | 13,745 | ||||||
| 49,207 | ||||||||
| Auto/Truck Parts & Equipment-Original - 1.2% | ||||||||
| Wonder Auto Technology, Inc.* | 1,800 | 21,456 | ||||||
| Batteries/Battery Systems - 0.8% | ||||||||
| China Ritar Power Corp.* | 3,100 | 14,074 | ||||||
| Chemicals-Specialty - 5.6% | ||||||||
| ICO, Inc.* | 5,600 | 23,688 | ||||||
| KMG Chemicals, Inc. | 2,000 | 35,600 | ||||||
| Omnova Solutions, Inc.* | 3,300 | 21,846 | ||||||
| Penford Corp.* | 2,300 | 19,136 | ||||||
| 100,270 | ||||||||
| Commercial Services - 0.9% | ||||||||
| StarTek, Inc.* | 2,400 | 16,632 | ||||||
| Communications Software - 1.4% | ||||||||
| Incredimail, Ltd. | 2,800 | 24,780 | ||||||
| Computer Services - 1.8% | ||||||||
| COMSYS IT Partners, Inc.* | 1,800 | 14,994 | ||||||
| Virtusa Corp.* | 1,900 | 16,663 | ||||||
| 31,657 | ||||||||
| Computers-Integrated Systems - 1.1% | ||||||||
| Radiant Systems, Inc.* | 2,080 | 20,155 | ||||||
| Computers-Memory Devices - 3.1% | ||||||||
| Dot Hill Systems Corp.* | 10,900 | 20,383 | ||||||
| Xyratex, Ltd.* | 3,100 | 34,937 | ||||||
| 55,320 | ||||||||
| Computers-Peripheral Equipment - 0.9% | ||||||||
| iGO, Inc.* | 12,500 | 15,375 | ||||||
| Consumer Products-Miscellaneous - 1.0% | ||||||||
| Summer Infant, Inc.* | 4,100 | 17,917 | ||||||
| Direct Marketing - 1.0% | ||||||||
| APAC Customer Services, Inc.* | 3,500 | 18,305 | ||||||
| Disposable Medical Products - 1.1% | ||||||||
| Medical Action Industries, Inc.* | 1,500 | 19,140 | ||||||
| Distribution/Wholesale - 1.0% | ||||||||
| Navarre Corp.* | 8,700 | 18,531 | ||||||
| E-Commerce/Products - 0.6% | ||||||||
| 1-800-FLOWERS.COM, Inc.* | 4,700 | 10,528 | ||||||
| Electronic Components-Miscellaneous - 2.3% | ||||||||
| NVE Corp.* | 400 | 15,060 | ||||||
| Stoneridge, Inc.* | 3,600 | 25,164 | ||||||
| 40,224 | ||||||||
| Electronic Components-Semiconductors - 4.4% | ||||||||
| AXT, Inc.* | 5,600 | 13,496 | ||||||
| Ceva, Inc.* | 1,992 | 23,187 | ||||||
| Mindspeed Technologies, Inc.* | 5,300 | 21,571 | ||||||
| MIPS Technologies, Inc. Cl. A* | 5,200 | 19,552 | ||||||
| 77,806 | ||||||||
| Electronic Measure Instruments - 1.3% | ||||||||
| Measurement Specialties, Inc.* | 2,600 | 23,634 | ||||||
| Hazardous Waste Disposal - 0.9% | ||||||||
| Sharps Compliance Corp.* | 1,800 | 16,254 | ||||||
| Health Care Cost Containment - 1.3% | ||||||||
| Integramed America, Inc.* | 2,840 | 22,748 | ||||||
| Healthcare Safety Device - 0.5% | ||||||||
| Alpha PRO Tech, Ltd.* | 1,700 | 8,466 | ||||||
| Housewares - 1.0% | ||||||||
| Lifetime Brands, Inc.* | 2,800 | 17,360 | ||||||
| Human Resources - 1.6% | ||||||||
| Hudson Highland Group, Inc.* | 6,950 | 27,939 | ||||||
| Industrial Audio & Video Products - 0.7% | ||||||||
| SRS Labs, Inc.* | 1,800 | 12,474 | ||||||
| Internet Applications Software - 1.2% | ||||||||
| interCLICK, Inc.* | 4,500 | 21,420 | ||||||
| Internet Content-Information/News - 1.0% | ||||||||
| Health Grades, Inc.* | 4,200 | 18,354 | ||||||
| Machinery-General Industry - 1.0% | ||||||||
| Intevac, Inc.* | 1,500 | 18,660 | ||||||
| Medical Information Systems - 1.0% | ||||||||
| AMICAS, Inc.* | 4,000 | 18,200 | ||||||
| Medical Instruments - 1.7% | ||||||||
| Endologix, Inc.* | 3,400 | 14,416 | ||||||
| Vascular Solutions, Inc.* | 2,020 | 16,423 | ||||||
| 30,839 | ||||||||
| Medical Products - 1.3% | ||||||||
| ATS Medical, Inc.* | 7,735 | 22,818 | ||||||
| Medical-Biomedical/Genetics - 0.5% | ||||||||
| Repligen Corp.* | 2,000 | 9,400 | ||||||
| Medical-Drugs - 1.0% | ||||||||
| Biospecifics Technologies Corp.* | 300 | 8,763 | ||||||
| Sciclone Pharmaceuticals, Inc.* | 4,400 | 9,416 | ||||||
| 18,179 | ||||||||
| Medical-Outpatient/Home Medical Care - 3.9% | ||||||||
| Almost Family, Inc.* | 500 | 18,065 | ||||||
| America Service Group, Inc. | 920 | 13,496 | ||||||
| Continucare Corp.* | 6,100 | 18,971 | ||||||
| NovaMed, Inc.* | 4,770 | 18,126 | ||||||
| 68,658 | ||||||||
| Networking Products - 2.2% | ||||||||
| Hypercom Corp.* | 8,400 | 25,536 | ||||||
| Silicom, Ltd.* | 1,800 | 14,562 | ||||||
| 40,098 | ||||||||
| Oil Companies-Exploration & Production - 4.7% | ||||||||
| GeoMet, Inc.* | 8,300 | 9,379 | ||||||
| Georesources, Inc.* | 1,600 | 17,216 | ||||||
| Gulfport Energy Corp.* | 3,400 | 32,334 | ||||||
| Rex Energy Corp.* | 2,700 | 24,435 | ||||||
| 83,364 | ||||||||
| Oil Field Machine & Equipment - 2.4% | ||||||||
| Gulf Island Fabrication, Inc. | 800 | 17,592 | ||||||
| T-3 Energy Services, Inc.* | 1,030 | 25,709 | ||||||
| 43,301 | ||||||||
| Oil-Field Services - 0.7% | ||||||||
| Trico Marine Services, Inc.* | 2,400 | 12,264 | ||||||
See Accompanying Notes to Financial Statements
3
U.S. Ultra Micro Cap Fund
Schedule of Investments
As of November 30, 2009
| Number of | ||||||||
| Shares | Value | |||||||
| Paper & Related Products - 2.6% | ||||||||
| Boise, Inc.* | 5,800 | $ | 28,362 | |||||
| KapStone Paper & Packaging Corp.* | 2,500 | 17,725 | ||||||
| 46,087 | ||||||||
| Pharmacy Services - 1.3% | ||||||||
| BioScrip, Inc.* | 3,100 | 23,312 | ||||||
| Physical Therapy/Rehabilitation Centers - 1.2% | ||||||||
| US Physical Therapy, Inc.* | 1,510 | 22,061 | ||||||
| Power Conversion/Supply Equipment - 1.7% | ||||||||
| PowerSecure International, Inc.* | 3,700 | 30,525 | ||||||
| Recycling - 1.2% | ||||||||
| Metalico, Inc.* | 5,090 | 21,073 | ||||||
| Retail-Apparel/Shoe - 1.8% | ||||||||
| Destination Maternity Corp.* | 600 | 10,620 | ||||||
| Shoe Carnival, Inc.* | 1,200 | 21,708 | ||||||
| 32,328 | ||||||||
| Retail-Automobile - 1.5% | ||||||||
| America’s Car-Mart, Inc.* | 1,085 | 26,246 | ||||||
| Retail-Restaurants - 4.6% | ||||||||
| AFC Enterprises, Inc.* | 2,430 | 19,027 | ||||||
| Caribou Coffee Co., Inc.* | 2,900 | 24,418 | ||||||
| Carrols Restaurant Group, Inc.* | 3,400 | 22,508 | ||||||
| Famous Dave’s Of America, Inc.* | 2,600 | 15,184 | ||||||
| 81,137 | ||||||||
| Retirement/Aged Care - 1.0% | ||||||||
| Five Star Quality Care, Inc.* | 6,100 | 18,605 | ||||||
| Semiconductor Components-Integrated Circuits - 1.3% | ||||||||
| Techwell, Inc.* | 1,986 | 23,157 | ||||||
| Semiconductor Equipment - 3.3% | ||||||||
| FSI International, Inc.* | 10,300 | 12,051 | ||||||
| Nanometrics, Inc.* | 2,600 | 28,132 | ||||||
| Ultra Clean Holdings* | 3,100 | 18,445 | ||||||
| 58,628 | ||||||||
| Steel-Producers - 1.4% | ||||||||
| Olympic Steel, Inc. | 900 | 24,957 | ||||||
| Telecommunication Equipment - 1.6% | ||||||||
| Anaren, Inc.* | 1,120 | 15,422 | ||||||
| AudioCodes, Ltd.* | 5,320 | 12,981 | ||||||
| 28,403 | ||||||||
| Telecommunication Equipment-Fiber Optics - 1.3% | ||||||||
| Oplink Communications, Inc.* | 1,300 | 22,412 | ||||||
| Textile-Apparel - 1.1% | ||||||||
| Perry Ellis International, Inc.* | 1,400 | 19,572 | ||||||
| Transport-Marine - 2.6% | ||||||||
| CAI International, Inc.* | 3,100 | 27,094 | ||||||
| Paragon Shipping, Inc. Cl. A | 3,800 | 18,354 | ||||||
| 45,448 | ||||||||
| Transport-Truck - 2.9% | ||||||||
| Celadon Group, Inc.* | 1,926 | 18,432 | ||||||
| Quality Distribution, Inc.* | 5,350 | 18,778 | ||||||
| Saia, Inc.* | 1,045 | 15,069 | ||||||
| 52,279 | ||||||||
| Web Hosting/Design - 2.2% | ||||||||
| Terremark Worldwide, Inc.* | 4,300 | 26,273 | ||||||
| Web.com Group, Inc.* | 2,100 | 12,495 | ||||||
| 38,768 | ||||||||
| Total Common Stock (Cost: $1,335,669) | 1,714,089 | |||||||
| Limited Partnerships - 1.3% | ||||||||
| Transport-Marine - 1.3% | ||||||||
| Navios Maritime Partners LP | ||||||||
| (Cost $13,444) | 1,600 | 22,656 | ||||||
Principal Amount | ||||||||
| Short Term Investments - 2.5% | ||||||||
| Time Deposit - 2.5% | ||||||||
| Wells Fargo - Grand Cayman | ||||||||
| 0.030%, 12/01/09 (Cost: $44,075) | $ | 44,075 | 44,075 | |||||
| Total Investments - 100.0% (Cost: $1,393,188) | 1,780,820 | |||||||
| Other Assets in Excess of Liabilities - 0.0% | (14 | ) | ||||||
| Net Assets - 100.0% | $ | 1,780,806 | ||||||
| * | Non-income producing securities. |
Schedule of Investments by Sector as of November 30, 2009 | ||||
| Percent of | ||||
| Sector | Net Assets | |||
| Technology | 21.0 | % | ||
| Consumer, Non-cyclical | 19.4 | |||
| Industrial | 16.8 | |||
| Consumer, Cyclical | 12.9 | |||
| Communications | 11.1 | |||
| Basic Materials | 8.5 | |||
| Energy | 7.8 | |||
| Short Term Investments | 2.5 | |||
| Total Investments | 100.0 | |||
| Other assets in excess of liabilities | 0.0 | |||
| Net Assets | 100.0 | % | ||
See Accompanying Notes to Financial Statements
4
U.S. Micro Cap Fund
Management Team: John C. McCraw, Portfolio Manager; Robert S. Marren, Portfolio Manager
Chief Investment Officer: Horacio A. Valeiras, CFA
Goal: The U.S. Micro Cap Fund seeks to maximize long-term capital appreciation by investing primarily in U.S. companies with market capitalizations similar to the Russell Microcap Growth Index at time of purchase.
Market Overview: U.S. equities posted significant gains during the eight months ended November 30, 2009. The rally — one of the steepest in Wall Street history — lifted stock prices higher across all major styles and capitalization segments of the market.
During the period, the Federal Reserve held short-term interest rates steady, after having lowered them to near zero at the height of the credit crisis. The central bank also pumped massive amounts of liquidity into the financial system by making loans and asset purchases. On the fiscal front, some of the $787 billion stimulus package worked its way into the economy via tax credits, the “cash for clunkers” auto trade-in program and other spending initiatives.
The government’s aggressive policies helped thaw the credit markets and jump-start the economy. Following a 6.4% annual drop in the first quarter of 2009, GDP fell just 0.7% in the second quarter and rose 2.2% in the third quarter. Moreover, existing homes sales spiked to their highest level since early 2007, a key home-price index advanced for five straight months and manufacturing activity hit a three and a-half year high. That said, several indicators suggested that the recovery would be gradual, including the unemployment rate which reached 10.2% in October 2009.
In addition to improvement in the economy, better-than-expected corporate profits — albeit off low expectations — also boosted investor sentiment. As November 2009 drew to a close, small-cap companies that had reported third-quarter earnings were beating estimates by about 4%, on average, and mid caps were ahead by about 9%.
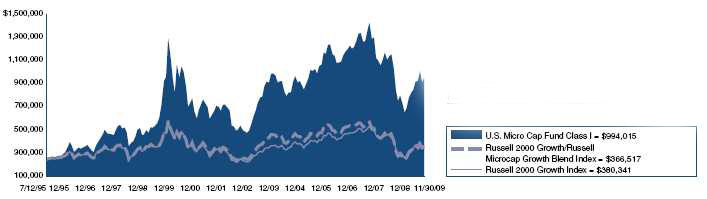
Performance: During the eight months ended November 30, 2009, the Fund’s Class I shares gained 37.73% and the Russell Microcap Growth Index gained 44.33%.
Portfolio Specifics: Stock selection in the energy sector had the largest favorable impact on results versus the index. One of the best-performing names in the Fund was Stone Energy, an oil and gas producer. The company benefited from several positive developments, including a rebound in oil prices, lower operating costs and a deepwater discovery in the Gulf of Mexico. Stock selection in the information technology and materials sectors also helped relative performance, where top contributors included software firm Ebix and chemical producer Omnova Solutions.
Within the Russell Microcap Growth Index, smaller market-cap stocks and stocks with lower prices generated some of the highest returns. This hurt the Fund’s relative performance, because our investment style generally leads to under- representation in these segments of the benchmark. From a sector perspective, stock selection among health care and consumer discretionary companies had the biggest negative impact on results versus the index. Major detractors included a provider of cardiac monitoring devices that expected lower reimbursement rates from insurance companies, and a youth apparel retailer that reported disappointing sales of merchandise tied to a popular new movie.
Market Outlook: The economy continues to face meaningful headwinds, including the weak job market and tepid bank lending. However, several positive factors could drive additional equity market gains in the coming months. For example, the Fed has resolved to keep interest rates low for an extended period of time, and corporate earnings are expected to show strong growth in 2010. Additionally, companies have large amounts of cash on their balance sheets, which could lead to increased merger and acquisition activity.
As events unfold, we are confident that our research-driven investment process will identify exciting growth opportunities for the Fund.
| Comparison of Change in Value of a $250,000 Investment in U.S. Micro Cap Fund Class I Shares with the Russell 2000 Growth/Russell Microcap Growth Blend Index and Russell 2000 Growth Index. |
Annualized Total Returns As of 11/30/09 | |||
| 1 Year | 5 Years | 10 Years | |
| U.S. Micro Cap Fund Class I | 27.37% | 0.81% | 2.85% |
Russell 2000 Growth/Russell Microcap Growth Blend Index | 35.42% | –3.59% | –0.87% |
| Russell 2000 Growth Index | 30.59% | –0.07% | –0.58% |
The graph above shows the value of a hypothetical $250,000 investment in the Fund’s Class I shares compared with the Russell 2000 Growth Index and a blended index comprised of the Russell 2000 Growth Index/Russell Microcap Growth Index. The Fund’s Class I shares calculate their performance based upon the historical performance of their corresponding series of Nicholas-Applegate Mutual Funds (renamed ING Mutual Funds), adjusted to reflect all fees and expenses applicable to Class I shares. The Nicholas-Applegate Institutional Funds’ Class I shares were first available on May 7, 1999. Average annual total return figures include changes in principal value, reinvestment of dividends, and capital gain distributions. The total returns shown above do not show the effects of income taxes on an individual’s investment. In most cases, taxes may reduce your actual investment returns on income or gains paid by the Fund or any gains you may realize if you sell your shares. Past performance cannot guarantee future results.
5
U.S. Micro Cap Fund
The Russell 2000 Growth Index is an unmanaged index comprised of those Russell 2000 companies with higher price-to-book ratios and higher forecasted growth values. The Russell 2000 Growth Index is an unmanaged index generally representative of the 2,000 smallest companies in the Russell 3000 Index, which represents approximately 10% of the total market capitalization of the Russell 3000 Index.
The Russell Microcap Growth Index isolates the smallest 1,000 securities in the Russell 2000 Index plus the next 1,000 securities. The Russell Microcap Growth Index isolates the securities in the Russell Microcap Index with purely growth characteristics. Unless otherwise noted, index returns reflect the reinvestment of income dividends and capital gains, if any, but do not reflect fees, brokerage commissions or other expenses of investing. The Russell 2000 Growth/Russell Microcap Growth Blend Index is a combination of the Russell 2000 Growth Index and the Russell Microcap Growth Index. The blended index exhibits Russell 2000 Growth performance from the inception of the Fund until August 2000, and Russell Microcap Growth performance thereafter. The Fund created the blended index because Russell Microcap Growth performance incepted in August 2000.
One cannot invest directly in an index. Since markets can go down as well as up, investment return and principal value will fluctuate with market conditions. You may have a gain or loss when you sell your shares. Further information relating to fund performance, including expense reimbursements, if applicable, is contained in the Financial Highlights section of the prospectus and elsewhere in this report.
6
U.S. Micro Cap Fund
Schedule of Investments
As of November 30, 2009
Number of Shares | Value | |||||||
| Common Stock - 98.1% | ||||||||
| Apparel Manufacturers - 0.9% | ||||||||
| Maidenform Brands, Inc.* | 33,800 | $ | 489,762 | |||||
| Applications Software - 2.5% | ||||||||
| China TransInfo Technology Corp.* | 58,600 | 434,812 | ||||||
| Ebix, Inc.* | 13,500 | 700,785 | ||||||
| inContact, Inc.* | 103,700 | 239,547 | ||||||
| 1,375,144 | ||||||||
| Auto/Truck Parts & Equipment-Original - 1.8% | ||||||||
| Titan International, Inc. | 49,200 | 407,376 | ||||||
| Wonder Auto Technology, Inc.* | 46,200 | 550,704 | ||||||
| 958,080 | ||||||||
| Batteries/Battery Systems - 0.7% | ||||||||
| China Ritar Power Corp.* | 78,200 | 355,028 | ||||||
| Broadcast Services/Programming - 1.0% | ||||||||
| DG FastChannel, Inc.* | 20,800 | 560,560 | ||||||
| Building-Heavy Construction - 0.9% | ||||||||
| Orion Marine Group, Inc.* | 25,000 | 462,250 | ||||||
| Casino Services - 0.9% | ||||||||
| Shuffle Master, Inc.* | 59,500 | 486,115 | ||||||
| Chemicals-Diversified - 0.5% | ||||||||
| Innospec, Inc. | 33,000 | 293,370 | ||||||
| Chemicals-Plastics - 0.8% | ||||||||
| Spartech Corp.* | 40,300 | 438,061 | ||||||
| Chemicals-Specialty - 1.4% | ||||||||
| Omnova Solutions, Inc.* | 111,700 | 739,454 | ||||||
| Coal - 0.7% | ||||||||
| James River Coal Co.* | 20,600 | 377,598 | ||||||
| Commercial Services - 0.7% | ||||||||
| StarTek, Inc.* | 52,500 | 363,825 | ||||||
| Commercial Services-Finance - 1.2% | ||||||||
| Dollar Financial Corp.* | 27,300 | 666,666 | ||||||
| Computer Services - 2.1% | ||||||||
| LivePerson, Inc.* | 96,900 | 614,346 | ||||||
| VanceInfo Technologies, Inc. - ADR* | 29,000 | 507,500 | ||||||
| 1,121,846 | ||||||||
| Computers-Integrated Systems - 2.0% | ||||||||
| Netscout Systems, Inc.* | 44,000 | 553,960 | ||||||
| Radiant Systems, Inc.* | 55,700 | 539,733 | ||||||
| 1,093,693 | ||||||||
| Computers-Memory Devices - 1.4% | ||||||||
| Xyratex, Ltd.* | 67,500 | 760,725 | ||||||
| Computers-Peripheral Equipment - 0.9% | ||||||||
| Compellent Technologies, Inc.* | 24,300 | 504,711 | ||||||
| Cosmetics & Toiletries - 1.1% | ||||||||
| Elizabeth Arden, Inc.* | 42,000 | 619,500 | ||||||
| Direct Marketing - 0.9% | ||||||||
| APAC Customer Services, Inc.* | 90,700 | 474,361 | ||||||
| Disposable Medical Products - 2.2% | ||||||||
| ICU Medical, Inc.* | 11,400 | 376,200 | ||||||
| Medical Action Industries, Inc.* | 30,900 | 394,284 | ||||||
| Merit Medical Systems, Inc.* | 24,800 | 408,704 | ||||||
| 1,179,188 | ||||||||
| Distribution/Wholesale - 1.0% | ||||||||
| MWI Veterinary Supply, Inc.* | 11,400 | 422,826 | ||||||
| Rentrak Corp.* | 8,600 | 128,570 | ||||||
| 551,396 | ||||||||
| Drug Delivery Systems - 0.4% | ||||||||
| Depomed, Inc.* | 66,900 | 218,763 | ||||||
| Electric Products-Miscellaneous - 2.0% | ||||||||
| Harbin Electric, Inc.* | 31,100 | 622,622 | ||||||
| SmartHeat, Inc.* | 35,800 | 473,276 | ||||||
| 1,095,898 | ||||||||
| Electronic Components-Miscellaneous - 0.6% | ||||||||
| NVE Corp.* | 8,800 | 331,320 | ||||||
| Electronic Components-Semiconductors - 2.6% | ||||||||
| Ceva, Inc.* | 38,600 | 449,304 | ||||||
| Conexant Systems, Inc.* | 137,000 | 312,360 | ||||||
| Mindspeed Technologies, Inc.* | 67,300 | 273,911 | ||||||
| MIPS Technologies, Inc. Cl. A* | 100,100 | 376,376 | ||||||
| 1,411,951 | ||||||||
| Enterprise Software/Services - 1.8% | ||||||||
| Opnet Technologies, Inc. | 42,500 | 447,100 | ||||||
| Taleo Corp. Cl. A* | 25,348 | 523,690 | ||||||
| 970,790 | ||||||||
| Finance-Consumer Loans - 1.7% | ||||||||
| Encore Capital Group, Inc.* | 21,700 | 369,768 | ||||||
| Portfolio Recovery Associates, Inc.* | 12,600 | 567,378 | ||||||
| 937,146 | ||||||||
| Healthcare Safety Device - 0.6% | ||||||||
| Alpha PRO Tech, Ltd.* | 60,100 | 299,298 | ||||||
| Home Furnishings - 0.7% | ||||||||
| La-Z-Boy, Inc.* | 40,500 | 386,775 | ||||||
| Industrial Audio & Video Products - 0.5% | ||||||||
| Sonic Solutions, Inc.* | 32,600 | 279,708 | ||||||
| Internet Applications Software - 0.3% | ||||||||
| interCLICK, Inc.* | 34,200 | 162,792 | ||||||
| Internet Incubators - 0.6% | ||||||||
| Internet Capital Group, Inc.* | 48,400 | 311,212 | ||||||
| Internet Infrastructure Software - 0.9% | ||||||||
| TeleCommunication Systems, Inc. Cl. A* | 55,300 | 466,179 | ||||||
| Machinery-General Industry - 2.0% | ||||||||
| Albany International Corp. Cl. A | 31,000 | 560,480 | ||||||
| Intevac, Inc.* | 43,300 | 538,652 | ||||||
| 1,099,132 | ||||||||
| Medical Imaging Systems - 1.5% | ||||||||
| Given Imaging, Ltd.* | 29,500 | 505,040 | ||||||
| Merge Healthcare, Inc.* | 103,700 | 317,322 | ||||||
| 822,362 | ||||||||
| Medical Information Systems - 1.6% | ||||||||
| AMICAS, Inc.* | 89,800 | 408,590 | ||||||
| Computer Programs & Systems, Inc. | 9,500 | 438,805 | ||||||
| 847,395 | ||||||||
| Medical Instruments - 1.1% | ||||||||
| Endologix, Inc.* | 80,700 | 342,168 | ||||||
| Symmetry Medical, Inc.* | 33,800 | 271,076 | ||||||
| 613,244 | ||||||||
See Accompanying Notes to Financial Statements
7
U.S. Micro Cap Fund
Schedule of Investments
As of November 30, 2009
Number of Shares | Value | |||||||
| Medical Labs & Testing Services - 1.1% | ||||||||
| Bio-Reference Labs, Inc.* | 17,460 | $ | 572,688 | |||||
| Medical Products - 2.7% | ||||||||
| ATS Medical, Inc.* | 100,100 | 295,295 | ||||||
| Cantel Medical Corp.* | 26,000 | 465,400 | ||||||
| Exactech, Inc.* | 18,600 | 293,880 | ||||||
| Hanger Orthopedic Group, Inc.* | 28,500 | 380,190 | ||||||
| 1,434,765 | ||||||||
| Medical-Biomedical/Genetics - 1.5% | ||||||||
| Affymax, Inc.* | 7,000 | 142,660 | ||||||
| Arena Pharmaceuticals, Inc.* | 48,000 | 174,240 | ||||||
| Immunogen, Inc.* | 31,200 | 245,856 | ||||||
| Immunomedics, Inc.* | 43,200 | 133,920 | ||||||
| Novavax, Inc.* | 35,500 | 106,500 | ||||||
| 803,176 | ||||||||
| Medical-Drugs - 1.7% | ||||||||
| Hi-Tech Pharmacal Co., Inc.* | 20,300 | 380,625 | ||||||
| Sciclone Pharmaceuticals, Inc.* | 96,900 | 207,366 | ||||||
| Vivus, Inc.* | 42,000 | 341,040 | ||||||
| 929,031 | ||||||||
| Medical-Outpatient/Home Medical Care - 1.4% | ||||||||
| Almost Family, Inc.* | 12,800 | 462,464 | ||||||
| America Service Group, Inc. | 21,000 | 308,070 | ||||||
| 770,534 | ||||||||
| Networking Products - 0.9% | ||||||||
| Hypercom Corp.* | 161,800 | 491,872 | ||||||
| Non-Ferrous Metals - 1.8% | ||||||||
| Brush Engineered Materials, Inc.* | 21,800 | 385,860 | ||||||
| Horsehead Holding Corp.* | 51,900 | 582,318 | ||||||
| 968,178 | ||||||||
| Office Supplies & Forms - 1.1% | ||||||||
| ACCO Brands Corp.* | 94,100 | 614,473 | ||||||
| Oil Companies-Exploration & Production - 4.7% | ||||||||
| Clayton Williams Energy, Inc.* | 17,100 | 483,417 | ||||||
| Gulfport Energy Corp.* | 81,500 | 775,065 | ||||||
| Rex Energy Corp.* | 39,500 | 357,475 | ||||||
| Stone Energy Corp.* | 49,400 | 934,154 | ||||||
| 2,550,111 | ||||||||
| Oil Field Machine & Equipment - 1.9% | ||||||||
| Gulf Island Fabrication, Inc. | 20,600 | 452,994 | ||||||
| T-3 Energy Services, Inc.* | 23,800 | 594,048 | ||||||
| 1,047,042 | ||||||||
| Oil-Field Services - 1.5% | ||||||||
| Hornbeck Offshore Services, Inc.* | 19,200 | 437,952 | ||||||
| Trico Marine Services, Inc.* | 69,700 | 356,167 | ||||||
| 794,119 | ||||||||
| Paper & Related Products - 3.2% | ||||||||
| Boise, Inc.* | 159,800 | 781,422 | ||||||
| Clearwater Paper Corp.* | 11,500 | 564,995 | ||||||
| KapStone Paper & Packaging Corp.* | 55,100 | 390,659 | ||||||
| 1,737,076 | ||||||||
| Pharmacy Services - 1.0% | ||||||||
| BioScrip, Inc.* | 68,500 | 515,120 | ||||||
| Physical Practice Management - 1.6% | ||||||||
| American Dental Partners, Inc.* | 33,400 | 407,480 | ||||||
| IPC The Hospitalist Co., Inc.* | 14,800 | 465,608 | ||||||
| 873,088 | ||||||||
| Property/Casualty Insurance - 0.8% | ||||||||
| Meadowbrook Insurance Group, Inc. | 63,200 | 432,920 | ||||||
| Recycling - 0.9% | ||||||||
| Metalico, Inc.* | 114,800 | 475,272 | ||||||
| Retail-Apparel/Shoe - 1.6% | ||||||||
| HOT Topic, Inc.* | 55,300 | 317,422 | ||||||
| Shoe Carnival, Inc.* | 31,100 | 562,599 | ||||||
| 880,021 | ||||||||
| Retail-Automobile - 0.9% | ||||||||
| America’s Car-Mart, Inc.* | 19,500 | 471,705 | ||||||
| Retail-Restaurants - 3.2% | ||||||||
| AFC Enterprises, Inc.* | 54,300 | 425,169 | ||||||
| Caribou Coffee Co., Inc.* | 56,700 | 477,414 | ||||||
| Carrols Restaurant Group, Inc.* | 62,300 | 412,426 | ||||||
| Einstein Noah Restaurant Group, Inc.* | 39,500 | 392,235 | ||||||
| 1,707,244 | ||||||||
| Retail-Sporting Goods - 1.0% | ||||||||
| Big 5 Sporting Goods Corp. | 32,400 | 529,416 | ||||||
| Satellite Telecommunications - 1.0% | ||||||||
| Hughes Communications, Inc.* | 20,200 | 519,140 | ||||||
| Semiconductor Components-Integrated Circuits - 3.5% | ||||||||
| Cirrus Logic, Inc.* | 89,300 | 484,899 | ||||||
| O2Micro International, Ltd. - ADR* | 80,170 | 343,929 | ||||||
| Pericom Semiconductor Corp.* | 45,800 | 472,198 | ||||||
| Techwell, Inc.* | 52,700 | 614,482 | ||||||
| 1,915,508 | ||||||||
| Semiconductor Equipment - 1.9% | ||||||||
| LTX-Credence Corp.* | 164,400 | 221,940 | ||||||
| Nanometrics, Inc.* | 47,400 | 512,868 | ||||||
| Ultratech, Inc.* | 23,000 | 303,140 | ||||||
| 1,037,948 | ||||||||
| Steel-Producers - 1.0% | ||||||||
| Olympic Steel, Inc. | 20,400 | 565,692 | ||||||
| Telecommunication Equipment - 0.7% | ||||||||
| Anaren, Inc.* | 26,300 | 362,151 | ||||||
| Telecommunication Equipment-Fiber Optics - 1.4% | ||||||||
| Oclaro, Inc.* | 239,600 | 301,896 | ||||||
| Oplink Communications, Inc.* | 26,000 | 448,240 | ||||||
| 750,136 | ||||||||
| Textile-Apparel - 0.8% | ||||||||
| Perry Ellis International, Inc.* | 29,900 | 418,002 | ||||||
| Therapeutics - 0.5% | ||||||||
| Inspire Pharmaceuticals, Inc.* | 41,600 | 242,112 | ||||||
| Transactional Software - 1.2% | ||||||||
| Bottomline Technologies, Inc.* | 40,100 | 645,209 | ||||||
| Transport-Air Freight - 0.7% | ||||||||
| Atlas Air Worldwide Holdings, Inc.* | 12,700 | 372,110 | ||||||
See Accompanying Notes to Financial Statements
8
U.S. Micro Cap Fund
Schedule of Investments
As of November 30, 2009
Number of Shares | Value | |||||||
| Transport-Marine - 2.3% | ||||||||
| Paragon Shipping, Inc. Cl. A | 81,400 | $ | 393,162 | |||||
| Safe Bulkers, Inc. | 62,300 | 530,173 | ||||||
| Star Bulk Carriers Corp. | 98,200 | 317,186 | ||||||
| 1,240,521 | ||||||||
| Transport-Services - 0.7% | ||||||||
| Vitran Corp., Inc.* | 41,700 | 370,296 | ||||||
| Transport-Truck - 0.7% | ||||||||
| Saia, Inc.* | 26,200 | 377,804 | ||||||
| Water Treatment Systems - 1.2% | ||||||||
| RINO International Corp.* | 18,900 | 647,325 | ||||||
| Web Hosting/Design - 1.5% | ||||||||
| Terremark Worldwide, Inc.* | 81,900 | 500,409 | ||||||
| Web.com Group, Inc.* | 52,500 | 312,375 | ||||||
| 812,784 | ||||||||
| Total Common Stock (Cost: $44,919,555) | 52,999,887 | |||||||
Principal Amount | ||||||||
| Short Term Investments - 1.8% | ||||||||
| Time Deposit - 1.8% | ||||||||
| Citibank Nassau | ||||||||
| 0.030%, 12/01/09 (Cost: $966,291) | $ | 966,291 | 966,291 | |||||
| Total Investments - 99.9% (Cost: $45,885,846) | 53,966,178 | |||||||
| Other Assets in Excess of Liabilities - 0.1% | 27,419 | |||||||
| Net Assets - 100.0% | $ | 53,993,597 | ||||||
| * | Non-income producing securities. |
| ADR - American Depositary Receipt | ||||
| Schedule of Investments by Sector | ||||
| as of November 30, 2009 | ||||
| Sector | Percent of Net Assets | |||
| Technology | 21.6 | % | ||
| Consumer, Non-cyclical | 21.4 | |||
| Industrial | 13.2 | |||
| Consumer, Cyclical | 12.7 | |||
| Communications | 9.1 | |||
| Energy | 8.8 | |||
| Basic Materials | 8.8 | |||
| Financial | 2.5 | |||
| Short Term Investments | 1.8 | |||
| Total Investments | 99.9 | |||
| Other assets in excess of liabilities | 0.1 | |||
| Net Assets | 100.0 | % | ||
See Accompanying Notes to Financial Statements
9
U.S. Emerging Growth Fund
Management Team: John C. McCraw, Portfolio Manager; Robert S. Marren, Portfolio Manager
Chief Investment Officer: Horacio A. Valeiras, CFA
Goal: The U.S. Emerging Growth Fund seeks to maximize long-term capital appreciation through investments primarily in U.S. companies with market capitalizations similar to the Russell 2000 Growth Index at time of purchase.
Market Overview: U.S. equities posted significant gains during the eight months ended November 30, 2009. The rally — one of the steepest in Wall Street history — lifted stock prices higher across all major styles and capitalization segments of the market.
During the period, the Federal Reserve held short-term interest rates steady, after having lowered them to near zero at the height of the credit crisis. The central bank also pumped massive amounts of liquidity into the financial system by making loans and asset purchases. On the fiscal front, some of the $787 billion stimulus package worked its way into the economy via tax credits, the “cash for clunkers” auto trade-in program and other spending initiatives.
The government’s aggressive policies helped thaw the credit markets and jump-start the economy. Following a 6.4% annual drop in the first quarter of 2009, GDP fell just 0.7% in the second quarter and rose 2.2% in the third quarter. Moreover, existing homes sales spiked to their highest level since early 2007, a key home-price index advanced for five straight months and manufacturing activity hit a three and a-half year high. That said, several indicators suggested that the recovery would be gradual, including the unemployment rate which reached 10.2% in October.
In addition to improvement in the economy, better-than-expected corporate profits — albeit off low expectations — also boosted investor sentiment. As November 2009 drew to a close, small-cap companies that had reported third-quarter earnings were beating estimates by about 4%, on average, and mid caps were ahead by about 9%.
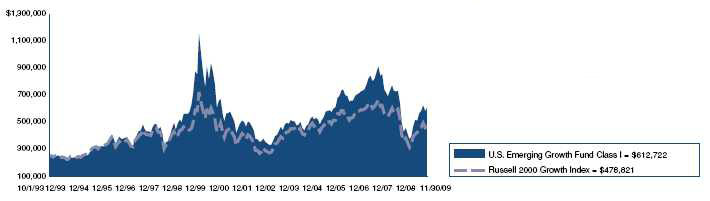
Performance: The Fund’s Class I shares gained 52.50% between April 1 and November 30, 2009, outperforming the 37.24% increase in the Russell 2000 Growth Index.
Portfolio Specifics: The Fund’s outperformance was driven by stock selection, which added value in most sectors and was particularly strong in energy and materials. Two of our best-performing holdings were Atwood Oceanics, a provider of offshore oil and gas drilling services, and Ashland, a diversified chemical company. Atwood Oceanics signed contracts for two of its jackup rigs that have the potential to keep the rigs utilized through the end of 2010. Ashland benefited from rising margins in its water technologies business, as well as record profits at its Valvoline automotive products unit.
Stock selection in the information technology sector was another major source of relative strength. The Fund’s top contributors included TriQuint Semiconductor and RF Micro Devices, chip makers that are capitalizing on the increasing adoption of 3G smartphones.
On the minus side, stock selection in the consumer discretionary sector negatively affected performance versus the index. One of our biggest detractors was an apparel company whose business was impacted by the difficult retail environment in key markets such as California and Florida.
Market Outlook: The economy continues to face meaningful headwinds, including the weak job market and tepid bank lending. However, several positive factors could drive additional equity market gains in the coming months. For example, the Fed has resolved to keep interest rates low for an extended period of time, and corporate earnings are expected to show strong growth in 2010. Additionally, companies have large amounts of cash on their balance sheets, which could lead to increased merger and acquisition activity.
Regardless of how big-picture developments play out, we believe that our bottom-up investment process will continue to add value to the benchmark.
| Comparison of Change in Value of a $250,000 Investment in U.S. Emerging Growth Fund Class I Shares with the Russell 2000 Growth Index. |
Annualized Total Returns As of 11/30/09 | |||
| 1 Year | 5 Years | 10 Years | |
| U.S. Emerging Growth Fund Class I | 41.75% | 3.00% | –1.61% |
| Russell 2000 Growth Index | 30.59% | –0.07% | –0.58% |
The graph above shows the value of a hypothetical $250,000 investment in the Fund’s Class I shares compared with the Russell 2000 Growth Index for the periods indicated. The Fund calculates performance based upon the historical performance of a corresponding series of Nicholas-Applegate Mutual Funds (renamed ING Mutual Funds), adjusted to reflect all fees and expenses applicable to Class I shares. The Nicholas-Applegate Institutional Funds’ Class I shares were first available on May 7, 1999. Average annual total return figures include changes in principal value, reinvested dividends, and capital gain distributions. The total returns shown above do not show the effects of income taxes on an individual’s investment. In most cases, taxes may reduce your actual investment returns on income or gains paid by the Fund or any gains you may realize if you sell your shares. Past performance cannot guarantee future results.
10
U.S. Emerging Growth Fund
The Russell 2000 Growth Index is an unmanaged index comprised of those Russell 2000 companies with higher price-to-book ratios and higher forecasted growth values. The Russell 2000 Index is an unmanaged index generally representative of the 2,000 smallest companies in the Russell 3000 Index, which represents approximately 10% of the total market capitalization of the Russell 3000 Index. Index returns include reinvestment of dividends. Unless otherwise noted, index returns reflect the reinvestment of income dividends and capital gains, if any, but do not reflect fees, brokerage commissions or other expense of investing. One cannot invest directly in an index.
Since markets can go down as well as up, investment returns and principal value will fluctuate with market conditions. You may have a gain or loss when you sell your shares. Further information relating to fund performance, including expense reimbursements, if applicable, is contained in the Financial Highlights section of the prospectus and elsewhere in this report.
11
U.S. Emerging Growth Fund
Schedule of Investments
As of November 30, 2009
Number of Shares | Value | |||||||
| Common Stock - 97.5% | ||||||||
| Aerospace/Defense - 0.4% | ||||||||
| Cubic Corp. | 2,000 | $ | 69,640 | |||||
| Aerospace/Defense-Equipment - 1.3% | ||||||||
| AAR Corp.* | 5,600 | 104,496 | ||||||
| BE Aerospace, Inc.* | 5,400 | 104,058 | ||||||
| 208,554 | ||||||||
| Airlines - 0.4% | ||||||||
| Hawaiian Holdings, Inc.* | 9,700 | 60,625 | ||||||
| Apparel Manufacturers - 1.1% | ||||||||
| Jones Apparel Group, Inc. | 6,400 | 108,480 | ||||||
| Quiksilver, Inc.* | 38,200 | 66,850 | ||||||
| 175,330 | ||||||||
| Applications Software - 1.0% | ||||||||
| Ebix, Inc.* | 3,100 | 160,921 | ||||||
| Auto/Truck Parts & Equipment-Original - 2.5% | ||||||||
| American Axle & Manufacturing | ||||||||
| Holdings, Inc.* | 19,100 | 119,375 | ||||||
| ArvinMeritor, Inc.* | 14,300 | 115,973 | ||||||
| Titan International, Inc. | 9,200 | 76,176 | ||||||
| Wonder Auto Technology, Inc.* | 8,900 | 106,088 | ||||||
| 417,612 | ||||||||
| Beverages-Wine/Spirits - 0.4% | ||||||||
| Central European Distribution Corp.* | 2,400 | 66,912 | ||||||
| Broadcast Services/Programming - 1.3% | ||||||||
| DG FastChannel, Inc.* | 3,600 | 97,020 | ||||||
| Liberty Media Corp. - Capital* | 5,600 | 123,704 | ||||||
| 220,724 | ||||||||
| Building-Heavy Construction - 1.3% | ||||||||
| Chicago Bridge & Iron Co. Cl. Y* | 5,900 | 103,781 | ||||||
| Orion Marine Group, Inc.* | 5,600 | 103,544 | ||||||
| 207,325 | ||||||||
| Casino Services - 0.7% | ||||||||
| Bally Technologies, Inc.* | 2,900 | 120,437 | ||||||
| Chemicals-Specialty - 0.6% | ||||||||
| NewMarket Corp. | 1,000 | 104,720 | ||||||
| Coal - 0.7% | ||||||||
| James River Coal Co.* | 6,700 | 122,811 | ||||||
| Commercial Banks-Central US - 0.6% | ||||||||
| MB Financial, Inc. | 5,500 | 102,575 | ||||||
| Commercial Services - 0.9% | ||||||||
| AerCap Holdings NV* | 12,200 | 100,040 | ||||||
| DynCorp International, Inc. Cl. A* | 3,800 | 53,124 | ||||||
| 153,164 | ||||||||
| Commercial Services-Finance - 3.6% | ||||||||
| Coinstar, Inc.* | 3,100 | 83,049 | ||||||
| Deluxe Corp. | 6,100 | 78,690 | ||||||
| Dollar Financial Corp.* | 6,000 | 146,520 | ||||||
| Net 1 UEPS Technologies, Inc.* | 5,700 | 106,476 | ||||||
| TNS, Inc.* | 3,700 | 92,685 | ||||||
| Wright Express Corp.* | 2,600 | 75,842 | ||||||
| 583,262 | ||||||||
| Computer Aided Design - 0.7% | ||||||||
| Parametric Technology Corp.* | 8,000 | 120,480 | ||||||
| Computers-Integrated Systems - 0.6% | ||||||||
| Netscout Systems, Inc.* | 7,800 | 98,202 | ||||||
| Computers-Memory Devices - 0.7% | ||||||||
| Xyratex, Ltd.* | 10,200 | 114,954 | ||||||
| Consumer Products-Miscellaneous - 2.2% | ||||||||
| Helen of Troy, Ltd.* | 4,900 | 100,695 | ||||||
| Jarden Corp. | 5,400 | 148,230 | ||||||
| Tupperware Brands Corp. | 2,400 | 111,720 | ||||||
| 360,645 | ||||||||
| Containers-Metal/Glass - 0.8% | ||||||||
| Greif, Inc. Cl. A | 2,300 | 128,478 | ||||||
| Containers-Paper/Plastic - 0.8% | ||||||||
| Rock-Tenn Co. Cl. A | 2,800 | 126,476 | ||||||
| Distribution/Wholesale - 0.6% | ||||||||
| Brightpoint, Inc.* | 14,200 | 101,956 | ||||||
| Diversified Operations - 0.7% | ||||||||
| Compass Diversified Holdings | 10,000 | 111,400 | ||||||
| Drug Delivery Systems - 0.6% | ||||||||
| Nektar Therapeutics* | 11,000 | 95,810 | ||||||
| E-Commerce/Services - 1.1% | ||||||||
| IAC/InterActiveCorp* | 4,300 | 83,635 | ||||||
| Internet Brands, Inc. Cl. A* | 14,300 | 98,813 | ||||||
| 182,448 | ||||||||
| Electric Products-Miscellaneous - 0.7% | ||||||||
| Harbin Electric, Inc.* | 5,700 | 114,114 | ||||||
| Electronic Components-Miscellaneous - 0.7% | ||||||||
| Sanmina-SCI Corp.* | 14,600 | 117,968 | ||||||
| Electronic Components-Semiconductors - 1.8% | ||||||||
| Amkor Technology, Inc.* | 16,800 | 93,240 | ||||||
| Microsemi Corp.* | 6,500 | 98,995 | ||||||
| Skyworks Solutions, Inc.* | 7,800 | 96,018 | ||||||
| 288,253 | ||||||||
| Electronic Design Automations - 0.6% | ||||||||
| Mentor Graphics Corp.* | 14,000 | 103,180 | ||||||
| Enterprise Software/Services - 2.4% | ||||||||
| Informatica Corp.* | 4,200 | 94,290 | ||||||
| JDA Software Group, Inc.* | 5,000 | 117,400 | ||||||
| Lawson Software, Inc.* | 12,800 | 83,840 | ||||||
| Taleo Corp. Cl. A* | 4,600 | 95,036 | ||||||
| 390,566 | ||||||||
| Entertainment Software - 0.5% | ||||||||
| Take-Two Interactive Software, Inc.* | 7,100 | 79,875 | ||||||
| Finance-Consumer Loans - 1.8% | ||||||||
| Encore Capital Group, Inc.* | 5,400 | 92,016 | ||||||
| Ocwen Financial Corp.* | 10,900 | 101,588 | ||||||
| Portfolio Recovery Associates, Inc.* | 2,400 | 108,072 | ||||||
| 301,676 | ||||||||
| Finance-Investment Bankers/Brokers - 0.5% | ||||||||
| MF Global, Ltd.* | 13,900 | 87,431 | ||||||
| Food-Canned - 0.6% | ||||||||
| Seneca Foods Corp. Cl. A* | 4,200 | 99,330 | ||||||
| Food-Miscellaneous/Diversified - 1.6% | ||||||||
| Chiquita Brands International, Inc.* | 5,900 | 100,241 | ||||||
| M&F Worldwide Corp.* | 4,800 | 158,640 | ||||||
| 258,881 | ||||||||
| Footwear & Related Apparel - 0.7% | ||||||||
| Deckers Outdoor Corp.* | 1,300 | 120,419 | ||||||
See Accompanying Notes to Financial Statements
12
Schedule of Investments
As of November 30, 2009
Number of Shares | Value | |||||||
| Home Furnishings - 0.7% | ||||||||
| La-Z-Boy, Inc.* | 12,400 | $ | 118,420 | |||||
| Hospital Beds/Equipment - 0.7% | ||||||||
| Hill-Rom Holdings, Inc. | 5,200 | 115,336 | ||||||
| Human Resources - 0.4% | ||||||||
| Emergency Medical Services Corp. Cl. A* | 1,400 | 67,550 | ||||||
| Instruments-Scientific - 0.4% | ||||||||
| FEI Co.* | 2,800 | 68,376 | ||||||
| Internet Applications Software - 0.6% | ||||||||
| Cybersource Corp.* | 5,600 | 96,152 | ||||||
| Internet Connectivity Services - 0.9% | ||||||||
| AboveNet, Inc.* | 2,800 | 143,640 | ||||||
| Internet Infrastructure Software - 1.4% | ||||||||
| AsiaInfo Holdings, Inc.* | 4,700 | 115,573 | ||||||
| TeleCommunication Systems, Inc. Cl. A* | 13,900 | 117,177 | ||||||
| 232,750 | ||||||||
| Intimate Apparel - 0.5% | ||||||||
| The Warnaco Group, Inc.* | 1,900 | 77,349 | ||||||
| Life/Health Insurance - 0.6% | ||||||||
| Delphi Financial Group, Inc. Cl. A | 4,800 | 104,928 | ||||||
| Machinery-General Industry - 0.8% | ||||||||
| Albany International Corp. Cl. A | 7,300 | 131,984 | ||||||
| Marine Services - 0.9% | ||||||||
| Aegean Marine Petroleum Network, Inc. | 5,700 | 153,216 | ||||||
| Medical Products - 3.2% | ||||||||
| Haemonetics Corp.* | 1,500 | 80,070 | ||||||
| Hanger Orthopedic Group, Inc.* | 7,900 | 105,386 | ||||||
| Invacare Corp. | 4,600 | 114,540 | ||||||
| Orthofix International NV* | 4,100 | 124,025 | ||||||
| PSS World Medical, Inc.* | 5,400 | 104,490 | ||||||
| 528,511 | ||||||||
| Medical Sterilize Product - 0.7% | ||||||||
| STERIS Corp. | 3,700 | 119,547 | ||||||
| Medical-Biomedical/Genetics - 2.6% | ||||||||
| Human Genome Sciences, Inc.* | 5,400 | 150,228 | ||||||
| Incyte Corp., Ltd.* | 12,200 | 101,626 | ||||||
| Regeneron Pharmaceuticals, Inc.* | 4,200 | 77,070 | ||||||
| Seattle Genetics, Inc.* | 9,800 | 90,944 | ||||||
| 419,868 | ||||||||
| Medical-Drugs - 0.9% | ||||||||
| Hi-Tech Pharmacal Co., Inc.* | 3,800 | 71,250 | ||||||
| Salix Pharmaceuticals, Ltd.* | 3,500 | 79,800 | ||||||
| 151,050 | ||||||||
| Medical-Generic Drugs - 0.6% | ||||||||
| Impax Laboratories, Inc.* | 9,000 | 102,600 | ||||||
| Medical-HMO - 0.9% | ||||||||
| WellCare Health Plans, Inc.* | 4,300 | 141,857 | ||||||
| Medical-Outpatient/Home Medical Care - 0.6% | ||||||||
| Almost Family, Inc.* | 2,700 | 97,551 | ||||||
| Metal-Aluminum - 0.7% | ||||||||
| Century Aluminum Co.* | 11,900 | 116,025 | ||||||
| Multi-line Insurance - 0.9% | ||||||||
| Unitrin, Inc. | 6,900 | 153,939 | ||||||
| Networking Products - 0.7% | ||||||||
| Anixter International, Inc.* | 2,500 | 108,050 | ||||||
| Oil & Gas Drilling - 1.2% | ||||||||
| Atlas Energy, Inc.* | 4,000 | 102,800 | ||||||
| Atwood Oceanics, Inc.* | 2,700 | 101,736 | ||||||
| 204,536 | ||||||||
| Oil Companies-Exploration & Production - 3.9% | ||||||||
| ATP Oil & Gas Corp.* | 5,500 | 87,725 | ||||||
| Berry Petroleum Co. Cl. A | 3,700 | 101,121 | ||||||
| Gran Tierra Energy, Inc.* | 21,300 | 121,623 | ||||||
| Mariner Energy, Inc.* | 7,400 | 92,574 | ||||||
| Stone Energy Corp.* | 7,200 | 136,152 | ||||||
| W&T Offshore, Inc. | 9,500 | 98,325 | ||||||
| 637,520 | ||||||||
| Oil-Field Services - 2.3% | ||||||||
| Helix Energy Solutions Group, Inc.* | 7,500 | 88,200 | ||||||
| Hercules Offshore, Inc.* | 17,600 | 89,936 | ||||||
| Hornbeck Offshore Services, Inc.* | 3,800 | 86,678 | ||||||
| Tetra Technologies, Inc.* | 10,500 | 108,780 | ||||||
| 373,594 | ||||||||
| Paper & Related Products - 3.7% | ||||||||
| Boise, Inc.* | 34,000 | 166,260 | ||||||
| Clearwater Paper Corp.* | 3,100 | 152,303 | ||||||
| Domtar Corp.* | 2,900 | 163,618 | ||||||
| Schweitzer-Mauduit International, Inc. | 2,000 | 123,120 | ||||||
| 605,301 | ||||||||
| Pharmacy Services - 0.6% | ||||||||
| Catalyst Health Solutions, Inc.* | 2,800 | 95,228 | ||||||
| Physical Practice Management - 0.6% | ||||||||
| IPC The Hospitalist Co., Inc.* | 3,100 | 97,526 | ||||||
| Physical Therapy/Rehabilitation Centers - 0.8% | ||||||||
| RehabCare Group, Inc.* | 4,400 | 123,948 | ||||||
| Printing-Commercial - 0.7% | ||||||||
| Cenveo, Inc.* | 14,700 | 112,896 | ||||||
| Property/Casualty Insurance - 0.6% | ||||||||
| Amtrust Financial Services, Inc. | 8,900 | 106,355 | ||||||
| Publishing-Books - 0.6% | ||||||||
| Scholastic Corp. | 4,000 | 100,840 | ||||||
| Real Estate Management/Service - 0.6% | ||||||||
| E-House China Holdings, Ltd. - ADR* | 5,300 | 103,085 | ||||||
| Real Estate Operation/Development - 0.8% | ||||||||
| Forest City Enterprises, Inc. Cl. A* | 12,300 | 131,979 | ||||||
| Reinsurance - 0.6% | ||||||||
| Maiden Holdings, Ltd. | 12,500 | 94,250 | ||||||
| Rental Auto/Equipment - 0.5% | ||||||||
| United Rentals, Inc.* | 9,500 | 87,590 | ||||||
| Retail-Apparel/Shoe - 4.3% | ||||||||
| AnnTaylor Stores Corp.* | 8,200 | 114,636 | ||||||
| Collective Brands, Inc.* | 6,700 | 129,578 | ||||||
| Genesco, Inc.* | 4,800 | 125,472 | ||||||
| Hanesbrands, Inc.* | 5,000 | 120,050 | ||||||
| Phillips-Van Heusen Corp. | 2,700 | 108,000 | ||||||
| The Finish Line, Inc. Cl. A | 12,400 | 109,740 | ||||||
| 707,476 | ||||||||
| Retail-Automobile - 0.5% | ||||||||
| Sonic Automotive, Inc. Cl. A* | 9,400 | 83,190 | ||||||
| Retail-Discount - 0.7% | ||||||||
| HSN, Inc.* | 6,600 | 118,272 | ||||||
See Accompanying Notes to Financial Statements
13
U.S. Emerging Growth Fund
Schedule of Investments
As of November 30, 2009
Number of Shares | Value | |||||||
| Retail-Gardening Products - 0.6% | ||||||||
| Tractor Supply Co.* | 2,100 | $ | 98,049 | |||||
| Retail-Office Supplies - 0.6% | ||||||||
| OfficeMax, Inc.* | 9,100 | 96,278 | ||||||
| Retail-Pawn Shops - 0.7% | ||||||||
| First Cash Financial Services, Inc.* | 6,300 | 120,330 | ||||||
| Retail-Perfume & Cosmetics - 0.6% | ||||||||
| Sally Beauty Holdings, Inc.* | 15,000 | 104,700 | ||||||
| Retail-Petroleum Products - 0.6% | ||||||||
| World Fuel Services Corp. | 1,900 | 101,042 | ||||||
| Retail-Restaurants - 0.6% | ||||||||
| Cracker Barrel Old Country Store, Inc. | 2,400 | 90,144 | ||||||
| Retail-Sporting Goods - 0.8% | ||||||||
| Big 5 Sporting Goods Corp. | 7,600 | 124,184 | ||||||
| Rubber-Tires - 0.8% | ||||||||
| Cooper Tire & Rubber Co. | 7,300 | 130,816 | ||||||
| Satellite Telecommunications - 0.7% | ||||||||
| GeoEye, Inc.* | 3,800 | 118,446 | ||||||
| Seismic Data Collection - 0.9% | ||||||||
| ION Geophysical Corp.* | 26,500 | 144,160 | ||||||
| Semiconductor Components-Integrated Circuits - 1.8% | ||||||||
| Cirrus Logic, Inc.* | 22,200 | 120,546 | ||||||
| Integrated Device Technology, Inc.* | 14,300 | 80,938 | ||||||
| Pericom Semiconductor Corp.* | 9,400 | 96,914 | ||||||
| 298,398 | ||||||||
| Semiconductor Equipment - 0.6% | ||||||||
| Tessera Technologies, Inc.* | 4,000 | 94,680 | ||||||
| Telecommunication Equipment-Fiber Optics - 0.8% | ||||||||
| Finisar Corp.* | 14,200 | 129,220 | ||||||
| Telecommunications Services - 1.3% | ||||||||
| Knology, Inc.* | 10,000 | 98,600 | ||||||
| TW Telecom, Inc. Cl. A* | 8,000 | 116,400 | ||||||
| 215,000 | ||||||||
| Therapeutics - 0.4% | ||||||||
| Onyx Pharmaceuticals, Inc.* | 2,500 | 71,525 | ||||||
| Transactional Software - 0.7% | ||||||||
| Solera Holdings, Inc. | 3,400 | 118,864 | ||||||
| Transport-Air Freight - 0.8% | ||||||||
| Atlas Air Worldwide Holdings, Inc.* | 4,200 | 123,060 | ||||||
| Transport-Marine - 1.5% | ||||||||
| Genco Shipping & Trading, Ltd.* | 5,800 | 136,184 | ||||||
| Navios Maritime Holdings, Inc. | 17,800 | 102,884 | ||||||
| 239,068 | ||||||||
| Transport-Rail - 0.6% | ||||||||
| Kansas City Southern* | 3,400 | 97,342 | ||||||
| Transport-Truck - 0.6% | ||||||||
| Saia, Inc.* | 7,200 | 103,824 | ||||||
| Web Portals/ISP - 0.5% | ||||||||
| United Online, Inc. | 11,600 | 78,880 | ||||||
| Wire & Cable Products - 0.8% | ||||||||
| Belden, Inc. | 5,700 | 126,084 | ||||||
| Total Common Stock (Cost: $13,857,372) | 16,033,533 | |||||||
| Limited Partnerships - 0.7% | ||||||||
| Pipelines - 0.7% | ||||||||
| Targa Resources Partners LP | ||||||||
| (Cost $78,695) | 5,600 | $ | 111,888 | |||||
Principal Amount | ||||||||
| Short Term Investments - 1.7% | ||||||||
| Time Deposit - 1.7% | ||||||||
| Wells Fargo - Grand Cayman | ||||||||
| 0.030%, 12/01/09 (Cost: $281,141) | $ | 281,141 | 281,141 | |||||
| Total Investments - 99.9% (Cost: $14,217,208) | 16,426,562 | |||||||
| Other Assets in Excess of Liabilities - 0.1% | 15,044 | |||||||
| Net Assets - 100.0% | $ | 16,441,606 | ||||||
| * | Non-income producing securities. |
ADR - - American Depositary Receipt
| Schedule of Investments by Sector | ||||
| as of November 30, 2009 | ||||
| Sector | Percent of Net Assets | |||
| Consumer, Non-cyclical | 25.0 | % | ||
| Consumer, Cyclical | 18.0 | |||
| Industrial | 11.3 | |||
| Technology | 11.4 | |||
| Communications | 9.9 | |||
| Energy | 9.7 | |||
| Financial | 7.2 | |||
| Basic Materials | 5.0 | |||
| Diversified | 0.7 | |||
| Short Term Investments | 1.7 | |||
| Total Investments | 99.9 | |||
| Other assets in excess of liabilities | 0.1 | |||
| Net Assets | 100.0 | % | ||
See Accompanying Notes to Financial Statements
14
U.S. Small to Mid Cap Growth Fund
Management Team: John C. McCraw, Portfolio Manager; Robert S. Marren, Portfolio Manager
Chief Investment Officer: Horacio A. Valeiras, CFA
Goal: The U.S. Small to Mid Cap Growth Fund seeks to maximize long-term capital appreciation by investing primarily in stocks from a universe of U.S. companies with small to mid (SMID) market capitalizations similar to the Russell 2500 Growth Index at time of purchase.
Market Overview: U.S. equities posted significant gains during the eight months ended November 30, 2009. The rally — one of the steepest in Wall Street history — lifted stock prices higher across all major styles and capitalization segments of the market.
During the period, the Federal Reserve held short-term interest rates steady, after having lowered them to near zero at the height of the credit crisis. The central bank also pumped massive amounts of liquidity into the financial system by making loans and asset purchases. On the fiscal front, some of the $787 billion stimulus package worked its way into the economy via tax credits, the “cash for clunkers” auto trade-in program and other spending initiatives.
The government’s aggressive policies helped thaw the credit markets and jump-start the economy. Following a 6.4% annual drop in the first quarter of 2009, GDP fell just 0.7% in the second quarter and rose 2.2% in the third quarter. Moreover, existing homes sales spiked to their highest level since early 2007, a key home-price index advanced for five straight months and manufacturing activity hit a three and a-half year high. That said, several indicators suggested that the recovery would be gradual, including the unemployment rate which reached 10.2% in October 2009.
In addition to improvement in the economy, better-than-expected corporate profits — albeit off low expectations — also boosted investor sentiment. As November drew to a close, small-cap companies that had reported third-quarter earnings were beating estimates by about 4%, on average, and mid caps were ahead by about 9%.
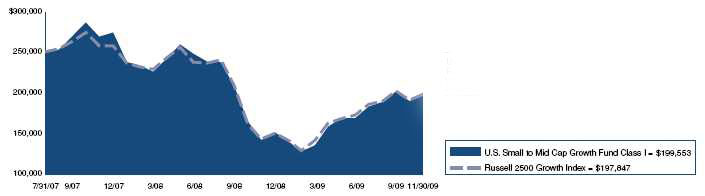
Performance: During the eight months ended November 30, 2009, the Fund’s Class I shares gained 47.23%. The Fund outperformed the Russell 2500 Growth Index, which rose 39.86% during the same period.
Portfolio Specifics: The primary driver of the Fund’s outperformance was stock selection, which was strongest in the energy sector. One position that performed especially well was coal producer Massey Energy. The company has been taking market share from smaller rivals whose higher cost structures and weaker financial positions made them vulnerable in the economic downturn. Massey is also benefiting from a favorable supply/demand outlook for metallurgical (met) coal used in steelmaking, since it has spare met coal production capacity.
Stock selection in the materials, industrials and information technology sectors also had a major positive impact on relative results. Top-performing holdings included Domtar, a paper producer that strengthened its balance sheet; Bucyrus International, a mining equipment manufacturer that benefited from a rebound in orders; and Stec, a supplier of data storage devices whose enterprise solid-state drive (SSD) business is ramping up.
Areas of relative weakness included stock selection in the health care sector, where a handful of biotechnology names had negative returns.
Market Outlook: The economy continues to face meaningful headwinds, including the weak job market and tepid bank lending. However, several positive factors could drive additional equity market gains in the coming months. For example, the Fed has resolved to keep interest rates low for an extended period of time, and corporate earnings are expected to show strong growth in 2010. Additionally, companies have large amounts of cash on their balance sheets, which could lead to increased merger and acquisition activity.
Whatever direction the broad market might take, we believe that the Fund will continue to benefit from our focus on company-specific fundamentals.
| Comparison of Change in Value of a $250,000 Investment in U.S. Small to Mid Cap Growth Fund Class I Shares with the Russell 2500 Growth Index. |
Annualized Total Returns As of 11/30/09 | ||
| 1 Year | Since Inception | |
| U.S. Small to Mid Cap Growth Fund Class I | 40.49% | –9.20% |
| Russell 2500 Growth Index | 38.18% | –9.54% |
The graph above shows the value of a hypothetical $250,000 investment in the Fund’s Class I shares with the Russell 2500 Growth Index for the periods indicated. Average annual total return figures include changes in principal value, reinvested dividends, and capital gain distributions. The Class I shares commenced operations on July 31, 2007. The total returns shown above do not show the effects of income taxes on an individuals’ investment. In most cases, taxes may reduce your actual investment returns on income or gains paid by the Fund or any gains you may realize if you sell your shares. Past performance cannot guarantee future results.
15
U.S. Small to Mid Cap Growth Fund
The Russell 2500 Growth Index is an unmanaged index comprised of those Russell 2500 companies with higher price-to-book ratios and higher forecasted growth values. The Russell 2500 Index is an unmanaged index generally representative of the 2,500 smallest companies in the Russell 3000 Index, which represents approximately 10% of the total market capitalization of the Russell 3000 Index. Unless otherwise noted, index returns reflect the reinvestment of income, dividends and capital gains, if any, but do not reflect fees, brokerage commissions or other expenses of investing.
Investors may not make direct investments into any index. Since markets can go down as well as up, investment return and principal value will fluctuate with market conditions. You may have a gain or loss when you sell shares. Further information relating to fund performance, including expense reimbursements, if applicable, is contained in the Financial Highlights section of the prospectus and elsewhere in this report.
16
U.S. Small to Mid Cap Growth Fund
Schedule of Investments
As of November 30, 2009
Number of Shares | Value | |||||||
| Common Stock - 97.7% | ||||||||
| Aerospace/Defense-Equipment - 0.8% | ||||||||
| AAR Corp.* | 1,900 | $ | 35,454 | |||||
| Apparel Manufacturers - 0.6% | ||||||||
| Jones Apparel Group, Inc. | 1,700 | 28,815 | ||||||
| Applications Software - 3.5% | ||||||||
| China TransInfo Technology Corp.* | 4,300 | 31,906 | ||||||
| Ebix, Inc.* | 1,000 | 51,910 | ||||||
| Nuance Communications, Inc.* | 2,770 | 42,076 | ||||||
| Red Hat, Inc.* | 1,200 | 32,040 | ||||||
| 157,932 | ||||||||
| Auto/Truck Parts & Equipment-Original - 1.5% | ||||||||
| American Axle & Manufacturing | ||||||||
| Holdings, Inc.* | 5,200 | 32,500 | ||||||
| ArvinMeritor, Inc.* | 4,700 | 38,117 | ||||||
| 70,617 | ||||||||
| Batteries/Battery Systems - 0.6% | ||||||||
| Energizer Holdings, Inc.* | 500 | 28,170 | ||||||
| Broadcast Services/Programming - 1.5% | ||||||||
| DG FastChannel, Inc.* | 1,300 | 35,035 | ||||||
| Liberty Media Corp. - Capital* | 1,600 | 35,344 | ||||||
| 70,379 | ||||||||
| Building-Heavy Construction - 0.7% | ||||||||
| Chicago Bridge & Iron Co. Cl. Y* | 1,800 | 31,662 | ||||||
| Casino Services - 0.7% | ||||||||
| Bally Technologies, Inc.* | 800 | 33,224 | ||||||
| Cellular Telecommunications - 0.7% | ||||||||
| Cellcom Israel, Ltd. | 1,000 | 31,010 | ||||||
| Chemicals-Diversified - 0.8% | ||||||||
| Celanese Corp. Cl. A | 1,300 | 38,688 | ||||||
| Chemicals-Specialty - 0.7% | ||||||||
| Ashland, Inc. | 900 | 32,337 | ||||||
| Coal - 2.4% | ||||||||
| James River Coal Co.* | 1,800 | 32,994 | ||||||
| Massey Energy Co. | 1,100 | 41,426 | ||||||
| Walter Energy, Inc. | 500 | 34,300 | ||||||
| 108,720 | ||||||||
| Commercial Services - 2.0% | ||||||||
| AerCap Holdings NV* | 3,800 | 31,160 | ||||||
| Alliance Data Systems Corp.* | 700 | 42,693 | ||||||
| DynCorp International, Inc. Cl. A* | 1,200 | 16,776 | ||||||
| 90,629 | ||||||||
| Commercial Services-Finance - 3.2% | ||||||||
| Dollar Financial Corp.* | 2,000 | 48,840 | ||||||
| Net 1 UEPS Technologies, Inc.* | 2,000 | 37,360 | ||||||
| TNS, Inc.* | 1,200 | 30,060 | ||||||
| Wright Express Corp.* | 1,000 | 29,170 | ||||||
| 145,430 | ||||||||
| Computer Aided Design - 0.8% | ||||||||
| Parametric Technology Corp.* | 2,500 | 37,650 | ||||||
| Computers-Memory Devices - 0.8% | ||||||||
| Xyratex, Ltd.* | 3,300 | 37,191 | ||||||
| Consumer Products-Miscellaneous - 3.3% | ||||||||
| Fortune Brands, Inc. | 800 | 30,728 | ||||||
| Jarden Corp. | 1,700 | 46,665 | ||||||
| Scotts Miracle-Gro Co. Cl. A | 1,000 | 39,930 | ||||||
| Tupperware Brands Corp. | 700 | 32,585 | ||||||
| 149,908 | ||||||||
| Containers-Metal/Glass - 0.9% | ||||||||
| Greif, Inc. Cl. A | 700 | 39,102 | ||||||
| Containers-Paper/Plastic - 0.7% | ||||||||
| Rock-Tenn Co. Cl. A | 710 | 32,071 | ||||||
| Diagnostic Kits - 0.8% | ||||||||
| Inverness Medical Innovations, Inc.* | 900 | 37,845 | ||||||
| Distribution/Wholesale - 0.8% | ||||||||
| Brightpoint, Inc.* | 5,000 | 35,900 | ||||||
| Diversified Manufacturing Operations - 0.7% | ||||||||
| Textron, Inc. | 1,700 | 34,085 | ||||||
| E-Commerce/Services - 1.6% | ||||||||
| IAC/InterActiveCorp* | 2,000 | 38,900 | ||||||
| Liberty Media Corp. - Interactive* | 3,000 | 31,920 | ||||||
| 70,820 | ||||||||
| Electric Products-Miscellaneous - 1.0% | ||||||||
| SmartHeat, Inc.* | 3,400 | 44,948 | ||||||
| Electronic Components-Miscellaneous - 0.6% | ||||||||
| Sanmina-SCI Corp.* | 3,400 | 27,472 | ||||||
| Electronic Components-Semiconductors - 2.7% | ||||||||
| Amkor Technology, Inc.* | 4,700 | 26,085 | ||||||
| LSI Corp.* | 5,210 | 27,561 | ||||||
| Rovi Corp.* | 1,270 | 37,859 | ||||||
| Skyworks Solutions, Inc. | 2,640 | 32,498 | ||||||
| 124,003 | ||||||||
| Electronic Design Automations - 0.6% | ||||||||
| Mentor Graphics Corp.* | 3,700 | 27,269 | ||||||
| Engineering/R & D Services - 0.7% | ||||||||
| McDermott International, Inc.* | 1,500 | 31,410 | ||||||
| Enterprise Software/Services - 1.5% | ||||||||
| Informatica Corp.* | 1,400 | 31,430 | ||||||
| Sybase, Inc.* | 900 | 36,216 | ||||||
| 67,646 | ||||||||
| Finance-Consumer Loans - 1.4% | ||||||||
| Ocwen Financial Corp.* | 3,900 | 36,348 | ||||||
| Portfolio Recovery Associates, Inc * | 650 | 29,269 | ||||||
| 65,617 | ||||||||
| Financial Guarantee Insurance - 0.7% | ||||||||
| Assured Guaranty, Ltd. | 1,500 | 34,020 | ||||||
| Food-Miscellaneous/Diversified - 1.7% | ||||||||
| Chiquita Brands International, Inc.* | 1,700 | 28,883 | ||||||
| M&F Worldwide Corp.* | 1,500 | 49,575 | ||||||
| 78,458 | ||||||||
| Home Decoration Products - 0.7% | ||||||||
| Newell Rubbermaid, Inc. | 2,100 | 30,471 | ||||||
| Home Furnishings - 0.9% | ||||||||
| La-Z-Boy, Inc.* | 4,100 | 39,155 | ||||||
| Hospital Beds/Equipment - 0.8% | ||||||||
| Hill-Rom Holdings, Inc. | 1,600 | 35,488 | ||||||
See Accompanying Notes to Financial Statements
17
U.S. Small to Mid Cap Growth Fund
Schedule of Investments
As of November 30, 2009
Number of Shares | Value | |||||||
| Hotels & Motels - 0.9% | ||||||||
| Wyndham Worldwide Corp. | 2,300 | $ | 42,711 | |||||
| Human Resources - 0.9% | ||||||||
| Hewitt Associates, Inc. Cl. A* | 1,000 | 40,180 | ||||||
| Internet Applications Software - 0.7% | ||||||||
| Cybersource Corp.* | 1,850 | 31,764 | ||||||
| Internet Connectivity Services - 0.9% | ||||||||
| AboveNet, Inc.* | 800 | 41,040 | ||||||
| Internet Infrastructure Software - 0.7% | ||||||||
| AsiaInfo Holdings, Inc.* | 1,300 | 31,967 | ||||||
| Internet Security - 0.7% | ||||||||
| McAfee, Inc.* | 880 | 33,572 | ||||||
| Intimate Apparel - 0.4% | ||||||||
| The Warnaco Group, Inc.* | 500 | 20,355 | ||||||
| Life/Health Insurance - 0.7% | ||||||||
| Delphi Financial Group, Inc. Cl. A | 1,400 | 30,604 | ||||||
| Machinery-Construction & Mining - 0.8% | ||||||||
| Bucyrus International, Inc. Cl. A | 700 | 36,253 | ||||||
| Machinery-General Industry - 0.8% | ||||||||
| Albany International Corp. Cl. A | 2,100 | 37,968 | ||||||
| Marine Services - 0.9% | ||||||||
| Aegean Marine Petroleum Network, Inc. | 1,500 | 40,320 | ||||||
| Medical Instruments - 0.8% | ||||||||
| Edwards Lifesciences Corp.* | 450 | 37,026 | ||||||
| Medical Products - 1.6% | ||||||||
| Orthofix International NV* | 1,200 | 36,300 | ||||||
| PSS World Medical, Inc.* | 1,800 | 34,830 | ||||||
| 71,130 | ||||||||
| Medical Sterilize Product - 0.7% | ||||||||
| STERIS Corp. | 1,000 | 32,310 | ||||||
| Medical-Biomedical/Genetics - 3.1% | ||||||||
| Alexion Pharmaceuticals, Inc.* | 630 | 28,570 | ||||||
| Bio-Rad Laboratories, Inc. Cl. A* | 430 | 41,577 | ||||||
| Human Genome Sciences, Inc.* | 1,200 | 33,384 | ||||||
| Life Technologies Corp.* | 800 | 39,824 | ||||||
| 143,355 | ||||||||
| Medical-Drugs - 0.8% | ||||||||
| Biovail Corp. | 2,600 | 37,518 | ||||||
| Medical-Generic Drugs - 0.8% | ||||||||
| Mylan, Inc.* | 2,100 | 37,527 | ||||||
| Medical-HMO - 1.0% | ||||||||
| WellCare Health Plans, Inc.* | 1,400 | 46,186 | ||||||
| Medical-Hospitals - 0.8% | ||||||||
| Community Health Systems, Inc.* | 1,200 | 36,612 | ||||||
| Metal-Aluminum - 0.7% | ||||||||
| Century Aluminum Co.* | 3,050 | 29,738 | ||||||
| Networking Products - 0.9% | ||||||||
| Anixter International, Inc. | 900 | 38,898 | ||||||
| Oil & Gas Drilling - 1.4% | ||||||||
| Atlas Energy, Inc.* | 1,200 | 30,840 | ||||||
| Atwood Oceanics, Inc.* | 850 | 32,028 | ||||||
| 62,868 | ||||||||
| Oil Companies-Exploration & Production - 3.5% | ||||||||
| Berry Petroleum Co. Cl. A | 1,200 | 32,796 | ||||||
| Comstock Resources, Inc.* | 700 | 25,991 | ||||||
| Gran Tierra Energy, Inc.* | 7,400 | 42,254 | ||||||
| Stone Energy Corp.* | 1,700 | 32,147 | ||||||
| W&T Offshore, Inc. | 2,600 | 26,910 | ||||||
| 160,098 | ||||||||
| Oil-Field Services - 2.0% | ||||||||
| Hercules Offshore, Inc.* | 5,550 | 28,361 | ||||||
| Hornbeck Offshore Services, Inc.* | 1,200 | 27,372 | ||||||
| Tetra Technologies, Inc.* | 3,300 | 34,188 | ||||||
| 89,921 | ||||||||
| Paper & Related Products - 3.6% | ||||||||
| Boise, Inc.* | 7,600 | 37,164 | ||||||
| Clearwater Paper Corp.* | 800 | 39,304 | ||||||
| Domtar Corp.* | 800 | 45,136 | ||||||
| Schweitzer-Mauduit International, Inc. | 700 | 43,092 | ||||||
| 164,696 | ||||||||
| Physical Practice Management - 0.6% | ||||||||
| IPC The Hospitalist Co., Inc.* | 920 | 28,943 | ||||||
| Printing-Commercial - 0.9% | ||||||||
| RR Donnelley & Sons Co. | 2,100 | 43,218 | ||||||
| Publishing-Books - 0.7% | ||||||||
| Scholastic Corp. | 1,300 | 32,773 | ||||||
| Publishing-Newspapers - 0.6% | ||||||||
| Gannett Co., Inc. | 2,600 | 25,714 | ||||||
| Real Estate Management/Service - 0.6% | ||||||||
| E-House China Holdings, Ltd. - ADR* | 1,500 | 29,175 | ||||||
| Real Estate Operation/Development - 0.9% | ||||||||
| Forest City Enterprises, Inc. Cl. A* | 3,800 | 40,774 | ||||||
| Respiratory Products - 0.8% | ||||||||
| ResMed, Inc.* | 680 | 34,184 | ||||||
| Retail-Apparel/Shoe - 4.8% | ||||||||
| AnnTaylor Stores Corp.* | 2,700 | 37,746 | ||||||
| Collective Brands, Inc.* | 1,900 | 36,746 | ||||||
| Genesco, Inc.* | 1,400 | 36,596 | ||||||
| Guess ?, Inc. | 1,000 | 37,050 | ||||||
| Hanesbrands, Inc.* | 1,700 | 40,817 | ||||||
| Phillips-Van Heusen Corp. | 700 | 28,000 | ||||||
| 216,955 | ||||||||
| Retail-Office Supplies - 0.6% | ||||||||
| OfficeMax, Inc.* | 2,400 | 25,392 | ||||||
| Retail-Petroleum Products - 0.7% | ||||||||
| World Fuel Services Corp. | 600 | 31,908 | ||||||
| Rubber-Tires - 0.9% | ||||||||
| Cooper Tire & Rubber Co. | 2,200 | 39,424 | ||||||
| Satellite Telecommunications - 0.9% | ||||||||
| GeoEye, Inc.* | 1,300 | 40,521 | ||||||
| Seismic Data Collection - 1.0% | ||||||||
| ION Geophysical Corp.* | 8,400 | 45,696 | ||||||
| Semiconductor Components - Integrated Circuits - 0.6% | ||||||||
| Integrated Device Technology, Inc.* | 5,000 | 28,300 | ||||||
See Accompanying Notes to Financial Statements
18
Schedule of Investments
As of November 30, 2009
Number of Shares | Value | |||||||
| Semiconductor Equipment - 1.3% | ||||||||
| Teradyne, Inc.* | 4,050 | $ | 35,883 | |||||
| Tessera Technologies, Inc.* | 1,000 | 23,670 | ||||||
| 59,553 | ||||||||
| Telecommunication Equipment - 0.7% | ||||||||
| CommScope, Inc.* | 1,300 | 32,669 | ||||||
| Telecommunication Equipment-Fiber Optics - 0.9% | ||||||||
| Finisar Corp.* | 4,500 | 40,950 | ||||||
| Telecommunications Services - 0.9% | ||||||||
| TW Telecom, Inc. Cl. A* | 2,700 | 39,285 | ||||||
| Transactional Software - 0.8% | ||||||||
| Solera Holdings, Inc. | 1,100 | 38,456 | ||||||
| Transport-Air Freight - 1.0% | ||||||||
| Atlas Air Worldwide Holdings, Inc.* | 1,500 | 43,950 | ||||||
| Transport-Marine - 0.8% | ||||||||
| Genco Shipping & Trading, Ltd.* | 1,500 | 35,220 | ||||||
| Transport-Rail - 0.7% | ||||||||
| Kansas City Southern* | 1,100 | 31,493 | ||||||
| Vitamins & Nutrition Products - 1.0% | ||||||||
| Herbalife, Ltd. | 1,100 | 46,134 | ||||||
| Web Portals/ISP - 0.6% | ||||||||
| United Online, Inc. | 4,000 | 27,200 | ||||||
| Wire & Cable Products - 0.9% | ||||||||
| Belden, Inc. | 1,800 | 39,816 | ||||||
| Total Common Stock (Cost: $3,633,376) | 4,455,916 | |||||||
| Limited Partnerships - 0.7% | ||||||||
| Pipelines - 0.7% | ||||||||
| Targa Resources Partners LP | ||||||||
| (Cost $21,342) | 1,600 | 31,968 | ||||||
Principal Amount | ||||||||
| Short Term Investments - 1.4% | ||||||||
| Time Deposit - 1.4% | ||||||||
| Citibank London | ||||||||
| 0.030%, 12/01/09 (Cost: $65,000) | $ | 65,000 | 65,000 | |||||
| Total Investments - 99.8% (Cost: $3,719,718) | 4,552,884 | |||||||
| Other Assets in Excess of Liabilities - 0.2% | 8,152 | |||||||
| Net Assets - 100.0% | $ | 4,561,036 | ||||||
| * | Non-income producing securities. |
ADR - - American Depositary Receipt
Schedule of Investments by Sector as of November 30, 2009 | ||||
| Sector | Percent of Net Assets | |||
| Consumer, Non-cyclical | 26.6 | % | ||
| Consumer, Cyclical | 13.5 | |||
| Communications | 12.9 | |||
| Technology | 12.7 | |||
| Industrial | 11.6 | |||
| Energy | 10.9 | |||
| Basic Materials | 5.8 | |||
| Financial | 4.4 | |||
| Short Term Investments | 1.4 | |||
| Total Investments | 99.8 | |||
| Other assets in excess of liabilities | 0.2 | |||
| Net Assets | 100.0 | % | ||
See Accompanying Notes to Financial Statements
19
U.S. Convertible Fund
Management Team: Douglas G. Forsyth, CFA, Portfolio Manager; William L. Stickney, Portfolio Manager; Justin Kass, CFA, Portfolio Manager; Michael E.Yee, Portfolio Manager
Chief Investment Officer: Horacio A. Valeiras, CFA
Goal: The U.S. Convertible Fund seeks to maximize total return consisting of capital appreciation and current income by investing primarily in securities that are convertible into common stock, across all ratings and capitalization ranges.
Market Overview: During the eight months ended November 30, 2009, the convertible market generated a positive return. The Merrill Lynch All Convertibles All Qualities Index rose 39.37%, with gains in every month but October 2009. By way of comparison, the S&P 500 Index and NASDAQ Composite Index were up 39.42% and 40.30%, respectively, over the same period.
Historically, convertibles have had a high correlation to movements in the underlying equity, with downside protection versus equities. More recently, however, credit has been the greater driver of returns. In 2008, the convertible universe participated in most of the downside of the equity markets, as rapidly widening corporate bond spreads caused the bond floors to fall. Through November of this year, credit continued to be the biggest driver of returns. As the capital markets opened up and access to capital improved, credit spreads tightened dramatically, sending all corporate bond prices higher.
During the eight-month period, every industry within the convertible market posted a substantial gain. Consumer discretionary, transportation and financials turned in the best results, while health care, consumer staples and utilities trailed the other sectors. Nearly all of the bond-like, or “busted,” convertibles rose significantly in price. Because many of these issues rarely trade, the liquidity was not there to build a position even if an issue was identified as a good candidate for purchase.
Performance: During the eight months ended November 30, 2009, the Fund’s Class I shares gained 27.85% and the Merrill Lynch All Convertibles All Qualities Index rose 39.37%.
Portfolio Specifics: The most distressed names in the convertible universe posted the strongest results, as numerous companies raised capital in the credit and equity markets. This negatively impacted the Fund’s relative performance, since the portfolio was underweight bond-like, distressed convertibles.
Positions in the technology and financial industries helped performance. Several technology issuers advanced as earnings beat expectations and earnings guidance was positive. Select financials benefited from capital raises and better trading and investment banking revenue. Positions in health care and telecommunications hurt performance. A number of the Fund’s health care holdings declined due to the uncertainty surrounding health care reform, and a rotation from defensive, low-beta industries into high-beta industries. The rotation into high-beta industries had a similar effect on telecom names.
As the equity markets improved during the period, the Fund’s conversion premium returned to a more balanced, asymmetric risk-return level. As of November 30, the Fund’s conversion premium was 33% versus 75% for the market.
Market Outlook: Year to date, improving credit conditions have played the most significant role in the recovery of the convertible market. While credit will continue to play an important role, we expect the equity component of the convertible bond to become a bigger driver of returns. With respect to equities, investor sentiment and economic data have improved. That said, we believe there needs to be more evidence of an economic recovery for there to be a sustainable rally in stocks.
We continue to build the Fund one security at a time by finding companies that are opportunistically capitalizing on change. We are also maintaining our discipline of seeking to identify the best convertibles with the optimal risk/reward profile: 70-80% of the upside and 40-50% of the downside.
| Comparison of Change in Value of a $250,000 Investment in U.S. Convertible Fund Class I, II and IV Shares with the Merrill Lynch All Convertibles, All Qualities Index. |
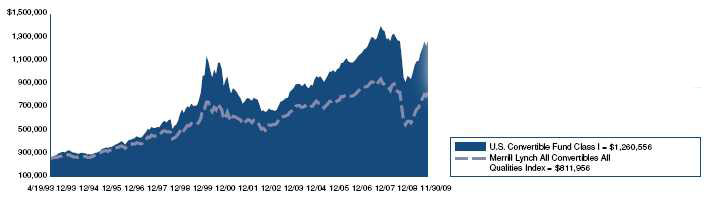
Annualized Total Returns As of 11/30/09 | |||
| 1 Year | 5 Years | 10 Years | |
| U.S. Convertible Fund Class I | 39.98% | 6.44% | 4.43% |
| Merrill Lynch All Convertibles All Qualities Index | 50.95% | 2.37% | 3.16% |
20
U.S. Convertible Fund
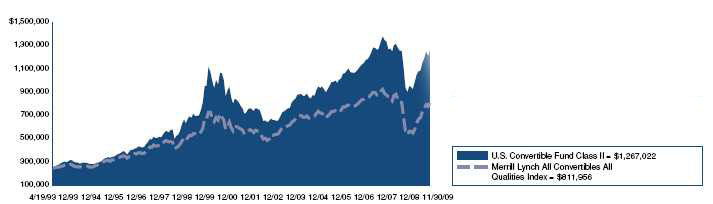
Annualized Total Returns As of 11/30/09 | |||
| 1 Year | 5 Years | 10 Years | |
| U.S. Convertible Fund Class II | 40.19% | 6.54% | 4.48% |
| Merrill Lynch All Convertibles All Qualities Index | 50.95% | 2.37% | 3.16% |

Annualized Total Returns As of 11/30/09 | |||
| 1 Year | 5 Years | 10 Years | |
| U.S. Convertible Fund Class IV | 40.38% | 6.60% | 4.51% |
| Merrill Lynch All Convertibles All Qualities Index | 50.95% | 2.37% | 3.16% |
The graphs above show the value of a hypothetical $250,000 investment in the Fund’s Class I, II and IV shares compared with the Merrill Lynch All Convertibles, All Qualities Index for the periods indicated. The Fund’s Class I, II and IV shares calculate their performance based upon the historical performance of their corresponding series of Nicholas-Applegate Mutual Funds (renamed ING Mutual Funds), adjusted to reflect all fees and expenses applicable to the Fund’s Class I, II and IV shares. The Nicholas-Applegate Institutional Funds’ Class I shares were first available on May 7, 1999, Class II shares on September 30, 2005 and Class IV shares on December 30, 2006. The historical performance of Class II and IV shares includes the performance of Class I shares for periods prior to the inception of Class II and IV. Average annual total return figures include changes in principal value, reinvested dividends, and capital gain distributions. The total returns shown above do not show the effects of income taxes on an individual’s investment. In most cases, taxes may reduce your actual investment returns on income or gains paid by the Fund or any gains you may realize if you sell your shares. Past performance cannot guarantee future results.
The Merrill Lynch All Convertibles All Qualities Index represents convertible securities spanning all corporate sectors and having a par amount outstanding of $25 Mil+. Maturities must be at least one year. The coupon range must be equal to or greater than zero and all qualities of bonds are included. Preferred equity redemption stocks are not included nor are component bonds once they are converted into corporate stock.
Unless otherwise noted, index returns reflect the reinvestment of income dividends and capital gains, if any, but do not reflect fees, brokerage commissions or other expense of investing. One cannot invest directly in an index.
Since markets can go down as well as up, investment return and principal value will fluctuate with market conditions. You may have a gain or loss when you sell your shares. Further information relating to fund performance, including expense reimbursements, if applicable, is contained in the Financial Highlights section of the prospectus and elsewhere in this report.
21
U.S. Convertible Fund
Schedule of Investments
As of November 30, 2009
Principal Amount | Value | |||||||
| Convertible Corporate Bonds - 77.6% | ||||||||
| Aerospace/Defense-Equipment - 1.2% | ||||||||
| AAR Corp. | ||||||||
| 1.750%, 02/01/26 | $ | 5,270,000 | $ | 4,881,338 | ||||
| Applications Software - 1.3% | ||||||||
| Nuance Communications, Inc. | ||||||||
| 2.750%, 08/15/27 | 5,005,000 | 5,424,169 | ||||||
| Auto/Truck Parts & Equipment-Original - 1.7% | ||||||||
| BorgWarner, Inc. | ||||||||
| 3.500%, 04/15/12 | 3,880,000 | 4,626,899 | ||||||
| TRW Automotive, Inc. 144A# | ||||||||
| 3.500%, 12/01/15 | 2,665,000 | 2,711,638 | ||||||
| 7,338,537 | ||||||||
| Auto-Cars/Light Trucks - 1.7% | ||||||||
| Ford Motor Co. | ||||||||
| 4.250%, 12/15/36 | 6,380,000 | 7,273,199 | ||||||
| Auto-Medium & Heavy Duty Trucks - 0.6% | ||||||||
| Navistar International Corp. | ||||||||
| 3.000%, 10/15/14 | 2,825,000 | 2,676,688 | ||||||
| Batteries/Battery Systems - 1.0% | ||||||||
EnerSys• | ||||||||
| 3.375%, 06/01/38 | 4,840,000 | 4,295,500 | ||||||
| Brewery - 1.0% | ||||||||
| Molson Coors Brewing Co. | ||||||||
| 2.500%, 07/30/13 | 3,985,000 | 4,418,369 | ||||||
| Broadcast Services/Programming - 1.2% | ||||||||
| Liberty Media LLC | ||||||||
| 3.125%, 03/30/23 | 5,205,000 | 5,224,519 | ||||||
| Building-Residential/Commercial - 1.1% | ||||||||
| DR Horton, Inc. | ||||||||
| 2.000%, 05/15/14 | 4,190,000 | 4,514,725 | ||||||
| Casino Services - 1.4% | ||||||||
| International Game Technology 144A# | ||||||||
| 3.250%, 05/01/14 | 4,655,000 | 5,714,013 | ||||||
| Coal - 1.4% | ||||||||
| Peabody Energy Corp. | ||||||||
| 4.750%, 12/15/41 | 6,125,000 | 6,033,125 | ||||||
| Commercial Services - 2.5% | ||||||||
| Alliance Data Systems Corp. | ||||||||
| 1.750%, 08/01/13 | 5,935,000 | 5,838,555 | ||||||
| Alliance Data Systems Corp. 144A# | ||||||||
| 4.750%, 05/15/14 | 385,000 | 566,431 | ||||||
| Quanta Services, Inc. | ||||||||
| 3.750%, 04/30/26 | 3,835,000 | 3,978,813 | ||||||
| 10,383,799 | ||||||||
| Commercial Services-Finance - 1.0% | ||||||||
| Coinstar, Inc. | ||||||||
| 4.000%, 09/01/14 | 4,205,000 | 4,089,363 | ||||||
| Computer Services - 1.1% | ||||||||
| DST Systems, Inc. | ||||||||
| 4.125%, 08/15/23 | 4,560,000 | 4,805,100 | ||||||
| Computers-Memory Devices - 4.3% | ||||||||
| EMC Corp./Massachusetts | ||||||||
| 1.750%, 12/01/13 | 4,940,000 | 6,026,800 | ||||||
| Maxtor Corp. | ||||||||
| 2.375%, 08/15/12 | 5,700,000 | 6,098,999 | ||||||
| NetApp, Inc. | ||||||||
| 1.750%, 06/01/13 | 4,615,000 | 5,411,088 | ||||||
| 17,536,887 | ||||||||
| Diagnostic Kits - 1.4% | ||||||||
| Inverness Medical Innovations, Inc. | ||||||||
| 3.000%, 05/15/16 | 5,025,000 | 5,772,469 | ||||||
| Diversified Manufacturing Operations - 1.0% | ||||||||
| Textron, Inc. | ||||||||
| 4.500%, 05/01/13 | 2,605,000 | 4,421,988 | ||||||
| Electronic Components-Semiconductors - 4.8% | ||||||||
| Advanced Micro Devices, Inc. | ||||||||
| 5.750%, 08/15/12 | 4,085,000 | 4,018,619 | ||||||
| Intel Corp. 144A# | ||||||||
| 3.250%, 08/01/39 | 5,140,000 | 5,711,824 | ||||||
| Micron Technology, Inc. | ||||||||
| 4.250%, 10/15/13 | 2,770,000 | 4,570,500 | ||||||
| ON Semiconductor Corp. | ||||||||
| 2.625%, 12/15/26 | 4,695,000 | 4,806,506 | ||||||
| Skyworks Solutions, Inc. | ||||||||
| 1.500%, 03/01/12 | 625,000 | 884,375 | ||||||
| 19,991,824 | ||||||||
| Electronic Measure Instruments - 1.3% | ||||||||
| Itron, Inc. | ||||||||
| 2.500%, 08/01/26 | 4,520,000 | 5,395,750 | ||||||
| Energy-Alternate Sources - 1.1% | ||||||||
| Covanta Holding Corp. 144A# | ||||||||
| 3.250%, 06/01/14 | 4,305,000 | 4,751,644 | ||||||
| Gold Mining - 1.4% | ||||||||
| Newmont Mining Corp. | ||||||||
| 1.250%, 07/15/14 | 4,335,000 | 5,841,413 | ||||||
| Home Decoration Products - 1.1% | ||||||||
| Newell Rubbermaid, Inc. | ||||||||
| 5.500%, 03/15/14 | 2,570,000 | 4,751,288 | ||||||
| Hospital Beds/Equipment - 1.2% | ||||||||
| Kinetic Concepts, Inc. 144A# | ||||||||
| 3.250%, 04/15/15 | 5,285,000 | 4,908,444 | ||||||
| Hotels & Motels - 1.3% | ||||||||
| Wyndham Worldwide Corp. | ||||||||
| 3.500%, 05/01/12 | 3,585,000 | 5,668,781 | ||||||
| Instruments-Scientific - 1.4% | ||||||||
| Fisher Scientific International, Inc. | ||||||||
| 3.250%, 03/01/24 | 4,370,000 | 5,724,700 | ||||||
| Internet Infrastructure Software - 0.9% | ||||||||
| TeleCommunication Systems, Inc. 144A# | ||||||||
| 4.500%, 11/01/14 | 3,375,000 | 3,681,450 | ||||||
| Internet Security - 2.7% | ||||||||
| Symantec Corp. | ||||||||
| 1.000%, 06/15/13 | 5,170,000 | 5,855,024 | ||||||
| VeriSign, Inc. | ||||||||
| 3.250%, 08/15/37 | 6,695,000 | 5,607,063 | ||||||
| 11,462,087 | ||||||||
See Accompanying Notes to Financial Statements
22
U.S. Convertible Fund
Schedule of Investments
As of November 30, 2009
Principal Amount | Value | |||||||
| Investment Management/Advisor Services - 2.4% | ||||||||
| BlackRock, Inc. | ||||||||
| 2.625%, 02/15/35 | $ | 2,500,000 | $ | 5,712,499 | ||||
| Janus Capital Group, Inc. | ||||||||
| 3.250%, 07/15/14 | 3,875,000 | 4,572,500 | ||||||
| 10,284,999 | ||||||||
| Machinery-General Industry - 1.1% | ||||||||
Roper Industries, Inc.• | ||||||||
| 0.000%, 01/15/34 | 6,855,000 | 4,430,044 | ||||||
| Medical Instruments - 0.4% | ||||||||
| NuVasive, Inc. | ||||||||
| 2.250%, 03/15/13 | 1,830,000 | 1,813,988 | ||||||
| Medical-Biomedical/Genetics - 3.7% | ||||||||
| Gilead Sciences, Inc. 144A# | ||||||||
| 0.625%, 05/01/13 | 1,905,000 | 2,455,069 | ||||||
| Gilead Sciences, Inc. | ||||||||
| 0.625%, 05/01/13 | 1,970,000 | 2,538,838 | ||||||
| Life Technology Corp. | ||||||||
| 2.000%, 08/01/23 | 3,460,000 | 5,133,774 | ||||||
| United Therapeutics Corp. | ||||||||
| 0.500%, 10/15/11 | 4,155,000 | 5,370,337 | ||||||
| 15,498,018 | ||||||||
| Medical-Drugs - 2.1% | ||||||||
| Biovail Corp. 144A# | ||||||||
| 5.375%, 08/01/14 | 4,695,000 | 5,557,705 | ||||||
| Valeant Pharmaceuticals International | ||||||||
| 4.000%, 11/15/13 | 2,555,000 | 3,094,744 | ||||||
| 8,652,449 | ||||||||
| Medical-Generic Drugs - 1.4% | ||||||||
| Mylan, Inc./PA 144A# | ||||||||
| 3.750%, 09/15/15 | 3,825,000 | 5,751,844 | ||||||
| Metal-Aluminum - 0.7% | ||||||||
| Alcoa, Inc. | ||||||||
| 5.250%, 03/15/14 | 1,460,000 | 3,082,425 | ||||||
| Motion Pictures & Services - 1.2% | ||||||||
| Macrovision Corp. | ||||||||
| 2.625%, 08/15/11 | 4,210,000 | 5,036,213 | ||||||
| Networking Products - 1.3% | ||||||||
| Anixter International, Inc. | ||||||||
| 1.000%, 02/15/13 | 5,835,000 | 5,411,963 | ||||||
| Oil Companies-Exploration & Production - 1.6% | ||||||||
| Chesapeake Energy Corp. | ||||||||
| 2.500%, 05/15/37 | 7,720,000 | 6,658,499 | ||||||
| Oil Field Machinery & Equipment - 1.2% | ||||||||
| Cameron International Corp. | ||||||||
| 2.500%, 06/15/26 | 4,125,000 | 5,249,063 | ||||||
| Oil-Field Services - 2.4% | ||||||||
| Oil States International, Inc. | ||||||||
| 2.375%, 07/01/25 | 3,840,000 | 4,996,800 | ||||||
| Schlumberger, Ltd. | ||||||||
| 2.125%, 06/01/23 | 3,275,000 | 5,280,937 | ||||||
| 10,277,737 | ||||||||
| REITS-Diversified - 1.3% | ||||||||
| Digital Realty Trust LP 144A# | ||||||||
| 4.125%, 08/15/26 | 3,420,000 | 5,275,350 | ||||||
| REITS-Office Property - 2.5% | ||||||||
| Alexandria Real Estate Equities, Inc. 144A# | ||||||||
| 8.000%, 04/15/29 | 3,340,000 | 5,222,925 | ||||||
| Boston Properties LP | ||||||||
| 3.750%, 05/15/36 | 5,150,000 | 5,323,812 | ||||||
| 10,546,737 | ||||||||
| Rental Auto/Equipment - 1.1% | ||||||||
| Hertz Global Holdings, Inc. | ||||||||
| 5.250%, 06/01/14 | 3,295,000 | 4,662,425 | ||||||
| Semiconductor Equipment - 1.3% | ||||||||
| Teradyne, Inc. | ||||||||
| 4.500%, 03/15/14 | 2,980,000 | 5,356,550 | ||||||
| Steel-Producers - 1.4% | ||||||||
| Steel Dynamics, Inc. | ||||||||
| 5.125%, 06/15/14 | 4,895,000 | 6,008,613 | ||||||
| Telecommunication Equipment-Fiber Optics - 0.7% | ||||||||
| Finisar Corp. 144A# | ||||||||
| 5.000%, 10/15/29 | 2,620,000 | 2,924,575 | ||||||
| Telecommunications Services - 2.3% | ||||||||
| MasTec, Inc. | ||||||||
| 4.000%, 06/15/14 | 3,770,000 | 3,991,488 | ||||||
| TW Telecom, Inc. | ||||||||
| 2.375%, 04/01/26 | 5,575,000 | 5,658,624 | ||||||
| 9,650,112 | ||||||||
| Therapeutics - 1.1% | ||||||||
| Onyx Pharmaceuticals, Inc. | ||||||||
| 4.000%, 08/15/16 | 4,450,000 | 4,678,063 | ||||||
| Toys - 1.4% | ||||||||
| Hasbro, Inc. | ||||||||
| 2.750%, 12/01/21 | 4,324,000 | 6,053,600 | ||||||
| Web Hosting/Design - 1.2% | ||||||||
| Equinix, Inc. | ||||||||
| 2.500%, 04/15/12 | 4,885,000 | 5,190,313 | ||||||
| Wire & Cable Products - 1.1% | ||||||||
| General Cable Corp. | ||||||||
| 0.875%, 11/15/13 | 5,485,000 | 4,765,094 | ||||||
| Wireless Equipment - 0.6% | ||||||||
| SBA Communications Corp. 144A# | ||||||||
| 4.000%, 10/01/14 | 2,085,000 | 2,621,888 | ||||||
| Total Convertible Corporate Bonds | ||||||||
| (Cost: $299,093,572) | 326,861,731 | |||||||
| Convertible Preferred Stock - 17.5% | ||||||||
| Agricultural Operations - 1.1% | ||||||||
| Bunge, Ltd. | ||||||||
| 4.875%, 12/31/49 | 54,910 | 4,735,988 | ||||||
| Chemicals-Diversified - 1.2% | ||||||||
| Celanese Corp. | ||||||||
| 4.250%, 12/31/49 | 136,085 | 5,173,952 | ||||||
| Electric-Generation - 1.3% | ||||||||
| AES Trust III | ||||||||
| 6.750%, 10/15/29 | 117,488 | 5,363,327 | ||||||
| Finance-Consumer Loans - 0.9% | ||||||||
| SLM Corp. | ||||||||
| 7.250%, 12/15/10 | 6,600 | 3,986,400 | ||||||
See Accompanying Notes to Financial Statements
23
U.S. Convertible Fund
Schedule of Investments
As of November 30, 2009
Principal Amount | Value | |||||||
| Financial Guarantee Insurance - 1.2% | ||||||||
| Assured Guaranty, Ltd. | ||||||||
| 8.500%, 06/01/12 | $ | 53,765 | $ | 5,032,942 | ||||
| Medical-Drugs - 1.0% | ||||||||
| Merck & Co., Inc. | ||||||||
| 6.000%, 08/13/10 | 16,035 | 4,067,278 | ||||||
| Metal-Diversified - 1.6% | ||||||||
| Freeport-McMoRan Copper & | ||||||||
| Gold, Inc. | ||||||||
| 6.750%, 05/01/10 | 57,765 | 6,830,710 | ||||||
| Multi-line Insurance - 1.3% | ||||||||
| XL Capital, Ltd. | ||||||||
| 10.750%, 08/15/11 | 192,225 | 5,416,901 | ||||||
| Office Supplies & Forms - 1.2% | ||||||||
| Avery Dennison Corp. | ||||||||
| 7.875%, 11/15/20 | 120,650 | 4,929,759 | ||||||
| Oil Companies-Exploration & Production - 1.3% | ||||||||
| Whiting Petroleum Corp. | ||||||||
| 6.250%, 12/31/49 | 33,355 | 5,368,821 | ||||||
| REITS-Regional Malls - 1.3% | ||||||||
| Simon Property Group, Inc. | ||||||||
| 6.000%, 12/31/49 | 89,800 | 5,590,050 | ||||||
| Super-Regional Banks-US - 4.1% | ||||||||
| Bank of America Corp. | ||||||||
| 7.250%, 12/31/49 | 6,630 | 5,652,075 | ||||||
| Fifth Third Bancorp | ||||||||
| 8.500%, 12/31/49 | 48,700 | 5,937,503 | ||||||
| Wells Fargo & Co. | ||||||||
| 7.500%, 12/31/49 | 6,375 | 5,686,500 | ||||||
| 17,276,078 | ||||||||
| Total Convertible Preferred Stock (Cost: $58,505,676) | 73,772,206 | |||||||
Number of Shares | ||||||||
| Common Stock - 1.6% | ||||||||
| Retail-Major Department Stores - 0.7% | ||||||||
| TJX Cos, Inc. | 81,981 | 3,146,431 | ||||||
| Wireless Equipment - 0.9% | ||||||||
| American Tower Corp. Cl. A* | 85,197 | 3,486,261 | ||||||
| Total Common Stock (Cost: $4,891,373) | 6,632,692 | |||||||
| Short Term Investments - 2.9% | ||||||||
| Time Deposit - 2.9% | ||||||||
| Citibank London | ||||||||
| 0.030%, 12/01/09 (Cost: $12,243,498) | 12,243,498 | 12,243,498 | ||||||
| Total Investments - 99.6% (Cost: $374,734,119) | 419,510,127 | |||||||
| Other Assets in Excess of Liabilities - 0.4% | 1,701,117 | |||||||
| Net Assets - 100.0% | $ | 421,211,244 | ||||||
| # | 144A Security. Certain condition for public sale may exist. The total market value of 144A securities owned at November 30, 2009 was $57,854,800 or 13.73% of net assets. |
| • | Step Bond: Coupon is a fixed rate for an initial period then resets at a specific date and rate. |
| * | Non-income producing securities. |
REIT - - Real Estate Investment Trust
Schedule of Investments by Sector as of November 30, 2009 | ||||
| Percent of | ||||
| Sector | Net Assets | |||
| Consumer, Non-cyclical | 20.0 | % | ||
| Financial | 15.1 | |||
| Technology | 12.6 | |||
| Consumer, Cyclical | 12.4 | |||
| Communications | 11.8 | |||
| Energy | 9.1 | |||
| Industrial | 8.0 | |||
| Basic Materials | 6.4 | |||
| Utilities | 1.3 | |||
| Short Term Investments | 2.9 | |||
| Total Investments | 99.6 | |||
| Other assets in excess of liabilities | 0.4 | |||
| Net Assets | 100.0 | % | ||
See Accompanying Notes to Financial Statements
24
International Growth Opportunities Fund
Management Team: Christopher A. Herrera, Portfolio Manager; Nelson W. Shing, Portfolio Manager
Chief Investment Officer: Horacio A. Valeiras, CFA
Goal: The International Growth Opportunities Fund seeks to maximize long-term capital appreciation through investments primarily in companies located outside the United States with market capitalizations predominantly in the bottom 20% of publicly traded companies, as measured by the market capitalization in the S&P Developed Ex-US BMI.
Market Overview: Stock markets in developed countries outside the United States posted dramatic gains during the eight months ended November 30, 2009. Depreciation in the U.S. dollar versus a range of currencies accentuated the gains for U.S.-based investors.
The rally was mainly driven by evidence that monetary and fiscal stimulus was pulling the global economy out of the worst recession since World War II. Several major economies returned to growth in the second quarter of 2009, including Germany and Japan. Others, such as Italy and the Netherlands, followed suit in the third quarter. Near the end of the period, policymakers in a number of countries were starting to unwind emergency stimulus measures enacted during the credit crisis. For example, central bankers in Australia and Norway raised interest rates, and the European Central Bank tightened loan collateral requirements for asset-backed securities.
The strong performance of developed non-U.S. markets was broad-based, with stocks in every country climbing higher. In dollar terms, one of the best-performing markets was Australia, where the commodity-heavy economy never entered recession in 2008 or 2009. Japan posted one of the smallest gains, weighed down by political concerns, worries about deflation and a strong yen.
Performance: The Fund’s Class I shares gained 58.75% from April 1 through November 30, 2009. The S&P Developed Ex-US Small Cap Growth Index, the Fund’s primary benchmark, and the S&P Developed Ex-US Small Cap Index, gained 60.43% and 59.96%, respectively.
Portfolio Specifics: Stock selection in Australia, the United Kingdom and the information technology and materials sectors helped results versus the indexes. Three of our best-performing holdings were Mount Gibson Iron, an Australia-based mining company that benefited from record Chinese iron ore imports; Unit 4 Agresso, a Netherlands-based software developer whose tight cost controls led to higher margins; and Victrex, a U.K.-based chemical manufacturer with accelerating sales volumes. An underweight in Japan, which resulted from our stock-by-stock investment decisions, was another key area of relative strength.
On the minus side, stock selection in Japan, France and the health care and consumer staples sectors negatively impacted relative performance. Names that lagged included a Japan-based food producer that was hurt by disappointing results in its domestic instant noodle business; a Norway-based pharmaceutical firm whose 2010 revenue guidance fell short of expectations; and an Ireland-based beverage company that reported declining sales for the first half of its fiscal year. An underweight in Australia also detracted from the Fund’s performance.
Market Outlook: The global economy is still weak, although conditions are improving, particularly in Asia and emerging countries. That said, overall risks remain elevated, clouding the outlook for international equities. Credit-related bank losses may not be behind us, imbalances in the currency markets could accelerate asset bubbles, and policymakers must unwind stimulus measures before inflation spikes, but not before growth is assured.
Despite these uncertainties, we are confident in our long-term outlook for the Fund given our focus on bottom-up stock selection.
| Comparison of Change in Value of a $250,000 Investment in International Growth Opportunities Fund Class I, II and III Shares with the S&P Developed Ex-US Small Cap Growth Index and the S&P Developed Ex-US Small Cap Index. |
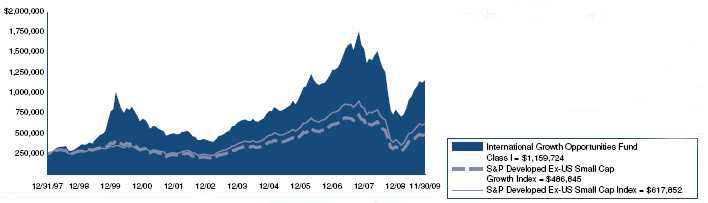
Annualized Total Returns As of 11/30/09 | |||
| 1 Year | 5 Years | 10 Years | |
| International Growth Opportunities Fund Class I | 58.52% | 9.21% | 5.91% |
| S&P Developed Ex-US Small Cap Growth Index | 57.09% | 5.50% | 3.49% |
| S&P Developed Ex-US Small Cap Index | 53.89% | 5.86% | 6.49% |
25
International Growth Opportunities Fund

Annualized Total Returns As of 11/30/09 | |||
| 1 Year | 5 Years | 10 Years | |
| International Growth Opportunities Fund Class II | 58.83% | 9.37% | 6.01% |
| S&P Developed Ex-US Small Cap Growth Index | 57.09% | 5.50% | 3.49% |
| S&P Developed Ex-US Small Cap Index | 53.89% | 5.86% | 6.49% |
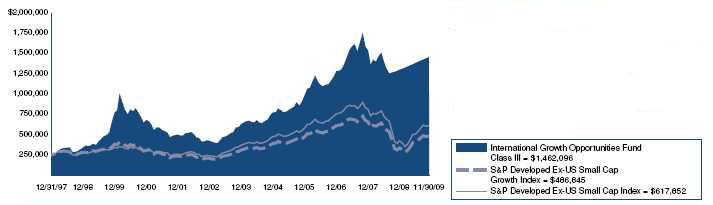
Annualized Total Returns As of 11/30/09 | |||
| 1 Year | 5 Years | 10 Years | |
| International Growth Opportunities Fund Class III | 58.87% | 10.37% | 8.71% |
| S&P Developed Ex-US Small Cap Growth Index | 57.09% | 5.50% | 3.49% |
| S&P Developed Ex-US Small Cap Index | 53.89% | 5.86% | 6.49% |
The graphs above show the value of a hypothetical $250,000 investment in the Fund’s Class I through III shares compared with the S&P Developed Ex-US Small Cap Index and S&P Developed Ex-US Small Cap Growth Index for the periods indicated. The Fund’s Class I through III shares calculate their performance based upon the historical performance of their corresponding series of Nicholas-Applegate Mutual Funds (renamed ING Mutual Funds), adjusted to reflect all fees and expenses applicable to the Fund’s Class I through III shares. The Nicholas-Applegate Institutional Funds’ Class I shares were first available on May 7, 1999, Class II shares commenced operations on June 5, 2003 and Class III shares on September 8, 2008. The historical performance of Class II and III shares includes the performance of Class I shares for periods prior to the inception of the relevant class. Average annual total return figures include changes in principal value, reinvested dividends, and capital gain distributions. The total returns shown on the previous page and above do not show the effects of income taxes on an individual’s investment. In most cases, taxes may reduce your actual investment returns on income or gains paid by the Fund or any gains you may realize if you sell your shares. Past performance cannot guarantee future results.
As of October 1, 2008, the S&P/Citigroup World xUS EMI and S&P/Citigroup World xUS EMI Growth indices have been renamed the S&P Developed Ex-US Small Cap Index and S&P Developed Ex-US Small Cap Growth Index, respectively. The S&P Developed Ex-US Small Cap is a market capitalization weighted index measuring capital appreciation. It is an unmanaged world equity index representative of small capitalization securities, defined as the bottom 20% of any given country’s available market capitalization excluding the U.S. The index does not include dividends; however, total rates of return, including all payments to shareholders, are calculated and published each month-end. S&P Developed Ex-US Small Cap Growth covers those small capitalization companies in each country that exhibit the characteristics of growth.
Investors may not make direct investments into any index. Since markets can go down as well as up, investment return and principal value will fluctuate with market conditions. You may have a gain or loss when you sell shares. Further information relating to fund performance, including expense reimbursements, if applicable, is contained in the Financial Highlights section of the prospectus and elsewhere in this report.
26
International Growth Opportunities Fund
Schedule of Investments
As of November 30, 2009
Number of Shares | Value | |||||||
| Common Stock - 91.3% | ||||||||
| Australia - 5.9% | ||||||||
| Aquarius Platinum, Ltd.* | 292,316 | $ | 1,699,647 | |||||
| Mount Gibson Iron, Ltd.* | 1,833,866 | 2,601,875 | ||||||
| Paladin Energy, Ltd.* | 292,444 | 1,102,877 | ||||||
| The Reject Shop, Ltd. | 119,580 | 1,521,460 | ||||||
| 6,925,859 | ||||||||
| Belgium - 3.8% | ||||||||
| EVS Broadcast Equipment SA | 33,903 | 2,331,232 | ||||||
| Umicore | 62,812 | 2,137,373 | ||||||
| 4,468,605 | ||||||||
| Bermuda - 1.1% | ||||||||
| Allied World Assurance Co. Holdings, Ltd. | 27,600 | 1,319,004 | ||||||
| Brazil - 1.7% | ||||||||
| Light SA | 145,400 | 2,005,259 | ||||||
| Canada - 6.7% | ||||||||
| Biovail Corp. | 105,100 | 1,516,593 | ||||||
| Calfrac Well Services, Ltd. | 78,800 | 1,423,146 | ||||||
| Capstone Mining Corp.* | 507,900 | 1,348,940 | ||||||
| Neo Material Technologies, Inc.* | 390,400 | 1,666,398 | ||||||
| RONA, Inc.* | 133,000 | 1,851,971 | ||||||
| 7,807,048 | ||||||||
| France - 3.7% | ||||||||
| EDF Energies Nouvelles SA | 39,523 | 2,057,243 | ||||||
| Ingenico | 87,412 | 2,290,725 | ||||||
| 4,347,968 | ||||||||
| Germany - 6.6% | ||||||||
| GEA Group AG | 98,532 | 2,076,951 | ||||||
| Rhoen Klinikum AG | 78,390 | 1,927,776 | ||||||
| Wacker Neuson SE | 95,429 | 1,298,047 | ||||||
| Wirecard AG | 186,384 | 2,367,342 | ||||||
| 7,670,116 | ||||||||
| Greece - 1.8% | ||||||||
| JUMBO SA* | 162,216 | 2,094,470 | ||||||
| Hong Kong - 1.9% | ||||||||
| Dah Sing Financial Holdings, Ltd.* | 374,800 | 2,239,084 | ||||||
| Ireland - 3.0% | ||||||||
| C&C Group PLC | 535,630 | 2,251,671 | ||||||
| Kingspan Group PLC* | 138,384 | 1,211,257 | ||||||
| 3,462,928 | ||||||||
| Italy - 5.0% | ||||||||
| Ansaldo STS SpA | 97,359 | 1,944,060 | ||||||
| Autogrill SpA* | 174,078 | 2,154,848 | ||||||
| Azimut Holding SpA | 136,807 | 1,786,938 | ||||||
| 5,885,846 | ||||||||
| Japan - 10.9% | ||||||||
| OKUMA Corp.* | 313,000 | 1,366,162 | ||||||
| Pigeon Corp. | 34,100 | 1,488,374 | ||||||
| Point, Inc. | 24,700 | 1,376,284 | ||||||
| Seven Bank, Ltd. | 425 | 851,529 | ||||||
| The Japan Steel Works, Ltd. | 121,300 | 1,481,312 | ||||||
| Torishima Pump Manufacturing Co., Ltd. | 70,300 | 1,410,162 | ||||||
| Towa Pharmaceutical Co., Ltd. | 26,400 | 1,320,843 | ||||||
| Tsumura & Co. | 47,000 | 1,568,576 | ||||||
| Unicharm Petcare Corp. | 50,300 | 1,839,283 | ||||||
| 12,702,525 | ||||||||
| Netherlands - 2.3% | ||||||||
| Unit 4 Agresso NV* | 105,983 | 2,736,822 | ||||||
| Norway - 1.0% | ||||||||
| Pronova BioPharma AS* | 421,000 | 1,112,031 | ||||||
| Portugal - 1.5% | ||||||||
| Mota Engil SGPS SA | 296,327 | 1,699,037 | ||||||
| Republic of China - 2.3% | ||||||||
| 7 Days Group Holdings, Ltd. - ADR* | 64,000 | 757,760 | ||||||
| Golden Eagle Retail Group, Ltd. | 877,000 | 1,941,810 | ||||||
| Peace Mark Holdings, Ltd.* | 2,428,000 | 3,133 | ||||||
| 2,702,703 | ||||||||
| Singapore - 3.5% | ||||||||
| Hyflux, Ltd. | 991,000 | 2,189,265 | ||||||
| MobileOne, Ltd. | 1,533,000 | 1,914,659 | ||||||
| 4,103,924 | ||||||||
| Spain - 1.0% | ||||||||
| Tecnicas Reunidas SA | 22,137 | 1,208,771 | ||||||
| Switzerland - 2.7% | ||||||||
| Banque Cantonale Vaudoise | 3,928 | 1,564,551 | ||||||
| Partners Group Holding AG | 12,814 | 1,569,451 | ||||||
| 3,134,002 | ||||||||
| Turkey - 1.5% | ||||||||
| Asya Katilim Bankasi AS* | 860,233 | 1,698,642 | ||||||
| United Kingdom - 23.4% | ||||||||
| ARM Holdings PLC | 545,020 | 1,383,687 | ||||||
| ASOS PLC* | 260,632 | 1,894,814 | ||||||
| Babcock International Group | 217,225 | 2,219,137 | ||||||
| Charter International PLC | 162,657 | 1,933,954 | ||||||
| Chemring Group PLC | 50,382 | 2,238,199 | ||||||
| Cookson Group PLC* | 203,906 | 1,293,345 | ||||||
| Croda International PLC | 156,827 | 1,916,111 | ||||||
| Dana Petroleum PLC* | 74,323 | 1,495,370 | ||||||
| Dechra Pharmaceuticals PLC | 153,980 | 1,139,662 | ||||||
| IG Group Holdings PLC | 439,555 | 2,283,084 | ||||||
| Inchcape PLC* | 2,616,275 | 1,193,183 | ||||||
| Petrofac, Ltd. | 105,821 | 1,689,739 | ||||||
| QinetiQ Group PLC | 404,830 | 1,043,720 | ||||||
| Restaurant Group PLC | 635,367 | 1,915,441 | ||||||
| RPS Group PLC | 437,091 | 1,445,380 | ||||||
| Victrex PLC | 161,593 | 2,100,307 | ||||||
| 27,185,133 | ||||||||
| Total Common Stock (Cost: $90,587,936) | 106,509,777 | |||||||
| Equity-Linked Securities - 3.7% | ||||||||
| Taiwan - 3.7% | ||||||||
| Credit Suisse FB Giant | ||||||||
| Manufacturing - 08/22/11 | 768,141 | 2,064,840 | ||||||
| Merrill Lynch Wistron | ||||||||
| Corp. - 12/03/12 144A#,* | 1,234,441 | 2,267,174 | ||||||
| 4,332,014 | ||||||||
| Total Equity-Linked Securities (Cost: $2,626,635) | 4,332,014 | |||||||
| Preferred Stock - 1.7% | ||||||||
| Brazil - 1.7% | ||||||||
| Banco do Estado do Rio Grande do Sul | ||||||||
| (Cost: $975,375) | 288,200 | 2,021,154 | ||||||
See Accompanying Notes to Financial Statements
27
International Growth Opportunities Fund
Schedule of Investments
As of November 30, 2009
Principal Amount | Value | |||||||
| Short Term Investments - 4.2% | ||||||||
| Time Deposit - 4.2% | ||||||||
| Citibank London | ||||||||
| 0.030%, 12/01/09 (Cost: $4,926,758) | $ | 4,926,758 | $ | 4,926,758 | ||||
| Total Investments - 100.9% (Cost: $99,116,704) | 117,789,703 | |||||||
| Liabilities in Excess of Other Assets - (0.9%) | (1,086,614 | ) | ||||||
| Net Assets - 100.0% | $ | 116,703,089 | ||||||
| * | Non-income producing securities. |
| # | 144A Security. Certain condition for public sale may exist. The total market value of 144A securities owned at November 30, 2009 was $2,267,174 or 1.94% of net assets. |
ADR - American Depository Receipt | ||||
| Schedule of Investments by Sector | ||||
| as of Novemeber 30, 2009 | ||||
| Percent of | ||||
| Sector | Net Assets | |||
| Consumer, Non-cyclical | 20.0 | % | ||
| Industrial | 19.9 | |||
| Financial | 13.1 | |||
| Consumer, Cyclical | 12.7 | |||
| Basic Materials | 11.1 | |||
| Technology | 7.4 | |||
| Energy | 5.7 | |||
| Communications | 3.3 | |||
| Diversified | 1.8 | |||
| Utilities | 1.7 | |||
| Short Term Investments | 4.2 | |||
| Total Investments | 100.9 | |||
| Liabilities in excess of other assets | (0.9 | ) | ||
| Net Assets | 100.0 | % | ||
See Accompanying Notes to Financial Statements
28
U.S. High Yield Bond Fund
Management Team: Douglas G. Forsyth, CFA, Portfolio Manager; William L. Stickney, Portfolio Manager; Justin Kass, CFA, Portfolio Manager; Michael E. Yee, Portfolio Manager
Chief Investment Officer: Horacio A. Valeiras, CFA
Goal: The U.S. High Yield Bond Fund seeks to deliver total return via high current income and capital growth from a diversified portfolio consisting primarily of bonds rated below investment grade.
Market Overview: The Merrill Lynch High Yield Master II Index gained 45.43% in the eight months ended November 30, 2009, outperforming the S&P 500 Index, which rose 39.42%, and the ten-year Treasury, which lost 2.53%. During the period, high-yield investors were treated to one of the fastest investment whipsaws in recent memory. The mantra of “sell everything” that defined the market in late 2008 was exchanged for “buy everything and ask questions later.”
The technical lift was the most prominent cause of the price and spread movement. Buyers chased nearly all issues higher, with increased demand pushing up prices. In addition, the fundamental picture brightened for both the issuers and the economy. Economic indicators improved, earnings reports were generally better than expected and the financial industry stabilized, as proven by many of the largest institutions paying back Troubled Asset Relief Program (TARP) funds.
The trend in the ratio of credit upgrades to downgrades was positive throughout most of the period. New issuance was robust, with companies raising approximately $145 billion in proceeds from 335 issues. Mutual fund flows brought $16.4 billion into the market and, at $28.9 billion year-to-date, fund flows were nearing record highs. The combination of performance, new issuance and demand returned the high-yield market to full functionality.
Performance: The Fund’s Class I shares gained 31.50% during the eight months ended November 30, 2009. The Merrill Lynch High Yield Master II Index rose 45.28%.
Portfolio Specifics: The Fund participated in the majority of the high-yield rally. However, the specific and broad contributors to the index return made it difficult to outperform the index. The lowest priced/distressed issuers were the greatest contributors to benchmark performance, and our underweight in these issuers dragged on our results. However, we believe these weaker credits will ultimately fall in price when investors return to focusing on company fundamentals. In terms of breadth, the index return was spread across an unusually large number of issues. Many of those issues rarely trade; therefore, even if an issue was identified as a good candidate for purchase, the liquidity was not there to build a position.
Notable positive performers in the Fund included two paper companies that rallied on economic strength and the potential for a return to marketing among the major financial institutions. One of the few negative performers was a manufacturer of truck parts that had lagging order trends despite a rebound in the auto industry.
Market Outlook: The outlook for the high-yield market remains positive. The market was oversold, but has rallied and is stabilizing with an upward bias. Spreads, which have narrowed to less than 800 basis points, are now inside prior market-cycle highs, but remain well above the average of the past twenty years. The default rate is declining and will likely continue to move lower. Most strategists have reduced their default expectations to mid-single digits for 2010. As default rate expectations are reduced, investors’ risk appetites increase, resulting in a commensurate drop in spread levels.
We continue to build the Fund one security at a time, by performing rigorous credit analysis to identify companies which are opportunistically capitalizing on change.
| Comparison of Change in Value of a $250,000 Investment in U.S. High Yield Bond Fund Class I Shares with the Merrill Lynch High Yield Master II Index. |
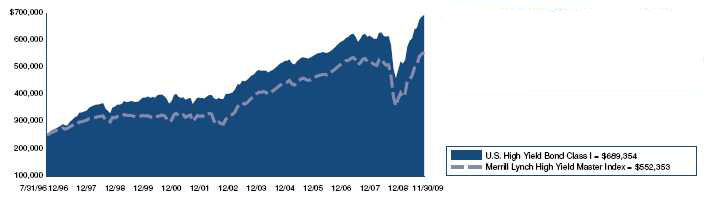
Annualized Total Returns As of 11/30/09 | |||
| 1 Year | 5 Years | 10 Years | |
| U.S. High Yield Bond Class I | 50.89% | 6.00% | 6.13% |
| Merrill Lynch High Yield Master Index | 64.14% | 6.01% | 6.25% |
The graph above shows the value of a hypothetical $250,000 investment in the Fund’s Class I shares compared with the Merrill Lynch High Yield Master II Index for the periods indicated. The Fund’s Class I shares calculate their performance based upon the historical performance of their corresponding series of Nicholas-Applegate Mutual Funds (renamed ING Mutual Funds), adjusted to reflect all fees and expenses applicable to the Fund’s Class I shares. The Nicholas-Applegate Institutional Funds’ Class I shares were first available on May 7, 1999. Average annual total return figures include changes in principal value, reinvested dividends, and capital gain distributions. The total returns shown above do not show the effects of income taxes on an individual’s investment. In most cases, taxes may reduce your actual investment returns on income or gains paid by the Fund or any gains you may realize if you sell your shares. Past performance cannot guarantee future results.
29
U.S. High Yield Bond Fund
The Merrill Lynch High Yield Master II Index is an unmanaged index consisting of U.S. dollar denominated bonds that are issued in countries having a BBB3 or higher debt rating with at least one year remaining until maturity. All bonds must have a credit rating below investment grade but not in default. Unless otherwise noted, index returns reflect the reinvestment of income dividends and capital gains, if any, but do not reflect fees, brokerage commissions or other expenses of investing. One cannot invest directly in an index.
Bond prices, and thus the Fund’s share price, generally move in the opposite direction from interest rates. Since markets can go down as well as up, investment return and principal value will fluctuate with market conditions. You may have a gain or loss when you sell your shares. Further information relating to fund performance, including expense reimbursements, if applicable, is contained in the Financial Highlights section of the prospectus and elsewhere in this report.
30
U.S. High Yield Bond Fund
Schedule of Investments
As of November 30, 2009
| Principal | ||||||||
| Amount | Value | |||||||
| Corporate Bonds - 87.0% | ||||||||
| Aerospace/Defense - 0.4% | ||||||||
| Spirit Aerosystems, Inc. 144A# | ||||||||
| 7.500%, 10/01/17 | $ | 260,000 | $ | 256,100 | ||||
| Aerospace/Defense-Equipment - 1.9% | ||||||||
| BE Aerospace, Inc. | ||||||||
| 8.500%, 07/01/18 | 675,000 | 700,312 | ||||||
| TransDigm, Inc. | ||||||||
| 7.750%, 07/15/14 | 645,000 | 656,288 | ||||||
| 1,356,600 | ||||||||
| Agricultural Chemicals - 1.0% | ||||||||
| Terra Capital, Inc. 144A# | ||||||||
| 7.750%, 11/01/19 | 630,000 | 670,950 | ||||||
| Apparel Manufacturers - 3.0% | ||||||||
| Levi Strauss & Co. | ||||||||
| 9.750%, 01/15/15 | 890,000 | 936,725 | ||||||
| Oxford Industries, Inc. | ||||||||
| 11.375%, 07/15/15 | 495,000 | 542,025 | ||||||
| Quiksilver, Inc. | ||||||||
| 6.875%, 04/15/15 | 770,000 | 592,900 | ||||||
| 2,071,650 | ||||||||
| Auto/Truck Parts & Equipment-Original - 0.8% | ||||||||
| Tenneco, Inc. | ||||||||
| 8.625%, 11/15/14 | 580,000 | 571,300 | ||||||
| Auto/Truck Parts & Equipment-Replacement - 1.4% | ||||||||
| Exide Technologies | ||||||||
| 10.500%, 03/15/13 | 955,000 | 955,000 | ||||||
| Auto-Medium & Heavy Duty Trucks - 0.9% | ||||||||
| Navistar International Corp. | ||||||||
| 8.250%, 11/01/21 | 650,000 | 641,875 | ||||||
| Building Products-Cement/Aggregate - 1.0% | ||||||||
| Texas Industries, Inc. | ||||||||
| 7.250%, 07/15/13 | 695,000 | 675,888 | ||||||
| Building-Residential/Commercial - 2.3% | ||||||||
| DR Horton, Inc. | ||||||||
| 6.500%, 04/15/16 | 630,000 | 607,950 | ||||||
| K Hovnanian Enterprises, Inc. | ||||||||
| 7.500%, 05/15/16 | 825,000 | 598,125 | ||||||
| K Hovnanian Enterprises, Inc. 144A# | ||||||||
| 10.625%, 10/15/16 | 355,000 | 363,875 | ||||||
| 1,569,950 | ||||||||
| Cable/Satellite TV - 3.1% | ||||||||
| Cablevision Systems Corp. 144A# | ||||||||
| 8.625%, 09/15/17 | 595,000 | 612,850 | ||||||
| Echostar DBS Corp. | ||||||||
| 7.125%, 02/01/16 | 800,000 | 796,000 | ||||||
| Mediacom Broadband LLC/Mediacom | ||||||||
| Broadband Corp. | ||||||||
| 8.500%, 10/15/15 | 780,000 | 776,100 | ||||||
| 2,184,950 | ||||||||
| Casino Hotels - 3.5% | ||||||||
| Harrah’s Operating Co., Inc. 144A# | ||||||||
| 10.000%, 12/15/18 | 920,000 | 703,800 | ||||||
| Harrah’s Operating Escrow LLC/Harrah’s | ||||||||
| Escrow Corp. 144A# | ||||||||
| 11.250%, 06/01/17 | 1,045,000 | 1,071,125 | ||||||
| MGM Mirage 144A# | ||||||||
| 11.375%, 03/01/18 | 805,000 | 698,338 | ||||||
| 2,473,263 | ||||||||
| Cellular Telecommunications - 1.7% | ||||||||
| Centennial Communications Corp. | ||||||||
| 10.000%, 01/01/13 | 260,000 | 274,300 | ||||||
| Nextel Communications, Inc. | ||||||||
| 7.375%, 08/01/15 | 965,000 | 897,450 | ||||||
| 1,171,750 | ||||||||
| Chemicals-Specialty - 0.9% | ||||||||
| Ashland, Inc. 144A# | ||||||||
| 9.125%, 06/01/17 | 600,000 | 646,500 | ||||||
| Coal - 0.7% | ||||||||
| Cloud Peak Energy Resources LLC/ | ||||||||
| Cloud Peak Energy Finance Corp. 144A# | ||||||||
| 8.250%, 12/15/17 | 485,000 | 480,150 | ||||||
| Commercial Services - 2.0% | ||||||||
| DI Finance/DynCorp International | ||||||||
| 9.500%, 02/15/13 | 735,000 | 746,025 | ||||||
| Iron Mountain, Inc. | ||||||||
| 8.375%, 08/15/21 | 650,000 | 667,875 | ||||||
| 1,413,900 | ||||||||
| Commercial Services-Finance - 1.4% | ||||||||
| Cardtronics, Inc. | ||||||||
| 9.250%, 08/15/13 | 375,000 | 383,437 | ||||||
| Deluxe Corp. | ||||||||
| 7.375%, 06/01/15 | 595,000 | 577,150 | ||||||
| 960,587 | ||||||||
| Computer Services - 1.4% | ||||||||
| Stream Global Services, Inc. 144A# | ||||||||
| 11.250%, 10/01/14 | 635,000 | 633,413 | ||||||
| Unisys Corp. 144A# | ||||||||
| 12.750%, 10/15/14 | 312,000 | 349,440 | ||||||
| 982,853 | ||||||||
| Consumer Products-Miscellaneous - 0.8% | ||||||||
| Jarden Corp. | ||||||||
| 7.500%, 05/01/17 | 580,000 | 577,100 | ||||||
| Containers-Metal/Glass - 1.6% | ||||||||
| BWAY Corp. 144A# | ||||||||
| 10.000%, 04/15/14 | 525,000 | 552,562 | ||||||
| Crown Americas LLC/Crown Americas | ||||||||
| Capital Corp. | ||||||||
| 7.750%, 11/15/15 | 530,000 | 543,250 | ||||||
| 1,095,812 | ||||||||
| Cosmetics & Toiletries - 1.1% | ||||||||
| Revlon Consumer Products Corp. 144A# | ||||||||
| 9.750%, 11/15/15 | 745,000 | 757,106 | ||||||
| Data Processing/Management - 1.2% | ||||||||
| First Data Corp. | ||||||||
| 9.875%, 09/24/15 | 935,000 | 836,825 | ||||||
| Direct Marketing - 1.0% | ||||||||
| Affinion Group, Inc. | ||||||||
| 11.500%, 10/15/15 | 685,000 | 715,825 | ||||||
| Distribution/Wholesale - 0.5% | ||||||||
| KAR Holdings, Inc. | ||||||||
| 8.750%, 05/01/14 | 345,000 | 363,975 | ||||||
| Diversified Banking Institution - 1.6% | ||||||||
| GMAC LLC 144A# | ||||||||
| 6.750%, 12/01/14 | 1,222,000 | 1,105,910 | ||||||
| Diversified Manufacturing Operations - 0.8% | ||||||||
| Harland Clarke Holdings Corp. | ||||||||
| 9.500%, 05/15/15 | 595,000 | 561,531 | ||||||
See Accompanying Notes to Financial Statements
31
U.S. High Yield Bond Fund
Schedule of Investments
As of November 30, 2009
Principal Amount | Value | |||||||
| Diversified Operations - 2.0% | ||||||||
| Kansas City Southern Railway | ||||||||
| 8.000%, 06/01/15 | $ | 670,000 | $ | 685,912 | ||||
| Kansas City Southern Railway | ||||||||
| 13.000%, 12/15/13 | 175,000 | 202,125 | ||||||
| Reynolds Group DL Escrow, Inc./ | ||||||||
| Reynolds Group Escrow LLC 144A# | ||||||||
| 7.750%, 10/15/16 | 470,000 | 477,050 | ||||||
| 1,365,087 | ||||||||
| Diversified Operations/Commercial Services - 0.2% | ||||||||
| ARAMARK Corp. | ||||||||
| 8.500%, 02/01/15 | 165,000 | 166,238 | ||||||
| Electric-Generation - 0.8% | ||||||||
| Edison Mission Energy | ||||||||
| 7.000%, 05/15/17 | 750,000 | 551,250 | ||||||
| Electronic Components-Miscellaneous - 0.9% | ||||||||
| Sanmina-SCI Corp. | ||||||||
| 8.125%, 03/01/16 | 610,000 | 596,275 | ||||||
| Electronic Components-Semiconductors - 1.5% | ||||||||
| Advanced Micro Devices, Inc. 144A# | ||||||||
| 8.125%, 12/15/17 | 250,000 | 237,188 | ||||||
| Amkor Technology, Inc. | ||||||||
| 9.250%, 06/01/16 | 800,000 | 828,000 | ||||||
| 1,065,188 | ||||||||
| Filtration/Separation Products - 0.8% | ||||||||
| Polypore, Inc. | ||||||||
| 8.750%, 05/15/12 | 545,000 | 540,913 | ||||||
| Finance-Auto Loans - 1.8% | ||||||||
| Ford Motor Credit Co. LLC | ||||||||
| 7.000%, 10/01/13 | 670,000 | 654,599 | ||||||
| Ford Motor Credit Co. LLC | ||||||||
| 9.875%, 08/10/11 | 565,000 | 586,586 | ||||||
| 1,241,185 | ||||||||
| Finance-Consumer Loans - 0.6% | ||||||||
| American General Finance Corp. | ||||||||
| 6.900%, 12/15/17 | 620,000 | 435,811 | ||||||
| Machinery-Construction & Mining - 0.7% | ||||||||
| Terex Corp. | ||||||||
| 7.375%, 01/15/14 | 490,000 | 483,875 | ||||||
| Machinery-Electrical - 1.0% | ||||||||
| Baldor Electric Co. | ||||||||
| 8.625%, 02/15/17 | 695,000 | 712,375 | ||||||
| Machinery-Farm - 1.0% | ||||||||
| Case New Holland, Inc. 144A# | ||||||||
| 7.750%, 09/01/13 | 700,000 | 701,750 | ||||||
| Medical-Drugs - 0.4% | ||||||||
| Valeant Pharmaceuticals International 144A# | ||||||||
| 8.375%, 06/15/16 | 240,000 | 248,400 | ||||||
| Medical-Hospitals - 3.4% | ||||||||
| AMR HoldCo, Inc./EmCare HoldCo, Inc. | ||||||||
| 10.000%, 02/15/15 | 610,000 | 643,550 | ||||||
| Community Health Systems, Inc. | ||||||||
| 8.875%, 07/15/15 | 840,000 | 858,900 | ||||||
| HCA, Inc. | ||||||||
| 9.250%, 11/15/16 | 810,000 | 858,600 | ||||||
| 2,361,050 | ||||||||
| Medical-Nursing Homes - 1.1% | ||||||||
| Sun Healthcare Group, Inc. | ||||||||
| 9.125%, 04/15/15 | 755,000 | 762,550 | ||||||
| Medical-Outpatient/Home Medical Care - 2.0% | ||||||||
| Apria Healthcare Group, Inc. 144A# | ||||||||
| 11.250%, 11/01/14 | 570,000 | 627,000 | ||||||
| Res-Care, Inc. | ||||||||
| 7.750%, 10/15/13 | 770,000 | 770,000 | ||||||
| 1,397,000 | ||||||||
| Multi-line Insurance - 0.3% | ||||||||
| American International Group, Inc. | ||||||||
| 8.175%, 05/15/58 | 385,000 | 222,338 | ||||||
| Oil Companies-Exploration & Production - 3.8% | ||||||||
| Chesapeake Energy Corp. | ||||||||
| 6.875%, 01/15/16 | 835,000 | 805,775 | ||||||
| Mariner Energy, Inc. | ||||||||
| 11.750%, 06/30/16 | 405,000 | 448,538 | ||||||
| PetroHawk Energy Corp. | ||||||||
| 7.875%, 06/01/15 | 790,000 | 791,975 | ||||||
| SandRidge Energy, Inc. 144A# | ||||||||
| 8.000%, 06/01/18 | 635,000 | 601,662 | ||||||
| 2,647,950 | ||||||||
| Oil-Field Services - 1.0% | ||||||||
| Allis-Chalmers Energy, Inc. | ||||||||
| 9.000%, 01/15/14 | 810,000 | 716,850 | ||||||
| Paper & Related Products - 2.2% | ||||||||
| Neenah Paper, Inc. | ||||||||
| 7.375%, 11/15/14 | 790,000 | 699,150 | ||||||
| NewPage Corp. 144A# | ||||||||
| 11.375%, 12/31/14 | 875,000 | 866,250 | ||||||
| 1,565,400 | ||||||||
| Pipelines - 1.5% | ||||||||
| Dynegy Holdings, Inc. | ||||||||
| 7.750%, 06/01/19 | 760,000 | 625,100 | ||||||
| El Paso Corp. | ||||||||
| 8.250%, 02/15/16 | 395,000 | 410,800 | ||||||
| 1,035,900 | ||||||||
| Printing-Commercial - 0.9% | ||||||||
| Cenveo Corp. | ||||||||
| 7.875%, 12/01/13 | 680,000 | 626,450 | ||||||
| Quarrying - 0.9% | ||||||||
| Compass Minerals International, Inc. 144A# | ||||||||
| 8.000%, 06/01/19 | 575,000 | 608,062 | ||||||
| Radio - 0.9% | ||||||||
| Salem Communications Corp. 144A# | ||||||||
| 9.625%, 12/15/16 | 590,000 | 604,750 | ||||||
| Real Estate Management/Service - 0.8% | ||||||||
| CB Richard Ellis Services, Inc. | ||||||||
| 11.625%, 06/15/17 | 485,000 | 538,350 | ||||||
| Rental Auto/Equipment - 2.6% | ||||||||
| Avis Budget Car Rental LLC/Avis | ||||||||
| Budget Finance, Inc. | ||||||||
| 7.750%, 05/15/16 | 765,000 | 688,500 | ||||||
| Hertz Corp. | ||||||||
| 10.500%, 01/01/16 | 590,000 | 616,550 | ||||||
| RSC Equipment Rental, Inc. | ||||||||
| 9.500%, 12/01/14 | 420,000 | 413,175 | ||||||
| United Rentals North America, Inc. 144A# | ||||||||
| 10.875%, 06/15/16 | 105,000 | 112,088 | ||||||
| 1,830,313 | ||||||||
See Accompanying Notes to Financial Statements
32
Schedule of Investments
As of November 30, 2009
Principal Amount | Value | |||||||
| Retail-Apparel/Shoe - 1.5% | ||||||||
| Brown Shoe Co., Inc. | ||||||||
| 8.750%, 05/01/12 | $ | 555,000 | $ | 560,550 | ||||
| Phillips-Van Heusen Corp. | ||||||||
| 8.125%, 05/01/13 | 500,000 | 511,250 | ||||||
| 1,071,800 | ||||||||
| Retail-Computer Equipment - 0.8% | ||||||||
| GameStop Corp./GameStop, Inc. | ||||||||
| 8.000%, 10/01/12 | 520,000 | 537,550 | ||||||
| Retail-Drug Store - 0.8% | ||||||||
| Rite Aid Corp. | ||||||||
| 7.500%, 03/01/17 | 640,000 | 582,400 | ||||||
| Retail-Propane Distribution - 1.2% | ||||||||
| Inergy LP/Inergy Finance Corp. | ||||||||
| 8.250%, 03/01/16 | 845,000 | 855,562 | ||||||
| Retail-Regional Department Stores - 0.4% | ||||||||
| The Neiman Marcus Group, Inc. | ||||||||
| 10.375%, 10/15/15 | 275,000 | 249,562 | ||||||
| Satellite Telecommunications - 2.4% | ||||||||
| DigitalGlobe, Inc. 144A# | ||||||||
| 10.500%, 05/01/14 | 850,000 | 913,750 | ||||||
| Hughes Network Systems LLC/HNS | ||||||||
| Finance Corp. | ||||||||
| 9.500%, 04/15/14 | 740,000 | 751,100 | ||||||
| 1,664,850 | ||||||||
| Steel-Producers - 0.8% | ||||||||
| Steel Dynamics, Inc. | ||||||||
| 7.375%, 11/01/12 | 565,000 | 566,413 | ||||||
| Super-Regional Banks-US - 0.6% | ||||||||
| BAC Capital Trust XI | ||||||||
| 6.625%, 05/23/36 | 530,000 | 446,495 | ||||||
| Telecommunications Services - 2.6% | ||||||||
| MasTec, Inc. | ||||||||
| 7.625%, 02/01/17 | 655,000 | 625,525 | ||||||
| Time Warner Telecom Holdings, Inc. | ||||||||
| 9.250%, 02/15/14 | 585,000 | 604,013 | ||||||
| West Corp. | ||||||||
| 11.000%, 10/15/16 | 585,000 | 592,312 | ||||||
| 1,821,850 | ||||||||
| Telephone-Integrated - 3.0% | ||||||||
| Cincinnati Bell, Inc. | ||||||||
| 8.375%, 01/15/14 | 880,000 | 878,900 | ||||||
| Sprint Capital Corp. | ||||||||
| 8.375%, 03/15/12 | 350,000 | 359,625 | ||||||
| Windstream Corp. | ||||||||
| 8.625%, 08/01/16 | 820,000 | 830,250 | ||||||
| 2,068,775 | ||||||||
| Travel Services - 1.1% | ||||||||
| Travelport LLC | ||||||||
| 9.875%, 09/01/14 | 785,000 | 788,925 | ||||||
| Web Hosting/Design - 1.0% | ||||||||
| Terremark Worldwide, Inc. 144A# | ||||||||
| 12.000%, 06/15/17 | 610,000 | 668,712 | ||||||
| Wire & Cable Products - 0.9% | ||||||||
| General Cable Corp. | ||||||||
| 7.125%, 04/01/17 | 620,000 | 602,950 | ||||||
| Wireless Equipment - 0.8% | ||||||||
| Crown Castle International Corp. | ||||||||
| 9.000%, 01/15/15 | 520,000 | 552,500 | ||||||
| Total US Corporate Bonds (Cost: $57,265,823) | 60,601,004 | |||||||
| Foreign Corporate Bonds - 8.8% | ||||||||
| Cellular Telecommunications - 1.4% | ||||||||
| Millicom international Cellular SA | ||||||||
| 10.000%, 12/01/13 | 955,000 | 989,619 | ||||||
| Cruise Lines - 1.8% | ||||||||
| NCL Corp., Ltd. 144A# | ||||||||
| 11.750%, 11/15/16 | 520,000 | 515,450 | ||||||
| Royal Carribean Cruises | ||||||||
| 11.875%, 07/15/15 | 625,000 | 703,125 | ||||||
| 1,218,575 | ||||||||
| Marine Services - 0.9% | ||||||||
| Trico Shipping AS 144A# | ||||||||
| 11.875%, 11/01/14 | 615,000 | 626,531 | ||||||
| Metal-Aluminum - 0.9% | ||||||||
| Novelis, Inc. 144A# | ||||||||
| 11.500%, 02/15/15 | 620,000 | 647,900 | ||||||
| Oil Companies-Exploration & Production - 0.9% | ||||||||
| OPTI Canada, Inc. | ||||||||
| 8.250%, 12/15/14 | 750,000 | 603,750 | ||||||
| Satellite Telecommunications - 1.1% | ||||||||
| Intelsat Jackson Holdings, Ltd. | ||||||||
| 9.500%, 06/15/16 | 735,000 | 772,669 | ||||||
| Telecommunications Services - 1.0% | ||||||||
| Global Crossing, Ltd. 144A# | ||||||||
| 12.000%, 09/15/15 | 650,000 | 695,500 | ||||||
| Transport-Marine - 0.8% | ||||||||
| General Maritime Corp. 144A# | ||||||||
| 12.000%, 11/15/17 | 535,000 | 557,737 | ||||||
| Total Foreign Corporate Bonds (Cost: $5,620,165) | 6,112,281 | |||||||
| Agency Bond - 1.0% | ||||||||
| Finance-Consumer Loans - 1.0% | ||||||||
| SLM Corp., 8.450%, 06/15/18 | ||||||||
| (Cost: $697,008) | 800,000 | 723,690 | ||||||
| 723,690 | ||||||||
| Short Term Investments - 3.1% | ||||||||
| Time Deposit - 3.1% | ||||||||
| Citibank London | ||||||||
| 0.030%, 12/01/09 (Cost: $2,166,261) | 2,166,261 | 2,166,261 | ||||||
| Total Investments - 99.9% (Cost: $65,749,257) | 69,603,236 | |||||||
| Other Assets in Excess of Liabilities - 0.1% | 63,756 | |||||||
| Net Assets - 100.0% | $ | 69,666,992 | ||||||
| # | 144A Security. Certain condition for public sale may exist. The total market value of 144A securities owned at November 30, 2009 was $18,611,899 or 26.72% of net assets. |
See Accompanying Notes to Financial Statements
33
U.S. High Yield Bond Fund
Schedule of Investments
As of November 30, 2009
| Schedule of Investments by Sector | ||||
| as of November 30, 2009 | ||||
| Percent of | ||||
| Sector | Net Assets | |||
| Consumer, Cyclical | 20.0 | % | ||
| Communications | 20.0 | |||
| Consumer, Non-cyclical | 16.8 | |||
| Industrial | 11.7 | |||
| Energy | 7.9 | |||
| Basic Materials | 6.8 | |||
| Financial | 6.8 | |||
| Technology | 4.1 | |||
| Diversified | 2.0 | |||
| Utilities | 0.8 | |||
| Short Term Investments | 3.1 | |||
| Total Investments | 99.9 | |||
| Other assets in excess of liabilities | 0.1 | |||
| Net Assets | 100.0 | % | ||
See Accompanying Notes to Financial Statements
34
(This page intentionally left blank)
35
Nicholas-Applegate Institutional Funds
Financial Highlights
For a Class I share outstanding during the period indicated
| Distributions from: | ||||||||||||||||||||||||
Net Asset Value, Beginning | Net Investment Income (Loss) (1) | Net Realized and Unrealized Gain (Loss) | Total from Investments Operations | Net Investment Income | Net Realized Capital Gains | |||||||||||||||||||
| U.S. EQUITY FUNDS | ||||||||||||||||||||||||
| U.S. ULTRA MICRO CAP | ||||||||||||||||||||||||
| For the period ended 11/30/09 | $ | 5.78 | $ | (0.10 | ) | $ | 3.25 | $ | 3.15 | $ | — | $ | — | |||||||||||
| For the year ended 03/31/09 | 9.28 | (0.16 | ) | (3.34 | ) | (3.50 | ) | — | — | |||||||||||||||
| 1/28/08 (Commenced) to 03/31/08 | 10.00 | (0.03 | ) | (0.69 | ) | (0.72 | ) | — | — | |||||||||||||||
| U.S. MICRO CAP | ||||||||||||||||||||||||
| For the period ended 11/30/09 | $ | 7.58 | $ | (0.07 | ) | $ | 2.93 | $ | 2.86 | $ | — | $ | — | |||||||||||
| For the year ended 03/31/09 | 11.60 | (0.07 | ) | (3.95 | ) | (4.02 | ) | — | (0.00 | )(7) | ||||||||||||||
| For the year ended 03/31/08 | 15.33 | (0.18 | ) | (1.49 | ) | (1.67 | ) | — | (2.06 | ) | ||||||||||||||
| For the year ended 03/31/07 | 17.43 | (0.12 | ) | (0.19 | ) | (0.31 | ) | — | (1.79 | ) | ||||||||||||||
| For the year ended 03/31/06 | 12.83 | (0.11 | ) | 5.06 | 4.95 | — | (0.35 | ) | ||||||||||||||||
| For the year ended 03/31/05 | 14.69 | (0.09 | ) | (1.09 | ) | (1.18 | ) | — | (0.68 | ) | ||||||||||||||
| U.S. EMERGING GROWTH | ||||||||||||||||||||||||
| For the period ended 11/30/09 | $ | 6.59 | $ | (0.03 | ) | $ | 3.49 | $ | 3.46 | $ | — | $ | — | |||||||||||
| For the year ended 03/31/09 | 11.45 | (0.04 | ) | (4.82 | )(5) | (4.86 | ) | — | — | |||||||||||||||
| For the year ended 03/31/08 | 13.09 | (0.06 | ) | (0.70 | )(5) | (0.76 | ) | — | (0.88 | ) | ||||||||||||||
| For the year ended 03/31/07 | 13.90 | (0.07 | ) | 0.19 | (5) | 0.12 | — | (0.93 | ) | |||||||||||||||
| For the year ended 03/31/06 | 9.77 | (0.11 | ) | 4.25 | 4.14 | — | (0.01 | ) | ||||||||||||||||
| For the year ended 03/31/05 | 9.61 | (0.07 | ) | 0.23 | 0.16 | — | — | |||||||||||||||||
| U.S. SMALL TO MID CAP GROWTH | ||||||||||||||||||||||||
| For the period ended 11/30/09 | $ | 5.42 | $ | (0.01 | ) | $ | 2.57 | $ | 2.56 | $ | — | $ | — | |||||||||||
| For the year ended 03/31/09 | 9.02 | (0.03 | ) | (3.57 | ) | (3.60 | ) | — | — | |||||||||||||||
| 7/31/07 (Commenced) to 03/31/08 | 10.00 | (0.03 | ) | (0.95 | ) | (0.98 | ) | — | — | |||||||||||||||
| U.S. CONVERTIBLE | ||||||||||||||||||||||||
| For the period ended 11/30/09 | $ | 19.01 | $ | 0.50 | $ | 4.77 | $ | 5.27 | $ | (0.36 | ) | $ | — | |||||||||||
| For the year ended 03/31/09 | 24.88 | 0.43 | (5.73 | )(5) | (5.30 | ) | (0.43 | ) | (0.14 | ) | ||||||||||||||
| For the year ended 03/31/08 | 24.35 | 0.37 | 0.58 | 0.95 | (0.32 | ) | (0.10 | ) | ||||||||||||||||
| For the year ended 03/31/07 | 24.57 | 0.45 | 2.03 | 2.48 | (0.47 | ) | (2.23 | ) | ||||||||||||||||
| For the year ended 03/31/06 | 22.44 | 0.27 | 3.45 | 3.72 | (0.55 | ) | (1.04 | ) | ||||||||||||||||
| For the year ended 03/31/05 | 23.11 | 0.39 | 0.66 | 1.05 | (0.45 | ) | (1.27 | ) | ||||||||||||||||
| (1) | Net investment income per share is calculated by dividing net investment income for the period by the average shares outstanding during the period. |
| (2) | Total returns are not annualized for periods less than one year. |
| (3) | Ratios are annualized for periods of less than one year. Expense reimbursements reflect voluntary reductions of total expenses. Such amounts would increase net investment income (loss) ratios had such reductions not occurred. |
| (4) | Net expenses include certain items not subject to expense reimbursement for periods prior to January 23, 2006. |
See Accompanying Notes to Financial Statements
36
| Ratios to Average Net Assets (3) | |||||||||||||||||||||||||||||||||||||||
Total Distributions | Net Asset Value, Ending | Total Return (2) | Net Assets, Ending (in 000’s) | Net Investment Income (Loss) | Total Expenses | Expenses (Reimbursements)/ Recoupment | Expenses Net of Reimbursement/ Recoupment | Expenses Net of Reimbursement/ Recoupment Offset (4) | Fund’s Portfolio Turnover Rate | ||||||||||||||||||||||||||||||
| $ | — | $ | 8.93 | 54.50 | % | $ | 1,781 | (1.81 | %) | 2.31 | % | — | 2.31 | % | 2.22 | % | 87 | % | |||||||||||||||||||||
| — | 5.78 | (37.72 | %) | 1,084 | (2.05 | %) | 2.40 | % | — | 2.40 | % | 2.31 | % | 109 | % | ||||||||||||||||||||||||
| — | 9.28 | (7.20 | %)(6) | 886 | (2.10 | %) | 2.31 | % | — | 2.31 | % | 2.15 | % | 19 | % | ||||||||||||||||||||||||
| $ | — | $ | 10.44 | 37.73 | % | $ | 53,994 | (1.14 | %) | 1.55 | % | — | 1.55 | % | 1.53 | % | 86 | % | |||||||||||||||||||||
| (0.00 | )(7) | 7.58 | (34.63 | %) | 40,178 | (0.64 | %) | 1.58 | % | — | 1.58 | % | 0.91 | % | 104 | % | |||||||||||||||||||||||
| (2.06 | ) | 11.60 | (13.25 | %) | 60,122 | (1.19 | %) | 1.58 | % | — | 1.58 | % | 1.38 | % | 139 | % | |||||||||||||||||||||||
| (1.79 | ) | 15.33 | (1.35 | %) | 84,405 | (0.75 | %) | 1.58 | % | — | 1.58 | % | 1.19 | % | 165 | % | |||||||||||||||||||||||
| (0.35 | ) | 17.43 | 39.04 | % | 78,058 | (0.78 | %) | 1.64 | % | (0.07 | %) | 1.57 | % | 1.10 | % | 180 | % | ||||||||||||||||||||||
| (0.68 | ) | 12.83 | (8.17 | %) | 69,246 | (0.72 | %) | 1.63 | % | (0.07 | %) | 1.56 | % | 1.12 | % | 266 | % | ||||||||||||||||||||||
| $ | — | $ | 10.05 | 52.50 | % | $ | 13,942 | (0.53 | %) | 1.18 | % | — | 1.18 | % | 1.16 | % | 97 | % | |||||||||||||||||||||
| — | 6.59 | (42.45 | %) | 6,591 | (0.34 | %) | 1.21 | % | — | 1.21 | % | 0.90 | % | 146 | % | ||||||||||||||||||||||||
| (0.88 | ) | 11.45 | (7.01 | %) | 7,499 | (0.46 | %) | 1.21 | % | — | 1.21 | % | 0.72 | % | 129 | % | |||||||||||||||||||||||
| (0.93 | ) | 13.09 | 1.30 | % | 7,409 | (0.54 | %) | 1.21 | % | — | 1.21 | % | 0.72 | % | 148 | % | |||||||||||||||||||||||
| (0.01 | ) | 13.90 | 42.38 | % | 6,721 | (1.04 | %) | 1.89 | % | (0.39 | %) | 1.50 | % | 1.17 | % | 128 | % | ||||||||||||||||||||||
| — | 9.77 | 1.66 | % | 12,043 | (0.75 | %) | 1.63 | % | (0.17 | %) | 1.46 | % | 1.06 | % | 142 | % | |||||||||||||||||||||||
| $ | — | $ | 7.98 | 47.23 | % | $ | 4,561 | (0.21 | %) | 0.95 | % | — | 0.95 | % | 0.91 | % | 119 | % | |||||||||||||||||||||
| — | 5.42 | (39.91 | %) | 3,102 | (0.44 | %) | 0.97 | % | — | 0.97 | % | 0.81 | % | 179 | % | ||||||||||||||||||||||||
| — | 9.02 | (9.80 | %)(6) | 4,862 | (0.50 | %) | 0.95 | % | — | 0.95 | % | 0.80 | % | 105 | % | ||||||||||||||||||||||||
| $ | (0.36 | ) | $ | 23.92 | 27.85 | % | $ | 64,996 | 3.34 | % | 1.00 | % | — | 1.00 | % | 0.99 | % | 84 | % | ||||||||||||||||||||
| (0.57 | ) | 19.01 | (21.30 | %) | 20,664 | 1.86 | % | 1.03 | % | — | 1.03 | % | 0.98 | % | 91 | % | |||||||||||||||||||||||
| (0.42 | ) | 24.88 | 3.84 | % | 47,773 | 1.45 | % | 1.03 | % | — | 1.03 | % | 0.89 | % | 98 | % | |||||||||||||||||||||||
| (2.70 | ) | 24.35 | 10.79 | % | 39,022 | 1.89 | % | 1.02 | % | — | 1.02 | % | 0.85 | % | 92 | % | |||||||||||||||||||||||
| (1.59 | ) | 24.57 | 17.15 | % | 31,627 | 1.02 | % | 1.14 | % | (0.11 | %) | 1.03 | % | 0.87 | % | 92 | % | ||||||||||||||||||||||
| (1.72 | ) | 22.44 | 4.62 | % | 35,397 | 1.68 | % | 1.10 | % | (0.08 | %) | 1.02 | % | 0.85 | % | 102 | % | ||||||||||||||||||||||
| (5) | Includes litigation proceeds of approximately $0.03 per share for the U.S. Micro Cap Fund during the fiscal year ended 2009, and $0.07 and $0.06 per share for the U.S. Emerging Growth Fund during the fiscal year for 2008 and 2009, respectively. For the U.S. Convertible Fund during the fiscal year ended 2009, litigation proceeds were less than $0.01 per share. The U.S. Emerging Growth Fund received $28,454 from a security litigation settlement for the fiscal year ended 2007 which is reflected in realized gains. The event had a $0.05 per share impact to the fund. |
| (6) | Inception to date return. |
| (7) | Less than one penny per share. |
37
Nicholas-Applegate Institutional Funds
Financial Highlights
For a Class I share outstanding during the period indicated
| Distributions from: | ||||||||||||||||||||||||
Net Asset Value, Beginning | Net Investment Income (Loss) (1) | Net Realized and Unrealized Gain (Loss) | Total from Investments Operations | Net Investment Income | Net Realized Capital Gains | |||||||||||||||||||
| GLOBAL EQUITY FUNDS | ||||||||||||||||||||||||
| INTERNATIONAL GROWTH OPPORTUNITIES | ||||||||||||||||||||||||
| For the period ended 11/30/09 | $ | 16.29 | $ | 0.14 | $ | 9.43 | $ | 9.57 | $ | — | $ | — | ||||||||||||
| For the year ended 03/31/09 | 40.10 | 0.33 | (19.44 | ) | (19.11 | ) | — | (4.70 | ) | |||||||||||||||
| For the year ended 03/31/08 | 57.36 | 0.14 | 3.43 | 3.57 | (1.26 | ) | (19.56 | ) | ||||||||||||||||
| For the year ended 03/31/07 | 49.86 | 0.05 | 9.07 | 9.12 | — | (1.62 | ) | |||||||||||||||||
| For the year ended 03/31/06 | 35.01 | (0.01 | ) | 15.10 | 15.09 | (0.24 | ) | — | ||||||||||||||||
| For the year ended 03/31/05 | 29.43 | 0.32 | 5.35 | 5.67 | (0.09 | ) | — | |||||||||||||||||
| U.S. HIGH YIELD BOND | ||||||||||||||||||||||||
| For the period ended 11/30/09 | $ | 7.40 | $ | 0.52 | $ | 1.77 | $ | 2.29 | $ | (0.52 | ) | $ | — | |||||||||||
| For the year ended 03/31/09 | 9.36 | 0.71 | (1.90 | ) | (1.19 | ) | (0.77 | ) | — | |||||||||||||||
| For the year ended 03/31/08 | 10.27 | 0.76 | (0.86 | ) | (0.10 | ) | (0.81 | ) | — | |||||||||||||||
| For the year ended 03/31/07 | 10.00 | 0.73 | 0.30 | 1.03 | (0.76 | ) | — | |||||||||||||||||
| For the year ended 03/31/06 | 10.04 | 0.70 | 0.02 | 0.72 | (0.76 | ) | — | |||||||||||||||||
| For the year ended 03/31/05 | 10.34 | 0.85 | (0.31 | ) | 0.54 | (0.84 | ) | (0.00 | )(5) | |||||||||||||||
| (1) | Net investment income per share is calculated by dividing net investment income for the period by the average shares outstanding during the period. |
| (2) | Total returns are not annualized for periods less than one year. |
| (3) | Ratios are annualized for periods of less than one year. Expense reimbursements reflect voluntary reductions of total expenses. Such amounts would increase net investment income (loss) ratios had such reductions not occurred. |
| (4) | Net expenses include certain items not subject to expense reimbursement for periods prior to January 23, 2006. |
See Accompanying Notes to Financial Statements
38
| Ratios to Average Net Assets (3) | |||||||||||||||||||||||||||||||||||||||
Total Distributions | Net Asset Value, Ending | Total Return (2) | Net Assets, Ending (in 000’s) | Net Investment Income (Loss) | Total Expenses | Expenses (Reimbursements)/ Recoupment | Expenses Net of Reimbursement/ Recoupment | Expenses Net of Reimbursement/ Recoupment Offset (4) | Fund’s Portfolio Turnover Rate | ||||||||||||||||||||||||||||||
| $ | — | $ | 25.86 | 58.75 | % | $ | 66,137 | 0.90 | % | 1.41 | % | — | 1.41 | % | 1.41 | % | 64 | % | |||||||||||||||||||||
| (4.70 | ) | 16.29 | (48.16 | %) | 39,680 | 1.14 | % | 1.44 | % | — | 1.44 | % | 1.17 | % | 106 | % | |||||||||||||||||||||||
| (20.83 | ) | 40.10 | 2.74 | % | 113,239 | 0.26 | % | 1.44 | % | — | 1.44 | % | 1.13 | % | 86 | % | |||||||||||||||||||||||
| (1.62 | ) | 57.36 | 18.71 | % | 104,003 | 0.09 | % | 1.43 | % | — | 1.43 | % | 1.18 | % | 127 | % | |||||||||||||||||||||||
| (0.24 | ) | 49.86 | 43.34 | % | 107,749 | (0.02 | %) | 1.38 | % | 0.00 | % | 1.38 | % | 1.07 | % | 168 | % | ||||||||||||||||||||||
| (0.09 | ) | 35.01 | 19.28 | % | 55,462 | 1.05 | % | 1.42 | % | 0.00 | % | 1.42 | % | 1.11 | % | 110 | % | ||||||||||||||||||||||
| $ | (0.52 | ) | $ | 9.17 | 31.50 | % | $ | 69,667 | 9.08 | % | 0.61 | % | — | 0.61 | % | 0.61 | % | 120 | % | ||||||||||||||||||||
| (0.77 | ) | 7.40 | (13.01 | %) | 49,233 | 8.56 | % | 0.64 | % | — | 0.64 | % | 0.61 | % | 55 | % | |||||||||||||||||||||||
| (0.81 | ) | 9.36 | (1.06 | %) | 50,271 | 7.66 | % | 0.63 | % | — | 0.63 | % | 0.57 | % | 81 | % | |||||||||||||||||||||||
| (0.76 | ) | 10.27 | 10.76 | % | 63,925 | 7.21 | % | 0.64 | % | — | 0.64 | % | 0.52 | %(6) | 92 | % | |||||||||||||||||||||||
| (0.76 | ) | 10.00 | 7.40 | % | 81,187 | 6.70 | % | 0.82 | % | (0.18 | %) | 0.64 | % | 0.56 | % | 112 | % | ||||||||||||||||||||||
| (0.84 | ) | 10.04 | 5.40 | % | 131,677 | 7.82 | % | 0.82 | % | (0.19 | %) | 0.63 | % | 0.60 | % | 123 | % | ||||||||||||||||||||||
| (5) | Less than one penny per share. |
| (6) | For the year ended March 31, 2007, ratios do not include one time expense credit. Had this credit been included, the expense ratios would have been decreased by 0.07%. |
39
Nicholas-Applegate Institutional Funds
Financial Highlights
For a Class II share outstanding during the period indicated
| Distributions from: | ||||||||||||||||||||||||
Net Asset Value, Beginning | Net Investment Income (1) | Net Realized and Unrealized Gain (Loss) | Total from Investments Operations | Net Investment Income | Net Realized Capital Gains | |||||||||||||||||||
| U.S. EQUITY FUNDS | ||||||||||||||||||||||||
| U.S. CONVERTIBLE | ||||||||||||||||||||||||
| For the period ended 11/30/09 | $ | 19.02 | $ | 0.51 | $ | 4.78 | $ | 5.29 | $ | (0.36 | ) | $ | — | |||||||||||
| For the year ended 03/31/09 | 24.88 | 0.53 | (5.80 | )(5) | (5.27 | ) | (0.45 | ) | (0.14 | ) | ||||||||||||||
| For the year ended 03/31/08 | 24.36 | 0.41 | 0.56 | 0.97 | (0.35 | ) | (0.10 | ) | ||||||||||||||||
| For the year ended 03/31/07 | 24.58 | 0.47 | 2.04 | 2.51 | (0.50 | ) | (2.23 | ) | ||||||||||||||||
| 9/30/05 (Commenced) to 03/31/06 | 23.97 | 0.30 | (1) | 1.63 | 1.93 | (0.28 | ) | (1.04 | ) | |||||||||||||||
| GLOBAL EQUITY FUNDS | ||||||||||||||||||||||||
| INTERNATIONAL GROWTH OPPORTUNITIES | ||||||||||||||||||||||||
| For the period ended 11/30/09 | $ | 16.93 | $ | 0.17 | $ | 9.81 | $ | 9.98 | $ | — | $ | — | ||||||||||||
| For the year ended 03/31/09 | 41.28 | 0.34 | (19.99 | ) | (19.65 | ) | — | (4.70 | ) | |||||||||||||||
| For the year ended 03/31/08 | 57.63 | 0.39 | 3.17 | 3.56 | (0.35 | ) | (19.56 | ) | ||||||||||||||||
| For the year ended 03/31/07 | 50.01 | 0.02 | 9.22 | 9.24 | — | (1.62 | ) | |||||||||||||||||
| For the year ended 03/31/06 | 35.02 | 0.13 | 15.06 | 15.19 | (0.20 | ) | — | |||||||||||||||||
| For the year ended 03/31/05 | 29.47 | 0.38 | 5.32 | 5.70 | (0.15 | ) | — | |||||||||||||||||
| (1) | Net investment income per share is calculated by dividing net investment income for the period by the average shares outstanding during the period. |
| (2) | Total returns are not annualized for periods less than one year. |
| (3) | Ratios are annualized for periods of less than one year. Expense reimbursements reflect voluntary reductions of total expenses. Such amounts would increase net investment income (loss) ratios had such reductions not occurred. |
| (4) | Net expenses include certain items not subject to expense reimbursement for periods prior to January 23, 2006. |
See Accompanying Notes to Financial Statements
40
| Ratios to Average Net Assets (3) | |||||||||||||||||||||||||||||||||||||||
Total Distributions | Net Asset Value, Ending | Total Return (2) | Net Assets, Ending (in 000’s) | Net Investment Income | Total Expenses | Expenses (Reimbursements)/ Recoupment | Expenses Net of Reimbursement/ Recoupment | Expenses Net of Reimbursement/ Recoupment Offset (4) | Fund’s Portfolio Turnover Rate | ||||||||||||||||||||||||||||||
| $ | (0.36 | ) | $ | 23.95 | 27.95 | % | $ | 37,823 | 3.46 | % | 0.90 | % | — | 0.90 | % | 0.89 | % | 84 | % | ||||||||||||||||||||
| (0.59 | ) | 19.02 | (21.21 | %) | 29,568 | 2.51 | % | 0.93 | % | — | 0.93 | % | 0.88 | % | 91 | % | |||||||||||||||||||||||
| (0.45 | ) | 24.88 | 3.91 | % | 9,103 | 1.58 | % | 0.93 | % | — | 0.93 | % | 0.79 | % | 98 | % | |||||||||||||||||||||||
| (2.73 | ) | 24.36 | 10.92 | % | 7,880 | 2.05 | % | 0.92 | % | — | 0.92 | % | 0.75 | % | 92 | % | |||||||||||||||||||||||
| (1.32 | ) | 24.58 | 8.47 | %(6) | 3,634 | 2.26 | % | 1.01 | % | (0.09 | %) | 0.92 | % | 0.77 | % | 92 | % | ||||||||||||||||||||||
| $ | — | $ | 26.91 | 58.95 | % | $ | 14,224 | 1.09 | % | 1.26 | % | — | 1.26 | % | 1.26 | % | 64 | % | |||||||||||||||||||||
| (4.70 | ) | 16.93 | (48.08 | %) | 6,828 | 1.27 | % | 1.29 | % | — | 1.29 | % | 1.01 | % | 106 | % | |||||||||||||||||||||||
| (19.91 | ) | 41.28 | 2.90 | % | 8,213 | 0.57 | % | 1.27 | % | — | 1.27 | % | 1.00 | % | 86 | % | |||||||||||||||||||||||
| (1.62 | ) | 57.63 | 18.90 | % | 73,640 | 0.05 | % | 1.28 | % | — | 1.28 | % | 1.03 | % | 127 | % | |||||||||||||||||||||||
| (0.20 | ) | 50.01 | 43.55 | % | 32,565 | 0.36 | % | 1.22 | % | (0.00 | %) | 1.22 | % | 0.91 | % | 168 | % | ||||||||||||||||||||||
| (0.15 | ) | 35.02 | 19.40 | % | 35,233 | 1.19 | % | 1.27 | % | (0.00 | %) | 1.27 | % | 0.97 | % | 110 | % | ||||||||||||||||||||||
| (5) | Includes litigation proceeds for the U.S. Convertible Fund of less than $0.01 per share, for the fiscal year ended 2009, litigation proceeds were less than $0.01 per share. |
| (6) | Inception to date return. |
41
Nicholas-Applegate Institutional Funds
Financial Highlights
For a Class III share outstanding during the period indicated
| Distributions from: | ||||||||||||||||||||||||
Net Asset Value, Beginning | Net Investment Income (1) | Net Realized and Unrealized Gain (Loss) | Total from Investments Operations | Net Investment Income | Net Realized Capital Gains | |||||||||||||||||||
| GLOBAL EQUITY FUNDS | ||||||||||||||||||||||||
| INTERNATIONAL GROWTH OPPORTUNITIES | ||||||||||||||||||||||||
| For the period ended 11/30/09 | $ | 16.94 | $ | 0.16 | $ | 9.83 | $ | 9.99 | $ | — | $ | — | ||||||||||||
| 9/08/08 (Commenced) to 03/31/09 | 34.51 | 0.08 | (12.95 | ) | (12.87 | ) | — | (4.70 | ) | |||||||||||||||
For a Class IV share outstanding during the period indicated
| Distributions from: | ||||||||||||||||||||||||
Net Asset Value, Beginning | Net Investment Income (1) | Net Realized and Unrealized Gain (Loss) | Total from Investments Operations | Net Investment Income | Net Realized Capital Gains | |||||||||||||||||||
| U.S. EQUITY FUNDS | ||||||||||||||||||||||||
| U.S. CONVERTIBLE | ||||||||||||||||||||||||
| For the period ended 11/30/09 | $ | 19.02 | $ | 0.53 | $ | 4.78 | $ | 5.31 | $ | (0.37 | ) | $ | — | |||||||||||
| For the year ended 03/31/09 | 24.89 | 0.53 | (5.78 | ) | (5.25 | ) | (0.48 | ) | (0.14 | ) | ||||||||||||||
| For the year ended 03/31/08 | 24.37 | 0.11 | 0.91 | 1.02 | (0.39 | ) | (0.10 | ) | ||||||||||||||||
| 12/28/06 (Commenced) to 03/31/07 | 23.47 | 0.12 | 0.91 | 1.03 | (0.13 | ) | — | |||||||||||||||||
| (1) | Net investment income per share is calculated by dividing net investment income for the period by the average shares outstanding during the period. |
| (2) | Total returns are not annualized for periods less than one year. |
| (3) | Ratios are annualized for periods of less than one year. Expense reimbursements reflect voluntary reductions of total expenses. Such amounts would increase net investment income (loss) ratios had such reductions not occurred. |
| (4) | Net expenses include certain items not subject to expense reimbursement for periods prior to January 23, 2006. |
See Accompanying Notes to Financial Statements
42
| Ratios to Average Net Assets (3) | |||||||||||||||||||||||||||||||||||||||
Total Distributions | Net Asset Value, Ending | Total Return (2) | Net Assets, Ending (in 000’s) | Net Investment Income | Total Expenses | Expenses (Reimbursements)/ Recoupment | Expenses Net of Reimbursement/ Recoupment | Expenses Net of Reimbursement/ Recoupment Offset (4) | Fund’s Portfolio Turnover Rate | ||||||||||||||||||||||||||||||
| $ | — | $ | 26.94 | 59.03 | % | $ | 36,342 | 0.99 | % | 1.20 | % | — | 1.20 | % | 1.20 | % | 64 | % | |||||||||||||||||||||
| (4.70 | ) | 16.94 | (36.92 | %)(5) | 16,274 | 0.68 | % | 1.24 | % | — | 1.24 | % | 1.04 | % | 106 | % | |||||||||||||||||||||||
| Ratios to Average Net Assets (3) | |||||||||||||||||||||||||||||||||||||||
Total Distributions | Net Asset Value, Ending | Total Return (2) | Net Assets, Ending (in 000’s) | Net Investment Income | Total Expenses | Expenses (Reimbursements)/ Recoupment | Expenses Net of Reimbursement/ Recoupment | Expenses Net of Reimbursement/ Recoupment Offset (4) | Fund’s Portfolio Turnover Rate | ||||||||||||||||||||||||||||||
| $ | (0.37 | ) | $ | 23.96 | 28.10 | % | $ | 318,393 | 3.61 | % | 0.75 | % | — | 0.75 | % | 0.74 | % | 84 | % | ||||||||||||||||||||
| (0.62 | ) | 19.02 | (21.11 | %) | 247,651 | 2.48 | % | 0.78 | % | — | 0.78 | % | 0.73 | % | 91 | % | |||||||||||||||||||||||
| (0.50 | ) | 24.89 | 4.07 | % | 253,227 | 1.70 | % | 0.78 | % | — | 0.78 | % | 0.64 | % | 98 | % | |||||||||||||||||||||||
| (0.13 | ) | 24.37 | 4.39 | %(5) | 97,007 | 1.97 | % | 0.77 | % | — | (6) | 0.77 | % | 0.60 | % | 92 | % | ||||||||||||||||||||||
| (5) | Inception to date return. |
| (6) | The expense reimbursement was terminated on January 23, 2006. |
43
(This page intentionally left blank)
44
Nicholas-Applegate Institutional Funds
Statements of Assets and Liabilities
| November 30, 2009 | U.S. Ultra Micro Cap | U.S. Micro Cap | U.S. Emerging Growth | U.S. Small to Mid Cap Growth | U.S. Convertible | International Growth Opportunities | U.S. High Yield Bond | |||||||||||||||||||||
| Assets | ||||||||||||||||||||||||||||
| Investments, at value* | $ | 1,780,820 | $ | 53,966,178 | $ | 16,426,562 | $ | 4,552,884 | $ | 419,510,127 | $ | 117,789,703 | $ | 69,603,236 | ||||||||||||||
| Foreign currencies, at value** | — | — | — | — | — | 43,658 | — | |||||||||||||||||||||
| Cash | — | — | — | — | — | 176 | — | |||||||||||||||||||||
| Receivables: | ||||||||||||||||||||||||||||
| Investment securities sold | 3,560 | 101,626 | 26,545 | 8,383 | — | 7,392 | 1,503,750 | |||||||||||||||||||||
| Capital shares sold | 11,500 | 5,424 | — | — | — | 59,725 | 29,396 | |||||||||||||||||||||
| Dividends | 254 | 12,058 | 12,586 | 4,259 | 368,033 | 74,671 | — | |||||||||||||||||||||
| Foreign taxes receivable | — | — | — | — | — | 104,886 | — | |||||||||||||||||||||
| Interest | — | — | — | — | 2,322,752 | — | 1,605,530 | |||||||||||||||||||||
| Other | 62 | 131 | 26 | 4 | 4,220 | — | 19 | |||||||||||||||||||||
| Total assets | 1,796,196 | 54,085,417 | 16,465,719 | 4,565,530 | 422,205,132 | 118,080,211 | 72,741,931 | |||||||||||||||||||||
| Liabilities | ||||||||||||||||||||||||||||
| Payables: | ||||||||||||||||||||||||||||
| Investments purchased | $ | — | $ | — | $ | — | $ | — | $ | 721,182 | $ | 1,219,192 | $ | 2,063,188 | ||||||||||||||
| Capital shares redeemed | 12,004 | 17,183 | 6,957 | — | — | 18,791 | 973,928 | |||||||||||||||||||||
| To investment advisor | 2,288 | 46,083 | 10,586 | 1,953 | 195,787 | 68,900 | 24,656 | |||||||||||||||||||||
| Other Liabilities | 1,098 | 28,554 | 6,570 | 2,541 | 76,919 | 70,239 | 13,167 | |||||||||||||||||||||
| Total Liabilities | 15,390 | 91,820 | 24,113 | 4,494 | 993,888 | 1,377,122 | 3,074,939 | |||||||||||||||||||||
| NET ASSETS | 1,780,806 | 53,993,597 | 16,441,606 | 4,561,036 | 421,211,244 | 116,703,089 | 69,666,992 | |||||||||||||||||||||
| * Investments, at cost | 1,393,188 | 45,885,846 | 14,217,208 | 3,719,718 | 374,734,119 | 99,116,704 | 65,749,257 | |||||||||||||||||||||
| ** Foreign currencies, at cost | — | — | — | — | — | 43,814 | — | |||||||||||||||||||||
| Net Assets Consist of: | ||||||||||||||||||||||||||||
| Paid-in capital | $ | 1,827,432 | $ | 63,804,961 | $ | 19,031,295 | $ | 5,530,490 | $ | 416,786,172 | $ | 149,021,274 | $ | 70,329,475 | ||||||||||||||
| Undistributed net investment income | — | — | — | — | 2,876,588 | 1,580,019 | 324,794 | |||||||||||||||||||||
| Accumulated net realized (loss) on investments and foreign currencies and short sales | (434,258 | ) | (17,891,696 | ) | (4,799,043 | ) | (1,802,620 | ) | (43,227,524 | ) | (52,588,375 | ) | (4,841,256 | ) | ||||||||||||||
| Net unrealized appreciation of investments and other assets and liabilities denominated in foreign currencies | 387,632 | 8,080,332 | 2,209,354 | 833,166 | 44,776,008 | 18,690,171 | 3,853,979 | |||||||||||||||||||||
| Net Assets applicable to all shares outstanding | $ | 1,780,806 | $ | 53,993,597 | $ | 16,441,606 | $ | 4,561,036 | $ | 421,211,244 | $ | 116,703,089 | $ | 69,666,992 | ||||||||||||||
| Net Assets of Class I shares | $ | 1,780,806 | $ | 53,993,597 | $ | 13,941,980 | $ | 4,561,036 | $ | 64,995,769 | $ | 66,136,968 | $ | 69,666,992 | ||||||||||||||
| Net Assets of Class II shares | — | — | — | — | 37,822,834 | 14,224,230 | — | |||||||||||||||||||||
| Net Assets of Class III shares | — | — | — | — | — | 36,341,891 | — | |||||||||||||||||||||
| Net Assets of Class IV shares | — | — | — | — | 318,392,641 | — | — | |||||||||||||||||||||
| Net Assets of Class R shares | — | — | 2,499,626 | — | — | — | — | |||||||||||||||||||||
| Class I Shares outstanding | 199,332 | 5,172,815 | 1,386,647 | 571,913 | 2,717,562 | 2,557,199 | 7,596,840 | |||||||||||||||||||||
| Class II Shares outstanding | — | — | — | — | 1,579,232 | 528,664 | — | |||||||||||||||||||||
| Class III Shares outstanding | — | — | — | — | — | 1,349,163 | — | |||||||||||||||||||||
| Class IV Shares outstanding | — | — | — | — | 13,289,698 | — | — | |||||||||||||||||||||
| Class R Shares outstanding | — | — | 255,689 | — | — | — | — | |||||||||||||||||||||
| Net Asset Value — Class I Share | $ | 8.93 | $ | 10.44 | $ | 10.05 | $ | 7.98 | $ | 23.92 | $ | 25.86 | $ | 9.17 | ||||||||||||||
| Net Asset Value — Class II Share | $ | — | $ | — | $ | — | $ | — | $ | 23.95 | $ | 26.91 | $ | — | ||||||||||||||
| Net Asset Value — Class III Share | $ | — | $ | — | $ | — | $ | — | $ | — | $ | 26.94 | $ | — | ||||||||||||||
| Net Asset Value — Class IV Share | $ | — | $ | — | $ | — | $ | — | $ | 23.96 | $ | — | $ | — | ||||||||||||||
| Net Asset Value — Class R Share | $ | — | $ | — | $ | 9.78 | $ | — | $ | — | $ | — | $ | — | ||||||||||||||
See Accompanying Notes to Financial Statements
45
Nicholas-Applegate Institutional Funds
Statements of Operations
| U.S. Ultra Micro Cap | U.S. Micro Cap | U.S. Emerging Growth | ||||||||||||||||||||||
April 1, 2009 to November 30, 2009 | Year ended March 31, 2009 | April 1, 2009 to November 30, 2009 | Year ended March 31, 2009 | April 1, 2009 to November 30, 2009 | Year ended March 31, 2009 | |||||||||||||||||||
| Investment Income | ||||||||||||||||||||||||
| Dividends, net of foreign taxes* | $ | 4,323 | $ | 3,494 | $ | 130,237 | $ | 145,845 | $ | 56,317 | $ | 54,235 | ||||||||||||
| Interest | — | — | — | 6 | 3 | — | ||||||||||||||||||
| Total Income | 4,323 | 3,494 | 130,237 | 145,851 | 56,320 | 54,235 | ||||||||||||||||||
| Expenses | ||||||||||||||||||||||||
| Advisory fee | 16,019 | 19,902 | 339,898 | 540,350 | 66,301 | 74,251 | ||||||||||||||||||
| Administration fees | 7,795 | 9,685 | 183,545 | 291,789 | 36,245 | 40,591 | ||||||||||||||||||
| Shareholder servicing fees | — | — | — | — | 3,763 | 5,878 | ||||||||||||||||||
| Trustees’ fees and expenses | — | 587 | — | 20,128 | 263 | 3,520 | ||||||||||||||||||
| Interest and credit facility fee | — | — | — | — | — | 193 | ||||||||||||||||||
| Miscellaneous | 864 | 1,654 | 1,738 | 4,021 | 1,388 | 1,517 | ||||||||||||||||||
| Total Expenses | 24,678 | 31,828 | 525,181 | 856,288 | 107,960 | 125,950 | ||||||||||||||||||
| Expense offset** | (1,000 | ) | (1,196 | ) | (6,418 | ) | (363,460 | ) | (1,360 | ) | (31,475 | ) | ||||||||||||
| Net Expenses | 23,678 | 30,632 | 518,763 | 492,828 | 106,600 | 94,475 | ||||||||||||||||||
| Net Investment Income (Loss) | (19,355 | ) | (27,138 | ) | (388,526 | ) | (346,977 | ) | (50,280 | ) | (40,240 | ) | ||||||||||||
| Net Realized and Unrealized Gain (Loss) on Investments | ||||||||||||||||||||||||
| Realized gain from: | ||||||||||||||||||||||||
| Securities | 72,454 | (489,084 | ) | (716,133 | ) | (15,983,886 | ) | 336,862 | (3,991,029 | ) | ||||||||||||||
| Foreign currency transactions | — | — | — | — | — | — | ||||||||||||||||||
| Net realized gain (loss) | 72,454 | (489,084 | ) | (716,133 | ) | (15,983,886 | ) | 336,862 | (3,991,029 | ) | ||||||||||||||
| Change in unrealized appreciation of: Investments | 554,095 | (122,292 | ) | 16,046,066 | (6,288,864 | ) | 4,245,852 | (1,566,687 | ) | |||||||||||||||
| Other assets and liabilities denominated | — | — | — | — | — | — | ||||||||||||||||||
| Net unrealized appreciation (depreciation) | 554,095 | (122,292 | ) | 16,046,066 | (6,288,864 | ) | 4,245,852 | (1,566,687 | ) | |||||||||||||||
| Net Gain (Loss) on Investments | 626,549 | (611,376 | ) | 15,329,933 | (22,272,750 | ) | 4,582,714 | (5,557,716 | ) | |||||||||||||||
| Net Increase in Assets Resulting from Operations | $ | 607,194 | $ | (638,514 | ) | $ | 14,941,407 | $ | (22,619,727 | ) | $ | 4,532,434 | $ | (5,597,956 | ) | |||||||||
| * Foreign taxes withheld | $ | — | $ | — | $ | — | $ | — | $ | — | $ | — | ||||||||||||
| ** | Please reference Note B in the Notes to Financial Statements. |
See Accompanying Notes to Financial Statements
46
| U.S. Small to Mid Cap Growth | U.S. Convertible | International Growth Opportunities | U.S. High Yield Bond | |||||||||||||||||||||||||||
April 1, 2009 to November 30, 2009 | Year ended March 31, 2009 | April 1, 2009 to November 30, 2009 | Year ended March 31, 2009 | April 1, 2009 to November 30, 2009 | Year ended March 31, 2009 | April 1, 2009 to November 30, 2009 | Year ended March 31, 2009 | |||||||||||||||||||||||
| $ | 19,346 | $ | 15,578 | $ | 2,877,173 | $ | 2,934,983 | $ | 1,471,045 | $ | 2,108,832 | $ | — | $ | 1,959 | |||||||||||||||
| 4 | — | 7,848,427 | 6,263,493 | — | 25 | 4,439,994 | 4,366,938 | |||||||||||||||||||||||
| 19,350 | 15,578 | 10,725,600 | 9,198,476 | 1,471,045 | 2,108,857 | 4,439,994 | 4,368,897 | |||||||||||||||||||||||
| 13,771 | 21,049 | 1,356,965 | 1,584,723 | 451,977 | 658,634 | 175,278 | 190,608 | |||||||||||||||||||||||
| 11,017 | 16,839 | 576,305 | 652,886 | 393,773 | 619,402 | 87,639 | 95,304 | |||||||||||||||||||||||
| — | — | — | — | — | — | — | — | |||||||||||||||||||||||
| — | 1,709 | 23,048 | 102,820 | — | 36,305 | 2,481 | 16,814 | |||||||||||||||||||||||
| — | — | — | — | 22 | 5,295 | — | 116 | |||||||||||||||||||||||
| 1,363 | 1,215 | 2,636 | 12,644 | 10,422 | 4,111 | 968 | 2,714 | |||||||||||||||||||||||
| 26,151 | 40,812 | 1,958,954 | 2,353,073 | 856,194 | 1,323,747 | 266,366 | 305,556 | |||||||||||||||||||||||
| (1,069 | ) | (6,826 | ) | (24,563 | ) | (148,264 | ) | (987 | ) | (247,946 | ) | (697 | ) | (15,047 | ) | |||||||||||||||
| 25,082 | 33,986 | 1,934,391 | 2,204,809 | 855,207 | 1,075,801 | 265,669 | 290,509 | |||||||||||||||||||||||
| (5,732 | ) | (18,408 | ) | 8,791,209 | 6,993,667 | 615,838 | 1,033,056 | 4,174,325 | 4,078,388 | |||||||||||||||||||||
| 190,746 | (1,672,761 | ) | (14,456,729 | ) | (22,074,355 | ) | (2,487,999 | ) | (29,398,851 | ) | (539,498 | ) | (3,328,327 | ) | ||||||||||||||||
| — | — | — | — | (52,079 | ) | 12,067 | — | — | ||||||||||||||||||||||
| 190,746 | (1,672,761 | ) | (14,456,729 | ) | (22,074,355 | ) | (2,540,078 | ) | (29,386,784 | ) | (539,498 | ) | (3,328,327 | ) | ||||||||||||||||
| 1,273,543 | (257,128 | ) | 93,128,823 | (49,650,857 | ) | 41,893,383 | (38,247,238 | ) | 13,269,547 | (7,257,264 | ) | |||||||||||||||||||
| — | — | — | — | 16,444 | 1,897 | — | — | |||||||||||||||||||||||
| 1,273,543 | (257,128 | ) | 93,128,823 | (49,650,857 | ) | 41,909,827 | (38,245,341 | ) | 13,269,547 | (7,257,264 | ) | |||||||||||||||||||
| 1,464,289 | (1,929,889 | ) | 78,672,094 | (71,725,212 | ) | 39,369,749 | (67,632,125 | ) | 12,730,049 | (10,585,591 | ) | |||||||||||||||||||
| $ | 1,458,557 | $ | (1,948,297 | ) | $ | 87,463,303 | $ | (64,731,545 | ) | $ | 39,985,587 | $ | (66,599,069 | ) | $ | 16,904,374 | $ | (6,507,203 | ) | |||||||||||
| $ | — | $ | — | $ | — | $ | — | $ | 126,193 | $ | 156,496 | $ | — | $ | — | |||||||||||||||
47
Nicholas-Applegate Institutional Funds
Statements of Changes in Net Assets
| U.S. Ultra Micro Cap | U.S. Micro Cap | |||||||||||||||||||||||
April 1, 2009 to November 30, 2009 | March 31, 2009 | March 31, 2008 | April 1, 2009 to November 30, 2009 | March 31, 2009 | March 31, 2008 | |||||||||||||||||||
| Increase (Decrease) In Net Assets: | ||||||||||||||||||||||||
| Net investment income (loss) | $ | (19,355 | ) | $ | (27,138 | ) | $ | (2,880 | ) | $ | (388,526 | ) | $ | (346,977 | ) | $ | (971,799 | ) | ||||||
| Net realized gain (loss) | 72,454 | (489,084 | ) | (17,628 | ) | (716,133 | ) | (15,983,886 | ) | 5,666,026 | ||||||||||||||
| Net unrealized appreciation (depreciation) | 554,095 | (122,292 | ) | (44,171 | ) | 16,046,066 | (6,288,864 | ) | (13,753,967 | ) | ||||||||||||||
| Investment operations | 607,194 | (638,514 | ) | (64,679 | ) | 14,941,407 | (22,619,727 | ) | (9,059,740 | ) | ||||||||||||||
| Distributions to Shareholders: | ||||||||||||||||||||||||
| From net investment income | ||||||||||||||||||||||||
| Class I | — | — | — | — | — | — | ||||||||||||||||||
| Class II | — | — | — | — | — | — | ||||||||||||||||||
| Class IV | — | — | — | — | — | — | ||||||||||||||||||
| From net realized gains | ||||||||||||||||||||||||
| Class I | — | — | — | — | (18,218 | ) | (9,796,779 | ) | ||||||||||||||||
| Class II | — | — | — | — | — | (98,864 | ) | |||||||||||||||||
| Class IV | — | — | — | — | — | — | ||||||||||||||||||
| Class R | — | — | — | — | — | — | ||||||||||||||||||
| Total distributions | — | — | — | — | (18,218 | ) | (9,895,643 | ) | ||||||||||||||||
| From Capital Share Transactions: | ||||||||||||||||||||||||
| Proceeds from shares sold | ||||||||||||||||||||||||
| Class I | 171,603 | 856,224 | 950,827 | 3,236,727 | 15,606,664 | 17,361,071 | ||||||||||||||||||
| Class II | — | — | — | — | — | 110,838 | ||||||||||||||||||
| Class IV | — | — | — | — | — | — | ||||||||||||||||||
| Class R | — | — | — | — | — | — | ||||||||||||||||||
| Distributions reinvested | ||||||||||||||||||||||||
| Class I | — | — | — | — | 18,097 | 9,746,287 | ||||||||||||||||||
| Class II | — | — | — | — | — | 98,864 | ||||||||||||||||||
| Class IV | — | — | — | — | — | — | ||||||||||||||||||
| Class R | — | — | — | — | — | — | ||||||||||||||||||
| Cost of shares redeemed | ||||||||||||||||||||||||
| Class I | (82,062 | ) | (19,787 | ) | — | (4,362,160 | ) | (12,931,589 | ) | (32,282,224 | ) | |||||||||||||
| Class II | — | — | — | — | — | (3,054,309 | ) | |||||||||||||||||
| Class IV | — | — | — | — | — | — | ||||||||||||||||||
| Class R | — | — | — | — | — | — | ||||||||||||||||||
| Net increase (decrease) in net assets from share transactions | 89,541 | 836,437 | 950,827 | (1,125,433 | ) | 2,693,172 | (8,019,473 | ) | ||||||||||||||||
| Net Increase (Decrease) in Net Assets | 696,735 | 197,923 | 886,148 | 13,815,974 | (19,944,773 | ) | (26,974,856 | ) | ||||||||||||||||
| Net Assets | ||||||||||||||||||||||||
| Beginning | 1,084,071 | 886,148 | — | 40,177,623 | 60,122,396 | 87,097,252 | ||||||||||||||||||
| Ending | $ | 1,780,806 | $ | 1,084,071 | $ | 886,148 | $ | 53,993,597 | $ | 40,177,623 | $ | 60,122,396 | ||||||||||||
| Undistributed net investment income (loss), ending | $ | — | $ | — | $ | — | $ | — | $ | — | $ | — | ||||||||||||
| Class I — Capital Share Activity | ||||||||||||||||||||||||
| Shares sold | 21,166 | 95,380 | 95,521 | 332,941 | 1,532,253 | 1,152,958 | ||||||||||||||||||
| Distributions reinvested | — | — | — | — | 2,288 | 692,700 | ||||||||||||||||||
| Shares redeemed | (9,269 | ) | (3,466 | ) | — | (460,453 | ) | (1,419,052 | ) | (2,167,801 | ) | |||||||||||||
| Net Class I Share Activity | 11,897 | 91,914 | 95,521 | (127,512 | ) | 115,489 | (322,143 | ) | ||||||||||||||||
| Class II — Capital Share Activity | ||||||||||||||||||||||||
| Shares sold | — | — | — | — | — | 6,464 | ||||||||||||||||||
| Distributions reinvested | — | — | — | — | — | 6,952 | ||||||||||||||||||
| Shares redeemed | — | — | — | — | — | (187,792 | ) | |||||||||||||||||
| Net Class II Share Activity | — | — | — | — | — | (174,376 | ) | |||||||||||||||||
| Class IV — Capital Share Activity | ||||||||||||||||||||||||
| Shares sold | — | — | — | — | — | — | ||||||||||||||||||
| Distributions reinvested | — | — | — | — | — | — | ||||||||||||||||||
| Shares redeemed | — | — | — | — | — | — | ||||||||||||||||||
| Net Class IV Share Activity | — | — | — | — | — | — | ||||||||||||||||||
| Class R — Capital Share Activity | ||||||||||||||||||||||||
| Shares sold | — | — | — | — | — | — | ||||||||||||||||||
| Distributions reinvested | — | — | — | — | — | — | ||||||||||||||||||
| Shares redeemed | — | — | — | — | — | — | ||||||||||||||||||
| Net Class R Share Activity | — | — | — | — | — | — | ||||||||||||||||||
See Accompanying Notes to Financial Statements
48
| U.S. Emerging Growth | U.S. Small to Mid Cap Growth | U.S. Convertible | ||||||||||||||||||||||||||||||||
April 1, 2009 to November 30, 2009 | March 31, 2009 | March 31, 2008 | April 1, 2009 to November 30, 2009 | March 31, 2009 | March 31, 2008 | April 1, 2009 to November 30, 2009 | March 31, 2009 | March 31, 2008 | ||||||||||||||||||||||||||
| $ | (50,280 | ) | $ | (40,240 | ) | $ | (63,162 | ) | $ | (5,732 | ) | $ | (18,408 | ) | $ | (17,854 | ) | $ | 8,791,209 | $ | 6,993,667 | $ | 3,307,246 | |||||||||||
| 336,862 | (3,991,029 | ) | 1,109,622 | 190,746 | (1,672,761 | ) | (320,604 | ) | (14,456,729 | ) | (22,074,355 | ) | 2,428,013 | |||||||||||||||||||||
| 4,245,852 | (1,566,687 | ) | (1,932,344 | ) | 1,273,543 | (257,128 | ) | (183,249 | ) | 93,128,823 | (49,650,857 | ) | (8,015,589 | ) | ||||||||||||||||||||
| 4,532,434 | (5,597,956 | ) | (885,884 | ) | 1,458,557 | (1,948,297 | ) | (521,707 | ) | 87,463,303 | (64,731,545 | ) | (2,280,330 | ) | ||||||||||||||||||||
| — | — | — | — | — | — | (755,722 | ) | (477,679 | ) | (514,906 | ) | |||||||||||||||||||||||
| — | — | — | — | — | — | (558,980 | ) | (621,794 | ) | (122,122 | ) | |||||||||||||||||||||||
| — | — | — | — | — | — | (4,972,169 | ) | (5,559,726 | ) | (2,605,259 | ) | |||||||||||||||||||||||
| — | — | (527,551 | ) | — | — | — | — | (107,496 | ) | (150,355 | ) | |||||||||||||||||||||||
| — | — | — | — | — | — | — | (237,582 | ) | (38,002 | ) | ||||||||||||||||||||||||
| — | — | — | — | — | — | — | (1,514,785 | ) | (710,833 | ) | ||||||||||||||||||||||||
| — | — | (217,858 | ) | — | — | — | — | — | — | |||||||||||||||||||||||||
| — | — | (745,409 | ) | — | — | — | (6,286,871 | ) | (8,519,062 | ) | (4,141,477 | ) | ||||||||||||||||||||||
| 4,310,648 | 5,416,300 | 2,539,292 | — | 188,770 | 5,383,713 | 41,089,111 | 18,412,911 | 15,784,572 | ||||||||||||||||||||||||||
| — | — | — | — | — | — | — | 41,196,161 | 965,357 | ||||||||||||||||||||||||||
| — | — | — | — | — | — | 5,467,462 | 53,965,866 | 164,185,347 | ||||||||||||||||||||||||||
| 430,366 | 659,133 | 1,124,520 | — | — | — | — | — | — | ||||||||||||||||||||||||||
| — | — | 526,107 | — | — | — | 669,520 | 568,643 | 654,378 | ||||||||||||||||||||||||||
| — | — | — | — | — | — | 558,980 | 859,376 | 160,124 | ||||||||||||||||||||||||||
| — | — | — | — | — | — | 68,517 | 35,016 | 4,685 | ||||||||||||||||||||||||||
| — | — | 217,859 | — | — | — | — | — | — | ||||||||||||||||||||||||||
| (663,990 | ) | (1,926,575 | ) | (1,777,085 | ) | — | — | — | (5,693,143 | ) | (43,467,945 | ) | (9,010,639 | ) | ||||||||||||||||||||
| — | — | — | — | — | — | (6,300 | ) | (10,541,032 | ) | — | ||||||||||||||||||||||||
| — | — | — | — | — | — | (1,646 | ) | — | (127,582 | ) | ||||||||||||||||||||||||
| (295,189 | ) | (792,831 | ) | (1,216,005 | ) | — | — | — | — | — | — | |||||||||||||||||||||||
3,781,835 | 3,356,027 | 1,414,688 | — | 188,770 | 5,383,713 | 42,152,501 | 61,028,996 | 172,616,242 | ||||||||||||||||||||||||||
| 8,314,269 | (2,241,929 | ) | (216,605 | ) | 1,458,557 | (1,759,527 | ) | 4,862,006 | 123,328,933 | (12,221,611 | ) | 166,194,435 | ||||||||||||||||||||||
| 8,127,337 | 10,369,266 | 10,585,871 | 3,102,479 | 4,862,006 | — | 297,882,311 | 310,103,922 | 143,909,487 | ||||||||||||||||||||||||||
| $ | 16,441,606 | $ | 8,127,337 | $ | 10,369,266 | $ | 4,561,036 | $ | 3,102,479 | $ | 4,862,006 | $ | 421,211,244 | $ | 297,882,311 | $ | 310,103,922 | |||||||||||||||||
| $ | — | $ | — | $ | — | $ | — | $ | — | $ | — | $ | 2,876,588 | $ | 373,877 | $ | 41,918 | |||||||||||||||||
| 458,353 | 554,485 | 182,466 | — | 32,886 | 539,027 | 1,852,253 | 875,435 | 630,900 | ||||||||||||||||||||||||||
| — | — | 37,552 | — | — | — | 29,892 | 27,942 | 25,119 | ||||||||||||||||||||||||||
| (71,623 | ) | (209,274 | ) | (131,451 | ) | — | — | — | (251,688 | ) | (1,736,645 | ) | (338,123 | ) | ||||||||||||||||||||
| 386,730 | 345,211 | 88,567 | — | 32,866 | 539,027 | 1,630,457 | (833,268 | ) | 317,896 | |||||||||||||||||||||||||
| — | — | — | — | — | — | — | 1,621,749 | 36,196 | ||||||||||||||||||||||||||
| — | — | — | — | — | — | 25,117 | 45,437 | 6,118 | ||||||||||||||||||||||||||
| — | — | — | — | — | — | (281 | ) | (478,652 | ) | — | ||||||||||||||||||||||||
| — | — | — | — | — | — | 24,836 | 1,188,534 | 42,314 | ||||||||||||||||||||||||||
| — | — | — | — | — | — | 268,286 | 2,843,254 | 6,197,172 | ||||||||||||||||||||||||||
| — | — | — | — | — | — | 3,079 | 1,837 | 180 | ||||||||||||||||||||||||||
| — | — | — | — | — | — | (70 | ) | — | (4,794 | ) | ||||||||||||||||||||||||
| — | — | — | — | — | — | 271,295 | 2,845,091 | 6,192,558 | ||||||||||||||||||||||||||
| 48,968 | 72,627 | 79,606 | — | — | — | — | — | — | ||||||||||||||||||||||||||
| — | — | 15,891 | — | — | — | — | — | — | ||||||||||||||||||||||||||
| (32,618 | ) | (89,614 | ) | (86,526 | ) | — | — | — | — | — | — | |||||||||||||||||||||||
| 16,350 | (16,987 | ) | 8,971 | — | — | — | — | — | — | |||||||||||||||||||||||||
49
Nicholas-Applegate Institutional Funds
Statements of Changes in Net Assets
| International Growth Opportunities | U.S. High Yield Bond | |||||||||||||||||||||||
April 1, 2009 to November 30, 2009 | March 31, 2009 | March 31, 2008 | April 1, 2009 to November 30, 2009 | March 31, 2009 | March 31, 2008 | |||||||||||||||||||
| Increase (Decrease) In Net Assets: | ||||||||||||||||||||||||
| Net investment income (loss) | $ | 615,838 | $ | 1,033,056 | $ | 839,340 | $ | 4,174,325 | $ | 4,078,388 | $ | 5,120,757 | ||||||||||||
| Net realized gain (loss) | (2,540,078 | ) | (29,386,784 | ) | 68,324,600 | (539,498 | ) | (3,328,327 | ) | (36,608 | ) | |||||||||||||
| Net unrealized appreciation (depreciation) | 41,909,827 | (38,245,341 | ) | (46,775,990 | ) | 13,269,547 | (7,257,264 | ) | (6,230,507 | ) | ||||||||||||||
| Investment operations | 39,985,587 | (66,599,069 | ) | 22,387,950 | 16,904,374 | (6,507,203 | ) | (1,146,358 | ) | |||||||||||||||
| Distributions to Shareholders: | ||||||||||||||||||||||||
| From net investment income | ||||||||||||||||||||||||
| Class I | — | — | (2,374,268 | ) | (3,919,569 | ) | (4,454,710 | ) | (4,645,370 | ) | ||||||||||||||
| Class II | — | — | (69,543 | ) | — | — | (708,781 | ) | ||||||||||||||||
| From net realized gains | ||||||||||||||||||||||||
| Class I | — | (10,682,297 | ) | (36,837,182 | ) | — | — | — | ||||||||||||||||
| Class II | — | (450,051 | ) | (3,939,300 | ) | — | — | — | ||||||||||||||||
| Class III | — | (3,457,540 | ) | (12,535 | ) | — | — | — | ||||||||||||||||
| Total distributions | — | (14,589,888 | ) | (43,232,828 | ) | (3,919,569 | ) | (4,454,710 | ) | (5,354,151 | ) | |||||||||||||
| From Capital Share Transactions: | ||||||||||||||||||||||||
| Proceeds from shares sold | ||||||||||||||||||||||||
| Class I | 13,928,228 | 26,847,095 | 60,762,777 | 19,433,673 | 25,191,406 | 15,112,012 | ||||||||||||||||||
| Class II | 2,290,482 | 12,108,095 | 1,218,257 | — | — | 57,244 | ||||||||||||||||||
| Class III | 8,139,109 | 25,556,793 | 45,968 | — | — | — | ||||||||||||||||||
| Class IV | — | — | 26,893 | — | — | — | ||||||||||||||||||
| Distributions reinvested | ||||||||||||||||||||||||
| Class I | — | 10,572,511 | 37,309,080 | 3,536,124 | 4,193,149 | 4,260,974 | ||||||||||||||||||
| Class II | — | 450,051 | — | — | — | 5,404 | ||||||||||||||||||
| Class III | — | 3,457,540 | 12,534 | — | — | — | ||||||||||||||||||
| Cost of shares redeemed | ||||||||||||||||||||||||
| Class I | (10,421,507 | ) | (47,427,822 | ) | (52,627,289 | ) | (15,520,970 | ) | (19,459,996 | ) | (27,693,992 | ) | ||||||||||||
| Class II | — | (9,046,524 | ) | (75,339,925 | ) | — | — | (32,698,711 | ) | |||||||||||||||
| Class III | — | — | (5,460,800 | ) | — | — | — | |||||||||||||||||
| Class IV | — | — | (75,746,255 | ) | — | — | — | |||||||||||||||||
| Net increase (decrease) in net assets from share transactions | 13,936,312 | 22,517,739 | (109,798,760 | ) | 7,448,827 | 9,924,559 | (40,957,069 | ) | ||||||||||||||||
| Net Increase (Decrease) in Net Assets | 53,921,899 | (58,671,218 | ) | (130,643,638 | ) | 20,433,632 | (1,037,354 | ) | (47,457,578 | ) | ||||||||||||||
| Net Assets | ||||||||||||||||||||||||
| Beginning | 62,781,190 | 121,452,408 | 252,096,046 | 49,233,360 | 50,270,714 | 97,728,292 | ||||||||||||||||||
| Ending | $ | 116,703,089 | $ | 62,781,190 | $ | 121,452,408 | $ | 69,666,992 | $ | 49,233,360 | $ | 50,270,714 | ||||||||||||
| Undistributed net investment income (loss), ending | $ | 1,580,019 | $ | 982,464 | $ | (863,873 | ) | $ | 324,794 | $ | 8,941 | $ | 243,250 | |||||||||||
| Class I — Capital Share Activity | ||||||||||||||||||||||||
| Shares sold | 584,960 | 1,091,824 | 1,089,540 | 2,286,156 | 3,227,477 | 1,521,238 | ||||||||||||||||||
| Distributions reinvested | — | 621,547 | 841,432 | 408,286 | 523,672 | 433,889 | ||||||||||||||||||
| Shares redeemed | (463,967 | ) | (2,101,210 | ) | (920,041 | ) | (1,751,564 | ) | (2,469,177 | ) | (2,806,757 | ) | ||||||||||||
| Net Class I Share Activity | 120,993 | (387,839 | ) | 1,010,931 | 942,878 | 1,281,972 | (851,630 | ) | ||||||||||||||||
| Class II — Capital Share Activity | ||||||||||||||||||||||||
| Shares sold | 125,237 | 537,531 | 20,169 | — | — | 5,705 | ||||||||||||||||||
| Distributions reinvested | — | 25,470 | — | — | — | 386 | ||||||||||||||||||
| Shares redeemed | — | (358,527 | ) | (1,099,006 | ) | — | — | (3,305,489 | ) | |||||||||||||||
| Net Class II Share Activity | 125,237 | 204,474 | (1,078,837 | ) | — | — | (3,299,398 | ) | ||||||||||||||||
| Class III — Capital Share Activity | ||||||||||||||||||||||||
| Shares sold | 388,421 | 765,180 | 669 | — | — | — | ||||||||||||||||||
| Distributions reinvested | — | 195,562 | 273 | — | — | — | ||||||||||||||||||
| Shares redeemed | — | — | (82,580 | ) | — | — | — | |||||||||||||||||
| Net Class III Share Activity | 388,421 | 960,742 | (81,638 | ) | — | — | — | |||||||||||||||||
| Class IV — Capital Share Activity | ||||||||||||||||||||||||
| Shares sold | — | — | 402 | — | — | — | ||||||||||||||||||
| Distributions reinvested | — | — | — | — | — | — | ||||||||||||||||||
| Shares redeemed | — | — | (1,212,404 | ) | — | — | — | |||||||||||||||||
| Net Class IV Share Activity | — | — | (1,212,002 | ) | — | — | — | |||||||||||||||||
See Accompanying Notes to Financial Statements
50
Nicholas-Applegate Institutional Funds
Notes to Financial Statements
Note A — ORGANIZATION
Each of the U.S. Ultra Micro Cap, U.S. Micro Cap, U.S. Emerging Growth, U.S. Small to Mid Cap Growth, U.S. Convertible, International Growth Opportunities and U.S. High Yield Bond Fund, (the “Funds”) is a series of shares of beneficial interest of the Nicholas-Applegate Institutional Funds (the “Trust”), an open-end investment management company. The Trust was established as a Delaware business trust on December 17, 1992 and consists of twelve separate portfolios, including the Funds. Each Fund’s investment objectives, strategies and risks are discussed in the Funds’ current prospectuses. All of the Funds have issued Class I shares (“Class I”), two Funds have issued Class II shares (“Class II”), one Fund has issued Class III shares (“Class III”), one Fund has issued Class IV shares (“Class IV”) and one Fund has issued Retirement shares (“Class R”). No shares have a sales charge. Class R has a shareholder service fee. The Funds offering Class I, Class II, Class III and Class IV shares are covered in this report.
Note B — SIGNIFICANT ACCOUNTING POLICIES
Significant accounting policies consistently followed by the Funds in preparing these financial statements are described below. The policies conform with accounting principles generally accepted in the United States.
Security Valuations
Equity securities, including ADRs, and GDRs, that are traded on a stock exchange or on the NASDAQ National Market System are valued at the last sale price as of the close of business on the New York Stock Exchange (normally 4:00 p.m. New York time) on the day the securities are being valued, or lacking any sales, at the mean between the closing bid and asked prices. A security that is listed or trades on more than one exchange is valued at the quotation on the exchange determined to be the primary market for such security. Securities listed or traded on certain non-U.S. exchanges whose operations are similar to the United States over-the-counter market are valued at the price within the limits of the latest available current bid and asked prices deemed by Nicholas-Applegate Capital Management LLC (the “Adviser”) to best reflect fair value. A security that is listed or traded on more than one exchange is valued at the quotation on the exchange determined to be the primary market for such security by the Adviser. Equity Linked Notes (“ELNs”) are valued by using the closing local price for the underlying security and applying the exchange rate for the currency to arrive at a USD equivalent.
Long-term debt obligations, including high quality and high yield corporate securities, municipal securities, asset-backed securities, collateralized mortgage obligations and U.S. Government and Agency issues, are normally valued at the mean between the bid and ask prices provided by an approved bond pricing service. In the event a TRACE price is used, the price is the last traded price on the valuation date for trades greater than or equal to 1mm par amount. Convertible securities are normally priced at the mean between the bid and ask prices. If such a security has a demand feature excercisable within one to seven days, the security is valued at par. In the event that a pricing service does not price a particular security or the price provided is not believed to be reliable, the Adviser will endeavor to use the average of one or two broker-dealer quotations. If broker-dealer quotations are not available, the Adviser generally does not change the price. Short-term debt instruments (e.g., commercial paper, bankers acceptances, U.S. Treasury Bills, etc.) having a maturity of less than 60 days will be valued at amortized cost. If a fixed income security has a maturity or greater than 60 days, it is valued at market price. U.S. Treasury Bills are priced via bids from an approved pricing source.
Securities or other assets for which reliable market quotations are not readily available or for which the pricing agent or principal market maker does not provide a valuation or methodology or provides a valuation or methodology that, in the judgment of the Adviser, does not represent fair value (“Fair Value Securities”), are valued by the Adviser’s Pricing Committee overseen by the Board of Trustees in consultation, as applicable, with the Adviser’s portfolio managers, investment analysts and legal and compliance personnel. Fair Value Securities may include, but are not limited to, the following: certain private placements and restricted securities that do not have an active trading market; securities whose trading has been suspended or for which there is no current market; securities whose prices are stale; securities denominated in currencies that are restricted or untraded, or for which exchange rates are disrupted; securities affected by significant events; and securities that the Adviser’s Pricing Committee believes were priced incorrectly. A “significant event” (which includes, but is not limited to, an extraordinary political or market event) is an event that the Adviser’s Pricing Committee believes with a reasonably high degree of certainty has caused the closing market prices of a Fund’s portfolio securities to no longer reflect their value at the time of the Fund’s NAV calculation.
Security Transactions and Investment Income
Security transactions are accounted for as of trade date. Realized gains and losses from security transactions are determined on an identified-cost basis.
Dividend income is recorded on the ex-dividend date or, for certain non-U.S. securities, when the information becomes available to the Funds. Interest income is recorded on an accrual basis. Discounts and premiums on debt securities are accreted and amortized on the yield to maturity basis.
Non-U.S. Currency Transactions
On each net asset valuation date, the value of assets and liabilities denominated in non-U.S. currencies are translated into U.S. dollars using the current exchange rate at 11:00 a.m. Eastern Time against the U.S. dollar spot rate, as provided by an approved pricing service. Security transactions, income and expenses are converted at the prevailing exchange rate on the day of the event. The effect of changes in exchange rates on securities denominated in a non-U.S. currency is included with the net realized and unrealized gain or loss of the associated security. Foreign exchange rates are translated into U.S. dollars when the exchange rate is struck at the close of the London Stock Exchange. Other non-U.S. currency gains or losses are reported separately.
51
Nicholas-Applegate Institutional Funds
Notes to Financial Statements – Continued
Certain Funds may use forward non-U.S. currency contracts to reduce their exposure to currency fluctuations of their non-U.S. securities. These contracts are commitments to purchase or sell a non-U.S. currency at a specified rate on a future date. When the contract is fulfilled or closed, gains or losses are realized. Until then, the gain or loss is included in unrealized appreciation or depreciation of investments. The contract commitment is fully collateralized by cash or securities of the Fund. Non-U.S. denominated assets and forward currency contracts may involve more risks than U.S. transactions, including currency risk, political and economic risk, regulatory and market risk. Evaluating and monitoring such risk exposure is a part of the Funds’ management strategy. The Funds did not have any forward non-U.S. currency contracts outstanding at November 30, 2009.
Futures Contracts
Each Fund may enter into futures contracts involving non-U.S. currency, interest rates, securities, and securities indices, for hedging purposes only. A futures contract obligates the seller of the contract to deliver and the purchaser of the contract to take delivery of the type of non-U.S. currency, financial instrument or security called for in the contract at a specified future time for a specified price. Upon entering into such a contract, a Fund is required to deposit and maintain as collateral such initial margin as required by the exchange on which the contract is traded. Pursuant to the contract, a Fund agrees to receive from or pay to the broker an amount equal to the daily fluctuations in the value of the contract. Such receipts or payments are known as variation margin and are recorded as unrealized gains or losses by the Fund. When the contract is closed, the Fund records a realized gain or loss equal to the difference between the value of the contract at the time it was opened and the value at the time it was closed. During the period ended November 30, 2009, the Funds did not hold futures contracts.
Equity-Linked Securities
Certain Funds may purchase equity-linked securities, also known as participation notes, equity swaps, and zero strike calls and warrants. Equity-linked securities are primarily used by a Fund as an alternative means to more efficiently and effectively access what is generally an emerging securities market. The Fund deposits an amount of cash with its custodian (or broker, if legally permitted) in an amount near or equal to the selling price of the underlying security in exchange for an equity linked security. Upon sale, the Fund receives cash from the broker or custodian equal to the value of the underlying security. Aside from market risk of the underlying securities, there is a risk of default by the counterparty to the transaction. In the event of insolvency of the counterparty, the Fund might be unable to obtain its expected benefit. In addition, while a Fund will seek to enter into such transactions only with parties which are capable of entering into closing transactions with the Fund, there can be no assurance that the Fund will be able to close out such a transaction with the counterparty or obtain an offsetting position with any counterparty, at any time prior to the end of the term of the underlying agreement. This may impair the Fund’s ability to enter into other transactions at a time when doing so might be advantageous.
Securities Lending
In order to generate expense offset credits, each of the Funds may lend portfolio securities, on a short-term or a long-term basis, up to 30% of a Fund’s total assets. The loans are secured by collateral in the form of cash, cash equivalents, U.S. government and agency securities equal to at least 102% of the market value of securities loaned on U.S. securities and 105% of the market value of securities loaned on non-U.S. securities. During the term of the loan, the Funds will continue to receive any interest, dividends or amounts equivalent thereto, on the loaned securities while receiving a fee from the borrower and/or earning interest on the investment of the cash collateral. Upon termination of the loan, the borrower will return to the Funds securities identical to the loaned securities. The Funds may pay reasonable finders’, administration and custodial fees in connection with a loan of their securities and may share the interest earned on the collateral with the borrower.
The Funds bear the risk of delay in recovery of, or even loss of rights in, the securities loaned should the borrower of the securities fail financially. The Funds also bear the risk of loss in the event the securities purchased with cash collateral depreciate in value. Loans are subject to termination at the option of the borrower of the Fund. There were no securities on loan for the period ended November 30, 2009. The Funds terminated the security lending program on April 1, 2009.
Credit Facility
The Trust has a $15 million credit facility available to fund temporary or emergency borrowing expiring in March 2010. A Fund will pay its pro-rata share of an annual commitment fee plus interest on its specific borrowings. For the period ended March 31, 2009 and November 30, 2009, the Funds did not borrow against the line of credit and balance was zero
Commitments and Contingencies
In the normal course of business, the Funds may enter into contracts and agreements that contain a variety of representations and warranties which provide general indemnifications. The maximum exposure to the Funds under these arrangements is unknown, as this would involve future claims that may be made against the Funds that have not yet occurred. However, based on experience, the Funds expect the risks of loss to be remote.
Fund Expenses and Multi-Class Allocations
Each Fund bears expenses incurred specifically on its behalf plus an allocation of its share of Trust level expenses. Each share offered by a Fund has equal rights to assets but incurs certain class-specific expenses. The Funds allocate income, gains and losses, both realized and unrealized, and expenses, except for class-specific expenses, based on the relative net assets of each share class.
52
During the period ended November 30, 2009, many of the brokers with whom the Adviser places trades on behalf of the Funds provided services to the Funds in addition to trade execution. These services included payments of certain expenses on behalf of the Funds. In addition, through arrangements with the Funds’ custodian, credits realized as a result of uninvested cash balances were used to reduce the Funds’ expenses. During the period ended November 30, 2009, the credits used to reduce the Funds’ expenses were as follows:
| Fund | Credit Interest Offset | Direct Brokerage Offset | Security Lending Offset |
| U.S. Ultra Micro Cap | 9 | 991 | — |
| U.S. Micro Cap | 246 | — | 6,172 |
| U.S. Emerging Growth | 116 | 1,244 | — |
| U.S. Small to Mid Cap Growth | 17 | 1,052 | — |
| U.S. Convertible | 3,273 | 21,290 | — |
| International Growth Opportunities | 987 | — | — |
| U.S. High Yield Bond | 697 | — | — |
Use of Estimates
The preparation of financial statements in conformity with accounting principles generally accepted in the United States requires management to make estimates and assumptions that affect the amounts reported in the financial statements and accompanying notes. Actual results could differ from these estimates.
Note C — FEDERAL INCOME TAXES
The Funds intend to comply with the requirements of the Internal Revenue Code applicable to regulated investment companies and to distribute substantially all of their taxable income to shareholders. Accordingly, no provision for federal income taxes is required. A Fund investing in foreign securities records any foreign taxes on income and gains on such investments in accordance with the applicable tax rules. The Funds’ tax accounting treatment of loss deferrals, accretion, passive foreign investment companies and expiration of capital loss carryforwards is different from the financial statement recognition of income and gains.
Capital loss carryforwards may be used to offset current or future capital gains until expiration.
Income Tax Status
The Funds have adopted a policy in accordance with U.S. generally accepted accounting principles (“GAAP”) which requires management to consider accounting for the uncertainty of income taxes through the application of recognition and measurement criteria. The policy is designed to recognize the estimated taxes payable or refundable on tax returns for the current year as a tax liability or asset as well as recognize a deferred tax liability or asset for the estimated future tax effects attributable to temporary differences and carryforwards. This policy defines the threshold for recognizing the benefits of tax-return positions in the financial statements as “more-likely-than-not” to be sustained upon challenge by the taxing authority. The policy also requires management of the Funds to evaluate tax positions taken (or expected to be taken) in the Funds’ tax returns and requires measurement of a tax position meeting the more-likely-than-not criterion, based on the largest benefit that is more than 50 percent likely to be realized. As of November 30, 2009, tax years 2004 through 2009 remain subject to examination by major tax jurisdictions, which include the United States of America and the State of Delaware, but the Funds have no examinations in progress. As of and during the period ended November 30, 2009, the Funds did not have a liability for unrecognized tax benefits.
Distributions to Shareholders
The Funds record distributions to shareholders on the ex-dividend date. Distributions are determined in accordance with income tax regulations that may differ from GAAP. Accordingly, the Funds’ capital accounts are periodically reclassified to reflect income and gains available for distribution under income tax regulations. The Funds make income and capital gain distributions at least annually. Funds with income objectives make distributions either quarterly or monthly in accordance with the prospectuses. Due to the concentrated shareholder base, a Fund at any time may be categorized for tax purposes as a Personal Holding Company as defined under Section 542 of the Internal Revenue Code.
53
Nicholas-Applegate Institutional Funds
Notes to Financial Statements – Continued
The tax characters of distributions paid during the period April 1, 2009 through November 30, 2009 were as follows:
| Distribution paid from: | ||||||||||||||||
| Fund | Ordinary Income | Net long term capital gain | Total taxable distributions | Total distributions paid(1) | ||||||||||||
| U.S. Ultra Micro Cap | — | — | — | — | ||||||||||||
| U.S. Micro Cap | — | — | — | — | ||||||||||||
| U.S. Emerging Growth | — | — | — | — | ||||||||||||
| U.S. Small to Mid Cap Growth | — | — | — | — | ||||||||||||
| U.S. Convertible | 6,286,871 | — | 6,286,871 | 6,286,871 | ||||||||||||
| International Growth Opportunities | — | — | — | — | ||||||||||||
| U.S. High Yield Bond | 3,919,569 | — | 3,919,569 | 3,919,569 | ||||||||||||
The tax characters of distributions paid during the fiscal year ended March 31, 2009 were as follows:
| Distribution paid from: | ||||||||||||||||
| Fund | Ordinary Income | Net long term capital gain | Total taxable distributions | Total distributions paid(1) | ||||||||||||
| U.S. Ultra Micro Cap | — | — | — | — | ||||||||||||
| U.S. Micro Cap | 18,218 | — | 18,218 | 18,218 | ||||||||||||
| U.S. Emerging Growth | — | — | — | — | ||||||||||||
| U.S. Small to Mid Cap Growth | — | — | — | — | ||||||||||||
| U.S. Convertible | 7,466,553 | 1,052,509 | 8,519,062 | 8,519,062 | ||||||||||||
| International Growth Opportunities | 5,778,238 | 8,811,650 | 14,589,888 | 14,589,888 | ||||||||||||
| U.S. High Yield Bond | 4,454,710 | — | 4,454,710 | 4,454,710 | ||||||||||||
The tax characters of distributions paid during the fiscal year ended March 31, 2008 were as follows:
| Distribution paid from: | ||||||||||||||||
| Fund | Ordinary Income | Net long term capital gain | Total taxable distributions | Total distributions paid(1) | ||||||||||||
| U.S. Ultra Micro Cap | — | — | — | — | ||||||||||||
| U.S. Micro Cap | 2,775,867 | 7,119,776 | 9,895,643 | 9,895,643 | ||||||||||||
| U.S. Emerging Growth | — | 745,409 | 745,409 | 745,409 | ||||||||||||
| U.S. Small to Mid Cap Growth | — | — | — | — | ||||||||||||
| U.S. Convertible | 3,242,287 | 899,190 | 4,141,477 | 4,141,477 | ||||||||||||
| International Growth Opportunities | 18,430,532 | 24,802,296 | 43,232,828 | 43,232,828 | ||||||||||||
| U.S. High Yield Bond | 5,354,151 | — | 5,354,151 | 5,354,151 | ||||||||||||
54
As of November 30, 2009, the components of accumulated earnings/(deficit) on a tax basis were as follows:
| Components of accumulated earnings/(deficit): | ||||||||||||||||||||||||
| Fund | Undistributed ordinary income | Undistributed long-term capital gains | Accumulated earnings | Accumulated capital and other losses | Unrealized appreciation/ (depreciation) | Total accumulated earning/(deficit) | ||||||||||||||||||
| U.S. Ultra Micro Cap | — | — | — | (424,142 | )(2) | 377,516 | (3) | (46,626 | ) | |||||||||||||||
| U.S. Micro Cap | — | — | — | (17,385,696 | )(2) | 7,574,332 | (3) | (9,811,364 | ) | |||||||||||||||
| U.S. Emerging Growth | — | — | — | (4,677,127 | )(2) | 2,087,438 | (3) | (2,589,689 | ) | |||||||||||||||
| U.S. Small to Mid Cap Growth | — | — | — | (1,773,263 | )(2) | 803,809 | (3) | (969,454 | ) | |||||||||||||||
| U.S. Convertible | 3,162,219 | — | — | (41,231,664 | )(2) | 42,494,517 | (3) | 4,425,072 | ||||||||||||||||
| International Growth Opportunities | 1,580,019 | — | — | (51,568,434 | )(2) | 17,670,230 | (3) | (32,318,185 | ) | |||||||||||||||
| U.S. High Yield Bond | 192,047 | — | — | (4,633,578 | )(2) | 3,779,048 | (3) | (662,483 | ) | |||||||||||||||
| (1) | Total distributions paid differ from the Statement of Changes in Net Assets because for tax purposes, dividends are recognized when actually paid. |
| (2) | The following Funds had net capital loss carryforwards of approximately: |
| Fund | Net Capital Loss CarryForward (in 000’s) | Expiration | Post October Losses (in 000’s) |
| U.S. Ultra Micro Cap | 263 | November 30, 2017 | 4 |
| 157 | November 30, 2016 | ||
| U.S. Micro Cap | 10,877 | November 30, 2017 | 89 |
| 6,420 | November 30, 2016 | ||
| U.S. Emerging Growth | 1,975 | November 30, 2017 | — |
| 1,672 | November 30, 2016 | ||
| 1,030 | November 30, 2010 | ||
| U.S. Small to Mid Cap Growth | 897 | November 30, 2017 | — |
| 777 | November 30, 2016 | ||
| 99 | November 30, 2015 | ||
| U.S. Convertible | 23,723 | November 30, 2017 | 680 |
| 11,402 | November 30, 2016 | ||
| 5,427 | November 30, 2010 | ||
| International Growth Opportunities | 18,732 | November 30, 2017 | — |
| 13,102 | November 30, 2016 | ||
| 19,734 | November 30, 2010 | ||
| U.S. High Yield Bond | 2,309 | November 30, 2017 | 23 |
| 2,302 | November 30, 2016 |
To the extent future capital gains are offset by capital loss carryforwards, such gains will not be distributed. The availability of loss carryforwards to any future years may be substantially limited as a result of past or future ownership changes as determined under Internal Revenue Code Section 382.
Net capital losses incurred after October 31, and within the taxable year are deemed to arise on the first business day of the Fund’s next taxable year. For the periodr ended November 30, 2009, the Fund deferred to November 30, 2010 post-October capital and currency losses.
| (3) | The difference between book-basis and tax-basis unrealized appreciation/(depreciation) is attributable primarily to the tax deferral of losses on wash sales. |
55
Nicholas-Applegate Institutional Funds
Notes to Financial Statements – Continued
Note D — TRANSACTIONS WITH AFFILIATES
Investment Advisory Fee
The Adviser receives a monthly fee at an annual rate based on the average daily net assets of the Funds. The investment advisory fee rate for each of the Funds is listed in the table below.
Administrative & Shareholder Services Fee
On January 24, 2006, the Funds entered into an Administration Agreement whereby the Funds pay for the administrative services they require under what is essentially an all-in fee structure. Class I, II, III & IV shareholders of the Funds pay an administrative fee to the Adviser computed as a percentage of the Funds’ average net assets attributable in the aggregate to Class I, II, III & IV shares. The Adviser, in turn, provides or procures administrative and shareholder services for Class I, II, III & IV shareholders and also bears the costs of most third-party administrative services required by the Funds, including audit, custodial, portfolio accounting, legal, transfer agency and printing costs. The administrative fees paid to the Adviser may exceed the related costs.
The investment advisory and administrative services fees are charged at the following annual rates:
| Advisory Fee | Administration Fee* | ||||
| Class I | Class II | Class III | Class IV | ||
| U.S. Ultra Micro Cap | 1.50% | 0.73% | — | — | — |
| U.S. Micro Cap | 1.00% | 0.54% | — | — | — |
| U.S. Emerging Growth | 0.75% | 0.41% | — | — | — |
| U.S. Small to Mid Cap Growth | 0.50% | 0.40% | — | — | — |
| U.S. Convertible | 0.55% | 0.44% | 0.34% | — | 0.19% |
| International Growth Opportunities | 0.70% | 0.69% | 0.54% | 0.49% | — |
| U.S. High Yield Bond | 0.40% | 0.20% | — | — | — |
| * | Excludes trustees’ fees and expenses, tax, brokerage and interest expenses, and extraordinary expenses. |
Affiliated Securities Lending Fees
The U.S. Micro Cap Fund participated in an agency securities lending program with an affiliated agent, Dresdner Bank AG, a direct subsidiary to Allianz AG and affiliate to the Trust (“Dresdner Program”). Income generated from the investment of cash collateral, less negotiated rebate fees paid to borrowers and transaction costs, was divided pursuant to the Dresdner Program Agency Agreement between the Funds and Dresdner Bank AG. The Trust terminated the securities lending program with Dresdner Bank AG on April 1, 2009.
Trustee Compensation
Certain officers of the Trust are also officers of the Adviser and the Distributor. The Trustees who are not affiliated with the Adviser and attended all scheduled meetings will receive an annual compensation of approximately $36,000 each from the Trust, except for the chairman of the Board of Trustees of the Trust and the chairman of the Audit Committee, who will receive an annual compensation of approximately $42,000 and $42,500, respectively, from the Trust.
56
Note E — INVESTMENT TRANSACTIONS
The following table presents purchases and sales of securities, excluding short-term investments, as of November 30, 2009, to indicate the volume of transactions in each Fund. The tax cost of securities held at November 30, 2009, and the related gross and net unrealized appreciation and depreciation, provide aggregate information on a tax basis against which future gains and losses on these investments are measured for distribution purposes.
| Fund | Purchases (in 000’s) | Sales (in 000’s) | Tax Cost (in 000’s) | Gross Unrealized Appreciation (in 000’s) | Gross Unrealized Depreciation (in 000’s) | Net Unrealized Appreciation (Depreciation) (in 000’s) | ||||||||||||||||||
| U.S. Ultra Micro Cap | $ | 1,374 | $ | 1,335 | $ | 1,403 | $ | 444 | $ | (66 | ) | $ | 378 | |||||||||||
| U.S. Micro Cap | 42,099 | 44,091 | 46,392 | 10,541 | (2,967 | ) | 7,574 | |||||||||||||||||
| U.S. Emerging Growth | 15,842 | 12,156 | 14,339 | 2,615 | (527 | ) | 2,088 | |||||||||||||||||
| U.S. Small to Mid Cap Growth | 4,787 | 4,728 | 3,749 | 909 | (105 | ) | 804 | |||||||||||||||||
| U.S. Convertible | 357,271 | 301,242 | 377,016 | 45,065 | (2,571 | ) | 42,494 | |||||||||||||||||
| International Growth Opportunities | 68,724 | 57,618 | 100,137 | 23,383 | (5,730 | ) | 17,653 | |||||||||||||||||
| U.S. High Yield Bond | 68,724 | 57,618 | 65,824 | 4,105 | (326 | ) | 3,779 | |||||||||||||||||
Note F — FINANCIAL INSTRUMENTS
The Funds may be party to financial instruments with off balance sheet risks, including forward non-U.S. currency contracts and futures, primarily in an attempt to minimize the risk to a Fund in respect of its portfolio transactions. These instruments may involve market and/or credit risk in excess of the amount recognized in the Statement of Assets and Liabilities. Risks arise from the possible inability of counterparties to meet the terms of their contracts and from unexpected movement in currencies, securities values and interest rates.
The contract amounts indicate the extent of the Funds’ involvement in such contracts. As of November 30, 2009 the Funds were not party to any such agreements.
Note G — FAIR VALUE OF FINANCIAL INSTRUMENTS
In accordance with GAAP, the Funds are required to disclose information regarding the fair value measurements of a Fund’s assets and liabilities. Fair value is the price that would be received to sell an asset or paid to transfer a liability in an orderly transaction between market participants at the measurement date. The disclosure requirement established a three-tier hierarchy to maximize the use of observable market data, minimize the use of unobservable inputs and establish classification of fair value measurements for disclosure purposes. Inputs refer broadly to the assumptions that market participants would use in pricing the asset or liability, including assumptions about risk; for example, the risk inherent in a particular valuation technique used to measure fair value, including such a pricing model and/or the risk inherent in the inputs to the valuation technique. Inputs may be observable or unobservable. Observable inputs are inputs that reflect the assumptions market participants would use in pricing the asset or liability developed based on market data obtained from sources independent of the reporting entity. Unobservable inputs are inputs that reflect the reporting entity’s own assumptions about the assumptions market participants would use in pricing the asset or liability developed based on the best information available in the circumstances.
On June 15, 2009, the Funds adopted additional disclosure requirements which provide the reader of the Funds’ financial statements additional guidance for estimating fair value when the volume and level of activity for the asset or liability have significantly decreased. Additional guidance on identifying circumstances that indicate a transaction is not orderly. The amended requirement emphasizes that even if there has been a significant decrease in the volume and level of activity for the asset or liability and regardless of the valuation technique(s) used, the objective of a fair value measurement remains the same. The three levels defined by the fair value measurement requirement hierarchy are as follows:
Level 1 — quoted prices in active markets for identical securities.
Level 2 — significant observable inputs (including quoted prices for similar securities, interest rates, prepayment speeds, credit risk, etc.).
Level 3 — significant unobservable inputs (including the Fund’s own assumptions in determining the fair value of investments).
In some instances, the inputs used to measure fair value might fall in different levels of the fair value hierarchy. The level in the fair value hierarchy within which the fair value measurement in its entirety falls is determined based on the lowest input level that is significant to the fair value measurement in its entirety. Because of the inherent uncertainties of valuation, the values reflected in the financial statements may materially differ from the value received upon actual sale of those investments.
57
Nicholas-Applegate Institutional Funds
Notes to Financial Statements – Continued
The following table summarizes the valuation of each Fund’s securities as of November 30, 2009, using the fair value hierarchy:
| U.S. Ultra Micro Cap | Level 1 Quoted Prices | Level 2 Other Significant Observable Inputs | Level 3 Significant Unobservable Inputs | Value at 11/30/2009 | ||||||||||||
| Investments in Securities | ||||||||||||||||
| Common Stock: | 1,736,745 | — | — | 1,736,745 | ||||||||||||
| Short-Term Investments: | 44,075 | — | — | 44,075 | ||||||||||||
| Total Investments in Securities | 1,780,820 | — | — | 1,780,820 | ||||||||||||
| U.S. Micro Cap | Level 1 Quoted Prices | Level 2 Other Significant Observable Inputs | Level 3 Significant Unobservable Inputs | Value at 11/30/2009 | ||||||||||||
| Investments Securities | ||||||||||||||||
| Common Stock: | 52,999,887 | — | — | 52,999,887 | ||||||||||||
| Short-Term Investments: | 966,291 | — | — | 986,291 | ||||||||||||
| Total Investments in Securities | 53,966,178 | — | — | 53,966,178 | ||||||||||||
| U.S. Emerging Growth | Level 1 Quoted Prices | Level 2 Other Significant Observable Inputs | Level 3 Significant Unobservable Inputs | Value at 11/30/2009 | ||||||||||||
| Investments in Securities | ||||||||||||||||
| Common Stock: | 16,033,533 | — | — | 16,033,533 | ||||||||||||
| Limited Partnerships: | 111,888 | — | — | 111,888 | ||||||||||||
| Short-Term Investments: | 281,141 | — | — | 281,141 | ||||||||||||
| Total Investments in Securities | 16,426,562 | — | — | 16,426,562 | ||||||||||||
| U.S. Small to Mid Cap Growth | Level 1 Quoted Prices | Level 2 Other Significant Observable Inputs | Level 3 Significant Unobservable Inputs | Value at 11/30/2009 | ||||||||||||
| Investments in Securities | ||||||||||||||||
| Common Stock: | 4,455,916 | — | — | 4,455,916 | ||||||||||||
| Limited Partnerships: | 31,968 | — | — | 31,968 | ||||||||||||
| Short-Term Investments: | 65,000 | — | — | 65,000 | ||||||||||||
| Total Investments in Securities | 4,552,884 | — | — | 4,552,884 | ||||||||||||
| U.S. Convertible | Level 1 Quoted Prices | Level 2 Other Significant Observable Inputs | Level 3 Significant Unobservable Inputs | Value at 11/30/2009 | ||||||||||||
| Investments in Securities | ||||||||||||||||
| Convertible Corporate Bonds: | — | 326,861,731 | — | 326,861,731 | ||||||||||||
| Convertible Preferred Stock: | 73,772,206 | — | — | 73,772,206 | ||||||||||||
| Common Stock: | 6,632,692 | — | — | 6,632,692 | ||||||||||||
| Short Term Investments | 12,243,498 | — | — | 12,243,498 | ||||||||||||
| Total Investments in Securities | 92,648,396 | 326,861,731 | — | 419,510,127 | ||||||||||||
58
| International Growth Opportunities | Level 1 Quoted Prices | Level 2 Other Significant Observable Inputs | Level 3 Significant Unobservable Inputs | Value at 11/30/2009 | ||||||||||||
| Investments in Securities | ||||||||||||||||
| Common Stock: | ||||||||||||||||
| Australia | 6,925,859 | — | — | 6,925,859 | ||||||||||||
| Belgium | 4,468,605 | — | — | 4,468,605 | ||||||||||||
| Bermuda | 1,319,004 | — | — | 1,319,004 | ||||||||||||
| Brazil | 2,005,259 | — | — | 2,005,259 | ||||||||||||
| Canada | 7,807,048 | — | — | 7,807,048 | ||||||||||||
| France | 4,347,968 | — | — | 4,347,968 | ||||||||||||
| Germany | 7,670,116 | — | — | 7,670,116 | ||||||||||||
| Greece | 2,094,470 | — | — | 2,094,470 | ||||||||||||
| Hong Kong | 2,239,084 | — | — | 2,239,084 | ||||||||||||
| Ireland | 3,462,928 | — | — | 3,462,928 | ||||||||||||
| Italy | 5,885,846 | — | — | 5,885,846 | ||||||||||||
| Japan | 12,702,525 | — | — | 12,702,525 | ||||||||||||
| Netherlands | 2,736,822 | — | — | 2,736,822 | ||||||||||||
| Norway | 1,112,031 | — | — | 1,112,031 | ||||||||||||
| Portugal | 1,699,037 | — | — | 1,699,037 | ||||||||||||
| Republic of China | 2,699,570 | — | 3,133 | 2,702,703 | ||||||||||||
| Singapore | 4,103,924 | — | — | 4,103,924 | ||||||||||||
| Spain | 1,208,771 | — | — | 1,208,771 | ||||||||||||
| Switzerland | 3,134,002 | — | — | 3,134,002 | ||||||||||||
| Turkey | 1,698,642 | — | — | 1,698,642 | ||||||||||||
| United Kingdom | 27,185,133 | — | — | 27,185,133 | ||||||||||||
| Equity Linked Securities: | ||||||||||||||||
| Taiwan | — | 4,332,014 | — | 4,332,014 | ||||||||||||
| Preferred Stock: | ||||||||||||||||
| Brazil | 2,021,154 | — | — | 2,021,154 | ||||||||||||
| Short-Term Investments: | 4,926,758 | — | — | 4,926,758 | ||||||||||||
| Total Investments in Securities | 113,454,556 | 4,332,014 | 3,133 | 117,789,703 | ||||||||||||
| U.S. High Yield | Level 1 Quoted Prices | Level 2 Other Significant Observable Inputs | Level 3 Significant Unobservable Inputs | Value at 11/30/2009 | ||||||||||||
| Investments in Securities | ||||||||||||||||
| Corporate Bonds: | — | 60,601,004 | — | 60,601,004 | ||||||||||||
| Foreign Corporate Bonds: | — | 6,112,281 | — | 6,112,281 | ||||||||||||
| Agency Bond | — | 723,690 | — | 723,690 | ||||||||||||
| Short-Term Investments: | 2,166,261 | — | — | 2,166,261 | ||||||||||||
| Total Investments in Securities | 2,166,261 | 67,436,975 | — | 69,603,236 | ||||||||||||
59
Nicholas-Applegate Institutional Funds
Notes to Financial Statements – Continued
A roll forward of fair value measurements using significant unobservable inputs (Level 3) for the period April 1, 2009 through November 30, 2009 was as follows:
| International Growth Opportunities Fund | ||||||||||||||||||||||||
Beginning Balance 3/31/2009 | Purchase, (Sales) and Settlements | Accrued Discounts (Premiums) | Net Realized and Unrealized Gain(Loss) | Transfers in and/or out of Level 3 | Ending Balance 11/30/2009 | |||||||||||||||||||
| Investments in Securities | ||||||||||||||||||||||||
| Common Stock | 3,133 | — | — | — | — | 3,133 | ||||||||||||||||||
| Total Investments in Securities | 3,133 | — | — | — | — | 3,133 | ||||||||||||||||||
Note H — MARKET PRICE RISK
The prices of securities held by the Funds may decline in response to certain events, including those directly involving the companies whose securities are owned by the Funds; conditions affecting the general economy; overall market changes; local, regional or global political, social or economic instability; and currency and interest rate fluctuations. The growth-oriented, equity-type securities generally purchased by the Funds may involve large price swings and potential for loss.
Investments in securities issued by entities based outside the United States may be subject to the risks described above to a greater extent and may also be affected by currency controls; different accounting, auditing, financial reporting, and legal standards and practices in some countries; expropriation; changes in tax policy; greater market volatility; differing securities market structures; higher transaction costs; and various administrative difficulties, such as delays in clearing and settling portfolio transactions or in receiving payment of dividends. These risks may be heightened in connection with investments in developing countries.
Note I — FINANCIAL DERIVATIVE INSTRUMENTS
In accordance with GAAP, the Funds are required to disclose certain information regarding derivative instruments and hedging activities. The Funds are required to provide enhanced disclosures about the use of and accounting for derivative instruments using a tabular format. Disclosing the fair values of derivative instruments and their gains and losses in a tabular format should provide a more complete picture of the location in an entity’s financial statements of both the derivative positions existing at period end and the effect of using derivatives during the reporting period. Disclosing information about credit-risk-related contingent features should provide information on the potential effect on an entity’s liquidity from using derivatives. Finally, the additional disclosure affords the reader the ability to cross-reference the information within the footnotes, which should help users of financial statements locate important information about derivative instruments. As of November 30, 2009, the Funds did not hold any derivative instruments.
Note J — SIGNIFICANT SHAREHOLDER CONCENTRATION
As of November 30, 2009, the Fund had individual shareholders’ and/or omnibus shareholder accounts (which are comprised of a group of individual shareholders) which individually amounted to more than 10% of the total shares outstanding of a Fund as detailed below.
| Fund | % of Fund | Number of Shareholders |
| U.S. Ultra Micro Cap | 92.16% | 4 |
| U.S. Micro Cap | 75.55% | 3 |
| U.S. Emerging Growth | 73.10% | 3 |
| U.S. Small to Mid Cap Growth | 93.14% | 1 |
| U.S. Convertible | 74.54% | 1 |
| International Growth Opportunities | 53.06% | 3 |
| U.S. High Yield | 56.23% | 2 |
Note K — ANNOUNCEMENT OF REORGANIZATION
At a meeting of the Board of Trustees of the Trust held on November 13, 2009, the Board approved a form of Plan of Reorganization (the “Plan”) with respect to each of the Funds. The Plan provides for the transfer of each Fund’s assets to a corresponding series of Allianz Funds Multi-Strategy Trust with substantially similar investment objectives and strategies in a tax-free exchange. The reorganization of each Fund is subject to approval by the shareholders of the Fund. In conjunction with the reorganization of the Funds the Board also approved a change in the Funds’ fiscal year end from March 31 to November 30.
60
Note L — EVALUATION OF SUBSEQUENT EVENTS
In accordance with GAAP, the Funds are required to recognize in the financial statements the effects of all subsequent events that provide additional evidence about conditions that existed at the date of the balance sheet, including the estimates inherent in the process of preparing financial statements. In preparing these financial statements, the Funds have evaluated events and transactions for potential recognition or disclosure through January 28, 2010, the date the financial statements were issued.
61
Nicholas-Applegate Institutional Funds
Report of Independent Registered Public Accounting Firm
To the Shareholders and Board of Trustees of
Nicholas-Applegate Institutional Funds
In our opinion, the accompanying statements of assets and liabilities, including the schedules of investments, and the related statements of operations and of changes in net assets and the financial highlights present fairly, in all material respects, the financial position of the U.S. Ultra Micro Cap Fund, U.S. Micro Cap Fund, U.S. Emerging Growth Fund, U.S. Small to Mid Cap Growth Fund, U.S. Convertible Fund, International Growth Opportunities Fund and U.S. High Yield Bond Fund (collectively, the “Funds”) at November 30, 2009, the results of each of their operations, the changes in each of their net assets and the financial highlights for each of the periods presented, in conformity with accounting principles generally accepted in the United States of America. These financial statements and financial highlights (hereafter referred to as “financial statements”) are the responsibility of the Funds’ management; our responsibility is to express an opinion on these financial statements based on our audits. We conducted our audits of these financial statements in accordance with the standards of the Public Company Accounting Oversight Board (United States). Those standards require that we plan and perform the audit to obtain reasonable assurance about whether the financial statements are free of material misstatement. An audit includes examining, on a test basis, evidence supporting the amounts and disclosures in the financial statements, assessing the accounting principles used and significant estimates made by management, and evaluating the overall financial statement presentation. We believe that our audits, which included confirmation of securities at November 30, 2009 by correspondence with the custodian and brokers, provide a reasonable basis for our opinion.
As explained in Note K to the financial statements, on November 13, 2009, the Board of Trustees of the Funds approved a reorganization of the Funds through a transfer of the Funds’ assets into a corresponding series of Allianz Funds Multi-Strategy Trust.
/s/ PricewaterhouseCoopers LLP
Los Angeles, California
January 28, 2010
62
Shareholder Expense Example
As a shareholder of a Fund, you incur two types of costs: (1) transaction costs, including redemption fees, and (2) ongoing costs, including management fees and other Fund expenses. This example is intended to help you understand your ongoing costs (in dollars) of investing in the Funds and to compare these costs with the ongoing costs of investing in other mutual funds.
The example is based on an investment of $1,000 invested at the beginning of the period and held for the entire period (June 1, 2009 to November 30, 2009).
ACTUAL EXPENSES
The first line of the table below for each Fund provides information about actual account values and actual expenses. You may use the information in this line, together with the amount you invested, to estimate the expenses that you paid over the period. Simply divide your account value by $1,000 (for example, an $8,600 account value divided by $1,000 = 8.6), then multiply the result by the number in the first line for a Fund under the heading “Expenses Paid During Period” to estimate the expenses you paid on your account during this period.
HYPOTHETICAL EXAMPLE FOR COMPARISON PURPOSES
The second line of the table below for each Fund provides information about hypothetical account values and hypothetical expenses based on a Fund’s actual expense ratio and an assumed rate of return of 5% per year before expenses, which is not the Fund’s actual return. The hypothetical account values and expenses may not be used to estimate the actual ending account balance or expenses you paid for the period. You may use this information to compare the ongoing costs of investing in a Fund and other funds. To do so, compare this 5% hypothetical example with the 5% hypothetical examples that appear in the shareholder reports of the other funds.
Please note that the expenses shown in the table are meant to highlight your ongoing costs only and do not reflect any transaction costs. Therefore, the second line of the table is useful in comparing ongoing costs only, and will not help you determine the relative total costs of owning different funds. In addition, if these transactional costs were included, your costs would have been higher.
Beginning Account Value June 1, 2009 | Ending Account Value November 30, 2009 | Expenses Paid During the Period* June 1, 2009 to November 30, 2009 | Annualized Expense Ratio | |
| U.S. Ultra Micro Cap — Class I | ||||
| Actual | $1,000.00 | $1,210.00 | $13.01 | 2.35% |
| Hypothetical (5% return before expenses) | $1,000.00 | $1,013.30 | $11.85 | 2.35% |
| U.S. Micro Cap — Class I | ||||
| Actual | $1,000.00 | $1,157.40 | $7.98 | 1.48% |
| Hypothetical (5% return before expenses) | $1,000.00 | $1,017.67 | $7.46 | 1.48% |
| U.S. Emerging Growth — Class I | ||||
| Actual | $1,000.00 | $1,174.10 | $6.51 | 1.19% |
| Hypothetical (5% return before expenses) | $1,000.00 | $1,019.08 | $6.04 | 1.19% |
| U.S. Small to Mid Cap Growth — Class I | ||||
| Actual | $1,000.00 | $1,182.20 | $5.31 | 0.97% |
| Hypothetical (5% return before expenses) | $1,000.00 | $1,020.20 | $4.92 | 0.97% |
| U.S. Convertible — Class I | ||||
| Actual | $1,000.00 | $1,165.70 | $5.52 | 1.02% |
| Hypothetical (5% return before expenses) | $1,000.00 | $1,019.97 | $5.15 | 1.02% |
| U.S. Convertible — Class II | ||||
| Actual | $1,000.00 | $1,166.10 | $4.96 | 0.91% |
| Hypothetical (5% return before expenses) | $1,000.00 | $1,020.49 | $4.62 | 0.91% |
| U.S. Convertible — Class IV | ||||
| Actual | $1,000.00 | $1,166.90 | $4.13 | 0.76% |
| Hypothetical (5% return before expenses) | $1,000.00 | $1,021.25 | $3.86 | 0.76% |
| International Growth Opportunities — Class I | ||||
| Actual | $1,000.00 | $1,276.50 | $8.13 | 1.43% |
| Hypothetical (5% return before expenses) | $1,000.00 | $1,017.88 | $7.26 | 1.43% |
| International Growth Opportunities — Class II | ||||
| Actual | $1,000.00 | $1,262.80 | $7.27 | 1.28% |
| Hypothetical (5% return before expenses) | $1,000.00 | $1,018.64 | $6.49 | 1.28% |
63
Shareholder Expense Example – Continued
Beginning Account Value June 1, 2009 | Ending Account Value November 30, 2009 | Expenses Paid During the Period* June 1, 2009 to November 30, 2009 | Annualized Expense Ratio | |
| International Growth Opportunities — Class III | ||||
| Actual | $1,000.00 | $1,263.00 | $6.99 | 1.23% |
| Hypothetical (5% return before expenses) | $1,000.00 | $1,018.89 | $6.23 | 1.23% |
| U.S. High Yield Bond — Class I | ||||
| Actual | $1,000.00 | $1,158.60 | $3.34 | 0.62% |
| Hypothetical (5% return before expenses) | $1,000.00 | $1,021.98 | $3.13 | 0.62% |
| * | Expenses are equal to the Fund’s annualized expense ratio, multiplied by the average account value over the period. |
64
Supplementary Information — (Unaudited)
PROXY VOTING
The Adviser votes proxies on behalf of the Funds pursuant to written policies and procedures adopted by the Funds. To obtain free information on how your Funds’ securities were voted, please call the Funds at 1-800-551-8043 or visit the Funds’ website at www.nacm.com. You may also view how the Fund’s securities were voted by visiting the Securities & Exchange Commission’s (the “SEC”) website at www.sec.gov. Additionally, information regarding each Fund’s proxy voting record for the most recent twelve month period ended June 30 is also available, free of charge, by calling the Funds at 1-800-551-8043 and from the SEC’s website at www.sec.gov.
ADDITIONAL FEDERAL TAX INFORMATION
The Jobs and Growth Tax Relief Reconciliation Act of 2003 allows a fund to distribute certain dividends paid to its eligible shareholders as qualified dividend income. Of the ordinary income (including short-term capital gain) distributions made by the Funds during the period ended November 30, 2009, the following percentages represent the amount of qualified income within each Fund:
| U.S. Convertible | 100 | % | ||
| U.S. High Yield | 100 |
The amounts which represent income derived from sources within, and taxes paid to non-U.S. countries or possessions of the United States are as follows:
| Fund | Foreign Source Income | FTC Total: |
| International Growth Opportunities | $1,607,772 | $132,588 |
The percentage of ordinary dividends paid by the Funds during the period ended November 30 2009, which qualify for the Dividends Received Deduction available to corporate shareholders was:
| Fund | Percentage |
| U.S. Convertible | 29.03% |
65
Supplementary Information — (Unaudited) — Continued
QUARTERLY FILING
The Funds provide a complete list of portfolio holdings four times in each fiscal year, at the end of each calendar quarter. For the second and fourth quarters, the portfolio holdings appear in the Funds’ semiannual and annual reports to shareholders. For the first and third quarters, the Funds file their portfolio holdings with the Securities and Exchange Commission on Form N-Q. Shareholders can look up the Funds’ Form N-Q on the SEC’s website at www.sec.gov. Forms N-Q may also be reviewed and copied at the SEC’s Public Reference Room in Washington, DC. To find out more about this public service, call the SEC at 1-202-942-8090.
TRUSTEE APPROVAL OF INVESTMENT ADVISORY AGREEMENT
Based upon the recommendation of the Contract Committee of the Board of Trustees, a Committee comprised of all of the Independent Trustees of the Trust (“Funds”), the Trustees unanimously approved the continuance of the Investment Advisory Agreement between the Funds and Nicholas-Applegate Capital Management (“Nicholas-Applegate”) at a meeting held on November 13, 2009. In approving the Investment Advisory Agreement, the Board of Trustees, through its Contract Committee, evaluated a comprehensive package of materials, including performance and expense data for other funds with similar asset sizes, investment objectives and policies that had been provided by Lipper Inc. (“Lipper”). Prior to making its recommendation, the Contract Committee reviewed the proposed continuance of the Investment Advisory Agreement with representatives of Nicholas-Applegate and with independent legal counsel to the Independent Trustees of the Trust. Members of the Contract Committee also met privately with independent legal counsel to discuss the factors they felt were relevant. The factors included: (1) the performance of the Funds and the financial condition of the Adviser and the Funds; (2) comparative performance data for each of the Funds and other funds with similar investment objectives/policies and to a relevant index; (3) the nature, extent and quality of investment advisory services rendered by Nicholas-Applegate; (4) marketing and sales efforts dedicated to the Funds; (5) compensation paid to Nicholas-Applegate; (6) costs borne by Nicholas-Applegate; (7) comparative fee and expense data for each of the Funds and other funds with similar investment objectives/policies; (8) Nicholas-Applegate’s policies and practices regarding allocation of portfolio transactions, best price and execution of portfolio transactions, and soft dollar arrangements; (9) fair valuation policies and procedures; (10) expense offset arrangements; (11) portfolio turnover rates; (12) fall-out benefits, such as research received pursuant to Section 28(e) of the Securities Exchange Act of 1934, as amended; (13) fees that Nicholas-Applegate charges its other clients with similar investment objectives/policies; (14) experience and qualifications of the member of the portfolio management teams; (15) material changes in personnel managing the Funds; and (16) the time dedicated by Nicholas-Applegate’s senior management, portfolio managers and other key personnel, including the Chief Executive Officer and the Chief Investment Officer, to the Funds. In their deliberations, the Contract Committee did not identify any particular information that was controlling, and each member of the Contract Committee attributed different weights to the various factors. The Contract Committee determined that the fees of the Investment Advisory Agreement between each of the Funds and Nicholas-Applegate were fair and reasonable in light of the services performed, expenses incurred and such other matters as the Contract Committee considered relevant in the exercise of their reasonable judgment. The Contract Committee also separately discussed the material factors and conclusions that formed the basis for the Contract Committee to recommend that the Board of Trustees approve the Investment Advisory Agreement for each of the Funds.
SERVICES PROVIDED BY NICHOLAS-APPLEGATE
Nicholas-Applegate manages the portfolios of each of the Funds under the direction of the Board of Trustees and manages each Fund consistent with each Fund’s investment objectives and policies. Nicholas-Applegate provides each Fund with office space and such other services and personnel as are necessary for its operations. The Contract Committee considered the scope and quality of services provided by Nicholas-Applegate under the Investment Advisory Agreement. The Contract Committee considered the quality of the investment research capabilities of Nicholas-Applegate and the other services to be provided to the Funds by Nicholas-Applegate, such as selecting broker-dealers for executing portfolio transactions, serving as the Funds’ administrator, producing shareholder reports, providing support services for the Trustees and Board Committees and overseeing the activities of other service providers, including monitoring compliance with various Fund policies and procedures and with applicable securities laws and regulations. The Contract Committee concluded that the nature, extent and quality of the services provided by Nicholas-Applegate to the Funds were appropriate and consistent with the terms of the Investment Advisory Agreement and that the Funds will continue to benefit from the services provided under the Investment Advisory Agreement with Nicholas-Applegate.
COST OF SERVICES & FUND EXPENSES
The Contract Committee examined the fee information and expenses for each of the Funds in comparison to information from other comparable funds as provided by Lipper. The Contract Committee agreed that overall the Funds’ management fees and expense ratios were reasonable in relation to the management fees and expense ratios of the Funds’ peer groups selected by Lipper. The Contract Committee also reviewed Nicholas-Applegate’s management fees charged to its institutional separate account clients and for sub-advised funds (funds for which Nicholas-Applegate provides portfolio management services only). The Contract Committee also reviewed the profitability analysis for each Fund. The Contract Committee concluded that overall the management fees and other compensation to be paid by the Funds to Nicholas-Applegate were reasonable in relation to the nature and quality of the services to be provided, taking into account (1) the fees charged by other advisers for managing comparable mutual funds with similar strategies and assets; (2) the fees that Nicholas-Applegate charges to other clients; (3) the estimated overall expense ratio of the Funds, taking into account the Funds’ expense offset arrangements with brokers, custodians and third party services providers; and (4) the Funds’ performance in light of challenging market conditions.
66
INVESTMENT RESULTS
The Contract Committee considered the investment results of each of the Funds as compared to funds with similar investment objectives and policies as determined by Lipper and with relevant securities indices. In addition to the information received by the Contract Committee for their meeting, Nicholas-Applegate provides detailed performance information for each Fund at each regular meeting of the Board of Trustees. The Contract Committee reviewed information showing absolute and relative performance of each Fund over 1-year, 3-year, 5-year and 10-year periods as applicable.
U.S. Ultra Micro Cap Fund
The Contract Committee reviewed Fund peer group information in connection with the approval of the Fund that commenced investment operations on January 28, 2008. The Committee compared the Fund’s performance since inception which had outperformed relative to the Russell Microcap Growth Index. Lipper performance peer group data was not available due in part to the lack of Lipper peer funds with market capitalizations of less than $275 million. The Committee noted that the Fund’s performance had improved significantly over the year following its inception. After further discussion concerning the expenses relative to the Fund’s peers, the Contract Committee concluded that performance on both a relative and absolute basis was very good.
U.S. Micro Cap Fund
The Contract Committee reviewed the information reporting performance of the U.S. Micro Cap Fund compared to its Lipper peer group and the Russell 2000 Growth Index and the Russell Micro Cap Growth Blended Index. The comparative information showed the Fund had outperformed relative to the Russell 2000 Growth Index over the 1, 5 and 10-year periods. The Fund underperformed relative to the Russell Microcap Growth Blended Index over the 1-year period yet outperformed over the 5 and 10-year periods. The Fund performed in the 1st and 2nd quintiles over the 1, 5 and 10-year periods relative to its Lipper performance universe. After further discussion, the Contract Committee concluded that, over the long-term, the U.S. Micro Cap Fund had performed well on both a relative and absolute basis.
U.S. Emerging Growth Fund
The Contract Committee reviewed information comparing performance of the Fund to its Lipper performance group and the Russell 2000 Growth Index. The comparative information showed the Fund outperformed relative to the Index over the 1 and 5-year periods and underperformed over the 10-year period. The Fund’s performance relative to the Lipper performance universe placed it in the 2nd quintile over the 1-year period, 1st quintile over the 5-year period and 4th quintile in the 10-year period. After further discussion, the Contract Committee concluded that the Fund had performed well on both a relative and absolute basis through intense market conditions.
U.S. Small to Mid Cap Growth Fund
The Contract Committee reviewed information comparing performance of the Fund to its Lipper performance group and the Russell 2500 Growth Index. The comparative information showed the Fund narrowly underperforming relative to the Index over the 1-year and since inception periods. The Fund’s performance relative to its Lipper performance universe performed in the 2nd quintiles for the 1-year and inception to date periods, respectively. Based on its review, the Contract Committee concluded that the Fund’s performance had been good.
U.S. Convertible Fund
The Contract Committee reviewed information comparing performance of the Fund to its Lipper performance universe and the Merrill Lynch All Convertibles All Qualities Index. The comparative information showed that the Fund underperformed the Index in the 1-year period and outperformed over the 5 and 10-year periods. The Fund’s performance relative to its Lipper performance universe placed the Fund in the 2nd quintile in the 1-year period and 1st quintile in the 5 and 10-year periods. Based on their review, the Contract Committee concluded that the Fund’s relative performance over time had been exceptional.
International Growth Opportunities Fund
The Contract Committee reviewed information comparing performance of the Fund to its Lipper performance universe and the S&P Developed Ex-US Small Cap Growth and S&P Developed Ex-US Small Cap Indexes. The comparative information showed that the Fund had outperformed the Indexes in the 1 and 5-year periods and underperformed in the 10-year period. The Fund’s performance relative to its Lipper performance universe placed it in the 2nd quintile for the 1-year period and the 1st quintile for the 5 and 10-year periods. Based on its review, the Contract Committee concluded that the Fund’s performance had been exceptional over time.
U.S. High Yield Bond Fund
The Contract Committee reviewed information comparing performance of the Fund to its Lipper performance universe and the Merrill Lynch High Yield Master II Index. The comparative information showed that the Fund had underperformed the Index in the 1 and 5-year periods and outperformed during the 10-year period. The Fund’s performance relative to its Lipper performance universe placed it in the 2nd quintile in the 1-year period and 1st in the 5 and 10-year periods. Based on its review, the Contact Committee concluded that the Fund’s relative performance over time had been exceptional.
INVESTMENT ADVISORY FEE AND OTHER EXPENSES
The Contract Committee considered the investment advisory fee paid by each Fund. The Contract Committee recognized that it was difficult to make comparisons of investment advisory fees because there are variations in the services that are included in the fees paid by other funds. The Contract Committee also considered the fees that Nicholas-Applegate charges other clients with similar investment objectives/policies. Nicholas-Applegate acts as sub-adviser to several open-end and closed-end registered investment companies, non-U.S. investment companies, and investment adviser to separately managed institutional accounts. For funds where Nicholas-Applegate acts as sub-adviser, the Investment advisory fee is generally lower. For separately managed accounts where Nicholas- Applegate acts solely as investment adviser, the investment advisory fee is comparable and in some cases higher. The Contract Committee also considered the total expense ratio for each Fund in comparison to their respective peers.
67
Supplementary Information — (Unaudited) — Continued
U.S. Ultra Micro Cap Fund
The Lipper peer group consisted of the Fund, the Expense Group and all other institutional small-cap growth funds, small-cap value funds, and small-cap core funds, excluding outliers (“Expense Universe”). The Fund’s Expense Group consisted of the Fund and four other funds with average net assets of less than $100 million. The Expense Group fee and expense data showed that the Fund’s total expenses were higher than the peer group median and in the 5th quintile of the Expense Universe. The Contract Committee noted the Fund’s relative undersize of $1 million to its closest peer with $60 million in average net assets and that the Fund was a new fund that commenced investment operations in January 2008. Based on its review, the Contract Committee concluded that the Fund’s expenses were acceptable in light of the quality of services offered and other factors considered.
U.S. Micro Cap Fund
The Lipper peer group consisted of the Fund, the Expense Group and all other institutional small-cap growth funds, small-cap value funds, and small-cap core funds, excluding outliers (“Expense Universe”). The Expense Group consisted of nine other funds with average net assets ranging between $500,000 and $250 million compared to $54.0 million for the Fund. The Expense Group fee and expense data showed that the Fund’s total expenses were the lowest in the Expense Group and ranked in the 2nd quintile of the Expense Universe. Based on its review, the Contract Committee concluded that the Fund’s expenses were very good in light of the quality of services offered and other factors considered.
U.S. Emerging Growth Fund
The Lipper peer group consisted of the Fund, the Expense Group and all other institutional small-cap growth funds, excluding outliers (“Expense Universe”). The Expense Group consisted of 15 other funds with average net assets ranging between $3.3 million and $85 million compared to $9.9 million for the Fund. The Expense Group fee and expense data showed that the Fund’s total expenses were the second lowest in the Expense Group and ranked in the 1st quintile of the Expense Universe. Based on its review, the Contract Committee concluded that the Fund’s expenses were very good in light of the quality of services offered and other factors considered.
U.S. Small to Mid Cap Growth Fund
The Lipper peer group consisted of the Fund, the Expense Group and all other institutional small-cap growth funds, excluding outliers (“Expense Universe”). The Expense Group consisted of 16 other funds with average net assets ranging between $3.3 million and $71 million compared to $4.2 million for the Fund. The Expense Group fee and expense data showed that the Fund’s total expenses ranked 4th lowest in the Expense Group and ranked in the 1st quintile of the Expense Universe. Based on its review, the Contract Committee concluded that the Fund’s expenses were very good in light of the quality of services offered and other factors considered.
U.S. Convertible Fund
The Lipper peer group consisted of the Fund, the Expense Group and all other institutional convertible securities funds, excluding outliers (“Expense Universe”). The Expense Group consisted of eight other funds with average net assets ranging between $48.4 million and $662 million compared to $48.4 million for the Fund. The Expense Group fee and expense data showed that the Fund’s total expenses were second to the highest in the Expense Group and ranked in the 5th quintile of the Expense Universe. The Contract Committee noted that the Expense Group median was 0.878% compared to the Fund at 0.979% and observed that the Fund with the lowest total expenses would have experienced greater expenses than the Fund without waivers. Based on its review, the Contract Committee concluded that the Fund’s expenses were acceptable in light of the quality of services offered and other factors considered.
International Growth Opportunities Fund
The Lipper peer group consisted of the Fund, the Expense Group and all other institutional international small/mid-cap growth funds, excluding outliers (“Expense Universe”). The Expense Group consisted of six other funds with average net assets ranging between $33.3 million and $170 million compared to $81.3 million for the Fund. The Expense Group fee and expense data showed that the Fund’s total expenses ranked 3rd lowest in the Expense Group and ranked in the 3rd quintile of the Expense Universe. Based on its review, the Contract Committee concluded that the Fund’s expenses were acceptable in light of the quality of services offered and other factors considered.
U.S. High Yield Bond Fund
The Lipper peer group consisted of the Fund, the Expense Group and all other institutional high current yield funds, excluding outliers (“Expense Universe”). The Expense Group consisted of 14 other funds with average net assets ranging between $11 million and $112 million compared to $47.7 million for the Fund. The Expense Group fee and expense data showed that the Fund’s total expenses ranked 5th lowest in the Expense Group and ranked in the 1st quintile of the Expense Universe. Based on its review, the Contract Committee concluded that the Fund’s expenses were very good in light of the quality of services offered and other factors considered.
68
ECONOMIES OF SCALE
The Contract Committee noted that the investment advisory and unitary fee schedules for the Funds do not contain breakpoints that reduce the fee rate on assets above specified levels. However, the Contract Committee did note that overall fees paid to Nicholas-Applegate (investment advisory, administration, and shareholder service) contain the functional equivalent of breakpoints through the offering of four to five different share classes that reduce the fees paid to Nicholas-Applegate based on the asset level of the account. The Contract Committee recognized that the existing fee structure is consistent with the institutional nature of the Funds’ shareholder base and of Nicholas-Applegate’s business, which caters to large institutional investors (e.g., pension plans, endowments and public funds). Having taken these factors into consideration, the Contract Committee concluded that the Funds’ current multiple share class fee structure establishes a reasonable basis for realizing economies of scale for the Funds which may exist when assets increase. At current asset levels, the Contract Committee also noted that the most of the Funds have not realized optimal economies of scale in respect to other expenses and that many expenses continue to be paid by Nicholas-Applegate.
69
Supplementary Information — (Unaudited) — Continued
CORPORATE GOVERNANCE
Name, Address (1) Age Position(s) Held with Fund Length of Time Served (2) | Principal Occupation(s) During Past 5 Years Other Directorship Held by Trustee Number of Portfolios in Fund Complex Overseen by Trustee |
| Independent Trustees: | |
Darlene T. DeRemer 11/27/1955 Chairperson of the Board Since August 2007 & Trustee Since May 1999 | Principal Occupations: Partner, Grail Partners LLC (since 2005); Managing Director, Putnam Lovell NBF Private Equity (2004-2005); Managing Director, NewRiver E-Business Advisory Services Division (2000-2003); Prior to, President and Founder, DeRemer Associates, a strategic and marketing consulting firm for the financial services industry (since 1987); Vice President and Director, Asset Management Division, State Street Bank and Trust Company, now referred to as State Street Global Advisers (1982-1987); Vice President, T. Rowe Price & Associates (1979-1982); Member, Boston Club (since 1998); Member, Financial Women’s Association Advisory Board (since 1995); Founder, Mutual Fund Cafe Website. Other Directorships Held: Founding Member and Director, National Defined Contribution Council (since 1997); Trustee, Boston Alzheimer’s Association (since 1998); Director, King’s Wood Montessori School (since 1995); Editorial Board, National Association of Variable Annuities (since 1997); Director, Nicholas-Applegate Strategic Opportunities, Ltd. (1994-1997); Trustee, Nicholas-Applegate Mutual Funds (1994-1999); Director, Jurika & Voyles Fund Group (since 1994-2000); Trustee, Barnwell Funds (2003-2005); Director, Independent Director Council (since 2004); Mutual Fund Director’s Council-Advisory Board; Board Member-Chatman Partners; Board Member-X-Shares LLC. Number of Portfolios Overseen by Trustee: 12 |
John J. Murphy 4/8/1944 Trustee Since September 2005 | Principal Occupations: Founder and senior principal, Murphy Capital Management. Other Directorships Held: Director, Smith Barney Multiple Discipline Trust; Director, Barclays International Funds Group Ltd. and affiliated companies; Smith Barney Consulting Group; Legg Mason Equity Funds. Number of Portfolios Overseen by Trustee: 12 |
Bradford K. Gallagher 2/24/1944 Trustee Since August 2007 | Principal Occupations: Founder, Spyglass Investments LLC (a private investment vehicle) (since 2001); Founder, President and CEO of CypressTree Investment Management Company and Annuity Company; Managing Director, Fidelity Investments. Other Directorships Held: Trustee, The Common Fund (since 2005); Director, Anchor Point Inc. (since 1995); Chairman and Trustee, Atlantic Maritime Heritage Foundation (since 2007); Director, Shielding Technology Inc. (since 2006); Director, United Way of Eastern Massachusetts (1988-1990); Director, Ouimet Scholarship Fund (1993-2005); Director, Emerson Hospital (1995-2005). Number of Portfolios Overseen by Trustee: 12 |
Steven Grenadier 12/14/1964 Trustee Since August 2007 | Principal Occupations: William F. Sharpe Professor of Financial Economics, Stanford University Graduate School of Business; Research Associate, National Bureau of Economic Research (since 2002); Chairman of the Finance Department, Stanford University Graduate Scholl of Business (2004-2006). Other Directorships Held: Independent Trustee, E Trade Funds. Number of Portfolios Overseen by Trustee: 12 |
| Interested Trustees: | |
Horacio A. Valeiras 1/8/1959 President & Trustee Since August 2004 | Principal Occupations: Managing Director (since 2004) and Chief Investment Officer, Nicholas-Applegate Capital Management, Nicholas-Applegate Securities (since 2002); Chief Investment Officer; Oppenheimer and AGI Management Partners (since 2008); Managing Director of Morgan Stanley Investment Management, London (1997-2002); Head of International Equity and Asset Allocation, Miller Anderson & Sherred; Director and Chief of Investment Strategies, Credit Suisse First Boston. Other Directorships Held: Trustee, The Bishops School (since 2002); Trustee, San Diego Rowing Club (since 2002). Number of Portfolios Overseen by Trustee: 12 |
Arthur B. Laffer 8/14/1940 Trustee Since August 2007 | Principal Occupations: Chairman, Laffer Associates (economic consulting) (since 1979); Chairman, Laffer Advisors Inc. (registered broker-dealer) (since 1981); Chairman, Laffer Investments (asset management) (since 2000); Member, Congressional Policy Advisory Board (since 1998); Distinguished University Professor and Director, Pepperdine University (1985-1988); Professor of Business Economics, University of Southern California (1976-1984); Associate Professor of Business Economics, University of Chicago (1967-1976). Other Directorships Held: Director of MPS Group, Inc. (NYSE:MPS) (since 2003); Director, Petco Animal Supplies, Inc. (NASDAQ:PETC) (2002-2005); Director, Oxigene Inc. (NASDAQ:OXGN), biopharmaceutical company (since 1998); Director of Provide Commerce (NASDAQ: PRVD) (since 1998); Director, Veolia Environmental Corporation (successor to U.S. Filter Corporation) (water purification) (1991-2006); Director, Nicholas-Applegate Fund, Inc. (1987-2007). Number of Portfolios Overseen by Trustee: 12 |
70
CORPORATE GOVERNANCE
Name, Address (1) Age Position(s) Held with Fund Length of Time Served (2) | Principal Occupation(s) During Past 5 Years Other Directorship Held by Officer Number of Portfolios in Fund Complex Overseen by Officer |
| Officers: | |
Charles H. Field, Jr. 7/24/1955 Secretary and Chief Compliance Officer Since May 2002 | Principal Occupations: Managing Director and General Counsel, Nicholas-Applegate Capital Management (since 1996); Chief Legal Officer of Oppenheimer Capital Management LLC (since 2009), Chief Legal Officer of Allianz Global Investors Management Partners LLC (since 2009); and Chief Legal Officer of Allianz Global Investors Solutions LLC (since 2009). Prior to joining Nicholas-Applegate in 1996 was an attorney for Federated Investors (1991-1996) and an attorney for Unified Management Corp. (1987-1991). Other Directorships Held: NA Number of Portfolios Overseen by Officer: 12 |
Deborah A. Wussow 1/31/1960 Treasurer and Assistant Secretary Since August 2006 | Principal Occupations: Senior Vice President, Chief Compliance Officer, Nicholas-Applegate Capital Management, LLC (since 2008), Chief Compliance Officer, Oppenheimer Capital Management, LLC (since April 2009); Chief Compliance Officer, Allianz Global Investors Management Partners, LLC (since 2009); Chief Compliance Officer, Allianz Solutions, LLC (since 2009); Deputy Chief Compliance Officer, Nicholas-Applegate Capital Management, LLC (2004-2008);Compliance Officer, Nicholas-Applegate Capital Management (1995-2004). Other Directorships Held: NA Number of Portfolios Overseen by Officer: 12 |
| (1) | Unless otherwise noted, the address of the Trustees and Officers is c/o: Nicholas-Applegate Capital Management, 600 West Broadway, 32nd Floor, San Diego, California 92101. |
| (2) | Each Trustee serves for an indefinite term, until her or his successor is elected. |
71
(This page intentionally left blank)
(This page intentionally left blank)
(This page intentionally left blank)
TRUSTEES OF NICHOLAS-APPLEGATE INSTITUTIONAL FUNDS
Darlene T. DeRemer, Chairperson
Horacio A. Valeiras
John J. Murphy
Bradford K. Gallagher
Steven Grenadier
Arthur B. Laffer
OFFICERS
Horacio A. Valeiras, President
Charles H. Field, Jr., Secretary & Chief Compliance Officer
Deborah A. Wussow, Treasurer & Assistant Secretary
INVESTMENT ADVISER
Nicholas-Applegate Capital Management
DISTRIBUTOR
Nicholas-Applegate Securities
CUSTODIAN
Brown Brothers Harriman & Co., Private Bankers
TRANSFER AGENT
UMB Fund Services Group, Inc.
INDEPENDENT REGISTERED PUBLIC ACCOUNTING FIRM
PricewaterhouseCoopers LLP
| SAR0909INST |
600 West Broadway
San Diego, California 92101
800.551.8043
November 30, 2009 Annual Report
Class R Shares
U.S. Emerging Growth
Letter to Shareholders
Dear Fellow Shareholder,
Stock markets around the world delivered impressive gains during the eight months ended November 30, 2009. In contrast to the panic coursing through the markets a year ago, the period was characterized by rising confidence in the global economy.
In this report, we review the performance of the financial markets and the U.S. Emerging Growth Fund from April 1, 2009 through November 30, 2009. We also highlight some of the key factors that drove investment returns and share our outlook for the future.
In the United States, the S&P 500 Index gained 39.4% in response to encouraging economic and earnings reports. While GDP fell at a 0.7% annual rate in the second quarter, this was a big improvement over the 6.4% first-quarter drop. The news got progressively better, with GDP rising 2.8% in the third quarter, boosted by government stimulus dollars. Throughout the period, the Federal Reserve held interest rates at 0.0% to 0.25% and used its balance sheet to provide extra liquidity to the financial system. The credit markets opened up, and corporate bond issuance for 2009 surpassed $1 trillion in October — the fastest pace on record. Corporate earnings remained under pressure, with S&P 500 companies posting their ninth consecutive quarter of profit declines. That said, earnings exceeded consensus estimates, aided by cost-cutting initiatives.
Stock markets outside the United States also performed well, lifted by mounting evidence that the global recession was ending. In local currencies, the MSCI EAFE Index, a barometer of developed non-U.S. markets, rose 32.0%, and the MSCI Emerging Markets Index rose 49.9%. The gains were even greater in U.S. dollar terms, with the MSCI EAFE and MSCI Emerging Markets indexes advancing 51.6% and 70.5%, respectively. The dollar declined against most foreign currencies, largely due to expectations that the Fed would keep interest rates low for longer than other central banks.
Central banks in a handful of countries, including Australia, did raise interest rates toward the end of the period. Australia’s mineral exports helped keep its economy out of recession amid a 31% jump in the Reuters/Jefferies CRB Index of nineteen commodities since March 1. With their economies just returning to growth, euro-zone and Japanese central bankers held rates steady, although the European Central Bank scaled back one of its stimulus programs. Japanese GDP grew at an annual pace of 2.3% in the second quarter and 1.3% in the third quarter. The euro region emerged from recession in the third quarter, with GDP rising 1.5% on an annual basis. The United Kingdom was a notable laggard, where the Bank of England kept interest rates at a record low of 0.5% and expanded its quantitative easing policy. The U.K. economy contracted in the third quarter — the sixth straight decline — but more recent data hinted at recovery.
The relatively strong performance of developing economies, combined with investors’ rising risk appetites, drove the extraordinary gains in emerging market equities. Stocks in the BRIC nations of Brazil, Russia, India and China turned in some of the best results in local currencies. Brazil and Russia, which have large energy industries, benefited from a 56% increase in oil prices during the period. In India and China — economies that had slowed but not entered recession — growth rebounded as government stimulus measures boosted domestic demand.
The improvement in the global economy created a powerful tailwind for the Nicholas-Applegate U.S. Emerging Growth Fund, which posted a substantial gain. In addition, the Fund outperformed its benchmark, the Russell 2000 Growth Index, by a wide margin. We are proud of the Fund’s strong results relative to the index, both in this period and over longer time horizons.
Looking ahead, we expect the U.S. economic recovery to be subdued relative to past recoveries, and real growth in other developed countries to also remain subpar. The Fed has stated its intentions to keep interest rates low for “an extended period,” but we believe short-term rates will start to rise next year as inflation returns to the U.S. economy. Foreign central banks have already embarked on post-crisis monetary tightening, and we expect this trend to continue. Against a backdrop of low growth and rising rates, we think that individual security selection will be especially important. This makes us confident in our outlook for the U.S. Emerging Growth Fund, given our bottom-up investment approach and commitment to in-depth fundamental research.
On behalf of everyone at Nicholas-Applegate, thank you for the trust you have placed in us. We look forward to serving your investment needs throughout the coming years.
Best Regards,
Horacio A. Valeiras, CFA
President and Chief Investment Officer
November 30, 2009
Table of Contents
The Fund’s Review and Outlook, Performance and
Schedule of Investments:
| U.S. Emerging Growth | 1 |
| The Fund’s: | |
| Financial Highlights | 6 |
| Statement of Assets and Liabilities | 8 |
| Statement of Operations | 9 |
| Statement of Changes in Net Assets | 10 |
| Notes to Financial Statements | 11 |
| Report of Independent Registered Public Accounting Firm | 18 |
| Shareholder Expense Example | 19 |
| Supplementary Information | 20 |
This report is authorized for distribution to shareholders and to others only when preceded or accompanied by a currently effective prospectus for Nicholas-Applegate Institutional Funds Class R Shares. Distributor: Nicholas-Applegate Securities.
U.S. Emerging Growth Fund
Management Team: John C. McCraw, Portfolio Manager; Robert S. Marren, Portfolio Manager
Chief Investment Officer: Horacio A. Valeiras, CFA
Goal: The U.S. Emerging Growth Fund seeks to maximize long-term capital appreciation through investments primarily in U.S. companies with market capitalizations similar to the Russell 2000 Growth Index at time of purchase.
Market Overview: U.S. equities posted significant gains during the eight months ended November 30, 2009. The rally — one of the steepest in Wall Street history — lifted stock prices higher across all major styles and capitalization segments of the market.
During the period, the Federal Reserve held short-term interest rates steady, after having lowered them to near zero at the height of the credit crisis. The central bank also pumped massive amounts of liquidity into the financial system by making loans and asset purchases. On the fiscal front, some of the $787 billion stimulus package worked its way into the economy via tax credits, the “cash for clunkers” auto trade-in program and other spending initiatives.
The government’s aggressive policies helped thaw the credit markets and jump-start the economy. Following a 6.4% annual drop in the first quarter of 2009, GDP fell just 0.7% in the second quarter and rose 2.8% in the third quarter. Moreover, existing homes sales spiked to their highest level since early 2007, a key home-price index advanced for five straight months and manufacturing activity hit a three and a-half year high. That said, several indicators suggested that the recovery would be gradual, including the unemployment rate which reached 10.2% in October 2009.
In addition to improvement in the economy, better-than-expected corporate profits — albeit off low expectations — also boosted investor sentiment. As November 2009 drew to a close, small-cap companies that had reported third-quarter earnings were beating estimates by about 4%, on average, and mid caps were ahead by about 9%.
Performance: The Fund’s Class R shares gained 52.34% between April 1 and November 30, 2009, outperforming the 37.24% increase in the Russell 2000 Growth Index ..
Portfolio Specifics: The Fund’s outperformance was driven by stock selection, which added value in most sectors and was particularly strong in energy and materials. Two of our best-performing holdings were Atwood Oceanics, a provider of offshore oil and gas drilling services, and Ashland, a diversified chemical company. Atwood Oceanics signed contracts for two of its jackup rigs that have the potential to keep the rigs utilized through the end of 2010. Ashland benefited from rising margins in its water technologies business, as well as record profits at its Valvoline automotive products unit.
Stock selection in the information technology sector was another major source of relative strength. The Fund’s top contributors included TriQuint Semiconductor and RF Micro Devices, chip makers that are capitalizing on the increasing adoption of 3G smartphones.
On the minus side, stock selection in the consumer discretionary sector negatively affected performance versus the index. One of our biggest detractors was an apparel company whose business was impacted by the difficult retail environment in key markets such as California and Florida.
Market Outlook: The economy continues to face meaningful headwinds, including the weak job market and tepid bank lending. However, several positive factors could drive additional equity market gains in the coming months. For example, the Fed has resolved to keep interest rates low for an extended period of time, and corporate earnings are expected to show strong growth in 2010. Additionally, companies have large amounts of cash on their balance sheets, which could lead to increased merger and acquisition activity.
Regardless of how big-picture developments play out, we believe that our bottom-up investment process will continue to add value to the benchmark.
Comparison of Change in Value of a $250,000 Investment In U.S. Emerging Growth Fund Class R Shares with the Russell 2000 Growth Index.
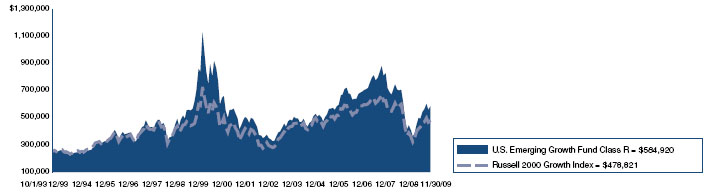
Annualized Total Returns As of 11/30/09 | ||||||||||||
| 1 Year | 5 Years | 10 Years | ||||||||||
| U.S. Emerging Growth Fund Class R | 41.33 | % | 2.73 | % | –7.48 | % | ||||||
| Russell 2000 Growth Index | 30.59 | % | –0.07 | % | –0.58 | % | ||||||
The graph above shows the value of a hypothetical $250,000 investment in the Fund compared with the Russell 2000 Growth Index for the periods indicated. The Fund’s Class R shares were first available on May 21, 1999. Performance prior to the introduction of Class R shares reflects the historical performance of the Fund’s Class I Shares. This performance has been restated to reflect shareholder services fees of 0.25% applicable to Class R shares, but not Class I shares of the Fund. The Fund’s Class I shares calculate their performance based upon the historical performance of a corresponding series of Nicholas-Applegate Mutual Funds (renamed ING Mutual Funds), adjusted to reflect all fees and expenses applicable to the Fund’s Class I shares. Average annual total return figures include changes in principal value, reinvested dividends, and capital gain distributions. The total returns shown above do not show the effects of income taxes on an individual’s investment. In most cases, taxes may reduce your actual investment returns on income or gains paid by the Fund or any gains you may realize if you sell your shares. Past performance cannot guarantee future results.
1
U.S. Emerging Growth Fund
The Russell 2000 Growth Index is an unmanaged index comprised of those Russell 2000 companies with higher price-to-book ratios and higher forecasted growth values. The Russell 2000 Index is an unmanaged index generally representative of the 2,000 smallest companies in the Russell 3000 Index, which represents approximately 10% of the total market capitalization of the Russell 3000 Index. Index returns include reinvestment of dividends. Unless otherwise noted, index returns reflect the reinvestment of income dividends and capital gains, if any, but do not reflect fees, brokerage commissions or other expenses of investing. One cannot invest directly in an index.
Since markets can go down as well as up, investment returns and principal value will fluctuate with market conditions. You may have a gain or loss when you sell your shares. Further information relating to fund performance, including expense reimbursements, if applicable, is contained in the Financial Highlights section of the prospectus and elsewhere in this report.
2
U.S. Emerging Growth Fund
Schedule of Investments
As of November 30, 2009
Number of Shares | Value | |||||||
| Common Stock - 97.5% | ||||||||
| Aerospace/Defense - 0.4% | ||||||||
| Cubic Corp. | 2,000 | $ | 69,640 | |||||
| Aerospace/Defense-Equipment - 1.3% | ||||||||
| AAR Corp.* | 5,600 | 104,496 | ||||||
| BE Aerospace, Inc.* | 5,400 | 104,058 | ||||||
| 208,554 | ||||||||
| Airlines - 0.4% | ||||||||
| Hawaiian Holdings, Inc.* | 9,700 | 60,625 | ||||||
| Apparel Manufacturers - 1.1% | ||||||||
| Jones Apparel Group, Inc. | 6,400 | 108,480 | ||||||
| Quiksilver, Inc.* | 38,200 | 66,850 | ||||||
| 175,330 | ||||||||
| Applications Software - 1.0% | ||||||||
| Ebix, Inc.* | 3,100 | 160,921 | ||||||
| Auto/Truck Parts & Equipment-Original - 2.5% | ||||||||
| American Axle & Manufacturing | ||||||||
| Holdings, Inc.* | 19,100 | 119,375 | ||||||
| ArvinMeritor, Inc.* | 14,300 | 115,973 | ||||||
| Titan International, Inc. | 9,200 | 76,176 | ||||||
| Wonder Auto Technology, Inc.* | 8,900 | 106,088 | ||||||
| 417,612 | ||||||||
| Beverages-Wine/Spirits - 0.4% | ||||||||
| Central European Distribution Corp.* | 2,400 | 66,912 | ||||||
| Broadcast Services/Programming - 1.3% | ||||||||
| DG FastChannel, Inc.* | 3,600 | 97,020 | ||||||
| Liberty Media Corp. - Capital* | 5,600 | 123,704 | ||||||
| 220,724 | ||||||||
| Building-Heavy Construction - 1.3% | ||||||||
| Chicago Bridge & Iron Co. Cl. Y* | 5,900 | 103,781 | ||||||
| Orion Marine Group, Inc.* | 5,600 | 103,544 | ||||||
| 207,325 | ||||||||
| Casino Services - 0.7% | ||||||||
| Bally Technologies, Inc.* | 2,900 | 120,437 | ||||||
| Chemicals-Specialty - 0.6% | ||||||||
| NewMarket Corp. | 1,000 | 104,720 | ||||||
| Coal - 0.7% | ||||||||
| James River Coal Co.* | 6,700 | 122,811 | ||||||
| Commercial Banks-Central US - 0.6% | ||||||||
| MB Financial, Inc. | 5,500 | 102,575 | ||||||
| Commercial Services - 0.9% | ||||||||
| AerCap Holdings NV* | 12,200 | 100,040 | ||||||
| DynCorp International, Inc. Cl. A* | 3,800 | 53,124 | ||||||
| 153,164 | ||||||||
| Commercial Services-Finance - 3.6% | ||||||||
| Coinstar, Inc.* | 3,100 | 83,049 | ||||||
| Deluxe Corp. | 6,100 | 78,690 | ||||||
| Dollar Financial Corp.* | 6,000 | 146,520 | ||||||
| Net 1 UEPS Technologies, Inc.* | 5,700 | 106,476 | ||||||
| TNS, Inc.* | 3,700 | 92,685 | ||||||
| Wright Express Corp.* | 2,600 | 75,842 | ||||||
| 583,262 | ||||||||
| Computer Aided Design - 0.7% | ||||||||
| Parametric Technology Corp.* | 8,000 | 120,480 | ||||||
| Computers-Integrated Systems - 0.6% | ||||||||
| Netscout Systems, Inc.* | 7,800 | 98,202 | ||||||
| Computers-Memory Devices - 0.7% | ||||||||
| Xyratex, Ltd.* | 10,200 | 114,954 | ||||||
| Consumer Products-Miscellaneous - 2.2% | ||||||||
| Helen of Troy, Ltd.* | 4,900 | 100,695 | ||||||
| Jarden Corp. | 5,400 | 148,230 | ||||||
| Tupperware Brands Corp. | 2,400 | 111,720 | ||||||
| 360,645 | ||||||||
| Containers-Metal/Glass - 0.8% | ||||||||
| Greif, Inc. Cl. A | 2,300 | 128,478 | ||||||
| Containers-Paper/Plastic - 0.8% | ||||||||
| Rock-Tenn Co. Cl. A | 2,800 | 126,476 | ||||||
| Distribution/Wholesale - 0.6% | ||||||||
| Brightpoint, Inc.* | 14,200 | 101,956 | ||||||
| Diversified Operations - 0.7% | ||||||||
| Compass Diversified Holdings | 10,000 | 111,400 | ||||||
| Drug Delivery Systems - 0.6% | ||||||||
| Nektar Therapeutics* | 11,000 | 95,810 | ||||||
| E-Commerce/Services - 1.1% | ||||||||
| IAC/InterActiveCorp* | 4,300 | 83,635 | ||||||
| Internet Brands, Inc. Cl. A* | 14,300 | 98,813 | ||||||
| 182,448 | ||||||||
| Electric Products-Miscellaneous - 0.7% | ||||||||
| Harbin Electric, Inc.* | 5,700 | 114,114 | ||||||
| Electronic Components-Miscellaneous - 0.7% | ||||||||
| Sanmina-SCI Corp.* | 14,600 | 117,968 | ||||||
| Electronic Components-Semiconductors - 1.8% | ||||||||
| Amkor Technology, Inc.* | 16,800 | 93,240 | ||||||
| Microsemi Corp.* | 6,500 | 98,995 | ||||||
| Skyworks Solutions, Inc.* | 7,800 | 96,018 | ||||||
| 288,253 | ||||||||
| Electronic Design Automations - 0.6% | ||||||||
| Mentor Graphics Corp.* | 14,000 | 103,180 | ||||||
| Enterprise Software/Services - 2.4% | ||||||||
| Informatica Corp.* | 4,200 | 94,290 | ||||||
| JDA Software Group, Inc.* | 5,000 | 117,400 | ||||||
| Lawson Software, Inc.* | 12,800 | 83,840 | ||||||
| Taleo Corp. Cl. A* | 4,600 | 95,036 | ||||||
| 390,566 | ||||||||
| Entertainment Software - 0.5% | ||||||||
| Take-Two Interactive Software, Inc.* | 7,100 | 79,875 | ||||||
| Finance-Consumer Loans - 1.8% | ||||||||
| Encore Capital Group, Inc.* | 5,400 | 92,016 | ||||||
| Ocwen Financial Corp.* | 10,900 | 101,588 | ||||||
| Portfolio Recovery Associates, Inc.* | 2,400 | 108,072 | ||||||
| 301,676 | ||||||||
| Finance-Investment Bankers/Brokers - 0.5% | ||||||||
| MF Global, Ltd.* | 13,900 | 87,431 | ||||||
| Food-Canned - 0.6% | ||||||||
| Seneca Foods Corp. Cl. A* | 4,200 | 99,330 | ||||||
| Food-Miscellaneous/Diversified - 1.6% | ||||||||
| Chiquita Brands International, Inc.* | 5,900 | 100,241 | ||||||
| M&F Worldwide Corp.* | 4,800 | 158,640 | ||||||
| 258,881 | ||||||||
| Footwear & Related Apparel - 0.7% | ||||||||
| Deckers Outdoor Corp.* | 1,300 | 120,419 | ||||||
See Accompanying Notes to Financial Statements
3
U.S. Emerging Growth Fund
Schedule of Investments
As of November 30, 2009
Number of Shares | Value | |||||||
| Home Furnishings - 0.7% | ||||||||
| La-Z-Boy, Inc.* | 12,400 | $ | 118,420 | |||||
| Hospital Beds/Equipment - 0.7% | ||||||||
| Hill-Rom Holdings, Inc. | 5,200 | 115,336 | ||||||
| Human Resources - 0.4% | ||||||||
| Emergency Medical Services Corp. Cl. A* | 1,400 | 67,550 | ||||||
| Instruments-Scientific - 0.4% | ||||||||
| FEI Co.* | 2,800 | 68,376 | ||||||
| Internet Applications Software - 0.6% | ||||||||
| Cybersource Corp.* | 5,600 | 96,152 | ||||||
| Internet Connectivity Services - 0.9% | ||||||||
| AboveNet, Inc.* | 2,800 | 143,640 | ||||||
| Internet Infrastructure Software - 1.4% | ||||||||
| AsiaInfo Holdings, Inc.* | 4,700 | 115,573 | ||||||
| TeleCommunication Systems, Inc. Cl. A* | 13,900 | 117,177 | ||||||
| 232,750 | ||||||||
| Intimate Apparel - 0.5% | ||||||||
| The Warnaco Group, Inc.* | 1,900 | 77,349 | ||||||
| Life/Health Insurance - 0.6% | ||||||||
| Delphi Financial Group, Inc. Cl. A | 4,800 | 104,928 | ||||||
| Machinery-General Industry - 0.8% | ||||||||
| Albany International Corp. Cl. A | 7,300 | 131,984 | ||||||
| Marine Services - 0.9% | ||||||||
| Aegean Marine Petroleum Network, Inc. | 5,700 | 153,216 | ||||||
| Medical Products - 3.2% | ||||||||
| Haemonetics Corp.* | 1,500 | 80,070 | ||||||
| Hanger Orthopedic Group, Inc.* | 7,900 | 105,386 | ||||||
| Invacare Corp. | 4,600 | 114,540 | ||||||
| Orthofix International NV* | 4,100 | 124,025 | ||||||
| PSS World Medical, Inc.* | 5,400 | 104,490 | ||||||
| 528,511 | ||||||||
| Medical Sterilize Product - 0.7% | ||||||||
| STERIS Corp. | 3,700 | 119,547 | ||||||
| Medical-Biomedical/Genetics - 2.6% | ||||||||
| Human Genome Sciences, Inc.* | 5,400 | 150,228 | ||||||
| Incyte Corp., Ltd.* | 12,200 | 101,626 | ||||||
| Regeneron Pharmaceuticals, Inc.* | 4,200 | 77,070 | ||||||
| Seattle Genetics, Inc.* | 9,800 | 90,944 | ||||||
| 419,868 | ||||||||
| Medical-Drugs - 0.9% | ||||||||
| Hi-Tech Pharmacal Co., Inc.* | 3,800 | 71,250 | ||||||
| Salix Pharmaceuticals, Ltd.* | 3,500 | 79,800 | ||||||
| 151,050 | ||||||||
| Medical-Generic Drugs - 0.6% | ||||||||
| Impax Laboratories, Inc.* | 9,000 | 102,600 | ||||||
| Medical-HMO - 0.9% | ||||||||
| WellCare Health Plans, Inc.* | 4,300 | 141,857 | ||||||
| Medical-Outpatient/Home Medical Care - 0.6% | ||||||||
| Almost Family, Inc.* | 2,700 | 97,551 | ||||||
| Metal-Aluminum - 0.7% | ||||||||
| Century Aluminum Co.* | 11,900 | 116,025 | ||||||
| Multi-line Insurance - 0.9% | ||||||||
| Unitrin, Inc. | 6,900 | 153,939 | ||||||
| Networking Products - 0.7% | ||||||||
| Anixter International, Inc.* | 2,500 | 108,050 | ||||||
| Oil & Gas Drilling - 1.2% | ||||||||
| Atlas Energy, Inc.* | 4,000 | 102,800 | ||||||
| Atwood Oceanics, Inc.* | 2,700 | 101,736 | ||||||
| 204,536 | ||||||||
| Oil Companies-Exploration & Production - 3.9% | ||||||||
| ATP Oil & Gas Corp.* | 5,500 | 87,725 | ||||||
| Berry Petroleum Co. Cl. A | 3,700 | 101,121 | ||||||
| Gran Tierra Energy, Inc.* | 21,300 | 121,623 | ||||||
| Mariner Energy, Inc.* | 7,400 | 92,574 | ||||||
| Stone Energy Corp.* | 7,200 | 136,152 | ||||||
| W&T Offshore, Inc. | 9,500 | 98,325 | ||||||
| 637,520 | ||||||||
| Oil-Field Services - 2.3% | ||||||||
| Helix Energy Solutions Group, Inc.* | 7,500 | 88,200 | ||||||
| Hercules Offshore, Inc.* | 17,600 | 89,936 | ||||||
| Hornbeck Offshore Services, Inc.* | 3,800 | 86,678 | ||||||
| Tetra Technologies, Inc.* | 10,500 | 108,780 | ||||||
| 373,594 | ||||||||
| Paper & Related Products - 3.7% | ||||||||
| Boise, Inc.* | 34,000 | 166,260 | ||||||
| Clearwater Paper Corp.* | 3,100 | 152,303 | ||||||
| Domtar Corp.* | 2,900 | 163,618 | ||||||
| Schweitzer-Mauduit International, Inc. | 2,000 | 123,120 | ||||||
| 605,301 | ||||||||
| Pharmacy Services - 0.6% | ||||||||
| Catalyst Health Solutions, Inc.* | 2,800 | 95,228 | ||||||
| Physical Practice Management - 0.6% | ||||||||
| IPC The Hospitalist Co., Inc.* | 3,100 | 97,526 | ||||||
| Physical Therapy/Rehabilitation Centers - 0.8% | ||||||||
| RehabCare Group, Inc.* | 4,400 | 123,948 | ||||||
| Printing-Commercial - 0.7% | ||||||||
| Cenveo, Inc.* | 14,700 | 112,896 | ||||||
| Property/Casualty Insurance - 0.6% | ||||||||
| Amtrust Financial Services, Inc. | 8,900 | 106,355 | ||||||
| Publishing-Books - 0.6% | ||||||||
| Scholastic Corp. | 4,000 | 100,840 | ||||||
| Real Estate Management/Service - 0.6% | ||||||||
| E-House China Holdings, Ltd. - ADR* | 5,300 | 103,085 | ||||||
| Real Estate Operation/Development - 0.8% | ||||||||
| Forest City Enterprises, Inc. Cl. A* | 12,300 | 131,979 | ||||||
| Reinsurance - 0.6% | ||||||||
| Maiden Holdings, Ltd. | 12,500 | 94,250 | ||||||
| Rental Auto/Equipment - 0.5% | ||||||||
| United Rentals, Inc.* | 9,500 | 87,590 | ||||||
| Retail-Apparel/Shoe - 4.3% | ||||||||
| AnnTaylor Stores Corp.* | 8,200 | 114,636 | ||||||
| Collective Brands, Inc.* | 6,700 | 129,578 | ||||||
| Genesco, Inc.* | 4,800 | 125,472 | ||||||
| Hanesbrands, Inc.* | 5,000 | 120,050 | ||||||
| Phillips-Van Heusen Corp. | 2,700 | 108,000 | ||||||
| The Finish Line, Inc. Cl. A | 12,400 | 109,740 | ||||||
| 707,476 | ||||||||
| Retail-Automobile - 0.5% | ||||||||
| Sonic Automotive, Inc. Cl. A* | 9,400 | 83,190 | ||||||
| Retail-Discount - 0.7% | ||||||||
| HSN, Inc.* | 6,600 | 118,272 | ||||||
See Accompanying Notes to Financial Statements
4
Schedule of Investments
As of November 30, 2009
Number of Shares | Value | |||||||
| Retail-Gardening Products - 0.6% | ||||||||
| Tractor Supply Co.* | 2,100 | $ | 98,049 | |||||
| Retail-Office Supplies - 0.6% | ||||||||
| OfficeMax, Inc.* | 9,100 | 96,278 | ||||||
| Retail-Pawn Shops - 0.7% | ||||||||
| First Cash Financial Services, Inc.* | 6,300 | 120,330 | ||||||
| Retail-Perfume & Cosmetics - 0.6% | ||||||||
| Sally Beauty Holdings, Inc.* | 15,000 | 104,700 | ||||||
| Retail-Petroleum Products - 0.6% | ||||||||
| World Fuel Services Corp. | 1,900 | 101,042 | ||||||
| Retail-Restaurants - 0.6% | ||||||||
| Cracker Barrel Old Country Store, Inc. | 2,400 | 90,144 | ||||||
| Retail-Sporting Goods - 0.8% | ||||||||
| Big 5 Sporting Goods Corp. | 7,600 | 124,184 | ||||||
| Rubber-Tires - 0.8% | ||||||||
| Cooper Tire & Rubber Co. | 7,300 | 130,816 | ||||||
| Satellite Telecommunications - 0.7% | ||||||||
| GeoEye, Inc.* | 3,800 | 118,446 | ||||||
| Seismic Data Collection - 0.9% | ||||||||
| ION Geophysical Corp.* | 26,500 | 144,160 | ||||||
| Semiconductor Components-Integrated Circuits - 1.8% | ||||||||
| Cirrus Logic, Inc.* | 22,200 | 120,546 | ||||||
| Integrated Device Technology, Inc.* | 14,300 | 80,938 | ||||||
| Pericom Semiconductor Corp.* | 9,400 | 96,914 | ||||||
| 298,398 | ||||||||
| Semiconductor Equipment - 0.6% | ||||||||
| Tessera Technologies, Inc.* | 4,000 | 94,680 | ||||||
| Telecommunication Equipment-Fiber Optics - 0.8% | ||||||||
| Finisar Corp.* | 14,200 | 129,220 | ||||||
| Telecommunications Services - 1.3% | ||||||||
| Knology, Inc.* | 10,000 | 98,600 | ||||||
| TW Telecom, Inc. Cl. A* | 8,000 | 116,400 | ||||||
| 215,000 | ||||||||
| Therapeutics - 0.4% | ||||||||
| Onyx Pharmaceuticals, Inc.* | 2,500 | 71,525 | ||||||
| Transactional Software - 0.7% | ||||||||
| Solera Holdings, Inc. | 3,400 | 118,864 | ||||||
| Transport-Air Freight - 0.8% | ||||||||
| Atlas Air Worldwide Holdings, Inc.* | 4,200 | 123,060 | ||||||
| Transport-Marine - 1.5% | ||||||||
| Genco Shipping & Trading, Ltd.* | 5,800 | 136,184 | ||||||
| Navios Maritime Holdings, Inc. | 17,800 | 102,884 | ||||||
| 239,068 | ||||||||
| Transport-Rail - 0.6% | ||||||||
| Kansas City Southern* | 3,400 | 97,342 | ||||||
| Transport-Truck - 0.6% | ||||||||
| Saia, Inc.* | 7,200 | 103,824 | ||||||
| Web Portals/ISP - 0.5% | ||||||||
| United Online, Inc. | 11,600 | 78,880 | ||||||
| Wire & Cable Products - 0.8% | ||||||||
| Belden, Inc. | 5,700 | 126,084 | ||||||
| Total Common Stock (Cost: $13,857,372) | 16,033,533 | |||||||
| Limited Partnerships - 0.7% | ||||||||
| Pipelines - 0.7% | ||||||||
| Targa Resources Partners LP | ||||||||
| (Cost $78,695) | 5,600 | 111,888 | ||||||
Principal Amount | Value | |||||||
| Short Term Investments - 1.7% | ||||||||
| Time Deposit - 1.7% | ||||||||
| Wells Fargo - Grand Cayman | ||||||||
| 0.030%, 12/01/09 (Cost: $281,141) | $ | 281,141 | $ | 281,141 | ||||
| Total Investments - 99.9% (Cost: $14,217,208) | 16,426,562 | |||||||
| Other Assets in Excess of Liabilities - 0.1% | 15,044 | |||||||
| Net Assets - 100.0% | $ | 16,441,606 | ||||||
| * | Non-income producing securities. |
ADR - - American Depository Receipt
Schedule of Investments by Sector
as of November 30, 2009
| Sector | Percent of Net Assets | |||
| Consumer, Non-cyclical | 25.0 | % | ||
| Consumer, Cyclical | 18.0 | |||
| Industrial | 11.3 | |||
| Technology | 11.4 | |||
| Communications | 9.9 | |||
| Energy | 9.7 | |||
| Financial | 7.2 | |||
| Basic Materials | 5.0 | |||
| Diversified | 0.7 | |||
| Short Term Investments | 1.7 | |||
| Total Investments | 99.9 | |||
| Other assets in excess of liabilities | 0.1 | |||
| Net Assets | 100.0 | % | ||
See Accompanying Notes to Financial Statements
5
Nicholas-Applegate Institutional Funds
Financial Highlights
For a Class R share outstanding during the periods indicated
| Distributions from: | ||||||||||||||||||||||||
Net Asset Value, Beginning | Net Investment (Loss) (1) | Net Realized and Unrealized Gain (Loss) | Total from Investment Operations | Net Investment Income | Net Realized Capital Gains | |||||||||||||||||||
| U.S EQUITY FUND | ||||||||||||||||||||||||
| U.S. EMERGING GROWTH | ||||||||||||||||||||||||
| For the period ended 11/30/09 | $ | 6.42 | $ | (0.05 | ) | $ | 3.41 | $ | 3.36 | $ | — | $ | — | |||||||||||
| For the year ended 03/31/09 | 11.20 | (0.06 | ) | (4.72 | )(5) | (4.78 | ) | — | — | |||||||||||||||
| For the year ended 03/31/08 | 12.84 | (0.10 | ) | (0.66 | )(5) | 0.76 | — | (0.88 | ) | |||||||||||||||
| For the year ended 03/31/07 | 13.69 | (0.10 | ) | 0.18 | (6) | 0.08 | — | (0.93 | ) | |||||||||||||||
| For the year ended 03/31/06 | 9.65 | (0.14 | ) | 4.18 | 4.04 | — | — | |||||||||||||||||
| For the year ended 03/31/05 | 9.52 | (0.10 | ) | 0.23 | 0.13 | — | — | |||||||||||||||||
| (1) | Net investment income per share is calculated by dividing net investment income for the period by the average shares outstanding during the period. |
| (2) | Total returns are not annualized for periods less than one year. |
| (3) | Ratios are annualized for periods of less than one year. Expense reimbursements reflect voluntary reductions of total expenses. Such amounts would increase net investment income (loss) ratios had such reductions not occurred. |
See Accompanying Notes to Financial Statements
6
| Ratios to Average Net Assets (3) | ||||||||||||||||||||||||||||||||||||||
Total Distributions | Net Asset Value, Ending | Total Return (2) | Net Assets, Ending (in 000’s) | Net Investment Income (Loss) | Total Expenses | Expense (Reimbursements)/ Recoupment | Expenses Net of Reimbursement/ Recoupment | Expenses Net of Reimbursement/ Recoupment Offset (4) | Fund’s Portfolio Turnover Rate | |||||||||||||||||||||||||||||
| $ | — | $ | 9.78 | 52.34 | % | $ | 2,500 | (0.77 | %) | 1.43 | % | — | 1.43 | % | 1.42 | % | 97 | % | ||||||||||||||||||||
| — | 6.42 | (42.68 | %) | 1,536 | (0.62 | %) | 1.46 | % | — | 1.46 | % | 1.14 | % | 146 | % | |||||||||||||||||||||||
| (0.88 | ) | 11.20 | (7.15 | %) | 2,870 | (0.71 | %) | 1.46 | % | — | 1.46 | % | 0.96 | % | 129 | % | ||||||||||||||||||||||
| (0.93 | ) | 12.84 | 1.02 | % | 3,177 | (0.78 | %) | 1.46 | % | — | 1.46 | % | 0.97 | % | 148 | % | ||||||||||||||||||||||
| — | 13.69 | 41.98 | % | 3,173 | 1.27 | %) | 2.09 | % | (0.36 | %) | 1.73 | % | 1.42 | % | 128 | % | ||||||||||||||||||||||
| — | 9.65 | 1.37 | % | 3,681 | (1.06 | %) | 1.89 | % | (0.20 | %) | 1.69 | % | 1.26 | % | 142 | % | ||||||||||||||||||||||
| (4) | Net expenses include certain items not subject to expense reimbursement for periods prior to January 23, 2006. |
| (5) | Includes litigation proceeds of approximately $0.07 and $0.06 per share for the U.S. Emerging Growth Fund during the fiscal year for 2008 and 2009, respectively. |
| (6) | The fund received $12,373 from a security litigation settlement during the year which is reflected in realized gains. This event had a $0.05 per share impact to the fund. |
7
Nicholas-Applegate Institutional Funds
Statement of Assets and Liabilities
| November 30, 2009 | U.S. Emerging Growth | |||
| Assets | ||||
| Investments, at value* | $ | 16,426,562 | ||
| Receivables: | ||||
| Investment securities sold | 26,545 | |||
| Dividends | 12,586 | |||
| Other | 26 | |||
| Total assets | 16,465,719 | |||
| Liabilities | ||||
| Payables: | ||||
| Capital shares redeemed | $ | 6,957 | ||
| To investment advisor | 10,586 | |||
| Other Liabilities | 6,570 | |||
| Total Liabilities | 24,113 | |||
| NET ASSETS | 16,441,606 | |||
| * Investments, at cost | 14,217,208 | |||
| Net Assets Consist of: | ||||
| Paid-in capital | $ | 19,031,295 | ||
| Accumulated net realized (loss) on investments and foreign currencies | (4,799,043 | ) | ||
| Net unrealized appreciation of investments and other assets and liabilities denominated in foreign currencies | 2,209,354 | |||
| Net Assets applicable to all shares outstanding | $ | 16,441,606 | ||
| Net Assets of Class I shares | $ | 13,941,980 | ||
| Net Assets of Class R shares | 2,499,626 | |||
| Class I Shares outstanding | 1,386,647 | |||
| Class R Shares outstanding | 255,689 | |||
| Net Asset Value — Class I Share | $ | 10.05 | ||
| Net Asset Value — Class R Share | $ | 9.78 | ||
See Accompanying Notes to Financial Statements
8
Nicholas-Applegate Institutional Funds
Statement of Operations
| U.S. Emerging Growth | ||||||||
April 1, 2009 to November 30, 2009 | Year ended March 31, 2009 | |||||||
| Investment Income | ||||||||
| Dividends | $ | 56,317 | $ | 54,235 | ||||
| Interest | 3 | — | ||||||
| Total Income | 56,320 | 54,235 | ||||||
| Expenses | ||||||||
| Advisory fee | 66,301 | 74,251 | ||||||
| Administration fees | 36,245 | 40,591 | ||||||
| Shareholder servicing fees | 3,763 | 5,878 | ||||||
| Trustees’ fees and expenses | 263 | 3,520 | ||||||
| Interest and credit facility fee | — | 193 | ||||||
| Miscellaneous | 1,388 | 1,517 | ||||||
| Total Expenses | 107,960 | 125,950 | ||||||
| Expense offset* | (1,360 | ) | (31,475 | ) | ||||
| Net Expenses | 106,600 | 94,475 | ||||||
| Net Investment (Loss) | (50,280 | ) | (40,240 | ) | ||||
| Net Realized and Unrealized | ||||||||
| Gain (Loss) on Investments | ||||||||
| Realized gain (loss) from: | ||||||||
| Securities | 336,862 | (3,991,029 | ) | |||||
| Net realized gain (loss) | 336,862 | (3,991,029 | ) | |||||
| Change in unrealized appreciation of: | ||||||||
| Investments | 4,245,852 | (1,566,687 | ) | |||||
| Net unrealized appreciation (depreciation) | 4,245,852 | (1,566,687 | ) | |||||
| Net Gain (Loss) on Investments | 4,582,714 | (5,557,716 | ) | |||||
| Net Increase in Assets Resulting From Operations | $ | 4,532,434 | $ | (5,597,956 | ) | |||
| * | Please reference Note B in the Notes to Financial Statements |
See Accompanying Notes to Financial Statements
9
Nicholas-Applegate Institutional Funds
Statement of Changes in Net Assets
| U.S. Emerging Growth | ||||||||||||
April 1, 2009 to November 30, 2009 | March 31, 2009 | March 31, 2008 | ||||||||||
| Increase (Decrease) In Net Assets | ||||||||||||
| Net investment (loss) | $ | (50,280 | ) | $ | (40,240 | ) | $ | (63,162 | ) | |||
| Net realized gain (loss) | 336,862 | (3,991,029 | ) | 1,109,622 | ||||||||
| Net unrealized appreciation (depreciation) | 4,245,852 | (1,566,687 | ) | (1,932,344 | ) | |||||||
| Investment operations | 4,532,434 | (5,597,956 | ) | (885,884 | ) | |||||||
| Distributions to Shareholders: | ||||||||||||
| From net investment income | ||||||||||||
| From net realized gains | ||||||||||||
| Class I | — | — | (527,551 | ) | ||||||||
| Class R | — | — | (217,858 | ) | ||||||||
| From Capital Share Transactions: | ||||||||||||
| Total distributions | — | — | (745,409 | ) | ||||||||
| Proceeds from shares sold | ||||||||||||
| Class I | 4,310,648 | 5,416,300 | 2,539,292 | |||||||||
| Class R | 430,366 | 659,133 | 1,124,520 | |||||||||
| Distributions reinvested | ||||||||||||
| Class I | — | — | 526,107 | |||||||||
| Class R | — | — | 217,859 | |||||||||
| Cost of shares redeemed | ||||||||||||
| Class I | (663,990 | ) | (1,926,575 | ) | (1,777,085 | ) | ||||||
| Class R | (295,189 | ) | (792,831 | ) | (1,216,005 | ) | ||||||
| Net increase in net assets from share transactions | 3,781,835 | 3,356,027 | 1,414,688 | |||||||||
| Net Increase (Decrease) in Net Assets | 8,314,269 | (2,241,929 | ) | (216,605 | ) | |||||||
| Net Assets | ||||||||||||
| Beginning | 8,127,337 | 10,369,266 | 10,585,871 | |||||||||
| Ending | $ | 16,441,606 | $ | 8,127,337 | $ | 10,369,266 | ||||||
| Class I — Capital Share Activity | ||||||||||||
| Shares sold | 458,353 | 554,485 | 182,466 | |||||||||
| Distributions reinvested | — | — | 37,552 | |||||||||
| Shares redeemed | (71,623 | ) | (209,274 | ) | (131,451 | ) | ||||||
| Net Class I Share Activity | 386,730 | 345,211 | 88,567 | |||||||||
| Class R — Capital Share Activity | ||||||||||||
| Shares sold | 48,968 | 72,627 | 79,606 | |||||||||
| Distributions reinvested | — | — | 15,891 | |||||||||
| Shares redeemed | (32,618 | ) | (89,614 | ) | (86,526 | ) | ||||||
| Net Class R Share Activity | 16,350 | (16,987 | ) | 8,971 | ||||||||
See Accompanying Notes to Financial Statements
10
Nicholas-Applegate Institutional Funds
Notes to Financial Statements
Note A — ORGANIZATION
Nicholas-Applegate Institutional Funds (the “Trust”) is an open-end investment management company. The Trust was established as a Delaware business trust on December 17, 1992 and consists of twelve separate portfolios (collectively, the “Funds” and each, a “Fund”). Each Fund’s investment objectives, strategies and risks are discussed in the Fund’s current prospectuses. All of the Funds have issued Class I shares (“Class I”), two Funds have issued Class II shares (“Class II”), one Fund has issued Class III shares (“Class III”), one Fund has issued Class IV shares (“Class IV”) and one Fund has issued Retirement shares (“Class R”). No shares have a sales charge. Class R has a shareholder service fee. The Fund offering Class R shares is covered in this report.
Note B — SIGNIFICANT ACCOUNTING POLICIES
Significant accounting policies consistently followed by the Fund in preparing these financial statements are described below. The policies conform with accounting principles generally accepted in the United States.
Security Valuations
Equity securities, including ADRs, and GDRs, that are traded on a stock exchange or on the NASDAQ National Market System are valued at the last sale price as of the close of business on the New York Stock Exchange (normally 4:00 p.m. New York time) on the day the securities are being valued, or lacking any sales, at the mean between the closing bid and asked prices. A security that is listed or trades on more than one exchange is valued at the quotation on the exchange determined to be the primary market for such security. Securities listed or traded on certain non-U.S. exchanges whose operations are similar to the United States over-the-counter market are valued at the price within the limits of the latest available current bid and asked prices deemed by Nicholas-Applegate Capital Management LLC (the “Adviser”) to best reflect fair value. A security that is listed or traded on more than one exchange is valued at the quotation on the exchange determined to be the primary market for such security by the Adviser. Equity Linked Notes (“ELNs”) are valued by using the closing local price for the underlying security and applying the exchange rate for the currency to arrive at a USD equivalent.
Long-term debt obligations, including high quality and high yield corporate securities, municipal securities, asset-backed securities, collateralized mortgage obligations and U.S. Government and Agency issues, are normally valued at the mean between bid and ask price provided by an approved bond pricing service. In the event a TRACE price is used, the last traded price on the valuation date for trades greater than or equal to 1mm par amount. Convertible securities are normally priced at the mean between the bid and ask prices. If such a security has a demand feature exercisable within one to seven days, the security is valued at par. In the event that a pricing service does not price a particular security or the price provided is not believed to be reliable, the Adviser will endeavor to use the average of one or two broker-dealer quotations. If broker-dealer quotations are not available, the Adviser generally does not change the price. Short-term debt instruments (e.g., commercial paper, bankers acceptances, U.S. Treasury Bills, etc.) having a maturity of less than 60 days will be valued at amortized cost. If a fixed income security has a maturity or greater than 60 days, it is valued at market price. U.S. Treasury Bills are priced via bids from an approved pricing source.
Securities or other assets for which reliable market quotations are not readily available or for which the pricing agent or principal market maker does not provide a valuation or methodology or provides a valuation or methodology that, in the judgment of the Adviser does not represent fair value (“Fair Value Securities”), are valued by the Adviser’s Pricing Committee overseen by the Board of Trustees in consultation, as applicable, with the Adviser’s portfolio managers, investment analysts and legal and compliance personnel. Fair Value Securities may include, but are not limited to, the following: certain private placements and restricted securities that do not have an active trading market; securities whose trading has been suspended or for which there is no current market; securities whose prices are stale; securities denominated in currencies that are restricted, untraded, or for which exchange rates are disrupted; securities affected by significant events; and securities that the Adviser’s Pricing Committee believes were priced incorrectly. A “significant event” (which includes, but is not limited to, an extraordinary political or market event) is an event that the Adviser’s Pricing Committee believes with a reasonably high degree of certainty has caused the closing market prices of the Fund’s portfolio securities to no longer reflect their value at the time of the Fund’s NAV calculation.
Security Transactions and Investment Income
Security transactions are accounted for as of trade date Realized gains and losses from security transactions are determined on an identified-cost basis.
Dividend income is recorded on the ex-dividend date or, for certain non-U.S. securities, when the information becomes available to the Fund. Interest income is recorded on an accrual basis. Discounts and premiums on debt securities are accreted and amortized on the yield to maturity basis.
Non-U.S. Currency Transactions
On each net asset valuation date, the value of assets and liabilities denominated in non-U.S. currencies are translated into U.S. dollars using the current exchange rate at 11:00 a.m. Eastern Time against the U.S. dollar spot rate, as provided by an approved pricing service. Security transactions, income and expenses are converted at the prevailing exchange rate on the day of the event. The effect of changes in exchange rates on securities denominated in a non-U.S. currency is included with the net realized and unrealized gain or loss of the associated security. Foreign exchange rates are translated into U.S. dollars when the exchange rate is struck at the close of the London Stock exchange. Other non-U.S. currency gains or losses are reported separately.
The Fund may use forward non-U.S. currency contracts to reduce their exposure to currency fluctuations of their non-U.S. securities. These contracts are commitments to purchase or sell a non-U.S. currency at a specified rate on a future date. When the contract is fulfilled or closed, gains or losses are realized. Until then, the gain or loss is included in unrealized appreciation or depreciation of investments. The contract commitment is fully collateralized by cash or securities of the Fund. Non-U.S. denominated assets and forward currency contracts may involve more risks than U.S. transactions, including currency risk, political and economic risk, regulatory and market risk. Evaluating and monitoring such risk exposure is a part of the Fund’s management strategy. The Fund did not use forward non-U.S. currency contracts at November 30, 2009.
11
Nicholas-Applegate Institutional Funds
Notes to Financial Statements - Continued
Futures Contracts
The Fund may enter into futures contracts involving non-U.S. currency, interest rates, securities, and securities indices, for hedging purposes only. A futures contract obligates the seller of the contract to deliver and the purchaser of the contract to take delivery of the type of non-U.S. currency, financial instrument or security called for in the contract at a specified future time for a specified price. Upon entering into such a contract, the Fund is required to deposit and maintain as collateral such initial margin as required by the exchange on which the contract is traded. Pursuant to the contract, the Fund agrees to receive from or pay to the broker an amount equal to the daily fluctuations in the value of the contract. Such receipts or payments are known as variation margin and are recorded as unrealized gains or losses by the Fund. When the contract is closed, the Fund records a realized gain or loss equal to the difference between the value of the contract at the time it was opened and the value at the time it was closed. During the period ended November 30, 2009, the Fund did not hold futures contracts.
Equity-Linked Securities
The Fund may purchase equity-linked securities, also known as participation notes, equity swaps, and zero strike calls and warrants. Equity-linked securities are primarily used by a Fund as an alternative means to more efficiently and effectively access what is generally an emerging securities market. The Fund deposits an amount of cash with its custodian (or broker, if legally permitted) in an amount near or equal to the selling price of the underlying security in exchange for an equity linked security. Upon sale, the Fund receives cash from the broker or custodian equal to the value of the underlying security. Aside from market risk of the underlying securities, there is a risk of default by the counterparty to the transaction. In the event of insolvency of the counterparty, the Fund may be unable to obtain its expected benefit. In addition, while a Fund will seek to enter into such transactions only with parties which are capable of entering into closing transactions with the Fund, there can be no assurance that the Fund will be able to close out such a transaction with the counterparty or obtain an offsetting position with any counterparty, at any time prior to the end of the term of the underlying agreement. This may impair the Fund’s ability to enter into other transactions at a time when doing so might be advantageous.
Securities Lending
In order to generate expense offset credits, the Fund may lend portfolio securities, on a short-term or a long-term basis, up to 30% of a Fund’s total assets. The loans are secured by collateral in the form of cash, cash equivalents, U.S. government and agency securities equal to at least 102% of the market value of securities loaned on U.S. securities and 105% of the market value of securities loaned on non-U.S. securities. During the term of the loan, the Fund will continue to receive any interest, dividends or amounts equivalent thereto, on the loaned securities while receiving a fee from the borrower and/or earning interest on the investment of the cash collateral. Upon termination of the loan, the borrower will return to the Fund securities identical to the loaned securities. The Fund may pay reasonable finders’, administration and custodial fees in connection with a loan of its securities and may share the interest earned on the collateral with the borrower.
The Fund bears the risk of delay in recovery of, or even loss of rights in, the securities loaned should the borrower of the securities fail financially. The Fund also bears the risk of loss in the event the securities purchased with cash collateral depreciate in value. Loans are subject to termination at the option of the borrower of the Fund. There were no securities on loan for the period ended November 30, 2009. The Fund terminated the security lending program on April 1, 2009.
Credit Facility
The Trust has a $15 million credit facility available to fund temporary or emergency borrowing expiring in March 2010. The Fund pays its pro-rata share of an annual commitment fee plus interest on its specific borrowings. For the period ended March 31, 2009 and November 30, 2009, the Fund did not borrow against the line of credit and the balance was zero.
Commitments and Contingencies
In the normal course of business, the Fund may enter into contracts and agreements that contain a variety of representations and warranties which provide general indemnifications. The maximum exposure to the Fund under these arrangements is unknown, as this would involve future claims that may be made against the Fund that have not yet occurred. However, based on experience, the Fund expects the risks of loss to be remote.
Fund Expenses and Multi-Class Allocations
The Fund bears expenses incurred specifically on its behalf plus an allocation of its share of Trust level expenses. Each share offered by the Fund has equal rights to assets but incurs certain Class specific expenses. The Fund allocates income, gains and losses, both realized and unrealized, and expenses, except for Class specific expenses, based on the relative net assets of each share class.
During the period ended November 30, 2009, many of the brokers with whom the Adviser places trades on behalf of the Fund provided services to the Fund in addition to trade execution. These services included payments of certain expenses on behalf of the Fund. In addition, through arrangements with the Fund’s custodian, credits used to reduce the Fund’s expenses. During the period ended November 30, 2009, the credits used to reduce the Fund’s expenses were:
12
| Fund | Credit Interest Offset | Direct Brokerage Offset | Security Lending Offset | |||||||||
| U.S. Emerging Growth | 116 | 1,244 | — | |||||||||
Use of Estimates
The preparation of financial statements in conformity with accounting principles generally accepted in the United States requires management to make estimates and assumptions that affect the amounts reported in the financial statements and accompanying notes. Actual results could differ from these estimates.
Note C — FEDERAL INCOME TAXES
The Fund intends to comply with the requirements of the Internal Revenue Code applicable to regulated investment companies and to distribute substantially all of their taxable income to shareholders. Accordingly, no provision for federal income taxes is required. A Fund investing in foreign securities records any foreign taxes on income and gains on such investments in accordance with the applicable tax rules. The Fund’s tax accounting treatment of loss deferrals, accretion, passive foreign investment companies and expiration of capital loss carryforwards is different from the financial statement recognition of income and gains.
Capital loss carryforwards may be used to offset current or future capital gains until expiration.
Income Tax Status
The Fund has adopted a policy in accordance with U.S. generally accepted accounting principles which requires management to account for the uncertainty of income taxes through the application of recognition and measurement criteria. The policy is designed to recognize the estimated taxes payable or refundable on tax returns for the current year as a tax liability or asset as well as recognize a deferred tax liability or asset for the estimated future tax effects attributable to temporary differences and carryforwards. This policy defines the threshold for recognizing the benefits of tax-return positions in the financial statements as “more-likely-than-not” to be sustained upon challenge by the taxing authority. The policy also requires management of the Fund to evaluate tax positions taken (or expected to be taken) in the Fund’s tax returns and requires measurement of a tax position meeting the more-likely-than-not criterion, based on the largest benefit that is more than 50 percent likely to be realized. As of November 30, 2009, tax years 2004 through 2009 remain subject to examination by major tax jurisdictions, which include the United States of America and the State of Delaware, but the Fund has no examinations in progress. As of and during the period ended November 30, 2009, the Fund did not have a liability for unrecognized tax benefits.
Distributions to Shareholders
The Fund records distributions to shareholders on the ex-dividend date. Distributions are determined in accordance with income tax regulations that may differ from GAAP. Accordingly, the Fund’s capital accounts are periodically reclassified to reflect income and gains available for distribution under income tax regulations. The Fund makes income and capital gain distributions at least annually. The Fund with income objectives make distributions either quarterly or monthly in accordance with the prospectuses. Due to the concentrated shareholder base, a Fund at any time may be categorized for tax purposes as a Personal Holding Company as defined under Section 542 of the Internal Revenue Code.
The tax characters of distributions paid during the period April 1, 2009 through November 30, 2009 were as follows:
| Distribution paid from: | ||||
| Fund | Ordinary Income | Net long-term capital gain | Total taxable distributions | Total distributions paid(1) |
| U.S. Emerging Growth | — | — | — | — |
The tax characters of distributions paid during the fiscal year ended March 31, 2009 were as follows:
| Distribution paid from: | ||||
| Fund | Ordinary Income | Net long-term capital gain | Total taxable distributions | Total distributions paid(1) |
| U.S. Emerging Growth | — | — | — | — |
13
Nicholas-Applegate Institutional Funds
Notes to Financial Statements - Continued
The tax characters of distributions paid during the fiscal year ended March 31, 2008 were as follows:
| Distribution paid from: | ||||
| Fund | Ordinary Income | Net long-term capital gain | Total taxable distributions | Total distributions paid(1) |
| U.S. Emerging Growth | — | 745,409 | 745,409 | 745,409 |
As of November 30, 2009, the components of accumulated earnings/(deficit) on a tax basis were as follows:
| Components of accumulated earnings/(deficit): | ||||||
| Fund | Undistributed ordinary income | Undistributed long-term capital gains | Accumulated earnings | Accumulated capital and other losses | Unrealized appreciation/ (depreciation) | Total accumulated earning/(deficit) |
| U.S. Emerging Growth | — | — | — | (4,677,127)(2) | 2,087,438(3) | (2,589,689) |
| (1) | Total distributions paid differ from the Statement of Changes in Net Assets because for tax purposes, dividends are recognized when actually paid. |
| (2) | The Fund had net capital loss carryforwards of approximately: |
| Fund | Net Capital Loss CarryForward (in 000’s) | Expiration | Post October Losses (in 000’s) | ||||||
| U.S. Emerging Growth | 1,975 | November 30, 2017 | — | ||||||
| 1,672 | November 30, 2016 | ||||||||
| 1,030 | November 30, 2010 | ||||||||
To the extent future capital gains are offset by capital loss carryforwards, such gains will not be distributed. The availability of loss carryforwards to any future years may be substantially limited as a result of past or future ownership changes as determined under Internal Revenue Code Section 382.
Net capital losses incurred after October 31, and within the taxable year are deemed to arise on the first business day of the Fund’s next taxable year. For the year ended November 30, 2009, the Fund deferred to November 30, 2010 post October capital and currency losses.
| (3) | The difference between book-basis and tax-basis unrealized appreciation/(depreciation) is attributable primarily to the tax deferral of losses on wash sales. |
Note D — TRANSACTIONS WITH AFFILIATES
Investment Advisory Fee
The Adviser receives a monthly fee at an annual rate based on the average daily net assets of the Fund. The investment advisory fee rate for the Fund is listed in the table below.
Administrative & Shareholder Services Fee
On January 24, 2006, the Fund entered into an Administration Agreement whereby the Fund pays for the administrative services it requires under what is essentially an all-in fee structure. Class R shareholders of the Fund pay an administrative fee to the Adviser computed as a percentage of the Fund’s average net assets attributable in the aggregate to R shares. The Adviser, in turn, provides or procures administrative and shareholder services for Class R shareholders and also bears the costs of most third-party administrative services required by the Fund, including audit, custodial, portfolio accounting, legal, transfer agency and printing costs. The administrative fees paid to the Adviser may exceed the related costs.
The investment advisory and administrative services fees are charged at the following annual rates:
| Fund | Advisory Fee | Administration Fee* Class R |
| U.S. Emerging Growth | 0.75% | 0.41% |
| * | Excludes trustees’ fees and expenses, tax, brokerage and interest expenses, and extraordinary expenses |
14
The shareholder servicing fees are charged at the following rates:
| Fund | ||||
| U.S. Emerging Growth | 0.25 | % | ||
Trustee Compensation
Certain officers of the Trust are also officers of the Adviser and the Distributor. The Trustees who are not affiliated with the Adviser and attended all scheduled meetings will receive an annual compensation of approximately $36,000 each from the Trust, except for the chairman of the Board of Trustees of the Trust and the chairman of the Audit Committee, who will receive an annual compensation of approximately $42,000 and $42,500, respectively, from the Trust.
Note E — INVESTMENT TRANSACTIONS
The following table presents purchases and sales of securities, excluding short-term investments, during the period April 1, 2009 through November 30, 2009, to indicate the volume of transactions in the Fund. The tax cost of securities held at November 30, 2009, and the related gross and net unrealized appreciation and depreciation, provide aggregate information on a tax basis against which future gains and losses on these investments are measured for distribution purposes.
| Fund | Purchases (in 000’s) | Sales (in 000’s) | Tax Cost (in 000’s) | Gross Unrealized Appreciation (in 000’s) | Gross Unrealized Depreciation (in 000’s) | Net Unrealized Appreciation (Depreciation) (in 000’s) | ||||||||||||||||||
| U.S. Emerging Growth | $ | 15,842 | $ | 12,156 | $ | 14,339 | $ | 2,615 | $ | (527 | ) | $ | 2,088 | |||||||||||
Note F — FINANCIAL INSTRUMENTS
The Fund may be party to financial instruments with off balance sheet risks, including forward non-U.S. currency contracts, and futures primarily in an attempt to minimize the risk to the Fund, in respect of its portfolio transactions. These instruments involve market and/or credit risk in excess of the amount recognized in the Statement of Assets and Liabilities. Risks arise from the possible inability of counterparties to meet the terms of their contracts and from unexpected movement in currencies, securities values and interest rates.
The contract amounts indicate the extent of the Fund’s involvement in such contracts. As of November 30, 2009, the Fund was not party to any such agreements.
Note G — FAIR VALUE OF FINANCIAL INSTRUMENTS
In accordance with GAAP, the Fund is required to disclose information regarding the fair value measurements of the Fund’s assets and liabilities. Fair value is the price that would be received to sell an asset or paid to transfer a liability in an orderly transaction between market participants at the measurement date. The disclosure requirement established a three-tier hierarchy to maximize the use of observable market data, minimize the use of unobservable inputs and establish classification of fair value measurements for disclosure purposes. Inputs refer broadly to the assumptions that market participants would use in pricing the asset or liability, including assumptions about risk; for example, the risk inherent in a particular valuation technique used to measure fair value including such a pricing model and/or the risk inherent in the inputs to the valuation technique. Inputs may be observable or unobservable. Observable inputs are inputs that reflect the assumptions market participants would use in pricing the asset or liability developed based on market data obtained from sources independent of the reporting entity. Unobservable inputs are inputs that reflect the reporting entity’s own assumptions about the assumptions market participants would use in pricing the asset or liability developed based on the best information available in the circumstances.
On June 15 2009, the Fund adopted additional disclosure requirements which provide the reader of the financial statements additional guidance for estimating fair value when the volume and level of activity for the asset or liability have significantly decreased. Additional guidance on identifying circumstances that indicate a transaction is not orderly. The amended requirement emphasizes that even if there has been a significant decrease in the volume and level of activity for the asset or liability and regardless of the valuation technique(s) used, the objective of a fair value measurement remains the same. The three levels defined by the fair value measurement requirement hierarchy are as follows:
Level 1 — quoted prices in active markets for identical securities.
Level 2 — significant observable inputs (including quoted prices for similar securities, interest rates, prepayment speeds, credit risk, etc.).
Level 3 — significant unobservable inputs (including the Fund’s own assumptions in determining the fair value of investments).
15
Nicholas-Applegate Institutional Funds
Notes to Financial Statements - Continued
In some instances, the inputs used to measure fair value might fall in different levels of the fair value hierarchy. The level in the fair value hierarchy within which the fair value measurement in its entirety falls is determined based on the lowest input level that is significant to the fair value measurement in its entirety. Because of the inherent uncertainties of valuation, the values reflected in the financial statements may materially differ from the value received upon actual sale of those investments.
The following table summarizes the valuation of the Fund’s securities as of November 30, 2009, using the fair value hierarchy:
| U.S. Emerging Growth | Level 1 Quoted Prices | Level 2 Other Significant Observable Inputs | Level 3 Significant Unobservable Inputs | Value at 11/30/2009 | ||||||||||||
| Investments in Securities | ||||||||||||||||
| Common Stock | 16,033,533 | — | — | 16,033,533 | ||||||||||||
| Limited Partnerships | 111,888 | — | — | 111,888 | ||||||||||||
| Short-Term Investments | 281,141 | — | — | 281,141 | ||||||||||||
| Total Investments in Securities | 16,426,562 | — | — | 16,426,562 | ||||||||||||
Note H — MARKET PRICE RISK
The prices of securities held by the Fund may decline in response to certain events, including those directly involving the companies whose securities are owned by the Fund; conditions affecting the general economy; overall market changes; local, regional or global political, social or economic instability; and currency and interest rate fluctuations. The growth-oriented, equity-type securities generally purchased by the Fund may involve large price swings and potential for loss.
Investments in securities issued by entities based outside the United States may be subject to the risks described above to a greater extent and may also be affected by currency controls; different accounting, auditing, financial reporting, and legal standards and practices in some countries; expropriation; changes in tax policy; greater market volatility; differing securities market structures; higher transaction costs; and various administrative difficulties, such as delays in clearing and settling portfolio transactions or in receiving payment of dividends. These risks may be heightened in connection with investments in developing countries.
Note I — FINANCIAL DERIVATIVE INSTRUMENTS
In accordance with GAAP, the Fund is required to disclose certain information regarding derivative instruments and hedging activities. The Fund is required to provide enhanced disclosures about the use of and accounting for derivative instruments using a tabular format. Disclosing the fair values of derivative instruments and their gains and losses in a tabular format should provide a more complete picture of the location in an entity’s financial statements of both the derivative positions existing at period end and the effect of using derivatives during the reporting period. Disclosing information about credit-risk-related contingent features should provide information on the potential effect on an entity’s liquidity from using derivatives. Finally, the additional disclosure affords the reader the ability to cross-reference the information within the footnotes, which should help users of financial statements locate important information about derivative instruments. The Fund did not hold any derivative instruments during the period ended November 30, 2009.
Note J — SIGNIFICANT SHAREHOLDER CONCENTRATION
As of November 30, 2009, the Fund had individual shareholders and/or omnibus shareholder accounts (which are comprised of a group of individual shareholders), which individually amounted to more than 10% of the total shares outstanding of the Fund as detailed below.
| Fund | % of Fund | Number of Shareholders | ||||||
| U.S. Emerging Growth | 73.10% | 3 | ||||||
Note K — ANNOUNCEMENT OF REORGANIZATION
At a meeting of the Board of Trustees of the Trust held on November 13, 2009, the Board approved a form of Plan of Reorganization (the “Plan”) with respect to each of the Funds. The Plan provides for the transfer of the Fund’s assets to a corresponding series of Allianz Funds Multi-Strategy Trust with substantially similar investment objectives and strategies in a tax-free exchange. The reorganization of the Fund is subject to approval by the shareholders of the Fund. In conjunction with the reorganization of the Fund the Board also approved a change in the Fund’s fiscal year end from March 31 to November 30.
16
Note L — EVALUATION OF SUBSEQUENT EVENTS
In accordance with GAAP, the Fund is required to recognize in the financial statements the effects of all subsequent events that provide additional evidence about conditions that existed at the date of the balance sheet, including the estimates inherent in the process of preparing financial statements. In preparing these financial statements, the Fund has evaluated events and transactions for potential recognition or disclosure through January 28, 2010, the date the financial statements were issued.
17
Nicholas-Applegate Institutional Funds
Report of Independent Registered Public Accounting Firm
To the Board of Trustees of Nicholas-Applegate Institutional Funds and
Shareholders of the U.S. Emerging Growth Fund
In our opinion, the accompanying statement of assets and liabilities, including the schedule of investments, and the related statements of operations and of changes in net assets and the financial highlights present fairly, in all material respects, the financial position of the U.S. Emerging Growth Fund (one of the funds constituting the Nicholas-Applegate Institutional Funds, hereinafter referred to as the “Fund”) at November 30, 2009, the results of its operations, the changes in its net assets and the financial highlights for each of the periods presented for Class R, in conformity with accounting principles generally accepted in the United States of America. These financial statements and financial highlights (hereafter referred to as “financial statements”) are the responsibility of the Fund’s management; our responsibility is to express an opinion on these financial statements based on our audit. We conducted our audit of these financial statements in accordance with the standards of the Public Company Accounting Oversight Board (United States). Those standards require that we plan and perform the audit to obtain reasonable assurance about whether the financial statements are free of material misstatement. An audit includes examining, on a test basis, evidence supporting the amounts and disclosures in the financial statements, assessing the accounting principles used and significant estimates made by management, and evaluating the overall financial statement presentation. We believe that our audit, which included confirmation of securities at November 30, 2009 by correspondence with the custodian and brokers, provides a reasonable basis for our opinion.
As explained in Note K to the financial statements, on November 13, 2009, the Board of Trustees of the Fund approved a reorganization of the Fund through a transfer of the Fund’s assets into a corresponding series of Allianz Funds Multi-Strategy Trust.
/s/ PricewaterhouseCoopers LLP
Los Angeles, California
January 28, 2010
18
Shareholder Expense Example — (Unaudited)
As a shareholder of a Fund, you incur two types of costs: (1) transaction costs, including redemption fees, and (2) ongoing costs, including management fees and other Fund expenses. This example is intended to help you understand your ongoing costs (in dollars) of investing in the Fund and to compare these costs with the ongoing costs of investing in other mutual funds.
The example is based on an investment of $1,000 invested at the beginning of the period and held for the entire period (June 1, 2009 to November 30, 2009).
ACTUAL EXPENSES
The first line of the table below for the Fund provides information about actual account values and actual expenses. You may use the information in this line, together with the amount you invested, to estimate the expenses that you paid over the period. Simply divide your account value by $1,000 (for example, an $8,600 account value divided by $1,000 = 8.6), then multiply the result by the number in the first line for a Fund under the heading “Expenses Paid During Period” to estimate the expenses you paid on your account during this period.
HYPOTHETICAL EXAMPLE FOR COMPARISON PURPOSES
The second line of the table below for the Fund provides information about hypothetical account values and hypothetical expenses based on a Fund’s actual expense ratio and an assumed rate of return of 5% per year before expenses, which is not the Fund’s actual return. The hypothetical account values and expenses may not be used to estimate the actual ending account balance or expenses you paid for the period. You may use this information to compare the ongoing costs of investing in a Fund and other funds. To do so, compare this 5% hypothetical example with the 5% hypothetical examples that appear in the shareholder reports of the other funds
Please note that the expenses shown in the table are meant to highlight your ongoing costs only and do not reflect any transaction costs. Therefore, the second line of the table is useful in comparing ongoing costs only, and will not help you determine the relative total costs of owning different funds. In addition, if these transactional costs were included, your costs would have been higher.
Beginning Account Value June 1, 2009 | Ending Account Value November 30, 2009 | Expenses Paid During the Period June 1, 2009 to November 30, 2009 | Annualized Expense Ratio | |||||||||||||
| U.S. Emerging Growth — Class R | ||||||||||||||||
| Actual | $ | 1,000.00 | $ | 1,174.10 | $ | 7.90 | 1.45 | % | ||||||||
| Hypothetical (5% return before expenses) | $ | 1,000.00 | $ | 1,017.80 | $ | 7.33 | 1.45 | % | ||||||||
| * | Expenses are equal to the Fund’s annualized expense ratio, multiplied by the average account value over the period. |
19
Supplementary Information — (Unaudited)
PROXY VOTING
The Adviser votes proxies on behalf of the Fund pursuant to written policies and procedures adopted by the Fund. To obtain free information on how the Fund’s securities were voted, please call the Fund at 1-800-551-8043 or visit the Fund’s website at www.nacm.com. You may also view how the Fund’s securities were voted by visiting the Securities & Exchange Commission’s (the “SEC”) website at www.sec.gov. Additionally, information regarding each Fund’s proxy voting record for the most recent twelve month period ended June 30 is also available, free of charge, by calling the Fund at 1-800-551-8043 and from the SEC’s website at www.sec.gov.
QUARTERLY FILING
The Fund provides a complete list of portfolio holdings four times in each fiscal year, at the end of each calendar quarter. For the second and fourth quarters, the portfolio holdings appear in the Fund’s semiannual and annual reports to shareholders. For the first and third quarters, the Fund file their portfolio holdings with the Securities and Exchange Commission on Form N-Q. Shareholders can look up the Fund’s Form N-Q on the SEC’s website at www.sec.gov. Forms N-Q may also be reviewed and copied at the SEC’s Public Reference Room in Washington, DC. To find out more about this public service, call the SEC at 1-202-942-8090.
TRUSTEE APPROVAL OF INVESTMENT ADVISORY AGREEMENT
Based upon the recommendation of the Contract Committee of the Board of Trustees, a Committee comprised of all of the Independent Trustees of the Trust (“Funds”), the Trustees unanimously approved the continuance of the Investment Advisory Agreement between the Funds and Nicholas- Applegate Capital Management (“Nicholas-Applegate”) at a meeting held on November 13, 2009. In approving the Investment Advisory Agreement, the Board of Trustees, through its Contract Committee, evaluated a comprehensive package of materials, including performance and expense data for other funds with similar asset sizes, investment objectives and policies that had been provided by Lipper Inc. (“Lipper”). Prior to making its recommendation, the Contract Committee reviewed the proposed continuance of the Investment Advisory Agreement with representatives of Nicholas-Applegate and with independent legal counsel to the Independent Trustees of the Trust. Members of the Contract Committee also met privately with independent legal counsel to discuss the factors they felt were relevant. The factors included: (1) the performance of the Fund and the financial condition of the Adviser and the Fund; (2) comparative performance data for the Fund and other funds with similar investment objectives/policies and to a relevant index; (3) the nature, extent and quality of investment advisory services rendered by Nicholas-Applegate; (4) marketing and sales efforts dedicated to the Fund; (5) compensation paid to Nicholas-Applegate; (6) cost borne by Nicholas-Applegate; (7) comparative fee and expense data for the Fund and other funds with similar investment objectives/policies; (8) Nicholas-Applegate’s policies and practices regarding allocation of portfolio transactions, best price and execution of portfolio transactions, and soft dollar arrangements; (9) fair valuation policies and procedures; (10) expense offset arrangements; (11) portfolio turnover rates; (12) fall-out benefits, such as research received pursuant to Section 28(e) of the Securities Exchange Act of 1934, as amended; (13) fees that Nicholas-Applegate charges its other clients with similar investment objectives/policies; (14) experience and qualifications of each member of the portfolio management teams; (15) material changes in personnel managing the Fund; and (16) the time dedicated by Nicholas-Applegate’s senior management, portfolio managers and other key personnel, including the Chief Executive Officer and the Chief Investment Officer, to the Fund. In their deliberations, the Contract Committee did not identify any particular information that was controlling, and each member of the Contract Committee attributed different weights to the various factors. The Contract Committee determined that the fees of the Investment Advisory Agreement between each of the Fund and Nicholas-Applegate were fair and reasonable in light of the services performed, expenses incurred and such other matters as the Contract Committee considered relevant in the exercise of their reasonable judgment. The Contract Committee also separately discussed the material factors and conclusions that formed the basis for the Contract Committee to recommend that the Board of Trustees approve the Investment Advisory Agreement for the Fund.
SERVICES PROVIDED BY NICHOLAS-APPLEGATE
Nicholas-Applegate manages the portfolio for the Fund under the direction of the Board of Trustees and manages each Fund consistent with each Fund’s investment objectives and policies. Nicholas-Applegate provides each Fund with office space and such other services and personnel as are necessary for its operations. The Contract Committee considered the scope and quality of services provided by Nicholas-Applegate under the Investment Advisory Agreement. The Contract Committee considered the quality of the investment research capabilities of Nicholas-Applegate and the other services to be provided to the Fund by Nicholas-Applegate, such as selecting broker-dealers for executing portfolio transactions, serving as the Fund’s administrator, producing shareholder reports, providing support services for the Trustees and Board Committees and overseeing the activities of other service providers, including monitoring compliance with various Fund policies and procedures and with applicable securities laws and regulations. The Contract Committee concluded that the nature, extent and quality of the services provided by Nicholas-Applegate to the Fund was appropriate and consistent with the terms of the Investment Advisory Agreement and that the Fund will continue to benefit from the services provided under the Investment Advisory Agreement with Nicholas-Applegate.
COST OF SERVICES & FUND EXPENSES
The Contract Committee examined the fee information and expenses for the Fund in comparison to information from other comparable funds as provided by Lipper. The Contract Committee agreed that overall the Fund’s management fees and expense ratios were reasonable in relation to the management fees and expense ratios of the Fund’s peer groups selected by Lipper. The Contract Committee also reviewed Nicholas-Applegate’s management fees charged to its institutional separate account clients and for sub-advised funds (funds for which Nicholas-Applegate provides portfolio management services only). The Contract Committee also reviewed the profitability analysis for the Fund. The Contract Committee concluded that overall the management fees and other compensation to be paid by the Fund to Nicholas-Applegate were reasonable in relation to the nature and quality of the services to be provided, taking into account (1) the fees charged by other advisers for managing comparable mutual funds with similar strategies and assets; (2) the fees that Nicholas-Applegate charges to other clients; (3) the estimated overall expense ratio of the Fund, taking into account the Fund’s expense offset arrangements with brokers, custodians and third party services providers; and (4) the Fund’s performance in light of challenging market conditions.
20
INVESTMENT RESULTS
The Contract Committee considered the investment results of the Fund as compared to funds with similar investment objectives and policies as determined by Lipper and with relevant securities indices. In addition to the information received by the Contract Committee for their meeting, Nicholas-Applegate provides detailed performance information for the Fund at each regular meeting of the Board of Trustees. The Contract Committee reviewed information showing absolute and relative performance for the Fund over 1-year, 3-year, 5-year and 10-year periods as applicable.
U.S. Emerging Growth Fund
The Contract Committee reviewed information comparing performance of the Fund to its Lipper performance group and the Russell 2000 Growth Index. The comparative information showed the Fund outperformed relative to the Index over the 1 and 5-year periods and underperformed over the 10-year period. The Fund’s performance relative to the Lipper performance universe placed it in the 2nd quintile over the 1-year period, 1st quintile over the 5-year period and 4th quintile in the 10-year period. After further discussion, the Contract Committee concluded that the Fund had performed well on both a relative and absolute basis through intense market conditions.
INVESTMENT ADVISORY FEE AND OTHER EXPENSES
The Contract Committee considered the investment advisory fee paid by the Fund. The Contract Committee recognized that it was difficult to make comparisons of investment advisory fee because there are variations in the services that are included in the fee paid by other funds. The Contract Committee also considered the fees that Nicholas-Applegate charges other clients with similar investment objectives/policies. Nicholas-Applegate acts as sub-adviser to several open-end and closed-end registered investment companies, non-U.S. investment companies, and investment adviser to separately managed institutional accounts. For funds where Nicholas-Applegate acts as sub-adviser, the Investment advisory fee is generally lower. For separately managed accounts where Nicholas- Applegate acts solely as investment adviser, the investment advisory fee is comparable and in some cases higher. The Contract Committee also considered the total expense ratio for the Fund in comparison to its respective peers.
U.S. Emerging Growth Fund
The Lipper peer group consisted of the Fund, the Expense Group and all other institutional small-cap growth funds, excluding outliers (“Expense Universe”). The Expense Group consisted of 15 other funds with average net assets ranging between $3.3 million and $85 million compared to $9.9 million for the Fund. The Expense Group fee and expense data showed that the Fund’s total expenses were the second lowest in the Expense Group and ranked in the 1st quintile of the Expense Universe. Based on its review, the Contract Committee concluded that the Fund’s expenses were very good in light of the quality of services offered and other factors considered.
ECONOMIES OF SCALE
The Contract Committee noted that the investment advisory and unitary fee schedules for the Fund do not contain breakpoints that reduce the fee rate on assets above specified levels. However, the Contract Committee did note that overall fees paid to Nicholas-Applegate (investment advisory, administration, and shareholder service) contain the functional equivalent of breakpoints through the offering of four to five different share classes that reduce the fees paid to Nicholas-Applegate based on the asset level of the account. The Contract Committee recognized that the existing fee structure is consistent with the institutional nature of the Fund’s shareholder base and of Nicholas-Applegate’s business, which caters to large institutional investors (e.g., pension plans, endowments and public funds). Having taken these factors into consideration, the Contract Committee concluded that the Fund’s current multiple share class fee structure establishes a reasonable basis for realizing economies of scale for the Funds which may exist when assets increase. At current asset levels, the Contract Committee also noted that the Fund has not realized optimal economies of scale in respect to other expenses and that many expenses continue to be paid by Nicholas-Applegate.
21
Supplementary Information — (Unaudited) — Continued
| CORPORATE GOVERNANCE (Unaudited) | |
| Name, Address (1) | |
| Age | Principal Occupation(s) during Past 5 Years |
| Position(s) Held with Fund | Other Directorship Held by Trustee |
| Length of Time Served (2) | Number of Portfolios in Fund Complex Overseen by Trustee |
| Independent Trustees: | |
| Darlene T. DeRemer | Principal Occupations: Partner, Grail Partners LLC (since 2005); Managing Director, Putnam Lovell NBF Private Equity |
| 11/27/1955 | (2004-2005); Managing Director, NewRiver E-Business Advisory Services Division (2000-2003); Prior to, President and |
| Chairperson of the Board | Founder, DeRemer Associates, a strategic and marketing consulting firm for the financial services industry (since 1987); |
| Since August 2007 & Trustee | Vice President and Director, Asset Management Division, State Street Bank and Trust Company, now referred to as State |
| Since May 1999 | Street Global Advisers (1982-1987); Vice President, T. Rowe Price & Associates (1979-1982); Member, Boston Club |
| (since 1998); Member, Financial Women’s Association Advisory Board (since 1995); Founder, Mutual Fund Cafe Website. | |
Other Directorships Held: Founding Member and Director, National Defined Contribution Council (since 1997); Trustee, | |
| Boston Alzheimer’s Association (since 1998); Director, King’s Wood Montessori School (since 1995); Editorial Board, | |
| National Association of Variable Annuities (since 1997); Director, Nicholas-Applegate Strategic Opportunities, Ltd. | |
| (1994-1997); Trustee, Nicholas-Applegate Mutual Funds (1994-1999); Director, Jurika & Voyles Fund Group (since | |
| 1994-2000); Trustee, Barnwell Funds (2003-2005); Director, Independent Director Council (since 2004); Mutual Fund | |
| Director’s Council-Advisory Board; Board Member-Chatman Partners; Board Member-X-Shares LLC. | |
Number of Portfolios Overseen by Trustee: 12 | |
| John J. Murphy | Principal Occupations: Founder and senior principal, Murphy Capital Management. |
| 4/8/1944 | |
| Trustee | Other Directorships Held: Director, Smith Barney Multiple Discipline Trust; Director, Barclays International Funds Group |
| Since September 2005 | Ltd. and affiliated companies; Smith Barney Consulting Group; Legg Mason Equity Funds. |
Number of Portfolios Overseen by Trustee: 12 | |
| Bradford K. Gallagher | Principal Occupations: Founder, Spyglass Investments LLC (a private investment vehicle) (since 2001); Founder, |
| 2/24/1944 | President and CEO of CypressTree Investment Management Company and Annuity Company; Managing Director, |
| Trustee | Fidelity Investments. |
| Since August 2007 | |
Other Directorships Held: Trustee, The Common Fund (since 2005); Director, Anchor Point Inc. (since 1995); Chairman | |
| and Trustee, Atlantic Maritime Heritage Foundation (since 2007); Director, Shielding Technology Inc. (since 2006); | |
| Director, United Way of Eastern Massachusetts (1988-1990); Director, Ouimet Scholarship Fund (1993-2005); Director, | |
| Emerson Hospital (1995-2005). | |
Number of Portfolios Overseen by Trustee: 12 | |
| Steven Grenadier | Principal Occupations: William F. Sharpe Professor of Financial Economics, Stanford University Graduate School of |
| 12/14/1964 | Business; Research Associate, National Bureau of Economic Research (since 2002); Chairman of the Finance |
| Trustee | Department, Stanford University Graduate School of Business (2004-2006). |
| Since August 2007 | |
Other Directorships Held: Independent Trustee, E Trade Funds. | |
Number of Portfolios Overseen by Trustee: 12 | |
Interested Trustees: | |
| Horacio A. Valeiras | Principal Occupations: Managing Director (since 2004) and Chief Investment Officer, Nicholas-Applegate Capital |
| 1/8/1959 | Management, Nicholas-Applegate Securities (since 2002); Chief Investment Officer; Oppenheimer and AGI Management |
| President & Trustee | Partners (since 2008); Managing Director of Morgan Stanley Investment Management, London (1997-2002); Head of |
| Since August 2004 | International Equity and Asset Allocation, Miller Anderson & Sherred; Director and Chief of Investment Strategies, Credit |
| Suisse First Boston. | |
Other Directorships Held: Trustee, The Bishops School (since 2002); Trustee, San Diego Rowing Club (since 2002). | |
Number of Portfolios Overseen by Trustee: 12 | |
| Arthur B. Laffer | Principal Occupations: Chairman, Laffer Associates (economic consulting) (since 1979); Chairman, Laffer Advisors |
| 8/14/1940 | Inc. (registered broker-dealer) (since 1981); Chairman, Laffer Investments (asset management) (since 2000); Member, |
| Trustee | Congressional Policy Advisory Board (since 1998); Distinguished University Professor and Director, Pepperdine |
| Since August 2007 | University (1985-1988); Professor of Business Economics, University of Southern California (1976-1984); Associate |
| Professor of Business Economics, University of Chicago (1967-1976). | |
Other Directorships Held: Director of MPS Group, Inc. (NYSE:MPS) (since 2003); Director, Petco Animal Supplies, Inc. | |
| (NASDAQ:PETC) (2002-2005); Director, Oxigene Inc. (NASDAQ:OXGN), biopharmaceutical company (since 1998); | |
| Director of Provide Commerce (NASDAQ: PRVD) (since 1998); Director, Veolia Environmental Corporation (successor to | |
| U.S. Filter Corporation) (water purification) (1991-2006); Director, Nicholas-Applegate Fund, Inc. (1987-2007). | |
Number of Portfolios Overseen by Trustee: 12 | |
22
| CORPORATE GOVERNANCE (Unaudited) | |
| Name, Address (1) | |
| Age | Principal Occupation(s) during Past 5 Years |
| Position(s) Held with Fund | Other Directorship Held by Officer |
| Length of Time Served (2) | Number of Portfolios in Fund Complex Overseen by Officer |
Officers: | |
| Charles H. Field, Jr. | Principal Occupations: Managing Director and General Counsel, Nicholas-Applegate Capital Management (since |
| 7/24/1955 | 1996); Chief Legal Officer of Oppenheimer Capital Management LLC (since 2009), Chief Legal Officer of Allianz Global |
| Secretary and Chief | Investors Management Partners LLC (since 2009); and Chief Legal Officer of Allianz Global Investors Solutions LLC |
| Compliance Office | (since 2009). Prior to joining Nicholas-Applegate in 1996 was an attorney for Federated Investors (1991-1996) and an |
| Since May 2002 | attorney for Unified Management Corp. (1987-1991). |
Other Directorships Held: NA | |
Number of Portfolios Overseen by Officer: 12 | |
| Deborah A. Wussow | Principal Occupations: Senior Vice President, Chief Compliance Officer, Nicholas-Applegate Capital Management, |
| 1/31/1960 | LLC (since 2008), Chief Compliance Officer, Oppenheimer Capital Management, LLC (since April 2009); Chief |
| Treasurer and Assistant | Compliance Officer, Allianz Global Investors Management Partners, LLC (since 2009); Chief Compliance Officer, Allianz |
| Secretary | Solutions, LLC (since 2009); Deputy Chief Compliance Officer, Nicholas-Applegate Capital Management, LLC |
| Since August 2006 | (2004-2008);Compliance Officer, Nicholas-Applegate Capital Management (1995-2004). |
Other Directorships Held: NA | |
Number of Portfolios Overseen by Officer: 12 | |
| (1) | Unless otherwise noted, the address of the Trustees and Officers is c/o: Nicholas-Applegate Capital Management, 600 West Broadway, 32nd Floor, San Diego, California 92101. |
| (2) | Each Trustee serves for an indefinite term, until her or his successor is elected. |
23
(This page intentionally left blank)
(This page intentionally left blank)
(This page intentionally left blank)
TRUSTEES OF NICHOLAS-APPLEGATE INSTITUTIONAL FUNDS
Darlene T. DeRemer, Chairperson
Horacio A. Valeiras
John J. Murphy
Bradford K. Gallagher
Steven Grenadier
Arthur B. Laffer
OFFICERS
Horacio A. Valeiras, President
Charles H. Field, Jr., Secretary & Chief Compliance Officer
Deborah A. Wussow, Treasurer & Assistant Secretary
INVESTMENT ADVISER
Nicholas-Applegate Capital Management
DISTRIBUTOR
Nicholas-Applegate Securities
CUSTODIAN
Brown Brothers Harriman & Co., Private Bankers
TRANSFER AGENT
UMB Fund Services Group, Inc.
INDEPENDENT REGISTERED PUBLIC ACCOUNTING FIRM
PricewaterhouseCoopers LLP
SAR0909INST
 | 600 West Broadway San Diego, California 92101 800.551.8043 |
Item 2. Code of Ethics.
| (a) | The registrant has adopted a code of ethics that applies to the registrant’s principal executive officer, principal financial officer, principal accounting officer or controller or persons performing similar functions. |
| (b) | The registrant has adopted a code of ethics that is reasonably designed to deter wrongdoing and to promote: |
| (1) | Honest and ethical conduct, including the ethical handling of actual or apparent conflicts of interest between personal and professional relationships; |
| (2) | Full, fair, accurate, timely, and understandable disclosure in reports and documents that a registrant files with, or submits to, the Commission and in other public communications made by the registrant; |
| (3) | Compliance with applicable governmental laws, rules, and regulations; |
| (4) | The prompt internal reporting of violations of the code to an appropriate person or persons identified in the code; and |
| (5) | Accountability for adherence to the code. |
| (c) | During the period covered by this Form N-CSR, there have been no amendments to a provision of the code of ethics that applies to the registrant’s principal executive officer, principal financial officer, principal accounting officer or controller, or persons performing similar functions, regardless of whether these individuals are employed by the registrant or a third party, and that relates to any element of the code of ethics description in Item 2(b) of this Form N-CSR. |
| (d) | During the period covered by this Form N-CSR, the registrant has not granted any waivers, including an implicit waiver, from a provision of the code of ethics that applies to the registrant’s principal executive officer, principal financial officer, principal accounting officer or controller, or persons performing similar functions, regardless of whether these individuals are employed by the registrant or a third party that relates to one or more of the items set forth in Item 2(b) of this Form N-CSR. |
| (e) | Not applicable. |
| (f) | (1) A copy of the code of ethics referenced in Item 2(a) of this Form N-CSR is filed as Exhibit 12(a)(1) to this Form N-CSR. |
Item 3. Audit Committee Financial Expert.
| (a) | (1) The registrant’s Board of Trustees has determined that the registrant has at least one audit committee financial expert serving on its audit committee. |
(2) The following Independent Trustees have been designated as audit committee financial experts by the Board of Trustees: Darlene T. DeRemer, Bradford K. Gallagher, Steven Grenadier and John J. Murphy. Each of Ms. DeRemer and Messrs. Gallagher, Grenadier and Murphy are “independent” as defined in Item 3(a)(2) of Form N-CSR.
Item 4. Principal Accountant Fees and Services.
| (a) | AUDIT FEES |
The aggregate fees billed for the fiscal year ended March 31, 2009 for professional services rendered by the principal accountant for the audit of the registrant’s annual financial statements or services that are normally provided by the accountant in connection with statutory and regulatory filings or engagements were $295,000. On November 13, 2009, the registrant changed its fiscal year end to November 30. The aggregate fees billed for the fiscal period ended November 30, 2009 for professional services rendered by the principal accountant for the audit of the registrant’s annual financial statements or services that are normally provided by the accountant in connection with statutory and regulatory filings or engagements were $150,000.
| (b) | AUDIT-RELATED FEES |
Not applicable.
| (c) | Tax Fees |
The aggregate fees billed in the fiscal year ended March 31, 2009 for professional services rendered by the principal accountant for tax compliance, tax advice and tax planning were $88,767. On November 13, 2009, the registrant changed its fiscal year end to November 30. The aggregate fees billed in the fiscal period ended November 30, 2009 for professional services rendered by the principal accountant for tax compliance, tax advice and tax planning were $26,490. The services for each of the fiscal year/period ended March 31, 2009 and November 30, 2009 consisted of (i) review or preparation of U.S. federal, state, local and excise tax returns; (ii) U.S. federal, state, local and Mauritius entity tax planning, advice and assistance regarding statutory, regulatory or administrative developments, and (iii) tax advice regarding tax qualification.
| (d) | All Other Fees |
Not applicable.
| (e) | (1) The registrant has adopted pre-approval policies and procedures consistent with Rule 2-01(c)(7) of Regulation S-X. The policies and procedures allow for the pre-approval of the following non-audit services: (1) consultations on generally accepted accounting principles in the U.S. and/or financial statement disclosure matters not exceeding $80,000/year; (2) consultations on tax accounting matters not exceeding $25,000/year; (3) review of annual excise distribution provisions not exceeding $15,000/year; and (4) various regulatory and tax filings in foreign jurisdictions (such as India, Taiwan and Venezuela) not exceeding $25,000/year. The policies and procedures require quarterly reporting to the Audit Committee of all such services performed and related fees billed pursuant to the policies and procedures. |
| (2) The percentage of services described in each of paragraphs (b) through (d) of this Item that were approved by the Audit Committee pursuant to paragraph (c)(7)(i)(C) of Rule 2-01 of Regulation S-X are as follows: |
(b) Not applicable.
(c) 100%
(d) Not applicable.
| (f) | Not applicable. |
| (g) | The aggregate non-audit fees billed by the registrant’s accountant for services rendered to the registrant, and rendered to the registrant's investment adviser (not including any sub-adviser whose role is primarily portfolio management and is subcontracted with or overseen by another investment adviser), and any entity controlling, controlled by, or under common control with the investment adviser that provides ongoing services to the registrant for the fiscal year/period ended March 31, 2009 and November 30, 2009 were $6,235,708 and $2,301,192, respectively. |
| (h) | The registrant’s Audit Committee has considered whether the provision of non-audit services that were rendered to the registrant’s investment adviser (not including any subadviser whose role is primarily portfolio management and is subcontracted with or overseen by another investment adviser), and any entity controlling, controlled by, or under common control with the investment adviser that provides ongoing services to the registrant that were not pre-approved pursuant to paragraph (c)(7)(ii) of Rule 2-01 of Regulation S-X is compatible with maintaining the principal accountant’s independence. |
Item 5. Audit Committee of Listed Registrants.
Not applicable.
Item 6. Investments.
This schedule is included as part of the report to shareholders filed under Item 1 of this Form N-CSR.
Item 7. Disclosure of Proxy Voting Policies and Procedures for Closed-End Management Investment Companies.
Not applicable.
Item 8. Portfolio Managers of Closed-End Management Investment Companies.
Not applicable.
Item 9. Purchases of Equity Securities by Closed-End Management Investment Company and Affiliated Purchasers.
Not applicable.
Item 10. Submission of Matters to a Vote of Security Holders.
There have been no material changes to the procedures by which the shareholders may recommend nominees to the registrant’s Board of Trustees, where those changes were implemented after the registrant last provided disclosure in response to the requirements of Item 407(c)(2)(iv) of Regulation S-K (as required by Item 22(b)(15) of Schedule 14A), or this Item.
Item 11. Controls and Procedures.
(a) The registrant’s principal executive and financial officers have concluded that the registrant’s disclosure controls and procedures (as defined in Rule 30a-3(c) under the Investment Company Act of 1940, as amended (the “1940 Act”)) are effective, as of a date within 90 days of the filing date of this Form N-CSR, based on their evaluation of these controls and procedures required by Rule 30a-3(b) under the 1940 Act and Rules 13a-15(b) or 15d-15(b) under the Securities Exchange Act of 1934, as amended (the “Exchange Act”).
(b) There were no changes in the registrant's internal control over financial reporting (as defined in Rule 30a-3(d) under the 1940 Act) that occurred during the registrant's second fiscal quarter of the period covered by this Form N-CSR, that have materially affected, or are reasonably likely to materially affect, the registrant's internal control over financial reporting.
Item 12. Exhibits.
(a)(1) The registrant’s code of ethics that is the subject of the disclosure required by Item 2 of this Form N-CSR is filed as Exhibit 12(a)(1) to this Form N-CSR.
(a)(2) A separate certification for the principal executive officer and principal financial officer of the registrant as required by Rule 30a-2(a) under the 1940 Act is filed as Exhibit 12(a)(2) to this Form N-CSR.
(a)(3) Not applicable.
(b) The certifications required by Rule 30a-2(b) under the 1940 Act, Rule 13a-14(b) or Rule 15d-14(b) under the Exchange Act, and Section 1350 of Chapter 63 of Title 18 of the United States Code are furnished as Exhibit 12(b) to this Form N-CSR.
SIGNATURES
Pursuant to the requirements of the Securities Exchange Act of 1934 and the Investment Company Act of 1940, the registrant has duly caused this report to be signed on its behalf by the undersigned, thereunto duly authorized.
(Registrant) Nicholas-Applegate Institutional Funds
By: (Signature and Title)
/s/ Horacio A. Valeiras
Horacio A. Valeiras
Title: President (Principal Executive Officer) and Trustee
Date: February 8, 2010
Pursuant to the requirements of the Securities Exchange Act of 1934 and the Investment Company Act of 1940, this report has been signed below by the following persons on behalf of the registrant and in the capacities and on the dates indicated.
By: (Signature and Title)
/s/ Horacio A. Valeiras
Horacio A. Valeiras
Title: President (Principal Executive Officer) and Trustee
Date: February 8, 2010
By: (Signature and Title)
/s/ Deborah A. Wussow-Hammalian
Deborah A. Wussow-Hammalian
Title: Treasurer (Principal Financial Officer and Principal Accounting Officer)
Date: February 8, 2010