UNITED STATES
SECURITIES AND EXCHANGE COMMISSION
WASHINGTON, D.C. 20549
FORM N-CSR
CERTIFIED SHAREHOLDER REPORT OF REGISTERED
MANAGEMENT INVESTMENT COMPANIES
Investment Company Act file number: 811-07384
NICHOLAS-APPLEGATE INSTITUTIONAL FUNDS
(Exact name of registrant as specified in charter)
600 WEST BROADWAY, 30TH FLOOR, SAN DIEGO, CA 92101
(Address of principal executive offices) (Zip Code)
Charles H. Field, Jr.
c/o Nicholas-Applegate Capital Management, LLC
600 West Broadway, 30th Floor
San Diego, CA 92101
(Name and address of agent for service)
Copy to:
Deborah A. Wussow
c/o Nicholas-Applegate Capital Management, LLC
600 West Broadway, 30th Floor
San Diego, CA 92101
Registrant's telephone number, including area code: (619) 687-2988
Date of fiscal year end: March 31
Date of reporting period: September 30, 2008
ITEM 1. REPORTS TO STOCKHOLDERS.

September 30, 2008 Semi-Annual Report (Unaudited)
Class I, II, III & IV Shares
U.S. Micro Cap
U.S. Emerging Growth
U.S. Ultra Micro Cap
U.S. Systematic Large Cap Growth
U.S. Small to Mid Cap Growth
U.S. Convertible
Global Equity 130/30
Global Select
International Growth
International Growth Opportunities
Emerging Markets
International Systematic
International All Cap Growth
U.S. High Yield Bond

LETTER TO SHAREHOLDERS
Dear Fellow Shareholder,
The six-month period ended September 30, 2008 was a challenging time for investors. The problems in the credit markets that began in 2007 intensified, dimming the outlook for the global economy and sending stock prices lower around the world.
In this semi-annual report, we review the performance of the financial markets and our mutual funds from April 1, 2008 through September 30, 2008. We also share our outlook for the months ahead.
In the United States, the S&P 500 Index declined 10.9% in the face of significant headwinds. S&P 500 companies posted a fourth straight quarter of negative earnings growth, the economy appeared to be faltering and a deepening of the credit crisis transformed Wall Street in September. Crippled by mortgage losses, one major financial institution after another faced insolvency, causing risk aversion to skyrocket, lending to dry up and stock prices to fall. The Federal Reserve flooded the banking system with extra liquidity but held the target funds rate at 2% after having lowered it 0.25% in April. The U.S. Treasury proposed a $700 billion program to buy up bad mortgage securities, the terms of which were being negotiated by Congress on September 30.
The crisis in the United States spread overseas, where a handful of large European financial institutions were rescued by their respective governments. The turmoil in the credit markets, along with signs of a sharp economic slowdown in Europe and Japan, contributed to the 13.4% loss in the MSCI EAFE Index in local currencies. The index shed 22.0% in U.S. dollar terms, as the euro, pound and yen fell 10.7%, 10.2% and 6.4%, respectively, versus the dollar on concerns about the deterioration in international economies. Monetary policy in developed non-U.S. countries was mixed. Like the Fed, the Bank of England eased in April but subsequently kept rates at 5% amid rising inflation. The European Central Bank tightened in July to combat inflation but then held rates at 4.25%, while the Bank of Japan maintained its 0.5% target rate throughout the period. Nonetheless, these and other central banks around the world joined the Fed in injecting liquidity into the credit markets.
Stocks in developing countries registered the biggest losses, with the MSCI Emerging Markets Index falling 22.0% in local currencies and 27.5% in U.S. dollars. The sell-off was triggered by rising risk aversion, fears of a global recession and a steep decline in commodity prices, as energy and materials companies represent nearly a third of the index’s market value. After rising 19.6% during the first half of the period, the Reuters/Jefferies CRB Index of nineteen commodities plunged 25.3% from July through September on worries about softening demand. Policymakers in emerging countries shifted their focus from curbing inflation, which showed signs of easing, to stabilizing their financial markets. For example, Chinese officials cut stock-trading taxes, bought shares of large local banks and lowered the country’s benchmark lending rate for the first time since 2002.
While investment returns were disappointing in absolute terms, we are pleased that the majority of our funds outperformed their benchmarks in the volatile environment. In addition, most of the funds that lagged did so by a modest amount, including Global Equity 130/30, a new fund we opened April 1 that has the flexibility to short stocks. The timing of the Fund’s launch turned out to be challenging, but we remain excited about its long-term prospects. Global Equity 130/30 seeks to deliver more alpha than similar long-only approaches — without a commensurate increase in risk — and capitalizes on our expertise in fundamental research, quantitative analysis and short selling.
Just as we are committed to providing innovative investment solutions, we are committed to continually strengthening our organization. During the period, we welcomed several highly qualified analysts to both our traditional and systematic investment teams. We are enhancing our global trading platform by implementing the latest in trade order management technology — technology that will enable faster, better execution. By fine-tuning our trading capabilities, we hope to more fully capture the value of our investment decisions in the funds.
As the end of 2008 draws near, the outlook for the financial markets is uncertain. We believe that many developed economies will slip into recession early next year, if they have not already, and that emerging economies will slow. Now that inflation is yesterday’s problem, we expect the Federal Reserve and other central banks to cut interest rates, which may help unfreeze the credit markets and stimulate growth. Beyond monetary policy, governments have intervened to shore up their banking systems and economies; however, the effectiveness of their actions is yet to be seen.
Since Nicholas-Applegate was founded in 1984, the markets have experienced periods of volatility, spanning both peaks and valleys. Throughout them all, we have maintained our disciplined, long-term approach to investing. As difficult as the current situation may seem, this too shall pass. Meanwhile, we will continue to faithfully adhere to our investment philosophy and process, which we believe will produce strong performance in the funds over time.
On behalf of everyone at the firm, thank you for your participation in the Nicholas-Applegate Institutional Funds. We appreciate the trust you have placed in us.
Best Regards,

Horacio A. Valeiras, CFA
President and Chief Investment Officer
September 30, 2008
TABLE OF CONTENTS
The Funds’ Review and Outlook, Performance and Schedules of Investments:
| U.S. Micro Cap | 1 |
| U.S. Emerging Growth | 5 |
| U.S. Ultra Micro Cap | 9 |
| U.S. Systematic Large Cap Growth | 12 |
| U.S. Small to Mid Cap Growth | 16 |
| U.S. Convertible | 20 |
| Global Equity 130/30 | 25 |
| Global Select | 28 |
| International Growth | 32 |
| International Growth Opportunities | 36 |
| Emerging Markets | 40 |
| International Systematic | 44 |
| International All Cap Growth | 48 |
| U.S. High Yield Bond | 52 |
The Funds’:
| Financial Highlights | 56 |
| Statements of Assets and Liabilities | 64 |
| Statements of Operations | 66 |
| Statements of Changes in Net Assets | 68 |
| Statement of Cash Flows | 72 |
| Notes to Financial Statements | 73 |
| Shareholder Expense Example | 80 |
| Supplementary Information | 82 |
This report is authorized for distribution to shareholders and to others only when preceded or accompanied by a currently effective prospectus for Nicholas-Applegate Institutional Funds Class I, II, III & IV Shares. Distributor: Nicholas-Applegate Securities.
U.S. MICRO CAP FUND
Management Team: John C. McCraw, Portfolio Manager; Robert S. Marren, Portfolio Manager
Chief Investment Officer: Horacio A. Valeiras, CFA
Goal: The U.S. Micro Cap Fund seeks to maximize long-term capital appreciation by investing primarily in U.S. companies with market capitalizations similar to the Russell Microcap Growth Index at time of purchase.
Market Overview: The Russell Microcap Growth Index fell from April 1 to September 30, 2008 in what was a volatile six months in the U.S. equity market. Major factors influencing stock prices were:
| · | Acceleration in the unwinding of leverage in the economy, which left several large financial firms at or near the brink of collapse and caused the credit markets to seize up |
| · | Dramatic swings in the prices of oil and other raw materials, with a key commodity index rising 19.6% through June then sliding 25.3% over the remainder of the period |
| · | Continued weakness in the housing market, including a record number of foreclosure filings and a 16.3% year-over-year drop in home prices in 20 large cities |
While GDP grew at an annual rate of 2.8% in the second quarter, more recent data suggested that the problems in the housing and credit markets were taking a severe toll on the broader economy. For example, the unemployment rate surged to a five-year high, and consumer spending lost steam due to the fading impact of $90 billion in tax rebate checks mailed between April and July. U.S. officials acted aggressively to shore up the financial system and economy, including drafting legislation that would allow the government to buy bad mortgage debt from financial firms.
Performance: The Fund’s Class I shares lost 2.84% from April 1 through September 30, 2008, outperforming the Russell Microcap Growth Index, which declined 5.76%.
Portfolio Specifics: Consistent with our bottom-up investment process, the Fund’s outperformance was due to stock selection, which was particularly strong in the industrials sector. Two of our best-performing holdings were Axsys Technologies, a manufacturer of surveillance cameras and imaging systems, and Team, Inc., a provider of maintenance and repair services for high-pressure piping systems. Axsys reported two quarters of better-than-expected earnings, boosted by strong sales in its high-margin surveillance business. Team benefited from healthy demand from its oil refinery customers, whose facilities are operating at near capacity and need continuous attention. Stock selection was also strong in the consumer discretionary sector, where restaurant chain Buffalo Wild Wings was a top performer. The company’s attractive menu prices helped drive robust revenue growth in the difficult consumer environment, and lower chicken costs contributed to margin improvement.
Areas of relative weakness in the Fund included stock selection in the information technology and energy sectors. An underweight in the defensive health care sector also detracted. Health care was one of the best-performing groups in the index, as anxious investors sought safe-haven assets.
Market Outlook: The stock market is likely to remain volatile over the coming months as investors measure the impact of the government rescue package and other policy steps aimed at stabilizing the financial system and economy. While it may take time for the environment to improve, it is worth noting that equities have recovered from significant shocks in the past.
In this dynamic environment, we believe that our focus on micro-cap stocks exhibiting positive and sustainable change will continue to benefit the Fund.
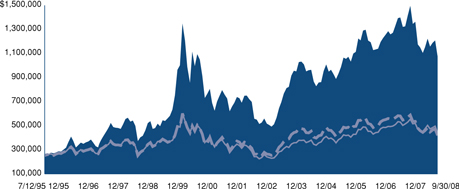
Comparison of Change in Value of a $250,000 Investment in U.S. Micro Cap Fund Class I Shares with the Russell 2000 Growth/Russell Microcap Growth Blend Index and Russell 2000 Growth Index.

| Annualized Total Returns As of 9/30/08 | |||
1 Year | 5 Years | 10 Years | |
| U.S. Micro Cap Fund Class I | -24.18% | 5.44% | 10.28% |
Russell 2000 Growth/Russell Microcap Growth Index | -26.46% | 1.40% | 4.17% |
| Russell 2000 Growth Index | -17.08% | 6.63% | 4.67% |
The graph above shows the value of a hypothetical $250,000 investment in the Fund’s Class I shares compared with the Russell 2000 Growth Index and a blended index comprised of the Russell 2000 Growth Index/Russell Microcap Growth Index. The Fund’s Class I shares calculate their performance based upon the historical performance of their corresponding series of Nicholas-Applegate Mutual Funds (renamed ING Mutual Funds), adjusted to reflect all fees and expenses applicable to Class I shares. The Nicholas-Applegate Institutional Funds’ Class I shares were first available on May 7, 1999. Average annual total return figures include changes in principal value, reinvestment dividends, and capital gain distributions. The total returns shown above do not show the effects of income taxes on an individual’s investment. In most cases, taxes may reduce your actual investment returns on income or gains paid by the Fund or any gains you may realize if you sell your shares. Past performance cannot guarantee future results.
The Russell 2000 Growth Index is an unmanaged index comprised of those Russell 2000 companies with higher price-to-book ratios and higher forecasted growth values. The Russell 2000 Growth Index is an unmanaged index generally representative of the 2,000 smallest companies in the Russell 3000 Index, which represents approximately 10% of the total market capitalization of the Russell 3000 Index.
The Russell Microcap Index isolates the smallest 1,000 securities in the Russell 2000 Index plus the next 1,000 securities. The Russell Microcap Growth Index isolates the securities in the Russell Microcap Index with purely growth characteristics. The Russell 2000 Growth/Russell Microcap Growth Blend Index is a combination of the Russell 2000 Growth Index and the Russell Microcap Growth Index. The blended index exhibits Russell 2000 Growth performance from the inception of the Fund until August 2000, and Russell Microcap Growth performance thereafter. The Fund created the blended index because Russell Microcap Growth performance incepted in August 2000.
The Indexes differ from the Fund in composition, do not pay management fees or expenses and include reinvested dividends. One cannot invest directly in an index. Since markets can go down as well as up, investment return and principal value will fluctuate with market conditions. You may have a gain or loss when you sell your shares.
1
U.S. MICRO CAP FUND
SCHEDULE OF INVESTMENTS (Unaudited)
As of September 30, 2008
Number of Shares | Value | ||||||
Common Stock - 98.6% | |||||||
Aerospace/Defense-Equipment - 0.4% | |||||||
| National Presto Industries, Inc. | 3,700 | $ | 275,650 | ||||
Alternative Waste Technology - 1.4% | |||||||
| Calgon Carbon Corp.** | 43,860 | 892,990 | |||||
Apparel Manufacturers - 0.7% | |||||||
| Maidenform Brands, Inc.* | 31,900 | 462,869 | |||||
Applications Software - 0.9% | |||||||
| EPIQ Systems, Inc.** | 39,070 | 531,352 | |||||
Auto Repair Centers - 1.0% | |||||||
| Monro Muffler, Inc. | 25,700 | 592,642 | |||||
Auto/Truck Parts & Equipment-Original - 1.1% | |||||||
| Titan International, Inc. | 19,917 | 424,630 | |||||
| Wonder Auto Technology, Inc.* | 39,200 | 251,272 | |||||
| 675,902 | |||||||
Batteries/Battery Systems - 0.9% | |||||||
| Greatbatch, Inc.* | 21,500 | 527,610 | |||||
Chemicals-Plastics - 0.5% | |||||||
| Metabolix, Inc.** | 25,700 | 279,616 | |||||
Coffee - 0.9% | |||||||
| Green Mountain Coffee Roasters, Inc.* | 14,500 | 570,430 | |||||
Commercial Services - 2.9% | |||||||
| HMS Holdings Corp.* | 28,961 | 693,905 | |||||
| Medifast, Inc.* | 66,600 | 453,546 | |||||
| Team, Inc.* | 18,206 | 657,601 | |||||
| 1,805,052 | |||||||
Commercial Services-Finance - 2.0% | |||||||
| Cardtronics, Inc.* | 38,900 | 305,754 | |||||
| CBIZ, Inc.* | 54,300 | 458,835 | |||||
| TNS, Inc.* | 26,000 | 503,620 | |||||
| 1,268,209 | |||||||
Communications Software - 0.8% | |||||||
| Seachange International, Inc.* | 51,900 | 501,354 | |||||
Computer Services - 1.7% | |||||||
| Furmanite Corp.* | 49,600 | 512,864 | |||||
| Ness Technologies, Inc.* | 47,900 | 549,413 | |||||
| 1,062,277 | |||||||
Computer Software - 0.7% | |||||||
| Double-Take Software, Inc.* | 41,100 | 408,945 | |||||
Computers-Integrated Systems - 1.7% | |||||||
| Netscout Systems, Inc.* | 52,300 | 556,472 | |||||
| Super Micro Computer, Inc.* | 53,200 | 479,332 | |||||
| 1,035,804 | |||||||
Computers-Peripheral Equipment - 1.4% | |||||||
| Compellent Technologies, Inc.* | 39,200 | 486,080 | |||||
| Transact Technologies, Inc.* | 44,400 | 353,424 | |||||
| 839,504 | |||||||
Consulting Services - 0.7% | |||||||
| Hill International, Inc.* | 30,100 | 416,885 | |||||
Disposable Medical Products - 0.9% | |||||||
| Merit Medical Systems, Inc.** | 30,600 | 574,362 | |||||
Distribution/Wholesale - 0.8% | |||||||
| MWI Veterinary Supply, Inc.* | 12,800 | 502,912 | |||||
Electronic Components-Semiconductors - 1.4% | |||||||
| Ceva, Inc.* | 40,200 | 333,660 | |||||
| Monolithic Power Systems, Inc.* | 30,100 | 522,837 | |||||
| 856,497 | |||||||
Electronic Measure Instruments - 1.4% | |||||||
| Axsys Technologies, Inc.* | 14,758 | 869,837 | |||||
Energy-Alternate Sources - 0.6% | |||||||
| Canadian Solar, Inc.** | 18,500 | 361,305 | |||||
Engineering/R & D Services - 1.3% | |||||||
| Stanley, Inc.* | 21,400 | 789,874 | |||||
Enterprise Software/Services - 1.9% | |||||||
| Opnet Technologies, Inc.* | 49,000 | 596,820 | |||||
| Taleo Corp. Cl. A* | 30,548 | 607,600 | |||||
| 1,204,420 | |||||||
Finance-Investment Bankers/Brokers - 1.6% | |||||||
| Penson Worldwide, Inc.* | 22,000 | 305,140 | |||||
| SWS Group, Inc. | 34,300 | 691,488 | |||||
| 996,628 | |||||||
Food-Miscellaneous/Diversified - 1.7% | |||||||
| American Italian Pasta Co.* | 24,300 | 403,380 | |||||
| Diamond Foods, Inc. | 23,900 | 669,917 | |||||
| 1,073,297 | |||||||
Food-Wholesale/Distribution - 2.4% | |||||||
| Nash Finch Co. | 14,700 | 633,864 | |||||
| Spartan Stores, Inc.* | 33,770 | 840,198 | |||||
| 1,474,062 | |||||||
Footwear & Related Apparel - 0.9% | |||||||
| Steven Madden, Ltd.* | 21,800 | 540,204 | |||||
Hazardous Waste Disposal - 0.8% | |||||||
| American Ecology Corp. | 17,400 | 481,458 | |||||
Human Resources - 1.0% | |||||||
| On Assignment, Inc.* | 76,100 | 599,668 | |||||
Insurance Brokers - 1.3% | |||||||
| Life Partners Holdings, Inc.* | 22,001 | 791,376 | |||||
Internet Applications Software - 3.2% | |||||||
| Cybersource Corp.* | 40,870 | 658,416 | |||||
| S1 Corp.* | 86,370 | 528,584 | |||||
| Vocus, Inc.* | 24,160 | 820,474 | |||||
| 2,007,474 | |||||||
Internet Infrastructure Software - 1.1% | |||||||
| AsiaInfo Holdings, Inc.* | 74,600 | 684,828 | |||||
Internet Security - 0.7% | |||||||
| Vasco Data Security International, Inc.* | 39,200 | 406,112 | |||||
Machinery-General Industry - 1.2% | |||||||
| DXP Enterprises, Inc.* | 8,500 | 453,135 | |||||
| Intevac, Inc.* | 28,700 | 305,368 | |||||
| 758,503 | |||||||
Medical Imaging Systems - 1.1% | |||||||
| IRIS International, Inc.* | 38,700 | 692,730 | |||||
Medical Instruments - 2.0% | |||||||
| Kensey Nash Corp.* | 18,600 | 585,156 | |||||
| Natus Medical, Inc.* | 30,100 | 682,066 | |||||
| 1,267,222 | |||||||
See Accompanying Notes to Financial Statements.
2
SCHEDULE OF INVESTMENTS (Unaudited)
As of September 30, 2008
Number of Shares | Value | ||||||
Medical Labs & Testing Services - 2.1% | |||||||
| Bio-Reference Labs, Inc.* | 23,760 | $ | 686,664 | ||||
| Life Sciences Research, Inc.* | 18,200 | 637,000 | |||||
| 1,323,664 | |||||||
Medical Laser Systems - 0.7% | |||||||
| Cynosure, Inc. Cl. A* | 25,710 | 461,237 | |||||
Medical Products - 3.3% | |||||||
| Exactech, Inc.* | 28,000 | 622,720 | |||||
| Hanger Orthopedic Group, Inc.* | 30,000 | 523,500 | |||||
| Synovis Life Technologies, Inc.* | 46,960 | 883,787 | |||||
| 2,030,007 | |||||||
Medical-Biomedical/Genetics - 4.3% | |||||||
| CryoLife, Inc.* | 61,700 | 809,504 | |||||
| Omrix Biopharmaceuticals, Inc.** | 31,700 | 568,698 | |||||
| RTI Biologics, Inc.* | 80,121 | 749,131 | |||||
| Seattle Genetics, Inc.* | 52,900 | 566,030 | |||||
| 2,693,363 | |||||||
Medical-Drugs - 2.1% | |||||||
| Array Biopharma, Inc.* | 62,200 | 477,696 | |||||
| Pharmasset, Inc.* | 21,800 | 434,910 | |||||
| Vivus, Inc.* | 50,000 | 397,000 | |||||
| 1,309,606 | |||||||
Medical-Nursing Homes - 1.1% | |||||||
| Sun Healthcare Group, Inc.* | 47,100 | 690,486 | |||||
Medical-Outpatient/Home Medical Care - 2.2% | |||||||
| Almost Family, Inc.* | 21,800 | 862,190 | |||||
| LHC Group, Inc.* | 17,400 | 495,552 | |||||
| 1,357,742 | |||||||
MRI/Medical Diagnostic Imaging Centers - 1.4% | |||||||
| Alliance Imaging, Inc.* | 63,100 | 648,037 | |||||
| RadNet, Inc.** | 58,100 | 232,981 | |||||
| 881,018 | |||||||
Networking Products - 1.6% | |||||||
| Extreme Networks* | 151,600 | 510,892 | |||||
| Switch & Data Facilities Co., Inc.* | 36,300 | 451,935 | |||||
| 962,827 | |||||||
Oil Companies-Exploration & Production - 1.7% | |||||||
| Gasco Energy, Inc.** | 149,100 | 271,362 | |||||
| GMX Resources, Inc.** | 10,000 | 478,000 | |||||
| NGAS Resources, Inc.** | 61,000 | 289,750 | |||||
| 1,039,112 | |||||||
Oil Field Machinery & Equipment - 0.8% | |||||||
| Mitcham Industries, Inc.* | 26,500 | 267,385 | |||||
| Natural Gas Services Group, Inc.* | 14,600 | 255,062 | |||||
| 522,447 | |||||||
Oil-Field Services - 1.4% | |||||||
| Boots & Coots International Control, Inc.* . | 143,900 | 277,727 | |||||
| Matrix Service Co.* | 29,340 | 560,394 | |||||
| 838,121 | |||||||
Patient Monitoring Equipment - 1.0% | |||||||
| CardioNet, Inc.* | 23,600 | 589,056 | |||||
Physical Practice Management - 0.9% | |||||||
| IPC The Hospitalist Co., Inc.* | 22,100 | 567,970 | |||||
Power Conversion/Supply Equipment - 1.7% | |||||||
| C&D Technologies, Inc.** | 59,600 | 338,528 | |||||
| Powell Industries, Inc.* | 17,600 | 718,256 | |||||
| 1,056,784 | |||||||
Private Corrections - 1.0% | |||||||
| Cornell Cos., Inc.* | 21,800 | 592,524 | |||||
Property/Casualty Insurance - 1.0% | |||||||
| Meadowbrook Insurance Group, Inc. | 85,900 | 606,454 | |||||
Research & Development - 2.1% | |||||||
| Exponent,Inc.* | 20,400 | 675,036 | |||||
| Kendle International, Inc.* | 14,600 | 652,766 | |||||
| 1,327,802 | |||||||
Retail-Apparel/Shoe - 4.4% | |||||||
| Cache, Inc.* | 33,900 | 232,893 | |||||
| HOT Topic, Inc.* | 81,500 | 538,715 | |||||
| JOS. A Bank Clothiers, Inc.** | 16,400 | 551,040 | |||||
| New York & Co., Inc.* | 53,900 | 514,206 | |||||
| Shoe Carnival, Inc.* | 26,500 | 434,070 | |||||
| The Wet Seal, Inc. Cl. A* | 128,700 | 467,181 | |||||
| 2,738,105 | |||||||
Retail-Computer Equipment - 0.5% | |||||||
| PC Mall, Inc.* | 47,400 | 323,742 | |||||
Retail-Convenience Store - 0.9% | |||||||
| Pantry, Inc.* | 25,600 | 542,464 | |||||
Retail-Discount - 0.6% | |||||||
| Citi Trends, Inc.* | 22,900 | 373,041 | |||||
Retail-Miscellaneous/Diversified - 0.7% | |||||||
| Titan Machinery, Inc.** | 19,500 | 405,795 | |||||
Retail-Pet Food & Supplies - 0.8% | |||||||
| PetMed Express, Inc.* | 29,900 | 469,430 | |||||
Retail-Restaurants - 1.0% | |||||||
| Buffalo Wild Wings, Inc.** | 15,600 | 627,744 | |||||
Savings & Loans/Thrifts-Eastern US - 1.6% | |||||||
| Flushing Financial Corp. | 30,700 | 537,250 | |||||
| OceanFirst Financial Corp. | 26,200 | 474,744 | |||||
| 1,011,994 | |||||||
Semiconductor Components-Integrated Circuits - 1.6% | |||||||
| O2Micro International, Ltd. - ADR* | 62,870 | 228,218 | |||||
| Pericom Semiconductor Corp.* | 37,000 | 388,500 | |||||
| Techwell, Inc.* | 37,800 | 356,454 | |||||
| 973,172 | |||||||
Semiconductor Equipment - 1.3% | |||||||
| Amtech Systems, Inc.* | 43,200 | 402,192 | |||||
| Ultratech, Inc.* | 31,600 | 382,360 | |||||
| 784,552 | |||||||
Telecommunication Equipment-Fiber Optics - 0.8% | |||||||
| Oplink Communications, Inc.* | 40,000 | 482,800 | |||||
Textile-Apparel - 0.8% | |||||||
| Perry Ellis International, Inc.* | 31,700 | 472,647 | |||||
Therapeutics - 0.9% | |||||||
| Allos Therapeutics, Inc.* | 25,600 | 189,696 | |||||
| Cypress Bioscience, Inc.* | 50,800 | 373,380 | |||||
| 563,076 | |||||||
See Accompanying Notes to Financial Statements.
3
U.S. MICRO CAP FUND
SCHEDULE OF INVESTMENTS (Unaudited)
As of September 30, 2008
Number of Shares | Value | ||||||
Transport-Services - 1.2% | |||||||
| Pacer International, Inc. | 17,700 | $ | 291,519 | ||||
| Vitran Corp., Inc.* | 32,300 | 435,081 | |||||
| 726,600 | |||||||
Transport-Truck - 0.9% | |||||||
| Saia, Inc.* | 40,300 | 535,184 | |||||
Ultra Sound Imaging Systems - 0.9% | |||||||
| SonoSite, Inc.** | 17,100 | 536,940 | |||||
Veterinary Diagnostics - 0.8% | |||||||
| Neogen Corp.* | 17,400 | 490,332 | |||||
Water Treatment Systems - 0.8% | |||||||
| Energy Recovery, Inc.** | 48,900 | 468,951 | |||||
Web Hosting/Design - 0.8% | |||||||
| Terremark Worldwide, Inc.** | 74,900 | 514,563 | |||||
Wireless Equipment - 0.6% | |||||||
| Globecomm Systems, Inc.* | 41,950 | 366,643 | |||||
| Total Common Stock (Cost: $61,920,085) | 61,337,855 | ||||||
Principal Amount | |||||||
Short Term Investments - | |||||||
Repurchase Agreement | |||||||
BNP Paribas Securities Corp., 0.150% dated 9/30/08, to be repurchased at $6,983,236 on 10/1/08 | $ | 6,983,207 | 6,983,207 | ||||
Time Deposit - 13.8% | |||||||
Bank of America London 3.470%, 10/01/08 | 1,621,498 | 1,621,498 | |||||
| Total Short Term Investments (Cost: $8,604,705) | 8,604,705 | ||||||
| Total Investments - 112.4% (Cost: $70,524,790) | 69,942,560 | ||||||
| Liabilities In Excess of Other Assets - (12.4)% | (7,733,984 | ) | |||||
| Net Assets - 100.0% | $ | 62,208,576 | |||||
** | All or a portion of the Fund’s holdings in this security was on loan as of September 30, 2008. |
* | Non-income producing securities. |
ADR - American Depository Receipt
SCHEDULE OF INVESTMENTS BY SECTOR
as of September 30, 2008
| Sector | Percent of Net Assets | |||
| Consumer, Non-cyclical | 40.2 | % | ||
| Industrial | 14.8 | |||
| Consumer, Cyclical | 13.1 | |||
| Technology | 12.4 | |||
| Communications | 8.7 | |||
| Financial | 5.5 | |||
| Energy | 3.9 | |||
| Short Term Investments | 13.8 | |||
| Total Investments | 112.4 | |||
| Liabilities in excess of other assets | (12.4 | ) | ||
| Net Assets | 100.0 | % | ||
See Accompanying Notes to Financial Statements.
4
U.S. EMERGING GROWTH FUND
Management Team: John C. McCraw, Portfolio Manager; Robert S. Marren, Portfolio Manager
Chief Investment Officer: Horacio A. Valeiras, CFA
Goal: The U.S. Emerging Growth Fund seeks to maximize long-term capital appreciation through investments primarily in U.S. companies with market capitalizations similar to the Russell 2000 Growth Index at time of purchase.
Market Overview: The Russell 2000 Growth Index declined in the six months ended September 30, 2008. However, small-cap growth stocks were much more resilient than large caps, due in part to better earnings from smaller companies.
The Russell 2000 Growth Index shook off weakness in June to end the first five months of the period with a nearly 10% gain. Returns were especially strong in April and May when the Federal Reserve made its seventh in a series of interest rate cuts, and small companies outside of financials reported healthy first quarter profits.
September turned out to be an exceptionally weak and volatile month, and small-cap growth stocks gave back all of their earlier gains and then some. During September, a number of bellwether U.S. financial institutions became overwhelmed by mortgage-related losses, including one that was forced into bankruptcy. Policymakers sprang into action, effectively nationalizing the largest U.S. mortgage lenders, providing a loan to one of the world’s biggest insurance companies and orchestrating the sale of two major banks. In addition, the Federal Reserve pumped liquidity into the financial system and expanded its emergency bank lending programs. Despite these efforts to stabilize the markets, investors shunned riskier assets, credit dried up and equity prices plummeted. The month ended on hopes that Congress would pass a $700 billion financial rescue package.
Performance: During the six months ended September 30, 2008, the Fund’s Class I shares posted a 7.25% loss and the Russell 2000 Growth Index fell 2.83%.
Portfolio Specifics: Overall, the Fund’s sector exposures positively impacted relative results. An underweight in materials — one of the worst-performing sectors in the index — was helpful, as deterioration in the outlook for the global economy sent commodity prices sharply lower from July through September. An overweight in health care was another plus, as health care was the best-performing sector in the benchmark. Investors typically favor this defensive group when the market is volatile, and this period was no exception.
In the risk-averse climate, investors also favored the larger-cap stocks in the Russell 2000 Growth Index. This was a headwind for the Fund, since the types of fast-growing companies that we like to own tend to be on the smaller side of small cap. In terms of sectors, stock selection among industrials and information technology companies subtracted the most from relative results.
While the portfolio generated a decline, there were a number of individual holdings that performed well. The Fund’s top contributors included Jos. A. Bank Clothiers, an apparel retailer; Alexion Pharmaceuticals, a biotechnology firm; and NuVasive, a medical device company.
Market Outlook: The stock market is likely to remain volatile over the coming months as investors measure the impact of the government rescue package and other policy steps aimed at stabilizing the financial system and economy. While it may take time for the environment to improve, it is worth noting that equities have recovered from significant shocks in the past.
Regardless of which direction the broad stock market takes, we believe that consistent application of our investment process will lead us to fast-growing small-cap companies for the Fund.
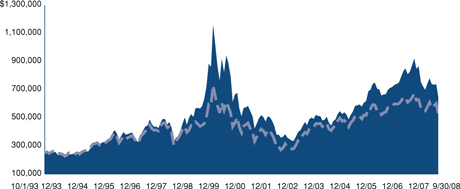
Comparison of Change in Value of a $250,000 Investment in U.S. Emerging Growth Fund Class I Shares with the Russell 2000 Growth Index.

| Annualized Total Returns As of 9/30/08 | |||
1 Year | 5 Years | 10 Years | |
| U.S. Emerging Growth Fund Class I | -25.58% | 7.68% | 6.07% |
| Russell 2000 Growth Index | -17.08% | 6.63% | 4.67% |
The graph above shows the value of a hypothetical $250,000 investment in the Fund’s Class I shares compared with the Russell 2000 Growth Index for the periods indicated. The Fund calculates performance based upon the historical performance of a corresponding series of Nicholas-Applegate Mutual Funds (renamed ING Mutual Funds), adjusted to reflect all fees and expenses applicable to Class I shares. The Nicholas-Applegate Institutional Funds’ Class I shares were first available on May 7, 1999. Average annual total return figures include changes in principal value, reinvested dividends, and capital gain distributions. The total returns shown above do not show the effects of income taxes on an individual’s investment. In most cases, taxes may reduce your actual investment returns on income or gains paid by the Fund or any gains you may realize if you sell your shares. Past performance cannot guarantee future results.
The Russell 2000 Growth Index is an unmanaged index comprised of those Russell 2000 companies with higher price-to-book ratios and higher forecasted growth values. The Russell 2000 Index is an unmanaged index generally representative of the 2,000 smallest companies in the Russell 3000 Index, which represents approximately 10% of the total market capitalization of the Russell 3000 Index. The unmanaged Index differs from the Fund in composition, does not pay management fees or expenses and includes reinvested dividends. One cannot invest directly in an index.
Since markets can go down as well as up, investment return and principal value will fluctuate with market conditions. You may have a gain or loss when you sell your shares.
5
U.S. EMERGING GROWTH FUND
SCHEDULE OF INVESTMENTS (Unaudited)
As of September 30, 2008
Number of Shares | Value | ||||||
Common Stock - 100.7% | |||||||
Aerospace/Defense-Equipment - 3.7% | |||||||
| BE Aerospace, Inc.* | 3,100 | $ | 49,073 | ||||
| Curtiss-Wright Corp. | 1,400 | 63,630 | |||||
| Moog, Inc. Cl. A* | 1,900 | 81,472 | |||||
| National Presto Industries, Inc. | 700 | 52,150 | |||||
| Orbital Sciences Corp.* | 4,300 | 103,071 | |||||
| Triumph Group, Inc. | 1,000 | 45,710 | |||||
| 395,106 | |||||||
Airlines - 0.9% | |||||||
| Hawaiian Holdings, Inc.* | 9,900 | 91,872 | |||||
Apparel Manufacturers - 1.7% | |||||||
| G-III Apparel Group, Ltd.* | 5,600 | 104,776 | |||||
| Jones Apparel Group, Inc. | 4,500 | 83,295 | |||||
| 188,071 | |||||||
Applications Software - 0.7% | |||||||
| Compuware Corp.* | 7,300 | 70,737 | |||||
Auto/Truck Parts & Equipment-Original - 0.5% | |||||||
| Titan International, Inc. | 2,500 | 53,300 | |||||
Batteries/Battery Systems - 0.8% | |||||||
| Greatbatch, Inc.* | 3,300 | 80,982 | |||||
Beverages-Wine/Spirits - 0.7% | |||||||
| Central European Distribution Corp.* | 1,600 | 72,656 | |||||
Chemicals-Diversified - 0.6% | |||||||
| Olin Corp. | 3,400 | 65,960 | |||||
Chemicals-Plastics - 0.4% | |||||||
| Metabolix, Inc.* | 4,400 | 47,872 | |||||
Coffee - 0.6% | |||||||
| Green Mountain Coffee Roasters, Inc.* | 1,700 | 66,878 | |||||
Commercial Banks-Western US - 0.6% | |||||||
| SVB Financial Group* | 1,200 | 69,504 | |||||
Commercial Services - 1.4% | |||||||
| HMS Holdings Corp.* | 2,700 | 64,692 | |||||
| Team, Inc.* | 2,400 | 86,688 | |||||
| 151,380 | |||||||
Commercial Services-Finance - 0.7% | |||||||
| TNS, Inc.* | 3,900 | 75,543 | |||||
Computer Aided Design - 0.5% | |||||||
| Parametric Technology Corp.* | 3,100 | 57,040 | |||||
Computer Services - 0.5% | |||||||
| Ness Technologies, Inc.* | 5,100 | 58,497 | |||||
Computer Software - 0.7% | |||||||
| Double-Take Software, Inc.* | 7,200 | 71,640 | |||||
Computers-Integrated Systems - 0.7% | |||||||
| Netscout Systems, Inc.* | 6,800 | 72,352 | |||||
Consulting Services - 3.7% | |||||||
| Forrester Research, Inc.* | 2,700 | 79,164 | |||||
| FTI Consulting, Inc.* | 1,100 | 79,464 | |||||
| Gartner, Inc. Cl. A* | 3,400 | 77,112 | |||||
| Navigant Consulting, Inc.* | 4,100 | 81,549 | |||||
| Watson Wyatt Worldwide, Inc. Cl. A | 1,600 | 79,568 | |||||
| 396,857 | |||||||
Consumer Products-Miscellaneous - 0.6% | |||||||
| Jarden Corp.* | 2,800 | 65,660 | |||||
Containers-Paper/Plastic - 0.7% | |||||||
| Rock-Tenn Co. Cl. A | 1,800 | 71,964 | |||||
Cosmetics & Toiletries - 0.9% | |||||||
| Elizabeth Arden, Inc.* | 4,900 | 96,187 | |||||
Disposable Medical Products - 0.7% | |||||||
| Merit Medical Systems, Inc.* | 3,900 | 73,203 | |||||
Distribution/Wholesale - 1.2% | |||||||
| Fossil, Inc.* | 2,100 | 59,283 | |||||
| LKQ Corp.* | 4,400 | 74,668 | |||||
| 133,951 | |||||||
Diversified Operations - 0.7% | |||||||
| Compass Diversified Holdings | 5,600 | 78,064 | |||||
Electronic Components-Semiconductors - 3.2% | |||||||
| Macrovision Solutions Corp.* | 4,400 | 67,672 | |||||
| Monolithic Power Systems, Inc.* | 4,600 | 79,902 | |||||
| ON Semiconductor Corp.* | 11,400 | 77,064 | |||||
| PMC - Sierra, Inc.* | 10,400 | 77,168 | |||||
| Renesola Ltd. - ADR* | 4,600 | 48,254 | |||||
| 350,060 | |||||||
Electronic Design Automations - 0.8% | |||||||
| Mentor Graphics Corp.* | 7,800 | 88,530 | |||||
Electronic Measure Instruments - 0.7% | |||||||
| Itron, Inc.* | 900 | 79,677 | |||||
Energy-Alternate Sources - 0.5% | |||||||
| Canadian Solar, Inc.* | 2,600 | 50,778 | |||||
Engineering/R & D Services - 0.8% | |||||||
| EMCOR Group, Inc.* | 3,200 | 84,224 | |||||
Enterprise Software/Services - 2.9% | |||||||
| Concur Technologies, Inc.* | 1,700 | 65,042 | |||||
| Lawson Software, Inc.* | 10,400 | 72,800 | |||||
| Mantech International Corp. Cl. A* | 2,000 | 118,580 | |||||
| Taleo Corp. Cl. A* | 2,800 | 55,692 | |||||
| 312,114 | |||||||
E-Services/Consulting - 1.3% | |||||||
| GSI Commerce, Inc.* | 5,100 | 78,948 | |||||
| Websense, Inc.* | 2,500 | 55,875 | |||||
| 134,823 | |||||||
Finance-Consumer Loans - 0.7% | |||||||
| Portfolio Recovery Associates, Inc.* | 1,500 | 72,945 | |||||
Finance-Investment Bankers/Brokers - 2.6% | |||||||
| Knight Capital Group, Inc. Cl. A* | 4,800 | 71,328 | |||||
| Raymond James Financial, Inc. | 3,000 | 98,940 | |||||
| SWS Group, Inc. | 5,400 | 108,864 | |||||
| 279,132 | |||||||
Food-Miscellaneous/Diversified - 0.8% | |||||||
| Diamond Foods, Inc. | 3,200 | 89,696 | |||||
Food-Wholesale/Distribution - 1.8% | |||||||
| Spartan Stores, Inc. | 4,000 | 99,520 | |||||
| United Natural Foods, Inc.* | 3,600 | 89,964 | |||||
| 189,484 | |||||||
Footwear & Related Apparel - 1.4% | |||||||
| Skechers U.S.A, Inc. Cl. A* | 3,200 | 53,856 | |||||
| Steven Madden, Ltd.* | 3,800 | 94,164 | |||||
| 148,020 | |||||||
Hazardous Waste Disposal - 0.7% | |||||||
| American Ecology Corp. | 2,600 | 71,942 | |||||
Industrial Automation/Robotics - 0.5% | |||||||
| Cognex Corp. | 2,600 | 52,416 | |||||
See Accompanying Notes to Financial Statements.
6
SCHEDULE OF INVESTMENTS (Unaudited)
As of September 30, 2008
Number of Shares | Value | ||||||
Internet Applications Software - 0.7% | |||||||
| Cybersource Corp.* | 4,800 | $ | 77,328 | ||||
Internet Security - 0.6% | |||||||
| Vasco Data Security International, Inc.* | 5,900 | 61,124 | |||||
Machinery-General Industry - 2.0% | |||||||
| Altra Holdings, Inc.* | 5,300 | 78,228 | |||||
| DXP Enterprises, Inc.* | 1,200 | 63,972 | |||||
| Wabtec Corp. | 1,400 | 71,722 | |||||
| 213,922 | |||||||
Medical Instruments - 4.9% | |||||||
| Bruker Corp.* | 7,100 | 94,643 | |||||
| Integra LifeSciences Holdings Corp.* | 1,700 | 74,851 | |||||
| Kensey Nash Corp.* | 2,800 | 88,088 | |||||
| Natus Medical, Inc.* | 4,300 | 97,438 | |||||
| NuVasive, Inc.* | 1,600 | 78,928 | |||||
| Thoratec Corp.* | 3,400 | 89,250 | |||||
| 523,198 | |||||||
Medical Labs & Testing Services - 1.8% | |||||||
| Bio-Reference Labs, Inc.* | 3,500 | 101,150 | |||||
| Icon PLC - ADR* | 2,300 | 87,975 | |||||
| 189,125 | |||||||
Medical Laser Systems - 0.5% | |||||||
| Cynosure, Inc. Cl. A* | 2,800 | 50,232 | |||||
Medical Products - 4.5% | |||||||
| American Medical Systems Holdings, Inc.* | 3,800 | 67,488 | |||||
| China Medical Technologies, Inc. - ADR | 2,300 | 74,934 | |||||
| Exactech, Inc.* | 3,200 | 71,168 | |||||
| Haemonetics Corp.* | 1,500 | 92,580 | |||||
| Wright Medical Group, Inc.* | 3,200 | 97,408 | |||||
| Zoll Medical Corp.* | 2,500 | 81,800 | |||||
| 485,378 | |||||||
Medical-Biomedical/Genetics - 5.2% | |||||||
| Alexion Pharmaceuticals, Inc.* | 2,600 | 102,180 | |||||
| Medicines Co.* | 3,800 | 88,236 | |||||
| Myriad Genetics, Inc.* | 1,300 | 84,344 | |||||
| OSI Pharmaceuticals, Inc.* | 1,900 | 93,651 | |||||
| Regeneron Pharmaceuticals, Inc.* | 2,700 | 58,941 | |||||
| Savient Pharmaceuticals, Inc.* | 2,600 | 38,766 | |||||
| United Therapeutics Corp.* | 900 | 94,653 | |||||
| 560,771 | |||||||
Medical-Drugs - 1.8% | |||||||
| Eurand NV* | 4,100 | 74,456 | |||||
| Pharmasset, Inc.* | 2,800 | 55,860 | |||||
| Rigel Pharmaceuticals, Inc.* | 2,800 | 65,380 | |||||
| 195,696 | |||||||
Medical-Nursing Homes - 0.7% | |||||||
| Sun Healthcare Group, Inc.* | 5,400 | 79,164 | |||||
Medical-Outpatient/Home Medical Care - 0.6% | |||||||
| LHC Group, Inc.* | 2,100 | 59,808 | |||||
Networking Products - 0.8% | |||||||
| Polycom, Inc.* | 3,500 | 80,955 | |||||
Oil Companies-Exploration & Production - 1.7% | |||||||
| EXCO Resources, Inc.* | 4,000 | 65,280 | |||||
| GMX Resources, Inc.* | 1,500 | 71,700 | |||||
| Venoco, Inc.* | 3,700 | 48,100 | |||||
| 185,080 | |||||||
Oil-Field Services - 3.0% | |||||||
| Cal Dive International, Inc.* | 7,700 | 81,620 | |||||
| Hornbeck Offshore Services, Inc.* | 1,300 | 50,206 | |||||
| Matrix Service Co.* | 4,000 | 76,400 | |||||
| Tetra Technologies, Inc.* | 4,200 | 58,170 | |||||
| Willbros Group, Inc.* | 2,100 | 55,650 | |||||
| 322,046 | |||||||
Pharmacy Services - 0.9% | |||||||
| HealthExtras, Inc* | 3,500 | 91,420 | |||||
Physical Practice Management - 0.6% | |||||||
| IPC The Hospitalist Co., Inc.* | 2,500 | 64,250 | |||||
Power Conversion/Supply Equipment - 1.2% | |||||||
| Energy Conversion Devices, Inc.* | 900 | 52,425 | |||||
| Powell Industries, Inc.* | 1,800 | 73,458 | |||||
| 125,883 | |||||||
Private Corrections - 0.8% | |||||||
| Cornell Cos., Inc.* | 3,000 | 81,540 | |||||
Property/Casualty Insurance - 0.6% | |||||||
| Amtrust Financial Services, Inc. | 4,600 | 62,514 | |||||
Research & Development - 1.6% | |||||||
| Kendle International, Inc.* | 2,100 | 93,891 | |||||
| Parexel International Corp.* | 2,900 | 83,114 | |||||
| 177,005 | |||||||
Retail-Apparel/Shoe - 4.6% | |||||||
| Aeropostale, Inc.* | 2,300 | 73,853 | |||||
| Brown Shoe Co., Inc. | 4,200 | 68,796 | |||||
| Collective Brands, Inc.* | 5,100 | 93,381 | |||||
| Dress Barn, Inc.* | 5,000 | 76,450 | |||||
| JOS. A Bank Clothiers, Inc.* | 1,900 | 63,840 | |||||
| Phillips-Van Heusen Corp. | 1,700 | 64,447 | |||||
| The Childrens Place Retail Stores, Inc.* | 1,700 | 56,695 | |||||
| 497,462 | |||||||
Retail-Convenience Store - 0.8% | |||||||
| Pantry, Inc.* | 3,900 | 82,641 | |||||
Retail-Miscellaneous/Diversified - 0.5% | |||||||
| Pricesmart, Inc. | 3,200 | 53,568 | |||||
Retail-Perfume & Cosmetics - 0.7% | |||||||
| Ulta Salon Cosmetics & Fragrance, Inc.* | 6,000 | 79,680 | |||||
Retail-Restaurants - 2.5% | |||||||
| Buffalo Wild Wings, Inc.* | 2,100 | 84,504 | |||||
| CBRL Group, Inc. | 2,600 | 68,380 | |||||
| CKE Restaurants, Inc. | 6,600 | 69,960 | |||||
| Jack in the Box, Inc.* | 2,300 | 48,530 | |||||
| 271,374 | |||||||
Seismic Data Collection - 0.7% | |||||||
| ION Geophysical Corp.* | 5,300 | 75,207 | |||||
Semiconductor Components - Integrated Circuits - 1.6% | |||||||
| O2Micro International, Ltd. - ADR* | 8,100 | 29,403 | |||||
| Pericom Semiconductor Corp.* | 6,600 | 69,300 | |||||
| TriQuint Semiconductor, Inc.* | 16,000 | 76,640 | |||||
| 175,343 | |||||||
Telecommuications Services - 1.7% | |||||||
| NTELOS Holdings Corp. | 3,300 | 88,737 | |||||
| Premiere Global Services, Inc.* | 6,500 | 91,390 | |||||
| 180,127 | |||||||
See Accompanying Notes to Financial Statements.
7
U.S. EMERGING GROWTH FUND
SCHEDULE OF INVESTMENTS (Unaudited)
As of September 30, 2008
Number of Shares | Value | ||||||
Telecommunication Equipment - 0.3% | |||||||
| Arris Group, Inc.* | 4,300 | $ | 33,239 | ||||
Telecommunication Equipment-Fiber Optics - 0.8% | |||||||
| IPG Photonics Corp.* | 4,400 | 85,844 | |||||
Textile-Apparel - 0.5% | |||||||
| Perry Ellis International, Inc.* | 3,500 | 52,185 | |||||
Theaters - 0.1% | |||||||
| Cinemark Holdings, Inc. | 400 | 5,440 | |||||
Therapeutics - 0.9% | |||||||
| Alnylam Pharmaceuticals, Inc.* | 1,800 | 52,110 | |||||
| Medarex, Inc.* | 7,100 | 45,937 | |||||
| 98,047 | |||||||
Transport-Air Freight - 0.7% | |||||||
| Atlas Air Worldwide Holdings, Inc.* | 1,900 | 76,589 | |||||
Transport-Equipment & Leasing - 1.1% | |||||||
| GATX Corp. | 1,400 | 55,398 | |||||
| TAL International Group, Inc. | 3,100 | 64,542 | |||||
| 119,940 | |||||||
Transport-Marine - 0.6% | |||||||
| Gulfmark Offshore, Inc.* | 1,400 | 62,832 | |||||
Transport-Rail - 0.8% | |||||||
| Genesee & Wyoming, Inc. Cl. A* | 2,200 | 82,544 | |||||
Transport-Services - 0.5% | |||||||
| Pacer International, Inc. | 3,200 | 52,704 | |||||
Transport-Truck - 2.0% | |||||||
| Con-way, Inc. | 1,800 | 79,398 | |||||
| Old Dominion Freight Line, Inc.* | 2,500 | 70,850 | |||||
| Saia, Inc.* | 4,700 | 62,416 | |||||
| 212,664 | |||||||
Ultra Sound Imaging Systems - 0.7% | |||||||
| SonoSite, Inc.* | 2,300 | 72,220 | |||||
Vitamins & Nutrition Products - 1.4% | |||||||
| Herbalife, Ltd. | 1,900 | 75,088 | |||||
| NBTY, Inc.* | 2,500 | 73,800 | |||||
| 148,888 | |||||||
Water Treatment Systems - 0.5% | |||||||
| Energy Recovery, Inc.* | 6,100 | 58,499 | |||||
| Total Common Stock (Cost: $11,431,122) | 10,872,593 | ||||||
| Total Investments - 100.7% (Cost: $11,431,122) | 10,872,593 | ||||||
| Liabilities In Excess of Other Assets - (0.7%) | (77,564 | ) | |||||
| Net Assets - 100.0% | $ | 10,795,029 | |||||
* Non-income producing securities.
ADR - American Depository Receipt
SCHEDULE OF INVESTMENTS BY SECTOR
as of September 30, 2008
| Sector | Percent of Net Assets | |||
| Consumer, Non-cyclical | 38.4 | % | ||
| Industrial | 18.0 | |||
| Consumer, Cyclical | 15.4 | |||
| Technology | 11.6 | |||
| Communications | 6.1 | |||
| Energy | 5.4 | |||
| Financial | 4.5 | |||
| Diversified | 0.7 | |||
| Basic Materials | 0.6 | |||
| Total Investments | 100.7 | |||
| Liabilities in excess of other assets | (0.7 | ) | ||
| Net Assets | 100.0 | % | ||
See Accompanying Notes to Financial Statements.
8
U.S. ULTRA MICRO CAP FUND
Management Team: John C. McCraw, Portfolio Manager; Robert S. Marren, Portfolio Manager
Chief Investment Officer: Horacio A. Valeiras, CFA
Goal: The U.S. Ultra Micro Cap Fund seeks to maximize long-term capital appreciation by investing primarily in U.S. companies with market capitalizations below the median of the Russell Microcap Growth Index at time of purchase.
Market Overview: The Russell Microcap Growth Index posted a loss between April 1 and September 30, 2008. The market environment was volatile, as four months of strong gains in the index were eclipsed by sharp declines in June and September.
The period started on a positive note, with the Federal Reserve cutting interest rates 0.25% in April, and smaller companies reporting healthy first quarter earnings growth, excluding financials. Stock prices subsequently retreated in June on concerns about rising inflation and news of credit write-downs by banks. Downbeat news on the economy contributed to the selling pressure, including the largest spike in the unemployment rate since 1986.
Stocks regained their footing over the summer, as falling oil prices, some encouraging economic data and hopes for a bottom in the housing market lifted investor confidence. However, that confidence was shattered in September, when a dramatic series of events in the financials sector triggered a broad sell-off in equities. Mortgage-related losses impaired the ability of several large financial institutions to access the capital markets, and they were taken over by the government, sold or, in one case, forced into bankruptcy. Unsure of which firm might be next, risk aversion soared and lending tightened up. As September drew to a close, Congress was negotiating the terms of a $700 billion bank rescue package — the largest proposed federal market intervention since Franklin Roosevelt’s New Deal.
Performance: During the six months ended September 30, 2008, the Fund’s Class I shares declined 4.74% but outperformed the Russell Microcap Growth Index, which fell 5.76%.
Portfolio Specifics: The Fund’s outperformance was driven by stock selection in the industrials, consumer discretionary and financials sectors. Top-performing holdings included DXP Enterprises, a distributor of pumps that saw strong demand from customers in the food/beverage and energy markets; G-III Apparel, a sportswear manufacturer that was recognized for the growth potential of its national and private-label brands; and Life Partners, a provider of life settlement transactions that benefited from increasing awareness of its industry. NCI, a supplier of Web management services to government entities, was another top contributor, helped by its high percentage of recurring revenue.
Overall, the Fund’s sector exposures, which are a byproduct of our bottom-up investment decisions, negatively impacted relative results. For example, an overweight in consumer discretionary stocks and an underweight in health care were unfavorable. Consumer discretionary was one of the worst-performing sectors in the index, as high food and gasoline prices cut into spending on non-essential items. Health care was one of the few sectors to generate a gain, supported by a general preference for companies with stable demand characteristics in the turbulent investment environment.
Market Outlook: The stock market is likely to remain volatile over the coming months as investors measure the impact of the government rescue package and other policy steps aimed at stabilizing the financial system and economy. While it may take time for the environment to improve, it is worth noting that equities have recovered from significant shocks in the past.
As events unfold, we believe our research-driven investment process will continue to identify stocks for the Fund that are poised to outperform.
9
U.S. ULTRA MICRO CAP FUND
SCHEDULE OF INVESTMENTS (Unaudited)
As of September 30, 2008
Number of Shares | Value | ||||||
Common Stock - 98.3% | |||||||
Air Pollution Control Equipment - 1.2% | |||||||
| Met-Pro Corp. | 1,256 | $ | 18,325 | ||||
Apparel Manufacturers - 1.8% | |||||||
| G-III Apparel Group, Ltd.* | 1,487 | 27,822 | |||||
Applications Software - 1.7% | |||||||
| Ebix, Inc.* | 274 | 25,745 | |||||
Chemicals-Specialty - 1.2% | |||||||
| American Pacific Corp.* | 1,362 | 17,788 | |||||
Commercial Banks-Western US - 1.2% | |||||||
| Center Financial Corp. | 1,400 | 17,878 | |||||
Commercial Services - 1.1% | |||||||
| Medifast, Inc.* | 2,500 | 17,025 | |||||
Communications Software - 1.3% | |||||||
| Seachange International, Inc.* | 2,100 | 20,286 | |||||
Computer Services - 1.4% | |||||||
| Furmanite Corp.* | 2,049 | 21,187 | |||||
Computer Software - 1.0% | |||||||
| Double-Take Software, Inc.* | 1,554 | 15,462 | |||||
Computers-Integrated Systems - 2.0% | |||||||
| NCI, Inc. Cl. A* | 1,088 | 30,986 | |||||
Computers-Memory Devices - 0.8% | |||||||
| Datalink Corp.* | 2,900 | 12,644 | |||||
Computers-Peripheral Equipment - 2.4% | |||||||
| iCAD, Inc.* | 5,300 | 16,907 | |||||
| Transact Technologies, Inc.* | 2,469 | 19,653 | |||||
| 36,560 | |||||||
Cosmetics & Toiletries - 0.9% | |||||||
| Parlux Fragrances, Inc.* | 2,727 | 14,017 | |||||
Data Processing/Management - 0.7% | |||||||
| Versant Corp.* | 551 | 10,667 | |||||
Diagnostic Equipment - 0.8% | |||||||
| Home Diagnostics, Inc.* | 1,290 | 12,487 | |||||
Distribution/Wholesale - 1.0% | |||||||
| FGX International Holdings, Ltd.* | 1,400 | 15,498 | |||||
Electric Products-Miscellaneous - 0.8% | |||||||
| Harbin Electric, Inc.* | 1,034 | 12,253 | |||||
Electronic Components-Miscellaneous - 0.8% | |||||||
| Chyron International Corp.* | 2,818 | 11,554 | |||||
Electronic Components-Semiconductors - 0.9% | |||||||
| Ceva, Inc.* | 1,662 | 13,795 | |||||
Electronic Security Devices - 1.1% | |||||||
| Digital Ally, Inc.* | 2,385 | 16,385 | |||||
Engineering/R & D Services - 1.0% | |||||||
| Argan, Inc.* | 1,000 | 15,480 | |||||
Enterprise Software/Services - 1.1% | |||||||
| Opnet Technologies, Inc.* | 1,400 | 17,052 | |||||
Food-Miscellaneous/Diversified - 2.9% | |||||||
| American Italian Pasta Co.* | 1,720 | 28,552 | |||||
| Overhill Farms, Inc.* | 3,193 | 16,444 | |||||
| 44,996 | |||||||
Hazardous Waste Disposal - 0.8% | |||||||
| Heritage-Crystal Clean, Inc.* | 940 | 12,690 | |||||
Health Care Cost Containment - 1.1% | |||||||
| Integramed America, Inc.* | 2,400 | 17,040 | |||||
Heart Monitors - 1.6% | |||||||
| Cardiac Science Corp.* | 2,358 | 24,429 | |||||
Human Resources - 1.3% | |||||||
| On Assignment, Inc.* | 2,536 | 19,984 | |||||
Industrial Automation/Robotics - 0.8% | |||||||
| Adept Technology, Inc. Cl. A* | 1,409 | 12,315 | |||||
Instruments-Controls - 0.7% | |||||||
| Spectrum Control, Inc.* | 1,353 | 10,107 | |||||
Insurance Brokers - 1.6% | |||||||
| Life Partners Holdings, Inc. | 688 | 24,747 | |||||
Machinery Tools & Relative Products - 0.9% | |||||||
| K-Tron International, Inc.* | 110 | 14,171 | |||||
Machinery-General Industry - 1.0% | |||||||
| DXP Enterprises, Inc.* | 288 | 15,353 | |||||
Medical Imaging Systems - 1.7% | |||||||
| IRIS International, Inc.* | 1,436 | 25,704 | |||||
Medical Instruments - 1.8% | |||||||
| AtriCure, Inc.* | 1,511 | 15,140 | |||||
| SenoRx, Inc.* | 2,686 | 13,269 | |||||
| 28,409 | |||||||
Medical Labs & Testing Services - 1.5% | |||||||
| Bio-Imaging Technologies, Inc.* | 2,979 | 22,998 | |||||
Medical Laser Systems - 0.8% | |||||||
| Cynosure, Inc. Cl. A* | 649 | 11,643 | |||||
Medical Products - 8.0% | |||||||
| Alphatec Holdings, Inc.* | 3,587 | 16,500 | |||||
| Atrion Corp. | 206 | 21,224 | |||||
| ATS Medical, Inc.* | 7,025 | 20,302 | |||||
| Exactech, Inc.* | 978 | 21,751 | |||||
| Synovis Life Technologies, Inc.* | 1,143 | 21,512 | |||||
| Vnus Medical Technologies, Inc.* | 1,054 | 22,060 | |||||
| 123,349 | |||||||
Medical-Biomedical/Genetics - 3.6% | |||||||
| Avigen, Inc.* | 3,800 | 15,200 | |||||
| CryoLife, Inc.* | 1,692 | 22,199 | |||||
| RTI Biologics, Inc.* | 1,972 | 18,438 | |||||
| 55,837 | |||||||
Medical-Drugs - 0.8% | |||||||
| Santarus, Inc.* | 5,700 | 11,571 | |||||
Medical-Outpatient/Home Medical Care - 3.5% | |||||||
| Allied Healthcare International, Inc.* | 7,542 | 14,330 | |||||
| Almost Family, Inc.* | 600 | 23,730 | |||||
| NovaMed, Inc.* | 3,400 | 16,116 | |||||
| 54,176 | |||||||
MRI/Medical Diagnostic Imaging Centers - 0.5% | |||||||
| RadNet, Inc.* | 2,014 | 8,076 | |||||
Oil Companies-Exploration & Production - 2.4% | |||||||
| Double Eagle Petroleum Co.* | 1,051 | 15,008 | |||||
| Meridian Resource Corp.* | 5,300 | 9,752 | |||||
| NGAS Resources, Inc.* | 2,516 | 11,951 | |||||
| 36,711 | |||||||
Oil Field Machinery & Equipment - 0.6% | |||||||
| Mitcham Industries, Inc.* | 936 | 9,444 | |||||
Oil-Field Services - 0.7% | |||||||
| Boots & Coots International Control, Inc.* | 5,564 | 10,739 | |||||
See Accompanying Notes to Financial Statements.
10
SCHEDULE OF INVESTMENTS (Unaudited)
As of September 30, 2008
Number of Shares | Value | ||||||
Optical Supplies - 1.0% | |||||||
| Staar Surgical Co.* | 3,297 | $ | 14,804 | ||||
Patient Monitoring Equipment - 1.4% | |||||||
| Somanetics Corp.* | 1,018 | 22,264 | |||||
Physical Therapy/Rehabilitation Centers - 1.5% | |||||||
| US Physical Therapy, Inc.* | 1,290 | 22,394 | |||||
Power Conversion/Supply Equipment - 1.1% | |||||||
| C&D Technologies, Inc.* | 3,052 | 17,335 | |||||
Private Corrections - 1.3% | |||||||
| Cornell Cos., Inc.* | 715 | 19,434 | |||||
Property/Casualty Insurance - 1.3% | |||||||
| Meadowbrook Insurance Group, Inc. | 2,867 | 20,241 | |||||
Research & Development - 1.1% | |||||||
| Exponent,Inc.* | 515 | 17,041 | |||||
Retail-Apparel/Shoe - 4.4% | |||||||
| Cache, Inc.* | 932 | 6,403 | |||||
| HOT Topic, Inc.* | 3,902 | 25,792 | |||||
| Shoe Carnival, Inc.* | 1,252 | 20,508 | |||||
| The Wet Seal, Inc. Cl. A* | 3,993 | 14,494 | |||||
| 67,197 | |||||||
Retail-Automobile - 0.9% | |||||||
| America’s Car-Mart, Inc.* | 775 | 14,407 | |||||
Retail-Computer Equipment - 0.6% | |||||||
| PC Mall, Inc.* | 1,379 | 9,419 | |||||
Retail-Discount - 1.1% | |||||||
| Citi Trends, Inc.* | 1,048 | 17,072 | |||||
Retail-Drug Store - 1.1% | |||||||
| Allion Healthcare, Inc.* | 2,929 | 17,428 | |||||
Retail-Miscellaneous/Diversified - 0.9% | |||||||
| Titan Machinery, Inc.* | 635 | 13,214 | |||||
Retail-Restaurants - 2.2% | |||||||
| Einstein Noah Restaurant Group, Inc.* | 1,563 | 15,755 | |||||
McCormick & Schmick’s Seafood Restaurants, Inc.* | 1,864 | 18,155 | |||||
| 33,910 | |||||||
Savings & Loans/Thrifts-Eastern US - 2.9% | |||||||
| OceanFirst Financial Corp. | 1,101 | 19,950 | |||||
| United Financial Bancorp, Inc. | 1,647 | 24,458 | |||||
| 44,408 | |||||||
Semiconductor Components - Integrated Circuits - 0.9% | |||||||
| Techwell, Inc.* | 1,396 | 13,164 | |||||
Semiconductor Equipment - 2.2% | |||||||
| Amtech Systems, Inc.* | 1,435 | 13,360 | |||||
| Ultra Clean Holdings* | 1,864 | 9,394 | |||||
| Ultratech, Inc.* | 966 | 11,689 | |||||
| 34,443 | |||||||
Textile-Apparel - 1.0% | |||||||
| Perry Ellis International, Inc.* | 1,048 | 15,626 | |||||
Transactional Software - 1.2% | |||||||
| Yucheng Technologies, Ltd.* | 1,829 | 18,564 | |||||
Transport-Marine - 0.8% | |||||||
| CAI International, Inc.* | 1,107 | 12,243 | |||||
Transport-Services - 0.9% | |||||||
| Vitran Corp., Inc.* | 1,004 | 13,524 | |||||
Transport-Truck - 3.2% | |||||||
| Celadon Group, Inc.* | 1,606 | 18,421 | |||||
| Saia, Inc.* | 1,425 | 18,924 | |||||
| USA Truck, Inc.* | 747 | 11,915 | |||||
| 49,260 | |||||||
Wireless Equipment - 1.0% | |||||||
| Globecomm Systems, Inc.* | 1,748 | 15,278 | |||||
| Total Common Stock (Cost: $1,547,154) | 1,518,055 | ||||||
Principal Amount | |||||||
Short Term Investments - 3.3% | |||||||
Time Deposit - 3.3% | |||||||
| Brown Brothers Harriman & Co. - Grand Cayman 3.470%, 10/01/08 (Cost: $50,577) | $ | 50,577 | 50,577 | ||||
| Total Investments - 101.6% (Cost: $1,597,731) | 1,568,632 | ||||||
| Liabilities In Excess of Other Assets - (1.6%) | (24,874 | ) | |||||
| Net Assets - 100.0% | $ | 1,543,758 | |||||
* Non-income producing securities.
SCHEDULE OF INVESTMENTS BY SECTOR
as of September 30, 2008
| Sector | Percent of Net Assets | |||
| Consumer, Non-cyclical | 37.8 | % | ||
| Industrial | 17.4 | |||
| Technology | 16.2 | |||
| Consumer, Cyclical | 14.0 | |||
| Financial | 7.0 | |||
| Energy | 3.7 | |||
| Basic Materials | 1.2 | |||
| Communications | 1.0 | |||
| Short Term Investments | 3.3 | |||
| Total Investments | 101.6 | |||
| Liabilities in excess of other assets | (1.6 | ) | ||
| Net Assets | 100.0 | % | ||
See Accompanying Notes to Financial Statements.
11
U.S. SYSTEMATIC LARGE CAP GROWTH FUND
Management Team: James Li, Ph.D., CFA, Portfolio Manager; Jane Edmondson, Portfolio Manager
Chief Investment Officer: Horacio A. Valeiras, CFA
Goal: The U.S. Systematic Large Cap Growth Fund seeks to maximize long-term capital appreciation by investing primarily in stocks from a universe of large U.S. companies with market capitalizations similar to the Russell 1000 Growth Index at time of purchase.
Market Overview: The Russell 1000 Growth Index, a barometer of U.S. large-cap growth stocks, posted a loss during the six months ended September 30, 2008. The decline was part of a broad sell-off in the market that pressured equities across styles and capitalization ranges.
The period began on a positive note, with the index generating strong gains in April and May amid optimism the emergency steps taken by the Federal Reserve in March would ease strains in the credit markets. An interest rate cut from the Fed on April 30, as well as some encouraging reports on the economy, further boosted investor sentiment.
Gains from the spring subsequently gave way to steep losses, which were driven by:
| • | Further deterioration in mortgage-linked assets that led to the bankruptcy, sale or government takeover of several large financial institutions |
| • | Seizing up of the credit markets, as uncertainty about which institution might be next to fail made banks afraid to lend, even to each other |
| • | Worsening outlook for the economy and weak corporate earnings, with second quarter profits for S&P 500 companies down more than 22% |
At the end of September, investors were awaiting the fate of legislation that would allow the Treasury to buy up to $700 billion of illiquid mortgage securities from financial firms.
Performance: The Fund’s Class I shares lost 9.44% between April 1 and September 30, 2008 but outperformed the Russell 1000 Growth Index, which fell 11.23%.
Portfolio Specifics: The Fund’s outperformance was driven by stock selection, which was strongest in the energy, consumer discretionary and industrials sectors. Areas of relative weakness included stock selection in the financials sector and an overweight in consumer discretionary companies, which lagged the broad market amid high food and gas prices.
At the individual stock level, some of our best-performing holdings were Amgen, Wal-Mart Stores and McDonald’s, which all generated double-digit gains. Optimistic business prospects and better-than-expected earnings growth boosted biotechnology firm Amgen. Wal-Mart, a defensive name in the consumer staples sector, continued to post solid same-store sales growth in a difficult retail environment. Fast food chain McDonald’s benefited from positive sales trends outside the United States and resilience in its U.S. business.
Holdings remained well-diversified throughout the period, consistent with our risk-controlled approach to portfolio construction. On September 30, the Fund’s largest overweights versus the Russell 1000 Growth Index were in the health care (+3.1%) and energy (+2.8%) sectors. The largest underweights were in financials (-3.4%) and information technology (-2.3%).
Market Outlook: Our process evaluates investment opportunities on a relative basis and is required to remain fully invested. As such, the process neither utilizes nor results in a forecast or outlook on the overall market, but expects to perform equally well versus the Russell 1000 Growth Index in both up and down markets.
Through consistent application of our systematic, model-driven process, we believe that the Fund will continue to add value to the benchmark.
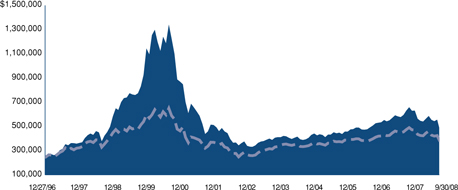
Comparison of Change in Value of a $250,000 Investment in U.S. Systematic Large Cap Growth Fund Class I and II Shares with the Russell 1000 Growth Index.


| Annualized Total Returns As of 9/30/08 | ||||||||||
1 Year | 5 Years | 10 Years | ||||||||
U.S. Systematic Large Cap Growth Fund Class I | -22.40% | 4.00% | 1.12% | |||||||
| Russell 1000 Growth Index | -20.88% | 3.74% | 0.59% | |||||||
12
U.S. SYSTEMATIC LARGE CAP GROWTH FUND

| Annualized Total Returns As of 9/30/08 | ||||||||||
1 Year | 5 Years | 10 Years | ||||||||
U.S. Systematic Large Cap Growth Fund Class II | -22.27% | 4.77% | 1.50% | |||||||
| Russell 1000 Growth Index | -20.88% | 3.74% | 0.59% | |||||||
The graphs above show the value of a hypothetical $250,000 investment in the Fund’s Class I and II shares compared with the Russell 1000 Growth Index for the periods indicated. The Fund’s Class I and II shares calculate their performance based upon the historical performance of a corresponding series of Nicholas-Applegate Mutual Funds (renamed ING Mutual Funds), adjusted to reflect all fees and expenses applicable to the Fund’s Class I and II shares. The Nicholas-Applegate Institutional Funds’ Class I shares were first available on May 7, 1999 and Class II shares on September 30, 2005. The historical performance of Class II shares includes the performance of Class I shares for periods prior to the inception of Class II. Average annual total return figures include changes in principal value, reinvested dividends, and capital gain distributions. The total returns shown above do not show the effects of income taxes on an individual’s investment. In most cases, taxes may reduce your actual investment returns on income or gains paid by the Fund or any gains you may realize if you sell your shares. Past performance cannot guarantee future results.
Russell 1000 Growth Index measures the performance of those Russell 1000 companies with higher price-to-book ratios and higher forecasted growth values. The Russell 1000 Index consists of the 1,000 largest securities in the Russell 3000 Index, which represents approximately 90% of the total market capitalization of the Russell 3000 Index. It is a large-cap, market-oriented index and is highly correlated with the S&P 500 Index. The unmanaged Index differs from the Fund in composition, does not pay management fees or expenses and includes reinvested dividends. One cannot invest directly in an index.
Since markets can go down as well as up, investment return and principal value will fluctuate with market conditions. You may have a gain or loss when you sell your shares.
13
U.S. SYSTEMATIC LARGE CAP GROWTH FUND
SCHEDULE OF INVESTMENTS (Unaudited)
As of September 30, 2008
As of September 30, 2008
| Number of | |||||||
| Shares | Value | ||||||
Common Stock - 98.6% | |||||||
Aerospace/Defense - 2.8% | |||||||
| Boeing Co. | 3,000 | $ | 172,050 | ||||
| Northrop Grumman Corp. | 1,500 | 90,810 | |||||
| 262,860 | |||||||
Agricultural Chemicals - 2.0% | |||||||
| CF Industries Holdings, Inc. | 700 | 64,022 | |||||
| Monsanto Co. | 1,200 | 118,776 | |||||
| 182,798 | |||||||
Apparel Manufacturers - 1.8% | |||||||
| VF Corp. | 2,100 | 162,351 | |||||
Applications Software - 5.2% | |||||||
| Microsoft Corp. | 18,100 | 483,089 | |||||
Beverages-Non-alcoholic - 1.8% | |||||||
| PepsiCo, Inc. | 2,400 | 171,048 | |||||
Building-Residential/Commercial - 1.3% | |||||||
| Pulte Homes, Inc. | 8,600 | 120,142 | |||||
Cable TV - 0.8% | |||||||
| DISH Network Corp. Cl. A * | 3,300 | 69,300 | |||||
Chemicals-Diversified - 1.0% | |||||||
| Celanese Corp. Cl. A | 3,400 | 94,894 | |||||
Coal - 0.8% | |||||||
| Foundation Coal Holdings, Inc. | 1,000 | 35,580 | |||||
| Walter Industries, Inc. | 800 | 37,960 | |||||
| 73,540 | |||||||
Commercial Services - 1.0% | |||||||
| Alliance Data Systems Corp.* | 1,500 | 95,070 | |||||
Commercial Services-Finance - 0.4% | |||||||
| Mastercard, Inc. Cl. A | 200 | 35,466 | |||||
Computers - 6.6% | |||||||
| Hewlett-Packard Co. | 6,500 | 300,560 | |||||
| International Business Machines Corp. | 2,700 | 315,792 | |||||
| 616,352 | |||||||
Computers-Integrated Systems - 1.0% | |||||||
| NCR Corp.* | 4,200 | 92,610 | |||||
Computers-Memory Devices - 0.8% | |||||||
| Western Digital Corp.* | 3,300 | 70,356 | |||||
Cosmetics & Toiletries - 1.0% | |||||||
| Procter & Gamble Co. | 1,375 | 95,824 | |||||
Diversified Manufacturing Operations - 0.9% | |||||||
| Tyco International, Ltd. | 2,500 | 87,550 | |||||
Electronic Components-Semiconductors - 1.1% | |||||||
| Intel Corp. | 3,200 | 59,936 | |||||
| MEMC Electronic Materials, Inc.* | 1,400 | 39,564 | |||||
| 99,500 | |||||||
Energy-Alternate Sources - 0.6% | |||||||
| First Solar, Inc.* | 300 | 56,673 | |||||
Engineering/R & D Services - 1.3% | |||||||
| Fluor Corp. | 1,600 | 89,120 | |||||
| The Shaw Group, Inc.* | 900 | 27,657 | |||||
| 116,777 | |||||||
Engines-Internal Combust - 1.2% | |||||||
| Cummins, Inc. | 2,500 | 109,300 | |||||
Internet Security - 1.3% | |||||||
| Symantec Corp.* | 6,200 | 121,396 | |||||
Linen Supply & Relative Items - 1.3% | |||||||
| Cintas Corp. | 4,200 | 120,582 | |||||
Machinery-Construction & Mining - 1.3% | |||||||
| Bucyrus International, Inc. Cl. A | 2,600 | 116,168 | |||||
Medical Instruments - 3.9% | |||||||
| Boston Scientific Corp.* | 8,200 | 100,614 | |||||
| Medtronic, Inc. | 3,300 | 165,330 | |||||
| St. Jude Medical, Inc.* | 2,300 | 100,027 | |||||
| 365,971 | |||||||
Medical Products - 1.8% | |||||||
| Johnson & Johnson | 2,400 | 166,272 | |||||
Medical-Biomedical/Genetics - 2.8% | |||||||
| Amgen, Inc.* | 3,300 | 195,591 | |||||
| Celgene Corp.* | 1,000 | 63,280 | |||||
| 258,871 | |||||||
Medical-Drugs - 4.0% | |||||||
| Eli Lilly & Co. | 2,800 | 123,284 | |||||
| Forest Laboratories, Inc.* | 5,600 | 158,368 | |||||
| Merck & Co., Inc. | 2,800 | 88,368 | |||||
| 370,020 | |||||||
Medical-HMO - 1.0% | |||||||
| Aetna, Inc. | 2,500 | 90,275 | |||||
Medical-Hospitals - 1.0% | |||||||
| Community Health Systems, Inc.* | 3,000 | 87,930 | |||||
Metal-Diversified - 1.0% | |||||||
| Freeport-McMoRan Copper & Gold, Inc. | 1,700 | 96,645 | |||||
Metal-Iron - 0.3% | |||||||
| Cleveland-Cliffs, Inc. | 500 | 26,470 | |||||
Multi-line Insurance - 1.1% | |||||||
| ACE, Ltd. | 1,900 | 102,847 | |||||
Networking Products - 4.6% | |||||||
| Cisco Systems, Inc.* | 19,000 | 428,640 | |||||
Office Automation & Equipment - 1.1% | |||||||
| Pitney Bowes, Inc. | 3,100 | 103,106 | |||||
Oil & Gas Drilling - 3.6% | |||||||
| Diamond Offshore Drilling, Inc. | 1,500 | 154,590 | |||||
| ENSCO International, Inc. | 3,100 | 178,653 | |||||
| 333,243 | |||||||
Oil Companies-Exploration & Production - 4.1% | |||||||
| Apache Corp. | 1,800 | 187,704 | |||||
| Occidental Petroleum Corp. | 1,600 | 112,720 | |||||
| Southwestern Energy Co.* | 2,600 | 79,404 | |||||
| 379,828 | |||||||
Oil Companies-Integrated - 3.0% | |||||||
| Exxon Mobil Corp. | 3,000 | 232,980 | |||||
| Hess Corp. | 500 | 41,040 | |||||
| 274,020 | |||||||
Oil Field Machine & Equipment - 0.9% | |||||||
| National Oilwell Varco, Inc.* | 1,600 | 80,368 | |||||
Pharmacy Services - 2.9% | |||||||
| Medco Health Solutions, Inc.* | 2,500 | 112,500 | |||||
| Omnicare, Inc. | 5,300 | 152,481 | |||||
| 264,981 | |||||||
See Accompanying Notes to Financial Statements.
14
SCHEDULE OF INVESTMENTS (Unaudited)
As of September 30, 2008
As of September 30, 2008
| Number of | |||||||
| Shares | Value | ||||||
Retail-Apparel/Shoe - 2.2% | |||||||
| Limited Brands, Inc. | 3,900 | $ | 67,548 | ||||
| Polo Ralph Lauren Corp. Cl. A | 2,000 | 133,280 | |||||
| 200,828 | |||||||
Retail-Discount - 4.2% | |||||||
| Wal-Mart Stores, Inc. | 6,500 | 389,285 | |||||
Retail-Restaurants - 2.8% | |||||||
| McDonald’s Corp. | 2,700 | 166,590 | |||||
| Panera Bread Co. Cl. A* | 1,900 | 96,710 | |||||
| 263,300 | |||||||
Semiconductor Components-Integrated Circuits - 0.6% | |||||||
| Integrated Device Technology, Inc.* | 7,600 | 59,128 | |||||
Telephone-Integrated - 0.9% | |||||||
| Verizon Communications, Inc. | 2,700 | 86,643 | |||||
Tobacco - 5.3% | |||||||
| Altria Group, Inc. | 12,400 | 246,016 | |||||
| Philip Morris International, Inc. | 5,200 | 250,120 | |||||
| 496,136 | |||||||
Transport-Marine - 0.7% | |||||||
| Frontline Ltd. | 1,400 | 67,298 | |||||
Transport-Rail - 3.5% | |||||||
| CSX Corp. | 3,500 | 190,995 | |||||
| Norfolk Southern Corp. | 1,200 | 79,452 | |||||
| Union Pacific Corp. | 700 | 49,812 | |||||
| 320,259 | |||||||
Vitamins & Nutrition Products - 0.5% | |||||||
| Herbalife, Ltd. | 1,100 | 43,472 | |||||
Web Portals/ISP - 2.6% | |||||||
| Google, Inc. Cl. A* | 300 | 120,156 | |||||
| Sohu.com, Inc.* | 2,200 | 122,650 | |||||
| 242,806 | |||||||
Wireless Equipment - 1.1% | |||||||
| QUALCOMM, Inc. | 2,400 | 103,128 | |||||
| Total Common Stock (Cost: $9,601,811) | 9,155,416 | ||||||
| Principal | |||||||
| Amount | |||||||
Short Term Investments - 1.4% | |||||||
Time Deposit - 1.4% | |||||||
| Citibank London | |||||||
| 3.470%, 10/01/08 | |||||||
| (Cost: $126,505) | $ | 126,505 | 126,505 | ||||
| Total Investments - 100.0% (Cost: $9,728,316) | 9,281,921 | ||||||
| Other Assets In Excess Of Liabilities - 0.0% | 4,224 | ||||||
| Net Assets - 100.0% | $ | 9,286,145 | |||||
* Non-income producing securities.
SCHEDULE OF INVESTMENTS BY SECTOR
as of September 30, 2008
| Sector | Percent of Net Assets | |||
| Consumer, Non-cyclical | 27.5 | % | ||
| Technology | 16.4 | |||
| Energy | 12.9 | |||
| Consumer, Cyclical | 12.8 | |||
| Industrial | 11.6 | |||
| Communications | 11.3 | |||
| Basic Materials | 4.3 | |||
| Financial | 1.1 | |||
| Consumer Non-cyclical | 0.7 | |||
| Short Term Investments | 1.4 | |||
| Total Investments | 100.0 | |||
| Other assets in excess of liabilities | 0.0 | |||
| Net Assets | 100.0 | % | ||
See Accompanying Notes to Financial Statements.
15
U.S. SMALL TO MID CAP GROWTH FUND
Management Team: John C. McCraw, Portfolio Manager; Robert S. Marren, Portfolio Manager
Chief Investment Officer: Horacio A. Valeiras, CFA
Goal: The U.S. Small to Mid Cap Growth Fund seeks to maximize long-term capital appreciation by investing primarily in stocks from a universe of U.S. companies with small to mid (SMID) market capitalizations similar to the Russell 2500 Growth Index at time of purchase.
Market Overview: The small- to mid-cap growth segment of the U.S. stock market, as measured by the Russell 2500 Growth Index, registered a decline from April 1 to September 30, 2008. Losses were concentrated in September, when deteriorating mortgage-related assets threatened the solvency of several major financial institutions. The fourth-largest U.S. securities firm ended up in bankruptcy, while others were considered too big to fail and received help from the government. Against this uncertain backdrop:
| • | Banks became afraid to lend, even to each other, and the short-term credit markets slowed to a near standstill |
| • | Investors withdrew nearly $250 billion from money market accounts in a ten-day period after one fund’s value fell below $1 per share |
| • | A widely followed measure of stock market volatility spiked to a record high |
Policymakers moved quickly to try and calm the markets. For example, the Federal Reserve injected huge amounts of liquidity into the financial system, and the Treasury unveiled a $50 billion insurance plan for money market funds and a $700 billion bank rescue package. The period ended on hopes that Congress would approve the $700 billion package after voting it down on September 29.
Performance: The Fund’s Class I shares posted a 7.87% decline between April 1 and September 30, 2008, outperforming the Russell 2500 Growth Index, which lost 8.91%.
Portfolio Specifics: The Fund’s outperformance was driven by stock selection, which was strongest in the energy sector. Two of the top contributors in the portfolio were Continental Resources, an exploration and production company, and Matrix Service, a provider of maintenance and construction services to the petroleum industry. Continental Resources benefited from high oil prices and the acreage it controls in the Bakken shale, a formation estimated to have significant oil reserves. Matrix Service met a critical project deadline and was also recognized for its sizeable order backlog and new business pipeline. Stock selection in the industrials sector was another source of relative strength, where Allied Waste Industries was a top performer. This waste services company reported better-than-expected earnings, supported by price increases, and announced plans to merge with a competitor.
Areas of relative weakness included stock selection in the health care sector and an overweight in consumer discretionary stocks that resulted from our bottom-up investment process. Consumer discretionary was one of the worst-performing sectors in the index due to the numerous challenges facing consumers, including falling home values, high gasoline prices and dimming job prospects.
Market Outlook: The stock market is likely to remain volatile over the coming months as investors measure the impact of the government rescue package and other policy steps aimed at stabilizing the financial system and economy. While it may take time for the environment to improve, it is worth noting that equities have recovered from significant shocks in the past.
Despite the uncertainty in the market, we believe that our focus on individual stock selection will lead to strong, long-term performance in the Fund.
Comparison of Change in Value of a $250,000 Investment in U.S. Small to Mid Cap Growth Fund Class I with the Russell 2500 Growth Index.
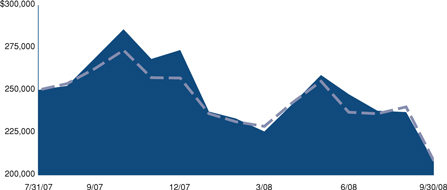

| Annualized Total Returns As of 9/30/08 | |||||||
Since | |||||||
1 Year | Inception | ||||||
U.S. Small to Mid Cap Growth Fund Class I | -22.70% | -14.64% | |||||
| Russell 2500 Growth Index | -20.70% | -14.48% | |||||
The graph above shows the value of a hypothetical $250,000 investment in the Fund’s Class I shares with the Russell 2500 Growth Index for the periods indicated. Average annual total return figures include changes in principal value, reinvested dividends and capital gain distributions. The total returns do not show the effects of income taxes on an individuals’ investment. In most cases, taxes may reduce your actual investment returns on income or gains paid by the Fund or any gains you may realize if you sell your shares. Past performance cannot guarantee future results.
The Russell 2500 Growth Index is an unmanaged index comprised of those Russell 2500 companies with higher price-to-book ratios and higher forecasted growth values. The Russell 2500 Index is considered generally representative of the 2,500 smallest companies in the Russell 3000 Index, which represents approximately 10% of the total market capitalization of the Russell 3000 Index. Index returns reflect the reinvestment of income dividends and capital gains, if any, but do not reflect fees, brokerage commissions or other expenses of investing. Investors may not make direct investment into any index.
16
U.S. SMALL TO MID CAP GROWTH FUND
SCHEDULE OF INVESTMENTS (Unaudited)
As of September 30, 2008
| Number of | |||||||
| Shares | Value | ||||||
Common Stock - 96.4% | |||||||
Aerospace/Defense-Equipment - 2.3% | |||||||
| Kaman Corp. | 1,400 | $ | 39,872 | ||||
| Orbital Sciences Corp. * | 1,800 | 43,146 | |||||
| Triumph Group, Inc. | 400 | 18,284 | |||||
| 101,302 | |||||||
Airlines - 1.0% | |||||||
| Allegiant Travel Co.* | 1,200 | 42,384 | |||||
Apparel Manufacturers - 1.6% | |||||||
| G-III Apparel Group, Ltd.* | 2,000 | 37,420 | |||||
| Jones Apparel Group, Inc. | 1,900 | 35,169 | |||||
| 72,589 | |||||||
Applications Software - 1.2% | |||||||
| Compuware Corp.* | 3,800 | 36,822 | |||||
| Nuance Communications, Inc.* | 1,500 | 18,285 | |||||
| 55,107 | |||||||
Auto/Truck Parts & Equipment-Original - 0.5% | |||||||
| Titan International, Inc. | 1,125 | 23,985 | |||||
Batteries/Battery Systems - 0.9% | |||||||
| Greatbatch, Inc.* | 1,600 | 39,264 | |||||
Beverages-Wine/Spirits - 0.6% | |||||||
| Central European Distribution Corp.* | 600 | 27,246 | |||||
Cellular Telecommunications - 0.8% | |||||||
| NII Holdings, Inc.* | 900 | 34,128 | |||||
Coffee - 0.6% | |||||||
| Green Mountain Coffee Roasters, Inc.* | 700 | 27,538 | |||||
Commercial Banks-Western US - 0.8% | |||||||
| SVB Financial Group* | 650 | 37,648 | |||||
Commercial Services - 0.9% | |||||||
| Quanta Services, Inc.* | 1,500 | 40,515 | |||||
Computers-Integrated Systems - 0.8% | |||||||
| NCR Corp.* | 1,600 | 35,280 | |||||
Consulting Services - 4.3% | |||||||
| Forrester Research, Inc.* | 1,300 | 38,116 | |||||
| FTI Consulting, Inc.* | 600 | 43,344 | |||||
| Gartner, Inc. Cl. A* | 1,600 | 36,288 | |||||
| Navigant Consulting, Inc.* | 2,100 | 41,769 | |||||
| Watson Wyatt Worldwide, Inc. Cl. A | 700 | 34,811 | |||||
| 194,328 | |||||||
Consumer Products-Miscellaneous - 0.7% | |||||||
| Jarden Corp.* | 1,400 | 32,830 | |||||
Containers-Paper/Plastic - 0.9% | |||||||
| Pactiv Corp.* | 1,700 | 42,211 | |||||
Distribution/Wholesale - 1.6% | |||||||
| Fossil, Inc.* | 1,200 | 33,876 | |||||
| LKQ Corp.* | 2,300 | 39,031 | |||||
| 72,907 | |||||||
Diversified Manufacturing Operations - 1.5% | |||||||
| Brink’s Co. | 700 | 42,714 | |||||
| SPX Corp. | 300 | 23,100 | |||||
| 65,814 | |||||||
Electronic Components-Semiconductors - 4.4% | |||||||
| LSI Corp.* | 5,700 | 30,552 | |||||
| Macrovision Solutions Corp.* | 2,100 | 32,298 | |||||
| Monolithic Power Systems, Inc.* | 1,800 | 31,266 | |||||
| ON Semiconductor Corp.* | 5,000 | 33,800 | |||||
| PMC - Sierra, Inc.* | 4,200 | 31,164 | |||||
| Skyworks Solutions, Inc.* | 4,600 | 38,456 | |||||
| 197,536 | |||||||
Electronic Design Automations - 0.9% | |||||||
| Mentor Graphics Corp.* | 3,600 | 40,860 | |||||
Electronic Measure Instruments - 1.4% | |||||||
| Flir Systems, Inc.* | 700 | 26,894 | |||||
| Itron, Inc.* | 400 | 35,412 | |||||
| 62,306 | |||||||
Energy-Alternate Sources - 0.5% | |||||||
| Canadian Solar, Inc.* | 1,200 | 23,436 | |||||
Engineering/R & D Services - 1.0% | |||||||
| Stanley, Inc.* | 1,200 | 44,292 | |||||
Enterprise Software/Services - 1.6% | |||||||
| Ariba, Inc.* | 1,500 | 21,195 | |||||
| Concur Technologies, Inc.* | 600 | 22,956 | |||||
| Taleo Corp. Cl. A* | 1,400 | 27,846 | |||||
| 71,997 | |||||||
Finance-Investment Bankers/Brokers - 0.8% | |||||||
| Raymond James Financial, Inc. | 1,100 | 36,278 | |||||
Finance-Other Services - 0.8% | |||||||
| The Nasdaq OMX Group* | 1,100 | 33,627 | |||||
Food-Dairy Products - 0.9% | |||||||
| Dean Foods Co.* | 1,700 | 39,712 | |||||
Food-Miscellaneous/Diversified - 2.0% | |||||||
| American Italian Pasta Co.* | 2,900 | 48,140 | |||||
| Ralcorp Holdings, Inc.* | 600 | 40,446 | |||||
| 88,586 | |||||||
Food-Wholesale/Distribution - 2.2% | |||||||
| Spartan Stores, Inc. | 2,000 | 49,760 | |||||
| United Natural Foods, Inc.* | 1,900 | 47,481 | |||||
| 97,241 | |||||||
Hazardous Waste Disposal - 0.8% | |||||||
| Stericycle, Inc.* | 600 | 35,346 | |||||
Home Decoration Products - 0.8% | |||||||
| Newell Rubbermaid, Inc. | 2,000 | 34,520 | |||||
Instruments-Controls - 0.9% | |||||||
| Mettler Toledo International, Inc.* | 400 | 39,200 | |||||
Internet Applications Software - 2.0% | |||||||
| Cybersource Corp.* | 2,500 | 40,275 | |||||
| Vocus, Inc.* | 1,500 | 50,940 | |||||
| 91,215 | |||||||
Internet Security - 0.7% | |||||||
| McAfee, Inc.* | 900 | 30,564 | |||||
Intimate Apparel - 1.0% | |||||||
| The Warnaco Group, Inc.* | 1,000 | 45,290 | |||||
Machinery-General Industry - 0.6% | |||||||
| Roper Industries, Inc. | 500 | 28,480 | |||||
Machinery-Pumps - 0.6% | |||||||
| Flowserve Corp. | 300 | 26,631 | |||||
See Accompanying Notes to Financial Statements.
17
U.S. SMALL TO MID CAP GROWTH FUND
SCHEDULE OF INVESTMENTS (Unaudited)
As of September 30, 2008
| Number of | |||||||
| Shares | Value | ||||||
Medical Instruments - 3.6% | |||||||
| Bruker Corp.* | 3,000 | $ | 39,990 | ||||
| Integra LifeSciences Holdings Corp.* | 900 | 39,627 | |||||
| NuVasive, Inc.* | 900 | 44,397 | |||||
| Thoratec Corp.* | 1,400 | 36,750 | |||||
| 160,764 | |||||||
Medical Labs & Testing Services - 2.0% | |||||||
| Bio-Reference Labs, Inc.* | 1,500 | 43,350 | |||||
| Icon PLC - ADR* | 1,200 | 45,900 | |||||
| 89,250 | |||||||
Medical Products - 5.5% | |||||||
| Abiomed, Inc.* | 2,100 | 37,275 | |||||
| American Medical Systems Holdings, Inc.* | 2,300 | 40,848 | |||||
| China Medical Technologies, Inc. - ADR | 1,000 | 32,580 | |||||
| Exactech, Inc.* | 1,600 | 35,584 | |||||
| Haemonetics Corp.* | 800 | 49,376 | |||||
| Wright Medical Group, Inc.* | 1,700 | 51,748 | |||||
| 247,411 | |||||||
Medical-Biomedical/Genetics - 5.3% | |||||||
| Alexion Pharmaceuticals, Inc.* | 1,200 | 47,160 | |||||
| Illumina, Inc.* | 1,000 | 40,530 | |||||
| Medicines Co.* | 2,100 | 48,762 | |||||
| Qiagen NV* | 2,200 | 43,406 | |||||
| Savient Pharmaceuticals, Inc.* | 1,100 | 16,401 | |||||
| United Therapeutics Corp.* | 400 | 42,068 | |||||
| 238,327 | |||||||
Medical-Drugs - 1.6% | |||||||
| Cephalon, Inc.* | 400 | 30,996 | |||||
| Rigel Pharmaceuticals, Inc.* | 1,700 | 39,695 | |||||
| 70,691 | |||||||
Medical-Nursing Homes - 1.0% | |||||||
| Sun Healthcare Group, Inc.* | 3,000 | 43,980 | |||||
Oil & Gas Drilling - 0.5% | |||||||
| Atwood Oceanics, Inc.* | 600 | 21,840 | |||||
Oil Companies-Exploration & Production - 1.7% | |||||||
| Arena Resources, Inc.* | 1,000 | 38,850 | |||||
| Quicksilver Resources, Inc.* | 1,800 | 35,334 | |||||
| 74,184 | |||||||
Oil-Field Services - 1.0% | |||||||
| Hornbeck Offshore Services, Inc.* | 600 | 23,172 | |||||
| Willbros Group, Inc.* | 800 | 21,200 | |||||
| 44,372 | |||||||
Pharmacy Services - 1.7% | |||||||
| HealthExtras, Inc* | 1,400 | 36,568 | |||||
| Omnicare, Inc. | 1,400 | 40,278 | |||||
| 76,846 | |||||||
Power Conversion/Supply Equipment - 0.4% | |||||||
| JA Solar Holdings Co. Ltd. - ADR* | 1,700 | 17,986 | |||||
Private Corrections - 0.6% | |||||||
| Corrections Corp. of America* | 1,100 | 27,335 | |||||
Property/Casualty Insurance - 0.8% | |||||||
| Amtrust Financial Services, Inc. | 2,600 | 35,334 | |||||
Research & Development - 2.8% | |||||||
| Kendle International, Inc.* | 1,000 | 44,710 | |||||
| Parexel International Corp.* | 1,400 | 40,124 | |||||
| Pharmaceutical Product Development, Inc. | 1,000 | 41,350 | |||||
| 126,184 | |||||||
Respiratory Products - 0.9% | |||||||
| ResMed, Inc.* | 900 | 38,700 | |||||
Retail-Apparel/Shoe - 7.3% | |||||||
| Brown Shoe Co., Inc. | 1,600 | 26,208 | |||||
| Collective Brands, Inc.* | 2,400 | 43,944 | |||||
| Dress Barn, Inc.* | 2,100 | 32,109 | |||||
| Genesco, Inc.* | 1,100 | 36,828 | |||||
| Guess ?, Inc. | 950 | 33,051 | |||||
| Gymboree Corp.* | 800 | 28,400 | |||||
| Hanesbrands, Inc.* | 1,300 | 28,275 | |||||
| JOS. A Bank Clothiers, Inc.* | 900 | 30,240 | |||||
| Polo Ralph Lauren Corp. Cl. A | 500 | 33,320 | |||||
| The Childrens Place Retail Stores, Inc.* | 1,000 | 33,350 | |||||
| 325,725 | |||||||
Retail-Automobile - 0.8% | |||||||
| Copart, Inc.* | 900 | 34,200 | |||||
Retail-Computer Equipment - 0.7% | |||||||
| GameStop Corp. Cl. A* | 900 | 30,789 | |||||
Retail-Convenience Store - 1.0% | |||||||
| Pantry, Inc.* | 2,000 | 42,380 | |||||
Retail-Discount - 0.7% | |||||||
| Citi Trends, Inc.* | 1,900 | 30,951 | |||||
Retail-Jewelry - 0.6% | |||||||
| Tiffany & Co. | 700 | 24,864 | |||||
Retail-Miscellaneous/Diversified - 0.5% | |||||||
| Pricesmart, Inc. | 1,400 | 23,436 | |||||
Retail-Restaurants - 1.2% | |||||||
| CKE Restaurants, Inc. | 3,000 | 31,800 | |||||
| Jack in the Box, Inc.* | 1,100 | 23,210 | |||||
| 55,010 | |||||||
Seismic Data Collection - 0.6% | |||||||
| ION Geophysical Corp.* | 1,900 | 26,961 | |||||
Telecommuications Services - 1.8% | |||||||
| NTELOS Holdings Corp. | 1,700 | 45,713 | |||||
| Premiere Global Services, Inc.* | 2,600 | 36,556 | |||||
| 82,269 | |||||||
Telecommunication Equipment-Fiber Optics - 0.9% | |||||||
| IPG Photonics Corp.* | 2,000 | 39,020 | |||||
Textile-Apparel - 0.5% | |||||||
| Perry Ellis International, Inc.* | 1,500 | 22,365 | |||||
Transport-Air Freight - 0.9% | |||||||
| Atlas Air Worldwide Holdings, Inc.* | 1,000 | 40,310 | |||||
Transport-Rail - 0.8% | |||||||
| Genesee & Wyoming, Inc. Cl. A* | 1,000 | 37,520 | |||||
Transport-Truck - 2.2% | |||||||
| Con-way, Inc. | 800 | 35,288 | |||||
| JB Hunt Transport Services, Inc. | 900 | 30,033 | |||||
| Saia, Inc.* | 2,400 | 31,872 | |||||
| 97,193 | |||||||
Vitamins & Nutrition Products - 1.0% | |||||||
| Herbalife, Ltd. | 1,100 | 43,472 | |||||
Web Portals/ISP - 0.9% | |||||||
| Sohu.com, Inc.* | 700 | 39,025 | |||||
| Total Common Stock (Cost: $4,561,135) | 4,320,887 | ||||||
See Accompanying Notes to Financial Statements.
18
SCHEDULE OF INVESTMENTS (Unaudited)
As of September 30, 2008
| Principal | |||||||
| Amount | Value | ||||||
Short Term Investments - 2.9% | |||||||
Time Deposit - 2.9% | |||||||
| Citibank London | |||||||
| 3.470%, 10/01/08 (Cost: $130,024) | $ | 130,024 | $ | 130,024 | |||
| Total Investments - 99.3% (Cost: $4,691,159) | 4,450,911 | ||||||
| Other Assets In Excess Of Liabilities - 0.7% | 31,026 | ||||||
| Net Assets - 100.0% | $ | 4,481,937 | |||||
| * | Non-income producing securities. |
ADR - American Depository Receipt
SCHEDULE OF INVESTMENTS BY SECTOR
as of September 30, 2008
| Percent of | ||||
| Sector | Net Assets | |||
| Consumer, Non-cyclical | 38.0 | % | ||
| Consumer, Cyclical | 19.7 | |||
| Industrial | 15.7 | |||
| Technology | 9.0 | |||
| Communications | 7.1 | |||
| Energy | 3.7 | |||
| Financial | 3.2 | |||
| Short Term Investments | 2.9 | |||
| Total Investments | 99.3 | |||
| Other assets in excess of liabilities | 0.7 | |||
| Net Assets | 100.0 | % | ||
See Accompanying Notes to Financial Statements.
19
U.S. CONVERTIBLE FUND
Management Team: Douglas G. Forsyth, CFA, Portfolio Manager; William L. Stickney, Portfolio Manager; Justin Kass, CFA, Portfolio Manager; Michael E. Yee, Portfolio Manager
Chief Investment Officer: Horacio A. Valeiras, CFA
Goal: The U.S. Convertible Fund seeks to maximize total return consisting of capital appreciation and current income by investing primarily in convertible securities of U.S. companies across all market capitalizations.
Market Overview: The Merrill Lynch All Convertibles All Qualities Index fell 16.31% during the six months ended September 30, 2008, driven by losses in September. By way of comparison, the S&P 500 Index and NASDAQ Composite Index were down 10.87% and 8.22%, respectively.
Like U.S. equities, the convertible market rallied in April and May, as first quarter earnings came in better than expected, and investors believed the worst of the financial crisis was behind them. The rebound faded over the summer, however, amid concerns about inflation and the financial health of the two largest U.S. mortgage companies. Then, in September, the equity and convertible markets came under tremendous pressure when the two companies were taken over by the government, and several other major financial institutions ceased to exist as independent entities. Beyond the obvious uncertainty these failures caused, the rapid unwinding of the leveraged positions on their balance sheets had a direct impact on the equity and credit markets. These liquidations found few willing buyers, so even the smallest trades created big price moves. During the period, all industries within the convertible market posted a loss. Health care and telecommunications held up the best, while financials and materials performed the worst.
Performance: The Fund’s Class I shares declined 10.55% during the six months ended September 30, 2008, outperforming the Merrill Lynch All Convertibles All Qualities Index, which fell 16.31%.
Portfolio Specifics: Our positions in the health care and defense industries positively affected the Fund’s relative performance. Health care companies benefited from their stable earnings and cash flows given the flight to safety that occurred. Defense names advanced as the amount of the supplemental defense spending bill came in higher than expected. One of our industrial issuers was acquired at a large premium and, while we did have some exposure to financials, our underweight was a plus.
Positions in the energy and utilities industries hurt relative performance. Energy issuers declined in response to a sharp pullback in oil prices and concerns about the impact the slowing global economy would have on demand. Similarly, utility issuers were lower on fears that the global slowdown would impact future earnings, despite having reported positive second quarter results.
On September 30, the Fund’s conversion premium was 28% versus the market’s premium of 49%. The Fund continues to be well positioned to participate in the upside of the market, while not sacrificing downside protection.
Market Outlook: The outlook for convertibles remains clouded. The financial failures and weak stock market have undercut investor, consumer and business confidence. There are offsetting factors, such as the level of intervention by the government. However, convertible performance is likely to remain volatile, as investors balance the uncertain outlook for the economy, corporate profits and equity valuations versus prior market cycles.
We continue to build the Fund one security at a time by finding companies that are opportunistically capitalizing on change. We are also maintaining our discipline of identifying the best convertibles with the optimal risk/reward profile: 70-80% of the upside and 40-50% of the downside.
Comparison of Change in Value of a $250,000 Investment in U.S. Convertible Fund Class I, II and IV Shares with the Merrill Lynch All Convertibles, All Qualities Index.
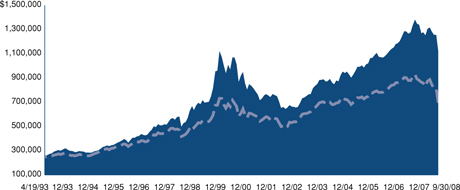

| Annualized Total Returns As of 9/30/08 | |||
1 Year | 5 Years | 10 Years | |
| U.S. Convertible Fund Class I | -15.96% | 7.85% | 7.86% |
Merrill Lynch All Convertibles All Qualities Index | -23.57% | 2.28% | 5.05% |
20
U.S. CONVERTIBLE FUND


| Annualized Total Returns As of 9/30/08 | |||
1 Year | 5 Years | 10 Years | |
| U.S. Convertible Fund Class II | -15.92% | 7.92% | 7.90% |
Merrill Lynch All Convertibles All Qualities Index | -23.57% | 2.28% | 5.05% |


| Annualized Total Returns As of 9/30/08 | |||
1 Year | 5 Years | 10 Years | |
| U.S. Convertible Fund Class IV | -15.79% | 7.94% | 7.91% |
Merrill Lynch All Convertibles All Qualities Index | -23.57% | 2.28% | 5.05% |
The graphs above show the value of a hypothetical $250,000 investment in the Fund’s Class I, II and IV shares compared with the Merrill Lynch All Convertibles, All Qualities Index for the periods indicated. The Fund’s Class I, II and IV shares calculate their performance based upon the historical performance of their corresponding series of Nicholas-Applegate Mutual Funds (renamed ING Mutual Funds), adjusted to reflect all fees and expenses applicable to the Fund’s Class I, II and IV shares. The Nicholas-Applegate Institutional Funds’ Class I shares were first available on May 7, 1999, Class II shares on September 30, 2005 and Class IV shares on December 30, 2006. The historical performance of Class I, II and IV shares includes the performance of Class I shares for periods prior to the inception of Class II. Average annual total return figures include changes in principal value, reinvested dividends, and capital gain distributions. The total returns shown above do not show the effects of income taxes on an individual’s investment. In most cases, taxes may reduce your actual investment returns on income or gains paid by the Fund or any gains you may realize if you sell your shares. Past performance cannot guarantee future results.
The Merrill Lynch All Convertible All Quality Index represents convertible securities spanning all corporate sectors and having a par amount outstanding of $25 Mil+. Maturities must be at least one year. The coupon range must be equal to or greater than zero and all qualities of bonds are included. Preferred equity redemption stocks are not included nor are component bonds once they are converted into corporate stock.
The unmanaged indexes differ from the Fund in composition, do not pay management fees or expenses and include reinvested dividends. One cannot invest directly in an index.
Since markets can go down as well as up, investment return and principal value will fluctuate with market conditions. You may have a gain or loss when you sell your shares.
21
U.S. CONVERTIBLE FUND
SCHEDULE OF INVESTMENTS (Unaudited)
As of September 30, 2008
| Principal | |||||||
| Amount | Value | ||||||
Convertible Corporate Bonds - 81.7% | |||||||
Advertising Agencies - 1.7% | |||||||
| Interpublic Group of Cos, Inc. | |||||||
| 4.250%, 03/15/23 | $ | 5,020,000 | $ | 4,668,600 | |||
Aerospace/Defense-Equipment - 1.8% | |||||||
| Orbital Sciences Corp. | |||||||
| 2.438%, 01/15/27 | 4,305,000 | 4,999,181 | |||||
Applications Software - 1.5% | |||||||
| Nuance Communications, Inc. | |||||||
| 2.750%, 08/15/27 | 1,730,000 | 1,598,088 | |||||
| Nuance Communications,Inc. 144A** | |||||||
| 2.750%, 08/15/27 | 2,845,000 | 2,628,068 | |||||
| 4,226,156 | |||||||
Auto-Cars/Light Trucks - 1.2% | |||||||
| Ford Motor Co. | |||||||
| 4.250%, 12/15/36 | 5,185,000 | 3,441,544 | |||||
Batteries/Battery Systems - 1.2% | |||||||
| EnerSys* | |||||||
| 3.375%, 06/01/38 | 4,720,000 | 3,528,200 | |||||
Brewery - 1.2% | |||||||
| Molson Coors Brewing Co. | |||||||
| 2.500%, 07/30/13 | 3,075,000 | 3,340,219 | |||||
Broadcast Services/Programming - 1.5% | |||||||
| Liberty Media LLC | |||||||
| 3.125%, 03/30/23 | 4,600,000 | 4,214,750 | |||||
Cellular Telecommunications - 2.6% | |||||||
| Leap Wireless International, Inc. 144A** | |||||||
| 4.500%, 07/15/14 | 4,880,000 | 3,824,700 | |||||
| NII Holdings, Inc. | |||||||
| 2.750%, 08/15/25 | 3,685,000 | 3,666,575 | |||||
| 7,491,275 | |||||||
Coal - 0.5% | |||||||
| Peabody Energy Corp. | |||||||
| 4.750%, 12/15/66 | 1,625,000 | 1,498,900 | |||||
Commercial Services - 1.5% | |||||||
| Quanta Services, Inc. 144A** | |||||||
| 3.750%, 04/30/26 | 870,000 | 1,165,800 | |||||
| Quanta Services, Inc. | |||||||
| 3.750%, 04/30/26 | 2,395,000 | 3,209,300 | |||||
| 4,375,100 | |||||||
Computer Services - 2.3% | |||||||
| Electronic Data Systems Corp. | |||||||
| 3.875%, 07/15/23 | 6,405,000 | 6,384,984 | |||||
Consulting Services - 1.7% | |||||||
| FTI Consulting, Inc. | |||||||
| 3.750%, 07/15/12 | 2,000,000 | 4,897,500 | |||||
Electronic Components-Semiconductors - 4.4% | |||||||
| Intel Corp.* | |||||||
| 2.950%, 12/15/35 | 4,645,000 | 4,081,793 | |||||
| ON Semiconductor Corp. | |||||||
| 2.625%, 12/15/26 | 4,430,000 | 3,809,800 | |||||
| Skyworks Solutions, Inc. | |||||||
| 1.500%, 03/01/12 | 2,280,000 | 2,508,000 | |||||
| Skyworks Solutions, Inc. | |||||||
| 1.250%, 03/01/10 | 2,145,000 | 2,198,625 | |||||
| 12,598,218 | |||||||
Electronic Measure Instruments - 3.2% | |||||||
| Flir Systems, Inc. | |||||||
| 3.000%, 06/01/23 | 1,400,000 | 4,873,749 | |||||
| Itron, Inc. | |||||||
| 2.500%, 08/01/26 | 2,995,000 | 4,286,594 | |||||
| 9,160,343 | |||||||
Electronics-Military - 1.6% | |||||||
| Level-3 Communications | |||||||
| Holdings, Inc. 144A** | |||||||
| 3.000%, 08/01/35 | 620,000 | 679,675 | |||||
| Level-3 Communications | |||||||
| Holdings, Inc. | |||||||
| 3.000%, 08/01/35 | 3,400,000 | 3,727,250 | |||||
| 4,406,925 | |||||||
Energy-Alternate Sources - 1.7% | |||||||
| Covanta Holding Corp. | |||||||
| 1.000%, 02/01/27 | 4,875,000 | 4,692,188 | |||||
Enterprise Software/Services - 2.4% | |||||||
| Lawson Software, Inc. | |||||||
| 2.500%, 04/15/12 | 3,360,000 | 2,595,600 | |||||
| Sybase, Inc. | |||||||
| 1.750%, 02/22/25 | 3,290,000 | 4,239,988 | |||||
| 6,835,588 | |||||||
Instruments-Scientific - 2.0% | |||||||
| Fisher Scientific International, Inc. | |||||||
| 3.250%, 03/01/24 | 3,775,000 | 5,539,813 | |||||
Life/Health Insurance - 1.9% | |||||||
Prudential Financial, Inc.++ | |||||||
| 0.419%, 12/12/36 | 5,370,000 | 5,281,395 | |||||
Machinery-Farm - 1.1% | |||||||
| AGCO Corp. | |||||||
| 1.250%, 12/15/36 | 2,430,000 | 3,013,200 | |||||
Machinery-General Industry - 1.5% | |||||||
| Roper Industries, Inc. | |||||||
| 1.481%, 01/15/34 | 6,200,000 | 4,270,250 | |||||
Medical Instruments - 3.6% | |||||||
| Medtronic, Inc. | |||||||
| 1.625%, 04/15/13 | 5,015,000 | 5,015,000 | |||||
| St Jude Medical, Inc. | |||||||
| 1.220%, 12/15/08 | 5,275,000 | 5,261,812 | |||||
| 10,276,812 | |||||||
Medical-Biomedical/Genetics - 8.4% | |||||||
| Amgen, Inc. | |||||||
| 0.375%, 02/01/13 | 5,670,000 | 5,131,350 | |||||
| Genzyme Corp. | |||||||
| 1.250%, 12/01/23 | 4,680,000 | 5,428,799 | |||||
| Illumina, Inc. | |||||||
| 0.625%, 02/15/14 | 2,360,000 | 4,407,300 | |||||
| Invitrogen Corp. | |||||||
| 2.000%, 08/01/23 | 3,855,000 | 4,534,444 | |||||
| OSI Pharmaceuticals, Inc. | |||||||
| 3.000%, 01/15/38 | 4,280,000 | 4,317,450 | |||||
| 23,819,343 | |||||||
See Accompanying Notes to Financial Statements.
22
SCHEDULE OF INVESTMENTS (Unaudited)
As of September 30, 2008
| Principal | |||||||
| Amount | Value | ||||||
Medical-Drugs - 7.5% | |||||||
| Allergan, Inc. 144A** | |||||||
| 1.500%, 04/01/26 | $ | 1,800,000 | $ | 1,872,000 | |||
| Allergan, Inc. | |||||||
| 1.500%, 04/01/26 | 2,530,000 | 2,631,200 | |||||
Bristol-Myers Squibb Co.++ | |||||||
| 2.319%, 09/15/23 | 6,250,000 | 6,281,249 | |||||
| Teva Pharmaceutical Finance LLC* | |||||||
| 0.500%, 02/01/24 | 4,150,000 | 5,099,313 | |||||
Wyeth++ | |||||||
| 2.621%, 01/15/24 | 5,560,000 | 5,433,788 | |||||
| 21,317,550 | |||||||
Medical-Generic Drugs - 1.9% | |||||||
| Watson Pharmaceuticals, Inc. | |||||||
| 1.750%, 03/15/23 | 5,685,000 | 5,329,688 | |||||
Oil & Gas Drilling - 3.0% | |||||||
| Nabors Industries, Inc. | |||||||
| 0.940%, 05/15/11 | 4,425,000 | 3,993,563 | |||||
| Transocean, Inc. | |||||||
| 1.500%, 12/15/37 | 5,065,000 | 4,609,149 | |||||
| 8,602,712 | |||||||
Oil Companies-Exploration & Production - 1.3% | |||||||
| Chesapeake Energy Corp. | |||||||
| 2.500%, 05/15/37 | 3,780,000 | 3,633,525 | |||||
Oil Field Machinery & Equipment - 0.9% | |||||||
| Cameron International Corp. | |||||||
| 2.500%, 06/15/26 | 1,990,000 | 2,519,838 | |||||
Power Conversion/Supply Equipment - 1.3% | |||||||
| JA Solar Holdings Co. Ltd. | |||||||
| 4.500%, 05/15/13 | 4,935,000 | 3,608,719 | |||||
REITS-Diversified - 2.0% | |||||||
| Digital Realty Trust LP 144A** | |||||||
| 4.125%, 08/15/26 | 3,825,000 | 5,620,838 | |||||
REITS-Office Property - 1.6% | |||||||
| Boston Properties LP | |||||||
| 3.750%, 05/15/36 | 4,370,000 | 4,451,938 | |||||
Retail-Major Dept Store - 1.4% | |||||||
TJX Cos., Inc.+ | |||||||
| –%, 02/13/21 | 4,005,000 | 4,035,038 | |||||
Semicon Components-Integrated Circuits - 0.1% | |||||||
| Cypress Semiconductor Corp.* | |||||||
| 1.000%, 09/15/09 | 340,000 | 338,300 | |||||
Super-Regional Banks-US - 1.7% | |||||||
US BanCorp.++ | |||||||
| 1.454%, 09/20/36 | 4,960,000 | 4,791,360 | |||||
Telecommuications Services - 1.9% | |||||||
| Amdocs, Ltd. | |||||||
| 0.500%, 03/15/24 | 5,365,000 | 5,244,288 | |||||
Therapeutics - 1.6% | |||||||
| Gilead Sciences, Inc. 144A** | |||||||
| 0.625%, 05/01/13 | 1,905,000 | 2,424,112 | |||||
| Gilead Sciences, Inc. | |||||||
| 0.625%, 05/01/13 | 1,575,000 | 2,004,188 | |||||
| 4,428,300 | |||||||
Toys - 1.7% | |||||||
| Hasbro, Inc. | |||||||
| 2.750%, 12/01/21 | 2,924,000 | 4,722,260 | |||||
Web Hosting/Design - 1.4% | |||||||
| Equinix, Inc. | |||||||
| 2.500%, 04/15/12 | 4,630,000 | 4,033,888 | |||||
Wire & Cable Products - 0.7% | |||||||
| General Cable Corp. | |||||||
| 0.875%, 11/15/13 | 2,360,000 | 2,106,300 | |||||
Wireless Equipment - 1.4% | |||||||
| American Tower Corp. | |||||||
| 3.000%, 08/15/12 | 2,220,000 | 3,929,400 | |||||
| Total Convertible Corporate Bonds (Cost: $249,040,429) | 231,674,426 | ||||||
| Number of | |||||||
| Shares | |||||||
Common Stock - 1.7% | |||||||
Aerospace/Defense - 0.7% | |||||||
| Lockheed Martin Corp. | 17,141 | 1,879,853 | |||||
Medical Instruments - 1.0% | |||||||
| Edwards Lifesciences Corp.* | 50,476 | 2,915,494 | |||||
| Total Common Stock (Cost: $4,568,782) | 4,795,347 | ||||||
Convertible Preferred Stock - 13.2% | |||||||
Agricultural Operations - 1.2% | |||||||
| Bunge, Ltd. | |||||||
| 4.875% 12/31/49 | 37,685 | 3,259,753 | |||||
Electric-Generation - 1.3% | |||||||
| AES Trust III | |||||||
| 6.750%, 10/15/29 | 99,243 | 3,805,969 | |||||
Electric-Integrated - 1.6% | |||||||
| Entergy Corp. | |||||||
| 7.625, 02/17/09 | 86,105 | 4,477,460 | |||||
Finance-Investment Bankers/Brokers - 1.7% | |||||||
| Citigroup, Inc. | 116,095 | 4,759,894 | |||||
Independent Power Producer - 1.1% | |||||||
| NRG Energy,Inc. | |||||||
| 5.75%, 03/16/09 | 13,955 | 3,125,920 | |||||
Metal-Diversified - 0.8% | |||||||
| Freeport-McMoRan Copper & Gold, Inc. | |||||||
| 6.375%. 05/01/10 | 27,215 | 2,310,826 | |||||
Multi-line Insurance - 1.4% | |||||||
| XL Capital Ltd.* | 146,445 | 3,917,404 | |||||
Special Purpose Entity - 1.6% | |||||||
| Omnicare Capital Trust II | 110,600 | 4,424,000 | |||||
Super-Regional Banks-US - 2.6% | |||||||
| Bank of America Corp. | |||||||
| 7.250%, 12/31/49 | 6,750 | 5,637,937 | |||||
| Wachovia Corp. | 4,240 | 1,632,400 | |||||
| 7,270,337 | |||||||
| Total Convertible Preferred Stock (Cost: $44,717,212) | 37,351,563 | ||||||
See Accompanying Notes to Financial Statements.
23
U.S. CONVERTIBLE FUND
SCHEDULE OF INVESTMENTS (Unaudited)
As of September 30, 2008
| Principal | |||||||
| Amount | Value | ||||||
Short Term Investments - 4.4% | |||||||
Time Deposit - 4.4% | |||||||
| Citibank London | |||||||
| 3.470%, 10/01/08 | |||||||
| (Cost: $12,562,843) | $ | 12,562,843 | $ | 12,562,843 | |||
| Total Investments -101.0% (Cost: $310,889,266) | 286,384,179 | ||||||
| Liabilities In Excess of Other Assets - (1.0)% | (2,686,445 | ) | |||||
| Net Assets - 100.0% | $ | 283,697,734 | |||||
| * | Non-income producing securities. |
| ** | 144A Security. Certain condition for public sale may exist. The total market value of 144A securities owned at September 30, 2008 was $18,215,192 or 6.42% of net assets. |
| ++ | The coupon rate shown on floating rate securities represents the rate at September 30, 2008. |
| + | Zero coupon bond. |
SCHEDULE OF INVESTMENTS BY SECTOR
as of September 30, 2008
| Percent of | ||||
| Sector | Net Assets | |||
| Consumer, Non-cyclical | 29.6 | % | ||
| Industrial | 15.1 | |||
| Financial | 14.3 | |||
| Technology | 10.7 | |||
| Communications | 10.4 | |||
| Energy | 7.4 | |||
| Consumer, Cyclical | 4.3 | |||
| Utilities | 4.0 | |||
| Basic Materials | 0.8 | |||
| Short Term Investments | 4.4 | |||
| Total Investments | 101.0 | |||
| Liabilities in excess of other assets | (1.0 | ) | ||
| Net Assets | 100.0 | % | ||
See Accompanying Notes to Financial Statements.
24
GLOBAL EQUITY 130/30 FUND
Management Team: Pedro V. Marcal, Portfolio Manager
Chief Investment Officer: Horacio A. Valeiras, CFA
Goal: The Global Equity 130/30 Fund seeks to maximize long-term capital appreciation by using fundamental research to identify both long and short investment opportunities that provide diversified exposure to a broad range of U.S. and non-U.S. companies. Normally, approximately 130% of the Fund’s assets will be in long positions and approximately 30% will be in short positions.
Market Overview: The global equity market posted a significant loss during the six months ended September 30, 2008. The downturn was broad-based, with every sector and nearly every country in the MSCI All Country World Index generating a decline. Developed markets were generally more resilient than emerging markets, consistent with the volatile investment environment.
The period began on a strong note, with stock prices climbing higher in April and May on hopes that emergency actions taken by the United States Federal Reserve in March would contain the housing-induced credit crisis. However, stocks retreated in June on inflation concerns and remained under pressure through the end of September as problems in the credit markets intensified. Weakened by losses on mortgage-linked securities, several major U.S. and European financial institutions were unable to raise the capital they needed to shore up their balance sheets. One major U.S. investment bank filed for bankruptcy, and several other global financial institutions were either rescued by their respective governments or sold. Amid worries about which firm might be next, risk aversion soared, lending dried up and equity prices tumbled. Policymakers around the world took steps to bolster investor confidence, but the period ended with uncertainty about how much damage the financial crisis had done to the global economy.
Performance: The Fund’s Class I shares posted a 19.90% loss between April 1 and September 30 2008, and the MSCI All Country World Index declined 17.65%.
Portfolio Specifics: Overall, our long equity positions contributed positively to the Fund’s results versus the index. For example, our holdings in Germany, Hong Kong and Ireland and the financials, materials and information technology sectors outperformed. Holdings in the United Kingdom, Japan and the health care and consumer discretionary sectors underperformed.
The short portion of the portfolio hurt the Fund’s relative results, with areas of underperformance including the United States and the United Kingdom. Short positions in Belgium and Austria benefited the portfolio. An especially helpful short position was a Belgian bank that had heavy exposure to the U.S. housing market and required a capital injection.
Market Outlook: Stock prices are likely to remain volatile as investors measure the impact of the steps policymakers have taken to stabilize their economies and financial systems. While we are optimistic that, over time, the governments’ efforts will be effective in stabilizing global equity markets and encouraging banks to resume lending, we are cautious in drawing expectations about the timing of a recovery.
In this dynamic environment, we believe that our bottom-up stock selection process will identify many exciting investment opportunities for the Fund, both long positions and short.
25
GLOBAL EQUITY 130/30 FUND
SCHEDULE OF INVESTMENTS (Unaudited)
As of September 30, 2008
| Number of | |||||||
| Shares | Value | ||||||
Common Stock - 105.6% | |||||||
Australia - 1.4% | |||||||
| Incitec Pivot, Ltd.* | 11,360 | $ | 46,219 | ||||
Austria - 0.6% | |||||||
| Erste Group Bank AG | 400 | 19,602 | |||||
Belgium - 0.5% | |||||||
| InBev NV | 296 | 17,626 | |||||
Bermuda - 2.5% | |||||||
| Arch Capital Group, Ltd.* | 400 | 29,212 | |||||
| PartnerRe, Ltd. | 400 | 27,236 | |||||
| RenaissanceRe Holdings, Ltd. | 500 | 26,000 | |||||
| 82,448 | |||||||
Brazil - 0.3% | |||||||
| Bolsa de Mercadorias e Futuros - BM&F | 1,900 | 8,372 | |||||
Canada - 1.2% | |||||||
| Potash Corp. of Saskatchewan | 300 | 39,155 | |||||
Denmark - 1.2% | |||||||
| Novo Nordisk - ADR | 800 | 40,960 | |||||
Finland - 0.4% | |||||||
| Outotec OYJ | 436 | 11,676 | |||||
France - 2.7% | |||||||
| Alstom SA | 228 | 17,138 | |||||
| BNP Paribas | 282 | 26,547 | |||||
| GDF Suez | 809 | 42,066 | |||||
| Suez SA* | 95 | 2,367 | |||||
| 88,118 | |||||||
Germany - 4.0% | |||||||
| E.ON AG | 447 | 22,624 | |||||
| Morphosys AG* | 424 | 26,086 | |||||
| Porsche Automobil Holding SE | 148 | 15,958 | |||||
| RWE AG | 215 | 20,644 | |||||
| SAP AG | 900 | 48,227 | |||||
| 133,539 | |||||||
Hong Kong - 1.1% | |||||||
| HongKong Electric Holdings | 5,500 | 34,867 | |||||
Ireland - 0.9% | |||||||
| Icon PLC - ADR* | 800 | 30,600 | |||||
Israel - 1.1% | |||||||
| Teva Pharmaceutical Industries, Ltd. - ADR | 800 | 36,632 | |||||
Italy - 0.9% | |||||||
| Saipem SpA | 945 | 28,141 | |||||
Japan - 16.8% | |||||||
| Capcom Co., Ltd. | 800 | 23,021 | |||||
| East JapanRailway Co. | 2 | 15,155 | |||||
| EPS Co., Ltd. | 6 | 19,146 | |||||
| Japan Tobacco, Inc. | 5 | 18,992 | |||||
| Kirin Holdings Co., Ltd. | 2,000 | 26,550 | |||||
| Mitsubishi Estate Co., Ltd. | 1,000 | 19,377 | |||||
| Mitsubishi UFJ Financial Group, Inc. | 5,400 | 46,488 | |||||
| Mizuho Financial Group, Inc. | 10 | 42,611 | |||||
| Nintendo Co., Ltd | 200 | 83,679 | |||||
| Nitori Co., Ltd. | 500 | 30,078 | |||||
| Nomura Holdings, Inc. | 1,600 | 20,453 | |||||
| Secom Co., Ltd. | 500 | 20,968 | |||||
| Sumitomo Mitsui Financial Group, Inc. | 8 | 48,588 | |||||
| T&D Holdings, Inc. | 450 | 23,686 | |||||
| The Japan Steel Works, Ltd. | 1,000 | 12,369 | |||||
| Toyo Tanso Co., Ltd. | 500 | 26,453 | |||||
| Unicharm Corp. | 300 | 30,367 | |||||
| Unicharm Petcare Corp. | 1,000 | 23,426 | |||||
| West Japan Railway Co. | 6 | 26,145 | |||||
| 557,552 | |||||||
Netherlands - 1.1% | |||||||
| Royal KPN NV | 2,453 | 35,616 | |||||
Spain - 0.7% | |||||||
| Telefonica SA | 948 | 22,669 | |||||
Sweden - 0.6% | |||||||
| Hennes & Mauritz AB Cl. B | 500 | 20,260 | |||||
Switzerland - 4.7% | |||||||
| ACE, Ltd. | 700 | 37,891 | |||||
| Nestle SA | 970 | 42,305 | |||||
| Roche Holding AG | 290 | 45,789 | |||||
| Syngenta AG | 133 | 28,546 | |||||
| 154,531 | |||||||
Taiwan - 0.7% | |||||||
Taiwan Semiconductor Manufacturing Co. Ltd. - ADR | 2,412 | 22,600 | |||||
United Kingdom - 8.1% | |||||||
| BG Group PLC | 1,116 | 20,414 | |||||
| British American Tobacco PLC | 1,733 | 57,425 | |||||
| Diageo PLC | 2,460 | 41,979 | |||||
| HSBC Holdings PLC | 2,400 | 38,209 | |||||
| Imperial Tobacco Group PLC | 848 | 27,517 | |||||
| SSL International PLC | 5,002 | 40,488 | |||||
| Unilever PLC | 729 | 20,036 | |||||
| Wellstream Holdings PLC* | 1,327 | 24,442 | |||||
| 270,510 | |||||||
United States - 54.4% | |||||||
| Aflac, Inc. | 600 | 35,250 | |||||
| Apple, Inc.* | 300 | 34,098 | |||||
| Bank of America Corp. | 2,300 | 80,500 | |||||
| BlackRock, Inc. Cl. A | 100 | 19,450 | |||||
| Cisco Systems, Inc.* | 1,000 | 22,560 | |||||
| Coca-Cola Co. | 600 | 31,728 | |||||
| Devon Energy Corp. | 300 | 27,360 | |||||
| Exelon Corp. | 500 | 31,310 | |||||
| Exxon Mobil Corp. | 900 | 69,894 | |||||
| FirstEnergy Corp. | 400 | 26,796 | |||||
| Forest Oil Corp.* | 500 | 24,800 | |||||
| Foundation Coal Holdings, Inc. | 700 | 24,906 | |||||
| FPL Group, Inc. | 400 | 20,120 | |||||
| Genentech, Inc.* | 300 | 26,604 | |||||
| General Dynamics Corp. | 500 | 36,810 | |||||
| Helmerich & Payne, Inc. | 500 | 21,595 | |||||
| Hess Corp. | 300 | 24,624 | |||||
| Hewlett-Packard Co. | 900 | 41,616 | |||||
| Hill-Rom Holdings, Inc. | 1,100 | 33,341 | |||||
| HJ Heinz Co. | 700 | 34,979 | |||||
| Intel Corp. | 900 | 16,857 | |||||
| International Business Machines Corp. | 600 | 70,176 | |||||
| Johnson & Johnson | 400 | 27,712 | |||||
| JPMorgan Chase & Co. | 1,200 | 56,040 | |||||
| Lockheed Martin Corp. | 400 | 43,868 | |||||
| Mastercard, Inc. Cl. A | 100 | 17,733 | |||||
| McDonald’s Corp. | 400 | 24,680 | |||||
| Merck & Co., Inc. | 1,000 | 31,560 | |||||
| Microsoft Corp. | 1,800 | 48,042 | |||||
| Monsanto Co. | 500 | 49,490 | |||||
See Accompanying Notes to Financial Statements.
26
SCHEDULE OF INVESTMENTS (Unaudited)
As of September 30, 2008
| Number of | |||||||
| Shares | Value | ||||||
| National Oilwell Varco, Inc.* | 1,100 | $ | 55,253 | ||||
| Northern Trust Corp. | 1,450 | 104,690 | |||||
| Occidental Petroleum Corp. | 300 | 21,135 | |||||
| Oracle Corp.* | 2,500 | 50,775 | |||||
| Philip Morris International, Inc. | 900 | 43,290 | |||||
| Praxair, Inc. | 600 | 43,044 | |||||
| Procter & Gamble Co. | 700 | 48,783 | |||||
| QUALCOMM, Inc. | 600 | 25,782 | |||||
| Schering-Plough Corp. | 2,000 | 36,940 | |||||
| Schlumberger, Ltd. | 600 | 46,854 | |||||
| Texas Instruments, Inc. | 800 | 17,200 | |||||
| The Bank of New York Mellon Corp. | 2,200 | 71,676 | |||||
| The Goldman Sachs Group, Inc. | 500 | 64,000 | |||||
| Thermo Fisher Scientific, Inc.* | 700 | 38,500 | |||||
| Valero Energy Corp. | 1,100 | 33,338 | |||||
| XTO Energy, Inc. | 1,125 | 52,335 | |||||
| 1,808,094 | |||||||
| Total Common Stock (Cost: $3,995,398) | 3,509,787 | ||||||
Preferred Stock - 2.1% | |||||||
Germany - 2.1% | |||||||
| Fresenius SE | 600 | 43,691 | |||||
| Henkel KGaA | 714 | 26,255 | |||||
| 69,946 | |||||||
| Total Preferred Stock (Cost: $83,614) | 69,946 | ||||||
| Principal | |||||||
| Amount | |||||||
Short Term Investments - 1.2% | |||||||
Time Deposit - 1.2% | |||||||
| Brown Brothers Harriman & Co. - Grand | |||||||
| Cayman 3.470%, 10/01/08 | $ | 38,747 | 38,747 | ||||
| Total Short Term Investments (Cost: $38,747) | 38,747 | ||||||
| Total Investments - 108.9% (Cost: $4,117,759) | 3,618,480 | ||||||
| Liabilities In Excess Of Other Assets - (8.9%) | (296,460 | ) | |||||
| Net Assets - 100.0% | $ | 3,322,020 | |||||
SCHEDULE OF SECURITIES
SOLD SHORT
| Number of | |||||||
| Shares | Value | ||||||
Common Stock - (9.3%) | |||||||
United States - (9.3%) | |||||||
| iShares MSCI ACWI Index Fund* | 2,100 | (86,709 | ) | ||||
| iShares MSCI EAFE Index Fund* | 2,300 | (129,490 | ) | ||||
| iShares S&P 500 Index Fund* | 800 | (94,000 | ) | ||||
| (310,199 | ) | ||||||
| Total Common Stock (Proceeds: ($335,934)) | (310,199 | ) | |||||
| Total Securities Sold Short (Proceeds: ($335,934)) | (310,199 | ) | |||||
| * | Non-income producing securities. |
ADR - American Depository Receipt
SCHEDULE OF INVESTMENTS BY SECTOR
as of September 30, 2008
| Percent of | ||||
| Sector | Net Assets | |||
| Consumer, Non-cyclical | 29.1 | % | ||
| Financial | 25.5 | |||
| Energy | 14.3 | |||
| Technology | 11.2 | |||
| Industrial | 6.9 | |||
| Basic Materials | 6.2 | |||
| Utilities | 6.0 | |||
| Consumer, Cyclical | 5.3 | |||
| Communications | 3.2 | |||
| Short Term Investments | 1.2 | |||
| Total Investments | 108.9 | |||
| Liabilities in excess of other assets | (8.9 | ) | ||
| Net Assets | 100.0 | % | ||
See Accompanying Notes to Financial Statements.
27
GLOBAL SELECT FUND
Management Team: Christopher A. Herrera, Portfolio Manager; Nelson W. Shing, Portfolio Manager
Chief Investment Officer: Horacio A. Valeiras, CFA
Goal: The Global Select Fund seeks to maximize long-term capital appreciation by investing in companies that, in the opinion of the Investment Adviser, represent the “best of the best” globally.
Market Overview: The global stock market posted a loss from April 1 through September 30, 2008, with much of the weakness occurring in September. While equities in nearly every country declined, emerging markets fared the worst, as the volatile investment environment dampened risk appetites.
After advancing in April and May, global share prices fell sharply in June due to weak economic data, credit write-downs by financial institutions and high commodity prices. Several resource-rich countries, including Brazil and Norway, finished the first half of the period with double-digit gains, but most markets were in negative territory.
Stocks stabilized in July and August, supported by falling commodity prices and a new law giving the U.S. Treasury the authority to rescue America’s two biggest mortgage lenders if needed. However, demand for equities was short-lived, as these and other major U.S. and European financial institutions ceased to exist as independent entities in September. With one firm after another facing insolvency, banks became unwilling to lend, the credit markets seized up and stock prices tumbled. Policymakers around the world took steps to restore investor confidence, including U.S. officials who drafted legislation allowing the Treasury to buy bad mortgage debt.
Downbeat economic news contributed to the broad sell-off in equities. One of the most striking indicators was September’s 53% drop in the Baltic Dry Index, a measure of dry bulk shipping costs that is considered to be a good proxy for global growth.
Performance: During the six months ended September 30, 2008, the Fund’s Class I shares lost 19.76%, and the MSCI All Country World Index declined 17.65%.
Portfolio Specifics: The Fund’s underperformance was driven by stock selection, which was weakest in the United States, Hong Kong and the industrials and financials sectors. Top detractors included a Japan-based trading company that was impacted by softening global economic activity and a U.S.-based provider of glass used in liquid crystal display (LCD) panels that was hurt by a slowdown in LCD manufacturing. Other areas of relative weakness were stock selection in China and the telecommunication services sector and an overweight in materials. Materials was the worst-performing sector in the index due to the decline in prices of metals, grains and other commodities that took place from July through September.
On the other hand, stock selection in the materials sector added significant value, as did stock selection in Israel and Ireland. The Fund’s top contributors included Israel Chemicals, a fertilizer producer, and Ireland-based Icon, a contract research organization serving various health care industries. Heinz, a U.S.-based food company, also posted a strong gain amid favorable pricing and volume trends.
Market Outlook: The U.S. Treasury, Federal Reserve and central banks abroad are acting in an unprecedented fashion to avoid a worsening global financial crisis. While we are hopeful longer term, we have seen little evidence of improvement to date. The credit markets remain frozen, suggesting that the United States, Europe and Japan will enter a recession if they have not already done so. On a positive note, valuations are compelling, especially in emerging countries, although it is likely that earnings estimates will be reduced.
We continue to closely monitor the direction of earnings estimates, monetary policy and economic activity as we seek out the best global growth opportunities for the Fund.
Comparison of Change in Value of a $250,000 Investment in Global Select Fund Class I and II Shares with the MSCI All Country World Index.
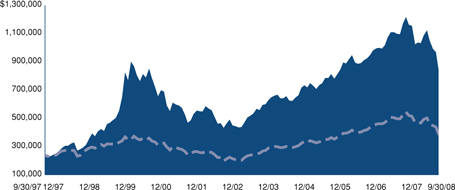

| Annualized Total Returns As of 9/30/08 | ||||||||||
1 Year | 5 Years | 10 Years | ||||||||
| Global Select Fund Class I | -29.16% | 8.14% | 11.22% | |||||||
| MSCI All Country World Index | -26.47% | 8.53% | 4.78% | |||||||
28
GLOBAL SELECT FUND
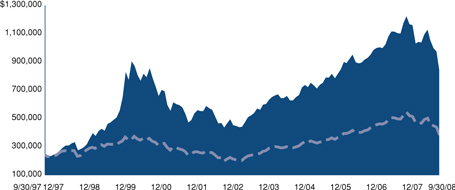

| Annualized Total Returns As of 9/30/08 | ||||||||||
1 Year | 5 Years | 10 Years | ||||||||
| Global Select Fund Class II | -29.16% | 8.18% | 11.24% | |||||||
| MSCI All Country World Index | -26.47% | 8.53% | 4.78% | |||||||
The graphs above show the value of a hypothetical $250,000 investment in the Fund’s Class I and II shares compared with the Morgan Stanley Capital International All Country World Index (“MSCI ACWI”) over the periods indicated. The Fund’s Class I and II shares calculate their performance based upon the historical performance of their corresponding series of Nicholas-Applegate Mutual Funds (renamed ING Mutual Funds), adjusted to reflect all fees and expenses applicable to the Fund’s Class I and II shares. The Nicholas-Applegate Institutional Funds’ Class I shares were first available on May 7, 1999 and Class II shares on June 30, 2003. The historical performance of Class II shares includes the performance of Class I shares for periods prior to the inception of Class II. Average annual total return figures include changes in principal value, reinvested dividends, and capital gain distributions. The total returns shown above do not show the effects of income taxes on an individual’s investment. In most cases, taxes may reduce your actual investment returns on income or gains paid by the Fund or any gains you may realize if you sell your shares. Past performance cannot guarantee future results.
The MSCI ACWI is a market capitalization weighted index composed of over 2000 companies. The MSCI ACWI is representative of the market structure of 21 countries in North America, Europe, and the Pacific Rim, excluding closed markets and those shares in otherwise free markets that are not purchasable by foreigners.
The unmanaged Index differs from the Fund in composition, does not pay management fees or expenses and includes reinvested dividends. One cannot invest directly in an index.
Since markets can go down as well as up, investment return and principal value will fluctuate with market conditions, currency volatility and the social, economic and political climates of countries where the Fund invests. You may have a gain or loss when you sell your shares.
29
GLOBAL SELECT FUND
SCHEDULE OF INVESTMENTS (Unaudited)
As of September 30, 2008
| Number of | |||||||
| Shares | Value | ||||||
Common Stock - 94.5% | |||||||
Australia - 1.1% | |||||||
| BHP Billiton, Ltd | 15,521 | $ | 386,114 | ||||
Brazil - 1.9% | |||||||
| All America Latina Logistica SA | 42,300 | 285,077 | |||||
| Banco do Brasil SA | 32,100 | 378,587 | |||||
| 663,664 | |||||||
Finland - 0.6% | |||||||
| Outotec OYJ | 8,390 | 224,686 | |||||
France - 5.9% | |||||||
| BNP Paribas | 8,066 | 759,308 | |||||
| Ingenico | 16,743 | 421,463 | |||||
| Neopost SA | 6,294 | 594,919 | |||||
| Vallourec SA | 1,385 | 298,050 | |||||
| 2,073,740 | |||||||
Germany - 5.4% | |||||||
| Bayer AG | 6,548 | 482,492 | |||||
| Henkel KGaA | 12,426 | 384,099 | |||||
| Linde AG | 4,295 | 461,155 | |||||
| RWE AG | 6,246 | 599,732 | |||||
| 1,927,478 | |||||||
Greece - 1.5% | |||||||
| Alpha Bank AE | 23,752 | 514,905 | |||||
Hong Kong - 0.3% | |||||||
| Melco International Development | 400,000 | 112,933 | |||||
Ireland - 1.3% | |||||||
| Icon PLC - ADR* | 11,800 | 451,350 | |||||
Israel - 1.1% | |||||||
| Israel Chemicals, Ltd. | 26,431 | 392,406 | |||||
Italy - 2.0% | |||||||
| Intesa Sanpaolo SpA | 128,170 | 701,842 | |||||
Japan - 7.7% | |||||||
| Asics Corp. | 65,000 | 509,447 | |||||
| Marubeni Corp. | 87,000 | 392,519 | |||||
| Mizuho Financial Group, Inc. | 172 | 732,902 | |||||
| Nintendo Co., Ltd | 1,400 | 585,751 | |||||
| Nitori Co., Ltd. | 8,650 | 520,351 | |||||
| 2,740,970 | |||||||
Kuwait - 1.1% | |||||||
| Global Investment House KSCC - GDR | |||||||
| 144A** | 27,100 | 392,950 | |||||
Republic of China - 2.5% | |||||||
| China Green Holdings, Ltd. | 228,000 | 185,068 | |||||
| China Mobile, Ltd. | 71,000 | 713,658 | |||||
| Peace Mark Holdings, Ltd. | 314,000 | 410 | |||||
| 899,136 | |||||||
Spain - 2.9% | |||||||
| Tecnicas Reunidas SA | 9,122 | 387,674 | |||||
| Telefonica SA | 27,096 | 647,938 | |||||
| 1,035,612 | |||||||
Switzerland - 7.0% | |||||||
| ACE, Ltd. | 8,600 | 465,518 | |||||
| Aryzta AG* | 12,151 | 479,641 | |||||
| Nestle SA | 22,441 | 978,726 | |||||
| Roche Holding AG | 3,403 | 537,315 | |||||
| 2,461,200 | |||||||
United Kingdom - 9.9% | |||||||
| ARM Holdings PLC | 167,137 | 286,721 | |||||
| BG Group PLC | 30,100 | 550,604 | |||||
| Croda International | 49,402 | 538,375 | |||||
| IG Group Holdings PLC | 119,214 | 675,420 | |||||
| International Power PLC | 89,677 | 585,804 | |||||
| Man Group PLC | 56,340 | 342,600 | |||||
| Wellstream Holdings PLC* | 28,009 | 515,894 | |||||
| 3,495,418 | |||||||
United States - 42.3% | |||||||
| Ansys, Inc.* | 12,600 | 477,162 | |||||
| Apple, Inc.* | 6,500 | 738,790 | |||||
| Best Buy Co., Inc. | 14,400 | 540,000 | |||||
| Coca-Cola Co. | 14,300 | 756,184 | |||||
| Corning, Inc. | 40,300 | 630,292 | |||||
| Crown Holdings, Inc.* | 25,000 | 555,250 | |||||
| Deere & Co. | 7,500 | 371,250 | |||||
| Devon Energy Corp. | 6,500 | 592,800 | |||||
| Energizer Holdings, Inc.* | 7,700 | 620,235 | |||||
| General Dynamics Corp. | 3,800 | 279,756 | |||||
| Genzyme Corp.* | 7,900 | 639,031 | |||||
| Guess ?, Inc. | 18,300 | 636,657 | |||||
| Hess Corp. | 6,100 | 500,688 | |||||
| Hill-Rom Holdings, Inc. | 20,100 | 609,231 | |||||
| HJ Heinz Co. | 13,100 | 654,607 | |||||
| National City Corp. | 122,100 | 213,675 | |||||
| Oracle Corp.* | 36,500 | 741,315 | |||||
| Praxair, Inc. | 8,000 | 573,920 | |||||
| Procter & Gamble Co. | 9,600 | 669,024 | |||||
| Prudential Financial, Inc. | 8,500 | 612,000 | |||||
| Schering-Plough Corp. | 35,500 | 655,685 | |||||
| Target Corp. | 16,400 | 804,420 | |||||
| The Bank of New York Mellon Corp. | 22,500 | 733,050 | |||||
| Thermo Fisher Scientific, Inc.* | 12,800 | 704,000 | |||||
| XTO Energy, Inc. | 14,800 | 688,496 | |||||
| 14,997,518 | |||||||
| Total Common Stock (Cost: $36,544,394) | 33,471,922 | ||||||
Equity-Linked Securities - 1.1% | |||||||
Taiwan - 1.1% | |||||||
| Credit Suisse FB Hon Hai Precision | |||||||
| Industry Co., Ltd. 11/05/10* | |||||||
| (Cost: $451,961) | 110,908 | 386,071 |
| Principal | |||||||
| Amount | |||||||
Short Term Investments - 2.8% | |||||||
Time Deposit - 2.8% | |||||||
| Bank of America London | |||||||
| 3.470%, 10/01/08 (Cost: $997,534) | $ | 997,534 | 997,534 | ||||
| Total Investments - 98.4% (Cost: $37,993,889) | 34,855,527 | ||||||
| Other Assets In Excess Of Liabilities - 1.6% | 569,214 | ||||||
| Net Assets - 100.0% | $ | 35,424,741 | |||||
| * | Non-income producing securities. |
| ** | 144A Security. Certain condition for public sale may exist. The total market value of 144A securities owned at September 30, 2008 was $392,950 or 1.11% of net assets. |
ADR - American Depository Receipt
GDR - Global Depository Receipt
See Accompanying Notes to Financial Statements.
30
SCHEDULE OF INVESTMENTS (Unaudited)
As of September 30, 2008
| SCHEDULE OF INVESTMENTS BY SECTOR | ||||
| as of September 30, 2008 | ||||
| Percent of | ||||
| Sector | Net Assets | |||
| Consumer, Non-cyclical | 19.8 | % | ||
| Financial | 18.4 | |||
| Industrial | 11.6 | |||
| Consumer, Cyclical | 11.3 | |||
| Technology | 9.2 | |||
| Energy | 8.0 | |||
| Basic Materials | 8.0 | |||
| Communications | 5.6 | |||
| Utilities | 3.4 | |||
| Diversified | 0.3 | |||
| Short Term Investments | 2.8 | |||
| Total Investments | 98.4 | |||
| Other assets in excess of liabilities | 1.6 | |||
| Net Assets | 100.0 | % | ||
See Accompanying Notes to Financial Statements.
31
INTERNATIONAL GROWTH FUND
Management Team: Horacio A. Valeiras, CFA, Portfolio Manager and Chief Investment Officer; Pedro V. Marcal, Portfolio Manager
Goal: The International Growth Fund seeks to maximize long-term capital appreciation through investments primarily in companies with above-average earnings growth and positioned in strong growth areas.
Market Overview: Developed non-U.S. stock markets were weak during the six months ended September 30, 2008. Losses were broad-based, with every country in the MSCI EAFE Index posting a negative return in local currencies. The U.S. dollar appreciated versus a basket of currencies, which accentuated the declines in dollar terms.
The period began with gains, fueled by optimism that the worst of the U.S.-led credit crisis might be over. However, international equities sold off in June, largely due to inflation fears, and remained under pressure throughout the rest of the period as the credit problems in the United States intensified. Overwhelmed by mortgage-related losses, the U.S. investment banking industry collapsed in September, causing a global credit freeze and darkening the outlook for the world economy.
European financials were also under considerable stress, and several institutions were rescued by their respective governments. To help stabilize the sector, the region’s central banks added extra liquidity to the money markets, and U.K. officials temporarily banned short selling of financial stocks. Euro area economies showed signs of rapid deterioration, with quarterly GDP contracting for the first time since the 1999 introduction of the common currency.
Japanese equities approached a four-year low, as data showed that the country’s financial companies had significant exposure to a U.S. securities firm that went bankrupt. In addition, lending standards tightened, business failures increased and consumer sentiment slumped to a record low. In September, the Bank of Japan set aside $60 billion to bolster troubled local and overseas financial firms.
Performance: During the six months ended September 30, 2008, the Fund’s Class I shares posted a 20.92% loss but outperformed the MSCI EAFE Index, which declined 22.03%.
Portfolio Specifics: Relative performance was helped by stock selection in Ireland and Hong Kong. Two of the Fund’s top contributors were Ireland-based Icon, a contract research organization serving the pharmaceutical and biotechnology industries, and HongKong Electric, a utility. Icon experienced strong growth in a robust demand environment, as more companies seek to lower the time and cost of drug development by outsourcing. HongKong Electric continued to pursue its international growth strategy by acquiring a 50% stake in New Zealand’s fourth-largest electricity distribution network.
A lack of exposure to Norway, one of the worst-performing countries in the index, was another plus. Energy companies represent a large percentage of Norway’s stock market capitalization, and the 28% drop in the price of oil from July through September was a significant headwind.
Areas of relative weakness included stock selection in Japan and France and exposure to emerging countries, which lagged their developed market counterparts in the risk-averse environment.
Market Outlook: We expect international stock markets to remain volatile as investors digest the implications of the U.S. government’s $700 billion bank rescue plan, as well as other aggressive steps taken by authorities around the world. Combined, these efforts may restore confidence in the financial system and, in turn, loosen up the credit markets and stimulate the global economy. Still, the real impact of these policy actions is likely to be measured in months and years rather than days and weeks.
In this dynamic environment, the consistent application of our investment process is more important than ever. We thus remain focused on identifying positive changes taking place within individual companies, which we believe will benefit the Fund over time.
Comparison of Change in Value of a $250,000 Investment in International Growth Fund Class I and II Shares with the MSCI EAFE Index.
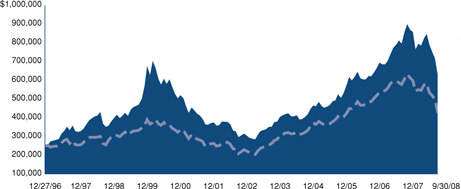

| Annualized Total Returns As of 9/30/08 | ||||||||||
1 Year | 5 Years | 10 Years | ||||||||
| International Growth Fund Class I | -27.71% | 12.04% | 5.87% | |||||||
| MSCI EAFE Index | -30.13% | 10.16% | 5.42% | |||||||
32
INTERNATIONAL GROWTH FUND
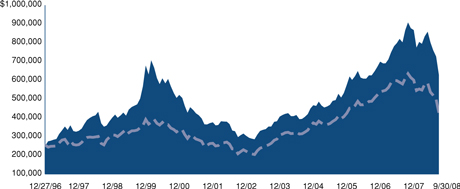

| Annualized Total Returns As of 9/30/08 | ||||||||||
1 Year | 5 Years | 10 Years | ||||||||
| International Growth Fund Class II | -27.49% | 12.26% | 5.97% | |||||||
| MSCI EAFE Index | -30.13% | 10.16% | 5.42% | |||||||
The graphs above show the value of a hypothetical $250,000 investment in the Fund’s Class I and II shares compared with the Morgan Stanley Capital International Europe, Australasia, Far East Index (“MSCI EAFE”) over the periods indicated. The Fund’s Class I and II shares calculate their performance based upon the historical performance of their corresponding series of Nicholas-Applegate Mutual Funds (renamed ING Mutual Funds), adjusted to reflect all fees and expenses applicable to the Fund’s Class I and II shares. The Nicholas-Applegate Institutional Funds’ Class I shares were first available on May 7, 1999 and Class II shares on January 23, 2006. The historical performance of Class II shares includes the performance of Class I shares for periods prior to the inception of Class II shares. Average annual total return figures include changes in principal value, reinvested dividends, and capital gain distributions. The total returns shown above do not show the effects of income taxes on an individual’s investment. In most cases, taxes may reduce your actual investment returns on income or gains paid by the Fund or any gains you may realize if you sell your shares. Past performance cannot guarantee future results.
The MSCI EAFE Index is an unmanaged index of over 900 companies, and is a generally accepted benchmark for major overseas markets. Index weightings represent the relative capitalizations of the major overseas markets included in the index on a U.S. dollar adjusted basis. The unmanaged Index differs from the Fund in composition, does not pay management fees or expenses and includes reinvested dividends. One cannot invest directly in an index.
Since markets can go down as well as up, investment return and principal value will fluctuate with market conditions, currency volatility and the social, economic and political climates of countries where the Fund invests. You may have a gain or loss when you sell your shares.
33
INTERNATIONAL GROWTH FUND
SCHEDULE OF INVESTMENTS (Unaudited)
As of September 30, 2008
| Number of | |||||||
| Shares | Value | ||||||
Common Stock - 93.9% | |||||||
Australia - 5.4% | |||||||
| AMP, Ltd. | 24,261 | $ | 135,893 | ||||
| CSL, Ltd. | 16,131 | 482,841 | |||||
| Incitec Pivot, Ltd.* | 52,320 | 212,868 | |||||
| Rio Tinto, Ltd | 1,730 | 117,311 | |||||
| 948,913 | |||||||
Belgium - 1.1% | |||||||
| InBev NV | 3,388 | 201,748 | |||||
Brazil - 1.6% | |||||||
| Bolsa de Mercadorias e Futuros - BM&F | 9,000 | 39,659 | |||||
| Cia Vale do Rio Doce Cl. B - ADR | 8,100 | 155,115 | |||||
| Unibanco - Uniao de Bancos | |||||||
| Brasileiros SA - GDR | 800 | 80,736 | |||||
| 275,510 | |||||||
Canada - 2.9% | |||||||
| Potash Corp. of Saskatchewan | 1,300 | 171,613 | |||||
| Rogers Communications, Inc. Cl. B | 5,600 | 181,821 | |||||
| Teck Cominco, Ltd. Cl. B | 5,400 | 153,488 | |||||
| 506,922 | |||||||
Denmark - 0.6% | |||||||
| Novo Nordisk AS Cl. B | 2,050 | 105,999 | |||||
Egypt - 0.5% | |||||||
| Orascom Construction Industries - GDR | 152 | 15,618 | |||||
| Orascom Construction Industries - GDR | 651 | 66,890 | |||||
| 82,508 | |||||||
Finland - 0.4% | |||||||
| Outotec OYJ | 2,886 | 77,288 | |||||
France - 8.5% | |||||||
| Alstom SA | 3,327 | 250,086 | |||||
| BNP Paribas | 2,221 | 209,078 | |||||
| Cie Generale de Geophysique-Veritas* | 4,701 | 148,272 | |||||
| Electricite de France | 1,244 | 90,266 | |||||
| GDF Suez | 7,402 | 384,886 | |||||
| Suez Environnement SA Rights* | 2 | 12 | |||||
| Suez SA* | 896 | 22,325 | |||||
| Suez SA | 109 | 5,365 | |||||
| Total SA | 3,955 | 239,906 | |||||
| Veolia Environnement | 3,827 | 157,369 | |||||
| 1,507,565 | |||||||
Germany - 9.0% | |||||||
| Deutsche Telekom AG | 8,208 | 125,749 | |||||
| E.ON AG | 8,699 | 440,278 | |||||
| Rhoen Klinikum AG | 4,076 | 119,441 | |||||
| RWE AG | 2,538 | 243,695 | |||||
| SAP AG | 4,396 | 235,562 | |||||
| Siemens AG | 1,438 | 134,495 | |||||
| Stada Arzneimittel AG | 4,143 | 166,664 | |||||
| United Internet AG | 12,077 | 130,221 | |||||
| 1,596,105 | |||||||
Greece - 1.7% | |||||||
| National Bank of Greece SA | 3,844 | 153,506 | |||||
| Piraeus Bank SA | 6,760 | 139,797 | |||||
| 293,303 | |||||||
Hong Kong - 1.3% | |||||||
| HongKong Electric Holdings | 28,000 | 177,503 | |||||
| Kerry Properties, Ltd. | 15,563 | 50,245 | |||||
| 227,748 | |||||||
Ireland - 0.8% | |||||||
| Icon PLC - ADR* | 3,500 | 133,875 | |||||
Israel - 1.3% | |||||||
Teva Pharmaceutical Industries, Ltd. - ADR | 5,200 | 238,108 | |||||
Italy - 3.5% | |||||||
| Intesa Sanpaolo SpA | 37,162 | 203,494 | |||||
| Saipem SpA | 8,395 | 249,995 | |||||
| UniCredit SpA | 42,773 | 158,227 | |||||
| 611,716 | |||||||
Japan - 21.4% | |||||||
| Air Water, Inc. | 1,000 | 10,036 | |||||
| Capcom Co., Ltd. | 3,200 | 92,085 | |||||
| East JapanRailway Co. | 33 | 250,053 | |||||
| Honda Motor Co., Ltd | 4,800 | 142,987 | |||||
| Japan Tobacco, Inc. | 52 | 197,513 | |||||
| KDDI Corp. | 26 | 147,633 | |||||
| Kirin Holdings Co., Ltd. | 10,000 | 132,748 | |||||
| Mitsubishi Corp. | 8,200 | 170,356 | |||||
| Mitsubishi Electric Corp. | 14,300 | 95,260 | |||||
| Mitsubishi Estate Co., Ltd. | 4,300 | 83,322 | |||||
| Mitsubishi UFJ Financial Group, Inc. | 31,700 | 272,902 | |||||
| Mizuho Financial Group, Inc. | 48 | 204,531 | |||||
| Nintendo Co., Ltd | 900 | 376,554 | |||||
| Nitori Co., Ltd. | 2,400 | 144,375 | |||||
| Nomura Holdings, Inc. | 15,300 | 195,583 | |||||
| Secom Co., Ltd. | 2,200 | 92,259 | |||||
| Sumitomo Mitsui Financial Group, Inc. | 37 | 224,718 | |||||
| T&D Holdings, Inc. | 1,950 | 102,641 | |||||
| The Japan Steel Works, Ltd. | 20,000 | 247,373 | |||||
| Tokyo Electric Power Co., Inc. | 3,300 | 82,397 | |||||
| Toyo Tanso Co., Ltd. | 3,100 | 164,070 | |||||
| Toyota Motor Corp. | 3,100 | 130,897 | |||||
| Unicharm Corp. | 1,500 | 117,131 | |||||
| West Japan Railway Co. | 29 | 126,366 | |||||
| 3,803,790 | |||||||
Mexico - 0.4% | |||||||
| America Movil SAB de CV - ADR | 1,400 | 64,904 | |||||
Netherlands - 1.2% | |||||||
| Royal KPN NV | 14,415 | 209,295 | |||||
Peru - 0.4% | |||||||
| Credicorp, Ltd. | 1,000 | 62,250 | |||||
Republic of China - 0.2% | |||||||
| China Communications Construction Co., Ltd. | 35,000 | 30,377 | |||||
Russian Federation - 0.7% | |||||||
| Evraz Group SA - GDR | 3,217 | 121,603 | |||||
Singapore - 1.7% | |||||||
| DBS Group Holdings, Ltd. | 25,100 | 298,307 | |||||
Spain - 1.9% | |||||||
| Banco Santander SA | 6,329 | 94,646 | |||||
| Iberdrola SA | 7,889 | 80,223 | |||||
| Telefonica SA | 6,915 | 165,356 | |||||
| 340,225 |
See Accompanying Notes to Financial Statements.
34
INTERNATIONAL GROWTH FUND
SCHEDULE OF INVESTMENTS (Unaudited)
As of September 30, 2008
| Number of | |||||||
| Shares | Value | ||||||
Switzerland - 8.1% | |||||||
| ACE, Ltd. | 5,400 | $ | 292,302 | ||||
| Julius Baer Holding AG | 2,850 | 140,286 | |||||
| Nestle SA | 12,499 | 545,123 | |||||
| Roche Holding AG | 2,210 | 348,947 | |||||
| Syngenta AG | 534 | 114,611 | |||||
| 1,441,269 | |||||||
United Kingdom - 19.7% | |||||||
| BG Group PLC | 9,382 | 171,620 | |||||
| BP PLC | 20,126 | 168,631 | |||||
| British American Tobacco PLC | 16,889 | 559,633 | |||||
| Diageo PLC | 14,858 | 253,545 | |||||
| HSBC Holdings PLC | 31,200 | 496,715 | |||||
| Imperial Tobacco Group PLC | 9,654 | 313,270 | |||||
| International Power PLC | 36,487 | 238,347 | |||||
| Reckitt Benckiser Group PLC | 4,098 | 200,616 | |||||
| Royal Dutch Shell PLC Cl. A | 5,748 | 167,942 | |||||
| SSL International PLC | 15,846 | 128,263 | |||||
| Standard Chartered PLC | 5,600 | 134,024 | |||||
| Unilever PLC | 10,346 | 284,348 | |||||
| Vodafone Group PLC | 86,287 | 191,185 | |||||
| Wellstream Holdings PLC* | 9,805 | 180,597 | |||||
| 3,488,736 | |||||||
| Total Common Stock (Cost: $18,776,431) | 16,668,064 | ||||||
Preferred Stock - 3.8% | |||||||
Brazil - 0.8% | |||||||
| Usinas Siderurgicas de Minas Gerais SA | 6,500 | 136,507 | |||||
Germany - 3.1% | |||||||
| Fresenius SE | 4,486 | 326,660 | |||||
| Henkel KGaA | 5,883 | 216,327 | |||||
| 542,987 | |||||||
| Total Preferred Stock (Cost: $824,276) | 679,494 | ||||||
| Principal | |||||||
| Amount | |||||||
Short Term Investments - 1.3% | |||||||
Time Deposit - 1.3% | |||||||
| Brown Brothers Harriman & Co. - Grand | |||||||
| Cayman 3.470%, 10/01/08 | |||||||
| (Cost: $230,973) | $ | 230,973 | 230,973 | ||||
| Total Investments - 99.1% (Cost: $19,831,680) | 17,578,531 | ||||||
| Other Assets In Excess Of Liabilities - 0.9% | 164,181 | ||||||
| Net Assets - 100.0% | $ | 17,742,712 | |||||
| * | Non-income producing securities. |
ADR - American Depository Receipt
GDR - Global Depository Receipt
| SCHEDULE OF INVESTMENTS BY SECTOR | ||||
| as of September 30, 2008 | ||||
| Percent of | ||||
| Sector | Net Assets | |||
| Consumer, Non-cyclical | 29.1 | % | ||
| Financial | 21.3 | |||
| Utilities | 10.8 | |||
| Industrial | 8.2 | |||
| Energy | 7.5 | |||
| Communications | 6.9 | |||
| Basic Materials | 6.7 | |||
| Consumer, Cyclical | 5.4 | |||
| Technology | 1.9 | |||
| Short Term Investments | 1.3 | |||
| Total Investments | 99.1 | |||
| Other assets in excess of liabilities | 0.9 | |||
| Net Assets | 100.0 | % | ||
See Accompanying Notes to Financial Statements.
35
INTERNATIONAL GROWTH OPPORTUNITIES FUND
Management Team: Christopher A. Herrera, Portfolio Manager; Nelson W. Shing, Portfolio Manager
Chief Investment Officer: Horacio A. Valeiras, CFA
Goal: The International Growth Opportunities Fund seeks to maximize long-term capital appreciation through investments primarily in companies located outside the United States with market capitalizations predominantly in the bottom 20% of publicly traded companies, as measured by the market capitalization in the S&P/Citi World xUS BMI.
Market Overview: International small-cap stocks, as measured by the S&P/Citi World xUS EMI, registered negative returns in local currencies from April 1 through September 30, 2008. Losses were concentrated in the second half of the period and were particularly steep in September. Appreciation in the U.S. dollar versus a range of currencies widened the decline in dollar terms. Some of the main factors depressing stock prices were:
| • | Turmoil in the global credit markets, as the collapse or near collapse of several major U.S. and European financial firms caused risk aversion to soar and banks to stop lending |
| • | Evidence of rapid deterioration in the U.S. and Japanese economies and in major economies throughout Europe |
| • | Volatility in the price of oil and other raw materials, with a key commodities index surging 19.6% from April through June and then plunging 25.3% on concerns about global growth |
As the period drew to a close, central bankers and other authorities from around the world were taking aggressive steps to stabilize their financial systems and economies.
Performance: The Fund’s Class I shares lost 27.78% during the six months ended September 30, 2008. The S&P/Citi World xUS EMI Growth, the Fund’s primary benchmark, declined 26.42% and the S&P/Citi World xUS EMI fell 26.17%.
Portfolio Specifics: The Fund’s underperformance was largely due to stock selection. From a country perspective, stock selection was particularly weak in China, France and Hong Kong. In terms of sectors, stock selection among consumer discretionary, industrials and energy companies subtracted the most from relative results. Major detractors included a China-based retailer that needed to secure financing to pay off a bridge loan, a Hong Kong-based conglomerate whose gaming business was hurt by a change in government regulation, and a U.K.-based energy pipeline producer that reported a decrease in its order backlog.
On the positive side, relative performance benefited from stock selection in Japan, Norway and the financials sector. One of the Fund’s top contributors was Norway-based Pronova BioPharma, the maker of a cholesterol-lowering drug that saw strong demand and announced plans to increase capacity. An overweight in the defensive health care sector was also a plus.
Market Outlook: The U.S. Treasury, Federal Reserve and central banks abroad are acting in an unprecedented fashion to avoid a worsening global financial crisis. While we are hopeful longer term, we have seen little evidence of improvement to date. The credit markets remain frozen, suggesting that the United States, Europe and Japan will enter a recession if they have not already done so. On a positive note, valuations are compelling, especially in emerging countries, although it is likely that earnings estimates will be reduced.
As events unfold, we believe that staying focused on investing in small cap companies exhibiting sustainable, timely and positive change will lead to strong, long-term performance in the Fund.
Comparison of Change in Value of a $250,000 Investment in International Growth Opportunities Fund Class I and II Shares with the Citigroup World EMI xUS Growth Index and the Citigroup World EMI xUS Index.


| Annualized Total Returns As of 9/30/08 | ||||||||||
1 Year | 5 Years | 10 Years | ||||||||
International Growth Opportunities Fund Class I | -37.85% | 13.79% | 13.48% | |||||||
Citigroup World EMI xUS Growth Index | -35.08% | 10.49% | 6.09% | |||||||
| Citigroup World EMI xUS Index | -34.48% | 11.63% | 8.49% | |||||||
36
INTERNATIONAL GROWTH OPPORTUNITIES FUND
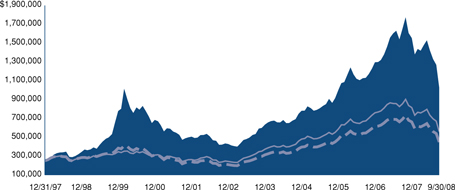

| Annualized Total Returns As of 9/30/08 | ||||||||||
1 Year | 5 Years | 10 Years | ||||||||
International Growth Opportunities Fund Class II | -37.75% | 13.97% | 13.57% | |||||||
Citigroup World EMI xUS Growth Index | -35.08% | 10.49% | 6.09% | |||||||
| Citigroup World EMI xUS Index | -34.48% | 11.63% | 8.49% | |||||||
The graphs above show the value of a hypothetical $250,000 investment in the Fund’s Class I through III shares compared with the Citigroup World EMI xUS Growth Index and Citigroup World EMI xUS Index for the periods indicated. The Fund’s Class I through III shares calculate their performance based upon the historical performance of their corresponding series of Nicholas-Applegate Mutual Funds (renamed ING Mutual Funds), adjusted to reflect all fees and expenses applicable to the Fund’s Class I through III shares. The Nicholas-Applegate Institutional Funds’ Class I shares were first available on May 7, 1999, Class II shares commenced operations on June 5, 2003 and Class III shares on September 30, 2005. The historical performance of Class II and III shares includes the performance of Class I shares for periods prior to the inception of the relevant class. Average annual total return figures include changes in principal value, reinvested dividends, and capital gain distributions. The total returns shown above do not show the effects of income taxes on an individual’s investment. In most cases, taxes may reduce your actual investment returns on income or gains paid by the Fund or any gains you may realize if you sell your shares. Past performance cannot guarantee future results.
The Citigroup World EMI xUS Index (“EMI”) is a world market capitalization weighted index measuring capital appreciation excluding the U.S. The EMI index is comprised of companies in the bottom 20% of any given country’s available market capitalization. Major corporate events such as extraordinary dividends, spin-offs, scrip issues in other securities, and shares repurchased via tender offers are accounted for in the calculation. The Citigroup World EMI xUS Growth Index covers only those companies in each country that exhibit growth characteristics relative to other companies in the same country according to a multivariable formula. The Indexes are unmanaged and do not include non-extraordinary dividends. The unmanaged indexes differ from the Fund in composition, do not pay management fees or expenses, and include reinvested dividends. One can not invest directly in an index.
Since markets can go down as well as up, investment return and principal value will fluctuate with market conditions, currency volatility and the social, economic and political climates of countries where the Fund invests. You may have a gain or loss when you sell your shares.
37
INTERNATIONAL GROWTH OPPORTUNITIES FUND
SCHEDULE OF INVESTMENTS (Unaudited)
As of September 30, 2008
| Number of | |||||||
| Shares | Value | ||||||
Common Stock - 92.1% | |||||||
Australia - 5.1% | |||||||
| Incitec Pivot, Ltd.* | 186,860 | $ | 760,254 | ||||
| Murchison Metals, Ltd.* | 698,281 | 714,455 | |||||
| Nufarm, Ltd. | 167,134 | 2,031,943 | |||||
| Paladin Energy, Ltd.* | 348,287 | 1,090,024 | |||||
| Western Areas NL* | 150,032 | 907,798 | |||||
| 5,504,474 | |||||||
Belgium - 2.6% | |||||||
| EVS Broadcast Equipment SA | 38,492 | 2,746,048 | |||||
Bermuda - 1.3% | |||||||
| Lancashire Holdings, Ltd.* | 251,578 | 1,399,221 | |||||
Canada - 1.2% | |||||||
| Canadian Western Bank | 69,700 | 1,305,892 | |||||
Finland - 0.8% | |||||||
| Outotec OYJ | 30,375 | 813,447 | |||||
France - 8.0% | |||||||
| EDF Energies Nouvelles SA | 52,363 | 2,609,361 | |||||
| Ingenico | 72,370 | 1,821,734 | |||||
| Neopost SA | 25,816 | 2,440,168 | |||||
| Nexans SA | 19,157 | 1,691,488 | |||||
| 8,562,751 | |||||||
Germany - 7.2% | |||||||
| Bauer AG | 35,440 | 1,789,674 | |||||
| Comdirect Bank AG | 202,171 | 1,501,209 | |||||
| Roth & Rau AG | 25,120 | 871,889 | |||||
| SGL Carbon AG* | 40,431 | 1,568,955 | |||||
| Stada Arzneimittel AG | 50,377 | 2,026,579 | |||||
| 7,758,306 | |||||||
Greece - 1.2% | |||||||
| JUMBO SA | 80,367 | 1,320,424 | |||||
Hong Kong - 0.4% | |||||||
| Melco International Development | 1,369,500 | 386,653 | |||||
Italy - 5.8% | |||||||
| ACEA SpA | 126,245 | 1,815,900 | |||||
| Azimut Holding SpA | 186,859 | 1,291,326 | |||||
| Brembo SpA | 164,309 | 1,611,097 | |||||
| Maire Tecnimont SpA* | 439,108 | 1,544,631 | |||||
| 6,262,954 | |||||||
Japan - 16.6% | |||||||
| Asics Corp. | 219,600 | 1,721,149 | |||||
| EPS Co., Ltd. | 481 | 1,534,859 | |||||
| Nitori Co., Ltd. | 33,350 | 2,006,208 | |||||
| Point, Inc. | 45,860 | 1,764,016 | |||||
| Seven Bank, Ltd. | 851 | 2,288,913 | |||||
| The Japan Steel Works, Ltd. | 98,300 | 1,215,838 | |||||
| Torishima Pump Manufacturing Co., Ltd. | 75,800 | 1,379,643 | |||||
| Towa Pharmaceutical Co., Ltd. | 73,700 | 2,692,788 | |||||
| Unicharm Petcare Corp. | 105,300 | 3,197,676 | |||||
| 17,801,090 | |||||||
Netherlands - 1.4% | |||||||
| Unit 4 Agresso NV | 82,618 | 1,478,255 | |||||
Norway - 3.8% | |||||||
| Pronova BioPharma AS* | 758,000 | 2,496,260 | |||||
| Songa Offshore ASA* | 169,976 | 1,603,503 | |||||
| 4,099,763 | |||||||
Republic of China - 1.6% | |||||||
| China Green Holdings, Ltd. | 2,154,000 | 1,748,407 | |||||
| Peace Mark Holdings, Ltd. | 2,428,000 | 3,174 | |||||
| 1,751,581 | |||||||
Singapore - 2.6% | |||||||
| StarHub, Ltd. | 1,547,500 | 2,827,794 | |||||
Spain - 3.1% | |||||||
| Grifols SA | 129,101 | 3,309,627 | |||||
Switzerland - 3.9% | |||||||
| Aryzta AG* | 64,963 | 2,564,395 | |||||
| Banque Cantonale Vaudoise | 5,368 | 1,616,227 | |||||
| 4,180,622 | |||||||
United Arab Emirates - 1.6% | |||||||
| Lamprell PLC | 289,753 | 1,682,178 | |||||
United Kingdom - 24.0% | |||||||
| ARM Holdings PLC | 310,464 | 532,596 | |||||
| Babcock International Group | 302,311 | 2,724,066 | |||||
| Chemring Group PLC | 54,308 | 2,013,334 | |||||
| Croda International | 225,340 | 2,455,719 | |||||
| De La Rue PLC | 196,977 | 3,208,375 | |||||
| IG Group Holdings PLC | 445,734 | 2,525,356 | |||||
| Pennon Group PLC | 133,327 | 1,407,232 | |||||
| RPS Group PLC | 546,682 | 2,406,260 | |||||
| SSL International PLC | 394,133 | 3,190,261 | |||||
| Subsea 7, Inc.* | 107,000 | 1,433,357 | |||||
| Victrex PLC | 81,995 | 1,058,660 | |||||
| Wellstream Holdings PLC* | 156,181 | 2,876,679 | |||||
| 25,831,895 | |||||||
| Total Common Stock (Cost: $115,771,162) | 99,022,975 | ||||||
Equity-Linked Securities - 2.3% | |||||||
Luxembourg - 2.3% | |||||||
| Merrill Lynch Powertec - 05/16/13 144A** | 602,000 | 1,291,290 | |||||
| Merrill Lynch Wistron Corp. - 12/03/12 144A** | 938,976 | 1,129,588 | |||||
| 2,420,878 | |||||||
| Total Equity-Linked Securities (Cost: $3,501,931) | 2,420,878 | ||||||
Preferred Stock - 1.0% | |||||||
Brazil - 1.0% | |||||||
| Banco do Estado do Rio Grande do Sul (Cost: $2,063,046) | 333,400 | 1,123,461 | |||||
| Principal | |||||||
| Amount | |||||||
Short Term Investments - 3.8% | |||||||
Time Deposit - 3.8% | |||||||
| Bank of America London | |||||||
| 3.470%, 10/01/08 | |||||||
| (Cost: $4,091,934) | $ | 4,091,934 | 4,091,934 | ||||
| Total Investments - 99.2% (Cost: $125,428,073) | 106,659,248 | ||||||
| Other Assets In Excess Of Liabilities - 0.8% | 846,032 | ||||||
| Net Assets - 100.0% | $ | 107,505,280 | |||||
| * | Non-income producing securities. |
| ** | 144A Security. Certain condition for public sale may exist. The total market value of 144A securities owned at September 30, 2008 was $2,420,878 or 2.25% of net assets. |
See Accompanying Notes to Financial Statements.
38
SCHEDULE OF INVESTMENTS (Unaudited)
As of September 30, 2008
| SCHEDULE OF INVESTMENTS BY SECTOR | ||||
| as of September 30, 2008 | ||||
| Percent of | ||||
| Sector | Net Assets | |||
| Consumer, Non-cyclical | 28.9 | % | ||
| Industrial | 13.3 | |||
| Financial | 10.7 | |||
| Basic Materials | 9.8 | |||
| Energy | 9.4 | |||
| Technology | 8.1 | |||
| Consumer, Cyclical | 7.8 | |||
| Communications | 4.0 | |||
| Utilities | 3.0 | |||
| Diversified | 0.4 | |||
| Short Term Investments | 3.8 | |||
| Total Investments | 99.2 | |||
| Other assets in excess of liabilities | 0.8 | |||
| Net Assets | 100.0 | % | ||
See Accompanying Notes to Financial Statements.
39
EMERGING MARKETS FUND
Management Team: Kunal Ghosh, Portfolio Manager; Steven Tael, Ph.D., CFA, Portfolio Manager
Chief Investment Officer: Horacio A. Valeiras, CFA
Goal: The Emerging Markets Fund seeks to maximize long-term capital appreciation primarily through investments in countries with emerging securities markets. These markets have yet to reach a level of maturity associated with the developed foreign stock markets and are, in the opinion of the Investment Adviser, less sophisticated than more developed markets in terms of participation, analyst coverage, liquidity and regulation.
Market Overview: From April 1 through September 30, 2008, prices of emerging market equities tumbled, with nearly every country in the MSCI Emerging Markets Index posting a decline in local currencies. Broad-based appreciation in the U.S. dollar increased the losses in dollar terms. The downturn was concentrated in the second half of the period and driven by:
| • | The collapse or near-collapse of several large U.S. and European financial firms, which made investors highly risk averse and clouded the outlook for the global economy |
| • | Steep drop in commodity prices that triggered a sell-off in energy and materials companies, which make up nearly a third of the MSCI Emerging Markets Index |
| • | Country-specific developments, such as Russia’s conflict with Georgia and a change in leadership in Pakistan |
Policymakers around the world took steps to shore up their economies and banking systems. Russia’s government produced a $120 billion financial rescue package, China’s central bank cut interest rates for the first time in six years and South Korea, Taiwan and Indonesia put restrictions on short selling.
Performance: The Fund’s Class I shares registered a 29.07% decline during the six months ended September 30, 2008. The MSCI Emerging Markets Index fell 27.45%.
Portfolio Specifics: Stock selection in Taiwan, Israel and the financials and information technology sectors had the largest negative effect on relative performance. Major detractors included several companies that produce liquid crystal display (LCD) panels, mainly used in televisions, which were weak due to concerns about consumer demand. Our position in a fertilizer manufacturer was another notable detractor in the Fund, as the deteriorating outlook for the global economy sent prices of agricultural commodities sharply lower.
On the positive side, stock selection in Brazil and the energy and industrials sectors helped relative results. One of our best-performing holdings was Turk Hava Yollari, a Turkish airline, which benefited from falling oil prices, healthy growth in passenger volumes and improved fuel efficiency in its fleet. An underweight in Russia, one of the worst-performing markets in the index, was another plus.
The Fund remained broadly diversified across countries and sectors throughout the period. Based on our model’s bottom-up stock selection recommendations, on September 30, the Fund’s largest overweights versus the benchmark were in Israel (+1.9%) and the industrials sector (+2.5%). The largest underweights were in Russia (-4.0%) and telecommunication services (-3.7%).
Market Outlook: The Fund’s investment process evaluates opportunities on a relative basis and neither utilizes, nor results in, a forecast or outlook on the overall market. Rather, the Fund expects to outperform the MSCI Emerging Markets Index in both up and down markets.
We are confident that the Fund’s proprietary stock-selection model, in conjunction with its risk-controlled approach to portfolio construction, will add value above the index over time.
Comparison of Change in Value of a $250,000 Investment in Emerging Markets Fund Class I and II Shares with the MSCI EM Index.
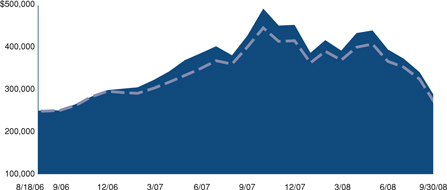

| Annualized Total Returns As of 9/30/08 | |||||||
1 Year | Since Inception | ||||||
| Emerging Markets Fund Class I | -34.86% | 4.86% | |||||
| MSCI EM Index | -33.01% | 3.09% | |||||
40
EMERGING MARKETS FUND
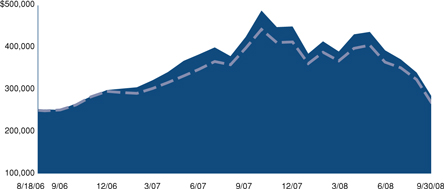

| Annualized Total Returns As of 9/30/08 | |||||||
1 Year | Since Inception | ||||||
| Emerging Markets Fund Class II | -34.78% | 4.93% | |||||
| MSCI EM Index | -33.01% | 3.09% | |||||
The graphs above show the value of a hypothetical $250,000 investment in the Fund’s Class I and II shares compared with the Morgan Stanley Capital International Emerging Markets Index (“MSCI EM”) over the periods indicated. Average annual total return figures include changes in principal value, reinvested dividends, and capital gain distributions. The total returns shown above do not show the effects of income taxes on an individual’s investment. In most cases, taxes may reduce your actual investment returns on income or gains paid by the Fund or any gains you may realize if you sell your shares. Past performance cannot guarantee future results.
The MSCI EM Index is a market capitalization weighted index composed of over 800 companies representative of the market structure of emerging countries in Europe, Latin America, Africa, Middle East and Asia. The MSCI EM Index excludes closed markets and those shares in otherwise free markets that are not purchasable by foreigners. Index weightings represent the relative capitalizations of the major overseas markets included in the index on a U.S. dollar adjusted basis.
The unmanaged Index differs from the Fund in composition, does not pay management fees or expenses and includes reinvested dividends. One cannot invest directly in an index. Since markets can go down as well as up, investment return and principal value will fluctuate with market conditions, currency volatility and the social, economic and political climates of countries where the Fund invests. You may have a gain or loss when you sell your shares.
41
EMERGING MARKETS FUND
SCHEDULE OF INVESTMENTS (Unaudited)
As of September 30, 2008
| Number of | |||||||
| Shares | Value | ||||||
Common Stock - 86.3% | |||||||
Argentina - 0.6% | |||||||
| Petrobras Energia Participaciones SA - ADR | 8,600 | $ | 84,624 | ||||
Brazil - 12.5% | |||||||
| Banco Itau Holding Financeira SA - ADR | 8,250 | 144,375 | |||||
| Brasil Telecom Participacoes SA - ADR | 2,200 | 107,492 | |||||
| Centrais Eletricas Brasileiras SA | 7,000 | 102,698 | |||||
Compania de Saneamento de Minas Gerais-COPASA | 3,600 | 37,326 | |||||
| Eletropaulo Metropolitana Eletricidade de Sao Paulo SA | 5,440 | 74,735 | |||||
| Petroleo Brasileiro SA - ADR | 8,800 | 386,760 | |||||
| Petroleo Brasileiro SA - ADR | 16,000 | 598,659 | |||||
| Tele Norte Leste Participacoes SA - ADR | 14,100 | 246,186 | |||||
| Unibanco - Uniao de Bancos Brasileiros SA - GDR | 600 | 60,552 | |||||
| 1,758,783 | |||||||
Colombia - 1.1% | |||||||
| BanColombia SA | 6,325 | 45,320 | |||||
| Ecopetrol SA | 97,371 | 114,423 | |||||
| 159,743 | |||||||
Egypt - 0.9% | |||||||
| Orascom Construction Industries | 2,188 | 126,766 | |||||
Hong Kong - 2.0% | |||||||
| BOC Hong Kong Holdings, Ltd. | 95,500 | 169,765 | |||||
| China Agri-Industries Holdings, Ltd.* | 131,000 | 69,005 | |||||
| China Pharmaceutical Group, Ltd. | 112,000 | 36,598 | |||||
| 275,368 | |||||||
India - 3.6% | |||||||
| Bank of India | 7,924 | 49,013 | |||||
| Chambal Fertilizers & Chemicals, Ltd. | 64,580 | 75,841 | |||||
| Housing Development Finance Corp. | 1,449 | 65,816 | |||||
| Infosys Technologies, Ltd. - ADR | 1,400 | 46,634 | |||||
| Mercator Lines, Ltd. | 41,853 | 50,098 | |||||
| Reliance Capital, Ltd. | 3,052 | 74,650 | |||||
| Sesa GOA, Ltd. | 15,360 | 39,685 | |||||
| Tata Steel, Ltd. | 10,838 | 99,488 | |||||
| 501,225 | |||||||
Indonesia - 0.3% | |||||||
| Bank Central Asia Tbk PT | 118,000 | 40,107 | |||||
Israel - 4.6% | |||||||
| Bank Leumi Le-Israel BM | 52,677 | 187,009 | |||||
| Bezeq Israeli Telecommunication Corp., Ltd. | 24,145 | 43,040 | |||||
| Israel Chemicals, Ltd. | 18,403 | 273,219 | |||||
| The Israel Corp., Ltd. | 180 | 136,066 | |||||
| 639,334 | |||||||
Kuwait - 0.9% | |||||||
| Global Investment House KSCC - GDR 144A** | 9,000 | 130,500 | |||||
Malaysia - 0.4% | |||||||
| Kulim Malaysia Berhad | 18,200 | 29,335 | |||||
| Lion Industries Corp. Berhad | 71,300 | 26,119 | |||||
| 55,454 | |||||||
Mexico - 4.8% | |||||||
| Alfa SAB de CV | 17,900 | 80,154 | |||||
| Fomento Economico Mexicano SAB de CV | 48,800 | 185,786 | |||||
| Grupo Carso SAB de CV | 10,200 | 38,804 | |||||
| Grupo Mexico SAB de CV Cl. B | 96,841 | 101,359 | |||||
| Telefonos de Mexico SAB de CV - ADR | 10,400 | 267,800 | |||||
| 673,903 | |||||||
Pakistan - 0.3% | |||||||
| Pakistan Petroleum, Ltd. | 16,940 | 41,922 | |||||
Peru - 0.4% | |||||||
| Credicorp, Ltd. | 1,000 | 62,250 | |||||
Poland - 2.2% | |||||||
| Polski Koncern Naftowy Orlen | 10,425 | 152,684 | |||||
| Telekomunikacja Polska SA | 15,852 | 154,081 | |||||
| 306,765 | |||||||
Republic of China - 12.1% | |||||||
| Bank of China, Ltd. | 403,000 | 155,393 | |||||
| Bank of Communications Co., Ltd. | 128,000 | 115,944 | |||||
| Chaoda Modern Agriculture | 86,000 | 72,841 | |||||
| China Construction Bank Corp. | 741,000 | 488,151 | |||||
| China COSCO Holdings Co., Ltd. | 71,000 | 63,756 | |||||
| China Life Insurance Co., Ltd. | 40,000 | 149,270 | |||||
| China Merchants Bank Co., Ltd. | 17,000 | 40,486 | |||||
| China Unicom, Ltd. | 18,000 | 27,245 | |||||
| CNOOC, Ltd. | 129,000 | 149,224 | |||||
| Dongfeng Motor Group Co., Ltd. | 80,000 | 29,070 | |||||
| Industrial & Commercial Bank of China | 391,300 | 234,251 | |||||
| Tencent Holdings, Ltd. | 19,600 | 142,185 | |||||
| Yanzhou Coal Mining Co., Ltd. | 34,000 | 35,553 | |||||
| 1,703,369 | |||||||
Russian Federation - 4.4% | |||||||
| Evraz Group SA - GDR | 2,680 | 101,304 | |||||
| Gazprom OAO - ADR | 2,772 | 85,793 | |||||
| LUKOIL - ADR | 2,800 | 167,300 | |||||
| Novolipetsk Steel OJSC - GDR | 2,200 | 40,854 | |||||
| Sberbank | 49,125 | 84,495 | |||||
| Vimpel-Communications - ADR | 6,700 | 136,010 | |||||
| 615,756 | |||||||
South Africa - 9.2% | |||||||
| African Rainbow Minerals, Ltd. | 6,169 | 116,814 | |||||
| ArcelorMittal South Africa, Ltd. | 15,883 | 314,566 | |||||
| Aveng, Ltd. | 21,572 | 162,819 | |||||
| Grindrod, Ltd. | 16,086 | 34,578 | |||||
| Remgro, Ltd. | 10,015 | 229,795 | |||||
| Sanlam, Ltd. | 46,679 | 99,213 | |||||
| Sasol, Ltd. | 7,784 | 328,914 | |||||
| 1,286,699 |
See Accompanying Notes to Financial Statements.
42
SCHEDULE OF INVESTMENTS (Unaudited)
As of September 30, 2008
| Number of | |||||||
| Shares | Value | ||||||
South Korea - 12.7% | |||||||
| Dongkuk Steel Mill Co., Ltd. | 2,340 | $ | 71,814 | ||||
| Hyundai Motor Co. | 2,834 | 177,572 | |||||
| Industrial Bank Of Korea | 3,080 | 37,022 | |||||
| Kolon Industries, Inc.* | 2,250 | 65,503 | |||||
| Korea Gas Corp. | 505 | 29,490 | |||||
| Korea Line Corp. | 577 | 74,029 | |||||
| LG Chem, Ltd. | 1,792 | 140,392 | |||||
| LG Corp. | 8,430 | 437,656 | |||||
| LG Micron, Ltd.* | 1,249 | 39,183 | |||||
| LG Telecom, Ltd. | 9,700 | 81,947 | |||||
| POSCO | 413 | 155,618 | |||||
| Samsung Electronics Co., Ltd. | 453 | 208,149 | |||||
| Shinhan Financial Group Co., Ltd. | 5,272 | 188,312 | |||||
| SK Holdings Co., Ltd. | 801 | 74,430 | |||||
| 1,781,117 | |||||||
Taiwan - 7.0% | |||||||
| Acer, Inc. | 164,000 | 277,096 | |||||
| China Development Financial Holding Corp. | 188,600 | 56,904 | |||||
| Chong Hong Construction Co. | 18,000 | 16,064 | |||||
| Chunghwa Telecom Co., Ltd.* | 35,000 | 83,035 | |||||
| Compal Electronics, Inc. | 1,030 | 752 | |||||
| Gigabyte Technology Co., Ltd. | 99,000 | 50,936 | |||||
| HTC Corp. | 2,000 | 30,807 | |||||
| Hua Nan Financial Holdings Co., Ltd. | 165,240 | 101,285 | |||||
| Huaku Development Co., Ltd. | 37,950 | 44,776 | |||||
| Lite-On Technology Corp. | 117,000 | 101,257 | |||||
| Polaris Securities Co., Ltd. | 11,480 | 4,503 | |||||
| POU Chen Corp. | 110,000 | 67,775 | |||||
| Quanta Computer, Inc. | 100,940 | 125,347 | |||||
| USI Corp. | 74,000 | 27,497 | |||||
| 988,034 | |||||||
Thailand - 2.9% | |||||||
| PTT Exploration & Production PCL | 23,000 | 87,526 | |||||
| PTT PCL | 42,200 | 288,307 | |||||
| Thoresen Thai Agencies PCL | 41,400 | 31,944 | |||||
| 407,777 | |||||||
Turkey - 3.3% | |||||||
| Eczacibasi Ilac Sanayi | 23,986 | 22,295 | |||||
| Gubre Fabrikalari TAS | 1,815 | 50,611 | |||||
| KOC Holding AS | 28,776 | 91,172 | |||||
| Tekfen Holding AS* | 7,184 | 41,516 | |||||
| Tupras Turkiye Petrol Rafine | 8,984 | 171,367 | |||||
| Turk Hava Yollari* | 17,031 | 90,851 | |||||
| 467,812 | |||||||
| Total Common Stock (Cost: $15,722,830) | 12,107,308 | ||||||
Equity-Linked Securities - 0.3% | |||||||
Luxembourg - 0.3% | |||||||
| Merrill Lynch Arabtech Holding Co.- 1/12/10* (Cost: $69,381) | 13,822 | 47,036 | |||||
Preferred Stock - 2.2% | |||||||
Brazil - 2.2% | |||||||
| Metalurgica Gerdau SA Cl. A | 9,800 | 150,890 | |||||
| Usinas Siderurgicas de Minas Gerais SA | 7,550 | 158,558 | |||||
| 309,448 | |||||||
| Total Preferred Stock (Cost: $349,316) | 309,448 | ||||||
Principal Amount | Value | ||||||
Short Term Investments - 4.2% | |||||||
Time Deposit - 4.2% | |||||||
Brown Brothers Harriman & Co. 9.950%, 10/01/08 ZAR | 6 | $ | 1 | ||||
Brown Brothers Harriman & Co. - Grand Cayman 3.470%, 10/01/08 | $ | 595,551 | 595,551 | ||||
Brown Brothers Harriman & Co. - Grand Cayman 0.844%, 10/02/08 HKD | 4 | 1 | |||||
| Total Short Term Investments (Cost: $595,553) | 595,553 | ||||||
| Total Investments - 93.0% (Cost: $16,667,699) | 13,059,345 | ||||||
| Other Assets In Excess Of Liabilities - 7.0% | 977,601 | ||||||
| Net Assets - 100.0% | $ | 14,036,946 |
| * | Non-income producing securities. |
| ** | 144A Security. Certain condition for public sale may exist. The total market value of 144A securities owned at September 30, 2008 was $130,500 or 0.93% of net assets. |
ADR - American Depository Receipt
GDR - Global Depository Receipt
| SCHEDULE OF INVESTMENTS BY SECTOR | ||||
| as of September 30, 2008 | ||||
| Percent of | ||||
| Sector | Net Assets | |||
| Financial | 21.5 | % | ||
| Energy | 19.7 | |||
| Basic Materials | 14.3 | |||
| Communications | 9.2 | |||
| Diversified | 6.6 | |||
| Technology | 6.0 | |||
| Industrial | 4.2 | |||
| Consumer, Non-cyclical | 3.0 | |||
| Consumer, Cyclical | 2.6 | |||
| Utilities | 1.7 | |||
| Short Term Investments | 4.2 | |||
| Total Investments | 93.0 | |||
| Other assets in excess of liabilities | 7.0 | |||
| Net Assets | 100.0 | % | ||
See Accompanying Notes to Financial Statements.
43
INTERNATIONAL SYSTEMATIC FUND
Management Team: Kunal Ghosh, Portfolio Manager; Steven Tael, Ph.D., CFA, Portfolio Manager
Chief Investment Officer: Horacio A. Valeiras, CFA
Goal: The International Systematic Fund seeks to maximize long-term capital appreciation through investments primarily in companies located in the developed countries represented in the MSCI EAFE Index. The Investment Adviser identifies investment opportunities using a quantitative model that integrates stock, sector, country and currency selection decisions.
Market Overview: Stocks in developed non-U.S. markets generated declines in local currencies during the six months ended September 30, 2008. A broad-based strengthening in the U.S. dollar accentuated losses in dollar terms.
The MSCI EAFE Index finished the first half of the period only modestly lower. Gains in April and May were overshadowed by a sell-off in June that was driven by concerns about rising inflation. Buoyed by strong demand from emerging countries, the price of oil rose 38% in the second quarter of 2008, the biggest three-month increase in nine years.
Inflation fears receded over the summer, as weak economic data and deterioration in the credit markets took center stage. Overcome by mortgage-related losses, a major U.S. securities firm filed for bankruptcy, and several other U.S. financials with a global reach were taken over by the government or sold. Banks became afraid to lend, the global credit markets froze and equity prices plummeted. Any hopes that the worst of the turmoil would be confined to the United States evaporated in late September, when several European financials were rescued by their respective governments.
During the period, every country and sector in the MSCI EAFE Index declined. The most resilient were Switzerland, viewed as a banking safe haven, and health care, a traditionally defensive sector.
Performance: The Fund’s Class I shares generated a 23.58% loss from April 1 through September 30, 2008. The MSCI EAFE Index declined 22.03%.
Portfolio Specifics: The main reason the Fund trailed the index was stock selection in Japan and the consumer discretionary sector. Two of the biggest detractors in the portfolio were a maker of Japanese pinball machines that faced sluggish demand and a Japan-based commercial transportation and logistics firm that was hurt by high fuel prices. Other areas of relative weakness included stock selection in Switzerland and Australia, as well as an underweight in Switzerland.
On the positive side, relative results benefited from stock selection in Hong Kong, Italy and the telecommunication services sector. For example, our position in Sweden-based Millicom International Cellular produced a strong gain for the Fund. Millicom is a holding company for a number of wireless providers in emerging countries and experienced robust subscriber growth. Consistent with the volatile market conditions, other names that performed well were AstraZeneca, a U.K.-based pharmaceutical firm, and WM Morrison Supermarkets, a U.K.-based grocery chain.
As the result of our risk-controlled approach to portfolio construction, the Fund’s holdings were broadly diversified throughout the period. On September 30, the largest overweights versus the MSCI EAFE Index were in Spain (+3.2%) and the energy sector (+1.0%). The largest underweights were in Germany (-4.7%) and financials (-5.4%).
Market Outlook: Our process evaluates investment opportunities on a relative basis. As such, the process neither utilizes nor results in a forecast or outlook on the overall market, but expects to perform equally well versus the MSCI EAFE Index in both up and down markets.
Through consistent application of our systematic, model-driven process, we believe that the Fund will deliver strong, long-term performance.
Comparison of Change in Value of a $250,000 Investment in International Systematic Fund Class I, II and III Shares with the MSCI EAFE Index.


| Annualized Total Returns As of 9/30/08 | |||||||
Since | |||||||
1 Year | Inception | ||||||
International Systematic Fund Class I | -35.59% | 4.10% | |||||
| MSCI EAFE Index | -30.13% | 4.71% | |||||
44
INTERNATIONAL SYSTEMATIC FUND


| Annualized Total Returns As of 9/30/08 | |||||||
Since | |||||||
1 Year | Inception | ||||||
International Systematic Fund Class II | -35.51% | 4.15% | |||||
| MSCI EAFE Index | -30.13% | 4.71% | |||||
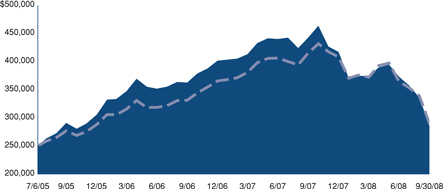

| Annualized Total Returns As of 9/30/08 | |||||||
Since | |||||||
1 Year | Inception | ||||||
International Systematic Fund Class III | -35.37% | 4.25% | |||||
| MSCI EAFE Index | -30.13% | 4.71% | |||||
The graphs above show the value of a hypothetical $250,000 investment in the Fund’s Class I, II and III shares with the MSCI EAFE Index for the periods indicated. Average annual total return figures include changes in principal value, reinvested dividends, and capital gain distributions. The Class I shares commenced operations on July 6, 2005 and Class II and III shares on December 22, 2006. The historical performance of Class II and III shares includes the performance of Class I shares for the periods prior to the inception of Class II and III shares. The total returns shown above do not show the effects of income taxes on an individuals’ investment. In most cases, taxes may reduce your actual investment returns on income or gains paid by the Fund or any gains you may realize if you sell your shares. Past performance cannot guarantee future results.
The MSCI EAFE Index is an unmanaged index comprised of over 900 companies and is a generally accepted benchmark for major overseas markets. Index weightings represent the relative capitalizations of the major overseas markets included in the Index on a U.S. dollar adjusted basis. The unmanaged Index differs from the Fund in composition, does not pay management fees or expenses and includes reinvestment dividends. One cannot invest directly in an index.
Since markets can go down as well as up, investment return and principal value will fluctuate with market conditions, currency volatility and the social, economic and political climates of countries where the Fund invests. You may have a gain or loss when you sell your shares.
45
INTERNATIONAL SYSTEMATIC FUND
SCHEDULE OF INVESTMENTS (Unaudited)
As of September 30, 2008
| Number of | |||||||
| Shares | Value | ||||||
Common Stock - 85.3% | |||||||
Australia - 2.4% | |||||||
| BHP Billiton, Ltd | 26,278 | $ | 653,715 | ||||
| Incitec Pivot, Ltd.* | 120,080 | 488,554 | |||||
| Rio Tinto, Ltd | 6,246 | 423,538 | |||||
| 1,565,807 | |||||||
Austria - 0.3% | |||||||
| Voestalpine AG | 6,073 | 187,895 | |||||
Belgium - 0.5% | |||||||
| Euronav NV | 12,790 | 354,275 | |||||
Bermuda - 0.2% | |||||||
| Seadrill, Ltd. | 6,800 | 140,056 | |||||
France - 7.4% | |||||||
| Alstom SA | 5,408 | 406,511 | |||||
| BNP Paribas | 22,808 | 2,147,074 | |||||
| France Telecom SA | 31,289 | 882,565 | |||||
| Total SA | 15,935 | 966,602 | |||||
| Unibail-Rodamco - REIT | 1,195 | 241,943 | |||||
| Vallourec SA | 1,241 | 267,061 | |||||
| 4,911,756 | |||||||
Germany - 4.4% | |||||||
| BASF SE | 14,191 | 681,300 | |||||
| Bayer AG | 5,777 | 425,681 | |||||
| Deutsche Boerse AG | 5,350 | 486,074 | |||||
| E.ON AG | 15,853 | 802,360 | |||||
| K+S AG | 2,826 | 195,532 | |||||
| RWE AG | 3,124 | 299,962 | |||||
| 2,890,909 | |||||||
Greece - 0.6% | |||||||
| Alpha Bank AE | 19,552 | 423,856 | |||||
Hong Kong - 1.6% | |||||||
| Hang Seng Bank, Ltd. | 40,100 | 756,338 | |||||
| Noble Group, Ltd. | 290,600 | 273,744 | |||||
| 1,030,082 | |||||||
Italy - 4.2% | |||||||
| Enel SpA | 129,918 | 1,089,786 | |||||
| ENI SpA | 32,010 | 847,920 | |||||
| Intesa Sanpaolo SpA | 73,743 | 403,807 | |||||
| Unipol Gruppo Finanziario SpA | 195,451 | 416,693 | |||||
| 2,758,206 | |||||||
Japan - 19.0% | |||||||
| Canon, Inc. | 14,000 | 515,569 | |||||
| FamilyMart Co., Ltd. | 5,800 | 249,937 | |||||
| Fast Retailing Co., Ltd. | 5,500 | 559,385 | |||||
| Fuji Heavy Industries, Ltd. | 210,000 | 1,054,757 | |||||
| Fujitsu, Ltd. | 60,000 | 337,222 | |||||
| Hitachi Maxell, Ltd. | 17,000 | 183,390 | |||||
| Hitachi, Ltd. | 122,000 | 844,461 | |||||
| Honda Motor Co., Ltd | 23,500 | 700,038 | |||||
| INPEX CORP | 48 | 414,615 | |||||
| Kubota Corp. | 48,000 | 299,855 | |||||
| Makita Corp. | 16,400 | 332,034 | |||||
| Mazda Motor Corp. | 164,900 | 664,496 | |||||
Mitsui Sumitomo Insurance Group Holdings, Inc. | 8,300 | 279,254 | |||||
| Mitsui OSK Lines, Ltd | 25,700 | 219,018 | |||||
| Nikon Corp. | 16,000 | 378,675 | |||||
| Nintendo Co., Ltd | 2,000 | 836,788 | |||||
| Nippon Telegraph & Telephone Corp. | 45 | 203,461 | |||||
| Nippon Yusen KK | 101,100 | 651,063 | |||||
| ORIX Corp. | 1,590 | 192,829 | |||||
| Panasonic Corp. | 48,000 | 830,618 | |||||
| Ricoh Co., Ltd. | 33,000 | 460,339 | |||||
| Rinnai Corp. | 10,800 | 444,577 | |||||
| Sanyo Electric Co., Ltd.* | 170,000 | 293,358 | |||||
| Seiko Epson Corp. | 11,500 | 267,738 | |||||
| Seven & I Holdings Co., Ltd. | 25,400 | 733,375 | |||||
| SFCG Co., Ltd. | 4,130 | 186,732 | |||||
| Tokio Marine Holdings, Inc. | 5,082 | 183,232 | |||||
| Toyo Suisan Kaisha, Ltd. | 10,100 | 258,999 | |||||
| 12,575,815 | |||||||
Luxembourg - 1.1% | |||||||
| Arcelor Mittal | 14,716 | 737,044 | |||||
Netherlands - 2.5% | |||||||
| European Aeronautic Defence & | |||||||
| Space Co. NV | 25,030 | 427,885 | |||||
| ING Groep NV | 5,691 | 121,041 | |||||
| Koninklijke Boskalis Westminster NV | 9,522 | 449,809 | |||||
| Koninklijke DSM NV | 14,377 | 683,147 | |||||
| 1,681,882 | |||||||
Norway - 0.5% | |||||||
| Yara International ASA | 8,800 | 307,895 | |||||
Portugal - 0.9% | |||||||
| Jeronimo Martins SGPS SA | 67,915 | 572,381 | |||||
Republic of China - 0.2% | |||||||
| Industrial & Commercial Bank of China | 265,000 | 158,641 | |||||
Spain - 7.3% | |||||||
| Banco Santander SA | 124,090 | 1,855,681 | |||||
| Mapfre SA | 271,462 | 1,186,929 | |||||
| Telefonica SA | 74,407 | 1,779,270 | |||||
| 4,821,880 | |||||||
Sweden - 2.9% | |||||||
| Alfa Laval AB | 58,200 | 595,934 | |||||
| Nordea Bank AB | 45,800 | 541,396 | |||||
| Oriflame Cosmetics SA - SDR | 9,550 | 441,953 | |||||
| Securitas AB Cl. B | 28,200 | 315,469 | |||||
| 1,894,752 | |||||||
Switzerland - 6.5% | |||||||
| ABB, Ltd* | 46,930 | 896,843 | |||||
| Actelion, Ltd.* | 9,313 | 481,169 | |||||
| Compagnie Financiere Richemont SA | 4,375 | 193,579 | |||||
| Swiss Reinsurance | 5,823 | 319,821 | |||||
| Syngenta AG | 3,450 | 740,467 | |||||
| Synthes, Inc. | 1,511 | 210,551 | |||||
| Zurich Financial Services AG | 5,235 | 1,449,473 | |||||
| 4,291,903 | |||||||
United Kingdom - 23.1% | |||||||
| Aggreko PLC | 32,470 | 318,673 | |||||
| Anglo American PLC | 15,339 | 513,812 | |||||
| AstraZeneca PLC | 43,641 | 1,938,621 | |||||
| BAE Systems PLC | 94,496 | 703,030 | |||||
| BG Group PLC | 34,422 | 629,644 | |||||
| BP PLC | 68,272 | 572,036 | |||||
| British American Tobacco PLC | 28,523 | 945,136 | |||||
| Charter PLC | 16,953 | 189,343 | |||||
| Cobham PLC | 95,147 | 326,275 | |||||
| Compass Group PLC | 47,806 | 296,964 | |||||
| Cookson Group PLC | 44,281 | 372,620 | |||||
See Accompanying Notes to Financial Statements.
46
SCHEDULE OF INVESTMENTS (Unaudited)
As of September 30, 2008
| Number of | |||||||
| Shares | Value | ||||||
| Diageo PLC | 27,132 | $ | 462,995 | ||||
| Drax Group PLC | 12,922 | 175,473 | |||||
| Game Group PLC | 39,746 | 147,133 | |||||
| GlaxoSmithKline PLC | 19,503 | 426,490 | |||||
| Imperial Tobacco Group PLC | 13,352 | 433,269 | |||||
| Man Group PLC | 49,613 | 301,694 | |||||
| Mondi PLC | 31,389 | 146,238 | |||||
| Prudential PLC | 57,303 | 525,142 | |||||
| Rio Tinto PLC | 5,200 | 325,928 | |||||
| Royal Bank of Scotland Group | 92,846 | 300,109 | |||||
| Royal Dutch Shell PLC Cl. A | 33,086 | 966,687 | |||||
| Royal Dutch Shell PLC Cl. B | 44,966 | 1,281,310 | |||||
| RSA Insurance Group PLC | 94,201 | 253,457 | |||||
| Smith & Nephew PLC | 27,466 | 293,120 | |||||
| Stagecoach Group PLC | 165,983 | 753,066 | |||||
| Standard Chartered PLC | 30,132 | 731,835 | |||||
| Standard Life PLC | 60,353 | 261,561 | |||||
| Vodafone Group PLC | 311,973 | 691,233 | |||||
| 15,282,894 | |||||||
| Total Common Stock (Cost: $69,422,906) | 56,587,929 | ||||||
| Principal | |||||||
| Amount | |||||||
Short Term Investments - 13.0% | |||||||
Time Deposit - 13.0% | |||||||
| Bank of America London | |||||||
| 3.470%, 10/01/08 | $ | 8,343,115 | 8,343,115 | ||||
| Citibank London | |||||||
| 3.102%, 10/01/08 EUR | 92,829 | 130,382 | |||||
| JP Morgan Chase London | |||||||
| 0.010%, 10/01/08 JPY | 15,196,272 | 143,179 | |||||
| Total Short Term Investments (Cost: $8,616,676) | 8,616,676 | ||||||
| Total Investments - 98.3% (Cost: $78,039,582) | 65,204,605 | ||||||
| Other Assets In Excess Of Liabilities - 1.7% | 1,106,498 | ||||||
| Net Assets - 100.0% | $ | 66,311,103 | |||||
* Non-income producing securities. | |||||||
SDR - Swedish Depository Receipt | |||||||
REIT - Real Estate Investment Trust |
| SCHEDULE OF INVESTMENTS BY SECTOR | ||||
| as of September 30, 2008 | ||||
| Sector | Percent of Net Assets | |||
| Financial | 20.7 | % | ||
| Industrial | 13.9 | |||
| Consumer, Non-cyclical | 10.7 | |||
| Basic Materials | 9.8 | |||
| Consumer, Cyclical | 9.5 | |||
| Energy | 8.6 | |||
| Communications | 5.4 | |||
| Utilities | 3.6 | |||
| Technology | 2.7 | |||
| Diversified | 0.4 | |||
| Short Term Investments | 13.0 | |||
| Total Investments | 98.3 | |||
| Other assets in excess of liabilities | 1.7 | |||
| Net Assets | 100.0 | % | ||
See Accompanying Notes to Financial Statements.
47
INTERNATIONAL ALL CAP GROWTH FUND
Management Team: Horacio A. Valeiras, CFA, Portfolio Manager and Chief Investment Officer; Pedro V. Marcal, Portfolio Manager
Goal: The International All Cap Growth Fund seeks to maximize long-term capital appreciation through investments primarily in companies with above-average earnings growth and positioned in strong growth areas.
Market Overview: Developed non-U.S. stock markets were weak during the six months ended September 30, 2008. Losses were broad-based, with every country in the MSCI EAFE Index posting a negative return in local currencies. The U.S. dollar appreciated versus a basket of currencies, which accentuated the declines in dollar terms.
The period began with gains, fueled by optimism that the worst of the U.S.-led credit crisis might be over. However, international equities sold off in June, largely due to inflation fears, and remained under pressure throughout the rest of the period as the credit problems in the United States intensified. Overwhelmed by mortgage-related losses, the U.S. investment banking industry collapsed in September, causing a global credit freeze and darkening the outlook for the world economy.
European financials were also under considerable stress, and several institutions were rescued by their respective governments. To help stabilize the sector, the region’s central banks added extra liquidity to the money markets, and U.K. officials temporarily banned short selling of financial stocks. Euro area economies showed signs of rapid deterioration, with quarterly GDP contracting for the first time since the 1999 introduction of the common currency.
Japanese equities approached a four-year low, as data showed that the country’s financial companies had significant exposure to a U.S. securities firm that went bankrupt. In addition, lending standards tightened, business failures increased and consumer sentiment slumped to a record low. In September, the Bank of Japan set aside $60 billion to bolster troubled local and overseas financial firms.
Performance: During the six months ended September 30, 2008, the Fund’s Class I shares posted a 20.40% loss. The MSCI EAFE Growth Index, the Fund’s primary benchmark, fell 21.68%, and the MSCI EAFE Index was down 22.03%.
Portfolio Specifics: Relative performance was helped by stock selection in Ireland and Hong Kong. Two of the Fund’s top contributors were Ireland-based Icon, a contract research organization serving the pharmaceutical and biotechnology industries, and HongKong Electric, a utility. Icon experienced strong growth in a robust demand environment, as more companies seek to lower the time and cost of drug development by outsourcing. HongKong Electric continued to pursue its international growth strategy by acquiring a 50% stake in New Zealand’s fourth-largest electricity distribution network.
A lack of exposure to Norway, one of the worst-performing countries in the indexes, was another plus. Energy companies represent a large percentage of Norway’s stock market capitalization, and the 28% drop in the price of oil from July through September was a significant headwind.
Areas of relative weakness included stock selection in Japan and France and exposure to emerging countries, which lagged their developed market counterparts in the risk-averse environment.
Market Outlook: We expect international stock markets to remain volatile as investors digest the implications of the U.S. government’s $700 billion bank rescue plan, as well as other aggressive steps taken by authorities around the world. Combined, these efforts may restore confidence in the financial system and, in turn, loosen up the credit markets and stimulate the global economy. Still, the real impact of these policy actions is likely to be measured in months and years rather than days and weeks.
In this dynamic environment, the consistent application of our investment process is more important than ever. We thus remain focused on identifying positive changes taking place within individual companies, which we believe will benefit the Fund over time.
Comparison of Change in Value of a $250,000 Investment in International All Cap Growth Fund Class I Shares with the MSCI EAFE Growth Index and MSCI EAFE Index.
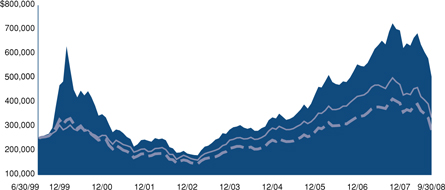

| Annualized Total Returns As of 9/30/08 | ||||||||||
Since | ||||||||||
1 Year | 5 Years | Inception | ||||||||
International All Cap Growth Fund Class I | -27.04% | 14.98% | 7.86% | |||||||
| MSCI EAFE Growth Index | -28.19% | 9.59% | 1.42% | |||||||
| MSCI EAFE Index | -30.13% | 10.16% | 3.25% | |||||||
The graph above shows the value of a hypothetical $250,000 investment in the Fund’s Class I shares compared with the MSCI EAFE Growth Index and MSCI EAFE Index for the periods indicated. Average annual total return figures include changes in principal value, reinvested dividends, and capital gain distributions. The total returns shown above do not show the effects of income taxes on an individual’s investment. In most cases, taxes may reduce your actual investment returns on income or gains paid by the Fund or any gains you may realize if you sell your shares. Past performance cannot guarantee future results.
48
INTERNATIONAL ALL CAP GROWTH FUND
On November 18, 2005, the Fund became the successor entity to the Nicholas-Applegate International All Cap Growth Fund, a series of the Professionally Managed Portfolios (“Acquired Fund”). The Acquired Fund transferred all of its assets and liabilities in exchange for shares of the Fund, and the investment objectives, policies and limitations of the Fund are substantially similar to those of the Acquired Fund. The performance shown above includes the historical performance of the Acquired Fund from June 30, 1999 to November 18, 2005.
The MSCI EAFE Growth Index is an unmanaged index that is a generally accepted benchmark for major overseas markets. It consists of the top 50% of the MSCI EAFE, those companies with the highest Price/Book Value ratio. The MSCI EAFE Index consists of approximately 900 companies with average market capitalization of U.S. $8.7 billion. Its weightings represent the relative capitalization of the major overseas markets included in the index on a U.S. dollar adjusted basis. The unmanaged indexes differ from the Fund in composition, do not pay management fees or expenses and include reinvested dividends. One cannot invest directly into an index.
Since markets can go down as well as up, investment return and principal value will fluctuate with market conditions, currency volatility and the social, economic and political climates of countries where the Fund invests. You may have a gain or loss when you sell your shares.
49
INTERNATIONAL ALL CAP GROWTH FUND
SCHEDULE OF INVESTMENTS (Unaudited)
As of September 30, 2008
| Number of | |||||||
| Shares | Value | ||||||
Common Stock - 92.1% | |||||||
Australia - 5.3% | |||||||
| AMP, Ltd. | 13,771 | $ | 77,136 | ||||
| CSL, Ltd. | 9,157 | 274,092 | |||||
| Incitec Pivot, Ltd.* | 29,699 | 120,833 | |||||
| Rio Tinto, Ltd | 982 | 66,589 | |||||
| 538,650 | |||||||
Belgium - 1.1% | |||||||
| InBev NV | 1,923 | 114,511 | |||||
Brazil - 1.6% | |||||||
| Bolsa de Mercadorias e Futuros - BM&F | 4,700 | 20,711 | |||||
| Cia Vale do Rio Doce Cl. B - ADR | 4,600 | 88,090 | |||||
| Unibanco - Uniao de Bancos | |||||||
| Brasileiros SA - GDR | 500 | 50,460 | |||||
| 159,261 | |||||||
Canada - 2.8% | |||||||
| Potash Corp. of Saskatchewan | 700 | 92,407 | |||||
| Rogers Communications, Inc. Cl. B | 3,200 | 103,898 | |||||
| Teck Cominco, Ltd. Cl. B | 3,100 | 88,113 | |||||
| 284,418 | |||||||
Denmark - 0.6% | |||||||
| Novo Nordisk AS Cl. B | 1,100 | 56,878 | |||||
Egypt - 0.5% | |||||||
| Orascom Construction Industries - GDR | 389 | 39,970 | |||||
| Orascom Construction Industries - GDR | 67 | 6,884 | |||||
| 46,854 | |||||||
Finland - 0.4% | |||||||
| Outotec OYJ | 1,638 | 43,866 | |||||
France - 8.4% | |||||||
| Alstom SA | 1,889 | 141,993 | |||||
| BNP Paribas | 1,261 | 118,707 | |||||
| Cie Generale de Geophysique-Veritas* | 2,668 | 84,150 | |||||
| Electricite de France | 706 | 51,228 | |||||
| GDF Suez | 4,266 | 221,821 | |||||
| Suez SA* | 457 | 11,387 | |||||
| Total SA | 2,245 | 136,180 | |||||
| Veolia Environnement | 2,172 | 89,314 | |||||
| 854,780 | |||||||
Germany - 8.8% | |||||||
| Deutsche Telekom AG | 4,659 | 71,377 | |||||
| E.ON AG | 4,938 | 249,924 | |||||
| Rhoen Klinikum AG | 2,314 | 67,808 | |||||
| RWE AG | 1,367 | 131,257 | |||||
| SAP AG | 2,495 | 133,696 | |||||
| Siemens AG | 762 | 71,269 | |||||
| Stada Arzneimittel AG | 2,352 | 94,617 | |||||
| United Internet AG | 6,855 | 73,914 | |||||
| 893,862 | |||||||
Greece - 1.6% | |||||||
| National Bank of Greece SA | 2,182 | 87,136 | |||||
| Piraeus Bank SA | 3,848 | 79,577 | |||||
| 166,713 | |||||||
Hong Kong - 1.3% | |||||||
| HongKong Electric Holdings | 16,000 | 101,430 | |||||
| Kerry Properties, Ltd. | 8,086 | 26,106 | |||||
| 127,536 | |||||||
Ireland - 0.8% | |||||||
| Icon PLC - ADR* | 2,000 | 76,500 | |||||
Israel - 1.3% | |||||||
| Teva Pharmaceutical Industries, Ltd. - ADR | 2,910 | 133,249 | |||||
Italy - 3.4% | |||||||
| Intesa Sanpaolo SpA | 21,094 | 115,508 | |||||
| Saipem SpA | 4,765 | 141,897 | |||||
| UniCredit SpA | 24,279 | 89,814 | |||||
| 347,219 | |||||||
Japan - 20.5% | |||||||
| Air Water, Inc. | 1,000 | 10,036 | |||||
| Capcom Co., Ltd. | 1,700 | 48,918 | |||||
| East JapanRailway Co. | 19 | 143,970 | |||||
| Honda Motor Co., Ltd | 2,700 | 80,430 | |||||
| Japan Tobacco, Inc. | 30 | 113,950 | |||||
| KDDI Corp. | 14 | 79,495 | |||||
| Kirin Holdings Co., Ltd. | 6,000 | 79,649 | |||||
| Mitsubishi Corp. | 4,400 | 91,410 | |||||
| Mitsubishi Electric Corp. | 8,200 | 54,624 | |||||
| Mitsubishi Estate Co., Ltd. | 2,000 | 38,754 | |||||
| Mitsubishi UFJ Financial Group, Inc. | 18,000 | 154,960 | |||||
| Mizuho Financial Group, Inc. | 27 | 115,049 | |||||
| Nintendo Co., Ltd | 500 | 209,197 | |||||
| Nitori Co., Ltd. | 1,350 | 81,211 | |||||
| Nomura Holdings, Inc. | 8,700 | 111,214 | |||||
| Secom Co., Ltd. | 1,200 | 50,323 | |||||
| Sumitomo Mitsui Financial Group, Inc. | 21 | 127,543 | |||||
| T&D Holdings, Inc. | 1,100 | 57,900 | |||||
| The Japan Steel Works, Ltd. | 6,700 | 82,870 | |||||
| Tokyo Electric Power Co., Inc. | 1,800 | 44,944 | |||||
| Toyo Tanso Co., Ltd. | 1,800 | 95,267 | |||||
| Toyota Motor Corp. | 1,800 | 76,005 | |||||
| Unicharm Corp. | 900 | 70,279 | |||||
| West Japan Railway Co. | 15 | 65,362 | |||||
| 2,083,360 | |||||||
Mexico - 0.4% | |||||||
| America Movil SAB de CV - ADR | 800 | 37,088 | |||||
Netherlands - 1.2% | |||||||
| Royal KPN NV | 8,182 | 118,797 | |||||
Peru - 0.4% | |||||||
| Credicorp, Ltd. | 600 | 37,350 | |||||
Republic of China - 0.2% | |||||||
China Communications Construction Co., Ltd. | 20,000 | 17,358 | |||||
Russian Federation - 0.7% | |||||||
| Evraz Group SA - GDR | 1,826 | 69,023 | |||||
Singapore - 1.6% | |||||||
| DBS Group Holdings, Ltd. | 14,000 | 166,386 | |||||
Spain - 1.8% | |||||||
| Banco Santander SA | 3,422 | 51,174 | |||||
| Iberdrola SA | 4,117 | 41,866 | |||||
| Telefonica SA | 3,925 | 93,857 | |||||
| 186,897 | |||||||
Switzerland - 8.1% | |||||||
| ACE, Ltd. | 3,100 | 167,803 | |||||
| Julius Baer Holding AG | 1,618 | 79,643 | |||||
| Nestle SA | 7,095 | 309,436 | |||||
| Roche Holding AG | 1,254 | 198,000 | |||||
| Syngenta AG | 322 | 69,110 | |||||
| 823,992 | |||||||
See Accompanying Notes to Financial Statements.
50
SCHEDULE OF INVESTMENTS (Unaudited)
As of September 30, 2008
| Number of | |||||||
| Shares | Value | ||||||
United Kingdom - 19.5% | |||||||
| BG Group PLC | 5,326 | $ | 97,426 | ||||
| BP PLC | 11,424 | 95,719 | |||||
| British American Tobacco PLC | 9,587 | 317,674 | |||||
| Diageo PLC | 8,434 | 143,922 | |||||
| HSBC Holdings PLC | 17,600 | 280,198 | |||||
| Imperial Tobacco Group PLC | 5,480 | 177,825 | |||||
| International Power PLC | 20,711 | 135,292 | |||||
| Reckitt Benckiser Group PLC | 2,326 | 113,868 | |||||
| Royal Dutch Shell PLC Cl. A | 3,263 | 95,336 | |||||
| SSL International PLC | 8,995 | 72,809 | |||||
| Standard Chartered PLC | 3,200 | 76,585 | |||||
| Unilever PLC | 5,873 | 161,413 | |||||
| Vodafone Group PLC | 48,980 | 108,524 | |||||
| Wellstream Holdings PLC* | 5,566 | 102,519 | |||||
| 1,979,110 | |||||||
| Total Common Stock (Cost: $10,949,411) | 9,363,658 | ||||||
Preferred Stock - 3.8% | |||||||
Brazil - 0.8% | |||||||
| Usinas Siderurgicas de Minas Gerais SA | 3,650 | 76,654 | |||||
Germany - 3.0% | |||||||
| Fresenius SE | 2,546 | 185,394 | |||||
| Henkel KGaA | 3,339 | 122,780 | |||||
| 308,174 | |||||||
| Total Preferred Stock (Cost: $490,703) | 384,828 | ||||||
Principal | |||||||
Amount | |||||||
Short Term Investments - 6.8% | |||||||
Time Deposit - 6.8% | |||||||
| Brown Brothers Harriman & Co. - Grand | |||||||
| Cayman 4.537%, 10/01/08 AUD | 1 | 1 | |||||
| Citibank London | |||||||
| 3.470%, 10/01/08 | $ | 689,167 | 689,167 | ||||
| Total Short Term Investments (Cost: $689,167) | 689,167 | ||||||
| Total Investments -102.6% (Cost: $12,129,281) | 10,437,653 | ||||||
| Liabilities In Excess Of Other Assets - (2.6%) | (267,116 | ) | |||||
| Net Assets - 100.0% | $ | 10,170,537 | |||||
* Non-income producing securities. | |||
ADR - American Depository Receipt | |||
GDR - Global Depository Receipt |
| SCHEDULE OF INVESTMENTS BY SECTOR | ||||
| as of September 30, 2008 | ||||
| Percent of | ||||
| Sector | Net Assets | |||
| Consumer, Non-cyclical | 28.8 | % | ||
| Financial | 20.9 | |||
| Utilities | 10.6 | |||
| Industrial | 7.5 | |||
| Energy | 7.4 | |||
| Communications | 6.8 | |||
| Basic Materials | 6.7 | |||
| Consumer, Cyclical | 5.3 | |||
| Technology | 1.8 | |||
| Short Term Investments | 6.8 | |||
| Total Investments | 102.6 | |||
| Liabilities in excess of other assets | (2.6 | ) | ||
| Net Assets | 100.0 | % | ||
See Accompanying Notes to Financial Statements.
51
U.S. HIGH YIELD BOND FUND
Management Team: Douglas G. Forsyth, CFA, Portfolio Manager; William L. Stickney, Portfolio Manager; Justin Kass, CFA, Portfolio Manager; Michael E. Yee, Portfolio Manager
Chief Investment Officer: Horacio A. Valeiras, CFA
Goal: The U.S. High Yield Bond Fund seeks to deliver total return via high current income and capital growth from a diversified portfolio consisting primarily of lower-rated U.S. corporate fixed-income securities.
Market Overview: The Merrill Lynch High Yield Master II Index posted a 7.84% loss during the six months ended September 30, 2008. By way of comparison, the high-yield market outperformed the S&P 500 Index, which fell 10.87%, but lagged the ten-year Treasury, which declined 1.26%.
After a difficult start to 2008, prices of high-yield securities rebounded in April and May, as investors believed the worst of the financial crisis was behind them. Several concerns, including rising inflation, helped send prices lower over the summer, although the market finished August with a slight gain. However, everything changed in September, when a number of large U.S. financial institutions ceased to exist as independent entities. Beyond the obvious uncertainty these failures caused, the rapid unwinding of the leveraged positions on their balance sheets had a direct impact on the high-yield market. These liquidations found few willing buyers, so even the smallest trades created big price moves. The dismal performance of investment-grade bonds exacerbated the selling pressure, and spreads between high-yield securities and comparable Treasuries widened more than 200 basis points. It is important to note that, for the most part, the negative performance was due to external factors and not any fundamental credit change in high-yield issuers.
Performance: During the six months ended September 30, 2008, the Fund’s Class I shares lost 4.11%, outperforming the Merrill Lynch High Yield Master II Index, which declined 7.84%.
Portfolio Specifics: Our underweighting of lower-quality issues was the primary driver of the Fund’s strong relative performance. Several highly rated issuers, such as financials, fell on troubled times, and avoiding them also helped our relative results.
Positive performers included a metal processing firm that was acquired and a manufacturer of utility meters that improved its credit profile by completing an equity offering. Negative performers included an automaker and retailer, which were hurt by broad-based weakness in their industries, as well as an energy company that was impacted by the steep drop in oil prices from mid-July through September.
Trading was limited during the period. The portfolio was well-positioned in higher-quality credits, as is always the case. There were no forced sales in the Fund due to market conditions or changes in credit quality.
Market Outlook: High-yield bonds offer a compelling total return for long-term investors. Spreads versus comparable Treasuries have surpassed the levels seen at the peak of the last credit cycle in October 2002. The market is likely to remain volatile given the uncertain outlook for the economy. However, many high-yield issuers remain fundamentally sound, the government has taken steps to stabilize the financial system and inflation pressures have abated. These factors, combined with the average spread in the market, suggest that high-yield bonds are near the lows for this cycle.
As always, we continue to build the Fund one security at a time, by using rigorous credit analysis to identify companies which are opportunistically capitalizing on change.
Comparison of Change in Value of a $250,000 Investment in U.S. High Yield Bond Fund Class I Shares with the Merrill Lynch High Yield Master II Index.
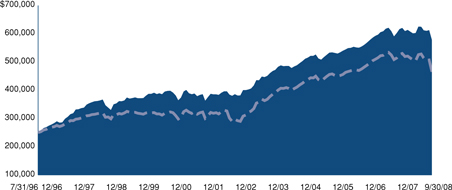

| Annualized Total Returns As of 9/30/08 | ||||||||||
1 Year | 5 Years | 10 Years | ||||||||
| U.S. High Yield Bond Fund Class I | -6.19% | 4.65% | 5.50% | |||||||
Merrill Lynch High Yield Master II Index | -11.64% | 4.26% | 4.32% | |||||||
The graph above shows the value of a hypothetical $250,000 investment in the Fund’s Class I shares compared with the Merrill Lynch High Yield Master II Index for the periods indicated. The Fund’s Class I shares calculate their performance based upon the historical performance of their corresponding series of Nicholas-Applegate Mutual Funds (renamed ING Mutual Funds), adjusted to reflect all fees and expenses applicable to the Fund’s Class I shares. The Nicholas-Applegate Institutional Funds’ Class I shares were first available on May 7, 1999. Average annual total return figures include changes in principal value, reinvested dividends, and capital gain distributions. The total returns shown above do not show the effects of income taxes on an individual’s investment. In most cases, taxes may reduce your actual investment returns on income or gains paid by the Fund or any gains you may realize if you sell your shares. Past performance cannot guarantee future results.
The Merrill Lynch High Yield Master II Index is an unmanaged index consisting of U.S. dollar denominated bonds that are issued in countries having a BBB3 or higher debt rating with at least one year remaining until maturity. All bonds must have a credit rating below investment grade but not in default.
The unmanaged Index differs from the Fund in composition, does not pay management fees or expenses and includes reinvested income and dividends. One cannot invest directly in an index.
Bond prices, and thus the Fund’s share price, generally move in the opposite direction from interest rates. Since markets can go down as well as up, investment return and principal value will fluctuate with market conditions. You may have a gain or loss when you sell your shares.
52
U.S. HIGH YIELD BOND FUND
SCHEDULE OF INVESTMENTS (Unaudited)
As of September 30, 2008
| Principal | |||||||
| Amount | Value | ||||||
Corporate Bonds - 92.8% | |||||||
Advertising Services - 0.2% | |||||||
| RH Donnelley, Inc. 144A* | |||||||
| 11.750%, 05/15/15 | $ | 184,000 | $ | 113,160 | |||
Aerospace/Defense-Equipment - 1.2% | |||||||
| TransDigm, Inc. | |||||||
| 7.750%, 07/15/14 | 645,000 | 609,525 | |||||
Agricultural Chemicals - 1.4% | |||||||
| The Mosaic Co. 144A* | |||||||
| 7.625%, 12/01/16 | 675,000 | 690,705 | |||||
Apparel Manufacturers - 2.8% | |||||||
| Levi Strauss & Co. | |||||||
| 9.750%, 01/15/15 | 810,000 | 704,700 | |||||
| Oxford Industries, Inc. | |||||||
| 8.875%, 06/01/11 | 705,000 | 640,669 | |||||
| 1,345,369 | |||||||
Auto/Truck Parts & Equipment-Original - 2.5% | |||||||
| Accuride Corp. | |||||||
| 8.500%, 02/01/15 | 910,000 | 582,400 | |||||
| Tenneco, Inc. | |||||||
| 8.625%, 11/15/14 | 820,000 | 656,000 | |||||
| 1,238,400 | |||||||
Auto/Truck Parts & Equipment-Replacement - 0.8% | |||||||
| Exide Technologies | |||||||
| 10.500%, 03/15/13 | 455,000 | 393,575 | |||||
Building Products-Cement/Aggregate - 0.9% | |||||||
| Texas Industries, Inc. 144A* | |||||||
| 7.250%, 07/15/13 | 510,000 | 446,250 | |||||
Cable TV - 5.5% | |||||||
| CCH I LLC/CCH I Capital Corp. | |||||||
| 11.000%, 10/01/15 | 505,000 | 335,825 | |||||
| DirecTV Holdings LLC/DirecTV | |||||||
| Financing Co. | |||||||
| 8.375%, 03/15/13 | 970,000 | 962,725 | |||||
| Echostar DBS Corp. | |||||||
| 7.125%, 02/01/16 | 1,000,000 | 807,500 | |||||
| Mediacom Broadband LLC/Mediacom | |||||||
| Broadband Corp. | |||||||
| 8.500%, 10/15/15 | 300,000 | 249,000 | |||||
| Mediacom LLC/Mediacom Capital Corp. | |||||||
| 9.500%, 01/15/13 | 375,000 | 337,500 | |||||
| 2,692,550 | |||||||
Cellular Telecommunications - 2.8% | |||||||
| Centennial Cellular Operating Co./ | |||||||
| Centennial Communications Corp. | |||||||
| 10.125%, 06/15/13 | 250,000 | 248,750 | |||||
| Centennial Communications Corp. | |||||||
| 10.000%, 01/01/13 | 260,000 | 256,100 | |||||
| Cricket Communications, Inc. | |||||||
| 9.375%, 11/01/14 | 710,000 | 663,850 | |||||
| Nextel Communications, Inc. | |||||||
| 7.375%, 08/01/15 | 340,000 | 224,527 | |||||
| 1,393,227 | |||||||
Commercial Services - 1.6% | |||||||
| ARAMARK Corp. | |||||||
| 8.500%, 02/01/15 | 835,000 | 789,075 | |||||
Commercial Services-Finance - 2.7% | |||||||
| Deluxe Corp. | |||||||
| 7.375%, 06/01/15 | 790,000 | 675,450 | |||||
| Lender Processing Services, Inc. 144A* | |||||||
| 8.125%, 07/01/16 | 670,000 | 656,600 | |||||
| 1,332,050 | |||||||
Computer Services - 1.4% | |||||||
| Unisys Corp. | |||||||
| 8.000%, 10/15/12 | 835,000 | 680,525 | |||||
Consumer Products-Miscellaneous - 1.2% | |||||||
| Jarden Corp. | |||||||
| 7.500%, 05/01/17 | 720,000 | 603,000 | |||||
Containers-Metal/Glass - 1.8% | |||||||
| Crown Americas LLC/Crown Americas | |||||||
| Capital Corp. | |||||||
| 7.750%, 11/15/15 | 905,000 | 886,900 | |||||
Data Processing/Management - 1.2% | |||||||
| First Data Corp. 144A* | |||||||
| 9.875%, 09/24/15 | 750,000 | 589,687 | |||||
Diversified Manufacturing Operations - 2.1% | |||||||
| Harland Clarke Holdings Corp. | |||||||
| 9.500%, 05/15/15 | 880,000 | 629,200 | |||||
| Park-Ohio Industries,Inc. | |||||||
| 8.375%, 11/15/14 | 495,000 | 394,763 | |||||
| 1,023,963 | |||||||
Diversified Operations - 1.4% | |||||||
| Kansas City Southern Railway | |||||||
| 8.000%, 06/01/15 | 670,000 | 663,300 | |||||
Electric-Generation - 1.1% | |||||||
| Edison Mission Energy | |||||||
| 7.000%, 05/15/17 | 605,000 | 547,525 | |||||
Electric-Integrated - 1.0% | |||||||
| Energy Future Holdings Corp. 144A* | |||||||
| 10.875%, 11/01/17 | 550,000 | 499,125 | |||||
Electronic Components-Semiconductors - 0.6% | |||||||
| Freescale Semiconductor, Inc. | |||||||
| 8.875%, 12/15/14 | 400,000 | 278,000 | |||||
Electronic Measure Instruments - 1.1% | |||||||
| Itron, Inc. | |||||||
| 7.750%, 05/15/12 | 525,000 | 523,687 | |||||
Filtration/Separation Products - 1.1% | |||||||
| Polypore, Inc. | |||||||
| 8.750%, 05/15/12 | 545,000 | 521,837 | |||||
Finance-Auto Loans - 2.6% | |||||||
| Ford Motor Credit Co. LLC | |||||||
| 7.000%, 10/01/13 | 670,000 | 425,450 | |||||
| Ford Motor Credit Co. LLC | |||||||
| 9.875%, 08/10/11 | 670,000 | 462,481 | |||||
| GMAC LLC | |||||||
| 6.750%, 12/01/14 | 965,000 | 370,735 | |||||
| 1,258,666 | |||||||
Independent Power Producer - 1.5% | |||||||
| NRG Energy, Inc. | |||||||
| 7.375%, 01/15/17 | 790,000 | 720,875 | |||||
See Accompanying Notes to Financial Statements.
53
U.S. HIGH YIELD BOND FUND
SCHEDULE OF INVESTMENTS (Unaudited)
As of September 30, 2008
| Principal | |||||||
| Amount | Value | ||||||
Machinery-Construction & Mining - 0.9% | |||||||
| Terex Corp. | |||||||
| 7.375%, 01/15/14 | $ | 490,000 | $ | 448,350 | |||
Machinery-Electrical - 1.5% | |||||||
| Baldor Electric Co. | |||||||
| 8.625%, 02/15/17 | 740,000 | 710,400 | |||||
Medical-Hospitals - 2.5% | |||||||
| Community Health Systems, Inc. | |||||||
| 8.875%, 07/15/15 | 840,000 | 802,200 | |||||
| HCA, Inc. | |||||||
| 9.250%, 11/15/16 | 445,000 | 433,875 | |||||
| 1,236,075 | |||||||
Medical-Nursing Homes - 1.0% | |||||||
| Sun Healthcare Group, Inc. | |||||||
| 9.125%, 04/15/15 | 500,000 | 480,000 | |||||
Medical-Outpatient/Home Medical Care - 1.5% | |||||||
| Res-Care, Inc. | |||||||
| 7.750%, 10/15/13 | 770,000 | 727,650 | |||||
Oil Companies-Exploration & Production - 4.8% | |||||||
| Forest Oil Corp. | |||||||
| 7.250%, 06/15/19 | 750,000 | 645,000 | |||||
| PetroHawk Energy Corp. 144A** | |||||||
| 7.875%, 06/01/15 | 790,000 | 691,250 | |||||
| SandRidge Energy, Inc. 144A** | |||||||
| 8.000%, 06/01/18 | 725,000 | 627,125 | |||||
| Southwestern Energy Co. 144A** | |||||||
| 7.500%, 02/01/18 | 395,000 | 385,125 | |||||
| 2,348,500 | |||||||
Oil Field Machine & Equipment - 1.5% | |||||||
| Complete Production Services, Inc. | |||||||
| 8.000%, 12/15/16 | 750,000 | 716,250 | |||||
Oil-Field Services - 0.6% | |||||||
| Helix Energy Solutions Group, Inc. 144A** | |||||||
| 9.500%, 01/15/16 | 295,000 | 277,300 | |||||
Paper & Related Products - 3.5% | |||||||
| Domtar Corp. | |||||||
| 7.125%, 08/15/15 | 625,000 | 578,125 | |||||
| Neenah Paper, Inc. | |||||||
| 7.375%, 11/15/14 | 790,000 | 630,025 | |||||
| NewPage Corp. | |||||||
| 10.000%, 05/01/12 | 535,000 | 481,500 | |||||
| 1,689,650 | |||||||
Physical Therapy/Rehabilitation Centers - 1.7% | |||||||
| Psychiatric Solutions, Inc. | |||||||
| 7.750%, 07/15/15 | 865,000 | 821,750 | |||||
Pipelines - 1.5% | |||||||
| Copano Energy LLC | |||||||
| 8.125%, 03/01/16 | 115,000 | 105,800 | |||||
| Dynegy Holdings, Inc. | |||||||
| 7.750%, 06/01/19 | 760,000 | 611,800 | |||||
| 717,600 | |||||||
Printing-Commercial - 0.9% | |||||||
| Cenveo Corp. | |||||||
| 7.875%, 12/01/13 | 585,000 | 453,375 | |||||
Radio - 0.7% | |||||||
| XM Satellite Radio Holdings, Inc. 144A** | |||||||
| 13.000%, 08/01/13 | 590,000 | 351,050 | |||||
Rental Auto/Equipment - 1.3% | |||||||
| Hertz Corp. | |||||||
| 10.500%, 01/01/16 | 740,000 | 621,600 | |||||
Retail-Apparel/Shoe - 2.8% | |||||||
| Brown Shoe Co., Inc. | |||||||
| 8.750%, 05/01/12 | 555,000 | 541,125 | |||||
| Phillips-Van Heusen Corp. | |||||||
| 8.125%, 05/01/13 | 830,000 | 832,075 | |||||
| 1,373,200 | |||||||
Retail-Computer Equip - 1.5% | |||||||
| GameStop Corp./GameStop, Inc. | |||||||
| 8.000%, 10/01/12 | 720,000 | 727,200 | |||||
Retail-Drug Store - 1.0% | |||||||
| Rite Aid Corp. | |||||||
| 7.500%, 03/01/17 | 665,000 | 508,725 | |||||
Retail-Propane Distribution - 2.4% | |||||||
| Inergy LP/Inergy Finance Corp. | |||||||
| 8.250%, 03/01/16 | 845,000 | 781,625 | |||||
| Star Gas Partners LP/Star Gas | |||||||
| Finance Co. | |||||||
| 10.250%, 02/15/13 | 435,000 | 384,975 | |||||
| 1,166,600 | |||||||
Retail-Regional Dept Store - 1.3% | |||||||
| The Neiman Marcus Group, Inc. | |||||||
| 10.375%, 10/15/15 | 735,000 | 619,238 | |||||
Special Purpose Entity - 4.9% | |||||||
| AMR HoldCo, Inc./EmCare HoldCo, Inc. | |||||||
| 10.000%, 02/15/15 | 810,000 | 852,525 | |||||
| Hughes Network Systems LLC/ | |||||||
| HNS Finance Corp. | |||||||
| 9.500%, 04/15/14 | 740,000 | 721,500 | |||||
| KAR Holdings, Inc. | |||||||
| 8.750%, 05/01/14 | 600,000 | 492,000 | |||||
| MedCath Holdings Corp. | |||||||
| 9.875%, 07/15/12 | 338,000 | 353,210 | |||||
| 2,419,235 | |||||||
Steel-Producers - 1.7% | |||||||
| Steel Dynamics, Inc. | |||||||
| 7.375%, 11/01/12 | 895,000 | 823,400 | |||||
Telecommuications Services - 4.1% | |||||||
| MasTec, Inc. | |||||||
| 7.625%, 02/01/17 | 1,155,000 | 981,750 | |||||
| Time Warner Telecom Holdings,Inc. | |||||||
| 9.250%, 02/15/14 | 625,000 | 600,000 | |||||
| West Corp. | |||||||
| 11.000%, 10/15/16 | 585,000 | 424,125 | |||||
| 2,005,875 | |||||||
Telephone-Integrated - 5.2% | |||||||
| Cincinnati Bell, Inc. | |||||||
| 8.375%, 01/15/14 | 880,000 | 770,000 | |||||
| Qwest Capital Funding, Inc. | |||||||
| 7.250%, 02/15/11 | 765,000 | 719,100 | |||||
| Sprint Capital Corp. | |||||||
| 8.375%, 03/15/12 | 340,000 | 306,220 | |||||
| Windstream Corp. | |||||||
| 8.625%, 08/01/16 | 820,000 | 760,550 | |||||
| 2,555,870 | |||||||
See Accompanying Notes to Financial Statements.
54
SCHEDULE OF INVESTMENTS (Unaudited)
As of September 30, 2008
| Principal | |||||||
| Amount | Value | ||||||
Wire & Cable Products - 2.9% | |||||||
| Anixter, Inc. | |||||||
| 5.950%, 03/01/15 | $ | 750,000 | $ | 656,250 | |||
| General Cable Corp. | |||||||
| 7.125%, 04/01/17 | 815,000 | 737,575 | |||||
| 1,393,825 | |||||||
Wireless Equipment - 0.8% | |||||||
| American Tower Corp. 144A** | |||||||
| 7.000%, 10/15/17 | 410,000 | 393,600 | |||||
| Total US Corporate Bonds (Cost: $51,176,028) | 45,427,294 | ||||||
Foreign Corporate Bonds - 3.5% | |||||||
Cellular Telecommunications - 1.8% | |||||||
| Millicom international Cellular SA | |||||||
| 10.000%, 12/01/13 | 605,000 | 635,250 | |||||
| Rogers Wireless, Inc. | |||||||
| 8.000%, 12/15/12 | 235,000 | 235,588 | |||||
| 870,838 | |||||||
Electronic Components-Miscellaneous - 0.6% | |||||||
| Flextronics International, Ltd. | |||||||
| 6.250%, 11/15/14 | 350,000 | 297,500 | |||||
Oil Companies-Exploration & Production - 0.8% | |||||||
| OPTI Canada, Inc. | |||||||
| 8.250%, 12/15/14 | 450,000 | 405,000 | |||||
Telecommunication Equipment - 0.3% | |||||||
| Nortel Networks, Ltd. 144A** | |||||||
| 10.750%, 07/15/16 | 255,000 | 157,462 | |||||
| Total Foreign Corporate Bonds (Cost: $1,883,877) | 1,730,800 | ||||||
Short Term Investments - 3.4% | |||||||
Time Deposit - 3.4% | |||||||
| Brown Brothers Harriman & Co. - | |||||||
| Grand Cayman | |||||||
| 3.470%, 10/01/08 | |||||||
| (Cost: $1,686,608) | 1,686,608 | 1,686,608 | |||||
| Total Investments - 99.7% (Cost: $54,746,513) | 48,844,702 | ||||||
| Other Assets In Excess Of Liabilities - 0.3% | 133,179 | ||||||
| Net Assets - 100.0% | $ | 48,977,881 | |||||
** 144A Security. Certain condition for public sale may exist. The | |||||||
total market value of 144A securities owned at September 30, | |||||||
2008 was $5,878,439 or 11.99% of net assets. |
| SCHEDULE OF INVESTMENTS BY SECTOR | ||||
| as of September 30, 2008 | ||||
| Percent of | ||||
| Sector | Net Assets | |||
| Communications | 21.6 | % | ||
| Consumer, Cyclical | 15.0 | |||
| Consumer, Non-cyclical | 14.4 | |||
| Industrial | 14.0 | |||
| Energy | 9.1 | |||
| Financial | 7.5 | |||
| Basic Materials | 6.5 | |||
| Utilities | 3.6 | |||
| Technology | 3.2 | |||
| Diversified | 1.4 | |||
| Short Term Investments | 3.4 | |||
| Total Investments | 99.7 | |||
| Other assets in excess of liabilities | 0.3 | |||
| Net Assets | 100.0 | % | ||
See Accompanying Notes to Financial Statements.
55
NICHOLAS-APPLEGATE INSTITUTIONAL FUNDS
FINANCIAL HIGHLIGHTS
FINANCIAL HIGHLIGHTS
For a Class I share outstanding during the period indicated
| Distributions from: | |||||||||||||||||||
| Net Asset | Net | Net Realized | Total from | Net | Net | ||||||||||||||
| Value, | Investment | and Unrealized | Investment | Investment | Realized | ||||||||||||||
| Beginning | Income (Loss) (2) | Gains (Loss) | Operations | Income | Capital Gains | ||||||||||||||
U.S. EQUITY FUNDS | |||||||||||||||||||
U.S. MICRO CAP | |||||||||||||||||||
| For the period ended 09/30/08 (1) | $ | 11.60 | $ | (0.05 | ) | $ | (0.28 | ) | $ | (0.33 | ) | $ | — | $ | — | ||||
| For the year ended 03/31/08 | 15.33 | (0.18 | ) | (1.49 | ) | (1.67 | ) | — | (2.06 | ) | |||||||||
| For the year ended 03/31/07 | 17.43 | (0.12 | ) | (0.19 | ) | (0.31 | ) | — | (1.79 | ) | |||||||||
| For the year ended 03/31/06 | 12.83 | (0.11 | ) | 5.06 | 4.95 | — | (0.35 | ) | |||||||||||
| For the year ended 03/31/05 | 14.69 | (0.09 | ) | (1.09 | ) | (1.18 | ) | — | (0.68 | ) | |||||||||
| For the year ended 03/31/04 | 7.44 | (0.13 | ) | 7.38 | 7.25 | — | — | ||||||||||||
U.S. EMERGING GROWTH | |||||||||||||||||||
| For the period ended 09/30/08 (1) | $ | 11.45 | $ | (0.02 | ) | $ | (0.81 | ) | $ | (0.83 | ) | $ | — | $ | — | ||||
| For the year ended 03/31/08 | 13.09 | (0.06 | ) | (0.70 | )(6) | (0.76 | ) | — | (0.88 | ) | |||||||||
| For the year ended 03/31/07 | 13.90 | (0.07 | ) | 0.19 | (7) | 0.12 | — | (0.93 | ) | ||||||||||
| For the year ended 03/31/06 | 9.77 | (0.11 | ) | 4.25 | 4.14 | — | (0.01 | ) | |||||||||||
| For the year ended 03/31/05 | 9.61 | (0.07 | ) | 0.23 | 0.16 | — | — | ||||||||||||
| For the year ended 03/31/04 | 6.32 | (0.09 | ) | 3.38 | 3.29 | — | — | ||||||||||||
U.S. ULTRA MICRO CAP | |||||||||||||||||||
| For the period ended 09/30/08 (1) | $ | 9.28 | $ | (0.11 | ) | $ | (0.33 | ) | $ | (0.44 | ) | $ | — | $ | — | ||||
| 1/28/08 (Commenced) to 03/31/08 | 10.00 | (0.03 | ) | (0.69 | ) | (0.72 | ) | — | — | ||||||||||
U.S. SYSTEMATIC LARGE CAP GROWTH | |||||||||||||||||||
| For the period ended 09/30/08 (1) | $ | 19.39 | $ | 0.04 | $ | (1.87 | ) | $ | (1.83 | ) | $ | — | $ | — | |||||
| For the year ended 03/31/08 | 19.77 | (0.02 | ) | (0.36 | )(6) | (0.38 | ) | — | — | ||||||||||
| For the year ended 03/31/07 | 17.86 | 0.02 | 1.89 | 1.91 | — | — | |||||||||||||
| For the year ended 03/31/06 | 15.67 | 0.03 | 2.16 | 2.19 | — | — | |||||||||||||
| For the year ended 03/31/05 | 15.06 | 0.07 | 0.54 | 0.61 | — | — | |||||||||||||
| For the year ended 03/31/04 | 12.73 | (0.02 | ) | 2.35 | 2.33 | — | — | ||||||||||||
U.S. SMALL TO MID CAP GROWTH | |||||||||||||||||||
| For the period ended 09/30/08 (1) | $ | 9.02 | $ | (0.02 | ) | $ | (0.69 | ) | $ | (0.71 | ) | $ | — | $ | — | ||||
| 7/31/07 (Commenced) to 03/31/08 | 10.00 | (0.03 | ) | (0.95 | ) | (0.98 | ) | — | — | ||||||||||
U.S. CONVERTIBLE | |||||||||||||||||||
| For the period ended 09/30/08 (1) | $ | 24.88 | $ | 0.17 | $ | (2.79 | ) | $ | (2.62 | ) | $ | (0.16 | ) | $ | — | ||||
| For the year ended 03/31/08 | 24.35 | 0.37 | 0.58 | 0.95 | (0.32 | ) | (0.10 | ) | |||||||||||
| For the year ended 03/31/07 | 24.57 | 0.45 | 2.03 | 2.48 | (0.47 | ) | (2.23 | ) | |||||||||||
| For the year ended 03/31/06 | 22.44 | 0.27 | 3.45 | 3.72 | (0.55 | ) | (1.04 | ) | |||||||||||
| For the year ended 03/31/05 | 23.11 | 0.39 | 0.66 | 1.05 | (0.45 | ) | (1.27 | ) | |||||||||||
| For the year ended 03/31/04 | 17.72 | 0.55 | 5.43 | 5.98 | (0.59 | ) | — | ||||||||||||
| Ratios to Average Net Assets (4) | |||||||||||||||||||||||||||||||
| Expenses | Expenses Net of | Fund’s | |||||||||||||||||||||||||||||
| Net Asset | Net Assets, | Net | Expense | Net of | Reimbursement/ | Portfolio | |||||||||||||||||||||||||
| Total | Value, | Total | Ending | Investment | Total | (Reimbursements)/ | Reimbursement/ | Recoupment | Turnover | ||||||||||||||||||||||
| Distributions | Ending | Return (3) | (in 000’s) | Income (Loss) | Expenses | Recoupment | Recoupment | Offset (5) | Rate | ||||||||||||||||||||||
U.S. EQUITY FUNDS | |||||||||||||||||||||||||||||||
U.S. MICRO CAP | |||||||||||||||||||||||||||||||
| For the period ended 09/30/08 (1) | $ | — | $ | 11.27 | (2.84 | %) | $ | 62,209 | (0.78 | %) | 1.58 | % | — | 1.58 | % | 0.94 | % | 55 | % | ||||||||||||
| For the year ended 03/31/08 | (2.06 | ) | 11.60 | (13.25 | %) | 60,122 | (1.19 | %) | 1.58 | % | — | 1.58 | % | 1.38 | % | 139 | % | ||||||||||||||
| For the year ended 03/31/07 | (1.79 | ) | 15.33 | (1.35 | %) | 84,405 | (0.75 | %) | 1.58 | % | — | 1.58 | % | 1.19 | % | 165 | % | ||||||||||||||
| For the year ended 03/31/06 | (0.35 | ) | 17.43 | 39.04 | % | 78,058 | (0.78 | %) | 1.64 | % | (0.07 | %) | 1.57 | % | 1.10 | % | 180 | % | |||||||||||||
| For the year ended 03/31/05 | (0.68 | ) | 12.83 | (8.17 | %) | 69,246 | (0.72 | %) | 1.63 | % | (0.07 | %) | 1.56 | % | 1.12 | % | 266 | % | |||||||||||||
| For the year ended 03/31/04 | — | 14.69 | 97.45 | % | 68,876 | (1.08 | %) | 1.64 | % | (0.07 | %) | 1.57 | % | 1.19 | % | 298 | % | ||||||||||||||
U.S. EMERGING GROWTH | |||||||||||||||||||||||||||||||
| For the period ended 09/30/08 (1) | $ | — | $ | 10.62 | (7.25 | %) | $ | 8,175 | (0.40 | %) | 1.22 | % | — | 1.22 | % | 0.81 | % | 74 | % | ||||||||||||
| For the year ended 03/31/08 | (0.88 | ) | 11.45 | (7.01 | %) | 7,499 | (0.46 | %) | 1.21 | % | — | 1.21 | % | 0.72 | % | 129 | % | ||||||||||||||
| For the year ended 03/31/07 | (0.93 | ) | 13.09 | 1.30 | % | 7,409 | (0.54 | %) | 1.21 | % | — | 1.21 | % | 0.72 | % | 148 | % | ||||||||||||||
| For the year ended 03/31/06 | (0.01 | ) | 13.90 | 42.38 | % | 6,721 | (1.04 | %) | 1.89 | % | (0.39 | %) | 1.50 | % | 1.17 | % | 128 | % | |||||||||||||
| For the year ended 03/31/05 | — | 9.77 | 1.66 | % | 12,043 | (0.75 | %) | 1.63 | % | (0.17 | %) | 1.46 | % | 1.06 | % | 142 | % | ||||||||||||||
| For the year ended 03/31/04 | — | 9.61 | 52.06 | % | 32,095 | (1.04 | %) | 1.48 | % | (0.00 | %) | 1.48 | % | 1.26 | % | 166 | % | ||||||||||||||
U.S. ULTRA MICRO CAP | |||||||||||||||||||||||||||||||
| For the period ended 09/30/08 (1) | $ | — | $ | 8.84 | (4.74 | %) | $ | 1,544 | (2.25 | %) | 2.45 | % | — | 2.45 | % | 2.40 | % | 60 | % | ||||||||||||
| 1/28/08 (Commenced) to 03/31/08 | — | 9.28 | (7.20 | %)(8) | 886 | (2.10 | %) | 2.31 | % | — | 2.31 | % | 2.15 | % | 19 | % | |||||||||||||||
U.S. SYSTEMATIC LARGE CAP GROWTH | |||||||||||||||||||||||||||||||
| For the period ended 09/30/08 (1) | $ | — | $ | 17.56 | (9.44 | %) | $ | 694 | (0.42 | %) | 1.20 | % | — | 1.20 | % | 1.17 | % | 58 | % | ||||||||||||
| For the year ended 03/31/08 | — | 19.39 | (1.92 | %) | 791 | (0.10 | %) | 1.14 | % | — | 1.14 | % | 1.10 | % | 106 | % | |||||||||||||||
| For the year ended 03/31/07 | — | 19.77 | 10.69 | % | 945 | (0.09 | %) | 1.13 | % | — | 1.13 | % | 1.05 | % | 100 | % | |||||||||||||||
| For the year ended 03/31/06 | — | 17.86 | 13.98 | % | 667 | 0.19 | % | 1.67 | % | (0.53 | %) | 1.14 | % | 1.04 | % | 147 | % | ||||||||||||||
| For the year ended 03/31/05 | — | 15.67 | 4.05 | % | 780 | 0.45 | % | 1.66 | % | (0.54 | %) | 1.12 | % | 1.00 | % | 197 | % | ||||||||||||||
| For the year ended 03/31/04 | — | 15.06 | 18.30 | % | 3,518 | (0.16 | %) | 1.33 | % | (0.20 | %) | 1.13 | % | 0.93 | % | 172 | % | ||||||||||||||
U.S. SMALL TO MID CAP GROWTH | |||||||||||||||||||||||||||||||
| For the period ended 09/30/08 (1) | $ | — | $ | 8.31 | (7.87 | %) | $ | 4,482 | (0.48 | %) | 0.97 | % | — | 0.97 | % | 0.82 | % | 94 | % | ||||||||||||
| 7/31/07 (Commenced) to 03/31/08 | — | 9.02 | (9.80 | %)(8) | 4,862 | (0.50 | %) | 0.95 | % | — | 0.95 | % | 0.80 | % | 105 | % | |||||||||||||||
U.S. CONVERTIBLE | |||||||||||||||||||||||||||||||
| For the period ended 09/30/08 (1) | $ | (0.16 | ) | $ | 22.10 | (10.55 | %) | $ | 13,396 | 1.31 | % | 1.03 | % | — | 1.03 | % | 0.94 | % | 53 | % | |||||||||||
| For the year ended 03/31/08 | (0.42 | ) | 24.88 | 3.84 | % | 47,773 | 1.45 | % | 1.03 | % | — | 1.03 | % | 0.89 | % | 98 | % | ||||||||||||||
| For the year ended 03/31/07 | (2.70 | ) | 24.35 | 10.79 | % | 39,022 | 1.89 | % | 1.02 | % | — | 1.02 | % | 0.85 | % | 92 | % | ||||||||||||||
| For the year ended 03/31/06 | (1.59 | ) | 24.57 | 17.15 | % | 31,627 | 1.02 | % | 1.14 | % | (0.11 | %) | 1.03 | % | 0.87 | % | 92 | % | |||||||||||||
| For the year ended 03/31/05 | (1.72 | ) | 22.44 | 4.62 | % | 35,397 | 1.68 | % | 1.10 | % | (0.08 | %) | 1.02 | % | 0.85 | % | 102 | % | |||||||||||||
| For the year ended 03/31/04 | (0.59 | ) | 23.11 | 34.15 | % | 50,103 | 2.57 | % | 1.10 | % | (0.06 | %) | 1.04 | % | 1.00 | % | 103 | % | |||||||||||||
(1) | Unaudited. |
(2) | Net investment income per share is calculated by dividing net investment income for the period by the average shares outstanding during the period. |
(3) | Total returns are not annualized for periods less than one year. |
(4) | Ratios are annualized for periods of less than one year. Expense reimbursements reflect voluntary reductions to total expenses. Such amounts would decrease net investment income (loss) ratios had such reductions not occurred. |
(5) | Net expenses include certain items not subject to expense reimbursement for periods prior to January 23, 2006. |
(6) | Includes litigation proceeds of approximately $0.07 per share for the U.S. Emerging Growth Fund and $0.09 per share for the U.S. Systematic Large Cap Growth Fund. |
(7) | The fund received $28,454 from a security litigation settlement during the year which is reflected in realized gains. This event had a $0.05 per share impact to the fund. |
(8) | Inception to date Return. |
See Accompanying Notes to Financial Statements.
56 & 57
NICHOLAS-APPLEGATE INSTITUTIONAL FUNDS
FINANCIAL HIGHLIGHTS
For a Class I share outstanding during the period indicated
| Distributions from: | |||||||||||||||||||
| Net Asset | Net | Net Realized | Total from | Net | Net | ||||||||||||||
| Value, | Investment | and Unrealized | Investment | Investment | Realized | ||||||||||||||
| Beginning | Income (Loss) (2) | Gains (Loss) | Operations | Income | Capital Gains | ||||||||||||||
GLOBAL EQUITY FUNDS | |||||||||||||||||||
GLOBAL EQUITY 130/30 | |||||||||||||||||||
| For the period ended 09/30/08 (1) | $ | 10.00 | $ | (1.88 | ) | $ | (0.11 | ) | $ | (1.99 | ) | $ | — | $ | — | ||||
GLOBAL SELECT | |||||||||||||||||||
| For the period ended 09/30/08 (1) | $ | 12.65 | $ | 0.07 | $ | (2.56 | ) | $ | (2.49 | ) | $ | — | $ | — | |||||
| For the year ended 03/31/08 | 18.60 | 0.11 | 0.92 | 1.03 | (0.28 | ) | (6.69 | ) | |||||||||||
| For the year ended 03/31/07 | 18.96 | 0.06 | 1.85 | 1.91 | — | (2.27 | ) | ||||||||||||
| For the year ended 03/31/06 | 16.09 | 0.03 | 3.97 | 4.00 | (0.03 | ) | (1.10 | ) | |||||||||||
| For the year ended 03/31/05 | 15.58 | 0.06 | 1.37 | 1.43 | — | (0.92 | ) | ||||||||||||
| For the year ended 03/31/04 | 10.26 | (0.01 | ) | 5.33 | 5.32 | — | — | ||||||||||||
INTERNATIONAL GROWTH | |||||||||||||||||||
| For the period ended 09/30/08 (1) | $ | 8.46 | $ | 0.09 | $ | (1.86 | ) | $ | (1.77 | ) | $ | — | $ | — | |||||
| For the year ended 03/31/08 | 22.35 | 0.17 | 3.82 | 3.99 | (0.29 | ) | (17.59 | ) | |||||||||||
| For the year ended 03/31/07 | 22.69 | 0.07 | 2.86 | 2.93 | (0.07 | ) | (3.20 | ) | |||||||||||
| For the year ended 03/31/06 | 20.47 | 0.16 | 6.05 | 6.21 | — | (3.99 | ) | ||||||||||||
| For the year ended 03/31/05 | 19.09 | 0.08 | 1.72 | 1.80 | — | (0.42 | ) | ||||||||||||
| For the year ended 03/31/04 | 12.83 | 0.30 | 6.00 | 6.30 | (0.04 | ) | — | ||||||||||||
INTERNATIONAL GROWTH OPPORTUNITIES | |||||||||||||||||||
| For the period ended 09/30/08 (1) | $ | 40.10 | $ | 0.38 | $ | (11.52 | ) | $ | (11.14 | ) | $ | — | $ | — | |||||
| For the year ended 03/31/08 | 57.36 | 0.14 | 3.43 | 3.57 | (1.26 | ) | (19.56 | ) | |||||||||||
| For the year ended 03/31/07 | 49.86 | 0.05 | 9.07 | 9.12 | — | (1.62 | ) | ||||||||||||
| For the year ended 03/31/06 | 35.01 | (0.01 | ) | 15.10 | 15.09 | (0.24 | ) | — | |||||||||||
| For the year ended 03/31/05 | 29.43 | 0.32 | 5.35 | 5.67 | (0.09 | ) | — | ||||||||||||
| For the year ended 03/31/04 | 17.39 | 0.18 | 11.86 | 12.04 | — | — | |||||||||||||
EMERGING MARKETS | |||||||||||||||||||
| For the period ended 09/30/08 (1) | $ | 13.52 | $ | 0.18 | $ | (4.11 | ) | $ | (3.93 | ) | $ | — | $ | — | |||||
| For the year ended 03/31/08 | 12.79 | 0.19 | 2.80 | 2.99 | (0.10 | ) | (2.16 | ) | |||||||||||
| 8/21/06 (Commenced) to 03/31/07 | 10.00 | 0.02 | 2.84 | 2.86 | (0.07 | ) | — | ||||||||||||
INTERNATIONAL SYSTEMATIC | |||||||||||||||||||
| For the period ended 09/30/08 (1) | $ | 13.57 | $ | 0.21 | $ | (3.41 | ) | $ | (3.20 | ) | $ | — | $ | — | |||||
| For the year ended 03/31/08 | 16.02 | 0.16 | (1.64 | ) | (1.48 | ) | (0.20 | ) | (0.77 | ) | |||||||||
| For the year ended 03/31/07 | 13.70 | 0.09 | 2.50 | 2.59 | (0.02 | ) | (0.25 | ) | |||||||||||
| 7/06/05 (Commenced) to 03/31/06 | 10.00 | 0.06 | 3.81 | 3.87 | (0.01 | ) | (0.16 | ) | |||||||||||
INTERNATIONAL ALL CAP GROWTH | |||||||||||||||||||
| For the period ended 09/30/08 (1) | $ | 12.01 | $ | 0.11 | $ | (2.56 | ) | $ | (2.45 | ) | $ | — | $ | — | |||||
| For the year ended 03/31/08 | 14.41 | 0.19 | 2.02 | 2.21 | (0.76 | ) | (3.85 | ) | |||||||||||
| For the year ended 03/31/07 | 13.00 | 0.07 | 1.93 | 2.00 | (0.08 | ) | (0.51 | ) | |||||||||||
| For the year ended 03/31/06 | 9.08 | 0.01 | 3.92 | 3.93 | (0.01 | ) | — | ||||||||||||
| For the year ended 03/31/05 | 8.19 | 0.01 | 0.92 | 0.93 | — | (0.04 | ) | ||||||||||||
| For the year ended 03/31/04 | 4.84 | (0.01 | ) | 3.36 | 3.35 | — | — | ||||||||||||
FIXED INCOME FUNDS | |||||||||||||||||||
U.S. HIGH YIELD BOND | |||||||||||||||||||
| For the period ended 09/30/08 (1) | $ | 9.36 | $ | 0.38 | $ | (0.74 | ) | $ | (0.36 | ) | $ | (0.38 | ) | $ | — | ||||
| For the year ended 03/31/08 | 10.27 | 0.76 | (0.86 | ) | (0.10 | ) | (0.81 | ) | — | ||||||||||
| For the year ended 03/31/07 | 10.00 | 0.73 | 0.30 | 1.03 | (0.76 | ) | — | ||||||||||||
| For the year ended 03/31/06 | 10.04 | 0.70 | 0.02 | 0.72 | (0.76 | ) | — | ||||||||||||
| For the year ended 03/31/05 | 10.34 | 0.85 | (0.31 | ) | 0.54 | (0.84 | ) | (0.00) | (7) | ||||||||||
| For the year ended 03/31/04 | 9.65 | 0.86 | 0.63 | 1.49 | (0.80 | ) | — | ||||||||||||
| Ratios to Average Net Assets (4) | |||||||||||||||||||||||||||||||
| Expenses | Expenses Net of | Fund’s | |||||||||||||||||||||||||||||
| Net Asset | Net Assets, | Net | Expense | Net of | Reimbursement/ | Portfolio | |||||||||||||||||||||||||
| Total | Value, | Total | Ending | Investment | Total | (Reimbursements)/ | Reimbursement/ | Recoupment | Turnover | ||||||||||||||||||||||
| Distributions | Ending | Return (3) | (in 000’s) | Income (Loss) | Expenses | Recoupment | Recoupment | Offset (5) | Rate | ||||||||||||||||||||||
GLOBAL EQUITY FUNDS | |||||||||||||||||||||||||||||||
GLOBAL EQUITY 130/30 | |||||||||||||||||||||||||||||||
| For the period ended 09/30/08 (1) | $ | — | $ | 8.01 | (19.90 | %) | $ | 3,322 | (0.38 | %) | 3.25 | % | — | 3.25 | % | 3.22 | % | 63 | % | ||||||||||||
GLOBAL SELECT | |||||||||||||||||||||||||||||||
| For the period ended 09/30/08 (1) | $ | — | $ | 10.16 | (19.68 | %) | $ | 25,928 | 1.17 | % | 1.17 | % | — | 1.17 | % | 0.95 | % | 53 | % | ||||||||||||
| For the year ended 03/31/08 | (6.98 | ) | 12.65 | 1.34 | % | 32,669 | 0.60 | % | 1.18 | % | — | 1.18 | % | 1.03 | % | 80 | % | ||||||||||||||
| For the year ended 03/31/07 | (2.27 | ) | 18.60 | 10.64 | % | 78,550 | (0.35 | %) | 1.16 | % | — | 1.16 | % | 1.00 | % | 105 | % | ||||||||||||||
| For the year ended 03/31/06 | (1.13 | ) | 18.96 | 25.76 | % | 77,225 | 0.16 | % | 1.13 | % | (0.00 | %) | 1.13 | % | 0.88 | % | 139 | % | |||||||||||||
| For the year ended 03/31/05 | (0.92 | ) | 16.09 | 9.27 | % | 66,115 | 0.41 | % | 1.15 | % | (0.01 | %) | 1.14 | % | 0.95 | % | 164 | % | |||||||||||||
| For the year ended 03/31/04 | — | 15.58 | 51.85 | % | 78,327 | (0.05 | %) | 1.28 | % | (0.10 | %) | 1.18 | % | 1.01 | % | 226 | % | ||||||||||||||
INTERNATIONAL GROWTH | |||||||||||||||||||||||||||||||
| For the period ended 09/30/08 (1) | $ | — | $ | 6.69 | (20.92 | %) | $ | 7,535 | 2.17 | % | 1.41 | % | — | 1.41 | % | 1.07 | % | 21 | % | ||||||||||||
| For the year ended 03/31/08 | (17.88 | ) | 8.46 | 11.37 | % | 9,496 | 1.02 | % | 1.38 | % | — | 1.38 | % | 0.99 | % | 113 | % | ||||||||||||||
| For the year ended 03/31/07 | (3.27 | ) | 22.35 | 13.80 | % | 15,000 | (0.30 | %) | 1.41 | % | — | 1.41 | % | 1.14 | % | 119 | % | ||||||||||||||
| For the year ended 03/31/06 | (3.99 | ) | 22.69 | 33.63 | % | 45,889 | 0.73 | % | 1.37 | % | (0.00 | %) | 1.37 | % | 0.99 | % | 167 | % | |||||||||||||
| For the year ended 03/31/05 | (0.42 | ) | 20.47 | 9.49 | % | 41,394 | 0.42 | % | 1.39 | % | (0.00 | %) | 1.39 | % | 1.08 | % | 203 | % | |||||||||||||
| For the year ended 03/31/04 | (0.04 | ) | 19.09 | 49.17 | % | 51,450 | 1.35 | % | 1.49 | % | (0.04 | %) | 1.45 | % | 1.19 | % | 186 | % | |||||||||||||
INTERNATIONAL GROWTH OPPORTUNITIES | |||||||||||||||||||||||||||||||
| For the period ended 09/30/08 (1) | $ | — | $ | 28.96 | (27.78 | %) | $ | 82,636 | 1.59 | % | 1.44 | % | — | 1.44 | % | 1.15 | % | 47 | % | ||||||||||||
| For the year ended 03/31/08 | (20.83 | ) | 40.10 | 2.74 | % | 113,239 | 0.26 | % | 1.44 | % | — | 1.44 | % | 1.13 | % | 86 | % | ||||||||||||||
| For the year ended 03/31/07 | (1.62 | ) | 57.36 | 18.71 | % | 104,003 | 0.09 | % | 1.43 | % | — | 1.43 | % | 1.18 | % | 127 | % | ||||||||||||||
| For the year ended 03/31/06 | (0.24 | ) | 49.86 | 43.34 | % | 107,749 | (0.02 | %) | 1.38 | % | (0.00 | %) | 1.38 | % | 1.07 | % | 168 | % | |||||||||||||
| For the year ended 03/31/05 | (0.09 | ) | 35.01 | 19.28 | % | 55,462 | 1.05 | % | 1.42 | % | (0.00 | %) | 1.42 | % | 1.11 | % | 110 | % | |||||||||||||
| For the year ended 03/31/04 | — | 29.43 | 69.24 | % | 54,015 | 0.74 | % | 1.47 | % | (0.00 | %) | 1.47 | % | 1.28 | % | 124 | % | ||||||||||||||
EMERGING MARKETS | |||||||||||||||||||||||||||||||
| For the period ended 09/30/08 (1) | $ | — | $ | 9.59 | (29.07 | %) | $ | 3,641 | 2.80 | % | 1.43 | % | — | 1.43 | % | 1.24 | % | 64 | % | ||||||||||||
| For the year ended 03/31/08 | (2.26 | ) | 13.52 | 21.19 | % | 2,491 | 1.32 | % | 1.45 | % | — | 1.45 | % | 1.16 | % | 183 | % | ||||||||||||||
| 8/21/06 (Commenced) to 03/31/07 | (0.07 | ) | 12.79 | 28.65% | (6) | 94 | (0.23 | %) | 1.63 | % | — | 1.63 | % | 1.52 | % | 22 | % | ||||||||||||||
INTERNATIONAL SYSTEMATIC | |||||||||||||||||||||||||||||||
| For the period ended 09/30/08 (1) | $ | — | $ | 10.37 | (23.58 | %) | $ | 21,267 | 3.21 | % | 1.03 | % | — | 1.03 | % | 0.88 | % | 101 | % | ||||||||||||
| For the year ended 03/31/08 | (0.97 | ) | 13.57 | 9.87 | % | 24,534 | 1.13 | % | 1.04 | % | — | 1.04 | % | 0.74 | % | 202 | % | ||||||||||||||
| For the year ended 03/31/07 | (0.27 | ) | 16.02 | 19.04 | % | 4,623 | (0.70 | %) | 0.9 | 3%(9) | — | 0.93 | % | 0.70 | % | 210 | % | ||||||||||||||
| 7/06/05 (Commenced) to 03/31/06 | (0.17 | ) | 13.70 | 38.92 | %(6) | 4,662 | 0.78 | % | 2.94 | % | (1.69 | %) | 1.25 | % | 1.11 | % | 103 | % | |||||||||||||
INTERNATIONAL ALL CAP GROWTH | |||||||||||||||||||||||||||||||
| For the period ended 09/30/08 (1) | $ | — | $ | 9.56 | (20.40 | %) | $ | 10,171 | 1.93 | % | 1.17 | % | — | 1.17 | % | 0.81 | % | 20 | % | ||||||||||||
| For the year ended 03/31/08 | (4.61 | ) | 12.01 | 12.58 | % | 7,340 | 1.09 | % | 1.16 | % | — | 1.16 | % | 0.90 | % | 113 | % | ||||||||||||||
| For the year ended 03/31/07 | (0.59 | ) | 14.41 | 15.75 | % | 23,827 | 0.49 | % | 1.18 | % | — | 1.18 | % | 1.04 | % | 118 | % | ||||||||||||||
| For the year ended 03/31/06 | (0.01 | ) | 13.00 | 43.28 | % | 20,562 | 0.08 | % | 1.89 | % | (0.47 | %) | 1.42 | % | 1.39 | % | 196 | % | |||||||||||||
| For the year ended 03/31/05 | (0.04 | ) | 9.08 | 11.34 | % | 33,900 | (0.42 | %) | 2.07 | % | (0.59 | %) | 1.48 | % | 1.48 | % | 166 | % | |||||||||||||
| For the year ended 03/31/04 | — | 8.19 | 69.21 | % | 28,700 | (0.87 | %) | 2.25 | % | (0.77 | %) | 1.48 | % | 1.48 | % | 153 | % | ||||||||||||||
FIXED INCOME FUNDS | |||||||||||||||||||||||||||||||
U.S. HIGH YIELD BOND | |||||||||||||||||||||||||||||||
| For the period ended 09/30/08 (1) | $ | (0.38 | ) | $ | 8.62 | (4.11 | %) | $ | 48,978 | 8.04 | % | 0.65 | % | — | 0.65 | % | 0.65 | % | 26 | % | |||||||||||
| For the year ended 03/31/08 | (0.81 | ) | 9.36 | 1.06 | % | 50,271 | 7.66 | % | 0.63 | % | — | 0.63 | % | 0.57 | % | 81 | % | ||||||||||||||
| For the year ended 03/31/07 | (0.76 | ) | 10.27 | 10.76 | % | 63,925 | 7.21 | % | 0.64 | % | — | 0.64 | % | 0.52% | (8) | 92 | % | ||||||||||||||
| For the year ended 03/31/06 | (0.76 | ) | 10.00 | 7.40 | % | 81,187 | 6.70 | % | 0.82 | % | (0.18 | %) | 0.64 | % | 0.56 | % | 112 | % | |||||||||||||
| For the year ended 03/31/05 | (0.84 | ) | 10.04 | 5.40 | % | 131,677 | 7.82 | % | 0.82 | % | (0.19 | %) | 0.63 | % | 0.60 | % | 123 | % | |||||||||||||
| For the year ended 03/31/04 | (0.80 | ) | 10.34 | 16.67 | % | 102,110 | 8.43 | % | 0.87 | % | (0.23 | %) | 0.64 | % | 0.61 | % | 134 | % | |||||||||||||
(1) | Unaudited. |
(2) | Net investment income per share is calculated by dividing net investment income for the period by the average shares outstanding during the period. |
(3) | Total returns are not annualized for periods less than one year. |
(4) | Ratios are annualized for periods of less than one year. Expense reimbursements reflect voluntary reductions to total expenses. Such amounts would increase net investment income (loss) ratios had such reductions not occurred. |
| (5) | Net expenses include certain items not subject to expense reimbursement for periods prior to January 23, 2006. |
| (6) | Inception to date Return. |
(7) | Less than one penny per share. |
(8) | For the year ended March 31, 2007 ratios do not include one time expense credit. Had this credit been included, the expense ratios would have been decreased by 0.07%. |
(9) | For the period from 11/28/06 to 12/21/06 the unitary fees for International Systematic Fund Class I were reduced from 0.48% to 0.23%. The Unitary fees were resumed to 0.48% through March 31, 2007. |
See Accompanying Notes to Financial Statements.
58 & 59
NICHOLAS-APPLEGATE INSTITUTIONAL FUNDS
FINANCIAL HIGHLIGHTS
For a Class II share outstanding during the period indicated
| Distributions from: | |||||||||||||||||||
| Net Asset | Net | Net Realized | Total from | Net | Net | ||||||||||||||
| Value, | Investment | and Unrealized | Investment | Investment | Realized | ||||||||||||||
| Beginning | Income (Loss) (2) | Gains (Loss) | Operations | Income | Capital Gains | ||||||||||||||
U.S. EQUITY FUNDS | |||||||||||||||||||
U.S. SYSTEMATIC LARGE CAP GROWTH | |||||||||||||||||||
| For the period ended 09/30/08 (1) | $ | 19.29 | $ | 0.06 | $ | (1.86 | ) | $ | (1.80 | ) | $ | — | $ | — | |||||
| For the year ended 03/31/08 | 19.67 | 0.01 | (6) | (0.36 | ) | (0.35 | ) | (0.03 | ) | — | |||||||||
| For the year ended 03/31/07 | 17.75 | 0.05 | 1.87 | 1.92 | (0.00 | )(8) | — | ||||||||||||
| 09/30/05 (Commenced) to 03/31/06 | 16.35 | 0.02 | 1.51 | 1.53 | (0.13 | ) | — | ||||||||||||
U.S. CONVERTIBLE | |||||||||||||||||||
| For the period ended 09/30/08 (1) | $ | 24.88 | $ | 0.20 | $ | (2.81 | ) | $ | (2.61 | ) | $ | (0.17 | ) | $ | — | ||||
| For the year ended 03/31/08 | 24.36 | 0.41 | 0.56 | 0.97 | (0.35 | ) | (0.10 | ) | |||||||||||
| For the year ended 03/31/07 | 24.58 | 0.47 | 2.04 | 2.51 | (0.50 | ) | (2.23 | ) | |||||||||||
| 09/30/05 (Commenced) to 03/31/06 | 23.97 | 0.30 | 1.63 | 1.93 | (0.28 | ) | (1.04 | ) | |||||||||||
GLOBAL FUNDS | |||||||||||||||||||
GLOBAL SELECT | |||||||||||||||||||
| For the period ended 09/30/08 (1) | $ | 12.92 | $ | 0.07 | $ | (2.61 | ) | $ | (2.54 | ) | $ | — | $ | — | |||||
| For the year ended 03/31/08 | 18.61 | 0.14 | 0.86 | 1.00 | (0.00 | )(8) | (6.69 | ) | |||||||||||
| For the year ended 03/31/07 | 18.97 | 0.08 | 1.84 | 1.92 | (0.01 | ) | (2.27 | ) | |||||||||||
| For the year ended 03/31/06 | 16.09 | 0.04 | 3.98 | 4.02 | (0.04 | ) | (1.10 | ) | |||||||||||
| For the year ended 03/31/05 | 15.58 | 0.07 | 1.36 | 1.43 | — | (0.92 | ) | ||||||||||||
| 6/30/03 (Commenced) to 03/31/04 | 12.12 | (0.01 | ) | 3.47 | 3.46 | — | — | ||||||||||||
INTERNATIONAL GROWTH | |||||||||||||||||||
| For the period ended 09/30/08 (1) | $ | 7.71 | $ | 0.10 | $ | (1.70 | ) | $ | (1.60 | ) | $ | — | $ | — | |||||
| For the year ended 03/31/08 | 22.36 | 0.33 | 3.24 | 3.57 | (0.63 | ) | (17.59 | ) | |||||||||||
| For the year ended 03/31/07 | 22.71 | 0.14 | 2.86 | 3.00 | (0.15 | ) | (3.20 | ) | |||||||||||
| 1/23/06 (Commenced) to 03/31/06 | 21.64 | 1.85 | (0.78 | ) | 1.07 | — | — | ||||||||||||
INTERNATIONAL GROWTH OPPORTUNITIES | |||||||||||||||||||
| For the period ended 09/30/08 (1) | $ | 41.28 | $ | 0.10 | $ | (11.55 | ) | $ | (11.45 | ) | $ | — | $ | — | |||||
| For the year ended 03/31/08 | 57.63 | 0.39 | 3.17 | 3.56 | (0.35 | ) | (19.56 | ) | |||||||||||
| For the year ended 03/31/07 | 50.01 | 0.02 | 9.22 | 9.24 | — | (1.62 | ) | ||||||||||||
| For the year ended 03/31/06 | 35.02 | 0.13 | 15.06 | 15.19 | (0.20 | ) | — | ||||||||||||
| For the year ended 03/31/05 | 29.47 | 0.38 | 5.32 | 5.70 | (0.15 | ) | — | ||||||||||||
| 6/05/03 (Commenced) to 03/31/04 | 20.85 | 0.14 | 8.48 | 8.62 | — | — | |||||||||||||
EMERGING MARKETS | |||||||||||||||||||
| For the period ended 09/30/08 (1) | $ | 13.54 | $ | 0.19 | $ | (4.13 | ) | $ | (3.94 | ) | $ | — | $ | — | |||||
| For the year ended 03/31/08 | 12.78 | 0.11 | 2.90 | 3.01 | (0.09 | ) | (2.16 | ) | |||||||||||
| 03/27/07 (Commenced) to 03/31/07 | 12.61 | 0.00 | (7) | 0.17 | 0.17 | — | — | ||||||||||||
INTERNATIONAL SYSTEMATIC | |||||||||||||||||||
| For the period ended 09/30/08 (1) | $ | 13.59 | $ | 0.23 | $ | (3.43 | ) | $ | (3.20 | ) | $ | — | $ | — | |||||
| For the year ended 03/31/08 | 16.00 | 0.06 | (1.51 | ) | (1.45 | ) | (0.19 | ) | (0.77 | ) | |||||||||
| 12/22/06 (Commenced) to 03/31/07 | 15.48 | 0.07 | 0.45 | 0.52 | — | — | |||||||||||||
| Ratios to Average Net Assets (4) | |||||||||||||||||||||||||||||||
| Expenses | Expenses Net of | Fund’s | |||||||||||||||||||||||||||||
| Net Asset | Net Assets, | Net | Expense | Net of | Reimbursement/ | Portfolio | |||||||||||||||||||||||||
| Total | Value, | Total | Ending | Investment | Total | (Reimbursements)/ | Reimbursement/ | Recoupment | Turnover | ||||||||||||||||||||||
| Distributions | Ending | Return (3) | (in 000’s) | Income (Loss) | Expenses | Recoupment | Recoupment | Offset (5) | Rate | ||||||||||||||||||||||
U.S. EQUITY FUNDS | |||||||||||||||||||||||||||||||
U.S. SYSTEMATIC LARGE CAP GROWTH | |||||||||||||||||||||||||||||||
| For the period ended 09/30/08 (1) | $ | — | $ | 17.49 | (9.33 | %) | $ | 3,508 | 0.59 | % | 1.02 | % | — | 1.02 | % | 0.97 | % | 58 | % | ||||||||||||
| For the year ended 03/31/08 | (0.03 | ) | 19.29 | (1.81 | %) | 10,594 | 0.05 | % | 0.99 | % | — | 0.99 | % | 0.96 | % | 106 | % | ||||||||||||||
| For the year ended 03/31/07 | — | 19.67 | 10.83 | % | 10,040 | 0.28 | % | 0.98 | % | — | 0.98 | % | 0.91 | % | 100 | % | |||||||||||||||
| 09/30/05 (Commenced) to 03/31/06 | (0.13 | ) | 17.75 | 9.43% | (7) | 3,743 | 0.27 | % | 1.37 | % | (0.37 | %) | 1.00 | % | 0.94 | % | 147 | % | |||||||||||||
U.S. CONVERTIBLE | |||||||||||||||||||||||||||||||
| For the period ended 09/30/08 (1) | $ | (0.17 | ) | $ | 22.10 | (10.51 | %) | $ | 37,702 | 1.58 | % | 0.94 | % | — | 0.94 | % | 0.91 | % | 53 | % | |||||||||||
| For the year ended 03/31/08 | (0.45 | ) | 24.88 | 3.91 | % | 9,103 | 1.58 | % | 0.93 | % | — | 0.93 | % | 0.79 | % | 98 | % | ||||||||||||||
| For the year ended 03/31/07 | (2.73 | ) | 24.36 | 10.92 | % | 7,880 | 2.05 | % | 0.92 | % | — | 0.92 | % | 0.75 | % | 92 | % | ||||||||||||||
| 09/30/05 (Commenced) to 03/31/06 | (1.32 | ) | 24.58 | 8.47% | (7) | 3,634 | 2.26 | % | 1.01 | % | (0.09 | %) | 0.92 | % | 0.77 | % | 92 | % | |||||||||||||
GLOBAL FUNDS | |||||||||||||||||||||||||||||||
GLOBAL SELECT | |||||||||||||||||||||||||||||||
| For the period ended 09/30/08 (1) | $ | — | $ | 10.38 | (19.66 | %) | $ | 9,497 | 1.11 | % | 1.12 | % | — | 1.12 | % | 0.92 | % | 53 | % | ||||||||||||
| For the year ended 03/31/08 | (6.69 | ) | 12.92 | 1.40 | % | 8,617 | 0.67 | % | 1.13 | % | — | 1.13 | % | 0.97 | % | 80 | % | ||||||||||||||
| For the year ended 03/31/07 | (2.28 | ) | 18.61 | 10.67 | % | 90,871 | 0.44 | % | 1.11 | % | — | 1.11 | % | 0.95 | % | 105 | % | ||||||||||||||
| For the year ended 03/31/06 | (1.14 | ) | 18.97 | 25.90 | % | 100,610 | 0.21 | % | 1.08 | % | — | 1.08 | % | 0.83 | % | 139 | % | ||||||||||||||
| For the year ended 03/31/05 | (0.92 | ) | 16.09 | 9.27 | % | 69,548 | 0.44 | % | 1.10 | % | (0.01 | %) | 1.09 | % | 0.90 | % | 164 | % | |||||||||||||
| 6/30/03 (Commenced) to 03/31/04 | — | 15.58 | 28.55% | (7) | 35,817 | (0.08 | %) | 1.24 | % | (0.12 | %) | 1.12 | % | 0.94 | % | 226 | % | ||||||||||||||
INTERNATIONAL GROWTH | |||||||||||||||||||||||||||||||
| For the period ended 09/30/08 (1) | $ | — | $ | 6.11 | (20.75 | %) | $ | 8,157 | 2.62 | % | 1.01 | % | — | 1.01 | % | 0.66 | % | 21 | % | ||||||||||||
| For the year ended 03/31/08 | (18.22 | ) | 7.71 | 9.52 | % | 11,518 | 1.56 | % | 0.99 | % | — | 0.99 | % | 0.72 | % | 113 | % | ||||||||||||||
| For the year ended 03/31/07 | (3.35 | ) | 22.36 | 14.12 | % | 52,420 | 0.64 | % | 1.02 | % | — | 1.02 | % | 0.75 | % | 119 | % | ||||||||||||||
| 1/23/06 (Commenced) to 03/31/06 | — | 22.71 | 4.94% | (7) | 56,501 | 1.21 | % | 0.99 | % | (0.00 | %) | 0.99 | % | 0.73 | % | 167 | % | ||||||||||||||
INTERNATIONAL GROWTH OPPORTUNITIES | |||||||||||||||||||||||||||||||
| For the period ended 09/30/08 (1) | $ | — | $ | 29.83 | (27.74 | %) | $ | 2,943 | 1.66 | % | 1.29 | % | — | 1.29 | % | 1.01 | % | 47 | % | ||||||||||||
| For the year ended 03/31/08 | (19.91 | ) | 41.28 | 2.90 | % | 8,213 | 0.57 | % | 1.27 | % | — | 1.27 | % | 1.00 | % | 86 | % | ||||||||||||||
| For the year ended 03/31/07 | (1.62 | ) | 57.63 | 18.90 | % | 73,640 | 0.05 | % | 1.28 | % | — | 1.28 | % | 1.03 | % | 127 | % | ||||||||||||||
| For the year ended 03/31/06 | (0.20 | ) | 50.01 | 43.55 | % | 32,565 | 0.36 | % | 1.22 | % | (0.00 | %) | 1.22 | % | 0.91 | % | 168 | % | |||||||||||||
| For the year ended 03/31/05 | (0.15 | ) | 35.02 | 19.40 | % | 35,233 | 1.19 | % | 1.27 | % | (0.00 | %) | 1.27 | % | 0.97 | % | 110 | % | |||||||||||||
| 6/05/03 (Commenced) to 03/31/04 | — | 29.47 | 41.34% | (7) | 60,394 | 0.66 | % | 1.29 | % | — | 1.29 | % | 1.11 | % | 124 | % | |||||||||||||||
EMERGING MARKETS | |||||||||||||||||||||||||||||||
| For the period ended 09/30/08 (1) | $ | — | $ | 9.60 | (29.10 | %) | $ | 10,396 | 2.91 | % | 1.32 | % | — | 1.32 | % | 1.06 | % | 64 | % | ||||||||||||
| For the year ended 03/31/08 | (2.25 | ) | 13.54 | 21.18 | % | 14,656 | 0.70 | % | 1.32 | % | — | 1.32 | % | 1.13 | % | 183 | % | ||||||||||||||
| 03/27/07 (Commenced) to 03/31/07 | — | 12.78 | 1.35% | (7) | 39,081 | 1.28 | % | 1.18 | % | — | 1.18 | % | 1.18 | % | 22 | % | |||||||||||||||
INTERNATIONAL SYSTEMATIC | |||||||||||||||||||||||||||||||
| For the period ended 09/30/08 (1) | $ | — | $ | 10.39 | (23.55 | %) | $ | 10,396 | 3.46 | % | 0.88 | % | — | 0.88 | % | 0.71 | % | 101 | % | ||||||||||||
| For the year ended 03/31/08 | (0.96 | ) | 13.59 | (9.68 | )% | 26,976 | 1.44 | % | 0.88 | % | — | 0.88 | % | 0.64 | % | 202 | % | ||||||||||||||
| 12/22/06 (Commenced) to 03/31/07 | — | 16.00 | 3.36% | (7) | 12,722 | 1.33 | % | 0.85 | % | — | 0.85 | % | 0.55 | % | 210 | % | |||||||||||||||
(1) | Unaudited. |
(2) | Net investment income per share is calculated by dividing net investment income for the period by the average shares outstanding during the period. |
(3) | Total returns are not annualized for periods less than one year. |
(4) | Ratios are annualized for periods of less than one year. Expense reimbursements reflect voluntary reductions to total expenses, as discussed in the notes to financial statements. Such amounts would increase net investment income (loss) ratios had such reductions not occurred. |
(5) | Net expenses include certain items not subject to expense reimbursement for periods prior to January 23, 2006. |
(6) | The net investment income per share includes litigation proceeds of approximately $0.09 per share for the U.S. Systematic Large Cap Growth Fund. |
(7) | Inception to date Return. |
(8) | Less than one penny per share. |
See Accompanying Notes to Financial Statements.
60 & 61
NICHOLAS-APPLEGATE INSTITUTIONAL FUNDS
FINANCIAL HIGHLIGHTS
For a class III share outstanding during the period indicated
| Distributions from: | |||||||||||||||||||
| Net Asset | Net | Net Realized | Total from | Net | Net | ||||||||||||||
| Value, | Investment | and Unrealized | Investment | Investment | Realized | ||||||||||||||
| Beginning | Income (Loss) (2) | Gains (Loss) | Operations | Income | Capital Gains | ||||||||||||||
GLOBAL FUNDS | |||||||||||||||||||
INTERNATIONAL GROWTH OPPORTUNITIES | |||||||||||||||||||
| 09/08/08 (Commenced) to 09/30/08 (1) | $ | 33.99 | $ | 0.02 | $ | (4.17 | ) | $ | (4.15 | ) | $ | — | $ | — | |||||
INTERNATIONAL SYSTEMATIC | |||||||||||||||||||
| For the period ended 09/30/08 (1) | $ | 13.61 | $ | 0.23 | $ | (3.42 | ) | $ | (3.19 | ) | $ | — | $ | — | |||||
| For the year ended 03/31/08 | 16.01 | 0.08 | (1.51 | ) | (1.43 | ) | (0.20 | ) | (0.77 | ) | |||||||||
| 12/21/06 (Commenced) to 03/31/07 | 15.36 | 0.09 | 0.56 | 0.65 | — | — | |||||||||||||
| Ratios to Average Net Assets (4) | |||||||||||||||||||||||||||||||
| Expenses | Expenses Net of | Fund’s | |||||||||||||||||||||||||||||
| Net Asset | Net Assets, | Net | Expense | Net of | Reimbursement/ | Portfolio | |||||||||||||||||||||||||
| Total | Value, | Total | Ending | Investment | Total | (Reimbursements)/ | Reimbursement/ | Recoupment | Turnover | ||||||||||||||||||||||
| Distributions | Ending | Return (3) | (in 000’s) | Income (Loss) | Expenses | Recoupment (7) | Recoupment | Offset (5) | Rate | ||||||||||||||||||||||
GLOBAL FUNDS | |||||||||||||||||||||||||||||||
INTERNATIONAL GROWTH OPPORTUNITIES | |||||||||||||||||||||||||||||||
| 09/08/08 (Commenced) to 09/30/08 (1) | $ | — | $ | 29.84 | (12.21%) | (6) | $ | 21,959 | 1.83 | % | 1.29 | % | — | 1.29 | % | 1.18 | % | 47 | % | ||||||||||||
INTERNATIONAL SYSTEMATIC | |||||||||||||||||||||||||||||||
| For the period ended 09/30/08 (1) | $ | — | $ | 10.42 | (23.44 | %) | $ | 37,759 | 3.46 | % | 0.78 | % | — | 0.78 | % | 0.63 | % | 101 | % | ||||||||||||
| For the year ended 03/31/08 | (0.97 | ) | 13.61 | (9.57 | %) | 49,322 | 1.79 | % | 0.79 | % | — | 0.79 | % | 0.55 | % | 202 | % | ||||||||||||||
| 12/21/06 (Commenced) to 03/31/07 | — | 16.01 | 4.23% | (6) | 54,604 | 1.95 | % | 0.76 | % | — | 0.76 | % | 0.46 | % | 210 | % | |||||||||||||||
For a class IV share outstanding during the period indicated
| Distributions from: | |||||||||||||||||||
| Net Asset | Net | Net Realized | Total from | Net | Net | ||||||||||||||
| Value, | Investment | and Unrealized | Investment | Investment | Realized | ||||||||||||||
| Beginning | Income (Loss) (2) | Gains (Loss) | Operations | Income | Capital Gains | ||||||||||||||
U.S. EQUITY FUNDS | |||||||||||||||||||
U.S. CONVERTIBLE | |||||||||||||||||||
| For the period ended 09/30/08 (1) | $ | 24.89 | $ | 0.21 | $ | (2.81 | ) | $ | (2.60 | ) | $ | (0.19 | ) | $ | — | ||||
| For the year ended 03/31/08 | 24.37 | 0.11 | 0.91 | 1.02 | (0.39 | ) | (0.10 | ) | |||||||||||
| 12/30/06 (Commenced) to 03/31/07 | 23.47 | 0.12 | 0.91 | 1.03 | (0.13 | ) | — | ||||||||||||
| Ratios to Average Net Assets (4) | |||||||||||||||||||||||||||||||
| Expenses | Expenses Net of | Fund’s | |||||||||||||||||||||||||||||
| Net Asset | Net Assets, | Net | Expense | Net of | Reimbursement/ | Portfolio | |||||||||||||||||||||||||
| Total | Value, | Total | Ending | Investment | Total | (Reimbursements)/ | Reimbursement/ | Recoupment | Turnover | ||||||||||||||||||||||
| Distributions | Ending | Return (3) | (in 000’s) | Income (Loss) | Expenses | Recoupment | Recoupment | Offset (5) | Rate | ||||||||||||||||||||||
U.S. EQUITY FUNDS | |||||||||||||||||||||||||||||||
U.S. CONVERTIBLE | |||||||||||||||||||||||||||||||
| For the period ended 09/30/08 (1) | $ | (0.19 | ) | $ | 22.10 | (10.47 | %) | $ | 232,600 | 1.64 | % | 0.78 | % | — | 0.78 | % | 0.71 | % | 53 | % | |||||||||||
| For the year ended 03/31/08 | (0.50 | ) | 24.89 | 4.07 | % | 253,227 | 1.70 | % | 0.78 | % | — | 0.78 | % | 0.64 | % | 98 | % | ||||||||||||||
| 12/30/06 (Commenced) to 03/31/07 | (0.13 | ) | 24.37 | 4.39% | (6) | 97,007 | 1.97 | % | 0.77 | % | — | 0.77 | % | 0.60 | % | 92 | % | ||||||||||||||
(1) | Unaudited. |
(2) | Net investment income per share is calculated by dividing net investment income for the period by the average shares outstanding during the period. |
(3) | Total returns are not annualized for periods less than one year. |
(4) | Ratios are annualized for periods of less than one year. Expense reimbursements reflect voluntary reductions to total expenses, as discussed in the notes to financial statements. Such amounts would increase net investment income (loss) ratios had such reductions not occurred. |
(5) | Net expenses include certain items not subject to expense reimbursement. |
(6) | Inception to date Return. |
(7) | The expense reimbursement was terminated on January 23, 2006. |
See Accompanying Notes to Financial Statements.
62 & 63
NICHOLAS-APPLEGATE INSTITUTIONAL FUNDS
STATEMENTS OF ASSETS AND LIABILITIES
| U.S. Systematic | U.S. Small | ||||||||||||||||||
| U.S. Emerging | U.S. Ultra | Large Cap | to Mid Cap | ||||||||||||||||
| September 30, 2008 | U.S. Micro Cap | Growth | Micro Cap | Growth | Growth | U.S. Convertible | |||||||||||||
| Assets | |||||||||||||||||||
| Investments, at value*, (a) | $ | 69,942,560 | $ | 10,872,593 | $ | 1,568,632 | $ | 9,281,921 | $ | 4,450,911 | $ | 286,384,179 | |||||||
| Foreign currencies, at value** | — | — | — | — | — | — | |||||||||||||
| Cash | — | — | — | — | — | — | |||||||||||||
| Deposits with brokers for securities sold short | — | — | — | — | — | — | |||||||||||||
| Receivables: | |||||||||||||||||||
| Investment securities sold | 116,258 | 251,291 | 48,009 | 150,354 | 97,688 | — | |||||||||||||
| Capital shares sold | 24,952 | 100 | 50 | 20,770 | — | 8,500 | |||||||||||||
| Dividends | 5,842 | 2,646 | 70 | 14,333 | 1,215 | 122,344 | |||||||||||||
| Foreign taxes receivable | — | — | — | 103 | — | — | |||||||||||||
| Interest | — | — | — | — | — | 1,245,723 | |||||||||||||
| Other | 39,373 | 1,924 | — | — | 315 | — | |||||||||||||
| Total Assets | 70,128,985 | 11,128,554 | 1,616,761 | 9,467,481 | 4,550,129 | 287,760,746 | |||||||||||||
| Liabilities | |||||||||||||||||||
| Payables: | |||||||||||||||||||
| Bank overdraft | $ | — | $ | 1,947 | $ | — | $ | — | $ | — | $ | 21,334 | |||||||
| Investments purchased | 765,433 | 206,193 | 69,756 | 113,348 | 62,982 | 3,775,544 | |||||||||||||
| Capital shares redeemed | 66,861 | 110,171 | — | 52,697 | — | — | |||||||||||||
| Collateral on securities loaned | 6,983,207 | — | — | — | — | — | |||||||||||||
| Securities sold short | — | — | — | — | — | — | |||||||||||||
| Financing fee | — | — | — | — | — | — | |||||||||||||
| To investment advisor | 58,726 | 7,833 | 2,148 | 3,942 | 2,119 | 144,328 | |||||||||||||
| Dividends payable for short sales | — | — | — | — | — | — | |||||||||||||
| Other Liabilities | 46,182 | 7,381 | 1,099 | 11,349 | 3,091 | 121,806 | |||||||||||||
| Total Liabilities | 7,920,409 | 333,525 | 73,003 | 181,336 | 68,192 | 4,063,012 | |||||||||||||
| NET ASSETS | 62,208,576 | 10,795,029 | 1,543,758 | 9,286,145 | 4,481,937 | 283,697,734 | |||||||||||||
| * Investments, at cost | 63,541,583 | 11,431,122 | 1,597,731 | 9,728,316 | 4,691,159 | 310,889,266 | |||||||||||||
| ** Foreign currencies, at cost | — | — | — | — | — | — | |||||||||||||
| Proceeds for securities sold short | — | — | — | — | — | — | |||||||||||||
| Net Assets Consist Of: | |||||||||||||||||||
| Paid-in capital | $ | 67,456,483 | $ | 17,250,972 | $ | 1,706,157 | $ | 16,074,088 | $ | 5,365,859 | $ | 322,873,996 | |||||||
| Undistributed net investment income (loss) | (250,912 | ) | (24,338 | ) | (17,639 | ) | 25,143 | (12,374 | ) | 193,418 | |||||||||
| Accumulated net realized gain/(loss) on investments and foreign currencies and short sales | (4,414,765 | ) | (5,873,076 | ) | (115,661 | ) | (6,366,691 | ) | (631,300 | ) | (14,864,593 | ) | |||||||
| Net unrealized (depreciation) of investment and other assets and liabilities denominated in foreign currencies and short sales | (582,230 | ) | (558,529 | ) | (29,099 | ) | (446,395 | ) | (240,248 | ) | (24,505,087 | ) | |||||||
| Net Assets applicable to all shares outstanding | $ | 62,208,576 | $ | 10,795,029 | $ | 1,543,758 | $ | 9,286,145 | $ | 4,481,937 | $ | 283,697,734 | |||||||
| Net Assets of Class I shares | $ | 62,208,576 | $ | 8,174,597 | $ | 1,543,758 | $ | 693,522 | $ | 4,481,937 | $ | 13,396,434 | |||||||
| Net Assets of Class II shares | — | — | — | 3,508,308 | — | 37,701,524 | |||||||||||||
| Net Assets of Class III shares | — | — | — | — | — | — | |||||||||||||
| Net Assets of Class IV shares | — | — | — | — | — | 232,599,776 | |||||||||||||
| Net Assets of Class R shares | — | 2,620,432 | — | 5,084,315 | — | — | |||||||||||||
| Class I Shares outstanding | 5,521,390 | 769,651 | 174,618 | 39,498 | 539,027 | 606,264 | |||||||||||||
| Class II Shares outstanding | — | — | — | 200,581 | — | 1,706,247 | |||||||||||||
| Class III Shares outstanding | — | — | — | — | — | — | |||||||||||||
| Class IV Shares outstanding | — | — | — | — | — | 10,523,309 | |||||||||||||
| Class R Shares outstanding | — | 252,536 | — | 295,902 | — | — | |||||||||||||
| Net Asset Value — Class I Share | $ | 11.27 | $ | 10.62 | $ | 8.84 | $ | 17.56 | $ | 8.31 | $ | 22.01 | |||||||
| Net Asset Value — Class II Share | $ | — | $ | — | $ | — | $ | 17.49 | $ | — | $ | 22.01 | |||||||
| Net Asset Value — Class III Share | $ | — | $ | — | $ | — | $ | — | $ | — | $ | — | |||||||
| Net Asset Value — Class IV Share | $ | — | $ | — | $ | — | $ | — | $ | — | $ | 22.01 | |||||||
| Net Asset Value — Class R Share | $ | — | $ | 10.38 | $ | — | $ | 17.18 | $ | — | $ | — | |||||||
| (a) Including securities on loan with values of: | $ | 6,639,339 | $ | — | $ | — | $ | — | $ | — | $ | — | |||||||
| International | |||||||||||||||||||||||||
| Global Equity | Global | International | Growth | Emerging | International | International | U.S. High Yield | ||||||||||||||||||
| September 30, 2008 | 130/30 | Select | Growth | Opportunities | Markets | Systematic | All Cap Growth | Bond | |||||||||||||||||
| Assets | |||||||||||||||||||||||||
| Investments, at value*, (a) | $ | 3,618,480 | $ | 34,855,527 | $ | 17,578,531 | $ | 106,659,248 | $ | 13,059,345 | $ | 65,204,605 | $ | 10,437,653 | $ | 48,844,702 | |||||||||
| Foreign currencies, at value** | — | 1 | 8,777 | — | 379,995 | — | 3 | — | |||||||||||||||||
| Cash | — | 30,291 | 658 | 386,616 | 89,971 | 7,217 | 1,016 | — | |||||||||||||||||
| Deposits with brokers for securities sold short | 103 | — | — | — | — | — | — | — | |||||||||||||||||
| Receivables: | |||||||||||||||||||||||||
| Investment securities sold | 106,722 | 453,579 | 547,920 | 1,009,030 | 479,209 | 2,773,197 | 255,220 | — | |||||||||||||||||
| Capital shares sold | — | — | 31,898 | 3,774,809 | 25 | — | 1,923 | 131,972 | |||||||||||||||||
| Dividends | 9,005 | 87,580 | 55,398 | 289,663 | 51,181 | 205,188 | 29,297 | — | |||||||||||||||||
| Foreign taxes receivable | 1,409 | 74,331 | 35,087 | 17,056 | 369 | 51,694 | 17,343 | — | |||||||||||||||||
| Interest | — | — | — | — | — | — | — | 1,305,719 | |||||||||||||||||
| Other | — | — | 829 | — | — | 1,145 | 1,919 | — | |||||||||||||||||
| Total Assets | 3,735,719 | 35,501,309 | 18,259,098 | 112,136,422 | 14,060,095 | 68,243,046 | 10,744,374 | 50,282,393 | |||||||||||||||||
| Liabilities | |||||||||||||||||||||||||
| Payables: | |||||||||||||||||||||||||
| Bank overdraft | $ | 1,238 | $ | — | $ | — | $ | 26,679 | $ | — | $ | 13,735 | $ | — | $ | — | |||||||||
| Investments purchased | 89,099 | — | 408,065 | 646,408 | — | 1,845,248 | 560,683 | — | |||||||||||||||||
| Capital shares redeemed | — | 23,176 | 83,983 | 3,779,393 | — | 4,352 | 1,784 | 1,262,583 | |||||||||||||||||
| Collateral on securities loaned | — | — | — | — | — | — | — | — | |||||||||||||||||
| Securities sold short | 310,199 | — | — | — | — | — | — | — | |||||||||||||||||
| Financing fee | 4,133 | — | — | — | — | — | — | — | |||||||||||||||||
| To investment advisor | 3,481 | 22,207 | 8,418 | 70,059 | 11,977 | 30,335 | 7,786 | 18,563 | |||||||||||||||||
| Dividends payable for short sales | 1,414 | — | — | — | — | — | — | — | |||||||||||||||||
| Other Liabilities | 4,135 | 31,185 | 15,920 | 108,603 | 11,171 | 38,273 | 3,584 | 23,366 | |||||||||||||||||
| Total Liabilities | 413,699 | 76,568 | 516,386 | 4,631,142 | 23,148 | 1,931,943 | 573,837 | 1,304,512 | |||||||||||||||||
| NET ASSETS | 3,322,020 | 35,424,741 | 17,742,712 | 107,505,280 | 14,036,947 | 66,311,103 | 10,170,537 | 48,977,881 | |||||||||||||||||
| * Investments, at cost | 4,117,759 | 37,993,889 | 19,831,680 | 125,428,073 | 16,667,699 | 78,039,582 | 12,129,281 | 54,746,513 | |||||||||||||||||
| ** Foreign currencies, at cost | — | 1 | 10,178 | — | 381,678 | 273,409 | 3 | — | |||||||||||||||||
| Proceeds for securities sold short | 335,934 | — | — | — | — | — | — | — | |||||||||||||||||
| Net Assets Consist Of: | |||||||||||||||||||||||||
| Paid-in capital | $ | 4,147,196 | $ | 8,760,190 | $ | 29,489,105 | $ | 134,963,145 | $ | 16,311,111 | $ | 101,669,096 | $ | 15,123,712 | $ | 59,447,149 | |||||||||
| Undistributed net investment income (loss) | (7,784 | ) | 1,290,856 | 731,358 | 68,478 | 350,383 | 2,014,840 | 184,696 | 190,989 | ||||||||||||||||
| Accumulated net realized gain/(loss) on investments and foreign currencies and short sales | (343,729 | ) | 28,508,220 | (10,225,465 | ) | (8,771,724 | ) | 853,040 | (24,540,552 | ) | (3,447,252 | ) | (4,758,446 | ) | |||||||||||
| Net unrealized (depreciation) of investment and other assets and liabilities denominated in foreign currencies and short sales | (473,663 | ) | (3,134,525 | ) | (2,252,286 | ) | (18,754,619 | ) | (3,477,587 | ) | (12,832,281 | ) | (1,690,619 | ) | (5,901,811 | ) | |||||||||
| Net Assets applicable to all shares outstanding | $ | 3,322,020 | $ | 35,424,741 | $ | 17,742,712 | $ | 107,505,280 | $ | 14,036,947 | $ | 66,311,103 | $ | 10,170,537 | $ | 48,977,881 | |||||||||
| Net Assets of Class I shares | $ | 3,322,020 | $ | 25,927,948 | $ | 7,535,283 | $ | 82,635,518 | $ | 3,640,588 | $ | 21,266,598 | $ | 10,170,537 | $ | 48,977,881 | |||||||||
| Net Assets of Class II shares | — | 9,496,793 | 8,157,126 | 2,943,035 | 10,396,358 | 7,289,357 | — | — | |||||||||||||||||
| Net Assets of Class III shares | — | — | — | 21,958,506 | — | 37,759,253 | — | — | |||||||||||||||||
| Net Assets of Class IV shares | — | — | — | — | — | — | — | — | |||||||||||||||||
| Net Assets of Class R shares | — | — | 2,050,303 | — | — | — | — | — | |||||||||||||||||
| Class I Shares outstanding | 414,535 | 2,552,745 | 1,126,448 | 2,853,393 | 379,662 | 2,049,868 | 1,064,358 | 5,679,149 | |||||||||||||||||
| Class II Shares outstanding | — | 915,157 | 1,334,528 | 98,659 | 1,082,835 | 701,435 | — | — | |||||||||||||||||
| Class III Shares outstanding | — | — | — | 735,872 | — | 3,625,307 | — | — | |||||||||||||||||
| Class IV Shares outstanding | — | — | — | — | — | — | — | — | |||||||||||||||||
| Class R Shares outstanding | — | — | 366,447 | — | — | — | — | — | |||||||||||||||||
| Net Asset Value — Class I Share | $ | 8.01 | $ | 10.16 | $ | 6.69 | $ | 28.96 | $ | 9.59 | $ | 10.37 | $ | 9.56 | $ | 8.62 | |||||||||
| Net Asset Value — Class II Share | $ | — | $ | 10.38 | $ | 6.11 | $ | 29.83 | $ | 9.60 | $ | 10.39 | $ | — | $ | — | |||||||||
| Net Asset Value — Class III Share | $ | — | $ | — | $ | — | $ | 29.84 | $ | — | $ | 10.42 | $ | — | $ | — | |||||||||
| Net Asset Value — Class IV Share | $ | — | $ | — | $ | — | $ | — | $ | — | $ | — | $ | — | $ | — | |||||||||
| Net Asset Value — Class R Share | $ | — | $ | — | $ | 5.60 | $ | — | $ | — | $ | — | $ | — | $ | — | |||||||||
| (a) Including securities on loan with values of: | $ | — | $ | — | $ | — | $ | — | $ | — | $ | — | $ | — | $ | — | |||||||||
See Accompanying Notes to Financial Statements.
64 & 65
NICHOLAS-APPLEGATE INSTITUTIONAL FUNDS
STATEMENTS OF OPERATIONS
| U.S. Systematic | U.S. Small | ||||||||||||||||||
| Period Ended | U.S. Emerging | U.S. Ultra | Large Cap | to Mid Cap | |||||||||||||||
| September 30, 2008 (Unaudited) | U.S. Micro Cap | Growth | Micro Cap | Growth | Growth | U.S. Convertible | |||||||||||||
| Investment Income | |||||||||||||||||||
| Dividends, net of foreign taxes* | $ | 53,199 | $ | 23,448 | $ | 1,140 | $ | 102,204 | $ | 8,945 | $ | 1,230,756 | |||||||
| Interest | — | — | — | — | — | 2,539,441 | |||||||||||||
| Total Income | 53,199 | 23,448 | 1,140 | 102,204 | 8,945 | 3,770,197 | |||||||||||||
| Expenses | |||||||||||||||||||
| Advisory fee | 322,530 | 42,658 | 11,738 | 29,174 | 12,973 | 880,413 | |||||||||||||
| Administration fees | 174,166 | 23,319 | 5,713 | 36,791 | 10,379 | 368,718 | |||||||||||||
| Shareholder servicing fees | — | 3,856 | — | 7,387 | — | — | |||||||||||||
| Financing fees | — | — | — | — | — | — | |||||||||||||
| Professional fees | 2,244 | 363 | 28 | 595 | 168 | 10,569 | |||||||||||||
| Trustees’ fees and expenses | 9,232 | 1,420 | 104 | 2,457 | 637 | 46,323 | |||||||||||||
| Interest and credit facility fee | — | 103 | — | 1,770 | — | — | |||||||||||||
| Dividend expense on securities sold short | — | — | — | — | — | — | |||||||||||||
| Miscellaneous | 2,960 | 1,322 | 1,627 | 1,371 | 1,059 | 11,072 | |||||||||||||
| Total Expenses | 511,132 | 73,041 | 19,210 | 79,545 | 25,216 | 1,317,096 | |||||||||||||
| Expense offset | (207,021 | ) | (25,255 | ) | (431 | ) | (2,484 | ) | (3,897 | ) | (111,356 | ) | |||||||
| Net Expenses | 304,111 | 47,786 | 18,779 | 77,061 | 21,319 | 1,205,740 | |||||||||||||
| Net Investment Income (Loss) | (250,912 | ) | (24,338 | ) | (17,639 | ) | 25,143 | (12,374 | ) | 2,564,457 | |||||||||
| Net Realized and Unrealized | |||||||||||||||||||
| Gain (Loss) on Investments | |||||||||||||||||||
| Realized gain from: | |||||||||||||||||||
| Securities | (3,223,088 | ) | (903,928 | ) | (98,033 | ) | 415,224 | (310,696 | ) | (10,034,057 | ) | ||||||||
| Securities sold short | — | — | — | — | — | — | |||||||||||||
| Foreign currency transactions | — | — | — | — | — | — | |||||||||||||
| Net realized loss | (3,223,088 | ) | (903,928 | ) | (98,033 | ) | 415,224 | (310,696 | ) | (10,034,057 | ) | ||||||||
| Change in unrealized appreciation (depreciation) of: | |||||||||||||||||||
| Investments | 1,094,640 | (88,718 | ) | 15,072 | (926,520 | ) | (56,999 | ) | (25,803,129 | ) | |||||||||
| Securities sold short | — | — | — | — | — | — | |||||||||||||
| Other assets and liabilities denominated in foreign currencies | — | — | — | — | — | — | |||||||||||||
| Net unrealized appreciation (depreciation) | 1,094,640 | (88,718 | ) | 15,072 | (926,520 | ) | (56,999 | ) | (25,803,129 | ) | |||||||||
| Net (Loss) on Investments | (2,128,448 | ) | (992,646 | ) | (82,961 | ) | (511,296 | ) | (367,695 | ) | (35,837,186 | ) | |||||||
| Assets Resulting From Operations | $ | (2,379,360 | ) | $ | (1,016,984 | ) | $ | (100,600 | ) | $ | (486,153 | ) | $ | (380,069 | ) | $ | (33,272,729 | ) | |
| * Foreign taxes withheld | $ | — | $ | — | $ | — | $ | 77 | $ | — | $ | — | |||||||
| ** For the period April 1, 2008 through September 30, 2008 |
| International | |||||||||||||||||||||||||
| Period Ended | Global Equity | Global | International | Growth | Emerging | International | International | U.S. High Yield | |||||||||||||||||
| September 30, 2008 (Unaudited) | 130/30** | Select | Growth | Opportunities | Markets | Systematic | All Cap Growth | Bond | |||||||||||||||||
| Investment Income | |||||||||||||||||||||||||
| Dividends, net of foreign taxes* | $ | 57,751 | $ | 451,775 | $ | 374,809 | $ | 1,599,213 | $ | 375,872 | $ | 1,936,188 | $ | 134,957 | $ | — | |||||||||
| Interest | — | 314 | 79 | 116 | 154 | 238 | 70 | 2,173,272 | |||||||||||||||||
| Total Income | 57,751 | 452,089 | 374,888 | 1,599,329 | 376,026 | 1,936,426 | 135,027 | 2,173,272 | |||||||||||||||||
| Expenses | |||||||||||||||||||||||||
| Advisory fee | 22,371 | 140,196 | 57,381 | 410,815 | 84,795 | 235,534 | 41,892 | 103,369 | |||||||||||||||||
| Administration fees | 13,626 | 98,663 | 76,688 | 395,720 | 32,405 | 149,384 | 13,307 | 51,684 | |||||||||||||||||
| Shareholder servicing fees | — | — | 3,285 | — | — | — | — | — | |||||||||||||||||
| Financing fees | 12,320 | — | — | — | — | — | — | — | |||||||||||||||||
| Professional fees | 137 | 1,518 | 754 | 4,114 | 714 | 3,433 | 240 | 1,757 | |||||||||||||||||
| Trustees’ fees and expenses | 518 | 6,430 | 3,447 | 17,689 | 3,000 | 15,110 | 1,069 | 7,479 | |||||||||||||||||
| Interest and credit facility fee | 1,695 | 111 | 21 | 4,042 | 1,174 | 520 | 153 | 15 | |||||||||||||||||
| Dividend expense on securities sold short | 14,398 | — | — | — | — | — | — | — | |||||||||||||||||
| Miscellaneous | 939 | 2,920 | 1,624 | 4,759 | 5,017 | 4,103 | 1,085 | 2,491 | |||||||||||||||||
| Total Expenses | 66,004 | 249,838 | 143,200 | 837,139 | 127,105 | 408,084 | 57,745 | 166,795 | |||||||||||||||||
| Expense offset | (469 | ) | (46,819 | ) | (39,114 | ) | (170,161 | ) | (22,891 | ) | (72,568 | ) | (17,879 | ) | (11,183 | ) | |||||||||
| Net Expenses | 65,535 | 203,019 | 104,086 | 666,978 | 104,214 | 335,516 | 39,866 | 155,612 | |||||||||||||||||
| Net Investment Income (Loss) | (7,784 | ) | 249,070 | 270,802 | 932,351 | 271,812 | 1,600,910 | 95,161 | 2,017,660 | ||||||||||||||||
| Net Realized and Unrealized | |||||||||||||||||||||||||
| Gain (Loss) on Investments | |||||||||||||||||||||||||
| Realized gain from: | |||||||||||||||||||||||||
| Securities | (380,584 | ) | 49,313 | (1,101,257 | ) | (3,474,979 | ) | (2,447,441 | ) | (13,911,024 | ) | (420,659 | ) | (431,000 | ) | ||||||||||
| Securities sold short | 34,854 | — | — | — | — | — | — | — | |||||||||||||||||
| Foreign currency transactions | 2,001 | (4,573 | ) | (2,813 | ) | (20,120 | ) | 4,824 | (23,691 | ) | 198 | — | |||||||||||||
| Net realized loss | (343,729 | ) | 44,740 | (1,104,070 | ) | (3,495,099 | ) | (2,442,617 | ) | (13,934,715 | ) | (420,462 | ) | (431,000 | ) | ||||||||||
| Change in unrealized appreciation (depreciation) of: | |||||||||||||||||||||||||
| Investments | (499,279 | ) | (9,166,654 | ) | (3,955,009 | ) | (33,795,679 | ) | (3,778,284 | ) | (9,683,945 | ) | (2,345,792 | ) | (3,743,507 | ) | |||||||||
| Securities sold short | 25,735 | — | — | — | — | — | — | — | |||||||||||||||||
| Other assets and liabilities denominated in foreign currencies | (119 | ) | (10,103 | ) | (6,641 | ) | 15,375 | (38,427 | ) | 137,157 | (2,274 | ) | — | ||||||||||||
| Net unrealized appreciation (depreciation) | (473,663 | ) | (9,176,757 | ) | (3,961,650 | ) | (33,780,304 | ) | (3,816,711 | ) | (9,546,788 | ) | (2,348,066 | ) | (3,743,507 | ) | |||||||||
| Net (Loss) on Investments | (817,392 | ) | (9,132,017 | ) | (5,065,720 | ) | (37,275,403 | ) | (6,259,328 | ) | (23,481,503 | ) | (2,768,528 | ) | (4,174,507 | ) | |||||||||
| Assets Resulting From Operations | $ | (825,176 | ) | $ | (8,882,947 | ) | $ | (4,794,918 | ) | $ | (36,343,052 | ) | $ | (5,987,516 | ) | $ | (21,880,593 | ) | $ | (2,673,367 | ) | $ | (2,156,847 | ) | |
| * Foreign taxes withheld | $ | 4,692 | $ | 42,592 | $ | 41,841 | $ | 129,548 | $ | 45,208 | $ | 248,667 | $ | 14,057 | $ | — | |||||||||
| ** For the period April 1, 2008 through September 30, 2008 |
See Accompanying Notes to Financial Statements.
66 & 67
NICHOLAS-APPLEGATE INSTITUTIONAL FUNDS
STATEMENTS OF CHANGES IN NET ASSETS
| U.S. Micro Cap | U.S. Emerging Growth | U.S. Ultra Micro Cap | |||||||||||||||||
| September 30, | September 30, | September 30, | |||||||||||||||||
| Periods Ended September 30, 2008 | 2008 | March 31, | 2008 | March 31, | 2008 | March 31, | |||||||||||||
| and March 31, 2008 | (Unaudited) | 2008 | (Unaudited) | 2008 | (Unaudited) | 2008 | |||||||||||||
| Increase (Decrease) In Net Assets | |||||||||||||||||||
| From Investment Operations: | |||||||||||||||||||
| Net investment income (loss) | $ | (250,912 | ) | $ | (971,799 | ) | $ | (24,338 | ) | $ | (63,162 | ) | $ | (17,639 | ) | $ | (2,880 | ) | |
| Net realized gain (loss) | (3,223,088 | ) | 5,666,026 | (903,928 | ) | 1,109,622 | (98,033 | ) | (17,628 | ) | |||||||||
| Net unrealized appreciation (depreciation) | 1,094,640 | (13,753,967 | ) | (88,718 | ) | (1,932,344 | ) | 15,072 | (44,171 | ) | |||||||||
| Investment operations | (2,379,360 | ) | (9,059,740 | ) | (1,016,984 | ) | (885,884 | ) | (100,600 | ) | (64,679 | ) | |||||||
| Distributions to Shareholders: | |||||||||||||||||||
| From net investment income | |||||||||||||||||||
| Class I | — | — | — | — | — | — | |||||||||||||
| Class II | — | — | — | — | — | — | |||||||||||||
| Class IV | — | — | — | — | — | — | |||||||||||||
| Class R | — | — | — | — | — | — | |||||||||||||
| From net realized gains | |||||||||||||||||||
| Class I | — | (9,796,779 | ) | — | (527,551 | ) | — | — | |||||||||||
| Class II | — | (98,864 | ) | — | — | — | — | ||||||||||||
| Class IV | — | — | — | — | — | — | |||||||||||||
| Class R | — | — | — | (217,858 | ) | — | — | ||||||||||||
| Total distributions | — | (9,895,643 | ) | — | (745,409 | ) | — | — | |||||||||||
| From Capital Share Transactions: | |||||||||||||||||||
| Proceeds from shares sold | |||||||||||||||||||
| Class I | 8,807,814 | 17,361,071 | 2,522,120 | 2,539,292 | 758,210 | 950,827 | |||||||||||||
| Class II | — | 110,838 | — | — | — | — | |||||||||||||
| Class IV | — | — | — | — | — | — | |||||||||||||
| Class R | — | — | 396,676 | 1,124,520 | — | — | |||||||||||||
| Distributions reinvested | |||||||||||||||||||
| Class I | — | 9,746,287 | — | 526,107 | — | — | |||||||||||||
| Class II | — | 98,864 | — | — | — | — | |||||||||||||
| Class IV | — | — | — | — | — | — | |||||||||||||
| Class R | — | — | — | 217,859 | — | — | |||||||||||||
| Cost of shares redeemed | |||||||||||||||||||
| Class I | (4,342,274 | ) | (32,282,224 | ) | (1,056,312 | ) | (1,777,085 | ) | — | — | |||||||||
| Class II | — | (3,054,309 | ) | — | — | — | — | ||||||||||||
| Class IV | — | — | — | — | — | — | |||||||||||||
| Class R | — | — | (419,737 | ) | (1,216,005 | ) | — | — | |||||||||||
| Net increase (decrease) in net assets | |||||||||||||||||||
| from share transactions | 4,465,540 | (8,019,473 | ) | 1,442,747 | 1,414,688 | 758,210 | 950,827 | ||||||||||||
| Net Increase (Decrease) in Net Assets | 2,086,180 | (26,974,856 | ) | 425,763 | (216,605 | ) | 657,610 | 886,148 | |||||||||||
| Net Assets | �� | ||||||||||||||||||
| Beginning | 60,122,396 | 87,097,252 | 10,369,266 | 10,585,871 | 886,148 | — | |||||||||||||
| Ending | $ | 62,208,576 | $ | 60,122,396 | $ | 10,795,029 | $ | 10,369,266 | $ | 1,543,758 | $ | 886,148 | |||||||
| Undistributed net investment income, ending | $ | 250,912 | $ | — | $ | 24,338 | $ | — | $ | 17,639 | $ | — | |||||||
| Class I — Capital Share Activity | |||||||||||||||||||
| Shares sold | 697,707 | 1,152,958 | 205,087 | 182,466 | 79,096 | 95,521 | |||||||||||||
| Distributions reinvested | — | 692,700 | — | 37,552 | — | — | |||||||||||||
| Shares redeemed | (361,155 | ) | (2,167,801 | ) | (90,141 | ) | (131,451 | ) | — | — | |||||||||
| Net Class I Share Activity | 336,552 | (322,143 | ) | 114,946 | 88,567 | 79,096 | 95,521 | ||||||||||||
| Class II — Capital Share Activity | |||||||||||||||||||
| Shares sold | — | 6,464 | — | — | — | — | |||||||||||||
| Distributions reinvested | — | 6,952 | — | — | — | — | |||||||||||||
| Shares redeemed | — | (187,792 | ) | — | — | — | — | ||||||||||||
| Net Class II Share Activity | — | (174,376 | ) | — | — | — | — | ||||||||||||
| Class IV — Capital Share Activity | |||||||||||||||||||
| Shares sold | — | — | — | — | — | — | |||||||||||||
| Distributions reinvested | — | — | — | — | — | — | |||||||||||||
| Shares redeemed | — | — | — | — | — | — | |||||||||||||
| Net Class IV Share Activity | — | — | — | — | — | — | |||||||||||||
| Class R — Capital Share Activity | |||||||||||||||||||
| Shares sold | — | — | 33,659 | 79,606 | — | — | |||||||||||||
| Distributions reinvested | — | — | — | 15,891 | — | — | |||||||||||||
| Shares redeemed | — | — | (37,449 | ) | (86,526 | ) | — | — | |||||||||||
| Net Class R Share Activity | — | — | (3,790 | ) | 8,971 | — | — | ||||||||||||
| U.S. Systematic | Global Equity | |||||||||||||||||||||
| Large Cap Growth | U.S. Small to Mid Cap Growth | U.S. Convertible | 130/30 | |||||||||||||||||||
| September 30, | September 30, | September 30, | September 30, | |||||||||||||||||||
| Periods Ended September 30, 2008 | 2008 | March 31, | 2008 | March 31, | 2008 | March 31, | 2008 | |||||||||||||||
| and March 31, 2008 | (Unaudited) | 2008 | (Unaudited) | 2008 | (Unaudited) | 2008 | (Unaudited) | |||||||||||||||
| Increase (Decrease) In Net Assets | ||||||||||||||||||||||
| From Investment Operations: | ||||||||||||||||||||||
| Net investment income (loss) | $ | 25,143 | $ | (17,588 | ) | $ | (12,374 | ) | $ | (17,854 | ) | $ | 2,564,457 | $ | 3,307,246 | $ | (7,784 | ) | ||||
| Net realized gain (loss) | 415,224 | 1,142,381 | (310,696 | ) | (320,604 | ) | (10,034,057 | ) | 2,428,013 | (343,729 | ) | |||||||||||
| Net unrealized appreciation (depreciation) | (926,520 | ) | (1,503,590 | ) | (56,999 | ) | (183,249 | ) | (25,803,129 | ) | (8,015,589 | ) | 473,663 | |||||||||
| Investment operations | (486,153 | ) | (378,797 | ) | (380,069 | ) | (521,707 | ) | (33,272,729 | ) | (2,280,330 | ) | (825,176 | ) | ||||||||
| Distributions to Shareholders: | ||||||||||||||||||||||
| From net investment income | ||||||||||||||||||||||
| Class I | — | — | — | — | (232,087 | ) | (514,906 | ) | — | |||||||||||||
| Class II | — | (16,091 | ) | — | — | (177,316 | ) | (122,122 | ) | — | ||||||||||||
| Class IV | — | — | — | — | (2,003,554 | ) | (2,605,259 | ) | — | |||||||||||||
| Class R | — | — | — | — | — | — | — | |||||||||||||||
| From net realized gains | ||||||||||||||||||||||
| Class I | — | — | — | — | — | (150,355 | ) | — | ||||||||||||||
| Class II | — | — | — | — | — | (38,002 | ) | — | ||||||||||||||
| Class IV | — | — | — | — | — | (710,833 | ) | — | ||||||||||||||
| Class R | — | — | — | — | — | — | — | |||||||||||||||
| Total distributions | — | (16,091 | ) | — | — | (2,412,957 | ) | (4,141,477 | ) | — | ||||||||||||
| From Capital Share Transactions: | ||||||||||||||||||||||
| Proceeds from shares sold | ||||||||||||||||||||||
| Class I | 27,670 | 106,984 | — | 5,383,713 | 8,440,790 | 15,784,572 | 4,148,209 | |||||||||||||||
| Class II | — | 2,468,812 | — | — | 41,196,161 | 965,357 | — | |||||||||||||||
| Class IV | — | — | — | — | 8,300,891 | 164,185,347 | — | |||||||||||||||
| Class R | 187,095 | 486,815 | — | — | — | — | — | |||||||||||||||
| Distributions reinvested | ||||||||||||||||||||||
| Class I | — | 16,091 | — | — | 227,083 | 654,378 | — | |||||||||||||||
| Class II | — | — | — | — | 177,316 | 160,124 | — | |||||||||||||||
| Class IV | — | — | — | — | 2,949 | 4,685 | — | |||||||||||||||
| Class R | — | — | — | — | — | — | — | |||||||||||||||
| Cost of shares redeemed | ||||||||||||||||||||||
| Class I | (55,896 | ) | (262,579 | ) | — | — | (41,865,975 | ) | (9,010,639 | ) | (1,013 | ) | ||||||||||
| Class II | (7,210,210 | ) | (1,650,704 | ) | — | — | (7,199,717 | ) | — | — | ||||||||||||
| Class IV | (382,762 | ) | (571,886 | ) | — | — | — | (127,582 | ) | — | ||||||||||||
| Class R | — | — | — | — | — | — | — | |||||||||||||||
| Net increase (decrease) in net assets | ||||||||||||||||||||||
| from share transactions | (7,434,103 | ) | 593,733 | — | 5,383,713 | 9,279,498 | 172,616,242 | 4,147,196 | ||||||||||||||
| Net Increase (Decrease) in Net Assets | ||||||||||||||||||||||
| Net Assets | (7,920,256 | ) | 198,845 | (380,069 | ) | 4,862,006 | (26,406,188 | ) | 166,194,435 | 3,322,020 | ||||||||||||
| Beginning | 17,206,401 | 17,007,556 | 4,862,006 | — | 310,103,922 | 143,909,487 | — | |||||||||||||||
| Ending | $ | 9,286,145 | $ | 17,206,401 | $ | 4,481,937 | $ | 4,862,006 | $ | 283,697,734 | $ | 310,103,922 | $ | 3,322,020 | ||||||||
| Undistributed net investment income, ending | $ | 25,143 | $ | - | $ | 12,374 | $ | – | $ | 193,419 | $ | 41,918 | $ | 7,784 | ||||||||
| Class I — Capital Share Activity | ||||||||||||||||||||||
| Shares sold | 1,531 | 5,151 | — | 539,027 | 326,085 | 630,900 | 414,635 | |||||||||||||||
| Distributions reinvested | — | — | — | — | 9,281 | 25,119 | — | |||||||||||||||
| Shares redeemed | (2,815 | ) | 12,161 | — | — | (1,649,475 | ) | (338,123 | ) | (100 | ) | |||||||||||
| Net Class I Share Activity | (1,284 | ) | (7,010 | ) | — | 539,027 | (1,314,109 | ) | 317,896 | 414,535 | ||||||||||||
| Class II — Capital Share Activity | ||||||||||||||||||||||
| Shares sold | — | 113,463 | — | — | 1,621,749 | 36,196 | — | |||||||||||||||
| Distributions reinvested | — | 704 | — | — | 8,027 | 6,118 | — | |||||||||||||||
| Shares redeemed | (348,642 | ) | (75,329 | ) | — | — | (289,391 | ) | — | — | ||||||||||||
| Net Class II Share Activity | (348,642 | ) | 38,838 | — | — | 1,340,385 | 42,314 | — | ||||||||||||||
| Class IV — Capital Share Activity | ||||||||||||||||||||||
| Shares sold | — | — | — | — | 349,871 | 6,197,172 | — | |||||||||||||||
| Distributions reinvested | — | — | — | — | 127 | 180 | — | |||||||||||||||
| Shares redeemed | — | — | — | — | — | (4,794 | ) | — | ||||||||||||||
| Net Class IV Share Activity | — | — | — | — | 349,998 | 6,192,558 | — | |||||||||||||||
| Class R — Capital Share Activity | ||||||||||||||||||||||
| Shares sold | 9,510 | 23,608 | — | — | — | — | — | |||||||||||||||
| Distributions reinvested | — | — | — | — | — | — | — | |||||||||||||||
| Shares redeemed | (20,108 | ) | (27,157 | ) | — | — | — | — | — | |||||||||||||
| Net Class R Share Activity | (10,598 | ) | (3,549 | ) | — | — | — | — | — | |||||||||||||
See Accompanying Notes to Financial Statements.
68 & 69
NICHOLAS-APPLEGATE INSTITUTIONAL FUNDS
STATEMENTS OF CHANGES IN NET ASSETS
| International | |||||||||||||||||||
| Global Select | International Growth | Growth Opportunities | |||||||||||||||||
| September 30, | September 30, | September 30, | |||||||||||||||||
| Periods Ended September 30, 2008 | 2008 | March 31, | 2008 | March 31, | 2008 | March 31, | |||||||||||||
| and March 31, 2008 | (Unaudited) | 2008 | (Unaudited) | 2008 | (Unaudited) | 2008 | |||||||||||||
| Increase (Decrease) In Net Assets | |||||||||||||||||||
| From Investment Operations: | |||||||||||||||||||
| Net investment income | $ | 249,070 | $ | 753,296 | $ | 270,802 | $ | 515,715 | $ | 932,351 | $ | 839,340 | |||||||
| Net realized gain (loss) | 44,740 | 32,195,785 | (1,104,070 | ) | 22,032,681 | (3,495,099 | ) | 628,324,600 | |||||||||||
| Net unrealized (depreciation) | (9,176,757 | ) | (15,140,580 | ) | (3,961,650 | ) | (10,216,944 | ) | (33,780,304 | ) | (46,775,990 | ) | |||||||
| Investment operations | (8,882,947 | ) | 17,808,501 | (4,794,918 | ) | 12,331,452 | (36,343,052 | ) | 22,387,950 | ||||||||||
| Distributions to Shareholders: | |||||||||||||||||||
| From net investment income | |||||||||||||||||||
| Class I | — | (612,353 | ) | — | (102,579 | ) | — | (2,374,268 | ) | ||||||||||
| Class II | — | (2,152 | ) | — | (264,648 | ) | — | (69,543 | ) | ||||||||||
| Class III | — | — | — | — | — | — | |||||||||||||
| Class IV | — | — | — | — | — | — | |||||||||||||
| Class R | — | — | — | (122,626 | ) | — | — | ||||||||||||
| From net realized gains | |||||||||||||||||||
| Class I | — | (14,408,538 | ) | — | (6,119,767 | ) | — | (36,837,182 | ) | ||||||||||
| Class II | — | (5,564,143 | ) | — | (7,384,655 | ) | — | (3,939,300 | ) | ||||||||||
| Class III | — | — | — | — | — | (12,535 | ) | ||||||||||||
| Class IV | — | — | — | — | — | — | |||||||||||||
| Class R | — | — | — | (2,036,861 | ) | — | — | ||||||||||||
| Total distributions | — | (20,587,186 | ) | — | (16,031,136 | ) | — | (43,232,828 | ) | ||||||||||
| From Capital Share Transactions: | |||||||||||||||||||
| Proceeds from shares sold | |||||||||||||||||||
| Class I | 2,334,923 | 3,385,644 | 1,171,131 | 4,506,739 | 15,657,248 | 60,762,777 | |||||||||||||
| Class II | 3,565,280 | 2,410,773 | — | 12,456,347 | 4,064,557 | 1,218,257 | |||||||||||||
| Class III | — | — | — | — | 25,010,796 | 45,968 | |||||||||||||
| Class IV | — | — | — | — | — | 26,893 | |||||||||||||
| Class R | — | — | 386,485 | 952,934 | — | — | |||||||||||||
| Distributions reinvested | |||||||||||||||||||
| Class I | — | 11,901,041 | — | 6,217,911 | — | 37,309,080 | |||||||||||||
| Class II | — | 5,566,296 | — | 7,649,303 | — | — | |||||||||||||
| Class III | — | — | — | — | — | 12,534 | |||||||||||||
| Class IV | — | — | — | — | — | — | |||||||||||||
| Class R | — | — | — | 2,159,486 | — | — | |||||||||||||
| Cost of shares redeemed | |||||||||||||||||||
| Class I | (2,838,184 | ) | (51,776,128 | ) | (1,148,582 | ) | (11,550,042 | ) | (15,807,425 | ) | (52,627,289 | ) | |||||||
| Class II | (40,102 | ) | (96,844,060 | ) | (1,123,348 | ) | (63,923,305 | ) | (6,529,252 | ) | (75,339,925 | ) | |||||||
| Class III | — | — | — | — | — | (5,460,800 | ) | ||||||||||||
| Class IV | — | — | — | — | — | (75,746,255 | ) | ||||||||||||
| Class R | — | — | (357,506 | ) | (873,729 | ) | — | — | |||||||||||
| Net increase (decrease) in net assets | |||||||||||||||||||
| from share transactions | 3,021,917 | (125,356,434 | ) | (1,071,820 | ) | (42,404,356 | ) | 22,395,924 | (109,798,760 | ) | |||||||||
| Net Increase (Decrease) in Net Assets | (5,861,030 | ) | (128,135,119 | ) | (5,866,738 | ) | 46,104,040 | (13,947,128 | ) | (130,643,638 | ) | ||||||||
| Net Assets | |||||||||||||||||||
| Beginning | 41,285,771 | 169,420,890 | 23,609,450 | 69,713,490 | 121,452,408 | 252,096,046 | |||||||||||||
| Ending | $ | 35,424,741 | $ | 41,285,771 | $ | 17,742,712 | $ | 23,609,450 | $ | 107,505,280 | $ | 121,452,408 | |||||||
| Undistributed net investment income, ending | $ | 1,290,856 | $ | 1,041,786 | $ | 731,357 | $ | 460,556 | $ | 68,478 | $ | (863,873 | ) | ||||||
| Class I — Capital Share Activity | |||||||||||||||||||
| Shares sold | 196,505 | 192,981 | 147,307 | 318,579 | 453,232 | 1,089,540 | |||||||||||||
| Distributions reinvested | — | 835,747 | — | 675,126 | — | 841,432 | |||||||||||||
| Shares redeemed | (226,679 | ) | (2,669,279 | ) | (143,605 | ) | (542,226 | ) | (423,883 | ) | (920,041 | ) | |||||||
| Net Class I Share Activity | (30,174 | ) | (1,640,551 | ) | 3,702 | 451,479 | 29,349 | 1,010,931 | |||||||||||
| Class II — Capital Share Activity | |||||||||||||||||||
| Shares sold | 251,076 | 114,030 | — | 615,162 | 111,423 | 20,169 | |||||||||||||
| Distributions reinvested | — | 382,826 | — | 911,717 | — | — | |||||||||||||
| Shares redeemed | (2,949 | ) | (4,713,094 | ) | (158,822 | ) | (2,377,559 | ) | (211,718 | ) | (1,099,006 | ) | |||||||
| Net Class II Share Activity | 248,127 | (4,216,238 | ) | (158,822 | ) | (850,680 | ) | (100,295 | ) | (1,078,837 | ) | ||||||||
| Class III — Capital Share Activity | |||||||||||||||||||
| Shares sold | — | — | — | — | 735,872 | 669 | |||||||||||||
| Distributions reinvested | — | — | — | — | — | 273 | |||||||||||||
| Shares redeemed | — | — | — | — | — | (82,580 | ) | ||||||||||||
| Net Class III Share Activity | — | — | — | — | 735,872 | (81,638 | ) | ||||||||||||
| Class IV — Capital Share Activity | |||||||||||||||||||
| Shares sold | — | — | — | — | — | 402 | |||||||||||||
| Distributions reinvested | — | — | — | — | — | — | |||||||||||||
| Shares redeemed | — | — | — | — | — | (1,212,404 | ) | ||||||||||||
| Net Class IV Share Activity | — | — | — | — | — | (1,212,002 | ) | ||||||||||||
| Class R — Capital Share Activity | |||||||||||||||||||
| Shares sold | — | — | 55,128 | 48,877 | — | — | |||||||||||||
| Distributions reinvested | — | — | — | 279,726 | — | — | |||||||||||||
| Shares redeemed | — | — | (55,043 | ) | (67,553 | ) | — | — | |||||||||||
| Net Class R Share Activity | — | — | 85 | 261,050 | — | — | |||||||||||||
| International | |||||||||||||||||||||||||
| Emerging Markets | International Systematic | All Cap Growth | U.S. High Yield Bond | ||||||||||||||||||||||
| September 30, | September 30, | September 30, | September 30, | ||||||||||||||||||||||
| Periods Ended September 30, 2008 | 2008 | March 31, | 2008 | March 31, | 2008 | March 31, | 2008 | March 31, | |||||||||||||||||
| and March 31, 2008 | (Unaudited) | 2008 | (Unaudited) | 2008 | (Unaudited) | 2008 | (Unaudited) | 2008 | |||||||||||||||||
| Increase (Decrease) In Net Assets | |||||||||||||||||||||||||
| From Investment Operations: | |||||||||||||||||||||||||
| Net investment income | $ | 271,812 | $ | 266,966 | $ | 1,600,910 | $ | 1,558,184 | $ | 95,161 | $ | 181,081 | $ | 2,017,660 | $ | 5,120,757 | |||||||||
| Net realized gain (loss) | (2,442,617 | ) | 7,702,427 | (13,934,715 | ) | (6,595,549 | ) | (420,462 | ) | 9,344,656 | (431,000 | ) | (36,608 | ) | |||||||||||
| Net unrealized (depreciation) | (3,816,711 | ) | (419,728 | ) | (9,546,788 | ) | (7,581,342 | ) | 2,348,066 | (4,606,291 | ) | (3,743,507 | ) | (6,230,507 | ) | ||||||||||
| Investment operations | (5,987,516 | ) | 7,549,665 | (21,880,593 | ) | (12,618,707 | ) | (2,673,367 | ) | 4,919,446 | (2,156,847 | ) | (1,146,358 | ) | |||||||||||
| Distributions to Shareholders: | |||||||||||||||||||||||||
| From net investment income | |||||||||||||||||||||||||
| Class I | — | (14,063 | ) | — | (362,782 | ) | — | (289,056 | ) | (2,069,921 | ) | (4,645,370 | ) | ||||||||||||
| Class II | — | (174,362 | ) | — | (344,624 | ) | — | — | — | (708,781 | ) | ||||||||||||||
| Class III | — | — | — | (685,445 | ) | — | — | — | — | ||||||||||||||||
| Class IV | — | — | — | — | — | — | — | — | |||||||||||||||||
| Class R | — | — | — | — | — | — | — | — | |||||||||||||||||
| From net realized gains | |||||||||||||||||||||||||
| Class I | — | (291,347 | ) | — | (1,381,086 | ) | — | (1,461,993 | ) | — | — | ||||||||||||||
| Class II | — | (4,120,846 | ) | — | (1,380,699 | ) | — | — | — | — | |||||||||||||||
| Class III | — | — | — | (2,628,903 | ) | — | — | — | — | ||||||||||||||||
| Class IV | — | — | — | — | — | — | — | — | |||||||||||||||||
| Class R | — | — | — | — | — | — | — | — | |||||||||||||||||
| Total distributions | — | (4,600,618 | ) | — | (6,783,539 | ) | — | (1,751,049 | ) | (2,069,921 | ) | (5,354,151 | ) | ||||||||||||
| From Capital Share Transactions: | |||||||||||||||||||||||||
| Proceeds from shares sold | |||||||||||||||||||||||||
| Class I | 3,677,277 | 2,500,423 | 2,761,031 | 28,313,307 | 6,841,031 | 3,445,406 | 7,983,221 | 15,112,012 | |||||||||||||||||
| Class II | 1,500 | 115,682 | 744,764 | 26,458,558 | — | — | — | 57,244 | |||||||||||||||||
| Class III | — | — | 750 | 29,728 | — | — | — | — | |||||||||||||||||
| Class IV | — | — | — | — | — | — | — | — | |||||||||||||||||
| Class R | — | — | — | — | — | — | — | — | |||||||||||||||||
| Distributions reinvested | |||||||||||||||||||||||||
| Class I | — | 305,410 | — | 1,681,704 | — | 1,751,051 | 1,944,042 | 4,260,974 | |||||||||||||||||
| Class II | — | 4,295,207 | — | 1,725,322 | — | — | — | 5,404 | |||||||||||||||||
| Class III | — | — | — | 3,314,349 | — | — | — | — | |||||||||||||||||
| Class IV | — | — | — | — | — | — | — | — | |||||||||||||||||
| Class R | — | — | — | — | — | — | — | — | |||||||||||||||||
| Cost of shares redeemed | |||||||||||||||||||||||||
| Class I | (800,443 | ) | (54,413 | ) | (108,493 | ) | (4,245,485 | ) | (1,337,398 | ) | (24,851,609 | ) | (6,993,328 | ) | (27,693,992 | ) | |||||||||
| Class II | (1,000 | ) | (32,139,382 | ) | (16,037,896 | ) | (8,925,925 | ) | — | — | — | (32,698,711 | ) | ||||||||||||
| Class III | — | — | — | (66,872 | ) | — | — | — | — | ||||||||||||||||
| Class IV | — | — | — | — | — | — | — | — | |||||||||||||||||
| Class R | — | — | — | — | — | — | — | — | |||||||||||||||||
| Net increase (decrease) in net assets | |||||||||||||||||||||||||
| from share transactions | 2,877,334 | (24,977,073 | ) | (12,639,844 | ) | 48,284,686 | 5,503,633 | (19,655,152 | ) | 2,933,935 | (40,957,069 | ) | |||||||||||||
| Net Increase (Decrease) in Net Assets | (3,110,182 | ) | (22,028,026 | ) | (34,520,437 | ) | 28,882,440 | 2,830,266 | (16,486,755 | ) | (1,292,833 | ) | (47,457,578 | ) | |||||||||||
| Net Assets | |||||||||||||||||||||||||
| Beginning | 17,147,129 | 39,175,155 | 100,831,540 | 71,949,100 | 7,340,271 | 23,827,026 | 50,270,714 | 97,728,292 | |||||||||||||||||
| Ending | $ | 14,036,947 | $ | 17,147,129 | $ | 66,311,103 | $ | 100,831,540 | $ | 10,170,537 | $ | 7,340,271 | $ | 48,977,881 | $ | 50,270,714 | |||||||||
| Undistributed net investment income, ending | $ | 353,014 | $ | 78,571 | $ | 2,014,841 | $ | 413,930 | $ | 184,696 | $ | 89,535 | $ | 190,989 | $ | 243,250 | |||||||||
| Class I — Capital Share Activity | |||||||||||||||||||||||||
| Shares sold | 259,103 | 160,501 | 249,361 | 1,688,592 | 573,623 | 244,259 | 966,689 | 1,521,238 | |||||||||||||||||
| Distributions reinvested | — | 19,806 | — | 110,493 | — | 133,363 | 108,242 | 433,889 | |||||||||||||||||
| Shares redeemed | (63,660 | ) | (3,445 | ) | (7,661 | ) | (279,597 | ) | (120,303 | ) | (1,419,579 | ) | (767,772 | ) | (2,806,757 | ) | |||||||||
| Net Class I Share Activity | 195,443 | 176,862 | 241,700 | 1,519,488 | 453,320 | (1,041,957 | ) | 307,159 | (851,630 | ) | |||||||||||||||
| Class II — Capital Share Activity | |||||||||||||||||||||||||
| Shares sold | 115 | 7,699 | 54,010 | 1,621,046 | — | — | — | 5,705 | |||||||||||||||||
| Distributions reinvested | — | 278,367 | — | 113,210 | — | — | — | 386 | |||||||||||||||||
| Shares redeemed | (107 | ) | (2,261,227 | ) | (1,337,592 | ) | (544,129 | ) | — | — | — | (3,305,489 | ) | ||||||||||||
| Net Class II Share Activity | 8 | (1,975,161 | ) | (1,283,582 | ) | 1,190,127 | — | — | — | (3,299,398 | ) | ||||||||||||||
| Class III — Capital Share Activity | |||||||||||||||||||||||||
| Shares sold | — | — | 56 | 1,938 | — | — | — | — | |||||||||||||||||
| Distributions reinvested | — | — | — | 217,334 | — | — | — | — | |||||||||||||||||
| Shares redeemed | — | — | — | (3,906 | ) | — | — | — | — | ||||||||||||||||
| Net Class III Share Activity | — | — | 56 | 215,366 | — | — | — | — | |||||||||||||||||
| Class IV — Capital Share Activity | |||||||||||||||||||||||||
| Shares sold | — | — | — | — | — | — | — | — | |||||||||||||||||
| Distributions reinvested | — | — | — | — | — | — | — | — | |||||||||||||||||
| Shares redeemed | — | — | — | — | — | — | �� | — | |||||||||||||||||
| Net Class IV Share Activity | — | — | — | — | — | — | — | — | |||||||||||||||||
| Class R — Capital Share Activity | |||||||||||||||||||||||||
| Shares sold | — | — | — | — | — | — | — | — | |||||||||||||||||
| Distributions reinvested | — | — | — | — | — | — | — | — | |||||||||||||||||
| Shares redeemed | — | — | — | — | — | — | — | — | |||||||||||||||||
| Net Class R Share Activity | — | — | — | — | — | — | — | — | |||||||||||||||||
See Accompanying Notes to Financial Statements.
70 & 71
NICHOLAS-APPLEGATE INSTITUTIONAL FUNDS
STATEMENT OF CASH FLOWS
Period Ended September 30, 2008 (Unaudited) | Global Equity 130/30 | |||
| Cash Flows from Operating Activities | ||||
| Net loss | $ | (825,176 | ) | |
| Adjustments to reconcile net loss to net cash used in operating activities | ||||
| Changes in: | ||||
| Purchase of investment securities | (6,589,139 | ) | ||
| Proceeds from disposition of investment securities | 2,129,544 | |||
| Purchase of short term securities, net | (38,747 | ) | ||
| Proceeds from securities sold short | 1,601,151 | |||
| Purchase to cover short positions | (1,540,563 | ) | ||
| Increase in deposits with brokers for short sales | (103 | ) | ||
| Increase in dividends and interest receivable | (10,414 | ) | ||
| Increase in receivable for securities sold | (106,722 | ) | ||
| Increase in securities sold short | 310,199 | |||
| Increase in payable for securities purchased | 89,099 | |||
| Increase in accrued expenses | 13,163 | |||
| Unrealized appreciation on securities and currencies | 473,544 | |||
| Net realized gain from investments and currencies | 345,730 | |||
| Net cash used in operating activities | (4,148,434 | ) | ||
| Cash Flows from Financing Activities | ||||
| Proceeds from shares sold | 4,148,209 | |||
| Payment on shares redeemed | (1,013 | ) | ||
| Bank overdraft | 1,238 | |||
| Net cash provided by financing activities | 4,148,434 | |||
| Net change in cash | — | |||
| Cash, beginning of period | — | |||
| Cash, end of period | $ | — | ||
See Accompanying Notes to Financial Statements.
72
NICHOLAS-APPLEGATE INSTITUTIONAL FUNDS
NOTES TO FINANCIAL STATEMENTS — (Unaudited)
NOTE A — ORGANIZATION
Nicholas-Applegate Institutional Funds (the “Trust”) is an open-end investment management company. The Trust was established as a Delaware business trust on December 17, 1992 and consists of fourteen separate portfolios (collectively the “Funds” and each a “Fund”). Each Fund’s investment objectives, strategies and risks are discussed in the Funds’ current prospectuses. All of the Funds have issued Class I shares (“Class I”), seven Funds have issued Class II shares (“Class II”), two Funds have issued Class III shares (“Class III”), one Fund has issued Class IV shares (“Class IV”) and three Funds have issued Retirement shares (“Class R”). No shares have a sales charge. Class R has a distribution fee. The Funds offering Class I, Class II, Class III and Class IV shares are covered in this report.
NOTE B — SIGNIFICANT ACCOUNTING POLICIES
Significant accounting policies consistently followed by the Funds in preparing these financial statements are described below. The policies conform with accounting principles generally accepted in the United States.
Security Valuations
Equity securities, including ADRs, SDR’s and GDRs, that are traded on a stock exchange or on the NASDAQ National Market System are valued at the last sale price as of the close of business on the New York Stock Exchange (normally 4:00 p.m. New York time) on the day the securities are being valued, or lacking any sales, at the mean between the closing bid and asked prices. Securities listed or traded on certain non-U.S. exchanges whose operations are similar to the United States over-the-counter market are valued at the price within the limits of the latest available current bid and asked prices deemed by the Adviser to best reflect fair value. A security that is listed or traded on more than one exchange is valued at the quotation on the exchange determined to be the primary market for such security by the Adviser. The Adviser has determined the Xetra is the primary market in Germany. Equity Linked Notes (“ELN’s”) are valued by using the closing local price for the underlying security and are translated into U.S. dollars at the exchange rate struck at the close of the London Stock Exchange.
The Funds value long-term debt obligations, including high quality and high yield corporate securities, municipal securities, asset-backed securities, collateralized mortgage obligations and US Government and Agency issues, at the quoted bid price provided by an approved bond pricing service. Convertible securities are normally priced at the mean between the bid and ask prices. Short-term debt instruments, (e.g., commercial paper, bankers acceptances, U.S. Treasury Bills, etc.) having a maturity of less than 60 days will be valued at amortized cost. If a fixed income security has a maturity of greater than 60 days, it will be valued at market price.
Securities or other assets for which reliable market quotations are not readily available or for which the pricing agent or principal market maker does not provide a valuation or methodology or provides a valuation or methodology that, in the judgment of the Adviser does not represent fair value (Fair Value Securities), are valued by the Pricing Committee overseen by the Board of Trustees in consultation as applicable, with the Adviser’s portfolio managers, traders, and research and credit analysts and legal and compliance personnel. Fair Value Securities may include, but are not limited to, the following: certain private placements and restricted securities that do not have an active trading market; securities whose trading has been suspended or for which there is no current market; securities whose prices are stale; securities denominated in currencies that are restricted, untraded, or for which exchange rates are disrupted; securities affected by significant events; and securities that the Adviser or Pricing Committee believe were priced incorrectly. A “significant event” (which includes, but is not limited to, an extraordinarily political or market event) is an event that the Adviser or Pricing Committee believes with a reasonably high degree of certainty has caused the closing market prices of a Fund’s portfolio securities to no longer reflect their value at the time of the Fund’s NAV calculation.
Security Transactions and Investment Income
Security transactions are accounted for as of trade date. Realized gains and losses from security transactions are determined on an identified-cost basis.
Dividend income is recorded on the ex-dividend date or, for certain non-U.S. securities, when the information becomes available to the Funds. Interest income is recorded on an accrual basis. Discounts and premiums on debt securities are accreted and amortized on the yield to maturity basis.
Non-U.S. Currency Transactions
At each net asset valuation date, the value of assets and liabilities denominated in non-U.S. currencies are translated into U.S. dollars using the current exchange rate at the spot rate at 11:00 a.m. Eastern Time against the U.S. dollar, as provided by an approved pricing service. Security transactions, income and expenses are converted at the prevailing exchange rate on the day of the event. The effect of changes in exchange rates on securities denominated in a non-U.S. currency is included with the net realized and unrealized gain or loss of the associated security. Other Non-U.S. currency gains or losses are reported separately.
Certain Funds may use forward non-U.S. currency contracts to reduce their exposure to currency fluctuations of their non-U.S. securities. These contracts are commitments to purchase or sell a non-U.S. currency at a specified rate on a future date. When the contract is fulfilled or closed, gains or losses are realized. Until then, the gain or loss is included in unrealized appreciation or depreciation of investments. The contract commitment is fully collateralized by cash or securities of the Fund. Non-U.S. denominated assets and forward currency contracts may involve more risks than U.S. transactions, including currency risk, political and economic risk, regulatory and market risk. Evaluating and monitoring such risk exposure is a part of the Funds’ management strategy. There were no such forward non-U.S. currency contracts at September 30, 2008.
73
NICHOLAS-APPLEGATE INSTITUTIONAL FUNDS
NOTES TO FINANCIAL STATEMENTS — (Unaudited) — Continued
Futures Contracts
Each Fund may enter into futures contracts involving non-U.S. currency, interest rates, securities, and securities indices, for hedging purposes only. A futures contract obligates the seller of the contract to deliver and the purchaser of the contract to take delivery of the type of non-U.S. currency, financial instrument or security called for in the contract at a specified future time for a specified price. Upon entering into such a contract, a Fund is required to deposit and maintain as collateral such initial margin as required by the exchange on which the contract is traded. Pursuant to the contract, a Fund agrees to receive from or pay to the broker an amount equal to the daily fluctuations in the value of the contract. Such receipts or payments are known as variation margin and are recorded as unrealized gains or losses by the Fund. When the contract is closed, the Fund records a realized gain or loss equal to the difference between the value of the contract at the time it was opened and the value at the time it was closed. There were no such futures contracts at September 30, 2008.
Options Contracts
The Funds may: (a) buy call options on non-U.S. currency in anticipation of an increase in the value of the underlying asset; (b) buy put options on non-U.S. currency, portfolio securities, and futures in anticipation of a decrease in the value of the underlying asset; and (c) write call options on portfolio securities and futures to generate income from premiums, and in anticipation of a decrease or only limited increase in the value of the underlying asset. If a call written by a Fund is exercised, the Fund foregoes any possible profit from an increase in the market price of the underlying asset over the exercise price plus the premium received. When a Fund writes options on futures contracts, it will be subject to margin requirements similar to those applied to futures contracts. There were no such options at September 30, 2008.
Equity-Linked Securities
Certain Funds may purchase equity-linked securities, also known as participation notes, equity swaps, and zero strike calls and warrants. Equity-linked securities are primarily used by a Fund as an alternative means to more efficiently and effectively access the securities market of what is generally an emerging securities market. The Fund deposits an amount of cash with its custodian (or broker, if legally permitted) in an amount near or equal to the selling price of the underlying security in exchange for an equity linked security. Upon sale, the Fund receives cash from the broker or custodian equal to the value of the underlying security. Aside from market risk of the underlying securities, there is a risk of default by the counterparty to the transaction. In the event of insolvency of the counterparty, the Fund might be unable to obtain its expected benefit. In addition, while a Fund will seek to enter into such transactions only with parties which are capable of entering into closing transactions with the Fund, there can be no assurance that the Fund will be able to close out such a transaction with the counterparty or obtain an offsetting position with any counterparty, at any time prior to the end of the term of the underlying agreement. This may impair the Fund’s ability to enter into other transactions at a time when doing so might be advantageous.
Securities Lending
In order to generate expense offset credits, each of the Funds may lend portfolio securities, on a short-term or a long-term basis, up to 30% of a Fund’s total assets. The loans are secured by collateral in the forms of cash, cash equivalents, U.S. government and agency securities equal to at least 102% of the market value of the securities loaned on U.S. securities and 105% of the market value loaned on non-U.S. securities. During the term of the loan, the Funds will continue to receive any interest, dividends or amounts equivalent thereto, on the loaned securities while receiving a fee from the borrower and/or earning interest on the investment of the cash collateral. Upon termination of the loan, the borrower will return to the lender securities identical to the loaned securities and may share the interest earned on the collateral with the borrower.
The Funds bear the risk of delay in recovery of, or even loss of rights in, the securities loaned should the borrower of the securities fail financially. The Funds also bear the risk of loss in the event the securities purchased with cash collateral depreciate in value. Loans are subject to termination at the option of the borrower or the Fund. The market value of securities on loan and the related collateral at the period ended September 30, 2008 were:
Fund | Market Value | Collateral | |||||
| U.S. Micro Cap | $ | 6,639,339 | $ | 6,983,207 | |||
Credit Facility
The Trust has a $15 million credit facility available to fund temporary or emergency borrowing expiring in March 2009. Each Fund pays its pro-rata share of an annual commitment fee plus interest on its specific borrowings. For the period ended September 30, 2008, the Funds did not borrow against the line of credit.
Commitments and Contingencies
In the normal course of business, the Funds may enter into contracts and agreements that contain a variety of representations and warranties which provide general indemnifications. The maximum exposure to the Funds under these arrangements is unknown, as this would involve future claims that may be made against the Funds that have not yet occurred. However, based on experience, the Funds expect the risks of loss to be remote.
Fund Expenses and Multi-Class Allocations
Each Fund bears expenses incurred specifically on its behalf plus an allocation of its share of Trust level expenses. Each share offered by a Fund has equal rights to assets but incurs certain Class specific expenses. The Funds allocate income, gains and losses, both realized and unrealized, and expenses, except for Class specific expenses, based on the relative net assets of each share class.
During the period ended September 30, 2008, many of the brokers with whom the Adviser places trades on behalf of the Funds provided services to the Funds in addition to trade execution. These services included payments of certain expenses on behalf of the Fund. In addition, through arrangements with the Funds custodian, credits realized as a result of uninvested cash balances were used to reduce the Funds expenses. During the period ended September 30, 2008, the credits used to reduce the Funds expenses were:
74
Fund | Credit Interest Offset | Direct Brokerage Offset | Security Lending Offset | |||||||
| U.S. Micro Cap | 12,305 | 34,290 | 160,426 | |||||||
| U.S. Emerging Growth | 2,611 | 5,399 | 17,244 | |||||||
| U.S. Ultra Micro Cap | 431 | — | — | |||||||
| U.S. Systematic Large Cap Growth | 2,182 | 269 | 33 | |||||||
| U.S. Small to Mid Cap Growth | 986 | 2,911 | — | |||||||
| U.S. Convertible | 111,356 | — | — | |||||||
| Global Equity 130/30 | 468 | — | — | |||||||
| Global Select | 9,927 | 3,322 | 33,569 | |||||||
| International Growth | 8,468 | 520 | 30,125 | |||||||
| International Growth Opportunities | 29,574 | 5,662 | 134,925 | |||||||
| Emerging Markets | 4,275 | 206 | 18,410 | |||||||
| International Systematic | 35,700 | 2,863 | 34,005 | |||||||
| International All Cap Growth | 4,302 | 2,744 | 10,833 | |||||||
| U.S. High Yield Bond | 11,183 | — | — | |||||||
Use of Estimates
The preparation of financial statements in conformity with accounting principles generally accepted in the United States requires management to make estimates and assumptions that affect the amounts reported in the financial statements and accompanying notes. Actual results could differ from these estimates.
NOTE C — FEDERAL INCOME TAXES
The Funds intend to comply with the requirements of the Internal Revenue Code applicable to regulated investment companies and to distribute substantially all of their taxable income to shareholders. Accordingly, no provision for federal income taxes is required. A Fund investing in foreign securities records any foreign taxes on income and gains on such investments in accordance with the applicable tax rules. The Funds’ tax accounting treatment of loss deferrals, accretion, passive foreign investment companies and expiration of capital loss carryforwards are different from the financial statement recognition of income and gains.
Capital loss carryforwards may be used to offset current or future capital gains until expiration.
Distributions to Shareholders
The Funds record distributions to shareholders on the ex-dividend date. Distributions are determined in accordance with income tax regulations that may differ from generally accepted accounting principles. Accordingly, the Funds’ capital accounts are periodically reclassified to reflect income and gains available for distribution under income tax regulations. The Funds make income and capital gain distributions at least annually. Funds with income objectives make distributions either quarterly or monthly in accordance with the prospectuses.
NOTE D — TRANSACTIONS WITH AFFILIATES
Investment Advisory Fee
The Adviser receives a monthly fee at an annual rate based on the average daily net assets of the Funds. The investment Advisory Fee rates for each of the Funds are listed in the table on page 76.
Administrative & Shareholder Services Fee
On January 24, 2006, the Funds entered into a new Administration Agreement whereby the Funds pay for the administrative services they require under what is essentially an all-in fee structure. Class I, II, III & IV shareholders of the Funds pay an administrative fee to the Investment Adviser computed as a percentage of the Funds’ assets attributable in the aggregate to Class I, II, III & IV shares, the Adviser, in turn, provides or procures administrative and shareholder services for Class I, II, III & IV shareholders and also bears the costs of most third-party administrative services required by the Funds, including audit, custodial, portfolio accounting, legal, transfer agency and printing costs. The administrative fees paid to the Adviser may exceed the related costs. Generally, this may not be the case for relatively small funds.
75
NICHOLAS-APPLEGATE INSTITUTIONAL FUNDS
NOTES TO FINANCIAL STATEMENTS — (Unaudited) — Continued
Advisory Fee | Administration Fee* | |||||||||||||||
Fund | Class I | Class II | Class III | Class IV | ||||||||||||
| U.S. Micro Cap | 1.00% | 0.54% | — | — | — | |||||||||||
| U.S. Emerging Growth | 0.75% | 0.41% | — | — | — | |||||||||||
| U.S. Ultra Micro Cap | 1.50% | 0.73% | — | — | — | |||||||||||
| U.S. Systematic Large Cap Growth | 0.45% | 0.64% | 0.49% | — | — | |||||||||||
| U.S. Small to Mid Cap Growth | 0.50% | 0.40% | — | — | — | |||||||||||
| U.S. Convertible | 0.55% | 0.44% | 0.34% | — | 0.19% | |||||||||||
| Global Select | 0.65% | 0.47% | 0.42% | — | — | |||||||||||
| Global Equity 130/30 (1) | 1.10% | 0.67% | — | — | — | |||||||||||
| International Growth | 0.50% | 0.86% | 0.46% | — | — | |||||||||||
| International Growth Opportunities | 0.70% | 0.69% | 0.54% | 0.49% | — | |||||||||||
| Emerging Markets | 0.90% | 0.42% | 0.32% | — | — | |||||||||||
| International Systematic | 0.50% | 0.48% | 0.33% | 0.23% | — | |||||||||||
| International All Cap Growth | 0.85% | 0.27% | — | — | — | |||||||||||
| U.S. High Yield Bond | 0.40% | 0.20% | — | — | — | |||||||||||
| (1) | Commenced 4/01/08 |
| * | Excludes trustees’ fees and expenses, tax, brokerage and interest expenses, and extraordinary expenses. |
Securities Lending Fees
The U.S. Micro Cap and U.S. Systematic Large Cap Growth Fund participate in an agency securities lending program with an affiliated agent, Dresdner Bank AG a direct subsidiary to Allianz AG and affiliate to the Trust (“Dresdner Program”). Income generated from the investment of cash collateral, less negotiated rebate fees paid to borrowers and transaction costs, is divided pursuant to the Dresdner Program Agency Agreement between the Funds and Dresdner Bank AG. The amount paid to Dresdner Bank AG for the period ended September 30, 2008 was $38,626. Cash collateral received for securities on loan is invested in securities identified in the Schedules of Investments and the corresponding liability is recognized as such in the Statements of Assets and Liabilities.
Trustee Compensation
Certain officers of the Trust are also officers of the Investment Adviser and the Distributor. The Trustees who were not affiliated with the Investment Adviser receive annual compensation of approximately $36,000 each from the Trust, except for the chairman of the Board of Trustees of the Trust and the chairman of the Audit Committee, who will receive annual compensation of approximately $42,000 and $41,000, respectively, from the Trust.
NOTE E — INVESTMENT TRANSACTIONS
The following table presents purchases and sales of securities, excluding short-term investments, during the period ended September 30, 2008 to indicate the volume of transactions in each Fund. The tax cost of securities held at September 30, 2008, and the related gross and net unrealized appreciation and depreciation, provide aggregate information on a tax basis against which future gains and losses on these investments are measured for distribution purposes.
Fund | Purchases (in 000’s) | Sales (in 000’s) | Tax Cost (in 000’s) | Gross Unrealized Appreciation (in 000’s) | Gross Unrealized Depreciation (in 000’s) | Net Unrealized Appreciation (Depreciation) (in 000’s) | |||||||||||||
| U.S. Micro Cap | $ | 38,746 | $ | 33,973 | $ | 63,542 | $ | 6,262 | $ | (6,844 | ) | $ | (582 | ) | |||||
| U.S. Emerging Growth | 9,861 | 8,090 | 11,431 | 674 | (1,232 | ) | (558 | ) | |||||||||||
| U.S. Ultra Micro Cap | 1,606 | 881 | 1,598 | 135 | (164 | ) | (29 | ) | |||||||||||
| U.S. Systematic Large Cap Growth | 7,357 | 14,478 | 9,728 | 705 | (1,151 | ) | (446 | ) | |||||||||||
| U.S. Small to Mid Cap Growth | 4,635 | 5,017 | 4,691 | 214 | (454 | ) | (240 | ) | |||||||||||
| U.S. Convertible | 187,347 | 158,048 | 310,889 | 5,837 | (30,342 | ) | (24,505 | ) | |||||||||||
| Global Equity 130/30 | 6,589 | 2,129 | 4,118 | 103 | (576 | ) | (473 | ) | |||||||||||
76
Fund | Purchases (in 000’s) | Sales (in 000’s) | Tax Cost (in 000’s) | Gross Unrealized Appreciation (in 000’s) | Gross Unrealized Depreciation (in 000’s) | Net Unrealized Appreciation (Depreciation) (in 000’s) | |||||||||||||
| Global Select | $ | 25,626 | $ | 21,643 | $ | 34,240 | $ | 3,323 | $ | (6,457 | ) | $ | (3,134 | ) | |||||
| International Growth | 4,621 | 5,426 | 20,079 | 1,313 | (3,565 | ) | (2,252 | ) | |||||||||||
| International Growth Opportunities | 71,311 | 52,102 | 126,958 | 7,940 | (26,663 | ) | (18,723 | ) | |||||||||||
| Emerging Markets | 18,021 | 15,190 | 16,668 | 430 | (3,907 | ) | (3,477 | ) | |||||||||||
| International Systematic | 88,432 | 101,138 | 78,930 | 1,832 | (14,660 | ) | (12,828 | ) | |||||||||||
| International All Cap Growth | 17,352 | 4,932 | 12,129 | 346 | (2036 | ) | (1,690 | ) | |||||||||||
| U.S. High Yield Bond | 16,731 | 12,820 | 54,766 | 162 | (6,083 | ) | (5,921 | ) | |||||||||||
Gains and losses resulting from the subscriptions-in-kind and redemptions-in-kind are included in the realized gain/loss from securities and non-U.S. currency transactions. During the period, ended September 30, 2008, the Global Equity 130/30 Fund had a subscription-in-kind valued at $3,815,014. The International Systematic and U.S. Systematic Large Cap Growth Funds had redemptions-in-kind valued at $14,372,507 and $3,600,000, respectively.
NOTE F — FINANCIAL INSTRUMENTS
During the period, several of the Funds have been party to financial instruments with off-balance sheet risks, including forward non-U.S. currency contracts, primarily in an attempt to minimize the risk to the Fund, in respect of its portfolio transactions. These instruments involve market and/or credit risk in excess of the amount recognized in the Statement of Assets and Liabilities. Risks arise from the possible inability of counterparties to meet the terms of their contracts and from unexpected movement in currencies, securities values and interest rates. The contract amounts indicate the extent of the Funds’ involvement in such contracts. For the period ended September 30, 2008 the Funds were not party to any such agreements.
NOTE G — FAIR VALUE OF FINANCIAL INSTRUMENTS
Effective April 1, 2008, the funds adopted FAS 157 — Fair Value Measurements (“FAS 157” or “the Statement”). FAS 157 defines fair value, establishes a framework for measuring fair value in generally accepted accounting principles (“GAAP”), and expands disclosures about fair value measurement. The Statement establishes a fair value hierarchy that distinguishes between (1) market participant assumptions developed based on market data obtained from sources independent of the funds (observable inputs) and (2) the funds own assumptions about market participant assumptions developed based on the best information available in the circumstances (unobservable inputs). The three levels defined by the FAS 157 hierarchy are as follows:
Level I — quoted prices in active markets for identical securities.
Level II — significant observable inputs (including quoted prices for similar securities, interest rates prepayment speeds, credit risk, etc.).
Level III — significant unobservable inputs (including the Fund’s own assumptions in determining the fair value of investments.
In some instances, the inputs used to measure fair value might fall in different levels of the fair value hierarchy. The level in the fair value hierarchy within which the fair value measurement in its entirety falls shall be determined based on the lowest input level that is significant to the fair value measurement in its entirety.
The following table summarizes the valuation of each fund’s securities using the fair value hierarchy:
At September 30, 2008 | Total | Level I | Level II | Level III | |||||||||
| U.S Micro Cap | |||||||||||||
| Investments | $ | 62,959,353 | $ | 62,959,353 | $ | — | $ | — | |||||
| U.S. Emerging Growth | |||||||||||||
| Investments | 10,872,593 | 10,872,593 | — | — | |||||||||
| U.S. Ultra Micro Cap | |||||||||||||
| Investments | 1,568,632 | 1,568,632 | — | — | |||||||||
| U.S. Systematic Large Cap Growth | |||||||||||||
| Investments | 9,281,921 | 9,161,765 | 120,156 | — | |||||||||
77
NICHOLAS-APPLEGATE INSTITUTIONAL FUNDS
NOTES TO FINANCIAL STATEMENTS — (Unaudited) — Continued
At September 30, 2008 | Total | Level I | Level II | Level III | |||||||||
| U.S. Small to Mid Cap Growth | |||||||||||||
| Investments | $ | 4,450,911 | $ | 4,450,911 | $ | — | $ | — | |||||
| U.S. Convertible | |||||||||||||
| Investments | 286,384,179 | 105,717,856 | 161,357,854 | 19,308,469 | |||||||||
| Global Equity 130/30 | |||||||||||||
| Investments | 3,618,480 | 3,618,480 | — | — | |||||||||
| Derivative liabilities | (310,199 | ) | (310,199 | ) | |||||||||
| Global Select | — | — | |||||||||||
| Investments | 34,855,527 | 34,469,046 | 386,481 | — | |||||||||
| International Growth | |||||||||||||
| Investments | 17,578,531 | 17,578,531 | — | — | |||||||||
| International Growth Opportunities | |||||||||||||
| Investments | 106,659,248 | 104,235,196 | 2,424,052 | — | |||||||||
| Emerging Markets | |||||||||||||
| Investments | 13,059,345 | 12,974,227 | 47,036 | 38,082 | |||||||||
| International Systematic | |||||||||||||
| Investments | 65,204,605 | 65,204,605 | — | — | |||||||||
| International All Cap Growth | |||||||||||||
| Investments | 10,437,653 | 10,437,653 | — | — | |||||||||
| U.S. High Yield Bond | |||||||||||||
| Investments | 48,844,702 | 1,686,608 | 43,193,006 | 3,965,088 | |||||||||
The following is a reconciliation of assets for which significant unobservable inputs (Level 3) were used in determining fair value during the period April 1, 2008 through September 30, 2008:
US Convertible | Investments in Securities | |||
| Balance as of March 31, 2008 | $ | — | ||
| Total realized gain (loss) | 144,996 | |||
| Change in unrealized appreciation (depreciation) | (307,853 | ) | ||
| Net purchases (sales) | 4,080,261 | |||
| Transfers in and/or out of Level 3 | 15,391,065 | |||
| Balance as of September 30, 2008 | $ | 19,308,469 | ||
Emerging Markets | Investments in Securities | |||
| Balance as of March 31, 2008 | $ | — | ||
| Total realized gain (loss) | — | |||
| Change in unrealized appreciation (depreciation) | (10,133 | ) | ||
| Net purchases (sales) | 48,215 | |||
| Transfers in and/or out of Level 3 | — | |||
| Balance as of September 30, 2008 | $ | 38,082 | ||
78
U.S. High Yield Bond | Investments in Securities | |||
| Balance as of March 31, 2008 | $ | — | ||
| Total realized gain (loss) | — | |||
| Change in unrealized appreciation (depreciation) | — | |||
| Net purchases (sales) | — | |||
| Transfers in and/or out of Level 3 | 3,965,088 | |||
| Balance as of September 30, 2008 | $ | 3,965,088 | ||
NOTE H — SUBSEQUENT EVENTS
Recent events in the financial sector have resulted in an unusually high degree of volatility in the financial markets and the net asset value of many mutual funds, including the Nicholas Applegate Institutional Funds. Such events occurring subsequent to the date of this report have included, but not limited to, the seizure of the Federal National Mortgage Association and the Federal Home Loan Mortgage Corporation by U.S. banking regulators, the bankruptcy filing of Lehman Brothers and the sale of Merrill Lynch to Bank of America, and the government bailout of AIG. These companies represent financial institutions with which certain of the Funds conduct business and/or whose securities are or may be held with in the Funds. The potential investment of each Fund’s investments in these issuers, and the financial sector in general, as reflected in each Fund’s schedule of investments, exposes investors to the negative (or positive) performance resulting from these and other events. U.S. Government Agency securities and collateral received by the Funds under various agreements may include bonds by the Federal National Mortgage Association and the Federal Home Loan Mortgage Corporation.
NOTE I — NEW ACCOUNTING PRONOUNCEMENTS
The Financial Accounting Standards Board (“FASB”) has recently issued Interpretation No.48, Accounting for Uncertainty in Income Taxes — an Interpretation of FASB Statement No.109 (“FIN 48”), which applies to all registered investment companies and clarifies the accounting for uncertain tax positions. FIN 48 requires the evaluation of tax positions taken, or expected to be taken, in the course of preparing the Fund’s tax returns to determine whether the tax positions are “more-likely-than-not” of being sustained by the applicable tax authority. To the extent that a tax benefit of a position is not deemed to meet the more-likely-than-not threshold, the Fund would report an income tax expense in the statement of operations. Adoption of FIN 48 is required for the last NAV calculation in the first financial statement reporting period for fiscal years beginning after December 15, 2006. Accordingly, management has evaluated tax positions taken by the Fund for the period April 1, 2008 through September 30, 2008 and determined that the adoption of FIN 48 did not have a material impact to the fund’s financial statements.
In March 2008, Statement of Financial Accounting Standards No. 161, Disclosures about Derivative Instruments and Hedging Activities (“FAS 161”), was issued and will be effective for fiscal years and interim periods beginning after November 15, 2008. FAS 161 requires enhanced disclosures about funds’ derivative and hedging activities. Management is currently evaluating the impact the adoption of FAS 161 will have on the Fund’s financial statement disclosures.
In September 2008, FASB Staff Position 133-1 and FIN 45-4, “Disclosures about Credit Derivatives and Certain Guarantees: An Amendment of FASB Statement No. 133 and FASB Interpretation No. 45; and Clarification of the Effective Date of FASB Statement No. 161” (“Amendment”) was issued and is effective for annual and interim reporting periods ending after November 15, 2008. The amendment requires enhanced disclosures regarding a fund’s credit derivatives holdings, including credit default swaps, credit spread options, and hybrid financial instruments containing embedded credit derivatives. Management is currently evaluating the impact the adoption of the Amendment will have on the Fund’s financial statement disclosures.
79
SHAREHOLDER EXPENSE EXAMPLE — (Unaudited)
As a shareholder of a Fund, you incur two types of costs: (1) transaction costs, including redemption fees, and (2) ongoing costs, including management fees and other Fund expenses. This Example is intended to help you understand your ongoing costs (in dollars) of investing in the Funds and to compare these costs with the ongoing costs of investing in other mutual funds.
The Example is based on an investment of $1,000 invested at the beginning of the period and held for the entire period (April 1, 2008 to September 30, 2008).
ACTUAL EXPENSES
The first line of the table below for each fund provides information about actual account values and actual expenses. You may use the information in this line, together with the amount you invested, to estimate the expenses that you paid over the period. Simply divide your account value by $1,000 (for example, an $8,600 account value divided by $1,000 = 8.6), then multiply the result by the number in the first line for a fund under the heading “Expenses Paid During Period” to estimate the expenses you paid on your account during this period.
HYPOTHETICAL EXAMPLE FOR COMPARISON PURPOSES
The second line of the table below for each fund provides information about hypothetical account values and hypothetical expenses based on a fund’s actual expense ratio and an assumed rate of return if 5% per year before expenses, which is not the Fund’s actual return. The hypothetical account values and expenses may not be used to estimate the actual ending account balance or expenses you paid for the period. You may use this information to compare the ongoing costs of investing in the Fund and other funds. To do so, compare this 5% hypothetical example with the 5% hypothetical examples that appear in the shareholder reports of the other funds.
Please note that the expenses shown in the table are meant to highlight your ongoing costs only and do not reflect any transaction costs. Therefore, the second line of the table is useful in comparing ongoing costs only, and will not help you determine the relative total costs of owning different funds. In addition, if these transactional costs were included, your costs would have been higher.
Expenses Paid | ||||
Beginning Account | Ending Account | During the Period | ||
Value | Value | April 1, 2008 to | Annualized | |
April 1, 2008 | September 30, 2008 | September 30, 2008 | Expense Ratio | |
U.S. Micro Cap — Class I Actual | $1,000.00 | $ 971.60 | $ 7.83 | 1.58% |
| Hypothetical (5% return before expenses) | $1,000.00 | $ 1017.12 | $ 8.01 | 1.58% |
U.S. Emerging Growth — Class I Actual | $1,000.00 | $ 927.50 | $ 5.88 | 1.22% |
| Hypothetical (5% return before expenses) | $1,000.00 | $1,018.97 | $ 6.15 | 1.22% |
U.S. Ultra Cap — Class I Actual | $1,000.00 | $ 952.60 | $12.02 | 2.45% |
| Hypothetical (5% return before expenses) | $1,000.00 | $1,012.76 | $12.39 | 2.45% |
U.S. Systematic Large Cap Growth — Class I Actual | $1,000.00 | $ 905.60 | $ 5.72 | 1.20% |
| Hypothetical (5% return before expenses) | $1,000.00 | $1,019.06 | $ 6.06 | 1.20% |
U.S. Systematic Large Cap Growth — Class II Actual | $1,000.00 | $ 906.70 | $ 4.88 | 1.02% |
| Hypothetical (5% return before expenses) | $1,000.00 | $ 1019.95 | $ 5.17 | 1.02% |
U.S. Small to Mid Cap Growth — Class I Actual | $1,000.00 | $ 921.30 | $ 1.51 | 0.97% |
| Hypothetical (5% return before expenses) | $1,000.00 | $ 1020.20 | $ 1.59 | 0.97% |
U.S. Convertible — Class I Actual | $1,000.00 | $ 894.50 | $ 4.88 | 1.03% |
| Hypothetical (5% return before expenses) | $1,000.00 | $1,019.92 | $ 5.20 | 1.03% |
U.S. Convertible — Class II Actual | $1,000.00 | $ 894.90 | $ 4.46 | 0.94% |
| Hypothetical (5% return before expenses) | $1,000.00 | $1,020.36 | $ 4.76 | 0.94% |
U.S. Convertible — Class IV Actual | $1,000.00 | $ 895.30 | $ 3.72 | 0.78% |
| Hypothetical (5% return before expenses) | $1,000.00 | $1,021.15 | $ 3.96 | 0.78% |
80
Expenses Paid | ||||
Beginning Account | Ending Account | During the Period | ||
Value | Value | April 1, 2008 to | Annualized | |
April 1, 2008 | September 30, 2008 | September 30, 2008 | Expense Ratio | |
Global Equity 130/30 — Class I Actual | $1,000.00 | $ 801.00 | $14.65 | 3.25% |
| Hypothetical (5% return before expenses) | $1,000.00 | $ 1,008.8 | $16.34 | 3.25% |
Global Select — Class I Actual | $1,000.00 | $ 803.20 | $ 5.29 | 1.17% |
| Hypothetical (5% return before expenses) | $1,000.00 | $1,019.20 | $ 5.92 | 1.17% |
Global Select — Class II Actual | $1,000.00 | $ 803.40 | $ 5.08 | 1.12% |
| Hypothetical (5% return before expenses) | $1,000.00 | $1,019.44 | $ 5.68 | 1.12% |
International Growth — Class I Actual | $1,000.00 | $ 790.80 | $ 6.34 | 1.41% |
| Hypothetical (5% return before expenses) | $1,000.00 | $1,017.99 | $ 7.14 | 1.41% |
International Growth — Class II Actual | $1,000.00 | $ 792.50 | $ 4.54 | 1.01% |
| Hypothetical (5% return before expenses) | $1,000.00 | $1,020.00 | $ 5.12 | 1.01% |
International Growth Opportunities — Class I Actual | $1,000.00 | $ 722.20 | $ 6.22 | 1.44% |
| Hypothetical (5% return before expenses) | $1,000.00 | $1,017.84 | $ 7.29 | 1.44% |
International Growth Opportunities — Class II Actual | $1,000.00 | $ 722.60 | $ 5.58 | 1.29% |
| Hypothetical (5% return before expenses) | $1,000.00 | $1,018.59 | $ 6.53 | 1.29% |
International Growth Opportunities — Class III (1) Actual | $1,000.00 | $ 877.90 | $ 6.09 | 1.29% |
| Hypothetical (5% return before expenses) | $1,000.00 | $1,018.58 | $ 6.53 | 1.29% |
Emerging Markets Fund — Class I | ||||
| Actual | $1,000.00 | $ 709.30 | $ 6.14 | 1.43% |
| Hypothetical (5% return before expenses) | $1,000.00 | $ 1017.89 | $ 7.25 | 1.43% |
Emerging Markets Fund — Class II Actual | $1,000.00 | $ 709.00 | $ 5.67 | 1.32% |
| Hypothetical (5% return before expenses) | $1,000.00 | $1,018.44 | $ 6.69 | 1.32% |
International Systematic — Class I Actual | $1,000.00 | $ 764.20 | $ 4.56 | 1.03% |
| Hypothetical (5% return before expenses) | $1,000.00 | $1,019.90 | $ 5.22 | 1.03% |
International Systematic — Class II | ||||
| Actual | $1,000.00 | $ 764.50 | $ 3.87 | 0.88% |
| Hypothetical (5% return before expenses) | $1,000.00 | $1,020.68 | $ 4.43 | 0.88% |
International Systematic — Class III Actual | $1,000.00 | $ 765.60 | $ 3.45 | 0.78% |
| Hypothetical (5% return before expenses) | $1,000.00 | $1,021.16 | $ 3.95 | 0.78% |
International All Cap Growth — Class I Actual | $1,000.00 | $ 790.80 | $ 5.26 | 1.17% |
| Hypothetical (5% return before expenses) | $1,000.00 | $1,019.19 | $ 5.93 | 1.17% |
U.S. High Yield Bond — Class I Actual | $1,000.00 | $ 958.90 | $ 3.17 | 0.65% |
| Hypothetical (5% return before expenses) | $1,000.00 | $1,021.83 | $ 3.27 | 0.65% |
(1) | International Growth Opportunities Fund’s Class III beginning account value on September 08, 2008 (Class inception date) |
| * | Expenses are equal to the Fund’s annualized expense ratio; multiplied by the average account value over the period |
81
SUPPLEMENTARY INFORMATION — (Unaudited)
QUARTERLY FILING
The Funds provide a complete list of portfolio holdings four times in each fiscal year, at the end of each calendar quarter. For the second and fourth quarters, the portfolio holdings appear in the Funds’ semiannual and annual reports to shareholders. For the first and third quarters, the Funds file their portfolio holdings with the Securities and Exchange Commission on Form N-Q. Shareholders can look up the Funds’ Form N-Q on the SEC’s website at www.sec.gov. Forms N-Q may also be reviewed and copied at the SEC’s Public Reference Room in Washington, DC. To find out more about this public service, call the SEC at 1-202-942-8090.
82
SUPPLEMENTARY INFORMATION — (Unaudited) — Continued
CORPORATE GOVERNANCE (UNAUDITED) | |
Name, Address (1) Age Position(s) Held with Fund Length of Time Served (2) | Principal Occupation(s) during Past 5 Years Other Directorship Held by Trustee Number of Portfolios in Fund complex Overseen by Trustee |
Independent Trustees: | |
Darlene T. DeRemer 11/27/1955 Chairperson of the Board Since August 2007 & Trustee Since May 1999 | Principal Occupations: Partner, Grail Partners LLC (since 2005); Managing Director, Putnam Lovell NBF Private Equity (Since 2004-2005); Managing Director, NewRiver E-Business Advisory Services Division (2000-2003); Prior to, President and Founder, DeRemer Associates, a strategic and marketing consulting firm for the financial services industry (1987-2003); Vice President and Director, Asset Management Division, State Street Bank and Trust Company, now referred to as State Street Global Advisers, (1982-1987); Vice President, T. Rowe Price & Associates (1979-1982); Member, Boston Club (since 1998); Member, Financial Women’s Association Advisory Board (since 1995); Founder, Mutual Fund Cafe Website. |
Other Directorships Held: Founding Member and Director, National Defined Contribution Council (since 1997); Trustee, Boston Alzheimer’s Association (since 1998); Director, King’s Wood Montessori School (since 1995); Editorial Board, National Association of Variable Annuities (since 1997); Director, Nicholas-Applegate Strategic Opportunities, Ltd. (1994-1997); Trustee, Nicholas-Applegate Mutual Funds (1994-1999); Director, Jurika & Voyles Fund Group (since 1994-2000); Trustee, Bramwell Funds (2003-2005); Director, Independent Director Council (since 2004); Mutual Fund Directors’ Council-Advisory Board; Board Member-Chatman Partners; Board Member X-Shares LLC. | |
Number of Portfolios Overseen by Trustee: 14 | |
John J. Murphy 4/8/1944 Trustee Since September 2005 | Principal Occupations: Founder and senior principal, Murphy Capital Management |
Other Directorships Held: Director, Smith Barney Multiple Discipline Trust; Director, Barclays International Funds Group Ltd. and affiliated companies; Smith Barney Consulting Group; Legg Mason Equity Funds. | |
Number of Portfolios Overseen by Trustee: 14 | |
Bradford K. Gallagher 2/24/1944 Trustee Since August 2007 | Principal Occupations: Founder, Spyglass Investments LLC (a private investment vehicle) (since 2001); Founder, President and CEO of CypressTree Investment Management Company and Annuity Company; Managing Director, Fidelity Investments. |
Other Directorships Held: Trustee, The Common Fund (since 2005); Director, Anchor Point Inc. (since 2005); Chairman and Trustee, Atlantic Maritime Heritage Foundation (since 2007); Director, Shielding Technology Inc. (since 2006);Director, United Way of Eastern Massachusetts (1988-1990); Director, Ouimet Scholarship Fund (1993-2005); Director, Emerson Hospital (1995-2005) | |
Number of Portfolios Overseen by Trustee: 14 | |
Steven Grenadier 12/14/1964 Trustee | Principal Occupations: William F. Sharpe Professor of Financial Economics, Stanford University Graduate School of Business; Research Associate, National Bureau of Economic Research (since 2002); Chairman of the Finance Department, Stanford University Graduate School of Business (2004-2006) |
| Since August 2007 | |
Other Directorships Held: Independent Trustee, E Trade Funds. | |
Number of Portfolios Overseen by Trustee: 14 | |
Interested Trustees: | |
Horacio A. Valeiras 1/8/1959 President & Trustee Since August 2004 | Principal Occupations: Managing Director (since 2004) and Chief Investment Officer, Nicholas-Applegate Capital Management, Nicholas-Applegate Securities (since 2002); Chief Investment Officer Oppenheimer Capital and AGI Management Partners (since 2008); Managing Director of Morgan Stanley Investment Management, London (1997-2002); Head of International Equity and Asset Allocation, Miller Anderson & Sherred; Director and Chief of Investment Strategies, Credit Suisse First Boston. |
Other Directorships Held: Trustee, The Bishops School (since 2002); Trustee, San Diego Rowing Club (since 2002). | |
Number of Portfolios Overseen by Trustee: 14 | |
Arthur B. Laffer 8/14/1940 Trustee Since August 2007 | Principal Occupations: Chairman, Laffer Associates (economic consulting) (since 1979); Chairman, Laffer Advisors Inc. (registered broker-dealer) (since 1981); Chairman Laffer Investments (asset management) (since 2000); Member, Congressional Policy Advisory Board (since 1998); Distinguished University Professor and Director, Pepperdine University (1985-1988); Professor of Business Economics, University of Southern California (1976-1984); Associate Professor of Business Economics, University of Chicago (1967-1976). |
Other Directorships Held: Director of MPS Group, Inc. (NYSE:MPS) (since 2003); Director, Petco Animal Supplies, Inc. (NASDAQ:PETC) (2002-2005); Director, Oxigene Inc. (NASDAQ:OXGN); biopharmaceutical company (since 1998); Director of Provide Commerce (NASDAQ: PRVD) (since 1998); Director, Veolia Environmental Corporation (successor to U.S. Filter Corporation (water purification) (1991-2006); Director, Nicholas Applegate Fund, Inc. (1987-2007). | |
Number of Portfolios Overseen by Trustee: 14 | |
83
SUPPLEMENTARY INFORMATION — (Unaudited) — Continued
CORPORATE GOVERNANCE (UNAUDITED)
Name, Address (1) Age Position(s) Held with Fund Length of Time Served (2) | Principal Occupation(s) during Past 5 Years Other Directorship Held by Trustee Number of Portfolios in Fund complex Overseen by Trustee | |
Officers: | ||
Charles H. Field, Jr. 7/24/1955 Secretary and Chief Compliance Officer Since May 2002 | Principal Occupations: Managing Director and General Counsel, Nicholas-Applegate Capital Management, Nicholas- Applegate Securities LLC, Nicholas-Applegate Holdings LLC (since February 2004), Deputy General Counsel, Nicholas- Applegate Capital Management, LLC (1996-2004). | |
Other Directorships Held: NA | ||
Number of Portfolios Overseen by Officer: 14 | ||
Deborah A. Wussow 1/31/1960 Treasurer and Assistant Secretary Since August 2006 | Principal Occupations: Senior Vice President and Chief Compliance Officer, Nicholas-Applegate Capital Management, (Since 2008), and previously Vice President and Director, Legal and Compliance, Nicholas-Applegate Capital Management (2005-2007) and Manager, Legal and Compliance, Nicholas-Applegate Capital Management (1995-2004)) | |
Other Directorships Held: NA | ||
Number of Portfolios Overseen by Officer: 14 | ||
| (1) | Unless otherwise noted, the address of the Trustees and Officers is c/o: Nicholas-Applegate Capital Management, 600 West Broadway, 32nd Floor, San Diego,California 92101. |
| (2) | Each Trustee serves for an indefinite term, until her or his successor is elected. |
84
(This page intentionally left blank)
(This page intentionally left blank)
TRUSTEES OF NICHOLAS - APPLEGATE INSTITUTIONAL FUNDS
Darlene T. DeRemer, Chairperson
Horacio A. Valeiras
John J. Murphy
Bradford K. Gallagher
Steven Grenadier
Arthur B. Laffer
OFFICERS
Horacio A. Valeiras, President
Charles H. Field, Jr., Secretary & Chief Compliance Officer
Deborah A. Wussow, Treasurer & Assistant Secretary
INVESTMENT ADVISER
Nicholas-Applegate Capital Management
DISTRIBUTOR
Nicholas-Applegate Securities
CUSTODIAN
Brown Brothers Harriman & Co., Private Bankers
TRANSFER AGENT
UMB Fund Services Group, Inc.
INDEPENDENT REGISTERED PUBLIC ACCOUNTING FIRM
PricewaterhouseCoopers LLP
 | SAR0908INST |
| 600 West Broadway | |
 | 800.551.8043 |

September 30, 2008 Semi-Annual Report (Unaudited)
Class R Shares
U.S. Emerging Growth
U.S. Systematic Large Cap Growth
International Growth

LETTER TO SHAREHOLDERS
Dear Fellow Shareholder,
The six-month period ended September 30, 2008 was a challenging time for investors. The problems in the credit markets that began in 2007 intensified, dimming the outlook for the global economy and sending stock prices lower around the world.
In this semi-annual report, we review the performance of the financial markets and our mutual funds from April 1, 2008 through September 30, 2008. We also share our outlook for the months ahead.
In the United States, the S&P 500 Index declined 10.9% in the face of significant headwinds. S&P 500 companies posted a fourth straight quarter of negative earnings growth, the economy appeared to be faltering and a deepening of the credit crisis transformed Wall Street in September. Crippled by mortgage losses, one major financial institution after another faced insolvency, causing risk aversion to skyrocket, lending to dry up and stock prices to fall. The Federal Reserve flooded the banking system with extra liquidity but held the target funds rate at 2% after having lowered it 0.25% in April. The U.S. Treasury proposed a $700 billion program to buy up bad mortgage securities, the terms of which were being negotiated by Congress on September 30.
The crisis in the United States spread overseas, where a handful of large European financial institutions were rescued by their respective governments. The turmoil in the credit markets, along with signs of a sharp economic slowdown in Europe and Japan, contributed to the 13.4% loss in the MSCI EAFE Index in local currencies. The index shed 22.0% in U.S. dollar terms, as the euro, pound and yen fell 10.7%, 10.2% and 6.4%, respectively, versus the dollar on concerns about the deterioration in international economies. Monetary policy in developed non-U.S. countries was mixed. Like the Fed, the Bank of England eased in April but subsequently kept rates at 5% amid rising inflation. The European Central Bank tightened in July to combat inflation but then held rates at 4.25%, while the Bank of Japan maintained its 0.5% target rate throughout the period. Nonetheless, these and other central banks around the world joined the Fed in injecting liquidity into the credit markets.
Stocks in developing countries registered the biggest losses, with the MSCI Emerging Markets Index falling 22.0% in local currencies and 27.5% in U.S. dollars. The sell-off was triggered by rising risk aversion, fears of a global recession and a steep decline in commodity prices, as energy and materials companies represent nearly a third of the index’s market value. After rising 19.6% during the first half of the period, the Reuters/Jefferies CRB Index of nineteen commodities plunged 25.3% from July through September on worries about softening demand. Policymakers in emerging countries shifted their focus from curbing inflation, which showed signs of easing, to stabilizing their financial markets. For example, Chinese officials cut stock-trading taxes, bought shares of large local banks and lowered the country’s benchmark lending rate for the first time since 2002.
While investment returns were disappointing in absolute terms, we are pleased that the U.S. Systematic Large Cap Growth Fund and the International Growth Fund outperformed their benchmarks in the volatile environment. The U.S. Emerging Growth Fund trailed its benchmark but has outperformed over longer periods of time.
We remain excited about the investment potential of our existing funds, as well as the potential of new strategies that we are offering. On April 1, we launched the Global Equity 130/30 Fund, which has the flexibility to short stocks. Global Equity 130/30 seeks to deliver more alpha than similar long-only approaches — without a commensurate increase in risk —and capitalizes on our expertise in fundamental research, quantitative analysis and short selling.
Just as we are committed to providing innovative investment solutions, we are committed to continually strengthening our organization. During the period, we welcomed several highly qualified analysts to both our traditional and systematic investment teams. We are enhancing our global trading platform by implementing the latest in trade order management technology — technology that will enable faster, better execution. By fine-tuning our trading capabilities, we hope to more fully capture the value of our investment decisions in the funds.
As the end of 2008 draws near, the outlook for the financial markets is uncertain. We believe that many developed economies will slip into recession early next year, if they have not already, and that emerging economies will slow. Now that inflation is yesterday’s problem, we expect the Federal Reserve and other central banks to cut interest rates, which may help unfreeze the credit markets and stimulate growth. Beyond monetary policy, governments have intervened to shore up their banking systems and economies; however, the effectiveness of their actions is yet to be seen.
Since Nicholas-Applegate was founded in 1984, the markets have experienced periods of volatility, spanning both peaks and valleys. Throughout them all, we have maintained our disciplined, long-term approach to investing. As difficult as the current situation may seem, this too shall pass. Meanwhile, we will continue to faithfully adhere to our investment philosophy and process, which we believe will produce strong performance in the funds over time.
On behalf of everyone at the firm, thank you for your participation in the Nicholas-Applegate Institutional Funds. We appreciate the trust you have placed in us.
Best Regards,

Horacio A. Valeiras, CFA
President and Chief Investment Officer
September 30, 2008
TABLE OF CONTENTS
The Funds’ Review and Outlook, Performance and | |
Schedule of Investments: | |
| U.S. Emerging Growth | 1 |
| U.S. Systematic Large Cap Growth | 5 |
| International Growth | 8 |
The Funds’: | |
| Financial Highlights | 12 |
| Statements of Assets and Liabilities | 14 |
| Statements of Operations | 15 |
| Statements of Changes in Net Assets | 16 |
| Notes to Financial Statements | 18 |
| Report of Independent Registered Public Accounting Firm | |
| Shareholder Expense Example | 23 |
| Supplementary Information | 24 |
This report is authorized for distribution to shareholders and to others only when preceded or accompanied by a currently effective prospectus for Nicholas-Applegate Institutional Funds Class R Shares. Distributor: Nicholas-Applegate Securities.
U.S. EMERGING GROWTH FUND
Management Team: John C. McCraw, Portfolio Manager; Robert S. Marren, Portfolio Manager
Chief Investment Officer: Horacio A. Valeiras, CFA
Goal: The U.S. Emerging Growth Fund seeks to maximize long-term capital appreciation through investments primarily in U.S. companies with market capitalizations similar to the Russell 2000 Growth Index at time of purchase.
Market Overview: The Russell 2000 Growth Index declined in the six months ended September 30, 2008. However, small-cap growth stocks were much more resilient than large caps, due in part to better earnings from smaller companies.
The Russell 2000 Growth Index shook off weakness in June to end the first five months of the period with a nearly 10% gain. Returns were especially strong in April and May when the Federal Reserve made its seventh in a series of interest rate cuts, and small companies outside of financials reported healthy first quarter profits.
September turned out to be an exceptionally weak and volatile month, and small-cap growth stocks gave back all of their earlier gains and then some. During September, a number of bellwether U.S. financial institutions became overwhelmed by mortgage-related losses, including one that was forced into bankruptcy. Policymakers sprang into action, effectively nationalizing the largest U.S. mortgage lenders, providing a loan to one of the world’s biggest insurance companies and orchestrating the sale of two major banks. In addition, the Federal Reserve pumped liquidity into the financial system and expanded its emergency bank lending programs. Despite these efforts to stabilize the markets, investors shunned riskier assets, credit dried up and equity prices plummeted. The month ended on hopes that Congress would pass a $700 billion financial rescue package.
Performance: During the six months ended September 30, 2008, the Fund’s Class R shares posted a 7.32% loss and the Russell 2000 Growth Index fell 2.83%.
Portfolio Specifics: Overall, the Fund’s sector exposures positively impacted relative results. An underweight in materials — one of the worst-performing sectors in the index —was helpful, as deterioration in the outlook for the global economy sent commodity prices sharply lower from July through September. An overweight in health care was another plus, as health care was the best-performing sector in the benchmark. Investors typically favor this defensive group when the market is volatile, and this period was no exception.
In the risk-averse climate, investors also favored the larger-cap stocks in the Russell 2000 Growth Index. This was a headwind for the Fund, since the types of fast-growing companies that we like to own tend to be on the smaller side of small cap. In terms of sectors, stock selection among industrials and information technology companies subtracted the most from relative results.
While the portfolio generated a decline, there were a number of individual holdings that performed well. The Fund’s top contributors included Jos. A. Bank Clothiers, an apparel retailer; Alexion Pharmaceuticals, a biotechnology firm; and NuVasive, a medical device company.
Market Outlook: The stock market is likely to remain volatile over the coming months as investors measure the impact of the government rescue package and other policy steps aimed at stabilizing the financial system and economy. While it may take time for the environment to improve, it is worth noting that equities have recovered from significant shocks in the past.
Regardless of which direction the broad stock market takes, we believe that consistent application of our investment process will lead us to fast-growing small-cap companies for the Fund.
Comparison of Change in Value of a $250,000 Investment in U.S. Emerging Growth Fund Class R Shares with the Russell 2000 Growth Index.
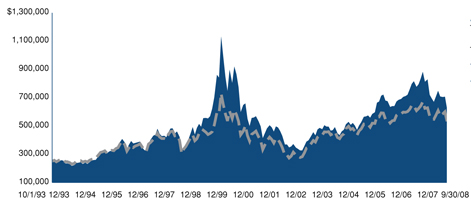

| Annualized Total Returns As of 9/30/08 | ||||||||||
1 Year | 5 Years | 10 Years | ||||||||
| U.S. Emerging Growth Fund Class R | -25.69% | 7.44% | 5.82% | |||||||
| Russell 2000 Growth Index | -17.08% | 6.63% | 4.67% | |||||||
The graph above shows the value of a hypothetical $250,000 investment in the Fund compared with the Russell 2000 Growth Index for the periods indicated. The Fund’s Class R shares were first available on May 21, 1999. Performance prior to the introduction of Class R shares reflects the historical performance of the Fund’s Class I Shares. This performance has been restated to reflect shareholder services fees of 0.25% applicable to Class R shares, but not Class I shares of the Fund. The Fund’s Class I shares calculate their performance based upon the historical performance of a corresponding series of Nicholas-Applegate Mutual Funds (renamed ING Mutual Funds), adjusted to reflect all fees and expenses applicable to the Fund’s Class I shares. Average annual total return figures include changes in principal value, reinvested dividends, and capital gain distributions. The total returns shown above do not show the effects of income taxes on an individual’s investment. In most cases, taxes may reduce your actual investment returns on income or gains paid by the Fund or any gains you may realize if you sell your shares. Past performance cannot guarantee future results.
The Russell 2000 Growth Index is an unmanaged index comprised of those Russell 2000 companies with higher price-to-book ratios and higher forecasted growth values. The Russell 2000 Index is an unmanaged index generally representative of the 2,000 smallest companies in the Russell 3000 Index, which represents approximately 10% of the total market capitalization of the Russell 3000 Index. The unmanaged Index differs from the Fund in composition, does not pay management fees or expenses and includes reinvested dividends. One cannot invest directly in an index.
Since markets can go down as well as up, investment return and principal value will fluctuate with market conditions.You may have a gain or loss when you sell your shares.
1
U.S. EMERGING GROWTH FUND
SCHEDULE OF INVESTMENTS (Unaudited)
As of September 30, 2008
| Number of | |||||||
| Shares | Value | ||||||
Common Stock - 100.7% | |||||||
Aerospace/Defense-Equipment - 3.7% | |||||||
| BE Aerospace, Inc.* | 3,100 | $ | 49,073 | ||||
| Curtiss-Wright Corp. | 1,400 | 63,630 | |||||
| Moog, Inc. Cl. A* | 1,900 | 81,472 | |||||
| National Presto Industries, Inc. | 700 | 52,150 | |||||
| Orbital Sciences Corp.* | 4,300 | 103,071 | |||||
| Triumph Group, Inc. | 1,000 | 45,710 | |||||
| 395,106 | |||||||
Airlines - 0.9% | |||||||
| Hawaiian Holdings, Inc.* | 9,900 | 91,872 | |||||
Apparel Manufacturers - 1.7% | |||||||
| G-III Apparel Group, Ltd.* | 5,600 | 104,776 | |||||
| Jones Apparel Group, Inc. | 4,500 | 83,295 | |||||
| 188,071 | |||||||
Applications Software - 0.7% | |||||||
| Compuware Corp.* | 7,300 | 70,737 | |||||
Auto/Truck Parts & Equipment-Original - 0.5% | |||||||
| Titan International, Inc. | 2,500 | 53,300 | |||||
Batteries/Battery Systems - 0.8% | |||||||
| Greatbatch, Inc.* | 3,300 | 80,982 | |||||
Beverages-Wine/Spirits - 0.7% | |||||||
| Central European Distribution Corp.* | 1,600 | 72,656 | |||||
Chemicals-Diversified - 0.6% | |||||||
| Olin Corp. | 3,400 | 65,960 | |||||
Chemicals-Plastics - 0.4% | |||||||
| Metabolix, Inc.* | 4,400 | 47,872 | |||||
Coffee - 0.6% | |||||||
| Green Mountain Coffee Roasters, Inc.* | 1,700 | 66,878 | |||||
Commercial Banks-Western US - 0.6% | |||||||
| SVB Financial Group* | 1,200 | 69,504 | |||||
Commercial Services - 1.4% | |||||||
| HMS Holdings Corp.* | 2,700 | 64,692 | |||||
| Team, Inc.* | 2,400 | 86,688 | |||||
| 151,380 | |||||||
Commercial Services-Finance - 0.7% | |||||||
| TNS, Inc.* | 3,900 | 75,543 | |||||
Computer Aided Design - 0.5% | |||||||
| Parametric Technology Corp.* | 3,100 | 57,040 | |||||
Computer Services - 0.5% | |||||||
| Ness Technologies, Inc.* | 5,100 | 58,497 | |||||
Computer Software - 0.7% | |||||||
| Double-Take Software, Inc.* | 7,200 | 71,640 | |||||
Computers-Integrated Systems - 0.7% | |||||||
| Netscout Systems, Inc.* | 6,800 | 72,352 | |||||
Consulting Services - 3.7% | |||||||
| Forrester Research, Inc.* | 2,700 | 79,164 | |||||
| FTI Consulting, Inc.* | 1,100 | 79,464 | |||||
| Gartner, Inc. Cl. A* | 3,400 | 77,112 | |||||
| Navigant Consulting, Inc.* | 4,100 | 81,549 | |||||
| Watson Wyatt Worldwide, Inc. Cl. A | 1,600 | 79,568 | |||||
| 396,857 | |||||||
Consumer Products-Miscellaneous - 0.6% | |||||||
| Jarden Corp.* | 2,800 | 65,660 | |||||
Containers-Paper/Plastic - 0.7% | |||||||
| Rock-Tenn Co. Cl. A | 1,800 | 71,964 | |||||
Cosmetics & Toiletries - 0.9% | |||||||
| Elizabeth Arden, Inc.* | 4,900 | 96,187 | |||||
Disposable Medical Products - 0.7% | |||||||
| Merit Medical Systems, Inc.* | 3,900 | 73,203 | |||||
Distribution/Wholesale - 1.2% | |||||||
| Fossil, Inc.* | 2,100 | 59,283 | |||||
| LKQ Corp.* | 4,400 | 74,668 | |||||
| 133,951 | |||||||
Diversified Operations - 0.7% | |||||||
| Compass Diversified Holdings | 5,600 | 78,064 | |||||
Electronic Components-Semiconductors - 3.2% | |||||||
| Macrovision Solutions Corp.* | 4,400 | 67,672 | |||||
| Monolithic Power Systems, Inc.* | 4,600 | 79,902 | |||||
| ON Semiconductor Corp.* | 11,400 | 77,064 | |||||
| PMC - Sierra, Inc.* | 10,400 | 77,168 | |||||
| Renesola Ltd. - ADR* | 4,600 | 48,254 | |||||
| 350,060 | |||||||
Electronic Design Automations - 0.8% | |||||||
| Mentor Graphics Corp.* | 7,800 | 88,530 | |||||
Electronic Measure Instruments - 0.7% | |||||||
| Itron, Inc.* | 900 | 79,677 | |||||
Energy-Alternate Sources - 0.5% | |||||||
| Canadian Solar, Inc.* | 2,600 | 50,778 | |||||
Engineering/R & D Services - 0.8% | |||||||
| EMCOR Group, Inc.* | 3,200 | 84,224 | |||||
Enterprise Software/Services - 2.9% | |||||||
| Concur Technologies, Inc.* | 1,700 | 65,042 | |||||
| Lawson Software, Inc.* | 10,400 | 72,800 | |||||
| Mantech International Corp. Cl. A* | 2,000 | 118,580 | |||||
| Taleo Corp. Cl. A* | 2,800 | 55,692 | |||||
| 312,114 | |||||||
E-Services/Consulting - 1.3% | |||||||
| GSI Commerce, Inc.* | 5,100 | 78,948 | |||||
| Websense, Inc.* | 2,500 | 55,875 | |||||
| 134,823 | |||||||
Finance-Consumer Loans - 0.7% | |||||||
| Portfolio Recovery Associates, Inc.* | 1,500 | 72,945 | |||||
Finance-Investment Bankers/Brokers - 2.6% | |||||||
| Knight Capital Group, Inc. Cl. A* | 4,800 | 71,328 | |||||
| Raymond James Financial, Inc. | 3,000 | 98,940 | |||||
| SWS Group, Inc. | 5,400 | 108,864 | |||||
| 279,132 | |||||||
Food-Miscellaneous/Diversified - 0.8% | |||||||
| Diamond Foods, Inc. | 3,200 | 89,696 | |||||
Food-Wholesale/Distribution - 1.8% | |||||||
| Spartan Stores, Inc. | 4,000 | 99,520 | |||||
| United Natural Foods, Inc.* | 3,600 | 89,964 | |||||
| 189,484 | |||||||
Footwear & Related Apparel - 1.4% | |||||||
| Skechers U.S.A, Inc. Cl. A* | 3,200 | 53,856 | |||||
| Steven Madden, Ltd.* | 3,800 | 94,164 | |||||
| 148,020 | |||||||
Hazardous Waste Disposal - 0.7% | |||||||
| American Ecology Corp. | 2,600 | 71,942 | |||||
Industrial Automation/Robotics - 0.5% | |||||||
| Cognex Corp. | 2,600 | 52,416 | |||||
See Accompanying Notes to Financial Statements.
2
SCHEDULE OF INVESTMENTS (Unaudited)
As of September 30, 2008
| Number of | |||||||
| Shares | Value | ||||||
Internet Applications Software - 0.7% | |||||||
| Cybersource Corp.* | 4,800 | $ | 77,328 | ||||
Internet Security - 0.6% | |||||||
| Vasco Data Security International, Inc.* | 5,900 | 61,124 | |||||
Machinery-General Industry - 2.0% | |||||||
| Altra Holdings, Inc.* | 5,300 | 78,228 | |||||
| DXP Enterprises, Inc.* | 1,200 | 63,972 | |||||
| Wabtec Corp. | 1,400 | 71,722 | |||||
| 213,922 | |||||||
Medical Instruments - 4.9% | |||||||
| Bruker Corp.* | 7,100 | 94,643 | |||||
| Integra LifeSciences Holdings Corp.* | 1,700 | 74,851 | |||||
| Kensey Nash Corp.* | 2,800 | 88,088 | |||||
| Natus Medical, Inc.* | 4,300 | 97,438 | |||||
| NuVasive, Inc.* | 1,600 | 78,928 | |||||
| Thoratec Corp.* | 3,400 | 89,250 | |||||
| 523,198 | |||||||
Medical Labs & Testing Services - 1.8% | |||||||
| Bio-Reference Labs, Inc.* | 3,500 | 101,150 | |||||
| Icon PLC - ADR* | 2,300 | 87,975 | |||||
| 189,125 | |||||||
Medical Laser Systems - 0.5% | |||||||
| Cynosure, Inc. Cl. A* | 2,800 | 50,232 | |||||
Medical Products - 4.5% | |||||||
| American Medical Systems Holdings, Inc.* | 3,800 | 67,488 | |||||
| China Medical Technologies, Inc. - ADR | 2,300 | 74,934 | |||||
| Exactech, Inc.* | 3,200 | 71,168 | |||||
| Haemonetics Corp.* | 1,500 | 92,580 | |||||
| Wright Medical Group, Inc.* | 3,200 | 97,408 | |||||
| Zoll Medical Corp.* | 2,500 | 81,800 | |||||
| 485,378 | |||||||
Medical-Biomedical/Genetics - 5.2% | |||||||
| Alexion Pharmaceuticals, Inc.* | 2,600 | 102,180 | |||||
| Medicines Co.* | 3,800 | 88,236 | |||||
| Myriad Genetics, Inc.* | 1,300 | 84,344 | |||||
| OSI Pharmaceuticals, Inc.* | 1,900 | 93,651 | |||||
| Regeneron Pharmaceuticals, Inc.* | 2,700 | 58,941 | |||||
| Savient Pharmaceuticals, Inc.* | 2,600 | 38,766 | |||||
| United Therapeutics Corp.* | 900 | 94,653 | |||||
| 560,771 | |||||||
Medical-Drugs - 1.8% | |||||||
| Eurand NV* | 4,100 | 74,456 | |||||
| Pharmasset, Inc.* | 2,800 | 55,860 | |||||
| Rigel Pharmaceuticals, Inc.* | 2,800 | 65,380 | |||||
| 195,696 | |||||||
Medical-Nursing Homes - 0.7% | |||||||
| Sun Healthcare Group, Inc.* | 5,400 | 79,164 | |||||
Medical-Outpatient/Home Medical Care - 0.6% | |||||||
| LHC Group, Inc.* | 2,100 | 59,808 | |||||
Networking Products - 0.8% | |||||||
| Polycom, Inc.* | 3,500 | 80,955 | |||||
Oil Companies-Exploration & Production - 1.7% | |||||||
| EXCO Resources, Inc.* | 4,000 | 65,280 | |||||
| GMX Resources, Inc.* | 1,500 | 71,700 | |||||
| Venoco, Inc.* | 3,700 | 48,100 | |||||
| 185,080 | |||||||
Oil-Field Services - 3.0% | |||||||
| Cal Dive International, Inc.* | 7,700 | 81,620 | |||||
| Hornbeck Offshore Services, Inc.* | 1,300 | 50,206 | |||||
| Matrix Service Co.* | 4,000 | 76,400 | |||||
| Tetra Technologies, Inc.* | 4,200 | 58,170 | |||||
| Willbros Group, Inc.* | 2,100 | 55,650 | |||||
| 322,046 | |||||||
Pharmacy Services - 0.9% | |||||||
| HealthExtras, Inc* | 3,500 | 91,420 | |||||
Physical Practice Management - 0.6% | |||||||
| IPC The Hospitalist Co., Inc.* | 2,500 | 64,250 | |||||
Power Conversion/Supply Equipment - 1.2% | |||||||
| Energy Conversion Devices, Inc.* | 900 | 52,425 | |||||
| Powell Industries, Inc.* | 1,800 | 73,458 | |||||
| 125,883 | |||||||
Private Corrections - 0.8% | |||||||
| Cornell Cos., Inc.* | 3,000 | 81,540 | |||||
Property/Casualty Insurance - 0.6% | |||||||
| Amtrust Financial Services, Inc. | 4,600 | 62,514 | |||||
Research & Development - 1.6% | |||||||
| Kendle International, Inc.* | 2,100 | 93,891 | |||||
| Parexel International Corp.* | 2,900 | 83,114 | |||||
| 177,005 | |||||||
Retail-Apparel/Shoe - 4.6% | |||||||
| Aeropostale, Inc.* | 2,300 | 73,853 | |||||
| Brown Shoe Co., Inc. | 4,200 | 68,796 | |||||
| Collective Brands, Inc.* | 5,100 | 93,381 | |||||
| Dress Barn, Inc.* | 5,000 | 76,450 | |||||
| JOS. A Bank Clothiers, Inc.* | 1,900 | 63,840 | |||||
| Phillips-Van Heusen Corp. | 1,700 | 64,447 | |||||
| The Childrens Place Retail Stores, Inc.* | 1,700 | 56,695 | |||||
| 497,462 | |||||||
Retail-Convenience Store - 0.8% | |||||||
| Pantry, Inc.* | 3,900 | 82,641 | |||||
Retail-Miscellaneous/Diversified - 0.5% | |||||||
| Pricesmart, Inc. | 3,200 | 53,568 | |||||
Retail-Perfume & Cosmetics - 0.7% | |||||||
| Ulta Salon Cosmetics & Fragrance, Inc.* | 6,000 | 79,680 | |||||
Retail-Restaurants - 2.5% | |||||||
| Buffalo Wild Wings, Inc.* | 2,100 | 84,504 | |||||
| CBRL Group, Inc. | 2,600 | 68,380 | |||||
| CKE Restaurants, Inc. | 6,600 | 69,960 | |||||
| Jack in the Box, Inc.* | 2,300 | 48,530 | |||||
| 271,374 | |||||||
Seismic Data Collection - 0.7% | |||||||
| ION Geophysical Corp.* | 5,300 | 75,207 | |||||
Semiconductor Components - Integrated Circuits - 1.6% | |||||||
| O2Micro International, Ltd. - ADR* | 8,100 | 29,403 | |||||
| Pericom Semiconductor Corp.* | 6,600 | 69,300 | |||||
| TriQuint Semiconductor, Inc.* | 16,000 | 76,640 | |||||
| 175,343 | |||||||
Telecommuications Services - 1.7% | |||||||
| NTELOS Holdings Corp. | 3,300 | 88,737 | |||||
| Premiere Global Services, Inc.* | 6,500 | 91,390 | |||||
| 180,127 | |||||||
See Accompanying Notes to Financial Statements.
3
U.S. EMERGING GROWTH FUND
SCHEDULE OF INVESTMENTS (Unaudited)
As of September 30, 2008
| Number of | |||||||
| Shares | Value | ||||||
Telecommunication Equipment - 0.3% | |||||||
| Arris Group, Inc.* | 4,300 | $ | 33,239 | ||||
Telecommunication Equipment-Fiber Optics - 0.8% | |||||||
| IPG Photonics Corp.* | 4,400 | 85,844 | |||||
Textile-Apparel - 0.5% | |||||||
| Perry Ellis International, Inc.* | 3,500 | 52,185 | |||||
Theaters - 0.1% | |||||||
| Cinemark Holdings, Inc. | 400 | 5,440 | |||||
Therapeutics - 0.9% | |||||||
| Alnylam Pharmaceuticals, Inc.* | 1,800 | 52,110 | |||||
| Medarex, Inc.* | 7,100 | 45,937 | |||||
| 98,047 | |||||||
Transport-Air Freight - 0.7% | |||||||
| Atlas Air Worldwide Holdings, Inc.* | 1,900 | 76,589 | |||||
Transport-Equipment & Leasing - 1.1% | |||||||
| GATX Corp. | 1,400 | 55,398 | |||||
| TAL International Group, Inc. | 3,100 | 64,542 | |||||
| 119,940 | |||||||
Transport-Marine - 0.6% | |||||||
| Gulfmark Offshore, Inc.* | 1,400 | 62,832 | |||||
Transport-Rail - 0.8% | |||||||
| Genesee & Wyoming, Inc. Cl. A* | 2,200 | 82,544 | |||||
Transport-Services - 0.5% | |||||||
| Pacer International, Inc. | 3,200 | 52,704 | |||||
Transport-Truck - 2.0% | |||||||
| Con-way, Inc. | 1,800 | 79,398 | |||||
| Old Dominion Freight Line, Inc.* | 2,500 | 70,850 | |||||
| Saia, Inc.* | 4,700 | 62,416 | |||||
| 212,664 | |||||||
Ultra Sound Imaging Systems - 0.7% | |||||||
| SonoSite, Inc.* | 2,300 | 72,220 | |||||
Vitamins & Nutrition Products - 1.4% | |||||||
| Herbalife, Ltd. | 1,900 | 75,088 | |||||
| NBTY, Inc.* | 2,500 | 73,800 | |||||
| 148,888 | |||||||
Water Treatment Systems - 0.5% | |||||||
| Energy Recovery, Inc.* | 6,100 | 58,499 | |||||
| Total Common Stock (Cost: $11,431,122) | 10,872,593 | ||||||
| Total Investments - 100.7% (Cost: $11,431,122) | 10,872,593 | ||||||
| Liabilities In Excess of Other Assets - (0.7%) | (77,564 | ) | |||||
| Net Assets - 100.0% | $ | 10,795,029 | |||||
* | Non-income producing securities. |
ADR - American Depository Receipt
| SCHEDULE OF INVESTMENTS BY SECTOR | ||||
| as of September 30, 2008 | ||||
| Percent of | ||||
| Sector | Net Assets | |||
| Consumer, Non-cyclical | 38.4 | % | ||
| Industrial | 18.0 | |||
| Consumer, Cyclical | 15.4 | |||
| Technology | 11.6 | |||
| Communications | 6.1 | |||
| Energy | 5.4 | |||
| Financial | 4.5 | |||
| Diversified | 0.7 | |||
| Basic Materials | 0.6 | |||
| Total Investments | 100.7 | |||
| Liabilities in excess of other assets | (0.7 | ) | ||
| Net Assets | 100.0 | % | ||
See Accompanying Notes to Financial Statements.
4
U.S. SYSTEMATIC LARGE CAP GROWTH FUND
Management Team: James Li, Ph.D., CFA, Portfolio Manager; Jane Edmondson, Portfolio Manager
Chief Investment Officer: Horacio A. Valeiras, CFA
Goal: The U.S. Systematic Large Cap Growth Fund seeks to maximize long-term capital appreciation by investing primarily in stocks from a universe of large U.S. companies with market capitalizations similar to the Russell 1000 Growth Index at time of purchase.
Market Overview: The Russell 1000 Growth Index, a barometer of U.S. large-cap growth stocks, posted a loss during the six months ended September 30, 2008. The decline was part of a broad sell-off in the market that pressured equities across styles and capitalization ranges.
The period began on a positive note, with the index generating strong gains in April and May amid optimism the emergency steps taken by the Federal Reserve in March would ease strains in the credit markets. An interest rate cut from the Fed on April 30, as well as some encouraging reports on the economy, further boosted investor sentiment.
Gains from the spring subsequently gave way to steep losses, which were driven by:
| • | Further deterioration in mortgage-linked assets that led to the bankruptcy, sale or government takeover of several large financial institutions |
| • | Seizing up of the credit markets, as uncertainty about which institution might be next to fail made banks afraid to lend, even to each other |
| • | Worsening outlook for the economy and weak corporate earnings, with second quarter profits for S&P 500 companies down more than 22% |
At the end of September, investors were awaiting the fate of legislation that would allow the Treasury to buy up to $700 billion of illiquid mortgage securities from financial firms.
Performance: The Fund’s Class I shares lost 9.53% between April 1 and September 30, 2008 but outperformed the Russell 1000 Growth Index, which fell 11.23%.
Portfolio Specifics: The Fund’s outperformance was driven by stock selection, which was strongest in the energy, consumer discretionary and industrials sectors. Areas of relative weakness included stock selection in the financials sector and an overweight in consumer discretionary companies, which lagged the broad market amid high food and gas prices.
At the individual stock level, some of our best-performing holdings were Amgen, Wal-Mart Stores and McDonald’s, which all generated double-digit gains. Optimistic business prospects and better-than-expected earnings growth boosted biotechnology firm Amgen. Wal-Mart, a defensive name in the consumer staples sector, continued to post solid same-store sales growth in a difficult retail environment. Fast food chain McDonald’s benefited from positive sales trends outside the United States and resilience in its U.S. business.
Holdings remained well-diversified throughout the period, consistent with our risk-controlled approach to portfolio construction. On September 30, the Fund’s largest overweights versus the Russell 1000 Growth Index were in the health care (+3.1%) and energy (+2.8%) sectors. The largest underweights were in financials (-3.4%) and information technology (-2.3%).
Market Outlook: Our process evaluates investment opportunities on a relative basis and is required to remain fully invested. As such, the process neither utilizes nor results in a forecast or outlook on the overall market, but expects to perform equally well versus the Russell 1000 Growth Index in both up and down markets.
Through consistent application of our systematic, model-driven process, we believe that the Fund will continue to add value to the benchmark.
Comparison of Change in Value of a $250,000 Investment in U.S. Systematic Large Cap Growth Fund Class R Shares with the Russell 1000 Growth Index.
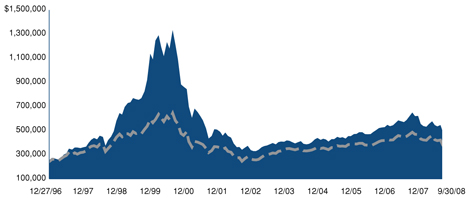

| Annualized Total Returns As of 9/30/08 | ||||||||||
1 Year | 5 Years | 10 Years | ||||||||
U.S. Systematic Large Cap Growth Fund Class R | -22.56% | 4.56% | 1.39% | |||||||
| Russell 1000 Growth Index | -20.88% | 3.74% | 0.59% | |||||||
The graph above shows the value of a hypothetical $250,000 investment in the Fund compared with the Russell 1000 Growth Index for the periods indicated. The Fund’s Class R shares were first available on May 21, 1999. Performance prior to the introduction of Class R shares reflects the historical performance of the Fund’s Class I Shares. This performance has been restated to reflect shareholder services fees of 0.25% applicable to Class R shares, but not Class I shares of the Fund. The Fund’s Class I Shares calculate their performance based upon the historical performance of a corresponding series of Nicholas-Applegate Mutual Funds (renamed ING Mutual Funds). Average annual total return figures include changes in principal value, reinvested dividends, and capital gain distributions. Absent expense limitations, total returns would have been slightly lower. The total returns shown above do not show the effects of income taxes on an individual’s investment. In most cases, taxes may reduce your actual investment returns on income or gains paid by the Fund or any gains you may realize if you sell your shares. Past performance cannot guarantee future results.
The Russell 1000 Growth Index measures the performance of those Russell 1000 companies with lower price-to-book ratios and lower forecasted growth values. The unmanaged index differs from the Fund in composition, does not pay management fees or expenses and includes reinvested dividends. One cannot invest directly in an index.
Since markets can go down as well as up, investment return and principal value will fluctuate with market conditions. You may have a gain or loss when you sell your shares.
5
U.S. SYSTEMATIC LARGE CAP GROWTH FUND
SCHEDULE OF INVESTMENTS (Unaudited)
As of September 30, 2008
| Number of | |||||||
| Shares | Value | ||||||
Common Stock - 98.6% | |||||||
Aerospace/Defense - 2.8% | |||||||
| Boeing Co. | 3,000 | $ | 172,050 | ||||
| Northrop Grumman Corp. | 1,500 | 90,810 | |||||
| 262,860 | |||||||
Agricultural Chemicals - 2.0% | |||||||
| CF Industries Holdings, Inc. | 700 | 64,022 | |||||
| Monsanto Co. | 1,200 | 118,776 | |||||
| 182,798 | |||||||
Apparel Manufacturers - 1.8% | |||||||
| VF Corp. | 2,100 | 162,351 | |||||
Applications Software - 5.2% | |||||||
| Microsoft Corp. | 18,100 | 483,089 | |||||
Beverages-Non-alcoholic - 1.8% | |||||||
| PepsiCo, Inc. | 2,400 | 171,048 | |||||
Building-Residential/Commercial - 1.3% | |||||||
| Pulte Homes, Inc. | 8,600 | 120,142 | |||||
Cable TV - 0.8% | |||||||
| DISH Network Corp. Cl. A * | 3,300 | 69,300 | |||||
Chemicals-Diversified - 1.0% | |||||||
| Celanese Corp. Cl. A | 3,400 | 94,894 | |||||
Coal - 0.8% | |||||||
| Foundation Coal Holdings, Inc. | 1,000 | 35,580 | |||||
| Walter Industries, Inc. | 800 | 37,960 | |||||
| 73,540 | |||||||
Commercial Services - 1.0% | |||||||
| Alliance Data Systems Corp.* | 1,500 | 95,070 | |||||
Commercial Services-Finance - 0.4% | |||||||
| Mastercard, Inc. Cl. A | 200 | 35,466 | |||||
Computers - 6.6% | |||||||
| Hewlett-Packard Co. | 6,500 | 300,560 | |||||
| International Business Machines Corp. | 2,700 | 315,792 | |||||
| 616,352 | |||||||
Computers-Integrated Systems - 1.0% | |||||||
| NCR Corp.* | 4,200 | 92,610 | |||||
Computers-Memory Devices - 0.8% | |||||||
| Western Digital Corp.* | 3,300 | 70,356 | |||||
Cosmetics & Toiletries - 1.0% | |||||||
| Procter & Gamble Co. | 1,375 | 95,824 | |||||
Diversified Manufacturing Operations - 0.9% | |||||||
| Tyco International, Ltd. | 2,500 | 87,550 | |||||
Electronic Components-Semiconductors - 1.1% | |||||||
| Intel Corp. | 3,200 | 59,936 | |||||
| MEMC Electronic Materials, Inc.* | 1,400 | 39,564 | |||||
| 99,500 | |||||||
Energy-Alternate Sources - 0.6% | |||||||
| First Solar, Inc.* | 300 | 56,673 | |||||
Engineering/R & D Services - 1.3% | |||||||
| Fluor Corp. | 1,600 | 89,120 | |||||
| The Shaw Group, Inc.* | 900 | 27,657 | |||||
| 116,777 | |||||||
Engines-Internal Combust - 1.2% | |||||||
| Cummins, Inc. | 2,500 | 109,300 | |||||
Internet Security - 1.3% | |||||||
| Symantec Corp.* | 6,200 | 121,396 | |||||
Linen Supply & Relative Items - 1.3% | |||||||
| Cintas Corp. | 4,200 | 120,582 | |||||
Machinery-Construction & Mining - 1.3% | |||||||
| Bucyrus International, Inc. Cl. A | 2,600 | 116,168 | |||||
Medical Instruments - 3.9% | |||||||
| Boston Scientific Corp.* | 8,200 | 100,614 | |||||
| Medtronic, Inc. | 3,300 | 165,330 | |||||
| St. Jude Medical, Inc.* | 2,300 | 100,027 | |||||
| 365,971 | |||||||
Medical Products - 1.8% | |||||||
| Johnson & Johnson | 2,400 | 166,272 | |||||
Medical-Biomedical/Genetics - 2.8% | |||||||
| Amgen, Inc.* | 3,300 | 195,591 | |||||
| Celgene Corp.* | 1,000 | 63,280 | |||||
| 258,871 | |||||||
Medical-Drugs - 4.0% | |||||||
| Eli Lilly & Co. | 2,800 | 123,284 | |||||
| Forest Laboratories, Inc.* | 5,600 | 158,368 | |||||
| Merck & Co., Inc. | 2,800 | 88,368 | |||||
| 370,020 | |||||||
Medical-HMO - 1.0% | |||||||
| Aetna, Inc. | 2,500 | 90,275 | |||||
Medical-Hospitals - 1.0% | |||||||
| Community Health Systems, Inc.* | 3,000 | 87,930 | |||||
Metal-Diversified - 1.0% | |||||||
| Freeport-McMoRan Copper & Gold, Inc. | 1,700 | 96,645 | |||||
Metal-Iron - 0.3% | |||||||
| Cleveland-Cliffs, Inc. | 500 | 26,470 | |||||
Multi-line Insurance - 1.1% | |||||||
| ACE, Ltd. | 1,900 | 102,847 | |||||
Networking Products - 4.6% | |||||||
| Cisco Systems, Inc.* | 19,000 | 428,640 | |||||
Office Automation & Equipment - 1.1% | |||||||
| Pitney Bowes, Inc. | 3,100 | 103,106 | |||||
Oil & Gas Drilling - 3.6% | |||||||
| Diamond Offshore Drilling, Inc. | 1,500 | 154,590 | |||||
| ENSCO International, Inc. | 3,100 | 178,653 | |||||
| 333,243 | |||||||
Oil Companies-Exploration & Production - 4.1% | |||||||
| Apache Corp. | 1,800 | 187,704 | |||||
| Occidental Petroleum Corp. | 1,600 | 112,720 | |||||
| Southwestern Energy Co.* | 2,600 | 79,404 | |||||
| 379,828 | |||||||
Oil Companies-Integrated - 3.0% | |||||||
| Exxon Mobil Corp. | 3,000 | 232,980 | |||||
| Hess Corp. | 500 | 41,040 | |||||
| 274,020 | |||||||
Oil Field Machine & Equipment - 0.9% | |||||||
| National Oilwell Varco, Inc.* | 1,600 | 80,368 | |||||
Pharmacy Services - 2.9% | |||||||
| Medco Health Solutions, Inc.* | 2,500 | 112,500 | |||||
| Omnicare, Inc. | 5,300 | 152,481 | |||||
| 264,981 | |||||||
See Accompanying Notes to Financial Statements.
6
SCHEDULE OF INVESTMENTS (Unaudited)
As of September 30, 2008
| Number of | |||||||
| Shares | Value | ||||||
Retail-Apparel/Shoe - 2.2% | |||||||
| Limited Brands, Inc. | 3,900 | $ | 67,548 | ||||
| Polo Ralph Lauren Corp. Cl. A | 2,000 | 133,280 | |||||
| 200,828 | |||||||
Retail-Discount - 4.2% | |||||||
| Wal-Mart Stores, Inc. | 6,500 | 389,285 | |||||
Retail-Restaurants - 2.8% | |||||||
| McDonald’s Corp. | 2,700 | 166,590 | |||||
| Panera Bread Co. Cl. A* | 1,900 | 96,710 | |||||
| 263,300 | |||||||
Semiconductor Components-Integrated Circuits - 0.6% | |||||||
| Integrated Device Technology, Inc.* | 7,600 | 59,128 | |||||
Telephone-Integrated - 0.9% | |||||||
| Verizon Communications, Inc. | 2,700 | 86,643 | |||||
Tobacco - 5.3% | |||||||
| Altria Group, Inc. | 12,400 | 246,016 | |||||
| Philip Morris International, Inc. | 5,200 | 250,120 | |||||
| 496,136 | |||||||
Transport-Marine - 0.7% | |||||||
| Frontline Ltd. | 1,400 | 67,298 | |||||
Transport-Rail - 3.5% | |||||||
| CSX Corp. | 3,500 | 190,995 | |||||
| Norfolk Southern Corp. | 1,200 | 79,452 | |||||
| Union Pacific Corp. | 700 | 49,812 | |||||
| 320,259 | |||||||
Vitamins & Nutrition Products - 0.5% | |||||||
| Herbalife, Ltd. | 1,100 | 43,472 | |||||
Web Portals/ISP - 2.6% | |||||||
| Google, Inc. Cl. A* | 300 | 120,156 | |||||
| Sohu.com, Inc.* | 2,200 | 122,650 | |||||
| 242,806 | |||||||
Wireless Equipment - 1.1% | |||||||
| QUALCOMM, Inc. | 2,400 | 103,128 | |||||
| Total Common Stock (Cost: $9,601,811) | 9,155,416 | ||||||
| Principal | |||||||
| Amount | |||||||
Short Term Investments - 1.4% | |||||||
Time Deposit - 1.4% | |||||||
| Citibank London | |||||||
| 3.470%, 10/01/08 | |||||||
| (Cost: $126,505) | $ | 126,505 | 126,505 | ||||
| Total Investments - 100.0% (Cost: $9,728,316) | 9,281,921 | ||||||
| Other Assets In Excess Of Liabilities - 0.0% | 4,224 | ||||||
| Net Assets - 100.0% | $ | 9,286,145 | |||||
| * | Non-income producing securities. |
| SCHEDULE OF INVESTMENTS BY SECTOR | ||||
| as of September 30, 2008 | ||||
| Percent of | ||||
| Sector | Net Assets | |||
| Consumer, Non-cyclical | 27.5 | % | ||
| Technology | 16.4 | |||
| Energy | 12.9 | |||
| Consumer, Cyclical | 12.8 | |||
| Industrial | 11.6 | |||
| Communications | 11.3 | |||
| Basic Materials | 4.3 | |||
| Financial | 1.1 | |||
| Consumer Non-cyclical | 0.7 | |||
| Short Term Investments | 1.4 | |||
| Total Investments | 100.0 | |||
| Other assets in excess of liabilities | 0.0 | |||
| Net Assets | 100.0 | % | ||
See Accompanying Notes to Financial Statements.
7
INTERNATIONAL GROWTH FUND
Management Team: Horacio A. Valeiras, CFA, Portfolio Manager and Chief Investment Officer; Pedro V. Marcal, Portfolio Manager
Goal: The International Growth Fund seeks to maximize long-term capital appreciation through investments primarily in companies with above-average earnings growth and positioned in strong growth areas.
Market Overview: Developed non-U.S. stock markets were weak during the six months ended September 30, 2008. Losses were broad-based, with every country in the MSCI EAFE Index posting a negative return in local currencies. The U.S. dollar appreciated versus a basket of currencies, which accentuated the declines in dollar terms.
The period began with gains, fueled by optimism that the worst of the U.S.-led credit crisis might be over. However, international equities sold off in June, largely due to inflation fears, and remained under pressure throughout the rest of the period as the credit problems in the United States intensified. Overwhelmed by mortgage-related losses, the U.S. investment banking industry collapsed in September, causing a global credit freeze and darkening the outlook for the world economy.
European financials were also under considerable stress, and several institutions were rescued by their respective governments. To help stabilize the sector, the region’s central banks added extra liquidity to the money markets, and U.K. officials temporarily banned short selling of financial stocks. Euro area economies showed signs of rapid deterioration, with quarterly GDP contracting for the first time since the 1999 introduction of the common currency.
Japanese equities approached a four-year low, as data showed that the country’s financial companies had significant exposure to a U.S. securities firm that went bankrupt. In addition, lending standards tightened, business failures increased and consumer sentiment slumped to a record low. In September, the Bank of Japan set aside $60 billion to bolster troubled local and overseas financial firms.
Performance: During the six months ended September 30, 2008, the Fund’s Class I shares posted a 20.90% loss but outperformed the MSCI EAFE Index, which declined 22.03%.
Portfolio Specifics: Relative performance was helped by stock selection in Ireland and Hong Kong. Two of the Fund’s top contributors were Ireland-based Icon, a contract research organization serving the pharmaceutical and biotechnology industries, and HongKong Electric, a utility. Icon experienced strong growth in a robust demand environment, as more companies seek to lower the time and cost of drug development by outsourcing. HongKong Electric continued to pursue its international growth strategy by acquiring a 50% stake in New Zealand’s fourth-largest electricity distribution network.
A lack of exposure to Norway, one of the worst-performing countries in the index, was another plus. Energy companies represent a large percentage of Norway’s stock market capitalization, and the 28% drop in the price of oil from July through September was a significant headwind.
Areas of relative weakness included stock selection in Japan and France and exposure to emerging countries, which lagged their developed market counterparts in the risk-averse environment.
Market Outlook: We expect international stock markets to remain volatile as investors digest the implications of the U.S. government’s $700 billion bank rescue plan, as well as other aggressive steps taken by authorities around the world. Combined, these efforts may restore confidence in the financial system and, in turn, loosen up the credit markets and stimulate the global economy. Still, the real impact of these policy actions is likely to be measured in months and years rather than days and weeks.
In this dynamic environment, the consistent application of our investment process is more important than ever. We thus remain focused on identifying positive changes taking place within individual companies, which we believe will benefit the Fund over time.
Comparison of Change in Value of a $250,000 Investment in International Growth Fund Class R Shares with the MSCI EAFE Index.
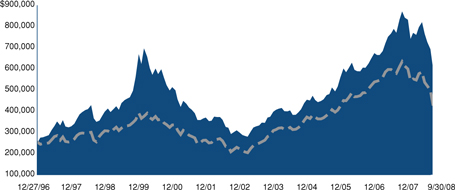

| Annualized Total Returns As of 9/30/08 | ||||||||||
1 Year | 5 Years | 10 Years | ||||||||
| International Growth Fund Class R | -27.85% | 11.73% | 5.58% | |||||||
| MSCI EAFE Index | -30.13% | 10.16% | 5.42% | |||||||
The graph above shows the value of a hypothetical $250,000 investment in the Fund’s Class R shares compared with the Morgan Stanley Capital International Europe, Australasia, Far East Index (“MSCI EAFE”) over the periods indicated. The Fund’s Class R shares were first available on May 21, 1999. Performance prior to the introduction of Class R shares reflects the historical performance of the Fund’s Class I Shares.
This performance has been restated to reflect shareholder services fees of 0.25% applicable to Class R shares, but not Class I shares of the Fund. The Fund’s Class I Shares calculate their performance based upon the historical performance of a corresponding series of Nicholas-Applegate Mutual Funds (renamed ING Mutual Funds), adjusted to reflect all fees and expenses applicable to the Fund’s Class I shares. Average annual total return figures include changes in principal value, reinvested dividends, and capital gain distributions.
The total returns shown above do not show the effects of income taxes on an individual’s investment. In most cases, taxes may reduce your actual investment returns on income or gains paid by the Fund or any gains you may realize if you sell your shares. Past performance cannot guarantee future results.
The MSCI EAFE Index is an unmanaged index of over 900 companies, and is a generally accepted benchmark for major overseas markets. Index weightings represent the relative capitalizations of the major overseas markets included in the index on a U.S. dollar adjusted basis. The unmanaged Index differs from the Fund in composition, does not pay management fees or expenses and includes reinvested dividends.
One cannot invest directly in an index.
Since markets can go down as well as up, investment return and principal value will fluctuate with market conditions, currency volatility and the social, economic and political climates of countries where the Fund invests. You may have a gain or loss when you sell your shares.
8
INTERNATIONAL GROWTH FUND
SCHEDULE OF INVESTMENTS (Unaudited)
As of September 30, 2008
| Number of | |||||||
| Shares | Value | ||||||
Common Stock - 93.9% | |||||||
Australia - 5.4% | |||||||
| AMP, Ltd. | 24,261 | $ | 135,893 | ||||
| CSL, Ltd. | 16,131 | 482,841 | |||||
| Incitec Pivot, Ltd.* | 52,320 | 212,868 | |||||
| Rio Tinto, Ltd | 1,730 | 117,311 | |||||
| 948,913 | |||||||
Belgium - 1.1% | |||||||
| InBev NV | 3,388 | 201,748 | |||||
Brazil - 1.6% | |||||||
| Bolsa de Mercadorias e Futuros - BM&F | 9,000 | 39,659 | |||||
| Cia Vale do Rio Doce Cl. B - ADR | 8,100 | 155,115 | |||||
| Unibanco - Uniao de Bancos | |||||||
| Brasileiros SA - GDR | 800 | 80,736 | |||||
| 275,510 | |||||||
Canada - 2.9% | |||||||
| Potash Corp. of Saskatchewan | 1,300 | 171,613 | |||||
| Rogers Communications, Inc. Cl. B | 5,600 | 181,821 | |||||
| Teck Cominco, Ltd. Cl. B | 5,400 | 153,488 | |||||
| 506,922 | |||||||
Denmark - 0.6% | |||||||
| Novo Nordisk AS Cl. B | 2,050 | 105,999 | |||||
Egypt - 0.5% | |||||||
| Orascom Construction Industries - GDR | 152 | 15,618 | |||||
| Orascom Construction Industries - GDR | 651 | 66,890 | |||||
| 82,508 | |||||||
Finland - 0.4% | |||||||
| Outotec OYJ | 2,886 | 77,288 | |||||
France - 8.5% | |||||||
| Alstom SA | 3,327 | 250,086 | |||||
| BNP Paribas | 2,221 | 209,078 | |||||
| Cie Generale de Geophysique-Veritas* | 4,701 | 148,272 | |||||
| Electricite de France | 1,244 | 90,266 | |||||
| GDF Suez | 7,402 | 384,886 | |||||
| Suez Environnement SA Rights* | 2 | 12 | |||||
| Suez SA* | 896 | 22,325 | |||||
| Suez SA | 109 | 5,365 | |||||
| Total SA | 3,955 | 239,906 | |||||
| Veolia Environnement | 3,827 | 157,369 | |||||
| 1,507,565 | |||||||
Germany - 9.0% | |||||||
| Deutsche Telekom AG | 8,208 | 125,749 | |||||
| E.ON AG | 8,699 | 440,278 | |||||
| Rhoen Klinikum AG | 4,076 | 119,441 | |||||
| RWE AG | 2,538 | 243,695 | |||||
| SAP AG | 4,396 | 235,562 | |||||
| Siemens AG | 1,438 | 134,495 | |||||
| Stada Arzneimittel AG | 4,143 | 166,664 | |||||
| United Internet AG | 12,077 | 130,221 | |||||
| 1,596,105 | |||||||
Greece - 1.7% | |||||||
| National Bank of Greece SA | 3,844 | 153,506 | |||||
| Piraeus Bank SA | 6,760 | 139,797 | |||||
| 293,303 | |||||||
Hong Kong - 1.3% | |||||||
| HongKong Electric Holdings | 28,000 | 177,503 | |||||
| Kerry Properties, Ltd. | 15,563 | 50,245 | |||||
| 227,748 | |||||||
Ireland - 0.8% | |||||||
| Icon PLC - ADR* | 3,500 | 133,875 | |||||
Israel - 1.3% | |||||||
Teva Pharmaceutical Industries, Ltd. - ADR | 5,200 | 238,108 | |||||
Italy - 3.5% | |||||||
| Intesa Sanpaolo SpA | 37,162 | 203,494 | |||||
| Saipem SpA | 8,395 | 249,995 | |||||
| UniCredit SpA | 42,773 | 158,227 | |||||
| 611,716 | |||||||
Japan - 21.4% | |||||||
| Air Water, Inc. | 1,000 | 10,036 | |||||
| Capcom Co., Ltd. | 3,200 | 92,085 | |||||
| East JapanRailway Co. | 33 | 250,053 | |||||
| Honda Motor Co., Ltd | 4,800 | 142,987 | |||||
| Japan Tobacco, Inc. | 52 | 197,513 | |||||
| KDDI Corp. | 26 | 147,633 | |||||
| Kirin Holdings Co., Ltd. | 10,000 | 132,748 | |||||
| Mitsubishi Corp. | 8,200 | 170,356 | |||||
| Mitsubishi Electric Corp. | 14,300 | 95,260 | |||||
| Mitsubishi Estate Co., Ltd. | 4,300 | 83,322 | |||||
| Mitsubishi UFJ Financial Group, Inc. | 31,700 | 272,902 | |||||
| Mizuho Financial Group, Inc. | 48 | 204,531 | |||||
| Nintendo Co., Ltd | 900 | 376,554 | |||||
| Nitori Co., Ltd. | 2,400 | 144,375 | |||||
| Nomura Holdings, Inc. | 15,300 | 195,583 | |||||
| Secom Co., Ltd. | 2,200 | 92,259 | |||||
| Sumitomo Mitsui Financial Group, Inc. | 37 | 224,718 | |||||
| T&D Holdings, Inc. | 1,950 | 102,641 | |||||
| The Japan Steel Works, Ltd. | 20,000 | 247,373 | |||||
| Tokyo Electric Power Co., Inc. | 3,300 | 82,397 | |||||
| Toyo Tanso Co., Ltd. | 3,100 | 164,070 | |||||
| Toyota Motor Corp. | 3,100 | 130,897 | |||||
| Unicharm Corp. | 1,500 | 117,131 | |||||
| West Japan Railway Co. | 29 | 126,366 | |||||
| 3,803,790 | |||||||
Mexico - 0.4% | |||||||
| America Movil SAB de CV - ADR | 1,400 | 64,904 | |||||
Netherlands - 1.2% | |||||||
| Royal KPN NV | 14,415 | 209,295 | |||||
Peru - 0.4% | |||||||
| Credicorp, Ltd. | 1,000 | 62,250 | |||||
Republic of China - 0.2% | |||||||
China Communications Construction Co., Ltd. | 35,000 | 30,377 | |||||
Russian Federation - 0.7% | |||||||
| Evraz Group SA - GDR | 3,217 | 121,603 | |||||
Singapore - 1.7% | |||||||
| DBS Group Holdings, Ltd. | 25,100 | 298,307 | |||||
Spain - 1.9% | |||||||
| Banco Santander SA | 6,329 | 94,646 | |||||
| Iberdrola SA | 7,889 | 80,223 | |||||
| Telefonica SA | 6,915 | 165,356 | |||||
| 340,225 |
See Accompanying Notes to Financial Statements.
9
INTERNATIONAL GROWTH FUND
SCHEDULE OF INVESTMENTS (Unaudited)
As of September 30, 2008
| Number of | |||||||
| Shares | Value | ||||||
Switzerland - 8.1% | |||||||
| ACE, Ltd. | 5,400 | $ | 292,302 | ||||
| Julius Baer Holding AG | 2,850 | 140,286 | |||||
| Nestle SA | 12,499 | 545,123 | |||||
| Roche Holding AG | 2,210 | 348,947 | |||||
| Syngenta AG | 534 | 114,611 | |||||
| 1,441,269 | |||||||
United Kingdom - 19.7% | |||||||
| BG Group PLC | 9,382 | 171,620 | |||||
| BP PLC | 20,126 | 168,631 | |||||
| British American Tobacco PLC | 16,889 | 559,633 | |||||
| Diageo PLC | 14,858 | 253,545 | |||||
| HSBC Holdings PLC | 31,200 | 496,715 | |||||
| Imperial Tobacco Group PLC | 9,654 | 313,270 | |||||
| International Power PLC | 36,487 | 238,347 | |||||
| Reckitt Benckiser Group PLC | 4,098 | 200,616 | |||||
| Royal Dutch Shell PLC Cl. A | 5,748 | 167,942 | |||||
| SSL International PLC | 15,846 | 128,263 | |||||
| Standard Chartered PLC | 5,600 | 134,024 | |||||
| Unilever PLC | 10,346 | 284,348 | |||||
| Vodafone Group PLC | 86,287 | 191,185 | |||||
| Wellstream Holdings PLC* | 9,805 | 180,597 | |||||
| 3,488,736 | |||||||
| Total Common Stock (Cost: $18,776,431) | 16,668,064 | ||||||
Preferred Stock - 3.8% | |||||||
Brazil - 0.8% | |||||||
| Usinas Siderurgicas de Minas Gerais SA | 6,500 | 136,507 | |||||
Germany - 3.1% | |||||||
| Fresenius SE | 4,486 | 326,660 | |||||
| Henkel KGaA | 5,883 | 216,327 | |||||
| 542,987 | |||||||
| Total Preferred Stock (Cost: $824,276) | 679,494 | ||||||
| Principal | |||||||
| Amount | |||||||
Short Term Investments - 1.3% | |||||||
Time Deposit - 1.3% | |||||||
| Brown Brothers Harriman & Co. - Grand | |||||||
| Cayman 3.470%, 10/01/08 | |||||||
| (Cost: $230,973) | $ | 230,973 | 230,973 | ||||
| Total Investments - 99.1% (Cost: $19,831,680) | 17,578,531 | ||||||
| Other Assets In Excess Of Liabilities - 0.9% | 164,181 | ||||||
| Net Assets - 100.0% | $ | 17,742,712 | |||||
| * | Non-income producing securities. |
ADR - American Depository Receipt
GDR - Global Depository Receipt
| SCHEDULE OF INVESTMENTS BY SECTOR | ||||
| as of September 30, 2008 | ||||
| Percent of | ||||
| Sector | Net Assets | |||
| Consumer, Non-cyclical | 29.1 | % | ||
| Financial | 21.3 | |||
| Utilities | 10.8 | |||
| Industrial | 8.2 | |||
| Energy | 7.5 | |||
| Communications | 6.9 | |||
| Basic Materials | 6.7 | |||
| Consumer, Cyclical | 5.4 | |||
| Technology | 1.9 | |||
| Short Term Investments | 1.3 | |||
| Total Investments | 99.1 | |||
| Other assets in excess of liabilities | 0.9 | |||
| Net Assets | 100.0 | % | ||
See Accompanying Notes to Financial Statements.
10
(This page intentionally left blank)
11
NICHOLAS-APPLEGATE INSTITUTIONAL FUNDS
FINANCIAL HIGHLIGHTS
For a Class R share outstanding during the period indicated
| Distributions from: | |||||||||||||||||||
| Net Asset | Net | Net Realized | Total from | Net | Net | ||||||||||||||
| Value, | Investment | and Unrealized | Investment | Investment | Realized | ||||||||||||||
| Beginning | Income (Loss) (2) | Gains (Loss) | Operations | Income | Capital Gains | ||||||||||||||
U.S. EQUITY FUNDS | |||||||||||||||||||
U.S. EMERGING GROWTH | |||||||||||||||||||
| For the period ended 09/30/08 (1) | $ | 11.20 | $ | (0.03 | ) | $ | (0.79 | ) | $ | (0.82 | ) | $ | — | $ | — | ||||
| For the year ended 03/31/08 | 12.84 | (0.10 | ) | (0.66) | (6) | (0.76 | ) | — | (0.88 | ) | |||||||||
| For the year ended 03/31/07 | 13.69 | (0.10 | ) | 0.18 | (7) | 0.08 | — | (0.93 | ) | ||||||||||
| For the year ended 03/31/06 | 9.65 | (0.14 | ) | 4.18 | 4.04 | — | — | ||||||||||||
| For the year ended 03/31/05 | 9.52 | (0.10 | ) | 0.23 | 0.13 | — | — | ||||||||||||
| For the year ended 03/31/04 | 6.27 | (0.11 | ) | 3.36 | 3.25 | — | — | ||||||||||||
U.S. SYSTEMATIC LARGE CAP GROWTH | |||||||||||||||||||
| For the period ended 09/30/08 (1) | $ | 18.99 | $ | 0.02 | $ | (1.83 | ) | $ | (1.81 | ) | $ | — | $ | — | |||||
| For the year ended 03/31/08 | 19.42 | (0.07 | ) | (0.36) | (6) | (0.43 | ) | — | — | ||||||||||
| For the year ended 03/31/07 | 17.59 | (0.02 | ) | 1.85 | 1.83 | — | — | ||||||||||||
| For the year ended 03/31/06 | 15.46 | (0.02 | ) | 2.15 | 2.13 | — | — | ||||||||||||
| For the year ended 03/31/05 | 14.90 | 0.02 | 0.54 | 0.56 | — | — | |||||||||||||
| For the year ended 03/31/04 | 12.61 | (0.06 | ) | 2.35 | 2.29 | — | — | ||||||||||||
GLOBAL EQUITY FUND | |||||||||||||||||||
INTERNATIONAL GROWTH | |||||||||||||||||||
| For the period ended 09/30/08 (1) | $ | 7.08 | $ | 0.07 | $ | (1.55 | ) | $ | (1.48 | ) | $ | — | $ | — | |||||
| For the year ended 03/31/08 | 21.78 | 0.10 | 3.85 | 3.95 | (1.06 | ) | (17.59 | ) | |||||||||||
| For the year ended 03/31/07 | 22.26 | (0.01 | ) | 2.79 | 2.78 | (0.06 | ) | (3.20 | ) | ||||||||||
| For the year ended 03/31/06 | 20.19 | 0.12 | 5.94 | 6.06 | — | (3.99 | ) | ||||||||||||
| For the year ended 03/31/05 | 18.93 | 0.15 | 1.53 | 1.68 | — | (0.42 | ) | ||||||||||||
| For the year ended 03/31/04 | 12.72 | 0.12 | 6.10 | 6.22 | (0.01 | ) | — | ||||||||||||
| Ratios to Average Net Assets (4) | |||||||||||||||||||||||||||||||
| Expenses | Expenses Net of | Fund’s | |||||||||||||||||||||||||||||
| Net Asset | Net Assets, | Net | Expense | Net of | Reimbursement/ | Portfolio | |||||||||||||||||||||||||
| Total | Value, | Total | Ending | Investment | Total | (Reimbursements)/ | Reimbursement/ | Recoupment | Turnover | ||||||||||||||||||||||
| Distributions | Ending | Return (3) | (in 000’s) | Income (Loss) | Expenses | Recoupment | Recoupment | Offset (5) | Rate | ||||||||||||||||||||||
U.S. EQUITY FUNDS | |||||||||||||||||||||||||||||||
U.S. EMERGING GROWTH | |||||||||||||||||||||||||||||||
| For the period ended 09/30/08 (1) | $ | — | $ | 10.38 | (7.32 | %) | $ | 2,620 | (0.49 | %) | 1.47 | % | — | 1.47 | % | 0.91 | % | 74 | % | ||||||||||||
| For the year ended 03/31/08 | (0.88 | ) | 11.20 | (7.15 | %) | 2,870 | (0.71 | %) | 1.46 | % | — | 1.46 | % | 0.96 | % | 129 | % | ||||||||||||||
| For the year ended 03/31/07 | (0.93 | ) | 12.84 | 1.02 | % | 3,177 | (0.78 | %) | 1.46 | % | — | 1.46 | % | 0.97 | % | 148 | % | ||||||||||||||
| For the year ended 03/31/06 | — | 13.69 | 41.98 | % | 3,173 | (1.27 | %) | 2.09 | % | (0.36 | %) | 1.73 | % | 1.42 | % | 128 | % | ||||||||||||||
| For the year ended 03/31/05 | — | 9.65 | 1.37 | % | 3,681 | (1.06 | %) | 1.89 | % | (0.20 | %) | 1.69 | % | 1.26 | % | 142 | % | ||||||||||||||
| For the year ended 03/31/04 | — | 9.52 | 51.83 | % | 3,948 | (1.28 | %) | 1.73 | % | — | 1.73 | % | 1.51 | % | 166 | % | |||||||||||||||
U.S. SYSTEMATIC LARGE CAP GROWTH | |||||||||||||||||||||||||||||||
| For the period ended 09/30/08 (1) | $ | — | $ | 17.18 | (9.53 | %) | $ | 5,084 | 0.17 | % | 1.45 | % | — | 1.45 | % | 1.42 | % | 58 | % | ||||||||||||
| For the year ended 03/31/08 | — | 18.99 | (2.21 | %) | 5,822 | (0.35 | %) | 1.39 | % | — | 1.39 | % | 1.36 | % | 106 | % | |||||||||||||||
| For the year ended 03/31/07 | — | 19.42 | 10.40 | % | 6,022 | (0.13 | %) | 1.38 | % | — | 1.38 | % | 1.30 | % | 100 | % | |||||||||||||||
| For the year ended 03/31/06 | — | 17.59 | 13.78 | % | 6,055 | (0.11 | %) | 1.86 | % | (0.48 | %) | 1.38 | % | 1.29 | % | 147 | % | ||||||||||||||
| For the year ended 03/31/05 | — | 15.46 | 3.76 | % | 9,318 | 0.14 | % | 1.94 | % | (0.57 | %) | 1.37 | % | 1.29 | % | 197 | % | ||||||||||||||
| For the year ended 03/31/04 | — | 14.90 | 18.16 | % | 10,229 | (0.41 | %) | 1.58 | % | (0.20 | %) | 1.38 | % | 1.18 | % | 172 | % | ||||||||||||||
GLOBAL EQUITY FUND | |||||||||||||||||||||||||||||||
INTERNATIONAL GROWTH | |||||||||||||||||||||||||||||||
| For the period ended 09/30/08 (1) | $ | — | $ | 5.60 | (20.90 | %) | $ | 2,050 | 1.93 | % | 1.66 | % | — | 1.66 | % | 1.33 | % | 21 | % | ||||||||||||
| For the year ended 03/31/08 | (18.65 | ) | 7.08 | 11.05 | % | 2,595 | 0.74 | % | 1.64 | % | — | 1.64 | % | 1.24 | % | 113 | % | ||||||||||||||
| For the year ended 03/31/07 | (3.26 | ) | 21.78 | 13.36 | % | 2,294 | (0.05 | %) | 1.67 | % | — | 1.67 | % | 1.41 | % | 119 | % | ||||||||||||||
| For the year ended 03/31/06 | (3.99 | ) | 22.26 | 33.34 | % | 1,776 | 0.57 | % | 1.62 | % | (0.00 | %) | 1.62 | % | 1.24 | % | 167 | % | |||||||||||||
| For the year ended 03/31/05 | (0.42 | ) | 20.19 | 8.94 | % | 1,749 | 0.80 | % | 1.66 | % | (0.02 | %) | 1.64 | % | 1.32 | % | 203 | % | |||||||||||||
| For the year ended 03/31/04 | (0.01 | ) | 18.93 | 48.86 | % | 9,236 | 0.71 | % | 1.74 | % | (0.04 | %) | 1.70 | % | 1.44 | % | 186 | % | |||||||||||||
(1) | Unaudited. |
(2) | Net investment income per share is calculated by dividing net investment income for the period by the average shares outstanding during the period. |
(3) | Total returns are not annualized for periods less than one year. |
(4) | Ratios are annualized for periods of less than one year. Expense reimbursements reflect voluntary reductions to total expenses. Such amounts would increase net investment income (loss) ratios had such reductions not occurred. |
(5) | Net expenses include certain items not subject to expense reimbursement for periods prior to January 23, 2006. |
(6) | Includes litigation proceeds of approximately $0.07 per share for the U.S. Emerging Growth Fund and $0.09 per share for the U.S. Systematic Large Cap Growth Fund. |
(7) | The fund received $12,373 from a security litigation settlement during the year which is reflected in realized gains. This event had a $0.05 per share impact to the fund. |
See Accompanying Notes to Financial Statements.
12 & 13
NICHOLAS-APPLEGATE INSTITUTIONAL FUNDS
STATEMENTS OF ASSETS AND LIABILITIES
| U.S. Systematic | ||||||||||
| U.S. Emerging | Large Cap | International | ||||||||
| September 30, 2008 | Growth | Growth | Growth | |||||||
| Assets | ||||||||||
| Investments, at value*, (a) | $ | 10,872,593 | $ | 9,281,921 | $ | 17,578,531 | ||||
| Foreign currencies, at value** | — | — | 8,777 | |||||||
| Cash | — | — | 658 | |||||||
| Deposits with brokers for securities sold short | — | — | — | |||||||
| Receivables: | ||||||||||
| Investment securities sold | 251,291 | 150,354 | 547,920 | |||||||
| Capital shares sold | 100 | 20,770 | 31,898 | |||||||
| Dividends | 2,646 | 14,333 | 55,398 | |||||||
| Foreign taxes receivable | — | 103 | 35,087 | |||||||
| Interest | — | — | — | |||||||
| Other | 1,924 | — | 829 | |||||||
| Total Assets | 11,128,554 | 9,467,481 | 18,259,098 | |||||||
| Liabilities | ||||||||||
| Payables: | ||||||||||
| Bank overdraft | $ | 1,947 | $ | — | $ | — | ||||
| Investments purchased | 206,193 | 113,348 | 408,065 | |||||||
| Capital shares redeemed | 110,171 | 52,697 | 83,983 | |||||||
| Collateral on securities loaned | — | — | — | |||||||
| Securities sold short | — | — | — | |||||||
| Financing fee | — | — | — | |||||||
| To investment advisor | 7,833 | 3,942 | 8,418 | |||||||
| Dividends payable for short sales | — | — | — | |||||||
| Other Liabilities | 7,381 | 11,349 | 15,920 | |||||||
| Total Liabilities | 333,525 | 181,336 | 516,386 | |||||||
| NET ASSETS | 10,795,029 | 9,286,145 | 17,742,712 | |||||||
| * Investments, at cost | 11,431,122 | 9,728,316 | 19,831,680 | |||||||
| ** Foreign currencies, at cost | — | — | 10,178 | |||||||
| Proceeds for securities sold short | — | — | — | |||||||
| Net Assets Consist Of: | ||||||||||
| Paid-in capital | $ | 17,250,972 | $ | 16,074,088 | $ | 29,489,105 | ||||
| Undistributed net investment income (loss) | (24,338 | ) | 25,143 | 731,358 | ||||||
| Accumulated net realized gain/(loss) on investments and foreign currencies and short sales | (5,873,076 | ) | (6,366,691 | ) | (10,225,465 | ) | ||||
| Net unrealized (depreciation) of investment and other assets and liabilities denominated in foreign currencies and short sales | (558,529 | ) | (446,395 | ) | (2,252,286 | ) | ||||
| Net Assets applicable to all shares outstanding | $ | 10,795,029 | $ | 9,286,145 | $ | 17,742,712 | ||||
| Net Assets of Class I shares | $ | 8,174,597 | $ | 693,522 | $ | 7,535,283 | ||||
| Net Assets of Class II shares | — | 3,508,308 | 8,157,126 | |||||||
| Net Assets of Class III shares | — | — | — | |||||||
| Net Assets of Class IV shares | — | — | — | |||||||
| Net Assets of Class R shares | 2,620,432 | 5,084,315 | 2,050,303 | |||||||
| Class I Shares outstanding | 769,651 | 39,498 | 1,126,448 | |||||||
| Class II Shares outstanding | — | 200,581 | 1,334,528 | |||||||
| Class III Shares outstanding | — | — | — | |||||||
| Class IV Shares outstanding | — | — | — | |||||||
| Class R Shares outstanding | 252,536 | 295,902 | 366,447 | |||||||
| Net Asset Value — Class I Share | $ | 10.62 | $ | 17.56 | $ | 6.69 | ||||
| Net Asset Value — Class II Share | $ | — | $ | 17.49 | $ | 6.11 | ||||
| Net Asset Value — Class III Share | $ | — | $ | — | $ | — | ||||
| Net Asset Value — Class IV Share | $ | — | $ | — | $ | — | ||||
| Net Asset Value — Class R Share | $ | 10.38 | $ | 17.18 | $ | 5.60 | ||||
| (a) Including securities on loan with values of: | $ | — | $ | — | $ | — | ||||
See Accompanying Notes to Financial Statements.
14
NICHOLAS-APPLEGATE INSTITUTIONAL FUNDS
STATEMENTS OF OPERATIONS
| U.S. Systematic | ||||||||||
| Period Ended | U.S. Emerging | Large Cap | International | |||||||
| September 30, 2008 (Unaudited) | Growth | Growth | Growth | |||||||
| Investment Income | ||||||||||
| Dividends, net of foreign taxes* | $ | 23,448 | $ | 102,204 | $ | 374,809 | ||||
| Interest | — | — | 79 | |||||||
| Total Income | 23,448 | 102,204 | 374,888 | |||||||
| Expenses | ||||||||||
| Advisory fee | 42,658 | 29,174 | 57,381 | |||||||
| Administration fees | 23,319 | 36,791 | 76,688 | |||||||
| Shareholder servicing fees | 3,856 | 7,387 | 3,285 | |||||||
| Financing fees | — | — | — | |||||||
| Professional fees | 363 | 595 | 754 | |||||||
| Trustees’ fees and expenses | 1,420 | 2,457 | 3,447 | |||||||
| Interest and credit facility fee | 103 | 1,770 | 21 | |||||||
| Dividend expense on securities sold short | — | — | — | |||||||
| Miscellaneous | 1,322 | 1,371 | 1,624 | |||||||
| Total Expenses | 73,041 | 79,545 | 143,200 | |||||||
| Expense offset | (25,255 | ) | (2,484 | ) | (39,114 | ) | ||||
| Net Expenses | 47,786 | 77,061 | 104,086 | |||||||
| Net Investment Income (Loss) | (24,338 | ) | 25,143 | 270,802 | ||||||
| Net Realized and Unrealized | ||||||||||
| Gain (Loss) on Investments | ||||||||||
| Realized gain from: | ||||||||||
| Securities | (903,928 | ) | 415,224 | (1,101,257 | ) | |||||
| Securities sold short | — | — | — | |||||||
| Foreign currency transactions | — | — | (2,813 | ) | ||||||
| Net realized loss | (903,928 | ) | 415,224 | (1,104,070 | ) | |||||
Change in unrealized appreciation (depreciation) of: | ||||||||||
| Investments | (88,718 | ) | (926,520 | ) | (3,955,009 | ) | ||||
| Securities sold short | — | — | — | |||||||
| Other assets and liabilities denominated in foreign currencies | — | — | (6,641 | ) | ||||||
| Net unrealized appreciation (depreciation) | (88,718 | ) | (926,520 | ) | (3,961,650 | ) | ||||
| Net (Loss) on Investments | (992,646 | ) | (511,296 | ) | (5,065,720 | ) | ||||
| Assets Resulting From Operations | $ | (1,016,984 | ) | $ | (486,153 | ) | $ | (4,794,918 | ) | |
| * Foreign taxes withheld | $ | — | $ | 77 | $ | 41,841 | ||||
See Accompanying Notes to Financial Statements.
15
NICHOLAS-APPLEGATE INSTITUTIONAL FUNDS
STATEMENTS OF CHANGES IN NET ASSETS
| U.S. Systematic | |||||||||||||
| U.S. Emerging Growth | Large Cap Growth | ||||||||||||
| September 30, | September 30, | ||||||||||||
| Periods Ended September 30, 2008 | 2008 | March 31, | 2008 | March 31, | |||||||||
| and March 31, 2008 | (Unaudited) | 2008 | (Unaudited) | 2008 | |||||||||
| Increase (Decrease) In Net Assets | |||||||||||||
| From Investment Operations: | |||||||||||||
| Net investment income (loss) | $ | (24,338 | ) | $ | (63,162 | ) | $ | 25,143 | $ | (17,588 | ) | ||
| Net realized gain (loss) | (903,928 | ) | 1,109,622 | 415,224 | 1,142,381 | ||||||||
| Net unrealized appreciation (depreciation) | (88,718 | ) | (1,932,344 | ) | (926,520 | ) | (1,503,590 | ) | |||||
| Investment operations | (1,016,984 | ) | (885,884 | ) | (486,153 | ) | (378,797 | ) | |||||
| Distributions to Shareholders: | |||||||||||||
| From net investment income | |||||||||||||
| Class I | — | — | — | — | |||||||||
| Class II | — | — | — | (16,091 | ) | ||||||||
| Class IV | — | — | — | — | |||||||||
| Class R | — | — | — | — | |||||||||
| From net realized gains | |||||||||||||
| Class I | — | (527,551 | ) | — | — | ||||||||
| Class II | — | — | — | — | |||||||||
| Class IV | — | — | — | — | |||||||||
| Class R | — | (217,858 | ) | — | — | ||||||||
| Total distributions | — | (745,409 | ) | — | (16,091 | ) | |||||||
| From Capital Share Transactions: | |||||||||||||
| Proceeds from shares sold | |||||||||||||
| Class I | 2,522,120 | 2,539,292 | 27,670 | 106,984 | |||||||||
| Class II | — | — | — | 2,468,812 | |||||||||
| Class IV | — | — | — | — | |||||||||
| Class R | 396,676 | 1,124,520 | 187,095 | 486,815 | |||||||||
| Distributions reinvested | |||||||||||||
| Class I | — | 526,107 | — | 16,091 | |||||||||
| Class II | — | — | — | — | |||||||||
| Class IV | — | — | — | — | |||||||||
| Class R | — | 217,859 | — | — | |||||||||
| Cost of shares redeemed | |||||||||||||
| Class I | (1,056,312 | ) | (1,777,085 | ) | (55,896 | ) | (262,579 | ) | |||||
| Class II | — | — | (7,210,210 | ) | (1,650,704 | ) | |||||||
| Class IV | — | — | (382,762 | ) | (571,886 | ) | |||||||
| Class R | (419,737 | ) | (1,216,005 | ) | — | — | |||||||
| Net increase (decrease) in net assets from share transactions | 1,442,747 | 1,414,688 | (7,434,103 | ) | 593,733 | ||||||||
| Net Increase (Decrease) in Net Assets | 425,763 | (216,605 | ) | (7,920,256 | ) | 198,845 | |||||||
| Net Assets | |||||||||||||
| Beginning | 10,369,266 | 10,585,871 | 17,206,401 | 17,007,556 | |||||||||
| Ending | $ | 10,795,029 | $ | 10,369,266 | $ | 9,286,145 | $ | 17,206,401 | |||||
| Undistributed net investment income, ending | $ | 24,338 | $ | — | $ | 25,143 | $ | — | |||||
| Class I — Capital Share Activity | |||||||||||||
| Shares sold | 205,087 | 182,466 | 1,531 | 5,151 | |||||||||
| Distributions reinvested | — | 37,552 | — | — | |||||||||
| Shares redeemed | (90,141 | ) | (131,451 | ) | (2,815 | ) | 12,161 | ||||||
| Net Class I Share Activity | 114,946 | 88,567 | (1,284 | ) | (7,010 | ) | |||||||
| Class II — Capital Share Activity | |||||||||||||
| Shares sold | — | — | — | 113,463 | |||||||||
| Distributions reinvested | — | — | — | 704 | |||||||||
| Shares redeemed | — | — | (348,642 | ) | (75,329 | ) | |||||||
| Net Class II Share Activity | — | — | (348,642 | ) | 38,838 | ||||||||
| Class IV — Capital Share Activity | |||||||||||||
| Shares sold | — | — | — | — | |||||||||
| Distributions reinvested | — | — | — | — | |||||||||
| Shares redeemed | — | — | — | — | |||||||||
| Net Class IV Share Activity | — | — | — | — | |||||||||
| Class R — Capital Share Activity | |||||||||||||
| Shares sold | 33,659 | 79,606 | 9,510 | 23,608 | |||||||||
| Distributions reinvested | — | 15,891 | — | — | |||||||||
| Shares redeemed | (37,449 | ) | (86,526 | ) | (20,108 | ) | (27,157 | ) | |||||
| Net Class R Share Activity | (3,790 | ) | 8,971 | (10,598 | ) | (3,549 | ) | ||||||
See Accompanying Notes to Financial Statements.
16
NICHOLAS-APPLEGATE INSTITUTIONAL FUNDS
STATEMENTS OF CHANGES IN NET ASSETS
| International Growth | |||||||
| September 30, | |||||||
| Periods Ended September 30, 2008 | 2008 | March 31, | |||||
| and March 31, 2008 | (Unaudited) | 2008 | |||||
| Increase (Decrease) In Net Assets | |||||||
| From Investment Operations: | |||||||
| Net investment income | $ | 270,802 | $ | 515,715 | |||
| Net realized gain (loss) | (1,104,070 | ) | 22,032,681 | ||||
| Net unrealized (depreciation) | (3,961,650 | ) | (10,216,944 | ) | |||
| Investment operations | (4,794,918 | ) | 12,331,452 | ||||
| Distributions to Shareholders: | |||||||
| From net investment income | |||||||
| Class I | — | (102,579 | ) | ||||
| Class II | — | (264,648 | ) | ||||
| Class III | — | — | |||||
| Class IV | — | — | |||||
| Class R | — | (122,626 | ) | ||||
| From net realized gains | |||||||
| Class I | — | (6,119,767 | ) | ||||
| Class II | — | (7,384,655 | ) | ||||
| Class III | — | — | |||||
| Class IV | — | — | |||||
| Class R | — | (2,036,861 | ) | ||||
| Total distributions | — | (16,031,136 | ) | ||||
| From Capital Share Transactions: | |||||||
| Proceeds from shares sold | |||||||
| Class I | 1,171,131 | 4,506,739 | |||||
| Class II | — | 12,456,347 | |||||
| Class III | — | — | |||||
| Class IV | — | — | |||||
| Class R | 386,485 | 952,934 | |||||
| Distributions reinvested | |||||||
| Class I | — | 6,217,911 | |||||
| Class II | — | 7,649,303 | |||||
| Class III | — | — | |||||
| Class IV | — | — | |||||
| Class R | — | 2,159,486 | |||||
| Cost of shares redeemed | |||||||
| Class I | (1,148,582 | ) | (11,550,042 | ) | |||
| Class II | (1,123,348 | ) | (63,923,305 | ) | |||
| Class III | — | — | |||||
| Class IV | — | — | |||||
| Class R | (357,506 | ) | (873,729 | ) | |||
| Net increase (decrease) in net assets from share transactions | (1,071,820 | ) | (42,404,356 | ) | |||
| Net Increase (Decrease) in Net Assets | (5,866,738 | ) | 46,104,040 | ||||
| Net Assets | |||||||
| Beginning | 23,609,450 | 69,713,490 | |||||
| Ending | $ | 17,742,712 | $ | 23,609,450 | |||
| Undistributed net investment income, ending | $ | 731,357 | $ | 460,556 | |||
| Class I — Capital Share Activity | |||||||
| Shares sold | 147,307 | 318,579 | |||||
| Distributions reinvested | — | 675,126 | |||||
| Shares redeemed | (143,605 | ) | (542,226 | ) | |||
| Net Class I Share Activity | 3,702 | 451,479 | |||||
| Class II — Capital Share Activity | |||||||
| Shares sold | — | 615,162 | |||||
| Distributions reinvested | — | 911,717 | |||||
| Shares redeemed | (158,822 | ) | (2,377,559 | ) | |||
| Net Class II Share Activity | (158,822 | ) | (850,680 | ) | |||
| Class III — Capital Share Activity | |||||||
| Shares sold | — | — | |||||
| Distributions reinvested | — | — | |||||
| Shares redeemed | — | — | |||||
| Net Class III Share Activity | — | — | |||||
| Class IV — Capital Share Activity | |||||||
| Shares sold | — | — | |||||
| Distributions reinvested | — | — | |||||
| Shares redeemed | — | — | |||||
| Net Class IV Share Activity | — | — | |||||
| Class R — Capital Share Activity | |||||||
| Shares sold | 55,128 | 48,877 | |||||
| Distributions reinvested | — | 279,726 | |||||
| Shares redeemed | (55,043 | ) | (67,553 | ) | |||
| Net Class R Share Activity | 85 | 261,050 | |||||
See Accompanying Notes to Financial Statements.
17
NICHOLAS-APPLEGATE INSTITUTIONAL FUNDS
NOTES TO FINANCIAL STATEMENTS — (Unaudited)
NOTE A — ORGANIZATION
Nicholas-Applegate Institutional Funds (the “Trust”) is an open-end investment management company. The Trust was established as a Delaware business trust on December 17, 1992 and consists of fourteen separate portfolios (collectively the “Funds” and each a “Fund”). Each Fund’s investment objectives, strategies and risks are discussed in the Funds’ current prospectuses. All of the Funds have issued Class I shares (“Class I”), eight Funds have issued Class II shares (“Class II”), two Funds have issued Class III shares (“Class III”), one Fund has issued Class IV shares (“Class IV”) and three Funds have issued Retirement shares (“Class R”). No shares have a sales charge. Class R has a distribution fee. The Funds offering Class R are covered in this report.
NOTE B — SIGNIFICANT ACCOUNTING POLICIES
Significant accounting policies consistently followed by the Funds in preparing these financial statements are described below. The policies conform with accounting principles generally accepted in the United States.
Security Valuations
Equity securities, including ADRs, SDR’s and GDRs, that are traded on a stock exchange or on the NASDAQ National Market System are valued at the last sale price as of the close of business on the New York Stock Exchange (normally 4:00 p.m. New York time) on the day the securities are being valued, or lacking any sales, at the mean between the closing bid and asked prices. Securities listed or traded on certain non-U.S. exchanges whose operations are similar to the United States over-the-counter market are valued at the price within the limits of the latest available current bid and asked prices deemed by the Adviser to best reflect fair value. A security that is listed or traded on more than one exchange is valued at the quotation on the exchange determined to be the primary market for such security by the Adviser. The Adviser has determined the Xetra is the primary market in Germany. Equity Linked Notes (“ELN’s”) are valued by using the closing local price for the underlying security and are translated into U.S. dollars at the exchange rate struck at the close of the London Stock Exchange.
The Funds value long-term debt obligations, including high quality and high yield corporate securities, municipal securities, asset-backed securities, collateralized mortgage obligations and US Government and Agency issues, at the quoted bid price provided by an approved bond pricing service. Convertible securities are normally priced at the mean between the bid and ask prices. Short-term debt instruments, (e.g., commercial paper, bankers acceptances, U.S. Treasury Bills, etc.) having a maturity of less than 60 days will be valued at amortized cost. If a fixed income security has a maturity of greater than 60 days, it will be valued at market price.
Securities or other assets for which reliable market quotations are not readily available or for which the pricing agent or principal market maker does not provide a valuation or methodology or provides a valuation or methodology that, in the judgment of the Adviser does not represent fair value (Fair Value Securities), are valued by the Pricing Committee overseen by the Board of Trustees in consultation as applicable, with the Adviser’s portfolio managers, traders, and research and credit analysts and legal and compliance personnel. Fair Value Securities may include, but are not limited to, the following: certain private placements and restricted securities that do not have an active trading market; securities whose trading has been suspended or for which there is no current market; securities whose prices are stale; securities denominated in currencies that are restricted, untraded, or for which exchange rates are disrupted; securities affected by significant events; and securities that the Adviser or Pricing Committee believe were priced incorrectly. A “significant event” (which includes, but is not limited to, an extraordinarily political or market event) is an event that the Adviser or Pricing Committee believes with a reasonably high degree of certainty has caused the closing market prices of a Fund’s portfolio securities to no longer reflect their value at the time of the Fund’s NAV calculation.
Security Transactions and Investment Income
Security transactions are accounted for as of trade date. Realized gains and losses from security transactions are determined on an identified-cost basis.
Dividend income is recorded on the ex-dividend date or, for certain non-U.S. securities, when the information becomes available to the Funds. Interest income is recorded on an accrual basis. Discounts and premiums on debt securities are accreted and amortized on the yield to maturity basis.
Non-U.S. Currency Transactions
At each net asset valuation date, the value of assets and liabilities denominated in non-U.S. currencies are translated into U.S. dollars using the current exchange rate at the spot rate at 11:00 a.m. Eastern Time against the U.S. dollar, as provided by an approved pricing service. Security transactions, income and expenses are converted at the prevailing exchange rate on the day of the event. The effect of changes in exchange rates on securities denominated in a non-U.S. currency is included with the net realized and unrealized gain or loss of the associated security. Other Non-U.S. currency gains or losses are reported separately.
Certain Funds may use forward non-U.S. currency contracts to reduce their exposure to currency fluctuations of their non-U.S. securities. These contracts are commitments to purchase or sell a non-U.S. currency at a specified rate on a future date. When the contract is fulfilled or closed, gains or losses are realized. Until then, the gain or loss is included in unrealized appreciation or depreciation of investments. The contract commitment is fully collateralized by cash or securities of the Fund. Non-U.S. denominated assets and forward currency contracts may involve more risks than U.S. transactions, including currency risk, political and economic risk, regulatory and market risk. Evaluating and monitoring such risk exposure is a part of the Funds’ management strategy. There were no such forward non-U.S. currency contracts at September 30, 2008.
18
Futures Contracts
Each Fund may enter into futures contracts involving non-U.S. currency, interest rates, securities, and securities indices, for hedging purposes only. A futures contract obligates the seller of the contract to deliver and the purchaser of the contract to take delivery of the type of non-U.S. currency, financial instrument or security called for in the contract at a specified future time for a specified price. Upon entering into such a contract, a Fund is required to deposit and maintain as collateral such initial margin as required by the exchange on which the contract is traded. Pursuant to the contract, a Fund agrees to receive from or pay to the broker an amount equal to the daily fluctuations in the value of the contract. Such receipts or payments are known as variation margin and are recorded as unrealized gains or losses by the Fund. When the contract is closed, the Fund records a realized gain or loss equal to the difference between the value of the contract at the time it was opened and the value at the time it was closed. There were no such futures contracts at September 30, 2008.
Options Contracts
The Funds may: (a) buy call options on non-U.S. currency in anticipation of an increase in the value of the underlying asset; (b) buy put options on non-U.S. currency, portfolio securities, and futures in anticipation of a decrease in the value of the underlying asset; and (c) write call options on portfolio securities and futures to generate income from premiums, and in anticipation of a decrease or only limited increase in the value of the underlying asset. If a call written by a Fund is exercised, the Fund foregoes any possible profit from an increase in the market price of the underlying asset over the exercise price plus the premium received. When a Fund writes options on futures contracts, it will be subject to margin requirements similar to those applied to futures contracts. There were no such options at September 30, 2008.
Equity-Linked Securities
Certain Funds may purchase equity-linked securities, also known as participation notes, equity swaps, and zero strike calls and warrants. Equity-linked securities are primarily used by a Fund as an alternative means to more efficiently and effectively access the securities market of what is generally an emerging securities market. The Fund deposits an amount of cash with its custodian (or broker, if legally permitted) in an amount near or equal to the selling price of the underlying security in exchange for an equity linked security. Upon sale, the Fund receives cash from the broker or custodian equal to the value of the underlying security. Aside from market risk of the underlying securities, there is a risk of default by the counterparty to the transaction. In the event of insolvency of the counterparty, the Fund might be unable to obtain its expected benefit. In addition, while a Fund will seek to enter into such transactions only with parties which are capable of entering into closing transactions with the Fund, there can be no assurance that the Fund will be able to close out such a transaction with the counterparty or obtain an offsetting position with any counterparty, at any time prior to the end of the term of the underlying agreement. This may impair the Fund’s ability to enter into other transactions at a time when doing so might be advantageous.
Securities Lending
In order to generate expense offset credits, each of the Funds may lend portfolio securities, on a short-term or a long-term basis, up to 30% of a Fund’s total assets. The loans are secured by collateral in the forms of cash, cash equivalents, U.S. government and agency securities equal to at least 102% of the market value of the securities loaned on U.S. securities and 105% of the market value loaned on non-U.S. securities. During the term of the loan, the Funds will continue to receive any interest, dividends or amounts equivalent thereto, on the loaned securities while receiving a fee from the borrower and/or earning interest on the investment of the cash collateral. Upon termination of the loan, the borrower will return to the lender securities identical to the loaned securities and may share the interest earned on the collateral with the borrower.
The Funds bear the risk of delay in recovery of, or even loss of rights in, the securities loaned should the borrower of the securities fail financially. The Funds also bear the risk of loss in the event the securities purchased with cash collateral depreciate in value. Loans are subject to termination at the option of the borrower or the Fund. There were no securities on loan at September 30, 2008.
Credit Facility
The Trust has a $15 million credit facility available to fund temporary or emergency borrowing expiring in March 2009. Each Fund pays its pro-rata share of an annual commitment fee plus interest on its specific borrowings. For the period ended September 30, 2008, the Funds did not borrow against the line of credit.
Commitments and Contingencies
In the normal course of business, the Funds may enter into contracts and agreements that contain a variety of representations and warranties which provide general indemnifications. The maximum exposure to the Funds under these arrangements is unknown, as this would involve future claims that may be made against the Funds that have not yet occurred. However, based on experience, the Funds expect the risks of loss to be remote.
Fund Expenses and Multi-Class Allocations
Each Fund bears expenses incurred specifically on its behalf plus an allocation of its share of Trust level expenses. Each share offered by a Fund has equal rights to assets but incurs certain Class specific expenses. The Funds allocate income, gains and losses, both realized and unrealized, and expenses, except for Class specific expenses, based on the relative net assets of each share class.
During the period ended September 30, 2008, many of the brokers with whom the Adviser places trades on behalf of the Funds provided services to the Funds in addition to trade execution. These services included payments of certain expenses on behalf of the Fund. In addition, through arrangements with the Funds custodian, credits realized as a result of uninvested cash balances were used to reduce the Funds expenses. During the period ended September 30, 2008, the credits used to reduce the Funds expenses were:
19
NICHOLAS-APPLEGATE INSTITUTIONAL FUNDS
NOTES TO FINANCIAL STATEMENTS — (Unaudited) — Continued
Credit | Direct | Security | ||||||||
Interest | Brokerage | Lending | ||||||||
Fund | Offset | Offset | Offset | |||||||
| U.S. Emerging Growth | 2,611 | 5,399 | 17,244 | |||||||
| U.S. Systematic Large Cap Growth | 2,182 | 269 | 33 | |||||||
| International Growth | 8,468 | 520 | 30,120 | |||||||
Use of Estimates
The preparation of financial statements in conformity with accounting principles generally accepted in the United States requires management to make estimates and assumptions that affect the amounts reported in the financial statements and accompanying notes. Actual results could differ from these estimates.
NOTE C — FEDERAL INCOME TAXES
The Funds intend to comply with the requirements of the Internal Revenue Code applicable to regulated investment companies and to distribute substantially all of their taxable income to shareholders. Accordingly, no provision for federal income taxes is required. A Fund investing in foreign securities records any foreign taxes on income and gains on such investments in accordance with the applicable tax rules. The Funds’ tax accounting treatment of loss deferrals, accretion, passive foreign investment companies and expiration of capital loss carryforwards are different from the financial statement recognition of income and gains.
Capital loss carryforwards may be used to offset current or future capital gains until expiration.
Distributions to Shareholders
The Funds record distributions to shareholders on the ex-dividend date. Distributions are determined in accordance with income tax regulations that may differ from generally accepted accounting principles. Accordingly, the Funds’ capital accounts are periodically reclassified to reflect income and gains available for distribution under income tax regulations. The Funds make income and capital gain distributions at least annually. Funds with income objectives make distributions either quarterly or monthly in accordance with the prospectuses.
NOTE D — TRANSACTIONS WITH AFFILIATES
Investment Advisory Fee
The Adviser receives a monthly fee at an annual rate based on the average daily net assets of the Funds. The investment Advisory Fee rates for each of the Funds are listed in the table below.
Administrative & Shareholder Services Fee
On January 24, 2006, the Funds entered into a new Administration Agreement whereby the Funds pay for the administrative services they require under what is essentially an all-in fee structure. Class R shareholders of the Funds pay an administrative fee to the Adviser computed as a percentage of the Funds’ assets attributable in the aggregate to Class R shares, the Adviser, in turn, provides or procures administrative and shareholder services for Class R shareholders and also bears the costs of most third-party administrative services required by the Funds, including audit, custodial, portfolio accounting, legal, transfer agency and printing costs. The administrative fees paid to the Adviser may exceed the related costs. Generally, this may not be the case for relatively small funds.
The investment advisory and administrative services fees are charged at the following annual rates:
Advisory Fee | Administration Fee* | ||||||
Fund | Class R | ||||||
| U.S. Emerging Growth | 0.75% | 0.41% | |||||
| U.S. Systematic Large Cap Growth | 0.45% | 0.64% | |||||
| International Growth | 0.50% | 0.86% | |||||
| * | Excludes trustees’ fees and expenses, tax, brokerage and interest expenses, and extraordinary expenses. |
Securities Lending Fees
The U.S. Systematic Large Cap Growth Fund participates in an agency securities lending program with an affiliated agent, Dresdner Bank AG a direct subsidiary to Allianz AG and affiliate to the Trust (“Dresdner Program”). Income generated from the investment of cash collateral, less negotiated rebate fees paid to borrowers and transaction costs, is divided pursuant to the Dresdner Program Agency Agreement between the Funds and Dresdner Bank AG. The amount paid to Dresdner Bank AG for the period ended September 30, 2008 was $38,626. Cash collateral received for securities on loan is invested in securities identified in the Schedules of Investments and the corresponding liability is recognized as such in the Statements of Assets and Liabilities
Trustee Compensation
Certain officers of the Trust are also officers of the Investment Adviser and the Distributor. The Trustees who were not affiliated with the Investment Adviser received annual compensation of approximately $36,000 each from the Trust, except for the chairman of the Board of Trustees of the Trust and the chairman of the Audit Committee, who will receive annual compensation of approximately $42,000 and $41,000, respectively, from the Trust.
20
NOTE E — INVESTMENT TRANSACTIONS
The following table presents purchases and sales of securities, excluding short-term investments, during the period ended September 30, 2008 to indicate the volume of transactions in each Fund. The tax cost of securities held at September 30, 2008, and the related gross and net unrealized appreciation and depreciation, provide aggregate information on a tax basis against which future gains and losses on these investments are measured for distribution purposes.
Net | |||||||||||||||||||
Gross | Gross | Unrealized | |||||||||||||||||
Unrealized | Unrealized | Appreciation | |||||||||||||||||
Purchases | Sales | Tax Cost | Appreciation | Depreciation | (Depreciation) | ||||||||||||||
Fund | (in 000’s) | (in 000’s) | (in 000’s) | (in 000’s) | (in 000’s) | (in 000’s) | |||||||||||||
| U.S. Emerging Growth | $ | 9,861 | $ | 8,090 | $ | 11,431 | $ | 674 | $ | (1,232 | ) | $ | (558 | ) | |||||
U.S. Systematic Large Cap Growth | 7,357 | 14,478 | 9,728 | 705 | (1,151 | ) | (446 | ) | |||||||||||
| International Growth | 4,621 | 5,426 | 20,079 | 1,313 | (3,565 | ) | (2,252 | ) | |||||||||||
Gains and losses resulting from the subscriptions-in-kind and redemptions-in-kind are included in the realized gain/loss from securities and non-U.S. currency transactions. During the period, ended September 30, 2008, the Funds did not have any subscriptions-in-kind. The U.S. Systematic Large Cap Growth Fund did have a redemption-in-kind valued at $3,600,000.
NOTE F — FINANCIAL INSTRUMENTS
The Funds may be party to financial instruments with off-balance sheet risks, including forward non-U.S. currency contracts, primarily in an attempt to minimize the risk to the Fund, in respect of its portfolio transactions. These instruments involve market and/or credit risk in excess of the amount recognized in the Statement of Assets and Liabilities. Risks arise from the possible inability of counterparties to meet the terms of their contracts and from unexpected movement in currencies, securities values and interest rates. The contract amounts indicate the extent of the Funds’ involvement in such contracts. For the period ended September 30, 2008 the Funds were not party to any such agreements.
NOTE G — FAIR VALUE OF FINANCIAL INSTRUMENTS
Effective April 1, 2008, the funds adopted FAS 157 — Fair Value Measurements (“FAS 157” or “the Statement”). FAS 157 defines fair value, establishes a framework for measuring fair value in generally accepted accounting principles (“GAAP”), and expands disclosures about fair value measurement. The Statement establishes a fair value hierarchy that distinguishes between (1) market participant assumptions developed based on market data obtained from sources independent of the funds (observable inputs) and (2) the funds own assumptions about market participant assumptions developed based on the best information available in the circumstances (unobservable inputs). The three levels defined by the FAS 157 hierarchy are as follows:
Level I — quoted prices in active markets for identical securities.
Level II — significant observable inputs (including quoted prices for similar securities, interest rates prepayment speeds, credit risk, etc.).
Level III — significant unobservable inputs (including the Fund’s own assumptions in determining the fair value of investments.
In some instances, the inputs used to measure fair value might fall in different levels of the fair value hierarchy. The level in the fair value hierarchy within which the fair value measurement in its entirety falls shall be determined based on the lowest input level that is significant to the fair value measurement in its entirety.
The following table summarizes the valuation of each fund’s securities using the fair value hierarchy:
At September 30, 2008 | Total | Level I | Level II | Level III | |||||||||
U.S. Emerging Markets Investments | 10,872,593 | 10,872,593 | — | — | |||||||||
U.S. Systematic Large Cap Growth Investments | 9,281,921 | 9,161,765 | 120,156 | — | |||||||||
International Growth Investments | 17,578,531 | 17,578,531 | — | — | |||||||||
21
NICHOLAS-APPLEGATE INSTITUTIONAL FUNDS
NOTES TO FINANCIAL STATEMENTS — (Unaudited) — Continued
SFAS 157 also requires a reconciliation of assets and liabilities for which significant unobservable inputs (Level 3) were used in determining fair value. During the period April 1, 2008 through September 30, 2008, no Funds held investments in which significant unobservable inputs (Level 3) were used in determining value.
NOTE H — SUBSEQUENT EVENTS
Recent events in the financial sector have resulted in an unusually high degree of volatility in the financial markets and the net asset value of many mutual funds, including the Nicholas Applegate Institutional Funds. Such events occurring subsequent to the date of this report have included, but not limited to, the seizure of the Federal National Mortgage Association and the Federal Home Loan Mortgage Corporation by U.S. banking regulators, the bankruptcy filing of Lehman Brothers and the sale of Merrill Lynch to Bank of America, and the government bailout of AIG. These companies represent financial institutions with which certain of the Funds conduct business and/or whose securities are or may be held with in the Funds. The potential investment of each Fund’s investments in these issuers, and the financial sector in general, as reflected in each Fund’s schedule of investments, exposes investors to the negative (or positive) performance resulting from these and other events. U.S. Government Agency securities and collateral received by the Funds under various agreements may include bonds by the Federal National Mortgage Association and the Federal Home Loan Mortgage Corporation.
NOTE I — NEW ACCOUNTING PRONOUNCEMENTS
The Financial Accounting Standards Board (“FASB”) has recently issued Interpretation No.48, Accounting for Uncertainty in Income Taxes — an Interpretation of FASB Statement No.109 (“FIN 48”), which applies to all registered investment companies and clarifies the accounting for uncertain tax positions. FIN 48 requires the evaluation of tax positions taken, or expected to be taken, in the course of preparing the Fund’s tax returns to determine whether the tax positions are “more-likely-than-not” of being sustained by the applicable tax authority. To the extent that a tax benefit of a position is not deemed to meet the more-likely-than-not threshold, the Fund would report an income tax expense in the statement of operations. Adoption of FIN 48 is required for the last NAV calculation in the first financial statement reporting period for fiscal years beginning after December 15, 2006. Accordingly, management has evaluated tax positions taken by the Fund for the period April 1, 2008 through September 30, 2008 and determined that the adoption of FIN 48 did not have a material impact to the fund’s financial statements.
In March 2008, Statement of Financial Accounting Standards No. 161, Disclosures about Derivative Instruments and Hedging Activities (“FAS 161”), was issued and will be effective for fiscal years and interim periods beginning after November 15, 2008. FAS 161 requires enhanced disclosures about funds’ derivative and hedging activities. Management is currently evaluating the impact the adoption of FAS 161 will have on the Fund’s financial statement disclosures.
In September 2008, FASB Staff Position 133-1 and Fin 45-4, “Disclosures about Credit Derivatives and Certain Guarantees: An Amendment of FASB Statement No. 133 and FASB Interpretation No. 45; and Clarification of the Effective Date of FASB Statement No. 161” (“Amendment”) was issued and is effective for annual and interim reporting periods ending after November 15, 2008. The amendment requires enhanced disclosures regarding a fund’s credit derivatives holdings, including credit default swaps, credit spread options, and hybrid financial instruments containing embedded credit derivatives. Management is currently evaluating the impact the adoption of the Amendment will have on the Fund’s financial statement disclosures.
22
SHAREHOLDER EXPENSE EXAMPLE — (Unaudited)
As a shareholder of a Fund, you incur two types of costs: (1) transaction costs, including redemption fees, and (2) ongoing costs, including management fees and other Fund expenses. This Example is intended to help you understand your ongoing costs (in dollars) of investing in the Funds and to compare these costs with the ongoing costs of investing in other mutual funds.
The Example is based on an investment of $1,000 invested at the beginning of the period and held for the entire period (April 1, 2008 to September 30, 2008).
ACTUAL EXPENSES
The first line of the table below for each fund provides information about actual account values and actual expenses. You may use the information in this line, together with the amount you invested, to estimate the expenses that you paid over the period. Simply divide your account value by $1,000 (for example, an $8,600 account value divided by $1,000 = 8.6), then multiply the result by the number in the first line for a fund under the heading “Expenses Paid During Period” to estimate the expenses you paid on your account during this period.
HYPOTHETICAL EXAMPLE FOR COMPARISON PURPOSES
The second line of the table below for each fund provides information about hypothetical account values and hypothetical expenses based on a fund’s actual expense ratio and an assumed rate of return if 5% per year before expenses, which is not the Fund’s actual return. The hypothetical account values and expenses may not be used to estimate the actual ending account balance or expenses you paid for the period. You may use this information to compare the ongoing costs of investing in the Fund and other funds. To do so, compare this 5% hypothetical example with the 5% hypothetical examples that appear in the shareholder reports of the other funds.
Please note that the expenses shown in the table are meant to highlight your ongoing costs only and do not reflect any transaction costs. Therefore, the second line of the table is useful in comparing ongoing costs only, and will not help you determine the relative total costs of owning different funds. In addition, if these transactional costs were included, your costs would have been higher.
Expenses Paid | |||||||||||||
Beginning Account | Ending Account | During the Period | |||||||||||
Value | Value | April 1, 2008 to | Annualized | ||||||||||
April 1, 2008 | September 30, 2008 | September 30, 2008 | Expense Ratio | ||||||||||
U.S. Emerging Growth — Class R | |||||||||||||
| Actual | $1,000.00 | $ 926.80 | $7.09 | 1.47% | |||||||||
| Hypothetical (5% return before expenses) | $1,000.00 | $1,017.71 | $7.42 | 1.47% | |||||||||
U.S. Systematic Large Cap Growth — Class R | |||||||||||||
| Actual | $1,000.00 | $ 904.70 | $6.92 | 1.45% | |||||||||
| Hypothetical (5% return before expenses) | $1,000.00 | $1,017.80 | $7.33 | 1.45% | |||||||||
International Growth — Class R | |||||||||||||
| Actual | $1,000.00 | $ 791.00 | $7.46 | 1.66% | |||||||||
| Hypothetical (5% return before expenses) | $1,000.00 | $1,016.74 | $8.40 | 1.66% | |||||||||
* Expenses are equal to the Fund’s annualized expense ratio; multiplied by the average account value over the period
23
SUPPLEMENTARY INFORMATION — (Unaudited)
QUARTERLY FILING
The Funds provide a complete list of portfolio holdings four times in each fiscal year, at the end of each calendar quarter. For the second and fourth quarters, the portfolio holdings appear in the Funds’ semiannual and annual reports to shareholders. For the first and third quarters, the Funds file their portfolio holdings with the Securities and Exchange Commission on Form N-Q. Shareholders can look up the Funds’ Form N-Q on the SEC’s website at www.sec.gov. Forms N-Q may also be reviewed and copied at the SEC’s Public Reference Room in Washington, DC. To find out more about this public service, call the SEC at 1-202-942-8090.
24
SUPPLEMENTARY INFORMATION — (Unaudited) — Continued
CORPORATE GOVERNANCE (UNAUDITED)
Name, Address (1) Age Position(s) Held with Fund Length of Time Served (2) | Principal Occupation(s) during Past 5 Years Other Directorship Held by Trustee Number of Portfolios in Fund complex Overseen by Trustee | |
Independent Trustees: | ||
Darlene T. DeRemer 11/27/1955 Chairperson of the Board Since August 2007 & Trustee Since May 1999 | Principal Occupations: Partner, Grail Partners LLC (since 2005); Managing Director, Putnam Lovell NBF Private Equity (Since 2004-2005); Managing Director, NewRiver E-Business Advisory Services Division (2000-2003); Prior to, President and Founder, DeRemer Associates, a strategic and marketing consulting firm for the financial services industry (1987-2003); Vice President and Director, Asset Management Division, State Street Bank and Trust Company, now referred to as State Street Global Advisers, (1982-1987); Vice President, T. Rowe Price & Associates (1979-1982); Member, Boston Club (since 1998); Member, Financial Women’s Association Advisory Board (since 1995); Founder, Mutual Fund Cafe Website. | |
Other Directorships Held: Founding Member and Director, National Defined Contribution Council (since 1997); Trustee, Boston Alzheimer’s Association (since 1998); Director, King’s Wood Montessori School (since 1995); Editorial Board, National Association of Variable Annuities (since 1997); Director, Nicholas-Applegate Strategic Opportunities, Ltd. (1994-1997); Trustee, Nicholas-Applegate Mutual Funds (1994-1999); Director, Jurika & Voyles Fund Group (since 1994-2000); Trustee, Bramwell Funds (2003-2005); Director, Independent Director Council (since 2004); Mutual Fund Directors’ Council-Advisory Board; Board Member-Chatman Partners; Board Member X-Shares LLC. | ||
Number of Portfolios Overseen by Trustee: 14 | ||
John J. Murphy 4/8/1944 Trustee Since September 2005 | Principal Occupations: Founder and senior principal, Murphy Capital Management Other Directorships Held: Director, Smith Barney Multiple Discipline Trust; Director, Barclays International Funds Group Ltd. and affiliated companies; Smith Barney Consulting Group; Legg Mason Equity Funds. Number of Portfolios Overseen by Trustee: 14 | |
Bradford K. Gallagher 2/24/1944 Trustee Since August 2007 | Principal Occupations: Founder, Spyglass Investments LLC (a private investment vehicle) (since 2001); Founder, President and CEO of CypressTree Investment Management Company and Annuity Company; Managing Director, Fidelity Investments. Other Directorships Held: Trustee, The Common Fund (since 2005); Director, Anchor Point Inc. (since 2005); Chairman and Trustee, Atlantic Maritime Heritage Foundation (since 2007); Director, Shielding Technology Inc. (since 2006); Director, United Way of Eastern Massachusetts (1988-1990); Director, Ouimet Scholarship Fund (1993-2005); Director, Emerson Hospital (1995-2005) Number of Portfolios Overseen by Trustee: 14 | |
Steven Grenadier 12/14/1964 Trustee Since August 2007 | Principal Occupations: William F. Sharpe Professor of Financial Economics, Stanford University Graduate School of Business; Research Associate, National Bureau of Economic Research (since 2002); Chairman of the Finance Department, Stanford University Graduate School of Business (2004-2006) Other Directorships Held: Independent Trustee, E Trade Funds. Number of Portfolios Overseen by Trustee: 14 | |
Interested Trustees: | ||
Horacio A. Valeiras 1/8/1959 President & Trustee Since August 2004 | Principal Occupations: Managing Director (since 2004) and Chief Investment Officer, Nicholas-Applegate Capital Management, Nicholas-Applegate Securities (since 2002); Chief Investment Officer Oppenheimer Capital and AGI Management Partners (since 2008); Managing Director of Morgan Stanley Investment Management, London (1997-2002); Head of International Equity and Asset Allocation, Miller Anderson & Sherred; Director and Chief of Investment Strategies, Credit Suisse First Boston. Other Directorships Held: Trustee, The Bishops School (since 2002); Trustee, San Diego Rowing Club (since 2002). Number of Portfolios Overseen by Trustee: 14 | |
Arthur B. Laffer 8/14/1940 Trustee Since August 2007 | Principal Occupations: Chairman, Laffer Associates (economic consulting) (since 1979); Chairman, Laffer Advisors Inc. (registered broker-dealer) (since 1981); Chairman Laffer Investments (asset management) (since 2000); Member, Congressional Policy Advisory Board (since 1998); Distinguished University Professor and Director, Pepperdine University (1985-1988); Professor of Business Economics, University of Southern California (1976-1984); Associate Professor of Business Economics, University of Chicago (1967-1976). Other Directorships Held: Director of MPS Group, Inc. (NYSE:MPS) (since 2003); Director, Petco Animal Supplies, Inc. (NASDAQ:PETC) (2002-2005); Director, Oxigene Inc. (NASDAQ:OXGN); biopharmaceutical company (since 1998); Director of Provide Commerce (NASDAQ: PRVD) (since 1998); Director, Veolia Environmental Corporation (successor to U.S. Filter Corporation (water purification) (1991-2006); Director, Nicholas Applegate Fund, Inc. (1987-2007). Number of Portfolios Overseen by Trustee: 14 |
25
SUPPLEMENTARY INFORMATION — (Unaudited) — Continued
CORPORATE GOVERNANCE
| Name, Address (1) | ||
| Age | Principal Occupation(s) during Past 5 Years | |
| Position(s) Held with Fund | Other Directorship Held by Trustee | |
| Length of Time Served (2) | Number of Portfolios in Fund complex Overseen by Trustee | |
Officers: | ||
Charles H. Field, Jr. 7/24/1955 Secretary and Chief Compliance Officer Since May 2002 | Principal Occupations: Managing Director and General Counsel, Nicholas-Applegate Capital Management, Nicholas- Applegate Securities LLC, Nicholas-Applegate Holdings LLC (since February 2004), Deputy General Counsel, Nicholas- Applegate Capital Management, LLC (1996-2004). Other Directorships Held: NA Number of Portfolios Overseen by Officer: 14 | |
Deborah A. Wussow 1/31/1960 Treasurer and Assistant Secretary Since August 2006 | Principal Occupations: Senior Vice President and Chief Compliance Officer, Nicholas-Applegate Capital Management, (Since 2008), and previously Vice President and Director, Legal and Compliance, Nicholas-Applegate Capital Management (2005-2007) and Manager, Legal and Compliance, Nicholas-Applegate Capital Management (1995-2004)) Other Directorships Held: NA Number of Portfolios Overseen by Officer: 14 |
| (1) | Unless otherwise noted, the address of the Trustees and Officers is c/o: Nicholas-Applegate Capital Management, 600 West Broadway, 32nd Floor, San Diego, California 92101. |
| (2) | Each Trustee serves for an indefinite term, until her or his successor is elected. |
26
TRUSTEES OF NICHOLAS-APPLEGATE INSTITUTIONAL FUNDS
Darlene T. DeRemer, Chairperson
Horacio A. Valeiras
John J. Murphy
Bradford K. Gallagher
Steven Grenadier
Arthur B. Laffer
OFFICERS
Horacio A. Valeiras, President
Charles H. Field, Jr., Secretary & Chief Compliance Officer
Deborah A. Wussow, Treasurer & Assistant Secretary
INVESTMENT ADVISER
Nicholas-Applegate Capital Management
DISTRIBUTOR
Nicholas-Applegate Securities
CUSTODIAN
Brown Brothers Harriman & Co., Private Bankers
TRANSFER AGENT
UMB Fund Services Group, Inc.
INDEPENDENT REGISTERED PUBLIC ACCOUNTING FIRM
PricewaterhouseCoopers LLP
 | SAR0908RET |
 | 600 West Broadway San Diego, California 92101 800.551.8043 |
ITEM 2. CODE OF ETHICS.
Not required for this semi-annual report on Form N-CSR.
ITEM 3. AUDIT COMMITTEE FINANCIAL EXPERT.
Not required for this semi-annual report on Form N-CSR.
ITEM 4. PRINCIPAL ACCOUNTANT FEES AND SERVICES.
Not required for this semi-annual report on Form N-CSR.
ITEM 5. AUDIT COMMITTEE OF LISTED REGISTRANTS.
Not applicable.
ITEM 6. INVESTMENTS.
This schedule is included as part of the report to shareholders filed under Item 1 of this Form N-CSR.
ITEM 7. DISCLOSURE OF PROXY VOTING POLICIES AND PROCEDURES FOR CLOSED-END MANAGEMENT INVESTMENT COMPANIES.
Not applicable.
ITEM 8. PORTFOLIO MANAGERS OF CLOSED-END MANAGEMENT INVESTMENT COMPANIES.
Not applicable.
ITEM 9. PURCHASES OF EQUITY SECURITIES BY CLOSED-END MANAGEMENT INVESTMENT COMPANY AND AFFILIATED PURCHASERS.
Not applicable.
ITEM 10. SUBMISSION OF MATTERS TO A VOTE OF SECURITY HOLDERS.
There have been no material changes to the procedures by which the shareholders may recommend nominees to the registrant’s board of trustees, where those changes were implemented after the registrant last provided disclosure in response to the requirements of Item 407(c)(2)(iv) of Regulation S-K (as required by Item 22(b)(15) of Schedule 14A), or this Item.
ITEM 11. CONTROLS AND PROCEDURES.
(a) The registrant’s principal executive and financial officers have concluded that the registrant's disclosure controls and procedures (as defined in Rule 30a-3(c) under the Investment Company Act of 1940, as amended (the “1940 Act”)) are effective, as of a date within 90 days of the filing date of this Form N-CSR, based on their evaluation of these controls and procedures required by Rule 30a-3(b) under the 1940 Act and Rules 13a-15(b) or 15d-15(b) under the Securities Exchange Act of 1934, as amended (the “Exchange Act”).
(b) There were no changes in the registrant's internal control over financial reporting (as defined in Rule 30a-3(d) under the 1940 Act) that occurred during the registrant's second fiscal quarter of the period covered by this Form N-CSR, that have materially affected, or are reasonably likely to materially affect, the registrant's internal control over financial reporting.
ITEM 12. EXHIBITS.
| (a)(1) | Not required for this semi-annual report on Form N-CSR. |
| (a)(2) | A separate certification for each principal executive officer and principal financial officer of the registrant as required by Rule 30a-2(a) under the 1940 Act is filed as Exhibit 12(a)(2) to this Form N-CSR. |
| (a)(3) | Not applicable. |
| (b) | The certifications required by Rule 30a-2(b) under the 1940 Act, Rule 13a-14(b) or Rule 15d-14(b) under the Exchange Act, and Section 1350 of Chapter 63 of Title 18 of the United States Code are furnished as Exhibit 12(b) to this Form N-CSR. |
SIGNATURES
Pursuant to the requirements of the Securities Exchange Act of 1934 and the Investment Company Act of 1940, the registrant has duly caused this report to be signed on its behalf by the undersigned, thereunto duly authorized.
(Registrant)
Nicholas-Applegate Institutional Funds
By (Signature and Title)
/s/ Horacio A. Valeiras
Horacio A. Valeiras
Title: President (Principal Executive Officer) and Trustee
Date: December 4, 2008
Pursuant to the requirements of the Securities Exchange Act of 1934 and the Investment Company Act of 1940, this report has been signed below by the following persons on behalf of the registrant and in the capacities and on the dates indicated.
By (Signature and Title)
/s/ Horacio A. Valeiras
Horacio A. Valeiras
Title: President (Principal Executive Officer) and Trustee
Date: December 4, 2008
By (Signature and Title)
/s/ Deborah A. Wussow
Deborah A. Wussow
Title: Treasurer (Principal Financial Officer and Principal Accounting Officer)
Date: December 4, 2008