UNITED STATES
SECURITIES AND EXCHANGE COMMISSION
WASHINGTON, D.C. 20549
FORM N-CSR
CERTIFIED SHAREHOLDER REPORT OF REGISTERED
MANAGEMENT INVESTMENT COMPANIES
Investment Company Act file number: 811-07384
NICHOLAS-APPLEGATE INSTITUTIONAL FUNDS
(Exact name of registrant as specified in charter)
600 WEST BROADWAY, 30th FLOOR, SAN DIEGO, CA 92101
(Address of principal executive offices) (Zip Code)
Charles H. Field, Jr.
c/o Nicholas-Applegate Capital Management, LLC
600 West Broadway, 30th Floor
San Diego, CA 92101
(Name and address of agent for service)
Copy to:
Deborah A. Wussow-Hammalian
c/o Nicholas-Applegate Capital Management, LLC
600 West Broadway, 30th Floor
San Diego, CA 92101
Registrant's telephone number, including area code: (619) 687-2988
Date of fiscal year end: March 31
Date of reporting period: September 30, 2009
Item 1. Reports to Stockholders.
September 30, 2009 Semi Annual Report (Unaudited)
Class I, II, III & IV Shares
U.S. Ultra Micro Cap
U.S. Micro Cap
U.S. Emerging Growth
U.S. Small to Mid Cap Growth
U.S. Systematic Large Cap Growth
U.S. Convertible
Global Select
International Growth
International Growth Opportunities
Emerging Markets
International Systematic
U.S. High Yield Bond

LETTER TO SHAREHOLDERS
Dear Fellow Shareholder,
Following the most severe correction since the 1930s, the global equity market came roaring back during the six months ended September 30, 2009. Stock markets around the world posted dramatic gains, as monetary and fiscal stimulus helped thaw the credit markets and stabilize the global economy.
In this semi-annual report, we review the performance of the financial markets and our mutual funds from April 1 through September 30, 2009. We also share our perspective on the dynamics shaping the investment environment and our outlook for the future.
In the United States, the S&P 500 Index rose 34.0%. The Federal Reserve held short-term interest rates near zero and continued to flood the credit markets with liquidity by making loans and asset purchases. As investors gained confidence in the financial system, borrowers had easier and cheaper access to credit. In addition, some of the $787 billion stimulus package made its way into the economy through tax credits, the “cash for clunkers” vehicle trade-in program and other initiatives. Economic data released during the period showed that policymakers’ efforts were paying off. GDP declined at an annual rate of 0.7% in the second quarter of 2009, after having fallen 6.4% in the first quarter. More recent indicators suggested that the economy might be growing again, despite persistent weakness in the labor market. Corporate earnings were another source of optimism. While earnings for S&P 500 companies continued to decline, they were better than anticipated, supported by cost-cutting measures.
Stock markets in developed countries outside the United States also performed well. The MSCI EAFE Index gained 34.8% in local currencies and 50.4% in dollar terms. The U.S. dollar fell 8.7% versus a basket of currencies on expectations that the Federal Reserve would not raise interest rates any time soon. Like the Fed, central bankers in Europe and Japan held interest rates at record lows and continued with the special liquidity programs they had established during the financial crisis. However, demand for some of these programs was waning, testament to the improvement in the credit markets. Several developed countries came out of recession in the second quarter of 2009, including Japan whose economy grew at an annual pace of 2.3%. The German and French economies expanded as well, although GDP for the entire euro region dropped 4.8%, weighed down by weakness in Spain and Italy.
Equities in emerging countries delivered the strongest gains, with the MSCI Emerging Markets Index rising 45.7% in local currencies and 63.2% in U.S. dollars. As the global economy stabilized, investors rotated out of more defensive assets into higher-risk areas, such as emerging markets. Emerging markets further benefited from the relative strength of developing economies and rising commodity prices. For example, Chinese GDP grew at an annual rate of 7.1% in the first half of the year, helped by a surge in bank lending. Russia, whose main export is oil, was one of the best-performing equity markets this period amid a 42% spike in oil prices.
Against this favorable backdrop, all of the Nicholas-Applegate funds generated significant gains. That said, a number of our funds struggled to keep up with their benchmarks in the rapidly rising market. We believe this was because the rally was driven more by sentiment than company fundamentals. As the panic of last fall and winter subsided, relieved investors jumped back into the market, buying securities rather indiscriminately. A sentiment-driven rally is not unusual to see coming out of a severe correction. Nonetheless, it was a headwind for the funds given our focus on company fundamentals.
The volatile investment environment has underscored the importance of risk management, which remains a top priority at Nicholas-Applegate.
Our risk management program has been in place for more than a decade and has become increasingly sophisticated over the years. Today, we produce approximately 1,600 charts, tables and reports that our investment teams use to evaluate a wide range of risk metrics. We also have a risk management program that supports our entire business. This effort is guided by Nicholas-Applegate’s World Class Execution Committee (WCEC). The goal of the WCEC is to ensure a standard of excellence in all that we do to provide shareholders with world-class investment solutions. Its mandate encompasses everything from operations to compliance to the introduction of new products.
Looking forward, we expect the U.S. recovery to be more muted than past recoveries, given the high unemployment rate and continued tightness in certain segments of the credit markets. Foreign developed nations should recover more quickly than the United States, but real growth is also likely to remain subpar. Prices of gold, commodities and inflation-protected securities are telling us disinflation is coming to an end, and that inflation is in our future. We believe stock selection will be very important, as investors look for companies that will benefit from an environment of potentially slow growth, high unemployment and inflation. This bodes well for the fundamentally driven, bottom-up investment processes that we use to manage the funds.
On behalf of everyone at the firm, thank you for your participation in the Nicholas-Applegate Institutional Funds. We appreciate the trust that you have placed in us and look forward to serving your investment needs throughout the coming years.

Horacio A. Valeiras, CFA
President and Chief Investment Officer
September 30, 2009
TABLE OF CONTENTS
| The Funds’ Review and Outlook, Performance and Schedules of Investments: | |
| U.S. Ultra Micro Cap | 1 |
| U.S. Micro Cap | 4 |
| U.S. Emerging Growth | 9 |
| U.S. Small to Mid Cap Growth | 13 |
| U.S. Systematic Large Cap Growth | 17 |
| U.S. Convertible | 20 |
| Global Select | 25 |
| International Growth | 29 |
| International Growth Opportunities | 33 |
| Emerging Markets | 37 |
| International Systematic | 41 |
| U.S. High Yield Bond | 45 |
| The Funds’: | |
| Financial Highlights | 50 |
| Statements of Assets and Liabilities | 58 |
| Statements of Operations | 60 |
| Statements of Changes in Net Assets | 62 |
| Notes to Financial Statements | 66 |
| Shareholder Expense Example | 76 |
| Supplementary Information | 78 |
This report is authorized for distribution to shareholders and to others only when preceded or accompanied by a currently effective prospectus for Nicholas-Applegate Institutional Funds Class I, II, III & IV Shares. Distributor: Nicholas-Applegate Securities.
U.S. ULTRA MICRO CAP FUND
Management Team: John C. McCraw, Portfolio Manager; Robert S. Marren, Portfolio Manager
Chief Investment Officer: Horacio A. Valeiras, CFA
Goal: The U.S. Ultra Micro Cap Fund seeks to maximize long-term capital appreciation by investing primarily in U.S. companies with market capitalizations below the weighted average of the Russell Microcap Growth Index at time of purchase.
Market Overview: During the six months ended September 30, 2009, the U.S. stock market continued to rebound from multi-year lows set in March. All of the major indexes climbed sharply higher in response to improvement in the credit markets and economy, with small- and micro-cap growth stocks turning in some of the best results.
In the first half of the period, equities soared as measures of investor fear and credit risk recovered to levels unseen since Lehman Brothers failed in September 2008. Various liquidity programs implemented by the Treasury and Federal Reserve helped unlock the credit markets, giving more borrowers access to cash. Although the economy remained weak, data suggested that it was deteriorating at a slower pace. This was confirmed in July, when the government reported that second-quarter GDP fell at an annual rate of 1.0% after having fallen 6.4% in the first quarter. The second-quarter figure was later revised to a 0.7% decline.
Equities maintained their upward momentum in the last half of the period, buoyed by better-than-expected earnings and generally upbeat economic data. Home prices appeared to have stabilized, the manufacturing sector expanded for the first time since early 2008 and retail sales posted their biggest monthly increase in over three years. In September, Fed Chairman Ben Bernanke said that it was “very likely” the recession had ended but warned that the unemployment rate could continue to rise.
Performance: The Fund’s Class I shares gained 62.11% from April 1, 2009 to September 30, 2009 outperforming the Russell Microcap Growth Index, which rose 53.87%.
Portfolio Specifics: The Fund’s outperformance was due to stock selection, which was strongest in the information technology, materials and consumer discretionary sectors. Three of the best-performing names in the portfolio were Terremark Worldwide, a provider of IT infrastructure services that is experiencing robust demand; Boise, a paper manufacturer that strengthened its balance sheet; and Carrols Restaurant Group, a fast-food chain with expanding operating margins. Stock selection also added value in the energy, industrials and consumer staples sectors. Gulfport Energy, an oil and gas producer, was another top performer in the Fund. The company ramped up drilling activity in response to strong oil prices and lower oilfield service costs.
The main area of relative weakness in the portfolio was stock selection in the health care sector. One of our biggest detractors was a supplier of diagnostic systems that reported disappointing earnings.
Market Outlook: While it is widely believed that the recession is over, we think that the economic recovery will be muted due to the high unemployment rate and large federal deficit. That said, several factors could fuel additional gains in the stock market over the months ahead, including:
| • | Expectations for a strong rebound in corporate earnings in 2010 |
| • | Potential for investors to move some of the $3.4 trillion sitting in low-yielding money market funds into equities |
| • | Indications from the Fed that it plans to keep interest rates low for an extended period of time |
Whatever direction the broad market takes, we believe that the Fund will continue to benefit from our focus on company-specific fundamentals.
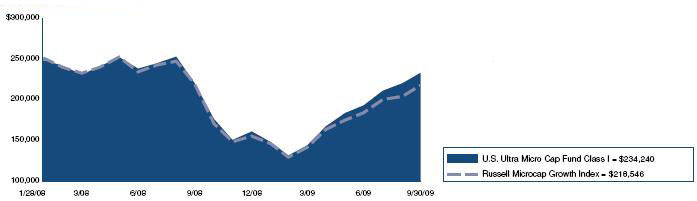
Comparison of Change in Value of a $250,000 Investment in U.S. Ultra Micro Cap Fund Class I Shares with the Russell Microcap Growth Index.
Annualized Total Returns As of 9/30/09 | ||
| 1 Year | Since Inception | |
| U.S. Ultra Micro Cap Fund Class I | 6.00% | –3.81% |
| Russell Microcap Growth Index | 6.72% | –7.73% |
The graph above shows the value of a hypothetical $250,000 investment in the Fund’s Class I shares with the Russell Microcap Growth Index for the periods indicated. Average annual total return figures include changes in principal value, reinvested dividends, and capital gain distributions. The Class I shares commenced operations on January 28, 2008. The total returns shown above do not show the effects of income taxes on an individuals’ investment. In most cases, taxes may reduce your actual investment returns on income or gains paid by the Fund or any gains you may realize if you sell your shares. Past performance cannot guarantee future results.
The Russell Microcap Index measures performance of the microcap segment, representing less than 3% of the U.S. equity market. The Russell Microcap Index includes the smallest 1,000 securities in the small-cap Russell 2000 Index plus the next 1,000 securities. The Russell Microcap Growth Index isolates the securities in the Russell Microcap Index with purely growth characteristics. Unless otherwise noted, index returns reflect the reinvestment of income dividends and capital gains, if any, but do not reflect fees, brokerage commissions or other expenses of investing. Investors may not make direct investments into any index. Since markets can go down as well as up, investment return and principal value will fluctuate with market conditions. You may have a gain or loss when you sell shares.
1
U.S. ULTRA MICRO CAP FUND
SCHEDULE OF INVESTMENTS (Unaudited)
As of September 30, 2009
| Number of | ||||||||
| Shares | Value | |||||||
| Common Stock - 97.9% | ||||||||
| Applications Software - 2.5% | ||||||||
| China TransInfo Technology Corp.* | 2,900 | $ | 27,434 | |||||
| inContact, Inc.* | 5,950 | 17,731 | ||||||
| 45,165 | ||||||||
| Auto/Truck Parts & Equipment-Original - 1.2% | ||||||||
| Wonder Auto Technology, Inc.* | 1,800 | 21,600 | ||||||
| Broadcast Services/Programming - 1.0% | ||||||||
| Acacia Research - Acacia Technologies* | 2,000 | 17,420 | ||||||
| Chemicals-Specialty - 4.8% | ||||||||
| ICO, Inc.* | 5,600 | 26,152 | ||||||
| KMG Chemicals, Inc. | 2,200 | 24,574 | ||||||
| Omnova Solutions, Inc.* | 3,300 | 21,384 | ||||||
| Penford Corp. | 2,300 | 16,491 | ||||||
| 88,601 | ||||||||
| Commercial Services - 1.1% | ||||||||
| StarTek, Inc.* | 2,400 | 20,832 | ||||||
| Commercial Services-Finance - 0.9% | ||||||||
| PRG-Schultz International, Inc.* | 3,000 | 16,800 | ||||||
| Communications Software - 1.3% | ||||||||
| Incredimail, Ltd. | 2,800 | 23,688 | ||||||
| Computer Services - 1.0% | ||||||||
| Virtusa Corp.* | 1,900 | 18,031 | ||||||
| Computers-Integrated Systems - 1.2% | ||||||||
| Radiant Systems, Inc.* | 2,080 | 22,339 | ||||||
| Computers-Memory Devices - 2.7% | ||||||||
| Dot Hill Systems Corp.* | 10,900 | 18,966 | ||||||
| Xyratex, Ltd.* | 3,300 | 31,383 | ||||||
| 50,349 | ||||||||
| Computers-Peripheral Equipment - 0.5% | ||||||||
| iGO, Inc.* | 7,500 | 8,175 | ||||||
| Consumer Products-Miscellaneous - 1.1% | ||||||||
| Summer Infant, Inc.* | 4,100 | 20,418 | ||||||
| Direct Marketing - 1.5% | ||||||||
| APAC Customer Services, Inc.* | 4,700 | 27,777 | ||||||
| Disposable Medical Products - 1.0% | ||||||||
| Medical Action Industries, Inc.* | 1,500 | 18,105 | ||||||
| Distribution/Wholesale - 1.0% | ||||||||
| Navarre Corp.* | 8,700 | 19,140 | ||||||
| Diversified Manufacturing Operations - 1.4% | ||||||||
| Park-Ohio Holdings Corp.* | 3,000 | 26,160 | ||||||
| Drug Delivery Systems - 0.7% | ||||||||
| Depomed, Inc.* | 3,100 | 13,547 | ||||||
| E-Commerce/Products - 0.9% | ||||||||
| 1-800-FLOWERS.COM, Inc.* | 4,700 | 16,215 | ||||||
| Electronic Components-Miscellaneous - 2.5% | ||||||||
| NVE Corp.* | 400 | 21,264 | ||||||
| Stoneridge, Inc.* | 3,600 | 25,488 | ||||||
| 46,752 | ||||||||
| Electronic Components-Semiconductors - 2.2% | ||||||||
| Ceva, Inc.* | 1,992 | 21,414 | ||||||
| MIPS Technologies, Inc. Cl. A* | 5,200 | 19,604 | ||||||
| 41,018 | ||||||||
| Electronic Measure Instruments - 1.4% | ||||||||
| Measurement Specialties, Inc.* | 2,600 | 26,546 | ||||||
| Hazardous Waste Disposal - 1.0% | ||||||||
| Sharps Compliance Corp.* | 1,800 | 17,730 | ||||||
| Health Care Cost Containment - 1.5% | ||||||||
| Integramed America, Inc.* | 2,840 | 26,980 | ||||||
| Human Resources - 1.2% | ||||||||
| Hudson Highland Group, Inc.* | 6,950 | 21,128 | ||||||
| Industrial Audio & Video Products - 0.7% | ||||||||
| SRS Labs, Inc.* | 1,800 | 13,158 | ||||||
| Instruments-Controls - 0.7% | ||||||||
| Spectrum Control, Inc.* | 1,573 | 13,355 | ||||||
| Insurance Brokers - 0.6% | ||||||||
| Life Partners Holdings, Inc. | 652 | 11,671 | ||||||
| Internet Applications Software - 1.8% | ||||||||
| Clicksoftware Technologies, Ltd.* | 2,100 | 13,209 | ||||||
| interCLICK, Inc.* | 9,000 | 18,990 | ||||||
| 32,199 | ||||||||
| Internet Content-Information/News - 1.1% | ||||||||
| Health Grades, Inc.* | 4,200 | 20,790 | ||||||
| Internet Infrastructure Software - 1.2% | ||||||||
| RADVision, Ltd.* | 2,400 | 21,264 | ||||||
| Machinery-General Industry - 1.1% | ||||||||
| Intevac, Inc.* | 1,500 | 20,160 | ||||||
| Medical Instruments - 2.1% | ||||||||
| Endologix, Inc.* | 3,400 | 21,046 | ||||||
| Vascular Solutions, Inc.* | 2,020 | 16,705 | ||||||
| 37,751 | ||||||||
| Medical Products - 2.0% | ||||||||
| ATS Medical, Inc.* | 7,735 | 20,730 | ||||||
| HealthTronics, Inc.* | 6,800 | 16,728 | ||||||
| 37,458 | ||||||||
| Medical-Biomedical/Genetics - 1.2% | ||||||||
| Repligen Corp.* | 2,000 | 10,020 | ||||||
| Transcept Pharmaceuticals, Inc.* | 800 | 11,064 | ||||||
| 21,084 | ||||||||
| Medical-Drugs - 1.5% | ||||||||
| Biospecifics Technologies Corp.* | 300 | 9,603 | ||||||
| Sciclone Pharmaceuticals, Inc.* | 4,400 | 18,744 | ||||||
| 28,347 | ||||||||
| Medical-Outpatient/Home Medical Care - 4.3% | ||||||||
| Almost Family, Inc.* | 500 | 14,875 | ||||||
| America Service Group, Inc. | 1,420 | 23,487 | ||||||
| Continucare Corp.* | 6,100 | 18,422 | ||||||
| NovaMed, Inc.* | 4,770 | 21,608 | ||||||
| 78,392 | ||||||||
| Networking Products - 2.3% | ||||||||
| Hypercom Corp.* | 8,400 | 26,040 | ||||||
| Silicom, Ltd.* | 1,800 | 16,884 | ||||||
| 42,924 | ||||||||
| Oil Companies-Exploration & Production - 3.6% | ||||||||
| GeoMet, Inc.* | 8,300 | 14,027 | ||||||
| Gulfport Energy Corp.* | 3,400 | 29,716 | ||||||
| Rex Energy Corp.* | 2,700 | 22,545 | ||||||
| 66,288 | ||||||||
See Accompanying Notes to Financial Statements.
2
SCHEDULE OF INVESTMENTS (Unaudited)
| As of September 30, 2009 |
| Number of | ||||||||
| Shares | Value | |||||||
| Oil Field Machine & Equipment - 1.9% | ||||||||
| Gulf Island Fabrication, Inc. | 800 | $ | 14,992 | |||||
| T-3 Energy Services, Inc.* | 1,030 | 20,291 | ||||||
| 35,283 | ||||||||
| Oil-Field Services - 0.8% | ||||||||
| Trico Marine Services, Inc.* | 2,000 | 15,440 | ||||||
| Paper & Related Products - 3.2% | ||||||||
| Boise, Inc.* | 7,200 | 38,016 | ||||||
| KapStone Paper & Packaging Corp.* | 2,500 | 20,350 | ||||||
| 58,366 | ||||||||
| Pharmacy Services - 1.1% | ||||||||
| BioScrip, Inc.* | 3,100 | 20,956 | ||||||
| Physical Therapy/Rehabilitation Centers - 1.2% | ||||||||
| US Physical Therapy, Inc.* | 1,510 | 22,756 | ||||||
| Power Conversion/Supply Equipment - 1.4% | ||||||||
| PowerSecure International, Inc.* | 3,700 | 25,086 | ||||||
| Recycling - 1.4% | ||||||||
| Metalico, Inc.* | 5,990 | 24,978 | ||||||
| Retail-Apparel/Shoe - 0.6% | ||||||||
| Destination Maternity Corp.* | 600 | 10,878 | ||||||
| Retail-Automobile - 1.4% | ||||||||
| America’s Car-Mart, Inc.* | 1,085 | 25,986 | ||||||
| Retail-Drug Store - 1.0% | ||||||||
| Allion Healthcare, Inc.* | 3,269 | 19,124 | ||||||
| Retail-Restaurants - 5.7% | ||||||||
| AFC Enterprises, Inc.* | 2,430 | 20,461 | ||||||
| Caribou Coffee Co., Inc.* | 2,900 | 20,938 | ||||||
| Carrols Restaurant Group, Inc.* | 3,400 | 25,704 | ||||||
| Einstein Noah Restaurant Group, Inc.* | 2,083 | 25,079 | ||||||
| Famous Dave’s Of America, Inc.* | 2,100 | 12,285 | ||||||
| 104,467 | ||||||||
| Retirement/Aged Care - 1.2% | ||||||||
| Five Star Quality Care, Inc.* | 6,100 | 22,326 | ||||||
| Semiconductor Components-Integrated Circuits - 2.1% | ||||||||
| Anadigics, Inc.* | 3,600 | 16,956 | ||||||
| Techwell, Inc.* | 1,986 | 21,806 | ||||||
| 38,762 | ||||||||
| Semiconductor Equipment - 1.4% | ||||||||
| Nanometrics, Inc.* | 3,900 | 25,623 | ||||||
| Steel-Producers - 1.4% | ||||||||
| Olympic Steel, Inc. | 900 | 25,821 | ||||||
| Telecommunication Equipment - 1.0% | ||||||||
| Anaren, Inc.* | 1,120 | 19,040 | ||||||
| Telecommunication Equipment-Fiber Optics - 1.0% | ||||||||
| Oplink Communications, Inc.* | 1,300 | 18,876 | ||||||
| Textile-Apparel - 1.8% | ||||||||
| Perry Ellis International, Inc.* | 2,100 | 33,684 | ||||||
| Transport-Marine - 1.2% | ||||||||
| CAI International, Inc.* | 3,100 | 22,847 | ||||||
| Transport-Services - 0.7% | ||||||||
| Vitran Corp., Inc.* | 1,404 | 12,664 | ||||||
| Transport-Truck - 3.1% | ||||||||
| Celadon Group, Inc.* | 1,926 | 21,783 | ||||||
| Quality Distribution, Inc.* | 5,350 | 18,029 | ||||||
| Saia, Inc.* | 1,045 | 16,804 | ||||||
| 56,616 | ||||||||
| Web Hosting/Design - 1.5% | ||||||||
| Terremark Worldwide, Inc.* | 4,300 | 26,746 | ||||||
| Wire & Cable Products - 1.1% | ||||||||
| Fushi Copperweld, Inc.* | 2,390 | 20,219 | ||||||
| Wireless Equipment - 0.9% | ||||||||
| WPCS International, Inc.* | 4,500 | 17,100 | ||||||
| Total Common Stock (Cost: $1,309,321) | 1,803,001 | |||||||
| Limited Partnerships - 1.0% | ||||||||
| Transport-Marine - 1.0% | ||||||||
| Navios Maritime Partners LP (Cost $13,444) | 1,600 | 19,120 | ||||||
| Principal | ||||||||
| Amount | ||||||||
| Short Term Investments - 1.1% | ||||||||
| Time Deposit - 1.1% | ||||||||
| Citibank London 0.030%, 10/01/09 | ||||||||
| (Cost: $20,183) | $ | 20,183 | 20,183 | |||||
| Total Investments - 100.0% (Cost: $1,342,948) | 1,842,304 | |||||||
| Other Assets in Excess of Liabilities - 0.0% | 430 | |||||||
| Net Assets - 100.0% | $ | 1,842,734 | ||||||
* Non-income producing securities.
SCHEDULE OF INVESTMENTS BY SECTOR | ||||
| as of September 30, 2009 | ||||
| Percent of | ||||
| Sector | Net Assets | |||
| Consumer, Non-cyclical | 23.0 | % | ||
| Industrial | 18.7 | |||
| Technology | 14.9 | |||
| Communications | 14.2 | |||
| Consumer, Cyclical | 12.7 | |||
| Basic Materials | 8.5 | |||
| Energy | 6.3 | |||
| Financial | 0.6 | |||
| Short Term Investments | 1.1 | |||
| Total Investments | 100.0 | |||
| Other assets in excess of liabilities | 0.0 | |||
| Net Assets | 100.0 | % | ||
See Accompanying Notes to Financial Statements.
3
U.S. MICRO CAP FUND
Management Team: John C. McCraw, Portfolio Manager; Robert S. Marren, Portfolio Manager
Chief Investment Officer: Horacio A. Valeiras, CFA
Goal: The U.S. Micro Cap Fund seeks to maximize long-term capital appreciation by investing primarily in U.S. companies with market capitalizations similar to the Russell Microcap Growth Index at time of purchase.
Market Overview: U.S. equities delivered significant gains during the six months ended September 30, 2009. While the rally was broad-based, micro-cap growth stocks did particularly well.
The following themes contributed to stocks’ strong performance:
| • | Improvement in the credit markets, with the London interbank offer rate for three-month dollars (Libor) — a proxy for financial stress — falling to record lows |
| • | Extremely inexpensive valuations following the dramatic sell-off in equities that occurred last fall and winter |
| • | Signs the recession was coming to an end, including the first monthly increase in a key index of home prices in nearly three years |
Government programs, such as the $8,000 new homebuyer tax credit, contributed to the improvement in the economy. In addition, the Federal Reserve kept interest rates at an all-time low of 0.00% to 0.25%. Because conditions in the financial markets had stabilized, the central bank cut back some of its emergency liquidity programs or let them expire. However, concerns about job losses and tighter consumer credit made the Fed cautious about shrinking its balance sheet too quickly, especially since inflation remained in check.
Performance: The Fund’s Class I shares gained 45.78%, from April 1 through September 30, 2009. The Russell Microcap Growth Index advanced 53.87%.
Portfolio Specifics: Stock selection in the information technology, energy and materials sectors had the largest positive impact on results versus the index. Top-performing holdings included Taleo, a software provider on the cusp of a new product cycle; Stone Energy, an energy exploration and production company that announced its first deepwater discovery; and Omnova Solutions, a chemical producer that benefited from lower manufacturing and raw material costs.
Within the Russell Microcap Growth Index, the smallest market-cap stocks and those with the lowest stock prices generated the highest returns, which was consistent with rising risk appetites. This had a negative impact on the Fund’s relative performance, since our investment style generally leads to under-representation in these segments of the benchmark. From a sector perspective, stock selection in health care and information technology subtracted the most from results versus the index.
Market Outlook: While it is widely believed that the recession is over, we think that the economic recovery will be muted due to the high unemployment rate and large federal deficit. That said, several factors could fuel additional gains in the stock market over the months ahead, including:
| • | Expectations for a strong rebound in corporate earnings in 2010 |
| • | Potential for investors to move some of the $3.4 trillion sitting in low-yielding money market funds into equities |
| • | Indications from the Fed that it plans to keep interest rates low for an extended period of time |
As events unfold, we are confident that our bottom-up investment process will identify exciting growth opportunities for the Fund.
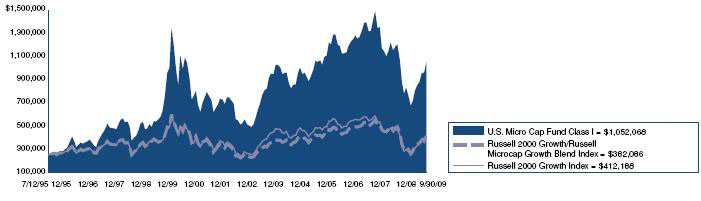
Comparison of Change in Value of a $250,000 Investment in U.S. Micro Cap Fund Class I Shares with the Russell 2000 Growth/Russell Microcap Growth Blend Index and Russell 2000 Growth Index
Annualized Total Returns As of 9/30/09 | |||
1 Year | 5 Years | 10 Years | |
| U.S. Micro Cap Fund Class I | –1.91% | 4.13% | 6.09% |
| Russell 2000 Growth/Russell | |||
| Microcap Growth Blend Index | 22.35% | 0.01% | 1.20% |
| Russell 2000 Growth Index | –6.32% | 2.91% | 1.10% |
The graph above shows the value of a hypothetical $250,000 investment in the Fund’s Class I shares compared with the Russell 2000 Growth Index and a blended index comprised of the Russell 2000 Growth Index/Russell Microcap Growth Index. The Fund’s Class I shares calculate their performance based upon the historical performance of their corresponding series of Nicholas-Applegate Mutual Funds (renamed ING Mutual Funds), adjusted to reflect all fees and expenses applicable to Class I shares. The Nicholas-Applegate Institutional Funds’ Class I shares were first available on May 7, 1999. Average annual total return figures include changes in principal value, reinvestment of dividends, and capital gain distributions. The total returns shown above do not show the effects of income taxes on an individual’s investment. In most cases, taxes may reduce your actual investment returns on income or gains paid by the Fund or any gains you may realize if you sell your shares. Past performance cannot guarantee future results.
4
U.S. MICRO CAP FUND
The Russell 2000 Growth Index is an unmanaged index comprised of those Russell 2000 companies with higher price-to-book ratios and higher forecasted growth values. The Russell 2000 Growth Index is an unmanaged index generally representative of the 2,000 smallest companies in the Russell 3000 Index, which represents approximately 10% of the total market capitalization of the Russell 3000 Index.
The Russell Microcap Growth Index isolates the smallest 1,000 securities in the Russell 2000 Index plus the next 1,000 securities. The Russell Microcap Growth Index isolates the securities in the Russell Microcap Index with purely growth characteristics. Unless otherwise noted, index returns reflect the reinvestment of income dividends and capital gains, if any, but do not reflect fees, brokerage commissions or other expenses of investing. The Russell 2000 Growth/Russell Microcap Growth Blend Index is a combination of the Russell 2000 Growth Index and the Russell Microcap Growth Index. The blended index exhibits Russell 2000 Growth performance from the inception of the Fund until August 2000, and Russell Microcap Growth performance thereafter. The Fund created the blended index because Russell Microcap Growth performance incepted in August 2000.
One cannot invest directly in an index. Since markets can go down as well as up, investment return and principal value will fluctuate with market conditions. You may have a gain or loss when you sell your shares.
5
U.S. MICRO CAP FUND
SCHEDULE OF INVESTMENTS (Unaudited)
As of September 30, 2009
| Number of | ||||||||
| Shares | Value | |||||||
| Common Stock - 97.9% | ||||||||
| Agricultural Operations - 0.7% | ||||||||
| The Andersons, Inc. | 12,100 | $ | 425,920 | |||||
| Apparel Manufacturers - 0.9% | ||||||||
| Maidenform Brands, Inc.* | 33,800 | 542,828 | ||||||
| Applications Software - 2.8% | ||||||||
| China TransInfo Technology Corp.* | 58,600 | 554,356 | ||||||
| Ebix, Inc.* | 13,500 | 747,360 | ||||||
| inContact, Inc.* | 103,700 | 309,026 | ||||||
| 1,610,742 | ||||||||
| Auto/Truck Parts & Equipment-Original - 1.7% | ||||||||
| Titan International, Inc. | 49,200 | 437,880 | ||||||
| Wonder Auto Technology, Inc.* | 46,200 | 554,400 | ||||||
| 992,280 | ||||||||
| Batteries/Battery Systems - 0.7% | ||||||||
| Greatbatch, Inc.* | 17,400 | 390,978 | ||||||
| Broadcast Services/Programming - 1.5% | ||||||||
| Acacia Research - Acacia Technologies* | 50,800 | 442,468 | ||||||
| DG FastChannel, Inc.* | 20,800 | 435,552 | ||||||
| 878,020 | ||||||||
| Building-Heavy Construction - 0.9% | ||||||||
| Orion Marine Group, Inc.* | 25,000 | 513,500 | ||||||
| Casino Services - 1.0% | ||||||||
| Shuffle Master, Inc.* | 59,500 | 560,490 | ||||||
| Chemicals-Diversified - 1.0% | ||||||||
| Innospec, Inc.* | 38,800 | 572,300 | ||||||
| Chemicals-Plastics - 0.8% | ||||||||
| Spartech Corp.* | 40,300 | 434,031 | ||||||
| Chemicals-Specialty - 1.3% | ||||||||
| Omnova Solutions, Inc.* | 111,700 | 723,816 | ||||||
| Coal - 0.7% | ||||||||
| James River Coal Co.* | 20,600 | 393,666 | ||||||
| Collectibles - 0.8% | ||||||||
| RC2 Corp.* | 31,800 | 453,150 | ||||||
| Commercial Services - 0.8% | ||||||||
| StarTek, Inc.* | 52,500 | 455,700 | ||||||
| Commercial Services-Finance - 0.8% | ||||||||
| Dollar Financial Corp.* | 27,300 | 437,346 | ||||||
| Communications Software - 1.5% | ||||||||
| Seachange International, Inc.* | 40,500 | 303,750 | ||||||
| Smith Micro Software, Inc.* | 44,700 | 552,492 | ||||||
| 856,242 | ||||||||
| Computer Services - 2.8% | ||||||||
| LivePerson, Inc.* | 96,900 | 488,376 | ||||||
| Ness Technologies, Inc.* | 67,800 | 534,942 | ||||||
| VanceInfo Technologies, Inc. - ADR* | 29,000 | 563,760 | ||||||
| 1,587,078 | ||||||||
| Computers-Integrated Systems - 2.1% | ||||||||
| Netscout Systems, Inc.* | 44,000 | 594,440 | ||||||
| Radiant Systems, Inc.* | 55,700 | 598,218 | ||||||
| 1,192,658 | ||||||||
| Computers-Memory Devices - 1.1% | ||||||||
| Xyratex, Ltd.* | 67,500 | 641,925 | ||||||
| Computers-Peripheral Equipment - 0.8% | ||||||||
| Compellent Technologies, Inc.* | 24,300 | 438,615 | ||||||
| Cosmetics & Toiletries - 0.9% | ||||||||
| Elizabeth Arden, Inc.* | 42,000 | $ | 494,340 | |||||
| Direct Marketing - 0.9% | ||||||||
| APAC Customer Services, Inc.* | 90,700 | 536,037 | ||||||
| Disposable Medical Products - 2.1% | ||||||||
| ICU Medical, Inc.* | 11,400 | 420,204 | ||||||
| Medical Action Industries, Inc.* | 30,900 | 372,963 | ||||||
| Merit Medical Systems, Inc.* | 22,900 | 396,857 | ||||||
| 1,190,024 | ||||||||
| Distribution/Wholesale - 1.2% | ||||||||
| MWI Veterinary Supply, Inc.* | 11,400 | 455,430 | ||||||
| Rentrak Corp.* | 13,800 | 246,468 | ||||||
| 701,898 | ||||||||
| Drug Delivery Systems - 0.8% | ||||||||
| Depomed, Inc.* | 105,500 | 461,035 | ||||||
| Electric Products-Miscellaneous - 1.7% | ||||||||
| Harbin Electric, Inc.* | 31,100 | 524,968 | ||||||
| SmartHeat, Inc.* | 39,700 | 471,239 | ||||||
| 996,207 | ||||||||
| Electronic Components-Miscellaneous - 0.8% | ||||||||
| NVE Corp.* | 8,800 | 467,808 | ||||||
| Electronic Components-Semiconductors - 0.7% | ||||||||
| Ceva, Inc.* | 38,600 | 414,950 | ||||||
| Enterprise Software/Services - 1.8% | ||||||||
| Opnet Technologies, Inc. | 42,500 | 464,525 | ||||||
| Taleo Corp. Cl. A* | 25,348 | 573,879 | ||||||
| 1,038,404 | ||||||||
| Finance-Consumer Loans - 1.0% | ||||||||
| Portfolio Recovery Associates, Inc.* | 12,600 | 571,158 | ||||||
| Food-Canned - 0.8% | ||||||||
| Seneca Foods Corp. Cl. A* | 16,700 | 457,580 | ||||||
| Insurance Brokers - 0.7% | ||||||||
| Life Partners Holdings, Inc. | 21,376 | 382,630 | ||||||
| Internet Incubators - 0.7% | ||||||||
| Internet Capital Group, Inc.* | 48,400 | 404,624 | ||||||
| Internet Infrastructure Software - 0.7% | ||||||||
| TeleCommunication Systems, Inc. Cl. A* | 50,300 | 420,508 | ||||||
| Machinery-General Industry - 2.1% | ||||||||
| Albany International Corp. Cl. A | 31,000 | 601,400 | ||||||
| Intevac, Inc.* | 43,300 | 581,952 | ||||||
| 1,183,352 | ||||||||
| Medical Imaging Systems - 1.3% | ||||||||
| Given Imaging, Ltd.* | 21,300 | 317,583 | ||||||
| Merge Healthcare, Inc.* | 103,700 | 426,207 | ||||||
| 743,790 | ||||||||
| Medical Information Systems - 1.3% | ||||||||
| AMICAS, Inc.* | 89,800 | 323,280 | ||||||
| Computer Programs & Systems, Inc. | 9,500 | 393,395 | ||||||
| 716,675 | ||||||||
| Medical Instruments - 1.7% | ||||||||
| Endologix, Inc.* | 80,700 | 499,533 | ||||||
| Symmetry Medical, Inc.* | 45,900 | 475,983 | ||||||
| 975,516 | ||||||||
| Medical Labs & Testing Services - 1.0% | ||||||||
| Bio-Reference Labs, Inc.* | 17,460 | 600,624 | ||||||
See Accompanying Notes to Financial Statements.
6
SCHEDULE OF INVESTMENTS (Unaudited)
| As of September 30, 2009 | ||||||||
| Number of | ||||||||
| Shares | Value | |||||||
| Medical Products - 2.5% | ||||||||
| ATS Medical, Inc.* | 100,100 | $ | 268,268 | |||||
| Cantel Medical Corp.* | 26,000 | 391,560 | ||||||
| Exactech, Inc.* | 25,700 | 404,518 | ||||||
| Hanger Orthopedic Group, Inc.* | 28,500 | 395,295 | ||||||
| 1,459,641 | ||||||||
| Medical-Biomedical/Genetics - 2.5% | ||||||||
| Affymax, Inc.* | 7,000 | 167,230 | ||||||
| Arena Pharmaceuticals, Inc.* | 48,000 | 214,560 | ||||||
| Immunogen, Inc.* | 34,400 | 278,984 | ||||||
| Immunomedics, Inc.* | 43,200 | 238,464 | ||||||
| Micromet, Inc.* | 29,300 | 195,138 | ||||||
| Novavax, Inc.* | 35,500 | 140,580 | ||||||
| NPS Pharmaceuticals, Inc.* | 45,500 | 182,910 | ||||||
| 1,417,866 | ||||||||
| Medical-Drugs - 2.3% | ||||||||
| Hi-Tech Pharmacal Co., Inc.* | 20,300 | 455,532 | ||||||
| Sciclone Pharmaceuticals, Inc.* | 96,900 | 412,794 | ||||||
| Vivus, Inc.* | 42,000 | 438,900 | ||||||
| 1,307,226 | ||||||||
| Medical-Outpatient/Home Medical Care - 1.3% | ||||||||
| Almost Family, Inc.* | 12,800 | 380,800 | ||||||
| America Service Group, Inc. | 21,000 | 347,340 | ||||||
| 728,140 | ||||||||
| MRI/Medical Diagnostic Imaging Centers - 0.9% | ||||||||
| Nighthawk Radiology Holdings, Inc.* | 68,000 | 491,640 | ||||||
| Networking Products - 2.4% | ||||||||
| Extreme Networks* | 144,500 | 404,600 | ||||||
| Hypercom Corp.* | 161,800 | 501,580 | ||||||
| Switch & Data Facilities Co., Inc.* | 34,600 | 470,906 | ||||||
| 1,377,086 | ||||||||
| Non-Ferrous Metals - 2.0% | ||||||||
| Brush Engineered Materials, Inc.* | 21,800 | 533,228 | ||||||
| Horsehead Holding Corp.* | 51,900 | 608,268 | ||||||
| 1,141,496 | ||||||||
| Office Supplies & Forms - 1.2% | ||||||||
| ACCO Brands Corp.* | 94,100 | 679,402 | ||||||
| Oil Companies-Exploration & Production - 4.1% | ||||||||
| Carrizo Oil & Gas, Inc.* | 12,100 | 296,329 | ||||||
| Clayton Williams Energy, Inc.* | 14,400 | 433,728 | ||||||
| Gulfport Energy Corp.* | 81,500 | 712,310 | ||||||
| Stone Energy Corp.* | 54,400 | 887,264 | ||||||
| 2,329,631 | ||||||||
| Oil Field Machine & Equipment - 1.3% | ||||||||
| Gulf Island Fabrication, Inc. | 16,100 | 301,714 | ||||||
| T-3 Energy Services, Inc.* | 23,800 | 468,860 | ||||||
| 770,574 | ||||||||
| Oil-Field Services - 1.6% | ||||||||
| Hornbeck Offshore Services, Inc.* | 19,200 | 529,152 | ||||||
| Trico Marine Services, Inc.* | 52,900 | 408,388 | ||||||
| 937,540 | ||||||||
| Paper & Related Products - 2.9% | ||||||||
| Boise, Inc.* | 159,800 | 843,744 | ||||||
| Clearwater Paper Corp.* | 11,500 | 475,295 | ||||||
| KapStone Paper & Packaging Corp.* | 45,400 | 369,556 | ||||||
| 1,688,595 | ||||||||
| Pharmacy Services - 1.6% | ||||||||
| BioScrip, Inc.* | 68,500 | 463,060 | ||||||
| Clarient, Inc.* | 106,000 | 446,260 | ||||||
| 909,320 | ||||||||
| Physical Practice Management - 1.6% | ||||||||
| American Dental Partners, Inc.* | 33,400 | 467,600 | ||||||
| IPC The Hospitalist Co., Inc.* | 14,800 | 465,460 | ||||||
| 933,060 | ||||||||
| Property/Casualty Insurance - 1.0% | ||||||||
| Meadowbrook Insurance Group, Inc. | 79,000 | 584,600 | ||||||
| Recycling - 1.0% | ||||||||
| Metalico, Inc.* | 137,500 | 573,375 | ||||||
| Retail-Automobile - 0.8% | ||||||||
| America’s Car-Mart, Inc.* | 19,500 | 467,025 | ||||||
| Retail-Restaurants - 3.4% | ||||||||
| AFC Enterprises, Inc.* | 54,300 | 457,206 | ||||||
| Caribou Coffee Co., Inc.* | 56,700 | 409,374 | ||||||
| Carrols Restaurant Group, Inc.* | 53,200 | 402,192 | ||||||
| Einstein Noah Restaurant Group, Inc.* | 39,500 | 475,580 | ||||||
| O’Charleys, Inc.* | 22,700 | 212,699 | ||||||
| 1,957,051 | ||||||||
| Retail-Sporting Goods - 0.9% | ||||||||
| Big 5 Sporting Goods Corp. | 32,400 | 489,240 | ||||||
| Satellite Telecommunications - 1.1% | ||||||||
| Hughes Communications, Inc.* | 20,200 | 612,868 | ||||||
| Semiconductor Components-Integrated Circuits - 3.9% | ||||||||
| Anadigics, Inc.* | 89,900 | 423,429 | ||||||
| Cirrus Logic, Inc.* | 82,700 | 459,812 | ||||||
| O2Micro International, Ltd. - ADR* | 80,170 | 420,893 | ||||||
| Pericom Semiconductor Corp.* | 35,700 | 350,217 | ||||||
| Techwell, Inc.* | 52,700 | 578,646 | ||||||
| 2,232,997 | ||||||||
| Semiconductor Equipment - 0.3% | ||||||||
| Nanometrics, Inc.* | 23,500 | 154,395 | ||||||
| Steel-Producers - 1.0% | ||||||||
| Olympic Steel, Inc. | 20,400 | 585,276 | ||||||
| Telecommunication Equipment - 0.8% | ||||||||
| Anaren, Inc.* | 26,300 | 447,100 | ||||||
| Textile-Apparel - 1.2% | ||||||||
| Perry Ellis International, Inc.* | 43,100 | 691,324 | ||||||
| Therapeutics - 0.4% | ||||||||
| Inspire Pharmaceuticals, Inc.* | 41,600 | 217,152 | ||||||
| Transactional Software - 0.8% | ||||||||
| Bottomline Technologies, Inc.* | 35,700 | 460,530 | ||||||
| Transport-Air Freight - 0.7% | ||||||||
| Atlas Air Worldwide Holdings, Inc.* | 12,700 | 406,019 | ||||||
| Transport-Marine - 1.5% | ||||||||
| Safe Bulkers, Inc. | 62,300 | 505,876 | ||||||
| Star Bulk Carriers Corp. | 98,200 | 341,736 | ||||||
| 847,612 | ||||||||
| Transport-Services - 0.7% | ||||||||
| Vitran Corp., Inc.* | 41,700 | 376,134 | ||||||
| Transport-Truck - 0.7% | ||||||||
| Saia, Inc.* | 26,200 | 421,296 | ||||||
See Accompanying Notes to Financial Statements.
7
U.S. MICRO CAP FUND
SCHEDULE OF INVESTMENTS (Unaudited)
As of September 30, 2009
| Number of | ||||||||
| Shares | Value | |||||||
| Water Treatment Systems - 0.9% | ||||||||
| RINO International Corp.* | 23,800 | $ | 503,132 | |||||
| Web Hosting/Design - 0.9% | ||||||||
| Terremark Worldwide, Inc.* | 81,900 | 509,418 | ||||||
| Wire & Cable Products - 0.8% | ||||||||
| Fushi Copperweld, Inc.* | 56,000 | 473,760 | ||||||
| Total Common Stock (Cost: $44,950,480) | 56,039,966 | |||||||
| Principal | ||||||||
| Amount | ||||||||
| Short Term Investments - 1.9% | ||||||||
| Time Deposit - 1.9% | ||||||||
| Citibank London 0.030%, 10/01/09 | ||||||||
| (Cost: $1,121,915) | $ | 1,121,915 | 1,121,915 | |||||
| Total Investments - 99.8% (Cost: $46,072,395) | 57,161,881 | |||||||
| Other Assets in Excess of Liabilities - 0.2% | 101,250 | |||||||
| Net Assets - 100.0% | $ | 57,263,131 | ||||||
| * Non-income producing securities. | ||
| ADR - American Depository Receipt |
SCHEDULE OF INVESTMENTS BY SECTOR | ||||
| as of September 30, 2009 | ||||
| Percent of | ||||
| Sector | Net Assets | |||
| Consumer, Non-cyclical | 25.2 | % | ||
| Technology | 19.9 | |||
| Industrial | 12.5 | |||
| Consumer, Cyclical | 11.9 | |||
| Basic Materials | 9.0 | |||
| Communications | 9.0 | |||
| Energy | 7.7 | |||
| Financial | 2.7 | |||
| Short Term Investments | 1.9 | |||
| Total Investments | 99.8 | |||
| Other assets in excess of liabilities | 0.2 | |||
| Net Assets | 100.0 | % | ||
See Accompanying Notes to Financial Statements.
8
U.S. EMERGING GROWTH FUND
Management Team: John C. McCraw, Portfolio Manager; Robert S. Marren, Portfolio Manager
Chief Investment Officer: Horacio A. Valeiras, CFA
Goal: The U.S. Emerging Growth Fund seeks to maximize long-term capital appreciation through investments primarily in U.S. companies with market capitalizations similar to the Russell 2000 Growth Index at time of purchase.
Market Overview: U.S. equities registered substantial gains during the six months ended September 30, 2009. Signs that the worst of the recession had passed helped lift stocks higher across sectors, styles and capitalization ranges. Small-cap stocks did especially well, supported by strong inflows into small-cap funds.
The credit markets thawed considerably, thanks in large part to the aggressive actions taken by the Treasury and Federal Reserve last fall and winter. As confidence in the financial system grew, companies had easier and cheaper access to credit. They took advantage of the more favorable conditions, issuing approximately $700 billion of debt in the first nine months of 2009 — a 38% increase over the same period the previous year.
Households seemed more intent on paring back borrowing and spending, and consumer credit fell by a record $21.5 billion in July. A driving force behind the decline was the rising unemployment rate, which reached a twenty-six year high. However, unemployment is a lagging indicator, and less backward-looking statistics suggested that the economy was on the mend. New home sales picked up, industrial production increased and second-quarter GDP contracted at a better-than-expected 0.7% annual rate. As the period drew to a close — almost exactly one year after the credit crisis had erupted — economists were expecting that GDP would grow by approximately 3% in the third quarter.
Performance: During the six months ended September 30, 2009, the Fund’s Class I shares gained 57.06%, outperforming the 43.06% increase in the Russell 2000 Growth Index.
Portfolio Specifics: The Fund’s outperformance was due to stock selection, which added value in nearly every sector. Stock selection was strongest in energy, where top-performing holdings included Massey Energy and Helix Energy Solutions. Massey, a coal producer, is seeing strong demand from India, which is increasing its steelmaking capacity. Helix, a diversified energy firm, benefited from an improved liquidity position and favorable production outlook. Stock selection was also especially strong in the information technology, industrials and materials sectors. For example, TriQuint Semiconductor was another top performer in the Fund. The company makes radio frequency modules used in wireless handsets and is winning business in the fast-growing smartphone market.
Areas of relative weakness included stock selection in the health care sector. One notable detractor was a medical device manufacturer facing lower payments from insurance companies.
Market Outlook: While it is widely believed that the recession is over, we think that the economic recovery will be muted due to the high unemployment rate and large federal deficit. That said, several factors could fuel additional gains in the stock market over the months ahead, including:
• Expectations for a strong rebound in corporate earnings in 2010
• Potential for investors to move some of the $3.4 trillion sitting in low-yielding money market funds into equities
• Indications from the Fed that it plans to keep interest rates low for an extended period of time
By consistently applying our bottom-up investment process in this environment, we believe we will continue to add value to the benchmark.
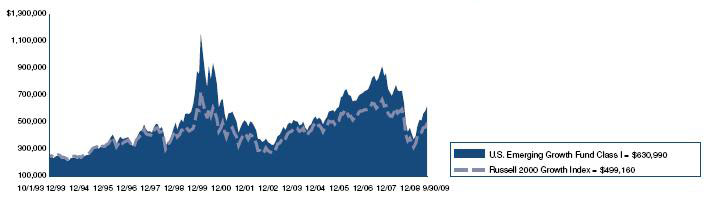
Comparison of Change in Value of a $250,000 Investment in U.S. Emerging Growth Fund Class I Shares with the Russell 2000 Growth Index.
Annualized Total Returns As of 9/30/09 | |||
| 1 Year | 5 Years | 10 Years | |
| U.S. Emerging Growth Fund Class I | –2.54% | 5.78% | 0.81% |
| Russell 2000 Growth Index | –6.32% | 2.91% | 1.10% |
The graph above shows the value of a hypothetical $250,000 investment in the Fund’s Class I shares compared with the Russell 2000 Growth Index for the periods indicated. The Fund calculates performance based upon the historical performance of a corresponding series of Nicholas-Applegate Mutual Funds (renamed ING Mutual Funds), adjusted to reflect all fees and expenses applicable to Class I shares. The Nicholas-Applegate Institutional Funds’ Class I shares were first available on May 7, 1999. Average annual total return figures include changes in principal value, reinvested dividends, and capital gain distributions. The total returns shown above do not show the effects of income taxes on an individual’s investment. In most cases, taxes may reduce your actual investment returns on income or gains paid by the Fund or any gains you may realize if you sell your shares. Past performance cannot guarantee future results.
The Russell 2000 Growth Index is an unmanaged index comprised of those Russell 2000 companies with higher price-to-book ratios and higher forecasted growth values. The Russell 2000 Index is an unmanaged index generally representative of the 2,000 smallest companies in the Russell 3000 Index, which represents approximately 10% of the total market capitalization of the Russell 3000 Index. Index returns include reinvestment of dividends. Unless otherwise noted, index returns reflect the reinvestment of income dividends and capital gains, if any, but do not reflect fees, brokerage commissions or other expense of investing. One cannot invest directly in an index.
Since markets can go down as well as up, investment returns and principal value will fluctuate with market conditions. You may have a gain or loss when you sell your shares
9
U.S. EMERGING GROWTH FUND
SCHEDULE OF INVESTMENTS (Unaudited)
As of September 30, 2009
| Number of | ||||||||
| Shares | Value | |||||||
| Common Stock - 96.8% | ||||||||
| Aerospace/Defense - 0.5% | ||||||||
| Cubic Corp. | 2,000 | $ | 78,940 | |||||
| Aerospace/Defense-Equipment - 1.3% | ||||||||
| AAR Corp.* | 4,900 | 107,506 | ||||||
| BE Aerospace, Inc.* | 5,400 | 108,756 | ||||||
| 216,262 | ||||||||
| Agricultural Operations - 0.7% | ||||||||
| The Andersons, Inc. | 3,300 | 116,160 | ||||||
| Airlines - 0.5% | ||||||||
| Hawaiian Holdings, Inc.* | 9,700 | 80,122 | ||||||
| Apparel Manufacturers - 1.8% | ||||||||
| Carter’s, Inc.* | 3,600 | 96,120 | ||||||
| Jones Apparel Group, Inc. | 6,400 | 114,752 | ||||||
| Quiksilver, Inc.* | 32,300 | 88,825 | ||||||
| 299,697 | ||||||||
| Applications Software - 1.5% | ||||||||
| Compuware Corp.* | 11,500 | 84,295 | ||||||
| Ebix, Inc.* | 3,100 | 171,616 | ||||||
| 255,911 | ||||||||
| Auto/Truck Parts & Equipment-Original - 1.6% | ||||||||
| American Axle & Manufacturing | ||||||||
| Holdings, Inc.* | 15,200 | 107,616 | ||||||
| ArvinMeritor, Inc.* | 11,600 | 90,712 | ||||||
| Titan International, Inc. | 9,200 | 81,880 | ||||||
| 280,208 | ||||||||
| Batteries/Battery Systems - 0.5% | ||||||||
| Greatbatch, Inc.* | 4,100 | 92,127 | ||||||
| Beverages-Wine/Spirits - 0.5% | ||||||||
| Central European Distribution Corp.* | 2,400 | 78,624 | ||||||
| Broadcast Services/Programming - 1.1% | ||||||||
| DG FastChannel, Inc.* | 3,600 | 75,384 | ||||||
| Liberty Media Corp. - Capital* | 5,600 | 117,152 | ||||||
| 192,536 | ||||||||
| Building-Heavy Construction - 1.8% | ||||||||
| Chicago Bridge & Iron Co. Cl. Y* | 5,900 | 110,212 | ||||||
| Orion Marine Group, Inc.* | 4,700 | 96,538 | ||||||
| Tutor Perini Corp.* | 5,000 | 106,500 | ||||||
| 313,250 | ||||||||
| Casino Services - 0.7% | ||||||||
| Bally Technologies, Inc.* | 2,900 | 111,273 | ||||||
| Chemicals-Specialty - 0.7% | ||||||||
| Ashland, Inc. | 2,900 | 125,338 | ||||||
| Coal - 0.6% | ||||||||
| James River Coal Co.* | 5,600 | 107,016 | ||||||
| Commercial Banks-Central US - 0.7% | ||||||||
| MB Financial, Inc. | 5,500 | 115,335 | ||||||
| Commercial Services - 1.3% | ||||||||
| AerCap Holdings NV* | 12,200 | 110,654 | ||||||
| DynCorp International, Inc. Cl. A* | 5,700 | 102,600 | ||||||
| 213,254 | ||||||||
| Commercial Services-Finance - 3.8% | ||||||||
| Coinstar, Inc.* | 3,100 | 102,238 | ||||||
| Deluxe Corp. | 6,100 | 104,310 | ||||||
| Dollar Financial Corp.* | 6,000 | 96,120 | ||||||
| Global Cash Access Holdings, Inc.* | 9,700 | 70,907 | ||||||
| Net 1 UEPS Technologies, Inc.* | 4,400 | 92,224 | ||||||
| TNS, Inc.* | 3,700 | 101,380 | ||||||
| Wright Express Corp.* | 2,600 | 76,726 | ||||||
| 643,905 | ||||||||
| Computer Aided Design - 0.4% | ||||||||
| Parametric Technology Corp.* | 4,800 | 66,336 | ||||||
| Computers-Integrated Systems - 0.6% | ||||||||
| Netscout Systems, Inc.* | 7,800 | 105,378 | ||||||
| Computers-Memory Devices - 0.4% | ||||||||
| STEC, Inc.* | 2,500 | 73,475 | ||||||
| Consumer Products-Miscellaneous - 1.6% | ||||||||
| Jarden Corp. | 5,400 | 151,578 | ||||||
| Tupperware Brands Corp. | 3,100 | 123,752 | ||||||
| 275,330 | ||||||||
| Containers-Metal/Glass - 0.7% | ||||||||
| Greif, Inc. Cl. A | 2,300 | 126,615 | ||||||
| Containers-Paper/Plastic - 0.8% | ||||||||
| Rock-Tenn Co. Cl. A | 2,800 | 131,908 | ||||||
| Disposable Medical Products - 0.5% | ||||||||
| Merit Medical Systems, Inc.* | 5,200 | 90,116 | ||||||
| Distribution/Wholesale - 0.7% | ||||||||
| Brightpoint, Inc.* | 14,200 | 124,250 | ||||||
| Diversified Manufacturing Operations - 0.6% | ||||||||
| Koppers Holdings, Inc. | 3,400 | 100,810 | ||||||
| Diversified Operations - 0.3% | ||||||||
| Compass Diversified Holdings | 5,200 | 54,444 | ||||||
| Drug Delivery Systems - 0.9% | ||||||||
| Nektar Therapeutics* | 16,400 | 159,736 | ||||||
| E-Commerce/Services - 0.5% | ||||||||
| IAC/InterActiveCorp* | 4,300 | 86,817 | ||||||
| Electric Products-Miscellaneous - 0.6% | ||||||||
| GrafTech International, Ltd.* | 6,600 | 97,020 | ||||||
| Electronic Components-Miscellaneous - 0.7% | ||||||||
| Sanmina-SCI Corp.* | 14,600 | 125,560 | ||||||
| Electronic Components-Semiconductors - 3.1% | ||||||||
| Amkor Technology, Inc.* | 16,800 | 115,584 | ||||||
| Fairchild Semiconductor | ||||||||
| International, Inc. Cl. A* | 10,300 | 105,369 | ||||||
| Omnivision Technologies, Inc.* | 6,600 | 107,448 | ||||||
| Rovi Corp.* | 3,100 | 104,160 | ||||||
| Skyworks Solutions, Inc.* | 7,800 | 103,272 | ||||||
| 535,833 | ||||||||
| Electronic Design Automations - 0.8% | ||||||||
| Mentor Graphics Corp.* | 14,000 | 130,340 | ||||||
| Enterprise Software/Services - 2.7% | ||||||||
| Informatica Corp.* | 4,200 | 94,836 | ||||||
| JDA Software Group, Inc.* | 5,000 | 109,700 | ||||||
| Lawson Software, Inc.* | 12,800 | 79,872 | ||||||
| Mantech International Corp. Cl. A* | 1,500 | 70,740 | ||||||
| Taleo Corp. Cl. A* | 4,600 | 104,144 | ||||||
| 459,292 | ||||||||
| Entertainment Software - 0.5% | ||||||||
| Take-Two Interactive Software, Inc.* | 7,100 | 79,591 | ||||||
See Accompanying Notes to Financial Statements.
10
SCHEDULE OF INVESTMENTS (Unaudited)
| As of September 30, 2009 | ||||||||
| Number of | ||||||||
| Shares | Value | |||||||
| Finance-Consumer Loans - 1.2% | ||||||||
| Ocwen Financial Corp.* | 7,800 | $ | 88,296 | |||||
| Portfolio Recovery Associates, Inc.* | 2,400 | 108,792 | ||||||
| 197,088 | ||||||||
| Finance-Investment Bankers/Brokers - 0.6% | ||||||||
| MF Global, Ltd.* | 13,900 | 101,053 | ||||||
| Food-Canned - 0.7% | ||||||||
| Seneca Foods Corp. Cl. A* | 4,200 | 115,080 | ||||||
| Food-Miscellaneous/Diversified - 1.1% | ||||||||
| Lance, Inc. | 3,400 | 87,788 | ||||||
| M&F Worldwide Corp.* | 4,800 | 97,152 | ||||||
| 184,940 | ||||||||
| Footwear & Related Apparel - 1.0% | ||||||||
| Deckers Outdoor Corp.* | 1,300 | 110,305 | ||||||
| Iconix Brand Group, Inc.* | 5,200 | 64,844 | ||||||
| 175,149 | ||||||||
| Hospital Beds/Equipment - 0.7% | ||||||||
| Hill-Rom Holdings, Inc. | 5,200 | 113,256 | ||||||
| Human Resources - 0.6% | ||||||||
| Emergency Medical Services Corp. Cl. A* | 2,200 | 102,300 | ||||||
| Instruments-Scientific - 0.6% | ||||||||
| FEI Co.* | 4,200 | 103,530 | ||||||
| Insurance Brokers - 0.6% | ||||||||
| CNinsure, Inc. - ADR | 4,300 | 98,728 | ||||||
| Internet Applications Software - 0.5% | ||||||||
| Cybersource Corp.* | 5,600 | 93,352 | ||||||
| Internet Connectivity Services - 0.8% | ||||||||
| AboveNet, Inc.* | 2,800 | 136,528 | ||||||
| Internet Infrastructure Equipment - 0.7% | ||||||||
| Avocent Corp.* | 5,900 | 119,593 | ||||||
| Internet Infrastructure Software - 1.2% | ||||||||
| AsiaInfo Holdings, Inc.* | 5,200 | 103,844 | ||||||
| TeleCommunication Systems, Inc. Cl. A* | 12,000 | 100,320 | ||||||
| 204,164 | ||||||||
| Intimate Apparel - 0.7% | ||||||||
| The Warnaco Group, Inc.* | 2,600 | 114,036 | ||||||
| Life/Health Insurance - 0.6% | ||||||||
| Delphi Financial Group, Inc. Cl. A | 4,800 | 108,624 | ||||||
| Machinery-Construction & Mining - 0.5% | ||||||||
| Bucyrus International, Inc. Cl. A | 2,300 | 81,926 | ||||||
| Machinery-General Industry - 0.8% | ||||||||
| Albany International Corp. Cl. A | 7,300 | 141,620 | ||||||
| Marine Services - 0.8% | ||||||||
| Aegean Marine Petroleum Network, Inc. | 5,700 | 128,250 | ||||||
| Medical Instruments - 0.5% | ||||||||
| NuVasive, Inc.* | 2,000 | 83,520 | ||||||
| Medical Labs & Testing Services - 0.4% | ||||||||
| Bio-Reference Labs, Inc.* | 1,800 | 61,920 | ||||||
| Medical Products - 3.6% | ||||||||
| Exactech, Inc.* | 4,700 | 73,978 | ||||||
| Haemonetics Corp.* | 1,500 | 84,180 | ||||||
| Hanger Orthopedic Group, Inc.* | 7,900 | 109,573 | ||||||
| Invacare Corp. | 4,600 | 102,488 | ||||||
| Orthofix International NV* | 4,100 | 120,499 | ||||||
| PSS World Medical, Inc.* | 5,400 | 117,882 | ||||||
| 608,600 | ||||||||
| Medical Sterilize Product - 0.7% | ||||||||
| STERIS Corp. | 3,700 | 112,665 | ||||||
| Medical-Biomedical/Genetics - 2.7% | ||||||||
| Human Genome Sciences, Inc.* | 5,400 | 101,628 | ||||||
| Incyte Corp., Ltd.* | 12,200 | 82,350 | ||||||
| Martek Biosciences Corp.* | 2,900 | 65,511 | ||||||
| Regeneron Pharmaceuticals, Inc.* | 4,200 | 81,060 | ||||||
| Seattle Genetics, Inc.* | 9,800 | 137,494 | ||||||
| 468,043 | ||||||||
| Medical-Drugs - 1.0% | ||||||||
| Eurand NV* | 6,000 | 90,840 | ||||||
| Hi-Tech Pharmacal Co., Inc.* | 3,800 | 85,272 | ||||||
| 176,112 | ||||||||
| Medical-HMO - 0.5% | ||||||||
| WellCare Health Plans, Inc.* | 3,800 | 93,670 | ||||||
| Medical-Outpatient/Home Medical Care - 0.5% | ||||||||
| Almost Family, Inc.* | 2,700 | 80,325 | ||||||
| Metal-Aluminum - 0.4% | ||||||||
| Century Aluminum Co.* | 7,900 | 73,865 | ||||||
| Multi-line Insurance - 0.8% | ||||||||
| Unitrin, Inc. | 6,900 | 134,481 | ||||||
| Oil & Gas Drilling - 1.2% | ||||||||
| Atlas Energy, Inc. | 4,000 | 108,280 | ||||||
| Atwood Oceanics, Inc.* | 2,700 | 95,229 | ||||||
| 203,509 | ||||||||
| Oil Companies-Exploration & Production - 3.5% | ||||||||
| ATP Oil & Gas Corp.* | 8,400 | 150,276 | ||||||
| Berry Petroleum Co. Cl. A | 3,700 | 99,086 | ||||||
| Gran Tierra Energy, Inc.* | 21,300 | 88,608 | ||||||
| Mariner Energy, Inc.* | 6,200 | 87,916 | ||||||
| Stone Energy Corp.* | 8,500 | 138,635 | ||||||
| W&T Offshore, Inc. | 2,600 | 30,446 | ||||||
| 594,967 | ||||||||
| Oil-Field Services - 3.0% | ||||||||
| Global Industries, Ltd.* | 13,100 | 124,450 | ||||||
| Helix Energy Solutions Group, Inc.* | 7,500 | 112,350 | ||||||
| Hercules Offshore, Inc.* | 13,300 | 65,303 | ||||||
| Hornbeck Offshore Services, Inc.* | 3,800 | 104,728 | ||||||
| Tetra Technologies, Inc.* | 10,500 | 101,745 | ||||||
| 508,576 | ||||||||
| Paper & Related Products - 3.0% | ||||||||
| Boise, Inc.* | 34,000 | 179,520 | ||||||
| Clearwater Paper Corp.* | 3,100 | 128,123 | ||||||
| Domtar Corp.* | 3,500 | 123,270 | ||||||
| Schweitzer-Mauduit International, Inc. | 1,600 | 86,976 | ||||||
| 517,889 | ||||||||
| Pharmacy Services - 0.5% | ||||||||
| Catalyst Health Solutions, Inc.* | 2,800 | 81,620 | ||||||
| Physical Practice Management - 0.6% | ||||||||
| IPC The Hospitalist Co., Inc.* | 3,100 | 97,495 | ||||||
| Physical Therapy/Rehabilitation Centers - 0.5% | ||||||||
| RehabCare Group, Inc.* | 4,200 | 91,098 | ||||||
| Property/Casualty Insurance - 0.6% | ||||||||
| Amtrust Financial Services, Inc. | 8,900 | 101,549 | ||||||
See Accompanying Notes to Financial Statements.
11
U.S. EMERGING GROWTH FUND
SCHEDULE OF INVESTMENTS (Unaudited)
As of September 30, 2009
| Number of | ||||||||
| Shares | Value | |||||||
| Publishing-Books - 0.6% | ||||||||
| Scholastic Corp. | 4,000 | $ | 97,360 | |||||
| Real Estate Management/Service - 1.2% | ||||||||
| E-House China Holdings, Ltd. - ADR* | 5,300 | 113,208 | ||||||
| Jones Lang LaSalle, Inc. | 2,000 | 94,740 | ||||||
| 207,948 | ||||||||
| Recreational Centers - 0.7% | ||||||||
| Life Time Fitness, Inc.* | 4,000 | 112,200 | ||||||
| Reinsurance - 0.5% | ||||||||
| Maiden Holdings, Ltd. | 12,500 | 90,875 | ||||||
| Rental Auto/Equipment - 0.8% | ||||||||
| United Rentals, Inc.* | 13,500 | 139,050 | ||||||
| Retail-Apparel/Shoe - 4.6% | ||||||||
| AnnTaylor Stores Corp.* | 8,200 | 130,298 | ||||||
| Collective Brands, Inc.* | 6,200 | 107,446 | ||||||
| Genesco, Inc.* | 4,800 | 115,536 | ||||||
| Guess ?, Inc. | 2,600 | 96,304 | ||||||
| Hanesbrands, Inc.* | 5,000 | 107,000 | ||||||
| Phillips-Van Heusen Corp. | 2,700 | 115,533 | ||||||
| The Finish Line, Inc. Cl. A | 10,600 | 107,696 | ||||||
| 779,813 | ||||||||
| Retail-Office Supplies - 0.7% | ||||||||
| OfficeMax, Inc.* | 9,100 | 114,478 | ||||||
| Retail-Perfume & Cosmetics - 0.5% | ||||||||
| Sally Beauty Holdings, Inc.* | 12,200 | 86,742 | ||||||
| Retail-Restaurants - 1.4% | ||||||||
| Buffalo Wild Wings, Inc.* | 1,800 | 74,898 | ||||||
| CKE Restaurants, Inc. | 8,400 | 88,116 | ||||||
| Cracker Barrel Old Country Store, Inc. | 2,400 | 82,560 | ||||||
| 245,574 | ||||||||
| Retail-Sporting Goods - 0.5% | ||||||||
| Big 5 Sporting Goods Corp. | 5,300 | 80,030 | ||||||
| Rubber-Tires - 0.8% | ||||||||
| Cooper Tire & Rubber Co. | 7,300 | 128,334 | ||||||
| Satellite Telecommunications - 0.6% | ||||||||
| GeoEye, Inc.* | 3,800 | 101,840 | ||||||
| Semiconductor Components-Integrated Circuits - 2.7% | ||||||||
| Cirrus Logic, Inc.* | 18,000 | 100,080 | ||||||
| Himax Technologies, Inc. - ADR | 23,000 | 76,590 | ||||||
| Integrated Device Technology, Inc.* | 14,300 | 96,668 | ||||||
| Pericom Semiconductor Corp.* | 9,400 | 92,214 | ||||||
| TriQuint Semiconductor, Inc.* | 13,400 | 103,448 | ||||||
| 469,000 | ||||||||
| Semiconductor Equipment - 0.5% | ||||||||
| Tessera Technologies, Inc.* | 2,900 | 80,881 | ||||||
| Telecommunication Equipment - 0.9% | ||||||||
| ADC Telecommunications, Inc.* | 11,100 | 92,574 | ||||||
| CommScope, Inc.* | 2,300 | 68,839 | ||||||
| 161,413 | ||||||||
| Telecommunication Equipment-Fiber Optics - 0.5% | ||||||||
| Finisar Corp.* | 9,400 | 90,992 | ||||||
| Therapeutics - 0.4% | ||||||||
| Onyx Pharmaceuticals, Inc.* | 2,500 | 74,925 | ||||||
| Transactional Software - 0.6% | ||||||||
| Solera Holdings, Inc. | 3,400 | 105,774 | ||||||
| Transport-Air Freight - 0.8% | ||||||||
| Atlas Air Worldwide Holdings, Inc.* | 4,200 | 134,274 | ||||||
| Transport-Marine - 0.7% | ||||||||
| Genco Shipping & Trading, Ltd.* | 5,800 | 120,524 | ||||||
| Transport-Rail - 0.5% | ||||||||
| Kansas City Southern* | 3,400 | 90,066 | ||||||
| Transport-Truck - 0.5% | ||||||||
| Saia, Inc.* | 4,800 | 77,184 | ||||||
| Web Portals/ISP - 0.5% | ||||||||
| United Online, Inc. | 11,600 | 93,264 | ||||||
| Wire & Cable Products - 0.5% | ||||||||
| Fushi Copperweld, Inc.* | 10,800 | 91,368 | ||||||
| Wireless Equipment - 1.1% | ||||||||
| InterDigital, Inc.* | 3,600 | 83,376 | ||||||
| RF Micro Devices, Inc.* | 18,200 | 98,826 | ||||||
| 182,202 | ||||||||
| Total Common Stock (Cost: $13,339,096) | 16,508,041 | |||||||
| Limited Partnerships - 0.6% | ||||||||
| Pipelines - 0.6% | ||||||||
| Targa Resources Partners LP | ||||||||
| (Cost $78,695) | 5,600 | 105,056 | ||||||
| Principal | ||||||||
| Amount | ||||||||
| Short Term Investments - 3.2% | ||||||||
| Time Deposit - 3.2% | ||||||||
| Citibank Nassau 0.030%, 10/01/09 | ||||||||
| (Cost: $544,711) | $ | 544,711 | 544,711 | |||||
| Total Investments - 100.6% (Cost: $13,962,502) | 17,157,808 | |||||||
| Liabilities in Excess of Other Assets - (0.6%) | (95,199 | ) | ||||||
| Net Assets - 100.0% | $ | 17,062,609 | ||||||
| * Non-income producing securities. | ||
| ADR - American Depository Receipt |
SCHEDULE OF INVESTMENTS BY SECTOR | ||||
| as of September 30, 2009 | ||||
| Percent of | ||||
| Sector | Net Assets | |||
| Consumer, Non-cyclical | 25.9 | % | ||
| Consumer, Cyclical | 16.2 | |||
| Technology | 13.8 | |||
| Industrial | 12.4 | |||
| Communications | 9.0 | |||
| Energy | 8.9 | |||
| Financial | 6.8 | |||
| Basic Materials | 4.1 | |||
| Diversified | 0.3 | |||
| Short Term Investments | 3.2 | |||
| Total Investments | 100.6 | |||
| Liabilities in excess of other assets | (0.6 | ) | ||
| Net Assets | 100.0 | % | ||
See Accompanying Notes to Financial Statements.
12
U.S. SMALL TO MID CAP GROWTH FUND
Management Team: John C. McCraw, Portfolio Manager; Robert S. Marren, Portfolio Manager
Chief Investment Officer: Horacio A. Valeiras, CFA
Goal: The U.S. Small to Mid Cap Growth Fund seeks to maximize long-term capital appreciation by investing primarily in stocks from a universe of U.S. companies with small to mid (SMID) market capitalizations similar to the Russell 2500 Growth Index at time of purchase.
Market Overview: The rally in the U.S. equity market that began in March continued throughout the six months ended September 30, 2009. The rebound was broad-based, although small- and mid-caps outpaced large caps and value stocks beat growth stocks. The outperformance of value stocks was driven by the strong performance of financials, which have a higher weight in the value indexes.
Some of the key factors fueling the market’s gains were:
| • | Recovery in the credit markets, illustrated by the 9.1% narrowing in spreads between yields on Treasury securities and high-yield bonds |
| • | Evidence that the economy was coming out of the recession, including the first expansion in manufacturing activity in 19 months |
| • | Better-than-expected earnings for mid- and large-cap stocks, albeit off low expectations |
Within the small- and mid-cap growth segment of the market, as measured by the Russell 2500 Growth Index, every sector posted a substantial gain. Energy stocks delivered the best results, supported by a 42% increase in the price of oil. Information technology was the second-best performing sector. Tech firms receive a relatively large percentage of revenues from abroad, and are benefiting from foreign growth prospects, the decline in the U.S. dollar and global inventory restocking.
Performance: The Fund’s Class I shares gained 48.52% from April 1 to September 30, 2009. The Fund outperformed the Russell 2500 Growth Index, which rose 42.70%.
Portfolio Specifics: Consistent with our bottom-up investment process, the Fund’s outperformance was due to stock selection. Stock selection was particularly strong in the information technology, energy and materials sectors. Top-performing positions included STEC, a supplier of data storage devices that has posted healthy revenue growth throughout the recession; Global Industries, an offshore oilfield construction firm demonstrating good cost control; and Ashland, a diversified chemical and transportation company with significant free cash flow. Tupperware Brands, a direct seller of household products, was another strong performer. Tupperware benefited from a positive growth outlook, especially in emerging markets where it derives 50% of its revenues.
The primary area of relative weakness was stock selection in the health care sector, where a biotech firm that missed sales expectations detracted.
Market Outlook: While it is widely believed that the recession is over, we think that the economic recovery will be muted due to the high unemployment rate and large federal deficit. That said, several factors could fuel additional gains in the stock market over the months ahead, including:
| • | Expectations for a strong rebound in corporate earnings in 2010 |
| • | Potential for investors to move some of the $3.4 trillion sitting in low-yielding money market funds into equities |
| • | Indications from the Fed that it plans to keep interest rates low for an extended period of time |
As events unfold, we are confident that our research-driven approach will continue to identify interesting growth companies to own in the Fund.
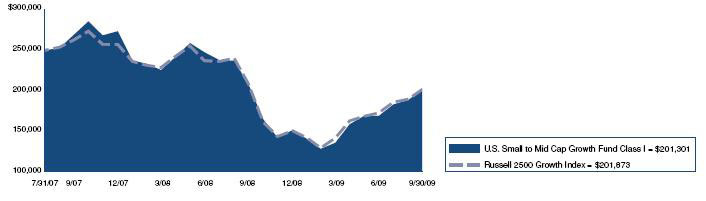
Comparison of Change in Value of a $250,000 Investment in U.S. Small to Mid Cap Growth Fund Class I Shares with the Russell 2500 Growth Index.
Annualized Total Returns As of 9/30/09 | ||
| Since | ||
| 1 Year | Inception | |
| U.S. Small to Mid Cap Growth | ||
| Fund Class I | –3.13% | –9.51% |
| Russell 2500 Growth Index | –3.08% | –9.40% |
The graph above shows the value of a hypothetical $250,000 investment in the Fund’s Class I shares with the Russell 2500 Growth Index for the periods indicated. Average annual total return figures include changes in principal value, reinvested dividends, and capital gain distributions. The Class I shares commenced operations on July 31, 2007. The total returns shown above do not show the effects of income taxes on an individuals’ investment. In most cases, taxes may reduce your actual investment returns on income or gains paid by the Fund or any gains you may realize if you sell your shares. Past performance cannot guarantee future results.
The Russell 2500 Growth Index is an unmanaged index comprised of those Russell 2500 companies with higher price-to-book ratios and higher forecasted growth values. The Russell 2500 Index is an unmanaged index generally representative of the 2,500 smallest companies in the Russell 3000 Index, which represents approximately 10% of the total market capitalization of the Russell 3000 Index. Unless otherwise noted, index returns reflect the reinvestment of income, dividends and capital gains, if any, but do not reflect fees, brokerage commissions or other expenses of investing.
Investors may not make direct investments into any index. Since markets can go down as well as up, investment return and principal value will fluctuate with market conditions. You may have a gain or loss when you sell shares.
13
U.S. SMALL TO MID CAP GROWTH FUND
SCHEDULE OF INVESTMENTS (Unaudited)
As of September 30, 2009
| Number of | ||||||||
| Shares | Value | |||||||
| Common Stock - 98.4% | ||||||||
| Agricultural Operations - 0.6% | ||||||||
| The Andersons, Inc. | 800 | $ | 28,160 | |||||
| Apparel Manufacturers - 1.2% | ||||||||
| Jones Apparel Group, Inc. | 1,700 | 30,481 | ||||||
| Quiksilver, Inc.* | 9,000 | 24,750 | ||||||
| 55,231 | ||||||||
| Applications Software - 4.1% | ||||||||
| China TransInfo Technology Corp.* | 4,300 | 40,678 | ||||||
| Compuware Corp.* | 4,230 | 31,006 | ||||||
| Ebix, Inc.* | 1,000 | 55,360 | ||||||
| Nuance Communications, Inc.* | 1,970 | 29,471 | ||||||
| Red Hat, Inc.* | 1,100 | 30,404 | ||||||
| 186,919 | ||||||||
| Auto/Truck Parts & Equipment-Original - 1.2% | ||||||||
| American Axle & Manufacturing | ||||||||
| Holdings, Inc.* | 3,700 | 26,196 | ||||||
| ArvinMeritor, Inc.* | 3,700 | 28,934 | ||||||
| 55,130 | ||||||||
| Auto-Medium & Heavy Duty Trucks - 0.4% | ||||||||
| Navistar International Corp.* | 500 | 18,710 | ||||||
| Batteries/Battery Systems - 0.7% | ||||||||
| Energizer Holdings, Inc.* | 500 | 33,170 | ||||||
| Broadcast Services/Programming - 2.0% | ||||||||
| Acacia Research - Acacia Technologies* | 3,800 | 33,098 | ||||||
| DG FastChannel, Inc.* | 1,300 | 27,222 | ||||||
| Liberty Media Corp. - Capital* | 1,600 | 33,472 | ||||||
| 93,792 | ||||||||
| Building-Heavy Construction - 0.6% | ||||||||
| Chicago Bridge & Iron Co. Cl. Y* | 1,600 | 29,888 | ||||||
| Casino Services - 0.7% | ||||||||
| Bally Technologies, Inc.* | 800 | 30,696 | ||||||
| Cellular Telecommunications - 0.6% | ||||||||
| Cellcom Israel, Ltd. | 900 | 27,387 | ||||||
| Chemicals-Specialty - 0.8% | ||||||||
| Ashland, Inc. | 900 | 38,898 | ||||||
| Coal - 1.8% | ||||||||
| James River Coal Co.* | 1,400 | 26,754 | ||||||
| Massey Energy Co. | 1,000 | 27,890 | ||||||
| Walter Energy, Inc. | 500 | 30,030 | ||||||
| 84,674 | ||||||||
| Commercial Services - 2.7% | ||||||||
| AerCap Holdings NV* | 3,800 | 34,466 | ||||||
| Alliance Data Systems Corp.* | 500 | 30,540 | ||||||
| DynCorp International, Inc. Cl. A* | 1,700 | 30,600 | ||||||
| StarTek, Inc.* | 3,500 | 30,380 | ||||||
| 125,986 | ||||||||
| Commercial Services-Finance - 3.4% | ||||||||
| Deluxe Corp. | 1,600 | 27,360 | ||||||
| Dollar Financial Corp.* | 2,000 | 32,040 | ||||||
| Global Cash Access Holdings, Inc.* | 3,200 | 23,392 | ||||||
| Net 1 UEPS Technologies, Inc.* | 1,200 | 25,152 | ||||||
| TNS, Inc.* | 1,100 | 30,140 | ||||||
| Wright Express Corp.* | 700 | 20,657 | ||||||
| 158,741 | ||||||||
| Computers-Memory Devices - 1.3% | ||||||||
| STEC, Inc.* | 700 | 20,573 | ||||||
| Xyratex, Ltd.* | 3,900 | 37,089 | ||||||
| 57,662 | ||||||||
| Consumer Products-Miscellaneous - 2.4% | ||||||||
| Jarden Corp. | 1,700 | 47,719 | ||||||
| Scotts Miracle-Gro Co. Cl. A | 700 | 30,065 | ||||||
| Tupperware Brands Corp. | 800 | 31,936 | ||||||
| 109,720 | ||||||||
| Containers-Metal/Glass - 0.8% | ||||||||
| Greif, Inc. Cl. A | 700 | 38,535 | ||||||
| Containers-Paper/Plastic - 0.7% | ||||||||
| Rock-Tenn Co. Cl. A | 710 | 33,448 | ||||||
| Diagnostic Kits - 0.7% | ||||||||
| Inverness Medical Innovations, Inc.* | 800 | 30,984 | ||||||
| Direct Marketing - 0.7% | ||||||||
| APAC Customer Services, Inc.* | 5,600 | 33,096 | ||||||
| Disposable Medical Products - 0.6% | ||||||||
| ICU Medical, Inc.* | 750 | 27,645 | ||||||
| Distribution/Wholesale - 0.8% | ||||||||
| Brightpoint, Inc.* | 4,200 | 36,750 | ||||||
| Diversified Manufacturing Operations - 1.3% | ||||||||
| Koppers Holdings, Inc. | 900 | 26,685 | ||||||
| Textron, Inc. | 1,700 | 32,266 | ||||||
| 58,951 | ||||||||
| E-Commerce/Services - 1.3% | ||||||||
| IAC/InterActiveCorp* | 1,400 | 28,266 | ||||||
| Liberty Media Corp. - Interactive* | 2,800 | 30,716 | ||||||
| 58,982 | ||||||||
| Electric Products-Miscellaneous - 0.6% | ||||||||
| GrafTech International, Ltd.* | 1,800 | 26,460 | ||||||
| Electronic Components-Miscellaneous - 0.7% | ||||||||
| Sanmina-SCI Corp.* | 3,900 | 33,540 | ||||||
| Electronic Components-Semiconductors - 3.2% | ||||||||
| Amkor Technology, Inc.* | 4,500 | 30,960 | ||||||
| Fairchild Semiconductor | ||||||||
| International, Inc. Cl. A* | 2,900 | 29,667 | ||||||
| LSI Corp.* | 5,210 | 28,603 | ||||||
| Rovi Corp.* | 970 | 32,592 | ||||||
| Skyworks Solutions, Inc.* | 1,940 | 25,686 | ||||||
| 147,508 | ||||||||
| Electronic Design Automations - 0.6% | ||||||||
| Mentor Graphics Corp.* | 3,000 | 27,930 | ||||||
| Engineering/R & D Services - 1.2% | ||||||||
| KBR, Inc. | 1,100 | 25,619 | ||||||
| McDermott International, Inc.* | 1,100 | 27,797 | ||||||
| 53,416 | ||||||||
| Enterprise Software/Services - 1.8% | ||||||||
| Informatica Corp.* | 1,300 | 29,354 | ||||||
| Mantech International Corp. Cl. A* | 450 | 21,222 | ||||||
| Sybase, Inc.* | 800 | 31,120 | ||||||
| 81,696 | ||||||||
| Finance-Consumer Loans - 1.3% | ||||||||
| Ocwen Financial Corp.* | 3,200 | 36,224 | ||||||
| Portfolio Recovery Associates, Inc.* | 550 | 24,932 | ||||||
| 61,156 | ||||||||
See Accompanying Notes to Financial Statements.
14
SCHEDULE OF INVESTMENTS (Unaudited)
| As of September 30, 2009 | ||||||||
| Number of | ||||||||
| Shares | Value | |||||||
| Finance-Investment Bankers/Brokers - 0.6% | ||||||||
| MF Global, Ltd.* | 3,800 | $ | 27,626 | |||||
| Food-Canned - 0.7% | ||||||||
| Seneca Foods Corp. Cl. A* | 1,200 | 32,880 | ||||||
| Food-Miscellaneous/Diversified - 1.3% | ||||||||
| Lance, Inc. | 1,200 | 30,984 | ||||||
| M&F Worldwide Corp.* | 1,500 | 30,360 | ||||||
| 61,344 | ||||||||
| Footwear & Related Apparel - 0.4% | ||||||||
| Iconix Brand Group, Inc.* | 1,600 | 19,952 | ||||||
| Home Decoration Products - 0.7% | ||||||||
| Newell Rubbermaid, Inc. | 2,100 | 32,949 | ||||||
| Hospital Beds/Equipment - 0.8% | ||||||||
| Hill-Rom Holdings, Inc. | 1,600 | 34,848 | ||||||
| Hotels & Motels - 0.6% | ||||||||
| Wyndham Worldwide Corp. | 1,700 | 27,744 | ||||||
| Insurance Brokers - 0.5% | ||||||||
| CNinsure, Inc. - ADR | 1,100 | 25,256 | ||||||
| Internet Applications Software - 0.6% | ||||||||
| Cybersource Corp.* | 1,650 | 27,506 | ||||||
| Internet Connectivity Services - 0.8% | ||||||||
| AboveNet, Inc.* | 800 | 39,008 | ||||||
| Internet Infrastructure Equipment - 0.6% | ||||||||
| Avocent Corp.* | 1,470 | 29,797 | ||||||
| Internet Infrastructure Software - 0.6% | ||||||||
| AsiaInfo Holdings, Inc.* | 1,300 | 25,961 | ||||||
| Internet Security - 0.7% | ||||||||
| McAfee, Inc.* | 780 | 34,156 | ||||||
| Intimate Apparel - 0.7% | ||||||||
| The Warnaco Group, Inc.* | 700 | 30,702 | ||||||
| Investment Management/Advisor Services - 0.6% | ||||||||
| Affiliated Managers Group, Inc.* | 400 | 26,004 | ||||||
| Life/Health Insurance - 0.7% | ||||||||
| Delphi Financial Group, Inc. Cl. A | 1,400 | 31,682 | ||||||
| Machinery-Construction & Mining - 0.5% | ||||||||
| Bucyrus International, Inc. Cl. A | 700 | 24,934 | ||||||
| Machinery-General Industry - 0.9% | ||||||||
| Albany International Corp. Cl. A | 2,100 | 40,740 | ||||||
| Marine Services - 0.7% | ||||||||
| Aegean Marine Petroleum Network, Inc. | 1,500 | 33,750 | ||||||
| Medical Instruments - 1.1% | ||||||||
| Edwards Lifesciences Corp.* | 350 | 24,468 | ||||||
| NuVasive, Inc.* | 600 | 25,056 | ||||||
| 49,524 | ||||||||
| Medical Products - 2.1% | ||||||||
| Haemonetics Corp.* | 500 | 28,060 | ||||||
| Hanger Orthopedic Group, Inc.* | 2,200 | 30,514 | ||||||
| PSS World Medical, Inc.* | 1,800 | 39,294 | ||||||
| 97,868 | ||||||||
| Medical Sterilize Product - 0.7% | ||||||||
| STERIS Corp. | 1,000 | 30,450 | ||||||
| Medical-Biomedical/Genetics - 4.4% | ||||||||
| Alexion Pharmaceuticals, Inc.* | 530 | 23,606 | ||||||
| Bio-Rad Laboratories, Inc. Cl. A* | 330 | 30,321 | ||||||
| Human Genome Sciences, Inc.* | 1,000 | 18,820 | ||||||
| Illumina, Inc.* | 640 | 27,200 | ||||||
| Incyte Corp., Ltd.* | 2,800 | 18,900 | ||||||
| Life Technologies Corp.* | 700 | 32,585 | ||||||
| Martek Biosciences Corp.* | 800 | 18,072 | ||||||
| Vertex Pharmaceuticals, Inc.* | 900 | 34,110 | ||||||
| 203,614 | ||||||||
| Medical-Drugs - 0.9% | ||||||||
| Biovail Corp. | 2,600 | 40,118 | ||||||
| Medical-Generic Drugs - 0.7% | ||||||||
| Mylan, Inc.* | 2,000 | 32,020 | ||||||
| Medical-HMO - 0.6% | ||||||||
| WellCare Health Plans, Inc.* | 1,100 | 27,115 | ||||||
| Medical-Hospitals - 0.8% | ||||||||
| Community Health Systems, Inc.* | 1,100 | 35,123 | ||||||
| Metal-Aluminum - 0.4% | ||||||||
| Century Aluminum Co.* | 2,200 | 20,570 | ||||||
| Oil & Gas Drilling - 1.4% | ||||||||
| Atlas Energy, Inc.* | 1,200 | 32,484 | ||||||
| Atwood Oceanics, Inc.* | 850 | 29,979 | ||||||
| 62,463 | ||||||||
| Oil Companies-Exploration & Production - 3.6% | ||||||||
| ATP Oil & Gas Corp.* | 1,900 | 33,991 | ||||||
| Berry Petroleum Co. Cl. A | 1,000 | 26,780 | ||||||
| Comstock Resources, Inc.* | 700 | 28,056 | ||||||
| Gran Tierra Energy, Inc.* | 7,400 | 30,784 | ||||||
| Stone Energy Corp.* | 2,300 | 37,513 | ||||||
| W&T Offshore, Inc. | 800 | 9,368 | ||||||
| 166,492 | ||||||||
| Oil-Field Services - 2.4% | ||||||||
| Global Industries, Ltd.* | 3,600 | 34,200 | ||||||
| Hercules Offshore, Inc.* | 3,600 | 17,676 | ||||||
| Hornbeck Offshore Services, Inc.* | 900 | 24,804 | ||||||
| Tetra Technologies, Inc.* | 3,300 | 31,977 | ||||||
| 108,657 | ||||||||
| Paper & Related Products - 2.9% | ||||||||
| Boise, Inc.* | 7,600 | 40,128 | ||||||
| Clearwater Paper Corp.* | 800 | 33,064 | ||||||
| Domtar Corp.* | 1,100 | 38,742 | ||||||
| Schweitzer-Mauduit International, Inc. | 400 | 21,744 | ||||||
| 133,678 | ||||||||
| Physical Practice Management - 0.6% | ||||||||
| IPC The Hospitalist Co., Inc.* | 820 | 25,789 | ||||||
| Printing-Commercial - 1.0% | ||||||||
| RR Donnelley & Sons Co. | 2,100 | 44,646 | ||||||
| Property/Casualty Insurance - 0.7% | ||||||||
| Amtrust Financial Services, Inc. | 2,730 | 31,149 | ||||||
| Publishing-Books - 0.7% | ||||||||
| Scholastic Corp. | 1,300 | 31,642 | ||||||
| Publishing-Newspapers - 0.7% | ||||||||
| Gannett Co., Inc. | 2,500 | 31,275 | ||||||
See Accompanying Notes to Financial Statements.
15
U.S. SMALL TO MID CAP GROWTH FUND
SCHEDULE OF INVESTMENTS (Unaudited)
As of September 30, 2009
| Number of | ||||||||
| Shares | Value | |||||||
| Real Estate Management/Service - 1.4% | ||||||||
| E-House China Holdings, Ltd. - ADR* | 1,500 | $ | 32,040 | |||||
| Jones Lang LaSalle, Inc. | 700 | 33,159 | ||||||
| 65,199 | ||||||||
| Recreational Centers - 0.7% | ||||||||
| Life Time Fitness, Inc.* | 1,100 | 30,855 | ||||||
| Reinsurance - 0.6% | ||||||||
| Maiden Holdings, Ltd. | 4,100 | 29,807 | ||||||
| Respiratory Products - 0.6% | ||||||||
| ResMed, Inc.* | 580 | 26,216 | ||||||
| Retail-Apparel/Shoe - 3.6% | ||||||||
| AnnTaylor Stores Corp.* | 2,100 | 33,369 | ||||||
| Genesco, Inc.* | 1,400 | 33,698 | ||||||
| Guess ?, Inc. | 1,000 | 37,040 | ||||||
| Hanesbrands, Inc.* | 1,400 | 29,960 | ||||||
| Phillips-Van Heusen Corp. | 700 | 29,953 | ||||||
| 164,020 | ||||||||
| Retail-Office Supplies - 0.6% | ||||||||
| OfficeMax, Inc.* | 2,200 | 27,676 | ||||||
| Retail-Restaurants - 0.5% | ||||||||
| Buffalo Wild Wings, Inc.* | 530 | 22,053 | ||||||
| Rubber-Tires - 1.6% | ||||||||
| Cooper Tire & Rubber Co. | 2,200 | 38,676 | ||||||
| Goodyear Tire & Rubber Co.* | 2,100 | 35,763 | ||||||
| 74,439 | ||||||||
| Satellite Telecommunications - 0.8% | ||||||||
| GeoEye, Inc.* | 1,300 | 34,840 | ||||||
| Semiconductor Components-Integrated Circuits - 1.1% | ||||||||
| Integrated Device Technology, Inc.* | 3,800 | 25,688 | ||||||
| TriQuint Semiconductor, Inc.* | 3,450 | 26,634 | ||||||
| 52,322 | ||||||||
| Semiconductor Equipment - 1.1% | ||||||||
| Teradyne, Inc.* | 3,200 | 29,600 | ||||||
| Tessera Technologies, Inc.* | 800 | 22,312 | ||||||
| 51,912 | ||||||||
| Telecommunication Equipment - 0.6% | ||||||||
| CommScope, Inc.* | 900 | 26,937 | ||||||
| Transport-Air Freight - 0.8% | ||||||||
| Atlas Air Worldwide Holdings, Inc.* | 1,200 | 38,364 | ||||||
| Transport-Marine - 0.6% | ||||||||
| Genco Shipping & Trading, Ltd.* | 1,400 | 29,092 | ||||||
| Transport-Rail - 0.6% | ||||||||
| Kansas City Southern* | 1,100 | 29,139 | ||||||
| Transport-Truck - 1.1% | ||||||||
| Con-way, Inc. | 700 | 26,824 | ||||||
| Saia, Inc.* | 1,400 | 22,512 | ||||||
| 49,336 | ||||||||
| Vitamins & Nutrition Products - 0.8% | ||||||||
| Herbalife, Ltd. | 1,100 | 36,014 | ||||||
| Web Portals/ISP - 0.6% | ||||||||
| United Online, Inc. | 3,200 | 25,728 | ||||||
| Wire & Cable Products - 0.7% | ||||||||
| Fushi Copperweld, Inc.* | 3,600 | 30,456 | ||||||
| Wireless Equipment - 0.5% | ||||||||
| RF Micro Devices, Inc.* | 4,600 | 24,978 | ||||||
| Total Common Stock (Cost: $3,535,018) | 4,533,276 | |||||||
| Limited Partnerships - 0.6% | ||||||||
| Pipelines - 0.6% | ||||||||
| Targa Resources Partners LP | ||||||||
| (Cost $21,342) | 1,600 | 30,016 | ||||||
| Principal | ||||||||
| Amount | ||||||||
| Short Term Investments - 2.4% | ||||||||
| Time Deposit - 2.4% | ||||||||
| Citibank London 0.030%, 10/01/09 | ||||||||
| (Cost: $109,415) | $ | 109,415 | 109,415 | |||||
| Total Investments - 101.4% (Cost: $3,665,775) | 4,672,707 | |||||||
| Liabilities in Excess of Other Assets - (1.4%) | (66,600 | ) | ||||||
| Net Assets - 100.0% | $ | 4,606,107 | ||||||
| ADR - American Depository Receipt |
SCHEDULE OF INVESTMENTS BY SECTOR | ||||
| as of September 30, 2009 | ||||
| Percent of | ||||
| Sector | Net Assets | |||
| Consumer, Non-cyclical | 28.2 | % | ||
| Consumer, Cyclical | 13.7 | |||
| Technology | 13.2 | |||
| Communications | 11.8 | |||
| Industrial | 11.8 | |||
| Energy | 9.8 | |||
| Financial | 6.4 | |||
| Basic Materials | 4.1 | |||
| Short Term Investments | 2.4 | |||
| Total Investments | 101.4 | |||
| Liabilities in excess of other assets | (1.4 | ) | ||
| Net Assets | 100.0 | % | ||
See Accompanying Notes to Financial Statements.
16
U.S. SYSTEMATIC LARGE CAP GROWTH FUND
Management Team: James Li, Ph.D., CFA, Portfolio Manager; Jane Edmondson, Portfolio Manager
Chief Investment Officer: Horacio A. Valeiras, CFA
Goal: The U.S. Systematic Large Cap Growth Fund seeks to maximize long-term capital appreciation by investing primarily in stocks from a universe of large U.S. companies with market capitalizations similar to the Russell 1000 Growth Index at time of purchase.
Market Overview: U.S. stocks posted dramatic gains during the six months ended September 30, 2009. In stark contrast to the panic coursing through the market last fall and winter, the period was characterized by rising appetites for risk. Investors jumped back into equities as the economy stabilized and corporate earnings beat expectations.
Government reports revealed brightening conditions in the consumer and manufacturing sectors, including the first back-to-back gain in industrial production since the start of the recession. The Federal Reserve held its key policy rate at 0.00% to 0.25% and continued adding liquidity to the financial system through special lending programs and asset purchases. The credit markets opened up, and corporate borrowers took advantage of cheaper lending rates and strong investor demand.
S&P 500 companies reported their eighth consecutive quarter of negative earnings growth, with first- and second-quarter earnings falling 35.6% and 27.3%, respectively. However, expectations were so low that even these weak numbers surprised on the upside.
Positive investor sentiment lifted stock prices higher across all major sectors, styles and capitalization segments of the market. Many of the stocks that performed the best were stocks of companies with the shakiest earnings prospects and balance sheets which had been hit especially hard during the credit crisis.
Performance: The Fund’s Class I shares gained 24.49% in the six months ended September 30, 2009 and the Russell 1000 Growth Index rose 32.57%.
Portfolio Specifics: All sectors in the Fund had strong positive returns, led by information technology. Three of our best-performing stocks were Apple Computer, Microsoft and Google.
While the Fund had a significant gain, it trailed the index because our systematic, model-based investment style was out of favor. The underperformance was concentrated in the first half of the period when two headwinds worked against us. First, the financial market had been driven primarily by macroeconomic news and government actions rather than company fundamentals, while our model focuses on company fundamentals. So our model struggled this period when there was a disconnect between fundamentals and stock prices and stocks with weaker fundamentals outperformed.
The second headwind was the speed at which expectations about the economy changed. In short order, investors went from thinking that the economy was in a freefall to believing it was on the mend. Inflection points like these are challenging for model-based strategies.
On a positive note, the market started to refocus on fundamentals toward the end of the period, and the Fund’s relative performance improved.
Market Outlook: Our process evaluates investment opportunities on a relative basis and is required to remain fully invested. As such, the process neither utilizes, nor results in, a forecast or outlook on the overall market, but expects to perform equally well in both up and down markets versus the Russell 1000 Growth Index.
We are confident that the Fund’s proprietary stock selection model, in conjunction with its risk-controlled approach to portfolio construction, will add value above the index over time.
Comparison of Change in Value of a $250,000 Investment in U.S. Systematic Large Cap Growth Fund Class I Shares with the Russell 1000 Growth Index.
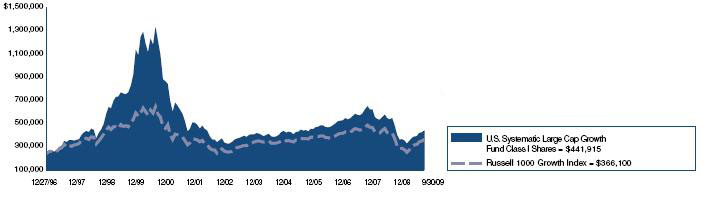
Annualized Total Returns As of 9/30/09 | |||
1 Year | 5 Years | 10 Years | |
| U.S. Systematic Large Cap | |||
| Growth Fund Class I | –8.83% | 1.85% | –5.70% |
| Russell 1000 Growth Index | –1.85% | 1.86% | –2.56% |
The graph above shows the value of a hypothetical $250,000 investment in the Fund’s Class I shares compared with the Russell 1000 Growth Index for the periods indicated. The Fund’s Class I shares calculate its performance based upon the historical performance of a corresponding series of Nicholas-Applegate Mutual Funds (renamed ING Mutual Funds), adjusted to reflect all fees and expenses applicable to the Fund’s Class I shares. The Nicholas-Applegate Institutional Funds’ Class I shares were first available on May 7, 1999. Average annual total return figures include changes in principal value, reinvested dividends, and capital gain distributions. The total returns shown above do not show the effects of income taxes on an individual’s investment. In most cases, taxes may reduce your actual investment returns on income or gains paid by the Fund or any gains you may realize if you sell your shares. Past performance cannot guarantee future results. Russell 1000 Growth Index measures the performance of those Russell 1000 companies with higher price-to-book ratios and higher forecasted growth values. The Russell 1000 Index consists of the 1,000 largest securities in the Russell 3000 Index, which represents approximately 90% of the total market capitalization of the Russell 3000 Index. It is a large-cap, market-oriented index and is highly correlated with the S&P 500 Index. Unless otherwise noted, index returns reflect the reinvestment of income dividends and capital gains, if any, but do not reflect fees, brokerage commissions or other expenses of investing.
Since markets can go down as well as up, investment return and principal value will fluctuate with market conditions. You may have a gain or loss when you sell your shares.
17
U.S. SYSTEMATIC LARGE CAP GROWTH FUND
SCHEDULE OF INVESTMENTS (Unaudited)
As of September 30, 2009
| Number of | ||||||||
| Shares | Value | |||||||
| Common Stock - 98.0% | ||||||||
| Aerospace/Defense - 2.9% | ||||||||
| Lockheed Martin Corp. | 500 | $ | 39,040 | |||||
| Raytheon Co. | 2,500 | 119,925 | ||||||
| 158,965 | ||||||||
| Agricultural Operations - 0.8% | ||||||||
| Archer-Daniels-Midland Co. | 1,600 | 46,752 | ||||||
| Applications Software - 5.2% | ||||||||
| Microsoft Corp. | 11,000 | 284,790 | ||||||
| Auto-Cars/Light Trucks - 0.8% | ||||||||
| Ford Motor Co.* | 6,200 | 44,702 | ||||||
| Beverages-Non-alcoholic - 3.7% | ||||||||
| Coca-Cola Co. | 1,100 | 59,070 | ||||||
| Coca-Cola Enterprises, Inc. | 4,400 | 94,204 | ||||||
| PepsiCo, Inc. | 900 | 52,794 | ||||||
| 206,068 | ||||||||
| Cable TV - 0.5% | ||||||||
| DISH Network Corp. Cl. A* | 1,500 | 28,890 | ||||||
| Computer Services - 1.0% | ||||||||
| Cognizant Technology Solutions Corp. Cl. A* | 1,400 | 54,124 | ||||||
| Computers - 10.8% | ||||||||
| Apple, Inc.* | 1,200 | 222,444 | ||||||
| Hewlett-Packard Co. | 3,300 | 155,793 | ||||||
| International Business Machines Corp. | 1,800 | 215,298 | ||||||
| 593,535 | ||||||||
| Computers-Memory Devices - 3.3% | ||||||||
| EMC Corp./Massachusetts* | 5,200 | 88,608 | ||||||
| NetApp, Inc.* | 1,100 | 29,348 | ||||||
| Western Digital Corp.* | 1,700 | 62,101 | ||||||
| 180,057 | ||||||||
| Containers-Metal/Glass - 2.2% | ||||||||
| Ball Corp. | 800 | 39,360 | ||||||
| Owens-Illinois, Inc.* | 2,200 | 81,180 | ||||||
| 120,540 | ||||||||
| Cosmetics & Toiletries - 2.1% | ||||||||
| Procter & Gamble Co. | 2,000 | 115,840 | ||||||
| Diversified Manufacturing Operations - 1.7% | ||||||||
| 3M Co. | 700 | 51,660 | ||||||
| General Electric Co. | 2,500 | 41,050 | ||||||
| 92,710 | ||||||||
| E-Commerce/Services - 2.7% | ||||||||
| eBay, Inc.* | 2,400 | 56,664 | ||||||
| Expedia, Inc.* | 1,200 | 28,740 | ||||||
| Liberty Media Corp. - Interactive* | 2,700 | 29,619 | ||||||
| priceline.com, Inc.* | 200 | 33,164 | ||||||
| 148,187 | ||||||||
| Electric-Integrated - 1.0% | ||||||||
| PG&E Corp. | 1,300 | 52,637 | ||||||
| Electronic Components-Semiconductors - 6.0% | ||||||||
| Broadcom Corp. Cl. A* | 2,400 | 73,656 | ||||||
| Intel Corp. | 3,800 | 74,366 | ||||||
| ON Semiconductor Corp.* | 5,700 | 47,025 | ||||||
| Rovi Corp.* | 1,700 | 57,120 | ||||||
| Texas Instruments, Inc. | 3,400 | 80,546 | ||||||
| 332,713 | ||||||||
| Enterprise Software/Services - 3.9% | ||||||||
| BMC Software, Inc.* | 1,000 | 37,530 | ||||||
| Oracle Corp. | 8,400 | 175,056 | ||||||
| 212,586 | ||||||||
| Finance-Investment Bankers/Brokers - 1.7% | ||||||||
| The Goldman Sachs Group, Inc. | 500 | 92,175 | ||||||
| Finance-Other Services - 1.0% | ||||||||
| The Nasdaq OMX Group* | 2,500 | 52,625 | ||||||
| Food-Miscellaneous/Diversified - 1.0% | ||||||||
| Kraft Foods, Inc. Cl. A | 2,000 | 52,540 | ||||||
| Gas-Distribution - 0.5% | ||||||||
| Centerpoint Energy, Inc. | 2,200 | 27,346 | ||||||
| Gold Mining - 0.5% | ||||||||
| Newmont Mining Corp. | 600 | 26,412 | ||||||
| Life/Health Insurance - 1.0% | ||||||||
| Prudential Financial, Inc.* | 1,100 | 54,901 | ||||||
| Medical Information Systems - 0.8% | ||||||||
| Cerner Corp.* | 600 | 44,880 | ||||||
| Medical Instruments - 0.8% | ||||||||
| Medtronic, Inc. | 1,200 | 44,160 | ||||||
| Medical Products - 2.4% | ||||||||
| Johnson & Johnson | 2,200 | 133,958 | ||||||
| Medical-Biomedical/Genetics - 1.1% | ||||||||
| Amgen, Inc. | 1,000 | 60,230 | ||||||
| Medical-Drugs - 5.6% | ||||||||
| Abbott Laboratories | 1,600 | 79,152 | ||||||
| Bristol-Myers Squibb Co. | 4,200 | 94,584 | ||||||
| Forest Laboratories, Inc.* | 1,400 | 41,216 | ||||||
| Schering-Plough Corp. | 3,400 | 96,050 | ||||||
| 311,002 | ||||||||
| Medical-Generic Drugs - 0.5% | ||||||||
| Mylan, Inc.* | 1,800 | 28,818 | ||||||
| Medical-HMO - 1.3% | ||||||||
| UnitedHealth Group, Inc.* | 1,600 | 40,064 | ||||||
| WellPoint, Inc.* | 700 | 33,152 | ||||||
| 73,216 | ||||||||
| Medical-Whosale Drug Distributors - 0.7% | ||||||||
| AmerisourceBergen Corp. Cl. A | 1,800 | 40,284 | ||||||
| Multi-line Insurance - 1.2% | ||||||||
| ACE, Ltd.* | 1,200 | 64,152 | ||||||
| Networking Products - 4.3% | ||||||||
| Cisco Systems, Inc.* | 10,100 | 237,754 | ||||||
| Oil & Gas Drilling - 0.5% | ||||||||
| ENSCO International, Inc. | 700 | 29,778 | ||||||
| Oil Companies-Exploration & Production - 1.6% | ||||||||
| Southwestern Energy Co.* | 1,300 | 55,484 | ||||||
| XTO Energy, Inc. | 800 | 33,056 | ||||||
| 88,540 | ||||||||
| Oil Companies-Integrated - 2.0% | ||||||||
| ConocoPhillips | 1,200 | 54,192 | ||||||
| Exxon Mobil Corp. | 800 | 54,888 | ||||||
| 109,080 | ||||||||
| Pharmacy Services - 1.0% | ||||||||
| Medco Health Solutions, Inc.* | 1,000 | 55,310 | ||||||
See Accompanying Notes to Financial Statements.
18
SCHEDULE OF INVESTMENTS (Unaudited)
As of September 30, 2009
| Number of | ||||||||
| Shares | Value | |||||||
| Publishing-Newspapers - 0.6% | ||||||||
| Gannett Co., Inc. | 2,800 | $ | 35,028 | |||||
| Retail-Apparel/Shoe - 0.5% | ||||||||
| Phillips-Van Heusen Corp. | 700 | 29,953 | ||||||
| Retail-Automobile - 0.7% | ||||||||
| AutoNation, Inc.* | 2,200 | 39,776 | ||||||
| Retail-Bedding - 1.1% | ||||||||
| Bed Bath & Beyond, Inc.* | 1,600 | 60,064 | ||||||
| Retail-Discount - 4.3% | ||||||||
| Target Corp. | 1,400 | 65,352 | ||||||
| Wal-Mart Stores, Inc. | 3,500 | 171,815 | ||||||
| 237,167 | ||||||||
| Retail-Drug Store - 0.5% | ||||||||
| CVS Caremark Corp. | 800 | 28,592 | ||||||
| Retail-Restaurants - 2.0% | ||||||||
| Darden Restaurants, Inc. | 1,600 | 54,608 | ||||||
| McDonald’s Corp. | 1,000 | 57,070 | ||||||
| 111,678 | ||||||||
| Semicon Components-Integrated Circuits - 1.4% | ||||||||
| Marvell Technology Group, Ltd.* | 4,800 | 77,712 | ||||||
| Steel-Producers - 0.6% | ||||||||
| Steel Dynamics, Inc. | 2,300 | 35,282 | ||||||
| Telephone-Integrated - 2.3% | ||||||||
| AT&T, Inc. | 2,500 | 67,525 | ||||||
| CenturyTel, Inc. | 1,700 | 57,120 | ||||||
| 124,645 | ||||||||
| Web Portals/ISP - 4.5% | ||||||||
| Google, Inc. Cl. A* | 500 | 247,925 | ||||||
| Wire & Cable Products - 0.4% | ||||||||
| General Cable Corp.* | 600 | 23,490 | ||||||
| Wireless Equipment - 1.0% | ||||||||
| QUALCOMM, Inc. | 1,200 | 53,976 | ||||||
| Total Common Stock (Cost: $4,492,596) | 5,405,545 | |||||||
| Total Investments - 98.0% (Cost: $4,492,596) | 5,405,545 | |||||||
| Other Assets in Excess of Liabilities - 2.0% | 111,715 | |||||||
| Net Assets - 100.0% | $ | 5,517,260 | ||||||
| * Non-income producing securities. |
SCHEDULE OF INVESTMENTS BY SECTOR | ||||
| as of September 30, 2009 | ||||
| Percent of | ||||
| Sector | Net Assets | |||
| TechnologyA | 32.4 | % | ||
| Consumer, Non-cyclical | 21.0 | |||
| Communications | 15.9 | |||
| Consumer, Cyclical | 9.9 | |||
| Industrial | 7.2 | |||
| Financial | 4.9 | |||
| Energy | 4.1 | |||
| Utilities | 1.5 | |||
| Basic Materials | 1.1 | |||
| Total Investments | 98.0 | |||
| Other assets in excess of liabilities | 2.0 | |||
| Net Assets | 100.0 | % | ||
See Accompanying Notes to Financial Statements.
19
U.S. CONVERTIBLE FUND
Management Team: Douglas G. Forsyth, CFA, Portfolio Manager; William L. Stickney, Portfolio Manager; Justin Kass, CFA, Portfolio Manager; Michael E.Yee, Portfolio Manager
Chief Investment Officer: Horacio A. Valeiras, CFA Goal: The U.S. Convertible Fund seeks to maximize total return consisting of capital appreciation and current income by investing primarily in securities that are convertible into common stock, across all ratings and capitalization ranges.
Market Overview: The convertible market produced a positive return during the six months ended September 30, 2009. The Merrill Lynch All Convertibles All Qualities Index rose 36.88%, with gains in every month of the period. By way of comparison, the S&P 500 Index and NASDAQ Composite Index were up 34.02% and 38.85%, respectively.
Historically, convertibles have had a high correlation to movements in the underlying equity. More recently, however, credit has been the greater driver of returns. In late 2008, the convertible universe participated in most of the downside of the equity markets, as rapidly widening corporate bond spreads caused the bond floors to fall. The reverse was true in the first nine months of this year, when credit continued to drive returns. As the capital markets opened up and access to capital improved, credit spreads tightened dramatically, sending all corporate bond prices higher.
Every industry within the convertible market posted a large gain during the six-month period. Transportation, consumer discretionary and financials were the best performers, while health care, consumer staples and telecommunications lagged. Nearly all of the bond-like, or “busted,” convertibles rose significantly in price. Many of these issues rarely trade; thus, even if an issue was identified as a good candidate for purchase, the liquidity was not there to build a position.
Performance: The Fund’s Class I shares gained 26.62% during the six months ended September 30, 2009. The Merrill Lynch All Convertibles All Qualities Index rose 36.88%.
Portfolio Specifics: The Fund’s relative performance was hurt by our underweight in bond-like, distressed convertibles. The most distressed names in the convertible universe posted the strongest results as numerous companies raised capital in the credit and equity markets.
Positions in the financial and technology industries helped performance. Select financials benefited from capital raises and lower-than-expected loan charge-offs. Several technology issuers advanced as second-quarter earnings beat expectations and earnings guidance was positive.
Positions in health care and telecommunications hurt performance. A number of our health care holdings declined due to the uncertainty surrounding health care reform, as well as a rotation from defensive, low-beta industries into high-beta industries. The rotation into high-beta industries had a similar effect on telecommunications companies.
On September 30, the Fund’s conversion premium was 35% versus 72% for the market. As the equity markets improved, the Fund’s conversion premium returned to a more balanced, asymmetric risk-return level.
Market Outlook: Credit will continue to play an important role in the convertible market, but we expect the equity component to become a bigger driver of returns going forward. With respect to equities, investor sentiment and economic data have improved, but we believe there needs to be more evidence of an economic recovery before there can be a sustainable rally in the stock market.
We continue to build the Fund one security at a time by finding companies that are opportunistically capitalizing on change. We are also maintaining our discipline of seeking to identify the best convertibles with the optimal risk/reward profile: 70-80% of the upside and 40-50% of the downside.
Comparison of Change in Value of a $250,000 Investment in U.S. Convertible Fund Class I, II and IV Shares with the Merrill Lynch All Convertibles, All Qualities Index.
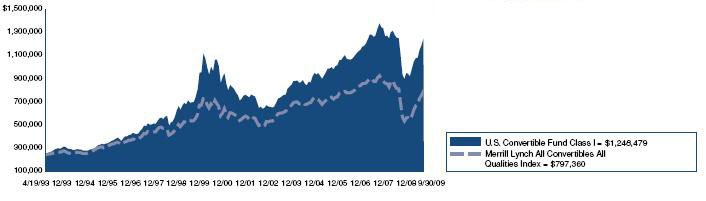
Annualized Total Returns As of 9/30/09 | |||
1 Year | 5 Years | 10 Years | |
| U.S. Convertible Fund Class I | 11.41% | 7.27% | 5.89% |
| Merrill Lynch All Convertibles | |||
| All Qualities Index | 14.50% | 2.82% | 3.95% |
20
U.S. CONVERTIBLE FUND
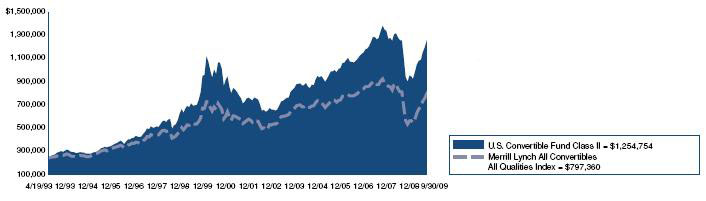
| Annualized Total Returns As of 9/30/09 | |||
1 Year | 5 Years | 10 Years | |
| U.S. Convertible Fund Class II | 11.57% | 7.37% | 5.95% |
| Merrill Lynch All Convertibles | |||
| All Qualities Index | 14.50% | 2.82% | 3.95% |
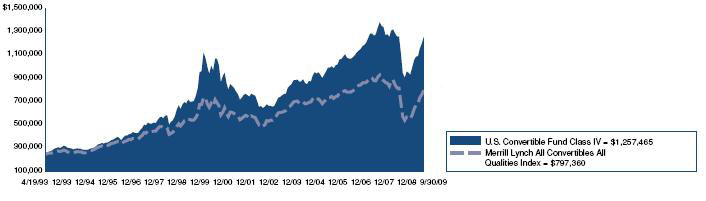
| Annualized Total Returns As of 9/30/09 | |||
1 Year | 5 Years | 10 Years | |
| U.S. Convertible Fund Class IV | 11.75% | 7.42% | 5.97% |
| Merrill Lynch All Convertibles | |||
| All Qualities Index | 14.50% | 2.62% | 3.95% |
The graphs above show the value of a hypothetical $250,000 investment in the Fund’s Class I, II and IV shares compared with the Merrill Lynch All Convertibles, All Qualities Index for the periods indicated. The Fund’s Class I, II and IV shares calculate their performance based upon the historical performance of their corresponding series of Nicholas-Applegate Mutual Funds (renamed ING Mutual Funds), adjusted to reflect all fees and expenses applicable to the Fund’s Class I, II and IV shares. The Nicholas-Applegate Institutional Funds’ Class I shares were first available on May 7, 1999, Class II shares on September 30, 2005 and Class IV shares on December 30, 2006. The historical performance of Class II and IV shares includes the performance of Class I shares for periods prior to the inception of Class II and IV. Average annual total return figures include changes in principal value, reinvested dividends, and capital gain distributions. The total returns shown above do not show the effects of income taxes on an individual’s investment. In most cases, taxes may reduce your actual investment returns on income or gains paid by the Fund or any gains you may realize if you sell your shares. Past performance cannot guarantee future results.
The Merrill Lynch All Convertibles All Qualities Index represents convertible securities spanning all corporate sectors and having a par amount outstanding of $25 Mil+. Maturities must be at least one year. The coupon range must be equal to or greater than zero and all qualities of bonds are included. Preferred equity redemption stocks are not included nor are component bonds once they are converted into corporate stock.
Unless otherwise noted, index returns reflect the reinvestment of income dividends and capital gains, if any, but do not reflect fees, brokerage commissions or other expense of investing. One cannot invest directly in an index.
Since markets can go down as well as up, investment return and principal value will fluctuate with market conditions. You may have a gain or loss when you sell your shares.
21
U.S. CONVERTIBLE FUND
SCHEDULE OF INVESTMENTS (Unaudited)
As of September 30, 2009
| Principal | ||||||||
| Amount | Value | |||||||
| Convertible Corporate Bonds - 80.3% | ||||||||
| Aerospace/Defense-Equipment - 0.5% | ||||||||
| AAR Corp. | ||||||||
| 1.750%, 02/01/26 | $ | 2,225,000 | $ | 2,169,375 | ||||
| Applications Software - 1.5% | ||||||||
| Nuance Communications, Inc. | ||||||||
| 2.750%, 08/15/27 | 5,650,000 | 6,024,313 | ||||||
| Auto/Truck Parts & Equipment-Original - 1.2% | ||||||||
| BorgWarner, Inc. | ||||||||
| 3.500%, 04/15/12 | 3,880,000 | 4,743,300 | ||||||
| Auto-Cars/Light Trucks - 1.6% | ||||||||
| Ford Motor Co. | ||||||||
| 4.250%, 12/15/36 | 6,330,000 | 6,448,688 | ||||||
| Batteries/Battery Systems - 1.1% | ||||||||
| EnerSys* | ||||||||
| 3.375%, 06/01/38 | 4,840,000 | 4,325,750 | ||||||
| Brewery - 1.1% | ||||||||
| Molson Coors Brewing Co. | ||||||||
| 2.500%, 07/30/13 | 3,985,000 | 4,527,956 | ||||||
| Broadcast Services/Programming - 1.3% | ||||||||
| Liberty Media LLC | ||||||||
| 3.125%, 03/30/23 | 5,205,000 | 5,178,975 | ||||||
| Building-Residential/Commercial - 1.2% | ||||||||
| DR Horton, Inc. | ||||||||
| 2.000%, 05/15/14 | 4,190,000 | 4,808,025 | ||||||
| Casino Services - 1.5% | ||||||||
International Game Technology 144A# | ||||||||
| 3.250%, 05/01/14 | 4,655,000 | 6,127,144 | ||||||
| Coal - 1.5% | ||||||||
| Peabody Energy Corp. | ||||||||
| 4.750%, 12/15/41 | 6,950,000 | 6,150,750 | ||||||
| Commercial Services - 3.1% | ||||||||
| Alliance Data Systems Corp. | ||||||||
| 1.750%, 08/01/13 | 5,935,000 | 5,742,112 | ||||||
Alliance Data Systems Corp. 144A# | ||||||||
| 4.750%, 05/15/14 | 885,000 | 1,283,250 | ||||||
| Quanta Services, Inc. | ||||||||
| 3.750%, 04/30/26 | 4,835,000 | 5,493,768 | ||||||
| 12,519,130 | ||||||||
| Commercial Services-Finance - 1.1% | ||||||||
| Coinstar, Inc. | ||||||||
| 4.000%, 09/01/14 | 4,205,000 | 4,588,706 | ||||||
| Computer Services - 1.2% | ||||||||
| DST Systems, Inc.* | ||||||||
| 4.125%, 08/15/23 | 4,560,000 | 4,924,800 | ||||||
| Computers-Memory Devices - 3.6% | ||||||||
| EMC Corp./Massachusetts | ||||||||
| 1.750%, 12/01/13 | 4,940,000 | 6,107,075 | ||||||
| Maxtor Corp. | ||||||||
| 2.375%, 08/15/12 | 5,700,000 | 6,170,249 | ||||||
| NetApp, Inc. | ||||||||
| 1.750%, 06/01/13 | 2,595,000 | 2,822,063 | ||||||
| 15,099,387 | ||||||||
| Diagnostic Kits - 1.3% | ||||||||
| Inverness Medical Innovations, Inc. | ||||||||
| 3.000%, 05/15/16 | 5,025,000 | 5,408,156 | ||||||
| Diversified Manufacturing Operations - 0.6% | ||||||||
| Textron, Inc. | ||||||||
| 4.500%, 05/01/13 | 1,470,000 | 2,405,288 | ||||||
| Electronic Components-Semiconductors - 6.7% | ||||||||
| Advanced Micro Devices, Inc. | ||||||||
| 5.750%, 08/15/12 | 7,630,000 | 6,437,812 | ||||||
| Intel Corp. | ||||||||
| 2.950%, 12/15/35 | 770,000 | 691,075 | ||||||
Intel Corp. 144A# | ||||||||
| 3.250%, 08/01/39 | 5,445,000 | 5,846,568 | ||||||
| Micron Technology, Inc. | ||||||||
| 4.250%, 10/15/13 | 2,770,000 | 4,968,688 | ||||||
| ON Semiconductor Corp. | ||||||||
| 2.625%, 12/15/26 | 4,695,000 | 5,070,599 | ||||||
| Skyworks Solutions, Inc. | ||||||||
| 1.250%, 03/01/10 | 1,110,000 | 1,577,588 | ||||||
| Skyworks Solutions, Inc. | ||||||||
| 1.500%, 03/01/12 | 2,280,000 | 3,388,650 | ||||||
| 27,980,980 | ||||||||
| Electronic Measure Instruments - 1.4% | ||||||||
| Itron, Inc. | ||||||||
| 2.500%, 08/01/26 | 4,520,000 | 5,553,950 | ||||||
| Energy-Alternate Sources - 1.2% | ||||||||
Covanta Holding Corp. 144A# | ||||||||
| 3.250%, 06/01/14 | 4,305,000 | 4,778,550 | ||||||
| Footwear & Related Apparel - 0.7% | ||||||||
| Iconix Brand Group, Inc. | ||||||||
| 1.875%, 06/30/12 | 3,105,000 | 2,724,638 | ||||||
| Home Decoration Products - 1.2% | ||||||||
| Newell Rubbermaid, Inc. | ||||||||
| 5.500%, 03/15/14 | 2,570,000 | 5,088,600 | ||||||
| Hospital Beds/Equipment - 1.3% | ||||||||
Kinetic Concepts, Inc. 144A# | ||||||||
| 3.250%, 04/15/15 | 5,285,000 | 5,159,481 | ||||||
| Hotels & Motels - 0.8% | ||||||||
| Wyndham Worldwide Corp. | ||||||||
| 3.500%, 05/01/12 | 2,195,000 | 3,138,850 | ||||||
| Instruments-Scientific - 1.3% | ||||||||
| Fisher Scientific International, Inc. | ||||||||
| 3.250%, 03/01/24 | 4,200,000 | 5,239,500 | ||||||
| Internet Security - 2.6% | ||||||||
| Symantec Corp. | ||||||||
| 1.000%, 06/15/13 | 4,645,000 | 4,981,763 | ||||||
| VeriSign, Inc. | ||||||||
| 3.250%, 08/15/37 | 6,695,000 | 5,841,387 | ||||||
| 10,823,150 | ||||||||
| Investment Management/Advisor Services - 2.7% | ||||||||
| BlackRock, Inc. | ||||||||
| 2.625%, 02/15/35 | 2,875,000 | 6,278,282 | ||||||
| Janus Capital Group, Inc. | ||||||||
| 3.250%, 07/15/14 | 3,875,000 | 4,877,656 | ||||||
| 11,155,938 | ||||||||
| Machinery-Farm - 0.9% | ||||||||
| AGCO Corp. | ||||||||
| 1.250%, 12/15/36 | 3,895,000 | 3,748,938 | ||||||
| Machinery-General Industry - 1.1% | ||||||||
| Roper Industries, Inc.* | ||||||||
| 0.000%, 01/15/34 | 6,855,000 | 4,352,925 | ||||||
See Accompanying Notes to Financial Statements.
22
SCHEDULE OF INVESTMENTS (Unaudited)
As of September 30, 2009
| Principal | ||||||||
| Amount | Value | |||||||
| Medical Instruments - 1.2% | ||||||||
NuVasive, Inc. 144A# | ||||||||
| 2.250%, 03/15/13 | $ | 4,480,000 | $ | 4,905,600 | ||||
| Medical-Biomedical/Genetics - 4.9% | ||||||||
Gilead Sciences, Inc. 144A# | ||||||||
| 0.625%, 05/01/13 | 1,905,000 | 2,497,931 | ||||||
| Gilead Sciences, Inc. | ||||||||
| 0.625%, 05/01/13 | 1,970,000 | 2,583,163 | ||||||
| Illumina, Inc. | ||||||||
| 0.625%, 02/15/14 | 2,705,000 | 5,308,562 | ||||||
| Life Technology Corp. | ||||||||
| 2.000%, 08/01/23 | 3,460,000 | 4,848,325 | ||||||
| United Therapeutics Corp. | ||||||||
| 0.500%, 10/15/11 | 3,770,000 | 5,150,762 | ||||||
| 20,388,743 | ||||||||
| Medical-Drugs - 1.4% | ||||||||
Biovail Corp. 144A# | ||||||||
| 5.375%, 08/01/14 | 4,695,000 | 5,851,144 | ||||||
| Medical-Generic Drugs - 1.7% | ||||||||
| Mylan, Inc. | ||||||||
| 1.250%, 03/15/12 | 1,650,000 | 1,623,188 | ||||||
Mylan, Inc./PA 144A# | ||||||||
| 3.750%, 09/15/15 | 3,825,000 | 5,340,656 | ||||||
| 6,963,844 | ||||||||
| Metal-Aluminum - 0.8% | ||||||||
| Alcoa, Inc. | ||||||||
| 5.250%, 03/15/14 | 1,460,000 | 3,219,300 | ||||||
| Motion Pictures & Services - 1.3% | ||||||||
| Macrovision Corp. | ||||||||
| 2.625%, 08/15/11 | 4,210,000 | 5,483,525 | ||||||
| Networking Products - 1.3% | ||||||||
| Anixter International, Inc. | ||||||||
| 1.000%, 02/15/13 | 5,835,000 | 5,258,794 | ||||||
| Oil Companies-Exploration & Production - 1.7% | ||||||||
| Chesapeake Energy Corp. | ||||||||
| 2.500%, 05/15/37 | 7,720,000 | 7,092,750 | ||||||
| Oil Field Machinery & Equipment - 1.3% | ||||||||
| Cameron International Corp. | ||||||||
| 2.500%, 06/15/26 | 4,125,000 | 5,300,625 | ||||||
| Oil-Field Services - 3.8% | ||||||||
| Hornbeck Offshore Services, Inc.* | ||||||||
| 1.625%, 11/15/26 | 5,405,000 | 4,810,450 | ||||||
| Oil States International, Inc. | ||||||||
| 2.375%, 07/01/25 | 4,695,000 | 6,038,943 | ||||||
| Schlumberger Ltd. | ||||||||
| 2.125%, 06/01/23 | 3,275,000 | 5,141,750 | ||||||
| 15,991,143 | ||||||||
| REITS-Diversified - 1.2% | ||||||||
Digital Realty Trust LP 144A# | ||||||||
| 4.125%, 08/15/26 | 3,420,000 | 5,031,675 | ||||||
| REITS-Office Property - 2.7% | ||||||||
| Alexandria Real Estate | ||||||||
Equities, Inc. 144A# | ||||||||
| 8.000%, 04/15/29 | 3,340,000 | 5,060,100 | ||||||
| Boston Properties LP | ||||||||
| 3.750%, 05/15/36 | 5,825,000 | 5,861,406 | ||||||
| 10,921,506 | ||||||||
| Rental Auto/Equipment - 1.2% | ||||||||
| Hertz Global Holdings, Inc. | ||||||||
| 5.250%, 06/01/14 | 3,295,000 | 4,983,688 | ||||||
| Retail-Automobile - 0.8% | ||||||||
| Sonic Automotive, Inc. | ||||||||
| 5.000%, 10/01/29 | 3,125,000 | 3,425,781 | ||||||
| Semiconductor Equipment - 1.0% | ||||||||
| Teradyne, Inc. | ||||||||
| 4.500%, 03/15/14 | 2,225,000 | 4,180,219 | ||||||
| Steel-Producers - 1.2% | ||||||||
| Steel Dynamics, Inc. | ||||||||
| 5.125%, 06/15/14 | 4,145,000 | 4,911,825 | ||||||
| Telecommunications Services - 2.3% | ||||||||
| MasTec, Inc. | ||||||||
| 4.000%, 06/15/14 | 3,770,000 | 3,986,775 | ||||||
| TW Telecom, Inc. | ||||||||
| 2.375%, 04/01/26 | 5,575,000 | 5,428,656 | ||||||
| 9,415,431 | ||||||||
| Therapeutics - 1.2% | ||||||||
| Onyx Pharmaceuticals, Inc. | ||||||||
| 4.000%, 08/15/16 | 4,450,000 | 4,744,813 | ||||||
| Toys - 1.4% | ||||||||
| Hasbro, Inc. | ||||||||
| 2.750%, 12/01/21 | 4,324,000 | 5,723,895 | ||||||
| Web Hosting/Design - 1.3% | ||||||||
| Equinix, Inc. | ||||||||
| 2.500%, 04/15/12 | 4,885,000 | 5,147,569 | ||||||
| Wire & Cable Products - 1.3% | ||||||||
| General Cable Corp. | ||||||||
| 0.875%, 11/15/13 | 5,485,000 | 5,437,006 | ||||||
| Total Convertible Corporate Bonds | ||||||||
| (Cost: $297,261,855) | 329,574,119 | |||||||
| Number of | ||||||||
| Shares | ||||||||
| Convertible Preferred Stock - 16.0% | ||||||||
| Agricultural Operations - 1.2% | ||||||||
| Bunge, Ltd. | ||||||||
| 4.875%, 12/31/49 | 54,910 | 4,770,306 | ||||||
| Chemicals-Diversified - 1.4% | ||||||||
| Celanese Corp. | ||||||||
| 4.250%, 12/31/49 | 171,985 | 5,622,190 | ||||||
| Electric-Generation - 1.3% | ||||||||
| AES Trust III | ||||||||
| 6.750%, 10/15/29 | 117,488 | 5,169,472 | ||||||
| Financial Guarantee Insurance - 1.3% | ||||||||
| Assured Guaranty, Ltd. | ||||||||
| 8.500%, 06/01/14 | 60,615 | 5,199,433 | ||||||
| Medical-Drugs - 0.9% | ||||||||
| Schering-Plough Corp. | ||||||||
| 6.000%, 08/13/10 | 16,035 | 3,891,695 | ||||||
| Metal-Diversified - 1.5% | ||||||||
| Freeport-McMoRan Copper & Gold, Inc. | ||||||||
| 6.750%, 05/01/10 | 57,765 | 5,949,795 | ||||||
| Multi-line Insurance - 1.3% | ||||||||
| XL Capital, Ltd. | ||||||||
| 10.750%, 08/15/11 | 192,225 | 5,315,021 | ||||||
See Accompanying Notes to Financial Statements.
23
U.S. CONVERTIBLE FUND
SCHEDULE OF INVESTMENTS (Unaudited)
As of September 30, 2009
| Number of | ||||||||
| Shares | Value | |||||||
| Office Supplies & Forms - 0.5% | ||||||||
| Avery Dennison Corp. | ||||||||
| 7.875%, 11/15/20 | 48,550 | $ | 1,857,038 | |||||
| Oil Companies-Exploration & Production - 1.2% | ||||||||
| Whiting Petroleum Corp. | ||||||||
| 6.250%, 12/31/49 | 33,355 | 5,035,604 | ||||||
| REITS-Regional Malls - 1.3% | ||||||||
| Simon Property Group, Inc. | ||||||||
| 6.000%, 12/31/49 | 89,800 | 5,455,350 | ||||||
| Super-Regional Banks-US - 4.1% | ||||||||
| Bank of America Corp. | ||||||||
| 7.250%, 12/31/49 | 6,630 | 5,635,434 | ||||||
| Fifth Third Bancorp | ||||||||
| 8.500%, 12/31/49 | 48,700 | 5,827,929 | ||||||
| Wells Fargo & Co. | ||||||||
| 7.500%, 12/31/49 | 6,375 | 5,692,875 | ||||||
| 17,156,238 | ||||||||
| Total Convertible Preferred Stock (Cost: $53,417,512) | 65,422,142 | |||||||
| Common Stock - 2.5% | ||||||||
| Auto/Truck Parts & Equipment-Original - 0.5% | ||||||||
| Johnson Controls, Inc. | 80,094 | 2,047,203 | ||||||
| Retail-Major Department Stores - 1.0% | ||||||||
| TJX Cos, Inc. | 107,381 | 3,989,204 | ||||||
| Wireless Equipment - 1.0% | ||||||||
| American Tower Corp. Cl. A | 114,797 | 4,178,611 | ||||||
| Total Common Stock (Cost: $8,948,790) | 10,215,018 | |||||||
| Total Investments - 98.8% (Cost: $359,628,157) | 405,211,279 | |||||||
| Other Assets in Excess of Liabilities - 1.2% | 4,919,141 | |||||||
| Net Assets - 100.0% | $ | 410,130,420 | ||||||
| * | Step Bond: Coupon is a fixed rate for an initial period then resets |
at a specific date and rate. | |
| # | 144A Security. Certain condition for public sale may exist. The |
total market value of 144A securities owned at September 30, | |
2009 was $51,882,099 or 12.65% of net assets. | |
| REIT - Real Estate Investment Trust | |
SCHEDULE OF INVESTMENTS BY SECTOR | ||||
| as of September 30, 2009 | ||||
| Percent of | ||||
| Sector | Net Assets | |||
| Consumer, Non-cyclical | 22.1 | % | ||
| Financial | 14.6 | |||
| Technology | 14.0 | |||
| Consumer, Cyclical | 13.2 | |||
| Energy | 10.7 | |||
| Communications | 9.8 | |||
| Industrial | 8.2 | |||
| Basic Materials | 4.9 | |||
| Utilities | 1.3 | |||
| Total Investments | 98.8 | |||
| Other assets in excess of liabilities | 1.2 | |||
| Net Assets | 100.0 | % | ||
See Accompanying Notes to Financial Statements.
24
GLOBAL SELECT FUND
Management Team: Christopher A. Herrera, Portfolio Manager; Nelson W. Shing, Portfolio Manager
Chief Investment Officer: Horacio A. Valeiras, CFA
Goal: The Global Select Fund seeks to maximize long-term capital appreciation by investing in companies that, in the opinion of the Investment Adviser, represent the “best of the best” globally.
Market Overview: During the six months ended September 30, 2009, stock markets in developed and emerging countries continued to rebound from multi-year lows set in March. The powerful rally was driven by a combination of improving economic news and positive earnings announcements. For example:
| • | The Japanese economy grew at a 2.3% annual rate in the second quarter of 2009, after having contracted 14.2% in the first quarter. |
| • | A key barometer of euro zone manufacturing output turned positive for the first time since May 2008, and low inventories relative to new orders suggested that inventory restocking was imminent. |
| • | The percent difference between reported earnings and analyst estimates for S&P 500 companies was at a historically high level, mainly due to better-than-expected cost-cutting. |
Every country and sector in the MSCI All Country World Index posted a gain. Emerging markets turned in the best results, supported by rising risk appetites, higher commodity prices and better growth prospects relative to developed economies. Value stocks outperformed growth stocks, thanks in large part to the strong performance of the financials sector, which has a higher weight in the value universe. Other sectors that outperformed included cyclical groups like materials and industrials, while defensive sectors like health care lagged.
Performance: The Fund’s Class I shares gained 34.38% from April 1 to September 30, 2009. The MSCI All Country World Index rose 44.58%.
Portfolio Specifics: Stock selection in the United Kingdom and the energy sector had the largest positive impact on the Fund’s results versus the index. Top-performing positions included Arm Holdings, a U.K.-based semiconductor design firm benefiting from the trend toward more sophisticated electronic devices; Petrofac, a U.K.-based oil services company that doubled its order backlog during the first half of 2009; and U.S.-based Anadarko Petroleum, an oil and gas producer that discovered oil off the coast of West Africa.
As previously noted, value stocks outperformed growth stocks during the period. This hurt relative results, since the Fund’s holdings are concentrated in growth stocks while the style-neutral benchmark is a blend of growth and value names. Stock selection in Spain, Switzerland and the financials sector also detracted. One of our weakest stocks was a Switzerland-based medical device manufacturer that reported disappointing sales.
At September 30, the Fund was overweight Europe, with an emphasis on companies whose businesses have a global focus. We also favor Asia ex-Japan equities which benefit from strength in Chinese demand and improving domestic economies. In terms of sectors, the Fund was overweight materials and industrials. These groups have high exposure to demand from emerging markets, as well as positive sensitivity to an expected upturn in the inventory cycle.
Market Outlook: We think that the key to sustaining the recent rally will be a continued positive outlook for corporate earnings, driven by improving economic and company-specific fundamentals. We thus expect the market’s focus to shift from valuation re-rating to earnings delivery over the next few months. As it does, we are confident that our focus on investing in companies with exceptional earnings visibility will benefit the Fund.
Comparison of Change in Value of a $250,000 Investment in Global Select Fund Class I and II Shares with the MSCI All Country World Index.

Annualized Total Returns As of 9/30/09 | |||
1 Year | 5 Years | 10 Years | |
| Global Select Fund Class I | –3.39% | 4.28% | 4.68% |
| MSCI All Country World Index | 0.53% | 5.10% | 2.03% |
25
GLOBAL SELECT FUND
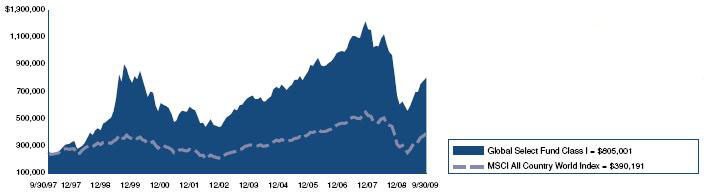
Annualized Total Returns As of 9/30/09 | |||
1 Year | 5 Years | 10 Years | |
| Global Select Fund Class II | –3.35% | 3.71% | 5.05% |
| MSCI All Country World Index | 0.53% | 5.10% | 2.03% |
The graphs above show the value of a hypothetical $250,000 investment in the Fund’s Class I and II shares compared with the Morgan Stanley Capital International All Country World Index (“MSCI ACWI”) over the periods indicated. The Fund’s Class I and II shares calculate their performance based upon the historical performance of their corresponding series of Nicholas-Applegate Mutual Funds (renamed ING Mutual Funds), adjusted to reflect all fees and expenses applicable to the Fund’s Class I and II shares. The Nicholas-Applegate Funds’ Class I shares were first available on May 7, 1999 and Class II shares on June 30, 2003. The historical performance of Class II shares includes the performance of Class I shares for periods prior to the inception of Class II. Average annual total return figures include changes in principal value, reinvested dividends, and capital gain distributions. The total returns shown above do not show the effects of income taxes on an individual’s investment. In most cases, taxes may reduce your actual Investment returns on income or gains paid by the Fund or any gains you may realize if you sell your shares. Past performance cannot guarantee future results.
The MSCI ACWI is a market capitalization weighted index composed of over 2000 companies. The MSCI ACWI is representative of the market structure of 21 countries in North America, Europe, and the Pacific Rim, excluding closed markets and those shares in otherwise free markets that are not purchasable by foreigners. Unless otherwise noted, index returns reflect the reinvestment of income dividends and capital gains, if any, but do not reflect fees, brokerage commissions or other expenses of investing. One cannot invest directly in an index.
Since markets can go down as well as up, investment return and principal value will fluctuate with market conditions, currency volatility and the social, economic and political climates of countries where the Fund invests. You may have a gain or loss when you sell your shares.
26
GLOBAL SELECT FUND
SCHEDULE OF INVESTMENTS (Unaudited)
As of September 30, 2009
| Number of | ||||||||
| Shares | Value | |||||||
| Common Stock - 97.6% | ||||||||
| Australia - 1.7% | ||||||||
| BHP Billiton, Ltd. | 12,666 | $ | 421,760 | |||||
| Belgium - 3.8% | ||||||||
| Anheuser-Busch InBev NV | 9,936 | 453,204 | ||||||
| Umicore | 15,854 | 474,136 | ||||||
| 927,340 | ||||||||
| Brazil - 1.8% | ||||||||
| Companhia Brasileira de Meios de | ||||||||
| Pagamento | 45,400 | 447,986 | ||||||
| France - 4.4% | ||||||||
| BNP Paribas | 4,698 | 374,942 | ||||||
| GDF Suez | 8,100 | 359,278 | ||||||
| Ingenico | 12,398 | 344,321 | ||||||
| 1,078,541 | ||||||||
| Germany - 7.3% | ||||||||
| Fresenius Medical Care AG & Co. KGaA | 8,468 | 421,212 | ||||||
| GEA Group AG | 17,665 | 368,206 | ||||||
| SGL Carbon SE* | 7,827 | 319,883 | ||||||
| Siemens AG* | 3,759 | 347,694 | ||||||
| ThyssenKrupp AG* | 8,936 | 307,343 | ||||||
| 1,764,338 | ||||||||
| Hong Kong - 2.7% | ||||||||
| China Mobile, Ltd. | 37,000 | 360,449 | ||||||
| China Resources Power Holdings | ||||||||
| Co. Ltd. | 122,000 | 283,038 | ||||||
| 643,487 | ||||||||
| Ireland - 1.3% | ||||||||
| C&C Group PLC | 73,754 | 310,482 | ||||||
| Israel - 1.4% | ||||||||
| Teva Pharmaceutical Industries, Ltd. - ADR | 6,500 | 328,640 | ||||||
| Japan - 7.5% | ||||||||
| ABC-Mart, Inc. | 12,500 | 390,211 | ||||||
| Fanuc, Ltd. | 4,100 | 368,627 | ||||||
| Honda Motor Co., Ltd. | 6,200 | 191,467 | ||||||
| Marubeni Corp. | 58,000 | 293,449 | ||||||
| Sumitomo Mitsui Financial Group, Inc. | 7,082 | 247,575 | ||||||
| Tsumura & Co. | 9,000 | 325,683 | ||||||
| 1,817,012 | ||||||||
| Kuwait - 0.1% | ||||||||
| Global Investment House KSCC - GDR* | 17,747 | 32,832 | ||||||
| Malaysia - 1.3% | ||||||||
| CIMB Group Holdings Berhad* | 100,400 | 321,999 | ||||||
| Netherlands - 2.7% | ||||||||
| ING Groep NV* | 14,346 | 255,828 | ||||||
| Koninklijke KPN NV | 23,682 | 392,373 | ||||||
| 648,201 | ||||||||
| Republic of China - 0.0% | ||||||||
| Peace Mark Holdings, Ltd.* | 314,000 | 405 | ||||||
| Singapore - 1.7% | ||||||||
| United Overseas Bank, Ltd. | 35,000 | 416,806 | ||||||
| Spain - 4.8% | ||||||||
| Iberdrola Renovables SA | 67,267 | 330,369 | ||||||
| Tecnicas Reunidas SA | 6,649 | 363,096 | ||||||
| Telefonica SA | 16,864 | 464,778 | ||||||
| 1,158,243 | ||||||||
| Switzerland - 9.0% | ||||||||
| ABB, Ltd.* | 20,793 | 416,802 | ||||||
| Alcon, Inc. | 3,400 | 471,478 | ||||||
| Credit Suisse Group AG | 8,872 | 491,630 | ||||||
| Nestle SA | 8,769 | 373,188 | ||||||
| Roche Holding AG* | 2,639 | 425,994 | ||||||
| 2,179,092 | ||||||||
| United Kingdom - 10.6% | ||||||||
| ARM Holdings PLC | 181,132 | 416,000 | ||||||
| BG Group PLC | 21,082 | 366,509 | ||||||
| Croda International PLC | 31,434 | 329,797 | ||||||
| HSBC Holdings PLC | 41,111 | 470,777 | ||||||
| IG Group Holdings PLC | 63,277 | 337,205 | ||||||
| Marks & Spencer Group PLC | 64,050 | 370,929 | ||||||
| Petrofac, Ltd. | 18,084 | 285,611 | ||||||
| 2,576,828 | ||||||||
| United States - 35.5% | ||||||||
| Anadarko Petroleum Corp. | 5,900 | 370,107 | ||||||
| Apple, Inc.* | 2,900 | 537,573 | ||||||
| Baker Hughes, Inc. | 7,000 | 298,620 | ||||||
| Bank of America Corp. | 28,300 | 478,836 | ||||||
| Best Buy Co., Inc. | 6,600 | 247,632 | ||||||
| CIGNA Corp.* | 9,800 | 275,282 | ||||||
| Cisco Systems, Inc.* | 17,800 | 419,012 | ||||||
| Ecolab, Inc. | 10,500 | 485,415 | ||||||
| Exxon Mobil Corp. | 5,600 | 384,216 | ||||||
| FedEx Corp. | 5,100 | 383,622 | ||||||
| Fluor Corp. | 6,400 | 325,440 | ||||||
| Guess ?, Inc. | 10,200 | 377,808 | ||||||
| JP Morgan Chase & Co. | 9,800 | 429,436 | ||||||
| Kellogg Co. | 7,700 | 379,071 | ||||||
| Mead Johnson Nutrition Co. Cl. A | 7,100 | 320,281 | ||||||
| Nike, Inc. Cl. B | 5,700 | 368,790 | ||||||
| Occidental Petroleum Corp. | 3,100 | 243,040 | ||||||
| Oracle Corp. | 23,600 | 491,824 | ||||||
| Praxair, Inc. | 5,000 | 408,450 | ||||||
| Target Corp. | 7,200 | 336,096 | ||||||
| Thermo Fisher Scientific, Inc.* | 8,300 | 362,461 | ||||||
| URS Corp.* | 7,000 | 305,550 | ||||||
| XTO Energy, Inc. | 8,500 | 351,220 | ||||||
| 8,579,782 | ||||||||
| Total Common Stock (Cost: $20,705,366) | 23,653,774 | |||||||
| Rights - 0.0% | ||||||||
| France - 0.0% | ||||||||
| BNP Paribas* (Cost: $0) | 4,698 | 10,163 | ||||||
| Principal | ||||||||
| Amount | ||||||||
| Short Term Investments - 1.9% | ||||||||
| Time Deposit - 1.9% | ||||||||
| Citibank Nassau 0.030%, 10/01/09 | ||||||||
| (Cost: $457,550) | $ | 457,550 | 457,550 | |||||
| Total Investments - 99.5% (Cost: $21,162,916) | 24,121,487 | |||||||
| Other Assets in Excess of Liabilities - 0.5% | 117,811 | |||||||
| Net Assets - 100.0% | $ | 24,239,298 | ||||||
| * Non-income producing securities. | |||
| ADR - American Depository Receipt | |||
| GDR - Global Depository Receipt |
See Accompanying Notes to Financial Statements.
27
GLOBAL SELECT FUND
SCHEDULE OF INVESTMENTS (Unaudited)
As of September 30, 2009
SCHEDULE OF INVESTMENTS BY SECTOR | ||||
| as of September 30, 2009 | ||||
| Percent of | ||||
| Sector | Net Assets | |||
| Consumer, Non-cyclical | 18.7 | % | ||
| Financial | 15.9 | |||
| Industrial | 11.8 | |||
| Basic Materials | 11.3 | |||
| Energy | 10.8 | |||
| Consumer, Cyclical | 10.7 | |||
| Technology | 7.5 | |||
| Communications | 6.7 | |||
| Utilities | 2.7 | |||
| Diversified | 1.5 | |||
| Short Term Investments | 1.9 | |||
| Total Investments | 99.5 | |||
| Other assets in excess of liabilities | 0.5 | |||
| Net Assets | 100.0 | % | ||
See Accompanying Notes to Financial Statements.
28
INTERNATIONAL GROWTH FUND
Management Team: Horacio A. Valeiras, CFA, Portfolio Manager and Chief Investment Officer; Pedro V. Marcal, Portfolio Manager
Goal: The International Growth Fund seeks to maximize long-term capital appreciation in a diversified portfolio of equity securities of companies primarily located in developed non-U.S. markets.
Market Overview: Stock markets in developed non-U.S. countries registered dramatic gains from April 1 to September 30, 2009. The gains were even greater for U.S.-based investors due to broad depreciation in the U.S. dollar.
The driving force behind the rally was the unprecedented monetary and fiscal stimulus provided by governments worldwide. These efforts helped restore investor confidence, unlock the credit markets and revive the global economy. For example:
| • | European banks issued roughly $150 billion in senior bonds in the first nine months of 2009, without government guarantees. |
| • | Several economies, including Germany, France and Japan, officially came out of recession. |
| • | Corporate earnings, while weak, were better than expected across Europe and Asia. |
Every country in the MSCI EAFE Index delivered a strong return. Singapore, the world’s most heavily trade dependent nation after Aruba, was one of the best-performing markets. Stabilization in the U.S. and Chinese economies helped send the MSCI Singapore Index up 61.52% in local currency.
Japanese shares lagged, as the country’s consumers remained reluctant to spend, and a change in political leadership raised concerns about government policies going forward. However, the MSCI Japan Index still managed an 18.88% gain in yen terms. Second-quarter GDP grew at a 2.3% annual rate, factory output rose for six straight months and Japanese export markets showed signs of improvement.
Performance: The Fund’s Class I shares gained 38.49% during the six months ended September 30, 2009. The MSCI EAFE Growth Index, the Fund’s primary benchmark, rose 42.18%, and the MSCI EAFE Index advanced 50.42%.
Portfolio Specifics: Stock selection in the United Kingdom and Ireland had a positive impact on performance versus the indexes. The Fund’s top contributor was Standard Chartered, a U.K.-based financial services firm. The company benefited from improved investor sentiment on the financials sector, as well as strength in its wholesale banking division. The Fund’s exposure to emerging countries, which are not in the benchmarks, was another plus. Overall, emerging markets outpaced developed non-U.S. markets due to the better performance of their economies, rising risk appetites and higher commodity prices.
Stock selection in Japan and Switzerland had the largest negative impact on relative results. Major detractors included a Japan-based producer of glass products that announced a change in management, and a Switzerland-based medical device manufacturer whose sales fell short of expectations. An underweight in Singapore that resulted from our bottom-up investment decisions also detracted.
Market Outlook: International equities do not appear overly expensive, despite the strength of the recent rally. In addition, the global economy continues to recover, with leading indicators rising in Europe and Asia the past six months.
Still, the road ahead is unlikely to be smooth, especially for export-dependent economies. Since March 31, the U.S. dollar has fallen 8.7% against a basket of currencies, which makes foreign goods more expensive for U.S. consumers. If the rest of the world recovers faster than the United States, and the Federal Reserve lags global peers in monetary tightening, the drop in the dollar could accelerate.
We believe that the Fund is well-positioned for this environment given the strong earnings growth prospects of our portfolio companies.
Comparison of Change in Value of a $250,000 Investment in International Growth Fund Class I Shares with the MSCI EAFE Growth Index and MSCI EAFE Index.
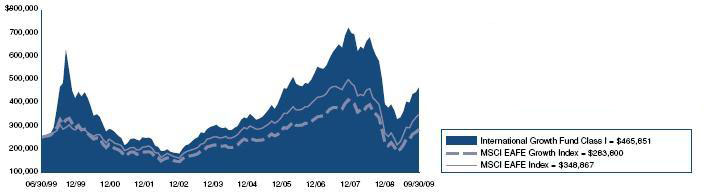
Annualized Total Returns As of 9/30/09 | |||
| Since | |||
| 1 Year | 5 Years | Inception | |
| International Growth Fund Class I | –7.56% | 9.79% | 6.25% |
| MSCI EAFE Growth Index | –0.36% | 6.12% | 1.25% |
| MSCI EAFE Index | 3.80% | 6.57% | 3.30% |
The graph above shows the value of a hypothetical $250,000 investment in the Fund’s Class I shares compared with the MSCI EAFE Growth Index and MSCI EAFE Index for the periods indicated. Average annual total return figures include changes in principal value, reinvested dividends, and capital gain distributions. The total returns shown above do not show the effects of income taxes on an individual’s investment. In most cases, taxes may reduce your actual investment returns on income or gains paid by the Fund or any gains you may realize if you sell your shares. Past performance cannot guarantee future results.
29
INTERNATIONAL GROWTH FUND
On November 18, 2005, the Fund became the successor entity to the Nicholas-Applegate International All Cap Growth Fund, a series of the Professionally Managed Portfolios (“Acquired Fund”). The Acquired Fund transferred all of its assets and liabilities in exchange for shares of the Fund, and the investment objectives, policies and limitations of the Fund are substantially similar to those of the Acquired Fund. The Performance shown above includes the historical performance of the Acquired Fund from June 30, 1999 to November 18, 2005.
The MSCI EAFE Growth Index is an unmanaged index that is a generally accepted benchmark for major overseas markets. It consists of the top 50% of the MSCI EAFE, those companies with the highest Price/Book Value ratio. The MSCI EAFE Index consists of approximately 900 companies with average market capitalization of U.S. $8.7 billion. Its weightings represent the relative capitalization of the major overseas markets included in the index on a U.S. dollar adjusted basis, unless otherwise noted, index returns reflect the reinvestment of income dividends and capital gains, if any, but do not reflect fees, brokerage commissions or other expenses of investing. One cannot invest directly into an index.
Since markets can go down as well as up, investment return and principal value will fluctuate with market conditions, currency volatility and the social, economic and political climates of countries where the Fund invests. You may have a gain or loss when you sell your shares.
30
INTERNATIONAL GROWTH FUND
SCHEDULE OF INVESTMENTS (Unaudited)
As of September 30, 2009
| Number of | ||||||||
| Shares | Value | |||||||
| Common Stock - 96.5% | ||||||||
| Australia - 7.8% | ||||||||
| Australia & New Zealand Banking | ||||||||
| Group, Ltd. | 15,509 | $ | 333,837 | |||||
| BHP Billiton, Ltd. | 10,267 | 341,877 | ||||||
| CSL, Ltd. | 8,043 | 237,511 | ||||||
| Incitec Pivot, Ltd. | 145,397 | 363,146 | ||||||
| Rio Tinto, Ltd* | 8,283 | 433,054 | ||||||
| Westpac Banking Corp. | 21,467 | 497,325 | ||||||
| WorleyParsons, Ltd. | 7,550 | 197,965 | ||||||
| 2,404,715 | ||||||||
| Belgium - 2.3% | ||||||||
| Anheuser-Busch InBev NV | 7,842 | 357,692 | ||||||
| Umicore | 12,061 | 360,701 | ||||||
| 718,393 | ||||||||
| Brazil - 3.3% | ||||||||
| Companhia Brasileira de Meios de | ||||||||
| Pagamento | 36,200 | 357,205 | ||||||
| Petroleo Brasileiro SA - ADR* | 4,900 | 224,910 | ||||||
| Vale SA - ADR | 18,900 | 437,157 | ||||||
| 1,019,272 | ||||||||
| Canada - 2.0% | ||||||||
| Barrick Gold Corp. | 8,100 | 305,948 | ||||||
| Suncor Energy, Inc. | 9,000 | 313,612 | ||||||
| 619,560 | ||||||||
| France - 8.7% | ||||||||
| Alstom SA | 4,414 | 321,758 | ||||||
| BNP Paribas | 6,375 | 508,780 | ||||||
| Compagnie Generale des Etablissements | ||||||||
| Michelin Cl. B | 3,936 | 308,432 | ||||||
| Electricite de France | 2,229 | 132,085 | ||||||
| France Telecom SA | 11,549 | 307,322 | ||||||
| GDF Suez | 5,164 | 229,051 | ||||||
| Gemalto NV* | 8,212 | 382,491 | ||||||
| Total SA | 8,132 | 482,653 | ||||||
| 2,672,572 | ||||||||
| Germany - 10.4% | ||||||||
| Aixtron AG | 13,633 | 371,047 | ||||||
| Bayer AG | 4,572 | 316,435 | ||||||
| E.ON AG | 11,083 | 469,477 | ||||||
| Fielmann AG | 3,181 | 230,856 | ||||||
| Fresenius Medical Care AG & Co. KGaA | 11,981 | 595,955 | ||||||
| MAN SE | 3,563 | 293,733 | ||||||
| Rhoen Klinikum AG | 10,292 | 261,612 | ||||||
| SAP AG | 5,838 | 283,992 | ||||||
| Siemens AG* | 3,973 | 367,488 | ||||||
| 3,190,595 | ||||||||
| Hong Kong - 4.9% | ||||||||
| BOC Hong Kong Holdings, Ltd. | 143,000 | 313,675 | ||||||
| HongKong Electric Holdings | 39,500 | 217,121 | ||||||
| Li & Fung, Ltd. | 60,000 | 246,192 | ||||||
| Shanghai Industrial Holdings, Ltd. | 67,000 | 303,011 | ||||||
| Wharf Holdings, Ltd. | 79,000 | 419,462 | ||||||
| 1,499,461 | ||||||||
| Ireland - 0.9% | ||||||||
| Icon PLC - ADR* | 11,600 | 284,084 | ||||||
| Israel - 0.7% | ||||||||
| Teva Pharmaceutical Industries, Ltd. - ADR | 4,210 | 212,858 | ||||||
| Italy - 1.7% | ||||||||
| Saipem SpA | 16,949 | 509,856 | ||||||
| Japan - 20.6% | ||||||||
| Aisin Seiki Co., Ltd. | 8,900 | 217,691 | ||||||
| Bridgestone Corp. | 17,000 | 305,880 | ||||||
| Canon, Inc. | 13,500 | 547,327 | ||||||
| East Japan Railway Co. | 4,900 | 353,538 | ||||||
| Fanuc, Ltd. | 3,200 | 287,709 | ||||||
| Honda Motor Co., Ltd. | 7,000 | 216,172 | ||||||
| JFE Holdings, Inc. | 7,700 | 264,880 | ||||||
| Kubota Corp. | 35,000 | 292,009 | ||||||
| Mitsubishi Corp. | 14,600 | 296,126 | ||||||
| Mitsubishi Electric Corp.* | 29,400 | 223,287 | ||||||
| Mitsubishi Estate Co., Ltd. | 17,200 | 271,250 | ||||||
| Mitsubishi UFJ Financial Group, Inc. | 77,100 | 415,058 | ||||||
| Nippon Sheet Glass Co., Ltd. | 39,000 | 130,675 | ||||||
| Nomura Holdings, Inc. | 26,700 | 164,909 | ||||||
| NSK, Ltd. | 28,000 | 174,189 | ||||||
| Panasonic Corp. | 10,000 | 147,763 | ||||||
| Sony Corp. | 15,500 | 459,625 | ||||||
| Sumitomo Mitsui Financial Group, Inc. | 7,192 | 251,421 | ||||||
| Tokio Marine Holdings, Inc. | 5,300 | 153,906 | ||||||
| Toyota Motor Corp. | 12,900 | 514,357 | ||||||
| Ube Industries, Ltd.* | 51,000 | 134,428 | ||||||
| Unicharm Corp. | 1,800 | 171,285 | ||||||
| Yamada Denki Co., Ltd.* | 4,620 | 313,728 | ||||||
| 6,307,213 | ||||||||
| Netherlands - 2.8% | ||||||||
| ING Groep NV* | 18,236 | 325,198 | ||||||
| Koninklijke KPN NV | 32,805 | 543,525 | ||||||
| 868,723 | ||||||||
| Republic of China - 2.5% | ||||||||
| China Yurun Food Group, Ltd. | 89,000 | 191,779 | ||||||
| Shandong Weigao Group Medical | ||||||||
| Polymer Co., Ltd. Cl. H | 64,000 | 211,406 | ||||||
| Tencent Holdings, Ltd. | 11,400 | 184,311 | ||||||
| ZTE Corp. Cl. H | 37,400 | 196,650 | ||||||
| 784,146 | ||||||||
| Singapore - 1.8% | ||||||||
| DBS Group Holdings, Ltd. | 25,000 | 235,620 | ||||||
| Singapore Exchange Ltd. | 54,000 | 322,685 | ||||||
| 558,305 | ||||||||
| South Korea - 0.8% | ||||||||
| Hyundai Motor Co.* | 2,495 | 236,107 | ||||||
| Spain - 1.2% | ||||||||
| Iberdrola SA | 20,195 | 197,925 | ||||||
| Telefonica SA | 6,349 | 174,981 | ||||||
| 372,906 | ||||||||
| Switzerland - 7.7% | ||||||||
| ABB, Ltd.* | 14,718 | 295,027 | ||||||
| Credit Suisse Group AG | 6,039 | 334,643 | ||||||
| Nestle SA | 12,999 | 553,208 | ||||||
| Roche Holding AG* | 3,760 | 606,948 | ||||||
| Syngenta AG | 1,544 | 354,287 | ||||||
| UBS AG* | 12,843 | 234,792 | ||||||
| 2,378,905 | ||||||||
See Accompanying Notes to Financial Statements.
31
INTERNATIONAL GROWTH FUND
SCHEDULE OF INVESTMENTS (Unaudited)
As of September 30, 2009
| Number of | ||||||||
| Shares | Value | |||||||
| United Kingdom - 16.4% | ||||||||
| ARM Holdings PLC | 155,326 | $ | 356,732 | |||||
| BG Group PLC | 16,429 | 285,617 | ||||||
| BP PLC | 52,196 | 461,643 | ||||||
| British American Tobacco PLC | 13,896 | 436,268 | ||||||
| Diageo PLC | 25,044 | 384,520 | ||||||
| HSBC Holdings PLC | 35,232 | 403,454 | ||||||
| HSBC Holdings PLC | 19,933 | 231,350 | ||||||
| Imperial Tobacco Group PLC | 12,160 | 351,622 | ||||||
| Marks & Spencer Group PLC | 57,720 | 334,271 | ||||||
| Reckitt Benckiser Group PLC | 8,976 | 438,999 | ||||||
| SSL International PLC | 16,491 | 168,799 | ||||||
| Standard Chartered PLC | 30,800 | 757,873 | ||||||
| Unilever PLC | 7,750 | 220,382 | ||||||
| Vodafone Group PLC | 100,490 | 225,328 | ||||||
| 5,056,858 | ||||||||
| Total Common Stock (Cost: $24,157,554) | 29,694,529 | |||||||
| Preferred Stock - 1.7% | ||||||||
| Brazil - 1.7% | ||||||||
| Usinas Siderurgicas de Minas Gerais SA | ||||||||
| (Cost: $257,558) | 19,750 | 517,806 | ||||||
| Rights - 0.0% | ||||||||
| France - 0.0% | ||||||||
| BNP Paribas* (Cost: $0) | 6,375 | 13,791 | ||||||
| Principal | ||||||||
| Amount | ||||||||
| Short Term Investments - 1.1% | ||||||||
| Time Deposit - 1.1% | ||||||||
| Citibank London 0.030%, 10/01/09 | ||||||||
| (Cost: $334,257) | $ | 334,257 | 334,257 | |||||
| Total Investments - 99.3% (Cost: $24,749,369) | 30,560,383 | |||||||
| Other Assets in Excess of Liabilities - 0.7% | 223,442 | |||||||
| Net Assets - 100.0% | $ | 30,783,825 | ||||||
| * Non-income producing securities. | ||
| ADR - American Depository Receipt |
SCHEDULE OF INVESTMENTS BY SECTOR | ||||
| as of September 30, 2009 | ||||
| Percent of | ||||
| Sector | Net Assets | |||
| Consumer, Non-cyclical | 19.4 | % | ||
| Financial | 19.0 | |||
| Consumer, Cyclical | 12.6 | |||
| Basic Materials | 12.4 | |||
| Industrial | 10.4 | |||
| Technology | 6.4 | |||
| Energy | 6.4 | |||
| Communications | 5.2 | |||
| Utilities | 4.0 | |||
| Diversified | 2.4 | |||
| Short Term Investments | 1.1 | |||
| Total Investments | 99.3 | |||
| Other assets in excess of liabilities | 0.7 | |||
| Net Assets | 100.0 | % | ||
See Accompanying Notes to Financial Statements.
32
INTERNATIONAL GROWTH OPPORTUNITIES FUND
Management Team: Christopher A. Herrera, Portfolio Manager; Nelson W. Shing, Portfolio Manager
Chief Investment Officer: Horacio A. Valeiras, CFA
Goal: The International Growth Opportunities Fund seeks to maximize long-term capital appreciation through investments primarily in companies located outside the United States with market capitalizations predominantly in the bottom 20% of publicly traded companies, as measured by the market capitalization in the S&P Developed Ex-US BMI.
Market Overview: From April 1 to September 30, 2009, international equities continued to rebound from March lows on signs the global economy was recovering from the credit crisis. Depreciation in the U.S. dollar versus a range of currencies boosted the gains for U.S.-based investors. The rally was broad-based, although small-cap stocks outperformed large caps amid rising risk appetites.
In Europe, stronger-than-expected corporate earnings and a return to growth for the region’s two largest economies buoyed investor sentiment. Germany’s economy grew at a 1.3% annual rate during the second quarter of 2009, its first expansion in more than a year. France also returned to growth, with output rising 1.4%. Both economies were helped by gains in household spending, which were driven by government stimulus programs and relatively low consumer debt.
Japan also came out of recession, with GDP growing at a 2.3% annual pace in the second quarter. The Japanese recovery was bolstered by a nearly 30% spike in exports, with China playing a major role in the rebound. However, the Japanese stock market lagged most other international markets. The country’s unemployment rate hit a record high, and consumer spending remained stagnant. In addition, investors questioned the free-market credentials of a newly elected government.
Performance: During the six-month period ended September 30, 2009, the Fund’s Class I shares gained 57.40%. The S&P Developed Ex-US Small Cap Growth Index, the Fund’s primary benchmark, and the S&P Developed Ex-US Small Cap Index, gained 60.47% and 61.76%, respectively.
Portfolio Specifics: Stock selection in Italy, Belgium and the information technology and materials sectors positively impacted results versus the indexes. One of our best-performing stocks was EVS Broadcast Equipment, a Belgium-based manufacturer of systems and software for the broadcasting industry. The company’s business rebounded from a weak second half of 2008, when its market was saturated after the summer Olympics and the economy weakened. Other top performers included Mount Gibson Iron, an Australia-based mining company that benefited from record steel production in China, and Maire Tecnimont, an Italy-based engineering and construction firm whose order backlog was expected to show strong growth.
Stock selection in France, Japan and the financials and health care sectors negatively impacted the Fund’s relative performance. Notable detractors included a France-based printing company that faced higher pension expenses, a Japan-based installer of ATM machines that issued a disappointing outlook, and a Japan-based food producer that was hurt by margin pressure in its domestic instant noodle business.
Market Outlook: We think that the key to sustaining the recent rally will be a continued positive outlook for corporate earnings, driven by improving economic and company-specific fundamentals. We thus expect the market’s focus to shift from valuation re-rating to earnings delivery over the next few months. We believe the Fund is well-positioned for this type of environment given our bottom-up approach to stock selection.
Comparison of Change in Value of a $250,000 Investment in International Growth Opportunities Fund Class I and II Shares with the S&P Developed Ex-US Small Cap Growth Index and the S&P Developed Ex-US Small Cap Index.

Annualized Total Returns As of 9/30/09 | |||
1 Year | 5 Years | 10 Years | |
| International Growth Opportunities | |||
| Fund Class I | 12.99% | 11.29% | 8.73% |
| S&P Developed Ex-US Small | |||
| Cap Growth Index | 10.20% | 7.61% | 4.24% |
| S&P Developed Ex-US Small | |||
| Cap Index | 10.09% | 8.38% | 6.86% |
33
INTERNATIONAL GROWTH OPPORTUNITIES FUND
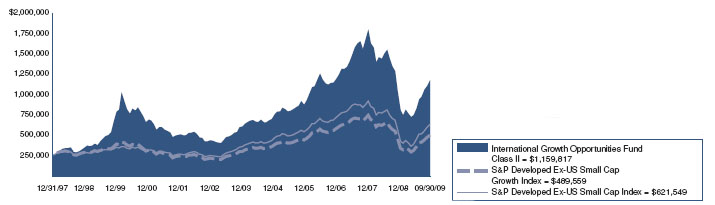
Annualized Total Returns As of 9/30/09 | |||
1 Year | 5 Years | 10 Years | |
| International Growth Opportunities | |||
| Fund Class II | 13.14% | 11.45% | 8.83% |
| S&P Developed Ex-US Small | |||
| Cap Growth Index | 10.20% | 7.61% | 4.24% |
| S&P Developed Ex-US Small | |||
| Cap Index | 10.09% | 8.38% | 6.86% |
The graphs above show the value of a hypothetical $250,000 investment in the Fund’s Class I through III shares compared with the S&P Developed Ex-US Small Cap Index and S&P Developed Ex-US Small Cap Growth Index for the periods indicated. The Fund’s Class I through III shares calculate their performance based upon the historical performance of their corresponding series of Nicholas-Applegate Mutual Funds (renamed ING Mutual Funds), adjusted to reflect all fees and expenses applicable to the Fund’s Class I through III shares. The Nicholas-Applegate Institutional Funds’ Class I shares were first available on May 7, 1999, Class II shares commenced operations on June 5, 2003 and Class III shares on September 8, 2008. The historical performance of Class II and III shares includes the performance of Class I shares for periods prior to the inception of the relevant class. Average annual total return figures include changes in principal value, reinvested dividends, and capital gain distributions. The total returns shown above do not show the effects of income taxes on an individual’s investment. In most cases, taxes may reduce your actual investment returns on income or gains paid by the Fund or any gains you may realize if you sell your shares. Past performance cannot guarantee future results.
As of 1-Oct-08, the S&P/Citigroup World xUS EMI and S&P/Citigroup World xUS EMI Growth indices have been renamed the S&P Developed Ex-US Small Cap and S&P Developed Ex-US Small Cap Growth, respectively. The S&P Developed Ex-US Small Cap is a market capitalization weighted index measuring capital appreciation. It is an unmanaged world equity index representative of small capitalization securities, defined as the bottom 20% of any given country’s available market capitalization excluding the U.S. The index does not include dividends; however, total rates of return, including all payments to shareholders, are calculated and published each month-end. S&P Developed Ex-US Small Cap Growth covers those small capitalization companies in each country that exhibit the characteristics of growth.
Investors may not make direct investments into any index. Since markets can go down as well as up, investment return and principal value will fluctuate with market conditions. You may have a gain or loss when you sell shares.
34
INTERNATIONAL GROWTH OPPORTUNITIES FUND
SCHEDULE OF INVESTMENTS (Unaudited)
As of September 30, 2009
| Number of | ||||||||
| Shares | Value | |||||||
| Common Stock - 88.3% | ||||||||
| Australia - 3.7% | ||||||||
| Aquarius Platinum, Ltd.* | 292,316 | $ | 1,299,693 | |||||
| Mount Gibson Iron, Ltd.* | 1,833,866 | 1,780,326 | ||||||
| Paladin Energy, Ltd.* | 292,444 | 1,161,434 | ||||||
| 4,241,453 | ||||||||
| Belgium - 5.2% | ||||||||
| EVS Broadcast Equipment SA | 47,467 | 3,547,528 | ||||||
| Umicore | 80,115 | 2,395,950 | ||||||
| 5,943,478 | ||||||||
| Bermuda - 1.2% | ||||||||
| Allied World Assurance Co. | ||||||||
| Holdings, Ltd. | 27,600 | 1,322,868 | ||||||
| Brazil - 1.2% | ||||||||
| Light S.A.* | 98,400 | 1,364,212 | ||||||
| Canada - 4.3% | ||||||||
| Calfrac Well Services, Ltd. | 93,300 | 1,651,635 | ||||||
| Capstone Mining Corp.* | 507,900 | 1,391,248 | ||||||
| RONA, Inc.* | 133,000 | 1,858,753 | ||||||
| 4,901,636 | ||||||||
| France - 6.8% | ||||||||
| EDF Energies Nouvelles SA | 39,523 | 2,176,225 | ||||||
| Ingenico | 87,412 | 2,427,632 | ||||||
| Nexans SA | 25,283 | 2,041,089 | ||||||
| SCOR SE | 38,404 | 1,048,604 | ||||||
| 7,693,550 | ||||||||
| Germany - 7.2% | ||||||||
| GEA Group AG | 109,528 | 2,282,984 | ||||||
| Rhoen Klinikum AG | 68,591 | 1,743,512 | ||||||
| SGL Carbon SE* | 47,494 | 1,941,039 | ||||||
| Wirecard AG | 186,384 | 2,217,641 | ||||||
| 8,185,176 | ||||||||
| Greece - 1.7% | ||||||||
| JUMBO SA* | 144,405 | 1,899,691 | ||||||
| Hong Kong - 2.9% | ||||||||
| China Power International | ||||||||
| Development, Ltd.* | 3,914,000 | 1,121,164 | ||||||
| Dah Sing Financial Holdings, Ltd.* | 374,800 | 2,166,572 | ||||||
| 3,287,736 | ||||||||
| Ireland - 2.7% | ||||||||
| C&C Group PLC | 339,568 | 1,429,478 | ||||||
| C&C Group PLC | 57,381 | 242,395 | ||||||
| Icon PLC - ADR* | 56,900 | 1,393,481 | ||||||
| 3,065,354 | ||||||||
| Italy - 6.4% | ||||||||
| Ansaldo STS SpA | 64,887 | 1,326,886 | ||||||
| Autogrill SpA* | 174,078 | 2,101,755 | ||||||
| Azimut Holding SpA | 136,807 | 1,726,748 | ||||||
| Maire Tecnimont SpA | 439,264 | 2,131,680 | ||||||
| 7,287,069 | ||||||||
| Japan - 14.3% | ||||||||
| ABC-Mart, Inc. | 65,900 | 2,057,190 | ||||||
| Hogy Medical Co., Ltd. | 20,100 | 1,129,201 | ||||||
| Mizuho Securities Co., Ltd.* | 237,000 | 865,572 | ||||||
| OKUMA Corp.* | 313,000 | 1,580,120 | ||||||
| Pigeon Corp. | 25,500 | 1,016,753 | ||||||
| Point, Inc. | 24,700 | 1,638,666 | ||||||
| Seven Bank, Ltd. | 425 | 1,053,778 | ||||||
| The Japan Steel Works, Ltd. | 121,300 | 1,398,130 | ||||||
| Torishima Pump Manufacturing Co., Ltd. | 70,300 | 1,154,197 | ||||||
| Towa Pharmaceutical Co., Ltd. | 26,400 | 1,300,318 | ||||||
| Tsumura & Co. | 41,000 | 1,483,666 | ||||||
| Unicharm Petcare Corp. | 44,300 | 1,652,560 | ||||||
| 16,330,151 | ||||||||
| Netherlands - 2.2% | ||||||||
| Unit 4 Agresso NV* | 117,109 | 2,516,320 | ||||||
| Norway - 1.1% | ||||||||
| Pronova BioPharma AS* | 421,000 | 1,269,755 | ||||||
| Republic of China - 1.3% | ||||||||
| Golden Eagle Retail Group, Ltd. | 877,000 | 1,468,824 | ||||||
| Peace Mark Holdings, Ltd.* | 2,428,000 | 3,133 | ||||||
| 1,471,957 | ||||||||
| Singapore - 3.6% | ||||||||
| Hyflux, Ltd. | 991,000 | 2,145,097 | ||||||
| MobileOne Ltd. | 1,533,000 | 1,925,702 | ||||||
| 4,070,799 | ||||||||
| Switzerland - 2.8% | ||||||||
| Banque Cantonale Vaudoise | 3,928 | 1,616,399 | ||||||
| Partners Group Holding AG | 12,814 | 1,560,921 | ||||||
| 3,177,320 | ||||||||
| United Kingdom - 19.7% | ||||||||
| ARM Holdings PLC | 545,020 | 1,251,729 | ||||||
| ASOS PLC* | 223,854 | 1,253,073 | ||||||
| Babcock International Group | 217,225 | 1,975,076 | ||||||
| Charter International PLC | 144,078 | 1,580,758 | ||||||
| Chemring Group PLC | 50,382 | 1,969,337 | ||||||
| Cookson Group PLC* | 203,906 | 1,340,667 | ||||||
| Croda International PLC | 156,827 | 1,645,387 | ||||||
| Dana Petroleum PLC* | 74,323 | 1,666,536 | ||||||
| IG Group Holdings PLC | 323,665 | 1,724,822 | ||||||
| Inchcape PLC* | 2,616,275 | 1,177,892 | ||||||
| Petrofac, Ltd. | 105,821 | 1,671,293 | ||||||
| Restaurant Group PLC | 548,393 | 1,692,750 | ||||||
| RPS Group PLC | 437,091 | 1,572,888 | ||||||
| Victrex PLC | 161,593 | 1,973,218 | ||||||
| 22,495,426 | ||||||||
| Total Common Stock (Cost: $83,775,754) | 100,523,951 | |||||||
See Accompanying Notes to Financial Statements.
35
INTERNATIONAL GROWTH OPPORTUNITIES FUND
SCHEDULE OF INVESTMENTS (Unaudited)
As of September 30, 2009
| Number of | ||||||||
| Shares | Value | |||||||
| Equity-Linked Securities - 3.5% | ||||||||
| Taiwan - 3.5% | ||||||||
| Credit Suisse FB Giant | ||||||||
| Manufacturing - 8/22/11 | 639,441 | $ | 1,728,473 | |||||
| Merrill Lynch Wistron Corp. - | ||||||||
12/03/12 144A#,* | 1,234,441 | 2,296,184 | ||||||
| 4,024,657 | ||||||||
| Total Equity-Linked Securities (Cost: $2,285,053) | 4,024,657 | |||||||
| Preferred Stock - 2.0% | ||||||||
| Brazil - 2.0% | ||||||||
| Banco do Estado do Rio Grande | ||||||||
| do Sul (Cost: $1,428,794) | 364,900 | 2,232,493 | ||||||
| Principal | ||||||||
| Amount | ||||||||
| Short Term Investments - 8.3% | ||||||||
| Time Deposit - 8.3% | ||||||||
| Citibank London 0.030%, 10/01/09 | ||||||||
| (Cost: $9,441,534) | $ | 9,441,534 | 9,441,534 | |||||
| Total Investments - 102.1% (Cost: $96,931,135) | 116,222,635 | |||||||
| Liabilities in Excess of Other Assets - (2.1%) | (2,374,042 | ) | ||||||
| Net Assets - 100.0% | $ | 113,848,593 | ||||||
| * | Non-income producing securities. | |
| # | 144A Security. Certain condition for public sale may exist. The total market value of 144A securities owned at September 30, 2009 was $2,296,184 or 2.02% of net assets. | |
| ADR - American Depository Receipt | ||
SCHEDULE OF INVESTMENTS BY SECTOR | ||||
| as of September 30, 2009 | ||||
| Percent of | ||||
| Sector | Net Assets | |||
| Consumer, Non-cyclical | 17.6 | % | ||
| Industrial | 15.9 | |||
| Financial | 13.5 | |||
| Consumer, Cyclical | 12.1 | |||
| Basic Materials | 11.8 | |||
| Energy | 8.3 | |||
| Technology | 7.5 | |||
| Communications | 2.8 | |||
| Utilities | 2.2 | |||
| Diversified | 2.1 | |||
| Short Term Investments | 8.3 | |||
| Total Investments | 102.1 | |||
| Liabilities in excess of other assets | (2.1 | ) | ||
| Net Assets | 100.0 | % | ||
See Accompanying Notes to Financial Statements.
36
EMERGING MARKETS FUND
Management Team: Kunal Ghosh, Portfolio Manager; Steven Tael, Ph.D., CFA, Portfolio Manager
Chief Investment Officer: Horacio A. Valeiras, CFA
Goal: The Emerging Markets Fund seeks to maximize long-term capital appreciation primarily through investments in countries with emerging securities markets. These markets have yet to reach a level of maturity associated with the developed foreign stock markets and are, in the opinion of the Investment Adviser, less sophisticated than more developed markets in terms of participation, analyst coverage, liquidity and regulation.
Market Overview: Emerging market equities posted impressive gains during the six months ended September 30, 2009. Stocks soared as fear that the global economy might fall into a deflationary spiral gave way to optimism that the recession was ending. Returns in every country in the MSCI Emerging Markets Index were positive in local currencies. Weakness in the U.S. dollar accentuated the gains for U.S.-based investors. Some of the best-performing countries were:
| • | India, where national elections brought the market-friendly Congress Party a resounding victory |
| • | Russia, which benefited from a 42% increase in the price of oil and stabilization of the ruble |
| • | Thailand, whose export-dependent economy officially came out of its first recession in more than a decade |
The rally had a speculative quality to it, which is often the case coming out of a severe market decline like the one that occurred last fall and winter. Many of the stocks that did the best were stocks that had suffered the biggest losses during the downturn. In general, these were stocks of companies with weak fundamentals — companies that had no earnings growth, distressed balance sheets or both.
Performance: Between April 1 and September 30, 2009, the Fund’s Class I shares gained 57.55% and the MSCI Emerging Markets Index rose 63.21%.
Portfolio Specifics: The Fund’s positive return was broad-based, with holdings in all countries and sectors delivering gains. One of our best-performing stocks was Turk Hava Yollari, a Turkish airline with strong passenger growth that is expanding its fleet.
In contrast, our position in Au Optronics negatively impacted the Fund’s results. This Taiwan-based company, which makes flat panels for liquid crystal display (LCD) TVs, experienced a sharp recovery in sales due to strong demand from China. Unfortunately, the market did not reward this fundamental improvement and the stock lagged.
The performance of Au Optronics helps illustrate why the Fund trailed the index this period. With the global equity markets in such a state of transition, the normal relationship between company fundamentals and stock prices broke down. In this environment, our bottom-up investment style was not in favor because it focuses on company fundamentals.
The systematic, model-driven nature of our approach was another challenge given the rapid shift in expectations for the global economy. Systematic processes like ours tend to struggle when the market hits these types of inflection points, because information is changing faster than it can be reflected in the model. However, as expectations for the economy stabilized toward the end of the period, the Fund’s relative performance also stabilized.
Market Outlook: The Fund’s investment process evaluates opportunities on a relative basis and neither utilizes, nor results in, a forecast or outlook on the overall market. Rather, the Fund expects to outperform the MSCI Emerging Markets Index in both up and down markets.
We believe that the Fund’s proprietary stock-selection model, in conjunction with its risk-controlled approach to portfolio construction, will deliver strong relative performance over time.
Comparison of Change in Value of a $250,000 Investment in Emerging Markets Fund Class I and II Shares with the MSCI EM Index.
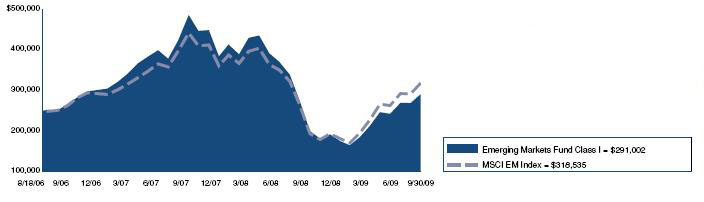
Annualized Total Returns As of 9/30/09 | ||
| Since | ||
| 1 Year | Inception | |
| Emerging Markets Fund Class I | 5.27% | 4.99% |
| MSCI EM Index | 19.44% | 8.08% |
37
EMERGING MARKETS FUND
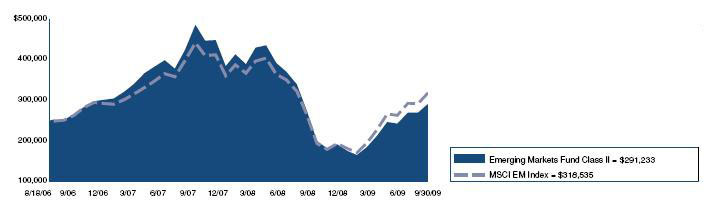
Annualized Total Returns As of 9/30/09 | ||
| Since | ||
| 1 Year | Inception | |
| Emerging Markets Fund Class II | 5.34% | –1.34% |
| MSCI EM Index | 19.44% | 8.08% |
The graphs above show the value of a hypothetical $250,000 investment in the Fund’s Class I and II shares compared with the Morgan Stanley Capital International Emerging Markets Index (“MSCI EM”) over the periods indicated. Average annual total return figures include changes in principal value, reinvested dividends, and capital gain distributions. The total returns shown above do not show the effects of income taxes on an individual’s investment. In most cases, taxes may reduce your actual investment returns on income or gains paid by the Fund or any gains you may realize if you sell your shares. Past performance cannot guarantee future results.
The MSCI EM Index is a market capitalization weighted index composed of over 800 companies representative of the market structure of emerging countries in Europe, Latin America, Africa, Middle East and Asia. The MSCI EM Index excludes closed markets and those shares in otherwise free markets that are not purchasable by foreigners. Index weightings represent the relative capitalizations of the major overseas markets included in the index on a U.S. dollar adjusted basis.
Unless otherwise noted, index returns reflect the reinvestment of income dividends and capital gains, if any, but do not reflect fees, brokerage commissions or other expenses of investing. One cannot invest directly in an index. Since markets can go down as well as up, investment return and principal value will fluctuate with market conditions, currency volatility and the social, economic and political climates of countries where the Fund invests. You may have a gain or loss when you sell your shares.
38
EMERGING MARKETS FUND
SCHEDULE OF INVESTMENTS (Unaudited)
As of September 30, 2009
| Number of | ||||||||
| Shares | Value | |||||||
| Common Stock - 93.8% | ||||||||
| Brazil - 12.7% | ||||||||
| Banco do Brasil SA | 25,700 | $ | 450,500 | |||||
| Cia de Saneamento Basico do Estado de Sao Paulo - ADR | 6,600 | 250,338 | ||||||
| Compania de Bebidas das Americas - ADR | 2,500 | 205,650 | ||||||
| Cosan SA Industria e Comercio* | 12,000 | 131,747 | ||||||
| Diagnosticos da America SA* | 10,000 | 257,185 | ||||||
| Lojas Renner SA | 24,700 | 430,614 | ||||||
| PDG Realty SA Empreendimentos e Participacoes | 52,000 | 429,053 | ||||||
| Petroleo Brasileiro SA - ADR* | 17,200 | 789,480 | ||||||
| Petroleo Brasileiro SA - ADR* | 30,200 | 1,187,161 | ||||||
| Vale SA - ADR | 31,200 | 721,656 | ||||||
| Vivo Participacoes SA - ADR* | 14,200 | 358,550 | ||||||
| 5,211,934 | ||||||||
| Chile - 0.4% | ||||||||
| Enersis SA - ADR | 8,600 | 158,670 | ||||||
| Egypt - 0.7% | ||||||||
| El Ezz Steel Co.* | 28,342 | 78,968 | ||||||
| Maridive & Oil Services SAE | 48,395 | 198,420 | ||||||
| 277,388 | ||||||||
| Hong Kong - 3.0% | ||||||||
| China Agri-Industries Holdings, Ltd. | 388,000 | 362,965 | ||||||
| China Mobile, Ltd. | 58,000 | 565,029 | ||||||
| China Pharmaceutical Group, Ltd. | 176,000 | 98,332 | ||||||
| China Resources Land, Ltd. | 86,000 | 188,200 | ||||||
| 1,214,526 | ||||||||
| Hungary - 0.6% | ||||||||
| Magyar Telekom Telecommunications PLC | 53,783 | 234,253 | ||||||
| India - 6.2% | ||||||||
| Allahabad Bank | 102,281 | 253,762 | ||||||
| Balrampur Chini Mills, Ltd.* | 97,136 | 246,954 | ||||||
| Bharat Petroleum Corp., Ltd. | 10,993 | 132,314 | ||||||
| Infosys Technologies, Ltd. | 5,227 | 250,338 | ||||||
| Maruti Suzuki India, Ltd. | 5,142 | 182,677 | ||||||
| McLeod Russel India, Ltd. | 45,487 | 206,609 | ||||||
| Mphasis, Ltd.* | 23,248 | 322,514 | ||||||
| Polaris Software Lab, Ltd. | 50,550 | 158,307 | ||||||
| Punjab National Bank, Ltd. | 20,014 | 336,645 | ||||||
| Tata Motors, Ltd. | 21,824 | 268,303 | ||||||
| Unitech, Ltd. | 79,223 | 176,875 | ||||||
| 2,535,298 | ||||||||
| Indonesia - 4.0% | ||||||||
| Astra International Tbk PT | 105,000 | 362,312 | ||||||
| Bank Central Asia Tbk PT | 538,500 | 257,689 | ||||||
| Bank Mandiri Tbk PT | 453,000 | 220,290 | ||||||
| Bumi Resources Tbk PT | 877,500 | 292,803 | ||||||
| Indofood Sukses Makmur Tbk PT | 644,000 | 201,562 | ||||||
| United Tractors Tbk PT | 196,000 | 316,358 | ||||||
| 1,651,014 | ||||||||
| Israel - 1.5% | ||||||||
| Teva Pharmaceutical Industries, Ltd. - ADR | 12,200 | 616,832 | ||||||
| Kuwait - 0.0% | ||||||||
| Global Investment House KSCC - GDR* | 9,656 | 17,864 | ||||||
| Malaysia - 1.1% | ||||||||
| CIMB Group Holdings Berhad* | 141,000 | 452,210 | ||||||
| Mexico - 2.4% | ||||||||
| America Movil SAB De CV Series L - ADR | 15,600 | 683,748 | ||||||
| Wal-Mart de Mexico SAB de CV | 82,300 | 285,199 | ||||||
| 968,947 | ||||||||
| Philippines - 0.4% | ||||||||
| Robinsons Land Corp. | 827,500 | 183,384 | ||||||
| Poland - 1.2% | ||||||||
| KGHM Polska Miedz SA | 16,379 | 488,251 | ||||||
| Republic of China - 16.2% | ||||||||
| Anta Sports Products, Ltd. | 136,600 | 169,207 | ||||||
| Bank of China, Ltd. | 1,310,000 | 689,647 | ||||||
| Bank of Communications Co., Ltd. | 177,000 | 215,596 | ||||||
| Changyou.com, Ltd. - ADR* | 3,400 | 120,768 | ||||||
| China Construction Bank Corp.* | 636,000 | 508,797 | ||||||
| China Life Insurance Co., Ltd. | 135,000 | 587,899 | ||||||
| China Petroleum & Chemical Corp. | 714,000 | 608,048 | ||||||
| China Shanshui Cement Group, Ltd. | 296,000 | 220,757 | ||||||
| Dongfeng Motor Group Co., Ltd. | 230,000 | 243,353 | ||||||
| Huadian Power International Co.* | 544,000 | 174,781 | ||||||
| Industrial & Commercial Bank of China | 1,216,300 | 914,965 | ||||||
| Jiangxi Copper Co., Ltd. | 103,000 | 230,984 | ||||||
| PetroChina Co., Ltd. | 284,000 | 321,376 | ||||||
| Semiconductor Manufacturing International Corp.* | 1,827,000 | 86,045 | ||||||
| Tencent Holdings, Ltd. | 37,200 | 601,436 | ||||||
| Tsingtao Brewery Co., Ltd. | 52,000 | 197,263 | ||||||
| Weichai Power Co., Ltd.* | 67,000 | 353,153 | ||||||
| Weiqiao Textile Co. | 150,000 | 92,516 | ||||||
| Xingda International Holdings, Ltd. | 767,000 | 318,674 | ||||||
| 6,655,265 | ||||||||
| Russian Federation - 5.2% | ||||||||
| Gazprom OAO - ADR | 18,450 | 436,158 | ||||||
| LUKOIL - ADR | 7,900 | 433,315 | ||||||
| Magnitogorsk Iron & Steel Works - GDR* | 22,000 | 204,600 | ||||||
| Mobile Telesystems OJSC - ADR | 7,700 | 371,679 | ||||||
| Novolipetsk Steel OJSC - GDR* | 8,100 | 206,145 | ||||||
| Rosneft Oil Co. - GDR | 39,050 | 291,105 | ||||||
| Sistema JSFC - GDR* | 12,100 | 176,660 | ||||||
| 2,119,662 | ||||||||
| South Africa - 7.1% | ||||||||
| Aveng, Ltd.* | 78,307 | 446,951 | ||||||
| Impala Platinum Holdings, Ltd. | 16,989 | 392,356 | ||||||
| Imperial Holdings, Ltd. | 23,610 | 248,735 | ||||||
| Investec, Ltd. | 27,028 | 203,776 | ||||||
| Kumba Iron Ore, Ltd. | 8,558 | 280,090 | ||||||
| MTN Group, Ltd.* | 19,686 | 317,340 | ||||||
| Naspers, Ltd. Cl. N | 12,597 | 426,694 | ||||||
| Sanlam, Ltd. | 122,171 | 330,680 | ||||||
| Sasol, Ltd. | 7,203 | 268,443 | ||||||
| 2,915,065 | ||||||||
See Accompanying Notes to Financial Statements.
39
EMERGING MARKETS FUND
SCHEDULE OF INVESTMENTS (Unaudited)
As of September 30, 2009
| Number of | ||||||||
| Shares | Value | |||||||
| South Korea - 13.0% | ||||||||
| Daewoo Securities Co., Ltd.* | 9,000 | $ | 164,609 | |||||
| Daewoo Shipbuilding & Marine Engineering Co., Ltd.* | 7,730 | 112,842 | ||||||
| Honam Petrochemical Corp.* | 1,619 | 121,880 | ||||||
| Hyundai Motor Co.* | 2,193 | 207,528 | ||||||
| KB Financial Group, Inc.* | 3,470 | 178,175 | ||||||
| Kolon Industries, Inc.* | 10,140 | 360,591 | ||||||
| LG Chem, Ltd.* | 3,773 | 701,283 | ||||||
| LG Corp.* | 5,030 | 337,254 | ||||||
| LG Telecom, Ltd.* | 44,670 | 322,632 | ||||||
| Lotte Shopping Co., Ltd.* | 486 | 130,961 | ||||||
| POSCO | 1,101 | 455,071 | ||||||
| Samsung Card Co.* | 3,498 | 156,753 | ||||||
| Samsung Electronics Co., Ltd. | 1,985 | 1,373,033 | ||||||
| Shinhan Financial Group Co., Ltd.* | 8,280 | 330,286 | ||||||
| SK Energy Co., Ltd.* | 928 | 99,239 | ||||||
| Sungwoo Hitech Co., Ltd.* | 29,392 | 265,669 | ||||||
| 5,317,806 | ||||||||
| Taiwan - 10.1% | ||||||||
| Advanced Semiconductor | ||||||||
| Engineering, Inc. | 433,000 | 356,254 | ||||||
| Compal Electronics, Inc. | 295,590 | 344,340 | ||||||
| Formosa Plastics Corp. | 59,200 | 120,617 | ||||||
| Hannstar Board Corp. | 226,000 | 208,088 | ||||||
| HON HAI Precision Industry Co., Ltd. | 145,000 | 581,840 | ||||||
| Lite-On Technology Corp. | 171,930 | 225,421 | ||||||
| MediaTek, Inc. | 46,076 | 768,220 | ||||||
| Quanta Computer, Inc. | 370,919 | 778,806 | ||||||
| Taiwan Semiconductor Manufacturing Co., Ltd. - ADR | 28,900 | 316,744 | ||||||
| Unimicron Technology Corp. | 193,000 | 234,736 | ||||||
| WPG Holdings Co., Ltd. | 142,000 | 200,977 | ||||||
| 4,136,043 | ||||||||
| Thailand - 3.1% | ||||||||
| Banpu PCL | 13,100 | 168,602 | ||||||
| Charoen Pokphand Foods PCL | 770,200 | 183,271 | ||||||
| Kiatnakin Bank PCL | 343,100 | 243,385 | ||||||
| PTT Exploration & Production PCL | 33,900 | 146,619 | ||||||
| PTT PCL | 53,100 | 416,409 | ||||||
| Thai Vegetable Oil PCL | 252,600 | 127,774 | ||||||
| 1,286,060 | ||||||||
| Turkey - 4.3% | ||||||||
| Arcelik* | 99,008 | 286,429 | ||||||
| Sinpas Gayrimenkul Yatirim Ortakligi AS - REIT | 87,360 | 317,384 | ||||||
| Turk Hava Yollari | 260,242 | 675,840 | ||||||
| Turkiye Garanti Bankasi AS | 123,918 | 466,876 | ||||||
| 1,746,529 | ||||||||
| United Kingdom - 0.6% | ||||||||
| Kazakhmys PLC* | 13,431 | 230,705 | ||||||
| Total Common Stock (Cost: $28,238,051) | 38,417,706 | |||||||
| Preferred Stock - 3.2% | ||||||||
| Brazil - 3.2% | ||||||||
| Bradespar SA | 9,000 | 164,683 | ||||||
| Contax Participacoes SA | 4,000 | 179,569 | ||||||
| Investimentos Itau SA | 126,400 | 760,557 | ||||||
| Metalurgica Gerdau SA Cl. A* | 11,600 | 193,051 | ||||||
| 1,297,860 | ||||||||
| Total Preferred Stock (Cost: $791,760) | 1,297,860 | |||||||
| Principal | ||||||||
| Amount | Value | |||||||
| Short Term Investments - 4.8% | ||||||||
| Time Deposit - 4.8% | ||||||||
| Citibank Nassau 0.030%, 10/01/09 | ||||||||
| (Cost: $1,960,330) | $ | 1,960,330 | $ | 1,960,330 | ||||
| Total Investments - 101.8% (Cost: $30,990,141) | 41,675,896 | |||||||
| Liabilities in Excess of Other Assets - (1.8%) | (717,271 | ) | ||||||
| Net Assets - 100.0% | $ | 40,958,625 | ||||||
* Non-income producing securities.
ADR - American Depository Receipt
GDR - Global Depository Receipt
REIT - Real Estate Investment Trust
SCHEDULE OF INVESTMENTS BY SECTOR
as of September 30, 2009
| Percent of | ||||
| Sector | Net Assets | |||
| Financial | 20.3 | % | ||
| Energy | 14.2 | |||
| Technology | 12.6 | |||
| Basic Materials | 12.1 | |||
| Communications | 10.0 | |||
| Consumer, Cyclical | 9.7 | |||
| Consumer, Non-cyclical | 7.2 | |||
| Industrial | 6.2 | |||
| Diversified | 3.3 | |||
| Utilities | 1.4 | |||
| Short Term Investments | 4.8 | |||
| Total Investments | 101.8 | |||
| Liabilities in excess of other assets | (1.8 | ) | ||
| Net Assets | 100.0 | % | ||
See Accompanying Notes to Financial Statements.
40
INTERNATIONAL SYSTEMATIC FUND
Management Team: Kunal Ghosh, Portfolio Manager; Steven Tael, Ph.D., CFA, Portfolio Manager
Chief Investment Officer: Horacio A. Valeiras, CFA
Goal: The International Systematic Fund seeks to maximize long-term capital appreciation through investments primarily in companies located in the developed countries represented in the MSCI EAFE Index. The Investment Adviser identifies investment opportunities using a quantitative model that integrates stock, sector, country and currency selection decisions.
Market Overview: Stock markets in developed non-U.S. countries generated broad-based gains between April 1 and September 30, 2009. Depreciation in the U.S. dollar versus a basket of currencies increased the gains in dollar terms.
After plummeting to a six-year low in March, the MSCI EAFE Index reversed course on hopes that the worst of the global recession had passed. The index turned in its best quarterly performance in more than twenty years during the second quarter of 2009. The rally continued through September as the global recovery picked up steam.
In Europe, central bankers held interest rates at record lows and continued with the special liquidity programs they had set up during the darkest days of the credit crisis. Policymakers throughout the region promoted their fiscal stimulus packages, including “cash for clunkers” vehicle salvage programs in Germany and France. Second-quarter economic growth turned positive in these two countries, and the pace of decline slowed in other nations.
In Japan, the economy also began to grow in the second quarter, boosted by a spike in exports. However, domestic demand remained weak amid an all-time high unemployment rate of 5.7%. Furthermore, the August election of a new government raised questions about how future wage, tax and trade policies might affect Japanese businesses.
Performance: The Fund’s Class I shares gained 42.48% during the six months ended September 30, 2009 and the MSCI EAFE Index gained 50.42%.
Portfolio Specifics: Holdings in every sector and nearly every country produced a gain for the Fund. The portfolio’s top overall contributor was the Spanish bank Banco Santander. During the period, banks were strong performers, especially those with significant exposure to emerging countries. Banco Santander has significant business operations in Latin America.
Alternatively, our position in Public Power of Greece, an electric utility, hurt the Fund’s results. The company showed sequential growth in cash flow over the last four quarters and was trading at a low valuation. However, the market ignored its cash flow growth and low valuation, focusing instead on the likelihood of tariff caps on electricity following upcoming Greek elections.
Our investment in Public Power is a good example of why the Fund lagged the index. During the period, macro-related themes, such as investor thirst for high-risk, low-quality assets, swamped consideration of company fundamentals. Our bottom-up stock selection process was not uniformly rewarded in this environment, since it emphasizes stocks with positive or improving fundamentals. In September, as investor interest began turning toward stocks characterized by positive or improving fundamentals, we were pleased to see the Fund do better versus the index.
Market Outlook: The Fund’s investment process evaluates opportunities on a relative basis and neither utilizes, nor results in, a forecast or outlook on the overall market. Rather, the Fund expects to outperform in both up and down markets. Through consistent application of our disciplined process, we are confident that the Fund will deliver strong, long-term performance.
Comparison of Change in Value of a $250,000 Investment in International Systematic Fund Class I and III Shares with the MSCI EAFE Index.
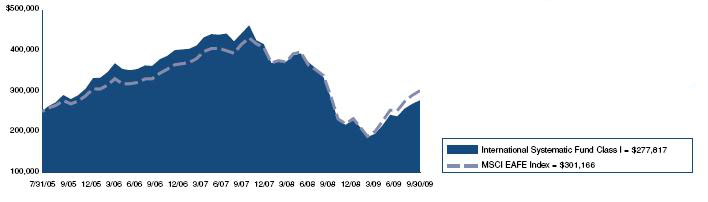
Annualized Total Returns As of 9/30/09 | ||
| Since | ||
| 1 Year | Inception | |
| International Systematic Fund Class I | –2.46% | 2.52% |
| MSCI EAFE Index | 3.80% | 4.49% |
41
INTERNATIONAL SYSTEMATIC FUND
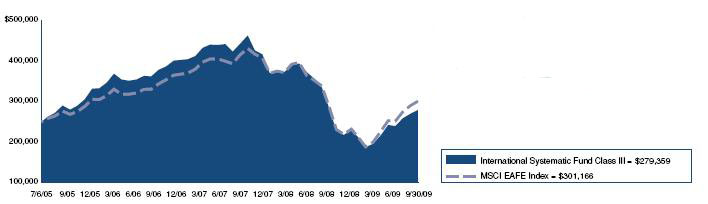
Annualized Total Returns As of 9/30/09 | ||
| Since | ||
| 1 Year | Inception | |
| International Systematic Fund Class III | –2.33% | 2.61% |
| MSCI EAFE Index | 3.80% | 4.49% |
The graphs above show the value of a hypothetical $250,000 investment in the Fund’s Class I and III shares with the MSCI EAFE Index for the periods indicated. Average annual total return figures include changes in principal value, reinvested dividends, and capital gain distributions. The Class I shares commenced operations on July 6, 2005 and III shares on December 22, 2006. The historical performance of Class II and III shares includes the performance of Class I shares for the periods prior to the inception of class III shares. The total returns shown above do not show the effects of income taxes on an individuals’ investment. In most cases, taxes may reduce your actual investment returns on income or gains paid by the Fund or any gains you may realize if you sell your shares. Past performance cannot guarantee future results.
The MSCI EAFE Index is an unmanaged index comprised of over 900 companies and is a generally accepted benchmark for major overseas markets. Index weightings represent the relative capitalizations of the major overseas markets included in the Index on a U.S. dollar adjusted basis, unless otherwise noted, index returns reflect the reinvestment of income dividends and capital gains, if any, but do not reflect fees, brokerage commissions or other expenses of investing One cannot invest directly in an index.
Since markets can go down as well as up, investment return and principal value will fluctuate with market conditions, currency volatility and the social, economic and political climates of countries where the Fund invests. You may have a gain or loss when you sell your shares.
42
INTERNATIONAL SYSTEMATIC FUND
SCHEDULE OF INVESTMENTS (Unaudited)
As of September 30, 2009
| Number of | ||||||||
| Shares | Value | |||||||
| Common Stock - 97.4% | ||||||||
| Australia - 7.3% | ||||||||
| Australia & New Zealand Banking Group, Ltd. | 18,310 | $ | 394,130 | |||||
| BHP Billiton, Ltd. | 21,879 | 728,540 | ||||||
| Challenger Financial Services Group, Ltd. | 148,080 | 445,646 | ||||||
| Commonwealth Bank of Australia | 30,313 | 1,384,455 | ||||||
| David Jones, Ltd. | 149,022 | 768,073 | ||||||
| Downer EDI, Ltd. | 59,364 | 429,088 | ||||||
| Leighton Holdings, Ltd. | 8,812 | 281,295 | ||||||
| OneSteel, Ltd. | 89,679 | 239,813 | ||||||
| Suncorp-Metway, Ltd. | 32,904 | 257,870 | ||||||
| 4,928,910 | ||||||||
| Belgium - 0.4% | ||||||||
| Anheuser-Busch InBev NV | 5,491 | 250,457 | ||||||
| Finland - 0.3% | ||||||||
| Huhtamaki OYJ | 16,400 | 208,555 | ||||||
| France - 11.4% | ||||||||
| AXA SA | 9,948 | 269,008 | ||||||
| BNP Paribas | 17,627 | 1,406,790 | ||||||
| Fonciere Des Regions - REIT | 2,524 | 293,634 | ||||||
| France Telecom SA | 19,116 | 508,682 | ||||||
| Groupe Steria SCA | 17,184 | 610,364 | ||||||
| PPR | 2,001 | 256,189 | ||||||
| Sanofi-Aventis SA | 20,483 | 1,501,491 | ||||||
| SCOR SE | 26,691 | 728,786 | ||||||
| Total SA | 22,471 | 1,333,706 | ||||||
| Vivendi | 26,718 | 825,790 | ||||||
| 7,734,440 | ||||||||
| Germany - 7.2% | ||||||||
| Bilfinger Berger AG | 6,221 | 430,019 | ||||||
| E.ON AG | 15,661 | 663,401 | ||||||
| GEA Group AG | 13,169 | 274,493 | ||||||
| Linde AG | 1,893 | 204,979 | ||||||
| ProSiebenSat.1 Media AG | 40,334 | 433,328 | ||||||
| RWE AG | 7,839 | 727,256 | ||||||
| Siemens AG* | 11,728 | 1,084,797 | ||||||
| ThyssenKrupp AG* | 16,040 | 551,677 | ||||||
| Volkswagen AG | 4,621 | 537,592 | ||||||
| 4,907,542 | ||||||||
| Greece - 0.4% | ||||||||
| Coca Cola Hellenic Bottling Co. SA* | 11,390 | 302,841 | ||||||
| Hong Kong - 4.5% | ||||||||
| BOC Hong Kong Holdings, Ltd. | 273,500 | 599,932 | ||||||
| Digital China Holdings, Ltd. | 225,000 | 212,805 | ||||||
| Minth Group, Ltd. | 266,000 | 239,227 | ||||||
| Noble Group, Ltd. | 437,000 | 759,837 | ||||||
| Shun Tak Holdings, Ltd. | 428,000 | 324,726 | ||||||
| Swire Pacific, Ltd. Cl. A | 42,000 | 494,784 | ||||||
| TPV Technology, Ltd. | 290,000 | 179,612 | ||||||
| VTech Holdings, Ltd. | 30,000 | 258,385 | ||||||
| 3,069,308 | ||||||||
| Israel - 0.4% | ||||||||
| Teva Pharmaceutical Industries, Ltd. - ADR | 5,100 | 257,856 | ||||||
| Italy - 3.2% | ||||||||
| Enel SpA | 222,614 | 1,411,401 | ||||||
| ENI SpA | 31,426 | 784,576 | ||||||
| 2,195,977 | ||||||||
| Japan - 16.3% | ||||||||
| Canon, Inc. | 5,400 | 218,931 | ||||||
| Fujitsu, Ltd. | 126,000 | 826,067 | ||||||
| Heiwa Corp. | 31,500 | 348,300 | ||||||
| Honda Motor Co., Ltd. | 13,600 | 419,992 | ||||||
| Hosiden Corp. | 15,800 | 214,761 | ||||||
| Ines Corp. | 35,000 | 298,263 | ||||||
| ITOCHU Corp. | 49,000 | 325,627 | ||||||
| KDDI Corp. | 107 | 604,702 | ||||||
| Komatsu, Ltd. | 40,400 | 758,951 | ||||||
| K’s Holdings Corp.* | 16,000 | 537,890 | ||||||
| Kyorin Co., Ltd. | 13,000 | 221,422 | ||||||
| Marubeni Corp. | 63,000 | 318,747 | ||||||
| Mitsubishi UFJ Financial Group, Inc. | 79,400 | 427,440 | ||||||
| Mitsui & Co., Ltd. | 14,000 | 183,571 | ||||||
| Nippo Corp.* | 14,000 | 114,614 | ||||||
| Nippon Electric Glass Co., Ltd. | 27,000 | 246,976 | ||||||
| Nippon Mining Holdings, Inc. | 30,500 | 150,567 | ||||||
| Nippon Soda Co., Ltd.* | 115,000 | 486,793 | ||||||
| Nippon Telegraph & Telephone Corp. | 7,600 | 353,113 | ||||||
| Nissan Motor Co., Ltd.* | 82,800 | 561,340 | ||||||
| Nitto Denko Corp. | 13,800 | 423,857 | ||||||
| Nomura Holdings, Inc. | 37,200 | 229,760 | ||||||
| Sojitz Corp. | 114,700 | 219,062 | ||||||
| Square Enix Holdings Co., Ltd. | 6,800 | 184,554 | ||||||
| Sumitomo Metal Mining Co., Ltd. | 26,000 | 428,034 | ||||||
| Taiyo Yuden Co., Ltd. | 14,000 | 165,589 | ||||||
| The Kansai Electric Power Co., Inc. | 28,400 | 688,312 | ||||||
| The Sumitomo Trust & Banking Co., Ltd. | 45,000 | 239,739 | ||||||
| Tokuyama Corp. | 22,000 | 161,680 | ||||||
| Toyota Motor Corp. | 6,400 | 255,185 | ||||||
| Ube Industries, Ltd.* | 169,000 | 445,457 | ||||||
| 11,059,296 | ||||||||
| Netherlands - 0.9% | ||||||||
| Koninklijke KPN NV | 37,639 | 623,617 | ||||||
| Norway - 0.3% | ||||||||
| Marine Harvest* | 261,000 | 188,610 | ||||||
| Republic of China - 2.5% | ||||||||
| Anta Sports Products, Ltd. | 157,000 | 194,476 | ||||||
| Bank of Communications Co., Ltd. | 254,000 | 309,386 | ||||||
| China Shanshui Cement Group, Ltd. | 296,000 | 220,757 | ||||||
| Huadian Power International Co.* | 506,000 | 162,572 | ||||||
| Tsingtao Brewery Co., Ltd. | 114,000 | 432,463 | ||||||
| Weichai Power Co., Ltd. | 69,000 | 363,694 | ||||||
| 1,683,348 | ||||||||
| Singapore - 3.5% | ||||||||
| Allgreen Properties, Ltd. | 318,000 | 255,023 | ||||||
| Hi-P International, Ltd. | 660,000 | 334,907 | ||||||
| Jardine Cycle & Carriage, Ltd. | 47,000 | 810,546 | ||||||
| Rotary Engineering, Ltd. | 337,000 | 275,043 | ||||||
| United Overseas Bank, Ltd. | 27,000 | 321,536 | ||||||
| Wilmar International, Ltd. | 76,000 | 340,882 | ||||||
| 2,337,937 | ||||||||
| Spain - 6.7% | ||||||||
| Banco Santander SA | 131,457 | 2,113,659 | ||||||
| Mapfre SA | 131,275 | 586,591 | ||||||
| Repsol YPF SA | 18,430 | 500,798 | ||||||
| Telefonica SA | 49,303 | 1,358,808 | ||||||
| 4,559,856 | ||||||||
See Accompanying Notes to Financial Statements.
43
INTERNATIONAL SYSTEMATIC FUND
SCHEDULE OF INVESTMENTS (Unaudited)
As of September 30, 2009
| Number of | ||||||||
| Shares | Value | |||||||
| Sweden - 2.3% | ||||||||
| Electrolux AB Cl. B* | 15,000 | $ | 342,135 | |||||
| Svenska Cellulosa AB Cl. B | 69,800 | 943,264 | ||||||
| Tele2 AB Cl. B | 22,100 | 292,334 | ||||||
| 1,577,733 | ||||||||
| Switzerland - 8.5% | ||||||||
| ABB, Ltd.* | 42,056 | 843,025 | ||||||
| Credit Suisse Group AG | 32,991 | 1,828,152 | ||||||
| Nestle SA | 8,868 | 377,402 | ||||||
| Novartis AG* | 5,473 | 273,479 | ||||||
| Roche Holding AG* | 6,652 | 1,073,781 | ||||||
| Syngenta AG | 670 | 153,739 | ||||||
| UBS AG* | 14,859 | 271,648 | ||||||
| Zurich Financial Services AG | 4,041 | 959,964 | ||||||
| 5,781,190 | ||||||||
| United Kingdom - 21.3% | ||||||||
| Anglo American PLC* | 8,997 | 286,780 | ||||||
| Antofagasta PLC | 28,738 | 349,082 | ||||||
| AstraZeneca PLC | 9,719 | 435,856 | ||||||
| Barclays PLC* | 164,989 | 976,338 | ||||||
| Barratt Developments PLC* | 56,237 | 220,719 | ||||||
| BG Group PLC | 19,029 | 330,818 | ||||||
| BP PLC | 90,970 | 804,576 | ||||||
| British American Tobacco PLC | 38,362 | 1,204,384 | ||||||
| Eurasian Natural Resources Corp. | 23,703 | 332,276 | ||||||
| GlaxoSmithKline PLC | 49,789 | 979,051 | ||||||
| HSBC Holdings PLC | 75,150 | 860,569 | ||||||
| J. Sainsbury PLC | 31,634 | 164,430 | ||||||
| Kazakhmys PLC* | 21,944 | 376,933 | ||||||
| Kingfisher PLC | 220,693 | 751,463 | ||||||
| Logica PLC | 149,713 | 311,516 | ||||||
| Marks & Spencer Group PLC | 135,879 | 786,909 | ||||||
| Marston’s PLC | 133,041 | 207,140 | ||||||
| Pearson PLC | 34,017 | 419,463 | ||||||
| Petrofac, Ltd. | 20,907 | 330,196 | ||||||
| Premier Foods PLC* | 263,981 | 177,323 | ||||||
| Prudential PLC | 90,682 | 872,369 | ||||||
| Royal Dutch Shell PLC Cl. B | 44,483 | 1,235,059 | ||||||
| Trinity Mirror PLC* | 59,175 | 162,594 | ||||||
| Tullett Prebon PLC | 99,671 | 622,970 | ||||||
| Tullow Oil PLC | 14,556 | 262,600 | ||||||
| Vodafone Group PLC | 222,513 | 498,938 | ||||||
| Xstrata PLC* | 28,622 | 422,289 | ||||||
| 14,382,641 | ||||||||
| Total Common Stock (Cost: $57,849,132) | 66,050,114 | |||||||
| Rights - 0.1% | ||||||||
| France - 0.1% | ||||||||
| BNP Paribas* (Cost: $0) | 17,627 | 38,133 | ||||||
| Principal | ||||||||
| Amount | Value | |||||||
| Short Term Investments - 1.9% | ||||||||
| Time Deposit - 1.9% | ||||||||
| Citibank London 0.030%, 10/01/09 | ||||||||
| (Cost: $1,299,422) | $ | 1,299,422 | $ | 1,299,422 | ||||
| Total Investments - 99.4% (Cost: $59,148,554) | 67,387,669 | |||||||
| Other Assets in Excess of Liabilities - 0.6% | 378,053 | |||||||
| Net Assets - 100.0% | $ | 67,765,722 | ||||||
| * Non-income producing securities. | ||
| ADR - American Depository Receipt | ||
| REIT - Real Estate Investment Trust | ||
SCHEDULE OF INVESTMENTS BY SECTOR | ||||
| as of September 30, 2009 | ||||
| Percent of | ||||
| Sector | Net Assets | |||
| Financial | 25.3 | % | ||
| Consumer, Non-cyclical | 13.3 | |||
| Consumer, Cyclical | 12.8 | |||
| Basic Materials | 9.6 | |||
| Communications | 9.2 | |||
| Energy | 8.6 | |||
| Industrial | 8.2 | |||
| Utilities | 5.3 | |||
| Technology | 3.1 | |||
| Diversified | 2.1 | |||
| Short Term Investments | 1.9 | |||
| Total Investments | 99.4 | |||
| Other assets in excess of liabilities | 0.6 | |||
| Net Assets | 100.0 | % | ||
See Accompanying Notes to Financial Statements.
44
U.S. HIGH YIELD BOND FUND
Management Team: Douglas G. Forsyth, CFA, Portfolio Manager; William L. Stickney, Portfolio Manager; Justin Kass, CFA, Portfolio Manager; Michael E. Yee, Portfolio Manager
Chief Investment Officer: Horacio A. Valeiras, CFA
Goal: The U.S. High Yield Bond Fund seeks to deliver total return via high current income and capital growth from a diversified portfolio consisting primarily of lower-rated U.S. corporate fixed-income securities.
Market Overview: In the six months ended September 30, 2009, the Merrill Lynch High Yield Master II Index gained 41.44%, outperforming the S&P 500 Index, which rose 34.02%, and the ten-year Treasury, which lost 3.76%. During the period, high-yield investors were treated to one of the fastest investment whipsaws in recent memory. The mantra of “sell everything” that defined the market in late 2008 was exchanged for “buy everything and ask questions later.” The technical lift was the most prominent cause of the price and spread movement. Buyers chased nearly all issues higher, with increased demand pushing up prices. In addition, the fundamental picture brightened for both the issuers and the economy. Economic indicators improved, earnings reports were generally better than expected and the financial industry stabilized, as proven by many of the largest institutions paying back Troubled Asset Relief Program (TARP) funds.
The trend in the ratio of credit upgrades to downgrades improved over the course of the period. New issuance was robust, with companies raising $107 billion in proceeds from 235 issues. Mutual fund flows brought $14.2 billion into the market, for a total of $25.5 billion year-to-date. The fund flows approach the 2003 record high of $32 billion. The combination of performance, new issuance and demand returned the high-yield market to full functionality.
Performance: The Fund’s Class I shares gained 28.17% during the six months ended September 30, 2009. The Merrill Lynch High Yield Master II Index rose 41.44%.
Portfolio Specifics: The Fund participated in the majority of the high-yield rally. However, the specific and broad contributors to the index return made it difficult to outperform the index. The lowest priced/distressed issuers were the greatest contributors to benchmark performance, and our underweight in these issuers dragged on our results. However, we believe these weaker credits will ultimately fall in price when investors return to focusing on company fundamentals. In terms of breadth, the index return was spread across an unusually large number of issues. Many of those issues rarely trade; therefore, even if an issue was identified as a good candidate for purchase, the liquidity was not there to build a position.
Notable positive performers in the Fund included a rental car company that rebounded on better-than-expected earnings and a more positive outlook, and a provider of information technology (IT) services that shored up its balance sheet and received new contract wins. One of the few negative performers was a manufacturer of truck parts that had lagging order trends despite a rebound in the auto industry.
Market Outlook: The high-yield asset class continues to offer a compelling total return opportunity. Spreads, which have narrowed to 800 basis points, are now inside of prior market-cycle highs. Some pullback is possible in the short term due to the speed of the market’s move higher. However, intermediate- and long-term performance will be driven by the realized default rate. Most strategists have reduced their default expectations to high-single-digits for the balance of 2009 and then falling in 2010. As default rate expectations are reduced, investor risk appetite increases, resulting in a commensurate drop in spread levels.
As always, we continue to build the Fund one security at a time, by performing rigorous credit analysis to identify companies which are opportunistically capitalizing on change.
Comparison of Change in Value of a $250,000 Investment in U.S. High Yield Bond Fund Class I Shares with the Merrill Lynch High Yield Master II Index.

Annualized Total Returns As of 9/30/09 | |||
| 1 Year | 5 Years | 10 Years | |
| U.S. High Yield Bond Class I | 16.28% | 5.97% | 6.10% |
| Merrill Lynch High Yield Master Index | 22.35% | 6.05% | 6.04% |
The graph above shows the value of a hypothetical $250,000 investment in the Fund’s Class I shares compared with the Merrill Lynch High Yield Master II Index for the periods indicated. The Fund’s Class I shares calculate their performance based upon the historical performance of their corresponding series of Nicholas-Applegate Mutual Funds (renamed ING Mutual Funds), adjusted to reflect all fees and expenses applicable to the Fund’s Class I shares. The Nicholas-Applegate Institutional Funds’ Class I shares were first available on May 7, 1999. Average annual total return figures include changes in principal value, reinvested dividends, and capital gain distributions. The total returns shown above do not show the effects of income taxes on an individual’s investment. In most cases, taxes may reduce your actual investment returns on income or gains paid by the Fund or any gains you may realize if you sell your shares. Past performance cannot guarantee future results.
The Merrill Lynch High Yield Master II Index is an unmanaged index consisting of U.S. dollar denominated bonds that are issued in countries having a BBB3 or higher debt rating with at least one year remaining until maturity. All bonds must have a credit rating below investment grade but not in default. Unless otherwise noted, index returns reflect the reinvestment of income dividends and capital gains, if any, but do not reflect fees, brokerage commissions or other expenses of investing. One cannot invest directly in an index.
Bond prices, and thus the Fund’s share price, generally move in the opposite direction from interest rates. Since markets can go down as well as up, investment return and principal value will fluctuate with market conditions. You may have a gain or loss when you sell your shares.
45
U.S. HIGH YIELD BOND FUND
SCHEDULE OF INVESTMENTS (Unaudited)
As of September 30, 2009
| Principal | ||||||||
| Amount | Value | |||||||
| Corporate Bonds - 88.7% | ||||||||
| Aerospace/Defense - 0.3% | ||||||||
Spirit Aerosystems, Inc. 144A# | ||||||||
| 7.500%, 10/01/17 | $ | 260,000 | $ | 260,000 | ||||
| Aerospace/Defense-Equipment - 1.8% | ||||||||
| BE Aerospace, Inc. | ||||||||
| 8.500%, 07/01/18 | 675,000 | 693,563 | ||||||
| TransDigm, Inc. | ||||||||
| 7.750%, 07/15/14 | 645,000 | 643,387 | ||||||
| 1,336,950 | ||||||||
| Apparel Manufacturers - 2.7% | ||||||||
| Levi Strauss & Co. | ||||||||
| 9.750%, 01/15/15 | 890,000 | 930,050 | ||||||
| Oxford Industries, Inc. | ||||||||
| 11.375%, 07/15/15 | 495,000 | 532,744 | ||||||
| Quiksilver, Inc. | ||||||||
| 6.875%, 04/15/15 | 770,000 | 579,425 | ||||||
| 2,042,219 | ||||||||
| Auto/Truck Parts & Equipment-Original - 0.7% | ||||||||
| Tenneco, Inc. | ||||||||
| 8.625%, 11/15/14 | 580,000 | 546,650 | ||||||
| Auto/Truck Parts & Equipment-Replacement - 1.3% | ||||||||
| Exide Technologies | ||||||||
| 10.500%, 03/15/13 | 955,000 | 943,063 | ||||||
| Beverages-Non-alcoholic - 1.1% | ||||||||
| Cott Beverages USA, Inc. | ||||||||
| 8.000%, 12/15/11 | 815,000 | 813,981 | ||||||
| Building Products-Cement/Aggregate - 0.9% | ||||||||
| Texas Industries, Inc. | ||||||||
| 7.250%, 07/15/13 | 695,000 | 670,675 | ||||||
| Building-Residential/Commercial - 1.4% | ||||||||
| DR Horton, Inc. | ||||||||
| 6.500%, 04/15/16 | 1,080,000 | 1,067,850 | ||||||
| Cable/Satellite TV - 3.0% | ||||||||
Cablevision Systems Corp. 144A# | ||||||||
| 8.625%, 09/15/17 | 595,000 | 617,312 | ||||||
| Echostar DBS Corp. | ||||||||
| 7.125%, 02/01/16 | 800,000 | 798,000 | ||||||
| Mediacom Broadband LLC/Mediacom Broadband Corp. | ||||||||
| 8.500%, 10/15/15 | 780,000 | 791,700 | ||||||
| 2,207,012 | ||||||||
| Casino Hotels - 4.1% | ||||||||
Harrah’s Operating Co., Inc. 144A# | ||||||||
| 10.000%, 12/15/18 | 920,000 | 736,000 | ||||||
Harrahs Operating Escrow LLC/Harrahs Escrow Corp. 144A# | ||||||||
| 11.250%, 06/01/17 | 1,045,000 | 1,078,963 | ||||||
MGM Mirage 144A# | ||||||||
| 11.375%, 03/01/18 | 805,000 | 760,725 | ||||||
MTR Gaming Group, Inc. 144A# | ||||||||
| 12.625%, 07/15/14 | 495,000 | 485,100 | ||||||
| 3,060,788 | ||||||||
| Cellular Telecommunications - 3.1% | ||||||||
| Centennial Communications Corp. | ||||||||
| 10.000%, 01/01/13 | 260,000 | 272,025 | ||||||
| Cricket Communications, Inc. | ||||||||
| 9.375%, 11/01/14 | 280,000 | 285,600 | ||||||
| MetroPCS Wireless, Inc. | ||||||||
| 9.250%, 11/01/14 | 870,000 | 893,925 | ||||||
| Nextel Communications, Inc. | ||||||||
| 7.375%, 08/01/15 | 965,000 | 870,912 | ||||||
| 2,322,462 | ||||||||
| Chemicals-Specialty - 0.9% | ||||||||
Ashland, Inc. 144A# | ||||||||
| 9.125%, 06/01/17 | 600,000 | 643,500 | ||||||
| Coal - 1.6% | ||||||||
Arch Coal, Inc. 144A# | ||||||||
| 8.750%, 08/01/16 | 270,000 | 279,450 | ||||||
| Peabody Energy Corp. | ||||||||
| 7.375%, 11/01/16 | 930,000 | 943,950 | ||||||
| 1,223,400 | ||||||||
| Commercial Services - 1.9% | ||||||||
| DI Finance/DynCorp International | ||||||||
| 9.500%, 02/15/13 | 735,000 | 753,375 | ||||||
| Iron Mountain, Inc. | ||||||||
| 8.375%, 08/15/21 | 650,000 | 672,750 | ||||||
| 1,426,125 | ||||||||
| Commercial Services-Finance - 1.3% | ||||||||
| Cardtronics, Inc. | ||||||||
| 9.250%, 08/15/13 | 375,000 | 379,688 | ||||||
| Deluxe Corp. | ||||||||
| 7.375%, 06/01/15 | 595,000 | 573,431 | ||||||
| 953,119 | ||||||||
| Computer Services - 1.3% | ||||||||
Stream Global Services, Inc. 144A# | ||||||||
| 11.250%, 10/01/14 | 635,000 | 617,537 | ||||||
Unisys Corp. 144A# | ||||||||
| 12.750%, 10/15/14 | 312,000 | 332,280 | ||||||
| 949,817 | ||||||||
| Consumer Products-Miscellaneous - 0.8% | ||||||||
| Jarden Corp. | ||||||||
| 7.500%, 05/01/17 | 580,000 | 566,950 | ||||||
| Containers-Metal/Glass - 1.5% | ||||||||
BWAY Corp. 144A# | ||||||||
| 10.000%, 04/15/14 | 525,000 | 557,812 | ||||||
| Crown Americas LLC/Crown Americas Capital Corp. | ||||||||
| 7.750%, 11/15/15 | 530,000 | 541,925 | ||||||
| 1,099,737 | ||||||||
| Data Processing/Management - 1.2% | ||||||||
| First Data Corp. | ||||||||
| 9.875%, 09/24/15 | 935,000 | 868,381 | ||||||
| Distribution/Wholesale - 0.5% | ||||||||
| KAR Holdings, Inc. | ||||||||
| 8.750%, 05/01/14 | 345,000 | 343,275 | ||||||
See Accompanying Notes to Financial Statements.
46
SCHEDULE OF INVESTMENTS (Unaudited)
As of September 30, 2009
| Principal | ||||||||
| Amount | Value | |||||||
| Diversified Banking Institution - 1.4% | ||||||||
GMAC LLC 144A# | ||||||||
| 6.750%, 12/01/14 | $ | 1,222,000 | $ | 1,050,920 | ||||
| Diversified Manufacturing Operations - 1.1% | ||||||||
| Harland Clarke Holdings Corp. | ||||||||
| 9.500%, 05/15/15 | 595,000 | 535,500 | ||||||
| Park-Ohio Industries, Inc. | ||||||||
| 8.375%, 11/15/14 | 345,000 | 267,375 | ||||||
| 802,875 | ||||||||
| Diversified Operations - 1.2% | ||||||||
| Kansas City Southern Railway | ||||||||
| 8.000%, 06/01/15 | 670,000 | 686,750 | ||||||
| Kansas City Southern Railway | ||||||||
| 13.000%, 12/15/13 | 175,000 | 202,125 | ||||||
| 888,875 | ||||||||
| Diversified Operations/Commercial Services - 1.0% | ||||||||
| ARAMARK Corp. | ||||||||
| 8.500%, 02/01/15 | 725,000 | 734,969 | ||||||
| Electric-Generation - 0.8% | ||||||||
| Edison Mission Energy | ||||||||
| 7.000%, 05/15/17 | 750,000 | 630,000 | ||||||
| Electric-Integrated - 1.0% | ||||||||
| Energy Future Holdings Corp.* | ||||||||
| 10.875%, 11/01/17 | 950,000 | 722,000 | ||||||
| Electronic Components-Miscellaneous - 0.7% | ||||||||
| Sanmina-SCI Corp. | ||||||||
| 8.125%, 03/01/16 | 535,000 | 509,587 | ||||||
| Electronic Components-Semiconductors - 2.4% | ||||||||
| Advanced Micro Devices, Inc. | ||||||||
| 7.750%, 11/01/12 | 1,105,000 | 997,263 | ||||||
| Amkor Technology, Inc. | ||||||||
| 9.250%, 06/01/16 | 800,000 | 828,000 | ||||||
| 1,825,263 | ||||||||
| Filtration/Separation Products - 0.7% | ||||||||
| Polypore, Inc. | ||||||||
| 8.750%, 05/15/12 | 545,000 | 534,100 | ||||||
| Finance-Auto Loans - 1.8% | ||||||||
| Ford Motor Credit Co. LLC | ||||||||
| 7.000%, 10/01/13 | 670,000 | 629,403 | ||||||
| Ford Motor Credit Co. LLC | ||||||||
| 9.875%, 08/10/11 | 670,000 | 679,795 | ||||||
| 1,309,198 | ||||||||
| Finance-Consumer Loans - 0.6% | ||||||||
| American General Finance Corp. | ||||||||
| 6.900%, 12/15/17 | 620,000 | 434,226 | ||||||
| Machinery-Construction & Mining - 0.7% | ||||||||
| Terex Corp. | ||||||||
| 7.375%, 01/15/14 | 490,000 | 487,550 | ||||||
| Machinery-Electrical - 0.9% | ||||||||
| Baldor Electric Co. | ||||||||
| 8.625%, 02/15/17 | 695,000 | 708,900 | ||||||
| Machinery-Farm - 0.9% | ||||||||
Case New Holland, Inc. 144A# | ||||||||
| 7.750%, 09/01/13 | 700,000 | 700,000 | ||||||
| Medical-Drugs - 0.3% | ||||||||
Valeant Pharmaceuticals International 144A# | ||||||||
| 8.375%, 06/15/16 | 240,000 | 244,800 | ||||||
| Medical-Hospitals - 3.1% | ||||||||
| AMR HoldCo, Inc./EmCare HoldCo, Inc. | ||||||||
| 10.000%, 02/15/15 | 610,000 | 648,125 | ||||||
| Community Health Systems, Inc. | ||||||||
| 8.875%, 07/15/15 | 840,000 | 863,100 | ||||||
| HCA, Inc. | ||||||||
| 9.250%, 11/15/16 | 810,000 | 839,363 | ||||||
| 2,350,588 | ||||||||
| Medical-Nursing Homes - 1.0% | ||||||||
| Sun Healthcare Group, Inc. | ||||||||
| 9.125%, 04/15/15 | 755,000 | 755,000 | ||||||
| Medical-Outpatient/Home Medical Care - 1.8% | ||||||||
Apria Healthcare Group, Inc. 144A# | ||||||||
| 11.250%, 11/01/14 | 570,000 | 615,600 | ||||||
| Res-Care, Inc. | ||||||||
| 7.750%, 10/15/13 | 770,000 | 754,600 | ||||||
| 1,370,200 | ||||||||
| MRI/Medical Diagnostic Imaging - 0.5% | ||||||||
| Alliance HealthCare Services, Inc. | ||||||||
| 7.250%, 12/15/12 | 235,000 | 227,950 | ||||||
| Alliance Imaging, Inc. | ||||||||
| 7.250%, 12/15/12 | 165,000 | 160,050 | ||||||
| 388,000 | ||||||||
| Multi-line Insurance - 0.3% | ||||||||
American International Group, Inc.++ | ||||||||
| 8.175%, 05/15/58 | 385,000 | 233,888 | ||||||
| Office Supplies & Forms - 0.3% | ||||||||
ACCO Brands Corp. 144A# | ||||||||
| 10.625%, 03/15/15 | 195,000 | 204,750 | ||||||
| Oil Companies-Exploration & Production - 6.0% | ||||||||
| Chesapeake Energy Corp. | ||||||||
| 6.875%, 01/15/16 | 835,000 | 795,338 | ||||||
| Forest Oil Corp. | ||||||||
| 7.250%, 06/15/19 | 380,000 | 357,200 | ||||||
| Mariner Energy, Inc. | ||||||||
| 11.750%, 06/30/16 | 485,000 | 525,012 | ||||||
| PetroHawk Energy Corp. | ||||||||
| 7.875%, 06/01/15 | 790,000 | 782,100 | ||||||
SandRidge Energy, Inc. 144A# | ||||||||
| 8.000%, 06/01/18 | 635,000 | 614,362 | ||||||
SandRidge Energy, Inc. 144A# | ||||||||
| 9.875%, 05/15/16 | 1,000,000 | 1,047,500 | ||||||
| Southwestern Energy Co. | ||||||||
| 7.500%, 02/01/18 | 340,000 | 345,100 | ||||||
| 4,466,612 | ||||||||
| Oil-Field Services - 0.7% | ||||||||
| Allis-Chalmers Energy, Inc. | ||||||||
| 9.000%, 01/15/14 | 620,000 | 508,400 | ||||||
| Paper & Related Products - 2.0% | ||||||||
| Neenah Paper, Inc. | ||||||||
| 7.375%, 11/15/14 | 790,000 | 626,075 | ||||||
NewPage Corp. 144A# | ||||||||
| 11.375%, 12/31/14 | 875,000 | 864,062 | ||||||
| 1,490,137 | ||||||||
See Accompanying Notes to Financial Statements.
47
U.S. HIGH YIELD BOND FUND
SCHEDULE OF INVESTMENTS (Unaudited)
As of September 30, 2009
| Principal | ||||||||
| Amount | Value | |||||||
| Pipelines - 2.1% | ||||||||
| Dynegy Holdings, Inc. | ||||||||
| 7.750%, 06/01/19 | $ | 760,000 | $ | 651,700 | ||||
| El Paso Corp. | ||||||||
| 8.250%, 02/15/16 | 895,000 | 921,850 | ||||||
| 1,573,550 | ||||||||
| Printing-Commercial - 0.7% | ||||||||
| Cenveo Corp. | ||||||||
| 7.875%, 12/01/13 | 680,000 | 549,100 | ||||||
| Quarrying - 0.8% | ||||||||
Compass Minerals International, Inc. 144A# | ||||||||
| 8.000%, 06/01/19 | 575,000 | 584,344 | ||||||
| Racetracks - 0.4% | ||||||||
Speedway Motorsports, Inc. 144A# | ||||||||
| 8.750%, 06/01/16 | 285,000 | 297,825 | ||||||
| Real Estate Management/Service - 0.7% | ||||||||
CB Richard Ellis Services, Inc. 144A# | ||||||||
| 11.625%, 06/15/17 | 485,000 | 526,225 | ||||||
| Rental Auto/Equipment - 1.7% | ||||||||
| Hertz Corp. | ||||||||
| 10.500%, 01/01/16 | 590,000 | 616,550 | ||||||
United Rentals North America, Inc. 144A# | ||||||||
| 10.875%, 06/15/16 | 605,000 | 650,375 | ||||||
| 1,266,925 | ||||||||
| Retail-Apparel/Shoe - 1.4% | ||||||||
| Brown Shoe Co., Inc. | ||||||||
| 8.750%, 05/01/12 | 555,000 | 548,062 | ||||||
| Phillips-Van Heusen Corp. | ||||||||
| 8.125%, 05/01/13 | 500,000 | 511,250 | ||||||
| 1,059,312 | ||||||||
| Retail-Automobile - 0.3% | ||||||||
| Penske Auto Group, Inc. | ||||||||
| 7.750%, 12/15/16 | 240,000 | 222,600 | ||||||
| Retail-Computer Equipment - 1.4% | ||||||||
| GameStop Corp./GameStop, Inc. | ||||||||
| 8.000%, 10/01/12 | 1,020,000 | 1,058,250 | ||||||
| Retail-Drug Store - 0.8% | ||||||||
| Rite Aid Corp. | ||||||||
| 7.500%, 03/01/17 | 640,000 | 566,400 | ||||||
| Retail-Propane Distribution - 1.1% | ||||||||
| Inergy LP/Inergy Finance Corp. | ||||||||
| 8.250%, 03/01/16 | 845,000 | 853,450 | ||||||
| Retail-Regional Department Stores - 0.8% | ||||||||
| The Neiman Marcus Group, Inc. | ||||||||
| 10.375%, 10/15/15 | 680,000 | 584,800 | ||||||
| Satellite Telecommunications - 2.2% | ||||||||
DigitalGlobe, Inc. 144A# | ||||||||
| 10.500%, 05/01/14 | 850,000 | 918,000 | ||||||
| Hughes Network Systems LLC/HNS Finance Corp. | ||||||||
| 9.500%, 04/15/14 | 740,000 | 747,400 | ||||||
| 1,665,400 | ||||||||
| Steel-Producers - 0.8% | ||||||||
| Steel Dynamics, Inc. | ||||||||
| 7.375%, 11/01/12 | 565,000 | 573,475 | ||||||
| Super-Regional Banks-US - 0.6% | ||||||||
| BAC Capital Trust XI | ||||||||
| 6.625%, 05/23/36 | 530,000 | 469,050 | ||||||
| Telecommunications Services - 3.1% | ||||||||
| MasTec, Inc. | ||||||||
| 7.625%, 02/01/17 | 1,155,000 | 1,091,475 | ||||||
| Time Warner Telecom Holdings, Inc. | ||||||||
| 9.250%, 02/15/14 | 585,000 | 605,475 | ||||||
| West Corp. | ||||||||
| 11.000%, 10/15/16 | 585,000 | 583,538 | ||||||
| 2,280,488 | ||||||||
| Telephone-Integrated - 3.5% | ||||||||
| Cincinnati Bell, Inc. | ||||||||
| 8.375%, 01/15/14 | 880,000 | 888,800 | ||||||
| Sprint Capital Corp. | ||||||||
| 8.375%, 03/15/12 | 850,000 | 881,875 | ||||||
| Windstream Corp. | ||||||||
| 8.625%, 08/01/16 | 820,000 | 842,550 | ||||||
| 2,613,225 | ||||||||
| Travel Services - 1.0% | ||||||||
| Travelport LLC | ||||||||
| 9.875%, 09/01/14 | 785,000 | 763,413 | ||||||
| Web Hosting/Design - 0.9% | ||||||||
Terremark Worldwide, Inc. 144A# | ||||||||
| 12.000%, 06/15/17 | 610,000 | 667,950 | ||||||
| Wire & Cable Products - 1.1% | ||||||||
| Anixter, Inc. | ||||||||
| 5.950%, 03/01/15 | 225,000 | 199,969 | ||||||
| General Cable Corp. | ||||||||
| 7.125%, 04/01/17 | 620,000 | 610,700 | ||||||
| 810,669 | ||||||||
| Wireless Equipment - 0.7% | ||||||||
| Crown Castle International Corp. | ||||||||
| 9.000%, 01/15/15 | 520,000 | 547,300 | ||||||
| Total US Corporate Bonds (Cost: $62,732,724) | 66,230,543 | |||||||
| Foreign Corporate Bonds - 6.1% | ||||||||
| Cellular Telecommunications - 1.3% | ||||||||
| Millicom international Cellular SA | ||||||||
| 10.000%, 12/01/13 | 955,000 | 995,587 | ||||||
| Cruise Lines - 1.0% | ||||||||
| Royal Carribean Cruises | ||||||||
| 11.875%, 07/15/15 | 625,000 | 706,250 | ||||||
| Metal-Aluminum - 0.8% | ||||||||
Novelis, Inc./GA 144A# | ||||||||
| 11.500%, 02/15/15 | 620,000 | 629,300 | ||||||
| Oil Companies-Exploration & Production - 1.1% | ||||||||
| OPTI Canada, Inc. | ||||||||
| 8.250%, 12/15/14 | 1,000,000 | 780,000 | ||||||
| Satellite Telecommunications - 1.0% | ||||||||
| Intelsat Jackson Holdings Ltd. | ||||||||
| 9.500%, 06/15/16 | 735,000 | 775,425 | ||||||
| Telecommuications Services - 0.9% | ||||||||
Global Crossing Ltd. 144A# | ||||||||
| 12.000%, 09/15/15 | 650,000 | 685,750 | ||||||
| Total Foreign Corporate Bonds (Cost: $4,231,217) | 4,572,312 | |||||||
See Accompanying Notes to Financial Statements.
48
SCHEDULE OF INVESTMENTS (Unaudited)
As of September 30, 2009
| Principal | ||||||||
| Amount | Value | |||||||
| Short Term Investments - 5.6% | ||||||||
| Time Deposit - 5.6% | ||||||||
| Citibank London 0.030%, 10/01/09 | ||||||||
| (Cost: $4,135,474) | $ | 4,135,474 | $ | 4,135,474 | ||||
| Total Investments - 100.4% (Cost: $71,320,121) | 74,938,329 | |||||||
| Liabilities in Excess of Other Assets - (0.4%) | (268,650 | ) | ||||||
| Net Assets - 100.0% | $ | 74,669,679 | ||||||
| # | 144A Security. Certain condition for public sale may exist. The total market value of 144A securities owned at September 30, 2009 was $16,670,442 or 22.33% of net assets. |
| * | Step Bond: Coupon is a fixed rate for an initial period then resets at a specific date and rate. |
| ++ | The coupon rate shown on floating rate securities represents the rate at September 30, 2009. |
SCHEDULE OF INVESTMENTS BY SECTOR | ||||
| as of September 30, 2009 | ||||
| Percent of | ||||
| Sector | Net Assets | |||
| Communications | 19.7 | % | ||
| Consumer, Cyclical | 18.9 | |||
| Consumer, Non-cyclical | 15.5 | |||
| Energy | 11.5 | |||
| Industrial | 10.6 | |||
| Financial | 5.4 | |||
| Basic Materials | 5.3 | |||
| Technology | 4.9 | |||
| Utilities | 1.8 | |||
| Diversified | 1.2 | |||
| Short Term Investments | 5.6 | |||
| Total Investments | 100.4 | |||
| Liabilities in excess of other assets | (0.4 | ) | ||
| Net Assets | 100.0 | % | ||
See Accompanying Notes to Financial Statements.
49
NICHOLAS-APPLEGATE INSTITUTIONAL FUNDS
FINANCIAL HIGHLIGHTS
For a Class I share outstanding during the period indicated
| Distributions from: | ||||||||||||||||||||||||
Net Asset Value, Beginning | Net Investment Income (Loss) (1) | Net Realized and Unrealized Gain (Loss) | Total from Investments Operations | Net Investment Income | Net Realized Capital Gains | |||||||||||||||||||
| U.S. EQUITY FUNDS | ||||||||||||||||||||||||
| U.S. ULTRA MICRO CAP | ||||||||||||||||||||||||
| For the period ended 09/30/09 | $ | 5.78 | $ | (0.07 | ) | $ | 3.66 | $ | 3.59 | $ | — | $ | — | |||||||||||
| For the year ended 03/31/09 | 9.28 | (0.16 | ) | (3.34 | ) | (3.50 | ) | — | — | |||||||||||||||
| 1/28/08 (Commenced) to 03/31/08 | 10.00 | (0.03 | ) | (0.69 | ) | (0.72 | ) | — | — | |||||||||||||||
| U.S. MICRO CAP | ||||||||||||||||||||||||
| For the period ended 09/30/09 | $ | 7.58 | $ | (0.05 | ) | $ | 3.52 | $ | 3.47 | $ | — | $ | — | |||||||||||
For the year ended 03/31/09 | 11.60 | (0.07 | ) | (3.95 | ) | (4.02 | ) | — | (0.00 | )(7) | ||||||||||||||
| For the year ended 03/31/08 | 15.33 | (0.18 | ) | (1.49 | ) | (1.67 | ) | — | (2.06 | ) | ||||||||||||||
| For the year ended 03/31/07 | 17.43 | (0.12 | ) | (0.19 | ) | (0.31 | ) | — | (1.79 | ) | ||||||||||||||
| For the year ended 03/31/06 | 12.83 | (0.11 | ) | 5.06 | 4.95 | — | (0.35 | ) | ||||||||||||||||
For the year ended 03/31/05 | 14.69 | (0.09 | ) | (1.09 | ) | (1.18 | ) | — | (0.68 | ) | ||||||||||||||
| U.S. EMERGING GROWTH | ||||||||||||||||||||||||
| For the period ended 09/30/09 | $ | 6.59 | $ | (0.03 | ) | $ | 3.79 | $ | 3.76 | $ | — | $ | — | |||||||||||
| For the year ended 03/31/09 | 11.45 | (0.04 | ) | (4.82 | )(5) | (4.86 | ) | — | — | |||||||||||||||
| For the year ended 03/31/08 | 13.09 | (0.06 | ) | (0.70 | )(5) | (0.76 | ) | — | (0.88 | ) | ||||||||||||||
| For the year ended 03/31/07 | 13.90 | (0.07 | ) | 0.19 | (5) | 0.12 | — | (0.93 | ) | |||||||||||||||
| For the year ended 03/31/06 | 9.77 | (0.11 | ) | 4.25 | 4.14 | — | (0.01 | ) | ||||||||||||||||
| For the year ended 03/31/05 | 9.61 | (0.07 | ) | 0.23 | 0.16 | — | — | |||||||||||||||||
| U.S. SMALL TO MID CAP GROWTH | ||||||||||||||||||||||||
For the period ended 09/30/09 | $ | 5.42 | $ | (0.01 | ) | $ | 2.64 | $ | 2.63 | $ | — | $ | — | |||||||||||
| For the year ended 03/31/09 | 9.02 | (0.03 | ) | (3.57 | ) | (3.60 | ) | — | — | |||||||||||||||
| 7/31/07 (Commenced) to 03/31/08 | 10.00 | (0.03 | ) | (0.95 | ) | (0.98 | ) | — | — | |||||||||||||||
| U.S. SYSTEMATIC LARGE CAP GROWTH | ||||||||||||||||||||||||
| For the period ended 09/30/09 | $ | 12.86 | $ | 0.04 | $ | 3.11 | $ | 3.15 | $ | — | $ | — | ||||||||||||
| For the year ended 03/31/09 | 19.39 | 0.10 | (6.63 | )(5) | (6.53 | ) | — | — | ||||||||||||||||
| For the year ended 03/31/08 | 19.77 | (0.02 | ) | (0.36 | )(5) | (0.38 | ) | — | — | |||||||||||||||
| For the year ended 03/31/07 | 17.86 | 0.02 | 1.89 | 1.91 | — | — | ||||||||||||||||||
| For the year ended 03/31/06 | 15.67 | 0.03 | 2.16 | 2.19 | — | — | ||||||||||||||||||
| For the year ended 03/31/05 | 15.06 | 0.07 | 0.54 | 0.61 | — | — | ||||||||||||||||||
| U.S. CONVERTIBLE | ||||||||||||||||||||||||
| For the period ended 09/30/09 | $ | 19.01 | $ | 0.37 | $ | 4.67 | $ | 5.04 | $ | (0.36 | ) | $ | — | |||||||||||
| For the year ended 03/31/09 | 24.88 | 0.43 | (5.73 | )(5) | (5.30 | ) | (0.43 | ) | (0.14 | ) | ||||||||||||||
For the year ended 03/31/08 | 24.35 | 0.37 | 0.58 | 0.95 | (0.32 | ) | (0.10 | ) | ||||||||||||||||
| For the year ended 03/31/07 | 24.57 | 0.45 | 2.03 | 2.48 | (0.47 | ) | (2.23 | ) | ||||||||||||||||
| For the year ended 03/31/06 | 22.44 | 0.27 | 3.45 | 3.72 | (0.55 | ) | (1.04 | ) | ||||||||||||||||
| For the year ended 03/31/05 | 23.11 | 0.39 | 0.66 | 1.05 | (0.45 | ) | (1.27 | ) | ||||||||||||||||
| (1) | Net investment income per share is calculated by dividing net investment income for the period by the average shares outstanding during the period. |
| (2) | Total returns are not annualized for periods less than one year. |
| (3) | Ratios are annualized for periods of less than one year. Expense reimbursements reflect voluntary reductions of total expenses. Such amounts would increase net investment income (loss) ratios had such reductions not occurred. |
| (4) | Net expenses include certain items not subject to expense reimbursement for periods prior to January 23, 2006. |
See Accompanying Notes to Financial Statements.
50
| Ratios to Average Net Assets (3) | ||||||||||||||||||||||||||||||||||||||
Total Distributions | Net Asset Value, Ending | Total Return (2) | Net Assets, Ending (in 000’s) | Net Investment Income (Loss) | Total Expenses | Expenses (Reimbursements)/ Recoupment | Expenses Net of Reimbursement/ Recoupment | Expenses Net of Reimbursement/ Recoupment Offset (4) | Fund’s Portfolio Turnover Rate | |||||||||||||||||||||||||||||
| $ | — | $ | 9.37 | 62.11 | % | $ | 1,843 | (1.76 | %) | 2.34 | % | — | 2.34 | % | 2.20 | % | 70 | % | ||||||||||||||||||||
| — | 5.78 | (37.72 | %) | 1,084 | (2.05 | %) | 2.40 | % | — | 2.40 | % | 2.31 | % | 109 | % | |||||||||||||||||||||||
| — | 9.28 | (7.20 | %)(6) | 886 | (2.10 | %) | 2.31 | % | — | 2.31 | % | 2.15 | % | 19 | % | |||||||||||||||||||||||
| $ | — | $ | 11.05 | 45.78 | % | $ | 57,263 | (1.10 | %) | 1.54 | % | — | 1.54 | % | 1.52 | % | 70 | % | ||||||||||||||||||||
| (0.00 | )(7) | 7.58 | (34.63 | %) | 40,178 | (0.64 | %) | 1.58 | % | — | 1.58 | % | 0.91 | % | 104 | % | ||||||||||||||||||||||
| (2.06 | ) | 11.60 | (13.25 | %) | 60,122 | (1.19 | %) | 1.58 | % | — | 1.58 | % | 1.38 | % | 139 | % | ||||||||||||||||||||||
| (1.79 | ) | 15.33 | (1.35 | %) | 84,405 | (0.75 | %) | 1.58 | % | — | 1.58 | % | 1.19 | % | 165 | % | ||||||||||||||||||||||
| (0.35 | ) | 17.43 | 39.04 | % | 78,058 | (0.78 | %) | 1.64 | % | (0.07 | %) | 1.57 | % | 1.10 | % | 180 | % | |||||||||||||||||||||
| (0.68 | ) | 12.83 | (8.17 | %) | 69,246 | (0.72 | %) | 1.63 | % | (0.07 | %) | 1.56 | % | 1.12 | % | 266 | % | |||||||||||||||||||||
| $ | — | $ | 10.35 | 57.06 | % | $ | 14,445 | (0.59 | %) | 1.18 | % | — | 1.18 | % | 1.16 | % | 74 | % | ||||||||||||||||||||
| — | 6.59 | (42.45 | %) | 6,591 | (0.34 | %) | 1.21 | % | — | 1.21 | % | 0.90 | % | 146 | % | |||||||||||||||||||||||
| (0.88 | ) | 11.45 | (7.01 | %) | 7,499 | (0.46 | %) | 1.21 | % | — | 1.21 | % | 0.72 | % | 129 | % | ||||||||||||||||||||||
| (0.93 | ) | 13.09 | 1.30 | % | 7,409 | (0.54 | %) | 1.21 | % | — | 1.21 | % | 0.72 | % | 148 | % | ||||||||||||||||||||||
| (0.01 | ) | 13.90 | 42.38 | % | 6,721 | (1.04 | %) | 1.89 | % | (0.39 | %) | 1.50 | % | 1.17 | % | 128 | % | |||||||||||||||||||||
| — | 9.77 | 1.66 | % | 12,043 | (0.75 | %) | 1.63 | % | (0.17 | %) | 1.46 | % | 1.06 | % | 142 | % | ||||||||||||||||||||||
| $ | — | $ | 8.05 | 48.52 | % | $ | 4,606 | (0.24 | %) | 0.95 | % | — | 0.95 | % | 0.90 | % | 91 | % | ||||||||||||||||||||
| — | 5.42 | (39.91 | %) | 3,102 | (0.44 | %) | 0.97 | % | — | 0.97 | % | 0.81 | % | 179 | % | |||||||||||||||||||||||
| — | 9.02 | (9.80 | %)(6) | 4,862 | (0.50 | %) | 0.95 | % | — | 0.95 | % | 0.80 | % | 105 | % | |||||||||||||||||||||||
| $ | — | $ | 16.01 | 24.49 | % | $ | 960 | 0.52 | % | 1.11 | % | — | 1.11 | % | 1.07 | % | 69 | % | ||||||||||||||||||||
| — | 12.86 | (33.68 | %) | 512 | 0.58 | % | 1.16 | % | — | 1.16 | % | 1.12 | % | 116 | % | |||||||||||||||||||||||
| — | 19.39 | (1.92 | %) | 791 | (0.10 | %) | 1.14 | % | — | 1.14 | % | 1.10 | % | 106 | % | |||||||||||||||||||||||
| — | 19.77 | 10.69 | % | 945 | (0.09 | %) | 1.13 | % | — | 1.13 | % | 1.05 | % | 100 | % | |||||||||||||||||||||||
| — | 17.86 | 13.98 | % | 667 | 0.19 | % | 1.67 | % | (0.53 | %) | 1.14 | % | 1.04 | % | 147 | % | ||||||||||||||||||||||
| — | 15.67 | 4.05 | % | 780 | 0.45 | % | 1.66 | % | (0.54 | %) | 1.12 | % | 1.00 | % | 197 | % | ||||||||||||||||||||||
| $ | (0.36 | ) | $ | 23.69 | 26.62 | % | $ | 57,451 | 3.41 | % | 1.00 | % | — | 1.00 | % | 1.00 | % | 74 | % | |||||||||||||||||||
| (0.57 | ) | 19.01 | (21.30 | %) | 20,664 | 1.86 | % | 1.03 | % | — | 1.03 | % | 0.98 | % | 91 | % | ||||||||||||||||||||||
| (0.42 | ) | 24.88 | 3.84 | % | 47,773 | 1.45 | % | 1.03 | % | — | 1.03 | % | 0.89 | % | 98 | % | ||||||||||||||||||||||
| (2.70 | ) | 24.35 | 10.79 | % | 39,022 | 1.89 | % | 1.02 | % | — | 1.02 | % | 0.85 | % | 92 | % | ||||||||||||||||||||||
| (1.59 | ) | 24.57 | 17.15 | % | 31,627 | 1.02 | % | 1.14 | % | (0.11 | %) | 1.03 | % | 0.87 | % | 92 | % | |||||||||||||||||||||
| (1.72 | ) | 22.44 | 4.62 | % | 35,397 | 1.68 | % | 1.10 | % | 0.08 | % | 1.02 | % | 0.85 | % | 102 | % | |||||||||||||||||||||
| (5) | Includes litigation proceeds of approximately $0.03 per share for U.S. Micro Cap Fund during the fiscal year ended 2009, $0.07 and $0.06 per share for the U.S. Emerging Growth Fund during the fiscal year for 2008 and 2009, respectively, $0.09 and 0.04 per share for the U.S Systematic Large Cap Growth Fund during the fiscal year for 2008 and 2009, respectively. For U.S. Convertible Fund during the fiscal year end 2009, litigation proceeds were less than $0.01 per share. The U.S. Emerging Growth Fund received $28,454 from a security litigation settlement for the fiscal year 2007 which is reflected in realized gains. The event had a $0.05 per share impact to the fund. |
| (6) | Inception to date return. |
| (7) | Less than one penny per share. |
51
NICHOLAS-APPLEGATE INSTITUTIONAL FUNDS
FINANCIAL HIGHLIGHTS
For a Class I share outstanding during the period indicated
| Distributions from: | ||||||||||||||||||||||||
Net Asset Value, Beginning | Net Investment Income (Loss) (1) | Net Realized and Unrealized Gain (Loss) | Total from Investments Operations | Net Investment Income | Net Realized Capital Gains | |||||||||||||||||||
| GLOBAL EQUITY FUNDS | ||||||||||||||||||||||||
| GLOBAL SELECT | ||||||||||||||||||||||||
| For the period ended 09/30/09 | $ | 0.32 | $ | 0.00 | $ | 0.11 | $ | 0.11 | $ | — | $ | — | ||||||||||||
| For the year ended 03/31/09 | 12.65 | 0.02 | (5.44 | ) | (5.42 | ) | (0.04 | ) | (6.87 | ) | ||||||||||||||
| For the year ended 03/31/08 | 18.60 | 0.11 | 0.92 | 1.03 | (0.28 | ) | (6.69 | ) | ||||||||||||||||
| For the year ended 03/31/07 | 18.96 | 0.06 | 1.85 | 1.91 | — | (2.27 | ) | |||||||||||||||||
| For the year ended 03/31/06 | 16.09 | 0.03 | 3.97 | 4.00 | (0.03 | ) | (1.10 | ) | ||||||||||||||||
| For the year ended 03/31/05 | 15.58 | 0.06 | 1.37 | 1.43 | — | (0.92 | ) | |||||||||||||||||
| INTERNATIONAL GROWTH | ||||||||||||||||||||||||
| For the period ended 09/30/09 | $ | 5.43 | $ | 0.07 | $ | 2.02 | $ | 2.09 | $ | — | $ | — | ||||||||||||
| For the year ended 03/31/09 | 12.01 | 0.13 | (5.64 | ) | (5.51 | ) | (0.06 | ) | (1.01 | ) | ||||||||||||||
| For the year ended 03/31/08 | 14.41 | 0.19 | 2.02 | 2.21 | (0.76 | ) | (3.85 | ) | ||||||||||||||||
| For the year ended 03/31/07 | 13.00 | 0.07 | 1.93 | 2.00 | (0.08 | ) | (0.51 | ) | ||||||||||||||||
| For the year ended 03/31/06 | 9.08 | 0.01 | 3.92 | 3.93 | (0.01 | ) | — | |||||||||||||||||
| For the year ended 03/31/05 | 8.19 | 0.01 | 0.92 | 0.93 | — | (0.04 | ) | |||||||||||||||||
| INTERNATIONAL GROWTH OPPORTUNITIES | ||||||||||||||||||||||||
| For the period ended 09/30/09 | $ | 16.29 | $ | 0.18 | $ | 9.17 | $ | 9.35 | $ | — | $ | — | ||||||||||||
| For the year ended 03/31/09 | 40.10 | 0.33 | (19.44 | ) | (19.11 | ) | — | (4.70 | ) | |||||||||||||||
| For the year ended 03/31/08 | 57.36 | 0.14 | 3.43 | 3.57 | (1.26 | ) | (19.56 | ) | ||||||||||||||||
| For the year ended 03/31/07 | 49.86 | 0.05 | 9.07 | 9.12 | — | (1.62 | ) | |||||||||||||||||
| For the year ended 03/31/06 | 35.01 | (0.01 | ) | 15.10 | 15.09 | (0.24 | ) | — | ||||||||||||||||
| For the year ended 03/31/05 | 29.43 | 0.32 | 5.35 | 5.67 | (0.09 | ) | — | |||||||||||||||||
| EMERGING MARKETS | ||||||||||||||||||||||||
| For the period ended 09/30/09 | $ | 5.23 | $ | 0.07 | $ | 2.94 | $ | 3.01 | $ | — | $ | — | ||||||||||||
| For the year ended 03/31/09 | 13.52 | 0.13 | (7.20 | ) | (7.07 | ) | (0.05 | ) | (1.17 | ) | ||||||||||||||
| For the year ended 03/31/08 | 12.79 | 0.19 | 2.80 | 2.99 | (0.10 | ) | (2.16 | ) | ||||||||||||||||
| 8/18/06 (Commenced) to 03/31/07 | 10.00 | 0.02 | 2.84 | 2.86 | (0.07 | ) | — | |||||||||||||||||
| INTERNATIONAL SYSTEMATIC | ||||||||||||||||||||||||
For the period ended 09/30/09 | $ | 6.78 | $ | 0.15 | $ | 2.73 | $ | 2.88 | $ | — | $ | — | ||||||||||||
| For the year ended 03/31/09(10) | 13.57 | 0.27 | (6.70 | ) | (6.43 | ) | (0.36 | ) | (0.00 | )(6) | ||||||||||||||
| For the year ended 03/31/08 | 16.02 | 0.16 | (1.64 | ) | (1.48 | ) | (0.20 | ) | (0.77 | ) | ||||||||||||||
| For the year ended 03/31/07 | 13.70 | 0.09 | 2.50 | 2.59 | (0.02 | ) | (0.25 | ) | ||||||||||||||||
| 7/06/05 (Commenced) to 03/31/06 | 10.00 | 0.06 | 3.81 | 3.87 | (0.01 | ) | (0.16 | ) | ||||||||||||||||
| U.S. HIGH YIELD BOND | ||||||||||||||||||||||||
| For the period ended 09/30/09 | $ | 7.40 | $ | 0.39 | $ | 1.66 | $ | 2.05 | $ | (0.38 | ) | $ | — | |||||||||||
| For the year ended 03/31/09 | 9.36 | 0.71 | (1.90 | ) | (1.19 | ) | (0.77 | ) | — | |||||||||||||||
For the year ended 03/31/08 | 10.27 | 0.76 | (0.86 | ) | (0.10 | ) | (0.81 | ) | — | |||||||||||||||
| For the year ended 03/31/07 | 10.00 | 0.73 | 0.30 | 1.03 | (0.76 | ) | — | |||||||||||||||||
| For the year ended 03/31/06 | 10.04 | 0.70 | 0.02 | 0.72 | (0.76 | ) | — | |||||||||||||||||
| For the year ended 03/31/05 | 10.34 | 0.85 | (0.31 | ) | 0.54 | (0.84 | ) | (0.00 | )(6) | |||||||||||||||
| (1) | Net investment income per share is calculated by dividing net investment income for the period by the average shares outstanding during the period. |
| (2) | Total returns are not annualized for periods less than one year. |
| (3) | Ratios are annualized for periods of less than one year. Expense reimbursements reflect voluntary reductions of total expenses. Such amounts would increase net investment income (loss) ratios had such reductions not occurred. |
| (4) | Net expenses include certain items not subject to expense reimbursement for periods prior to January 23, 2006. |
| (5) | Inception to date return. |
| (6) | Less than one penny per share. |
See Accompanying Notes to Financial Statements.
52
| Ratios to Average Net Assets (3) | ||||||||||||||||||||||||||||||||||||||
Total Distributions | Net Asset Value, Ending | Total Return (2) | Net Assets, Ending (in 000’s) | Net Investment Income (Loss) | Total Expenses | Expenses (Reimbursements)/ Recoupment | Expenses Net of Reimbursement/ Recoupment | Expenses Net of Reimbursement/ Recoupment Offset (4) | Fund’s Portfolio Turnover Rate | |||||||||||||||||||||||||||||
| $ | — | $ | 0.43 | 34.38 | % | $ | 19,126 | 1.19 | % | 1.13 | % | — | 1.13 | % | 1.10 | % | 61 | % | ||||||||||||||||||||
| (6.91 | ) | 0.32 | (42.26 | %) | 14,692 | 1.04 | % | 1.17 | % | — | 1.17 | % | 0.92 | % | 122 | % | ||||||||||||||||||||||
| (6.98 | ) | 12.65 | 1.34 | % | 32,669 | 0.60 | % | 1.18 | % | — | 1.18 | % | 1.03 | % | 80 | % | ||||||||||||||||||||||
| (2.27 | ) | 18.60 | 10.64 | % | 78,550 | (0.35 | %) | 1.16 | % | — | 1.16 | % | 1.00 | % | 105 | % | ||||||||||||||||||||||
| (1.13 | ) | 18.96 | 25.76 | % | 77,225 | 0.16 | % | 1.13 | % | (0.00 | %) | 1.13 | % | 0.88 | % | 139 | % | |||||||||||||||||||||
| (0.92 | ) | 16.09 | 9.27 | % | 66,115 | 0.41 | % | 1.15 | % | (0.01 | %) | 1.14 | % | 0.95 | % | 164 | % | |||||||||||||||||||||
| $ | — | $ | 7.52 | 38.49 | % | $ | 20,103 | 1.98 | % | 1.14 | % | — | 1.14 | % | 1.13 | % | 71 | % | ||||||||||||||||||||
| (1.07 | ) | 5.43 | (46.87 | %) | 17,034 | 1.70 | % | 1.16 | % | — | 1.16 | % | 0.91 | % | 60 | % | ||||||||||||||||||||||
| (4.61 | ) | 12.01 | 12.58 | % | 7,340 | 1.09 | % | 1.16 | % | — | 1.16 | % | 0.90 | % | 113 | % | ||||||||||||||||||||||
| (0.59 | ) | 14.41 | 15.75 | % | 23,827 | 0.49 | % | 1.18 | % | — | 1.18 | % | 1.04 | % | 118 | % | ||||||||||||||||||||||
| (0.01 | ) | 13.00 | 43.28 | % | 20,562 | 0.08 | % | 1.89 | % | (0.47 | %) | 1.42 | % | 1.39 | % | 196 | % | |||||||||||||||||||||
| (0.04 | ) | 9.08 | 11.34 | % | 33,900 | (0.42 | %) | 2.07 | % | (0.59 | %) | 1.48 | % | 1.48 | % | 166 | % | |||||||||||||||||||||
| $ | — | $ | 25.64 | 57.40 | % | $ | 64,693 | 1.64 | % | 1.41 | % | — | 1.41 | % | 1.42 | % | 50 | % | ||||||||||||||||||||
| (4.70 | ) | 16.29 | (48.16 | %) | 39,680 | 1.14 | % | 1.44 | % | — | 1.44 | % | 1.17 | % | 106 | % | ||||||||||||||||||||||
| (20.83 | ) | 40.10 | 2.74 | % | 113,239 | 0.26 | % | 1.44 | % | — | 1.44 | % | 1.13 | % | 86 | % | ||||||||||||||||||||||
| (1.62 | ) | 57.36 | 18.71 | % | 104,003 | 0.09 | % | 1.43 | % | — | 1.43 | % | 1.18 | % | 127 | % | ||||||||||||||||||||||
| (0.24 | ) | 49.86 | 43.34 | % | 107,749 | (0.02 | %) | 1.38 | % | 0.00 | % | 1.38 | % | 1.07 | % | 168 | % | |||||||||||||||||||||
| (0.09 | ) | 35.01 | 19.28 | % | 55,462 | 1.05 | % | 1.42 | % | 0.00 | % | 1.42 | % | 1.11 | % | 110 | % | |||||||||||||||||||||
| $ | — | $ | 8.24 | 57.55 | % | $ | 14,148 | 2.04 | % | 1.48 | % | — | 1.48 | % | 1.47 | % | 110 | % | ||||||||||||||||||||
| (1.22 | ) | 5.23 | (52.61 | %) | 8,586 | 1.78 | %(11) | 1.40 | % | — | 1.40 | % | 1.27 | % | 149 | % | ||||||||||||||||||||||
| (2.26 | ) | 13.52 | 21.19 | % | 2,491 | 1.32 | % | 1.45 | % | — | 1.45 | % | 1.16 | % | 183 | % | ||||||||||||||||||||||
| (0.07 | ) | 12.79 | 28.65 | %(5) | 94 | (0.23 | %) | 1.63 | % | — | 1.63 | % | 1.52 | % | 22 | % | ||||||||||||||||||||||
| $ | — | $ | 9.66 | 42.48 | % | $ | 25,655 | 3.46 | % | 0.98 | % | — | 0.98 | % | 0.97 | % | 113 | % | ||||||||||||||||||||
| (0.36 | ) | 6.78 | (47.68 | %) | 17,997 | 2.66 | % | 1.02 | % | — | 1.02 | % | 0.87 | % | 215 | % | ||||||||||||||||||||||
| (0.97 | ) | 13.57 | (9.87 | %) | 24,534 | 1.13 | % | 1.04 | % | — | 1.04 | % | 0.74 | % | 202 | % | ||||||||||||||||||||||
| (0.27 | ) | 16.02 | 19.04 | % | 4,623 | (0.70 | %) | 0.93 | % | — | 0.93 | % | 0.70 | % | 210 | % | ||||||||||||||||||||||
| (0.17 | ) | 13.70 | 38.92 | %(5) | 4,662 | 0.78 | % | 2.94 | % | (1.69 | %) | 1.25 | % | 1.11 | % | 103 | % | |||||||||||||||||||||
| $ | (0.38 | ) | $ | 9.07 | 28.17 | % | $ | 74,670 | 9.18 | % | 0.60 | % | — | 0.60 | % | 0.60 | % | 77 | % | |||||||||||||||||||
| (0.77 | ) | 7.40 | (13.01 | %) | 49,233 | 8.56 | % | 0.64 | % | — | 0.64 | % | 0.61 | % | 55 | % | ||||||||||||||||||||||
| (0.81 | ) | 9.36 | (1.06 | %) | 50,271 | 7.66 | % | 0.63 | % | — | 0.63 | % | 0.57 | % | 81 | % | ||||||||||||||||||||||
| (0.76 | ) | 10.27 | 10.76 | % | 63,925 | 7.21 | % | 0.64 | % | — | 0.64 | % | 0.52 | %(7) | 92 | % | ||||||||||||||||||||||
| (0.76 | ) | 10.00 | 7.40 | % | 81,187 | 6.70 | % | 0.82 | % | (0.18 | %) | 0.64 | % | 0.56 | % | 112 | % | |||||||||||||||||||||
| (0.84 | ) | 10.04 | 5.40 | % | 131,677 | 7.82 | % | 0.82 | % | (0.19 | %) | 0.63 | % | 0.60 | % | 123 | % | |||||||||||||||||||||
| (7) | For the year ended March 31, 2007 ratios do not include one time expense credit. Had this credit been included, the expense ratios would have been decreased by 0.07%. |
| (8) | For the period from 11/28/06 to 12/21/06 the unitary fees for the International Systematic Fund Class I were reduced from 0.48% to 0.23%. The Unitary fees were resumed to 0.48% through March 31, 2007. |
| (9) | Includes litigation proceeds of approximately $0.01 per share for the Global Select Fund during the fiscal year ended 2009. |
| (10) | As of March 31, 2009 International Systematic Class II Shareholders exchanged their shares for Class I Shares, closing out Class II. |
| (11) | For the year ended March 31, 2009 the net investment income per share and the ratio of the net investment income (loss) included a non-recurring special cash dividend amounting to $0.04 per share and 0.51% of average net assets, respectively. |
53
NICHOLAS-APPLEGATE INSTITUTIONAL FUNDS
FINANCIAL HIGHLIGHTS
For a Class I share outstanding during the period indicated
| Distributions from: | ||||||||||||||||||||||||
Net Asset Value, Beginning | Net Investment Income (1) | Net Realized and Unrealized Gain (Loss) | Total from Investments Operations | Net Investment Income | Net Realized Capital Gains | |||||||||||||||||||
| U.S. EQUITY FUNDS | ||||||||||||||||||||||||
| U.S. CONVERTIBLE | ||||||||||||||||||||||||
| For the period ended 09/30/09 | $ | 19.02 | $ | 0.38 | $ | 4.68 | $ | 5.06 | $ | (0.36 | ) | $ | — | |||||||||||
| For the year ended 03/31/09 | 24.88 | 0.53 | (5.80 | )(5) | (5.27 | ) | (0.45 | ) | (0.14 | ) | ||||||||||||||
| For the year ended 03/31/08 | 24.36 | 0.41 | 0.56 | 0.97 | (0.35 | ) | (0.10 | ) | ||||||||||||||||
| For the year ended 03/31/07 | 24.58 | 0.47 | 2.04 | 2.51 | (0.50 | ) | (2.23 | ) | ||||||||||||||||
| 9/30/05 (Commenced) to 03/31/06 | 23.97 | 0.30 | 1.63 | 1.93 | (0.28 | ) | (1.04 | ) | ||||||||||||||||
| GLOBAL EQUITY FUNDS | ||||||||||||||||||||||||
| GLOBAL SELECT | ||||||||||||||||||||||||
| For the period ended 09/30/09 | $ | 0.50 | $ | 0.00 | $ | 0.18 | $ | 0.18 | $ | — | $ | — | ||||||||||||
| For the year ended 03/31/09 | 12.92 | 0.02 | (7) | (5.55 | )(5) | (5.53 | ) | (0.02 | ) | (6.37 | ) | |||||||||||||
| For the year ended 03/31/08 | 18.61 | 0.14 | 6.87 | 7.01 | 0.00 | (6.69 | ) | |||||||||||||||||
| For the year ended 03/31/07 | 18.97 | 0.08 | 1.84 | 1.92 | (0.01 | ) | (2.27 | ) | ||||||||||||||||
| For the year ended 03/31/06 | 16.09 | 0.04 | 3.98 | 4.02 | (0.04 | ) | (1.10 | ) | ||||||||||||||||
| For the year ended 03/31/05 | 15.58 | 0.07 | 1.36 | 1.43 | — | (0.92 | ) | |||||||||||||||||
| INTERNATIONAL GROWTH | ||||||||||||||||||||||||
| For the period ended 09/30/09 | $ | 5.43 | $ | 0.07 | $ | 2.02 | $ | 2.09 | $ | — | $ | — | ||||||||||||
| 2/17/09 (Commenced) to 03/31/09 | 5.54 | 0.04 | 0.15 | (0.11 | ) | — | — | |||||||||||||||||
| INTERNATIONAL GROWTH OPPORTUNITIES | ||||||||||||||||||||||||
| For the period ended 09/30/09 | $ | 16.93 | $ | 0.20 | $ | 9.53 | $ | 9.73 | $ | — | $ | — | ||||||||||||
| For the year ended 03/31/09 | 41.28 | 0.34 | (19.99 | ) | (19.65 | ) | — | (4.70 | ) | |||||||||||||||
| For the year ended 03/31/08 | 57.63 | 0.39 | 3.17 | 3.56 | (0.35 | ) | (19.56 | ) | ||||||||||||||||
| For the year ended 03/31/07 | 50.01 | 0.02 | 9.22 | 9.24 | — | (1.62 | ) | |||||||||||||||||
| For the year ended 03/31/06 | 35.02 | 0.13 | 15.06 | 15.19 | (0.20 | ) | — | |||||||||||||||||
| For the year ended 03/31/05 | 29.47 | 0.38 | 5.32 | 5.70 | (0.15 | ) | — | |||||||||||||||||
| EMERGING MARKETS | ||||||||||||||||||||||||
| For the period ended 09/30/09 | $ | 5.26 | $ | 0.08 | $ | 2.95 | $ | 3.03 | $ | — | $ | — | ||||||||||||
| For the year ended 03/31/09 | 13.54 | 0.15 | (8) | (7.24 | ) | (7.09 | ) | (0.02 | ) | (1.17 | ) | |||||||||||||
| For the year ended 03/31/08 | 12.78 | 0.11 | 2.90 | 3.01 | (0.09 | ) | (2.16 | ) | ||||||||||||||||
3/23/07 (Commenced) to 03/31/07 | 12.61 | (0.00 | )(7) | 0.17 | 0.17 | — | — | |||||||||||||||||
| (1) | Net investment income per share is calculated by dividing net investment income for the period by the average shares outstanding during the period. |
| (2) | Total returns are not annualized for periods less than one year. |
| (3) | Ratios are annualized for periods of less than one year. Expense reimbursements reflect voluntary reductions of total expenses. Such amounts would increase net investment income (loss) ratios had such reductions not occurred. |
| (4) | Net expenses include certain items not subject to expense reimbursement for periods prior to January 23, 2006. |
See Accompanying Notes to Financial Statements.
54
| Ratios to Average Net Assets (3) | ||||||||||||||||||||||||||||||||||||||
Total Distributions | Net Asset Value, Ending | Total Return (2) | Net Assets, Ending (in 000’s) | Net Investment Income | Total Expenses | Expenses (Reimbursements)/ Recoupment | Expenses Net of Reimbursement/ Recoupment | Expenses Net of Reimbursement/ Recoupment Offset (4) | Fund’s Portfolio Turnover Rate | |||||||||||||||||||||||||||||
| $ | (0.36 | ) | $ | 23.72 | 26.73 | % | $ | 37,457 | 3.52 | % | 0.90 | % | — | 0.90 | % | 0.89 | % | 74 | % | |||||||||||||||||||
| (0.59 | ) | 19.02 | (21.21 | %) | 29,568 | 2.51 | % | 0.93 | % | — | 0.93 | % | 0.88 | % | 91 | % | ||||||||||||||||||||||
| (0.45 | ) | 24.88 | 3.91 | % | 9,103 | 1.58 | % | 0.93 | % | — | 0.93 | % | 0.79 | % | 98 | % | ||||||||||||||||||||||
| (2.73 | ) | 24.36 | 10.92 | % | 7,880 | 2.05 | % | 0.92 | % | — | 0.92 | % | 0.75 | % | 92 | % | ||||||||||||||||||||||
| (1.32 | ) | 24.58 | 8.47 | %(6) | 3,634 | 2.26 | % | 1.01 | % | (0.09 | %) | 0.92 | % | 0.77 | % | 92 | % | |||||||||||||||||||||
| $ | — | $ | 0.68 | 36.00 | % | $ | 5,114 | 1.28 | % | 1.14 | % | — | 1.14 | % | 1.16 | % | 61 | % | ||||||||||||||||||||
| (6.89 | ) | 0.50 | (42.91 | %) | 2,971 | 0.98 | % | 1.13 | % | — | 1.13 | % | 0.88 | % | 122 | % | ||||||||||||||||||||||
| (6.69 | ) | 12.92 | 1.40 | % | 8,617 | 0.67 | % | 1.13 | % | — | 1.13 | % | 0.97 | % | 80 | % | ||||||||||||||||||||||
| (2.28 | ) | 18.61 | 10.67 | % | 90,871 | 0.44 | % | 1.11 | % | — | 1.11 | % | 0.95 | % | 105 | % | ||||||||||||||||||||||
| (1.14 | ) | 18.97 | 25.90 | % | 100,610 | 0.21 | % | 1.08 | % | — | 1.08 | % | 0.83 | % | 139 | % | ||||||||||||||||||||||
| (0.92 | ) | 16.09 | 9.27 | % | 69,548 | 0.44 | % | 1.10 | % | (0.01 | %) | 1.09 | % | 0.90 | % | 164 | % | |||||||||||||||||||||
| $ | — | $ | 7.52 | 38.49 | % | $ | 10,680 | 2.12 | % | 0.99 | % | — | 0.99 | % | 0.99 | % | 71 | % | ||||||||||||||||||||
| — | 5.43 | (1.99 | %)(6) | 6,882 | 6.51 | % | 1.00 | % | — | 1.00 | % | 0.93 | % | 60 | % | |||||||||||||||||||||||
| $ | — | $ | 26.66 | 57.47 | % | $ | 14,194 | 1.80 | % | 1.26 | % | — | 1.26 | % | 1.27 | % | 50 | % | ||||||||||||||||||||
| (4.70 | ) | 16.93 | (48.08 | %) | 6,828 | 1.27 | % | 1.29 | % | — | 1.29 | % | 1.01 | % | 106 | % | ||||||||||||||||||||||
| (19.91 | ) | 41.28 | 2.90 | % | 8,213 | 0.57 | % | 1.27 | % | — | 1.27 | % | 1.00 | % | 86 | % | ||||||||||||||||||||||
| (1.62 | ) | 57.63 | 18.90 | % | 73,640 | 0.05 | % | 1.28 | % | — | 1.28 | % | 1.03 | % | 127 | % | ||||||||||||||||||||||
| (0.20 | ) | 50.01 | 43.55 | % | 32,565 | 0.36 | % | 1.22 | % | (0.00 | %) | 1.22 | % | 0.91 | % | 168 | % | |||||||||||||||||||||
| (0.15 | ) | 35.02 | 19.40 | % | 35,233 | 1.19 | % | 1.27 | % | (0.00 | %) | 1.27 | % | 0.97 | % | 110 | % | |||||||||||||||||||||
| $ | — | $ | 8.29 | 57.60 | % | $ | 26,810 | 2.14 | % | 1.37 | % | — | 1.37 | % | 1.36 | % | 110 | % | ||||||||||||||||||||
| (1.19 | ) | 5.26 | (52.61 | %) | 18,088 | 1.92 | % | 1.29 | % | — | 1.29 | % | 1.12 | % | 149 | % | ||||||||||||||||||||||
| (2.25 | ) | 13.54 | 21.18 | % | 14,656 | 0.70 | % | 1.32 | % | — | 1.32 | % | 1.13 | % | 183 | % | ||||||||||||||||||||||
| — | 12.78 | 1.35 | %(6) | 39,081 | 1.28 | % | 1.18 | % | — | 1.18 | % | 1.18 | % | 22 | % | |||||||||||||||||||||||
| (5) | Includes litigation proceeds of approximately $0.03 per share for U.S. Micro Cap Fund during the fiscal year ended 2009, $0.07 and $0.06 per share for the U.S. Emerging Growth Fund during the fiscal year for 2008 and 2009, respectively. For U.S. Convertible Fund during the fiscal year end 2009, litigation proceeds were less than $0.01 per share. The U.S. Emerging Growth Fund received $28,454 from a security litigation settlement for the fiscal year 2007 which is reflected in realized gains. The event had a $0.05 per share impact to the fund. |
| (6) | Inception to date return. |
| (7) | Less than one penny per share. |
| (8) | For the year ended March 31, 2009 the net investment income per share and the ratio of net investment income (loss) included a non-recurring special cash dividend amounting to a $0.04 per share and 0.51% of average net assets, respectively. |
55
NICHOLAS-APPLEGATE INSTITUTIONAL FUNDS
FINANCIAL HIGHLIGHTS
For a Class I share outstanding during the period indicated
| Distributions from: | ||||||||||||||||||||||||
Net Asset Value, Beginning | Net Investment Income (1) | Net Realized and Unrealized Gain (Loss) | Total from Investments Operations | Net Investment Income | Net Asset Value, Beginning | |||||||||||||||||||
| GLOBAL EQUITY FUNDS | ||||||||||||||||||||||||
INTERNATIONAL GROWTH OPPORTUNITIES | ||||||||||||||||||||||||
| For the period ended 09/30/09 | $ | 16.94 | $ | 0.20 | $ | 9.55 | $ | 9.75 | $ | — | $ | — | ||||||||||||
| 9/08/08 (Commenced) to 03/31/09 | 34.51 | 0.08 | (12.95 | ) | (12.87 | ) | — | (4.70 | ) | |||||||||||||||
| INTERNATIONAL SYSTEMATIC | ||||||||||||||||||||||||
| For the period ended 09/30/09 | $ | 6.79 | $ | 0.16 | $ | 2.74 | $ | 2.90 | $ | — | $ | — | ||||||||||||
| For the year ended 03/31/09 | 13.61 | 0.30 | (6.73 | ) | (6.43 | ) | (0.39 | ) | (0.00 | )(7) | ||||||||||||||
| For the year ended 03/31/08 | 16.01 | 0.08 | (1.51 | ) | (1.43 | ) | (0.20 | ) | (0.77 | ) | ||||||||||||||
| 12/19/06 (Commenced) to 03/31/07 | 15.36 | 0.09 | 0.56 | 0.65 | — | — | ||||||||||||||||||
For a Class IV share outstanding during the period indicated | ||||||||||||||||||||||||
| Distributions from: | ||||||||||||||||||||||||
Net Asset Value, Beginning | Net Investment Income (1) | Net Realized and Unrealized Gain (Loss) | Total from Investments Operations | Net Investment Income | Net Asset Value, Beginning | |||||||||||||||||||
| U.S. EQUITY FUNDS | ||||||||||||||||||||||||
| U.S. CONVERTIBLE | ||||||||||||||||||||||||
| For the period ended 09/30/09 | $ | 19.02 | $ | 0.39 | $ | 4.68 | $ | 5.07 | $ | (0.37 | ) | $ | — | |||||||||||
| For the year ended 03/31/09 | 24.89 | 0.53 | (5.78 | ) | (5.25 | ) | (0.48 | ) | (0.14 | ) | ||||||||||||||
| For the year ended 03/31/08 | 24.37 | 0.11 | 0.91 | 1.02 | (0.39 | ) | (0.10 | ) | ||||||||||||||||
| 12/28/06 (Commenced) to 03/31/07 | 23.47 | 0.12 | 0.91 | 1.03 | (0.13 | ) | — | |||||||||||||||||
| (1) | Net investment income per share is calculated by dividing net investment income for the period by the average shares outstanding during the period. |
| (2) | Total returns are not annualized for periods less than one year. |
| (3) | Ratios are annualized for periods of less than one year. Expense reimbursements reflect voluntary reductions of total expenses. Such amounts would increase net investment income (loss) ratios had such reductions not occurred. |
See Accompanying Notes to Financial Statements.
56
| Ratios to Average Net Assets (3) | ||||||||||||||||||||||||||||||||||||||
Total Distributions | Net Asset Value, Ending | Total Return (2) | Net Assets, Ending (in 000’s) | Net Investment Income | Total Expenses | Expenses (Reimbursements)/ Recoupment | Expenses Net of Reimbursement/ Recoupment | Expenses Net of Reimbursement/ Recoupment Offset (4) | Fund’s Portfolio Turnover Rate | |||||||||||||||||||||||||||||
| $ | — | $ | 26.69 | 57.56 | % | $ | 34,961 | 1.77 | % | 1.21 | % | — | 1.21 | % | 1.21 | % | 50 | % | ||||||||||||||||||||
| (4.70 | ) | 16.94 | (36.92 | %)(5) | 16,274 | 0.68 | % | 1.24 | % | — | 1.24 | % | 1.04 | % | 106 | % | ||||||||||||||||||||||
| $ | — | $ | 9.69 | 42.71 | % | $ | 42,111 | 3.65 | % | 0.73 | % | — | 0.73 | % | 0.72 | % | 113 | % | ||||||||||||||||||||
| (0.39 | ) | 6.79 | (47.60 | %) | 25,860 | 2.94 | % | 0.78 | % | — | 0.78 | % | 0.62 | % | 215 | % | ||||||||||||||||||||||
| (0.97 | ) | 13.61 | (9.57 | %) | 49,322 | 1.79 | % | 0.79 | % | — | 0.79 | % | 0.55 | % | 202 | % | ||||||||||||||||||||||
| — | 16.01 | 4.23 | %(5) | 54,604 | 1.95 | % | 0.76 | % | — | (6) | 0.76 | % | 0.46 | % | 210 | % | ||||||||||||||||||||||
| Ratios to Average Net Assets (3) | ||||||||||||||||||||||||||||||||||||||
Total Distributions | Net Asset Value, Ending | Total Return (2) | Net Assets, Ending (in 000’s) | Net Investment Income | Total Expenses | Expenses (Reimbursements)/ Recoupment | Expenses Net of Reimbursement/ Recoupment | Expenses Net of Reimbursement/ Recoupment Offset (4) | Fund’s Portfolio Turnover Rate | |||||||||||||||||||||||||||||
| $ | (0.37 | ) | $ | 23.72 | 26.82 | % | $ | 315,222 | 3.66 | % | 0.75 | % | — | 0.75 | % | 0.74 | % | 74 | % | |||||||||||||||||||
| (0.62 | ) | 19.02 | (21.11 | %) | 247,651 | 2.48 | % | 0.78 | % | — | 0.78 | % | 0.73 | % | 91 | % | ||||||||||||||||||||||
| (0.50 | ) | 24.89 | 4.07 | % | 253,227 | 1.70 | % | 0.78 | % | — | 0.78 | % | 0.64 | % | 98 | % | ||||||||||||||||||||||
| (0.13 | ) | 24.37 | 4.39 | %(5) | 97,007 | 1.97 | % | 0.77 | % | — | (6) | 0.77 | % | 0.60 | % | 92 | % | |||||||||||||||||||||
| (4) | Net expenses include certain items not subject to expense reimbursement for periods prior to January 23, 2006. |
| (5) | Inception to date return. |
| (6) | The expense reimbursement was terminated on January 23, 2006. |
| (7) | Less than one penny per share. |
57
NICHOLAS-APPLEGATE INSTITUTIONAL FUNDS
STATEMENTS OF ASSETS AND LIABILITIES
| September 30, 2009 (Unaudited) | U.S. Ultra Micro Cap | U.S. Micro Cap | U.S. Emerging Growth | U.S. Small to Mid Cap Growth | ||||||||||||
| Assets | ||||||||||||||||
| Investments, at value* | $ | 1,842,304 | $ | 57,161,881 | $ | 17,157,808 | $ | 4,672,707 | ||||||||
| Foreign currencies, at value** | — | — | — | — | ||||||||||||
| Cash | — | — | — | — | ||||||||||||
| Receivables: | ||||||||||||||||
| Investment securities sold | 21,410 | 474,046 | 269,954 | 30,110 | ||||||||||||
| Capital shares sold | 50 | 54,146 | 46,888 | — | ||||||||||||
| Dividends | — | 5,025 | 5,160 | 1,625 | ||||||||||||
| Foreign taxes receivable | — | — | — | — | ||||||||||||
| Interest | — | — | — | — | ||||||||||||
| Other | 63 | 131 | 88 | 6 | ||||||||||||
| Total assets | 1,863,827 | 57,695,228 | 17,479,898 | 4,704,448 | ||||||||||||
| Liabilities | ||||||||||||||||
| Payables: | ||||||||||||||||
| Bank overdraft | $ | — | $ | — | $ | — | $ | — | ||||||||
| Investments purchased | 17,284 | 352,421 | 395,085 | 93,709 | ||||||||||||
| Capital shares redeemed | 366 | 1,912 | 4,600 | — | ||||||||||||
| To investment advisor | 2,239 | 45,557 | 10,292 | 1,852 | ||||||||||||
| Other Liabilities | 1,204 | 32,207 | 7,312 | 2,780 | ||||||||||||
| Total Liabilities | 21,093 | 432,097 | 417,289 | 98,341 | ||||||||||||
NET ASSETS | 1,842,734 | 57,263,131 | 17,062,609 | 4,606,107 | ||||||||||||
| * Investments, at cost | 1,342,948 | 46,072,395 | 13,962,502 | 3,665,776 | ||||||||||||
| ** Foreign currencies, at cost | — | — | — | — | ||||||||||||
| Net Assets Consist of: | ||||||||||||||||
| Paid-in capital | $ | 1,821,060 | $ | 64,274,948 | $ | 23,040,421 | $ | 5,536,221 | ||||||||
| Undistributed net investment income (loss) | (13,387 | ) | (271,938 | ) | (38,288 | ) | (4,741 | ) | ||||||||
Accumulated net realized (loss) on investments and foreign currencies | (464,295 | ) | (17,829,365 | ) | (9,134,830 | ) | (1,932,304 | ) | ||||||||
| Net unrealized appreciation of investments | ||||||||||||||||
and other assets and liabilities denominated | ||||||||||||||||
| in foreign currencies | 499,356 | 11,089,486 | 3,195,306 | 1,006,931 | ||||||||||||
| Net Assets applicable to all shares outstanding | $ | 1,842,734 | $ | 57,263,131 | $ | 17,062,609 | $ | 4,606,107 | ||||||||
| Net Assets of Class I shares | $ | 1,842,734 | $ | 57,263,131 | $ | 14,445,075 | $ | 4,606,107 | ||||||||
| Net Assets of Class II shares | — | — | — | — | ||||||||||||
| Net Assets of Class III shares | — | — | — | — | ||||||||||||
| Net Assets of Class IV shares | — | — | — | — | ||||||||||||
| Net Assets of Class R shares | — | — | 2,617,534 | — | ||||||||||||
| Class I Shares outstanding | 196,642 | 5,180,056 | 1,395,795 | 571,913 | ||||||||||||
| Class II Shares outstanding | — | — | — | — | ||||||||||||
| Class III Shares outstanding | — | — | — | — | ||||||||||||
| Class IV Shares outstanding | — | — | — | — | ||||||||||||
| Class R Shares outstanding | — | — | 260,005 | — | ||||||||||||
Net Asset Value — Class I Share | $ | 9.37 | $ | 11.05 | $ | 10.35 | $ | 8.05 | ||||||||
Net Asset Value — Class II Share | $ | — | $ | — | $ | — | $ | — | ||||||||
Net Asset Value — Class III Share | $ | — | $ | — | $ | — | $ | — | ||||||||
Net Asset Value — Class IV Share | $ | — | $ | — | $ | — | $ | — | ||||||||
Net Asset Value — Class R Share | $ | — | $ | — | $ | 10.07 | $ | — | ||||||||
See Accompanying Notes to Financial Statements.
58
U.S. Systematic Large Cap Growth | U.S. Convertible | Global Select | International Growth | International Growth Opportunities | Emerging Markets | International Systematic | U.S. High Yield Bond | |||||||||||||||||||||||
| $ | 5,405,545 | $ | 405,211,279 | $ | 24,121,487 | $ | 30,560,383 | $ | 116,222,635 | $ | 41,675,896 | $ | 67,387,669 | $ | 74,938,329 | |||||||||||||||
| — | — | 1 | 10,307 | 1 | 457,985 | 21,857 | — | |||||||||||||||||||||||
| 120,487 | — | 14 | 6 | 180 | 6 | 30 | — | |||||||||||||||||||||||
| — | 6,484,218 | 754,056 | 550,939 | 13,166 | 2,883,291 | 1,412,265 | 3,166,497 | |||||||||||||||||||||||
| — | 7,045 | 1,695 | 14,392 | 27,495 | 175 | — | 66,637 | |||||||||||||||||||||||
| 4,037 | 120,169 | 48,858 | 71,302 | 244,338 | 138,259 | 172,558 | — | |||||||||||||||||||||||
| — | — | 94,159 | 34,591 | 93,248 | 829 | 136,120 | — | |||||||||||||||||||||||
| — | 2,136,893 | — | — | — | — | — | 1,734,169 | |||||||||||||||||||||||
| — | 1,149 | 2,559 | 1,184 | — | — | 12,833 | — | |||||||||||||||||||||||
| 5,530,069 | 413,960,753 | 25,022,829 | 31,243,104 | 116,601,063 | 45,156,441 | 69,143,332 | 79,905,632 | |||||||||||||||||||||||
| $ | — | $ | 574,937 | $ | — | $ | — | $ | — | $ | — | $ | — | $ | — | |||||||||||||||
| — | 2,993,391 | 748,267 | 427,742 | 2,606,206 | 138,970 | 1,256,719 | 5,193,618 | |||||||||||||||||||||||
| 3,781 | — | 375 | 6,373 | 9,542 | 4,006,750 | 63,484 | 4,430 | |||||||||||||||||||||||
| 2,002 | 181,082 | 12,829 | 21,064 | 63,441 | 32,035 | 27,571 | 23,015 | |||||||||||||||||||||||
| 7,026 | 80,923 | 22,060 | 4,100 | 73,281 | 20,061 | 29,836 | 14,890 | |||||||||||||||||||||||
| 12,809 | 3,830,333 | 783,531 | 459,279 | 2,752,470 | 4,197,816 | 1,377,610 | 5,235,953 | |||||||||||||||||||||||
| 5,517,260 | 410,130,420 | 24,239,298 | 30,783,825 | 113,848,593 | 40,958,625 | 67,765,722 | 74,669,679 | |||||||||||||||||||||||
| 4,492,596 | 359,628,157 | 21,162,916 | 24,749,369 | 96,931,135 | 30,990,141 | 59,148,554 | 71,320,121 | |||||||||||||||||||||||
| — | — | 1 | 10,249 | 1 | 447,560 | 21,795 | — | |||||||||||||||||||||||
| $ | 13,756,023 | $ | 409,993,029 | $ | 33,321,283 | $ | 34,164,601 | $ | 147,206,249 | $ | 35,720,980 | $ | 104,316,221 | $ | 79,842,592 | |||||||||||||||
| 59,604 | 495,099 | 424,722 | 535,888 | 1,744,206 | 673,809 | 1,350,740 | 216,059 | |||||||||||||||||||||||
| (9,211,316 | ) | (45,940,830 | ) | (12,475,805 | ) | (9,730,637 | ) | (54,397,894 | ) | (6,134,841 | ) | (46,151,687 | ) | (9,007,180 | ) | |||||||||||||||
| 912,949 | 45,583,122 | 2,969,098 | 5,813,973 | 19,296,032 | 10,698,677 | 8,250,448 | 3,618,208 | |||||||||||||||||||||||
| $ | 5,517,260 | $ | 410,130,420 | $ | 24,239,298 | $ | 30,783,825 | $ | 113,848,593 | $ | 40,958,625 | $ | 67,765,722 | $ | 74,669,679 | |||||||||||||||
| $ | 960,430 | $ | 57,450,787 | $ | 19,125,520 | $ | 20,103,462 | $ | 64,693,495 | $ | 14,148,210 | $ | 25,655,115 | $ | 74,669,679 | |||||||||||||||
| — | 37,457,478 | 5,113,778 | 10,680,363 | 14,193,692 | 26,810,415 | — | — | |||||||||||||||||||||||
| — | — | — | — | 34,961,406 | — | 42,110,607 | — | |||||||||||||||||||||||
| — | 315,222,155 | — | — | — | — | — | — | |||||||||||||||||||||||
| 4,556,830 | — | — | — | — | — | — | — | |||||||||||||||||||||||
| 59,984 | 2,425,193 | 44,359,167 | 2,671,730 | 2,523,624 | 1,717,553 | 2,656,913 | 8,233,508 | |||||||||||||||||||||||
| — | 1,579,320 | 7,519,165 | 1,419,743 | 532,367 | 3,235,109 | — | — | |||||||||||||||||||||||
| — | — | — | — | 1,309,914 | — | 4,345,892 | — | |||||||||||||||||||||||
| — | 13,289,768 | — | — | — | — | — | — | |||||||||||||||||||||||
| 291,596 | — | — | — | — | — | — | — | |||||||||||||||||||||||
| $ | 16.01 | $ | 23.69 | $ | 0.43 | $ | 7.52 | $ | 25.64 | $ | 8.24 | $ | 9.66 | $ | 9.07 | |||||||||||||||
| $ | — | $ | 23.72 | $ | 0.68 | $ | 7.52 | $ | 26.66 | $ | 8.29 | $ | — | $ | — | |||||||||||||||
| $ | — | $ | — | $ | — | $ | — | $ | 26.69 | $ | — | $ | 9.69 | $ | — | |||||||||||||||
| $ | — | $ | 23.72 | $ | — | $ | — | $ | — | $ | — | $ | — | $ | — | |||||||||||||||
| $ | 15.63 | $ | — | $ | — | $ | — | $ | — | $ | — | $ | — | $ | — | |||||||||||||||
59
NICHOLAS-APPLEGATE INSTITUTIONAL FUNDS
STATEMENTS OF OPERATIONS
Six Months Ended September 30, 2009 (Unaudited) | U.S. Ultra Micro Cap | U.S. Micro Cap | U.S. Emerging Growth | U.S. Small to Mid Cap Growth | ||||||||||||
| Dividends, net of foreign taxes* | $ | 3,349 | $ | 103,340 | $ | 34,181 | $ | 13,033 | ||||||||
| Interest | — | 1 | 3 | 4 | ||||||||||||
| Total Income | 3,349 | 103,341 | 34,184 | 13,037 | ||||||||||||
| Expenses | ||||||||||||||||
| Advisory fee | 11,391 | 246,534 | 45,147 | 9,896 | ||||||||||||
| Administration fees | 5,544 | 133,129 | 24,680 | 7,917 | ||||||||||||
| Shareholder servicing fees | — | — | 2,680 | — | ||||||||||||
Trustees’ fees and expenses | — | — | — | — | ||||||||||||
| Interest and credit facility fee | — | — | — | — | ||||||||||||
| Miscellaneous | 800 | 800 | 1,272 | 1,030 | ||||||||||||
| Total Expenses | 17,734 | 380,463 | 73,779 | 18,843 | ||||||||||||
| Expense offset | (998 | ) | (5,184 | ) | (1,307 | ) | (1,065 | ) | ||||||||
| Net Expenses | 16,736 | 375,279 | 72,472 | 17,778 | ||||||||||||
| Net Investment Income (Loss) | (13,387 | ) | (271,938 | ) | (38,288 | ) | (4,741 | ) | ||||||||
| Net Realized and Unrealized | ||||||||||||||||
| Gain (Loss) on Investments | ||||||||||||||||
| Realized gain from: | ||||||||||||||||
Securities | 42,417 | (653,802 | ) | (174,653 | ) | 61,061 | ||||||||||
| Foreign currency transactions | — | — | — | — | ||||||||||||
| Net realized gain (loss) | 42,417 | (653,802 | ) | (174,653 | ) | 61,061 | ||||||||||
| Change in unrealized appreciation of: | ||||||||||||||||
| Investments | 665,819 | 19,055,220 | 5,231,804 | 1,447,309 | ||||||||||||
Other assets and liabilities denominated in | ||||||||||||||||
| foreign currencies | — | — | — | — | ||||||||||||
| Net unrealized appreciation | 665,819 | 19,055,220 | 5,231,804 | 1,447,309 | ||||||||||||
| Net Gain on Investments | 708,236 | 18,401,418 | 5,057,151 | 1,508,370 | ||||||||||||
| Assets Resulting From Operations | $ | 694,849 | $ | 18,129,480 | $ | 5,018,863 | $ | 1,503,629 | ||||||||
| * Foreign taxes withheld | $ | 64 | $ | — | $ | 116 | $ | 298 | ||||||||
See Accompanying Notes to Financial Statements.
60
U.S. Systematic Large Cap Growth | U.S. Convertible | Global Select | International Growth | International Growth Opportunities | Emerging Markets | International Systematic | U.S. High Yield Bond | |||||||||||||||||||||||
| $ | 46,449 | $ | 1,898,292 | $ | 241,851 | $ | 443,941 | $ | 1,366,903 | $ | 682,635 | $ | 1,230,951 | $ | — | |||||||||||||||
| 31 | 5,899,488 | — | 86 | — | — | 1,239 | 3,252,147 | |||||||||||||||||||||||
| 46,480 | 7,797,780 | 241,851 | 444,027 | 1,366,903 | 682,635 | 1,232,190 | 3,252,147 | |||||||||||||||||||||||
| 13,080 | 974,173 | 68,565 | 121,284 | 316,775 | 175,283 | 140,251 | 126,219 | |||||||||||||||||||||||
| 17,797 | 408,432 | 48,636 | 32,097 | 276,047 | 68,092 | 92,634 | 63,109 | |||||||||||||||||||||||
| 5,021 | — | — | — | — | — | — | — | |||||||||||||||||||||||
| — | 8,476 | — | 979 | — | 832 | — | 103 | |||||||||||||||||||||||
| — | — | 4 | 245 | 23 | 127 | 198 | — | |||||||||||||||||||||||
| 800 | 1,475 | 1,155 | 1,333 | 7,519 | 28,408 | 800 | 855 | |||||||||||||||||||||||
| 36,698 | 1,392,556 | 118,360 | 155,938 | 600,364 | 272,743 | 233,883 | 190,286 | |||||||||||||||||||||||
| (1,150 | ) | (2,869 | ) | (2,310 | ) | (670 | ) | 4,797 | (1,419 | ) | (4,611 | ) | (552 | ) | ||||||||||||||||
| 35,548 | 1,389,687 | 116,050 | 155,268 | 605,161 | 271,324 | 229,272 | 189,734 | |||||||||||||||||||||||
| 10,932 | 6,408,093 | 125,801 | 288,759 | 761,742 | 411,311 | 1,002,918 | 3,062,413 | |||||||||||||||||||||||
| (487,957 | ) | (17,168,408 | ) | (442,726 | ) | (128,897 | ) | (4,313,958 | ) | 5,590,688 | 1,326,153 | (1,209,395 | ) | |||||||||||||||||
| — | — | (2,386 | ) | 16,986 | (17,358 | ) | (30,011 | ) | 3,573 | — | ||||||||||||||||||||
| (487,957 | ) | (17,168,408 | ) | (445,112 | ) | (111,911 | ) | (4,331,316 | ) | 5,560,677 | 1,329,726 | (1,209,395 | ) | |||||||||||||||||
| 1,717,427 | 93,935,937 | 6,447,754 | 8,995,556 | 42,511,885 | 10,120,376 | 16,601,379 | 13,033,776 | |||||||||||||||||||||||
| — | — | 8,252 | 2,011 | 3,803 | 11,573 | 7,922 | — | |||||||||||||||||||||||
| 1,717,427 | 93,935,937 | 6,456,006 | 8,997,567 | 42,515,688 | 10,131,949 | 16,609,301 | 13,033,776 | |||||||||||||||||||||||
| 1,229,470 | 76,767,529 | 6,010,894 | 8,885,656 | 38,184,372 | 15,692,626 | 17,939,027 | 11,824,381 | |||||||||||||||||||||||
| $ | 1,240,402 | $ | 83,175,622 | $ | 6,136,695 | $ | 9,174,415 | $ | 38,946,114 | $ | 16,103,937 | $ | 18,941,945 | $ | 14,886,794 | |||||||||||||||
| $ | — | $ | — | $ | 21,075 | $ | 42,561 | $ | 124,840 | $ | 78,349 | $ | 138,612 | $ | — | |||||||||||||||
61
NICHOLAS-APPLEGATE INSTITUTIONAL FUNDS
STATEMENTS OF CHANGES IN NET ASSETS
| U.S. Ultra Micro Cap | U.S. Micro Cap | |||||||||||||||
Six Months Ended September 30, 2009 and Year Ended March 31, 2009 | September 30, 2009 (Unaudited) | March 2009 | September 30, 2009 (Unaudited) | March 2009 | ||||||||||||
| Increase (Decrease) in Net Assets: | ||||||||||||||||
Net investment income (loss) | $ | (13,387 | ) | $ | (27,138 | ) | $ | (271,938 | ) | $ | (346,977 | ) | ||||
| Net realized gain (loss) | 42,417 | (489,084 | ) | (653,802 | ) | (15,983,886 | ) | |||||||||
| Net unrealized appreciation (depreciation) | 665,819 | (122,292 | ) | 19,055,220 | (6,288,864 | ) | ||||||||||
| Investment operations | 694,849 | (638,514 | ) | 18,129,480 | (22,619,727 | ) | ||||||||||
| Distributions to Shareholders: | ||||||||||||||||
| From net investment income | ||||||||||||||||
| Class I | — | — | — | — | ||||||||||||
| Class II | — | — | — | — | ||||||||||||
| Class IV | — | — | — | — | ||||||||||||
| From net realized gains | ||||||||||||||||
| Class I | — | — | — | (18,218 | ) | |||||||||||
| Class II | — | — | — | — | ||||||||||||
| Class IV | — | — | — | — | ||||||||||||
Total distributions | — | — | — | (18,218 | ) | |||||||||||
| From Capital Share Transactions: | ||||||||||||||||
| Proceeds from shares sold | ||||||||||||||||
| Class I | 121,878 | 856,224 | 2,415,126 | 15,606,664 | ||||||||||||
| Class II | — | — | — | — | ||||||||||||
| Class IV | — | — | — | — | ||||||||||||
| Class R | — | — | — | — | ||||||||||||
| Distributions reinvested | ||||||||||||||||
| Class I | — | — | — | 18,097 | ||||||||||||
| Class II | — | — | — | — | ||||||||||||
| Class IV | — | — | — | — | ||||||||||||
| Cost of shares redeemed | ||||||||||||||||
| Class I | (58,064 | ) | (19,787 | ) | (3,459,098 | ) | (12,931,589 | ) | ||||||||
| Class II | — | — | — | — | ||||||||||||
| Class R | — | — | — | — | ||||||||||||
| Net increase (decrease) in net assets from share transactions | 63,814 | 836,437 | (1,043,972 | ) | 2,693,172 | |||||||||||
Net Increase (Decrease) in Net Assets | 758,663 | 197,923 | 17,085,508 | (19,944,773 | ) | |||||||||||
| Net Assets | ||||||||||||||||
| Beginning | 1,084,071 | 886,147 | 40,177,623 | 60,122,396 | ||||||||||||
| Ending | $ | 1,842,734 | $ | 1,084,071 | $ | 57,263,131 | $ | 40,177,623 | ||||||||
| Undistributed net investment income (loss), ending | $ | (13,387 | ) | $ | (27,138 | ) | $ | (271,938 | ) | $ | — | |||||
Class I — Capital Share Activity | ||||||||||||||||
| Shares sold | 15,768 | 95,380 | 256,753 | 1,532,253 | ||||||||||||
| Distributions reinvested | — | — | — | 2,288 | ||||||||||||
| Shares exchanged | — | — | — | |||||||||||||
| Shares redeemed | (6,561 | ) | (3,466 | ) | (377,024 | ) | (1,419,052 | ) | ||||||||
| Net Class I Share Activity | 9,207 | 91,914 | (120,271 | ) | 115,489 | |||||||||||
Class II — Capital Share Activity | ||||||||||||||||
| Shares sold | — | — | — | — | ||||||||||||
| Distributions reinvested | — | — | — | — | ||||||||||||
| Shares redeemed | — | — | — | — | ||||||||||||
| Net Class II Share Activity | — | — | — | — | ||||||||||||
Class IV — Capital Share Activity | ||||||||||||||||
| Shares sold | — | — | — | — | ||||||||||||
Distributions reinvested | — | — | — | — | ||||||||||||
| Shares redeemed | — | — | — | — | ||||||||||||
| Net Class IV Share Activity | — | — | — | — | ||||||||||||
Class R — Capital Share Activity | ||||||||||||||||
| Shares sold | — | — | — | — | ||||||||||||
| Distributions reinvested | — | — | — | — | ||||||||||||
| Shares redeemed | — | — | — | — | ||||||||||||
| Net Class R Share Activity | — | — | — | — | ||||||||||||
See Accompanying Notes to Financial Statements.
62
| U.S. Emerging Growth | U.S. Small to Mid Cap Growth | U.S. Systematic Large Cap Growth | U.S. Convertible | |||||||||||||||||||||||||||
September 30, 2009 (Unaudited) | March 2009 | September 30, 2009 (Unaudited) | March 2009 | September 30, 2009 (Unaudited) | March 2009 | September 30, 2009 (Unaudited) | March 2009 | |||||||||||||||||||||||
| $ | (38,288 | ) | $ | (40,240 | ) | $ | (4,741 | ) | $ | (18,408 | ) | $ | 10,932 | $ | 48,672 | $ | 6,408,093 | $ | 6,993,667 | |||||||||||
| (174,653 | ) | (3,991,029 | ) | 61,061 | (1,672,761 | ) | (487,957 | ) | (1,713,044 | ) | (17,168,408 | ) | (22,074,355 | ) | ||||||||||||||||
| 5,231,804 | (1,566,687 | ) | 1,447,308 | (257,128 | ) | 1,717,427 | (1,284,603 | ) | 93,935,937 | (49,650,857 | ) | |||||||||||||||||||
| 5,018,863 | (5,597,956 | ) | 1,503,628 | (1,948,297 | ) | 1,240,402 | (2,948,975 | ) | 83,175,622 | (64,731,545 | ) | |||||||||||||||||||
| — | — | — | — | — | — | (755,722 | ) | (477,679 | ) | |||||||||||||||||||||
| — | — | — | — | — | — | (558,980 | ) | (621,794 | ) | |||||||||||||||||||||
| — | — | — | — | — | — | (4,972,169 | ) | (5,559,726 | ) | |||||||||||||||||||||
| — | — | — | — | — | — | — | (107,496 | ) | ||||||||||||||||||||||
| — | — | — | — | — | — | — | (237,582 | ) | ||||||||||||||||||||||
| — | — | — | — | — | — | — | (1,514,785 | ) | ||||||||||||||||||||||
| — | — | — | — | — | — | (6,286,871 | ) | (8,519,062 | ) | |||||||||||||||||||||
| 4,153,557 | 5,416,300 | — | 188,770 | 329,351 | 64,726 | 31,516,118 | 18,412,911 | |||||||||||||||||||||||
| — | — | — | — | 653 | (400 | ) | — | 41,196,161 | ||||||||||||||||||||||
| — | — | — | — | — | — | 5,467,462 | 53,965,866 | |||||||||||||||||||||||
| 321,992 | 659,133 | — | — | 349,050 | 329,609 | — | — | |||||||||||||||||||||||
| — | — | — | — | — | — | 669,520 | 568,643 | |||||||||||||||||||||||
| — | — | — | — | — | — | 558,980 | 859,376 | |||||||||||||||||||||||
| — | — | — | — | — | — | 68,517 | 35,016 | |||||||||||||||||||||||
| (410,187 | ) | (1,926,575 | ) | — | — | (41,548 | ) | (90,716 | ) | (2,917,039 | ) | (43,467,945 | ) | |||||||||||||||||
| — | — | — | — | (2,496,831 | ) | (7,520,810 | ) | (4,200 | ) | (10,541,032 | ) | |||||||||||||||||||
| (148,953 | ) | (792,831 | ) | — | — | (111,389 | ) | (792,263 | ) | — | — | |||||||||||||||||||
| 3,916,409 | 3,356,027 | — | 188,770 | (1,970,714 | ) | (8,009,854 | ) | 35,359,358 | 61,028,996 | |||||||||||||||||||||
| 8,935,272 | (2,241,929 | ) | 1,503,628 | (1,759,527 | ) | (730,312 | ) | (10,958,829 | ) | 112,248,109 | (12,221,611 | ) | ||||||||||||||||||
| 8,127,337 | 10,369,266 | 3,102,479 | 4,862,006 | 6,247,572 | 17,206,401 | 297,882,311 | 310,103,922 | |||||||||||||||||||||||
| $ | 17,062,609 | $ | 8,127,337 | $ | 4,606,107 | $ | 3,102,479 | $ | 5,517,260 | $ | 6,247,572 | $ | 410,130,420 | $ | 297,882,311 | |||||||||||||||
| $ | (38,288 | ) | $ | (40,240 | ) | $ | (4,741 | ) | $ | — | $ | 59,604 | $ | 48,672 | $ | 495,099 | $ | 376,387 | ||||||||||||
| 442,919 | 554,485 | — | 32,886 | 23,149 | 4,483 | 1,443,619 | 875,435 | |||||||||||||||||||||||
| — | — | — | — | — | — | 29,892 | 27,942 | |||||||||||||||||||||||
| — | — | — | — | — | — | — | — | |||||||||||||||||||||||
| (47,041 | ) | (209,274 | ) | — | — | (2,927 | ) | (5,503 | ) | (135,423 | ) | 1,736,645 | ||||||||||||||||||
| 395,878 | 345,211 | — | 32,866 | 20,222 | (1,020 | ) | 1,338,088 | (833,268 | ) | |||||||||||||||||||||
| — | — | — | — | — | (21 | ) | — | 1,621,749 | ||||||||||||||||||||||
| — | — | — | — | — | — | 25,116 | 45,437 | |||||||||||||||||||||||
| — | — | — | — | (177,372 | ) | (371,830 | ) | (192 | ) | (478,652 | ) | |||||||||||||||||||
| — | — | — | — | (177,372 | ) | (371,851 | ) | 24,924 | 1,188,534 | |||||||||||||||||||||
| — | — | — | — | — | — | 268,286 | 2,843,254 | |||||||||||||||||||||||
| — | — | — | — | — | — | 3,079 | 1,837 | |||||||||||||||||||||||
| — | — | — | — | — | — | — | — | |||||||||||||||||||||||
| — | — | — | — | — | — | 271,365 | 2,845,091 | |||||||||||||||||||||||
| 38,275 | 72,627 | — | — | 24,293 | 20,763 | — | — | |||||||||||||||||||||||
| — | — | — | — | — | — | — | — | |||||||||||||||||||||||
| (17,609 | ) | (89,614 | ) | — | — | (7,975 | ) | (51,985 | ) | — | — | |||||||||||||||||||
| 20,666 | (16,987 | ) | — | — | 16,318 | (31,222 | ) | — | — | |||||||||||||||||||||
63
NICHOLAS-APPLEGATE INSTITUTIONAL FUNDS
STATEMENTS OF CHANGES IN NET ASSETS
| Global Select | International Growth | |||||||||||||||
Periods Ended September 30, 2009 and March 31, 2009 | September 30, 2009 (Unaudited) | March 2009 | September 30, 2009 (Unaudited) | March 2009 | ||||||||||||
| Increase (Decrease) in Net Assets: | ||||||||||||||||
| Net investment income (loss) | $ | 125,801 | $ | 331,247 | $ | 288,759 | $ | 250,744 | ||||||||
| Net realized gain (loss) | (445,112 | ) | (9,604,900 | ) | (111,911 | ) | (5,033,601 | ) | ||||||||
| Net unrealized appreciation (depreciation) | 6,456,006 | (9,529,140 | ) | 8,997,567 | (3,841,041 | ) | ||||||||||
| Investment operations | 6,136,695 | (18,802,793 | ) | 9,174,415 | (8,623,898 | ) | ||||||||||
| Distributions to Shareholders: | ||||||||||||||||
| From net investment income | ||||||||||||||||
| Class I | — | (927,999 | ) | — | (89,546 | ) | ||||||||||
| Class II | — | (115,238 | ) | — | — | |||||||||||
| Class III | — | — | — | — | ||||||||||||
| From net realized gains | ||||||||||||||||
| Class I | — | (23,253,999 | ) | — | (1,561,939 | ) | ||||||||||
| Class II | — | (7,666,149 | ) | — | — | |||||||||||
| Class III | — | — | — | — | ||||||||||||
| Total distributions | — | (31,963,385 | ) | — | (1,651,485 | ) | ||||||||||
| From Capital Share Transactions: | ||||||||||||||||
| Proceeds from shares sold | ||||||||||||||||
| Class I | 679,807 | 3,419,045 | 5,531,587 | 32,914,863 | ||||||||||||
| Class II | 1,075,789 | 3,565,280 | 1,167,220 | 6,757,109 | ||||||||||||
| Class III | — | — | — | — | ||||||||||||
Distributions reinvested | ||||||||||||||||
| Class I | — | 22,886,619 | — | 1,649,290 | ||||||||||||
| Class II | — | 7,781,254 | — | — | ||||||||||||
| Class III | — | — | — | — | ||||||||||||
| Cost of shares redeemed | ||||||||||||||||
| Class I | (1,315,487 | ) | (6,601,603 | ) | (8,911,900 | ) | (14,452,820 | ) | ||||||||
| Class II | (443 | ) | (3,907,251 | ) | (94,000 | ) | (16,827 | ) | ||||||||
| Class III | — | — | — | — | ||||||||||||
| Net increase (decrease) in net assets from share transactions | 439,666 | 27,143,344 | (2,307,093 | ) | 26,851,615 | |||||||||||
| Net Increase (Decrease) in Net Assets | 6,576,361 | (23,622,834 | ) | 6,867,322 | 16,576,232 | |||||||||||
| Net Assets | ||||||||||||||||
| Beginning | 17,662,937 | 41,285,771 | 23,916,503 | 7,340,271 | ||||||||||||
| Ending | $ | 24,239,298 | $ | 17,662,937 | $ | 30,783,825 | $ | 23,916,503 | ||||||||
| Undistributed net investment income, ending | $ | 424,722 | $ | 298,921 | $ | 535,888 | $ | 247,129 | ||||||||
Class I — Capital Share Activity | ||||||||||||||||
| Shares sold | 1,817,003 | 3,371,929 | 882,549 | 4,779,674 | ||||||||||||
Distributions reinvested | — | 45,906,774 | — | 269,492 | ||||||||||||
| Shares exchanged | — | — | — | — | ||||||||||||
| Shares redeemed | (3,411,834 | ) | 5,907,624 | (1,347,664 | ) | (2,523,359 | ) | |||||||||
| Net Class I Share Activity | (1,594,831 | ) | 43,371,079 | (465,115 | ) | 2,525,807 | ||||||||||
Class II — Capital Share Activity | ||||||||||||||||
| Shares sold | 1,630,046 | 251,077 | 165,456 | 1,268,477 | ||||||||||||
| Distributions reinvested | — | 10,954,527 | — | — | ||||||||||||
| Shares exchanged | — | — | — | — | ||||||||||||
| Shares redeemed | (652 | ) | (5,982,864 | ) | (14,190 | ) | — | |||||||||
| Net Class II Share Activity | 1,629,394 | 5,222,740 | 151,266 | 1,268,477 | ||||||||||||
Class III — Capital Share Activity | ||||||||||||||||
| Shares sold | — | — | — | — | ||||||||||||
| Distributions reinvested | — | — | — | — | ||||||||||||
| Shares redeemed | — | — | — | — | ||||||||||||
| Net Class III Share Activity | — | — | — | — | ||||||||||||
Class IV — Capital Share Activity | ||||||||||||||||
| Shares sold | — | — | — | — | ||||||||||||
| Distributions reinvested | — | — | — | — | ||||||||||||
| Shares redeemed | — | — | — | — | ||||||||||||
| Net Class IV Share Activity | — | — | — | — | ||||||||||||
See Accompanying Notes to Financial Statements.
64
International Growth Opportunities | Emerging Markets | International Systematic | U.S. High Yield Bond | |||||||||||||||||||||||||||
September 30, 2009 (Unaudited) | March 2009 | September 30, 2009 (Unaudited) | March 2009 | September 30, 2009 (Unaudited) | March 2009 | September 30, 2009 (Unaudited) | March 2009 | |||||||||||||||||||||||
| $ | 761,742 | $ | 1,033,056 | $ | 411,311 | $ | 358,652 | $ | 1,002,918 | $ | 2,067,447 | $ | 3,062,413 | $ | 4,078,388 | |||||||||||||||
| (4,331,316 | ) | (29,386,784 | ) | 5,560,677 | (11,667,294 | ) | 1,329,726 | (39,416,288 | ) | (1,209,395 | ) | (3,328,327 | ) | |||||||||||||||||
| 42,515,688 | (38,245,341 | ) | 10,131,949 | 227,604 | 16,609,301 | (5,073,360 | ) | 13,033,776 | (7,257,264 | ) | ||||||||||||||||||||
| 38,946,114 | (66,599,069 | ) | 16,103,937 | (11,081,038 | ) | 18,941,945 | (42,422,201 | ) | 14,886,794 | (6,507,203 | ) | |||||||||||||||||||
| — | — | — | (16,036 | ) | — | (746,687 | ) | (2,855,295 | ) | (4,454,710 | ) | |||||||||||||||||||
| — | — | — | (62,553 | ) | — | — | — | — | ||||||||||||||||||||||
| — | — | — | — | — | (1,409,121 | ) | — | — | ||||||||||||||||||||||
| — | (10,682,297 | ) | — | (404,993 | ) | — | (4,064 | ) | — | — | ||||||||||||||||||||
| — | (450,051 | ) | — | (3,015,024 | ) | — | (284 | ) | — | — | ||||||||||||||||||||
| — | (3,457,540 | ) | — | — | — | (7,178 | ) | — | — | |||||||||||||||||||||
| — | (14,589,888 | ) | — | (3,498,606 | ) | — | (2,167,334 | ) | (2,855,295 | ) | (4,454,710 | ) | ||||||||||||||||||
| 10,506,527 | 26,847,095 | 2,205,694 | 11,242,745 | 205,807 | 6,557,476 | 16,810,672 | 25,191,406 | |||||||||||||||||||||||
| 1,091,673 | 12,108,095 | 9,156,833 | 11,246,474 | — | 1,672,727 | — | — | |||||||||||||||||||||||
| 7,120,840 | 25,556,793 | — | — | 4,968,715 | 3,024 | — | — | |||||||||||||||||||||||
| — | 10,572,511 | — | 421,029 | — | 750,751 | 2,579,589 | 4,193,149 | |||||||||||||||||||||||
| — | 450,051 | — | 3,077,577 | — | 284 | — | — | |||||||||||||||||||||||
| — | 3,457,540 | — | — | — | 1,416,008 | — | — | |||||||||||||||||||||||
| (7,893,198 | ) | (47,427,822 | ) | (1,604,879 | ) | (1,880,291 | ) | (207,519 | ) | (112,516 | ) | (5,985,441 | ) | (19,459,996 | ) | |||||||||||||||
| 1,295,467 | (9,046,524 | ) | (11,576,979 | ) | (1,000 | ) | — | (22,510,707 | ) | — | — | |||||||||||||||||||
| (20 | ) | — | — | — | — | (5,271 | ) | — | — | |||||||||||||||||||||
| 12,121,289 | 22,517,739 | (1,819,331 | ) | 24,106,534 | 4,967,003 | (12,385,231 | ) | 13,404,820 | 9,924,559 | |||||||||||||||||||||
| 51,067,403 | (58,671,218 | ) | 14,284,606 | 9,526,890 | 23,908,948 | (56,974,766 | ) | 25,436,319 | 1,037,354 | |||||||||||||||||||||
| 62,781,190 | 121,452,408 | 26,674,019 | 17,147,129 | 43,856,774 | 100,831,540 | 49,233,360 | 50,270,714 | |||||||||||||||||||||||
| $ | 113,848,593 | $ | 62,781,190 | $ | 40,958,625 | $ | 26,674,019 | $ | 67,765,722 | $ | 43,856,774 | $ | 74,669,679 | $ | 49,233,360 | |||||||||||||||
| $ | 1,744,206 | $ | 982,464 | $ | 673,809 | $ | 262,498 | $ | 1,350,740 | $ | 347,822 | $ | 48,652 | $ | 8,941 | |||||||||||||||
| 454,042 | 1,091,824 | 306,465 | 1,647,455 | 24,894 | 594,056 | 1,987,758 | 3,227,477 | |||||||||||||||||||||||
| — | 621,547 | — | 77,681 | — | 96,746 | 303,912 | 523,672 | |||||||||||||||||||||||
| — | — | — | — | — | 164,661 | — | — | |||||||||||||||||||||||
| (366,624 | ) | (2,101,210 | ) | (230,431 | ) | (267,836 | ) | (23,456 | ) | (8,156 | ) | (712,124 | ) | (2,469,177 | ) | |||||||||||||||
| 87,418 | (387,839 | ) | 76,034 | 1,457,300 | 1,438 | 847,307 | 1,579,546 | 1,281,972 | ||||||||||||||||||||||
| 42,178 | 537,531 | 1,375,716 | 1,790,959 | — | 164,800 | — | — | |||||||||||||||||||||||
| — | 25,470 | — | 564,693 | — | 35 | — | — | |||||||||||||||||||||||
| — | — | — | — | — | (157,007 | ) | — | — | ||||||||||||||||||||||
| 86,762 | (358,527 | ) | (1,578,979 | ) | (106 | ) | — | (1,992,845 | ) | — | — | |||||||||||||||||||
| 128,940 | 204,474 | (203,263 | ) | 2,355,546 | — | (1,985,017 | ) | — | — | |||||||||||||||||||||
| 349,173 | 765,180 | — | — | 538,809 | 341 | — | — | |||||||||||||||||||||||
| — | 195,562 | — | — | — | 182,240 | — | — | |||||||||||||||||||||||
| (1 | ) | — | — | — | — | (749 | ) | — | — | |||||||||||||||||||||
| 349,172 | 960,742 | — | — | 538,809 | 181,832 | — | — | |||||||||||||||||||||||
| — | — | — | — | — | — | — | — | |||||||||||||||||||||||
| — | — | — | — | — | — | — | — | |||||||||||||||||||||||
| — | — | — | — | — | — | — | — | |||||||||||||||||||||||
| — | — | — | — | — | — | — | — | |||||||||||||||||||||||
65
NICHOLAS-APPLEGATE INSTITUTIONAL FUNDS
NOTES TO FINANCIAL STATEMENTS — (Unaudited)
NOTE A — ORGANIZATION
Nicholas-Applegate Institutional Funds (the “Trust”) is an open-end investment management company. The Trust was established as a Delaware business trust on December 17, 1992 and consists of twelve separate portfolios (collectively, the “Funds” and each, a “Fund”). Each Fund’s investment objectives, strategies and risks are discussed in the Funds’ current prospectuses. All of the Funds have issued Class I shares (“Class I”), four Funds have issued Class II shares (“Class II”), two Funds have issued Class III shares (“Class III”), one Fund has issued Class IV shares (“Class IV”) and two Funds have issued Retirement shares (“Class R”). No shares have a sales charge. Class R has a distribution fee. The Funds offering Class I, Class II, Class III and Class IV shares are covered in this report.
NOTE B — SIGNIFICANT ACCOUNTING POLICIES
Significant accounting policies consistently followed by the Funds in preparing these financial statements are described below. The policies conform with accounting principles generally accepted in the United States.
Security Valuations
Equity securities, including ADRs, and GDRs, that are traded on a stock exchange or on the NASDAQ National Market System are valued at the last sale price as of the close of business on the New York Stock Exchange (normally 4:00 p.m. New York time) on the day the securities are being valued, or lacking any sales, at the mean between the closing bid and asked prices. Securities listed or traded on certain non-U.S. exchanges whose operations are similar to the United States over-the-counter market are valued at the price within the limits of the latest available current bid and asked prices deemed by Nicholas-Applegate Capital Management LLC (the “Adviser”) to best reflect fair value. A security that is listed or traded on more than one exchange is valued at the quotation on the exchange determined to be the primary market for such security by the Adviser. Equity Linked Notes (“ELN’s”) are valued by using the closing local price for the underlying security and applying the exchange rate for the currency to arrive at a USD equivalent.
Long-term debt obligations, including high quality and high yield corporate securities, municipal securities, asset-backed securities, collateralized mortgage obligations and U.S. Government and Agency issues, are normally valued at the mean between bid and ask price provided by an approved bond pricing service. In the event a TRACE price is used, the price is the last traded price on that day greater than or equal to 1mm par amount. Convertible securities are normally priced at the mean between the bid and ask prices. If such a security has a demand feature excercisable within one to seven days, the security is valued at par. In the event that a pricing service does not price a particular security or the price provided is not believed to be reliable, the Adviser will endeavor to use the average of one or two broker-dealer quotations. If broker-dealer quotations are not available, the Adviser generally “stales” the price. Short-term debt instruments (e.g., commercial paper, bankers acceptances, U.S. Treasury Bills, etc.) having a maturity of less than 60 days will be valued at amortized cost.
Securities or other assets for which reliable market quotations are not readily available or for which the pricing agent or principal market maker does not provide a valuation or methodology or provides a valuation or methodology that, in the judgment of the Adviser, does not represent fair value (“Fair Value Securities”), are valued by the Adviser’s Pricing Committee overseen by the Board of Trustees in consultation, as applicable, with the Adviser’s portfolio managers, investment analysts and legal and compliance personnel. Fair Value Securities may include, but are no limited to, the following: certain private placements and restricted securities that do not have an active trading market; securities whose trading has been suspended or for which there is no current market; securities whose prices are stale; securities denominated in currencies that are restricted or untraded, or for which exchange rates are disrupted; securities affected by significant events; and securities that the Adviser’s Pr icing Committee believes were priced incorrectly. A “significant event” (which includes, but is not limited to, an extraordinary political or market event) is an event that the Adviser’s Pricing Committee believes with a reasonably high degree of certainty has caused the closing market prices of a Fund’s portfolio securities to no longer reflect their value at the time of the Fund’s NAV calculation.
Security Transactions and Investment Income
Security ransactions are accounted for as of trade date. Realized gains and losses from security transactions are determined on an identified-cost basis.
Dividend income is recorded on the ex-dividend date or, for certain non-U.S. securities, when the information becomes available to the Funds. Interest income is recorded on an accrual basis. Discounts and premiums on debt securities are accreted and amortized on the yield to maturity basis.
Non-U.S. Currency Transactions
On each net asset valuation date, the value of assets and liabilities denominated in non-U.S. currencies are translated into U.S. dollars using the current exchange rate at 11:00 a.m. Eastern Time against the U.S. dollar, as provided by an approved pricing service. Security transactions, income and expenses are converted at the prevailing exchange rate on the day of the event. The effect of changes in exchange rates on securities denominated in a non-U.S. currency is included with the net realized and unrealized gain or loss of the associated security. Foreign exchange rates are translated into U.S. dollars when the exchange rate is struck at the close of the London Stock exchange. Other non-U.S. currency gains or losses are reported separately.
Certain Funds may use forward non-U.S. currency contracts to reduce their exposure to currency fluctuations of their non- U.S. securities. These contracts are commitments to purchase or sell a non-U.S. currency at a specified rate on a future date. When the contract is fulfilled or closed, gains or losses are realized. Until then, the gain or loss is included in unrealized appreciation or depreciation of investments. The contract commitment is fully collateralized by cash or securities of the Fund. Non-U.S. denominated assets and forward currency contracts may involve more risks than U.S. transactions, including currency risk, political and economic risk, regulatory and market risk. Evaluating and monitoring such risk exposure is a part of the Funds’ management strategy. The Funds did not use forward non-U.S. currency contracts at September 30, 2009.
66
Futures Contracts
Each Fund may enter into futures contracts involving non-U.S. currency, interest rates, securities, and securities indices, for hedging purposes only. A futures contract obligates the seller of the contract to deliver and the purchaser of the contract to take deliver y of the type of non-U.S. currency, financial instrument or security called for in the contract at a specified future time for a specified price. Upon entering into such a contract, a Fund is required to deposit and maintain as collateral such initial margin as required by the exchange on which the contract is traded. Pursuant to the contract, a Fund agrees to receive from or pay to the broker an amount equal to the daily fluctuations in the value of the contract. Such receipts or payments are known as variation margin and are recorded as unrealized gains or losses by the Fund. When the contract is closed, the Fund records a realized gain or loss equal to the difference between the value of the contract at the time it was opened and the value at the time it was closed. For the period ended September 30, 2009, the Funds did hold futures contracts.
Equity-Linked Securities
Certain Funds may purchase equity-linked securities, also known as participation notes, equity swaps, and zero strike calls and warrants. Equity-linked securities are primarily used by a Fund as an alternative means to more efficiently and effectively access what is generally an emerging securities market. The Fund deposits an amount of cash with its custodian (or broker, if legally permitted) in an amount near or equal to the selling price of the underlying security in exchange for an equity linked security. Upon sale, the Fund receives cash from the broker or custodian equal to the value of the underlying security. Aside from market risk of the underlying securities, there is a risk of default by the counterparty to the transaction. In the event of insolvency of the counterparty, the Fund might be unable to obtain its expected benefit. In addition, while a Fund will seek to enter into such transactions only with parties which are capable of entering into closing transactions with the Fund, there can be no assurance that the Fund will be able to close out such a transaction with the counterparty or obtain an offsetting position with any counterparty, at any time prior to the end of the term of the underlying agreement. This may impair the Fund’s ability to enter into other transactions at a time when doing so might be advantageous.
Securities Lending
In order to generate expense offset credits, each of the Funds may lend portfolio securities, on a short-term or a long-term basis, up to 30% of a Fund’s total assets. The loans are secured by collateral in the form of cash, cash equivalents, U.S. government and agency securities equal to at least 102% of the market value of securities loaned on U.S. securities and 105% of the market value of securites loaned on non-U.S. securities. During the term of the loan, the Funds will continue to receive any interest, dividends or amounts equivalent thereto, on the loaned securities while receiving a fee from the borrower and/or earning interest on the investment of the cash collateral. Upon termination of the loan, the borrower will return to the Funds securities identical to the loaned securities. The Funds may pay reasonable finders’, administration and custodial fees in connection with a loan of its securities and may share the interest earned on the collateral with the borrower.
The Funds bear the risk of delay in recovery of, or even loss of rights in, the securities loaned should the borrower of the securities fail financially. The Funds also bear the risk of loss in the event the securities purchased with cash collateral depreciate in value. Loans are subject to termination at the option of the borrower of the Fund. There were no securities on loan for the period ended September 30, 2009. The Funds terminated the security lending program on April 1, 2009.
Credit Facility
The Trust has a $15 million credit facility available to fund temporary or emergency borrowing expiring in March 2010. A Fund will pay its pro-rata share of an annual commitment fee plus interest on its specific borrowings. For the period ended September 30, 2009, the Funds did not borrow against the line of credit.
Commitments and Contingencies
In the normal course of business, the Funds may enter into contracts and agreements that contain a variety of representations and warranties which provide general indemnifications. The maximum exposure to the Funds under these arrangements is unknown, as this would involve future claims that may be made against the Funds that have not yet occurred. However, based on experience, the Funds expect the risks of loss to be remote.
Fund Expenses and Multi-Class Allocations
Each Fund bears expenses incurred specifically on its behalf plus an allocation of its share of Trust level expenses. Each share offered by a Fund has equal rights to assets but incurs certain Class specific expenses. The Funds allocate income, gains and losses, both realized and unrealized, and expenses, except for Class specific expenses, based on the relative net assets of each share class.
During the period ended September 30, 2009, many of the brokers with whom the Adviser places trades on behalf of the Funds provided services to the Funds in addition to trade execution. These services included payments of certain expenses on behalf of the Funds. In addition, through arrangements with the Funds’ custodian, credits realized as a result of uninvested cash balances were used to reduce the Funds’ expenses. During the period ended September 30, 2009, the credits used to reduce the Funds’ expenses were:
67
NICHOLAS-APPLEGATE INSTITUTIONAL FUNDS
NOTES TO FINANCIAL STATEMENTS — (Unaudited) — Continued
| Fund | Credit Interest Offset | Direct Brokerage Offset | Security Lending Offset | |||||||||
| U.S. Ultra Micro Cap | 7 | 991 | — | |||||||||
| U.S. Micro Cap | 177 | (1,165 | ) | 6,172 | ||||||||
| U.S. Emerging Growth | 90 | 1,217 | — | |||||||||
| U.S. Small to Mid Cap Growth | 14 | 1,052 | — | |||||||||
| U.S. Systematic Large Cap Growth | 25 | 1,099 | 26 | |||||||||
| U.S. Convertible | 2,869 | — | — | |||||||||
| Global Select | 263 | 2,047 | — | |||||||||
| International Growth | 195 | 475 | — | |||||||||
| International Growth Opportunities | 679 | (5,476 | ) | — | ||||||||
| Emerging Markets | 263 | 1,156 | — | |||||||||
| International Systematic | 663 | 3,948 | — | |||||||||
| U.S. High Yield Bond | 552 | — | — | |||||||||
Use of Estimates
The preparation of financial statements in conformity with accounting principles generally accepted in the United States requires management to make estimates and assumptions that affect the amounts reported in the financial statements and accompanying notes. Actual results could differ from these estimates.
NOTE C — FEDERAL INCOME TAXES
The Funds intend to comply with the requirements of the Internal Revenue Code applicable to regulated investment companies and to distribute substantially all of their taxable income to shareholders. Accordingly, no provision for federal income taxes is required. A Fund investing in foreign securities records any foreign taxes on income and gains on such investments in accordance with the applicable tax rules. The Funds’ tax accounting treatment of loss deferrals, accretion, passive foreign investment companies and expiration of capital loss carryforwards is different from the financial statement recognition of income and gains.
Capital loss carryforwards may be used to offset current or future capital gains until expiration.
Income Tax Status
The Funds have adopted a policy in accordance with U.S. generally accepted accounting principles (“GAAP”) which requires management to consider accounting for the uncertainty of income taxes through the application of recognition and measurement criteria. The policy is designed to recognize the estimated taxes payable or refundable on tax returns for the current year as a tax liability or asset as well as recognize a deferred tax liability or asset for the estimated future tax effects attributable to temporary differences and carryforwards. This policy defines the threshold for recognizing the benefits of tax-return positions in the financial statements as “more-likely-than-not” to be sustained upon challenge by the taxing authority. The policy also requires management of the Funds to evaluate tax positions taken (or expected to be taken) in the Funds’ tax returns and requires measurement of a tax position meeting the more-likely-than-not criterion, based on the largest benefit that is more than 50 percent likely to be realized. As of September 30, 2009, tax years 2004 through 2008 remain subject to examination by major tax jurisdictions, which include the United States of America and the Commonwealth of Massachusetts, but the Funds have no examinations in progress. As of and during the six-month period September 30, 2009, the Funds did not have a liability for unrecognized tax benefits.
Distributions to Shareholders
The Funds record distributions to shareholders on the ex- dividend date. Distributions are determined in accordance with income tax regulations that may differ from generally accepted accounting principles. Accordingly, the Funds’ capital accounts are periodically reclassified to reflect income and gains available for distribution under income tax regulations. The Funds make income and capital gain distributions at least annually. Funds with income objectives make distributions either quarterly or monthly in accordance with the prospectuses.
NOTE D — TRANSACTIONS WITH AFFILIATES
Investment Advisory Fee
The Adviser receives a monthly fee at an annual rate based on the average daily net assets of the Funds. The investment advisory fee rate for each of the Funds is listed in the table below.
Administrative & Shareholder Services Fee
On January 24, 2006, the Funds entered into an Administration Agreement whereby the Funds pay for the administrative services they require under what is essentially an all-in fee structure. Class I, II, III & IV shareholders of the Funds pay an administrative fee to the Adviser computed as a percentage of the Funds’ average net assets attributable in the aggregate to Class I, II, III & IV shares. The Adviser, in turn, provides or procures administrative and shareholder services for Class I, II, III & IV shareholders and also bears the costs of most third-party administrative services required by the Funds, including audit, custodial, portfolio accounting, legal, transfer agency and printing costs. The administrative fees paid to the Adviser may exceed the related costs.
68
The investment advisory and administrative services fees are charged at the following annual rates:
| Advisory Fee | Administration Fee* | ||||
| Class I | Class II | Class III | Class IV | ||
| U.S. Ultra Micro Cap | 1.50% | 0.73% | — | — | — |
| U.S. Micro Cap | 1.00% | 0.54% | — | — | — |
| U.S. Emerging Growth | 0.75% | 0.41% | — | — | — |
| U.S. Small to Mid Cap Growth | 0.50% | 0.40% | — | — | — |
| U.S. Systematic Large Cap Growth | 0.45% | 0.64% | — | — | — |
| U.S. Convertible | 0.55% | 0.44% | 0.34% | — | 0.19% |
| Global Select | 0.65% | 0.47% | 0.42% | — | — |
| International Growth | 0.85% | 0.27% | 0.12% | — | — |
| International Growth Opportunities | 0.70% | 0.69% | 0.54% | 0.49% | — |
| Emerging Markets | 0.90% | 0.42% | 0.32% | — | — |
| International Systematic | 0.50% | 0.48% | — | 0.23% | — |
| U.S. High Yield Bond | 0.40% | 0.20% | — | — | — |
* Excludes trustees’ fees and expenses, tax, brokerage and interest expenses, and extraordinary expenses
Affiliated Securities Lending Fees
The Funds participated in an agency securities lending program with an affiliated agent, Dresdner Bank AG, a direct subsidiary to Allianz AG and affiliate to the Trust (“Dresdner Program”). Income generated from the investment of cash collateral, less negotiated rebate fees paid to borrowers and transaction costs, is divided pursuant to the Dresdner Program Agency Agreement between the Funds and Dresdner Bank AG. The securities lending program ended with Dresdner Bank AG on April 1, 2009.
Trustee Compensation
Certain officers of the Trust are also officers of the Adviser and the Distributor. The Trustees who are not affiliated with the Adviser and attended all scheduled meetings will receive an annual compensation of approximately $36,000 each from the Trust, except for the chairman of the Board of Trustees of the Trust and the chairman of the Audit Committee, who will receive an annual compensation of approximately $42,000 and $42,500, respectively, from the Trust.
NOTE E — INVESTMENT TRANSACTIONS
The following table presents purchases and sales of securities, excluding short-term investments, during the period ended September 30, 2009, to indicate the volume of transactions in each Fund. The tax cost of securities held at September 30, 2009, and the related gross and net unrealized appreciation and depreciation, provide aggregate information on a tax basis against which future gains and losses on these investments are measured for distribution purposes.
| Fund | Purchases (in 000’s) | Sales (in 000’s) | Tax Cost (in 000’s) | Gross Unrealized Appreciation (in 000’s) | Gross Unrealized Depreciation (in 000’s) | Net Unrealized Appreciation (Depreciation) (in 000’s) | ||||||||||||||||||
| U.S. Ultra Micro Cap | $ | 1,081 | $ | 1,039 | $ | 1,343 | $ | 520 | $ | (21 | ) | $ | 499 | |||||||||||
| U.S. Micro Cap | 34,023 | 36,162 | 46,072 | 12,621 | (1,532 | ) | 11,089 | |||||||||||||||||
| U.S. Emerging Growth | 12,307 | 8,627 | 13,963 | 3,448 | (253 | ) | 3,195 | |||||||||||||||||
| U.S. Small to Mid Cap Growth | 3,533 | 3,540 | 3,666 | 1,069 | (62 | ) | 1,007 | |||||||||||||||||
| U.S. Systematic Large Cap Growth | 5,687 | 3,903 | 4,493 | 946 | (33 | ) | 913 | |||||||||||||||||
| U.S. Convertible | 285,131 | 255,213 | 359,628 | 47,405 | (1,822 | ) | 45,583 | |||||||||||||||||
| Global Select | 13,572 | 12,212 | 21,163 | 4,096 | (1,127 | ) | 2,969 | |||||||||||||||||
| International Growth | 20,055 | 21,446 | 24,749 | 6,113 | (299 | ) | 5,814 | |||||||||||||||||
| International Growth Opportunities | 48,681 | 42,450 | 96,931 | 24,023 | (4,727 | ) | 19,296 | |||||||||||||||||
| Emerging Markets | 41,005 | 42,995 | 30,990 | 10,991 | (292 | ) | 10,699 | |||||||||||||||||
| International Systematic | 64,381 | 60,516 | 59,149 | 9,926 | (1,676 | ) | 8,250 | |||||||||||||||||
| U.S. High Yield Bond | 58,521 | 45,914 | 71,099 | 4,533 | (694 | ) | 3,839 | |||||||||||||||||
69
NICHOLAS-APPLEGATE INSTITUTIONAL FUNDS
NOTES TO FINANCIAL STATEMENTS — (Unaudited) — Continued
NOTE F — FINANCIAL INSTRUMENTS
The Funds may be party to financial instruments with off balance sheet risks, including forward non-U.S. currency contracts and futures, primarily in an attempt to minimize the risk to the Fund in respect of its portfolio transactions. These instruments involve market and/or credit risk in excess of the amount recognized in the Statement of Assets and Liabilities. Risks arise from the possible inability of counterparties to meet the terms of their contracts and from unexpected movement in currencies, securities values and interest rates.
The contract amounts indicate the extent of the Funds’ involvement in such contracts. As of September 30, 2009, the Funds were not party to any such agreements.
NOTE G — FAIR VALUE OF FINANCIAL INSTRUMENTS
In accordance with GAAP, the Funds are required to disclose information regarding the fair value measurements of a Fund’s assets and liabilities. Fair value is the price that would be received to sell an asset or paid to transfer a liability in an orderly transaction between market participants at the measurement date. The disclosure requirement established a three-tier hierarchy to maximize the use of observable market data, minimize the use of unobservable inputs and establish classification of fair value measurements for disclosure purposes. Inputs refer broadly to the assumptions that market participants would use in pricing the asset or liability, including assumptions about risk; for example, the risk inherent in a particular valuation technique used to measure fair value including such a pricing model and/or the risk inherent in the inputs to the valuation technique. Inputs may be observable or unobservable. Observable inputs are inputs that reflect the assumptions market participants would use in pricing the asset or liability developed based on market data obtained from sources independent of the reporting entity. Unobservable inputs are inputs that reflect the reporting entity’s own assumptions about the assumptions market participants would use in pricing the asset or liability developed based on the best information available in the circumstances.
On June 15, 2009, the Funds adopted additional disclosure requirements which provide the reader of the financial statements additional guidance for estimating fair value when the volume and level of activity for the asset or liability have significantly decreased. Additional guidance on identifying circumstances that indicate a transaction is not orderly. The amended requirement emphasizes that even if there has been a significant decrease in the volume and level of activity for the asset or liability and regardless of the valuation technique(s) used, the objective of a fair value measurement remains the same. The three levels defined by the fair value measurement requirement hierarchy are as follows:
Level 1 — quoted prices in active markets for identical securities.
Level 2 — significant observable inputs (including quoted prices for similar securities, interest rates, prepayment speeds, credit risk, etc.)
Level 3 — significant unobservable inputs (including the Fund’s own assumptions in determining the fair value of investments).
In some instances, the inputs used to measure fair value might fall in different levels of the fair value hierarchy. The level in the fair value hierarchy within which the fair value measurement in its entirety falls is determined based on the lowest input level that is significant to the fair value measurement in its entirety. Because of the inherent uncertainties of valuation, the values reflected in the financial statements may materially differ from the value received upon actual sale of those investments.
The following table summarizes the valuation of each fund’s securities as of September 30, 2009, using the fair value hierarchy:
| U.S. Ultra Micro Cap | Level 1 Quoted Prices | Level 2 Other Significant Observable Inputs | Level 3 Significant Unobservable Inputs | Value at 9/30/2009 | ||||||||||||
| Investments in Securities — Assets | ||||||||||||||||
| Common Stock | 1,822,121 | — | — | 1,822,121 | ||||||||||||
| Short-Term Investments | 20,183 | — | — | 20,183 | ||||||||||||
| Total Investments in Securities — Assets | 1,842,304 | — | — | 1,842,304 | ||||||||||||
| U.S. Micro Cap | Level 1 Quoted Prices | Level 2 Other Significant Observable Inputs | Level 3 Significant Unobservable Inputs | Value at 9/30/2009 | ||||||||||||
| Investments Securities — Assets | ||||||||||||||||
| Common Stock | 56,039,966 | — | — | 56,039,966 | ||||||||||||
| Short-Term Investments | 1,121,915 | — | — | 1,121,915 | ||||||||||||
| Total Investments in Securities — Assets | 57,161,881 | — | — | 57,161,881 | ||||||||||||
70
| U.S. Emerging Growth | Level 1 Quoted Prices | Level 2 Other Significant Observable Inputs | Level 3 Significant Unobservable Inputs | Value at 9/30/2009 | ||||||||||||
| Investments in Securities — Assets | ||||||||||||||||
| Common Stock | 16,508,041 | — | — | 16,508,041 | ||||||||||||
| Limited Partnerships | 105,056 | — | — | 105,056 | ||||||||||||
| Short-Term Investments | 544,711 | — | — | 544,711 | ||||||||||||
| Total Investments in Securities — Assets | 17,157,808 | — | — | 17,157,808 | ||||||||||||
| U.S. Small to Mid Cap Growth | Level 1 Quoted Prices | Level 2 Other Significant Observable Inputs | Level 3 Significant Unobservable Inputs | Value at 9/30/2009 | ||||||||||||
| Investments in Securities — Assets | ||||||||||||||||
| Common Stock | ||||||||||||||||
| Oil & Gas Drilling | — | 32,484 | — | 32,484 | ||||||||||||
| All Other | 4,500,792 | — | — | 4,500,792 | ||||||||||||
| Limited Partnerships | 30,016 | — | — | 30,016 | ||||||||||||
| Short-Term Investments | 109,415 | — | — | 109,415 | ||||||||||||
| Total Investments in Securities — Assets | 4,640,223 | — | — | 4,672,707 | ||||||||||||
| U.S. Systematic Large Cap Growth | Level 1 Quoted Prices | Level 2 Other Significant Observable Inputs | Level 3 Significant Unobservable Inputs | Value at 9/30/2009 | ||||||||||||
| Investments In Securities — Assets | ||||||||||||||||
| Common Stock | 5,405,545 | — | — | 5,405,545 | ||||||||||||
| Short-Term Investments | — | — | — | — | ||||||||||||
| Total Investments in Securities — Assets | 5,405,545 | — | — | 5,405,545 | ||||||||||||
| U.S. Convertible | Level 1 Quoted Prices | Level 2 Other Significant Observable Inputs | Level 3 Significant Unobservable Inputs | Value at 9/30/2009 | ||||||||||||
| Investments in Securities — Assets | ||||||||||||||||
| Convertible Corporate Bonds | — | 329,574,119 | — | 329,574,119 | ||||||||||||
| Convertible Preferred Stock | 65,422,142 | — | — | 65,422,142 | ||||||||||||
| Common Stock | 10,215,018 | — | — | 10,215,018 | ||||||||||||
| Total Investments in Securities — Assets | 75,637,160 | 329,574,119 | — | 405,211,279 | ||||||||||||
| Global Select | Level 1 Quoted Prices | Level 2 Other Significant Observable Inputs | Level 3 Significant Unobservable Inputs | Value at 9/30/2009 | ||||||||||||
| Investments in Securities — Assets | ||||||||||||||||
| Common Stock: | ||||||||||||||||
| Australia | 421,760 | — | — | 421,760 | ||||||||||||
| Belgium | 927,340 | — | — | 927,340 | ||||||||||||
| Brazil | 447,986 | — | — | 447,986 | ||||||||||||
| France | 1,078,541 | — | — | 1,078,541 | ||||||||||||
| Germany | 1,764,338 | — | — | 1,764,338 | ||||||||||||
71
NICHOLAS-APPLEGATE INSTITUTIONAL FUNDS
NOTES TO FINANCIAL STATEMENTS — (Unaudited) — Continued
| Global Select | Level 1 Quoted Prices | Level 2 Other Significant Observable Inputs | Level 3 Significant Unobservable Inputs | Value at 9/30/2009 | ||||||||||||
| Hong Kong | 643,487 | — | — | 643,487 | ||||||||||||
| Ireland | 310,482 | — | — | 310,482 | ||||||||||||
| Israel | 328,640 | — | — | 328,640 | ||||||||||||
| Japan | 1,817,012 | — | — | 1,817,012 | ||||||||||||
| Kuwait | — | 32,832 | — | 32,832 | ||||||||||||
| Malaysia | 321,999 | — | — | 321,999 | ||||||||||||
| Netherlands | 648,201 | — | — | 648,201 | ||||||||||||
| Republic of China | — | — | 405 | 405 | ||||||||||||
| Singapore | 416,806 | — | — | 416,806 | ||||||||||||
| Spain | 1,158,243 | — | — | 1,158,243 | ||||||||||||
| Switzerland | 2,179,092 | — | — | 2,179,092 | ||||||||||||
| United Kingdom | 2,576,828 | — | — | 2,576,828 | ||||||||||||
| Other | 8,579,782 | — | — | 8,579,782 | ||||||||||||
| Rights: | ||||||||||||||||
| France | — | 10,163 | — | 10,163 | ||||||||||||
| Short-Term Investments | 457,550 | — | — | 457,550 | ||||||||||||
| Total Investments in Securities — Assets | 24,078,087 | 42,995 | 405 | 24,121,487 | ||||||||||||
| International Growth | Level 1 Quoted Prices | Level 2 Other Significant Observable Inputs | Level 3 Significant Unobservable Inputs | Value at 9/30/2009 | ||||||||||||
| Investments in Securities — Assets | ||||||||||||||||
| Common Stock | 29,694,529 | — | — | 29,694,529 | ||||||||||||
| Preferred Stock: | ||||||||||||||||
| Brazil | 517,806 | — | — | 517,806 | ||||||||||||
| Rights: | ||||||||||||||||
| France | — | 13,791 | — | 13,791 | ||||||||||||
| Short-Term Investments | 334,257 | — | — | 334,257 | ||||||||||||
| Total Investments in Securities — Assets | 30,546,592 | 13,791 | — | 30,560,383 | ||||||||||||
| International Growth Opportunities | Level 1 Quoted Prices | Level 2 Other Significant Observable Inputs | Level 3 Significant Unobservable Inputs | Value at 9/30/2009 | ||||||||||||
| Investments in Securities — Assets | ||||||||||||||||
| Common Stock: | ||||||||||||||||
| Australia | 2,941,760 | — | — | 2,941,760 | ||||||||||||
| Belgium | 5,943,478 | — | — | 5,943,478 | ||||||||||||
| Bermuda | 1,322,868 | — | — | 1,322,868 | ||||||||||||
| Brazil | 1,364,212 | — | — | 1,364,212 | ||||||||||||
| Canada | 4,901,636 | — | — | 4,901,636 | ||||||||||||
| France | 7,693,550 | — | — | 7,693,550 | ||||||||||||
| Germany | 8,185,176 | — | — | 8,185,176 | ||||||||||||
| Greece | 1,899,691 | — | — | 1,899,691 | ||||||||||||
72
| International Growth Opportunities | Level 1 Quoted Prices | Level 2 Other Significant Observable Inputs | Level 3 Significant Unobservable Inputs | Value at 9/30/2009 | ||||||||||||
| Hong Kong | 3,287,736 | — | — | 3,287,736 | ||||||||||||
| Ireland | 3,065,354 | — | — | 3,065,354 | ||||||||||||
| Italy | 7,287,069 | — | — | 7,287,069 | ||||||||||||
| Japan | 16,330,151 | — | — | 16,330,151 | ||||||||||||
| Netherlands | 2,516,320 | — | — | 2,516,320 | ||||||||||||
| Norway | 1,269,755 | — | — | 1,269,755 | ||||||||||||
| Republic of China | 1,468,824 | — | 3,133 | 1,471,957 | ||||||||||||
| Singapore | 4,070,799 | — | — | 4,070,799 | ||||||||||||
| South Africa | 1,299,693 | — | — | 1,299,693 | ||||||||||||
| Switzerland | 3,177,320 | — | — | 3,177,320 | ||||||||||||
| United Kingdom | 22,495,426 | — | — | 22,495,426 | ||||||||||||
| Equity Linked Securities: | ||||||||||||||||
| Taiwan | — | 4,024,657 | — | 4,024,657 | ||||||||||||
| Preferred Stock: | ||||||||||||||||
| Brazil | 2,232,493 | — | — | 2,232,493 | ||||||||||||
| Short-Term Investments | 9,441,534 | — | — | 9,441,534 | ||||||||||||
| Total Investments in Securities — Assets | 112,194,845 | 4,024,657 | 3,133 | 116,222,635 | ||||||||||||
| Emerging Markets | Level 1 Quoted Prices | Level 2 Other Significant Observable Inputs | Level 3 Significant Unobservable Inputs | Value at 9/30/2009 | ||||||||||||
| Investments in Securities — Assets | ||||||||||||||||
| Common Stock | ||||||||||||||||
| Brazil | 5,211,934 | — | — | 5,211,934 | ||||||||||||
| Chile | 158,670 | — | — | 158,670 | ||||||||||||
| Egypt | 277,388 | — | — | 277,388 | ||||||||||||
| Hong Kong | 1,214,526 | — | — | 1,214,526 | ||||||||||||
| Hungary | 234,253 | — | — | 234,253 | ||||||||||||
| India | 2,535,298 | — | — | 2,535,298 | ||||||||||||
| Indonesia | 1,651,014 | — | — | 1,651,014 | ||||||||||||
| Israel | 616,832 | — | — | 616,832 | ||||||||||||
| Kuwait | — | 17,864 | — | 17,864 | ||||||||||||
| Maylasia | 452,210 | — | — | 452,210 | ||||||||||||
| Mexico | 968,947 | — | — | 968,947 | ||||||||||||
| Philipines | 183,384 | — | — | 183,384 | ||||||||||||
| Poland | 488,251 | — | — | 488,251 | ||||||||||||
| Republic of China | 6,655,265 | — | — | 6,655,265 | ||||||||||||
| Russian Federation | 2,119,662 | — | — | 2,119,662 | ||||||||||||
| South Africa | 2,915,065 | — | — | 2,915,065 | ||||||||||||
| South Korea | 5,317,806 | — | — | 5,317,806 | ||||||||||||
| Taiwan | 4,136,043 | — | — | 4,136,043 | ||||||||||||
| Thailand | 1,139,441 | 146,619 | — | 1,286,060 | ||||||||||||
| Turkey | 1,746,529 | — | — | 1,746,529 | ||||||||||||
73
NICHOLAS-APPLEGATE INSTITUTIONAL FUNDS
NOTES TO FINANCIAL STATEMENTS — (Unaudited) — Continued
| Emerging Markets | Level 1 Quoted Prices | Level 2 Other Significant Observable Inputs | Level 3 Significant Unobservable Inputs | Value at 9/30/2009 | ||||||||||||
| United Kingdom | 230,705 | — | — | 230,705 | ||||||||||||
| Preferred Stock: | — | |||||||||||||||
| Brazil | 1,297,860 | — | — | 1,297,860 | ||||||||||||
| Short-Term Investments | 1,960,330 | — | — | 1,960,330 | ||||||||||||
| Total Investments in Securities — Assets | 41,511,413 | 164,483 | — | 41,675,896 | ||||||||||||
| International Systematic | Level 1 Quoted Prices | Level 2 Other Significant Observable Inputs | Level 3 Significant Unobservable Inputs | Value at 9/30/2009 | ||||||||||||
| Investments in Securities — Assets | ||||||||||||||||
| Common Stock: | 66,050,114 | — | — | 66,050,114 | ||||||||||||
| Rights: | ||||||||||||||||
| France | — | 38,133 | — | 38,133 | ||||||||||||
| Short-Term Investments | 1,299,422 | — | — | 1,299,422 | ||||||||||||
| Total Investments in Securities — Assets | 67,349,536 | 38,133 | — | 67,387,669 | ||||||||||||
| U.S. High Yield | Level 1 Quoted Prices | Level 2 Other Significant Observable Inputs | Level 3 Significant Unobservable Inputs | Value at 9/30/2009 | ||||||||||||
| Investments in Securities — Assets | ||||||||||||||||
| Corporate Bonds | — | 66,230,543 | — | 66,230,543 | ||||||||||||
| Foreign Corporate Bonds | — | 4,572,312.00 | — | 4,572,312 | ||||||||||||
| Short-Term Investments | 4,135,474 | — | — | 4,135,474 | ||||||||||||
| Total Investments in Securities — Assets | 4,135,474 | 70,802,855 | — | 74,938,329 | ||||||||||||
A roll forward of fair value measurements using significant unobservable inputs (Level 3) for the period ended September 30, 2009 was as follows:
| Global Select Fund | Beginning Balance 3/31/2009 | Purchase, (Sales) and Settlements | Accrued Discounts (Premiums) | Net Realized and Unrealized Gain(Loss) | Transfers in and/or out of Level 3 | Ending Balance 9/30/2009 | ||||||||||||||||||
| Investments in Securities — Assets | ||||||||||||||||||||||||
| Common Stock | 17,087 | — | — | — | (16,682 | ) | 405 | |||||||||||||||||
| Total Investments in Securities — Assets | 17,087 | — | — | — | (16,682 | ) | 405 | |||||||||||||||||
| International Growth Opportunities Fund | Beginning Balance 3/31/2009 | Purchase, (Sales) and Settlements | Accrued Discounts (Premiums) | Net Realized and Unrealized Gain(Loss) | Transfers in and/or out of Level 3 | Ending Balance 9/30/2009 | ||||||||||||||||||
| Investments in Securities — Assets | ||||||||||||||||||||||||
| Common Stock | 3,133 | — | — | — | — | 3,133 | ||||||||||||||||||
| Total Investments in Securities — Assets | 3,133 | — | — | — | — | 3,133 | ||||||||||||||||||
| Emerging Markets Fund | Beginning Balance 3/31/2009 | Purchase, (Sales) and Settlements | Accrued Discounts (Premiums) | Net Realized and Unrealized Gain(Loss) | Transfers in and/or out of Level 3 | Ending Balance 9/30/2009 | ||||||||||||||||||
| Investments in Securities — Assets | ||||||||||||||||||||||||
| Common Stock | 156,915 | — | — | — | (156,915 | ) | — | |||||||||||||||||
| Total Investments in Securities — Assets | 156,915 | — | — | — | (156,915 | ) | — | |||||||||||||||||
74
| International Systematic Fund | Beginning Balance 3/31/2009 | Purchase, (Sales) and Settlements | Accrued Discounts (Premiums) | Net Realized and Unrealized Gain(Loss) | Transfers in and/or out of Level 3 | Ending Balance 9/30/2009 | ||||||||||||||||||
| Investments in Securities — Assets | ||||||||||||||||||||||||
| Common Stock | 119,105 | — | — | — | 119,105 | — | ||||||||||||||||||
| Total Investments in Securities — Assets | 119,105 | — | — | — | 119,105 | — | ||||||||||||||||||
NOTE H — MARKET PRICE RISK
The prices of securities held by the Funds may decline in response to certain events, including those directly involving the companies whose securities are owned by the Funds; conditions affecting the general economy; overall market changes; local, regional or global political, social or economic instability; and currency and interest rate fluctuations. The growth-oriented, equity-type securities generally purchased by the Funds may involve large price swings and potential for loss.
Investments in securities issued by entities based outside the United States may be subject to the risks described above to a greater extent and may also be affected by currency controls; different accounting, auditing, financial reporting, and legal standards and practices in some countries; expropriation; changes in tax policy; greater market volatility; differing securities market structures; higher transaction costs; and various administrative difficulties, such as delays in clearing and settling portfolio transactions or in receiving payment of dividends. These risks may be heightened in connection with investments in developing countries.
NOTE I — FINANCIAL DERIVATIVE INSTRUMENTS
In accordance with GAAP, the Funds are required to disclose certain information regarding derivative instruments and hedging activities. The Funds are required to provide enhanced disclosures about the use of and accounting for derivative instruments using a tabular format. Disclosing the fair values of derivative instruments and their gains and losses in a tabular format should provide a more complete picture of the location in an entity’s financial statements of both the derivative positions existing at period end and the effect of using derivatives during the reporting period. Disclosing information about credit-risk-related contingent features should provide information on the potential effect on an entity’s liquidity from using derivatives. Finally, the additional disclosure affords the reader the ability to cross-reference the information within the footnotes, which should help users of financial statements locate important information about derivative instruments. As of September 30, 2009, the Funds did not hold any derivative instruments.
NOTE J — SIGNIFICANT SHAREHOLDER CONCENTRATION
As of September 30, 2009, the Funds had a single shareholder and/or omnibus shareholder accounts (which are comprised of a group of individual shareholders), which individually amounted to more than 10% of the total shares outstanding of a Fund as detailed below.
| Fund | % of Fund | Number of Shareholders |
| U.S. Ultra Micro Cap | 97.43% | 4 |
| U.S. Micro Cap Growth | 82.87% | 3 |
| U.S. Emerging Growth | 81.39% | 3 |
| U.S. Small to Mid Cap Growth | 93.14% | 1 |
| U.S. Systematic Large Cap Growth | 82.95% | 1 |
| U.S. Convertible | 75.77% | 1 |
| Global Select | 64.57% | 3 |
| International Growth Opportunities | 62.78% | 3 |
| Emerging Markets | 91.83% | 3 |
| International Systematic | 94.69% | 3 |
| International Growth | 84.99% | 3 |
| U.S. High Yield | 65.76% | 2 |
NOTE K — EVALUATION OF SUBSEQUENT EVENTS
In accordance with GAAP, the Funds are required to recognize in the financial statements the effects of all subsequent events that provide additional evidence about conditions that existed at the date of the balance sheet, including the estimates inherent in the process of preparing financial statements. In preparing these financial statements, the Funds have evaluated events and transactions for potential recognition or disclosure through November 30, 2009, the date the financial statements were issued.
On November 13, 2009, the Board approved a Plan of Reorganization with respect to each of the Nicholas-Applegate Institutional Funds. Shareholders of each Institutional Fund will be asked to approve the Plan on behalf of the fund at a special meeting of shareholders.
The Board also approved, on November 13, 2009, a Plan of Liquidation providing for the liquidation and dissolution of the Nicholas-Applegate International Systematic Fund.
75
SHAREHOLDER EXPENSE EXAMPLE
As a shareholder of a Fund, you incur two types of costs: (1) transaction costs, including redemption fees, and (2) ongoing costs, including management fees and other Fund expenses. This example is intended to help you understand your ongoing costs (in dollars) of investing in the Funds and to compare these costs with the ongoing costs of investing in other mutual funds.
The example is based on an investment of $1,000 invested at the beginning of the period and held for the entire period (April 1, 2009 to September 30, 2009).
ACTUAL EXPENSES
The first line of the table below for each Fund provides information about actual account values and actual expenses. You may use the information in this line, together with the amount you invested, to estimate the expenses that you paid over the period. Simply divide your account value by $1,000 (for example, an $8,600 account value divided by $1,000 = 8.6), then multiply the result by the number in the first line for a Fund under the heading “Expenses Paid During Period” to estimate the expenses you paid on your account during this period.
HYPOTHETICAL EXAMPLE FOR COMPARISON PURPOSES
The second line of the table below for each Fund provides information about hypothetical account values and hypothetical expenses based on a Fund’s actual expense ratio and an assumed rate of return of 5% per year before expenses, which is not the Fund’s actual return. The hypothetical account values and expenses may not be used to estimate the actual ending account balance or expenses you paid for the period. You may use this information to compare the ongoing costs of investing in a Fund and other funds. To do so, compare this 5% hypothetical example with the 5% hypothetical examples that appear in the shareholder reports of the other funds.
Please note that the expenses shown in the table are meant to highlight your ongoing costs only and do not reflect any transaction costs. Therefore, the second line of the table is useful in comparing ongoing costs only, and will not help you determine the relative total costs of owning different funds. In addition, if these transactional costs were included, your costs would have been higher.
Beginning Account Value April 1, 2009 | Ending Account Value September 30, 2009 | Expenses Paid During the Period* April 1, 2009 to September 30, 2009 | Annualized Expense Ratio | |||||||||||||
| U.S. Ultra Micro Cap — Class I | ||||||||||||||||
| Actual | $ | 1,000.00 | $ | 1,621.10 | $ | 15.38 | 2.34 | % | ||||||||
| Hypothetical (5% return before expenses) | $ | 1,000.00 | $ | 1,013.34 | $ | 11.81 | 2.34 | % | ||||||||
| U.S. Micro Cap — Class I | ||||||||||||||||
| Actual | $ | 1,000.00 | $ | 542.20 | $ | 5.95 | 1.54 | % | ||||||||
| Hypothetical (5% return before expenses) | $ | 1,000.00 | $ | 1,017.35 | $ | 7.79 | 1.54 | % | ||||||||
| U.S. Emerging Growth — Class I | ||||||||||||||||
| Actual | $ | 1,000.00 | $ | 1,570.60 | $ | 7.60 | 1.18 | % | ||||||||
| Hypothetical (5% return before expenses) | $ | 1,000.00 | $ | 1,019.15 | $ | 5.97 | 1.18 | % | ||||||||
| U.S. Small to Mid Cap Growth — Class I | ||||||||||||||||
| Actual | $ | 1,000.00 | $ | 1,485.20 | $ | 5.92 | 0.95 | % | ||||||||
| Hypothetical (5% return before expenses) | $ | 1,000.00 | $ | 1,020.31 | $ | 4.81 | 0.95 | % | ||||||||
| U.S. Systematic Large Cap Growth — Class I | ||||||||||||||||
| Actual | $ | 1,000.00 | $ | 1,244.90 | $ | 6.25 | 1.11 | % | ||||||||
| Hypothetical (5% return before expenses) | $ | 1,000.00 | $ | 1,019.50 | $ | 5.62 | 1.11 | % | ||||||||
| U.S. Convertible — Class I | ||||||||||||||||
| Actual | $ | 1,000.00 | $ | 1,266.20 | $ | 5.68 | 1.00 | % | ||||||||
| Hypothetical (5% return before expenses) | $ | 1,000.00 | $ | 1,020.05 | $ | 5.06 | 1.00 | % | ||||||||
| U.S. Convertible — Class II | ||||||||||||||||
| Actual | $ | 1,000.00 | $ | 1,267.30 | $ | 5.12 | 0.90 | % | ||||||||
| Hypothetical (5% return before expenses) | $ | 1,000.00 | $ | 1,020.56 | $ | 4.56 | 0.90 | % | ||||||||
| U.S. Convertible — Class IV | ||||||||||||||||
| Actual | $ | 1,000.00 | $ | 1,268.20 | $ | 4.26 | 0.75 | % | ||||||||
| Hypothetical (5% return before expenses) | $ | 1,000.00 | $ | 1,021.31 | $ | 3.80 | 0.75 | % | ||||||||
| Global Select — Class I | ||||||||||||||||
| Actual | $ | 1,000.00 | $ | 1,343.80 | $ | 6.64 | 1.13 | % | ||||||||
| Hypothetical (5% return before expenses) | $ | 1,000.00 | $ | 1,019.40 | $ | 5.72 | 1.13 | % | ||||||||
76
Beginning Account Value April 1, 2009 | Ending Account Value September 30, 2009 | Expenses Paid During the Period* April 1, 2009 to September 30, 2009 | Annualized Expense Ratio | |||||||||||||
| Global Select — Class II | ||||||||||||||||
| Actual | $ | 1,000.00 | $ | 1,360.00 | $ | 6.74 | 1.14 | % | ||||||||
| Hypothetical (5% return before expenses) | $ | 1,000.00 | $ | 1,019.35 | $ | 5.77 | 1.14 | % | ||||||||
| International Growth — Class I | ||||||||||||||||
| Actual | $ | 1,000.00 | $ | 1,384.90 | $ | 6.82 | 1.14 | % | ||||||||
| Hypothetical (5% return before expenses) | $ | 1,000.00 | $ | 1,019.35 | $ | 5.77 | 1.14 | % | ||||||||
| International Growth — Class II | ||||||||||||||||
| Actual | $ | 1,000.00 | $ | 1,384.90 | $ | 5.92 | 0.99 | % | ||||||||
| Hypothetical (5% return before expenses) | $ | 1,000.00 | $ | 1,020.10 | $ | 5.01 | 0.99 | % | ||||||||
| International Growth Opportunities — Class I | ||||||||||||||||
| Actual | $ | 1,000.00 | $ | 1,574.00 | $ | 9.10 | 1.41 | % | ||||||||
| Hypothetical (5% return before expenses) | $ | 1,000.00 | $ | 1,018.00 | $ | 7.13 | 1.41 | % | ||||||||
| International Growth Opportunities — Class II | ||||||||||||||||
| Actual | $ | 1,000.00 | $ | 1,574.70 | $ | 8.13 | 1.26 | % | ||||||||
| Hypothetical (5% return before expenses) | $ | 1,000.00 | $ | 1,018.75 | $ | 6.38 | 1.26 | % | ||||||||
| International Growth Opportunities — Class III | ||||||||||||||||
| Actual | $ | 1,000.00 | $ | 1,575.60 | $ | 7.81 | 1.21 | % | ||||||||
| Hypothetical (5% return before expenses) | $ | 1,000.00 | $ | 1,019.00 | $ | 6.12 | 1.21 | % | ||||||||
| Emerging Markets Fund — Class I | ||||||||||||||||
| Actual | $ | 1,000.00 | $ | 1,575.50 | $ | 8.59 | 1.33 | % | ||||||||
| Hypothetical (5% return before expenses) | $ | 1,000.00 | $ | 1,018.40 | $ | 6.73 | 1.33 | % | ||||||||
| Emerging Markets Fund — Class II | ||||||||||||||||
| Actual | $ | 1,000.00 | $ | 1,576.00 | $ | 8.85 | 1.37 | % | ||||||||
| Hypothetical (5% return before expenses) | $ | 1,000.00 | $ | 1,018.20 | $ | 6.93 | 1.37 | % | ||||||||
| International Systematic Fund — Class I | ||||||||||||||||
| Actual | $ | 1,000.00 | $ | 1,424.80 | $ | 5.96 | 0.98 | % | ||||||||
| Hypothetical (5% return before expenses) | $ | 1,000.00 | $ | 1,020.16 | $ | 4.96 | 0.98 | % | ||||||||
| International Systematic Fund — Class III | ||||||||||||||||
| Actual | $ | 1,000.00 | $ | 1,427.10 | $ | 4.44 | 0.73 | % | ||||||||
| Hypothetical (5% return before expenses) | $ | 1,000.00 | $ | 1,021.41 | $ | 3.70 | 0.73 | % | ||||||||
| U.S. High Yield Bond — Class I | ||||||||||||||||
| Actual | $ | 1,000.00 | $ | 1,281.70 | $ | 3.43 | 0.60 | % | ||||||||
| Hypothetical (5% return before expenses) | $ | 1,000.00 | $ | 1,022.06 | $ | 3.04 | 0.60 | % | ||||||||
| * Expenses are equal to the Fund’s annualized expense ratio, multiplied by the average account value over the period. | ||||||||||||||||
77
SUPPLEMENTARY INFORMATION
PROXY VOTING
The Adviser votes proxies on behalf of the Funds pursuant to written policies and procedures adopted by the Funds. To obtain free information on how your Funds’ securities were voted, please call the Funds at 1-800-551-8043 or visit the Funds’ website at www.nacm.com. You may also view how the Fund’s securities were voted by visiting the Securities & Exchange Commission’s (the “SEC”) website at www.sec.gov. Additionally, information regarding each Fund’s proxy voting record for the most recent twelve month period ended June 30 is also available, free of charge, by calling the Funds at 1-800-551-8043 and from the SEC’s website at www.sec.gov.
78
SUPPLEMENTARY INFORMATION — (Unaudited) — Continued
CORPORATE GOVERNANCE
Name, Address (1) Age Position(s) Held with Fund Length of Time Served (2) | Principal Occupation(s) During Past 5 Years Other Directorship Held by Trustee Number of Portfolios in Fund complex Overseen by Trustee |
| Independent Trustees: | |
Darlene T. DeRemer 11/27/1955 Chairperson of the Board Since August 2007 & Trustee Since May 1999 | Principal Occupations: Partner, Grail Partners LLC (since 2005); Managing Director, Putnam Lovell NBF Private Equity (2004-2005); Managing Director, NewRiver E-Business Advisory Services Division (2000-2003); Prior to, President and Founder, DeRemer Associates, a strategic and marketing consulting firm for the financial services industry (since 1987); Vice President and Director, Asset Management Division, State Street Bank and Trust Company, now referred to as State Street Global Advisers (1982-1987); Vice President, T. Rowe Price & Associates (1979-1982); Member, Boston Club (since 1998); Member, Financial Women’s Association Advisory Board (since 1995); Founder, Mutual Fund Cafe Website. Other Directorships Held: Founding Member and Director, National Defined Contribution Council (since 1997); Trustee, Boston Alzheimer’s Association (since 1998); Director, King’s Wood Montessori School (since 1995); Editorial Board, National Association of Variable Annuities (since 1997); Director, Nicholas-Applegate Strategic Opportunities, Ltd. (1994-1997); Trustee, Nicholas-Applegate Mutual Funds (1994-1999); Director, Jurika & Voyles Fund Group (since 1994-2000); Trustee, Barnwell Funds (2003-2005); Director, Independent Director Council (since 2004); Mutual Fund Director’s Council-Advisory Board; Board Member-Chatman Partners; Board Member-X-Shares LLC. |
Number of Portfolios Overseen by Trustee: 12 | |
John J. Murphy 4/8/1944 Trustee Since September 2005 | Principal Occupations: Founder and senior principal, Murphy Capital Management. Other Directorships Held: Director, Smith Barney Multiple Discipline Trust; Director, Barclays International Funds Group Ltd. and affiliated companies; Smith Barney Consulting Group; Legg Mason Equity Funds. |
Number of Portfolios Overseen by Trustee: 12 | |
Bradford K. Gallagher 2/24/1944 Trustee Since August 2007 | Principal Occupations: Founder, Spyglass Investments LLC (a private investment vehicle) (since 2001); Founder, President and CEO of CypressTree Investment Management Company and Annuity Company; Managing Director, Fidelity Investments. |
Other Directorships Held: Trustee, The Common Fund (since 2005); Director, Anchor Point Inc. (since 1995); Chairman and Trustee, Atlantic Maritime Heritage Foundation (since 2007); Director, Shielding Technology Inc. (since 2006); Director, United Way of Eastern Massachusetts (1988-1990); Director, Ouimet Scholarship Fund (1993-2005); Director, Emerson Hospital (1995-2005). | |
Number of Portfolios Overseen by Trustee: 12 | |
Steven Grenadier 12/14/1964 Trustee Since August 2007 | Principal Occupations: William F. Sharpe Professor of Financial Economics, Stanford University Graduate School of Business; Research Associate, National Bureau of Economic Research (since 2002); Chairman of the Finance Department, Stanford University Graduate School of Business (2004-2006). |
Other Directorships Held: Independent Trustee, E Trade Funds. | |
Number of Portfolios Overseen by Trustee: 12 | |
| Interested Trustees: | |
Horacio A. Valeiras 1/8/1959 President & Trustee Since August 2004 | Principal Occupations: Managing Director (since 2004) and Chief Investment Officer, Nicholas-Applegate Capital Management, Nicholas-Applegate Securities (since 2002); Chief Investment Officer; Oppenheimer and AGI Management Partners (since 2008); Managing Director of Morgan Stanley Investment Management, London (1997-2002); Head of International Equity and Asset Allocation, Miller Anderson & Sherred; Director and Chief of Investment Strategies, Credit Suisse First Boston. |
Other Directorships Held: Trustee, The Bishops School (since 2002); Trustee, San Diego Rowing Club (since 2002). | |
Number of Portfolios Overseen by Trustee: 12 | |
Arthur B. Laffer 8/14/1940 Trustee Since August 2007 | Principal Occupations: Chairman, Laffer Associates (economic consulting) (since 1979); Chairman, Laffer Advisors Inc. (registered broker-dealer) (since 1981); Chairman, Laffer Investments (asset management) (since 2000); Member, Congressional Policy Advisory Board (since 1998); Distinguished University Professor and Director, Pepperdine University (1985-1988); Professor of Business Economics, University of Southern California (1976-1984); Associate Professor of Business Economics, University of Chicago (1967-1976). Other Directorships Held: Director of MPS Group, Inc. (NYSE:MPS) (since 2003); Director, Petco Animal Supplies, Inc. (NASDAQ:PETC) (2002-2005); Director, Oxigene Inc. (NASDAQ:OXGN), biopharmaceutical company (since 1998); Director of Provide Commerce (NASDAQ: PRVD) (since 1998); Director, Veolia Environmental Corporation (successor to U.S. Filter Corporation) (water purification) (1991-2006); Director, Nicholas-Applegate Fund, Inc. (1987-2007). Number of Portfolios Overseen by Trustee: 12 |
79
SUPPLEMENTARY INFORMATION — (Unaudited) — Continued
CORPORATE GOVERNANCE
Name, Address (1) Age Position(s) Held with Fund Length of Time Served (2) | Principal Occupation(s) During Past 5 Years Other Directorship Held by Officer Number of Portfolios in Fund complex Overseen by Officer |
| Officers: | |
Charles H. Field, Jr. 7/24/1955 Secretary and Chief Compliance Officer Since May 2002 | Principal Occupations: Managing Director and General Counsel, Nicholas-Applegate Capital Management (since 1996); Chief Legal Officer of Oppenheimer Capital Management LLC (since 2009), Chief Legal Officer of Allianz Global Investors Management Partners LLC (since 2009); and Chief Legal Officer of Allianz Global Investors Solutions LLC (since 2009). Prior to joining Nicholas-Applegate in 1996, Mr. Field was an attorney for Federated Investors (1991-1996) and an attorney for Unified Management Corp. (1987-1991). Other Directorships Held: NA Number of Portfolios Overseen by Officer: 12 |
Deborah A. Wussow 1/31/1960 Treasurer and Assistant Secretary Since August 2006 | Principal Occupations: Senior Vice President, Chief Compliance Officer, Nicholas-Applegate Capital Management, LLC (since 2008); Chief Compliance Officer, Oppenheimer Capital Management, LLC (since April 2009); Chief Compliance Officer, Allianz Global Investors Management Partners, LLC (since 2009); Chief Compliance Officer, Allianz Solutions, LLC (since 2009); Deputy Chief Compliance Officer, Nicholas-Applegate Capital Management, LLC (2004-2008); Compliance Officer; Nicholas-Applegate Capital Management (1995-2004) Other Directorships Held: NA Number of Portfolios Overseen by Officer: 12 |
| (1) | Unless otherwise noted, the address of the Trustees and Officers is c/o: Nicholas-Applegate Capital Management, 600 West Broadway, 32nd Floor, San Diego, California 92101. |
| (2) | Each Trustee serves for an indefinite term, until her or his successor is elected. |
80
(This page intentionally left blank)
(This page intentionally left blank)
TRUSTEES OF NICHOLAS-APPLEGATE INSTITUTIONAL FUNDS
Darlene T. DeRemer, Chairperson
Horacio A. Valeiras
John J. Murphy
Bradford K. Gallagher
Steven Grenadier
Arthur B. Laffer
OFFICERS
Horacio A. Valeiras, President
Charles H. Field, Jr., Secretary & Chief Compliance Officer
Deborah A. Wussow, Treasurer & Assistant Secretary
INVESTMENT ADVISER
Nicholas-Applegate Capital Management
DISTRIBUTOR
Nicholas-Applegate Securities
CUSTODIAN
Brown Brothers Harriman & Co., Private Bankers
TRANSFER AGENT
UMB Fund Services Group, Inc.
INDEPENDENT REGISTERED PUBLIC ACCOUNTING FIRM
PricewaterhouseCoopers LLP
| SAR0909INST |
 | 600 West Broadway San Diego, California 92101 800.551.8043 |
September 30, 2009 Semi Annual Report (Unaudited)
Class R Shares
U.S. Emerging Growth
U.S. Systematic Large Cap Growth
LETTER TO SHAREHOLDERS
Dear Fellow Shareholder,
Following the most severe correction since the 1930s, the global equity market came roaring back during the six months ended September 30, 2009. Stock markets around the world posted dramatic gains, as monetary and fiscal stimulus helped thaw the credit markets and stabilize the global economy.
In this semi-annual report, we review the performance of the financial markets and our mutual funds from April 1 through September 30, 2009. We also share our perspective on the dynamics shaping the investment environment and our outlook for the future.
In the United States, the S&P 500 Index rose 34.0%. The Federal Reserve held short-term interest rates near zero and continued to flood the credit markets with liquidity by making loans and asset purchases. As investors gained confidence in the financial system, borrowers had easier and cheaper access to credit. In addition, some of the $787 billion stimulus package made its way into the economy through tax credits, the “cash for clunkers” vehicle trade-in program and other initiatives. Economic data released during the period showed that policymakers’ efforts were paying off. GDP declined at an annual rate of 0.7% in the second quarter of 2009, after having fallen 6.4% in the first quarter. More recent indicators suggested that the economy might be growing again, despite persistent weakness in the labor market. Corporate earnings were another source of optimism. While earnings for S&P 500 companies continued to decline, they were better than anticipated, supported by cost-cutting measures.
Stock markets in developed countries outside the United States also performed well. The MSCI EAFE Index gained 34.8% in local currencies and 50.4% in dollar terms. The U.S. dollar fell 8.7% versus a basket of currencies on expectations that the Federal Reserve would not raise interest rates any time soon. Like the Fed, central bankers in Europe and Japan held interest rates at record lows and continued with the special liquidity programs they had established during the financial crisis. However, demand for some of these programs was waning, testament to the improvement in the credit markets. Several developed countries came out of recession in the second quarter of 2009, including Japan whose economy grew at an annual pace of 2.3%. The German and French economies expanded as well, although GDP for the entire euro region dropped 4.8%, weighed down by weakness in Spain and Italy.
Equities in emerging countries delivered the strongest gains, with the MSCI Emerging Markets Index rising 45.7% in local currencies and 63.2% in U.S. dollars. As the global economy stabilized, investors rotated out of more defensive assets into higher-risk areas, such as emerging markets. Emerging markets further benefited from the relative strength of developing economies and rising commodity prices. For example, Chinese GDP grew at an annual rate of 7.1% in the first half of the year, helped by a surge in bank lending. Russia, whose main export is oil, was one of the best-performing equity markets this period amid a 42% spike in oil prices.
Against this favorable backdrop, all of the Nicholas-Applegate funds generated significant gains. That said, a number of our funds struggled to keep up with their benchmarks in the rapidly rising market. We believe this was because the rally was driven more by sentiment than company fundamentals. As the panic of last fall and winter subsided, relieved investors jumped back into the market, buying securities rather indiscriminately. A sentiment-driven rally is not unusual to see coming out of a severe correction. Nonetheless, it was a headwind for the funds given our focus on company fundamentals.
The volatile investment environment has underscored the importance of risk management, which remains a top priority at Nicholas-Applegate.
Our risk management program has been in place for more than a decade and has become increasingly sophisticated over the years. Today, we produce approximately 1,600 charts, tables and reports that our investment teams use to evaluate a wide range of risk metrics. We also have a risk management program that supports our entire business. This effort is guided by Nicholas-Applegate’s World Class Execution Committee (WCEC). The goal of the WCEC is to ensure a standard of excellence in all that we do to provide shareholders with world-class investment solutions. Its mandate encompasses everything from operations to compliance to the introduction of new products.
Looking forward, we expect the U.S. recovery to be more muted than past recoveries, given the high unemployment rate and continued tightness in certain segments of the credit markets. Foreign developed nations should recover more quickly than the United States, but real growth is also likely to remain subpar. Prices of gold, commodities and inflation-protected securities are telling us disinflation is coming to an end, and that inflation is in our future. We believe stock selection will be very important, as investors look for companies that will benefit from an environment of potentially slow growth, high unemployment and inflation. This bodes well for the fundamentally driven, bottom-up investment processes that we use to manage the funds.
On behalf of everyone at the firm, thank you for your participation in the Nicholas-Applegate Institutional Funds. We appreciate the trust that you have placed in us and look forward to serving your investment needs throughout the coming years.
Best Regards,
Horacio A. Valeiras, CFA
President and Chief Investment Officer
September 30, 2009
TABLE OF CONTENTS
| The Funds’ Review and Outlook, Performance and | |
| Schedule of Investments: | |
U.S. Emerging Growth | 1 |
U.S. Systematic Large Cap Growth | 5 |
| The Funds’: | |
Financial Highlights | 8 |
Statements of Assets and Liabilities | 10 |
Statements of Operations | 11 |
Statements of Changes in Net Assets | 12 |
Notes to Financial Statements | 13 |
Shareholder Expense Example | 19 |
Supplementary Information | 20 |
This report is authorized for distribution to shareholders and to others only when preceded or accompanied by a currently effective prospectus for Nicholas-Applegate Institutional Funds Class R Shares. Distributor: Nicholas-Applegate Securities.
U.S. EMERGING GROWTH FUND
Management Team: John C. McCraw, Portfolio Manager; Robert S. Marren, Portfolio Manager
Chief Investment Officer: Horacio A. Valeiras, CFA
Goal: The U.S. Emerging Growth Fund seeks to maximize long-term capital appreciation through investments primarily in U.S. companies with market capitalizations similar to the Russell 2000 Growth Index at time of purchase.
Market Overview: U.S. equities registered substantial gains during the six months ended September 30, 2009. Signs that the worst of the recession had passed helped lift stocks higher across sectors, styles and capitalization ranges. Small-cap stocks did especially well, supported by strong inflows into small-cap funds.
The credit markets thawed considerably, thanks in large part to the aggressive actions taken by the Treasury and Federal Reserve last fall and winter. As confidence in the financial system grew, companies had easier and cheaper access to credit. They took advantage of the more favorable conditions, issuing approximately $700 billion of debt in the first nine months of 2009 — a 38% increase over the same period the previous year.
Households seemed more intent on paring back borrowing and spending, and consumer credit fell by a record $21.5 billion in July. A driving force behind the decline was the rising unemployment rate, which reached a twenty-six year high. However, unemployment is a lagging indicator, and less backward-looking statistics suggested that the economy was on the mend. New home sales picked up, industrial production increased and second-quarter GDP contracted at a better-than-expected 0.7% annual rate. As the period drew to a close — almost exactly one year after the credit crisis had erupted — economists were expecting that GDP would grow by approximately 3% in the third quarter.
Performance: During the six months ended September 30, 2009, he Fund’s Class R shares gained 56.85% outperforming the 43.06% increase in the Russell 2000 Growth Index.
Portfolio Specifics: The Fund’s outperformance was due to stock selection, which added value in nearly every sector. Stock selection was strongest in energy, where top-performing holdings included Massey Energy and Helix Energy Solutions. Massey, a coal producer, is seeing strong demand from India, which is increasing its steelmaking capacity. Helix, a diversified energy firm, benefited from an improved liquidity position and favorable production outlook. Stock selection was also especially strong in the information technology, industrials and materials sectors. For example, TriQuint Semiconductor was another top performer in the Fund. The company makes radio frequency modules used in wireless handsets and is winning business in the fast-growing smartphone market.
Areas of relative weakness included stock selection in the health care sector. One notable detractor was a medical device manufacturer facing lower payments from insurance companies.
Market Outlook: While it is widely believed that the recession is over, we think that the economic recovery will be muted due to the high unemployment rate and large federal deficit. That said, several factors could fuel additional gains in the stock market over the months ahead, including:
| • | Expectations for a strong rebound in corporate earnings in 2010 |
| • | Potential for investors to move some of the $3.4 trillion sitting in low-yielding money market funds into equities |
| • | Indications from the Fed that it plans to keep interest rates low for an extended period of time |
By consistently applying our bottom-up investment process in this environment, we believe we will continue to add value to the benchmark.
Comparison of Change in Value of a $250,000 Investment in U.S. Emerging Growth Fund Class R Shares with the Russell 2000 Growth Index.
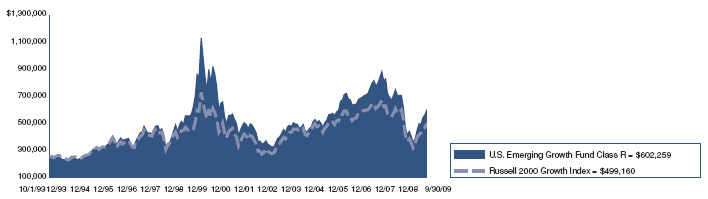
Annualized Total Returns As of 9/30/09 | |||
| 1 Year | 5 Years | 10 Years | |
| U.S. Emerging Growth Fund Class R | –2.99% | 5.50% | –0.67% |
| Russell 2000 Growth Index | –6.32% | 2.91% | 1.10% |
The graph above shows the value of a hypothetical $250,000 investment in the Fund compared with the Russell 2000 Growth Index for the periods indicated. The Fund’s Class R shares were first available on May 21, 1999. Performance prior to the introduction of Class R shares reflects the historical performance of the Fund’s Class I Shares. This performance has been restated to reflect shareholder services fees of 0.25% applicable to Class R shares, but not Class I shares of the Fund. The Fund’s Class I shares calculate their performance based upon the historical performance of a corresponding series of Nicholas-Applegate Mutual Funds (renamed ING Mutual Funds), adjusted to reflect all fees and expenses applicable to the Fund’s Class I shares. Average annual total return figures include changes in principal value, reinvested dividends, and capital gain distributions. The total returns shown above do not show the effects of income taxes on an individual’s investment. In most cases, taxes may reduce your actual investment returns on income or gains paid by the Fund or any gains you may realize if you sell your shares. Past performance cannot guarantee future results.
The Russell 2000 Growth Index is an unmanaged index comprised of those Russell 2000 companies with higher price-to-book ratios and higher forecasted growth values. The Russell 2000 Index is an unmanaged index generally representative of the 2,000 smallest companies in the Russell 3000 Index, which represents approximately 10% of the total market capitalization of the Russell 3000 Index. Index returns include reinvestment of dividends. Unless otherwise noted, index returns reflect the reinvestment of income dividends and capital gains, if any, but do not reflect fees, brokerage commissions or other expenses of investing. One cannot invest directly in an index.
Since markets can go down as well as up, investment returns and principal value will fluctuate with market conditions. You may have a gain or loss when you sell your shares.
1
U.S. EMERGING GROWTH FUND
SCHEDULE OF INVESTMENTS (Unaudited)
As of September 30, 2009
Number of Shares | Value | |||||||
| Common Stock - 96.8% | ||||||||
| Aerospace/Defense - 0.5% | ||||||||
| Cubic Corp. | 2,000 | $ | 78,940 | |||||
| Aerospace/Defense-Equipment - 1.3% | �� | |||||||
| AAR Corp.* | 4,900 | 107,506 | ||||||
| BE Aerospace, Inc.* | 5,400 | 108,756 | ||||||
| 216,262 | ||||||||
| Agricultural Operations - 0.7% | ||||||||
| The Andersons, Inc. | 3,300 | 116,160 | ||||||
| Airlines - 0.5% | ||||||||
| Hawaiian Holdings, Inc.* | 9,700 | 80,122 | ||||||
| Apparel Manufacturers - 1.8% | ||||||||
| Carter’s, Inc.* | 3,600 | 96,120 | ||||||
| Jones Apparel Group, Inc. | 6,400 | 114,752 | ||||||
| Quiksilver, Inc.* | 32,300 | 88,825 | ||||||
| 299,697 | ||||||||
| Applications Software - 1.5% | ||||||||
| Compuware Corp.* | 11,500 | 84,295 | ||||||
| Ebix, Inc.* | 3,100 | 171,616 | ||||||
| 255,911 | ||||||||
| Auto/Truck Parts & Equipment-Original - 1.6% | ||||||||
| American Axle & Manufacturing Holdings, Inc.* | 15,200 | 107,616 | ||||||
| ArvinMeritor, Inc.* | 11,600 | 90,712 | ||||||
| Titan International, Inc. | 9,200 | 81,880 | ||||||
| 280,208 | ||||||||
| Batteries/Battery Systems - 0.5% | ||||||||
| Greatbatch, Inc.* | 4,100 | 92,127 | ||||||
| Beverages-Wine/Spirits - 0.5% | ||||||||
| Central European Distribution Corp.* | 2,400 | 78,624 | ||||||
| Broadcast Services/Programming - 1.1% | ||||||||
| DG FastChannel, Inc.* | 3,600 | 75,384 | ||||||
| Liberty Media Corp. - Capital* | 5,600 | 117,152 | ||||||
| 192,536 | ||||||||
| Building-Heavy Construction - 1.8% | ||||||||
| Chicago Bridge & Iron Co. Cl. Y* | 5,900 | 110,212 | ||||||
| Orion Marine Group, Inc.* | 4,700 | 96,538 | ||||||
| Tutor Perini Corp.* | 5,000 | 106,500 | ||||||
| 313,250 | ||||||||
| Casino Services - 0.7% | ||||||||
| Bally Technologies, Inc.* | 2,900 | 111,273 | ||||||
| Chemicals-Specialty - 0.7% | ||||||||
| Ashland, Inc. | 2,900 | 125,338 | ||||||
| Coal - 0.6% | ||||||||
| James River Coal Co.* | 5,600 | 107,016 | ||||||
| Commercial Banks-Central US - 0.7% | ||||||||
| MB Financial, Inc. | 5,500 | 115,335 | ||||||
| Commercial Services - 1.3% | ||||||||
| AerCap Holdings NV* | 12,200 | 110,654 | ||||||
| DynCorp International, Inc. Cl. A* | 5,700 | 102,600 | ||||||
| 213,254 | ||||||||
| Commercial Services-Finance - 3.8% | ||||||||
| Coinstar, Inc.* | 3,100 | 102,238 | ||||||
| Deluxe Corp. | 6,100 | 104,310 | ||||||
| Dollar Financial Corp.* | 6,000 | 96,120 | ||||||
| Global Cash Access Holdings, Inc.* | 9,700 | 70,907 | ||||||
| Net 1 UEPS Technologies, Inc.* | 4,400 | 92,224 | ||||||
| TNS, Inc.* | 3,700 | 101,380 | |||
| Wright Express Corp.* | 2,600 | 76,726 | |||
| 643,905 | |||||
| Computer Aided Design - 0.4% | |||||
| Parametric Technology Corp.* | 4,800 | 66,336 | |||
| Computers-Integrated Systems - 0.6% | |||||
| Netscout Systems, Inc.* | 7,800 | 105,378 | |||
| Computers-Memory Devices - 0.4% | |||||
| STEC, Inc.* | 2,500 | 73,475 | |||
| Consumer Products-Miscellaneous - 1.6% | |||||
| Jarden Corp. | 5,400 | 151,578 | |||
| Tupperware Brands Corp. | 3,100 | 123,752 | |||
| 275,330 | |||||
| Containers-Metal/Glass - 0.7% | |||||
| Greif, Inc. Cl. A | 2,300 | 126,615 | |||
| Containers-Paper/Plastic - 0.8% | |||||
| Rock-Tenn Co. Cl. A | 2,800 | 131,908 | |||
| Disposable Medical Products - 0.5% | |||||
| Merit Medical Systems, Inc.* | 5,200 | 90,116 | |||
| Distribution/Wholesale - 0.7% | |||||
| Brightpoint, Inc.* | 14,200 | 124,250 | |||
| Diversified Manufacturing Operations - 0.6% | |||||
| Koppers Holdings, Inc. | 3,400 | 100,810 | |||
| Diversified Operations - 0.3% | |||||
| Compass Diversified Holdings | 5,200 | 54,444 | |||
| Drug Delivery Systems - 0.9% | |||||
| Nektar Therapeutics* | 16,400 | 159,736 | |||
| E-Commerce/Services - 0.5% | |||||
| IAC/InterActiveCorp* | 4,300 | 86,817 | |||
| Electric Products-Miscellaneous - 0.6% | |||||
| GrafTech International, Ltd.* | 6,600 | 97,020 | |||
| Electronic Components-Miscellaneous - 0.7% | |||||
| Sanmina-SCI Corp.* | 14,600 | 125,560 | |||
| Electronic Components-Semiconductors - 3.1% | |||||
| Amkor Technology, Inc.* | 16,800 | 115,584 | |||
| Fairchild Semiconductor International, Inc. Cl. A* | 10,300 | 105,369 | |||
| Omnivision Technologies, Inc.* | 6,600 | 107,448 | |||
| Rovi Corp.* | 3,100 | 104,160 | |||
| Skyworks Solutions, Inc.* | 7,800 | 103,272 | |||
| 535,833 | |||||
| Electronic Design Automations - 0.8% | |||||
| Mentor Graphics Corp.* | 14,000 | 130,340 | |||
| Enterprise Software/Services - 2.7% | |||||
| Informatica Corp.* | 4,200 | 94,836 | |||
| JDA Software Group, Inc.* | 5,000 | 109,700 | |||
| Lawson Software, Inc.* | 12,800 | 79,872 | |||
| Mantech International Corp. Cl. A* | 1,500 | 70,740 | |||
| Taleo Corp. Cl. A* | 4,600 | 104,144 | |||
| 459,292 | |||||
| Entertainment Software - 0.5% | |||||
| Take-Two Interactive Software, Inc.* | 7,100 | 79,591 | |||
| Finance-Consumer Loans - 1.2% | |||||
| Ocwen Financial Corp.* | 7,800 | 88,296 | |||
| Portfolio Recovery Associates, Inc.* | 2,400 | 108,792 | |||
| 197,088 |
See Accompanying Notes to Financial Statements.
2
SCHEDULE OF INVESTMENTS (Unaudited)
As of September 30, 2009
Number of Shares | Value | |||||||
| Finance-Investment Bankers/Brokers - 0.6% | ||||||||
| MF Global, Ltd.* | 13,900 | $ | 101,053 | |||||
| Food-Canned - 0.7% | ||||||||
| Seneca Foods Corp. Cl. A* | 4,200 | 115,080 | ||||||
| Food-Miscellaneous/Diversified - 1.1% | ||||||||
| Lance, Inc. | 3,400 | 87,788 | ||||||
| M&F Worldwide Corp.* | 4,800 | 97,152 | ||||||
| 184,940 | ||||||||
| Footwear & Related Apparel - 1.0% | ||||||||
| Deckers Outdoor Corp.* | 1,300 | 110,305 | ||||||
| Iconix Brand Group, Inc.* | 5,200 | 64,844 | ||||||
| 175,149 | ||||||||
| Hospital Beds/Equipment - 0.7% | ||||||||
| Hill-Rom Holdings, Inc. | 5,200 | 113,256 | ||||||
| Human Resources - 0.6% | ||||||||
| Emergency Medical Services Corp. Cl. A* | 2,200 | 102,300 | ||||||
| Instruments-Scientific - 0.6% | ||||||||
| FEI Co.* | 4,200 | 103,530 | ||||||
| Insurance Brokers - 0.6% | ||||||||
| CNinsure, Inc. - ADR | 4,300 | 98,728 | ||||||
| Internet Applications Software - 0.5% | ||||||||
| Cybersource Corp.* | 5,600 | 93,352 | ||||||
| Internet Connectivity Services - 0.8% | ||||||||
| AboveNet, Inc.* | 2,800 | 136,528 | ||||||
| Internet Infrastructure Equipment - 0.7% | ||||||||
| Avocent Corp.* | 5,900 | 119,593 | ||||||
| Internet Infrastructure Software - 1.2% | ||||||||
| AsiaInfo Holdings, Inc.* | 5,200 | 103,844 | ||||||
| TeleCommunication Systems, Inc. Cl. A* | 12,000 | 100,320 | ||||||
| 204,164 | ||||||||
| Intimate Apparel - 0.7% | ||||||||
| The Warnaco Group, Inc.* | 2,600 | 114,036 | ||||||
| Life/Health Insurance - 0.6% | ||||||||
| Delphi Financial Group, Inc. Cl. A | 4,800 | 108,624 | ||||||
| Machinery-Construction & Mining - 0.5% | ||||||||
| Bucyrus International, Inc. Cl. A | 2,300 | 81,926 | ||||||
| Machinery-General Industry - 0.8% | ||||||||
| Albany International Corp. Cl. A | 7,300 | 141,620 | ||||||
| Marine Services - 0.8% | ||||||||
| Aegean Marine Petroleum Network, Inc. | 5,700 | 128,250 | ||||||
| Medical Instruments - 0.5% | ||||||||
| NuVasive, Inc.* | 2,000 | 83,520 | ||||||
| Medical Labs & Testing Services - 0.4% | ||||||||
| Bio-Reference Labs, Inc.* | 1,800 | 61,920 | ||||||
| Medical Products - 3.6% | ||||||||
| Exactech, Inc.* | 4,700 | 73,978 | ||||||
| Haemonetics Corp.* | 1,500 | 84,180 | ||||||
| Hanger Orthopedic Group, Inc.* | 7,900 | 109,573 | ||||||
| Invacare Corp. | 4,600 | 102,488 | ||||||
| Orthofix International NV* | 4,100 | 120,499 | ||||||
| PSS World Medical, Inc.* | 5,400 | 117,882 | ||||||
| 608,600 | ||||||||
| Medical Sterilize Product - 0.7% | ||||||||
| STERIS Corp. | 3,700 | 112,665 | ||||||
| Medical-Biomedical/Genetics - 2.7% | |||||
| Human Genome Sciences, Inc.* | 5,400 | 101,628 | |||
| Incyte Corp., Ltd.* | 12,200 | 82,350 | |||
| Martek Biosciences Corp.* | 2,900 | 65,511 | |||
| Regeneron Pharmaceuticals, Inc.* | 4,200 | 81,060 | |||
| Seattle Genetics, Inc.* | 9,800 | 137,494 | |||
| 468,043 | |||||
| Medical-Drugs - 1.0% | |||||
| Eurand NV* | 6,000 | 90,840 | |||
| Hi-Tech Pharmacal Co., Inc.* | 3,800 | 85,272 | |||
| 176,112 | |||||
| Medical-HMO - 0.5% | |||||
| WellCare Health Plans, Inc.* | 3,800 | 93,670 | |||
| Medical-Outpatient/Home Medical Care - 0.5% | |||||
| Almost Family, Inc.* | 2,700 | 80,325 | |||
| Metal-Aluminum - 0.4% | |||||
| Century Aluminum Co.* | 7,900 | 73,865 | |||
| Multi-line Insurance - 0.8% | |||||
| Unitrin, Inc. | 6,900 | 134,481 | |||
| Oil & Gas Drilling - 1.2% | |||||
| Atlas Energy, Inc. | 4,000 | 108,280 | |||
| Atwood Oceanics, Inc.* | 2,700 | 95,229 | |||
| 203,509 | |||||
| Oil Companies-Exploration & Production - 3.5% | |||||
| ATP Oil & Gas Corp.* | 8,400 | 150,276 | |||
| Berry Petroleum Co. Cl. A | 3,700 | 99,086 | |||
| Gran Tierra Energy, Inc.* | 21,300 | 88,608 | |||
| Mariner Energy, Inc.* | 6,200 | 87,916 | |||
| Stone Energy Corp.* | 8,500 | 138,635 | |||
| W&T Offshore, Inc. | 2,600 | 30,446 | |||
| 594,967 | |||||
| Oil-Field Services - 3.0% | |||||
| Global Industries, Ltd.* | 13,100 | 124,450 | |||
| Helix Energy Solutions Group, Inc.* | 7,500 | 112,350 | |||
| Hercules Offshore, Inc.* | 13,300 | 65,303 | |||
| Hornbeck Offshore Services, Inc.* | 3,800 | 104,728 | |||
| Tetra Technologies, Inc.* | 10,500 | 101,745 | |||
| 508,576 | |||||
| Paper & Related Products - 3.0% | |||||
| Boise, Inc.* | 34,000 | 179,520 | |||
| Clearwater Paper Corp.* | 3,100 | 128,123 | |||
| Domtar Corp.* | 3,500 | 123,270 | |||
| Schweitzer-Mauduit International, Inc. | 1,600 | 86,976 | |||
| 517,889 | |||||
| Pharmacy Services - 0.5% | |||||
| Catalyst Health Solutions, Inc.* | 2,800 | 81,620 | |||
| Physical Practice Management - 0.6% | |||||
| IPC The Hospitalist Co., Inc.* | 3,100 | 97,495 | |||
| Physical Therapy/Rehabilitation Centers - 0.5% | |||||
| RehabCare Group, Inc.* | 4,200 | 91,098 | |||
| Property/Casualty Insurance - 0.6% | |||||
| Amtrust Financial Services, Inc. | 8,900 | 101,549 | |||
| Publishing-Books - 0.6% | |||||
| Scholastic Corp. | 4,000 | 97,360 |
See Accompanying Notes to Financial Statements.
3
U.S. EMERGING GROWTH FUND
SCHEDULE OF INVESTMENTS (Unaudited)
As of September 30, 2009
Number of Shares | Value | |||||||
| Real Estate Management/Service - 1.2% | ||||||||
| E-House China Holdings, Ltd. - ADR* | 5,300 | $ | 113,208 | |||||
| Jones Lang LaSalle, Inc. | 2,000 | 94,740 | ||||||
| 207,948 | ||||||||
| Recreational Centers - 0.7% | ||||||||
| Life Time Fitness, Inc.* | 4,000 | 112,200 | ||||||
| Reinsurance - 0.5% | ||||||||
| Maiden Holdings, Ltd. | 12,500 | 90,875 | ||||||
| Rental Auto/Equipment - 0.8% | ||||||||
| United Rentals, Inc.* | 13,500 | 139,050 | ||||||
| Retail-Apparel/Shoe - 4.6% | ||||||||
| AnnTaylor Stores Corp.* | 8,200 | 130,298 | ||||||
| Collective Brands, Inc.* | 6,200 | 107,446 | ||||||
| Genesco, Inc.* | 4,800 | 115,536 | ||||||
| Guess ?, Inc. | 2,600 | 96,304 | ||||||
| Hanesbrands, Inc.* | 5,000 | 107,000 | ||||||
| Phillips-Van Heusen Corp. | 2,700 | 115,533 | ||||||
| The Finish Line, Inc. Cl. A | 10,600 | 107,696 | ||||||
| 779,813 | ||||||||
| Retail-Office Supplies - 0.7% | ||||||||
| OfficeMax, Inc.* | 9,100 | 114,478 | ||||||
| Retail-Perfume & Cosmetics - 0.5% | ||||||||
| Sally Beauty Holdings, Inc.* | 12,200 | 86,742 | ||||||
| Retail-Restaurants - 1.4% | ||||||||
| Buffalo Wild Wings, Inc.* | 1,800 | 74,898 | ||||||
| CKE Restaurants, Inc. | 8,400 | 88,116 | ||||||
| Cracker Barrel Old Country Store, Inc. | 2,400 | 82,560 | ||||||
| 245,574 | ||||||||
| Retail-Sporting Goods - 0.5% | ||||||||
| Big 5 Sporting Goods Corp. | 5,300 | 80,030 | ||||||
| Rubber-Tires - 0.8% | ||||||||
| Cooper Tire & Rubber Co. | 7,300 | 128,334 | ||||||
| Satellite Telecommunications - 0.6% | ||||||||
| GeoEye, Inc.* | 3,800 | 101,840 | ||||||
| Semiconductor Components-Integrated Circuits - 2.7% | ||||||||
| Cirrus Logic, Inc.* | 18,000 | 100,080 | ||||||
| Himax Technologies, Inc. - ADR | 23,000 | 76,590 | ||||||
| Integrated Device Technology, Inc.* | 14,300 | 96,668 | ||||||
| Pericom Semiconductor Corp.* | 9,400 | 92,214 | ||||||
| TriQuint Semiconductor, Inc.* | 13,400 | 103,448 | ||||||
| 469,000 | ||||||||
| Semiconductor Equipment - 0.5% | ||||||||
| Tessera Technologies, Inc.* | 2,900 | 80,881 | ||||||
| Telecommunication Equipment - 0.9% | ||||||||
| ADC Telecommunications, Inc.* | 11,100 | 92,574 | ||||||
| CommScope, Inc.* | 2,300 | 68,839 | ||||||
| 161,413 | ||||||||
| Telecommunication Equipment-Fiber Optics - 0.5% | ||||||||
| Finisar Corp.* | 9,400 | 90,992 | ||||||
| Therapeutics - 0.4% | ||||||||
| Onyx Pharmaceuticals, Inc.* | 2,500 | 74,925 | ||||||
| Transactional Software - 0.6% | ||||||||
| Solera Holdings, Inc. | 3,400 | 105,774 | ||||||
| Transport-Air Freight - 0.8% | ||||||||
| Atlas Air Worldwide Holdings, Inc.* | 4,200 | 134,274 | ||||||
| Transport-Marine - 0.7% | ||||||||
Genco Shipping & Trading, Ltd.* | 5,800 | 120,524 | ||||||
| Transport-Rail - 0.5% | ||||||||
Kansas City Southern* | 3,400 | 90,066 | ||||||
| Transport-Truck - 0.5% | ||||||||
Saia, Inc.* | 4,800 | 77,184 | ||||||
| Web Portals/ISP - 0.5% | ||||||||
United Online, Inc. | 11,600 | 93,264 | ||||||
| Wire & Cable Products - 0.5% | ||||||||
Fushi Copperweld, Inc.* | 10,800 | 91,368 | ||||||
| Wireless Equipment - 1.1% | ||||||||
InterDigital, Inc.* | 3,600 | 83,376 | ||||||
RF Micro Devices, Inc.* | 18,200 | 98,826 | ||||||
| 182,202 | ||||||||
| Total Common Stock (Cost: $13,339,096) | 16,508,041 | |||||||
| Limited Partnerships - 0.6% | ||||||||
| Pipelines - 0.6% | ||||||||
Targa Resources Partners LP (Cost $78,695) | 5,600 | 105,056 | ||||||
| Principal | ||||||||
| Amount | ||||||||
| Short Term Investments - 3.2% | ||||||||
| Time Deposit - 3.2% | ||||||||
| Citibank Nassau 0.030%, 10/01/09 | ||||||||
| (Cost: $544,711) | $ | 544,711 | 544,711 | |||||
| Total Investments - 100.6% (Cost: $13,962,502) | 17,157,808 | |||||||
| Liabilities in Excess of Other Assets - (0.6%) | (95,199 | ) | ||||||
| Net Assets - 100.0% | $ | 17,062,609 | ||||||
* Non-income producing securities.
ADR - American Depository Receipt
SCHEDULE OF INVESTMENTS BY SECTOR as of September 30, 2009 | ||||
| Sector | Percent of Net Assets | |||
| Consumer, Non-cyclical | 25.9 | % | ||
| Consumer, Cyclical | 16.2 | |||
| Technology | 13.8 | |||
| Industrial | 12.4 | |||
| Communications | 9.0 | |||
| Energy | 8.9 | |||
| Financial | 6.8 | |||
| Basic Materials | 4.1 | |||
| Diversified | 0.3 | |||
| Short Term Investments | 3.2 | |||
| Total Investments | 100.6 | |||
| Liabilities in excess of other assets | (0.6 | ) | ||
| Net Assets | 100.0 | % | ||
See Accompanying Notes to Financial Statements.
4
U.S. SYSTEMATIC LARGE CAP GROWTH FUND
Management Team: James Li, Ph.D., CFA, Portfolio Manager; Jane Edmondson, Portfolio Manager
Chief Investment Officer: Horacio A. Valeiras, CFA
Goal: The U.S. Systematic Large Cap Growth Fund seeks to maximize long-term capital appreciation by investing primarily in stocks from a universe of large U.S. companies with market capitalizations similar to the Russell 1000 Growth Index at time of purchase.
Market Overview: U.S. stocks posted dramatic gains during the six months ended September 30, 2009. In stark contrast to the panic coursing through the market last fall and winter, the period was characterized by rising appetites for risk. Investors jumped back into equities as the economy stabilized and corporate earnings beat expectations.
Government reports revealed brightening conditions in the consumer and manufacturing sectors, including the first back-to-back gain in industrial production since the start of the recession. The Federal Reserve held its key policy rate at 0.00% to 0.25% and continued adding liquidity to the financial system through special lending programs and asset purchases. The credit markets opened up, and corporate borrowers took advantage of cheaper lending rates and strong investor demand.
S&P 500 companies reported their eighth consecutive quarter of negative earnings growth, with first- and second-quarter earnings falling 35.6% and 27.3%, respectively. However, expectations were so low that even these weak numbers surprised on the upside.
Positive investor sentiment lifted stock prices higher across all major sectors, styles and capitalization segments of the market. Many of the stocks that performed the best were stocks of companies with the shakiest earnings prospects and balance sheets which had been hit especially hard during the credit crisis.
Performance: The Fund’s Class R shares gained 24.34% in the six months ended September 30, 2009 and the Russell 1000 Growth Index rose 32.57%.
Portfolio Specifics: All sectors in the Fund had strong positive returns, led by information technology. Three of our best-performing stocks were Apple Computer, Microsoft and Google.
While the Fund had a significant gain, it trailed the index because our systematic, model-based investment style was out of favor. The underperformance was concentrated in the first half of the period when two headwinds worked against us. First, the financial market had been driven primarily by macroeconomic news and government actions rather than company fundamentals, while our model focuses on company fundamentals. So our model struggled this period when there was a disconnect between fundamentals and stock prices and stocks with weaker fundamentals outperformed.
The second headwind was the speed at which expectations about the economy changed. In short order, investors went from thinking that the economy was in a freefall to believing it was on the mend. Inflection points like these are challenging for model-based strategies.
On a positive note, the market started to refocus on fundamentals toward the end of the period, and the Fund’s relative performance improved.
Market Outlook: Our process evaluates investment opportunities on a relative basis and is required to remain fully invested. As such, the process neither utilizes, nor results in, a forecast or outlook on the overall market, but expects to perform equally well in both up and down markets versus the Russell 1000 Growth Index.
We are confident that the Fund’s proprietary stock selection model, in conjunction with its risk-controlled approach to portfolio construction, will add value above the index over time.
Comparison of Change in Value of a $250,000 Investment in U.S. Systematic Large Cap Growth Fund Class R Shares with the Russell 1000 Growth Index.
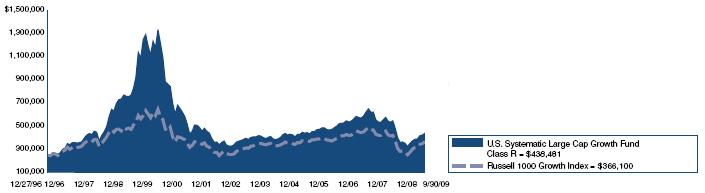
Annualized Total Returns As of 9/30/09 | |||
| 1 Year | 5 Years | 10 Years | |
| U.S. Systematic Large Cap Growth Fund Class R | –9.02% | 2.33% | –5.47% |
| Russell 1000 Growth Index | –1.85% | 1.86% | –2.56% |
The graph above shows the value of a hypothetical $250,000 investment in the Fund compared with the Russell 1000 Growth Index for the periods indicated. The Fund’s Class R shares were first available on May 21, 1999. Performance prior to the introduction of Class R shares reflects the historical performance of the Fund’s Class I Shares. This performance has been restated to reflect shareholder services fees of 0.25% applicable to Class R shares, but not Class I shares of the Fund. The Fund’s Class I Shares calculate their performance based upon the historical performance of a corresponding series of Nicholas-Applegate Mutual Funds (renamed ING Mutual Funds). Average annual total return figures include changes in principal value, reinvested dividends, and capital gain distributions. Absent expense limitations, total returns would have been slightly lower. The total returns shown above do not show the effects of income taxes on an individual’s investment. In most cases, taxes may reduce your actual investment returns on income or gains paid by the Fund or any gains you may realize if you sell your shares. Past performance cannot guarantee future results.
Russell 1000 Growth Index measures the performance of those Russell 1000 companies with higher price-to-book ratios and higher forecasted growth values. The Russell 1000 Index consists of the 1,000 largest securities in the Russell 3000 Index, which represents approximately 90% of the total market capitalization of the Russell 3000 Index. It is a large-cap, market-oriented index and is highly correlated with the S&P 500 Index. Unless otherwise noted, index returns reflect the reinvestment of income dividends and capital gains, if any, but do not reflect fees, brokerage commissions or other expenses of investing.
Since markets can go down as well as up, investment return and principal value will fluctuate with market conditions. You may have a gain or loss when you sell your shares.
5
U.S. SYSTEMATIC LARGE CAP GROWTH FUND
SCHEDULE OF INVESTMENTS (Unaudited)
As of September 30, 2009
| Number of | ||||||||
| Shares | Value | |||||||
| Common Stock - 98.0% | ||||||||
| Aerospace/Defense - 2.9% | ||||||||
Lockheed Martin Corp. | 500 | $ | 39,040 | |||||
Raytheon Co. | 2,500 | 119,925 | ||||||
| 158,965 | ||||||||
| Agricultural Operations - 0.8% | ||||||||
Archer-Daniels-Midland Co. | 1,600 | 46,752 | ||||||
| Applications Software - 5.2% | ||||||||
Microsoft Corp. | 11,000 | 284,790 | ||||||
| Auto-Cars/Light Trucks - 0.8% | ||||||||
Ford Motor Co.* | 6,200 | 44,702 | ||||||
| Beverages-Non-alcoholic - 3.7% | ||||||||
Coca-Cola Co. | 1,100 | 59,070 | ||||||
Coca-Cola Enterprises, Inc. | 4,400 | 94,204 | ||||||
PepsiCo, Inc. | 900 | 52,794 | ||||||
| 206,068 | ||||||||
| Cable TV - 0.5% | ||||||||
DISH Network Corp. Cl. A* | 1,500 | 28,890 | ||||||
| Computer Services - 1.0% | ||||||||
Cognizant Technology Solutions Corp. Cl. A* | 1,400 | 54,124 | ||||||
| Computers - 10.8% | ||||||||
Apple, Inc.* | 1,200 | 222,444 | ||||||
Hewlett-Packard Co. | 3,300 | 155,793 | ||||||
International Business Machines Corp. | 1,800 | 215,298 | ||||||
| 593,535 | ||||||||
| Computers-Memory Devices - 3.3% | ||||||||
EMC Corp./Massachusetts* | 5,200 | 88,608 | ||||||
NetApp, Inc.* | 1,100 | 29,348 | ||||||
Western Digital Corp.* | 1,700 | 62,101 | ||||||
| 180,057 | ||||||||
| Containers-Metal/Glass - 2.2% | ||||||||
Ball Corp. | 800 | 39,360 | ||||||
Owens-Illinois, Inc.* | 2,200 | 81,180 | ||||||
| 120,540 | ||||||||
| Cosmetics & Toiletries - 2.1% | ||||||||
Procter & Gamble Co. | 2,000 | 115,840 | ||||||
| Diversified Manufacturing Operations - 1.7% | ||||||||
3M Co. | 700 | 51,660 | ||||||
General Electric Co. | 2,500 | 41,050 | ||||||
| 92,710 | ||||||||
| E-Commerce/Services - 2.7% | ||||||||
eBay, Inc.* | 2,400 | 56,664 | ||||||
Expedia, Inc.* | 1,200 | 28,740 | ||||||
Liberty Media Corp. - Interactive* | 2,700 | 29,619 | ||||||
priceline.com, Inc.* | 200 | 33,164 | ||||||
| 148,187 | ||||||||
| Electric-Integrated - 1.0% | ||||||||
PG&E Corp. | 1,300 | 52,637 | ||||||
| Electronic Components-Semiconductors - 6.0% | ||||||||
Broadcom Corp. Cl. A* | 2,400 | 73,656 | ||||||
Intel Corp. | 3,800 | 74,366 | ||||||
ON Semiconductor Corp.* | 5,700 | 47,025 | ||||||
Rovi Corp.* | 1,700 | 57,120 | ||||||
Texas Instruments, Inc. | 3,400 | 80,546 | ||||||
| 332,713 | ||||||||
| Enterprise Software/Services - 3.9% | ||||||||
BMC Software, Inc.* | 1,000 | 37,530 | ||||||
Oracle Corp. | 8,400 | 175,056 | ||||||
| 212,586 | ||||||||
| Finance-Investment Bankers/Brokers - 1.7% | ||||||||
The Goldman Sachs Group, Inc. | 500 | 92,175 | ||||||
| Finance-Other Services - 1.0% | ||||||||
The Nasdaq OMX Group* | 2,500 | 52,625 | ||||||
| Food-Miscellaneous/Diversified - 1.0% | ||||||||
Kraft Foods, Inc. Cl. A | 2,000 | 52,540 | ||||||
| Gas-Distribution - 0.5% | ||||||||
Centerpoint Energy, Inc. | 2,200 | 27,346 | ||||||
| Gold Mining - 0.5% | ||||||||
Newmont Mining Corp. | 600 | 26,412 | ||||||
| Life/Health Insurance - 1.0% | ||||||||
Prudential Financial, Inc.* | 1,100 | 54,901 | ||||||
| Medical Information Systems - 0.8% | ||||||||
Cerner Corp.* | 600 | 44,880 | ||||||
| Medical Instruments - 0.8% | ||||||||
Medtronic, Inc. | 1,200 | 44,160 | ||||||
| Medical Products - 2.4% | ||||||||
Johnson & Johnson | 2,200 | 133,958 | ||||||
| Medical-Biomedical/Genetics - 1.1% | ||||||||
Amgen, Inc. | 1,000 | 60,230 | ||||||
| Medical-Drugs - 5.6% | ||||||||
Abbott Laboratories | 1,600 | 79,152 | ||||||
Bristol-Myers Squibb Co. | 4,200 | 94,584 | ||||||
Forest Laboratories, Inc.* | 1,400 | 41,216 | ||||||
Schering-Plough Corp. | 3,400 | 96,050 | ||||||
| 311,002 | ||||||||
| Medical-Generic Drugs - 0.5% | ||||||||
Mylan, Inc.* | 1,800 | 28,818 | ||||||
| Medical-HMO - 1.3% | ||||||||
UnitedHealth Group, Inc.* | 1,600 | 40,064 | ||||||
WellPoint, Inc.* | 700 | 33,152 | ||||||
| 73,216 | ||||||||
| Medical-Whosale Drug Distributors - 0.7% | ||||||||
AmerisourceBergen Corp. Cl. A | 1,800 | 40,284 | ||||||
| Multi-line Insurance - 1.2% | ||||||||
ACE, Ltd.* | 1,200 | 64,152 | ||||||
| Networking Products - 4.3% | ||||||||
Cisco Systems, Inc.* | 10,100 | 237,754 | ||||||
| Oil & Gas Drilling - 0.5% | ||||||||
ENSCO International, Inc. | 700 | 29,778 | ||||||
| Oil Companies-Exploration & Production - 1.6% | ||||||||
Southwestern Energy Co.* | 1,300 | 55,484 | ||||||
XTO Energy, Inc. | 800 | 33,056 | ||||||
| 88,540 | ||||||||
| Oil Companies-Integrated - 2.0% | ||||||||
ConocoPhillips | 1,200 | 54,192 | ||||||
Exxon Mobil Corp. | 800 | 54,888 | ||||||
| 109,080 | ||||||||
| Pharmacy Services - 1.0% | ||||||||
Medco Health Solutions, Inc.* | 1,000 | 55,310 | ||||||
See Accompanying Notes to Financial Statements.
6
SCHEDULE OF INVESTMENTS (Unaudited)
As of September 30, 2009
| Number of | ||||||||
| Shares | Value | |||||||
| Publishing-Newspapers - 0.6% | ||||||||
| Gannett Co., Inc. | 2,800 | $ | 35,028 | |||||
| Retail-Apparel/Shoe - 0.5% | ||||||||
| Phillips-Van Heusen Corp. | 700 | 29,953 | ||||||
| Retail-Automobile - 0.7% | ||||||||
| AutoNation, Inc.* | 2,200 | 39,776 | ||||||
| Retail-Bedding - 1.1% | ||||||||
| Bed Bath & Beyond, Inc.* | 1,600 | 60,064 | ||||||
| Retail-Discount - 4.3% | ||||||||
| Target Corp. | 1,400 | 65,352 | ||||||
| Wal-Mart Stores, Inc. | 3,500 | 171,815 | ||||||
| 237,167 | ||||||||
| Retail-Drug Store - 0.5% | ||||||||
| CVS Caremark Corp. | 800 | 28,592 | ||||||
| Retail-Restaurants - 2.0% | ||||||||
| Darden Restaurants, Inc. | 1,600 | 54,608 | ||||||
| McDonald’s Corp. | 1,000 | 57,070 | ||||||
| 111,678 | ||||||||
| Semicon Components-Integrated Circuits - 1.4% | ||||||||
| Marvell Technology Group, Ltd.* | 4,800 | 77,712 | ||||||
| Steel-Producers - 0.6% | ||||||||
| Steel Dynamics, Inc. | 2,300 | 35,282 | ||||||
| Telephone-Integrated - 2.3% | ||||||||
| AT&T, Inc. | 2,500 | 67,525 | ||||||
| CenturyTel, Inc. | 1,700 | 57,120 | ||||||
| 124,645 | ||||||||
| Web Portals/ISP - 4.5% | ||||||||
| Google, Inc. Cl. A* | 500 | 247,925 | ||||||
| Wire & Cable Products - 0.4% | ||||||||
| General Cable Corp.* | 600 | 23,490 | ||||||
| Wireless Equipment - 1.0% | ||||||||
| QUALCOMM, Inc. | 1,200 | 53,976 | ||||||
| Total Common Stock (Cost: $4,492,596) | 5,405,545 | |||||||
| Total Investments - 98.0% (Cost: $4,492,596) | 5,405,545 | |||||||
| Other Assets in Excess of Liabilities - 2.0% | 111,715 | |||||||
| Net Assets - 100.0% | $ | 5,517,260 | ||||||
| * Non-income producing securities. |
SCHEDULE OF INVESTMENTS BY SECTOR | ||||
| as of September 30, 2009 | ||||
| Percent of | ||||
| Sector | Net Assets | |||
| Technology | 32.4 | % | ||
| Consumer, Non-cyclical | 21.0 | |||
| Communications | 15.9 | |||
| Consumer, Cyclical | 9.9 | |||
| Industrial | 7.2 | |||
| Financial | 4.9 | |||
| Energy | 4.1 | |||
| Utilities | 1.5 | |||
| Basic Materials | 1.1 | |||
| Total Investments | 98.0 | |||
| Other assets in excess of liabilities | 2.0 | |||
| Net Assets | 100.0 | % | ||
| See Accompanying Notes to Financial Statements. |
7
NICHOLAS-APPLEGATE INSTITUTIONAL FUNDS
FINANCIAL HIGHLIGHTS
For a Class R share outstanding during the periods indicated
| Distributions from: | ||||||||||||||||||||||||
Net Asset Value, Beginning | Net Investment Income (Loss) (1) | Net Realized and Unrealized Gain (Loss) | Total from Investments Operations | Net Investment Income | Net Realized Capital Gains | |||||||||||||||||||
| U.S. EQUITY FUNDS | ||||||||||||||||||||||||
| U.S. EMERGING GROWTH | ||||||||||||||||||||||||
| For the period ended 09/30/09 | $ | 6.42 | $ | (0.04 | ) | $ | 3.69 | $ | 3.65 | $ | — | $ | — | |||||||||||
| For the year ended 03/31/09 | 11.20 | (0.06 | ) | (4.72 | )(5) | (4.78 | ) | — | — | |||||||||||||||
| For the year ended 03/31/08 | 12.84 | (0.10 | ) | (0.66 | )(5) | (0.76 | ) | — | (0.88 | ) | ||||||||||||||
| For the year ended 03/31/07 | 13.69 | (0.10 | ) | 0.18 | (6) | 0.08 | — | (0.93 | ) | |||||||||||||||
| For the year ended 03/31/06 | 9.65 | (0.14 | ) | 4.18 | 4.04 | — | — | |||||||||||||||||
| For the year ended 03/31/05 | 9.52 | (0.10 | ) | 0.23 | 0.13 | — | — | |||||||||||||||||
| U.S. SYSTEMATIC LARGE CAP GROWTH | ||||||||||||||||||||||||
| For the period ended 09/30/09 | $ | 12.57 | $ | 0.02 | $ | 3.04 | $ | 3.06 | $ | — | $ | — | ||||||||||||
| For the year ended 03/31/09 | 18.99 | 0.05 | (6.47 | )(5) | (6.42 | ) | — | — | ||||||||||||||||
| For the year ended 03/31/08 | 19.42 | (0.07 | ) | (0.36 | )(5) | (0.43 | ) | — | — | |||||||||||||||
| For the year ended 03/31/07 | 17.59 | (0.02 | ) | 1.85 | 1.83 | — | — | |||||||||||||||||
| For the year ended 03/31/06 | 15.46 | (0.02 | ) | 2.15 | 2.13 | — | — | |||||||||||||||||
| For the year ended 03/31/05 | 14.90 | 0.02 | 0.54 | 0.56 | — | — | ||||||||||||||||||
| (1) | Net investment income per share is calculated by dividing net investment income for the period by the average shares outstanding during the period. |
| (2) | Total returns are not annualized for periods less than one year. |
| (3) | Ratios are annualized for periods of less than one year. Expense reimbursements reflect voluntary reductions of total expenses. Such amounts would increase net investment income (loss) ratios had such reductions not occurred. |
| (4) | Net expenses include certain items not subject to expense reimbursement for periods prior to January 23, 2006. |
See Accompanying Notes to Financial Statements.
8
| Ratios to Average Net Assets (3) | ||||||||||||||||||||||||||||||||||||||
Total Distributions | Net Asset Value, Ending | Total Return(2) | Net Assets, Ending (in 000’s) | Net Investment Income(Loss) | Total Expenses | Expense (Reimbursements)/ Recoupment | Expenses Net of Reimbursement/ Recoupment | Expenses Net of Reimbursement/ Recoupment Offset(4) | Fund’s Portfolio Turnover Rate | |||||||||||||||||||||||||||||
| $ | — | $ | 10.07 | 56.85 | % | $ | 2,618 | (0.83 | %) | 1.43 | % | — | 1.43 | % | 1.42 | % | 74 | % | ||||||||||||||||||||
| — | 6.42 | (42.68 | %) | 1,536 | (0.62 | %) | 1.46 | % | — | 1.46 | % | 1.14 | % | 146 | % | |||||||||||||||||||||||
| (0.88 | ) | 11.20 | (7.15 | %) | 2,870 | (0.71 | %) | 1.46 | % | — | 1.46 | % | 0.96 | % | 129 | % | ||||||||||||||||||||||
| (0.93 | ) | 12.84 | 1.02 | % | 3,177 | (0.78 | %) | 1.46 | % | — | 1.46 | % | 0.97 | % | 148 | % | ||||||||||||||||||||||
| — | 13.69 | 41.98 | % | 3,173 | (1.27 | %) | 2.09 | % | (0.36 | %) | 1.73 | % | 1.42 | % | 128 | % | ||||||||||||||||||||||
| — | 9.65 | 1.37 | % | 3,681 | (1.06 | %) | 1.89 | % | (0.20 | %) | 1.69 | % | 1.26 | % | 142 | % | ||||||||||||||||||||||
| $ | — | $ | 15.63 | 24.34 | % | $ | 4,557 | 0.28 | % | 1.36 | % | — | 1.36 | % | 1.32 | % | 69 | % | ||||||||||||||||||||
| — | 12.57 | (33.81 | %) | 3,461 | 0.32 | % | 1.46 | % | — | 1.42 | % | 1.37 | % | 116 | % | |||||||||||||||||||||||
| — | 18.99 | (2.21 | %) | 5,822 | (0.35 | %) | 1.39 | % | — | 1.39 | % | 1.36 | % | 106 | % | |||||||||||||||||||||||
| — | 19.42 | 10.40 | % | 6,022 | (0.13 | %) | 1.38 | % | — | 1.38 | % | 1.30 | % | 100 | % | |||||||||||||||||||||||
| — | 17.59 | 13.78 | % | 6,055 | (0.11 | %) | 1.86 | % | (0.48 | %) | 1.38 | % | 1.29 | % | 147 | % | ||||||||||||||||||||||
| — | 15.46 | 3.76 | % | 9,318 | 0.14 | % | 1.94 | % | (0.57 | %) | 1.37 | % | 1.29 | % | 197 | % | ||||||||||||||||||||||
| (5) | Includes litigation proceeds of approximately, $0.07 and $0.06 per share for the U.S. Emerging Growth Fund during the fiscal year for 2008 and 2009, respectively, $0.09 and $0.04 per share for the U.S. Systematic Large Cap Growth Fund during the fiscal year for 2008 and 2009, respectively. |
| (6) | The Fund received $12,373 from a security litigation settlement during the year which is reflected in realized gains. This event had a $0.05 per share impact to the fund. |
9
NICHOLAS-APPLEGATE INSTITUTIONAL FUNDS
STATEMENTS OF ASSETS AND LIABILITIES
| September 30, 2009 (Unaudited) | U.S. Emerging Growth | U.S. Systematic Large Cap Growth | ||||||
| Assets | ||||||||
| Investments, at value* | $ | 17,157,808 | $ | 5,405,545 | ||||
| Cash | — | 120,487 | ||||||
| Receivables: | ||||||||
| Investment securities sold | 269,954 | — | ||||||
| Capital shares sold | 46,888 | — | ||||||
| Dividends | 5,160 | 4,037 | ||||||
| Other | 88 | — | ||||||
| Total assets | 17,479,898 | 5,530,069 | ||||||
| Liabilities | ||||||||
| Payables: | ||||||||
| Investments purchased | $ | 395,085 | $ | — | ||||
| Capital shares redeemed | 4,600 | 3,781 | ||||||
| To investment advisor | 10,292 | 2,002 | ||||||
| Other liabilities | 7,312 | 7,026 | ||||||
| Total Liabilities | 417,289 | 12,809 | ||||||
| NET ASSETS | 17,062,609 | 5,517,260 | ||||||
| * Investments, at cost | 13,962,502 | 4,492,596 | ||||||
| Net Assets Consist of: | ||||||||
| Paid in capital | $ | 23,040,421 | $ | 13,756,023 | ||||
| Undistributed net investment income (loss) | (38,288 | ) | 59,604 | |||||
| Accumulated net realized (loss) on investments and foreign currencies | (9,134,830 | ) | (9,211,316 | ) | ||||
| Net unrealized appreciation of investments and other assets and liabilities | ||||||||
| denominated in foreign currencies | 3,195,306 | 912,949 | ||||||
| Net Assets applicable to all shares outstanding | $ | 17,062,609 | $ | 5,517,260 | ||||
| Net Assets of Class I shares | $ | 14,445,075 | $ | 960,430 | ||||
| Net Assets of Class II shares | — | — | ||||||
| Net Assets of Class R shares | 2,617,534 | 4,556,830 | ||||||
| Class I Shares outstanding | 1,395,795 | 59,984 | ||||||
| Class II Shares outstanding | — | — | ||||||
| Class R Shares outstanding | 260,005 | 291,596 | ||||||
| Net Asset Value — Class I Share | $ | 10.35 | $ | 16.01 | ||||
| Net Asset Value — Class II Share | $ | — | $ | — | ||||
| Net Asset Value — Class R Share | $ | 10.07 | $ | 15.63 | ||||
10
NICHOLAS-APPLEGATE INSTITUTIONAL FUNDS
STATEMENTS OF OPERATIONS
| U.S. Systematic | ||||||||
| Six Months Ended | U.S. Emerging | Large Cap | ||||||
| September 30, 2009 (Unaudited) | Growth | Growth | ||||||
| Investment Income | ||||||||
| Dividends, net of foreign taxes* | $ | 34,181 | $ | 46,449 | ||||
Interest | 3 | 31 | ||||||
| Total Income | 34,184 | 46,480 | ||||||
| Expenses | ||||||||
Advisory fee | 45,147 | 13,080 | ||||||
Administration fees | 24,680 | 17,797 | ||||||
| Shareholder servicing fees | 2,680 | 5,021 | ||||||
Miscellaneous | 1,272 | 800 | ||||||
| Total Expenses | 73,779 | 36,698 | ||||||
| Expense offset | (1,307 | ) | (1,150 | ) | ||||
| Net Expenses | 72,472 | 35,548 | ||||||
| Net Investment Income (Loss) | (38,288 | ) | 10,932 | |||||
| Net Realized and Unrealized | ||||||||
Loss on Investments | ||||||||
| Realized loss from: | ||||||||
Securities | (174,653 | ) | (487,957 | ) | ||||
Net realized (loss) | (174,653 | ) | (487,957 | ) | ||||
| Change in unrealized appreciation of: | ||||||||
Investments | 5,231,804 | 1,717,427 | ||||||
| Net unrealized appreciation | 5,231,804 | 1,717,427 | ||||||
| Net Gain on Investments | 5,057,151 | 1,229,470 | ||||||
| Assets Resulting From Operations | $ | 5,018,863 | $ | 1,240,402 | ||||
| * Foreign taxes withheld | $ | 116 | $ | |||||
11
NICHOLAS-APPLEGATE INSTITUTIONAL FUNDS
STATEMENTS OF CHANGES IN NET ASSETS
| U.S. Systematic | ||||||||||||||||
| U.S. Emerging Growth | Large Cap Growth | |||||||||||||||
| September 30, | September 30, | |||||||||||||||
| Six Months Ended September 30, 2009 | 2009 | 2009 | ||||||||||||||
| and the Year Ended March 31, 2009 | (Unaudited) | March 2009 | (Unaudited) | March 2009 | ||||||||||||
| Increase (Decrease) In Net Assets | ||||||||||||||||
Net investment income (loss) | $ | (38,288 | ) | $ | (40,240 | ) | $ | 10,932 | $ | 48,672 | ||||||
Net realized gain (loss) | (174,653 | ) | (3,991,029 | ) | (487,957 | ) | (1,713,044 | ) | ||||||||
Net unrealized appreciation (depreciation) | 5,231,804 | (1,566,687 | ) | 1,717,427 | (1,284,603 | ) | ||||||||||
| Investment operations | 5,018,863 | (5,597,956 | ) | 1,240,402 | (2,948,975 | ) | ||||||||||
Proceeds from shares sold | ||||||||||||||||
Class I | 4,153,557 | 5,416,300 | 329,351 | 64,726 | ||||||||||||
Class II | — | — | 653 | (400 | ) | |||||||||||
Class R | 321,992 | 659,133 | 349,050 | 329,609 | ||||||||||||
Cost of shares redeemed | ||||||||||||||||
Class I | (410,187 | ) | (1,926,575 | ) | (41,548 | ) | (90,716 | ) | ||||||||
Class II | — | — | (2,496,831 | ) | (7,520,810 | ) | ||||||||||
Class R | (148,953 | ) | (792,831 | ) | (111,389 | ) | (792,263 | ) | ||||||||
| Net increase (decrease) in net assets from share transactions | 3,916,409 | 3,356,027 | (1,970,714 | ) | (8,009,854 | ) | ||||||||||
| Net Increase (Decrease) in Net Assets | 8,935,272 | (2,241,929 | ) | (730,312 | ) | (10,958,829 | ) | |||||||||
| Net Assets | ||||||||||||||||
Beginning | 8,127,337 | 10,369,266 | 6,247,572 | 17,206,401 | ||||||||||||
Ending | $ | 17,062,609 | $ | 8,127,337 | $ | 5,517,260 | $ | 6,247,572 | ||||||||
| Undistributed net investment income (loss), ending | $ | (38,288 | ) | $ | (40,240 | ) | $ | 59,604 | $ | 48,672 | ||||||
| Class I — Capital Share Activity | ||||||||||||||||
Shares sold | 442,919 | 554,485 | 23,149 | 4,483 | ||||||||||||
Distributions reinvested | — | — | — | — | ||||||||||||
Shares redeemed | (47,041 | ) | (209,274 | ) | (2,927 | ) | (5,503 | ) | ||||||||
Net Class I Share Activity | 395,878 | 345,211 | 20,222 | (1,020 | ) | |||||||||||
| Class II — Capital Share Activity | ||||||||||||||||
Shares sold | — | — | — | (21 | ) | |||||||||||
Distributions reinvested | — | — | — | — | ||||||||||||
Shares redeemed | — | — | (177,372 | ) | (371,830 | ) | ||||||||||
Net Class II Share Activity | — | — | (177,372 | ) | (371,851 | ) | ||||||||||
| Class R — Capital Share Activity | ||||||||||||||||
Shares sold | 38,275 | 72,627 | 24,293 | 20,763 | ||||||||||||
Distributions reinvested | — | — | — | — | ||||||||||||
Shares redeemed | (17,609 | ) | (89,614 | ) | (7,975 | ) | (51,985 | ) | ||||||||
Net Class R Share Activity | 20,666 | (16,987 | ) | 16,318 | (31,222 | ) | ||||||||||
See Accompanying Notes to Financial Statements.
12
NICHOLAS-APPLEGATE INSTITUTIONAL FUNDS
NOTES TO FINANCIAL STATEMENTS — (Unaudited)
NOTE A — ORGANIZATION
Nicholas-Applegate Institutional Funds (the “Trust”) is an open-end investment management company. The Trust was established as a Delaware business trust on December 17, 1992 and consists of twelve separate portfolios (collectively, the “Funds” and each, a “Fund”). Each Fund’s investment objectives, strategies and risks are discussed in the Funds’ current prospectuses. All of the Funds have issued Class I shares (“Class I”), four Funds have issued Class II shares (“Class II”), two Fund has issued Class III shares (“Class III”), one Fund has issued Class IV shares (“Class IV”) and two Funds have issued Retirement shares (“Class R”). No shares have a sales charge. Class R has a distribution fee. The Funds offering Class R shares are covered in this report.
NOTE B — SIGNIFICANT ACCOUNTING POLICIES
Significant accounting policies consistently followed by the Funds in preparing these financial statements are described below. The policies conform with accounting principles generally accepted in the United States.
Security Valuations
Equity securities, including ADRs, and GDRs, that are traded on a stock exchange or on the NASDAQ National Market System are valued at the last sale price as of the close of business on the New York Stock Exchange (normally 4:00 p.m. New York time) on the day the securities are being valued, or lacking any sales, at the mean between the closing bid and asked prices. Securities listed or traded on certain non-U.S. exchanges whose operations are similar to the United States over-the-counter market are valued at the price within the limits of the latest available current bid and asked prices deemed by Nicholas-Applegate Capital Management LLC (the “Adviser”) to best reflect fair value. A security that is listed or traded on more than one exchange is valued at the quotation on the exchange determined to be the primary market for such security by the Adviser. Equity Linked Notes (“ELN’s”) are valued by using the closing local price for the underlying security and applying the exchange rate for the currency to arrive at a USD equivalent.
Long-term debt obligations, including high quality and high yield corporate securities, municipal securities, asset-backed securities, collateralized mor tgage obligations and U.S. Government and Agency issues, are normally valued at the mean between bid and ask price provided by an approved bond pricing service. In the event a TRACE price is used, the price is the last traded price on that day greater than or equal to 1mm par amount. Convertible securities are normally priced at the mean between the bid and ask prices. If such a security has a demand feature exercisable within one to seven days, the security is valued at par. In the event that a pricing service does not price a particular security or the price provided is not believed to be reliable, the Adviser will endeavor to use the average of one or two broker-dealer quotations. If broker-dealer quotations are not available, the Adviser generally “stales” the price.
Short-term debt instruments (e.g., commercial paper, bankers acceptances, U.S. Treasury Bills, etc.) having a maturity of less than 60 days will be valued at amortized cost.
Securities or other assets for which reliable market quotations are not readily available or for which the pricing agent or principal market maker does not provide a valuation or methodology or provides a valuation or methodology that, in the judgment of the Adviser does not represent fair value (“Fair Value Securities”), are valued by the Pricing Committee overseen by the Board of Trustees in consultation as applicable, with the Adviser’s portfolio managers, traders, and research and credit analysts and legal and compliance personnel. Fair Value Securities may include, but are no limited to, the following: certain private placements and restricted securities that do not have an active trading market; securities whose trading has been suspended or for which there is no current market; securities whose prices are stale; securities denominated in currencies that are restricted, untraded, or for which exchange rates are disrupted; securities affected by significant events; and securities that the Adviser or Pricing Committee believe were pr iced incorrectly. A “significant event” (which includes, but is not limited to, an extraordinary political or market event) is an event that the Adviser or Pricing Committee believes with a reasonably high degree of certainty has caused the closing market prices of a Fund’s portfolio securities to no longer reflect their value at the time of the Fund’s NAV calculation.
Security Transactions and Investment Income
Security transactions are accounted for as of trade date Realized gains and losses from security transactions are determined on an identified-cost basis.
Dividend income is recorded on the ex-dividend date or, for certain non-U.S. securities, when the information becomes available to the Funds. Interest income is recorded on an accrual basis. Discounts and premiums on debt securities are accreted and amortized on the yield to maturity basis.
Non-U.S. Currency Transactions
On each net asset valuation date, the value of assets and liabilities denominated in non-U.S. currencies are translated into U.S. dollars using the current exchange rate at 11:00 a.m. Eastern Time against the U.S. dollar, as provided by an approved pricing service. Security transactions, income and expenses are converted at the prevailing exchange rate on the day of the event. The effect of changes in exchange rates on securities denominated in a non-U.S. currency is included with the net realized and unrealized gain or loss of the associated security. Foreign exchange rates are translated into U.S. dollars when the exchange rate is struck at the close of the London Stock exchange. Other non-U.S. currency gains or losses are reported separately.
Certain Funds may use forward non-U.S. currency contracts to reduce their exposure to currency fluctuations of their non-U.S. securities. These contracts are commitments to purchase or sell a non-U.S. currency at a specified rate on a future date. When the contract is fulfilled or closed, gains or losses are realized. Until then, the gain or loss is included in unrealized appreciation
13
NICHOLAS-APPLEGATE INSTITUTIONAL FUNDS
NOTES TO FINANCIAL STATEMENTS — (Unaudited) — Continued
or depreciation of investments. The contract commitment is fully collateralized by cash or securities of the Fund. Non-U.S. denominated assets and forward currency contracts may involve more risks than U.S. transactions, including currency risk, political and economic risk, regulatory and market risk. Evaluating and monitoring such risk exposure is a part of the Funds’ management strategy. The Funds did not use forward non-U.S. currency contracts at September 30, 2009.
Futures Contracts
Each Fund may enter into futures contracts involving non-U.S. currency, interest rates, securities, and securities indices, for hedging purposes only. A futures contract obligates the seller of the contract to deliver and the purchaser of the contract to take delivery of the type of non-U.S. currency, financial instrument or security called for in the contract at a specified future time for a specified price. Upon entering into such a contract, a Fund is required to deposit and maintain as collateral such initial margin as required by the exchange on which the contract is traded. Pursuant to the contract, a Fund agrees to receive from or pay to the broker an amount equal to the daily fluctuations in the value of the contract. Such receipts or payments are known as variation margin and are recorded as unrealized gains or losses by the Fund. When the contract is closed, the Fund records a realized gain or loss equal to the difference between the value of the contract at the time it was opened and the value at the time it was closed. For the period ended September 30, 2009, the Funds did not hold futures contracts.
Equity-Linked Securities
Certain Funds may purchase equity-linked securities, also known as participation notes, equity swaps, and zero strike calls and warrants. Equity-linked securities are primarily used by a Fund as an alternative means to more efficiently and effectively access what is generally an emerging securities market. The Fund deposits an amount of cash with its custodian (or broker, if legally permitted) in an amount near or equal to the selling price of the underlying security in exchange for an equity linked security. Upon sale, the Fund receives cash from the broker or custodian equal to the value of the underlying security. Aside from market risk of the underlying securities, there is a risk of default by the counterparty to the transaction. In the event of insolvency of the counterparty, the Fund might be unable to obtain its expected benefit. In addition, while a Fund will seek to enter into such transactions only with parties which are capable of entering into closing transactions with the Fund, there can be no assurance that the Fund will be able to close out such a transaction with the counterparty or obtain an offsetting position with any counterparty, at any time prior to the end of the term of the underlying agreement. This may impair the Fund’s ability to enter into other transactions at a time when doing so might be advantageous.
Securities Lending
In order to generate expense offset credits, each of the Funds may lend portfolio securities, on a short-term or a long-term basis, up to 30% of a Fund’s total assets. The loans are secured by collateral in the form of cash, cash equivalents, U.S. government and agency securities equal to at least 102% of the market value of securities loaned on U.S. securities and 105% of the market value of securities loaned on non-U.S. securities. During the term of the loan, the Funds will continue to receive any interest, dividends or amounts equivalent thereto, on the loaned securities while receiving a fee from the borrower and/or earning interest on the investment of the cash collateral. Upon termination of the loan, the borrower will return to the Funds securities identical to the loaned securities. The Funds may pay reasonable finders’, administration and custodial fees in connection with a loan of its securities and may share the interest earned on the collateral with the borrower.
The Funds bear the risk of delay in recovery of, or even loss of rights in, the securities loaned should the borrower of the securities fail financially. The Funds also bear the risk of loss in the event the securities purchased with cash collateral depreciate in value. Loans are subject to termination at the option of the borrower of the Fund. There were no securities on loan for the period ended September 30, 2009. The Funds terminated the security lending program on April 1, 2009.
Credit Facility
The Trust has a $15 million credit facility available to fund temporary or emergency borrowing expiring in March 2010. A Fund will pays its pro-rata share of an annual commitment fee plus interest on its specific borrowings. For the period ended September 30, 2009, the Funds did not borrow against the line of credit.
Commitments and Contingencies
In the normal course of business, the Funds may enter into contracts and agreements that contain a variety of representations and warranties which provide general indemnifications. The maximum exposure to the Funds under these arrangements is unknown, as this would involve future claims that may be made against the Funds that have not yet occurred. However, based on experience, the Funds expect the risks of loss to be remote.
Fund Expenses and Multi-Class Allocations
Each Fund bears expenses incurred specifically on its behalf plus an allocation of its share of Trust level expenses. Each share offered by a Fund has equal rights to assets but incurs certain Class specific expenses. The Funds allocate income, gains and losses, both realized and unrealized, and expenses, except for Class specific expenses, based on the relative net assets of each share class.
During the period ended September 30, 2009, many of the brokers with whom the Adviser places trades on behalf of the Funds provided services to the Funds in addition to trade execution. These services included payments of certain expenses on behalf of the Funds. In addition, through arrangements with the Funds’ custodian, credits realized as a result of uninvested cash balances were used to reduce the Funds’ expenses. During the period ended September 30, 2009, the credits used to reduce the Funds’ expenses were:
14
| Credit | Security | Security | |
| Interest | Lending | Lending | |
| Fund | Offset | Offset | Offset |
| U.S. Emerging Growth | 90 | 1,217 | — |
| U.S. Systematic Large Cap Growth | 25 | 1,099 | 26 |
Use of Estimates
The preparation of financial statements in conformity with accounting principles generally accepted in the United States requires management to make estimates and assumptions that affect the amounts reported in the financial statements and accompanying notes. Actual results could differ from these estimates.
NOTE C — FEDERAL INCOME TAXES
The Funds intend to comply with the requirements of the Internal Revenue Code applicable to regulated investment companies and to distribute substantially all of their taxable income to shareholders. Accordingly, no provision for federal income taxes is required. A Fund investing in foreign securities records any foreign taxes on income and gains on such investments in accordance with the applicable tax rules. The Funds’ tax accounting treatment of loss deferrals, accretion, passive foreign investment companies and expiration of capital loss carryforwards is different from the financial statement recognition of income and gains.
Capital loss carryforwards may be used to offset current or future capital gains until expiration.
Income Tax Status
The Funds have adopted a policy in accordance with U.S. generally accepted accounting principles (“GAAP”) which requires management to consider accounting for the uncertainty of income taxes through the application of recognition and measurement criteria. The policy is designed to recognize the estimated taxes payable or refundable on tax returns for the current year as a tax liability or asset as well as recognize a deferred tax liability or asset for the estimated future tax effects attributable to temporary differences and carryforwards. This policy defines the threshold for recognizing the benefits of tax-return positions in the financial statements as “more-likely-than-not” to be sustained upon challenge by the taxing authority. The policy also requires management of the Funds to evaluate tax positions taken (or expected to be taken) in the Funds’ tax returns and requires measurement of a tax position meeting the more-likely-than-not criterion, based on the largest benefit that is more than 50 percent likely to be realized. As of September 30, 2009, tax years 2004 through 2008 remain subject to examination by major tax jurisdictions, which include the United States of America and the Commonwealth of Massachusetts, but the Funds have no examinations in progress. As of and during the six-month period September 30, 2009, the Funds did not have a liability for unrecognized tax benefits.
Distributions to Shareholders
The Funds record distributions to shareholders on the ex-dividend date. Distributions are determined in accordance with income tax regulations that may differ from generally accepted accounting principles. Accordingly, the Funds’ capital accounts are periodically reclassified to reflect income and gains available for distribution under income tax regulations. The Funds make income and capital gain distributions at least annually. Funds with income objectives make distributions either quarterly or monthly in accordance with the prospectuses.
NOTE D — TRANSACTIONS WITH AFFILIATES
Investment Advisory Fee
The Adviser receives a monthly fee at an annual rate based on the average daily net assets of the Funds. The investment advisory fee rates for each of the Funds is listed in the table below.
Administrative & Shareholder Services Fee
On January 24, 2006, the Funds entered into an Administration Agreement whereby the Funds pay for the administrative services they require under what is essentially an all-in fee structure. Class R shareholders of the Funds pay an administrative fee to the Adviser computed as a percentage of the Funds’ average net assets attributable in the aggregate to R shares. The Adviser, in turn, provides or procures administrative and shareholder services for Class R shareholders and also bears the costs of most third-party administrative services required by the Funds, including audit, custodial, portfolio accounting, legal, transfer agency and printing costs. The administrative fees paid to the Adviser may exceed the related costs.
15
NICHOLAS-APPLEGATE INSTITUTIONAL FUNDS
NOTES TO FINANCIAL STATEMENTS — (Unaudited) — Continued
The investment advisory and administrative services fees are charged at the following annual rates:
| Advisory Fee | Administration Fee* | |
| Fund | Class R | |
| U.S. Emerging Growth | 0.75% | 0.41% |
| U.S. Systematic Large Cap Growth | 0.45% | 0.64% |
| * | Excludes trustees’ fees and expenses, tax, brokerage and interest expenses, and extraordinary expenses |
The shareholder servicing fees are charged at the following rates:
| Fund | |
| U.S. Emerging Growth | 0.25% |
| U.S. Systematic Large Cap Growth | 0.25% |
Securities Lending Fees
The U.S. Systematic Large Cap Growth Fund participated in an agency securities lending program with an affiliated agent, Dresdner Bank AG, a direct subsidiary to Allianz AG and affiliate to the Trust (“Dresdner Program”). Income generated from the investment of cash collateral, less negotiated rebate fees paid to borrowers and transaction costs, is divided pursuant to the Dresdner Program Agency Agreement between the Funds and Dresdner Bank AG. The securities lending program ended with Dresdner Bank AG on April 1, 2009.
Trustee Compensation
Certain officers of the Trust are also officers of the Adviser and the Distributor. The Trustees who are not affiliated with the Adviser and attended all scheduled meetings will receive an annual compensation of approximately $36,000 each from the Trust, except for the chairman of the Board of Trustees of the Trust and the chairman of the Audit Committee, who will receive an annual compensation of approximately $42,000 and $42,500, respectively, from the Trust.
NOTE E — INVESTMENT TRANSACTIONS
The following table presents purchases and sales of securities, excluding short-term investments, during the period ended September 30, 2009, to indicate the volume of transactions in each Fund. The tax cost of securities held at September 30, 2009, and the related gross and net unrealized appreciation and depreciation, provide aggregate information on a tax basis against which future gains and losses on these investments are measured for distribution purposes.
| Net | ||||||||||||||||||||||||
| Gross | Gross | Unrealized | ||||||||||||||||||||||
| Unrealized | Unrealized | Appreciation | ||||||||||||||||||||||
| Purchases | Sales | Tax Cost | Appreciation | Depreciation | (Depreciation) | |||||||||||||||||||
| Fund | (in 000’s) | (in 000’s) | (in 000’s) | (in 000’s) | (in 000’s) | (in 000’s) | ||||||||||||||||||
| U.S. Emerging Growth | $ | 12,307 | $ | 8,627 | $ | 13,963 | $ | 3,448 | $ | (253 | ) | $ | 3,195 | |||||||||||
| U.S. Systematic Large Cap Growth | 5,687 | 3,903 | 4,493 | 946 | (33 | ) | 913 | |||||||||||||||||
NOTE F — FINANCIAL INSTRUMENTS
The Funds may be party to financial instruments with off balance sheet risks, including forward non-U.S. currency contracts and futures, primarily in an attempt to minimize the risk to the Fund in respect of its portfolio transactions. These instruments involve market and/or credit risk in excess of the amount recognized in the Statement of Assets and Liabilities. Risks arise from the possible inability of counterparties to meet the terms of their contracts and from unexpected movement in currencies, securities values and interest rates.
The contract amounts indicate the extent of the Funds’ involvement in such contracts. As of September 30, 2009, the Funds were not party to any such agreements.
NOTE G — FAIR VALUE OF FINANCIAL INSTRUMENTS
In accordance with GAAP, the Funds are required to disclose information regarding the fair value measurements of a Fund’s assets and liabilities. Fair value is the price that would be received to sell an asset or paid to transfer a liability in an orderly transaction between market participants at the measurement date. The disclosure requirement established a three-tier hierarchy to maximize the use of observable market data, minimize the use of unobservable inputs and establish classification of fair value measurements for disclosure purposes. Inputs refer broadly to the assumptions that market participants would use in pricing the asset or liability, including assumptions about risk; for example, the risk inherent in a particular valuation technique used to measure fair value including such a pricing model and/or the risk inherent in the inputs to the valuation technique. Inputs may be observable or unobservable. Observable inputs are inputs that reflect the assumptions market participants would use in pricing the asset or liability developed based on market data obtained from sources independent of the reporting entity. Unobservable inputs are inputs that reflect the reporting entity’s own assumptions about the assumptions market participants would use in pricing the asset or liability developed based on the best information available in the circumstances.
16
On June 15, 2009, the Funds adopted additional disclosure requirements which provide the reader of the financial statements additional guidance for estimating fair value when the volume and level of activity for the asset or liability have significantly decreased. Additional guidance on identifying circumstances that indicate a transaction is not orderly. The amended requirement emphasizes that even if there has been a significant decrease in the volume and level of activity for the asset or liability and regardless of the valuation technique(s) used, the objective of a fair value measurement remains the same. The three levels defined by the fair value measurement requirement hierarchy are as follows:
Level 1 — quoted prices in active markets for identical securities.
Level 2 — significant observable inputs (including quoted prices for similar securities, interest rates, prepayment speeds, credit risk, etc.).
Level 3 — significant unobservable inputs (including the Fund’s own assumptions in determining the fair value of investments).
In some instances, the inputs used to measure fair value might fall in different levels of the fair value hierarchy. The level in the fair value hierarchy within which the fair value measurement in its entirety falls is determined based on the lowest input level that is significant to the fair value measurement in its entirety. Because of the inherent uncertainties of valuation, the values reflected in the financial statements may materially differ from the value received upon actual sale of those investments.
The following table summarizes the valuation of each fund’s securities as of September 30, 2009, using the fair value hierarchy:
| Level 2 | Level 3 | |||||||||||||||
| Other Significant | Significant | |||||||||||||||
| Level 1 | Observable | Unobservable | Value at | |||||||||||||
| U.S. Emerging Growth | Quoted Prices | Inputs | Inputs | 9/30/2009 | ||||||||||||
| Investments in Securities — Assets | ||||||||||||||||
| Common Stock | 16,508,041 | — | — | 16,508,041 | ||||||||||||
| Limited Partnerships | 105,056 | — | — | 105,056 | ||||||||||||
| Short-Term Investments | 544,711 | — | — | 544,711 | ||||||||||||
| Total Investments in Securities — Assets | 17,157,808 | — | — | 17,157,808 | ||||||||||||
| Level 2 | Level 3 | |||||||||||||||
| Other Significant | Significant | |||||||||||||||
| Level 1 | Observable | Unobservable | Value at | |||||||||||||
| U.S. Systematic Large Cap Growth | Quoted Prices | Inputs | Inputs | 9/30/2009 | ||||||||||||
| Investments in Securities — Assets | ||||||||||||||||
| Common Stock | 5,405,545 | — | — | 5,405,545 | ||||||||||||
| Short-Term Investments | — | — | — | — | ||||||||||||
| Total Investments in Securities — Assets | 5,405,545 | — | — | 5,405,545 | ||||||||||||
NOTE H — MARKET PRICE RISK
The prices of securities held by the Funds may decline in response to certain events, including those directly involving the companies whose securities are owned by the Funds; conditions affecting the general economy; overall market changes; local, regional or global political, social or economic instability; and currency and interest rate fluctuations. The growth-oriented, equity-type securities generally purchased by the Funds may involve large price swings and potential for loss.
Investments in securities issued by entities based outside the United States may be subject to the risks described above to a greater extent and may also be affected by currency controls; different accounting, auditing, financial reporting, and legal standards and practices in some countries; expropriation; changes in tax policy; greater market volatility; differing securities market structures; higher transaction costs; and various administrative difficulties, such as delays in clearing and settling portfolio transactions or in receiving payment of dividends. These risks may be heightened in connection with investments in developing countries.
17
NICHOLAS-APPLEGATE INSTITUTIONAL FUNDS
NOTES TO FINANCIAL STATEMENTS — (Unaudited) — Continued
NOTE I — NEW ACCOUNTING PRONOUNCEMENTS
In accordance with GAAP, the Funds are required to disclose certain information regarding derivative instruments and hedging activities. The Funds are required to provide enhanced disclosures about the use of and accounting for derivative instruments using a tabular format. Disclosing the fair values of derivative instruments and their gains and losses in a tabular format should provide a more complete picture of the location in an entity’s financial statements of both the derivative positions existing at period end and the effect of using derivatives during the reporting period. Disclosing information about credit-risk-related contingent features should provide information on the potential effect on an entity’s liquidity from using derivatives. Finally, the additional disclosure affords the reader the ability to cross-reference the information within the footnotes, which should help users of financial statements locate important information about derivative instruments. As of September 30, 2009, the Funds did not hold any derivative instruments.
NOTE J — SIGNIFICANT SHAREHOLDER CONCENTRATION
As of September 30, 2009, the Funds had a single shareholder and/or omnibus shareholder accounts (which are comprised of a group of individual shareholders), which individually amounted to more than 10% of the total shares outstanding of a Fund as detailed below.
| Number of | ||
| Fund | % of Fund | Shareholders |
| U.S. Emerging Growth | 81.39% | 3 |
| U.S. Systematic Large Cap Growth | 82.95% | 1 |
NOTE K — EVALUATION OF SUBSEQUENT EVENTS
In accordance with GAAP, the Funds are required to recognize in the financial statements the effects of all subsequent events that provide additional evidence about conditions that existed at the date of the balance sheet, including the estimates inherent in the process of preparing financial statements. In preparing these financial statements, the Funds have evaluated events and transactions for potential recognition or disclosure through November 30, 2009, the date the financial statements were issued.
On November 13, 2009, the Board approved a Plan of Reorganization with respect to each of the Nicholas-Applegate Institutional Funds. Shareholders of each Institutional Fund will be asked to approve the Plan on behalf of the fund at a special meeting of shareholders.
The Board also approved, on November 13, 2009, a Plan of Liquidation providing for the liquidation and dissolution of the Nicholas-Applegate International Systematic Fund.
18
SHAREHOLDER EXPENSE EXAMPLE — (Unaudited)
As a shareholder of a Fund, you incur two types of costs: (1) transaction costs, including redemption fees, and (2) ongoing costs, including management fees and other Fund expenses. This example is intended to help you understand your ongoing costs (in dollars) of investing in the Funds and to compare these costs with the ongoing costs of investing in other mutual funds.
The example is based on an investment of $1,000 invested at the beginning of the period and held for the entire period (April 1, 2009 to September 30, 2009).
ACTUAL EXPENSES
The first line of the table below for each Fund provides information about actual account values and actual expenses. You may use the information in this line, together with the amount you invested, to estimate the expenses that you paid over the period. Simply divide your account value by $1,000 (for example, an $8,600 account value divided by $1,000 = 8.6), then multiply the result by the number in the first line for a Fund under the heading “Expenses Paid During Period” to estimate the expenses you paid on your account during this period.
HYPOTHETICAL EXAMPLE FOR COMPARISON PURPOSES
The second line of the table below for each Fund provides information about hypothetical account values and hypothetical expenses based on a Fund’s actual expense ratio and an assumed rate of return of 5% per year before expenses, which is not the Fund’s actual return. The hypothetical account values and expenses may not be used to estimate the actual ending account balance or expenses you paid for the period. You may use this information to compare the ongoing costs of investing in a Fund and other funds. To do so, compare this 5% hypothetical example with the 5% hypothetical examples that appear in the shareholder reports of the other funds.
Please note that the expenses shown in the table are meant to highlight your ongoing costs only and do not reflect any transaction costs. Therefore, the second line of the table is useful in comparing ongoing costs only, and will not help you determine the relative total costs of owning different funds. In addition, if these transactional costs were included, your costs would have been higher.
| Expenses Paid | ||||||||||||||||
| Beginning Account | Ending Account | During the Period* | ||||||||||||||
| Value | Value | April 1, 2009 to | Annualized | |||||||||||||
| April 1, 2009 | September 30, 2009 | September 30, 2009 | Expense Ratio | |||||||||||||
| U.S. Emerging Growth — Class R | ||||||||||||||||
| Actual | $ | 1,000.00 | $ | 1,568.50 | $ | 9.21 | 1.43 | % | ||||||||
| Hypothetical (5% return before expenses) | $ | 1,000.00 | $ | 1,017.90 | $ | 7.23 | 1.43 | % | ||||||||
| U.S. Systematic Large Cap Growth — Class R | ||||||||||||||||
| Actual | $ | 1,000.00 | $ | 1,243.40 | $ | 7.65 | 1.36 | % | ||||||||
| Hypothetical (5% return before expenses) | $ | 1,000.00 | $ | 1,018.25 | $ | 6.88 | 1.36 | % | ||||||||
* Expenses are equal to the Fund’s annualized expense ratio, multiplied by the average account value over the period. | |||||||
19
SUPPLEMENTARY INFORMATION — (Unaudited)
PROXY VOTING
The Adviser votes proxies on behalf of the Funds pursuant to written policies and procedures adopted by the Funds. To obtain free information on how your Funds’ securities were voted, please call the Funds at 1-800-551-8043 or visit the Funds’ website at www.nacm.com. You may also view how the Fund’s securities were voted by visiting the Securities & Exchange Commission’s (the “SEC”) website at www.sec.gov. Additionally, information regarding each Fund’s proxy voting record for the most recent twelve month period ended June 30 is also available, free of charge, by calling the Funds at 1-800-551-8043 and from the SEC’s website at www.sec.gov.
20
SUPPLEMENTARY INFORMATION — (Unaudited) — Continued
CORPORATE GOVERNANCE
| Name, Address (1) | |
| Age | Principal Occupation(s) During Past 5 Years |
| Position(s) Held with Fund | Other Directorship Held by Trustee |
| Length of Time Served (2) | Number of Portfolios in Fund complex Overseen by Trustee |
| Independent Trustees:: | |
Darlene T. DeRemer 11/27/1955 Chairperson of the Board Since August 2007 & Trustee Since May 1999 | Principal Occupations: Partner, Grail Partners LLC (since 2005); Managing Director, Putnam Lovell NBF Private Equity (2004-2005); Managing Director, NewRiver E-Business Advisory Services Division (2000-2003); Prior to, President and Founder, DeRemer Associates, a strategic and marketing consulting firm for the financial services industry (since 1987); Vice President and Director, Asset Management Division, State Street Bank and Trust Company, now referred to as State Street Global Advisers (1982-1987); Vice President, T. Rowe Price & Associates (1979-1982); Member, Boston Club (since 1998); Member, Financial Women’s Association Advisory Board (since 1995); Founder, Mutual Fund Cafe Website. Other Directorships Held: Founding Member and Director, National Defined Contribution Council (since 1997); Trustee, Boston Alzheimer’s Association (since 1998); Director, King’s Wood Montessori School (since 1995); Editorial Board, National Association of Variable Annuities (since 1997); Director, Nicholas-Applegate Strategic Opportunities, Ltd. (1994-1997); Trustee, Nicholas-Applegate Mutual Funds (1994-1999); Director, Jurika & Voyles Fund Group (since 1994-2000); Trustee, Barnwell Funds (2003-2005); Director, Independent Director Council (since 2004); Mutual Fund Director’s Council-Advisory Board; Board Member-Chatman Partners; Board Member-X-Shares LLC. Number of Portfolios Overseen by Trustee: 12 |
John J. Murphy 4/8/1944 Trustee Since September 2005 | Principal Occupations: Founder and senior principal, Murphy Capital Management. Other Directorships Held: Director, Smith Barney Multiple Discipline Trust; Director, Barclays International Funds Group Ltd. and affiliated companies; Smith Barney Consulting Group; Legg Mason Equity Funds. Number of Portfolios Overseen by Trustee: 12 |
Bradford K. Gallagher 2/24/1944 Trustee Since August 2007 | Principal Occupations: Founder, Spyglass Investments LLC (a private investment vehicle) (since 2001); Founder, President and CEO of CypressTree Investment Management Company and Annuity Company; Managing Director, Fidelity Investments. Other Directorships Held: Trustee, The Common Fund (since 2005); Director, Anchor Point Inc. (since 1995); Chairman and Trustee, Atlantic Maritime Heritage Foundation (since 2007); Director, Shielding Technology Inc. (since 2006); Director, United Way of Eastern Massachusetts (1988-1990); Director, Ouimet Scholarship Fund (1993-2005); Director, Emerson Hospital (1995-2005). Number of Portfolios Overseen by Trustee: 12 |
Steven Grenadier 12/14/1964 Trustee Since August 2007 | Principal Occupations: William F. Sharpe Professor of Financial Economics, Stanford University Graduate School of Business; Research Associate, National Bureau of Economic Research (since 2002); Chairman of the Finance Department, Stanford University Graduate School of Business (2004-2006). Other Directorships Held: Independent Trustee, E Trade Funds. Number of Portfolios Overseen by Trustee: 12 |
| Interested Trustees: | |
Horacio A. Valeiras 1/8/1959 President & Trustee Since August 2004 | Principal Occupations: Managing Director (since 2004) and Chief Investment Officer, Nicholas-Applegate Capital Management, Nicholas-Applegate Securities (since 2002); Chief Investment Officer; Oppenheimer and AGI Management Partners (since 2008); Managing Director of Morgan Stanley Investment Management, London (1997-2002); Head of International Equity and Asset Allocation, Miller Anderson & Sherred; Director and Chief of Investment Strategies, Credit Suisse First Boston. Other Directorships Held: Trustee, The Bishops School (since 2002); Trustee, San Diego Rowing Club (since 2002). Number of Portfolios Overseen by Trustee: 12 |
Arthur B. Laffer 8/14/1940 Trustee Since August 2007 | Principal Occupations: Chairman, Laffer Associates (economic consulting) (since 1979); Chairman, Laffer Advisors Inc. (registered broker-dealer) (since 1981); Chairman, Laffer Investments (asset management) (since 2000); Member, Congressional Policy Advisory Board (since 1998); Distinguished University Professor and Director, Pepperdine University (1985-1988); Professor of Business Economics, University of Southern California (1976-1984); Associate Professor of Business Economics, University of Chicago (1967-1976). Other Directorships Held: Director of MPS Group, Inc. (NYSE:MPS) (since 2003); Director, Petco Animal Supplies, Inc. (NASDAQ:PETC) (2002-2005); Director, Oxigene Inc. (NASDAQ:OXGN), biopharmaceutical company (since 1998); Director of Provide Commerce (NASDAQ: PRVD) (since 1998); Director, Veolia Environmental Corporation (successor to U.S. Filter Corporation) (water purification) (1991-2006); Director, Nicholas-Applegate Fund, Inc. (1987-2007). Number of Portfolios Overseen by Trustee: 12 |
21
SUPPLEMENTARY INFORMATION — (Unaudited) — Continued
CORPORATE GOVERNANCE
| Name, Address (1) | |
| Age | Principal Occupation(s) During Past 5 Years |
| Position(s) Held with Fund | Other Directorship Held by Officer |
| Length of Time Served (2) | Number of Portfolios in Fund complex Overseen by Officer |
| Officers: | |
Charles H. Field, Jr. 7/24/1955 Secretary and Chief Compliance Officer Since May 2002 | Managing Director and General Counsel, Nicholas-Applegate Capital Management (since 1996); Chief Legal Officer of Oppenheimer Capital Management LLC (since 2009), Chief Legal Officer of Allianz Global Investors Management Partners LLC (since 2009); and Chief Legal Officer of Allianz Global Investors Solutions LLC (since 2009). Prior to joining Nicholas-Applegate in 1996, Mr. Field was an attorney for Federated Investors (1991-1996) and an attorney for Unified Management Corp. (1987-1991). Other Directorships Held: NA Number of Portfolios Overseen by Officer: 12 |
Deborah A. Wussow 1/31/1960 Treasurer and Assistant Secretary Since August 2006 | Senior Vice President, Chief Compliance Officer, Nicholas-Applegate Capital Management, LLC (since 2008); Chief Compliance Officer, Oppenheimer Capital Management, LLC (since April 2009); Chief Compliance Officer, Allianz Global Investors Management Partners, LLC (since 2009); Chief Compliance Officer, Allianz Solutions, LLC (since 2009); Deputy Chief Compliance Officer, Nicholas-Applegate Capital Management, LLC (2004-2008); Compliance Officer; Nicholas-Applegate Capital Management (1995-2004). Other Directorships Held: NA Number of Portfolios Overseen by Officer: 12 |
| (1) | Unless otherwise noted, the address of the Trustees and Officers is c/o: Nicholas-Applegate Capital Management, 600 West Broadway, 32nd Floor, San Diego, California 92101. |
| (2) | Each Trustee serves for an indefinite term, until her or his successor is elected. |
22
TRUSTEES OF NICHOLAS-APPLEGATE INSTITUTIONAL FUNDS
Darlene T. DeRemer, Chairperson
Horacio A. Valeiras
John J. Murphy
Bradford K. Gallagher
Steven Grenadier
Arthur B. Laffer
OFFICERS
Horacio A Valeiras, President
Charles H. Field, Jr., Secretary & Chief Compliance Officer
Deborah A. Wussow, Treasurer & Assistant Secretary
INVESTMENT ADVISER
Nicholas-Applegate Capital Management
DISTRIBUTOR
Nicholas-Applegate Securities
CUSTODIAN
Brown Brothers Harriman & Co., Private Bankers
TRANSFER AGENT
UMB Fund Services Group, Inc.
INDEPENDENT REGISTERED PUBLIC ACCOUNTING FIRM
PricewaterhouseCoopers LLP
| 600 West Broadway San Diego, California 92101 800.551.8043 |
Item 2. Code of Ethics.
Not required for this semi-annual report on Form N-CSR.
Item 3. Audit Committee Financial Expert.
Not required for this semi-annual report on Form N-CSR.
Item 4. Principal Accountant Fees and Services.
Not required for this semi-annual report on Form N-CSR.
Item 5. Audit Committee of Listed Registrants.
Not applicable.
Item 6. Investments.
This schedule is included as part of the report to shareholders filed under Item 1 of this Form N-CSR.
Item 7. Disclosure of Proxy Voting Policies and Procedures for Closed-End Management Investment Companies.
Not applicable.
Item 8. Portfolio Managers of Closed-End Management Investment Companies.
Not applicable.
Item 9. Purchases of Equity Securities by Closed-End Management Investment Company and Affiliated Purchasers.
Not applicable.
Item 10. Submission of Matters to a Vote of Security Holders.
There have been no material changes to the procedures by which the shareholders may recommend nominees to the registrant’s board of trustees, where those changes were implemented after the registrant last provided disclosure in response to the requirements of Item 407(c)(2)(iv) of Regulation S-K (as required by Item 22(b)(15) of Schedule 14A), or this Item.
Item 11. Controls and Procedures.
(a) The registrant’s principal executive and financial officers have concluded that the registrant's disclosure controls and procedures (as defined in Rule 30a-3(c) under the Investment Company Act of 1940, as amended (the “1940 Act”)) are effective, as of a date within 90 days of the filing date of this Form N-CSR, based on their evaluation of these controls and procedures required by Rule 30a-3(b) under the 1940 Act and Rules 13a-15(b) or 15d-15(b) under the Securities Exchange Act of 1934, as amended (the “Exchange Act”).
(b) There were no changes in the registrant's internal control over financial reporting (as defined in Rule 30a-3(d) under the 1940 Act) that occurred during the registrant's second fiscal quarter of the period covered by this Form N-CSR, that have materially affected, or are reasonably likely to materially affect, the registrant's internal control over financial reporting.
Item 12. Exhibits.
(a)(1) Not required for this semi-annual report on Form N-CSR.
(a)(2) A separate certification for each principal executive officer and principal financial officer of the registrant as required by Rule 30a-2(a) under the 1940 Act is filed as Exhibit 12(a)(2) to this Form N-CSR.
(a)(3) Not applicable.
(b) The certifications required by Rule 30a-2(b) under the 1940 Act, Rule 13a-14(b) or Rule 15d-14(b) under the Exchange Act, and Section 1350 of Chapter 63 of Title 18 of the United States Code are furnished as Exhibit 12(b) to this Form N-CSR.
SIGNATURES
Pursuant to the requirements of the Securities Exchange Act of 1934 and the Investment Company Act of 1940, the registrant has duly caused this report to be signed on its behalf by the undersigned, thereunto duly authorized.
(Registrant) Nicholas-Applegate Institutional Funds
By: (Signature and Title)
/s/ Horacio A. Valeiras
Horacio A. Valeiras
Title: President (Principal Executive Officer) and Trustee
Date: December 4, 2009
Pursuant to the requirements of the Securities Exchange Act of 1934 and the Investment Company Act of 1940, this report has been signed below by the following persons on behalf of the registrant and in the capacities and on the dates indicated.
By: (Signature and Title)
/s/ Horacio A. Valeiras
Horacio A. Valeiras
Title: President (Principal Executive Officer) and Trustee
Date: December 4, 2009
By: (Signature and Title)
/s/ Deborah A. Wussow-Hammalian
Deborah A. Wussow-Hammalian
Title: Treasurer (Principal Financial Officer and Principal Accounting Officer)
Date: December 4, 2009