UNITED STATES
SECURITIES AND EXCHANGE COMMISSION
Washington, D.C. 20549
FORM N-CSR
CERTIFIED SHAREHOLDER REPORT OF REGISTERED
MANAGEMENT INVESTMENT COMPANIES
Investment Company Act file number | 811-7396 |
|
Western Asset Managed High Income Fund Inc. |
(Exact name of registrant as specified in charter) |
|
55 Water Street, New York, NY | | 10041 |
(Address of principal executive offices) | | (Zip code) |
|
Robert I. Frenkel, Esq. Legg Mason & Co., LLC 100 First Stamford Place Stamford, CT 06902 |
(Name and address of agent for service) |
|
Registrant’s telephone number, including area code: | (888) 777-0102 | |
|
Date of fiscal year end: | February 28 | |
|
Date of reporting period: | February 28, 2011 | |
| | | | | | | | |
ITEM 1. REPORT TO STOCKHOLDERS.
The Annual Report to Stockholders is filed herewith.
February 28, 2011 | 
|
Annual Report
Western Asset Managed High Income Fund Inc.
(MHY)
INVESTMENT PRODUCTS: NOT FDIC INSURED · NO BANK GUARANTEE · MAY LOSE VALUE |
II | | Western Asset Managed High Income Fund Inc. | | |
Fund objectives
The Fund’s primary investment objective is high current income. Capital appreciation is a secondary objective.
What’s inside
Letter from the chairman | | II |
| | |
Investment commentary | | III |
| | |
Fund overview | | 1 |
| | |
Fund at a glance | | 7 |
| | |
Spread duration | | 8 |
| | |
Effective duration | | 9 |
| | |
Schedule of investments | | 10 |
| | |
Statement of assets and liabilities | | 26 |
| | |
Statement of operations | | 27 |
| | |
Statements of changes in net assets | | 28 |
| | |
Financial highlights | | 29 |
| | |
Notes to financial statements | | 30 |
| | |
Report of independent registered public accounting firm | | 40 |
| | |
Board approval of management and subadvisory agreements | | 41 |
| | |
Additional information | | 48 |
| | |
Annual chief executive officer and chief financial officer certifications | | 54 |
| | |
Dividend reinvestment plan | | 55 |
| | |
Important tax information | | 57 |
| | |
Letter from the chairman | 
|
Dear Shareholder,
We are pleased to provide the annual report of Western Asset Managed High Income Fund Inc. for the twelve-month reporting period ended February 28, 2011. Please read on for a detailed look at prevailing economic and market conditions during the Fund’s reporting period and to learn how those conditions have affected Fund performance.
As always, we remain committed to providing you with excellent service and a full spectrum of investment choices. We also remain committed to supplementing the support you receive from your financial advisor. One way we accomplish this is through our website, www.leggmason.com/cef. Here you can gain immediate access to market and investment information, including:
· Fund prices and performance,
· Market insights and commentaries from our portfolio managers, and
· A host of educational resources.
We look forward to helping you meet your financial goals.
Sincerely,

R. Jay Gerken, CFA
Chairman, President and Chief Executive Officer
March 25, 2011
| | Western Asset Managed High Income Fund Inc. | | III |
Investment commentary
Economic review
While economic reports remained mixed, the U.S. economy continued to expand over the twelve months ended February 28, 2011. During the fourth quarter of 2010, fears regarding moderating economic growth were replaced with optimism for a strengthening economy in 2011. With investor sentiment improving, rising interest rates negatively impacted some sectors of the fixed-income market. All told, investors who took on additional risk in their portfolios during the reporting period were generally rewarded.
Although the U.S. Department of Commerce continued to report positive U.S. gross domestic product (“GDP”)i growth, the expansion has moderated since peaking at 5.0% in the fourth quarter of 2009. A slower drawdown in business inventories and renewed consumer spending were contributing factors spurring the economy’s solid growth at the end of 2009. However, the economy grew at a more modest pace in 2010. According to the Commerce Department, GDP growth was 3.7%, 1.7%, 2.6% and 3.1% during the first, second, third and fourth quarters of 2010, respectively. For calendar 2010 as whole, the economy expanded 2.9%.
Turning to the job market, the unemployment rate moved lower during the last three months of the reporting period, though it remained elevated. The unemployment rate fell to 9.4% in December 2010 and 9.0% in January 2011. It then dipped to 8.9% in February, marking the first time the unemployment rate was below 9.0% since April 2009. This favorable trend, however, did not mean that all was well in the labor market. The U.S. Department of Labor reported in February 2011 that approximately 13.7 million Americans looking for work have yet to find a job, and almost 44% of these individuals have been out of work for more than six months. In addition, while the Federal Reserve Board (“Fed”)ii believes that unemployment will continue to decline, it projects that it will remain relatively high, between 7.5% and 8.0% at the end of 2012.
The long-ailing housing market continued to show some signs of strains during the reporting period. Looking back, sales increased in the spring of 2010 largely due to the government’s $8,000 tax credit for first-time home buyers. However, this proved to be only a temporary boost, as sales subsequently weakened after the tax credit expired at the end of April. Existing-home sales did rebound somewhat toward the end of 2010 and in January 2011, as mortgage rates remained relatively low. According to the National Association of Realtors (“NAR”), existing-home sales increased 3.4% in January 2011. However, home sales then declined 9.6% in February and the inventory of unsold homes was an 8.6 month supply at the current sales level, versus a 7.5 month supply in January. In addition, existing-home prices remained disappointingly low, with the NAR reporting that the median existing-home price for all housing types was $156,100 in February 2011, down 5.2% from February 2010.
The manufacturing sector was one area of the economy that remained relatively strong during the reporting period. Based on the Institute for Supply Management’s PMIiii, the manufacturing sector has grown nineteen consecutive months since it began expanding in August 2009. After reaching a six-year peak of 60.4 in March 2010 (a reading below 50 indicates a contraction, whereas a reading above 50 indicates an expansion), PMI data indicated
IV | | Western Asset Managed High Income Fund Inc. | | |
Investment commentary (cont’d)
somewhat more modest growth during the next nine months. However, in January 2011, the manufacturing sector expanded at its fastest pace since May 2004, with a reading of 60.8 versus 58.5 for the previous month. There was further strengthening in February, with a reading of 61.4.
Financial market overview
The financial markets experienced several periods of volatility during the reporting period that tested the resolve of novice and experienced investors alike. During most of the first two months of the reporting period, the financial markets were largely characterized by healthy investor risk appetite and solid results by stocks and lower-quality bonds. The market then experienced sharp sell-offs in late April and in May, and again in mid-November and mid-February 2011. During those periods, investors tended to favor the relative safety of U.S. Treasury securities. However, these setbacks proved to be only temporary and, in each case, risk aversion was replaced with solid demand for riskier assets.
Due to signs that certain areas of the economy were moderating early in the reporting period, the Fed took further actions to spur the economy. At its August 10th meeting, the Fed announced an ongoing program that calls for using the proceeds from expiring agency debt and agency mortgage-backed securities to purchase longer-dated Treasury securities.
In addition, the Fed remained cautious throughout the reporting period given pockets of weakness in the economy. At its meeting in September 2010, the Fed said, “The Committee will continue to monitor the economic outlook and financial developments and is prepared to provide additional accommodation if needed to support the economic recovery. . . .” This led to speculation that the Fed may again move to purchase large amounts of agency and Treasury securities in an attempt to avoid a double-dip recession and ward off deflation.
The Fed then took additional action in early November 2010. Citing that “the pace of recovery in output and employment continues to be slow,” the Fed announced another round of quantitative easing to help stimulate the economy, entailing the purchase of $600 billion of long-term U.S. Treasury securities by the end of the second quarter of 2011. This, coupled with the Fed’s previously announced program to use the proceeds of expiring securities to purchase Treasuries, means it could buy a total of $850 billion to $900 billion of Treasury securities by the end of June 2011. At its meeting in March 2011, the Fed said it “will maintain the target range for the federal funds rateiv at 0 to 1/4 percent and continues to anticipate that economic conditions, including low rates of resource utilization, subdued inflation trends, and stable inflation expectations, are likely to warrant exceptionally low levels for the federal funds rate for an extended period.”
Fixed-income market review
Nearly every spread sector (non-Treasury) outperformed equal-durationv Treasuries during most of the first two months of the reporting period. Over that time, investor confidence was high given encouraging economic data, continued low interest rates, benign inflation and rebounding corporate profits. The spread sectors then took a step backward toward the end of April and during the month of May due to the escalating sovereign debt crisis in Europe, uncertainties regarding new financial reforms in the U.S. and some worse-than-expected economic data.
| | Western Asset Managed High Income Fund Inc. | | V |
Most spread sectors then produced positive absolute returns in June and July, as investor demand for these securities again increased. There was another bout of risk aversion in August, given fears that the economy may slip back into a recession. However, due to expectations for additional quantitative easing, most spread sectors rallied in September and October. The spread sectors started to weaken again toward the middle of November as the European sovereign debt crisis again took center stage. While several spread sectors regained their footing during much of the last three months of the reporting period, others remained weak given ongoing uncertainties in Europe, concerns regarding economic growth in China and its potential impact on the global economy, and geopolitical unrest in Egypt and Libya.
Both short- and long-term Treasury yields fluctuated but, overall, moved lower during the twelve months ended February 28, 2011. When the period began, two- and ten-year Treasury yields were 0.81% and 3.61%, respectively. On April 5, 2010, two- and ten-year Treasury yields peaked at 1.18% and 4.01%, respectively. Subsequent to hitting their highs for the period, yields largely declined during much of the next six months, with two-year Treasuries hitting their low for the reporting period of 0.33% on November 4, 2010. Ten-year Treasuries reached their reporting period trough of 2.41% in early October. Yields then moved sharply higher given expectations for stronger growth in 2011 and the potential for rising inflation. However, yields declined again beginning in mid-February as there was another “flight to quality” due to the conflict in Libya. When the period ended on February 28, 2011, two-year Treasury yields were 0.69% and ten-year Treasury yields were 3.42%. For the twelve months ended February 28, 2011, the Barclays Capital U.S. Aggregate Indexvi returned 4.93%.
The U.S. high-yield bond market produced strong results during the reporting period. The asset class posted positive returns during each month, except for May and November 2010 when risk aversion rose sharply. The high-yield market was supported by better-than-expected corporate profits and overall strong investor demand. All told, the Barclays Capital U.S. High Yield — 2% Issuer Cap Indexvii returned 17.34% for the twelve months ended February 28, 2011.
Emerging market debt posted solid results for the twelve months ended February 28, 2011. The asset class posted positive returns during seven of the first eight months of the reporting period. This was the result of strong economic growth in many emerging market countries, solid domestic demand and overall robust investor demand. However, a portion of these gains was given back as the asset class posted negative returns during three of the last four months of the period. During that time, emerging market debt prices were negatively impacted by concerns over China’s ability to orchestrate a “soft landing” for its economy, as well as increased geopolitical unrest in the Middle East and Libya. All told, the JPMorgan Emerging Markets Bond Index Global (“EMBI Global”)viii returned 9.79% over the twelve months ended February 28, 2011.
VI | | Western Asset Managed High Income Fund Inc. | | |
Investment commentary (cont’d)
As always, thank you for your confidence in our stewardship of your assets.
Sincerely,

R. Jay Gerken, CFA
Chairman, President and
Chief Executive Officer
March 25, 2011
All investments are subject to risk including the possible loss of principal. Past performance is no guarantee of future results. All index performance reflects no deduction for fees, expenses or taxes. Please note that an investor cannot invest directly in an index.
i Gross domestic product (“GDP”) is the market value of all final goods and services produced within a country in a given period of time.
ii The Federal Reserve Board (“Fed”) is responsible for the formulation of policies designed to promote economic growth, full employment, stable prices and a sustainable pattern of international trade and payments.
iii The Institute for Supply Management’s PMI is based on a survey of purchasing executives who buy the raw materials for manufacturing at more than 350 companies. It offers an early reading on the health of the manufacturing sector.
iv The federal funds rate is the rate charged by one depository institution on an overnight sale of immediately available funds (balances at the Federal Reserve) to another depository institution; the rate may vary from depository institution to depository institution and from day to day.
v Duration is the measure of the price sensitivity of a fixed-income security to an interest rate change of 100 basis points. Calculation is based on the weighted average of the present values for all cash flows.
vi The Barclays Capital U.S. Aggregate Index is a broad-based bond index comprised of government, corporate, mortgage- and asset-backed issues, rated investment grade or higher, and having at least one year to maturity.
vii The Barclays Capital U.S. High Yield — 2% Issuer Cap Index is an index of the 2% Issuer Cap component of the Barclays Capital U.S. Corporate High Yield Index, which covers the U.S. dollar-denominated, non-investment grade, fixed-rate, taxable corporate bond market.
viii The JPMorgan Emerging Markets Bond Index Global (“EMBI Global”) tracks total returns for U.S. dollar-denominated debt instruments issued by emerging market sovereign and quasi-sovereign entities: Brady bonds, loans, Eurobonds and local market instruments.
| | Western Asset Managed High Income Fund Inc. 2011 Annual Report | | 1 |
Fund overview
Q. What is the Fund’s investment strategy?
A. As a primary investment objective, the Fund seeks high current income. Capital appreciation is a secondary objective. The Fund invests primarily in high-yield corporate bonds, debentures and notes. The managers employ an actively managed approach that assimilates top-down macroeconomic views with industry sector insights and bottom-up credit research to derive the general framework for the Fund’s predominantly non-investment grade credit mandate. This framework provides the foundation for how the portfolio is positioned with respect to risk (aggressive, neutral, conservative) as well as identifying sector overweights and underweights. Risk and weightings are reviewed on a regular basis. The bottom-up process provides the basis for populating the targeted industry weightings through individual credit selection. Analysts work closely with the portfolio managers to determine which securities provide the best risk/reward relationship within their respective sectors. The research team focuses on key fundamental measures such as leverage, cash flow adequacy, liquidity, amortization schedule, underlying asset value and management integrity/track record.
At Western Asset Management Company (“Western Asset”), the Fund’s subadviser, we utilize a fixed-income team approach, with decisions derived from interaction among various investment management sector specialists. The sector teams are comprised of Western Asset’s senior portfolio managers, research analysts and an in-house economist. Under this team approach, management of client fixed-income portfolios will reflect a consensus of interdisciplinary views within the Western Asset organization. The portfolio managers responsible for development of investment strategy, day-to-day portfolio management, oversight and coordination of the Fund are Stephen A. Walsh, S. Kenneth Leech, Michael C. Buchanan and Keith J. Gardner.
Q. What were the overall market conditions during the Fund’s reporting period?
A. During the twelve months ended February 28, 2011, the riskier segments of the fixed-income market produced strong results and outperformed U.S. Treasuries. This was due, in part, to improving economic conditions following the lengthy downturn from mid-2008 through mid-2009. Also supporting the spread sectors (non-U.S. Treasuries) was overall solid demand from investors seeking incremental yields given the low rates available from short-term fixed-income securities.
While the spread sectors rallied during most of the reporting period, there were several notable exceptions when investor risk aversion increased. A “flight to quality” began in late April 2010, triggered by concerns regarding the escalating sovereign debt crisis in Europe. In addition, investor sentiment was negatively impacted by uncertainties surrounding financial reform legislation in the U.S. and signs that economic growth was moderating. Collectively, this caused investors to flock to the relative safety of Treasury securities, driving their yields lower and prices higher.
Robust investor risk appetite largely resumed in June and July, and again in September and October. These
2 | | Western Asset Managed High Income Fund Inc. 2011 Annual Report | | |
Fund overview (cont’d)
turnarounds occurred as the situation in Europe appeared to stabilize, the U.S. financial reform bill was signed into law and the Federal Reserve Board (“Fed”)i continued to indicate that it would keep short-term rates low for an extended period. Investor risk aversion returned briefly in November when fears regarding the European debt crisis re-emerged. While investor sentiment improved in December given expectations for strengthening economic conditions in 2011, there was another flight to quality in mid-February. This occurred against a backdrop of increased unrest in Libya and sharply rising oil prices.
The yields on two- and ten-year Treasuries began the fiscal year at 0.81% and 3.61%, respectively. Treasury yields fluctuated during the twelve-month reporting period given mixed signals regarding the economy and uncertainties regarding Fed monetary policy. Yields moved sharply lower in October 2010 in anticipation of additional quantitative easing (“QE2”) by the Fed. Yields then generally rose from November through mid-February as certain economic data were stronger than expected and there were concerns regarding future inflation. Yields then declined at the end of the period given increased geopolitical unrest. During the fiscal year, two-year Treasury yields moved as high as 1.18% and as low as 0.33%, while ten-year Treasury yields rose as high as 4.01% and fell as low as 2.41%. On February 28, 2011, yields on two- and ten-year Treasuries were 0.69% and 3.42%, respectively.
The Barclays Capital U.S. Aggregate Indexii returned 4.93% for the twelve months ended February 28, 2011. Comparatively, riskier fixed-income securities, including high-yield bonds, produced stronger results. Over the fiscal year, the Barclays Capital U.S. High Yield — 2% Issuer Cap Indexiii (the “Index”) returned 17.34%. During this period, as measured by the Index, lower-quality CCC-rated bonds outperformed higher-quality BB-rated securities, returning 20.05% and 15.77%, respectively.
Q. How did we respond to these changing market conditions?
A. A number of adjustments were made to the Fund during the reporting period. While the Fund maintained its lower-quality bias versus the Index, we pared our exposure to certain lower-quality CCC-rated securities to capture profits during the fiscal year. We also reduced the Fund’s underweight exposure to BB-rated bonds, which generated solid results during periods of increased investor risk aversion and increased demand from investment grade corporate portfolio managers looking for additional yield. While we maintained an underweight to BB-rated bonds, we targeted issuers that our research team felt had potential to be upgraded to investment grade.
From a sector positioning perspective, the Fund’s exposure to Utilities was reduced to pursue what we felt were more attractive opportunities elsewhere. We added to the Fund’s position in the Information Technology (“IT”) sector in order to increase our exposure to more cyclical areas of the market that we felt were experiencing improved fundamental performance.
| | Western Asset Managed High Income Fund Inc. 2011 Annual Report | | 3 |
We actively participated in the new issue market by selectively purchasing high-yield corporate bonds from a variety of sectors. Toward the end of the fiscal year, we added to the Fund’s cash position. This was done as a defensive measure in the event that there were a pullback in the market, as well as to have added flexibility to pursue attractive opportunities in the new issue market.
The Fund employed U.S. Treasury futures during the reporting period to manage its yield curveiv positioning and durationv. The use of these derivative instruments was a slight detractor from performance.
Performance review
For the twelve months ended February 28, 2011, Western Asset Managed High Income Fund Inc. returned 19.31% based on its net asset value (“NAV”)vi and 14.91% based on its New York Stock Exchange (“NYSE”) market price per share. The Fund’s unmanaged benchmark, the Barclays Capital U.S. High Yield — 2% Issuer Cap Index, returned 17.34% over the same time frame. The Lipper High Current Yield Closed-End Funds Category Averagevii returned 19.57% for the same period. Please note that Lipper performance returns are based on each fund’s NAV.
During the twelve-month period, the Fund made distributions to shareholders totaling $0.59 per share. The performance table shows the Fund’s twelve-month total return based on its NAV and market price as of February 28, 2011. Past performance is no guarantee of future results.
Performance Snapshot as of February 28, 2011
Price Per Share | | 12-Month
Total Return* | |
$6.24 (NAV) | | 19.31% | |
$6.27 (Market Price) | | 14.91% | |
All figures represent past performance and are not a guarantee of future results.
* Total returns are based on changes in NAV or market price, respectively. Total returns assume the reinvestment of all distributions in additional shares in accordance with the Fund’s Dividend Reinvestment Plan.
Q. What were the leading contributors to performance?
A. The largest contributor to the Fund’s relative performance during the reporting period was security selection. In particular, issues from Sprint Capital Corp., American International Group Inc. and its aircraft-leasing arm International Lease Finance Corp., and Harrah’s Operating Co. Inc. produced the best results. Wireless service provider Sprint posted improved fundamental results and continued to generate significant free cash flow, which caused its BB-rated unsecured bonds to perform well during the period. AIG’s senior debt performed well due to improved fundamental results, combined with an improving balance sheet which included an initial public offering of its Asia operations and the sale of another business to a competitor during the
4 | | Western Asset Managed High Income Fund Inc. 2011 Annual Report | | |
Fund overview (cont’d)
period. As we anticipated, AIG’s International Lease Finance Corp. freed up collateral by repaying a government loan during the period and the company accessed the capital markets in order to extend its maturity profile. This balance sheet management, combined with stable fundamental results, caused the issuer’s bonds to rally significantly during the period. Gaming company Harrah’s performed well as occupancy rates at its properties improved. This, coupled with rising demand for its bonds and an improvement in the overall economic backdrop, helped spreads on Harrah’s debt narrow from their previous wide levels.
The portfolio’s quality biases also significantly contributed to performance during the period. Relative to the Index, the portfolio’s overweight to CCC-rated securities benefited from improved demand as investors looked to receive higher incremental yield and reduced sensitivity to changes in interest rates. Additionally, our overweight to CCC-rated securities benefited from improved corporate fundamentals and lower default rates among high-yield issuers.
From a sector perspective, the Fund’s overweight in IT was a positive for performance. The sector performed well as the economy showed signs of improvement during the fiscal year. Additionally, the Fund benefited from our decision to move from an underweight to an overweight in the Consumer Cyclicals1 sector. This move was rewarded as cyclical businesses benefited disproportionately from improving fundamentals and macro conditions in the U.S.
Q. What were the leading detractors from performance?
A. A number of individual holdings negatively impacted results and were the largest detractors from relative performance during the period. These included our exposures to issuers Turbo Beta Ltd. and Station Casinos Inc. Turbo Beta, also known as KCA Deutag, is a global onshore and offshore oil drilling company that operates in nearly 100 countries. The company’s bonds performed poorly as investors were concerned about the amount of debt on its balance sheet incurred in a 2008 leveraged buyout. The new private equity owners proved overly optimistic and have been unsuccessful at growing the business into their new capital structure. As a result, bondholders entered into discussions with management in an attempt to restructure the outstanding debt. We believe the recent disruptions in global oil supply, and subsequent increase in price, will be beneficial for Turbo Beta’s business and aid unsecured lenders in the negotiation process regarding the structuring of its debt. The gaming market suffered deep declines during the previous economic recession and, given its deteriorating fundamental results, Station Casinos filed for bankruptcy in July 2009. The company continued to negotiate with lenders and creditors into 2010 and, unable to reach a favorable agreement for unsecured creditors, the issuer’s bonds moved lower in a rising market.
Our overall sector positioning was also a modest detractor from performance.
1 Consumer Cyclicals consists of the following industries: Automotive, Entertainment, Gaming, Home Construction, Lodging, Retailers, Restaurants, Textiles and other consumer services.
| | Western Asset Managed High Income Fund Inc. 2011 Annual Report | | 5 |
In particular, our slight underweight to the Financials sector was detrimental as it was the best performing area within the Index during the twelve months ended February 28, 2011. Conversely, we held an overweight to the more traditionally defensive Utilities sector, which was the worst performing sector within the Index during the fiscal year as the market rallied. As previously mentioned, we reduced our overweight exposure to a neutral position over the course of the fiscal year. Our underweight to the relatively strong performing IT sector also tempered our results. Over the period, we increased our exposure to the sector, reducing our underweight position.
Looking for additional information?
The Fund is traded under the symbol “MHY” and its closing market price is available in most newspapers under the NYSE listings. The daily NAV is available on-line under the symbol “XMHYX” on most financial websites. Barron’s and the Wall Street Journal’s Monday edition both carry closed-end fund tables that provide additional information. In addition, the Fund issues a quarterly press release that can be found on most major financial websites as well as www.leggmason.com/cef.
In a continuing effort to provide information concerning the Fund, shareholders may call 1-888-777-0102 (toll free), Monday through Friday from 8:00 a.m. to 5:30 p.m. Eastern Time, for the Fund’s current NAV, market price and other information.
Thank you for your investment in Western Asset Managed High Income Fund Inc. As always, we appreciate that you have chosen us to manage your assets and we remain focused on achieving the Fund’s investment goals.
Sincerely,
Western Asset Management Company
March 15, 2011
RISKS: As interest rates rise, bond prices fall, reducing the value of the fixed-income securities held by the Fund. The Fund invests in high-yield bonds, which are subject to additional risks such as the increased risk of default and greater volatility because of the lower credit quality of the issues. The Fund may use derivatives, such as options and futures, which can be illiquid, may disproportionately increase losses, and have a potentially large impact on Fund performance. In addition, the Fund may invest in foreign securities, which are subject to certain risks of overseas investing including currency fluctuations and changes in political and economic conditions, which could result in significant market fluctuations.
Portfolio holdings and breakdowns are as of February 28, 2011 and are subject to change and may not be representative of the portfolio managers’ current or future investments. Please refer to pages 10 through 25 for a list and percentage breakdown of the Fund’s holdings.
The mention of sector breakdowns is for informational purposes only and should not be construed as a recommendation to purchase or sell any securities. The information provided regarding such sectors is not a sufficient basis upon which to make an investment decision. Investors seeking financial advice regarding the appropriateness of investing in any securities or investment strategies discussed should consult their financial professional. The Fund’s top five sector holdings (as a percentage of net assets) as of February 28, 2011 were: Consumer Discretionary (24.5%), Energy (15.2%), Industrials (13.4%), Financials (9.8%) and Materials (9.2%). The Fund’s portfolio composition is subject to change at any time.
All investments are subject to risk including the possible loss of principal. Past performance is no guarantee of future results. All index performance reflects no deduction for fees, expenses or taxes.
6 | | Western Asset Managed High Income Fund Inc. 2011 Annual Report | | |
Fund overview (cont’d)
Please note that an investor cannot invest directly in an index.
The information provided is not intended to be a forecast of future events, a guarantee of future results or investment advice. Views expressed may differ from those of the firm as a whole.
i The Federal Reserve Board (“Fed”) is responsible for the formulation of policies designed to promote economic growth, full employment, stable prices and a sustainable pattern of international trade and payments.
ii The Barclays Capital U.S. Aggregate Index is a broad-based bond index comprised of government, corporate, mortgage- and asset-backed issues, rated investment grade or higher, and having at least one year to maturity.
iii The Barclays Capital U.S. High Yield — 2% Issuer Cap Index is an index of the 2% Issuer Cap component of the Barclays Capital U.S. Corporate High Yield Index, which covers the U.S. dollar-denominated, non-investment grade, fixed-rate, taxable corporate bond market.
iv The yield curve is the graphical depiction of the relationship between the yield on bonds of the same credit quality but different maturities.
v Duration is the measure of the price sensitivity of a fixed-income security to an interest rate change of 100 basis points. Calculation is based on the weighted average of the present values for all cash flows.
vi Net asset value (“NAV”) is calculated by subtracting total liabilities and outstanding preferred stock (if any) from the closing value of all securities held by the Fund (plus all other assets) and dividing the result (total net assets) by the total number of the common shares outstanding. The NAV fluctuates with changes in the market prices of securities in which the Fund has invested. However, the price at which an investor may buy or sell shares of the Fund is the Fund’s market price as determined by supply of and demand for the Fund’s shares.
vii Lipper, Inc., a wholly-owned subsidiary of Reuters, provides independent insight on global collective investments. Returns are based on the twelve-month period ended February 28, 2011, including the reinvestment of all distributions, including returns of capital, if any, calculated among the 7 funds in the Fund’s Lipper category.
| | Western Asset Managed High Income Fund Inc. 2011 Annual Report | | 7 |
Fund at a glance† (unaudited)
Investment breakdown (%) as a percent of total investments
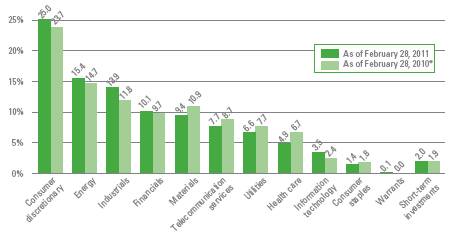
† The bar graph above represents the composition of the Fund’s investments as of February 28, 2011 and February 28, 2010 and does not include derivatives, such as futures contracts and forward foreign currency contracts. The Fund is actively managed. As a result, the composition of the Fund’s investments is subject to change at any time.
* Prior year percentages have been restated to reflect current period classifications.
8 | | Western Asset Managed High Income Fund Inc. 2011 Annual Report | | |
Spread duration (unaudited)
Economic Exposure — February 28, 2011
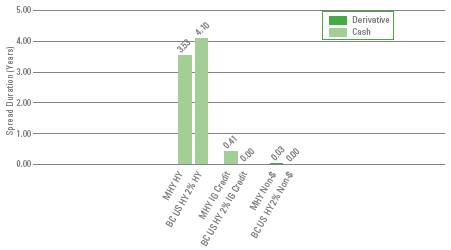
Spread duration measures the sensitivity to changes in spreads. The spread over Treasuries is the annual risk premium demanded by investors to hold non-Treasury securities. Spread duration is quantified as the % change in price resulting from a 100 basis points change in spreads. For a security with positive spread duration, an increase in spreads would result in a price decline and a decline in spreads would result in a price increase. This chart highlights the market sector exposure of the Fund’s sectors relative to the selected benchmark sectors as of the end of the reporting period.
BC US HY 2% | — Barclays Capital U.S. High Yield — 2% Issuer Cap Index |
EM | — Emerging Markets |
HY | — High Yield |
IG Credit | — Investment Grade Credit |
MHY | — Western Asset Managed High Income Fund Inc. |
Non-$ | — Non-U.S. Dollar |
| | Western Asset Managed High Income Fund Inc. 2011 Annual Report | | 9 |
Effective duration (unaudited)
Interest Rate Exposure — February 28, 2011
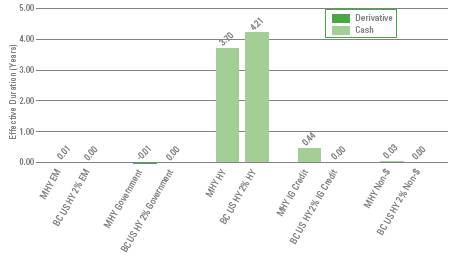
Effective duration measures the sensitivity to changes in relevant interest rates. Effective duration is quantified as the % change in price resulting from a 100 basis points change in interest rates. For a security with positive effective duration, an increase in interest rates would result in a price decline and a decline in interest rates would result in a price increase. This chart highlights the interest rate exposure of the Fund’s sectors relative to the selected benchmark sectors as of the end of the reporting period.
BC US HY 2% | — Barclays Capital U.S. High Yield — 2% Issuer Cap Index |
EM | — Emerging Markets |
HY | — High Yield |
IG Credit | — Investment Grade Credit |
MHY | — Western Asset Managed High Income Fund Inc. |
Non-$ | — Non-U.S. Dollar |
10 | | Western Asset Managed High Income Fund Inc. 2011 Annual Report | | |
Schedule of investments
February 28, 2011
Western Asset Managed High Income Fund Inc.
Security | | Rate | | Maturity
Date | | Face
Amount† | | Value | |
Corporate Bonds & Notes — 88.4% | | | | | | | | | |
Consumer Discretionary — 21.5% | | | | | | | | | |
Auto Components — 0.1% | | | | | | | | | |
Hertz Holdings Netherlands BV, Senior Secured Bonds | | 8.500 | % | 7/31/15 | | 170,000 | EUR | $ 256,291 | (a) |
Automobiles — 1.4% | | | | | | | | | |
Ford Motor Credit Co., LLC, Senior Notes | | 9.875 | % | 8/10/11 | | 1,060,000 | | 1,095,116 | |
Ford Motor Credit Co., LLC, Senior Notes | | 12.000 | % | 5/15/15 | | 955,000 | | 1,207,079 | |
Motors Liquidation Co., Senior Notes | | 7.200 | % | 1/15/11 | | 1,860,000 | | 595,200 | (b) |
Motors Liquidation Co., Senior Notes | | 7.125 | % | 7/15/13 | | 1,325,000 | | 427,312 | (b) |
Motors Liquidation Co., Senior Notes | | 8.375 | % | 7/15/33 | | 2,440,000 | | 823,500 | (b) |
Total Automobiles | | | | | | | | 4,148,207 | |
Diversified Consumer Services — 0.8% | | | | | | | | | |
Realogy Corp., Senior Secured Notes | | 7.875 | % | 2/15/19 | | 410,000 | | 413,587 | (a) |
Service Corp. International, Senior Notes | | 7.500 | % | 4/1/27 | | 455,000 | | 447,038 | |
Sotheby’s, Senior Notes | | 7.750 | % | 6/15/15 | | 930,000 | | 1,029,975 | |
Stonemor Operating LLC/Cornerstone Family Services of WV/Osiris Holding, Senior Notes | | 10.250 | % | 12/1/17 | | 495,000 | | 520,987 | |
Total Diversified Consumer Services | | | | | | | | 2,411,587 | |
Hotels, Restaurants & Leisure — 7.7% | | | | | | | | | |
Boyd Gaming Corp., Senior Notes | | 9.125 | % | 12/1/18 | | 340,000 | | 358,700 | (a) |
Boyd Gaming Corp., Senior Subordinated Notes | | 7.125 | % | 2/1/16 | | 410,000 | | 394,625 | |
CCM Merger Inc., Notes | | 8.000 | % | 8/1/13 | | 1,450,000 | | 1,471,750 | (a) |
CityCenter Holdings LLC/CityCenter Finance Corp., Senior Secured Notes | | 10.750 | % | 1/15/17 | | 1,250,000 | | 1,312,500 | (a)(c) |
Downstream Development Quapaw, Senior Notes | | 12.000 | % | 10/15/15 | | 1,030,000 | | 1,086,650 | (a) |
Dunkin Finance Corp., Senior Notes | | 9.625 | % | 12/1/18 | | 300,000 | | 305,250 | (a) |
El Pollo Loco Inc., Senior Notes | | 11.750 | % | 11/15/13 | | 1,470,000 | | 1,330,350 | |
El Pollo Loco Inc., Senior Secured Notes | | 11.750 | % | 12/1/12 | | 575,000 | | 598,000 | |
Fontainebleau Las Vegas Holdings LLC/ Fontainebleau Las Vegas Capital Corp. | | 11.000 | % | 6/15/15 | | 270,000 | | 1,350 | (a)(b) |
Harrah’s Operating Co. Inc., Senior Bonds | | 5.625 | % | 6/1/15 | | 2,007,000 | | 1,678,354 | |
Harrah’s Operating Co. Inc., Senior Notes | | 10.750 | % | 2/1/16 | | 2,039,000 | | 2,023,707 | |
Harrah’s Operating Co. Inc., Senior Secured Notes | | 11.250 | % | 6/1/17 | | 729,000 | | 831,060 | |
Inn of the Mountain Gods Resort & Casino, Senior Secured Notes | | 1.250 | % | 11/30/20 | | 1,603,000 | | 841,575 | (a)(c) |
Inn of the Mountain Gods Resort & Casino, Senior Secured Notes | | 8.750 | % | 11/30/20 | | 712,000 | | 679,960 | (a) |
Landry’s Holdings Inc., Senior Secured Notes | | 11.500 | % | 6/1/14 | | 700,000 | | 698,250 | (a) |
See Notes to Financial Statements.
| | Western Asset Managed High Income Fund Inc. 2011 Annual Report | | 11 |
Western Asset Managed High Income Fund Inc.
Security | | Rate | | Maturity
Date | | Face
Amount† | | Value | |
Hotels, Restaurants & Leisure — continued | | | | | | | | | |
Landry’s Restaurants Inc., Senior Secured Notes | | 11.625 | % | 12/1/15 | | 695,000 | | $ 757,550 | |
Landry’s Restaurants Inc., Senior Secured Notes | | 11.625 | % | 12/1/15 | | 200,000 | | 218,000 | (a) |
MGM MIRAGE Inc., Senior Notes | | 5.875 | % | 2/27/14 | | 1,430,000 | | 1,376,375 | |
MGM MIRAGE Inc., Senior Notes | | 6.625 | % | 7/15/15 | | 480,000 | | 458,400 | |
MGM Resorts International, Senior Secured Notes | | 10.375 | % | 5/15/14 | | 90,000 | | 101,250 | |
Mohegan Tribal Gaming Authority, Senior Secured Notes | | 11.500 | % | 11/1/17 | | 450,000 | | 457,875 | (a) |
Mohegan Tribal Gaming Authority, Senior Subordinated Notes | | 8.000 | % | 4/1/12 | | 1,890,000 | | 1,630,125 | |
NCL Corp. Ltd., Senior Notes | | 9.500 | % | 11/15/18 | | 850,000 | | 924,375 | (a) |
NCL Corp. Ltd., Senior Secured Notes | | 11.750 | % | 11/15/16 | | 1,110,000 | | 1,316,737 | |
Pinnacle Entertainment Inc., Senior Notes | | 8.625 | % | 8/1/17 | | 560,000 | | 617,400 | |
Pinnacle Entertainment Inc., Senior Subordinated Notes | | 7.500 | % | 6/15/15 | | 60,000 | | 61,200 | |
Pinnacle Entertainment Inc., Senior Subordinated Notes | | 8.750 | % | 5/15/20 | | 140,000 | | 149,975 | |
Sbarro Inc., Senior Notes | | 10.375 | % | 2/1/15 | | 635,000 | | 180,975 | (b) |
Snoqualmie Entertainment Authority, Senior Secured Notes | | 4.428 | % | 2/1/14 | | 545,000 | | 500,038 | (a)(d) |
Snoqualmie Entertainment Authority, Senior Secured Notes | | 9.125 | % | 2/1/15 | | 105,000 | | 105,525 | (a) |
Station Casinos Inc., Senior Notes | | 6.000 | % | 4/1/12 | | 860,000 | | 86 | (b)(e) |
Station Casinos Inc., Senior Notes | | 7.750 | % | 8/15/16 | | 1,430,000 | | 143 | (b)(e) |
Station Casinos Inc., Senior Subordinated Notes | | 6.625 | % | 3/15/18 | | 40,000 | | 4 | (b)(e) |
Total Hotels, Restaurants & Leisure | | | | | | | | 22,468,114 | |
Household Durables — 0.4% | | | | | | | | | |
DirectBuy Holdings Inc., Senior Secured Notes | | 12.000 | % | 2/1/17 | | 550,000 | | 517,000 | (a) |
Standard Pacific Corp., Senior Notes | | 8.375 | % | 1/15/21 | | 630,000 | | 667,800 | (a) |
Total Household Durables | | | | | | | | 1,184,800 | |
Household Products — 0.2% | | | | | | | | | |
YCC Holdings LLC/Yankee Finance Inc., Senior Notes | | 10.250 | % | 2/15/16 | | 630,000 | | 652,050 | (a)(c) |
Internet & Catalog Retail — 0.8% | | | | | | | | | |
Netflix Inc., Senior Notes | | 8.500 | % | 11/15/17 | | 810,000 | | 921,375 | |
QVC Inc., Senior Secured Notes | | 7.375 | % | 10/15/20 | | 1,205,000 | | 1,283,325 | (a) |
Total Internet & Catalog Retail | | | | | | | | 2,204,700 | |
Media — 4.6% | | | | | | | | | |
Affinity Group Inc., Senior Secured Notes | | 11.500 | % | 12/1/16 | | 430,000 | | 446,125 | (a) |
See Notes to Financial Statements.
12 | | Western Asset Managed High Income Fund Inc. 2011 Annual Report | | |
Schedule of investments (cont’d)
February 28, 2011
Western Asset Managed High Income Fund Inc.
Security | | Rate | | Maturity
Date | | Face
Amount† | | Value | |
Media — continued | | | | | | | | | |
Cablevision Systems Corp., Senior Notes | | 8.000 | % | 4/15/20 | | 270,000 | | $ 295,650 | |
CCH II LLC/CCH II Capital Corp., Senior Notes | | 13.500 | % | 11/30/16 | | 301,825 | | 367,095 | |
CCO Holdings LLC/CCO Holdings Capital Corp., Senior Notes | | 7.875 | % | 4/30/18 | | 1,140,000 | | 1,222,650 | |
CCO Holdings LLC/CCO Holdings Capital Corp., Senior Notes | | 8.125 | % | 4/30/20 | | 1,130,000 | | 1,224,637 | |
Cengage Learning Acquisitions Inc., Senior Notes | | 10.500 | % | 1/15/15 | | 380,000 | | 396,150 | (a) |
Cengage Learning Acquisitions Inc., Senior Subordinated Notes | | 13.250 | % | 7/15/15 | | 1,600,000 | | 1,712,000 | (a) |
DISH DBS Corp., Senior Notes | | 6.625 | % | 10/1/14 | | 60,000 | | 63,750 | |
DISH DBS Corp., Senior Notes | | 7.875 | % | 9/1/19 | | 700,000 | | 762,125 | |
Nielsen Finance LLC/Nielsen Finance Co., Senior Notes | | 7.750 | % | 10/15/18 | | 2,640,000 | | 2,867,700 | (a) |
Ono Finance II PLC, Senior Bonds | | 10.875 | % | 7/15/19 | | 300,000 | | 324,000 | (a) |
Univision Communications Inc., Senior Notes | | 8.500 | % | 5/15/21 | | 690,000 | | 722,775 | (a) |
Univision Communications Inc., Senior Secured Notes | | 12.000 | % | 7/1/14 | | 205,000 | | 224,475 | (a) |
Univision Communications Inc., Senior Secured Notes | | 7.875 | % | 11/1/20 | | 860,000 | | 926,650 | (a) |
UPC Holding BV, Senior Notes | | 9.875 | % | 4/15/18 | | 410,000 | | 457,150 | (a) |
UPCB Finance III Ltd., Senior Secured Notes | | 6.625 | % | 7/1/20 | | 1,410,000 | | 1,411,762 | (a) |
Total Media | | | | | | | | 13,424,694 | |
Multiline Retail — 0.5% | | | | | | | | | |
Neiman Marcus Group Inc., Senior Secured Notes | | 7.125 | % | 6/1/28 | | 1,485,000 | | 1,373,625 | |
Specialty Retail — 3.1% | | | | | | | | | |
American Greetings Corp., Senior Notes | | 7.375 | % | 6/1/16 | | 1,770,000 | | 1,836,375 | |
American Greetings Corp., Senior Notes | | 7.375 | % | 6/1/16 | | 205,000 | | 204,488 | |
American Greetings Corp., Senior Notes | | 7.375 | % | 6/1/16 | | 160,000 | | 159,600 | |
Edcon Proprietary Ltd., Senior Secured Notes | | 9.500 | % | 3/1/18 | | 1,190,000 | EUR | 1,187,025 | (a) |
Michaels Stores Inc., Senior Notes | | 7.750 | % | 11/1/18 | | 910,000 | | 944,125 | (a) |
Michaels Stores Inc., Senior Subordinated Bonds | | 11.375 | % | 11/1/16 | | 670,000 | | 735,325 | |
Michaels Stores Inc., Senior Subordinated Notes, step bond | | 0.000 | % | 11/1/16 | | 2,280,000 | | 2,331,300 | |
PETCO Animal Supplies Inc., Senior Notes | | 9.250 | % | 12/1/18 | | 1,380,000 | | 1,497,300 | (a) |
Total Specialty Retail | | | | | | | | 8,895,538 | |
Textiles, Apparel & Luxury Goods — 1.9% | | | | | | | | | |
Burlington Coat Factory Warehouse Corp., Senior Notes | | 10.000 | % | 2/15/19 | | 540,000 | | 548,100 | (a) |
See Notes to Financial Statements.
| | Western Asset Managed High Income Fund Inc. 2011 Annual Report | | 13 |
Western Asset Managed High Income Fund Inc.
Security | | Rate | | Maturity
Date | | Face
Amount† | | Value | |
Textiles, Apparel & Luxury Goods — continued | | | | | | | | | |
Empire Today LLC/Empire Today Finance Corp., Senior Secured Notes | | 11.375 | % | 2/1/17 | | 200,000 | | $ 210,000 | (a) |
Express LLC/Express Finance Corp., Senior Notes | | 8.750 | % | 3/1/18 | | 820,000 | | 886,625 | |
Giraffe Acquisition Corp., Senior Notes | | 9.125 | % | 12/1/18 | | 1,280,000 | | 1,312,000 | (a) |
Oxford Industries Inc., Senior Secured Notes | | 11.375 | % | 7/15/15 | | 1,565,000 | | 1,768,450 | |
Phillips-Van Heusen Corp., Senior Notes | | 7.375 | % | 5/15/20 | | 680,000 | | 727,600 | |
Total Textiles, Apparel & Luxury Goods | | | | | | | | 5,452,775 | |
Total Consumer Discretionary | | | | | | | | 62,472,381 | |
Consumer Staples — 1.4% | | | | | | | | | |
Food Products — 1.2% | | | | | | | | | |
Blue Merger Sub Inc., Senior Notes | | 7.625 | % | 2/15/19 | | 1,270,000 | | 1,289,050 | (a) |
Bumble Bee Acquisiton Co., Senior Secured Notes | | 9.000 | % | 12/15/17 | | 480,000 | | 520,800 | (a) |
Simmons Foods Inc., Senior Secured Notes | | 10.500 | % | 11/1/17 | | 1,220,000 | | 1,320,650 | (a) |
Smithfield Foods Inc., Senior Secured Notes | | 10.000 | % | 7/15/14 | | 198,000 | | 234,630 | |
Total Food Products | | | | | | | | 3,365,130 | |
Tobacco — 0.2% | | | | | | | | | |
Alliance One International Inc., Senior Notes | | 10.000 | % | 7/15/16 | | 610,000 | | 632,875 | |
Total Consumer Staples | | | | | | | | 3,998,005 | |
Energy — 14.9% | | | | | | | | | |
Energy Equipment & Services — 2.3% | | | | | | | | | |
Complete Production Services Inc., Senior Notes | | 8.000 | % | 12/15/16 | | 690,000 | | 733,125 | |
GulfMark Offshore Inc., Senior Subordinated Notes | | 7.750 | % | 7/15/14 | | 990,000 | | 1,009,800 | |
Hercules Offshore LLC, Senior Secured Notes | | 10.500 | % | 10/15/17 | | 1,380,000 | | 1,376,550 | (a) |
Key Energy Services Inc., Senior Notes | | 8.375 | % | 12/1/14 | | 1,215,000 | | 1,327,387 | |
Laredo Petroleum Inc., Senior Notes | | 9.500 | % | 2/15/19 | | 730,000 | | 766,500 | (a) |
Parker Drilling Co., Senior Notes | | 9.125 | % | 4/1/18 | | 900,000 | | 972,000 | |
Precision Drilling Corp., Senior Notes | | 6.625 | % | 11/15/20 | | 660,000 | | 683,100 | (a) |
Total Energy Equipment & Services | | | | | | | | 6,868,462 | |
Oil, Gas & Consumable Fuels — 12.6% | | | | | | | | | |
Belden & Blake Corp., Secured Notes | | 8.750 | % | 7/15/12 | | 2,360,000 | | 2,348,200 | |
Berry Petroleum Co., Senior Notes | | 10.250 | % | 6/1/14 | | 700,000 | | 815,500 | |
Berry Petroleum Co., Senior Notes | | 6.750 | % | 11/1/20 | | 90,000 | | 92,925 | |
Calfrac Holdings LP, Senior Notes | | 7.500 | % | 12/1/20 | | 490,000 | | 503,475 | (a) |
Chesapeake Energy Corp., Senior Notes | | 7.250 | % | 12/15/18 | | 745,000 | | 825,087 | |
Chesapeake Energy Corp., Senior Notes | | 6.625 | % | 8/15/20 | | 420,000 | | 443,100 | |
Compagnie Generale de Geophysique-Veritas, Senior Notes | | 7.500 | % | 5/15/15 | | 300,000 | | 312,000 | |
See Notes to Financial Statements.
14 | | Western Asset Managed High Income Fund Inc. 2011 Annual Report | | |
Schedule of investments (cont’d)
February 28, 2011
Western Asset Managed High Income Fund Inc.
Security | | Rate | | Maturity
Date | | Face
Amount† | | Value | |
Oil, Gas & Consumable Fuels — continued | | | | | | | | | |
Compagnie Generale de Geophysique-Veritas, Senior Notes | | 9.500 | % | 5/15/16 | | 270,000 | | $ 304,425 | |
Compagnie Generale de Geophysique-Veritas, Senior Notes | | 7.750 | % | 5/15/17 | | 200,000 | | 212,500 | |
Concho Resources Inc., Senior Notes | | 7.000 | % | 1/15/21 | | 780,000 | | 819,000 | |
CONSOL Energy Inc., Senior Notes | | 8.250 | % | 4/1/20 | | 860,000 | | 952,450 | (a) |
Corral Petroleum Holdings AB, Senior Bonds | | 12.500 | % | 9/18/11 | | 1,625,638 | | 1,568,741 | (a)(c) |
Crosstex Energy LP/Crosstex Energy Finance Corp., Senior Notes | | 8.875 | % | 2/15/18 | | 220,000 | | 243,650 | |
Energy Transfer Equity LP, Senior Notes | | 7.500 | % | 10/15/20 | | 830,000 | | 903,662 | |
Enterprise Products Operating LLP, Junior Subordinated Notes | | 8.375 | % | 8/1/66 | | 840,000 | | 907,138 | (d) |
Enterprise Products Operating LLP, Subordinated Notes | | 7.034 | % | 1/15/68 | | 410,000 | | 428,006 | (d) |
EXCO Resources Inc., Senior Notes | | 7.500 | % | 9/15/18 | | 1,570,000 | | 1,566,075 | |
Goodrich Petroleum Corp., Senior Notes | | 8.875 | % | 3/15/19 | | 430,000 | | 429,463 | (a) |
Linn Energy LLC/Linn Energy Finance Corp., Senior Notes | | 8.625 | % | 4/15/20 | | 830,000 | | 929,600 | (a) |
Linn Energy LLC/Linn Energy Finance Corp., Senior Notes | | 7.750 | % | 2/1/21 | | 460,000 | | 491,050 | (a) |
MarkWest Energy Partners LP/MarkWest Energy Finance Corp., Senior Notes | | 8.750 | % | 4/15/18 | | 640,000 | | 704,000 | |
MarkWest Energy Partners LP/MarkWest Energy Finance Corp., Senior Notes | | 6.750 | % | 11/1/20 | | 40,000 | | 41,200 | |
MarkWest Energy Partners LP/MarkWest Energy Finance Corp., Senior Notes | | 6.500 | % | 8/15/21 | | 610,000 | | 610,000 | |
Murray Energy Corp., Senior Secured Notes | | 10.250 | % | 10/15/15 | | 1,225,000 | | 1,313,812 | (a) |
Offshore Group Investments Ltd., Senior Secured Notes | | 11.500 | % | 8/1/15 | | 1,820,000 | | 2,047,500 | (a) |
Overseas Shipholding Group Inc., Senior Notes | | 8.125 | % | 3/30/18 | | 905,000 | | 909,525 | |
Peabody Energy Corp., Senior Notes | | 7.375 | % | 11/1/16 | | 750,000 | | 851,250 | |
Peabody Energy Corp., Senior Notes | | 7.875 | % | 11/1/26 | | 310,000 | | 348,750 | |
Petroplus Finance Ltd., Senior Notes | | 6.750 | % | 5/1/14 | | 670,000 | | 670,000 | (a) |
Petroplus Finance Ltd., Senior Notes | | 7.000 | % | 5/1/17 | | 470,000 | | 461,775 | (a) |
Plains Exploration & Production Co., Senior Notes | | 10.000 | % | 3/1/16 | | 685,000 | | 780,900 | |
Plains Exploration & Production Co., Senior Notes | | 8.625 | % | 10/15/19 | | 725,000 | | 813,813 | |
PT Adaro Indonesia, Senior Notes | | 7.625 | % | 10/22/19 | | 250,000 | | 275,625 | (a) |
Quicksilver Resources Inc., Senior Notes | | 11.750 | % | 1/1/16 | | 1,375,000 | | 1,612,187 | |
Quicksilver Resources Inc., Senior Notes | | 9.125 | % | 8/15/19 | | 200,000 | | 213,000 | |
See Notes to Financial Statements.
| | Western Asset Managed High Income Fund Inc. 2011 Annual Report | | 15 |
Western Asset Managed High Income Fund Inc.
Security | | Rate | | Maturity
Date | | Face
Amount† | | Value | |
Oil, Gas & Consumable Fuels — continued | | | | | | | | | |
Range Resources Corp., Senior Subordinated Notes | | 8.000 | % | 5/15/19 | | 170,000 | | $ 188,063 | |
Regency Energy Partners LP/Regency Energy Finance Corp., Senior Notes | | 6.875 | % | 12/1/18 | | 820,000 | | 865,100 | |
SandRidge Energy Inc., Senior Toggle Notes | | 8.625 | % | 4/1/15 | | 1,150,000 | | 1,201,750 | (c) |
Stone Energy Corp., Senior Notes | | 8.625 | % | 2/1/17 | | 580,000 | | 607,550 | |
Teekay Corp., Senior Notes | | 8.500 | % | 1/15/20 | | 1,390,000 | | 1,502,937 | |
Tennessee Gas Pipeline Co., Senior Notes | | 8.000 | % | 2/1/16 | | 645,000 | | 768,963 | |
Tennessee Gas Pipeline Co., Senior Notes | | 8.375 | % | 6/15/32 | | 1,960,000 | | 2,442,621 | |
TNK-BP Finance SA, Senior Notes | | 7.875 | % | 3/13/18 | | 918,000 | | 1,045,418 | (a) |
Venoco Inc., Senior Notes | | 8.875 | % | 2/15/19 | | 410,000 | | 416,663 | (a) |
Whiting Petroleum Corp., Senior Subordinated Notes | | 7.000 | % | 2/1/14 | | 55,000 | | 58,850 | |
Whiting Petroleum Corp., Senior Subordinated Notes | | 6.500 | % | 10/1/18 | | 710,000 | | 740,175 | |
Total Oil, Gas & Consumable Fuels | | | | | | | | 36,587,474 | |
Total Energy | | | | | | | | 43,455,936 | |
Financials — 7.6% | | | | | | | | | |
Capital Markets — 0.2% | | | | | | | | | |
Goldman Sachs Group Inc., Subordinated Notes | | 6.750 | % | 10/1/37 | | 670,000 | | 688,863 | |
Commercial Banks — 1.5% | | | | | | | | | |
BAC Capital Trust VI, Capital Securities, Junior Subordinated Notes | | 5.625 | % | 3/8/35 | | 650,000 | | 565,283 | |
BankAmerica Institutional Capital A, Junior Subordinated Bonds | | 8.070 | % | 12/31/26 | | 310,000 | | 316,200 | (a) |
BankAmerica Institutional Capital B, Junior Subordinated Bonds | | 7.700 | % | 12/31/26 | | 200,000 | | 202,500 | (a) |
CIT Group Inc., Senior Secured Bonds | | 7.000 | % | 5/1/16 | | 678,739 | | 686,375 | |
CIT Group Inc., Senior Secured Bonds | | 7.000 | % | 5/1/17 | | 128,235 | | 129,517 | |
Credit Agricole SA, Subordinated Notes | | 8.375 | % | 10/13/19 | | 510,000 | | 544,425 | (a)(d)(f) |
NB Capital Trust II, Junior Subordinated Notes | | 7.830 | % | 12/15/26 | | 900,000 | | 915,750 | |
NB Capital Trust IV, Junior Subordinated Notes | | 8.250 | % | 4/15/27 | | 590,000 | | 607,700 | |
Royal Bank of Scotland Group PLC, Junior Subordinated Bonds | | 7.648 | % | 9/30/31 | | 480,000 | | 441,600 | (d)(f) |
Total Commercial Banks | | | | | | | | 4,409,350 | |
Consumer Finance — 2.3% | | | | | | | | | |
Ally Financial Inc., Debentures | | 0.000 | % | 6/15/15 | | 2,610,000 | | 2,032,537 | |
Ally Financial Inc., Senior Bonds | | 0.000 | % | 12/1/12 | | 1,160,000 | | 1,086,375 | |
Ally Financial Inc., Senior Notes | | 7.500 | % | 9/15/20 | | 1,490,000 | | 1,637,138 | (a) |
GMAC International Finance BV, Senior Bonds | | 7.500 | % | 4/21/15 | | 460,000 | EUR | 678,418 | |
See Notes to Financial Statements.
16 | | Western Asset Managed High Income Fund Inc. 2011 Annual Report | | |
Schedule of investments (cont’d)
February 28, 2011
Western Asset Managed High Income Fund Inc.
Security | | Rate | | Maturity
Date | | Face
Amount† | | Value | |
Consumer Finance — continued | | | | | | | | | |
SLM Corp., Medium-Term Notes, Senior Notes | | 8.450 | % | 6/15/18 | | 570,000 | | $ 627,862 | |
SLM Corp., Medium-Term Notes, Senior Notes | | 8.000 | % | 3/25/20 | | 590,000 | | 627,151 | |
Total Consumer Finance | | | | | | | | 6,689,481 | |
Diversified Financial Services — 3.0% | | | | | | | | | |
Bank of America Corp., Notes, Preferred Securities | | 8.000 | % | 1/30/18 | | 65,000 | | 68,711 | (d)(f) |
Bankrate Inc., Senior Secured Notes | | 11.750 | % | 7/15/15 | | 450,000 | | 515,813 | (a) |
Capital One Capital V, Junior Subordinated Notes, Cumulative Trust Preferred Securities | | 10.250 | % | 8/15/39 | | 680,000 | | 742,900 | |
Countrywide Capital III, Junior Subordinated Notes | | 8.050 | % | 6/15/27 | | 180,000 | | 190,575 | |
International Lease Finance Corp., Medium-Term Notes, Senior Notes | | 5.625 | % | 9/20/13 | | 1,010,000 | | 1,036,513 | |
International Lease Finance Corp., Senior Notes | | 8.875 | % | 9/1/17 | | 2,520,000 | | 2,885,400 | |
International Lease Finance Corp., Senior Notes | | 8.250 | % | 12/15/20 | | 1,290,000 | | 1,436,737 | |
MBNA Capital A, Junior Subordinated Notes | | 8.278 | % | 12/1/26 | | 840,000 | | 858,900 | |
Midwest Gaming Borrower LLC/Midwest Finance Corp., Senior Secured Notes | | 11.625 | % | 4/15/16 | | 320,000 | | 342,400 | (a) |
Residential Capital LLC, Junior Secured Notes | | 9.625 | % | 5/15/15 | | 700,000 | | 710,500 | |
Total Diversified Financial Services | | | | | | | | 8,788,449 | |
Insurance — 0.6% | | | | | | | | | |
American International Group Inc., Senior Notes | | 8.250 | % | 8/15/18 | | 890,000 | | 1,065,956 | |
ING Capital Funding Trust III, Junior Subordinated Bonds | | 3.903 | % | 6/30/11 | | 250,000 | | 241,052 | (d)(f) |
MetLife Capital Trust IV, Junior Subordinated Notes | | 7.875 | % | 12/15/37 | | 360,000 | | 389,700 | (a) |
Total Insurance | | | | | | | | 1,696,708 | |
Total Financials | | | | | | | | 22,272,851 | |
Health Care — 4.9% | | | | | | | | | |
Health Care Equipment & Supplies — 0.3% | | | | | | | | | |
Biomet Inc., Senior Notes | | 10.000 | % | 10/15/17 | | 130,000 | | 145,438 | |
Biomet Inc., Senior Toggle Notes | | 10.375 | % | 10/15/17 | | 535,000 | | 601,206 | (c) |
Total Health Care Equipment & Supplies | | | | | | | | 746,644 | |
Health Care Providers & Services — 4.3% | | | | | | | | | |
American Renal Holdings, Senior Secured Notes | | 8.375 | % | 5/15/18 | | 690,000 | | 725,363 | |
Aviv Healthcare Properties LP, Senior Notes | | 7.750 | % | 2/15/19 | | 200,000 | | 209,500 | (a) |
CRC Health Corp., Senior Subordinated Notes | | 10.750 | % | 2/1/16 | | 2,585,000 | | 2,604,387 | |
Fresenius U.S. Finance II Inc., Senior Notes | | 9.000 | % | 7/15/15 | | 340,000 | | 391,425 | (a) |
See Notes to Financial Statements.
| | Western Asset Managed High Income Fund Inc. 2011 Annual Report | | 17 |
Western Asset Managed High Income Fund Inc.
Security | | Rate | | Maturity
Date | | Face
Amount† | | Value | |
Health Care Providers & Services — continued | | | | | | | | | |
HCA Inc., Debentures | | 7.500 | % | 11/15/95 | | 2,345,000 | | $ 1,934,625 | |
HCA Inc., Notes | | 7.690 | % | 6/15/25 | | 490,000 | | 476,525 | |
HCA Inc., Senior Secured Notes | | 7.875 | % | 2/15/20 | | 1,890,000 | | 2,086,087 | |
Tenet Healthcare Corp., Senior Secured Notes | | 10.000 | % | 5/1/18 | | 717,000 | | 846,060 | |
Tenet Healthcare Corp., Senior Secured Notes | | 8.875 | % | 7/1/19 | | 520,000 | | 594,100 | |
Universal Hospital Services Inc., Senior Secured Notes | | 4.133 | % | 6/1/15 | | 320,000 | | 308,800 | (d) |
Universal Hospital Services Inc., Senior Secured Notes | | 8.500 | % | 6/1/15 | | 1,190,000 | | 1,249,500 | (c) |
Vanguard Health Holdings Co., II LLC, Senior Notes | | 8.000 | % | 2/1/18 | | 850,000 | | 877,625 | |
Vanguard Health Systems Inc., Senior Notes | | 0.000 | % | 2/1/16 | | 560,000 | | 364,000 | (a) |
Total Health Care Providers & Services | | | | | | | | 12,667,997 | |
Pharmaceuticals — 0.3% | | | | | | | | | |
Giant Funding Corp., Senior Secured Notes | | 8.250 | % | 2/1/18 | | 710,000 | | 733,075 | (a) |
Total Health Care | | | | | | | | 14,147,716 | |
Industrials — 12.7% | | | | | | | | | |
Aerospace & Defense — 1.5% | | | | | | | | | |
FGI Operating Co. Inc., Senior Secured Notes | | 10.250 | % | 8/1/15 | | 1,195,000 | | 1,283,131 | |
Kratos Defense & Security Solutions Inc., Senior Secured Notes | | 10.000 | % | 6/1/17 | | 630,000 | | 713,475 | |
Triumph Group Inc., Senior Notes | | 8.625 | % | 7/15/18 | | 620,000 | | 686,650 | |
Wyle Services Corp., Senior Subordinated Notes | | 10.500 | % | 4/1/18 | | 1,605,000 | | 1,669,200 | (a) |
Total Aerospace & Defense | | | | | | | | 4,352,456 | |
Airlines — 2.3% | | | | | | | | | |
American Airlines Pass-Through Trust, Secured Notes | | 7.000 | % | 1/31/18 | | 470,000 | | 470,000 | |
Continental Airlines Inc., Pass-Through Certificates | | 7.373 | % | 12/15/15 | | 155,808 | | 156,587 | |
Continental Airlines Inc., Pass-Through Certificates | | 9.250 | % | 5/10/17 | | 109,234 | �� | 115,788 | |
Continental Airlines Inc., Pass-Through Certificates, Subordinated Secured Notes | | 8.312 | % | 4/2/11 | | 42,052 | | 42,262 | |
Continental Airlines Inc., Pass-Through Certificates, Subordinated Secured Notes | | 7.339 | % | 4/19/14 | | 1,110,730 | | 1,121,837 | |
Continental Airlines Inc., Senior Secured Notes | | 6.750 | % | 9/15/15 | | 300,000 | | 309,750 | (a) |
DAE Aviation Holdings Inc., Senior Notes | | 11.250 | % | 8/1/15 | | 2,345,000 | | 2,479,838 | (a) |
Delta Air Lines, Secured Notes | | 6.375 | % | 1/2/16 | | 80,000 | | 79,600 | |
Delta Air Lines Inc., Pass-Through Certificates | | 8.954 | % | 8/10/14 | | 58,855 | | 61,827 | |
See Notes to Financial Statements.
18 | | Western Asset Managed High Income Fund Inc. 2011 Annual Report | | |
Schedule of investments (cont’d)
February 28, 2011
Western Asset Managed High Income Fund Inc.
Security | | Rate | | Maturity
Date | | Face
Amount† | | Value | |
Airlines — continued | | | | | | | | | |
Delta Air Lines Inc., Pass-Through Certificates, Secured Notes | | 8.021 | % | 8/10/22 | | 704,379 | | $ 738,189 | |
Delta Air Lines Inc., Pass-Through Certificates, Subordinated Secured Notes | | 9.750 | % | 12/17/16 | | 342,682 | | 370,096 | |
Delta Air Lines Inc., Senior Secured Notes | | 9.500 | % | 9/15/14 | | 359,000 | | 393,105 | (a) |
United Air Lines Inc., Senior Secured Notes | | 9.875 | % | 8/1/13 | | 369,000 | | 403,133 | (a) |
Total Airlines | | | | | | | | 6,742,012 | |
Building Products — 0.1% | | | | | | | | | |
Ashton Woods USA LLC/Ashton Woods Finance Co., Senior Subordinated Notes, step bond | | 0.000 | % | 6/30/15 | | 395,200 | | 258,856 | (a)(e) |
Commercial Services & Supplies — 2.3% | | | | | | | | | |
ACCO Brands Corp., Senior Secured Notes | | 10.625 | % | 3/15/15 | | 1,020,000 | | 1,157,700 | |
ACCO Brands Corp., Senior Subordinated Notes | | 7.625 | % | 8/15/15 | | 380,000 | | 389,025 | |
Altegrity Inc., Senior Subordinated Notes | | 10.500 | % | 11/1/15 | | 120,000 | | 128,250 | (a) |
Altegrity Inc., Senior Subordinated Notes | | 11.750 | % | 5/1/16 | | 1,570,000 | | 1,695,600 | (a) |
American Reprographics Co., Senior Notes | | 10.500 | % | 12/15/16 | | 780,000 | | 854,100 | (a) |
Garda World Security Corp., Senior Notes | | 9.750 | % | 3/15/17 | | 440,000 | | 475,200 | (a) |
Geo Group Inc., Senior Notes | | 7.750 | % | 10/15/17 | | 980,000 | | 1,049,825 | |
RSC Equipment Rental Inc./RSC Holdings III LLC, Senior Notes | | 8.250 | % | 2/1/21 | | 830,000 | | 881,875 | (a) |
Total Commercial Services & Supplies | | | | | | | | 6,631,575 | |
Construction & Engineering — 0.3% | | | | | | | | | |
Abengoa Finance SAU, Senior Notes | | 8.875 | % | 11/1/17 | | 800,000 | | 796,000 | (a) |
Electrical Equipment — 0.3% | | | | | | | | | |
NES Rentals Holdings Inc., Senior Secured Notes | | 12.250 | % | 4/15/15 | | 980,000 | | 960,400 | (a) |
Industrial Conglomerates — 0.3% | | | | | | | | | |
Leucadia National Corp., Senior Notes | | 8.125 | % | 9/15/15 | | 850,000 | | 939,250 | |
Marine — 1.0% | | | | | | | | | |
Navios Maritime Acquisition Corp./Navios Acquisition Finance U.S. Inc., Senior Secured Notes | | 8.625 | % | 11/1/17 | | 1,450,000 | | 1,518,875 | (a) |
Navios Maritime Holdings Inc./Navios Maritime Finance II U.S. Inc., Senior Notes | | 8.125 | % | 2/15/19 | | 450,000 | | 452,250 | (a) |
Trico Shipping AS, Senior Secured Notes | | 13.875 | % | 11/1/14 | | 1,241,938 | | 1,012,180 | (a)(b) |
Total Marine | | | | | | | | 2,983,305 | |
Road & Rail — 3.1% | | | | | | | | | |
Florida East Coast Holdings Corp., Senior Notes | | 10.500 | % | 8/1/17 | | 920,000 | | 924,600 | (a)(c) |
Florida East Coast Industries Inc., Senior Secured Notes | | 8.125 | % | 2/1/17 | | 1,190,000 | | 1,249,500 | (a) |
See Notes to Financial Statements.
| | Western Asset Managed High Income Fund Inc. 2011 Annual Report | | 19 |
Western Asset Managed High Income Fund Inc.
Security | | Rate | | Maturity
Date | | Face
Amount† | | Value | |
Road & Rail — continued | | | | | | | | | |
Jack Cooper Holdings Corp., Senior Secured Notes | | 12.750 | % | 12/15/15 | | 1,198,000 | | $ 1,245,920 | (a)(g) |
Kansas City Southern de Mexico, Senior Notes | | 12.500 | % | 4/1/16 | | 571,000 | | 699,475 | |
Kansas City Southern de Mexico, Senior Notes | | 8.000 | % | 2/1/18 | | 2,030,000 | | 2,227,925 | |
Kansas City Southern Railway, Senior Notes | | 13.000 | % | 12/15/13 | | 136,000 | | 163,200 | |
Kansas City Southern Railway, Senior Notes | | 8.000 | % | 6/1/15 | | 140,000 | | 152,600 | |
Quality Distribution LLC/QD Capital Corp., Senior Secured Notes | | 9.875 | % | 11/1/18 | | 1,120,000 | | 1,181,600 | (a) |
RailAmerica Inc., Senior Secured Notes | | 9.250 | % | 7/1/17 | | 1,138,000 | | 1,266,025 | |
Total Road & Rail | | | | | | | | 9,110,845 | |
Trading Companies & Distributors — 0.4% | | | | | | | | | |
Ashtead Holdings PLC, Senior Secured Notes | | 8.625 | % | 8/1/15 | | 280,000 | | 294,000 | (a) |
H&E Equipment Services Inc., Senior Notes | | 8.375 | % | 7/15/16 | | 835,000 | | 870,488 | |
Total Trading Companies & Distributors | | | | | | | | 1,164,488 | |
Transportation — 1.0% | | | | | | | | | |
Hapag-Lloyd AG, Senior Notes | | 9.750 | % | 10/15/17 | | 1,600,000 | | 1,764,000 | (a) |
Syncreon Global Ireland Ltd./Syncreon Global Finance US Inc., Senior Notes | | 9.500 | % | 5/1/18 | | 1,000,000 | | 1,042,500 | (a) |
Total Transportation | | | | | | | | 2,806,500 | |
Transportation Infrastructure — 0.1% | | | | | | | | | |
Aguila 3 SA, Senior Secured Notes | | 7.875 | % | 1/31/18 | | 320,000 | | 333,600 | (a) |
Total Industrials | | | | | | | | 37,079,287 | |
Information Technology — 3.4% | | | | | | | | | |
Electronic Equipment, Instruments & Components — 0.7% | | | | | | | |
NXP BV/NXP Funding LLC, Senior Secured Notes | | 9.750 | % | 8/1/18 | | 1,830,000 | | 2,099,925 | (a) |
IT Services — 1.6% | | | | | | | | | |
Ceridian Corp., Senior Notes | | 12.250 | % | 11/15/15 | | 899,925 | | 960,670 | (c) |
First Data Corp., Senior Notes | | 5.625 | % | 11/1/11 | | 150,000 | | 150,750 | |
First Data Corp., Senior Notes | | 10.550 | % | 9/24/15 | | 2,434,559 | | 2,598,892 | (c) |
First Data Corp., Senior Notes | | 11.250 | % | 3/31/16 | | 270,000 | | 261,900 | |
Interactive Data Corp., Senior Notes | | 10.250 | % | 8/1/18 | | 520,000 | | 580,450 | (a) |
Total IT Services | | | | | | | | 4,552,662 | |
Semiconductors & Semiconductor Equipment — 1.1% | | | | | | | | | |
CDW LLC/CDW Finance Corp., Senior Notes | | 11.000 | % | 10/12/15 | | 430,000 | | 469,775 | |
CDW LLC/CDW Finance Corp., Senior Notes | | 11.500 | % | 10/12/15 | | 360,000 | | 392,400 | (c) |
Freescale Semiconductor Inc., Senior Notes | | 10.750 | % | 8/1/20 | | 310,000 | | 359,600 | (a) |
Freescale Semiconductor Inc., Senior Secured Notes | | 9.250 | % | 4/15/18 | | 400,000 | | 448,000 | (a) |
See Notes to Financial Statements.
20 | | Western Asset Managed High Income Fund Inc. 2011 Annual Report | | |
Schedule of investments (cont’d)
February 28, 2011
Western Asset Managed High Income Fund Inc.
Security | | Rate | | Maturity
Date | | Face
Amount† | | Value | |
Semiconductors & Semiconductor Equipment — continued | | | | | |
Freescale Semiconductor Inc., Senior Subordinated Notes | | 10.125 | % | 12/15/16 | | 1,260,000 | | $1,367,100 | |
Freescale Semiconductor Inc., Senior Toggle Notes | | 9.125 | % | 12/15/14 | | 219,555 | | 230,533 | (c) |
Total Semiconductors & Semiconductor Equipment | | | | | | | 3,267,408 | |
Total Information Technology | | | | | | | | 9,919,995 | |
Materials — 9.1% | | | | | | | | | |
Chemicals — 2.9% | | | | | | | | | |
Ashland Inc., Senior Notes | | 9.125 | % | 6/1/17 | | 140,000 | | 163,538 | |
CF Industries Inc., Senior Notes | | 7.125 | % | 5/1/20 | | 510,000 | | 573,750 | |
FMC Finance III SA, Senior Notes | | 6.875 | % | 7/15/17 | | 1,170,000 | | 1,238,737 | |
Georgia Gulf Corp., Senior Secured Notes | | 9.000 | % | 1/15/17 | | 735,000 | | 821,362 | (a) |
Hexion U.S. Finance Corp./Hexion Nova Scotia Finance ULC, Senior Secured Notes | | 9.000 | % | 11/15/20 | | 560,000 | | 597,100 | (a) |
Ineos Finance PLC, Senior Secured Notes | | 9.000 | % | 5/15/15 | | 700,000 | | 771,750 | (a) |
Kerling PLC, Senior Secured Notes | | 10.625 | % | 1/28/17 | | 582,000 | EUR | 915,569 | (a) |
LBI Escrow Corp., Senior Secured Notes | | 8.000 | % | 11/1/17 | | 935,000 | | 1,054,797 | (a) |
Lyondell Chemical Co., Senior Secured Notes | | 11.000 | % | 5/1/18 | | 290,000 | | 334,225 | |
Solutia Inc., Senior Notes | | 8.750 | % | 11/1/17 | | 585,000 | | 650,081 | |
Solutia Inc., Senior Notes | | 7.875 | % | 3/15/20 | | 740,000 | | 817,700 | |
Texas Petrochemical Corp. Group LLC, Senior Secured Notes | | 8.250 | % | 10/1/17 | | 470,000 | | 501,138 | (a) |
Total Chemicals | | | | | | | | 8,439,747 | |
Containers & Packaging — 2.5% | | | | | | | | | |
Ardagh Packaging Finance PLC, Senior Notes | | 9.125 | % | 10/15/20 | | 1,360,000 | | 1,499,400 | (a) |
Ardagh Packaging Finance PLC, Senior Secured Notes | | 7.375 | % | 10/15/17 | | 340,000 | EUR | 486,191 | (a) |
Berry Plastics Corp., Senior Secured Notes | | 9.500 | % | 5/15/18 | | 540,000 | | 544,050 | |
Packaging Dynamics Finance Corp., Senior Subordinated Notes | | 10.000 | % | 5/1/16 | | 680,000 | | 724,200 | (a) |
Radnor Holdings Inc., Senior Notes | | 11.000 | % | 3/15/10 | | 425,000 | | 0 | (b)(e)(g)(h) |
Reynolds Group Issuer Inc./Reynolds Group Issuer LLC, Senior Notes | | 9.000 | % | 4/15/19 | | 1,180,000 | | 1,236,050 | (a) |
Reynolds Group Issuer Inc./Reynolds Group Issuer LLC, Senior Notes | | 8.250 | % | 2/15/21 | | 970,000 | | 977,275 | (a) |
Solo Cup Co., Senior Secured Notes | | 10.500 | % | 11/1/13 | | 385,000 | | 394,625 | |
Viskase Cos. Inc., Senior Secured Notes | | 9.875 | % | 1/15/18 | | 1,280,000 | | 1,376,000 | (a)(e) |
Viskase Cos. Inc., Senior Secured Notes | | 9.875 | % | 1/15/18 | | 100,000 | | 107,500 | (a)(e) |
Total Containers & Packaging | | | | | | | | 7,345,291 | |
Metals & Mining — 1.9% | | | | | | | | | |
Atkore International Inc., Senior Secured Notes | | 9.875 | % | 1/1/18 | | 510,000 | | 557,813 | (a) |
FMG Resources (August 2006), Senior Notes | | 6.375 | % | 2/1/16 | | 510,000 | | 520,200 | (a) |
See Notes to Financial Statements.
| | Western Asset Managed High Income Fund Inc. 2011 Annual Report | | 21 |
Western Asset Managed High Income Fund Inc.
Security | | Rate | | Maturity
Date | | Face
Amount† | | Value | |
Metals & Mining — continued | | | | | | | | | |
FMG Resources (August 2006) Pty Ltd., Senior Notes | | 7.000 | % | 11/1/15 | | 170,000 | | $ 177,225 | (a) |
Midwest Vanadium Pty Ltd., Senior Secured Notes | | 11.500 | % | 2/15/18 | | 1,860,000 | | 1,925,100 | (a) |
Novelis Inc., Senior Notes | | 8.750 | % | 12/15/20 | | 1,240,000 | | 1,373,300 | (a) |
Ryerson Holding Corp., Senior Secured Notes | | 0.000 | % | 2/1/15 | | 1,720,000 | | 920,200 | |
Ryerson Inc., Senior Secured Notes | | 12.000 | % | 11/1/15 | | 20,000 | | 21,600 | |
Total Metals & Mining | | | | | | | | 5,495,438 | |
Paper & Forest Products — 1.8% | | | | | | | | | |
Appleton Papers Inc., Senior Secured Notes | | 11.250 | % | 12/15/15 | | 2,072,000 | | 1,958,040 | |
Boise Cascade LLC, Senior Subordinated Notes | | 7.125 | % | 10/15/14 | | 290,000 | | 291,087 | |
Neenah Paper Inc., Senior Notes | | 7.375 | % | 11/15/14 | | 93,000 | | 95,441 | |
NewPage Corp., Senior Secured Notes | | 11.375 | % | 12/31/14 | | 1,490,000 | | 1,493,725 | |
PE Paper Escrow GmbH, Senior Secured Notes | | 12.000 | % | 8/1/14 | | 340,000 | | 393,259 | (a) |
Smurfit Capital Funding PLC, Debentures | | 7.500 | % | 11/20/25 | | 240,000 | | 226,800 | |
Verso Paper Holdings LLC, Senior Secured Notes | | 8.750 | % | 2/1/19 | | 450,000 | | 472,500 | (a) |
Verso Paper Holdings LLC, Senior Subordinated Notes | | 11.375 | % | 8/1/16 | | 310,000 | | 330,925 | |
Total Paper & Forest Products | | | | | | | | 5,261,777 | |
Total Materials | | | | | | | | 26,542,253 | |
Telecommunication Services — 6.6% | | | | | | | | | |
Diversified Telecommunication Services — 3.7% | | | | | | | | | |
Cincinnati Bell Inc., Senior Notes | | 8.375 | % | 10/15/20 | | 580,000 | | 574,200 | |
Cincinnati Bell Telephone Co., Senior Debentures | | 6.300 | % | 12/1/28 | | 115,000 | | 91,425 | |
Cogent Communications Group Inc., Senior Secured Notes | | 8.375 | % | 2/15/18 | | 750,000 | | 780,000 | (a) |
Inmarsat Finance PLC, Senior Notes | | 7.375 | % | 12/1/17 | | 1,350,000 | | 1,458,000 | (a) |
Intelsat Jackson Holdings Ltd., Senior Notes | | 11.250 | % | 6/15/16 | | 30,000 | | 32,250 | |
Intelsat Jackson Holdings Ltd., Senior Notes | | 11.500 | % | 6/15/16 | | 1,140,000 | | 1,222,650 | |
Level 3 Financing Inc., Senior Notes | | 9.250 | % | 11/1/14 | | 600,000 | | 622,500 | |
Primus Telecommunications Group Inc., Senior Subordinated Secured Notes | | 14.250 | % | 5/20/13 | | 180,000 | | 182,475 | (c) |
TW Telecom Holdings Inc., Senior Notes | | 8.000 | % | 3/1/18 | | 1,035,000 | | 1,115,212 | |
West Corp., Senior Notes | | 8.625 | % | 10/1/18 | | 780,000 | | 830,700 | (a) |
West Corp., Senior Notes | | 7.875 | % | 1/15/19 | | 1,120,000 | | 1,152,200 | (a) |
Wind Acquisition Finance SA, Senior Notes | | 11.750 | % | 7/15/17 | | 500,000 | | 576,250 | (a) |
Wind Acquisition Finance SA, Senior Secured Notes | | 7.250 | % | 2/15/18 | | 480,000 | | 496,800 | (a) |
Wind Acquisition Holdings Finance SpA, Senior Notes | | 12.250 | % | 7/15/17 | | 755,016 | | 887,144 | (a)(c) |
See Notes to Financial Statements.
22 | | Western Asset Managed High Income Fund Inc. 2011 Annual Report | | |
Schedule of investments (cont’d)
February 28, 2011
Western Asset Managed High Income Fund Inc.
Security | | Rate | | Maturity
Date | | Face
Amount† | | Value | |
Diversified Telecommunication Services — continued | | | | | | | | | |
Windstream Corp., Senior Notes | | 8.625 | % | 8/1/16 | | 300,000 | | $ 318,750 | |
Windstream Corp., Senior Notes | | 7.750 | % | 10/15/20 | | 480,000 | | 499,800 | |
Total Diversified Telecommunication Services | | | | | | | | 10,840,356 | |
Wireless Telecommunication Services — 2.9% | | | | | | | | | |
Buccaneer Merger Sub Inc., Senior Notes | | 9.125 | % | 1/15/19 | | 930,000 | | 1,009,050 | (a) |
MetroPCS Wireless Inc., Senior Notes | | 7.875 | % | 9/1/18 | | 660,000 | | 700,425 | |
Sprint Capital Corp., Global Notes | | 6.900 | % | 5/1/19 | | 490,000 | | 496,737 | |
Sprint Capital Corp., Senior Notes | | 6.875 | % | 11/15/28 | | 350,000 | | 317,188 | |
Sprint Capital Corp., Senior Notes | | 8.750 | % | 3/15/32 | | 4,285,000 | | 4,477,825 | |
True Move Co., Ltd., Notes | | 10.750 | % | 12/16/13 | | 1,370,000 | | 1,472,750 | (a) |
Total Wireless Telecommunication Services | | | | | | | | 8,473,975 | |
Total Telecommunication Services | | | | | | | | 19,314,331 | |
Utilities — 6.3% | | | | | | | | | |
Electric Utilities — 1.2% | | | | | | | | | |
AES Red Oak LLC, Secured Notes | | 9.200 | % | 11/30/29 | | 870,000 | | 861,300 | |
Astoria Depositor Corp., Pass-Through Certificates | | 8.144 | % | 5/1/21 | | 950,000 | | 931,000 | (a) |
Reliant Energy Mid-Atlantic Power Holdings LLC, Senior Notes | | 9.681 | % | 7/2/26 | | 1,450,000 | | 1,551,500 | |
Total Electric Utilities | | | | | | | | 3,343,800 | |
Gas Utilities — 0.4% | | | | | | | | | |
Ferrellgas LP/Ferrellgas Finance Corp., Senior Notes | | 6.500 | % | 5/1/21 | | 460,000 | | 450,800 | (a) |
Suburban Propane Partners LP/Suburban Energy Finance Corp., Senior Notes | | 7.375 | % | 3/15/20 | | 740,000 | | 795,500 | |
Total Gas Utilities | | | | | | | | 1,246,300 | |
Independent Power Producers & Energy Traders — 4.7% | | | | | | | |
Calpine Corp., Senior Secured Notes | | 7.875 | % | 7/31/20 | | 230,000 | | 244,375 | (a) |
Calpine Corp., Senior Secured Notes | | 7.500 | % | 2/15/21 | | 1,640,000 | | 1,685,100 | (a) |
Calpine Corp., Senior Secured Notes | | 7.875 | % | 1/15/23 | | 870,000 | | 895,013 | (a) |
Dynegy Inc., Bonds | | 7.670 | % | 11/8/16 | | 160,000 | | 155,600 | |
Edison Mission Energy, Senior Notes | | 7.625 | % | 5/15/27 | | 545,000 | | 400,575 | |
Energy Future Holdings Corp., Senior Notes | | 10.875 | % | 11/1/17 | | 3,131,000 | | 2,614,385 | |
Energy Future Holdings Corp., Senior Notes | | 11.250 | % | 11/1/17 | | 1,017,069 | | 836,539 | (c) |
Energy Future Intermediate Holding Co. LLC, Senior Secured Notes | | 9.750 | % | 10/15/19 | | 270,000 | | 280,366 | |
Energy Future Intermediate Holding Co. LLC/ EFIH Finance Inc., Senior Secured Notes | | 10.000 | % | 12/1/20 | | 1,009,000 | | 1,058,292 | |
Foresight Energy LLC/Foresight Energy Corp., Senior Notes | | 9.625 | % | 8/15/17 | | 1,930,000 | | 2,084,400 | (a) |
Mirant Americas Generation LLC, Senior Notes | | 9.125 | % | 5/1/31 | | 2,575,000 | | 2,690,875 | |
See Notes to Financial Statements.
| | Western Asset Managed High Income Fund Inc. 2011 Annual Report | | 23 |
Western Asset Managed High Income Fund Inc.
Security | | Rate | | Maturity
Date | | Face
Amount† | | Value | |
Independent Power Producers & Energy Traders — continued | | | | | | | |
Mirant Mid Atlantic LLC, Pass-Through Certificates | | 10.060 | % | 12/30/28 | | 526,119 | | $ 594,514 | |
NRG Energy Inc., Senior Notes | | 7.375 | % | 1/15/17 | | 45,000 | | 47,531 | |
Total Independent Power Producers & Energy Traders | | | | | | 13,587,565 | |
Total Utilities | | | | | | | | 18,177,665 | |
Total Corporate Bonds & Notes (Cost — $241,820,585) | | | | | | | 257,380,420 | |
Collateralized Senior Loans — 2.4% | | | | | | | | | |
Consumer Discretionary — 1.0% | | | | | | | | | |
Diversified Consumer Services — 0.6% | | | | | | | | | |
Realogy Corp., Term Loan | | 13.500 | % | 10/15/17 | | 1,500,000 | | 1,662,188 | (i) |
Hotels, Restaurants & Leisure — 0.1% | | | | | | | | | |
CityCenter Holdings LLC, Term Loan | | 7.500 | % | 1/13/15 | | 250,000 | | 253,281 | (i) |
Media — 0.3% | | | | | | | | | |
Newsday LLC, Term Loan | | 10.500 | % | 8/1/13 | | 1,000,000 | | 1,066,875 | (i) |
Total Consumer Discretionary | | | | | | | | 2,982,344 | |
Energy — 0.2% | | | | | | | | | |
Energy Equipment & Services — 0.2% | | | | | | | | | |
Turbo Beta Ltd., Term Loan | | 14.500 | % | 3/15/18 | | 1,627,777 | | 431,035 | (e)(g)(i) |
Industrials — 0.1% | | | | | | | | | |
Aerospace & Defense — 0.1% | | | | | | | | | |
Hawker Beechcraft Acquisition Co. LLC, Term Loan | 2.262 - 2.303 | % | 3/26/14 | | 381,263 | | 342,243 | (i) |
Telecommunication Services — 0.9% | | | | | | | | | |
Diversified Telecommunication Services — 0.3% | | | | | | | | | |
Level 3 Financing Inc., Term Loan | | 11.500 | % | 3/13/14 | | 750,000 | | 808,750 | (i) |
Wireless Telecommunication Services — 0.6% | | | | | | | | | |
Vodafone Group PLC, Term Loan | | 6.875 | % | 8/11/15 | | 1,747,448 | | 1,764,923 | (c)(i) |
Total Telecommunication Services | | | | | | | | 2,573,673 | |
Utilities — 0.2% | | | | | | | | | |
Independent Power Producers & Energy Traders — 0.2% | | | | | | | | |
Energy Future Holdings, Term Loan B3 | 3.764 - 3.803 | % | 10/10/14 | | 663,146 | | 559,363 | (i) |
Total Collateralized Senior Loans (Cost — $7,701,192) | | | | | | | | 6,888,658 | |
Convertible Bonds & Notes — 1.4% | | | | | | | | | |
Consumer Discretionary — 0.7% | | | | | | | | | |
Diversified Consumer Services — 0.7% | | | | | | | | | |
Realogy Corp., Senior Subordinated Bonds | | 11.000 | % | 4/15/18 | | 2,000,000 | | 2,040,000 | (a)(g) |
Industrials — 0.6% | | | | | | | | | |
Marine — 0.6% | | | | | | | | | |
Horizon Lines Inc., Senior Notes | | 4.250 | % | 8/15/12 | | 2,100,000 | | 1,958,250 | |
| | | | | | | | | | | |
See Notes to Financial Statements.
24 | | Western Asset Managed High Income Fund Inc. 2011 Annual Report | | |
Schedule of investments (cont’d)
February 28, 2011
Western Asset Managed High Income Fund Inc.
Security | | Rate | | | | Shares | | Value | |
Materials — 0.1% | | | | | | | | | |
Chemicals — 0.1% | | | | | | | | | |
Hercules Inc. | | 6.500 | % | 6/30/29 | | 250,000 | | $ 196,875 | |
Total Convertible Bonds & Notes (Cost — $3,301,754) | | | | | | | | 4,195,125 | |
Common Stocks — 1.4% | | | | | | | | | |
Consumer Discretionary — 1.3% | | | | | | | | | |
Media — 1.3% | | | | | | | | | |
Charter Communications Inc., Class A Shares | | | | | | 82,229 | | 3,763,621 | * |
Energy — 0.1% | | | | | | | | | |
Oil, Gas & Consumable Fuels — 0.1% | | | | | | | | | |
SemGroup Corp., Class A Shares | | | | | | 5,433 | | 174,454 | * |
Industrials — 0.0% | | | | | | | | | |
Building Products — 0.0% | | | | | | | | | |
Ashton Woods USA LLC, Class B Membership | | | | | | 122 | | 54,906 | (e)(g) |
Nortek Inc. | | | | | | 1,738 | | 77,341 | * |
Total Industrials | | | | | | | | 132,247 | |
Total Common Stocks (Cost — $2,116,741) | | | | | | | | 4,070,322 | |
Convertible Preferred Stocks — 0.6% | | | | | | | | | |
Financials — 0.6% | | | | | | | | | |
Diversified Financial Services — 0.6% | | | | | | | | | |
Bank of America Corp. (Cost — $1,806,075) | | 7.250 | % | | | 1,820 | | 1,827,280 | |
Preferred Stocks — 1.6% | | | | | | | | | |
Financials — 1.6% | | | | | | | | | |
Commercial Banks — 0.4% | | | | | | | | | |
Banesto Holdings Ltd. | | 10.500 | % | | | 47,050 | | 1,180,663 | (a) |
Diversified Financial Services — 1.2% | | | | | | | | | |
Citigroup Capital XII | | 8.500 | % | | | 89,350 | | 2,376,710 | (d) |
Citigroup Capital XIII | | 7.875 | % | | | 46,675 | | 1,262,559 | (d) |
Total Diversified Financial Services | | | | | | | | 3,639,269 | |
Total Preferred Stocks (Cost — $4,645,023) | | | | | | | | 4,819,932 | |
| | | | Expiration
Date | | Warrants | | | |
Warrants — 0.1% | | | | | | | | | |
Buffets Restaurant Holdings | | | | 4/28/14 | | 891 | | 9 | *(e)(g) |
Charter Communications Inc. | | | | 11/30/14 | | 1,790 | | 16,110 | * |
Jack Cooper Holdings Corp. | | | | 12/15/17 | | 1,198 | | 53,910 | *(g) |
Nortek Inc. | | | | 12/7/14 | | 3,364 | | 25,230 | *(e)(g) |
SemGroup Corp. | | | | 11/30/14 | | 5,719 | | 61,765 | *(e) |
Turbo Beta Ltd. | | | | 11/1/14 | | 1 | | 0 | *(e)(g) |
Total Warrants (Cost — $46,471) | | | | | | | | 157,024 | |
Total Investments before Short-Term Investments
(Cost — $261,437,841) | | | | | | | | 279,338,761 | |
See Notes to Financial Statements.
| | Western Asset Managed High Income Fund Inc. 2011 Annual Report | | 25 |
Western Asset Managed High Income Fund Inc.
Security | | Rate | | Maturity
Date | | Face
Amount† | | Value | |
Short-Term Investments — 1.9% | | | | | | | | | |
U.S. Government Agencies — 0.0% | | | | | | | | | |
Federal National Mortgage Association (FNMA), Discount Notes (Cost — $98,955) | | 0.240 | % | 5/9/11 | | 99,000 | | $ 98,983 | (j)(k) |
Repurchase Agreements — 1.9% | | | | | | | | | |
Morgan Stanley tri-party repurchase agreement dated 2/28/11; Proceeds at maturity — $5,508,023; (Fully collateralized by various U.S. government agency obligations, 0.290% to 2.250% due 10/12/12 to 12/21/15; Market value — $5,618,483) (Cost — $5,508,000) | | 0.150 | % | 3/1/11 | | 5,508,000 | | 5,508,000 | |
Total Short-Term Investments (Cost — $5,606,955) | | | | | | | | 5,606,983 | |
Total Investments — 97.8% (Cost — $267,044,796#) | | | | | | | | 284,945,744 | |
Other Assets in Excess of Liabilities — 2.2% | | | | | | | | 6,314,804 | |
Total Net Assets — 100.0% | | | | | | | | $291,260,548 | |
† | Face amount denominated in U.S. dollars, unless otherwise noted. |
* | Non-income producing security. |
(a) | Security is exempt from registration under Rule 144A of the Securities Act of 1933. This security may be resold in transactions that are exempt from registration, normally to qualified institutional buyers. This security has been deemed liquid pursuant to guidelines approved by the Board of Directors, unless otherwise noted. |
(b) | The coupon payment on these securities is currently in default as of February 28, 2011. |
(c) | Payment-in-kind security for which part of the income earned may be paid as additional principal. |
(d) | Variable rate security. Interest rate disclosed is as of the most recent information available. |
(e) | Illiquid security (unaudited). |
(f) | Security has no maturity date. The date shown represents the next call date. |
(g) | Security is valued in good faith in accordance with procedures approved by the Board of Directors (See Note 1). |
(h) | The maturity principal is currently in default as of February 28, 2011. |
(i) | Interest rates disclosed represent the effective rates on collateralized senior loans. Ranges in interest rates are attributable to multiple contracts under the same loan. |
(j) | Rate shown represents yield-to-maturity. |
(k) | All or a portion of this security is held at the broker as collateral for open futures contracts. |
# | Aggregate cost for federal income tax purposes is $267,361,606. |
| |
| Abbreviation used in this schedule: |
| EUR — Euro |
See Notes to Financial Statements.
26 | | Western Asset Managed High Income Fund Inc. 2011 Annual Report | | |
Statement of assets and liabilities
February 28, 2011
Assets: | | | |
Investments, at value (Cost — $267,044,796) | | $284,945,744 | |
Foreign currency, at value (Cost — $1,225,696) | | 1,254,888 | |
Cash | | 57,576 | |
Interest receivable | | 5,683,085 | |
Receivable for securities sold | | 1,693,792 | |
Unrealized appreciation on forward foreign currency contracts | | 830 | |
Prepaid expenses | | 5,400 | |
Other receivables | | 210 | |
Total Assets | | 293,641,525 | |
| | | |
Liabilities: | | | |
Payable for securities purchased | | 2,081,250 | |
Investment management fee payable | | 178,539 | |
Unrealized depreciation on forward foreign currency contracts | | 11,901 | |
Payable to broker — variation margin on open futures contracts | | 3,906 | |
Directors’ fees payable | | 967 | |
Accrued expenses | | 104,414 | |
Total Liabilities | | 2,380,977 | |
Total Net Assets | | $291,260,548 | |
| | | |
Net Assets: | | | |
Par value ($0.001 par value; 46,669,922 shares issued and outstanding; 500,000,000 shares authorized) (Note 5) | | $ 46,670 | |
Paid-in capital in excess of par value | | 331,050,070 | |
Undistributed net investment income | | 2,513,289 | |
Accumulated net realized loss on investments, futures contracts and foreign currency transactions | | (60,286,105) | |
Net unrealized appreciation on investments, futures contracts and foreign currencies | | 17,936,624 | |
Total Net Assets | | $291,260,548 | |
| | | |
Shares Outstanding | | 46,669,922 | |
| | | |
Net Asset Value | | $6.24 | |
See Notes to Financial Statements.
| | Western Asset Managed High Income Fund Inc. 2011 Annual Report | | 27 |
Statement of operations
For the Year Ended February 28, 2011
Investment Income: | | | |
Interest | | $26,409,337 | |
Dividends | | 464,592 | |
Total Investment Income | | 26,873,929 | |
| | | |
Expenses: | | | |
Investment management fee (Note 2) | | 2,222,195 | |
Transfer agent fees | | 83,336 | |
Directors’ fees | | 59,910 | |
Audit and tax | | 48,650 | |
Shareholder reports | | 46,554 | |
Legal fees | | 42,850 | |
Stock exchange listing fees | | 36,790 | |
Insurance | | 8,489 | |
Custody fees | | 7,088 | |
Fund accounting fees | | 4,091 | |
Miscellaneous expenses | | 5,258 | |
Total Expenses | | 2,565,211 | |
Less: Compensating balance arrangements (Note 1) | | (108) | |
Net Expenses | | 2,565,103 | |
Net Investment Income | | 24,308,826 | |
| | | |
Realized and Unrealized Gain (Loss) on Investments, Futures Contracts and Foreign Currency Transactions (Notes 1, 3 and 4): | | | |
Net Realized Gain (Loss) From: | | | |
Investment transactions | | 11,269,003 | |
Futures contracts | | (295,742) | |
Foreign currency transactions | | 23,985 | |
Net Realized Gain | | 10,997,246 | |
Change in Net Unrealized Appreciation (Depreciation) From: | | | |
Investments | | 13,874,998 | |
Futures contracts | | 12,672 | |
Foreign currencies | | 21,018 | |
Change in Net Unrealized Appreciation (Depreciation) | | 13,908,688 | |
Net Gain on Investments, Futures Contracts and Foreign Currency Transactions | | 24,905,934 | |
Increase in Net Assets from Operations | | $49,214,760 | |
See Notes to Financial Statements.
28 | | Western Asset Managed High Income Fund Inc. 2011 Annual Report | | |
Statements of changes in net assets
For the Years Ended February 28, | | 2011 | | 2010 | |
| | | | | |
Operations: | | | | | |
Net investment income | | $ 24,308,826 | | $ 27,928,797 | |
Net realized gain (loss) | | 10,997,246 | | (34,055,662) | |
Change in net unrealized appreciation (depreciation) | | 13,908,688 | | 111,351,707 | |
Increase in Net Assets From Operations | | 49,214,760 | | 105,224,842 | |
| | | | | |
Distributions to Shareholders From (Note 1): | | | | | |
Net investment income | | (27,536,504) | | (27,228,527) | |
Decrease in Net Assets From Distributions to Shareholders | | (27,536,504) | | (27,228,527) | |
| | | | | |
Fund Share Transactions: | | | | | |
Reinvestment of distributions (350,406 and 499,780 shares issued, respectively) | | 2,116,318 | | 2,574,613 | |
Increase in Net Assets From Fund Share Transactions | | 2,116,318 | | 2,574,613 | |
Increase in Net Assets | | 23,794,574 | | 80,570,928 | |
| | | | | |
Net Assets: | | | | | |
Beginning of year | | 267,465,974 | | 186,895,046 | |
End of year* | | $291,260,548 | | $267,465,974 | |
* Includes undistributed net investment income of: | | $2,513,289 | | $5,340,051 | |
See Notes to Financial Statements.
| | Western Asset Managed High Income Fund Inc. 2011 Annual Report | | 29 |
Financial highlights
For a share of capital stock outstanding throughout each year ended February 28, unless otherwise noted:
| | 2011† | | 2010 | | 2009 | | 20081 | | 2007 | |
| | | | | | | | | | | |
Net asset value, beginning of year | | $5.77 | | $4.08 | | $6.21 | | $7.19 | | $6.94 | |
| | | | | | | | | | | |
Income (loss) from operations: | | | | | | | | | | | |
Net investment income | | 0.52 | | 0.61 | | 0.59 | | 0.55 | | 0.54 | |
Net realized and unrealized gain (loss) | | 0.54 | | 1.67 | | (2.16) | | (0.99) | | 0.21 | |
Total income (loss) from operations | | 1.06 | | 2.28 | | (1.57) | | (0.44) | | 0.75 | |
| | | | | | | | | | | |
Less distributions from: | | | | | | | | | | | |
Net investment income | | (0.59) | | (0.59) | | (0.56) | | (0.54) | | (0.50) | |
Total distributions | | (0.59) | | (0.59) | | (0.56) | | (0.54) | | (0.50) | |
| | | | | | | | | | | |
Net asset value, end of year | | $6.24 | | $5.77 | | $4.08 | | $6.21 | | $7.19 | |
| | | | | | | | | | | |
Market price, end of year | | $6.27 | | $6.02 | | $4.11 | | $5.60 | | $6.96 | |
Total return, based on NAV2,3 | | 19.31 | % | 58.43 | % | (26.43) | % | (5.86) | % | 12.11 | % |
Total return, based on Market Price3 | | 14.91 | % | 64.09 | % | (17.81) | % | (12.30) | % | 22.27 | % |
| | | | | | | | | | | |
Net assets, end of year (millions) | | $291 | | $267 | | $187 | | $283 | | $328 | |
| | | | | | | | | | | |
Ratios to average net assets: | | | | | | | | | | | |
Gross expenses | | 0.92 | % | 0.98 | % | 0.96 | % | 0.90 | % | 0.97% | 4 |
Net expenses5 | | 0.92 | | 0.98 | | 0.96 | | 0.90 | | 0.94 | 4,6 |
Net investment income | | 8.75 | | 11.68 | | 10.92 | | 8.04 | | 7.56 | |
| | | | | | | | | | | |
Portfolio turnover rate | | 96 | % | 87 | % | 54 | % | 58 | % | 67 | % |
1 | For the year ended February 29, 2008. |
2 | Performance figures may reflect compensating balance arrangements, fee waivers and/or expense reimbursements. In the absence of compensating balance arrangements, fee waivers and/or expense reimbursements, the total return would have been lower. Past performance is no guarantee of future results. |
3 | The total return calculation assumes that distributions are reinvested in accordance with the Fund’s dividend reinvestment plan. Past performance is no guarantee of future results. |
4 | Included in the expense ratios are certain non-recurring restructuring (and reorganization, if applicable) fees that were incurred by the Fund during the period. Without these fees, the gross and net expense ratios would have been 0.91%. |
5 | The impact of compensating balance arrangements, if any, was less than 0.01%. |
6 | Reflects fee waivers and/or expense reimbursements. |
† | Per share amounts have been calculated using the average shares method. |
See Notes to Financial Statements.
30 | | Western Asset Managed High Income Fund Inc. 2011 Annual Report | | |
Notes to financial statements
1. Organization and significant accounting policies
Western Asset Managed High Income Fund Inc. (the “Fund”) was incorporated in Maryland on December 24, 1992 and is registered as a diversified, closed-end management investment company under the Investment Company Act of 1940, as amended (the “1940 Act”). The Fund’s primary investment objective is high current income. Capital appreciation is a secondary objective.
The following are significant accounting policies consistently followed by the Fund and are in conformity with U.S. generally accepted accounting principles (“GAAP”). Estimates and assumptions are required to be made regarding assets, liabilities and changes in net assets resulting from operations when financial statements are prepared. Changes in the economic environment, financial markets and any other parameters used in determining these estimates could cause actual results to differ. Subsequent events have been evaluated through the date the financial statements were issued.
(a) Investment valuation. Debt securities are valued at the mean between the last quoted bid and asked prices provided by an independent pricing service, which are based on transactions in debt obligations, quotations from bond dealers, market transactions in comparable securities and various other relationships between securities. Futures contracts are valued daily at the settlement price established by the board of trade or exchange on which they are traded. Equity securities for which market quotations are available are valued at the last reported sales price or official closing price on the primary market or exchange on which they trade. When reliable prices are not readily available, such as when the value of a security has been significantly affected by events after the close of the exchange or market on which the security is principally traded, but before the Fund calculates its net asset value, the Fund values these securities as determined in accordance with procedures approved by the Fund’s Board of Directors. Short-term obligations with maturities of 60 days or less are valued at amortized cost, which approximates fair value.
The Fund has adopted Financial Accounting Standards Board Codification Topic 820 (“ASC Topic 820”). ASC Topic 820 establishes a single definition of fair value, creates a three-tier hierarchy as a framework for measuring fair value based on inputs used to value the Fund’s investments, and requires additional disclosure about fair value. The hierarchy of inputs is summarized below.
· Level 1 — quoted prices in active markets for identical investments
· Level 2 — other significant observable inputs (including quoted prices for similar investments, interest rates, prepayment speeds, credit risk, etc.)
· Level 3 — significant unobservable inputs (including the Fund’s own assumptions in determining the fair value of investments)
The inputs or methodology used for valuing securities are not necessarily an indication of the risk associated with investing in those securities.
| | Western Asset Managed High Income Fund Inc. 2011 Annual Report | | 31 |
The Fund uses valuation techniques to measure fair value that are consistent with the market approach and/or income approach, depending on the type of security and the particular circumstance. The market approach uses prices and other relevant information generated by market transactions involving identical or comparable securities. The income approach uses valuation techniques to discount estimated future cash flows to present value.
The following is a summary of the inputs used in valuing the Fund’s assets and liabilities carried at fair value:
ASSETS |
Description | | Quoted Prices
(Level 1) | | Other Significant
Observable Inputs
(Level 2) | | Significant
Unobservable
Inputs
(Level 3) | | Total | |
Long-term investments†: | | | | | | | | | | |
Corporate bonds & notes | | — | | | $256,134,500 | | | $1,245,920 | | | $257,380,420 | | |
Collateralized senior loans | | — | | | 6,888,658 | | | — | | | 6,888,658 | | |
Convertible bonds & notes | | — | | | 2,155,125 | | | 2,040,000 | | | 4,195,125 | | |
Common stocks: | | | | | | | | | | | | | |
Industrials | | $ 77,341 | | | — | | | 54,906 | | | 132,247 | | |
Other common stocks | | 3,938,075 | | | — | | | — | | | 3,938,075 | | |
Convertible preferred stocks | | 1,827,280 | | | — | | | — | | | 1,827,280 | | |
Preferred stocks | | 3,639,269 | | | 1,180,663 | | | — | | | 4,819,932 | | |
Warrants | | 16,110 | | | 61,765 | | | 79,149 | | | 157,024 | | |
Total long-term investments | | $9,498,075 | | | $266,420,711 | | | $3,419,975 | | | $279,338,761 | | |
Short-term investments† | | — | | | 5,606,983 | | | — | | | 5,606,983 | | |
Total investments | | $9,498,075 | | | $272,027,694 | | | $3,419,975 | | | $284,945,744 | | |
Other financial instruments: | | | | | | | | | | | | | |
Futures contracts | | $ 94,372 | | | — | | | — | | | $ 94,372 | | |
Forward foreign currency contracts | | — | | | $ 830 | | | — | | | 830 | | |
Total other financial instruments | | $ 94,372 | | | $ 830 | | | — | | | $ 95,202 | | |
Total | | $9,592,447 | | | $272,028,524 | | | $3,419,975 | | | $285,040,946 | | |
LIABILITIES |
Description | | Quoted Prices
(Level 1) | | Other Significant
Observable Inputs
(Level 2) | | Significant
Unobservable
Inputs
(Level 3) | | Total | |
Other financial instruments: | | | | | | | | | | |
Futures contracts | | $78,677 | | | — | | | — | | | $78,677 | | |
Forward foreign currency contracts | | — | | | $11,901 | | | — | | | 11,901 | | |
Total | | $78,677 | | | $11,901 | | | — | | | $90,578 | | |
† | See Schedule of Investments for additional detailed categorizations. |
32 | | Western Asset Managed High Income Fund Inc. 2011 Annual Report | | |
Notes to financial statements (cont’d)
The following is a reconciliation of investments in which significant unobservable inputs (Level 3) were used in determining fair value:
| | Corporate
Bonds & | | Convertible
Bonds & | | | Common
Stocks | | | | | | |
Investments in Securities | | Notes | | Notes | | Industrials | | Warrants | | Total | |
Balance as of February 28, 2010 | | $ 0 | * | — | | — | | $42,900 | | $ 42,900 | |
Accrued premiums/discounts | | 366 | | $ 6,002 | | — | | — | | 6,368 | |
Realized gain (loss) | | — | | — | | — | | — | | — | |
Change in unrealized appreciation (depreciation)1 | | 58,544 | | 860,670 | | $ 54,906 | | 36,249 | | 1,010,369 | |
Net purchases (sales) | | 1,187,010 | | 1,173,328 | | 0 | | 0 | | 2,360,338 | |
Transfers into Level 3 | | — | | — | | — | | — | | — | |
Transfers out of Level 3 | | — | | — | | — | | — | | — | |
Balance as of February 28, 2011 | | $1,245,920 | | $2,040,000 | | $ 54,906 | | $79,149 | | $3,419,975 | |
Net change in unrealized appreciation (depreciation) for investments in securities still held at February 28, 20111 | | $ 58,544 | | $ 860,670 | | $ 54,906 | | $36,249 | | $1,010,369 | |
* | Value is less than $1. |
| |
1 | This amount is included in the change in net unrealized appreciation (depreciation) in the accompanying Statement of Operations. Change in unrealized appreciation (depreciation) includes net unrealized appreciation (depreciation) resulting from changes in investment values during the reporting period and the reversal of previously recorded unrealized appreciation (depreciation) when gains or losses are realized. |
(b) Repurchase agreements. The Fund may enter into repurchase agreements with institutions that its investment adviser has determined are creditworthy. Each repurchase agreement is recorded at cost. Under the terms of a typical repurchase agreement, the Fund acquires a debt security subject to an obligation of the seller to repurchase, and of the Fund to resell, the security at an agreed-upon price and time, thereby determining the yield during the Fund’s holding period. When entering into repurchase agreements, it is the Fund’s policy that its custodian or a third party custodian, acting on the Fund’s behalf, take possession of the underlying collateral securities, the market value of which, at all times, at least equals the principal amount of the repurchase transaction, including accrued interest. To the extent that any repurchase transaction maturity exceeds one business day, the value of the collateral is marked-to-market and measured against the value of the agreement in an effort to ensure the adequacy of the collateral. If the counterparty defaults, the Fund generally has the right to use the collateral to satisfy the terms of the repurchase transaction. However, if the market value of the collateral declines during the period in which the Fund seeks to assert its rights or if bankruptcy proceedings are commenced with respect to the seller of the security, realization of the collateral by the Fund may be delayed or limited.
(c) Futures contracts. The Fund uses futures contracts to gain exposure to, or hedge against, changes in the value of interest rates or foreign currencies. A futures contract represents a commitment for the future purchase or sale of an asset at a specified price on a specified date.
| | Western Asset Managed High Income Fund Inc. 2011 Annual Report | | 33 |
Upon entering into a futures contract, the Fund is required to deposit cash or cash equivalents with a broker in an amount equal to a certain percentage of the contract amount. This is known as the “initial margin” and subsequent payments (“variation margin”) are made or received by the Fund each day, depending on the daily fluctuation in the value of the contract. For certain futures, including foreign denominated futures, variation margin is not settled daily, but is recorded as a net variation margin payable or receivable. Futures contracts are valued daily at the settlement price established by the board of trade or exchange on which they are traded. The daily changes in contract value are recorded as unrealized gains or losses in the Statement of Operations and the Fund recognizes a realized gain or loss when the contract is closed.
Futures contracts involve, to varying degrees, risk of loss in excess of the amounts reflected in the financial statements. In addition, there is the risk that the Fund may not be able to enter into a closing transaction because of an illiquid secondary market.
(d) Forward foreign currency contracts. The Fund enters into a forward foreign currency contract to hedge against foreign currency exchange rate risk on its non-U.S. dollar denominated securities or to facilitate settlement of a foreign currency denominated portfolio transaction. A forward foreign currency contract is an agreement between two parties to buy and sell a currency at a set price with delivery and settlement at a future date. The contract is marked-to-market daily and the change in value is recorded by the Fund as an unrealized gain or loss. When a forward foreign currency contract is closed, through either delivery or offset by entering into another forward foreign currency contract, the Fund recognizes a realized gain or loss equal to the difference between the value of the contract at the time it was opened and the value of the contract at the time it is closed.
Forward foreign currency contracts involve elements of market risk in excess of the amounts reflected on the Statement of Assets and Liabilities. The Fund bears the risk of an unfavorable change in the foreign exchange rate underlying the forward foreign currency contract. Risks may also arise upon entering into these contracts from the potential inability of the counterparties to meet the terms of their contracts.
(e) Foreign currency translation. Investment securities and other assets and liabilities denominated in foreign currencies are translated into U.S. dollar amounts based upon prevailing exchange rates on the date of valuation. Purchases and sales of investment securities and income and expense items denominated in foreign currencies are translated into U.S. dollar amounts based upon prevailing exchange rates on the respective dates of such transactions.
The Fund does not isolate that portion of the results of operations resulting from fluctuations in foreign exchange rates on investments from the
34 | | Western Asset Managed High Income Fund Inc. 2011 Annual Report | | |
Notes to financial statements (cont’d)
fluctuations arising from changes in market prices of securities held. Such fluctuations are included with the net realized and unrealized gain or loss on investments.
Net realized foreign exchange gains or losses arise from sales of foreign currencies, including gains and losses on forward foreign currency contracts, currency gains or losses realized between the trade and settlement dates on securities transactions, and the difference between the amounts of dividends, interest, and foreign withholding taxes recorded on the Fund’s books and the U.S. dollar equivalent of the amounts actually received or paid. Net unrealized foreign exchange gains and losses arise from changes in the values of assets and liabilities, other than investments in securities, on the date of valuation, resulting from changes in exchange rates.
Foreign security and currency transactions may involve certain considerations and risks not typically associated with those of U.S. dollar denominated transactions as a result of, among other factors, the possibility of lower levels of governmental supervision and regulation of foreign securities markets and the possibility of political or economic instability.
(f) Credit and market risk. The Fund invests in high-yield instruments that are subject to certain credit and market risks. The yields of high-yield obligations reflect, among other things, perceived credit and market risks. The Fund’s investment in securities rated below investment grade typically involves risks not associated with higher rated securities including, among others, greater risk related to timely and ultimate payment of interest and principal, greater market price volatility and less liquid secondary market trading.
(g) Counterparty risk and credit-risk-related contingent features of derivative instruments. The Fund may invest in certain securities or engage in other transactions, where the Fund is exposed to counterparty credit risk in addition to broader market risks. The Fund may invest in securities of issuers, which may also be considered counterparties as trading partners in other transactions. This may increase the risk of loss in the event of default or bankruptcy by the counterparty or if the counterparty otherwise fails to meet its contractual obligations. The Fund’s investment manager attempts to mitigate counterparty risk by (i) periodically assessing the creditworthiness of its trading partners, (ii) monitoring and/or limiting the amount of its net exposure to each individual counterparty based on its assessment and (iii) requiring collateral from the counterparty for certain transactions. Market events and changes in overall economic conditions may impact the assessment of such counterparty risk by the investment manager. In addition, declines in the values of underlying collateral received may expose the Fund to increased risk of loss.
The Fund has entered into master agreements with certain of its derivative counterparties that provide for general obligations, representations, agreements, collateral, events of default or termination and credit related contingent
| | Western Asset Managed High Income Fund Inc. 2011 Annual Report | | 35 |
features. The credit related contingent features include, but are not limited to, a percentage decrease in the Fund’s net assets or NAV over a specified period of time. If these credit related contingent features were triggered, the derivatives counterparty could terminate the positions and demand payment or require additional collateral.
As of February 28, 2011, the Fund held forward foreign currency contracts with credit related contingent features which had a liability position of $11,901. If a contingent feature in the master agreements would have been triggered, the Fund would have been required to pay this amount to its derivatives counterparties.
(h) Security transactions and investment income. Security transactions are accounted for on a trade date basis. Interest income, adjusted for amortization of premium and accretion of discount, is recorded on the accrual basis. Dividend income is recorded on the ex-dividend date. The cost of investments sold is determined by use of the specific identification method. To the extent any issuer defaults or a credit event occurs that impacts the issuer, the Fund may halt any additional interest income accruals and consider the realizability of interest accrued up to the date of default or credit event.
(i) Distributions to shareholders. Distributions from net investment income for the Fund, if any, are declared quarterly and paid on a monthly basis. Distributions of net realized gains, if any, are declared at least annually. Distributions are recorded on the ex-dividend date and are determined in accordance with income tax regulations, which may differ from GAAP.
(j) Compensating balance arrangements. The Fund has an arrangement with its custodian bank whereby a portion of the custodian’s fees is paid indirectly by credits earned on the Fund’s cash on deposit with the bank. This amount is shown as a reduction of expenses in the Statement of Operations.
(k) Federal and other taxes. It is the Fund’s policy to comply with the federal income and excise tax requirements of the Internal Revenue Code of 1986 (the “Code”), as amended, applicable to regulated investment companies. Accordingly, the Fund intends to distribute its taxable income and net realized gains, if any, to shareholders in accordance with timing requirements imposed by the Code. Therefore, no federal or state income tax provision is required in the Fund’s financial statements.
Management has analyzed the Fund’s tax positions taken on income tax returns for all open tax years and has concluded that as of February 28, 2011, no provision for income tax is required in the Fund’s financial statements. The Fund’s federal and state income and federal excise tax returns for tax years for which the applicable statutes of limitations have not expired are subject to examination by Internal Revenue Service and state departments of revenue.
36 | | Western Asset Managed High Income Fund Inc. 2011 Annual Report | | |
Notes to financial statements (cont’d)
(l) Reclassification. GAAP requires that certain components of net assets be reclassified to reflect permanent differences between financial and tax reporting. These reclassifications have no effect on net assets or net asset values per share. During the current year, the following reclassifications have been made:
| Undistributed
Net Investment Income | | Accumulated Net
Realized Loss | | Paid-in Capital | |
(a) | — | | | $38,635,215 | | | $(38,635,215 | ) | |
(b) | $400,916 | | | (400,916 | ) | | — | | |
(a) | Reclassifications are primarily due to the expiration of a capital loss carryforward. |
(b) | Reclassifications are primarily due to foreign currency transactions treated as ordinary income for tax purposes, differences between book and tax amortization of premium on fixed-income securities and losses from mortgage-backed securities treated as capital losses for tax purposes. |
2. Investment management agreement and other transactions with affiliates
Legg Mason Partners Fund Advisor, LLC (“LMPFA”) is the Fund’s investment manager. Western Asset Management Company (“Western Asset”) and Western Asset Management Company Limited (“Western Asset Limited”) are the Fund’s subadvisers. LMPFA, Western Asset and Western Asset Limited are wholly-owned subsidiaries of Legg Mason, Inc. (“Legg Mason”).
LMPFA provides administrative and certain oversight services to the Fund. The Fund pays an investment management fee, calculated daily and paid monthly, at an annual rate of 0.80% of the Fund’s average daily net assets.
LMPFA delegates to Western Asset the day-to-day portfolio management of the Fund. Western Asset Limited provides certain advisory services to the Fund relating to currency transactions and investments in non-U.S. dollar denominated securities. Western Asset Limited does not receive any compensation from the Fund and is paid by Western Asset for its services to the Fund. For its services, LMPFA pays Western Asset 70% of the net management fee it receives from the Fund. In turn, Western Asset pays Western Asset Limited a subadvisory fee of 0.30% on the assets managed by Western Asset Limited.
All officers and one Director of the Fund are employees of Legg Mason or its affiliates and do not receive compensation from the Fund.
3. Investments
During the year ended February 28, 2011, the aggregate cost of purchases and proceeds from sales of investments (excluding short-term investments) and U.S Government & Agency Obligations were as follows:
| | Investments | | U.S. Government &
Agency Obligations | |
Purchases | | $259,301,480 | | $643,893 | | |
Sales | | 266,919,304 | | 649,135 | | |
| | Western Asset Managed High Income Fund Inc. 2011 Annual Report | | 37 |
At February 28, 2011, the aggregate gross unrealized appreciation and depreciation of investments for federal income tax purposes were as follows:
Gross unrealized appreciation | | $25,717,415 | |
Gross unrealized depreciation | | (8,133,277 | ) |
Net unrealized appreciation | | $17,584,138 | |
At February 28, 2011, the Fund had the following open futures contracts:
| | Number of
Contracts | | Expiration
Date | | Basis
Value | | Market
Value | | Unrealized
Gain (Loss) | |
Contracts to Buy: | | | | | | | | | | | |
U.S. Treasury Ultra Long-Term Bonds | | 25 | | 6/11 | | $ 2,995,472 | | $ 3,089,844 | | $ 94,372 | | |
| | | | | | | | | | | | |
Contracts to Sell: | | | | | | | | | | | | |
U.S. Treasury 5-Year Notes | | 100 | | 6/11 | | 11,615,073 | | 11,693,750 | | (78,677 | ) | |
Net unrealized gain on open futures contracts | | | | | | | | | | $ 15,695 | | |
At February 28, 2011, the Fund had the following open forward foreign currency contracts:
Foreign Currency | | Counterparty | | Local
Currency | | Market
Value | | Settlement
Date | | Unrealized
Gain (Loss) | |
Contracts to Sell: | | | | | | | | | | | |
Euro | | Citibank, N.A | | 578,467 | | $797,469 | | 5/18/11 | | $ (9,106 | ) | |
Euro | | Citibank, N.A. | | 217,146 | | 299,355 | | 5/18/11 | | 830 | | |
Euro | | Royal Bank of Scotland PLC | | 575,000 | | 792,689 | | 5/18/11 | | (2,795 | ) | |
Net unrealized loss on open forward foreign currency contracts | | | | | | | | $(11,071 | ) | |
4. Derivative instruments and hedging activities
Financial Accounting Standards Board Codification Topic 815 requires enhanced disclosure about an entity’s derivative and hedging activities.
Below is a table, grouped by derivative type that provides information about the fair value and the location of derivatives within the Statement of Assets and Liabilities at February 28, 2011.
ASSET DERIVATIVES1 |
| | Interest Rate
Contracts Risk | | Foreign
Exchange
Contracts Risk | | Total | |
Futures contracts2 | | $94,372 | | — | | $94,372 | |
Forward foreign currency contracts | | — | | $830 | | 830 | |
Total | | $94,372 | | $830 | | $95,202 | |
38 | | Western Asset Managed High Income Fund Inc. 2011 Annual Report | | |
Notes to financial statements (cont’d)
LIABILITY DERIVATIVES1 |
| | Interest Rate
Contracts Risk | | Foreign
Exchange
Contracts Risk | | Total | |
Futures contracts2 | | $78,677 | | — | | $78,677 | |
Forward foreign currency contracts | | — | | $11,901 | | 11,901 | |
Total | | $78,677 | | $11,901 | | $90,578 | |
1 | Generally, the balance sheet location for asset derivatives is receivables/net unrealized appreciation (depreciation) and for liability derivatives is payables/net unrealized appreciation (depreciation). |
| |
2 | Includes cumulative appreciation (depreciation) of futures contracts as reported in the footnotes. Only variation margin is reported within the receivables and/or payables of the Statement of Assets and Liabilities. |
The following tables provide information about the effect of derivatives and hedging activities on the Fund’s Statement of Operations for the year ended February 28, 2011. The first table provides additional detail about the amounts and sources of gains (losses) realized on derivatives during the year. The second table provides additional information about the change in unrealized appreciation (depreciation) resulting from the Fund’s derivatives and hedging activities during the year.
AMOUNT OF REALIZED GAIN (LOSS) ON DERIVATIVES RECOGNIZED |
| | Interest Rate
Contracts Risk | | Foreign
Exchange
Contracts Risk | | Total | |
Futures contracts | | $(295,742 | ) | | — | | | $(295,742 | ) | |
Forward foreign currency contracts | | — | | | $36,356 | | | 36,356 | | |
Total | | $(295,742 | ) | | $36,356 | | | $(259,386 | ) | |
CHANGE IN UNREALIZED APPRECIATION (DEPRECIATION) ON DERIVATIVES RECOGNIZED |
| | Interest Rate
Contracts Risk | | Foreign
Exchange
Contracts Risk | | Total | |
Futures contracts | | $12,672 | | | — | | | $ 12,672 | | |
Forward foreign currency contracts | | — | | | $(10,073 | ) | | (10,073 | ) | |
Total | | $12,672 | | | $(10,073 | ) | | $ 2,599 | | |
During the year ended February 28, 2011, the volume of derivative activity for the Fund was as follows:
| | Average
Market Value | |
Futures contracts (to buy) | | $ 3,256,971 | |
Futures contracts (to sell) | | 11,825,946 | |
Forward foreign currency contracts (to buy)† | | 179,464 | |
Forward foreign currency contracts (to sell) | | 1,272,925 | |
† At February 28 2011, there were no open positions held in this derivative.
| | Western Asset Managed High Income Fund Inc. 2011 Annual Report | | 39 |
5. Capital shares
On November 16, 1999, the Fund commenced a share repurchase plan. Since the inception of the repurchase plan, the Fund repurchased (and retired) 1,213,500 shares with a total cost of $10,210,959. For the year ended February 28, 2011, the Fund did not repurchase shares.
6. Distributions subsequent to February 28, 2011
On February 14, 2011, the Fund’s Board declared three distributions, each in the amount of $0.0475 per share, payable on March 25, 2011, April 29, 2011 and May 27, 2011 to shareholders of record on March 18, 2011, April 21, 2011 and May 20, 2011, respectively.
7. Income tax information and distributions to shareholders
The tax character of distributions paid during the fiscal years ended February 28, was as follows:
| | 2011 | | 2010 | |
Distributions Paid From: | | | | | |
Ordinary Income | | $27,536,504 | | $27,228,527 | |
| | |
As of February 28, 2011, the components of accumulated earnings on a tax basis were as follows: | | |
| | | | | |
Undistributed ordinary income — net | | | | $ 2,865,298 | |
Capital loss carryforward* | | | | (59,953,600 | ) |
Other book/tax temporary differences(a) | | | | (367,704 | ) |
Unrealized appreciation (depreciation)(b) | | | | 17,619,814 | |
| | | | | |
Total accumulated earnings (losses) — net | | | | $(39,836,192 | ) |
* As of February 28, 2011, the Fund had the following net capital loss carryforward remaining:
Year of Expiration | | Amount |
2/29/2012 | | $ (4,980,975 | ) |
2/28/2017 | | (14,045,166 | ) |
2/28/2018 | | (35,714,593 | ) |
2/28/2019 | | (5,212,866 | ) |
| | $(59,953,600 | ) |
These amounts will be available to offset future taxable capital gains. Under the recently enacted Regulated Investment Company Modernization Act of 2010, the Fund will be permitted to carry forward capital losses incurred in taxable years beginning after December 22, 2010 for an unlimited period. However, any losses incurred during those future years will be required to be utilized prior to the losses incurred in pre-enactment taxable years. As a result of this ordering rule, pre-enactment capital loss carryforwards may be more likely to expire unused. Additionally, post-enactment capital losses that are carried forward will retain their character as either short-term or long-term capital losses rather than being considered all short-term as under previous law.
(a) | Other book/tax temporary differences are attributable primarily to the the realization for tax purposes of unrealized gains (losses) on certain futures and currency contracts, differences between book/tax accrual of interest income on securities in default and book/tax differences in the timing of the deductibility of various expenses. |
(b) | The difference between book-basis and tax-basis unrealized appreciation (depreciation) is attributable primarily to the tax deferral of losses on wash sales and the difference between book and tax amortization methods for premiums on fixed-income securities. |
40 | | Western Asset Managed High Income Fund Inc. 2011 Annual Report | | |
Report of independent registered public accounting firm
The Board of Directors and Shareholders
Western Asset Managed High Income Fund Inc.:
We have audited the accompanying statement of assets and liabilities of Western Asset Managed High Income Fund Inc., including the schedule of investments, as of February 28, 2011, and the related statement of operations for the year then ended, the statements of changes in net assets for each of the years in the two-year period then ended, and the financial highlights for each of the years in the five-year period then ended. These financial statements and financial highlights are the responsibility of the Fund’s management. Our responsibility is to express an opinion on these financial statements and financial highlights based on our audits.
We conducted our audits in accordance with the standards of the Public Company Accounting Oversight Board (United States). Those standards require that we plan and perform the audit to obtain reasonable assurance about whether the financial statements and financial highlights are free of material misstatement. An audit includes examining, on a test basis, evidence supporting the amounts and disclosures in the financial statements. Our procedures included confirmation of securities owned as of February 28, 2011, by correspondence with the custodian and brokers or by other appropriate auditing procedures. An audit also includes assessing the accounting principles used and significant estimates made by management, as well as evaluating the overall financial statement presentation. We believe that our audits provide a reasonable basis for our opinion.
In our opinion, the financial statements and financial highlights referred to above present fairly, in all material respects, the financial position of Western Asset Managed High Income Fund Inc. as of February 28, 2011, the results of its operations for the year then ended, the changes in its net assets for each of the years in the two-year period then ended, and the financial highlights for each of the years in the five-year period then ended, in conformity with U.S. generally accepted accounting principles.
New York, New York
April 19, 2011
| | Western Asset Managed High Income Fund Inc. | | 41 |
Board approval of management and subadvisory agreements (unaudited)
Background
The Investment Company Act of 1940, as amended (the “1940 Act”), requires that the Board of Directors (the “Board”) of Western Asset Managed High Income Fund Inc. (the “Fund”), including a majority of its members that are not considered to be “interested persons” under the 1940 Act (the “Independent Directors”) voting separately, approve on an annual basis the continuation of the investment management contract (the “Management Agreement”) with the Fund’s manager, Legg Mason Partners Fund Advisor, LLC (the “Manager”) and the sub-advisory agreements (individually, a “Sub-Advisory Agreement,” and, collectively, the “Sub-Advisory Agreements”) with the Manager’s affiliates, Western Asset Management Company (“Western Asset”) and Western Asset Management London (“Western Asset London” and, together with Western Asset, the “Sub-Advisers”). At a meeting (the “Contract Renewal Meeting”) held in-person on November 10 and 11, 2010, the Board, including the Independent Directors, considered and approved the continuation of each of the Management Agreement and the Sub-Advisory Agreements for an additional one-year term. To assist in its consideration of the renewals of the Management Agreement and the Sub-Advisory Agreements, the Board received and considered a variety of information (together with the information provided at the Contract Renewal Meeting, the “Contract Renewal Information”) about the Manager and Sub-Advisers, as well as the management and sub-advisory arrangements for the Fund and the other closed-end funds in the same complex under the Board’s supervision (collectively, the “Legg Mason Closed-End Funds”), certain portions of which are discussed below. A presentation made by the Manager and Western Asset to the Board at the Contract Renewal Meeting in connection with its evaluations of the Management Agreement and the Sub-Advisory Agreements encompassed the Fund and other Legg Mason Closed-End Funds. In addition to the Contract Renewal Information, the Board received performance and other information throughout the year related to the respective services rendered by the Manager and the Sub-Advisers to the Fund. The Board’s evaluation took into account the information received throughout the year and also reflected the knowledge and familiarity gained as members of the Board of the Fund and the other Legg Mason Closed-End Funds with respect to the services provided to the Fund by the Manager and the Sub-Advisers.
The Manager provides the Fund with investment advisory and administrative services pursuant to the Management Agreement and the Sub-Advisers together provide the Fund with certain investment sub-advisory services pursuant to the Sub-Advisory Agreements. The discussion below covers both the advisory and administrative functions being rendered by the Manager, each such function being encompassed by the Management Agreement, and the investment sub-advisory functions being rendered by the Sub-Advisers.
42 | | Western Asset Managed High Income Fund Inc. | | |
Board approval of management and subadvisory agreements (unaudited) (cont’d)
In its deliberations regarding renewal of the Management Agreement and the Sub-Advisory Agreements, the Board, including the Independent Directors, considered the factors below.
Nature, extent and quality of the services under the management agreement and sub-advisory agreements
The Board received and considered Contract Renewal Information regarding the nature, extent and quality of services provided to the Fund by the Manager and the Sub-Advisers under the Management Agreement and the Sub-Advisory Agreements, respectively, during the past year. The Board also reviewed Contract Renewal Information regarding the Fund’s compliance policies and procedures established pursuant to the 1940 Act.
The Board reviewed the qualifications, backgrounds and responsibilities of the Fund’s senior personnel and the portfolio management team primarily responsible for the day-to-day portfolio management of the Fund. The Board also considered, based on its knowledge of the Manager and its affiliates, the Contract Renewal Information and the Board’s discussions with the Manager and Western Asset at the Contract Renewal Meeting, the general reputation and investment performance records of the Manager, Western Asset and their affiliates and the financial resources available to the corporate parent of the Manager and the Sub-Advisers, Legg Mason, Inc. (“Legg Mason”), to support their activities in respect of the Fund and the other Legg Mason Closed-End Funds.
The Board considered the responsibilities of the Manager and the Sub-Advisers under the Management Agreement and the Sub-Advisory Agreements, respectively, including the Manager’s coordination and oversight of services provided to the Fund by the Sub-Advisers and others and Western Asset’s coordination and oversight of the services provided to the Fund by Western Asset London. The Management Agreement permits the Manager to delegate certain of its responsibilities, including its investment advisory duties thereunder, provided that the Manager, in each case, will supervise the activities of the delegee. Pursuant to this provision of the Management Agreement, the Manager does not provide day-to-day portfolio management services to the Fund. Rather, portfolio management services for the Fund are provided by Western Asset pursuant to the Sub-Advisory Agreement (the “Western Asset Sub-Advisory Agreement”) between the Manager and Western Asset. The Western Asset Sub-Advisory Agreement permits Western Asset to delegate certain of its responsibilities, including its investment sub-advisory duties thereunder, provided that Western Asset, in each case, will supervise the activities of the delegee. Pursuant to this provision of the Western Asset Sub-Advisory Agreement, Western Asset London helps to provide certain investment sub-advisory services to the Fund pursuant to a separate Sub-Advisory Agreement with Western Asset.
| | Western Asset Managed High Income Fund Inc. | | 43 |
In reaching its determinations regarding continuation of the Management Agreement and the Sub-Advisory Agreements, the Board took into account that Fund shareholders, in pursuing their investment goals and objectives, likely purchased their shares based upon the reputation and the investment style, philosophy and strategy of the Manager and Western Asset, as well as the resources available to the Manager and the Sub-Advisers.
The Board concluded that, overall, the nature, extent and quality of the management, investment advisory and other services provided to the Fund under the Management Agreement and the Sub-Advisory Agreements have been satisfactory under the circumstances.
Fund performance
The Board received and considered performance information and analyses (the “Lipper Performance Information”) for the Fund, as well as for a group of funds (the “Performance Universe”) selected by Lipper, Inc. (“Lipper”), an independent provider of investment company data. The Board was provided with a description of the methodology Lipper used to determine the similarity of the Fund with the funds included in the Performance Universe. The Performance Universe consisted of the Fund and all non-leveraged high current yield closed-end funds, as classified by Lipper, regardless of asset size. The Performance Universe consisted of seven funds for each of the 1- and 3-year periods ended June 30, 2010 and five funds for each of the 5- and 10-year periods ended June 30, 2010. The Board noted that it had received and discussed with the Manager and Western Asset information throughout the year at periodic intervals comparing the Fund’s performance against its benchmark and, at the Board’s request, its peer funds as selected by Lipper.
The Lipper Performance Information comparing the Fund’s performance to that of the Performance Universe based on net asset value per share showed, among other things, that the Fund’s performance for each of the 1- and 3-year periods ended June 30, 2010 was ranked second among the funds in the Performance Universe for that period and was better than the Performance Universe median and that the Fund’s performance for each of the 5- and 10-year periods ended June 30, 2010 was ranked third among the funds in the Performance Universe for that period and was at the Performance Universe median. The Board noted that the small number of funds in the Performance Universe made meaningful comparisons difficult. The Board also considered the volatile market conditions during 2008 and the Fund’s performance in relation to its benchmark and in absolute terms.
Based on its review of the Fund’s performance, which included consideration of all of the factors noted above, the Board concluded that, under the circumstances, the Fund’s performance supported continuation of the
44 | | Western Asset Managed High Income Fund Inc. | | |
Board approval of management and subadvisory agreements (unaudited) (cont’d)
Management Agreement and the Sub-Advisory Agreements for an additional period not to exceed one year.
Management fees and expense ratios
The Board reviewed and considered the management fee (the “Management Fee”) payable by the Fund to the Manager under the Management Agreement and the sub-advisory fees (the “Sub-Advisory Fees”) payable to the Sub-Advisers under the Sub-Advisory Agreements in light of the nature, extent and overall quality of the management, sub-advisory and other services provided by the Manager and the Sub-Advisers. The Board noted that the Sub-Advisory Fees payable to Western Asset under the Western Asset Subadvisory Agreement are paid by the Manager, not the Fund, and, accordingly, that the retention of Western Asset does not increase the fees or expenses otherwise incurred by the Fund’s shareholders. Similarly, the Board noted that the Sub-Advisory Fees payable to Western Asset London under its Sub-Advisory Agreement with Western Asset are paid by Western Asset, not the Fund, and, accordingly, that the retention of Western Asset London does not increase the fees or expenses otherwise incurred by the Fund’s shareholders.
Additionally, the Board received and considered information and analyses prepared by Lipper (the “Lipper Expense Information”) comparing the Management Fee and the Fund’s overall expenses with those of funds in an expense universe (the “Expense Universe”) selected and provided by Lipper. The comparison was based upon the constituent funds’ latest fiscal years. The Expense Universe consisted of the Fund and six other non-leveraged high current yield closed-end funds, as classified by Lipper. The seven funds in the Expense Universe, which included two other Legg Mason Closed-End Funds managed by Western Asset, had average net common share assets ranging from $26.8 million to $348.6 million. One of the Funds in the Expense Universe was larger than the Fund and five were smaller.
The Lipper Expense Information comparing the Management Fee as well as the Fund’s actual total expenses to the Fund’s Expense Universe showed that the Management Fee on both a contractual basis and on an actual basis (i.e., giving effect to any voluntary fee waivers implemented by the Manager with respect to the Fund and by the managers of the other Expense Universe funds), was ranked third among the funds in the Expense Universe and was at the Expense Universe median. The Lipper Expense Information also showed that the Fund’s actual total expenses were ranked second among the funds in the Expense Universe and were better than the Expense Universe median. The Board noted, among other things, that the small number of funds in the Expense Universe, which included funds varying widely in size and two other funds managed by Western Asset, made meaningful comparisons difficult.
| | Western Asset Managed High Income Fund Inc. | | 45 |
At the Contract Renewal Meeting, the Board considered and approved a request (the “Cost Allocation Request”) from the Manager to allocate to the Fund certain fund accounting and financial reporting costs, previously paid by the Manager on a voluntary basis, in line with industry practice and the terms of the Management Agreement. In doing so, the Board reviewed supporting information and analyses provided by the Manager, including information and analyses as to the impact of the Cost Allocation Request on Fund expenses.
The Board also reviewed Contract Renewal Information regarding fees charged by the Manager to other U.S. clients investing primarily in an asset class similar to that of the Fund, including, where applicable, separate accounts. The Board was advised that the fees paid by such other clients generally are lower, and may be significantly lower, than the Management Fee. The Contract Renewal Information discussed the significant differences in scope of services provided to the Fund and to these other clients, noting that the Fund is provided with administrative services, office facilities, Fund officers (including the Fund’s chief executive, chief financial and chief compliance officers), and that the Manager coordinates and oversees the provision of services to the Fund by other fund service providers. The Contract Renewal Information included an analysis of complex-wide management fees provided by the Manager. At the Contract Renewal Meeting, the Board noted that the Contract Renewal Information included information regarding management fees paid by open-end mutual funds in the same complex (the “Legg Mason Open-End Funds”) and that such information indicated that the management fees paid by the Legg Mason Closed-End Funds generally were higher than those paid by the Legg Mason Open-End Funds. The Manager, in response, discussed differences between the services provided to the Fund and the other Legg Mason Closed-end Funds and services provided to the Legg Mason Open-End Funds. The Board considered the fee comparisons in light of the services provided in managing these other types of clients and funds.
Taking all of the above into consideration, the Board determined that the Management Fee and the Sub-Advisory Fees were reasonable in light of the nature, extent and overall quality of the management, investment advisory and other services provided to the Fund under the Management Agreement and the Sub-Advisory Agreements.
Manager profitability
The Board, as part of the Contract Renewal Information, received an analysis of the profitability to the Manager and its affiliates in providing services to the Fund for the Manager’s fiscal years ended March 31, 2010 and March 31, 2009. The Board also received profitability information with respect to the Legg Mason fund complex as a whole. In addition, the Board received Contract Renewal Information with respect to the Manager’s
46 | | Western Asset Managed High Income Fund Inc. | | |
Board approval of management and subadvisory agreements (unaudited) (cont’d)
revenue and cost allocation methodologies used in preparing such profitability data. In 2007, the Board received a report from an outside consultant that had reviewed the Manager’s methodologies and the Board was assured by the Manager at the Contract Renewal Meeting that there had been no significant changes in those methodologies since the report was rendered. The profitability to each of the Sub-Advisers was not considered to be a material factor in the Board’s considerations since Western Asset’s Sub-Advisory Fees are paid by the Manager, not the Fund, and the Sub-Advisory Fees for Western Asset London are paid by Western Asset, not the Fund. The profitability analysis presented to the Board as part of the Contract Renewal Information indicated that profitability to the Manager in providing services to the Fund had declined by 1 percent over the period covered by the analysis. The Manager presented information to the Board showing that the Cost Allocation Request would increase profitability slightly. The Board concluded that profitability remained at a level that was not excessive in light of the nature, extent and overall quality of the management, investment advisory and other services provided to the Fund by the Manager and the Sub-Advisers.
Economies of scale
The Board received and discussed Contract Renewal Information concerning whether the Manager realizes economies of scale if the Fund’s assets grow. The Board noted that because the Fund is a closed-end fund with no current plans to seek additional assets beyond maintaining its dividend reinvestment plan, any significant growth in its assets generally will occur through appreciation in the value of the Fund’s investment portfolio, rather than sales of additional shares in the Fund. The Board determined that the Management Fee structure was appropriate under present circumstances.
Other benefits to the manager and the sub-advisers
The Board considered other benefits received by the Manager, the Sub-Advisers and their affiliates as a result of their relationship with the Fund and did not regard such benefits as excessive.
* * * * * *
In light of all of the foregoing and other relevant factors, the Board determined that, under the circumstances, continuation of the Management Agreement and the Sub-Advisory Agreements would be consistent with the interests of the Fund and its shareholders and unanimously voted to continue each Agreement for a period of one additional year.
No single factor reviewed by the Board was identified by the Board as the principal factor in determining whether to approve continuation of the Management Agreement and the Sub-Advisory Agreements, and each Board member attributed different weights to the various factors. The Independent Directors were advised by separate independent legal counsel throughout
| | Western Asset Managed High Income Fund Inc. | | 47 |
the process. Prior to the Contract Renewal Meeting, the Board received a memorandum prepared by the Manager discussing its responsibilities in connection with the proposed continuation of the Management Agreement and the Sub-Advisory Agreements as part of the Contract Renewal Information and the Independent Directors separately received a memorandum discussing such responsibilities from their independent counsel. Prior to voting, the Independent Directors also discussed the proposed continuation of the Management Agreement and the Sub-Advisory Agreements in private sessions with their independent legal counsel at which no representatives of the Manager were present.
48 | | Western Asset Managed High Income Fund Inc. | | |
Additional information (unaudited)
Information about Directors and Officers
The business and affairs of Western Asset Managed High Income Fund Inc. (the “Fund”) are conducted by management under the supervision and subject to the direction of its Board of Directors. The business address of each Director is c/o R. Jay Gerken, 620 Eighth Avenue, New York, New York 10018. Information pertaining to the Directors and officers of the Fund is set forth below.
Independent Directors†:
Carol L. Colman | | |
Year of birth | | 1946 |
Position(s) held with Fund1 | | Director and Member of the Nominating and Audit Committees, Class I |
Term of office1 and length of time served | | Since 2007 |
Principal occupation(s) during past five years | | President, Colman Consulting Company (consulting) |
Number of portfolios in fund complex overseen by Director (including the Fund) | | 24 |
Other board memberships held by Director | | None |
Daniel P. Cronin | | |
Year of birth | | 1946 |
Position(s) held with Fund1 | | Director and Member of the Nominating and Audit Committees, Class II |
Term of office1 and length of time served | | Since 2007 |
Principal occupation(s) during past five years | | Retired; formerly, Associate General Counsel, Pfizer Inc. (prior to and including 2004) |
Number of portfolios in fund complex overseen by Director (including the Fund) | | 24 |
Other board memberships held by Director | | None |
Paolo M. Cucchi | | |
Year of birth | | 1941 |
Position(s) held with Fund1 | | Director and Member of the Nominating and Audit Committees, Class III |
Term of office1 and length of time served | | Since 1993 |
Principal occupation(s) during past five years | | Professor of French and Italian at Drew University; formerly, Vice President and Dean of College of Liberal Arts at Drew University (1984 to 2009) |
Number of portfolios in fund complex overseen by Director (including the Fund) | | 24 |
Other board memberships held by Director | | None |
| | Western Asset Managed High Income Fund Inc. | | 49 |
Independent Directors cont’d
Leslie H. Gelb | | |
Year of birth | | 1937 |
Position(s) held with Fund1 | | Director and Member of the Nominating and Audit Committees, Class I |
Term of office1 and length of time served | | Since 2008 |
Principal occupation(s) during past five years | | President Emeritus and Senior Board Fellow (since 2003), The Council on Foreign Relations; formerly, President, (prior to 2003), the Council on Foreign Relations; formerly, Columnist, Deputy Editorial Page Editor and Editor, Op-Ed Page, The New York Times |
Number of portfolios in fund complex overseen by Director (including the Fund) | | 24 |
Other board memberships held by Director | | Director of two registered investment companies advised by Blackstone Asia Advisors LLC: India Fund, Inc. and Asia Tigers Fund, Inc. (since 1994) |
William R. Hutchinson | | |
Year of birth | | 1942 |
Position(s) held with Fund1 | | Director and Member of the Nominating and Audit Committees, Class III |
Term of office1 and length of time served | | Since 2001 |
Principal occupation(s) during past five years | | President, W.R. Hutchinson & Associates Inc. (Consulting) (since 2001) |
Number of portfolios in fund complex overseen by Director (including the Fund) | | 24 |
Other board memberships held by Director | | Director (Non-Executive Chairman of the Board (since December 1, 2009)), Associated Banc Corp. (banking) (since 1994) |
Riordan Roett | | |
Year of birth | | 1938 |
Position(s) held with Fund1 | | Director and Member of the Nominating and Audit Committees, Class I |
Term of office1 and length of time served | | Since 2008 |
Principal occupation(s) during past five years | | The Sarita and Don Johnston Professor of Political Science and Director of Western Hemisphere Studies, Paul H. Nitze School of Advanced International Studies, The John Hopkins University (since 1973) |
Number of portfolios in fund complex overseen by Director (including the Fund) | | 24 |
Other board memberships held by Director | | None |
50 | | Western Asset Managed High Income Fund Inc. | | |
Additional information (unaudited) (cont’d)
Information about Directors and Officers
Independent Directors cont’d
Jeswald W. Salacuse | | |
Year of birth | | 1938 |
Position(s) held with Fund1 | | Director and Member of the Nominating and Audit Committees, Class II |
Term of office1 and length of time served | | Since 2008 |
Principal occupation(s) during past five years | | Henry J. Braker Professor of Commercial Law, The Fletcher School of Law and Diplomacy, Tufts University (since 1986); President and Member, Arbitration Tribunal, World Bank/ICSID (since 2004) |
Number of portfolios in fund complex overseen by Director (including the Fund) | | 24 |
Other board memberships held by Director | | Director of two registered investment companies advised by Blackstone Asia Advisors LLC; India Fund, Inc. and Asia Tigers Fund, Inc. (since 1993) |
Interested Director and Officer:
R. Jay Gerken, CFA2 | | |
Year of birth | | 1951 |
Position(s) held with Fund1 | | Director, Chairman, President and Chief Executive Officer, Class II |
Term of office1 and length of time served | | Since 2002 |
Principal occupation(s) during past five years | | Managing Director of Legg Mason & Co., LLC (“Legg Mason & Co.”) (since 2005); Officer and Trustee/Director of 165 funds associated with Legg Mason Partners Fund Advisor, LLC (“LMPFA”) or its affiliates (since 2006) and Legg Mason & Co. predecessors (prior to 2006); President and Chief Executive Officer (“CEO”) of LMPFA (since 2006); President and CEO of Smith Barney Fund Management LLC (“SBFM”) and Citi Fund Management Inc. (“CFM”) (formerly registered investment advisers) (since 2002); formerly, Chairman, President and CEO, Travelers Investment Adviser Inc. (prior to 2005) |
Number of portfolios in fund complex overseen by Director (including the Fund) | | 136 |
Other board memberships held by Director | | Former Trustee, Consulting Group Capital Markets Funds (11 funds) (prior to 2006) |
| | Western Asset Managed High Income Fund Inc. | | 51 |
Additional Officers:
Ted P. Becker | | |
Legg Mason | | |
620 Eighth Avenue, New York, NY 10018 |
Year of birth | | 1951 |
Position(s) held with Fund1 | | Chief Compliance Officer |
Term of office1 and length of time served | | Since 2006 |
Principal occupation(s) during past five years | | Director of Global Compliance at Legg Mason (since 2006); Chief Compliance Officer of LMPFA (since 2006); Managing Director of Compliance of Legg Mason & Co. (since 2005); Chief Compliance Officer of certain mutual funds associated with Legg Mason & Co. or its affiliates (since 2006) and Legg Mason & Co. predecessors (prior to 2006) |
John Chiota | | |
Legg Mason | | |
100 First Stamford Place, Stamford, CT 06902 |
Year of birth | | 1968 |
Position(s) with Fund1 | | Identity Theft Prevention Officer |
Term of office1 and length of time served | | Since 2008 |
Principal occupation(s) during past five years | | Identity Theft Prevention Officer of certain mutual funds associated with Legg Mason & Co. or its affiliates (since 2008); Chief Anti-Money Laundering Compliance Officer of certain mutual funds associated with Legg Mason & Co. or its affiliates (since 2006); Vice President of Legg Mason & Co. (since 2006) and Legg Mason & Co. predecessors (prior to 2006); formerly, Chief Anti-Money Laundering Compliance Officer of TD Waterhouse (prior to 2004) |
Robert I. Frenkel | | |
Legg Mason | | |
100 First Stamford Place, Stamford, CT 06902 |
Year of birth | | 1954 |
Position(s) held with Fund1 | | Secretary and Chief Legal Officer |
Term of office1 and length of time served | | Since 2003 |
Principal occupation(s) during past five years | | Vice President and Deputy General Counsel of Legg Mason (since 2006); Managing Director and General Counsel of Global Mutual Funds for Legg Mason & Co. (since 2006) and Legg Mason & Co. predecessors (since 1994); Secretary and Chief Legal Officer of certain mutual funds associated with Legg Mason & Co. or its affiliates (since 2006) and Legg Mason & Co. predecessors (prior to 2006) |
52 | | Western Asset Managed High Income Fund Inc. | | |
Additional information (unaudited) (cont’d)
Information about Directors and Officers
Additional Officers cont’d
Thomas C. Mandia | | |
Legg Mason | | |
100 First Stamford Place, Stamford, CT 06902 |
Year of birth | | 1962 |
Position(s) held with Fund1 | | Assistant Secretary |
Term of office1 and length of time served | | Since 2006 |
Principal occupation(s) during past five years | | Managing Director and Deputy General Counsel of Legg Mason & Co. (since 2005) and Legg Mason & Co. predecessors (prior to 2005); Secretary of LMPFA (since 2006); Assistant Secretary of certain mutual funds associated with Legg Mason & Co. or its affiliates (since 2006) and Legg Mason & Co. predecessors (prior to 2006); Secretary of SBFM and CFM (since 2002) |
Kaprel Ozsolak | | |
Legg Mason | | |
55 Water Street, New York, NY 10041 |
Year of birth | | 1965 |
Position(s) held with Fund1 | | Chief Financial Officer |
Term of office1 and length of time served | | Since 2004 |
Principal occupation(s) during past five years | | Director of Legg Mason & Co. (since 2005); Chief Financial Officer of certain mutual funds associated with Legg Mason & Co. or its affiliates (since 2007) and Legg Mason & Co. predecessors (prior to 2007); formerly, Treasurer of certain mutual funds associated with Legg Mason & Co. or its affiliates (prior to 2010) and Legg Mason & Co. predecessors (prior to 2005); formerly, Controller of certain mutual funds associated with Legg Mason & Co. predecessors (prior to 2004) |
Steven Frank | | |
Legg Mason | | |
55 Water Street, New York, NY 10041 |
Year of birth | | 1967 |
Position(s) held with Fund1 | | Treasurer |
Term of office1 and length of time served | | Since 2010 |
Principal occupation(s) during past five years | | Vice President of Legg Mason & Co. and Legg Mason & Co. predecessors (since 2002); Treasurer of certain mutual funds associated with Legg Mason & Co. or its affiliates (since 2010); formerly, Controller of certain mutual funds associated with Legg Mason & Co. or its affiliates (prior to 2010); formerly, Assistant Controller of certain mutual funds associated with Legg Mason & Co. predecessors (prior to 2005) |
| | Western Asset Managed High Income Fund Inc. | | 53 |
Additional Officers cont’d
Jeanne M. Kelly | | |
Legg Mason | | |
620 Eighth Avenue, New York, NY 10018 |
Year of birth | | 1951 |
Position(s) with Fund1 | | Senior Vice President |
Term of office1 and length of time served | | Since 2007 |
Principal occupation(s) during past five years | | Senior Vice President of certain mutual funds associated with Legg Mason & Co. or its affiliates (since 2007); Senior Vice President of LMPFA (since 2006); Managing Director of Legg Mason & Co. (since 2005) and Legg Mason & Co. predecessors (prior to 2005) |
† | Directors who are not “interested persons” of the Fund within the meaning of Section 2(a)(19) of the 1940 Act. |
1 | The Fund’s Board of Directors is divided into three classes: Class I, Class II and Class III. The terms of office of the Class I, II and III Directors expire at the Annual Meetings of Stockholders in the year 2011, year 2012 and year 2013, respectively, or thereafter in each case when their respective successors are duly elected and qualified. The Fund’s executive officers are chosen each year at the first meeting of the Fund’s Board of Directors following the Annual Meeting of Stockholders, to hold office until the meeting of the Board following the next Annual Meeting of Stockholders and until their successors are duly elected and qualified. |
2 | Mr. Gerken is an “interested person” of the Fund as defined in the 1940 Act because Mr. Gerken is an officer of LMPFA and certain of its affiliates. |
54 | | Western Asset Managed High Income Fund Inc. | | |
Annual chief executive officer and chief financial officer certifications (unaudited)
The Fund’s Chief Executive Officer (“CEO”) has submitted to the NYSE the required annual certification and the Fund also has included the Certifications of the Fund’s CEO and Chief Financial Officer required by Section 302 of the Sarbanes-Oxley Act in the Fund’s Form N-CSR filed with the SEC for the period of this report.
| | Western Asset Managed High Income Fund Inc. | | 55 |
Dividend reinvestment plan (unaudited)
Under the Fund’s Dividend Reinvestment Plan (“Plan”), a shareholder whose shares of Common Stock are registered in his own name will have all distributions from the Fund reinvested automatically by American Stock Transfer & Trust Company (“AST”), as agent under the Plan, unless the shareholder elects to receive cash. Distributions with respect to shares registered in the name of a broker-dealer or other nominee (that is, in “street name”) will be reinvested by the broker or nominee in additional shares under the Plan, unless the service is not provided by the broker or nominee or the shareholder elects to receive distributions in cash. Investors who own Common Stock registered in street name should consult their broker-dealers for details regarding reinvestment. All distributions to Fund shareholders who do not participate in the Plan will be paid by check mailed directly to the record holder by or under the direction of AST as dividend-paying agent.
If the Fund declares a dividend or capital gains distribution payable either in shares of Common Stock or in cash, shareholders who are not Plan participants will receive cash, and Plan participants will receive the equivalent amount in shares of Common Stock. When the market price of the Common Stock is equal to or exceeds the net asset value per share of the Common Stock on the Valuation Date (as defined below), Plan participants will be issued shares of Common Stock valued at the net asset value most recently determined or, if net asset value is less than 95% of the then current market price of the Common Stock, then at 95% of the market value. The Valuation Date is the dividend or capital gains distribution record date or, if that date is not a New York Stock Exchange (“NYSE”) trading day, the immediately preceding trading day.
If the market price of the Common Stock is less than the net asset value of the Common Stock, a broker-dealer not affiliated with Legg Mason, Inc., as purchasing agent for Plan participants (“Purchasing Agent”), will buy Common Stock in the open market, on the NYSE or elsewhere, for the participants’ accounts. If, following the commencement of the purchases and before the Purchasing Agent has completed its purchases, the market price exceeds the net asset value of the Common Stock, the average per share purchase price paid by the Purchasing Agent may exceed the net asset value of the Common Stock, resulting in the acquisition of fewer shares than if the dividend or capital gains distribution had been paid in Common Stock issued by the Fund at net asset value. Additionally, if the market price exceeds the net asset value of shares before the Purchasing Agent has completed its purchases, the Purchasing Agent is permitted to cease purchasing shares and the Fund may issue the remaining shares at a price equal to the greater of (a) net asset value or (b) 95% of the then current market price. In a case where the Purchasing Agent has terminated open market purchases and the Fund has issued the remaining shares, the number of shares received by the participant in respect of the cash dividend or distribution will be based on the weighted average of prices paid for shares purchased in the open market
56 | | Western Asset Managed High Income Fund Inc. | | |
Dividend reinvestment plan (unaudited) (cont’d)
and the price at which the Fund issues the remaining shares. AST will apply all cash received as a dividend or capital gains distribution to purchase Common Stock on the open market as soon as practicable after the payable date of the dividend or capital gains distribution, but in no event later than 30 days after that date, except when necessary to comply with applicable provisions of the federal securities laws.
AST will maintain all shareholder accounts in the Plan and will furnish written confirmations of all transactions in each account, including information needed by a shareholder for personal and tax records. The automatic reinvestment of dividends and capital gains distributions will not relieve Plan participants of any income tax that may be payable on the dividends or capital gains distributions. Common Stock in the account of each Plan participant will be held by AST on behalf of the Plan participant, and each shareholder’s proxy will include those shares purchased pursuant to the Plan.
Plan participants are subject to no charge for reinvesting dividends and capital gains distributions. AST’s fees for handling the reinvestment of dividends and capital gains distributions will be paid by the Fund. No brokerage charges apply with respect to shares of Common Stock issued directly by the Fund as a result of dividends or capital gains distributions payable either in Common Stock or in cash. Each Plan participant will, however, bear a proportionate share of brokerage commissions incurred with respect to open market purchases made in connection with the reinvestment of dividends or capital gains distributions.
Experience under the Plan may indicate that changes to it are desirable. The Fund reserves the right to amend or terminate the Plan as applied to any dividend or capital gains distribution paid subsequent to written notice of the change sent to participants at least 30 days before the record date for the dividend or capital gains distribution. The Plan also may be amended or terminated by AST, with the Fund’s prior written consent, on at least 30 days’ written notice to Plan participants. All correspondence concerning the Plan should be directed by mail to American Stock Transfer & Trust Company, 59 Maiden Lane, New York, New York 10038 or by telephone at 1-888-888-0151.
| | Western Asset Managed High Income Fund Inc. | | 57 |
Important tax information (unaudited)
The following information is provided with respect to the distributions paid during the taxable year ended February 28, 2011:
Record date: | | Monthly | | Monthly | | Monthly | |
Payable date: | | January 2010 -
February 2010 | | March 2010 -
December 2010 | | January 2011 -
February 2011 | |
Ordinary income: | | | | | | | |
Qualified dividend income for individuals | | 1.19% | | 0.63% | | 0.45% | |
Dividends qualifying for the dividends received deduction for corporations | | 1.19% | | 0.43% | | 0.45% | |
Please retain this information for your records.
Western Asset
Managed High Income Fund Inc.
Directors | | Western Asset Managed High Income Fund Inc. | | Independent registered public accounting firm |
Carol L. Colman | | 55 Water Street | | KPMG LLP |
Daniel P. Cronin | | New York, NY 10041 | | 345 Park Avenue |
Paolo M. Cucchi | | | | New York, NY 10154 |
Leslie H. Gelb | | Investment manager | | |
R. Jay Gerken, CFA | | Legg Mason Partners Fund Advisor, LLC | | Legal counsel |
Chairman | | | | Simpson Thacher & Bartlett LLP |
William R. Hutchinson | | Subadvisers | | 425 Lexington Avenue |
Riordan Roett | | Western Asset Management Company | | New York, NY 10017 |
Jeswald W. Salacuse | | Western Asset Management Company Limited | | |
| | | | New York Stock Exchange Symbol |
Officers | | Custodian | | MHY |
R. Jay Gerken, CFA | | State Street Bank and Trust Company | | |
President and Chief Executive Officer | | 1 Lincoln Street | | |
Kaprel Ozsolak | | Boston, MA 02111 | | |
Chief Financial Officer | | | | |
Ted P. Becker | | Transfer agent | | |
Chief Compliance Officer | | American Stock Transfer & Trust Company | | |
Robert I. Frenkel | | 59 Maiden Lane | | |
Secretary and Chief Legal Officer | | New York, NY 10038 | | |
Thomas Mandia | | | | |
Assistant Secretary | | | | |
Steven Frank | | | | |
Treasurer | | | | |
Jeanne M. Kelly | | | | |
Senior Vice President | | | | |
Privacy policy
We are committed to keeping nonpublic personal information about you secure and confidential. This notice is intended to help you understand how we fulfill this commitment. From time to time, we may collect a variety of personal information about you, including:
· Information we receive from you on applications and forms, via the telephone, and through our websites;
· Information about your transactions with us, our affiliates, or others (such as your purchases, sales, or account balances); and
· Information we receive from consumer reporting agencies.
We do not disclose nonpublic personal information about our customers or former customers, except to our affiliates (such as broker-dealers or investment advisers with the Legg Mason family of companies) or as is otherwise permitted by applicable law or regulation. For example, we may share this information with others in order to process your transactions or service an account. We may also provide this information to companies that perform marketing services on our behalf, such as printing and mailing, or to other financial institutions with whom we have joint marketing agreements. When we enter into such agreements, we will require these companies to protect the confidentiality of this information and to use it only to perform the services for which we hired them.
With respect to our internal security procedures, we maintain physical, electronic, and procedural safeguards to protect your nonpublic personal information, and we restrict access to this information.
If you decide at some point either to close your account(s) or become an inactive customer, we will continue to adhere to our privacy policies and practices with respect to your nonpublic personal information.
| | | | |
| | NOT PART OF THE ANNUAL REPORT | | |
| | | | |
Western Asset Managed High Income Fund Inc.
Western Asset Managed High Income Fund Inc.
55 Water Street
New York, NY 10041
Notice is hereby given in accordance with Section 23(c) of the Investment Company Act of 1940, as amended, that from time to time the Fund may purchase at market price shares of its common stock in the open market.
The Fund files its complete schedule of portfolio holdings with the Securities and Exchange Commission (“SEC”) for the first and third quarters of each fiscal year on Form N-Q. The Fund’s Forms N-Q are available on the SEC website at www.sec.gov. The Fund’s Forms N-Q may be reviewed and copied at the SEC Public Reference Room in Washington, D.C., and information on the operation of the Public Reference Room may be obtained by calling 1-800-SEC-0330. To obtain information on Form N-Q from the Fund, shareholders can call 1-888-777-0102.
Information on how the Fund voted proxies relating to portfolio securities during the prior 12-month period ended June 30th of each year and a description of the policies and procedures that the Fund uses to determine how to vote proxies related to portfolio transactions are available (1) without charge, upon request, by calling 1-888-777-0102, (2) on the Fund’s website at www.leggmason.com/cef and (3) on the SEC’s website at www.sec.gov.
This report is transmitted to the shareholders of Western Asset Managed High Income Fund Inc. for their information. This is not a prospectus, circular or representation intended for use in the purchase of shares of the Fund or any securities mentioned in this report.
American Stock
Transfer & Trust Company
59 Maiden Lane
New York, NY 10038
WASX010547 4/11 SR11-1355
ITEM 2. CODE OF ETHICS.
The registrant has adopted a code of ethics that applies to the registrant’s principal executive officer, principal financial officer, principal accounting officer or controller.
ITEM 3. AUDIT COMMITTEE FINANCIAL EXPERT.
The Board of Directors of the registrant has determined that William R. Hutchinson, the chairman of the Board’s Audit Committee, possesses the attributes identified in Instruction 2(b) of Item 3 to Form N-CSR to qualify as an “audit committee financial expert,” and has designated Mr. Hutchinson as the audit committee financial expert. Mr. Hutchinson is an “independent” Director pursuant to paragraph (a)(2) of Item 3 to Form N-CSR.
ITEM 4. PRINCIPAL ACCOUNTANT FEES AND SERVICES.
(a) Audit Fees. The aggregate fees billed in the last two fiscal years ending February 28, 2010 and February 28, 2011 (the “Reporting Periods”) for professional services rendered by the Registrant’s principal accountant (the “Auditor”) for the audit of the Registrant’s annual financial statements, or services that are normally provided by the Auditor in connection with the statutory and regulatory filings or engagements for the Reporting Periods, were $44,850 in 2010 and $45,150 in 2011.
(b) Audit-Related Fees. There were no fees billed in the Reporting Periods for assurance and related services by the Auditor that are reasonably related to the performance of the audit of the Registrant’s financial statements and are not reported under paragraph (a) of this Item 4.
In addition, there were no Audit-Related Fees billed in the Reporting Period for assurance and related services by the Auditor to the Registrant’s investment adviser (not including any sub-adviser whose role is primarily portfolio management and is subcontracted with or overseen by another investment adviser), and any entity controlling, controlled by or under common control with the investment adviser that provides ongoing services to the Western Asset Managed High Income Fund Inc. (“service affiliates”), that were reasonably related to the performance of the annual audit of the service affiliates. Accordingly, there were no such fees that required pre-approval by the Audit Committee for the Reporting Periods.
(c) Tax Fees. The aggregate fees billed in the Reporting Periods for professional services rendered by the Auditor for tax compliance, tax advice and tax planning (“Tax Services”) were $0 in 2010 and $7,400 in 2011. These services consisted of (i) review or preparation of U.S. federal, state, local and excise tax returns; (ii) U.S. federal, state and local tax planning, advice and assistance regarding statutory, regulatory or administrative developments, and (iii) tax advice regarding tax qualification matters and/or treatment of various financial instruments held or proposed to be acquired or held.
There were no fees billed for tax services by the Auditors to service affiliates during the Reporting Periods that required pre-approval by the Audit Committee.
(d) All Other Fees. There were no other fees billed in the Reporting Periods for products and services provided by the Auditor, other than the services reported in paragraphs (a) through (c) for the Item 4 for the Western Asset Managed High Income Fund Inc.
All Other Fees. There were no other non-audit services rendered by the Auditor to Legg Mason Partners Fund Advisors, LLC (“LMPFA”), and any entity controlling, controlled by or under common control with LMPFA that provided ongoing services to Western Asset Managed High Income Fund Inc. requiring pre-approval by the Audit Committee in the Reporting Period.
(e) Audit Committee’s pre—approval policies and procedures described in paragraph (c) (7) of Rule 2-01 of Regulation S-X.
(1) The Charter for the Audit Committee (the “Committee”) of the Board of each registered investment company (the “Fund”) advised by LMPFA or one of their affiliates (each, an “Adviser”) requires that the Committee shall approve (a) all audit and permissible non-audit services to be provided to the Fund and (b) all permissible non-audit services to be provided by the Fund’s independent auditors to the Adviser and any Covered Service Providers if the engagement relates directly to the operations and financial reporting of the Fund. The Committee may implement policies and procedures by which such services are approved other than by the full Committee.
The Committee shall not approve non-audit services that the Committee believes may impair the independence of the auditors. As of the date of the approval of this Audit Committee Charter, permissible non-audit services include any professional services (including tax services), that are not prohibited services as described below, provided to the Fund by the independent auditors, other than those provided to the Fund in connection with an audit or a review of the financial statements of the Fund. Permissible non-audit services may not include: (i) bookkeeping or other services related to the accounting records or financial statements of the Fund; (ii) financial information systems design and implementation; (iii) appraisal or valuation services, fairness opinions or contribution-in-kind reports; (iv) actuarial services; (v) internal audit outsourcing services; (vi) management functions or human resources; (vii) broker or dealer, investment adviser or investment banking services; (viii) legal services and expert services unrelated to the audit; and (ix) any other service the Public Company Accounting Oversight Board determines, by regulation, is impermissible.
Pre-approval by the Committee of any permissible non-audit services is not required so long as: (i) the aggregate amount of all such permissible non-audit services provided to the Fund, the Adviser and any service providers controlling, controlled by or under common control with the Adviser that provide ongoing services to the Fund (“Covered Service Providers”) constitutes not more than 5% of the total amount of revenues paid to the independent auditors during the fiscal year in which the permissible non-audit services are provided to (a) the Fund, (b) the Adviser and (c) any entity controlling, controlled by or under common control with the Adviser that provides ongoing services to the Fund during the fiscal year in which the services are provided that would have to be approved by the Committee; (ii) the permissible non-audit services were not recognized by the Fund at the time of the engagement to be non-audit services; and (iii) such services are promptly brought to the attention of the Committee and approved by the Committee (or its delegate(s)) prior to the completion of the audit.
(2) For the Western Asset Managed High Income Fund Inc., the percentage of fees that were approved by the audit committee, with respect to: Audit-Related Fees were 100% and 100% for 2010 and 2011; Tax Fees were 100% and 100% for 2010 and 2011; and Other Fees were 100% and 100% for 2010 and 2011.
(f) N/A
(g) Non-audit fees billed by the Auditor for services rendered to Western Asset Managed High Income Fund Inc., LMPFA and any entity controlling, controlled by, or under common control with LMPFA that provides ongoing services to Western Asset Managed High Income Fund Inc. during the reporting period were $0 in 2011.
(h) Yes. Western Asset Managed High Income Fund Inc.’s Audit Committee has considered whether the provision of non-audit services that were rendered to Service Affiliates, which were not pre-approved (not requiring pre-approval), is compatible with maintaining the Accountant’s independence. All services provided by the Auditor to the Western Asset Managed High Income Fund Inc. or to Service Affiliates, which were required to be pre-approved, were pre-approved as required.
ITEM 5. AUDIT COMMITTEE OF LISTED REGISTRANTS.
a) Registrant has a separately-designated standing Audit Committee established in accordance with Section 3(a)58(A) of the Exchange Act. The Audit Committee consists of the following Board members:
William R. Hutchinson
Paolo M. Cucchi
Daniel P. Cronin
Carol L. Colman
Leslie H. Gelb
Dr. Riordan Roett
Jeswald W. Salacuse
b) Not applicable
ITEM 6. SCHEDULE OF INVESTMENTS.
Included herein under Item 1.
ITEM 7. DISCLOSURE OF PROXY VOTING POLICIES AND PROCEDURES FOR CLOSED-END MANAGEMENT INVESTMENT COMPANIES.
Proxy Voting Guidelines and Procedures
Legg Mason Partners Fund Advisor, LLC (“LMPFA”) delegates the responsibility for voting proxies for the fund to the subadviser through its contracts with the subadviser. The subadviser will use its own proxy voting policies and procedures to vote proxies. Accordingly, LMPFA does not expect to have proxy-voting responsibility for the fund. Should LMPFA become responsible for voting proxies for any reason, such as the inability of the subadviser to provide investment advisory services, LMPFA shall utilize the proxy voting guidelines established by the most recent subadviser to vote proxies until a new subadviser is retained.
The subadviser’s Proxy Voting Policies and Procedures govern in determining how proxies relating to the fund’s portfolio securities are voted and are provided below. Information regarding how each fund voted proxies (if any) relating to portfolio securities during the most recent 12-month period ended June 30 is available without charge (1) by calling 888-777-0102, (2) on the fund’s website at http://www.leggmason.com/individualinvestors and (3) on the SEC’s website at http://www.sec.gov.
Background
Western Asset Management Company (“WA”) and Western Asset Management Company Limited (“WAML”) (together “Western Asset”) have adopted and implemented policies and procedures that we believe are reasonably designed to ensure that proxies are voted in the best interest of clients, in accordance with our fiduciary duties and SEC Rule 206(4)-6 under the Investment Advisers Act of 1940 (“Advisers Act”). Our authority to vote the proxies of our clients is established through investment management agreements or comparable documents, and our proxy voting guidelines have been tailored to reflect these specific contractual obligations. In addition to SEC requirements governing advisers, our proxy voting policies reflect the long-standing fiduciary standards and responsibilities for ERISA accounts. Unless a manager of ERISA assets has been expressly precluded from voting proxies, the Department of Labor has determined that the responsibility for these votes lies with the Investment Manager.
In exercising its voting authority, Western Asset will not consult or enter into agreements with officers, directors or employees of Legg Mason Inc. or any of its affiliates (except that WA and WAML may so consult and agree with each other) regarding the voting of any securities owned by its clients.
Policy
Western Asset’s proxy voting procedures are designed and implemented in a way that is reasonably expected to ensure that proxy matters are handled in the best interest of our clients. While the guidelines included in the procedures are intended to provide a benchmark for voting standards, each vote is ultimately cast on a case-by-case basis, taking into consideration Western Asset’s contractual obligations to our clients and all other relevant facts and circumstances at the time of the vote (such that these guidelines may be overridden to the extent Western Asset deems appropriate).
Procedures
Responsibility and Oversight
The Western Asset Compliance Department (“Compliance Department”) is responsible for administering and overseeing the proxy voting process. The gathering of proxies is coordinated through the Corporate Actions area of Investment Support (“Corporate Actions”). Research analysts and portfolio managers are responsible for determining appropriate voting positions on each proxy utilizing any applicable guidelines contained in these procedures.
Client Authority
Prior to August 1, 2003, all existing client investment management agreements (“IMAs”) will be reviewed to determine whether Western Asset has authority to vote client proxies. At account start-up, or upon amendment of an IMA, the applicable client IMA are similarly reviewed. If an agreement is silent on proxy voting, but contains an overall delegation of discretionary authority or if the account represents assets of an ERISA plan, Western Asset will assume responsibility for proxy voting. The Client Account Transition Team maintains a matrix of proxy voting authority.
Proxy Gathering
Registered owners of record, client custodians, client banks and trustees (“Proxy Recipients”) that receive proxy materials on behalf of clients should forward them to Corporate Actions. Prior to August 1, 2003, Proxy Recipients of existing clients will be reminded of the appropriate routing to Corporate Actions for proxy materials received and reminded of their responsibility to forward all proxy materials on a timely basis. Proxy Recipients for new clients (or, if Western Asset becomes aware that the applicable Proxy Recipient for an existing client has changed, the Proxy Recipient for the existing client) are notified at start-up of appropriate routing to Corporate Actions of proxy materials received and reminded of their responsibility to forward all proxy materials on a timely basis. If Western Asset personnel other than Corporate Actions receive proxy materials, they should promptly forward the materials to Corporate Actions.
Proxy Voting
Once proxy materials are received by Corporate Actions, they are forwarded to the Compliance Department for coordination and the following actions:
a. Proxies are reviewed to determine accounts impacted.
b. Impacted accounts are checked to confirm Western Asset voting authority.
c. Compliance Department staff reviews proxy issues to determine any material conflicts of interest. (See conflicts of interest section of these procedures for further information on determining material conflicts of interest.)
d. If a material conflict of interest exists, (i) to the extent reasonably practicable and permitted by applicable law, the client is promptly notified, the conflict is disclosed and Western Asset obtains the client’s proxy voting instructions, and (ii) to the extent that it is not reasonably practicable or permitted by applicable law to notify the client and obtain such instructions (e.g., the client is a mutual fund or other commingled vehicle or is an ERISA plan client), Western Asset seeks voting instructions from an independent third party.
e. Compliance Department staff provides proxy material to the appropriate research analyst or portfolio manager to obtain their recommended vote. Research analysts and portfolio managers determine votes on a case-by-case basis taking into account the voting guidelines contained in these procedures. For avoidance of doubt, depending on the best interest of each individual client, Western Asset may vote the same proxy differently for different clients. The analyst’s or portfolio manager’s basis for their decision is documented and maintained by the Compliance Department.
f. Compliance Department staff votes the proxy pursuant to the instructions received in (d) or (e) and returns the voted proxy as indicated in the proxy materials.
Timing
Western Asset personnel act in such a manner to ensure that, absent special circumstances, the proxy gathering and proxy voting steps noted above can be completed before the applicable deadline for returning proxy votes.
Recordkeeping
Western Asset maintains records of proxies voted pursuant to Section 204-2 of the Advisers Act and ERISA DOL Bulletin 94-2. These records include:
a. A copy of Western Asset’s policies and procedures.
b. Copies of proxy statements received regarding client securities.
c. A copy of any document created by Western Asset that was material to making a decision how to vote proxies.
d. Each written client request for proxy voting records and Western Asset’s written response to both verbal and written client requests.
e. A proxy log including:
1. Issuer name;
2. Exchange ticker symbol of the issuer’s shares to be voted;
3. Council on Uniform Securities Identification Procedures (“CUSIP”) number for the shares to be voted;
4. A brief identification of the matter voted on;
5. Whether the matter was proposed by the issuer or by a shareholder of the issuer;
6. Whether a vote was cast on the matter;
7. A record of how the vote was cast; and
8. Whether the vote was cast for or against the recommendation of the issuer’s management team.
Records are maintained in an easily accessible place for five years, the first two in Western Asset’s offices.
Disclosure
Part II of the WA Form ADV and the WAML Form ADV Form ADV, each, contain a description of Western Asset’s proxy policies. Prior to August 1, 2003, Western Asset will deliver Part II of its revised Form ADV to all existing clients, along with a letter identifying the new disclosure. Clients will be provided a copy of these policies and procedures upon request. In addition, upon request, clients may receive reports on how their proxies have been voted.
Conflicts of Interest
All proxies are reviewed by the Compliance Department for material conflicts of interest. Issues to be reviewed include, but are not limited to:
1. Whether Western Asset (or, to the extent required to be considered by applicable law, its affiliates) manages assets for the company or an employee group of the company or otherwise has an interest in the company;
2. Whether Western Asset or an officer or director of Western Asset or the applicable portfolio manager or analyst responsible for recommending the proxy vote (together, “Voting Persons”) is a close relative of or has a personal or business relationship with an executive, director or person who is a candidate for director of the company or is a participant in a proxy contest; and
3. Whether there is any other business or personal relationship where a Voting Person has a personal interest in the outcome of the matter before shareholders.
Voting Guidelines
Western Asset’s substantive voting decisions turn on the particular facts and circumstances of each proxy vote and are evaluated by the designated research analyst or portfolio manager. The examples outlined below are meant as guidelines to aid in the decision making process.
Guidelines are grouped according to the types of proposals generally presented to shareholders. Part I deals with proposals which have been approved and are recommended by a company’s board of directors; Part II deals with proposals submitted by shareholders for inclusion in proxy statements; Part III addresses issues relating to voting shares of investment companies; and Part IV addresses unique considerations pertaining to foreign issuers.
I. Board Approved Proposals
The vast majority of matters presented to shareholders for a vote involve proposals made by a company itself that have been approved and recommended by its board of directors. In view of the enhanced corporate
governance practices currently being implemented in public companies, Western Asset generally votes in support of decisions reached by independent boards of directors. More specific guidelines related to certain board-approved proposals are as follows:
1. Matters relating to the Board of Directors
Western Asset votes proxies for the election of the company’s nominees for directors and for board-approved proposals on other matters relating to the board of directors with the following exceptions:
a. Votes are withheld for the entire board of directors if the board does not have a majority of independent directors or the board does not have nominating, audit and compensation committees composed solely of independent directors.
b. Votes are withheld for any nominee for director who is considered an independent director by the company and who has received compensation from the company other than for service as a director.
c. Votes are withheld for any nominee for director who attends less than 75% of board and committee meetings without valid reasons for absences.
d. Votes are cast on a case-by-case basis in contested elections of directors.
2. Matters relating to Executive Compensation
Western Asset generally favors compensation programs that relate executive compensation to a company’s long-term performance. Votes are cast on a case-by-case basis on board-approved proposals relating to executive compensation, except as follows:
a. Except where the firm is otherwise withholding votes for the entire board of directors, Western Asset votes for stock option plans that will result in a minimal annual dilution.
b. Western Asset votes against stock option plans or proposals that permit replacing or repricing of underwater options.
c. Western Asset votes against stock option plans that permit issuance of options with an exercise price below the stock’s current market price.
d. Except where the firm is otherwise withholding votes for the entire board of directors, Western Asset votes for employee stock purchase plans that limit the discount for shares purchased under the plan to no more than 15% of their market value, have an offering period of 27 months or less and result in dilution of 10% or less.
3. Matters relating to Capitalization
The management of a company’s capital structure involves a number of important issues, including cash flows, financing needs and market conditions that are unique to the circumstances of each company. As a result, Western Asset votes on a case-by-case basis on board-approved proposals involving changes to a company’s capitalization except where Western Asset is otherwise withholding votes for the entire board of directors.
a. Western Asset votes for proposals relating to the authorization of additional common stock.
b. Western Asset votes for proposals to effect stock splits (excluding reverse stock splits).
c. Western Asset votes for proposals authorizing share repurchase programs.
4. Matters relating to Acquisitions, Mergers, Reorganizations and Other Transactions
Western Asset votes these issues on a case-by-case basis on board-approved transactions.
5. Matters relating to Anti-Takeover Measures
Western Asset votes against board-approved proposals to adopt anti-takeover measures except as follows:
a. Western Asset votes on a case-by-case basis on proposals to ratify or approve shareholder rights plans.
b. Western Asset votes on a case-by-case basis on proposals to adopt fair price provisions.
6. Other Business Matters
Western Asset votes for board-approved proposals approving such routine business matters such as changing the company’s name, ratifying the appointment of auditors and procedural matters relating to the shareholder meeting.
a. Western Asset votes on a case-by-case basis on proposals to amend a company’s charter or bylaws.
b. Western Asset votes against authorization to transact other unidentified, substantive business at the meeting.
II. Shareholder Proposals
SEC regulations permit shareholders to submit proposals for inclusion in a company’s proxy statement. These proposals generally seek to change some aspect of a company’s corporate governance structure or to change some aspect of its business operations. Western Asset votes in accordance with the recommendation of the company’s board of directors on all shareholder proposals, except as follows:
1. Western Asset votes for shareholder proposals to require shareholder approval of shareholder rights plans.
2. Western Asset votes for shareholder proposals that are consistent with Western Asset’s proxy voting guidelines for board-approved proposals.
3. Western Asset votes on a case-by-case basis on other shareholder proposals where the firm is otherwise withholding votes for the entire board of directors.
III. Voting Shares of Investment Companies
Western Asset may utilize shares of open or closed-end investment companies to implement its investment strategies. Shareholder votes for investment companies that fall within the categories listed in Parts I and II above are voted in accordance with those guidelines.
1. Western Asset votes on a case-by-case basis on proposals relating to changes in the investment objectives of an investment company taking into account the original intent of the fund and the role the fund plays in the clients’ portfolios.
2. Western Asset votes on a case-by-case basis all proposals that would result in increases in expenses (e.g., proposals to adopt 12b-1 plans, alter investment advisory arrangements or approve fund mergers) taking into account comparable expenses for similar funds and the services to be provided.
IV. Voting Shares of Foreign Issuers
In the event Western Asset is required to vote on securities held in foreign issuers — i.e. issuers that are incorporated under the laws of a foreign jurisdiction and that are not listed on a U.S. securities exchange or the NASDAQ stock market, the following guidelines are used, which are premised on the existence of a sound corporate governance and disclosure framework. These guidelines, however, may not be appropriate under some circumstances for foreign issuers and therefore apply only where applicable.
1. Western Asset votes for shareholder proposals calling for a majority of the directors to be independent of management.
2. Western Asset votes for shareholder proposals seeking to increase the independence of board nominating, audit and compensation committees.
3. Western Asset votes for shareholder proposals that implement corporate governance standards similar to those established under U.S. federal law and the listing requirements of U.S. stock exchanges, and that do not otherwise violate the laws of the jurisdiction under which the company is incorporated.
4. Western Asset votes on a case-by-case basis on proposals relating to (1) the issuance of common stock in excess of 20% of a company’s outstanding common stock where shareholders do not have preemptive rights, or (2) the issuance of common stock in excess of 100% of a company’s outstanding common stock where shareholders have preemptive rights.
ITEM 8. PORTFOLIO MANAGERS OF CLOSED-END MANAGEMENT INVESTMENT COMPANIES.
(a)(1):
NAME AND | | LENGTH OF | | PRINCIPAL OCCUPATION(S) DURING |
ADDRESS | | TIME SERVED | | PAST 5 YEARS |
| | | | |
S. Kenneth Leech Western Asset | | Since 2006 | | Co-portfolio manager of the fund; Chief Investment Officer of Western Asset from 1998 to 2008; Senior Advisor/Chief Investment Officer Emeritus of Western Asset. |
385 East Colorado Blvd. Pasadena, CA 91101 | | | | |
| | | | |
Stephen A. Walsh Western Asset
385 East Colorado Blvd. Pasadena, CA 91101 | | Since 2006 | | Co-portfolio manager of the fund; Deputy Chief Investment Officer of Western Asset from 2000 to 2008; Chief Investment Officer of Western Asset since 2008. |
| | | | |
Keith J. Gardner Western Asset
385 East Colorado Blvd. Pasadena, CA 91101 | | Since 2006 | | Co-portfolio manager of the fund; portfolio manager and research analyst at Western Asset since 1994. |
| | | | |
Michael C. Buchanan Western Asset 385 East Colorado Blvd. Pasadena, CA 91101 | | Since 2006 | | Co-portfolio manager of the fund; Managing Director and head of U.S. Credit Products from 2003-2005 at Credit Suisse Asset Management |
(a)(2): DATA TO BE PROVIDED BY FINANCIAL CONTROL
The following tables set forth certain additional information with respect to the fund’s portfolio managers for the fund. Unless noted otherwise, all information is provided as of February 28, 2011.
Other Accounts Managed by Portfolio Managers
The table below identifies the number of accounts (other than the fund) for which the fund’s portfolio managers have day-to-day management responsibilities and the total assets in such accounts, within each of the following categories: registered investment companies, other pooled investment vehicles, and other accounts. For each category, the number of accounts and total assets in the accounts where fees are based on performance is also indicated.
| | Registered | | Other Pooled | | |
Portfolio | | Investment | | Investment | | Other |
Manager(s) | | Companies | | Vehicles | | Accounts |
| | | | | | |
S. Kenneth Leech ‡ | | 102 registered investment companies with $167.6 billion in total assets under management | | 216 Other pooled investment vehicles with $109.6 billion in assets under management* | | 791 Other accounts with $175.0 on in total assets under management** |
| | | | | | |
Stephen A. Walsh ‡ | | 102 registered investment companies with $167.6 billion in total assets under management | | 216 Other pooled investment vehicles with $109.6 billion in assets under management* | | 791 Other accounts with $175.0 billion in total assets under management** |
| | | | | | |
Keith J. Gardner ‡ | | 41 registered investment companies with $27.2 billion in total assets under management | | 6 Other pooled investment vehicles with $1.3 billion in assets under management | | 1 Other account with $0.2 billion in total assets under management |
| | | | | | |
Michael C. Buchanan ‡ | | 49 registered investment Companies with $30.6 billion in total assets Under management | | 8 Other pooled investment vehicles with $3.7 billion in assets under management | | 11 Other accounts with $1.8 billion in total assets under management |
* | Includes 7 accounts managed, totaling $1.2 billion, for which advisory fee is performance based. |
** | Includes 83 accounts managed, totaling $20.1 billion, for which advisory fee is performance based. |
‡ The numbers above reflect the overall number of portfolios managed by employees of Western Asset Management Company (“Western Asset”). Mr. Leech and Mr. Walsh are involved in the management of all the Firm’s portfolios, but they are not solely responsible for particular portfolios. Western Asset’s investment discipline emphasizes a team approach that combines the efforts of groups of specialists working in different market sectors. They are responsible for overseeing implementation of Western Asset’s overall investment ideas and coordinating the work of the various sector teams. This structure ensures that client portfolios benefit from a consensus that draws on the expertise of all team members.
(a)(3): Portfolio Manager Compensation
With respect to the compensation of the portfolio managers, Western Asset’s compensation system assigns each employee a total compensation range, which is derived from annual market surveys that benchmark each role with its job function and peer universe. This method is designed to reward employees with total compensation reflective of the external market value of their skills, experience, and ability to produce desired results. Standard compensation includes competitive base salaries, generous employee benefits, and a retirement plan.
In addition, the subadviser’s employees are eligible for bonuses. These are structured to closely align the interests of employees with those of the subadviser, and are determined by the professional’s job function and pre-tax performance as measured by a formal review process. All bonuses are completely discretionary. The principal factor considered is a portfolio manager’s investment performance versus appropriate peer groups and benchmarks (e.g., a securities index and with respect to a fund, the benchmark set forth in the fund’s Prospectus to which the fund’s average annual total returns are compared or, if none, the benchmark set forth in the fund’s annual report). Performance is reviewed on a 1, 3 and 5 year basis for compensation—with 3 years having the most emphasis. The subadviser may also measure a portfolio manager’s pre-tax investment performance against other benchmarks, as it determines appropriate. Because portfolio managers are generally responsible for multiple accounts (including the funds) with similar investment strategies, they are generally compensated on the performance of the aggregate group of similar accounts, rather than a specific account. Other factors that may be considered when making bonus decisions include client service, business development, length of service to the subadviser, management or supervisory responsibilities, contributions to developing business strategy and overall contributions to the subadviser’s business.
Finally, in order to attract and retain top talent, all professionals are eligible for additional incentives in recognition of outstanding performance. These are determined based upon the factors described above and include Legg Mason stock options and long-term incentives that vest over a set period of time past the award date.
Potential Conflicts of Interest
Conflicts of Interest
The manager, subadvisers and portfolio managers have interests which conflict with the interests of the fund. There is no guarantee that the policies and procedures adopted by the manager, the subadvisers and the fund will be able to identify or mitigate these conflicts of interest.
Some examples of material conflicts of interest include:
Allocation of Limited Time and Attention. A portfolio manager who is responsible for managing multiple funds and/or accounts may devote unequal time and attention to the management of those funds and/or accounts. A portfolio manager may not be able to formulate as complete a strategy or identify equally attractive investment opportunities for each of those funds and accounts as might be the case if he or she were to devote substantially more attention to the management of a single fund. Such a portfolio manager may make general determinations across multiple funds, rather than tailoring a unique approach for each fund. The effects of this conflict may be more pronounced where funds and/or accounts overseen by a particular portfolio manager have different investment strategies.
Allocation of Limited Investment Opportunities; Aggregation of Orders. If a portfolio manager identifies a limited investment opportunity that may be suitable for multiple funds and/or accounts, the opportunity may be allocated among these several funds or accounts, which may limit the fund’s ability to take full advantage of the investment opportunity. Additionally, a subadviser may aggregate transaction orders for multiple accounts for purpose of execution. Such aggregation may cause the price or brokerage costs to be less favorable to a particular client than if similar transactions were not being executed concurrently for other accounts. In addition, a subadviser’s trade allocation policies may result in the fund’s orders not being fully executed or being delayed in execution.
Pursuit of Differing Strategies. At times, a portfolio manager may determine that an investment opportunity may be appropriate for only some of the funds and/or accounts for which he or she exercises investment responsibility, or may decide that certain of the funds and/or accounts should take differing positions with respect to a particular security. In these cases, the portfolio manager may place separate transactions for one or more funds or accounts which may affect the market price of the security or the execution of the transaction, or both, to the detriment or benefit of one or more other funds and/or accounts. For example, a portfolio manager may determine that it would be in the interest of another account to sell a security that the fund holds long, potentially resulting in a decrease in the market value of the security held by the fund.
Cross Trades. Portfolio managers may manage funds that engage in cross trades, where one of the manager’s funds or accounts sells a particular security to another fund or account managed by the same manager. Cross trades may pose conflicts of interest because of, for example, the possibility that one account sells a security to another account at a higher price than an independent third party would pay or otherwise enters into a transaction that it would not enter into with an independent party, such as the sale of a difficult-to-obtain security.
Selection of Broker/Dealers. Portfolio managers may select or influence the selection of the brokers and dealers that are used to execute securities transactions for the funds and/or accounts that they supervise. In addition to executing trades, some brokers and dealers provide subadvisers with brokerage and research services, These services may be taken into account in the selection of brokers and dealers whether a broker is being selected to effect a trade on an agency basis for a commission or (as is normally the case for the funds) whether a dealer is being selected to effect a trade on a principal basis. This may result in the payment of higher brokerage fees and/or execution at a less favorable price than might have otherwise been available. The services obtained may ultimately be more beneficial to certain of the manager’s funds or accounts than to others (but not necessarily to the funds that pay the increased commission or incur the less favorable execution). A decision as to the selection of brokers and dealers could therefore yield disproportionate costs and benefits among the funds and/or accounts managed.
Variation in Financial and Other Benefits. A conflict of interest arises where the financial or other benefits available to a portfolio manager differ among the funds and/or accounts that he or she manages. If the amount or structure of the investment manager’s management fee and/or a portfolio manager’s
compensation differs among funds and/or accounts (such as where certain funds or accounts pay higher management fees or performance-based management fees), the portfolio manager might be motivated to help certain funds and/or accounts over others. Similarly, the desire to maintain assets under management or to enhance the portfolio manager’s performance record or to derive other rewards, financial or otherwise, could influence the portfolio manager in affording preferential treatment to those funds and/or accounts that could most significantly benefit the portfolio manager. A portfolio manager may, for example, have an incentive to allocate favorable or limited opportunity investments or structure the timing of investments to favor such funds and/or accounts. Also, a portfolio manager’s or the manager’s or a subadviser’s desire to increase assets under management could influence the portfolio manager to keep a fund open for new investors without regard to potential benefits of closing the fund to new investors. Additionally, the portfolio manager might be motivated to favor funds and/or accounts in which he or she has an ownership interest or in which the investment manager and/or its affiliates have ownership interests. Conversely, if a portfolio manager does not personally hold an investment in the fund, the portfolio manager’s conflicts of interest with respect to the fund may be more acute.
Related Business Opportunities. The investment manager or its affiliates may provide more services (such as distribution or recordkeeping) for some types of funds or accounts than for others. In such cases, a portfolio manager may benefit, either directly or indirectly, by devoting disproportionate attention to the management of funds and/or accounts that provide greater overall returns to the investment manager and its affiliates.
(a)(4): Portfolio Manager Securities Ownership
The table below identifies the dollar range of securities beneficially owned by each portfolio managers as of February 28, 2011.
Portfolio Manager(s) | | Dollar Range of
Portfolio
Securities
Beneficially
Owned | |
| | | |
S. Kenneth Leech | | A | |
Stephen A. Walsh | | A | |
Keith J. Gardner | | A | |
Michael C. Buchanan | | A | |
Dollar Range ownership is as follows:
A: none
B: $1 - $10,000
C: 10,001 - $50,000
D: $50,001 - $100,000
E: $100,001 - $500,000
F: $500,001 - $1 million
G: over $1 million
ITEM 9. PURCHASES OF EQUITY SECURITIES BY CLOSED-END MANAGEMENT INVESTMENT COMPANY AND AFFILIATED PURCHASERS.
None
ITEM 10. SUBMISSION OF MATTERS TO A VOTE OF SECURITY HOLDERS.
None.
ITEM 11. CONTROLS AND PROCEDURES.
(a) The registrant’s principal executive officer and principal financial officer have concluded that the registrant’s disclosure controls and procedures (as defined in Rule 30a- 3(c) under the Investment Company Act of 1940, as amended (the “1940 Act”)) are effective as of a date within 90 days of the filing date of this report that includes the disclosure required by this paragraph, based on their evaluation of the disclosure controls and procedures required by Rule 30a-3(b) under the 1940 Act and 15d-15(b) under the Securities Exchange Act of 1934.
(b) There were no changes in the registrant’s internal control over financial reporting (as defined in Rule 30a-3(d) under the 1940 Act) that occurred during the registrant’s last fiscal half-year (the registrant’s second fiscal half-year in the case of an annual report) that have materially affected, or are likely to materially affect the registrant’s internal control over financial reporting.
ITEM 12. EXHIBITS.
(a) (1) Code of Ethics attached hereto.
Exhibit 99.CODE ETH
(a) (2) Certifications pursuant to section 302 of the Sarbanes-Oxley Act of 2002 attached hereto.
Exhibit 99.CERT
(b) Certifications pursuant to Section 906 of the Sarbanes-Oxley Act of 2002 attached hereto.
Exhibit 99.906CERT
SIGNATURES
Pursuant to the requirements of the Securities Exchange Act of 1934 and the Investment Company Act of 1940, the registrant has duly caused this Report to be signed on its behalf by the undersigned, there unto duly authorized.
Western Asset Managed High Income Fund Inc.
By: | /s/ R. Jay Gerken | |
| (R. Jay Gerken) | |
| Chief Executive Officer of | |
| Western Asset Managed High Income Fund Inc. | |
| | |
Date: | April 27, 2011 | |
Pursuant to the requirements of the Securities Exchange Act of 1934 and the Investment Company Act of 1940, this report has been signed below by the following persons on behalf of the registrant and in the capacities and on the dates indicated.
By: | /s/ R. Jay Gerken | |
| (R. Jay Gerken) | |
| Chief Executive Officer of | |
| Western Asset Managed High Income Fund Inc. | |
| | |
Date: | April 27, 2011 | |
| | |
| | |
By: | /s/ Kaprel Ozsolak | |
| (Kaprel Ozsolak) | |
| Chief Financial Officer of | |
| Western Asset Managed High Income Fund Inc. | |
| | |
Date: | April 27, 2011 | |