Table of Contents
UNITED STATES
SECURITIES AND EXCHANGE COMMISSION
Washington, D.C. 20549
FORM N-CSR
CERTIFIED SHAREHOLDER REPORT OF REGISTERED
MANAGEMENT INVESTMENT COMPANIES
Investment Company Act file number 811-1940
Smith Barney Appreciation Fund Inc.
(Exact name of registrant as specified in charter)
| 125 Broad Street, New York, NY | 10004 | |
| (Address of principal executive offices) | (Zip code) | |
Robert I. Frenkel, Esq.
Smith Barney Fund Management LLC
300 First Stamford Place
Stamford, CT 06902
(Name and address of agent for service)
Registrant’s telephone number, including area code: (800) 451-2010
Date of fiscal year end: December 31
Date of reporting period: December 31, 2004
Table of Contents
| ITEM 1. | REPORT TO STOCKHOLDERS. |
The Annual Report to Stockholders is filed herewith.
Table of Contents
SMITH BARNEY
APPRECIATION FUND INC.
CLASSIC SERIES | ANNUAL REPORT | DECEMBER 31, 2004

NOT FDIC INSURED • NOT BANK GUARANTEED • MAY LOSE VALUE
Table of Contents
|

HERSH COHEN
PORTFOLIO MANAGER

SCOTT K. GLASSER
PORTFOLIO MANAGER
|
|

Annual Report • December 31, 2004
SMITH BARNEY
APPRECIATION FUND INC.
HERSH COHEN
Hersh Cohen has more than 35 years of securities business experience.
Education: BA from Case Western Reserve University; Ph.D. in Psychology from Tufts University
SCOTT K. GLASSER
Scott K. Glasser has more than 12 years of securities business experience and has been working with the Fund since 1995.
Education: BA from Middlebury College; MBA in Finance from Pennsylvania State University
FUND OBJECTIVE
The fund seeks long-term appreciation of shareholders’ capital by investing primarily in equity securities of U.S. companies. The fund typically invests in medium and large capitalization companies but may also invest in small capitalization companies.
| 1 | ||
| 3 | ||
| 5 | ||
| 6 | ||
| 8 | ||
| 9 | ||
| 10 | ||
| 15 | ||
| 16 | ||
| 17 | ||
| 18 | ||
| 20 | ||
| 27 | ||
| 28 | ||
| 30 |
Table of Contents

R. JAY GERKEN, CFA
Chairman, President and
Chief Executive Officer
Dear Shareholder,
The stock market rallied at the start of the past year, but then slid into a fairly limited trading range that endured for most of the year, only to rally again sharply in the fourth quarter. Most major equity market indexes reported reasonable gains for 2004 and several indexes recorded double-digit growth. In many cases, most of those returns were achieved on the performance gains made in November and December alone.
Record-high energy prices, rising short-term interest rates, a growing trade deficit, uncertainty over the domestic employment situation, presidential election politics and the situation in Iraq all pressured the stock market for much of the year. Strength in the domestic economy was fairly selective, with stronger returns seen broadly in the energy, utilities and materials sectors while the information technology, healthcare, consumer staples and financials sectors languished for much of the period.
Small capitalization and value-oriented stocks tended to enjoy the strongest performance over the past twelve months, while large-cap and more growth-oriented stocks posted generally positive but weaker results. International stocks typically outperformed the broad
U.S. market, as foreign returns were boosted by the weaker U.S. dollar, which set record lows against some currencies. Stocks outperformed bonds in general, which suffered late in the year as the U.S. Federal Reserve Board (“Fed”)i continued to incrementally raise the federal funds rate.ii
The U.S. economy has entered its fourth year of expansion since the 2001 recession. After a slow start in 2002 and the first half of 2003, the economic expansion has gained traction over the past six quarters as corporations repaired balance sheets and earlier cost-cutting began to pay dividends. Although a series of one-off events — surging oil prices, hurricanes, the waning effects of 2002-2003 tax cuts, etc. — undoubtedly restrained growth in 2004, the economy proved resilient enough to grow an average of 4.0% over the past four quarters.iii
Please read on for a more detailed look at prevailing economic and market conditions during the fund’s fiscal year and to learn how those conditions have affected fund performance.
Information About Your Fund
As you may be aware, several issues in the mutual fund industry have recently come under the scrutiny of federal and state regulators. The fund’s Adviser and some of its affiliates have received requests for information from various government regulators regarding market timing, late trading, fees, and other mutual fund issues in connection with various investigations. The regulators appear to be examining, among other things, the fund’s response to market timing and shareholder exchange activity, including compliance with prospectus disclosure related to these subjects. The fund has been informed that the Adviser and its affiliates are responding to those information requests, but are not in a position to predict the outcome of these requests and investigations.
As previously disclosed by Citigroup, the Staff of the Securities and Exchange Commission (“SEC”) has notified Citigroup Asset Management (“CAM”) and Citicorp Trust Bank (“CTB”), an affiliate of CAM, that the Staff is considering recommending a civil injunctive action and/or an administrative proceeding against CAM, CTB, the former CEO of CAM, two former employees and a current employee of CAM, relating to the creation, operation and fees of an internal transfer agent unit that serves various CAM-managed funds. Citigroup is cooperating with the SEC and will seek to resolve
1 Smith Barney Appreciation Fund Inc. | 2004 Annual Report
Table of Contents
this matter in discussion with the SEC Staff. Although there can be no assurance, Citigroup does not believe that this matter will have a material adverse effect on the fund. For further information, please see the “Additional Information” note in the Notes to the Financial Statements included in this report.
As always, thank you for your confidence in our stewardship of your assets. We look forward to helping you continue to meet your financial goals.
Sincerely,

R. Jay Gerken, CFA
Chairman, President and Chief Executive Officer
January 31, 2005
2 Smith Barney Appreciation Fund Inc. | 2004 Annual Report
Table of Contents
Performance Review
For the 12 months ended December 31, 2004, Class A shares of the Smith Barney Appreciation Fund Inc., excluding sales charges, returned 8.92%. These shares underperformed the fund’s unmanaged benchmark, the S&P 500 Indexiv, which returned 10.87% for the same period. They outperformed the Lipper Large-Cap Core Funds Category Average1, which was 7.78%.
Market Overview
The stock market produced solid gains in 2004, though not as exuberant as the rally in 2003 when equities rebounded strongly from the depressed levels of the bear market. The positive momentum from the year-end rally of 2003 carried into the first quarter of 2004, setting highs in many parts of the market that were not revisited until the fourth quarter. For the majority of the year, the stock market traded sideways as it digested the gains of the prior year rally and struggled to understand and cope with a host of unanswered questions. Specifically, concerns over the job market, interest rates and inflation, rising oil prices, geopolitical events including terrorism and Iraq, and a country divided by a U.S. presidential contest kept many investors on the sidelines.
Despite these issues, certain sectors of the markets, notably energy, industrials and basic materials continued to show signs of strength throughout the year, while the mid- and small-capitalization stocks also continued to garner investor’s attention. Large capitalization stocks, in general, were held down by disappointments in some high profile, blue-chip companies. As we moved into the fourth quarter, stock prices had already discounted the potential negatives discussed above and became vulnerable to upside surprises. The resolution of the U.S. elections combined with improving investor confidence in the economic recovery and the absence of further geopolitical events, helped produced a strong year-end rally.
PERFORMANCE SNAPSHOT
AS OF DECEMBER 31, 2004
(excluding sales charges)
(unaudited)
| 6 Months | 12 Months | |||||
Class A Shares — Appreciation Fund | 5.48 | % | 8.92 | % | ||
S&P 500 Index | 7.19 | % | 10.87 | % | ||
Lipper Large-Cap Core Funds Category Average | 5.63 | % | 7.78 | % |
The performance shown represents past performance. Past performance is no guarantee of future results and current performance may be higher or lower than the performance shown above. Principal value and investment returns will fluctuate and investors’ shares, when redeemed, may be worth more or less than their original cost. To obtain performance data current to the most recent month-end, please visit our website at www.smithbarneymutualfunds.com.
Performance figures may reflect reimbursements and/or fee waivers, without which the performance would have been lower.
Class A share returns assume the reinvestment of income dividends and capital gains distributions at net asset value and the deduction of all fund expenses. Returns have not been adjusted to include sales charges that may apply when shares are purchased or the deduction of taxes that a shareholder would pay on fund distributions. Excluding sales charges, Class B shares returned 4.96%, Class C shares returned 5.05 and Class Y shares returned 5.69% over the six months ended December 31, 2004. Excluding sales charges, Class B shares returned 7.99%, Class C shares returned 8.08% and Class Y shares returned 9.30% over the twelve months ended December 31, 2004.
Lipper, Inc. is a major independent mutual-fund tracking organization. Returns are based on the period ended December 31, 2004, including the reinvestment of dividends and capital gains, if any, calculated among the 956 funds for the six-month period and among the 926 funds for the 12-month period in the fund’s Lipper category and excluding sales charges.
Fund Overview
The fund recorded solid performance for the year, achieving positive returns in all sectors of the market except information technology, where the fund maintained an underweight position due to the managers’ cautious sector outlook. Overall, the fund underperformed
| 1 | Lipper, Inc. is a major independent mutual-fund tracking organization. Returns are based on the 12-month period ended December 31, 2004, including the reinvestment of dividends and capital gains, if any, calculated among the 926 funds in the fund’s Lipper category, and excluding sales charges. |
3 Smith Barney Appreciation Fund Inc. | 2004 Annual Report
Table of Contents
its benchmark due, in part, to its cash position, which rose in the fourth quarter as the fund took profits in many stocks whose prices, in our opinion, appeared extended.
The largest returns came from energy, a sector where the fund has maintained an overweight for some time, followed by the consumer staples and telecommunications services sectors. Stock selection in the consumer discretionary and financials sectors hurt performance in comparison to the benchmark. On the positive side, an underweight in the poorly performing information technology sector and stock selection in the consumer staples sector helped performance in comparison to the S&P 500 Index.
Specific fund holdings that hurt performance included shares of pharmaceutical companies Pfizer Inc. and Merck & Co., Inc. in healthcare. The fund eliminated its position in Merck during the year but still held shares of Pfizer at the close of the period. Other stocks that hurt performance included information technology holdings in Intel Corp. and Agilent Technologies Inc., as well as insurance company The St. Paul Travelers Cos., Inc. in financials. Individual stocks that contributed significantly to performance included EnCana Corp. and Exxon Mobil Corp. in energy, General Electric Co. in industrials, Biogen Idec Inc. in healthcare and holdings in The St. Joe Co., a residential real estate developer. With the exception of Merck & Co., Inc. and Agilent Technologies Inc., the fund still held shares of all the above-named companies at the close of the period.
Thank you for your investment in the Smith Barney Appreciation Fund Inc. As ever, we appreciate that you have chosen us to manage your assets and we remain focused on achieving the fund's investment goals.
Sincerely,
 |  | |
| Harry D. Cohen | Scott K. Glasser | |
| Portfolio Manager | Portfolio Manager |
January 31, 2005
The information provided is not intended to be a forecast of future events, a guarantee of future results or investment advice. Views expressed may differ from those of the firm as a whole.
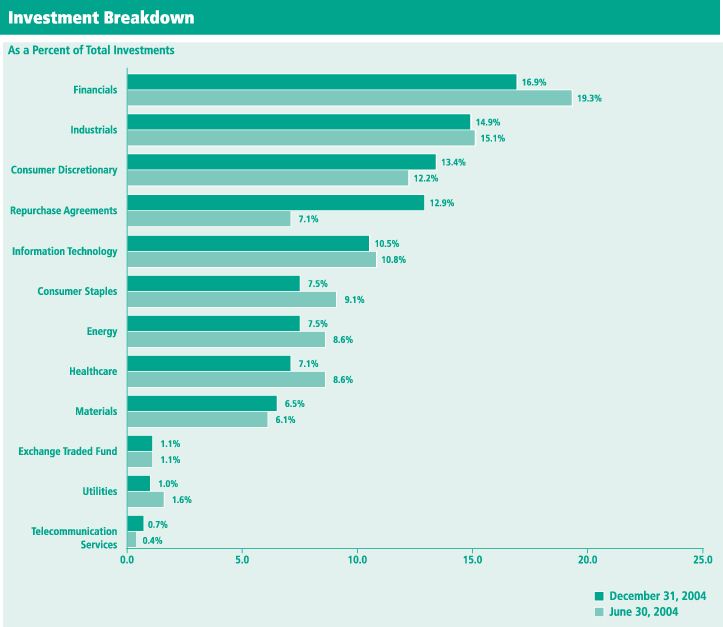
Portfolio holdings and breakdowns are as of December 31, 2004 and are subject to change and may not be representative of the portfolio manager’s current or future investments. The fund’s top ten holdings (as a % of net assets) as of this date were: Berkshire Hathaway, Inc. (6.1%), Microsoft Corp. (3.6%), General Electric Co. (3.5%), 3M Co. (3.1%), Exxon Mobil Corp. (2.2%), Wells Fargo & Co. (2.1%), Johnson & Johnson (1.8%), Time Warner Inc. (1.6%), EnCana Corp. (1.6%) and The Walt Disney Co. (1.5%). Please refer to pages 10 through 14 for a list and percentage breakdown of the fund’s holdings.
The mention of sector breakdowns is for informational purposes only and should not be construed as a recommendation to purchase or sell any securities. The information provided regarding such sectors is not a sufficient basis upon which to make an investment decision. Investors seeking financial advice regarding the appropriateness of investing in any securities or investment strategies discussed should consult their financial professional. Portfolio holdings are subject to change at any time and may not be representative of the portfolio manager’s current or future investments. The fund’s top five sector holdings (as a % of net assets) as of December 31, 2004 were: Financial (16.9%), Industrials (15.0%), Consumer Discretionary (13.4%), Information Technology (10.5%) and Consumer Staples (7.5%). The fund’s portfolio composition is subject to change at any time.
RISKS: The fund may invest in small- and mid-cap companies that may involve a higher degree of risk and volatility than investments in large-cap companies. The fund may use derivatives, such as options and futures, which can be illiquid, may disproportionately increase losses, and have a potentially large impact on fund performance.
All index performance reflects no deduction for fees, expenses or taxes. Please note an investor cannot invest directly in an index.
| i | The Fed is responsible for the formulation of a policy designed to promote economic growth, full employment, stable prices, and a sustainable pattern of international trade and payments. |
| ii | The federal funds rate is the interest rate that banks with excess reserves at a Federal Reserve district bank charge other banks that need overnight loans. |
| iii | As measured by gross domestic product (“GDP”), a market value of goods and services produced by labor and property in a given country. Source: Bureau of Economic Analysis, U.S. Department of Commerce, December 22, 2004. |
| iv | The S&P 500 Index is a market capitalization-weighted index of 500 widely held common stocks. |
4 Smith Barney Appreciation Fund Inc. | 2004 Annual Report
Table of Contents
5 Smith Barney Appreciation Fund Inc. | 2004 Annual Report
Table of Contents
| Fund Expenses (unaudited) |
Example
As a shareholder of the Fund, you may incur two types of costs: (1) transaction costs, including front-end and back-end sales charges (loads) on purchase payments, reinvested dividends, or other distributions; and (2) ongoing costs, including management fees; distribution and/or service (12b-1) fees; and other Fund expenses. This example is intended to help you understand your ongoing costs (in dollars) of investing in the Fund and to compare these costs with the ongoing costs of investing in other mutual funds.
This example is based on an investment of $1,000 invested on July 1, 2004 and held for the six months ended December 31, 2004.
Actual Expenses
The table below titled “Based on Actual Total Return” provides information about actual account values and actual expenses. You may use the information provided in this table, together with the amount you invested, to estimate the expenses that you paid over the period. To estimate the expenses you paid on your account, divide your ending account value by $1,000 (for example, an $8,600 ending account value divided by $1,000 = 8.6), then multiply the result by the number under the heading entitled “Expenses Paid During the Period”.
Based on Actual Total Return(1)
| Actual Total Return Without Sales Charges(2) | Beginning Account Value | Ending Account Value | Annualized Expense Ratio | Expenses Paid During the Period(3) | |||||||||||
Class A | 5.48 | % | $ | 1,000.00 | $ | 1,054.80 | 0.93 | % | $ | 4.80 | |||||
Class B | 4.96 | 1,000.00 | 1,049.60 | 1.76 | 9.07 | ||||||||||
Class C(4) | 5.05 | 1,000.00 | 1,050.50 | 1.75 | 9.02 | ||||||||||
Class Y | 5.69 | 1,000.00 | 1,056.90 | 0.53 | 2.74 | ||||||||||
| (1) | For the six months ended December 31, 2004. |
| (2) | Assumes reinvestment of all dividends and capital gain distributions, if any, at net asset value and does not reflect the deduction of the applicable sales charges with respect to Class A shares or the applicable contingent deferred sales charges (“CDSC”) with respect to Class B and C shares. Total return is not annualized, as it may not be representative of the total return for the year. Performance figures may reflect voluntary fee waivers. Past performance is no guarantee of future results. In the absence of voluntary fee waivers, the total return would have been lower. |
| (3) | Expenses (net of voluntary fee waiver) are equal to each class’ respective annualized expense ratio multiplied by the average account value over the period, multiplied by the number of days in the most recent fiscal half-year, then divided by 366. |
| (4) | On April 29, 2004, Class L shares were renamed as Class C shares. |
6 Smith Barney Appreciation Fund Inc. | 2004 Annual Report
Table of Contents
| Fund Expenses (unaudited) (continued) |
Hypothetical Example for Comparison Purposes
The table below titled “Based on Hypothetical Total Return” provides information about hypothetical account values and hypothetical expenses based on the actual expense ratio and an assumed rate of return of 5.00% per year before expenses, which is not the Fund’s actual return. The hypothetical account values and expenses may not be used to estimate the actual ending account balance or expenses you paid for the period. You may use the information provided in this table to compare the ongoing costs of investing in the Fund and other funds. To do so, compare the 5.00% hypothetical example relating to the Fund with the 5.00% hypothetical examples that appear in the shareholder reports of the other funds.
Please note that the expenses shown in the table below are meant to highlight your ongoing costs only and do not reflect any transactional costs, such as front-end or back-end sales charges (loads). Therefore, the table is useful in comparing ongoing costs only, and will not help you determine the relative total costs of owning different funds. In addition, if these transaction costs were included, your costs would have been higher.
Based on Hypothetical Total Return(1)
| Hypothetical Annualized Total Return | Beginning Account Value | Ending Account Value | Annualized Expense Ratio | Expenses Paid During the Period(2) | |||||||||||
Class A | 5.00 | % | $ | 1,000.00 | $ | 1,020.46 | 0.93 | % | $ | 4.72 | |||||
Class B | 5.00 | 1,000.00 | 1,016.29 | 1.76 | 8.92 | ||||||||||
Class C(3) | 5.00 | 1,000.00 | 1,016.34 | 1.75 | 8.87 | ||||||||||
Class Y | 5.00 | 1,000.00 | 1,022.47 | 0.53 | 2.69 | ||||||||||
| (1) | For the six months ended December 31, 2004. |
| (2) | Expenses (net of voluntary fee waiver) are equal to each class’ respective annualized expense ratio multiplied by the average account value over the period, multiplied by the number of days in the most recent fiscal half-year, then divided by 366. |
| (3) | On April 29, 2004, Class L shares were renamed as Class C shares. |
7 Smith Barney Appreciation Fund Inc. | 2004 Annual Report
Table of Contents
| Average Annual Total Returns(1) (unaudited) |
| Without Sales Charges(2) | ||||||||||||
| Class A | Class B | Class C(3) | Class Y | |||||||||
Twelve Months Ended 12/31/04 | 8.92 | % | 7.99 | % | 8.08 | % | 9.30 | % | ||||
Five Years Ended 12/31/04 | 1.86 | 1.01 | 1.05 | 2.22 | ||||||||
Ten Years Ended 12/31/04 | 11.46 | 10.56 | 10.58 | N/A | ||||||||
Inception* through 12/31/04 | 11.25 | 9.40 | 9.05 | 9.90 | ||||||||
| With Sales Charges(4) | ||||||||||||
| Class A | Class B | Class C(3) | Class Y | |||||||||
Twelve Months Ended 12/31/04 | 3.44 | % | 2.99 | % | 7.08 | % | 9.30 | % | ||||
Five Years Ended 12/31/04 | 0.82 | 0.83 | 1.05 | 2.22 | ||||||||
Ten Years Ended 12/31/04 | 10.89 | 10.56 | 10.58 | N/A | ||||||||
Inception* through 12/31/04 | 11.09 | 9.40 | 9.05 | 9.90 | ||||||||
Cumulative Total Returns(1) (unaudited) |
| |||||||||||
| Without Sales Charges(2) | |||
Class A (12/31/94 through 12/31/04) | 195.88 | % | |
Class B (12/31/94 through 12/31/04) | 172.89 | ||
Class C(3) (12/31/94 through 12/31/04) | 173.43 | ||
Class Y (Inception* through 12/31/04) | 132.11 | ||
| (1) | All figures represent past performance and are not a guarantee of future results. Investment return and principal value of an investment will fluctuate so that an investor’s shares, when redeemed, may be worth more or less than their original cost. The returns shown do not reflect the deduction of taxes that a shareholder would pay on fund distributions or the redemption of fund shares. Performance figures may reflect voluntary fee waivers and/or expense reimbursements. In the absence of voluntary fee waivers and/or expense reimbursements, the total return would have been lower. |
| (2) | Assumes reinvestment of all dividends and capital gain distributions, if any, at net asset value and does not reflect the deduction of the applicable sales charges with respect to Class A shares or the applicable CDSC with respect to Class B and C shares. |
| (3) | On April 29, 2004, Class L shares were renamed as Class C shares. |
| (4) | Assumes reinvestment of all dividends and capital gain distributions, if any, at net asset value. In addition, Class A shares reflect the deduction of the maximum sales charge of 5.00%; Class B shares reflect the deduction of a 5.00% CDSC, which applies if shares are redeemed within one year from purchase payment. Thereafter, this CDSC declines by 1.00% per year until no CDSC is incurred. Class C shares also reflect the deduction of a 1.00% CDSC, which applies if shares are redeemed within one year from purchase payment. The 1.00% sales charge on Class C share is no longer imposed effective February 2, 2004. |
| * | Inception dates for Class A, B, C and Y shares is March 10, 1970, November 6, 1992, February 4, 1993 and January 30, 1996, respectively. |
8 Smith Barney Appreciation Fund Inc. | 2004 Annual Report
Table of Contents
| Historical Performance (unaudited) |
Value of $10,000 Invested in Class A Shares of the
Smith Barney Appreciation Fund Inc. vs. the S&P 500 Index†
December 1994 — December 2004
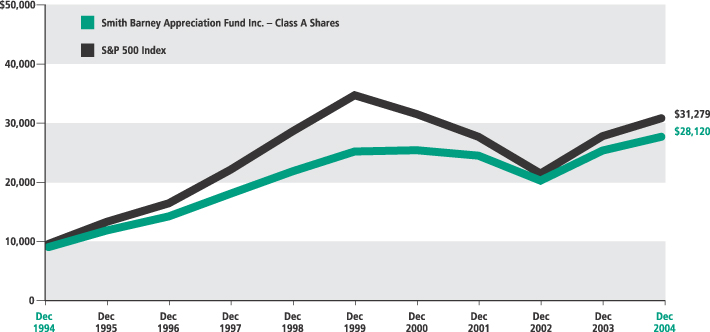
| † | Hypothetical illustration of $10,000 invested in Class A shares on December 31, 1994, assuming deduction of the maximum 5.00% sales charge at the time of investment for Class A shares. It also assumes reinvestment of dividends and capital gains, if any, at net asset value through December 31, 2004. The S&P 500 Index is composed of 500 widely held common stocks listed on the New York Stock Exchange, American Stock Exchange and over-the-counter markets. The Index is unmanaged and is not subject to the same management and trading expenses as a mutual fund. Please note that an investor cannot invest directly in an index. The performance of the Fund’s other classes may be greater or less than the Class A shares’ performance indicated on this chart, depending on whether greater or lesser sales charges and fees were incurred by shareholders investing in the other classes. |
All figures represent past performance and are not a guarantee of future results. The investment return and principal value of an investment, will fluctuate so that an investor’s shares, when redeemed, may be worth more or less than their original cost. The returns shown do not reflect the deduction of taxes that a shareholder would pay on fund distributions or the redemption of fund shares. Performance figures may reflect voluntary fee waivers and/or expense reimbursements. In the absence of voluntary fee waivers and/or expense reimbursements, the total return would have been lower.
9 Smith Barney Appreciation Fund Inc. | 2004 Annual Report
Table of Contents
| Schedule of Investments | December 31, 2004 |
| SHARES | SECURITY | VALUE | |||
| COMMON STOCK — 87.2% | |||||
| CONSUMER DISCRETIONARY — 13.4% | |||||
| Distributors — 0.3% | |||||
| 600,000 | CarMax, Inc. (a) | $ | 18,630,000 | ||
| Hotels, Restaurants & Leisure — 1.0% | |||||
| 1,208,700 | Fairmont Hotels & Resorts Inc. | 41,869,368 | |||
| 600,000 | The Marcus Corp. | 15,084,000 | |||
| 56,953,368 | |||||
| Leisure Equipment & Products — 0.1% | |||||
| 500,000 | Hasbro, Inc. | 9,690,000 | |||
| Media — 9.1% | |||||
| 1,900,000 | Comcast Corp., Special Class A Shares (a) | 62,396,000 | |||
| 500,000 | Fox Entertainment Group Inc., Class A Shares (a) | 15,630,000 | |||
| 900,000 | Gannett Co., Inc. | 73,530,000 | |||
| 1,500,000 | Liberty Media Corp., Class A Shares (a) | 16,470,000 | |||
| 800,000 | Meredith Corp. | 43,360,000 | |||
| 1,300,000 | SBS Broadcasting SA (a) | 52,299,000 | |||
| 800,000 | Shaw Communications Inc., Class B Shares | 14,632,000 | |||
| 5,000,000 | Time Warner Inc. (a) | 97,200,000 | |||
| 500,000 | Tribune Co. | 21,070,000 | |||
| 1,500,000 | Viacom Inc., Class B Shares | 54,585,000 | |||
| 3,200,000 | The Walt Disney Co. | 88,960,000 | |||
| 540,132,000 | |||||
| Multi-Line Retail — 1.6% | |||||
| 500,000 | Costco Wholesale Corp. | 24,205,000 | |||
| 1,300,000 | Wal-Mart Stores, Inc. | 68,666,000 | |||
| 92,871,000 | |||||
| Specialty Retail — 1.3% | |||||
| 500,000 | Bed Bath & Beyond Inc. (a) | 19,915,000 | |||
| 1,300,000 | The Home Depot, Inc. | 55,562,000 | |||
| 75,477,000 | |||||
| TOTAL CONSUMER DISCRETIONARY | 793,753,368 | ||||
| CONSUMER STAPLES — 7.5% | |||||
| Beverages — 1.3% | |||||
| 1,500,000 | PepsiCo, Inc. | 78,300,000 | |||
| Food & Drug Retailing — 0.6% | |||||
| 900,000 | Walgreen Co. | 34,533,000 | |||
| Food Products — 3.2% | |||||
| 1,500,000 | Archer-Daniels-Midland Co. | 33,465,000 | |||
| 700,000 | General Mills, Inc. | 34,797,000 | |||
| 1,000,000 | H.J. Heinz Co. | 38,990,000 | |||
| 300,000 | Hershey Foods Corp. | 16,662,000 | |||
| 200,000 | Tejon Ranch Co. (a) | 8,160,000 | |||
| 835,000 | Wm. Wrigley Jr. Co. | 57,773,650 | |||
| 189,847,650 | |||||
See Notes to Financial Statements.
10 Smith Barney Appreciation Fund Inc. | 2004 Annual Report
Table of Contents
| Schedule of Investments (continued) | December 31, 2004 |
| SHARES | SECURITY | VALUE | |||
| Household Products — 1.7% | |||||
| 700,000 | Kimberly-Clark Corp. | $ | 46,067,000 | ||
| 1,000,000 | The Procter & Gamble Co. | 55,080,000 | |||
| 101,147,000 | |||||
| Personal Products — 0.7% | |||||
| 900,000 | The Gillette Co. | 40,302,000 | |||
| TOTAL CONSUMER STAPLES | 444,129,650 | ||||
| ENERGY — 7.5% | |||||
| Energy Equipment & Services — 1.1% | |||||
| 1,000,000 | ENSCO International Inc. | 31,740,000 | |||
| 500,000 | Schlumberger Ltd. | 33,475,000 | |||
| 65,215,000 | |||||
| Oil & Gas — 6.4% | |||||
| 1,200,000 | BP PLC, Sponsored ADR | 70,080,000 | |||
| 1,200,000 | Canadian Natural Resources Ltd. | 51,324,000 | |||
| 1,700,000 | EnCana Corp. | 97,002,000 | |||
| 2,500,000 | Exxon Mobil Corp. | 128,150,000 | |||
| 900,000 | Suncor Energy, Inc. | 31,860,000 | |||
| 378,416,000 | |||||
| TOTAL ENERGY | 443,631,000 | ||||
| EXCHANGE TRADED FUND — 1.1% | |||||
| 6,000,000 | iShares MSCI Japan Index Fund | 65,520,000 | |||
| FINANCIALS — 16.9% | |||||
| Banks — 3.8% | |||||
| 1,300,000 | The Bank of New York Co., Inc. | 43,446,000 | |||
| 500,000 | Brookline Bancorp, Inc. | 8,160,000 | |||
| 300,000 | Fifth Third Bancorp | 14,184,000 | |||
| 250,000 | M&T Bank Corp. | 26,960,000 | |||
| 200,000 | Washington Mutual, Inc. | 8,456,000 | |||
| 2,000,000 | Wells Fargo & Co. | 124,300,000 | |||
| 225,506,000 | |||||
| Diversified Financials — 2.6% | |||||
| 200,000 | The Goldman Sachs Group, Inc. | 20,808,000 | |||
| 1,500,000 | JPMorgan Chase & Co. | 58,515,000 | |||
| 1,300,000 | Merrill Lynch & Co., Inc. | 77,701,000 | |||
| 157,024,000 | |||||
| Insurance — 8.3% | |||||
| 600,000 | American International Group, Inc. | 39,402,000 | |||
| 4,100 | Berkshire Hathaway Inc., Class A Shares (a) | 360,390,000 | |||
| 300,000 | Lincoln National Corp. | 14,004,000 | |||
| 500,000 | Old Republic International Corp. | 12,650,000 | |||
| 1,700,000 | The St. Paul Travelers Cos., Inc. | 63,019,000 | |||
| 489,465,000 | |||||
See Notes to Financial Statements.
11 Smith Barney Appreciation Fund Inc. | 2004 Annual Report
Table of Contents
| Schedule of Investments (continued) | December 31, 2004 |
| SHARES | SECURITY | VALUE | |||
| Real Estate — 2.2% | |||||
| 1,100,000 | Forest City Enterprises, Inc., Class A Shares | $ | 63,305,000 | ||
| 1,000,000 | The St. Joe Co. | 64,200,000 | |||
| 127,505,000 | |||||
| TOTAL FINANCIALS | 999,500,000 | ||||
| HEALTHCARE — 7.1% | |||||
| Biotechnology — 2.8% | |||||
| 1,300,000 | Amgen Inc. (a) | 83,395,000 | |||
| 500,000 | Biogen Idec Inc. (a) | 33,305,000 | |||
| 300,000 | Genentech, Inc. (a) | 16,332,000 | |||
| 600,000 | IDEXX Laboratories, Inc. (a) | 32,754,000 | |||
| 165,786,000 | |||||
| Healthcare Equipment & Supplies — 0.3% | |||||
| 300,000 | C.R. Bard, Inc. | 19,194,000 | |||
| Pharmaceuticals — 4.0% | |||||
| 1,000,000 | Bristol-Myers Squibb Co. | 25,620,000 | |||
| 400,000 | Eli Lilly and Co. | 22,700,000 | |||
| 1,700,000 | Johnson & Johnson | 107,814,000 | |||
| 3,000,000 | Pfizer Inc. | 80,670,000 | |||
| 236,804,000 | |||||
| TOTAL HEALTHCARE | 421,784,000 | ||||
| INDUSTRIALS — 15.0% | |||||
| Aerospace & Defense — 2.0% | |||||
| 1,200,000 | Raytheon Co. | 46,596,000 | |||
| 700,000 | United Technologies Corp. | 72,345,000 | |||
| 118,941,000 | |||||
| Air Freight & Couriers — 0.7% | |||||
| 500,000 | United Parcel Service, Inc., Class B Shares | 42,730,000 | |||
| Airlines — 0.3% | |||||
| 700,000 | JetBlue Airways Corp. (a) | 16,254,000 | |||
| Building Products — 0.6% | |||||
| 1,000,000 | Masco Corp. | 36,530,000 | |||
| Commercial Services & Supplies — 1.8% | |||||
| 800,000 | Automatic Data Processing Inc. | 35,480,000 | |||
| 150,000 | Hudson Highland Group, Inc. (a) | 4,320,000 | |||
| 2,300,000 | Waste Management, Inc. | 68,862,000 | |||
| 108,662,000 | |||||
| Electrical Equipment — 0.4% | |||||
| 1,000,000 | American Power Conversion Corp. | 21,400,000 | |||
| Industrial Conglomerates — 8.2% | |||||
| 2,200,000 | 3M Co. | 180,554,000 | |||
| 200,000 | Canadian Pacific Railway Ltd. | 6,882,000 | |||
| 5,600,000 | General Electric Co. | 204,400,000 | |||
| 1,100,000 | Honeywell International Inc. | 38,951,000 | |||
| 1,500,000 | Tyco International Ltd. | 53,610,000 | |||
| 484,397,000 | |||||
See Notes to Financial Statements.
12 Smith Barney Appreciation Fund Inc. | 2004 Annual Report
Table of Contents
| Schedule of Investments (continued) | December 31, 2004 |
| SHARES | SECURITY | VALUE | |||
| Road & Rail — 1.0% | |||||
| 1,231,033 | Florida East Coast Industries, Inc. | $ | 55,519,588 | ||
| TOTAL INDUSTRIALS | 884,433,588 | ||||
| INFORMATION TECHNOLOGY — 10.5% | |||||
| Communications Equipment — 1.8% | |||||
| 1,500,000 | 3Com Corp. (a) | 6,255,000 | |||
| 2,300,000 | Cisco Systems, Inc. (a) | 44,390,000 | |||
| 2,500,000 | JDS Uniphase Corp. (a) | 7,925,000 | |||
| 5,000,000 | Lucent Technologies Inc. (a) | 18,800,000 | |||
| 1,500,000 | Motorola, Inc. | 25,800,000 | |||
| 103,170,000 | |||||
| Computers & Peripherals — 2.5% | |||||
| 600,000 | Dell Inc. (a) | 25,284,000 | |||
| 3,000,000 | EMC Corp. (a) | 44,610,000 | |||
| 800,000 | International Business Machines Corp. | 78,864,000 | |||
| 148,758,000 | |||||
| Electronic Equipment & Instruments — 0.6% | |||||
| 400,000 | Mettler-Toledo International Inc. (a) | 20,524,000 | |||
| 2,500,000 | Solectron Corp. (a) | 13,325,000 | |||
| 33,849,000 | |||||
| Internet Software & Services — 0.4% | |||||
| 700,000 | IAC/InterActiveCorp (a) | 19,334,000 | |||
| 1,000,000 | SonicWALL, Inc. (a) | 6,320,000 | |||
| 25,654,000 | |||||
| Semiconductor Equipment & Products — 1.6% | |||||
| 9,000,000 | Agere Systems Inc., Class A Shares (a) | 12,330,000 | |||
| 1,500,000 | Freescale Semiconductor Inc., Class B Shares (a) | 27,540,000 | |||
| 1,700,000 | Intel Corp. | 39,763,000 | |||
| 600,000 | Texas Instruments Inc. | 14,772,000 | |||
| 94,405,000 | |||||
| Software — 3.6% | |||||
| 8,000,000 | Microsoft Corp. | 213,680,000 | |||
| TOTAL INFORMATION TECHNOLOGY | 619,516,000 | ||||
| MATERIALS — 6.5% | |||||
| Chemicals — 3.4% | |||||
| 1,000,000 | The Dow Chemical Co. | 49,510,000 | |||
| 1,500,000 | E.I. du Pont de Nemours & Co. | 73,575,000 | |||
| 1,100,000 | PPG Industries, Inc. | 74,976,000 | |||
| 198,061,000 | |||||
| Metals & Mining — 2.2% | |||||
| 1,000,000 | Alcoa Inc. | 31,420,000 | |||
| 300,000 | Freeport-McMoRan Copper & Gold, Inc., Class B Shares | 11,469,000 | |||
| 1,000,000 | Newmont Mining Corp. | 44,410,000 | |||
| 350,000 | Rio Tinto PLC, Sponsored ADR | 41,723,500 | |||
| 129,022,500 | |||||
See Notes to Financial Statements.
13 Smith Barney Appreciation Fund Inc. | 2004 Annual Report
Table of Contents
| Schedule of Investments (continued) | December 31, 2004 |
| SHARES | SECURITY | VALUE | ||||
| Paper & Forest Products — 0.9% | ||||||
| 500,000 | International Paper Co. | $ | 21,000,000 | |||
| 500,000 | Weyerhaeuser Co. | 33,610,000 | ||||
| 54,610,000 | ||||||
| TOTAL MATERIALS | 381,693,500 | |||||
| TELECOMMUNICATION SERVICES — 0.7% | ||||||
| Diversified Telecommunication Services — 0.6% | ||||||
| 800,000 | Verizon Communications Inc. | 32,408,000 | ||||
| Wireless Telecommunication services — 0.1% | ||||||
| 315,400 | Vodafone Group PLC, Sponsored ADR | 8,635,652 | ||||
| TOTAL TELECOMMUNICATION SERVICES | 41,043,652 | |||||
| UTILITIES — 1.0% | ||||||
| Electric Utilities — 0.7% | ||||||
| 900,000 | Cinergy Corp. | 37,467,000 | ||||
| Gas Utilities — 0.3% | ||||||
| 500,000 | KeySpan Corp. | 19,725,000 | ||||
| TOTAL UTILITIES | 57,192,000 | |||||
| TOTAL COMMON STOCK (Cost — $3,586,222,404) | 5,152,196,758 | |||||
| WARRANTS — 0.0% | ||||||
| COMMUNICATIONS — 0.0% | ||||||
| Telecommunications — 0.0% | ||||||
| 255,775 | Lucent Technologies Inc. Expire 12/10/07 (Cost — $0) | 404,125 | ||||
| SUB-TOTAL INVESTMENTS — 87.2% (Cost — $3,586,222,404) | 5,152,600,883 | |||||
| FACE AMOUNT | ||||||
| REPURCHASE AGREEMENTS — 12.9% | ||||||
| $300,000,000 | Deutsche Bank, dated 12/31/04, 2.150% due 1/3/05; Proceeds at maturity — $300,053,750; | 300,000,000 | ||||
| 63,546,000 | Merrill Lynch & Co., Inc., dated 12/31/04, 2.240% due 1/3/05; Proceeds at maturity — $63,557,862; | 63,546,000 | ||||
| 400,000,000 | Morgan Stanley, dated 12/31/04, 2.180% due 1/3/05; Proceeds at maturity — $400,072,667; | 400,000,000 | ||||
| TOTAL REPURCHASE AGREEMENTS (Cost — $763,546,000) | 763,546,000 | |||||
| TOTAL INVESTMENTS — 100.1% (Cost — $4,349,768,404*) | 5,916,146,883 | |||||
Other Assets in Excess of Liabilities — (0.1%) | (7,425,523 | ) | ||||
| TOTAL NET ASSETS — 100.0% | $ | 5,908,721,360 | ||||
| (a) | Non-income producing security. |
| * | Aggregate cost for federal income tax purposes is $4,354,491,427. |
Abbreviation used in this schedule:
ADR — American Depositary Receipt
See Notes to Financial Statements.
14 Smith Barney Appreciation Fund Inc. | 2004 Annual Report
Table of Contents
| Statement of Assets and Liabilities | December 31, 2004 |
| ASSETS: | |||
Investments, at value (Cost — $3,586,222,404) | $ | 5,152,600,883 | |
Repurchase agreements, at value (Cost — $763,546,000) | 763,546,000 | ||
Total Investments (Cost — $4,349,768,404) | 5,916,146,883 | ||
Cash | 473 | ||
Receivable for Fund shares sold | 9,236,114 | ||
Receivable for securities sold | 5,739,091 | ||
Dividends and interest receivable | 5,229,239 | ||
Prepaid expenses | 108,973 | ||
Other receivables | 215,971 | ||
Total Assets | 5,936,676,744 | ||
| LIABILITIES: | |||
Payable for securities purchased | 19,668,786 | ||
Payable for Fund shares reacquired | 2,819,845 | ||
Investment advisory fee payable | 2,008,234 | ||
Transfer agency services payable | 1,397,327 | ||
Distribution fees payable | 1,049,167 | ||
Administration fee payable | 738,856 | ||
Directors’ fees payable | 12,043 | ||
Accrued expenses | 261,126 | ||
Total Liabilities | 27,955,384 | ||
Total Net Assets | $ | 5,908,721,360 | |
| NET ASSETS: | |||
Par value of capital shares (Note 6) | $ | 405,006 | |
Capital paid in excess of par value | 4,286,922,853 | ||
Undistributed net investment income | 678,921 | ||
Accumulated net realized gain from investments transactions and futures contracts | 54,333,720 | ||
Net unrealized appreciation of investments and foreign currencies | 1,566,380,860 | ||
Total Net Assets | $ | 5,908,721,360 | |
Shares Outstanding: | |||
Class A | 243,697,643 | ||
Class B | 74,855,180 | ||
Class C | 42,589,242 | ||
Class Y | 43,864,346 | ||
Net Asset Value: | |||
Class A (and redemption price) | $14.67 | ||
Class B * | $14.40 | ||
Class C * | $14.42 | ||
Class Y (and redemption price) | $14.63 | ||
Maximum Public Offering Price Per Share: | |||
Class A: (based on maximum sales charge of 5.00%) | $15.44 | ||
| * | Redemption price is NAV of Class B and C shares reduced by a 5.00% and 1.00% CDSC, respectively, if shares are redeemed within one year from purchase payment (See Note 2). |
See Notes to Financial Statements.
15 Smith Barney Appreciation Fund Inc. | 2004 Annual Report
Table of Contents
| Statement of Operations | For the Year Ended December 31, 2004 |
| INVESTMENT INCOME: | ||||
Dividends | $ | 97,404,591 | ||
Interest | 7,068,202 | |||
Less: Foreign withholding tax | (341,162 | ) | ||
Total Investment Income | 104,131,631 | |||
| EXPENSES: | ||||
Distribution fees (Notes 2 and 4) | 24,547,818 | |||
Investment advisory fees (Note 2) | 22,649,716 | |||
Administration fees (Note 2) | 8,331,059 | |||
Transfer agency services (Notes 2 and 4) | 7,209,774 | |||
Shareholder communications (Note 4) | 305,018 | |||
Custody | 232,319 | |||
Audit and legal fees | 103,500 | |||
Registration fees | 101,752 | |||
Directors’ fees | 53,763 | |||
Other | 86,561 | |||
Total Expenses | 63,621,280 | |||
Less: Investment advisory fee waiver (Notes 2 and 8) | (1,221,599 | ) | ||
Net Expenses | 62,399,681 | |||
Net Investment Income | 41,731,950 | |||
| REALIZED AND UNREALIZED GAIN ON INVESTMENTS AND FUTURES CONTRACTS (NOTES 1 AND 3): | ||||
Realized Gain From: | ||||
Investment transactions | 145,213,497 | |||
Futures contracts | 14,058,210 | |||
Foreign currency transactions | 1,404 | |||
Net Realized Gain | 159,273,111 | |||
Net Change in Unrealized Appreciation/Depreciation From: | ||||
Investments | 265,449,557 | |||
Foreign currencies | (1,128 | ) | ||
Net Change in Unrealized Appreciation/Depreciation of Investments, Futures Contracts | 265,448,429 | |||
Net Gain on Investments, Futures Contracts and Foreign Currencies | 424,721,540 | |||
Increase in Assets From Operations | $ | 466,453,490 | ||
See Notes to Financial Statements.
16 Smith Barney Appreciation Fund Inc. | 2004 Annual Report
Table of Contents
| Statements of Changes in Net Assets | For the Years Ended December 31, |
| 2004 | 2003 | |||||||
| OPERATIONS: | ||||||||
Net investment income | $ | 41,731,950 | $ | 15,120,864 | ||||
Net realized gain | 159,273,111 | 77,075,649 | ||||||
Net change in unrealized appreciation/depreciation | 265,448,429 | 919,007,730 | ||||||
Increase in Net Assets From Operations | 466,453,490 | 1,011,204,243 | ||||||
| DIVIDENDS AND DISTRIBUTIONS TO SHAREHOLDERS FROM (NOTES 1 AND 5): | ||||||||
Net investment income | (43,156,200 | ) | (25,412,632 | ) | ||||
Net realized gain | (82,029,346 | ) | — | |||||
Decrease in Net Assets From Dividends and Distributions to Shareholders | (125,185,546 | ) | (25,412,632 | ) | ||||
| FUND SHARE TRANSACTIONS (NOTE 6): | ||||||||
Net proceeds from sales of shares | 965,446,223 | 1,176,362,357 | ||||||
Net asset value of shares issued for reinvestment of dividends and distributions | 116,115,224 | 23,023,182 | ||||||
Cost of shares reacquired | (803,571,601 | ) | (936,585,023 | ) | ||||
Increase in Net Assets From Fund Share Transactions | 277,989,846 | 262,800,516 | ||||||
Increase in Net Assets | 619,257,790 | 1,248,592,127 | ||||||
| NET ASSETS: | ||||||||
Beginning of year | 5,289,463,570 | 4,040,871,443 | ||||||
End of year* | $ | 5,908,721,360 | $ | 5,289,463,570 | ||||
* Includes undistributed net investment income of: | $678,921 | $2,101,767 | ||||||
See Notes to Financial Statements.
17 Smith Barney Appreciation Fund Inc. | 2004 Annual Report
Table of Contents
| Financial Highlights |
For a share of each class of capital stock outstanding throughout each year ended December 31:
| Class A Shares(1) | 2004 | 2003 | 2002 | 2001 | 2000 | ||||||||||
Net Asset Value, Beginning of Year | $13.79 | $11.13 | $13.69 | $14.55 | $15.73 | ||||||||||
Income (Loss) From Operations: | |||||||||||||||
Net investment income | 0.14 | 0.07 | 0.06 | 0.10 | 0.16 | ||||||||||
Net realized and unrealized gain (loss) | 1.09 | 2.67 | (2.39 | ) | (0.59 | ) | (0.04 | ) | |||||||
Total Income (Loss) From Operations | 1.23 | 2.74 | (2.33 | ) | (0.49 | ) | 0.12 | ||||||||
Less Dividends and Distributions From: | |||||||||||||||
Net investment income | (0.14 | ) | (0.08 | ) | (0.01 | ) | (0.08 | ) | (0.15 | ) | |||||
Net realized gains | (0.21 | ) | — | (0.22 | ) | (0.29 | ) | (1.15 | ) | ||||||
Total Dividends and Distributions | (0.35 | ) | (0.08 | ) | (0.23 | ) | (0.37 | ) | (1.30 | ) | |||||
Net Asset Value, End of Year | $14.67 | $13.79 | $11.13 | $13.69 | $14.55 | ||||||||||
Total Return(2) | 8.92 | % | 24.70 | % | (17.00 | )% | (3.44 | )% | 0.73 | % | |||||
Net Assets, End of Year (millions) | $3,575 | $3,210 | $2,476 | $3,140 | $3,212 | ||||||||||
Ratios to Average Net Assets: | |||||||||||||||
Expenses | 0.93 | %(3) | 0.96 | % | 0.95 | % | 0.92 | % | 0.90 | % | |||||
Net investment income | 0.96 | 0.55 | 0.48 | 0.68 | 1.02 | ||||||||||
Portfolio Turnover Rate | 40 | % | 42 | % | 74 | % | 62 | % | 61 | % | |||||
| Class B Shares(1) | 2004 | 2003 | 2002 | 2001 | 2000 | ||||||||||
Net Asset Value, Beginning of Period | $13.54 | $10.95 | $13.58 | $14.47 | $15.66 | ||||||||||
Income (Loss) From Operations: | |||||||||||||||
Net investment income (loss) | 0.02 | (0.03 | ) | (0.05 | ) | (0.02 | ) | 0.03 | |||||||
Net realized and unrealized gain (loss) | 1.06 | 2.62 | (2.36 | ) | (0.58 | ) | (0.04 | ) | |||||||
Total Income (Loss) From Operations | 1.08 | 2.59 | (2.41 | ) | (0.60 | ) | (0.01 | ) | |||||||
Less Dividends and Distributions From: | |||||||||||||||
Net investment income | (0.01 | ) | — | — | — | (0.03 | ) | ||||||||
Net realized gains | (0.21 | ) | — | (0.22 | ) | (0.29 | ) | (1.15 | ) | ||||||
Total Dividends and Distributions | (0.22 | ) | — | (0.22 | ) | (0.29 | ) | (1.18 | ) | ||||||
Net Asset Value, End of Period | $14.40 | $13.54 | $10.95 | $13.58 | $14.47 | ||||||||||
Total Return(2) | 7.99 | % | 23.65 | % | (17.70 | )% | (4.20 | )% | (0.12 | )% | |||||
Net Assets, End of Period (millions) | $1,078 | $1,075 | $871 | $1,081 | $1,305 | ||||||||||
Ratios to Average Net Assets: | |||||||||||||||
Expenses | 1.76 | %(3) | 1.76 | % | 1.82 | % | 1.76 | % | 1.69 | % | |||||
Net investment income (loss) | 0.11 | (0.26 | ) | (0.38 | ) | (0.17 | ) | 0.23 | |||||||
Portfolio Turnover Rate | 40 | % | 42 | % | 74 | % | 62 | % | 61 | % | |||||
| (1) | Per share amounts have been calculated using the monthly average shares method. |
| (2) | Performance figures may reflect voluntary fee waivers. Past performance is no guarantee of future results. In the absence of voluntary fee waivers, the total return would have been lower. |
| (3) | The investment adviser voluntarily waived a portion of its management fee for the year ended December 31, 2004. If such fees were not voluntarily waived, the actual expense ratios for Class A and Class B shares would have been 0.95% and 1.78%, respectively. |
See Notes to Financial Statements.
18 Smith Barney Appreciation Fund Inc. | 2004 Annual Report
Table of Contents
| Financial Highlights (continued) |
For a share of each class of capital stock outstanding throughout each year ended December 31:
| Class C Shares(1)(2) | 2004 | 2003 | 2002 | 2001 | 2000 | ||||||||||
Net Asset Value, Beginning of Year | $13.55 | $10.96 | $13.58 | $14.47 | $15.65 | ||||||||||
Income (Loss) From Operations: | |||||||||||||||
Net investment income (loss) | 0.02 | (0.03 | ) | (0.04 | ) | (0.02 | ) | 0.03 | |||||||
Net realized and unrealized gain (loss) | 1.08 | 2.62 | (2.36 | ) | (0.58 | ) | (0.03 | ) | |||||||
Total Income (Loss) From Operations | 1.10 | 2.59 | (2.40 | ) | (0.60 | ) | — | ||||||||
Less Dividends and Distributions From: | |||||||||||||||
Net investment income | (0.02 | ) | — | (0.00 | )* | — | (0.03 | ) | |||||||
Net realized gains | (0.21 | ) | — | (0.22 | ) | (0.29 | ) | (1.15 | ) | ||||||
Total Dividends and Distributions | (0.23 | ) | — | (0.22 | ) | (0.29 | ) | (1.18 | ) | ||||||
Net Asset Value, End of Year | $14.42 | $13.55 | $10.96 | $13.58 | $14.47 | ||||||||||
Total Return(3) | 8.08 | % | 23.63 | % | (17.62 | )% | (4.20 | )% | (0.07 | )% | |||||
Net Assets, End of Year (millions) | $614 | $531 | $318 | $266 | $190 | ||||||||||
Ratios to Average Net Assets: | |||||||||||||||
Expenses | 1.74 | %(4) | 1.80 | % | 1.75 | % | 1.72 | % | 1.72 | % | |||||
Net investment income (loss) | 0.16 | (0.28 | ) | (0.30 | ) | (0.13 | ) | 0.20 | |||||||
Portfolio Turnover Rate | 40 | % | 42 | % | 74 | % | 62 | % | 61 | % | |||||
| Class Y Shares(1) | 2004 | 2003 | 2002 | 2001 | 2000 | ||||||||||
Net Asset Value, Beginning of Year | $13.76 | $11.15 | $13.67 | $14.52 | $15.69 | ||||||||||
Income (Loss) From Operations: | |||||||||||||||
Net investment income | 0.19 | 0.12 | 0.10 | 0.14 | 0.20 | ||||||||||
Net realized and unrealized gain (loss) | 1.09 | 2.67 | (2.39 | ) | (0.58 | ) | (0.02 | ) | |||||||
Total Income (Loss) From Operations | 1.28 | 2.79 | (2.29 | ) | (0.44 | ) | 0.18 | ||||||||
Less Dividends and Distributions From: | |||||||||||||||
Net investment income | (0.20 | ) | (0.18 | ) | (0.01 | ) | (0.12 | ) | (0.20 | ) | |||||
Net realized gains | (0.21 | ) | — | (0.22 | ) | (0.29 | ) | (1.15 | ) | ||||||
Total Dividends and Distributions | (0.41 | ) | (0.18 | ) | (0.23 | ) | (0.41 | ) | (1.35 | ) | |||||
Net Asset Value, End of Year | $14.63 | $13.76 | $11.15 | $13.67 | $14.52 | ||||||||||
Total Return(3) | 9.30 | % | 25.11 | % | (16.71 | )% | (3.07 | )% | 1.07 | % | |||||
Net Assets, End of Year (millions) | $642 | $474 | $85 | $87 | $89 | ||||||||||
Ratios to Average Net Assets: | |||||||||||||||
Expenses | 0.55 | %(4) | 0.59 | % | 0.59 | % | 0.58 | % | 0.58 | % | |||||
Net investment income | 1.35 | 0.96 | 0.85 | 1.02 | 1.34 | ||||||||||
Portfolio Turnover Rate | 40 | % | 42 | % | 74 | % | 62 | % | 61 | % | |||||
| (1) | Per share amounts have been calculated using the monthly average shares method. |
| (2) | On April 29, 2004, Class L shares were renamed as Class C shares. |
| (3) | Performance figures may reflect voluntary fee waivers. Past performance is no guarantee of future results. In the absence of voluntary fee waivers, the total return would have been lower. |
| (4) | The investment adviser voluntarily waived a portion of its management fee for the year ended December 31, 2004. If such fees were not voluntarily waived, the actual expense ratios for Class C and Class Y shares would have been 1.76% and 0.57%, respectively. |
| * | Amount represents less than $0.01 per share. |
See Notes to Financial Statements.
19 Smith Barney Appreciation Fund Inc. | 2004 Annual Report
Table of Contents
| 1. | Significant Accounting Policies |
Smith Barney Appreciation Fund Inc. (the “Fund”), a Maryland corporation, is registered under the Investment Company Act of 1940, as amended, as a diversified, open-end management investment company.
The following are significant accounting policies consistently followed by the Fund and are in conformity with U.S. generally accepted accounting principles (“GAAP”). Estimates and assumptions are required to be made regarding assets, liabilities and changes in net assets resulting from operations when financial statements are prepared. Changes in the economic environment, financial markets and any other parameters used in determining these estimates could cause actual results to differ.
(a) Investment Valuation. Securities listed on a national securities exchange are valued on the basis of the last sale on the date on which the valuation is made or, in the absence of sales, at the mean between the closing bid and asked prices. Securities listed on the NASDAQ National Market System for which market quotations are available are valued at the official closing price or, if there is no official closing price on that day, at the last sale price. Over-the-counter securities are valued at the mean between the closing bid and asked prices on each day. When market quotations or official closing prices are not readily available, or are determined not to reflect accurately fair value, such as when the value of a security has been significantly affected by events after the close of the exchange or market on which the security is principally traded, but before the Fund calculates its net asset value, the Fund may value these investments at fair value as determined in accordance with the procedures approved by the Fund’s Board of Directors. Short-term obligations maturing within 60 days or less are valued at amortized cost, which approximates value.
(b) Repurchase Agreements. When entering into repurchase agreements, it is the Fund’s policy that a custodian takes possession of the underlying collateral securities, the value of which at least equals the principal amount of the repurchase transaction, including accrued interest. To the extent that any repurchase transaction exceeds one business day, the value of the collateral is marked-to-market to ensure the adequacy of the collateral. If the seller defaults and the value of the collateral declines or if bankruptcy proceedings are commenced with respect to the seller of the security, realization of the collateral by the Fund may be delayed or limited.
(c) Futures Contracts. The Fund may enter into futures contracts to the extent permitted by its investment policies and objectives. Upon entering into a futures contract, the Fund is required to deposit cash or securities as initial margin. Additional securities are also segregated up to the current market value of the futures contracts. Subsequent payments, which are dependent on the daily fluctuations in the value of the underlying instrument, are made or received by the Fund each day (daily variation margin) and are recorded as unrealized gains or losses until the contracts are closed. When the contracts are closed, the Fund records a realized gain or loss equal to the difference between the proceeds from (or cost of) the closing transactions and the Fund’s basis in the contracts. The Fund enters into such contracts typically to hedge a portion of the portfolio. The risks associated with of entering into futures contracts include the possibility that a change in the value of the contract may not correlate with the changes in the value of the underlying instruments. In addition, investing in futures contract involves the risk that the Fund could lose more than the original margin deposit and subsequent payments required for a futures transaction.
(d) Security Transactions and Investment Income. Security transactions are accounted for on a trade date basis. Interest income, adjusted for amortization of premium and accretion of discount, is recorded on the accrual basis. Dividend income is recorded on the ex-dividend date. Foreign dividend income is recorded on the ex-dividend date or as soon as practical after the Fund determines the existence of a dividend declaration after exercising reasonable due diligence. The cost of investments sold is determined by use of the specific identification method.
20 Smith Barney Appreciation Fund Inc. | 2004 Annual Report
Table of Contents
Notes to Financial Statements (continued)
(e) Foreign Currency Translation. The books and records of the Fund are maintained in U.S. dollars. Transactions denominated in foreign currencies are recorded at the current prevailing exchange rates. All assets and liabilities denominated in foreign currencies are translated into U.S. dollar amounts at the current exchange rates at the end of the period. Translation gains or losses resulting from changes in the exchange rates during the reporting period and realized gains and losses on the settlement of foreign currency transactions are reported in the statement of operations for the current period. The Fund does not isolate that portion of realized gains and losses on investments in securities, which are due to changes in the foreign exchange rate from that which is due to changes in market prices of equity securities.
(f) Dividends and Distributions to Shareholders. Dividends from net investment income and distributions from net realized gains to shareholders for the Fund, if any, are declared at least annually. Dividends and distributions to shareholders of the Fund are recorded on the ex-dividend date and are determined in accordance with income tax regulations which may differ from GAAP.
(g) Class Accounting. Investment income, common expenses and realized/unrealized gain (loss) on investments are allocated to the various classes of the Fund on the basis of daily net assets of each class. Distribution, transfer agency services and shareholder communications fees relating to a specific class are charged directly to that class.
(h) Federal and Other Taxes. It is the Fund’s policy to comply with the federal income and excise tax requirements of the Internal Revenue Code of 1986, as amended, applicable to regulated investment companies. Accordingly, the Fund intends to distribute substantially all of its taxable income and net realized gains on investments, if any, to shareholders each year. Therefore, no federal income tax provision is required. Under the applicable foreign tax law, a withholding tax may be imposed on interest, dividends and capital gains at various rates.
(i) Reclassification. GAAP requires that certain components of net assets be adjusted to reflect permanent differences between financial and tax reporting. Accordingly, during the current year, $1,404 has been reclassified between accumulated net realized gain on investment transactions and undistributed net investment income due to differences between book foreign currency transactions treated as ordinary income for tax purposes. This reclassification has no effect on net assets or net asset values per share.
| 2. | Investment Advisory Agreement and Other Transactions with Affiliates |
Smith Barney Fund Management LLC (“SBFM”), an indirect wholly-owned subsidiary of Citigroup Inc. (“Citigroup”), acts as investment adviser of the Fund. The Fund pays SBFM an investment advisory fee calculated at the annual rate of 0.55% on the Fund’s average daily net assets up to $250 million; 0.513% on the next $250 million; 0.476% on the next $500 million; 0.439% on the next $1 billion; 0.402% on the next $1 billion; and 0.365% on the Fund’s average daily net assets in excess of $3 billion. This fee is calculated daily and paid monthly.
During the year ended December 31, 2004, SBFM voluntarily waived a portion of its investment advisory fee in the amount of $1,221,599.
SBFM also serves as the Fund’s administrator for which the Fund pays a fee calculated at an annual rate of 0.20% on the Fund’s average daily net assets up to $250 million; 0.187% on the next $250 million; 0.174% on the next $500 million; 0.161% on the next $1 billion; 0.148% on the next $1 billion and 0.135% on the the Fund’s average daily net assets in excess of $3 billion. This fee is calculated daily and paid monthly.
Citicorp Trust Bank, fsb. (“CTB”), another subsidiary of Citigroup, acts as the Fund’s transfer agent. PFPC Inc. (“PFPC”) and Primerica Shareholder Services (“PSS”), another subsidiary of Citigroup, act as the Fund’s sub-transfer agents. CTB receives account fees and asset-based fees that vary according to size and type of account. PFPC and PSS are responsible for
21 Smith Barney Appreciation Fund Inc. | 2004 Annual Report
Table of Contents
Notes to Financial Statements (continued)
shareholder recordkeeping and financial processing for all shareholder accounts and are paid by CTB. For the year ended December 31, 2004, the Fund paid transfer agent fees of $3,712,269 to CTB.
Citigroup Global Markets Inc. (“CGM”) and PFS Distributors, Inc., both of which are subsidiaries of Citigroup, act as the Fund’s distributors.
On February 2, 2004, sales charges on Class L shares were eliminated. Effective April 29, 2004, the Fund’s Class L shares were renamed as Class C shares.
There is a maximum sales charge of 5.00% for Class A shares. There is a contingent deferred sales charge (“CDSC”) of 5.00% on Class B shares, which applies if redemption occurs within one year from purchase payment and declines thereafter by 1.00% per year until no CDSC is incurred. Class C shares have a 1.00% CDSC which applies if redemption occurs within one year from purchase payment. In certain cases, Class A shares also have a 1.00% CDSC, which applies if redemption occurs within one year from purchase payment. This CDSC only applies to those purchases of Class A shares, which, when combined with current holdings of Class A shares, equal or exceed $1,000,000 in the aggregate. These purchases do not incur a sales charge.
For the year ended December 31, 2004, CGM and its affiliates received sales charges of approximately $9,051,000 and $135,000 on sales of the Fund’s Class A and C shares, respectively. In addition, for the year ended December 31, 2004, CDSCs paid to CGM and its affiliates were approximately:
| Class A | Class B | Class C | |||||||
CDSCs | $ | 41,000 | $ | 1,633,000 | $ | 81,000 | |||
For the year ended December 31, 2004, CGM and its affiliates received brokerage commissions of $198,557.
All officers and one Director of the Fund are employees of Citigroup or its affiliates and do not receive compensation from the Fund.
| 3. | Investments |
During the year ended December 31, 2004, the aggregate cost of purchases and proceeds from sales of investments (excluding short-term investments) were as follows:
Purchases | $ | 1,999,082,474 | |
Sales | 2,147,426,774 | ||
At December 31, 2004, the aggregate gross unrealized appreciation and depreciation of investments for federal income tax purposes were as follows:
Gross unrealized appreciation | $ | 1,570,993,182 | ||
Gross unrealized depreciation | (9,337,726 | ) | ||
Net unrealized appreciation | $ | 1,561,655,456 | ||
22 Smith Barney Appreciation Fund Inc. | 2004 Annual Report
Table of Contents
Notes to Financial Statements (continued)
| 4. | Class Specific Expenses |
Pursuant to a Rule 12b-1 Distribution Plan, the Fund pays a service fee with respect to its Class A, B and C shares calculated at an annual rate of 0.25% of the average daily net assets of each class, respectively. The Fund also pays a distribution fee with respect to Class B and C shares calculated at an annual rate of 0.75% of the average daily net assets of each class, respectively. For the year ended December 31, 2004, total Rule 12b-1 Distribution Plan fees, which are accrued daily and paid monthly, were as follows:
| Class A | Class B | Class C | |||||||
Rule 12b-1 Distribution Plan Fees | $ | 8,344,490 | $ | 10,536,862 | $ | 5,666,466 | |||
For the year ended December 31, 2004, total Transfer Agency Service expenses were as follows:
| Class A | Class B | Class C | Class Y | |||||||||
Transfer Agency Service Expenses | $ | 4,117,632 | $ | 2,074,514 | $ | 1,017,262 | $ | 366 | ||||
For the year ended December 31, 2004, total Shareholder Communication expenses were as follows:
| Class A | Class B | Class C | Class Y | |||||||||
Shareholder Communication Expenses | $ | 160,521 | $ | 101,785 | $ | 35,888 | $ | 6,824 | ||||
| 5. | Dividends and Distributions Paid to Shareholders by Class |
| Year Ended December 31, 2004 | Year Ended December 31, 2003 | |||||
Class A | ||||||
Net Investment Income | $ | 33,155,145 | $ | 19,269,683 | ||
Net Realized Gains | 49,301,619 | — | ||||
Total | $ | 82,456,764 | $ | 19,269,683 | ||
Class B | ||||||
Net Investment Income | $ | 915,125 | — | |||
Net Realized Gains | 15,239,783 | — | ||||
Total | $ | 16,154,908 | — | |||
Class C† | ||||||
Net Investment Income | $ | 635,789 | — | |||
Net Realized Gains | 8,637,529 | — | ||||
Total | $ | 9,273,318 | — | |||
| Class Y | ||||||
Net Investment Income | $ | 8,450,141 | $ | 6,142,949 | ||
Net Realized Gains | 8,850,415 | — | ||||
Total | $ | 17,300,556 | $ | 6,142,949 | ||
| † | On April 29, 2004 Class L shares were renamed as Class C shares. |
| 6. | Capital Shares |
At December 31, 2004, the Fund had one billion shares of capital stock authorized with a par value of $0.001 per share. The Fund has the ability to issue multiple classes of shares. Each share of a class represents an identical interest and has the same rights except that each class bears expenses specifically related to the distribution of its shares. Effective April 29, 2004, the Fund renamed Class L shares as Class C shares.
23 Smith Barney Appreciation Fund Inc. | 2004 Annual Report
Table of Contents
Notes to Financial Statements (continued)
Transactions in shares of each class were as follows:
| Year Ended December 31, 2004 | Year Ended December 31, 2003 | |||||||||||||
| Shares | Amount | Shares | Amount | |||||||||||
Class A | ||||||||||||||
Shares sold | 35,351,754 | $ | 498,635,254 | 35,326,517 | $ | 433,034,096 | ||||||||
Shares issued on reinvestment | 5,365,607 | 77,725,534 | 1,384,598 | 18,071,724 | ||||||||||
Shares reacquired | (29,771,134 | ) | (419,571,631 | ) | (26,353,600 | ) | (317,863,939 | ) | ||||||
Net Increase | 10,946,227 | $ | 156,789,157 | 10,357,515 | $ | 133,241,881 | ||||||||
Class B | ||||||||||||||
Shares sold | 11,228,439 | $ | 154,824,428 | 18,265,663 | $ | 216,093,603 | ||||||||
Shares issued on reinvestment | 1,079,859 | 15,377,185 | — | — | ||||||||||
Shares reacquired | (16,828,304 | ) | (232,065,414 | ) | (18,386,441 | ) | (217,188,666 | ) | ||||||
Net Decrease | (4,520,006 | ) | $ | (61,863,801 | ) | (120,778 | ) | $ | (1,095,063 | ) | ||||
Class C† | ||||||||||||||
Shares sold | 9,487,857 | $ | 130,928,824 | 15,867,917 | $ | 189,244,812 | ||||||||
Shares issued on reinvestment | 612,773 | 8,732,009 | — | — | ||||||||||
Shares reacquired | (6,671,683 | ) | (91,944,618 | ) | (5,716,208 | ) | (66,867,882 | ) | ||||||
Net Increase | 3,428,947 | $ | 47,716,215 | 10,151,709 | $ | 122,376,930 | ||||||||
Class Y | ||||||||||||||
Shares sold | 12,734,945 | $ | 181,057,717 | 28,255,831 | $ | 326,434,172 | ||||||||
Shares issued on reinvestment | 988,774 | 14,280,496 | 379,634 | 4,951,458 | ||||||||||
Shares reacquired | (4,299,046 | ) | (59,989,938 | ) | (1,811,607 | ) | (22,659,694 | ) | ||||||
Net Increase | 9,424,673 | $ | 135,348,275 | 26,823,858 | $ | 308,725,936 | ||||||||
Class Z* | ||||||||||||||
Shares sold | — | — | 1,047,437 | $ | 11,555,674 | |||||||||
Shares reacquired | — | — | (27,146,580 | ) | (312,004,842 | ) | ||||||||
Net Decrease | — | — | (26,099,143 | ) | $ | (300,449,168 | ) | |||||||
| † | On April 29, 2004, Class L shares were renamed as Class C shares. |
| * | As of April 21, 2003, Class Z shares were fully exchanged into Class Y shares. |
| 7. | Income Tax Information & Distributions to Shareholders |
The tax character of distributions paid during the fiscal years ended December 31, was as follows:
| 2004 | 2003 | |||||
Ordinary income | $ | 43,156,200 | $ | 25,412,632 | ||
Net Long-term capital gains | 82,029,346 | — | ||||
Total distributions paid | $ | 125,185,546 | $ | 25,412,632 | ||
As of December 31, 2004, the components of accumulated earnings on a tax basis were as follows:
Undistributed ordinary income | $ | 14,417,193 | ||
Undistributed long-term capital gains | 45,330,584 | |||
Total undistributed earnings | 59,747,777 | |||
Other book/tax temporary differences | (12,113 | )* | ||
Unrealized appreciation | 1,561,657,837 | ** | ||
Total accumulated earnings | $ | 1,621,393,501 | ||
| * | Other book/tax temporary differences are attributable primarily to differences in the book/tax treatment of various items. |
| ** | The difference between book-basis and tax-basis unrealized appreciation is attributable primarily to the tax deferral of losses on wash sales. |
24 Smith Barney Appreciation Fund Inc. | 2004 Annual Report
Table of Contents
Notes to Financial Statements (continued)
| 8. | Additional Information |
In connection with an investigation previously disclosed by Citigroup, the Staff of the Securities and Exchange Commission (“SEC”) has notified Citigroup Asset Management (“CAM”), the Citigroup business unit that includes the funds’ investment manager and other investment advisory companies; Citicorp Trust Bank (“CTB”), an affiliate of CAM; Thomas W. Jones, the former CEO of CAM; and three other individuals, one of whom is an employee and two of whom are former employees of CAM, that the SEC Staff is considering recommending a civil injunctive action and/or an administrative proceeding against each of them relating to the creation and operation of an internal transfer agent unit to serve various CAM-managed funds.
In 1999, CTB entered the transfer agent business. CTB hired an unaffiliated subcontractor to perform some of the transfer agent services. The subcontractor, in exchange, had signed a separate agreement with CAM in 1998 that guaranteed investment management revenue to CAM and investment banking revenue to a CAM affiliate. The subcontractor’s business was later taken over by PFPC Inc., and at that time the revenue guarantee was eliminated and a one-time payment was made by the subcontractor to a CAM affiliate.
CAM did not disclose the revenue guarantee when the boards of various CAM-managed funds hired CTB as transfer agent. Nor did CAM disclose to the boards of the various CAM-managed funds the one-time payment received by the CAM affiliate when it was made. As previously disclosed, CAM has already paid the applicable funds, primarily through voluntary fee waivers, a total of approximately $17 million (plus interest), which is the amount of the revenue received by Citigroup relating to the revenue guarantee.
In addition, the SEC Staff has indicated that it is considering recommending action based on the adequacy of the disclosures made to the fund boards that approved the transfer agency arrangement, CAM’s initiation and operation of, and compensation for, the transfer agent business and CAM’s retention of, and agreements with, the subcontractor.
Citigroup is cooperating fully in the SEC’s investigation and is seeking to resolve the matter in discussions with the SEC Staff. On January 20, 2005, Citigroup stated that it had established an aggregate reserve of $196 million ($25 million in the third quarter of 2004 and $171 million in the fourth quarter of 2004) related to its discussions with the SEC Staff. Settlement negotiations are ongoing and any settlement of this matter with the SEC will require approval by the Citigroup Board and acceptance by the Commission.
Unless and until any settlement is consummated, there can be no assurance that any amount reserved by Citigroup will be distributed. Nor is there at this time any certainty as to how the proceeds of any settlement would be distributed, to whom any such distribution would be made, the methodology by which such distribution would be allocated, and when such distribution would be made.
Although there can be no assurance, Citigroup does not believe that this matter will have a material adverse effect on the funds.
| 9. | Legal Matters |
Beginning in June 2004, class action lawsuits alleging violations of the federal securities laws were filed against Citigroup Global Markets Inc. (the “Distributor”) and a number of its affiliates, including Smith Barney Fund Management LLC and Salomon Brothers Asset Management Inc (the “Advisers”), substantially all of the mutual funds managed by the Advisers, including the Fund (the “Funds”), and directors or trustees of the Funds (collectively, the “Defendants”). The complaints alleged, among other things, that the Distributor created various undisclosed incentives for its brokers to sell Smith Barney and Salomon Brothers funds. In addition, according to the complaints, the Advisers caused the Funds to pay excessive
25 Smith Barney Appreciation Fund Inc. | 2004 Annual Report
Table of Contents
Notes to Financial Statements (continued)
brokerage commissions to the Distributor for steering clients towards proprietary funds. The complaints also alleged that the defendants breached their fiduciary duty to the Funds by improperly charging Rule 12b-1 fees and by drawing on fund assets to make undisclosed payments of soft dollars and excessive brokerage commissions. The complaints also alleged that the Funds failed to adequately disclose certain of the allegedly wrongful conduct. The complaints sought injunctive relief and compensatory and punitive damages, rescission of the Funds’ contracts with the Advisers, recovery of all fees paid to the Advisers pursuant to such contracts and an award of attorneys’ fees and litigation expenses.
On December 15, 2004, a consolidated amended complaint (the “Complaint”) was filed alleging substantially similar causes of action. While the lawsuit is in its earliest stages, to the extent that the Complaint purports to state causes of action against the Funds, Citigroup Asset Management believes the Funds have significant defenses to such allegations, which the Funds intend to vigorously assert in responding to the Complaint.
Additional lawsuits arising out of these circumstances and presenting similar allegations and requests for relief may be filed against the Defendants in the future.
As of the date of this report, Citigroup Asset Management and the Funds believe that the resolution of the pending lawsuit will not have a material effect on the financial position or results of operations of the Funds or the ability of the Advisers and their affiliates to continue to render services to the Funds under their respective contracts.
26 Smith Barney Appreciation Fund Inc. | 2004 Annual Report
Table of Contents
The Shareholders and Board of Directors of Smith Barney Appreciation Fund Inc.:
We have audited the accompanying statement of assets and liabilities, including the schedule of investments, of Smith Barney Appreciation Fund Inc. (“Fund”) as of December 31, 2004, and the related statement of operations for the year then ended, the statements of changes in net assets for each of the years in the two-year period then ended, and the financial highlights for each of the years in the five-year period then ended. These financial statements and financial highlights are the responsibility of the Fund’s management. Our responsibility is to express an opinion on these financial statements and financial highlights based on our audits.
We conducted our audits in accordance with the standards of the Public Company Accounting Oversight Board (United States). Those standards require that we plan and perform the audit to obtain reasonable assurance about whether the financial statements and financial highlights are free of material misstatement. An audit includes examining, on a test basis, evidence supporting the amounts and disclosures in the financial statements. Our procedures included confirmation of securities owned as of December 31, 2004, by correspondence with the custodian and brokers or by other appropriate auditing procedures where replies from brokers were not received. An audit also includes assessing the accounting principles used and significant estimates made by management, as well as evaluating the overall financial statement presentation. We believe that our audits provide a reasonable basis for our opinion.
In our opinion, the financial statements and financial highlights referred to above present fairly, in all material respects, the financial position of Smith Barney Appreciation Fund Inc. as of December 31, 2004, and the results of its operations for the year then ended, the changes in its net assets for each of the years in the two-year period then ended, and the financial highlights for each of the years in the five-year period then ended, in conformity with U.S. generally accepted accounting principles.

New York, New York
February 18, 2005
27 Smith Barney Appreciation Fund Inc. | 2004 Annual Report
Table of Contents
| Additional Information (unaudited) |
Information about Directors and Officers
The business and affairs of the Smith Barney Appreciation Fund Inc. (“Fund”) are managed under the direction of the Board of Directors. Information pertaining to the Directors and Officers of the Fund is set forth below. The Statement of Additional Information includes additional information about the Fund’s and is available, without charge, upon request by calling the Citicorp Trust Bank, fsb. at 1-800-451-2010 or (PFPC at 1-800-451-2010 and Primerica Shareholder Services at 1-800-544-5445).
| Name, Address, and Birth Year | Position(s) Held with Fund | Term of Office* and Length of Time Served | Principal Occupation(s) During Past 5 Years | Number of Portfolios in Fund Complex Overseen by Director | Other Board Memberships Held by Director | |||||
Non-Interested Directors: | ||||||||||
Dwight B. Crane Harvard Business School Soldiers Field Morgan Hall #375 Boston, MA 02163 Birth Year: 1937 | Director | Since 1995 | Professor, Harvard Business School | 49 | None | |||||
Burt N. Dorsett The Straford #702 5601 Turtle Bay Drive Naples, FL 34108 Birth Year: 1930 | Director | Since 1973 | President of Dorsett McCabe Capital Management Inc.; Chief Investment Officer of Leeb Capital Management, Inc. (since 1999) | 27 | None | |||||
Elliot S. Jaffe The Dress Barn Inc. Executive Office 30 Dunnigan Drive Suffern, NY 10901 Birth Year: 1926 | Director | Since 1988 | Chairman of The Dress Barn Inc. | 27 | The Dress Barn, Inc. | |||||
Stephen E. Kaufman Stephen E. Kaufman PC 277 Park Avenue, 47th Floor New York, NY 10172 Birth Year: 1932 | Director | Since 1995 | Attorney | 55 | None | |||||
Cornelius C. Rose, Jr. P.O. Box 5388 West Lebanon, NH 03784 Birth Year: 1932 | Director | Since 1973 | Chief Executive Officer of Performance Learning Systems | 27 | None | |||||
Interested Director: | ||||||||||
R. Jay Gerken, CFA** Citigroup Asset Management (“CAM”) 399 Park Avenue, 4th Floor New York, NY 10022 Birth Year: 1951 | Chairman, President and Chief Executive Officer | Since 2002 | Managing Director of Citigroup Global Markets Inc. (“CGM”); Chairman, President and Chief Executive Officer of Smith Barney Fund Management LLC (“SBFM”), Travelers Investment Adviser, Inc. (“TIA”) and Citi Fund Management Inc. (“CFM”); President and Chief Executive Officer of certain mutual funds associated with Citigroup Inc. (“Citigroup”); Formerly Portfolio Manager of Smith Barney Allocation Series Inc. (from 1996 to 2001) and Smith Barney Growth and Income Fund (from 1996 to 2000) | 219 | None | |||||
28 Smith Barney Appreciation Fund Inc. | 2004 Annual Report
Table of Contents
| Additional Information (unaudited) (continued) |
| Name, Address, and Birth Year | Position(s) Held with Fund | Term of Office* and Length of Time Served | Principal Occupation(s) During Past 5 Years | Number of Portfolios in Fund Complex Overseen by Director | Other Board Memberships Held by Director | |||||
Officers: | ||||||||||
Andrew B. Shoup CAM 125 Broad Street, 11th Floor New York, NY 10004 Birth Year: 1956 | Senior Vice President and Chief Administrative Officer | Since 2003 | Director of CAM; Senior Vice President and Chief Administrative Officer of mutual funds associated with Citigroup; Head of International Funds Administration of CAM (from 2001 to 2003); Director of Global Funds Administration of CAM (from 2000 to 2001); Head of U.S. Citibank Funds Administration of CAM (from 1998 to 2000) | N/A | N/A | |||||
Kaprel Ozsolak CAM 125 Broad Street, 11th Floor New York, NY 10004 Birth Year: 1965 | Chief Financial Officer and Treasurer | Since 2004 | Vice President of CGM; Chief Financial Officer and Treasurer of certain mutual funds associated with Citigroup; Controller of certain mutual funds associated with Citigroup (from 2002 to 2004) | N/A | N/A | |||||
Harry D. Cohen CAM 399 Park Avenue New York, NY 10022 Birth Year: 1940 | Vice President and Investment Officer | Since 1980 | Managing Director of CGM; Chief Investment Officer of SBFM, CFM and TIA | N/A | N/A | |||||
Scott K. Glasser CAM 399 Park Avenue New York, NY 10022 Birth Year: 1966 | Vice President and Investment Officer | Since 1996 | Managing Director of CGM; Investment Officer of SBFM | N/A | N/A | |||||
Andrew Beagley CAM 399 Park Avenue, 4th Floor New York, NY 10022 Birth Year: 1962 | Chief Anti-Money Laundering Compliance Officer
Chief Compliance Officer | Since
Since | Director of CGM (since 2000); Director of Compliance, North America, CAM (since 2000); Chief Anti-Money Laundering Compliance Officer and Vice President of certain mutual funds associated with Citigroup; Director of Compliance, Europe, the Middle East and Africa, Citigroup Asset Management (from 1999 to 2000); Chief Compliance Officer: SBFM, CFM, TIA, Salomon Brothers Asset Management Limited, Smith Barney Global Capital Management, Inc., | N/A | N/A | |||||
Robert I. Frenkel CAM 300 First Stamford Place, 4th Floor Stamford, CT 06902 Birth Year: 1954 | Secretary and Chief Legal Officer | Since 2003 | Managing Director and General Counsel of Global Mutual Funds for CAM and its predecessor (since 1994); Secretary and Chief Legal Officer of mutual funds associated with Citigroup | N/A | N/A | |||||
| * | Each Director and Officer serves until his or her successor has been duly elected and qualified. |
| ** | Mr. Gerken is an “interested person” of the Fund as defined in the Investment Company Act of 1940, as amended, because Mr. Gerken is an officer of SBFM and certain of its affiliates. |
29 Smith Barney Appreciation Fund Inc. | 2004 Annual Report
Table of Contents
Important Tax Information (unaudited)
|
The following information is provided with respect to the ordinary income and capital gain distributions paid by Smith Barney Appreciation Fund Inc. during the taxable year ended December 31, 2004:
Record Date: | 7/27/2004 | 12/13/2004 | ||||||
Payable Date: | 7/30/2004 | 12/16/2004 | ||||||
Qualified Dividend Income for Individuals | 100.00 | % | 100.00 | % | ||||
Dividends Qualifying for the Dividends Received Deduction for Corporations | 100.00 | % | 100.00 | % | ||||
Long-term Capital Gains Dividend | $ | — | $ | 0.206500 | ||||
Please retain this information for your records.
30 Smith Barney Appreciation Fund Inc. | 2004 Annual Report
Table of Contents
SMITH BARNEY
APPRECIATION FUND INC.
DIRECTORS Dwight B. Crane Burt N. Dorsett R. Jay Gerken, CFA Elliot S. Jaffe Stephen E. Kaufman Cornelius C. Rose, Jr.
OFFICERS R. Jay Gerken, CFA President and Chief Executive Officer
Andrew B. Shoup Senior Vice President and Chief Administrative Officer
Kaprel Ozsolak Chief Financial Officer and Treasurer
Harry D. Cohen Vice President and Investment Officer
Scott K. Glasser Vice President and Investment Officer
Andrew Beagley Chief Anti-Money Laundering Compliance Officer
Robert I. Frenkel Secretary and Chief Legal Officer | INVESTMENT ADVISER Smith Barney Fund Management LLC
DISTRIBUTORS Citigroup Global Markets Inc. PFS Distributors, Inc.
CUSTODIAN State Street Bank and Trust Company
TRANSFER AGENT Citicorp Trust Bank, fsb. 125 Broad Street, 11th Floor New York, New York 10004
SUB-TRANSFER AGENTS PFPC Inc. P.O. Box 9699 Providence, Rhode Island 02940-9699
Primerica Shareholder Services P.O. Box 9662 Providence, Rhode Island 02940-9662 |
Table of Contents
Smith Barney Appreciation Fund Inc.
The Fund files its complete schedule of portfolio holdings with Securities and Exchange Commission for the first and third quarters of each fiscal year on Form N-Q. The Fund’s Forms N-Q are available on the Commission’s website at www.sec.gov. The Fund’s Forms N-Q may be reviewed and copied at the Commission’s Public Reference Room in Washington D.C., and information on the operation of the Public Reference Room may be obtained by calling 1-800-SEC-0330. To obtain information on Form N-Q from the Fund, shareholders can call 1-800-451-2010.
Information on how the Fund voted proxies relating to portfolio securities during the 12-month period ended June 30, 2004 and a description of the policies and procedures that the Fund uses to determine how to vote proxies relating to portfolio securities is available (1) without charge, upon request, by calling 1-800-451-2010, (2) on the Fund’s website at www.citigroupAM.com and (3) on the SEC’s website at www.sec.gov.
This report is submitted for the general information of the shareholders of Smith Barney Appreciation Fund Inc., but it also may be used as sales literature when preceded or accompanied by the current Prospectus.
SMITH BARNEY APPRECIATION FUND INC.
Smith Barney Mutual Funds
125 Broad Street
10th Floor, MF-2
New York, New York 10004
This report must be preceded or accompanied by a free prospectus. Investors should consider the fund’s investment objectives, risks, charges and expenses carefully before investing. The prospectus contains this and other important information about the fund. Please read the prospectus carefully before you invest or send money.
www.smithbarneymutualfunds.com
©2004 Citigroup Global Markets Inc.
Member NASD, SIPC
| FD0404 2/05 | 05-7913 |
Table of Contents
| ITEM 2. | CODE OF ETHICS. |
The registrant has adopted a code of ethics that applies to the registrant’s principal executive officer, principal financial officer, principal accounting officer or controller.
| ITEM 3. | AUDIT COMMITTEE FINANCIAL EXPERT. |
The Board of Directors of the registrant has determined that Dwight B. Crane, the Chairman of the Board’s Audit Committee, possesses the technical attributes identified in Instruction 2(b) of Item 3 to Form N-CSR to qualify as an “audit committee financial expert,” and has designated Mr. Crane as the Audit Committee’s financial expert. Mr. Crane is an “independent” Director pursuant to paragraph (a)(2) of Item 3 to Form N-CSR.
| Item 4. | Principal Accountant Fees and Services |
| (a) | Audit Fees for the Smith Barney Appreciation Fund were $36,500 and $36,500 for the years ended 12/31/04 and 12/31/03. |
| (b) | Audit-Related Fees for the Smith Barney Appreciation Fund were $0 and $0 for the years ended 12/31/04 and 12/31/03. |
| (c) | Tax Fees for Smith Barney Appreciation Fund of $3,400 and $3,400 for the years ended 12/31/04 and 12/31/03. These amounts represent aggregate fees paid for tax compliance, tax advice and tax planning services, which include (the filing and amendment of federal, state and local income tax returns, timely RIC qualification review and tax distribution and analysis planning) rendered by the Accountant to Smith Barney Appreciation Fund. |
| (d) | All Other Fees for Smith Barney Appreciation Fund of $0 and $0 for the years ended 12/31/04 and 12/31/03. |
| (e) | (1) Audit Committee’s pre–approval policies and procedures described in paragraph (c) (7) of Rule 2-01 of Regulation S-X. |
The Charter for the Audit Committee (the “Committee”) of the Board of each registered investment company (the “Fund”) advised by Smith Barney Fund Management LLC or Salomon Brothers Asset Management Inc or one of their affiliates (each, an “Adviser”) requires that the Committee shall approve (a) all audit and permissible non-audit services to be provided to the Fund and (b) all permissible non-audit services to be provided by the Fund’s independent auditors to the Adviser and any Covered Service Providers if the engagement relates directly to the operations and financial reporting of the Fund. The Committee may implement policies and procedures by which such services are approved other than by the full Committee.
The Committee shall not approve non-audit services that the Committee believes may impair the independence of the auditors. As of the date of the approval of this Audit Committee Charter, permissible non-audit services include any professional services (including tax services), that are not prohibited services as described below, provided to the Fund by the independent auditors, other than those provided to the Fund in connection with an audit or a review of the financial statements of the Fund. Permissible non-audit services may not include: (i) bookkeeping or other services related to the accounting records or financial statements of the Fund; (ii) financial information systems design and implementation; (iii) appraisal or valuation services, fairness opinions or contribution-in-kind reports; (iv) actuarial services; (v) internal audit outsourcing services; (vi) management functions or human resources; (vii) broker or dealer, investment adviser or investment banking services; (viii) legal services and expert services unrelated to the audit; and (ix) any other service the Public Company Accounting Oversight Board determines, by regulation, is impermissible.
Table of Contents
Pre-approval by the Committee of any permissible non-audit services is not required so long as: (i) the aggregate amount of all such permissible non-audit services provided to the Fund, the Adviser and any service providers controlling, controlled by or under common control with the Adviser that provide ongoing services to the Fund (“Covered Service Providers”) constitutes not more than 5% of the total amount of revenues paid to the independent auditors during the fiscal year in which the permissible non-audit services are provided to (a) the Fund, (b) the Adviser and (c) any entity controlling, controlled by or under common control with the Adviser that provides ongoing services to the Fund during the fiscal year in which the services are provided that would have to be approved by the Committee; (ii) the permissible non-audit services were not recognized by the Fund at the time of the engagement to be non-audit services; and (iii) such services are promptly brought to the attention of the Committee and approved by the Committee (or its delegate(s)) prior to the completion of the audit.
(2) For the Smith Barney Appreciation Fund, the percentage of fees that were approved by the audit committee, with respect to: Audit-Related Fees were 100% and 100% for the years ended 12/31/04 and 12/31/03; Tax Fees were 100% and 100% for the years ended 12/31/04 and 12/31/03; and Other Fees were 100% and 100% for the years ended 12/31/04 and 12/31/03.
| (f) | N/A |
| (g) | Non-audit fees billed by the Accountant for services rendered to Smith Barney Appreciation Fund and CAM and any entity controlling, controlled by, or under common control with CAM that provides ongoing services to Smith Barney Appreciation Fund. Fees billed to and paid by Citigroup Global Markets, Inc. related to the transfer agent matter as fully described in the notes to the financial statements titled “additional information” were $75,000 and $0 for the years ended 12/31/04 and 12/31/03. |
| (h) | Yes. The Smith Barney Appreciation Fund’s Audit Committee has considered whether the provision of non-audit services that were rendered to Service Affiliates which were not pre-approved (not requiring pre-approval) is compatible with maintaining the Accountant’s independence. All services provided by the Accountant to the Smith Barney Appreciation Fund or to Service Affiliates which were required to be pre-approved were pre-approved as required. |
| ITEM 5. | AUDIT COMMITTEE OF LISTED REGISTRANTS. |
Not applicable.
| ITEM 6. | [RESERVED] |
| ITEM 7. | DISCLOSURE OF PROXY VOTING POLICIES AND PROCEDURES FOR CLOSED-END MANAGEMENT INVESTMENT COMPANIES. |
Not applicable.
| ITEM 8. | [RESERVED] |
| ITEM 9. | SUBMISSION OF MATTERS TO A VOTE OF SECURITY HOLDERS. |
Not applicable.
Table of Contents
| ITEM 10. | CONTROLS AND PROCEDURES. |
| (a) | The registrant’s principal executive officer and principal financial officer have concluded that the registrant’s disclosure controls and procedures (as defined in Rule 30a- 3(c) under the Investment Company Act of 1940, as amended (the “1940 Act”)) are effective as of a date within 90 days of the filing date of this report that includes the disclosure required by this paragraph, based on their evaluation of the disclosure controls and procedures required by Rule 30a-3(b) under the 1940 Act and 15d-15(b) under the Securities Exchange Act of 1934. |
| (b) | There were no changes in the registrant’s internal control over financial reporting (as defined in Rule 30a-3(d) under the 1940 Act) that occurred during the registrant’s last fiscal half-year (the registrant’s second fiscal half-year in the case of an annual report) that have materially affected, or are likely to materially affect the registrant’s internal control over financial reporting. |
| ITEM 11. | EXHIBITS. |
| (a) | Code of Ethics attached hereto. |
Exhibit 99.CODE ETH
| (b) | Attached hereto. |
| Exhibit 99.CERT | Certifications pursuant to section 302 of the Sarbanes-Oxley Act of 2002 | |
| Exhibit 99.906CERT | Certifications pursuant to Section 906 of the Sarbanes-Oxley Act of 2002 | |
Table of Contents
SIGNATURES
Pursuant to the requirements of the Securities Exchange Act of 1934 and the Investment Company Act of 1940, the registrant has duly caused this Report to be signed on its behalf by the undersigned, there unto duly authorized.
Smith Barney Appreciation Fund Inc.
| By: | /s/ R. Jay Gerken | |
| R. Jay Gerken | ||
| Chief Executive Officer of | ||
| Smith Barney Appreciation Fund Inc. | ||
| Date: | March 9, 2005 | |
Pursuant to the requirements of the Securities Exchange Act of 1934 and the Investment Company Act of 1940, this report has been signed below by the following persons on behalf of the registrant and in the capacities and on the dates indicated.
| By: | /s/ R. Jay Gerken | |
| (R. Jay Gerken) | ||
| Chief Executive Officer of | ||
| Smith Barney Appreciation Fund Inc. | ||
| Date: | March 9, 2005 | |
| By: | /s/ Kaprel Ozsolak | |
| (Kaprel Ozsolak) | ||
| Chief Financial Officer of | ||
| Smith Barney Appreciation Fund Inc. | ||
| Date: | March 9, 2005 | |