UNITED STATES
SECURITIES AND EXCHANGE COMMISSION
Washington, D.C. 20549
FORM N-CSR
CERTIFIED SHAREHOLDER REPORT OF REGISTERED
MANAGEMENT INVESTMENT COMPANIES
Investment Company Act file number 811-1940
Smith Barney Appreciation Fund Inc.
(Exact name of registrant as specified in charter)
125 Broad Street, New York, NY 10004
(Address of principal executive offices) (Zip code)
Robert I. Frenkel, Esq.
Legg Mason & Co., LLC
300 First Stamford Place, 4th Floor
Stamford, CT 06902
(Name and address of agent for service)
Registrant’s telephone number, including area code: (800) 451-2010
Date of fiscal year end: December 31
Date of reporting period: December 31, 2005
ITEM 1. REPORT TO STOCKHOLDERS.
The Annual Report to Stockholders is filed herewith.
EXPERIENCE
ANNUAL REPORT
DECEMBER 31, 2005

Smith Barney
Appreciation Fund Inc.
INVESTMENT PRODUCTS: NOT FDIC INSURED • NO BANK GUARANTEE • MAY LOSE VALUE
Smith Barney Appreciation Fund Inc.
Annual Report • December 31, 2005
Inside
Fund Objective
The Fund seeks long-term appreciation of shareholders’ capital.
| I | ||
| 1 | ||
| 4 | ||
| 5 | ||
| 7 | ||
| 8 | ||
| 9 | ||
| 15 | ||
| 16 | ||
| 17 | ||
| 18 | ||
| 22 | ||
| 33 | ||
| 34 | ||
| 41 | ||
| 45 | ||
| 46 | ||
Under a licensing agreement between Citigroup and Legg Mason, the names of funds, the names of any classes of shares of funds, and the names of investment advisers of funds, as well as all logos, trademarks and service marks related to Citigroup or any of its affiliates (“Citi Marks”) are licensed for use by Legg Mason. Citi Marks include, but are not limited to, “Smith Barney,” “Salomon Brothers,” “Citi” and “Citigroup Asset Management”. Legg Mason and its affiliates, as well as the Fund’s investment manager, are not affiliated with Citigroup.
All Citi Marks are owned by Citigroup, and are licensed for use until no later than one year after the date of the licensing agreement.

R. JAY GERKEN, CFA
Chairman, President and Chief Executive Officer
Dear Shareholder,
Despite numerous obstacles, including rising short-term interest rates, surging oil prices, a destructive hurricane season, and geopolitical issues, the U.S. economy continued to expand at a healthy pace during the reporting period. After a 3.8% advance in the first quarter of 2005, gross domestic product (“GDP”)i growth was 3.3% during the second quarter and 4.1% in the third quarter. While fourth quarter figures have not yet been released, another slight gain is anticipated.
Given the strength of the economy and inflationary pressures, the Federal Reserve Board (“Fed”)ii continued to raise interest rates throughout the period. After raising rates five times from June 2004 through December 2004, the Fed increased its target for the federal funds rateiii in 0.25% increments eight additional times over the reporting period. This represents the longest sustained Fed tightening cycle since the 1970s. All told, the Fed’s thirteen rate hikes have brought the target for the federal funds rate from 1.00% to 4.25%. After the end of the Fund’s reporting period, at its January meeting, the Fed once again raised its target for the federal funds rate by 0.25% to 4.50%.
For the one-year period ended December 31, 2005, the U.S. stock market generated positive results, with the S&P 500 Indexiv returning 4.91%. While corporate profits remained strong during the year, they were often overshadowed by rising interest rates and higher oil prices.
Looking at the fiscal year as a whole, mid-cap stocks outperformed their large- and small-cap counterparts, with the Russell Midcapv, Russell 1000vi, and Russell 2000vii Indexes returning 12.65%, 6.27%, and 4.55%, respectively. From an investment style perspective, value stocks outperformed growth stocks for the sixth consecutive calendar year, with the Russell 3000 Valueviii and Russell 3000 Growthix Indexes returning 6.85% and 5.17%, respectively, in 2005.
Smith Barney Appreciation Fund Inc. I
Please read on for a more detailed look at prevailing economic and market conditions during the Fund’s fiscal year and to learn how those conditions have affected Fund performance.
Special Shareholder Notices
On December 1, 2005, Citigroup Inc. (“Citigroup”) completed the sale of substantially all of its asset management business, Citigroup Asset Management (“CAM”), to Legg Mason, Inc. (“Legg Mason”). As a result, the Fund’s investment adviser (the “Manager”), previously an indirect wholly-owned subsidiary of Citigroup, has become a wholly-owned subsidiary of Legg Mason. Completion of the sale caused the Fund’s existing investment advisory contract to terminate. The Fund’s shareholders previously approved a new investment management contract between the Fund and the Manager, which became effective on December 1, 2005.
On or about April 7, 2006, the Smith Barney Appreciation Fund Inc. will be renamed Legg Mason Partners Appreciation Fund.
Information About Your Fund
As you may be aware, several issues in the mutual fund industry have recently come under the scrutiny of federal and state regulators. The Fund’s Manager and some of its affiliates have received requests for information from various government regulators regarding market timing, late trading, fees, and other mutual fund issues in connection with various investigations. The regulators appear to be examining, among other things, the Fund’s response to market timing and shareholder exchange activity, including compliance with prospectus disclosure related to these subjects. The Fund has been informed that the Manager and its affiliates are responding to those information requests, but are not in a position to predict the outcome of these requests and investigations.
Important information concerning the Fund and its Manager with regard to recent regulatory developments is contained in the Notes to Financial Statements included in this report.
II Smith Barney Appreciation Fund Inc.
As always, thank you for your confidence in our stewardship of your assets. We look forward to helping you continue to meet your financial goals.
Sincerely,

R. Jay Gerken, CFA
Chairman, President and Chief Executive Officer
February 2, 2006
All index performance reflects no deduction for fees, expenses or taxes. Please note that an investor cannot invest directly in an index.
| i | Gross domestic product is a market value of goods and services produced by labor and property in a given country. |
| ii | The Federal Reserve Board is responsible for the formulation of a policy designed to promote economic growth, full employment, stable prices, and a sustainable pattern of international trade and payments. |
| iii | The federal funds rate is the interest rate that banks with excess reserves at a Federal Reserve district bank charge other banks that need overnight loans. |
| iv | The S&P 500 Index is an unmanaged index of 500 stocks that is generally representative of the performance of larger companies in the U.S. |
| v | The Russell Midcap Index measures the performance of the 800 smallest companies in the Russell 1000 Index whose average market capitalization was approximately $4.7 billion as of 6/24/05. |
| vi | The Russell 1000 Index measures the performance of the 1,000 largest companies in the Russell 3000 Index, which represents approximately 92% of the total market capitalization of the Russell 3000 Index. |
| vii | The Russell 2000 Index measures the performance of the 2,000 smallest companies in the Russell 3000 Index, which represents approximately 8% of the total market capitalization of the Russell 3000 Index. |
| viii | The Russell 3000 Value Index measures the performance of those Russell 3000 Index companies with lower price-to-book ratios and lower forecasted growth values. (A price-to-book ratio is the price of a stock compared to the difference between a company’s assets and liabilities.) |
| ix | The Russell 3000 Growth Index measures the performance of those Russell 3000 Index companies with higher price-to-book ratios and higher forecasted growth values. |
Smith Barney Appreciation Fund Inc. III
Manager Overview
 |  | HERSH COHEN (left) Portfolio Manager
SCOTT K. GLASSER (right) Portfolio Manager |
Q. What were the overall market conditions during the Fund’s reporting period?
A. When viewed at year-end 2005, the financial markets seemed fairly benign, with the stock market in general having posted small gains, and bonds finishing the year about where they began. While that might seem boring, there was plenty of volatility inside the markets. Several events fueled substantial media and public pessimism. Natural disasters in New Orleans, Florida and Asia made for horrible stories of human tragedy, along with strains on oil prices and deficits. The Federal Reserve Board (“Fed”)i repeatedly lifted short-term interest rates, which raised the specter of indigestion in the financial markets. Yet despite such visible and dramatic problems, the stock market did not break, and long-term interest rates did not soar. Some groups, like energy and natural resources, had big moves interrupted by some sharp corrections. Other groups, despite excellent or improving fundamentals, suffered from neglect. That was particularly true of many of the big blue chip stocks.
Performance Review
For the 12 months ended December 31, 2005, Class A shares of the Smith Barney Appreciation Fund Inc., excluding sales charges, returned 4.15%. These shares underperformed the Lipper Large-Cap Core Funds Category Average,1 which increased 4.86%. The Fund’s unmanaged benchmark, the S&P 500 Index,ii returned 4.91% for the same period.
Smith Barney Appreciation Fund Inc. 2005 Annual Report 1
| 1 | Lipper, Inc. is a major independent mutual-fund tracking organization. Returns are based on the 12-month period ended December 31, 2005, including the reinvestment of all distributions, including returns of capital, if any, calculated among the 888 funds in the Fund’s Lipper category, and excluding sales charges. |
| Performance Snapshot as of December 31, 2005 (excluding sales charges) (unaudited) | ||||||
| 6 months | 12 months | |||||
Appreciation Fund — Class A Shares | 5.42% | 4.15% | ||||
S&P 500 Index | 5.76% | 4.91% | ||||
Lipper Large-Cap Core Funds Category Average | 6.01% | 4.86% | ||||
| The performance shown represents past performance. Past performance is no guarantee of future results and current performance may be higher or lower than the performance shown above. Principal value and investment returns will fluctuate and investors’ shares, when redeemed, may be worth more or less than their original cost. To obtain performance data current to the most recent month-end, please visit our website at www.citigroupam.com. | ||||||
| All share class returns assume the reinvestment of all distributions, including returns of capital, if any, at net asset value and the deduction of all Fund expenses. Returns have not been adjusted to include sales charges that may apply when shares are purchased or the deduction of taxes that a shareholder would pay on Fund distributions. Excluding sales charges, Class B shares returned 4.96%, Class C shares returned 4.95% and Class Y shares returned 5.61% over the six months ended December 31, 2005. Excluding sales charges, Class B shares returned 3.31%, Class C shares returned 3.31% and Class Y shares returned 4.62% over the twelve months ended December 31, 2005. | ||||||
| Lipper, Inc. is a major independent mutual-fund tracking organization. Returns are based on the period ended December 31, 2005, including the reinvestment of all distributions, including returns of capital, if any, calculated among the 913 funds for the 6-month period and among the 888 funds for the 12-month period in the Fund’s Lipper category, and excluding sales charges. | ||||||
Q. What were the most significant factors affecting Fund performance?
A. The Fund’s strongest returns for the year came in the energy sector as oil prices reached record highs in the wake of the Gulf hurricanes. The Fund’s position in energy stocks accounted for a significant portion of the Fund’s total returns for the year. The Fund’s financials sector position also made a meaningful contribution to performance for the year, along with positive returns in the health care, consumer staples, materials and utilities sectors. The Fund’s positions in the industrials, consumer discretionary, information technology and telecommunication services sectors registered losses for the year. The Fund’s relative overweight to the robust energy sector and its underweight to the poorly performing telecommunication services sector helped relative performance, but these positives were offset by the negative impact of an underweight to utilities stocks, which also had strong returns, and stock selection in the industrials sector.
What were the leading contributors to performance?
A. The greatest contributors to performance for the period included positions in Canadian Natural Resources Ltd. and EnCana Corp. in energy, Hewlett-Packard Co. in information technology, Rio Tinto PLC in materials, and Forest City Enterprises Inc. in financials (real estate). All five top contributors were still held by the Fund at the close of the year.
What were the leading detractors from performance?
A. The greatest detractors from performance for the period included positions in Gannett Co. Inc. and Walt Disney Co. in consumer discretionary, International
2 Smith Barney Appreciation Fund Inc. 2005 Annual Report
Business Machines Corp. (IBM) and Symantec Corp. in information technology, and Tyco International Ltd. in industrials. All five top detractors were still held by the Fund at the close of the year.
Q. Were there any significant changes to the Fund during the reporting period?
A. While the Fund did experience a historically consistent level of portfolio turnover during the past year, the managers did not make any significant alterations to the portfolio or its sector allocation.
Thank you for your investment in the Smith Barney Appreciation Fund Inc. As ever, we appreciate that you have chosen us to manage your assets and we remain focused on achieving the Fund’s investment goals.
Sincerely,
 |  | |
| Harry D. Cohen | Scott K. Glasser | |
| Portfolio Manager | Portfolio Manager |
January 25, 2006
The information provided is not intended to be a forecast of future events, a guarantee of future results or investment advice. Views expressed may differ from those of the firm as a whole.
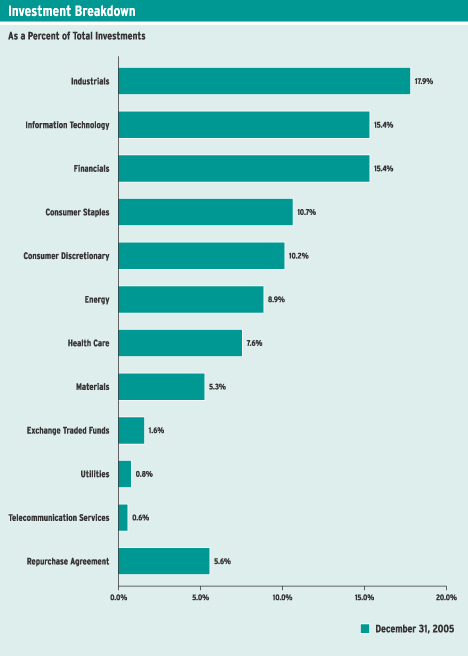
Portfolio holdings and breakdowns are as of December 31, 2005 and are subject to change and may not be representative of the portfolio manager’s current or future investments. The Fund’s top ten holdings (as a percentage of net assets) as of this date were: Berkshire Hathaway Inc. (6.2%), Microsoft Corp. (4.9%), General Electric Co. (4.5%), 3M Co. (3.3%), Exxon Mobil Corp. (3.2%), Procter & Gamble Co. (2.0%), Johnson & Johnson (1.8%), Wells Fargo & Co. (1.8%), Time Warner Inc. (1.8%) and PepsiCo Inc. (1.7%). Please refer to pages 9 through 14 for a list and percentage breakdown of the Fund’s holdings.
The mention of sector breakdowns is for informational purposes only and should not be construed as a recommendation to purchase or sell any securities. The information provided regarding such sectors is not a sufficient basis upon which to make an investment decision. Investors seeking financial advice regarding the appropriateness of investing in any securities or investment strategies discussed should consult their financial professional. Portfolio holdings are subject to change at any time and may not be representative of the portfolio manager’s current or future investments. The Fund’s top five sector holdings (as a percentage of net assets) as of December 31, 2005 were: Industrials (18.0%), Information Technology (15.5%), Financials (15.4%), Consumer Staples (10.7%) and Consumer Discretionary (10.3%). The Fund’s portfolio composition is subject to change at any time.
RISKS: Keep in mind, stock prices are subject to market fluctuations. The Fund may invest in small- and mid-cap companies that may involve a higher degree of risk and volatility than investments in large-cap companies. This Fund may invest in foreign stocks, which are subject to certain risks of overseas investing not associated with domestic investing, such as currency fluctuations and changes in political and economic conditions, which could result in significant market fluctuations. These risks are magnified in emerging markets. The Fund may use derivatives, such as options and futures, which can be illiquid, may disproportionately increase losses, and have a potentially large impact on Fund performance. Please see the Fund’s prospectus for more information on these and other risks.
All index performance reflects no deduction for fees, expenses or taxes. Please note an investor cannot invest directly in an index.
| i | The Federal Reserve Board is responsible for the formulation of a policy designed to promote economic growth, full employment, stable prices, and a sustainable pattern of international trade and payments. |
| ii | The S&P 500 Index is an unmanaged index of 500 stocks that is generally representative of the performance of larger companies in the U.S. |
Smith Barney Appreciation Fund Inc. 2005 Annual Report 3
4 Smith Barney Appreciation Fund Inc. 2005 Annual Report
Example
As a shareholder of the Fund, you may incur two types of costs: (1) transaction costs, including front-end and back-end sales charges (loads) on purchase payments; and (2) ongoing costs, including management fees; distribution and/or service (12b-1) fees; and other Fund expenses. This example is intended to help you understand your ongoing costs (in dollars) of investing in the Fund and to compare these costs with the ongoing costs of investing in other mutual funds.
This example is based on an investment of $1,000 invested on July 1, 2005 and held for the six months ended December 31, 2005.
Actual Expenses
The table below titled “Based on Actual Total Return” provides information about actual account values and actual expenses. You may use the information provided in this table, together with the amount you invested, to estimate the expenses that you paid over the period. To estimate the expenses you paid on your account, divide your ending account value by $1,000 (for example, an $8,600 ending account value divided by $1,000 = 8.6), then multiply the result by the number under the heading entitled “Expenses Paid During the Period”.
| Based on Actual Total Return(1) | |||||||||||||||
| Actual Total Return Without Sales Charges(2) | Beginning Account Value | Ending Account Value | Annualized Expense Ratio | Expenses Paid During the Period(3) | |||||||||||
Class A | 5.42 | % | $ | 1,000.00 | $ | 1,054.20 | 0.97 | % | $ | 5.02 | |||||
Class B | 4.96 | 1,000.00 | 1,049.60 | 1.79 | 9.25 | ||||||||||
Class C | 4.95 | 1,000.00 | 1,049.50 | 1.76 | 9.09 | ||||||||||
Class Y | 5.61 | 1,000.00 | 1,056.10 | 0.57 | 2.95 | ||||||||||
| (1) | For the six months ended December 31, 2005. |
| (2) | Assumes reinvestment of all distributions, including returns of capital, if any, at net asset value and does not reflect the deduction of the applicable sales charges with respect to Class A shares or the applicable contingent deferred sales charges (“CDSC”) with respect to Class B and C shares. Total return is not annualized, as it may not be representative of the total return for the year. Past performance is no guarantee of future results. |
| (3) | Expenses are equal to each class’ respective annualized expense ratio multiplied by the average account value over the period, multiplied by the number of days in the most recent fiscal half-year, then divided by 365. |
Smith Barney Appreciation Fund Inc. 2005 Annual Report 5
Fund Expenses (unaudited) (continued)
Hypothetical Example for Comparison Purposes
The table below titled “Based on Hypothetical Total Return” provides information about hypothetical account values and hypothetical expenses based on the actual expense ratio and an assumed rate of return of 5.00% per year before expenses, which is not the Fund’s actual return. The hypothetical account values and expenses may not be used to estimate the actual ending account balance or expenses you paid for the period. You may use the information provided in this table to compare the ongoing costs of investing in the Fund and other funds. To do so, compare the 5.00% hypothetical example relating to the Fund with the 5.00% hypothetical examples that appear in the shareholder reports of the other funds.
Please note that the expenses shown in the table below are meant to highlight your ongoing costs only and do not reflect any transactional costs, such as front-end or back-end sales charges (loads). Therefore, the table is useful in comparing ongoing costs only, and will not help you determine the relative total costs of owning different funds. In addition, if these transaction costs were included, your costs would have been higher.
| Based on Hypothetical Total Return(1) | |||||||||||||||
| Hypothetical Annualized Total Return | Beginning Account Value | Ending Account Value | Annualized Expense Ratio | Expenses Paid During the Period(2) | |||||||||||
Class A | 5.00 | % | $ | 1,000.00 | $ | 1,020.32 | 0.97 | % | $ | 4.94 | |||||
Class B | 5.00 | 1,000.00 | 1,016.18 | 1.79 | 9.10 | ||||||||||
Class C | 5.00 | 1,000.00 | 1,016.33 | 1.76 | 8.94 | ||||||||||
Class Y | 5.00 | 1,000.00 | 1,022.33 | 0.57 | 2.91 | ||||||||||
| (1) | For the six months ended December 31, 2005. |
| (2) | Expenses are equal to each class’ respective annualized expense ratio multiplied by the average account value over the period, multiplied by the number of days in the most recent fiscal half-year, then divided by 365. |
6 Smith Barney Appreciation Fund Inc. 2005 Annual Report
Fund Performance
| Average Annual Total Returns(1) (unaudited) | ||||||||||||
| Without Sales Charges(2) | ||||||||||||
| Class A | Class B | Class C | Class Y | |||||||||
Twelve Months Ended 12/31/05 | 4.15 | % | 3.31 | % | 3.31 | % | 4.62 | % | ||||
Five Years Ended 12/31/05 | 2.54 | 1.69 | 1.73 | 2.92 | ||||||||
Ten Years Ended 12/31/05 | 9.08 | 8.19 | 8.21 | N/A | ||||||||
Inception* through 12/31/05 | 11.05 | 8.93 | 8.60 | 9.36 | ||||||||
| With Sales Charges(3) | ||||||||||||
| Class A | Class B | Class C | Class Y | |||||||||
Twelve Months Ended 12/31/05 | (1.05 | )% | (1.58 | )% | 2.33 | % | 4.62 | % | ||||
Five Years Ended 12/31/05 | 1.49 | 1.51 | 1.73 | 2.92 | ||||||||
Ten Years Ended 12/31/05 | 8.52 | 8.19 | 8.21 | N/A | ||||||||
Inception* through 12/31/05 | 10.89 | 8.93 | 8.60 | 9.36 | ||||||||
| Cumulative Total Returns(1) (unaudited) | |||||||||||
| Without Sales Charges(2) | |||||||||||
Class A (12/31/95 through 12/31/05) | 138.40 | % | |||||||||
Class B (12/31/95 through 12/31/05) | 119.75 | ||||||||||
Class C (12/31/95 through 12/31/05) | 120.17 | ||||||||||
Class Y (Inception* through 12/31/05) | 142.83 | ||||||||||
| (1) | All figures represent past performance and are not a guarantee of future results. Investment return and principal value of an investment will fluctuate so that an investor’s shares, when redeemed, may be worth more or less than their original cost. The returns shown do not reflect the deduction of taxes that a shareholder would pay on fund distributions or the redemption of fund shares. Performance figures may reflect voluntary fee waivers and/or expense reimbursements. In the absence of voluntary fee waivers and/or expense reimbursements, the total return would have been lower. |
| (2) | Assumes reinvestment of all distributions, including returns of capital, if any, at net asset value and does not reflect the deduction of the applicable sales charges with respect to Class A shares or the applicable CDSC with respect to Class B and C shares. |
| (3) | Assumes reinvestment of all distributions, including returns of capital, if any, at net asset value. In addition, Class A shares reflect the deduction of the maximum sales charge of 5.00%; Class B shares reflect the deduction of a 5.00% CDSC, which applies if shares are redeemed within one year from purchase payment. Thereafter, this CDSC declines by 1.00% per year until no CDSC is incurred. Class C shares also reflect the deduction of a 1.00% CDSC, which applies if shares are redeemed within one year from purchase payment. |
| * | Inception dates for Class A, B, C and Y shares are March 10, 1970, November 6, 1992, February 4, 1993 and January 30, 1996, respectively. |
Smith Barney Appreciation Fund Inc. 2005 Annual Report 7
Historical Performance (unaudited)
Value of $10,000 Invested in Class A Shares of the Smith Barney Appreciation Fund Inc. vs. the S&P 500 Index† (December 1995 — December 2005)
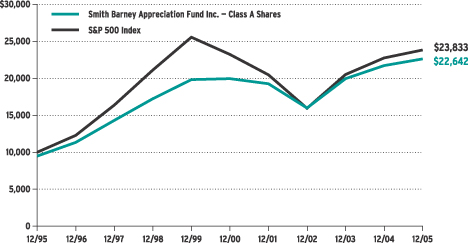
| † | Hypothetical illustration of $10,000 invested in Class A shares on December 31, 1995, assuming deduction of the maximum 5.00% sales charge at the time of investment for Class A shares. It also assumes reinvestment of all distributions, including returns of capital, if any, at net asset value through December 31, 2005. The S&P 500 Index is composed of 500 widely held common stocks listed on the New York Stock Exchange, American Stock Exchange and over-the-counter markets. The Index is unmanaged and is not subject to the same management and trading expenses as a mutual fund. Please note that an investor cannot invest directly in an index. The performance of the Fund’s other classes may be greater or less than the Class A shares’ performance indicated on this chart, depending on whether greater or lesser sales charges and fees were incurred by shareholders investing in the other classes. |
All figures represent past performance and are not a guarantee of future results. The investment return and principal value of an investment, will fluctuate so that an investor’s shares, when redeemed, may be worth more or less than their original cost. The returns shown do not reflect the deduction of taxes that a shareholder would pay on fund distributions or the redemption of fund shares. Performance figures may reflect voluntary fee waivers and/or expense reimbursements. In the absence of voluntary fee waivers and/or expense reimbursements, the total return would have been lower.
8 Smith Barney Appreciation Fund Inc. 2005 Annual Report
Schedule of Investments (December 31, 2005)
SMITH BARNEY APPRECIATION FUND INC.
| Shares | Security | Value | ||||
| COMMON STOCKS — 94.9% | ||||||
| CONSUMER DISCRETIONARY — 10.3% | ||||||
| Hotels, Restaurants & Leisure — 1.3% | ||||||
| 700,000 | Fairmont Hotels & Resorts Inc. | $ | 29,687,000 | |||
| 900,000 | International Game Technology | 27,702,000 | ||||
| 700,000 | Marcus Corp. | 16,450,000 | ||||
Total Hotels, Restaurants & Leisure | 73,839,000 | |||||
| Internet & Catalog Retail — 1.0% | ||||||
| 600,000 | Amazon.com Inc.* | 28,290,000 | ||||
| 1,100,000 | IAC/InterActiveCorp.* | 31,141,000 | ||||
Total Internet & Catalog Retail | 59,431,000 | |||||
| Media — 6.0% | ||||||
| 1,000,000 | Comcast Corp., Special Class A Shares* | 25,690,000 | ||||
| 1,000,000 | Gannett Co. Inc. | 60,570,000 | ||||
| 1,000,000 | Liberty Media Corp., Class A Shares* | 7,870,000 | ||||
| 700,000 | Meredith Corp. | 36,638,000 | ||||
| 6,000,000 | Time Warner Inc. | 104,640,000 | ||||
| 600,000 | Viacom Inc., Class B Shares | 19,560,000 | ||||
| 3,500,000 | Walt Disney Co. | 83,895,000 | ||||
| 500,000 | XM Satellite Radio Holdings Inc., Class A Shares* | 13,640,000 | ||||
Total Media | 352,503,000 | |||||
| Specialty Retail — 2.0% | ||||||
| 1,000,000 | Bed Bath & Beyond Inc.* | 36,150,000 | ||||
| 1,400,000 | Home Depot Inc. | 56,672,000 | ||||
| 400,000 | Tiffany & Co. | 15,316,000 | ||||
| 500,000 | TJX Cos. Inc. | 11,615,000 | ||||
Total Specialty Retail | 119,753,000 | |||||
| TOTAL CONSUMER DISCRETIONARY | 605,526,000 | |||||
| CONSUMER STAPLES — 10.7% | ||||||
| Beverages — 1.7% | ||||||
| 1,700,000 | PepsiCo Inc. | 100,436,000 | ||||
| Food & Staples Retailing — 3.2% | ||||||
| 1,000,000 | Costco Wholesale Corp. | 49,470,000 | ||||
| 2,100,000 | Wal-Mart Stores Inc. | 98,280,000 | ||||
| 1,000,000 | Walgreen Co. | 44,260,000 | ||||
Total Food & Staples Retailing | 192,010,000 | |||||
| Food Products — 2.8% | ||||||
| 500,000 | Cadbury Schweppes PLC, Sponsored ADR | 19,145,000 | ||||
| 600,000 | Dean Foods Co.* | 22,596,000 | ||||
| 400,000 | General Mills Inc. | 19,728,000 | ||||
| 1,004,931 | H.J. Heinz Co. | 33,886,273 | ||||
| 200,000 | Hershey Co. | 11,050,000 | ||||
| 903,168 | Wm. Wrigley Jr. Co. | 60,051,641 | ||||
Total Food Products | 166,456,914 | |||||
See Notes to Financial Statements.
Smith Barney Appreciation Fund Inc. 2005 Annual Report 9
Schedule of Investments (December 31, 2005) (continued)
| Shares | Security | Value | ||||
| Household Products — 3.0% | ||||||
| 1,000,000 | Kimberly-Clark Corp. | $ | 59,650,000 | |||
| 1,989,121 | Procter & Gamble Co. | 115,130,323 | ||||
Total Household Products | 174,780,323 | |||||
| TOTAL CONSUMER STAPLES | 633,683,237 | |||||
| ENERGY — 8.9% | ||||||
| Energy Equipment & Services — 1.0% | ||||||
| 550,000 | ENSCO International Inc. | 24,392,500 | ||||
| 350,000 | Schlumberger Ltd. | 34,002,500 | ||||
Total Energy Equipment & Services | 58,395,000 | |||||
| Oil, Gas & Consumable Fuels — 7.9% | ||||||
| 1,000,000 | BP PLC, Sponsored ADR | 64,220,000 | ||||
| 1,300,000 | Canadian Natural Resources Ltd. | 64,506,000 | ||||
| 550,000 | Cimarex Energy Co.* | 23,655,500 | ||||
| 1,700,000 | EnCana Corp. | 76,772,000 | ||||
| 3,400,000 | Exxon Mobil Corp. | 190,978,000 | ||||
| 400,000 | Suncor Energy Inc. | 25,252,000 | ||||
| 950,000 | Western Oil Sands Inc., Class A Shares* | 22,659,205 | ||||
Total Oil, Gas & Consumable Fuels | 468,042,705 | |||||
| TOTAL ENERGY | 526,437,705 | |||||
| EXCHANGE TRADED FUNDS — 1.6% | ||||||
| 3,000,000 | iShares MSCI Japan Index Fund | 40,560,000 | ||||
| 1,000,000 | streetTRACKS Gold Trust* | 51,580,000 | ||||
| TOTAL EXCHANGE TRADED FUNDS | 92,140,000 | |||||
| FINANCIALS — 15.4% | ||||||
| Capital Markets — 2.3% | ||||||
| 1,000,000 | Bank of New York Co. Inc. | 31,850,000 | ||||
| 175,000 | Goldman Sachs Group Inc. | 22,349,250 | ||||
| 1,200,000 | Merrill Lynch & Co. Inc. | 81,276,000 | ||||
Total Capital Markets | 135,475,250 | |||||
| Commercial Banks — 3.0% | ||||||
| 1,600,000 | Bank of America Corp. | 73,840,000 | ||||
| 1,700,000 | Wells Fargo & Co. | 106,811,000 | ||||
Total Commercial Banks | 180,651,000 | |||||
| Diversified Financial Services — 0.5% | ||||||
| 700,000 | JPMorgan Chase & Co. | 27,783,000 | ||||
| Insurance — 7.6% | ||||||
| 4,100 | Berkshire Hathaway Inc., Class A Shares* | 363,342,000 | ||||
| 600,000 | Covanta Holding Corp.* | 9,036,000 | ||||
| 1,700,000 | St. Paul Travelers Cos. Inc. | 75,939,000 | ||||
Total Insurance | 448,317,000 | |||||
See Notes to Financial Statements.
10 Smith Barney Appreciation Fund Inc. 2005 Annual Report
Schedule of Investments (December 31, 2005) (continued)
| Shares | Security | Value | ||||
| Real Estate — 1.9% | ||||||
| 2,200,000 | Forest City Enterprises Inc., Class A Shares | $ | 83,446,000 | |||
| 300,000 | St. Joe Co. | 20,166,000 | ||||
| 175,000 | Tejon Ranch Co.* | 6,986,000 | ||||
Total Real Estate | 110,598,000 | |||||
| Thrifts & Mortgage Finance — 0.1% | ||||||
| 600,000 | Brookline Bancorp Inc. | 8,502,000 | ||||
| TOTAL FINANCIALS | 911,326,250 | |||||
| HEALTH CARE — 7.6% | ||||||
| Biotechnology — 1.4% | ||||||
| 800,000 | Amgen Inc.* | 63,088,000 | ||||
| 500,000 | Biogen Idec Inc.* | 22,665,000 | ||||
Total Biotechnology | 85,753,000 | |||||
| Health Care Equipment & Supplies — 1.6% | ||||||
| 301,192 | C.R. Bard Inc. | 19,854,577 | ||||
| 450,000 | IDEXX Laboratories Inc.* | 32,391,000 | ||||
| 700,000 | Medtronic Inc. | 40,299,000 | ||||
Total Health Care Equipment & Supplies | 92,544,577 | |||||
| Health Care Providers & Services — 0.7% | ||||||
| 500,000 | WellPoint Inc.* | 39,895,000 | ||||
| Pharmaceuticals — 3.9% | ||||||
| 1,800,000 | Johnson & Johnson | 108,180,000 | ||||
| 750,000 | MGI Pharma Inc.* | 12,870,000 | ||||
| 2,300,000 | Pfizer Inc. | 53,636,000 | ||||
| 650,000 | Teva Pharmaceutical Industries Ltd., Sponsored ADR | 27,956,500 | ||||
| 600,000 | Wyeth | 27,642,000 | ||||
Total Pharmaceuticals | 230,284,500 | |||||
| TOTAL HEALTH CARE | 448,477,077 | |||||
| INDUSTRIALS — 18.0% | ||||||
| Aerospace & Defense — 3.3% | ||||||
| 900,000 | Honeywell International Inc. | 33,525,000 | ||||
| 1,700,000 | Raytheon Co. | 68,255,000 | ||||
| 1,700,000 | United Technologies Corp. | 95,047,000 | ||||
Total Aerospace & Defense | 196,827,000 | |||||
| Air Freight & Logistics — 1.5% | ||||||
| 1,200,000 | United Parcel Service Inc., Class B Shares | 90,180,000 | ||||
| Airlines — 0.4% | ||||||
| 1,400,000 | Southwest Airlines Co. | 23,002,000 | ||||
| Building Products — 0.4% | ||||||
| 706,136 | Masco Corp. | 21,318,246 | ||||
See Notes to Financial Statements.
Smith Barney Appreciation Fund Inc. 2005 Annual Report 11
Schedule of Investments (December 31, 2005) (continued)
| Shares | Security | Value | ||||
| Commercial Services & Supplies — 1.9% | ||||||
| 700,000 | ARAMARK Corp., Class B Shares | $ | 19,446,000 | |||
| 500,000 | Pitney Bowes Inc. | 21,125,000 | ||||
| 2,300,000 | Waste Management Inc. | 69,805,000 | ||||
Total Commercial Services & Supplies | 110,376,000 | |||||
| Electrical Equipment — 0.4% | ||||||
| 1,200,000 | American Power Conversion Corp. | 26,400,000 | ||||
| Industrial Conglomerates — 9.2% | ||||||
| 2,500,000 | 3M Co. | 193,750,000 | ||||
| 7,500,000 | General Electric Co. | 262,875,000 | ||||
| 3,000,000 | Tyco International Ltd. | 86,580,000 | ||||
Total Industrial Conglomerates | 543,205,000 | |||||
| Road & Rail — 0.9% | ||||||
| 1,231,033 | Florida East Coast Industries Inc. | 52,158,868 | ||||
| TOTAL INDUSTRIALS | 1,063,467,114 | |||||
| INFORMATION TECHNOLOGY — 15.5% | ||||||
| Communications Equipment — 2.4% | ||||||
| 1,500,000 | Avaya Inc.* | 16,005,000 | ||||
| 5,000,000 | Cisco Systems Inc.* | 85,600,000 | ||||
| 4,500,000 | Lucent Technologies Inc.* | 11,970,000 | ||||
| 1,300,000 | Motorola Inc. | 29,367,000 | ||||
Total Communications Equipment | 142,942,000 | |||||
| Computers & Peripherals — 3.0% | ||||||
| 3,700,000 | EMC Corp.* | 50,394,000 | ||||
| 1,800,000 | Hewlett-Packard Co. | 51,534,000 | ||||
| 900,000 | International Business Machines Corp. | 73,980,000 | ||||
Total Computers & Peripherals | 175,908,000 | |||||
| Internet Software & Services — 2.1% | ||||||
| 500,000 | Digital River Inc.* | 14,870,000 | ||||
| 15,000 | Google Inc., Class A Shares* | 6,222,900 | ||||
| 1,200,000 | VeriSign Inc.* | 26,304,000 | ||||
| 2,000,000 | Yahoo! Inc.* | 78,360,000 | ||||
Total Internet Software & Services | 125,756,900 | |||||
| IT Services — 1.0% | ||||||
| 1,300,000 | Automatic Data Processing Inc. | 59,657,000 | ||||
| Semiconductors & Semiconductor Equipment — 1.4% | ||||||
| 1,200,000 | Freescale Semiconductor Inc., Class B Shares* | 30,204,000 | ||||
| 1,500,000 | Intel Corp. | 37,440,000 | ||||
| 400,000 | Texas Instruments Inc. | 12,828,000 | ||||
Total Semiconductors & Semiconductor Equipment | 80,472,000 | |||||
| Software — 5.6% | ||||||
| 11,000,000 | Microsoft Corp. | 287,650,000 | ||||
See Notes to Financial Statements.
12 Smith Barney Appreciation Fund Inc. 2005 Annual Report
Schedule of Investments (December 31, 2005) (continued)
| Shares | Security | Value | ||||
| Software — 5.6% (continued) | ||||||
| 2,500,000 | Symantec Corp.* | $ | 43,750,000 | |||
Total Software | 331,400,000 | |||||
| TOTAL INFORMATION TECHNOLOGY | 916,135,900 | |||||
| MATERIALS — 5.4% | ||||||
| Chemicals — 3.5% | ||||||
| 800,000 | Cytec Industries Inc. | 38,104,000 | ||||
| 500,000 | Dow Chemical Co. | 21,910,000 | ||||
| 1,500,000 | E.I. du Pont de Nemours & Co. | 63,750,000 | ||||
| 800,000 | Ecolab Inc. | 29,016,000 | ||||
| 950,000 | PPG Industries Inc. | 55,005,000 | ||||
Total Chemicals | 207,785,000 | |||||
| Metals & Mining — 1.4% | ||||||
| 700,000 | Alcoa Inc. | 20,699,000 | ||||
| 400,000 | Newmont Mining Corp. | 21,360,000 | ||||
| 225,000 | Rio Tinto PLC, Sponsored ADR | 41,127,750 | ||||
Total Metals & Mining | 83,186,750 | |||||
| Paper & Forest Products — 0.5% | ||||||
| 400,000 | Weyerhaeuser Co. | 26,536,000 | ||||
| TOTAL MATERIALS | 317,507,750 | |||||
| TELECOMMUNICATION SERVICES — 0.7% | ||||||
| Diversified Telecommunication Services — 0.1% | ||||||
| 100,000 | Verizon Communications Inc. | 3,012,000 | ||||
| Wireless Telecommunication Services — 0.6% | ||||||
| 1,500,000 | Sprint Nextel Corp. | 35,040,000 | ||||
| TOTAL TELECOMMUNICATION SERVICES | 38,052,000 | |||||
| UTILITIES — 0.8% | ||||||
| Electric Utilities — 0.7% | ||||||
| 904,407 | Cinergy Corp. | 38,401,121 | ||||
| Multi-Utilities — 0.1% | ||||||
| 200,000 | KeySpan Corp. | 7,138,000 | ||||
| TOTAL UTILITIES | 45,539,121 | |||||
| TOTAL COMMON STOCKS (Cost — $4,148,477,860) | 5,598,292,154 | |||||
| Warrants | ||||||
| WARRANTS — 0.0% | ||||||
| 255,775 | Lucent Technologies Inc., Expires 12/10/07* (Cost — $0) | 144,513 | ||||
| TOTAL INVESTMENTS BEFORE SHORT-TERM INVESTMENT (Cost — $4,148,477,860) | 5,598,436,667 | |||||
See Notes to Financial Statements.
Smith Barney Appreciation Fund Inc. 2005 Annual Report 13
Schedule of Investments (December 31, 2005) (continued)
| Face Amount | Security | Value | |||||
| SHORT-TERM INVESTMENT — 5.6% | |||||||
| Repurchase Agreement — 5.6% | |||||||
| $ | 334,502,000 | Interest in $570,630,000 joint tri-party repurchase agreement dated 12/30/05 with Banc of America Securities LLC, 4.250% due 1/3/06; Proceeds at maturity — $334,659,959; (Fully collateralized by various U.S. government agency obligations, 0.000% to 6.500% due 1/30/06 to 8/7/28; Market Value — $341,192,215) (Cost — $334,502,000) | $ | 334,502,000 | |||
| TOTAL INVESTMENTS — 100.5% (Cost — $4,482,979,860#) | 5,932,938,667 | ||||||
Liabilities in Excess of Other Assets — (0.5)% | (32,104,006 | ) | |||||
| TOTAL NET ASSETS — 100.0% | $ | 5,900,834,661 | |||||
| * | Non-income producing security. |
| # | Aggregate cost for federal income tax purposes is $4,491,676,947. |
Abbreviation used in this schedule: |
| ADR — American Depositary Receipt |
See Notes to Financial Statements.
14 Smith Barney Appreciation Fund Inc. 2005 Annual Report
Statement of Assets and Liabilities (December 31, 2005)
| ASSETS: | |||
Investments, at value (Cost — $4,482,979,860) | $ | 5,932,938,667 | |
Cash | 247 | ||
Dividends and interest receivable | 6,962,423 | ||
Receivable for Fund shares sold | 4,469,049 | ||
Receivable for securities sold | 1,654,009 | ||
Prepaid expenses | 109,141 | ||
Total Assets | 5,946,133,536 | ||
| LIABILITIES: | |||
Payable for Fund shares repurchased | 36,273,966 | ||
Payable for securities purchased | 3,111,269 | ||
Investment advisory fee payable | 2,079,069 | ||
Transfer agent fees payable | 1,698,212 | ||
Distribution fees payable (Notes 2 and 4) | 1,132,288 | ||
Administration fee payable | 765,044 | ||
Deferred compensation payable | 19,501 | ||
Directors’ fees payable | 7,868 | ||
Accrued expenses | 211,658 | ||
Total Liabilities | 45,298,875 | ||
Total Net Assets | $ | 5,900,834,661 | |
| NET ASSETS: | |||
Par value (Note 6) | $ | 412,022 | |
Paid-in capital in excess of par value | 4,401,760,392 | ||
Undistributed net investment income | 988,790 | ||
Accumulated net realized gain on investments, futures contracts | 47,715,299 | ||
Net unrealized appreciation on investments and foreign currencies | 1,449,958,158 | ||
Total Net Assets | $ | 5,900,834,661 | |
Shares Outstanding: | |||
Class A | 248,837,128 | ||
Class B | 69,980,731 | ||
Class C | 46,862,444 | ||
Class Y | 46,342,172 | ||
Net Asset Value: | |||
Class A (and redemption price) | $14.42 | ||
Class B * | $14.09 | ||
Class C * | $14.11 | ||
Class Y (and redemption price) | $14.38 | ||
Maximum Public Offering Price Per Share: | |||
Class A (based on maximum sales charge of 5.00%) | $15.18 | ||
| * | Redemption price is NAV of Class B and C shares reduced by a 5.00% and 1.00% CDSC, respectively, if shares are redeemed within one year from purchase payment (See Note 2). |
See Notes to Financial Statements.
Smith Barney Appreciation Fund Inc. 2005 Annual Report 15
Statement of Operations (For the year ended December 31, 2005)
| INVESTMENT INCOME: | ||||
Dividends | $ | 79,219,055 | ||
Interest | 14,228,099 | |||
Less: Foreign taxes withheld | (191,428 | ) | ||
Total Investment Income | 93,255,726 | |||
| EXPENSES: | ||||
Distribution fees (Notes 2 and 4) | 25,887,743 | |||
Investment advisory fee (Note 2) | 24,175,618 | |||
Administration fees (Note 2) | 8,895,433 | |||
Transfer agent fees (Notes 2 and 4) | 8,446,725 | |||
Shareholder reports (Note 4) | 394,706 | |||
Custody fees | 279,492 | |||
Registration fees | 181,584 | |||
Directors’ fees | 108,216 | |||
Insurance | 108,038 | |||
Legal fees | 69,920 | |||
Audit and tax | 38,785 | |||
Miscellaneous expenses | 50,875 | |||
Total Expenses | 68,637,135 | |||
Net Investment Income | 24,618,591 | |||
REALIZED AND UNREALIZED GAIN (LOSS) ON INVESTMENTS, FUTURES CONTRACTS AND FOREIGN CURRENCY TRANSACTIONS (NOTES 1 AND 3): | ||||
Net Realized Gain From: | ||||
Investments | 330,023,803 | |||
Futures contracts | 583,944 | |||
Foreign currency transactions | 106 | |||
Net Realized Gain | 330,607,853 | |||
Change in Net Unrealized Appreciation/Depreciation From: | ||||
Investments | (125,497,941 | ) | ||
Foreign currencies | (3,030 | ) | ||
Change in Net Unrealized Appreciation/Depreciation | (125,500,971 | ) | ||
Net Gain on Investments, Futures Contracts and Foreign Currency Transactions | 205,106,882 | |||
Increase in Net Assets From Operations | $ | 229,725,473 | ||
See Notes to Financial Statements.
16 Smith Barney Appreciation Fund Inc. 2005 Annual Report
Statements of Changes in Net Assets (For the years ended December 31,)
| 2005 | 2004 | |||||||
| OPERATIONS: | ||||||||
Net investment income | $ | 24,618,591 | $ | 41,731,950 | ||||
Net realized gain | 330,607,853 | 159,273,111 | ||||||
Change in net unrealized appreciation/depreciation | (125,500,971 | ) | 265,448,429 | |||||
Increase in Net Assets From Operations | 229,725,473 | 466,453,490 | ||||||
| DISTRIBUTIONS TO SHAREHOLDERS FROM (NOTES 1 AND 5): | ||||||||
Net investment income | (24,308,828 | ) | (43,156,200 | ) | ||||
Net realized gains | (315,326,302 | ) | (82,029,346 | ) | ||||
Decrease in Net Assets From | (339,635,130 | ) | (125,185,546 | ) | ||||
| FUND SHARE TRANSACTIONS (NOTE 6): | ||||||||
Net proceeds from sale of shares | 762,835,757 | 965,446,223 | ||||||
Reinvestment of distributions | 317,853,741 | 116,115,224 | ||||||
Cost of shares repurchased | (1,066,147,249 | ) | (803,571,601 | ) | ||||
Net assets of shares issued in connection with Merger (Note 7) | 87,480,709 | — | ||||||
Increase in Net Assets From Fund Share Transactions | 102,022,958 | 277,989,846 | ||||||
Increase (Decrease) in Net Assets | (7,886,699 | ) | 619,257,790 | |||||
| NET ASSETS: | ||||||||
Beginning of year | 5,908,721,360 | 5,289,463,570 | ||||||
End of year* | $ | 5,900,834,661 | $ | 5,908,721,360 | ||||
* Includes undistributed net investment income of: | $988,790 | $678,921 | ||||||
See Notes to Financial Statements.
Smith Barney Appreciation Fund Inc. 2005 Annual Report 17
For a share of each class of capital stock outstanding throughout each year ended December 31:
| Class A Shares(1) | 2005 | 2004 | 2003 | 2002 | 2001 | |||||||||||||||
Net Asset Value, Beginning of Year | $ | 14.67 | $ | 13.79 | $ | 11.13 | $ | 13.69 | $ | 14.55 | ||||||||||
Income (Loss) From Operations: | ||||||||||||||||||||
Net investment income | 0.09 | 0.14 | 0.07 | 0.06 | 0.10 | |||||||||||||||
Net realized and unrealized gain (loss) | 0.52 | 1.09 | 2.67 | (2.39 | ) | (0.59 | ) | |||||||||||||
Total Income (Loss) From Operations | 0.61 | 1.23 | 2.74 | (2.33 | ) | (0.49 | ) | |||||||||||||
Less Distributions From: | ||||||||||||||||||||
Net investment income | (0.07 | ) | (0.14 | ) | (0.08 | ) | (0.01 | ) | (0.08 | ) | ||||||||||
Net realized gains | (0.79 | ) | (0.21 | ) | — | (0.22 | ) | (0.29 | ) | |||||||||||
Total Distributions | (0.86 | ) | (0.35 | ) | (0.08 | ) | (0.23 | ) | (0.37 | ) | ||||||||||
Net Asset Value, End of Year | $ | 14.42 | $ | 14.67 | $ | 13.79 | $ | 11.13 | $ | 13.69 | ||||||||||
Total Return(2) | 4.15 | % | 8.92 | % | 24.70 | % | (17.00 | )% | (3.44 | )% | ||||||||||
Net Assets, End of Year (millions) | $3,587 | $3,575 | $3,210 | $2,476 | $3,140 | |||||||||||||||
Ratios to Average Net Assets: | ||||||||||||||||||||
Gross expenses | 0.96 | % | 0.95 | % | 0.96 | % | 0.95 | % | 0.92 | % | ||||||||||
Net expenses | 0.96 | 0.93 | (3) | 0.96 | 0.95 | 0.92 | ||||||||||||||
Net investment income | 0.61 | 0.96 | 0.55 | 0.48 | 0.68 | |||||||||||||||
Portfolio Turnover Rate | 53 | % | 40 | % | 42 | % | 74 | % | 62 | % | ||||||||||
| (1) | Per share amounts have been calculated using the average shares method. |
| (2) | Performance figures may reflect voluntary fee waivers and/or expense reimbursements. Past performance is no guarantee of future results. In the absence of voluntary fee waivers and/or expense reimbursements, the total return would have been lower. |
| (3) | The investment adviser voluntarily waived a portion of its advisory fees. |
See Notes to Financial Statements.
18 Smith Barney Appreciation Fund Inc. 2005 Annual Report
Financial Highlights (continued)
For a share of each class of capital stock outstanding throughout each year ended December 31:
| Class B Shares(1) | 2005 | 2004 | 2003 | 2002 | 2001 | |||||||||||||||
Net Asset Value, Beginning of Year | $ | 14.40 | $ | 13.54 | $ | 10.95 | $ | 13.58 | $ | 14.47 | ||||||||||
Income (Loss) From Operations: | ||||||||||||||||||||
Net investment income (loss) | (0.03 | ) | 0.02 | (0.03 | ) | (0.05 | ) | (0.02 | ) | |||||||||||
Net realized and unrealized gain (loss) | 0.51 | 1.06 | 2.62 | (2.36 | ) | (0.58 | ) | |||||||||||||
Total Income (Loss) From Operations | 0.48 | 1.08 | 2.59 | (2.41 | ) | (0.60 | ) | |||||||||||||
Less Distributions From: | ||||||||||||||||||||
Net investment income | (0.00 | )(2) | (0.01 | ) | — | — | — | |||||||||||||
Net realized gains | (0.79 | ) | (0.21 | ) | — | (0.22 | ) | (0.29 | ) | |||||||||||
Total Distributions | (0.79 | ) | (0.22 | ) | — | (0.22 | ) | (0.29 | ) | |||||||||||
Net Asset Value, End of Year | $ | 14.09 | $ | 14.40 | $ | 13.54 | $ | 10.95 | $ | 13.58 | ||||||||||
Total Return(3) | 3.31 | % | 7.99 | % | 23.65 | % | (17.70 | )% | (4.20 | )% | ||||||||||
Net Assets, End of Year (millions) | $986 | $1,078 | $1,075 | $871 | $1,081 | |||||||||||||||
Ratios to Average Net Assets: | ||||||||||||||||||||
Gross expenses | 1.80 | % | 1.78 | % | 1.76 | % | 1.82 | % | 1.76 | % | ||||||||||
Net expenses | 1.80 | 1.76 | (4) | 1.76 | 1.82 | 1.76 | ||||||||||||||
Net investment income (loss) | (0.23 | ) | 0.11 | (0.26 | ) | (0.38 | ) | (0.17 | ) | |||||||||||
Portfolio Turnover Rate | 53 | % | 40 | % | 42 | % | 74 | % | 62 | % | ||||||||||
| (1) | Per share amounts have been calculated using the average shares method. |
| (2) | Amount represents less than $0.01 per share. |
| (3) | Performance figures may reflect voluntary fee waivers and/or expense reimbursements. Past performance is no guarantee of future results. In the absence of voluntary fee waivers and/or expense reimbursements, the total return would have been lower. |
| (4) | The investment adviser voluntarily waived a portion of its advisory fees. |
See Notes to Financial Statements.
Smith Barney Appreciation Fund Inc. 2005 Annual Report 19
Financial Highlights (continued)
For a share of each class of capital stock outstanding throughout each year ended December 31:
| Class C Shares(1)(2) | 2005 | 2004 | 2003 | 2002 | 2001 | |||||||||||||||
Net Asset Value, Beginning of Year | $ | 14.42 | $ | 13.55 | $ | 10.96 | $ | 13.58 | $ | 14.47 | ||||||||||
Income (Loss) From Operations: | ||||||||||||||||||||
Net investment income (loss) | (0.03 | ) | 0.02 | (0.03 | ) | (0.04 | ) | (0.02 | ) | |||||||||||
Net realized and unrealized gain (loss) | 0.51 | 1.08 | 2.62 | (2.36 | ) | (0.58 | ) | |||||||||||||
Total Income (Loss) From Operations | 0.48 | 1.10 | 2.59 | (2.40 | ) | (0.60 | ) | |||||||||||||
Less Distributions From: | ||||||||||||||||||||
Net investment income | (0.00 | )(3) | (0.02 | ) | — | (0.00 | )(3) | — | ||||||||||||
Net realized gains | (0.79 | ) | (0.21 | ) | — | (0.22 | ) | (0.29 | ) | |||||||||||
Total Distributions | (0.79 | ) | (0.23 | ) | — | (0.22 | ) | (0.29 | ) | |||||||||||
Net Asset Value, End of Year | $ | 14.11 | $ | 14.42 | $ | 13.55 | $ | 10.96 | $ | 13.58 | ||||||||||
Total Return(4) | 3.31 | % | 8.08 | % | 23.63 | % | (17.62 | )% | (4.20 | )% | ||||||||||
Net Assets, End of Year (millions) | $661 | $614 | $531 | $318 | $266 | |||||||||||||||
Ratios to Average Net Assets: | ||||||||||||||||||||
Gross expenses | 1.77 | % | 1.76 | % | 1.80 | % | 1.75 | % | 1.72 | % | ||||||||||
Net expenses | 1.77 | 1.74 | (5) | 1.80 | 1.75 | 1.72 | ||||||||||||||
Net investment income (loss) | (0.20 | ) | 0.16 | (0.28 | ) | (0.30 | ) | (0.13 | ) | |||||||||||
Portfolio Turnover Rate | 53 | % | 40 | % | 42 | % | 74 | % | 62 | % | ||||||||||
| (1) | Per share amounts have been calculated using the average shares method. |
| (2) | On April 29, 2004, Class L shares were renamed as Class C shares. |
| (3) | Amount represents less than $0.01 per share. |
| (4) | Performance figures may reflect voluntary fee waivers and/or expense reimbursements. Past performance is no guarantee of future results. In the absence of voluntary fee waivers and/or expense reimbursements, the total return would have been lower. |
| (5) | The investment adviser voluntarily waived a portion of its advisory fees. |
See Notes to Financial Statements.
20 Smith Barney Appreciation Fund Inc. 2005 Annual Report
Financial Highlights (continued)
For a share of each class of capital stock outstanding throughout each year ended December 31:
| Class Y Shares(1) | 2005 | 2004 | 2003 | 2002 | 2001 | |||||||||||||||
Net Asset Value, Beginning of Year | $ | 14.63 | $ | 13.76 | $ | 11.15 | $ | 13.67 | $ | 14.52 | ||||||||||
Income (Loss) From Operations: | ||||||||||||||||||||
Net investment income | 0.15 | 0.19 | 0.12 | 0.10 | 0.14 | |||||||||||||||
Net realized and unrealized gain (loss) | 0.53 | 1.09 | 2.67 | (2.39 | ) | (0.58 | ) | |||||||||||||
Total Income (Loss) From Operations | 0.68 | 1.28 | 2.79 | (2.29 | ) | (0.44 | ) | |||||||||||||
Less Distributions From: | ||||||||||||||||||||
Net investment income | (0.14 | ) | (0.20 | ) | (0.18 | ) | (0.01 | ) | (0.12 | ) | ||||||||||
Net realized gains | (0.79 | ) | (0.21 | ) | — | (0.22 | ) | (0.29 | ) | |||||||||||
Total Distributions | (0.93 | ) | (0.41 | ) | (0.18 | ) | (0.23 | ) | (0.41 | ) | ||||||||||
Net Asset Value, End of Year | $ | 14.38 | $ | 14.63 | $ | 13.76 | $ | 11.15 | $ | 13.67 | ||||||||||
Total Return(2) | 4.62 | % | 9.30 | % | 25.11 | % | (16.71 | )% | (3.07 | )% | ||||||||||
Net Assets, End of Year (millions) | $667 | $642 | $474 | $85 | $87 | |||||||||||||||
Ratios to Average Net Assets: | ||||||||||||||||||||
Gross expenses | 0.57 | % | 0.57 | % | 0.59 | % | 0.59 | % | 0.58 | % | ||||||||||
Net expenses | 0.57 | 0.55 | (3) | 0.59 | 0.59 | 0.58 | ||||||||||||||
Net investment income | 1.00 | 1.35 | 0.96 | 0.85 | 1.02 | |||||||||||||||
Portfolio Turnover Rate | 53 | % | 40 | % | 42 | % | 74 | % | 62 | % | ||||||||||
| (1) | Per share amounts have been calculated using the average shares method. |
| (2) | Performance figures may reflect voluntary fee waivers and/or expense reimbursements. Past performance is no guarantee of future results. In the absence of voluntary fee waivers and/or expense reimbursements, the total return would have been lower. |
| (3) | The investment adviser voluntarily waived a portion of its advisory fees. |
See Notes to Financial Statements.
Smith Barney Appreciation Fund Inc. 2005 Annual Report 21
| 1. | Organization and Significant Accounting Policies |
The Smith Barney Appreciation Fund Inc. (the “Fund”), a Maryland corporation, is registered under the Investment Company Act of 1940, as amended (the “1940 Act”), as a diversified, open-end management investment company.
The following are significant accounting policies consistently followed by the Fund and are in conformity with U.S. generally accepted accounting principles (“GAAP”). Estimates and assumptions are required to be made regarding assets, liabilities and changes in net assets resulting from operations when financial statements are prepared. Changes in the economic environment, financial markets and any other parameters used in determining these estimates could cause actual results to differ.
(a) Investment Valuation. Equity securities for which market quotations are available are valued at the last sale price or official closing price on the primary market or exchange on which they trade. Debt securities are valued at the mean between the bid and asked prices provided by an independent pricing service that are based on transactions in debt obligations, quotations from bond dealers, market transactions in comparable securities and various relationships between securities. When prices are not readily available, or are determined not to reflect fair value, such as when the value of a security has been significantly affected by events after the close of the exchange or market on which the security is principally traded, but before the Fund calculates its net asset value, the Fund may value these investments at fair value as determined in accordance with the procedures approved by the Fund’s Board of Directors. Short-term obligations with maturities of 60 days or less are valued at amortized cost, which approximates market value.
(b) Repurchase Agreements. When entering into repurchase agreements, it is the Fund’s policy that its custodian or a third party custodian take possession of the underlying collateral securities, the market value of which at least equals the principal amount of the repurchase transaction, including accrued interest. To the extent that any repurchase transaction exceeds one business day, the value of the collateral is marked-to-market to ensure the adequacy of the collateral. If the seller defaults, and the market value of the collateral declines or if bankruptcy proceedings are commenced with respect to the seller of the security, realization of the collateral by the Fund may be delayed or limited.
(c) Financial Futures Contracts. The Fund may enter into financial futures contracts typically to hedge a portion of the portfolio. Upon entering into a financial futures contract, the Fund is required to deposit cash or securities as initial margin. Additional securities are also segregated up to the current market value of the financial futures contracts. Subsequent payments, known as variation margin, are made or received by the Fund each day, depending on the daily fluctuation in the value of the underlying financial instruments. The Fund recognizes an unrealized gain or loss equal to the daily variation margin. When the financial futures contracts are closed, a realized gain or loss is recognized equal to the difference between the proceeds from (or cost of) the closing transactions and the Fund’s basis in the contracts.
The risks associated with entering into financial futures contracts include the possibility that a change in the value of the contract may not correlate with the changes in the value of the underlying instruments. In addition, investing in financial futures contracts involves the
22 Smith Barney Appreciation Fund Inc. 2005 Annual Report
Notes to Financial Statements (continued)
risk that the Fund could lose more than the original margin deposit and subsequent payments required for a futures transaction. Risks may also arise upon entering into these contracts from the potential inability of the counterparties to meet the terms of their contracts.
(d) Security Transactions and Investment Income. Security transactions are accounted for on a trade date basis. Interest income, adjusted for amortization of premium and accretion of discount, is recorded on the accrual basis. Dividend income is recorded on the ex-dividend date. Foreign dividend income is recorded on the ex-dividend date or as soon as practical after the Fund determines the existence of a dividend declaration after exercising reasonable due diligence. The cost of investments sold is determined by use of the specific identification method. To the extent any issuer defaults on an expected interest payment, the Fund’s policy is to generally halt any additional interest income accruals and consider the realizability of interest accrued up to the date of default.
(e) Foreign Currency Translation. Investment securities and other assets and liabilities denominated in foreign currencies are translated into U.S. dollar amounts based upon prevailing exchange rates on the date of valuation. Purchases and sales of investment securities and income and expense items denominated in foreign currencies are translated into U.S. dollar amounts based upon prevailing exchange rates on the respective dates of such transactions.
The Fund does not isolate that portion of the results of operations resulting from changes in foreign exchange rates on investments from the fluctuations arising from changes in market prices of securities held. Such fluctuations are included with the net realized and unrealized gain or loss on investments.
Net realized foreign exchange gains or losses arise from sales of foreign currencies, including gains and losses on forward foreign currency contracts, currency gains or losses realized between the trade and settlement dates on securities transactions and the difference between the amounts of dividends, interest and foreign withholding taxes recorded on the Fund’s books and the U.S. dollar equivalent of the amounts actually received or paid. Net unrealized foreign exchange gains and losses arise from changes in the fair values of assets and liabilities, other than investments in securities, at the date of valuation, resulting from changes in exchange rates.
Foreign security and currency transactions may involve certain considerations and risks not typically associated with those of U.S. dollar denominated transactions as a result of, among other factors, the possibility of lower levels of governmental supervision and regulation of foreign securities markets and the possibility of political or economic instability.
(f) Distributions to Shareholders. Distributions from net investment income and distributions of net realized gains, if any, are declared at least annually. Distributions to shareholders of the Fund are recorded on the ex-dividend date and are determined in accordance with income tax regulations, which may differ from GAAP.
(g) Class Accounting. Investment income, common expenses and realized/unrealized gain (loss) on investments are allocated to the various classes of the Fund on the basis of daily net assets of each class. Fees relating to a specific class are charged directly to that class.
(h) Federal and Other Taxes. It is the Fund’s policy to comply with the federal income and excise tax requirements of the Internal Revenue Code of 1986, as amended, applicable to regulated investment companies. Accordingly, the Fund intends to distribute substantially all of its income and net realized gains on investments, if any, to shareholders
Smith Barney Appreciation Fund Inc. 2005 Annual Report 23
Notes to Financial Statements (continued)
each year. Therefore, no federal income tax provision is required in the Fund’s financial statements. Under the applicable foreign tax laws, a withholding tax may be imposed on interest, dividends and capital gains at various rates.
(i) Reclassification. GAAP requires that certain components of net assets be adjusted to reflect permanent differences between financial and tax reporting. These reclassifications have no effect on net assets or net asset values per share. During the current year, the following reclassifications have been made:
| Undistributed Net Investment Income | Accumulated Net Realized Gain | Paid-in Capital | ||||||
(a) — | $ | 81,182,467 | $ | (81,182,467 | ) | |||
(b) $106 | (106 | ) | — | |||||
| (a) | Reclassifications are primarily due to various tax limitations that will cause the expiration of a portion of the capital loss carryover from the merger with Smith Barney Group Spectrum Fund. |
| (b) | Reclassifications are primarily due to foreign currency transactions treated as ordinary income for tax purposes. |
| 2. | Management Agreement and Other Transactions with Affiliates |
On December 1, 2005, Citigroup Inc. (“Citigroup”) completed the sale of substantially all of its asset management business, Citigroup Asset Management (“CAM”), to Legg Mason, Inc. (“Legg Mason”). As a result, the Fund’s investment adviser and administrator, Smith Barney Fund Management LLC (the “Manager”), previously an indirect wholly-owned subsidiary of Citigroup, has become a wholly-owned subsidiary of Legg Mason. Completion of the sale caused the Fund’s existing investment advisory and administrative contract to terminate. The Fund’s shareholders approved a new investment management contract between the Fund and the Manager, which became effective on December 1, 2005.
Legg Mason, whose principal executive offices are in Baltimore, Maryland, is a financial services holding company.
Prior to the transaction, the Fund paid the Manager an investment advisory fee calculated daily and paid monthly at an annual rate of the Fund’s average daily net assets as follows:
| Average Daily Net Assets | Annual Rate | ||
First $250 million | 0.550 | % | |
Next $250 million | 0.513 | ||
Next $500 million | 0.476 | ||
Next $1 billion | 0.439 | ||
Next $1 billion | 0.402 | ||
Over $3 billion | 0.365 | ||
24 Smith Barney Appreciation Fund Inc. 2005 Annual Report
Notes to Financial Statements (continued)
The Fund also paid the Manager an administration fee calculated daily and paid monthly at an annual rate of the Fund’s average daily net assets as follows:
| Average Daily Net Assets | Annual Rate | ||
First $250 million | 0.200 | % | |
Next $250 million | 0.187 | ||
Next $500 million | 0.174 | ||
Next $1 billion | 0.161 | ||
Next $1 billion | 0.148 | ||
Over $3 billion | 0.135 | ||
Under the new Investment Management agreement, the Fund pays the Manager a management fee calculated daily and payable monthly at an annual rate of the Fund’s average daily net assets as follows:
| Average Daily Net Assets | Annual Rate | ||
First $250 million | 0.750 | % | |
Next $250 million | 0.700 | ||
Next $500 million | 0.650 | ||
Next $1 billion | 0.600 | ||
Next $1 billion | 0.550 | ||
Over $3 billion | 0.500 | ||
The Fund’s Board has approved PFPC Inc. (“PFPC”) to serve as transfer agent for the Fund, effective January 1, 2006. The principal business office of PFPC is located at 4400 Computer Drive, Westborough, MA 01581. During the period covered by this report, Citicorp Trust Bank, fsb. (“CTB”), a subsidiary of Citigroup, acted as the Fund’s transfer agent. PFPC and Primerica Shareholder Services (“PSS”) acted as the Fund’s sub-transfer agents. CTB received account fees and asset-based fees that varied according to the size and type of account. PFPC was responsible for shareholder recordkeeping and financial processing for all shareholder accounts, except PSS was responsible for shareholder recordkeeping and financial processing for all PFS Investments Inc. (“PFS”) shareholder accounts and was paid by CTB. For the period ended December 31, 2005, the Fund paid transfer agent fees of $5,254,932 to CTB. In addition, for the period ended December 31, 2005, the Fund also paid $128,301 to other Citigroup affiliates, including PSS, for shareholder recordkeeping services.
The Fund’s Board has appointed the Fund’s current distributor, Citigroup Global Markets Inc. (“CGM”), PFS and Legg Mason Investor Services, LLC (“LMIS”), a wholly-owned broker-dealer subsidiary of Legg Mason, as co-distributors of the Fund. The Fund’s Board has also approved amended and restated Rule 12b-1 Plans (the “Rule 12b-1 Plan”). CGM, PFS and other broker-dealers, financial intermediaries and financial institutions (each called a “Service Agent”) that currently offer Fund shares will continue to make the Fund’s shares available to their clients. Additional Service Agents may offer Fund shares in the future.
Smith Barney Appreciation Fund Inc. 2005 Annual Report 25
Notes to Financial Statements (continued)
There is a maximum initial sales charge of 5.00% for Class A shares. There is a contingent deferred sales charge (“CDSC”) of 5.00% on Class B shares, which applies if redemption occurs within one year from purchase payment and declines thereafter by 1.00% per year until no CDSC is incurred. Class C shares also have a 1.00% CDSC, which applies if redemption occurs within one year from purchase payment. In certain cases, Class A shares have a 1.00% CDSC, which applies if redemption occurs within one year from purchase payment. This CDSC only applies to those purchases of Class A shares which, when combined with current holdings of Class A shares, equal or exceed $1,000,0000 in the aggregate. These purchases do not incur an initial sales charge.
For the period ended December 31, 2005, sales charges and CDSCs received by CGM, its affiliates and LMIS were approximately:
| Class A | Class B | Class C | |||||||
Sales Charges | $ | 7,531,000 | — | — | |||||
CDSCs | 3,000 | $ | 1,643,000 | $ | 38,000 | ||||
During the year ended December 31, 2005, CGM and its affiliates received brokerage commissions in the amount of $140,621 for the Fund.
The Fund has adopted an unfunded, non-qualified deferred compensation plan (the “Plan”) which allows non-interested directors (“Directors”) to defer the receipt of all or a portion of the directors’ fees earned until a later date specified by the Directors. The deferred fees earn a return based on notional investments selected by the Directors. The balance of the deferred fees payable may change depending upon the investment performance. Any gains or losses incurred in the deferred balances are reported in the statement of operations under directors’ fees. Under the Plan, deferred fees are considered a general obligation of the Fund and any payments made pursuant to the Plan will be made from the Fund’s general assets.
As of December 31, 2005, the Fund has accrued $19,501 as deferred compensation.
Certain officers and one Director of the Fund are employees of Legg Mason or its affiliates and do not receive compensation from the Fund.
| 3. | Investments |
During the year ended December 31, 2005, the aggregate cost of purchases and proceeds from sales of investments (excluding short-term investments) were as follows:
Purchases | $ | 3,091,271,036 | |
Sales | 2,929,264,839 | ||
At December 31, 2005, the aggregate gross unrealized appreciation and depreciation of investments for federal income tax purposes were as follows:
Gross unrealized appreciation | $ | 1,468,914,174 | ||
Gross unrealized depreciation | (27,652,454 | ) | ||
Net unrealized appreciation | $ | 1,441,261,720 | ||
26 Smith Barney Appreciation Fund Inc. 2005 Annual Report
Notes to Financial Statements (continued)
| 4. | Class Specific Expenses |
Pursuant to the Rule 12b-1 Plan, the Fund pays a service fee with respect to its Class A, B and C shares calculated at the annual rate of 0.25% of the average daily net assets of each respective class. The Fund also pays a distribution fee with respect to its Class B and C shares calculated at the annual rate of 0.75% of the average daily net assets of each class, respectively. For the year ended December 31, 2005, total distribution fees, which are accrued daily and paid monthly, were as follows:
| Class A | Class B | Class C | |||||||
Distribution Fees | $ | 8,952,702 | $ | 10,339,736 | $ | 6,595,305 | |||
For the year ended December 31, 2005, total transfer agent fees were as follows:
| Class A | Class B | Class C | Class Y | |||||||||
Transfer Agent Fees | $ | 4,939,506 | $ | 2,227,009 | $ | 1,279,144 | $ | 1,066 | ||||
For the year ended December 31, 2005, total shareholder reports expenses were as follows:
| Class A | Class B | Class C | Class Y | |||||||||
Shareholder Reports Expenses | $ | 215,512 | $ | 131,579 | $ | 47,330 | $ | 285 | ||||
| 5. | Distributions to Shareholders by Class |
| Year Ended December 31, 2005 | Year Ended December 31, 2004 | |||||
Class A | ||||||
Net investment income | $ | 17,785,308 | $ | 33,155,145 | ||
Net realized gain | 191,020,886 | 49,301,619 | ||||
Total | $ | 208,806,194 | $ | 82,456,764 | ||
Class B | ||||||
Net investment income | $ | 131,491 | $ | 915,125 | ||
Net realized gain | 54,046,971 | 15,239,783 | ||||
Total | $ | 54,178,462 | $ | 16,154,908 | ||
Class C* | ||||||
Net investment income | $ | 85,876 | $ | 635,789 | ||
Net realized gain | 35,329,023 | 8,637,529 | ||||
Total | $ | 35,414,899 | $ | 9,273,318 | ||
Class Y | ||||||
Net investment income | $ | 6,306,153 | $ | 8,450,141 | ||
Net realized gain | 34,929,422 | 8,850,415 | ||||
Total | $ | 41,235,575 | $ | 17,300,556 | ||
| * | On April 29, 2004, Class L shares were renamed as Class C shares |
Smith Barney Appreciation Fund Inc. 2005 Annual Report 27
Notes to Financial Statements (continued)
| 6. | Capital Shares |
At December 31, 2005, the Company had one billion shares of capital stock authorized with a par value of $0.001 per share. The Fund has the ability to issue multiple classes of shares. Each share of a class represents an identical interest in the Fund and has the same rights, except that each class bears certain expenses, including those specifically related to the distribution of its shares.
Transactions in shares of each class were as follows:
| Year Ended December 31, 2005 | Year Ended December 31, 2004 | |||||||||||||
| Shares | Amount | Shares | Amount | |||||||||||
Class A | ||||||||||||||
Shares sold | 30,990,095 | $ | 452,570,100 | 35,351,754 | $ | 498,635,254 | ||||||||
Shares issued on reinvestment | 13,519,344 | 197,787,424 | 5,365,607 | 77,725,534 | ||||||||||
Shares repurchased | (40,124,610 | ) | (585,813,599 | ) | (29,771,134 | ) | (419,571,631 | ) | ||||||
Shares issued in connection | 754,656 | 11,167,932 | — | — | ||||||||||
Net Increase | 5,139,485 | $ | 75,711,857 | 10,946,227 | $ | 156,789,157 | ||||||||
Class B | ||||||||||||||
Shares sold | 8,799,794 | $ | 125,567,978 | 11,228,439 | $ | 154,824,428 | ||||||||
Shares issued on reinvestment | 3,616,431 | 51,670,347 | 1,079,859 | 15,377,185 | ||||||||||
Shares repurchased | (18,558,225 | ) | (265,816,383 | ) | (16,828,304 | ) | (232,065,414 | ) | ||||||
Shares issued in connection with merger (Note 7) | 1,267,551 | 18,414,370 | — | — | ||||||||||
Net Decrease | (4,874,449 | ) | $ | (70,163,688 | ) | (4,520,006 | ) | $ | (61,863,801 | ) | ||||
Class C* | ||||||||||||||
Shares sold | 7,003,079 | $ | 100,065,738 | 9,487,857 | $ | 130,928,824 | ||||||||
Shares issued on reinvestment | 2,323,194 | 33,233,184 | 612,773 | 8,732,009 | ||||||||||
Shares repurchased | (9,034,353 | ) | (129,452,520 | ) | (6,671,683 | ) | (91,944,618 | ) | ||||||
Shares issued in connection with merger (Note7) | 3,981,282 | 57,898,407 | — | — | ||||||||||
Net Increase | 4,273,202 | $ | 61,744,809 | 3,428,947 | $ | 47,716,215 | ||||||||
Class Y | ||||||||||||||
Shares sold | 5,874,496 | $ | 84,631,941 | 12,734,945 | $ | 181,057,717 | ||||||||
Shares issued on reinvestment | 2,405,753 | 35,162,786 | 988,774 | 14,280,496 | ||||||||||
Shares repurchased | (5,802,423 | ) | (85,064,747 | ) | (4,299,046 | ) | (59,989,938 | ) | ||||||
Net Increase | 2,477,826 | $ | 34,729,980 | 9,424,673 | $ | 135,348,275 | ||||||||
| * | On April 29, 2004, Class L shares were renamed as Class C shares. |
| 7. | Transfer of Net Assets |
On March 4, 2005, the Fund acquired the assets and certain liabilities of the Smith Barney Group Spectrum Fund (“Group Spectrum Fund”) pursuant to a plan of reorganization approved by Group Spectrum Fund shareholders on February 25, 2005. Total shares
28 Smith Barney Appreciation Fund Inc. 2005 Annual Report
Notes to Financial Statements (continued)
issued by the Fund, the total net assets of the Group Spectrum Fund and total net assets of the Fund on the date of transfer were as follows:
| Acquired Fund | Shares Issued by the Fund | Total Net Assets of the Group Spectrum Fund | Total Net Assets of the Fund | |||||
Group Spectrum Fund | 6,003,489 | $ | 87,480,709 | $ | 6,014,143,916 | |||
The total assets of the Group Spectrum Fund before acquisition included unrealized appreciation of $9,078,269 and accumulated net realized loss of $103,082,333. The accumulated net realized loss from the Group Spectrum Fund is subject to various tax limitations that will result in $81,182,467 of these losses expiring unutilized. Therefore, only $21,899,866 will be available to offset future gains of the Fund. Total net assets of the Fund immediately after the transfer were $6,101,624,625. The transaction was structured to qualify as a tax-free reorganization under the Internal Revenue Code of 1986, as amended.
| 8. | Income Tax Information and Distributions to Shareholders |
The tax character of distributions paid during the fiscal years ended December 31 was as follows:
| 2005 | 2004 | |||||
Distributions paid from: | ||||||
Ordinary Income | $ | 53,828,198 | $ | 43,156,200 | ||
Net Long-term Capital Gains | 285,806,932 | 82,029,346 | ||||
Total Distributions Paid | $ | 339,635,130 | $ | 125,185,546 | ||
As of December 31, 2005, the components of accumulated earnings on a tax basis were as follows:
Undistributed ordinary income — net | $ | 28,083,740 | ||
Undistributed long-term capital gains — net | 48,014,067 | |||
Total undistributed earnings | $ | 76,097,807 | ||
Capital loss carryforward* | (18,677,130 | ) | ||
Other book/tax temporary differences(a) | (19,501 | ) | ||
Unrealized appreciation/(depreciation)(b) | 1,441,261,071 | |||
Total accumulated earnings/(losses) — net | $ | 1,498,662,247 | ||
| * | During the taxable year ended December 31, 2005, the Fund utilized $3,059,979 of its capital loss carryover transferred from Group Spectrum Fund. As of December 31, 2005, the Fund had the following net capital loss carryforwards remaining: |
Year of Expiration | Amount | |||
12/31/2010 | $ | (18,677,130 | ) | |
These amounts will be available to offset any future taxable capital gains other than those that are attributable to appreciation in the Fund’s portfolio at the time of the reorganization.
| (a) | Other book/tax temporary differences are attributable primarily to differences in the book/tax treatment of various items. |
| (b) | The difference between book-basis and tax-basis unrealized appreciation/(depreciation) is attributable primarily to the tax deferral of losses on wash sales. |
Smith Barney Appreciation Fund Inc. 2005 Annual Report 29
Notes to Financial Statements (continued)
| 9. | Regulatory Matters |
On May 31, 2005, the U.S. Securities and Exchange Commission (“SEC”) issued an order in connection with the settlement of an administrative proceeding against SBFM and CGM relating to the appointment of an affiliated transfer agent for the Smith Barney family of mutual funds (the “Funds”).
The SEC order finds that SBFM and CGM willfully violated Section 206(1) of the Investment Advisers Act of 1940 (“Advisers Act”). Specifically, the order finds that SBFM and CGM knowingly or recklessly failed to disclose to the boards of the Funds in 1999 when proposing a new transfer agent arrangement with an affiliated transfer agent that: First Data Investors Services Group (“First Data”), the Funds’ then-existing transfer agent, had offered to continue as transfer agent and do the same work for substantially less money than before; and that Citigroup Asset Management (“CAM”), the Citigroup business unit that, at the time, included the Fund’s investment manager and other investment advisory companies, had entered into a side letter with First Data under which CAM agreed to recommend the appointment of First Data as sub-transfer agent to the affiliated transfer agent in exchange for, among other things, a guarantee by First Data of specified amounts of asset management and investment banking fees to CAM and CGM. The order also finds that SBFM and CGM willfully violated Section 206(2) of the Advisers Act by virtue of the omissions discussed above and other misrepresentations and omissions in the materials provided to the Funds’ boards, including the failure to make clear that the affiliated transfer agent would earn a high profit for performing limited functions while First Data continued to perform almost all of the transfer agent functions, and the suggestion that the proposed arrangement was in the Funds’ best interests and that no viable alternatives existed. SBFM and CGM do not admit or deny any wrongdoing or liability. The settlement does not establish wrongdoing or liability for purposes of any other proceeding.
The SEC censured SBFM and CGM and ordered them to cease and desist from violations of Sections 206(1) and 206(2) of the Advisers Act. The order requires Citigroup to pay $208.1 million, including $109 million in disgorgement of profits, $19.1 million in interest, and a civil money penalty of $80 million. Approximately $24.4 million has already been paid to the Funds, primarily through fee waivers. The remaining $183.7 million, including the penalty, has been paid to the U.S. Treasury and will be distributed pursuant to a plan prepared and submitted for approval by the SEC. The order also requires that transfer agency fees received from the Funds since December 1, 2004 less certain expenses be placed in escrow and provides that a portion of such fees may be subsequently distributed in accordance with the terms of the order.
The order required SBFM to recommend a new transfer agent contract to the Fund boards within 180 days of the entry of the order; if a Citigroup affiliate submitted a proposal to serve as transfer agent or sub-transfer agent, SBFM and CGM would have been required, at their expense, to engage an independent monitor to oversee a competitive bidding process. On November 21, 2005, and within the specified timeframe, the Fund’s Board selected a new transfer agent for the Fund. No Citigroup affiliate submitted a proposal to serve as transfer agent. Under the order, SBFM also must comply with an amended version of a vendor policy that Citigroup instituted in August 2004.
30 Smith Barney Appreciation Fund Inc. 2005 Annual Report
Notes to Financial Statements (continued)
At this time, there is no certainty as to how the proceeds of the settlement will be distributed, to whom such distributions will be made, the methodology by which such distributions will be allocated, and when such distributions will be made. Although there can be no assurance, SBFM does not believe that this matter will have a material adverse effect on the Funds.
On December 1, 2005, Citigroup completed the sale of substantially all of its global asset management business, including SBFM, to Legg Mason.
| 10. | Legal Matters |
Beginning in August 2005, five class action lawsuits alleging violations of federal securities laws and state law were filed against CGM and SBFM (collectively, the “Defendants”) based on the May 31, 2005 settlement order issued against the Defendants by the SEC described in Note 9. The complaints seek injunctive relief and compensatory and punitive damages, removal of SBFM as the investment manager for the Smith Barney family of funds, rescission of the Funds’ management and other contracts with SBFM, recovery of all fees paid to SBFM pursuant to such contracts, and an award of attorneys’ fees and litigation expenses.
On October 5, 2005, a motion to consolidate the five actions and any subsequently filed, related action was filed. That motion contemplates that a consolidated amended complaint alleging substantially similar causes of action will be filed in the future. As of the date of this report, the Fund’s investment manager believes that resolution of the pending lawsuit will not have a material effect on the financial position or results of operations of the Fund or the ability of the Fund’s investment manager and its affiliates to continue to render services to the Funds under their respective contracts.
***
Beginning in June 2004, class action lawsuits alleging violations of the federal securities laws were filed against CGM and a number of its affiliates, including SBFM and Salomon Brothers Asset Management Inc. (the “Advisers”), substantially all of the mutual funds managed by the Advisers, including the Fund (the “Funds”), and directors or trustees of the Funds (collectively, the “Defendants”). The complaints alleged, among other things, that CGM created various undisclosed incentives for its brokers to sell Smith Barney and Salomon Brothers funds. In addition, according to the complaints, the Advisers caused the Funds to pay excessive brokerage commissions to CGM for steering clients towards proprietary funds. The complaints also alleged that the Defendants breached their fiduciary duty to the Funds by improperly charging Rule l2b-1 fees and by drawing on fund assets to make undisclosed payments of soft dollars and excessive brokerage commissions. The complaints also alleged that the Funds failed to adequately disclose certain aspects of the allegedly wrongful conduct. The complaints sought injunctive relief and compensatory and punitive damages, rescission of the Funds’ contracts with the Advisers, recovery of all fees paid to the Advisers pursuant to such contracts and an award of attorneys’ fees and litigation expenses.
On December 15, 2004, a consolidated amended complaint (the “Complaint”) was filed alleging substantially similar causes of action. While the lawsuit is in its earliest stages,
Smith Barney Appreciation Fund Inc. 2005 Annual Report 31
Notes to Financial Statements (continued)
to the extent that the Complaint purports to state causes of action against the Funds, the Fund’s investment manager believes the Funds have significant defenses to such allegations, which the Funds intend to vigorously assert in responding to the Complaint.
Additional lawsuits arising out of theses circumstances and presenting similar allegations and requests for relief may be filed against the Defendants in the future.
As of the date of this report, the Fund’s investment manager and the Funds believe that the resolution of the pending lawsuit will not have a material effect on the financial position or results of operations of the Funds or the ability of the Advisers and their affiliates to continue to render services to the Funds under their respective contracts.
The Defendants have moved to dismiss the Complaint. Those motions are pending before the court.
| 11. | Other Matters |
On September 16, 2005, the staff of the SEC informed SBFM and Salomon Brothers Asset Management Inc (“SBAM”)that the staff is considering recommending that the SEC institute administrative proceedings against SBFM and SBAM for alleged violations of Sections 19(a) and 34(b) of the 1940 Act (and related Rule 19a-1). The notification is a result of an industry wide inspection undertaken by the Commission and is based upon alleged deficiencies in disclosures regarding dividends and distributions paid to shareholders of certain funds. Section 19(a) and related Rule 19a-1 of the Investment Company Act generally require funds that are making dividend and distribution payments to provide shareholders with a written statement disclosing the source of the dividends and distributions, and, in particular, the portion of the payments made from each of net investment income, undistributed net profits and/or paid-in capital. In connection with the contemplated proceedings, the staff may seek a cease and desist order and/or monetary damages from SBFM or SBAM.
Although there can be no assurance, SBFM and SBAM believe that this matter is not likely to have a material adverse effect on the Fund or SBFM’s and SBAM’s ability to perform investment management services relating to the Fund.
32 Smith Barney Appreciation Fund Inc. 2005 Annual Report
Report of Independent Registered Public Accounting Firm
The Shareholders and Board of Directors Smith Barney Appreciation Fund Inc.:
We have audited the accompanying statement of assets and liabilities, including the schedule of investments, of Smith Barney Appreciation Fund Inc. as of December 31, 2005, and the related statement of operations for the year then ended, the statements of changes in net assets for each of the years in the two-year period then ended, and the financial highlights for each of the years in the five-year period then ended. These financial statements and financial highlights are the responsibility of the Fund’s management. Our responsibility is to express an opinion on these financial statements and financial highlights based on our audits.
We conducted our audits in accordance with the standards of the Public Company Accounting Oversight Board (United States). Those standards require that we plan and perform the audit to obtain reasonable assurance about whether the financial statements and financial highlights are free of material misstatement. An audit includes examining, on a test basis, evidence supporting the amounts and disclosures in the financial statements. Our procedures included confirmation of securities owned as of December 31, 2005, by correspondence with the custodian and brokers or by other appropriate auditing procedures. An audit also includes assessing the accounting principles used and significant estimates made by management, as well as evaluating the overall financial statement presentation. We believe that our audits provide a reasonable basis for our opinion.
In our opinion, the financial statements and financial highlights referred to above present fairly, in all material respects, the financial position of Smith Barney Appreciation Fund Inc. as of December 31, 2005, and the results of its operations for the year then ended, the changes in its net assets for each of the years in the two-year period then ended, and the financial highlights for each of the years in the five-year period then ended, in conformity with U.S. generally accepted accounting principles.

New York, New York
February 22, 2006
Smith Barney Appreciation Fund Inc. 2005 Annual Report 33
Board Approval of Management Agreement (unaudited)
At separate meetings of the Fund’s Board of Directors, the Board considered the re-approval for an annual period of the Fund’s management agreement (the “Agreement”), pursuant to which Smith Barney Fund Management LLC (the “Manager”) provides the Fund with investment advisory and administrative services. The Board members who are not “interested persons” (as defined in the Investment Company Act of 1940, as amended (the “Independent Directors”)) of the Fund were assisted in their review by Fund counsel and independent legal counsel and met with independent legal counsel in executive sessions separate from representatives of the Manager. The Independent Directors requested and received information from the Manager they deemed reasonably necessary for their review of the Agreement and the Manager’s performance. This information was initially reviewed by a special committee of the Independent Directors and then by the full Board. Prior to the Board’s deliberations, Citigroup, Inc. had announced an agreement to sell the Manager to Legg Mason, which, subject to certain approvals, was expected to be effective later in the year. Consequently, representatives of Legg Mason discussed with the Board Legg Mason’s intentions regarding the preservation and strengthening of the Manager’s business. The Independent Directors also requested and received certain assurances from senior management of Legg Mason regarding the continuation of the Fund’s portfolio management team and of the level of other services provided to the Fund and its shareholders should the sale of the Manager be consummated. At subsequent Board meetings, representatives of Citigroup Asset Management (“CAM”) and Legg Mason made additional presentations to and responded to further questions from the Board regarding Legg Mason’s acquisition of CAM, which includes the Manager. After considering these presentations and reviewing additional written materials provided by CAM and Legg Mason, the Board, including the Independent Directors, approved, subject to shareholder approval, a new Agreement permitting the Manager to continue to provide its services to the Fund after consummation of the sale of the Manager to Legg Mason. (Shareholders approved the new Agreement and the sale of CAM to Legg Mason was consummated as of December 1, 2005.)
In voting to approve the Agreement, the Independent Directors considered whether the approval of the Agreement would be in the best interests of the Fund and its shareholders, an evaluation based on several factors including those discussed below.
Analysis of the Nature, Extent and Quality of the Services provided to the Fund
The Board received a presentation from representatives of the Manager regarding the nature, extent and quality of services provided to the Fund and other funds in the CAM fund complex. In addition, the Independent Directors received and considered other information regarding the services provided to the Fund by the Manager under the Agreement during the past year, including a description of the administrative and other services rendered to the Fund and its shareholders by the Manager. The Board noted information received at regular meetings throughout the year related to the services rendered by the Manager about the management of the Fund’s affairs and the Manager’s role in coordinating the activities of the Fund’s other service providers. The Board’s evaluation of the services provided by the
34 Smith Barney Appreciation Fund Inc. 2005 Annual Report
Board Approval of Management Agreement (unaudited) (continued)
Manager took into account the Board’s knowledge and familiarity gained as Board members of funds in the CAM fund complex, including the scope and quality of the Manager’s investment management and other capabilities and the quality of its administrative and other services. The Board observed that the scope of services provided by the Manager had expanded over time as a result of regulatory and other developments, including maintaining and monitoring its own and the Fund’s expanded compliance programs. The Board also considered the Manager’s response to recent regulatory compliance issues affecting the Manager and the CAM fund complex. The Board reviewed information received from the Manager and the Fund’s Chief Compliance Officer regarding the implementation to date of the Fund’s compliance policies and procedures established pursuant to Rule 38a-1 under the Investment Company Act of 1940, as amended.
The Board reviewed the qualifications, backgrounds and responsibilities of the Fund’s senior personnel and the portfolio management team primarily responsible for the day-to-day portfolio management of the Fund. The Board also considered the willingness of the Manager to consider and implement organizational changes to improve investment results and the services provided to the CAM fund complex. The Board noted that the Manager’s Office of the Chief Investment Officer, comprised of the senior officers of the investment teams managing the funds in the CAM complex, participates in reporting to the Board on investment matters. The Board also considered, based on its knowledge of the Manager and its affiliates, the financial resources available to CAM and its parent organization, Citigroup Inc.
The Board also considered the Manager’s brokerage policies and practices, the standards applied in seeking best execution, the Manager’s policies and practices regarding soft dollars, the use of a broker affiliated with the Manager and the existence of quality controls applicable to brokerage allocation procedures. In addition, management also reported to the Board on, among other things, its business plans, recent organizational changes and portfolio manager compensation plan.
The Board concluded that, overall, it was satisfied with the nature, extent and quality of services provided (and expected to be provided) under the Agreement by the Manager.
Fund Performance
The Board received and reviewed performance information for the Fund and for a group of comparable funds (the “Performance Universe”) selected by Lipper Inc., an independent provider of investment company data. The Board was provided with a description of the methodology Lipper used to determine the similarity of the Fund with the funds included in the Performance Universe. The Board also was provided with information comparing the Fund’s performance to the Lipper category averages over various time periods. The Board members noted that they had also received and discussed with management information throughout the year at periodic intervals comparing the Fund’s performance against its benchmark index. The information comparing the Fund’s performance to that of the Performance Universe, consisting of all retail and institutional funds classified as “large-cap core funds” by Lipper, was for the one-, three-, five- and ten-year periods ended
Smith Barney Appreciation Fund Inc. 2005 Annual Report 35
Board Approval of Management Agreement (unaudited) (continued)
March 31, 2005. The Fund performed better then the median for each time period and, in fact, its performance for the three- and five-year periods ranked in the 1st quintile of the Performance Universe. The Board also reviewed performance information provided by the Manager for periods ended June 2005, which showed the Fund’s performance continued to be competitive during the second quarter compared to the Lipper category average. Based on its review, the Board generally was satisfied with the Fund’s performance.
Management Fees and Expense Ratios
The Board reviewed and considered the contractual management fee (the “Contractual Management Fee”) payable by the Fund to the Manager for investment advisory and administrative services in light of the nature, extent and quality of the management services provided by the Manager.
Additionally, the Board received and considered information comparing the Fund’s Contractual Management Fee and the Fund’s overall expense ratio with those of funds in both the relevant expense group (the “Expense Group”) and a broader group of funds, each selected and provided by Lipper. The Board also reviewed information regarding the fees the Manager charged any of its other U.S. clients investing primarily in an asset class similar to that of the Fund including, where applicable, separate accounts. The Manager reviewed with the Board the significant differences in the scope of services provided to the Fund and to these other clients, noting that the Fund is provided with regulatory compliance and administrative services, office facilities and fund officers (including the Fund’s chief executive, chief financial and chief compliance officers), and that the Manager coordinates and oversees the provision of services to the Fund by other fund service providers. The Board considered the fee comparisons in light of the scope of services required to manage these different types of accounts. The Board received an analysis of complex-wide management fees provided by the Manager, which, among other things, set out a proposed framework of fees based on asset classes.
Management also discussed with the Board the Fund’s distribution arrangements. The Board was provided with information concerning revenues received by and certain expenses incurred by the Fund’s affiliated distributors and how the amounts received by the distributors are expended.
The information comparing the Fund’s Contractual Management Fee as well as its actual total expense ratio to its Expense Group, consisting of 18 retail front-end load funds (including the Fund) classified as “large-cap core funds” by Lipper, showed that the Fund’s Contractual Management Fee was lower than the median of management fees paid by the other funds in the Expense Group. The Board noted that the Fund’s actual total expense ratio also was lower than the median of total expense ratios of the other funds in the Expense Group.
Taking all of the above into consideration, the Board determined that the management fee was reasonable in light of the comparative performance and expense information and the nature, extent and quality of the services provided to the Fund under the Agreement.
36 Smith Barney Appreciation Fund Inc. 2005 Annual Report
Board Approval of Management Agreement (unaudited) (continued)
Manager Profitability
The Board received and considered a profitability analysis of the Manager and its affiliates in providing services to the Fund. The Board also received profitability information with respect to the CAM fund complex as a whole. In addition, the Board received information with respect to the Manager’s allocation methodologies used in preparing this profitability data as well as a report from an outside consultant that had reviewed the Manager’s methodology. The Board also noted the profitability percentage ranges determined by appropriate court cases to be reasonable given the services rendered to investment companies. The Board determined that the Manager’s profitability was not excessive in light of the nature, extent and quality of the services provided to the Fund.
Economies of Scale
The Board received and considered information regarding whether there have been economies of scale with respect to the management of the Fund, whether the Fund has appropriately benefited from any economies of scale, and whether there is potential for realization of any further economies of scale. The Board considered whether economies of scale in the provision of services to the Fund were being passed along to the shareholders. The Board also considered whether alternative management fee structures (such as with additional breakpoints) would be more appropriate or reasonable taking into consideration economies of scale or other efficiencies.
The Board noted that the Fund’s assets exceeded the specified asset level at which one or more breakpoints to its Contractual Management Fee were triggered. Accordingly, the Fund and its shareholders have realized economies of scale because the total expense ratio of the Fund was lower than if no breakpoints were in place. The Board also noted that as the Fund’s assets have increased over time, the Fund and its shareholders have realized other economies of scale as certain expenses, such as fixed Fund fees, became a smaller percentage of overall assets. The Board noted that it appeared that the benefits of any economies of scale also would be appropriately shared with shareholders through increased investment in fund management and administration resources.
Other Benefits to the Manager
The Board considered other benefits received by the Manager and its affiliates as a result of the Manager’s relationship with the Fund, including any soft dollar arrangements, receipt of brokerage commissions and the opportunity to offer additional products and services to Fund shareholders.
In light of the costs of providing investment management and other services to the Fund and the Manager’s ongoing commitment to the Fund, the profits and other ancillary benefits that the Manager and its affiliates received were considered reasonable.
Based on their discussions and considerations, including those described above, the Board members approved the Agreement to continue for another year.
No single factor reviewed by the Board was identified by the Board as the principal factor in determining whether to approve the Agreement.
Smith Barney Appreciation Fund Inc. 2005 Annual Report 37
Board Approval of Management Agreement (unaudited) (continued)
Additional Information
On June 23, 2005, Citigroup Inc. entered into a definitive agreement (the “Transaction Agreement”) with Legg Mason, Inc. under which Citigroup agreed to sell substantially all of its asset management business, CAM, which includes the Manager, to Legg Mason in exchange for the broker-dealer and investment banking businesses of Legg Mason and certain other considerations (the “Transaction”). The Transaction closed on December 1, 2005.
The consummation of the Transaction resulted in the automatic termination of the Fund’s current advisory agreement in accordance with the Investment Company Act of 1940, as amended (the “1940 Act”). Prior to the closing of the Transaction, the Fund’s Board approved a new management agreement between the Fund and the Manager (the “New Management Agreement”) and authorized the Fund’s officers to submit the New Management Agreement to shareholders for their approval.
On July 11, 2005, members of the Board discussed with CAM management and certain Legg Mason representatives the Transaction and Legg Mason’s general plans and intentions regarding CAM’s business and its combination with Legg Mason’s business. The Board Members also inquired about the plans for and anticipated roles and responsibilities of certain CAM employees and officers after the Transaction.
At a meeting held on August 1, 2005, the Fund’s Board, including a majority of the Board Members who are not “interested persons” of the Fund or the Manager as defined in the 1940 Act (the “Independent Board Members”), approved the New Management Agreement. To assist the Board in its consideration of the New Management Agreement, Legg Mason provided materials and information about Legg Mason, including its financial condition, asset management capabilities and organization, and CAM provided materials and information about the Transaction between Legg Mason and Citigroup. Representatives of CAM and Legg Mason also made presentations to and responded to questions from the Board. The Independent Board Members, through their independent legal counsel, also requested and received additional information from CAM and Legg Mason in connection with their consideration of the New Management Agreement. The additional information was provided in advance of and at the August meeting. After the presentations and after reviewing the written materials provided, the Independent Board Members met in executive session with their counsel to consider the New Management Agreement. The Independent Board Members also conferred separately and with their counsel about the Transaction on a number of occasions, including in connection with the July and August meetings.
In their deliberations concerning the New Management Agreement, among other things, the Board Members considered:
(i) the reputation, financial strength and resources of Legg Mason and its investment advisory subsidiaries;
(ii) that, following the Transaction, CAM will be part of an organization focused on the asset management business;
(iii) that Legg Mason is an experienced and respected asset management firm, and that Legg Mason has advised the Board Members that (a) it may wish to combine
38 Smith Barney Appreciation Fund Inc. 2005 Annual Report
Board Approval of Management Agreement (unaudited) (continued)
certain CAM operations with those of certain Legg Mason subsidiaries; (b) it is expected that these combination processes will result in changes to portfolio managers or portfolio management teams for a number of the CAM funds, subject to Board oversight and appropriate notice to shareholders, and that, in other cases, the current portfolio managers or portfolio management teams will remain in place; and (c) in the future, it may recommend that Legg Mason subsidiaries be appointed as the adviser or subadviser to some or all of the CAM funds, subject to applicable regulatory requirements;
(iv) that CAM management had advised the Board that a number of portfolio managers and other key CAM personnel would be retained after the closing of the Transaction;
(v) that CAM management and Legg Mason have advised the Board that following the Transaction, there is not expected to be any diminution in the nature, quality and extent of services provided to the Fund and its shareholders by the Manager, including compliance services;
(vi) that under the Transaction Agreement, Citigroup and Legg Mason have agreed not to take any action that is not contemplated by the Transaction or fail to take any action that to their respective knowledge would cause any “undue burden” on Fund shareholders under applicable provisions of the 1940 Act;
(vii) the assurances from Citigroup and Legg Mason that, for a three-year period following the closing of the Transaction, Citigroup-affiliated broker-dealers will continue to offer the Fund as an investment product, and the potential benefits to Fund shareholders from this and other third-party distribution access;
(viii) the potential benefits to Fund shareholders from being part of a combined fund family with Legg Mason-sponsored funds;
(ix) that Citigroup and Legg Mason would derive benefits from the Transaction and that, as a result, they have a financial interest in the matters that were being considered;
(x) the potential effects of regulatory restrictions on the Fund if Citigroup-affiliated broker-dealers remain principal underwriters of the Fund after the closing of the Transaction;
(xi) the fact that the Fund’s total advisory and administrative fees will not increase by virtue of the New Management Agreement, but will remain the same;
(xii) the terms and conditions of the New Management Agreement, including the differences from the current advisory agreement, and the benefits of a single, uniform form of agreement covering these services;
(xiii) that the Fund would not bear the costs of obtaining shareholder approval of the New Management Agreement;
(xiv) that the Fund would avail itself of permissions granted under certain licensing arrangements between Citigroup and Legg Mason that would permit the Fund (including any share classes thereof) to maintain its current name, as well as all logos, trademarks and service marks, related to Citigroup or any of its affiliates for some agreed upon time period after the closing of the Transaction; and
Smith Barney Appreciation Fund Inc. 2005 Annual Report 39
Board Approval of Management Agreement (unaudited) (continued)
(xv) that, as discussed in detail above, within the past year the Board had performed a full annual review of the current advisory agreement as required by the 1940 Act. In that regard, the Board, in its deliberations concerning the New Management Agreement, considered the same factors regarding the nature, quality and extent of services provided, costs of services provided, profitability, fall-out benefits, fees and economies of scale and investment performance as it did when it renewed the current advisory agreement, and reached substantially the same conclusions.
40 Smith Barney Appreciation Fund Inc. 2005 Annual Report
Additional Information (unaudited)
Information about Directors and Officers
The business and affairs of the Smith Barney Appreciation Fund Inc. (“Fund”) are managed under the direction of the Board of Directors. Information pertaining to the Directors and Officers of the Fund is set forth below. The Statement of Additional Information includes additional information about the Directors and is available, without charge, upon request by calling Shareholder Services at 1-800-451-2010.
| Name, Address, and Birth Year | Position(s) Held with Fund | Term of Office* and Length of Time Served | Principal Occupation(s) During Past 5 Years | Number of Portfolios in Fund Complex Overseen by Director | Other Board Memberships Held by Director | |||||
| Non-Interested Directors: | ||||||||||
Dwight B. Crane Harvard Business School Soldiers Field Morgan Hall #375 Boston, MA 02163 Birth Year: 1937 | Director | Since 1995 | Professor, Harvard Business School | 49 | None | |||||
Burt N. Dorsett The Straford #702 5601 Turtle Bay Drive Naples, FL 34108 Birth Year: 1930 | Director | Since 1973 | President of Dorsett McCabe Capital Management Inc.; Chief Investment Officer of Leeb Capital Management, Inc. (since 1999) | 27 | None | |||||
Elliot S. Jaffe The Dress Barn Inc. Executive Office 30 Dunnigan Drive Suffern, NY 10901 Birth Year: 1926 | Director | Since 1988 | Chairman of The Dress Barn Inc. | 27 | The Dress Barn, Inc. | |||||
Stephen E. Kaufman Stephen E. Kaufman PC 277 Park Avenue, 47th Floor New York, NY 10172 Birth Year: 1932 | Director | Since 1995 | Attorney | 55 | None | |||||
Cornelius C. Rose, Jr. P.O. Box 5388 West Lebanon, NH 03784 Birth Year: 1932 | Director | Since 1973 | Chief Executive Officer of Performance Learning Systems | 27 | None | |||||
Smith Barney Appreciation Fund Inc. 2005 Annual Report 41
Additional Information (unaudited) (continued)
| Name, Address, and Birth Year | Position(s) Held with Fund | Term of Office* and Length of Time Served | Principal Occupation(s) During Past 5 Years | Number of Portfolios in Fund Complex Overseen by Director | Other Board Memberships Held by Director | |||||
| Interested Director: | ||||||||||
R. Jay Gerken, CFA** Citigroup Asset Management (“CAM”) 399 Park Avenue, Mezzanine New York, NY 10022 Birth Year: 1951 | Chairman, President and Chief Executive Officer | Since 2002 | Managing Director of CAM, Chairman, President and Chief Executive Officer of Smith Barney Fund Management LLC (“SBFM”) and Citi Fund Management Inc. (“CFM”); President and Chief Executive Officer of certain mutual funds associated with CAM; Formerly Portfolio Manager of Smith Barney Allocation Series Inc. (from 1996 to 2001) | 183 | None | |||||
| Officers: | ||||||||||
Andrew B. Shoup CAM 125 Broad Street, 11th Floor New York, NY 10004 Birth Year: 1956 | Senior Vice President and Chief Administrative Officer | Since 2003 | Director of CAM; Senior Vice President and Chief Administrative Officer of certain mutual funds associated with CAM; Chief Financial Officer and Treasurer of certain mutual funds associated with CAM; Head of International Funds Administration of CAM (from 2001 to 2003). Director of Global Funds Administration of CAM (from 2000 to 2001) | N/A | N/A | |||||
Kaprel Ozsolak CAM 125 Broad Street, 11th Floor New York, NY 10004 Birth Year: 1965 | Chief Financial Officer and Treasurer | Since 2004 | Director of CAM; Chief Financial Officer and Treasurer of certain mutual funds associated with CAM; Controller of certain mutual funds associated with CAM (from 2002 to 2004) | N/A | N/A | |||||
Harry D. Cohen CAM 399 Park Avenue, 4th Floor New York, NY 10022 Birth Year: 1940 | Vice President and Investment Officer | Since 1980 | Managing Director of CAM; Chief Investment Officer of SBFM and CFM | N/A | N/A | |||||
42 Smith Barney Appreciation Fund Inc. 2005 Annual Report
Additional Information (unaudited) (continued)
| Name, Address, and Birth Year | Position(s) Held with Fund | Term of Office* and Length of Time Served | Principal Occupation(s) During Past 5 Years | Number of Portfolios in Fund Complex Overseen by Director | Other Board Memberships Held by Director | |||||
Scott K. Glasser CAM 399 Park Avenue, 4th Floor New York, NY 10022 Birth Year: 1966 | Vice President and Investment Officer | Since 1996 | Managing Director of CAM; Investment Officer of SBFM; Co-Director of Research for CAM North America | N/A | N/A | |||||
Ted P. Becker CAM 399 Park Avenue, 4th Floor New York, NY 10022 Birth Year: 1951 | Chief Compliance Officer | Since
| Managing Director of Compliance at Legg Mason & Co., LLC (2005 to Present); Chief Anti-Money Laundering Compliance Officer with certain mutual funds associated with CAM (since 2006); Managing Director of Compliance at Citigroup Asset Management (2002 to 2005). Prior to 2002, Managing Director — Internal Audit & Risk Review at Citigroup Inc. | N/A | N/A | |||||
John Chiota CAM 100 First Stamford Place, 5th Floor Stamford, CT 06902 Birth Year: 1968 | Chief Anti-Money Laundering Compliance Officer | Since
| Vice President of CAM (since 2004); Chief Anti-Money Laundering Compliance Officer of certain mutual funds associated with CAM (since 2006); prior to August 2004, Chief AML Compliance Officer with TD Waterhouse. | N/A | N/A | |||||
Steven Frank 125 Broad Street, 11th Floor New York, NY 10004 Birth Year: 1967 | Controller | Since | Vice President of CAM (since 2002); Assistant Controller of certain mutual funds associated with CAM; Assistant Controller of CAM (from 2001 to 2005) | N/A | N/A | |||||
Smith Barney Appreciation Fund Inc. 2005 Annual Report 43
Additional Information (unaudited) (continued)
| Name, Address, and Birth Year | Position(s) Held with Fund | Term of Office* and Length of Time Served | Principal Occupation(s) During Past 5 Years | Number of Portfolios in Fund Complex Overseen by Director | Other Board Memberships Held by Director | |||||
Robert I. Frenkel CAM 300 First Stamford Place, 4th Floor Stamford, CT 06902 Birth Year: 1954 | Secretary and Chief Legal Officer | Since 2003 | Managing Director and General Counsel of Global Mutual Funds for CAM and its predecessor (since 1994); Secretary and Chief Legal Officer of certain mutual funds associated with CAM | N/A | N/A | |||||
| * | Each Director and Officer serves until his or her successor has been duly elected and qualified. |
| ** | Mr. Gerken is an “interested person” of the Fund as defined in the Investment Company Act of 1940, as amended, because Mr. Gerken is an officer of SBFM and certain of its affiliates. |
44 Smith Barney Appreciation Fund Inc. 2005 Annual Report
Additional Shareholder Information (unaudited)
Results of a Special Meeting of Shareholders
On November 15, 2005, a Special Meeting of Shareholders was held for the following purposes: 1) to approve a new management agreement and 2) to elect Directors. The following table provides the number of votes cast for, against or withheld, as well as the number of abstentions and broker non-votes as to each matter voted on at the Special Meeting of Shareholders.
| Item Voted On | Votes For | Votes Against | Abstentions | Broker Non-Votes | ||||
New Management Agreement | 212,878,039.244 | 4,685,940.870 | 6,865,684.677 | 12,098,540.000 | ||||
Election of Directors
| Nominees: | Votes For | Votes Against | Abstentions | |||
Dwight B. Crane | 228,230,672.532 | 8,006,967.857 | 390,564.402 | |||
Burt N. Dorsett | 228,140,141.659 | 8,097,498.730 | 290,564.402 | |||
Elliot S. Jaffe | 228,111,810.910 | 8,125,829.479 | 290,564.402 | |||
Stephen E. Kaufman | 228,102,866.014 | 8,134,774.375 | 290,564.402 | |||
Cornelius C. Rose, Jr. | 228,146,884.885 | 8,093,152.414 | 288,167.492 | |||
R. Jay Gerken | 228,046,277.043 | 8,191,363.346 | 290,564.402 | |||
Smith Barney Appreciation Fund Inc. 2005 Annual Report 45
Important Tax Information (unaudited)
The following information is provided with respect to the distributions paid during the taxable year ended December 31, 2005
Record Date: | 3/1/2005 | 12/8/2005 | 12/27/2005 | ||||||||
Payable Date: | 3/2/2005 | 12/9/2005 | 12/28/2005 | ||||||||
Ordinary Income: | |||||||||||
Qualified Dividend Income for Individuals | 100.00 | % | 100.00 | % | 100.00 | % | |||||
Dividends Qualifying for the Dividends | |||||||||||
Received Deduction for Corporations | 100.00 | % | 100.00 | % | 100.00 | % | |||||
Long-Term Capital Gain Dividend | $ | 0.112100 | $ | 0.603553 | — | ||||||
Please retain this information for your records.
46 Smith Barney Appreciation Fund Inc. 2005 Annual Report
Smith Barney Appreciation Fund Inc.
DIRECTORS Dwight B. Crane Burt N. Dorsett R. Jay Gerken, CFA Elliot S. Jaffe Stephen E. Kaufman Cornelius C. Rose, Jr.
OFFICERS R. Jay Gerken, CFA President and Chief Executive Officer
Andrew B. Shoup Senior Vice President and Chief Administrative Officer
Kaprel Ozsolak Chief Financial Officer and Treasurer
Harry D. Cohen Vice President and Investment Officer
Scott K. Glasser Vice President and Investment Officer
Ted P. Becker Chief Compliance Officer
John Chiota Chief Anti-Money | OFFICERS (continued) Steven Frank Controller
Robert I. Frenkel Secretary and Chief Legal Officer
INVESTMENT MANAGER Smith Barney Fund
DISTRIBUTORS Citigroup Global Markets Inc. Legg Mason Investor PFS Investments, Inc.
CUSTODIAN State Street Bank and Trust Company
TRANSFER AGENT PFPC Inc. 4400 Computer Drive Westborough, Massachusetts 01581
INDEPENDENT REGISTERED PUBLIC ACCOUNTING FIRM KPMG LLP 345 Park Avenue New York, New York 10154 |
This report is submitted for the general information of the shareholders of Smith Barney Appreciation Fund Inc., but it also may be used as sales literature when preceded or accompanied by the current Prospectus.
This report must be preceded or accompanied by a free prospectus. Investors should consider the Fund’s investment objectives, risks, charges and expenses carefully before investing. The prospectus contains this and other important information about the Fund. Please read the prospectus carefully before investing.
www.citigroupam.com
©2005 Legg Mason Investor Services, LLC.
Member NASD, SIPC
| FD0312 2/06 | 06-9636 |
Smith Barney Appreciation Fund Inc.
SMITH BARNEY APPRECIATION FUND INC.
Smith Barney Mutual Funds
125 Broad Street
10th Floor, MF-2
New York, New York 10004
The Fund files its complete schedule of portfolio holdings with Securities and Exchange Commission for the first and third quarters of each fiscal year on Form N-Q. The Fund’s Forms N-Q are available on the Commission’s website at www.sec.gov. The Fund’s Forms N-Q may be reviewed and copied at the Commission’s Public Reference Room in Washington D.C., and information on the operation of the Public Reference Room may be obtained by calling 1-800-SEC-0330. To obtain information on Form N-Q from the Fund, shareholders can call 1-800-451-2010.
Information on how the Fund voted proxies relating to portfolio securities during the most recent 12-month period ended June 30 and a description of the policies and procedures that the Fund uses to determine how to vote proxies relating to portfolio securities is available (1) without charge, upon request, by calling 1-800-451-2010, (2) on the Fund’s website at www.citigroupam.com and (3) on the SEC’s website at www.sec.gov.
ITEM 2. CODE OF ETHICS.
The registrant has adopted a code of ethics that applies to the registrant’s principal executive officer, principal financial officer, principal accounting officer or controller.
ITEM 3. AUDIT COMMITTEE FINANCIAL EXPERT.
The Board of Directors of the registrant has determined that Dwight B. Crane, the Chairman of the Board’s Audit Committee, possesses the technical attributes identified in Instruction 2(b) of Item 3 to Form N-CSR to qualify as an “audit committee financial expert,” and has designated Mr. Crane as the Audit Committee’s financial expert. Mr. Crane is an “independent” Director pursuant to paragraph (a)(2) of Item 3 to Form N-CSR.
Item 4. Principal Accountant Fees and Services
a) Audit Fees. The aggregate fees billed in the last two fiscal years ending December 31, 2004 and December 31, 2005 (the “Reporting Periods”) for professional services rendered by the Registrant’s principal accountant (the “Auditor”) for the audit of the Registrant’s annual financial statements, or services that are normally provided by the Auditor in connection with the statutory and regulatory filings or engagements for the Reporting Periods, were $36,500 in 2004 and $36,500 in 2005.
b) Audit-Related Fees. There were no fees billed in the Reporting Periods for assurance and related services by the Auditor that are reasonably related to the performance of the audit of the Registrant’s financial statements and are not reported under paragraph (a) of this Item 4.
In addition, there were no Audit-Related Fees billed in the Reporting Period for assurance and related services by the Auditor to the Registrant’s investment adviser (not including any sub-adviser whose role is primarily portfolio management and is subcontracted with or overseen by another investment adviser), and any entity controlling, controlled by or under common control with the investment adviser that provides ongoing services to the Smith Barney Appreciation Fund Inc. (“service affiliates”), that were reasonably related to the performance of the annual audit of the service affiliates. Accordingly, there were no such fees that required pre-approval by the Audit Committee for the Reporting Periods (prior to May 6, 2003 services provided by the Auditor were not required to be pre-approved).
(c) Tax Fees. The aggregate fees billed in the Reporting Periods for professional services rendered by the Auditor for tax compliance, tax advice and tax planning (“Tax Services”) were $3,400 in 2004 and $5,900 in 2005. These services consisted of (i) review or preparation of U.S. federal, state, local and excise tax returns; (ii) U.S. federal, state and local tax planning, advice and assistance regarding statutory, regulatory or administrative developments, and (iii) tax advice regarding tax qualification matters and/or treatment of various financial instruments held or proposed to be acquired or held.
There were no fees billed for tax services by the Auditors to service affiliates during the Reporting Periods that required pre-approval by the Audit Committee.
d) All Other Fees. There were no other fees billed in the Reporting Periods for products and services provided by the Auditor, other than the services reported in paragraphs (a) through (c) of this Item for the Smith Barney Appreciation Fund Inc.
All Other Fees. There were no other non-audit services rendered by the Auditor to Smith Barney Fund Management LLC (“SBFM”), and any entity controlling, controlled by or under common control with SBFM that provided ongoing services to Smith Barney Appreciation Fund Inc. requiring pre-approval by the Audit Committee in the Reporting Period.
(e) Audit Committee’s pre–approval policies and procedures described in paragraph (c) (7) of Rule 2-01 of Regulation S-X.
(1) The Charter for the Audit Committee (the “Committee”) of the Board of each registered investment company (the “Fund”) advised by Smith Barney Fund Management LLC or Salomon Brothers Asset Management Inc. or one of their affiliates (each, an “Adviser”) requires that the Committee shall approve (a) all audit and permissible non-audit services to be provided to the Fund and (b) all permissible non-audit services to be provided by the Fund’s independent auditors to the Adviser and any Covered Service Providers if the engagement relates directly to the operations and financial reporting of the Fund. The Committee may implement policies and procedures by which such services are approved other than by the full Committee.
The Committee shall not approve non-audit services that the Committee believes may impair the independence of the auditors. As of the date of the approval of this Audit Committee Charter, permissible non-audit services include any professional services (including tax services), that are not prohibited services as described below, provided to the Fund by the independent auditors, other than those provided to the Fund in connection with an audit or a review of the financial statements of the Fund. Permissible non-audit services may not include: (i) bookkeeping or other services related to the accounting records or financial statements of the Fund; (ii) financial information systems design and implementation; (iii) appraisal or valuation services, fairness opinions or contribution-in-kind reports; (iv) actuarial services; (v) internal audit outsourcing services; (vi) management functions or human resources; (vii) broker or dealer, investment adviser or investment banking services; (viii) legal services and expert services unrelated to the audit; and (ix) any other service the Public Company Accounting Oversight Board determines, by regulation, is impermissible.
Pre-approval by the Committee of any permissible non-audit services is not required so long as: (i) the aggregate amount of all such permissible non-audit services provided to the Fund, the Adviser and any service providers controlling, controlled by or under common control with the Adviser that provide ongoing services to the Fund (“Covered Service Providers”) constitutes not more than 5% of the total amount of revenues paid to the independent auditors during the fiscal year in which the permissible non-audit services are provided to (a) the Fund, (b) the Adviser and (c) any entity controlling, controlled by or under common control with the Adviser that provides ongoing services to the Fund during the fiscal year in which the services are provided that would have to be approved by the Committee; (ii) the permissible non-audit services were not recognized by the Fund at the time of the engagement to be non-audit services; and (iii) such services are promptly brought to the attention of the Committee and approved by the Committee (or its delegate(s)) prior to the completion of the audit.
(2) For the Smith Barney Appreciation Fund Inc., the percentage of fees that were approved by the audit committee, with respect to: Audit-Related Fees were 100% and 100% for 2004 and 2005; Tax Fees were 100% and 100% for 2004 and 2005; and Other Fees were 100% and 100% for 2004 and 2005.
(f) N/A
(g) Non-audit fees billed by the Auditor for services rendered to Smith Barney Appreciation Fund Inc. and CAM and any entity controlling, controlled by, or under common control with CAM that provides ongoing services to Smith Barney Appreciation Fund Inc. during the reporting period were $0 in 2005 for fees related to the transfer agent matter as fully described in the notes the financial statements titled “additional information” and $75,000 for 2004.
(h) Yes. The Smith Barney Appreciation Fund Inc.’ Audit Committee has considered whether the provision of non-audit services that were rendered to Service Affiliates which were not pre-approved (not requiring pre-approval) is compatible with maintaining the Accountant’s independence. All services provided by the Auditor to the Smith Barney Appreciation Fund Inc. or to Service Affiliates, which were required to be pre-approved, were pre-approved as required.
ITEM 5. AUDIT COMMITTEE OF LISTED REGISTRANTS.
Not applicable.
ITEM 6. SCHEDULE OF INVESTMENTS.
Included herein under Item 1.
ITEM 7. DISCLOSURE OF PROXY VOTING POLICIES AND PROCEDURES FOR CLOSED-END MANAGEMENT INVESTMENT COMPANIES.
Not applicable.
ITEM 8. PORTFOLIO MANAGERS OF CLOSED-END MANAGEMENT INVESTMENT COMPANIES.
Not applicable.
ITEM 9. PURCHASES OF EQUITY SECURITIES BY CLOSED-END MANAGEMENT INVESTMENT COMPANY AND AFFILIATED PURCHASERS.
Not applicable.
ITEM 10. SUBMISSION OF MATTERS TO A VOTE OF SECURITY HOLDERS.
Not applicable.
ITEM 11. CONTROLS AND PROCEDURES.
| (a) | The registrant’s principal executive officer and principal financial officer have concluded that the registrant’s disclosure controls and procedures (as defined in Rule 30a- 3(c) under the Investment Company Act of 1940, as amended (the “1940 Act”)) are effective as of a date within 90 days of the filing date of this report that includes the disclosure required by this paragraph, based on their evaluation of the disclosure controls and procedures required by Rule 30a-3(b) under the 1940 Act and 15d-15(b) under the Securities Exchange Act of 1934. |
| (b) | There were no changes in the registrant’s internal control over financial reporting (as defined in Rule 30a-3(d) under the 1940 Act) that occurred during the registrant’s last fiscal half-year (the registrant’s second fiscal half-year in the case of an annual report) that have materially affected, or are likely to materially affect the registrant’s internal control over financial reporting. |
ITEM 12. EXHIBITS.
(a) Code of Ethics attached hereto.
Exhibit 99.CODE ETH
(b) Attached hereto.
| Exhibit 99.CERT | Certifications pursuant to section 302 of the Sarbanes-Oxley Act of 2002 | |
| Exhibit 99.906 CERT | Certifications pursuant to Section 906 of the Sarbanes-Oxley Act of 2002 | |
SIGNATURES
Pursuant to the requirements of the Securities Exchange Act of 1934 and the Investment Company Act of 1940, the registrant has duly caused this Report to be signed on its behalf by the undersigned, there unto duly authorized.
| Smith Barney Appreciation Fund Inc. | ||
| By: | /s/ R. Jay Gerken | |
| (R. Jay Gerken) | ||
| Chief Executive Officer of | ||
| Smith Barney Appreciation Fund Inc. | ||
| Date: | March 10, 2006 | |
Pursuant to the requirements of the Securities Exchange Act of 1934 and the Investment Company Act of 1940, this report has been signed below by the following persons on behalf of the registrant and in the capacities and on the dates indicated.
| By: | /s/ R. Jay Gerken | |
| (R. Jay Gerken) | ||
| Chief Executive Officer of | ||
| Smith Barney Appreciation Fund Inc. | ||
| Date: | March 10, 2006 | |
| By: | /s/ Kaprel Ozsolak | |
| (Kaprel Ozsolak) | ||
| Chief Financial Officer of | ||
| Smith Barney Appreciation Fund Inc. | ||
| Date: | March 10, 2006 | |