Exhibit 99.4

The Shell Report 2004
Meeting the energy challenge – our progress in contributing to sustainable development

Guide to contents
| | | | | |
| | 1 | | | Message from the Group Chief Executive |
| | | | | Jeroen van der Veer on our efforts to improve performance and rebuild trust after a difficult year for Shell. |
| | | | | |
| | 2 | | | The year at a glance |
| | | | | The main events for Shell in 2004. |
| | | | | |
| | 4 | | | About Shell |
| | | | | What we do. How we are governed. Sustainable development and our business strategy. |
| | | | | |
| | 8 | | | Issues |
| | | | | Our response to the environmental and social issues that most affect our business. |
| | | | | |
| | 12 | | | Energy security |
| | | | | The energy security aspect of the global energy challenge and what we are doing to help. |
| | | | | |
| | 16 | | | Location reports |
| | | | | Our efforts to address environmental and social concerns at key locations in Nigeria, the Philippines, Russia, South Africa and the USA. |
| | | | | |
| | 24 | | | Performance data |
| | | | | Our 2004 financial, social and environmental performance data, and future targets. |
| | | | | |
| | 30 | | | Approach to reporting, assurance and performance assessment |
| | | | | How we select the issues and locations we report on, and help make sure our sustainability reporting is honest, relevant and transparent. |
| | | | | |
| | 31 | | | Assurance and basis of reporting |
| | | | | Assurance report from KPMG Accountants N.V. and PricewaterhouseCoopers LLP and our description of the basis of reporting. |
| | | | | |
| | 32 | | | Data table |
| | | | | An overview of our performance data. |
| | | | | |
| | 33 | | | Find out more |
| | | | | Links to further information on the web. |
Finding your way around
Don’t just take our word for it
KPMG Accountants N.V. and PricewaterhouseCoopers LLP have carried out assurance work on selected financial, safety and environmental data marked with , and the extraction of selected data from the audited financial statements. They also reviewed the other information included in this report (see pages 30 and 31 for more).
Members of the communities affected by our operations and external experts have assessed our performance at key locations (page 30).
These assessments, and other uncensored views, including a sample of the e-mails sent to ‘Tell Shell’, can be found in the ‘What others say’ boxes.
What others say
Tell us what you think
Share your views at tellshell@shell.com, write to us (addresses on back cover) or join our forum discussions at www.shell.com/tellshell.
Find out more
This report is supported on the web by additional financial, social and environmental performance data and more detailed discussion of our approach to sustainable development and related issues. Web links on each page and on the back page show where to find this information.

Find out more
The shell pictured on the cover isTectus Conusfrom the Indo-Pacific region.
Message from the Group Chief Executive1
Message from the Group Chief Executive

“This report describes our efforts in 2004 to live up to our commitment to contribute to sustainable development.”
It was a year of real contrasts for us, in which we delivered record earnings and also faced up to the challenge of addressing the very difficult issues that arose from the recategorisation of our proved reserves. We took important steps to rebuild trust and lay the foundation for our future business success, making major improvements to the way we book reserves, proposing far reaching changes to the way we are governed and making progress implementing our business strategy.
The events of the last year have only reinforced my belief that making sustainable development an integral part of how we do our business is critical for our future success. The growth of energy companies in the decades ahead will depend on their ability to operate with integrity and to listen and respond to society’s expectations for their operations and products.
Sustainable development starts with the safety of our people. I am pleased with the improvements to our safety performance in 2004, and in particular the progress made through our road safety programmes. However, I deeply regret that two employees and 35 contractors lost their lives at work. Of these fatalities, 18 were caused by road accidents or security incidents. Improving our safety performance remains a top priority.
Sustainable development also means improving our environmental and social performance. Over the past few years, we have made challenging and, in several cases, industry-leading commitments in areas like biodiversity, reducing our greenhouse gas emissions, and ending the continuous flaring of gas. The progress we made on these in 2004 represents a lot of hard work. It is also clear to me that we cannot take our eye off the ball, particularly in Nigeria where we expect delays in our programme to end continuous flaring. Implementing our commitments will continue to require attention and focus over the coming years.
We continued our efforts to understand better and manage the impacts we have on the communities where we operate. Our Oil Products business met its target to have social performance plans in place at the 28 major facilities it operates near communities in 2004. We increased our efforts to improve environmental performance and rebuilt relationships at several locations where we had lost the trust of our neighbours. I am pleased to see the strong relationships with the local community at Norco.
Contributing to sustainable development also involves helping to meet the world’s growing demand for energy in more environmentally and socially responsible ways. We continued to develop and provide cleaner products for customers, for example launching cleaner burning V-Power transport fuels in the United States, making more than 40 countries where we offer premium quality fuel.
This report has again been prepared in line with the Global Reporting Initiative guidelines. I believe it represents a balanced and reasonable presentation of our organisation’s economic, environmental and social performance.
I hope it helps you to judge our performance for yourself.

Jeroen van der Veer
Group Chief Executive
2The Shell Report
The year at a glance
An overview of our main financial, social and environmental events of 2004.
Loss of life
We are deeply saddened that two of our employees and 35 contractors lost their lives at work. Of these fatalities, 18 were caused by road accidents or security incidents. The Fatal Accident Rate was our lowest ever reported. Improving our safety performance is a top priority for 2005 (page 27).
Reporting reserves
In April 2004, the Group restated its Financial Statements to reflect the removal of 4.47 billion barrels of oil equivalent (boe) originally reported as proved reserves as at December 31, 2002. Actions were taken to address the weakness in our controls on reserves bookings identified by an independent review. In February 2005, as a result of reservoir-by-reservoir reviews of substantially all our proved reserves volumes, the Group announced the removal of approximately 1.37 billion boe originally reported as proved reserves as at December 31, 2003 and has restated its Financial Statements accordingly.1
We agreed to pay a $120 million civil penalty to the Securities and Exchange Commission in the USA and £17 million ($32 million) to the United Kingdom’s Financial Services Authority to resolve their investigations into our reserves restatements. We also undertook to spend a further $5 million developing a comprehensive internal compliance programme.1
Improving compliance
We began to review and strengthen our compliance programmes. A Group Compliance Officer, reporting to the Group’s Legal Director and with direct access to our Group Chief Executive, has been appointed.1
One company, one board, one Chief Executive
The Boards of our two existing parent companies, Royal Dutch and Shell Transport and Trading, proposed unifying under a single new parent company, Royal Dutch Shell plc, with a single board and one corporate headquarters in the Netherlands. The Boards also appointed Jeroen van der Veer as the Group’s first Chief Executive (page 5).
Sustainability indices
The Dow Jones Sustainability Index2 and FTSE4Good Index3again included Shell in their rankings of socially and environmentally responsible companies.
Responding to criticism of our environmental and social performance
Sakhalin Energy (55% Shell) asked the World Conservation Union (IUCN) to set up a panel of independent experts to assess the impact of the Sakhalin II oil and gas project on the critically endangered western gray whales, and responded to the panel’s findings (pages 18-19).
Operations in Brazil, Nigeria, the Philippines, South Africa and the USA stepped up efforts to improve strained relations with local communities and respond to criticism of past environmental performance (pages 11 and 16-23).
We supported United Nations (UN) efforts to define the role of business in safeguarding human rights, but opposed the draft UN human rights norms for business. Like others, we believed they risked weakening governments’ responsibilities under international law. We were criticised by some for this stand.4
Tomorrow’s energy today
Shell increased its global wind power capacity by about 10%, to 740 megawatts, enough to supply over 220,000 homes. Shell Solar opened the world’s largest solar power station in Leipzig, Germany. It also provided solar power to another 33,000 homes without reliable access to electricity from the power grid, and expects to reach a total of more than 100,000 in 2005.5
Find out more
1www.shell.com/annualreport
2www.sustainability-index.com
3www.ftse.com/ftse4good
4www.shell.com/humanrights
5www.shell.com/renewables
Performance headlines
Financial
$18.2 billion net income
$7.6 billion in asset sales
More than $10 billion invested in our upstream businesses
Social
Mixed safety performance (a priority for improvement in 2005)
$6.3 billion spent with locally-owned companies in developing world
Environmental
Met target for energy efficiency
Slightly improved flaring and spills but missed targets
Delays to end of continuous gas flaring in Nigeria
The year at a glance3
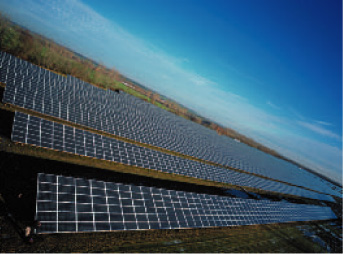
World’s largest solar power station in Leipzig, Germany
More upstream
Our Exploration & Production and Gas & Power businesses stepped up efforts to produce and bring to market more oil and natural gas, investing more than $10 billion and announcing plans to recruit around 1,000 engineers.1
The government of Oman extended the oil and gas concession of Petroleum Development Oman (34% Shell) to 2044.
We supported the go ahead of the Kashagan project (16.7% Shell) in Kazakhstan to develop an oil field estimated to contain up to 13 billion barrels of oil.
We signed an agreement to develop gas reserves in Qatar and build the world’s largest plant to convert natural gas into transport fuel (page 13).
The Corrib natural gas project in Ireland (45% Shell) received planning permission. At peak production, Corrib gas could meet up to 60% of the country’s gas needs.2
Bringing liquefied natural gas (LNG) to market
Our Gas & Power business continued securing facilities for bringing LNG into North America. Gas & Power companies signed an agreement for 50% of the initial capacity of a new LNG terminal in Baja California, Mexico, continued to pursue permits for an offshore terminal in the Gulf of Mexico and proposed another in Long Island Sound on the east coast of the USA.3
Sakhalin Energy (55% Shell) signed a deal to supply LNG from Sakhalin Island to Mexico – the first sale of Russian natural gas to North America.
The fourth train of LNG at the North West Shelf project (22% Shell) in Australia began production. Nigeria LNG (26% Shell) got final approval from all partners to build a sixth LNG train.
Profitable downstream
Our Oil Products and Chemicals businesses expanded into fast growing markets in Asia. Construction of the Nanhai petrochemicals plant in China (50% Shell) proceeded4and a $187 million joint venture contract was signed to develop a network of 500 service stations in Jiangsu province, China. We became the first foreign company to win a licence to open service stations in India.
Our Chemicals business increased production capacity in Canada, the Netherlands and the USA.
We continued restructuring our portfolio to focus on high growth and high margin activities, selling pipelines and a refinery in the USA, retail and commercial assets in Spain and Portugal, part of Showa Shell in Japan and our interest in a refinery in Thailand.1
Our Oil Products and Chemicals businesses combined some activities into one downstream organisation on January 1, 2005, to standardise processes, save costs and serve customers better.1
Sustainable transport
Iogen, partly owned by Shell, produced the first commercially available biofuel from straw (‘eco-ethanol’).5
Shell Hydrogen opened the world’s first hydrogen dispenser at a retail service station in Washington, DC.6
We launched V-Power diesel, offering better performance and lower emissions, in Austria, Germany, Greece and the Netherlands. V-Power petrol was made available in the USA, one of more than 40 countries where we offer premium quality fuels.
Find out more
1www.shell.com/annualreport
2www.shell.com/corrib
3www.shell-usgp.com
4www.cnoocshell.com
5www.iogen.ca
6www.shell.com/hydrogen
4The Shell Report
About Shell
We are a global group of energy and petrochemical companies operating in more than 140 countries and employing more than 112,000 people.
What we do
Upstream
Shell’s upstream businesses explore for and extract oil and natural gas, and build and operate the infrastructure necessary to deliver these hydrocarbons to market. Activities also include marketing and trading of natural gas and electricity, as well as converting natural gas to liquids to provide cleaner fuels.
| | | | | |
| |
Exploration & Production | | | | |
| Employees (thousand) | | | 17 | |
| Capital investment ($ million) | | | 9,868 | |
| |
Gas & Power | | | | |
| Employees (thousand) | | | 2 | |
| Capital investment ($ million) | | | 1,633 | |
| |
Downstream
Shell’s downstream businesses engage in refining crude oil into a range of products including fuels, lubricants and petrochemicals. The Group operates the largest single brand retail network, with over 46,000 service stations.
| | | | | |
| |
Oil Products | | | | |
| Employees (thousand) | | | 76 | |
| Capital investment ($ million) | | | 2,466 | |
| |
Chemicals | | | | |
| Employees (thousand) | | | 8 | |
| Capital investment ($ million) | | | 705 | |
| |
Everyday products
Shell’s products play a part in people’s everyday lives:
| | | – fuels and lubricants used in cars, trucks, buses and planes; |
| |
| | | – natural gas, wind power and solar panels used to generate electricity for industrial and domestic use; and |
| |
| | | – base chemicals and intermediates used to manufacture household products, from detergents to CDs to toys. |
Renewables and Hydrogen
The activities covered in Shell’s new energy portfolio aim to build a commercially viable business based on hydrogen and renewable sources. Part of this portfolio includes producing wind and solar energy used to generate electricity and finding solutions to develop hydrogen as a cleaner and more efficient fuel.
| | | | | |
| |
Corporate and Other | | | | |
| Employees (thousand) | | | 9 | |
| Capital investment ($ million) | | | 243 | |
| |

Though we are probably best known to the public for our service stations and for finding and producing oil and natural gas, our activities result in many other products that play a role in people’s everyday lives
About Shell5
Good corporate governance is critical to our business success and to ensuring we live by our business principles, including our commitment to contribute to sustainable development.
How we are governed
We are committed to upholding the highest standards of integrity and transparency in the governance of the Royal Dutch/Shell Group of Companies. In 2004, we initiated important changes to our structure and the way we run the Group.*
One company, one board, one Chief Executive
A review of the structure and governance of the Group was carried out during 2004 by a steering group drawn from the Boards of the Group’s two parent companies, Royal Dutch Petroleum Company (60% interest in the Group) and The “Shell” Transport and Trading Company, p.l.c. (40% interest). It considered how best to simplify the structures of the parent companies, the Boards and management of the Group; how to improve the decision-making processes and the personal accountability of management; and how to enhance leadership of the Group. Based on the steering group’s final recommendations, the Boards’ proposal to shareholders is for the unification of the two existing parent companies under a single new parent company, Royal Dutch Shell plc. The company is incorporated in England and Wales and has a single corporate headquarters and its tax domicile in the Netherlands. Royal Dutch Shell plc will have a single 15-person board with a majority of independent non-executive directors, headed by a non-executive chairman. A single Chief Executive leads the Executive Committee, whose members report to him.
The Boards believe that this proposal will provide a clearer and simpler structure with a single smaller board and a simplified senior management structure. The lines of accountability will be clearer with the Executive Committee reporting to the Chief Executive, who in turn will report to the unified single board and non-executive chairman. Efficiencies will be achieved by reducing duplication and centralising functions in one headquarters in The Hague.
The Executive Committee has already been established and Jeroen van der Veer has been appointed as the Group’s first Chief Executive.
Strengthening compliance
We also launched a review of our processes for ensuring compliance with regulations and our own policies and standards. As a result, a Group Compliance Officer was appointed, reporting to the Group Legal Director, and with direct access to the Group Chief Executive and the Group Audit Committee to co-ordinate and strengthen regulatory compliance across the Group. Royal Dutch Petroleum Company also launched its global whistle-blowing procedure to protect employees who report any breach or suspected breach of any law, regulation or company policy or guideline, including the Shell General Business Principles. In addition, executives responsible for each Shell Business and country operation continued to be required to inform our Group Chief Executive, through their annual assurance letters, whether the operations they had operational control over complied with Group policies and standards. Results are reported to the Group Audit Committee.
Sustainable development governance
Making sustainable development part of how we work remained the responsibility of our operational staff and project teams, supported by environmental, health, safety and social performance resources in our businesses. We have in place a range of Group policies and standards dealing with the environmental and social dimensions of sustainable development. A Social Responsibility Committee continued to review the policies and conduct of the Group with respect to the Shell General Business Principles (including our commitment to contribute to sustainable development), our Health, Safety and Environment Commitment and Policy and major issues of public concern on behalf of the Boards. This included advising on the relevance and balance of The Shell Report. In 2004, the Committee, composed of six Non-executive Directors, was chaired by Dr Eileen Buttle, an environmental scientist.
| * | | For more on corporate governance and the proposed changes to our structure, see the Annual Report and Accounts of our parent companies and www.shell.com/unification. |
Find out more
www.shell.com/aboutshell
www.shell.com/annualreport
www.shell.com/corporategovernance
6The Shell Report
Contributing to sustainable development is part of our business principles. It is also something we must do to achieve our strategy and remain a leading energy and petrochemicals company.
Sustainable development and our business strategy
Contributing to sustainable development for us means, above all, helping to meet the global energy challenge by responding to society’s rapidly-growing need for energy and petrochemicals in environmentally and socially responsible ways. This starts with listening to our stakeholders, so that we understand society’s changing expectations and learn to see our business through a wider lens. It then involves working with others to provide the innovative energy solutions needed to meet those expectations, as well as behaving honestly and being transparent about our successes and failures. This is how we aim to do our business. We know we have work to do to live up to this aspiration fully.
Our strategy – more upstream and profitable downstream
Our strategy over the next five years is clear: ‘More upstream, profitable downstream’.1 More upstream means improving our performance in finding and producing oil, and especially natural gas, and increasing the upstream share of our portfolio. Profitable downstream means increasing returns in our Oil Products and Chemicals businesses by running our facilities better, investing in fast growing markets like China and other parts of Asia, and selling off activities with lower returns or limited growth potential. As the energy mix continues to evolve, we will continue to invest in alternative energy. Our new energy portfolio currently includes wind and solar power, biofuels and hydrogen.
Sustainable development and our strategy
We believe this strategy will improve our business performance and increase our contribution to sustainable development. Stronger emphasis on our upstream activities and fast growing markets will help us deliver the energy the world needs for economic growth and poverty reduction. Our increased focus on producing cleaner burning natural gas will help us contribute to reducing dependence on coal.
At the same time, growing demand for oil and natural gas presents sustainable development challenges. Producing and using this extra energy will only be sustainable, and socially acceptable, if ways are found to deal with the risk to the climate, operate safely in biodiversity sensitive areas and avoid health, safety and environmental incidents. Our operations and the wealth they create must not lead to human rights abuses or support civil unrest or regimes under international sanctions. We recognise that we will not achieve our strategy and improve business performance for our shareholders unless we respond effectively to these key environmental and social concerns (see the Issues section pages 8-11).
Successful projects and operations depend not only on good engineering, commercial and project management skills, but also on earning the trust of a wide range of stakeholders.
For example, reassuring the public of the safety and environmental acceptability of liquefied natural gas (LNG) terminals will be essential in seeking to expand the use of LNG in North America and could determine who will win permission to supply that market (page 15).
Likewise the success of the Sakhalin II project in Russia (pages 18-19), our biggest new upstream investment, depends on mitigating potential adverse impacts on the community, as well as on the environment, including on the critically endangered western gray whales. Sakhalin Energy has delayed construction of the offshore pipeline and changed the route in response to concerns about the whales.
At our refineries and chemical plants, we know that good environmental and social performance, and good operational performance go hand-in-hand, lowering the risk of incidents, fines, environmental liabilities and disruptions from local communities, and contributing to the morale of our employees.2See the Locations section (pages 20-23) for our efforts at several downstream operations to win back community trust by improving environmental and social performance.
What others say
“It seems that management has taken their eye off the ball, and is now more concerned with being socially and politically correct than managing the company in the best interests of the shareholders. Making money for the shareholders is the primary responsibility of management.”
Tell Shell, USA
Find out more
www.shell.com/envandsociety
1www.shell.com/strategy
2www.shell.com/sdbusinessvalue
About Shell7
Sustainable development – making it happen
Making sustainable development part of how we run our facilities and make decisions involves setting clear requirements that address our main environmental, social and ethical issues (see the Issues section pages 8-11). These must then be integrated into our business processes and supported by controls, incentives and training to ensure employees and contractors can follow them.
Shell-wide requirements
We require all Shell companies and joint ventures over which we have operational control to follow our policies and standards.1These include our Health, Safety and Environment (HSE) policy and our Business Principles2which, for example, support human rights and forbid bribery and political payments. They also include our global environmental standards, and our standards for diversity and inclusiveness (to encourage a workplace that values differences), for security, biodiversity, ship quality, animal testing and health management. In addition, all our contractors must follow our HSE policy.
Shell employees are also required to use their influence to encourage the adoption of comparable policies and standards by suppliers, companies and ventures where we do not have operational control. These are typically companies and ventures where we own a minority share or are not the operator, like most of our Gas & Power ventures and Motiva, which runs several refineries in the USA, including Norco and Port Arthur (pages 20-21). If similar HSE policies and business principles cannot be adopted within a reasonable time, we are required to end the relationship, which we did with 64 contracts in 2004 (page 25).
Controls, incentives and training
Our assurance letter process (page 5) is an important control. In addition, we require the HSE management systems at major plants to be audited and their environmental component to be externally certified to international standards (for example ISO 14001). Key performance indicators, covering our main company-wide environmental and social impacts, help us track and manage our performance and identify priority areas for improvement.
Sustainable development continues to count in performance appraisals and pay. Bonuses are based both on individual achievement and on how well the Group performs. Environmental and social aspects of sustainable development make up 20% of how Group performance is measured, with the focus in 2005 on safety, reflecting the high priority being put on reducing fatalities and accidents. Sustainable development remains a prominent theme when we recruit new staff, in leadership development, and in technical and product innovation.
Sustainable development at our refineries and chemical plants
Shell requirements at the refineries and chemical plants we operate include:
| | – | Social performance plans to maintain an open dialogue with stakeholders, help to generate jobs and other benefits for our neighbours and minimise unwanted social impacts. |
| |
| | – | Energy efficiency improvements to be achieved, for example, by running an Energise™ energy review and conservation programmes (page 28). |
| |
| | – | Reduction targets for injuries and spills (pages 27 and 29). |
Sustainable development in new oil and natural gas projects
New oil and natural gas projects we control must for example:
| | – | Complete integrated environmental, social and health impact assessments, demonstrating they have the plans and resources to engage with key stakeholders, protect the environment and manage impacts on communities. |
| |
| | – | Not explore or drill for oil and natural gas in natural World Heritage sites and follow our biodiversity standard when operating in other environmentally sensitive areas (page 10). |
| |
| | – | Include the future costs of greenhouse gas emissions in project economics, and implement plans to reduce those emissions cost effectively. |
| |
| | – | Comply with United Nations sanctions and operate in line with our security standard. |
Guidance and training include our human rights compliance tool (page 11), the ‘Chronos’ sustainable development e-learning module and our ‘Hearts and Minds’ safe behaviour programme. In 2004, we launched a major initiative to ensure everyone responsible for tasks with a significant HSE risk (more than 20,000 staff) has undergone the necessary training and possesses the required skills.
In 2005, in addition to tightening compliance processes, we will be looking for ways to better communicate social and environmental requirements and to change attitudes that tolerate rule-breaking. In addition, we aim to improve the way sustainable development is considered in the planning, design and review of major new projects, acquisitions and divestments.
Find out more
www.shell.com/embeddingsd
1www.shell.com/standards
2www.shell.com/sgbp
Issues
How we are addressing the environmental and social concerns that matter most to our stakeholders, our reputation and our business.
Climate change
We provide energy and petrochemicals to meet society’s needs. Today, much of that energy comes from burning fossil fuels, which is adding to the concentration of carbon dioxide (CO2) in the atmosphere. This higher CO2 concentration is now generally linked to a changing climate.
By 2030, energy demand could be 60% higher than today and by 2050 more than double, as the population grows and developing countries expand their economies. Meeting this demand and avoiding the environmental threat posed by climate change is a serious energy and sustainability challenge. Energy technology and use will have to evolve. The foundations for change have to be laid now and urgently. Governments must provide leadership. However, business has an important role to play.
Managing greenhouse gas (GHG) emissions from our operations
In 2004, we continued working to meet our voluntary GHG emissions target. This requires the total GHG emissions across all the facilities we operate to be 5% lower in 2010 than they were in 1990. We will need to actively manage these emissions to offset the rise in our CO2 releases that will occur as we use more energy to maintain production from ageing oil and natural gas fields, to refine heavier oils and to meet demand for lower sulphur petrol and diesel. Growth from new projects, such as the expansion of our Athabasca Oil Sands Project in Canada (page 14) and the proposed Gas to Liquids plant in Qatar (page 13) will also add to our emissions.
Improvements in energy efficiency will help, as we operate our refineries and chemicals plants better and complete Energise™ energy efficiency programmes at many of them (page 28). But the biggest reduction by far – a further 15 million tonnes of CO2 – will come from ending continuous flaring at oil production facilities, especially in Nigeria (pages 16-17).
In 2004, GHG emissions from the facilities we operate remained unchanged at 112 million tonnes of CO2 equivalent or 9% below 1990 levels (page 28).
What others say
“As a shareholder I am disappointed at how little capital is employed in renewable energy. We are still spending most of shareholders’ funds on extracting oil and causing global warming as a result. Much more effort needs to go into renewable energy.”
Tell Shell, USA
Responding to GHG regulations
The Kyoto Protocol is ratified and in force. Governments are responding to the commitment it brings. For example, the European Union’s (EU) Emissions Trading System officially started on January 1, 2005. Large industrial facilities in the EU must hold one tradable allowance for every tonne of CO2 they emit. Allowances have been allocated to each facility. There are fewer allowances available than expected emissions, forcing some facilities to invest in emissions reductions and encouraging surplus allowances to be traded.
Currently we have 28 facilities in the scheme, covering about a fifth of our worldwide operational emissions. We have been preparing for the scheme over two years, including developing the business processes required, identifying potential emission reduction projects and building capacity in Shell Trading. In 2003, Shell Trading executed the first ever trade in first-period EU allowances (2005-2007) and we were reported to have made the first ever trade in 2004 for the second-period (2008-2012). Trading systems are likely to be implemented in other regions and we hope they will encourage the development of a global carbon market.
Find out more
www.shell.com/climate
Issues9
Energy and carbon footprint
Since 1997, we have reported our CO2 and other main GHG emissions from the production and manufacturing sites we operate. However, using our energy products (for example petrol, diesel and natural gas) emits about seven times more GHGs. A small share of the energy products we make, such as electricity from our wind turbines, emit no CO2 at all during use.
The diagram (right) shows the energy and GHG emissions from the production, refining and final use of the energy products we produce.
In 2002, the most recent year for which international data is available, the Group produced energy products that delivered nearly 11.7 exajoules of energy. That was 20 times the power needed to provide electricity, heating and transportation for London, and equivalent to 3.9% of the world’s final energy consumption. Our customers emitted an estimated 763 million tonnes of CO2 using these energy products. We released a further 111 million tonnes of CO2 and other GHGs making them. This is calculated on an equity ownership basis, including our share of joint ventures which we do not operate. Together, this is equivalent to 3.6% of global CO2 emitted from the combustion of fossil fuels.
We recognise that our response to climate change means more than reducing our own emissions. A shift to lower carbon-emitting energy products is also needed, so the rapid rise in energy use does not bring an equally big increase in GHG emissions. Expanding our natural gas business will help. In the longer term, so will our efforts to lower the costs and increase the use of biofuels, wind and solar power, and hydrogen, and to develop efficient ways to capture and safely store the CO2 from fossil fuels (page 15). But both meeting the energy supply challenge and first slowing, and then eventually reversing, the rise in carbon emissions will remain a major challenge for energy producers and users alike.
10The Shell Report
Operating in environmentally sensitive areas
As the need to increase and diversify energy supplies grows, pressure is increasing to explore and operate in environmentally sensitive areas. This is why, in 2001, we adopted a Biodiversity Standard.1In 2003, we made additional commitments on protected areas, agreeing not to explore or drill for oil and natural gas in natural World Heritage sites. We also committed to take extra care and work with local communities and scientific experts when operating in the World Conservation Union (IUCN) category I-IV protected areas or in other locations where we find sensitive flora and fauna through our impact assessments. In 2004, five Shell companies worked in seven IUCN category I-IV areas.
On Sakhalin Island we are working with experts to understand fully and reduce our impact on the critically endangered western gray whale (pages 18-19). In Australia, a panel of quarantine experts is helping ChevronTexaco, the operator of the Gorgon LNG joint venture (25% Shell), to protect Barrow Island. This is an IUCN category Ia nature reserve where natural gas from the Gorgon offshore fields will be turned into LNG. Oil has been produced safely on the island for over 40 years, but preventing the introduction of non-indigenous species continues to require tight quarantine systems.2
In 2004, we developed specific requirements and targets for companies operating in sensitive areas. We now require all sites in IUCN I-IV areas to have Biodiversity Action Plans in place by the end of 2005, and sites in other areas of high biodiversity value to do the same by the end of 2007. We also included guidance in our Health, Safety and Environment management system on what these action plans need to contain.
Managing political risks
We operate in more than 140 countries and face a range of political risks. These include civil unrest, international sanctions, governments nationalising our assets and operating in countries with poor human rights records. To manage these risks, we set clear rules and apply them using local knowledge.

African Skimmer at Shell’s operation in Gabon, where the Smithsonian Institution is working in partnership with Shell Gabon and the Shell Foundation to reduce our operational impacts and protect biodiversity in the region
All our operations must follow the Shell General Business Principles (including our commitment to human rights), which we promote in joint ventures where we do not have operational control and with host governments. Our operations must also apply our security standard to protect staff and property. This includes guidance on when and how to use armed security. We respect international law and all United Nations sanctions. When individual countries impose broad sanctions or specific export restrictions in countries where we have investments, such as the USA has done against Iran, Sudan and Syria, we review our operations and take the steps needed to comply with the laws applying to the Shell companies and staff involved.
The Shell chairperson in each country is responsible for assessing and responding to the political risks, assisted by regional advisers and issue management teams. In countries with the biggest financial or reputational consequences for Shell, the regional advisers review our responses and the risk exposure of our overall portfolio, updating our Executive Committee quarterly.3
Energy prices
High energy prices pose a threat to economic growth. However, they also attract more energy investment, encourage energy conservation and stimulate the growth of alternatives like wind or solar power. Our oil and natural gas production businesses benefit when prices rise, though competition laws prevent us using these profits to subsidise other parts of the business or petrol prices. Large energy companies are sometimes accused of controlling the market and driving up prices. However, transport fuel prices are
Find out more
1www.shell.com/biodiversity
2www.gorgon.com.au
3www.shell.com/politicalrisks
Issues11
determined by many factors, including taxes (sometimes more than 75%), world oil prices, local exchange rates against the US dollar and local competition. We produce about 3% of the world’s oil and cannot influence global prices, nor would we wish to do so. Locally, selling fuel remains a very competitive business and our efforts continue to ensure our local operations compete fairly and respect applicable competition laws (page 25).1
Operating our facilities safely
We are committed to preventing incidents such as spills, fires and accidents that could pose a risk to people, the environment and our facilities. All Shell companies and joint ventures we control must follow our Health, Safety and Environment policy and standards (page 7) and all tankers we use must meet our Ship Quality Assurance Standard.2If an incident occurs, emergency response plans must be in place to minimise damage. We investigate serious incidents and cases where a serious incident was narrowly averted, to learn how to avoid them in future.
Human rights
We remain committed to supporting fundamental human rights, as required by our Business Principles. In practice, this means responding to many different concerns. These include respecting the rights of employees and contractors, for example by providing grievance procedures and offering access to unions or staff councils where applicable, avoiding child labour and providing a healthy, safe and secure work environment. They also include working with governments to ensure our operations do not violate the rights of local communities, and to reduce the chance of oil and natural gas revenues encouraging corruption (pages 25-29). The ‘Human Rights Compliance Assessment’ tool, which we continued to pilot in 2004, helps our staff understand these challenges and set priorities for improvement.3
Crop protection legacies
Until 1993 we made and sold crop protection chemicals, including pesticides known as ‘drins’. These pesticides were manufactured almost exclusively by Shell. Like a number of other pesticides, drins are now banned because they are toxic and persistent in the environment.
Safely disposing of remaining stocks
An important use of drins was the control of locusts and insects carrying diseases such as malaria, and stocks were often donated by aid agencies and the UN to developing countries. We estimate that seven of these countries still have stocks of more than ten tonnes, but have neither the funds nor the resources to dispose of them safely. We do not own or control these now obsolete stocks. But as part of our commitment to product stewardship, we support the efforts of the industry body, CropLife International4, to find and safely dispose of them.
By the end of 2004, more than half of the identified old stocks of Shell crop protection chemicals had been dealt with, according to CropLife International. Many of those remaining are in remote locations in countries where it is often difficult to operate, so this clean-up work will take more time. In 2004, CropLife helped complete a clean-up programme in Senegal and, with the Africa Stockpiles Programme, made progress in countries including Mali and Tanzania. We remain committed to supporting these organisations in their efforts to deal with these stocks safely.
Cleaning up contamination
We are assessing the contamination at each site where we produced or handled these products and are responding on the basis of any health risks identified, in line with international best practice.
In Brazil we are working with the authorities at Paulinia, a former Shell Chemicals plant, and Vila Carioca (Ipiranga district), a fuel depot and former chemicals plant, to deal with contamination from our former operations there. In 2001, our site investigation at Paulinia detected contamination in the groundwater in a neighbouring residential area. We offered residents precautionary blood tests, which found that drins levels, for example, were 100 times lower than the World Health Organisation’s safe level. In 2004, we built a groundwater barrier and water treatment plant to help keep contamination from spreading to the river. In 2005, we will be cleaning up an area of soil and installing bioremediation systems. At Vila Carioca (Ipiranga district), we have completed several projects to excavate and remove contaminated soil. We are discussing a detailed plan for managing soil and groundwater contamination with the regulators.
Find out more
1www.shell.com/fuelprices
2www.shell.com/standards
3www.shell.com/humanrights
4www.croplife.org
12The Shell Report
Energy security
Our biggest contribution to sustainable development is helping to meet the energy challenge – finding ways to satisfy rising energy demand in environmentally and socially responsible ways. Last year, we highlighted one aspect of this challenge – making transportation more sustainable. This year we look at energy security.
The issue
Growing economies are critically dependent on secure, affordable energy supplies. The sharp rise in energy prices in 2004 reinforced three concerns about the long-term security of the global energy system: whether there will be enough energy to meet demand, whether supplies are safe from disruption (for example from political unrest), and whether the environment (especially the climate) can be protected in the face of growing fossil fuel use.
These concerns are based on the widespread recognition by energy experts that energy demand will almost certainly continue to grow strongly over the coming decades; that most of this extra energy will likely need to come from burning coal, oil and natural gas; and that the dependence on imported energy, especially from the Organisation of Petroleum Exporting Countries (OPEC) and Russia, will continue to grow.
The International Energy Agency (IEA)1, for example, expects the world to be using nearly 60% more energy by 2030. That would mean adding more than Japan’s total 2003 energy use every two and a half years. Most of the growth in demand is expected to come in today’s developing world, particularly in Asia. China is leading the way. In the last decade it has doubled its oil consumption and the size of its economy, lifting over 100 million people out of extreme poverty in the process. Our new global scenarios2envision a similar range of demand growth as the IEA, driven by fast growing Asian markets (see graph).
The continued reliance on fossil fuels is mainly because other energy sources will not be available on a large enough scale over the next 20 years. For example, public opposition could well continue to limit the development of nuclear and large hydro installations in many parts of the world. Financing and building these installations can take ten years, several times longer than constructing less capital-intensive natural gas-fired power plants.
Rising global energy demand
Supplies from biomass, wind, solar, geothermal or small-scale hydro could grow strongly, but are beginning from a small base today. They currently supply about 1% of global energy demand. Our new scenarios, for example, see these sources growing by about 10% a year with strong government support, despite their higher costs. This would be many times faster than growth in coal, oil or even natural gas. However, the sheer size of the growth expected in global energy demand means these sources would still provide less than 10% of total world energy demand by 2025.
Hydrogen use could also begin to spread if the costs of fuel cells drop substantially and progress is made building regional networks of refuelling stations. All these alternatives could eventually become significant energy sources, but cannot be relied on to meet growing demand over the coming decades.
With domestic oil and natural gas supplies in most major energy-using countries on the decline, more energy will need to cross national borders whether by ship, cross-border pipelines or power grids. OPEC, Russia and central Asia – where most of the world’s remaining big low-cost fields are located – also look poised to increase their share of oil and natural gas production as growth in output elsewhere slows.
Find out more
www.shell.com/sustainabletransport
www.shell.com/energysecurity
1www.iea.org
2www.shell.com/scenarios
Energy security13
Possible solutions and our contribution
Bringing the energy needed to the market at the right time, so disruptions and price spikes are avoided, will require concerted effort and effective partnerships. Government policies will need to support international energy markets, promote emission reductions and energy efficiency. The energy industry will need to continue to develop and apply the necessary technologies, which will require massive investments, an estimated $16 trillion by 2030 according to the IEA. Energy users have the task of using energy responsibly and efficiently.
We see five main priorities for responding to concerns about energy security and recognise that we, and our industry, have an important role to play:
1. Conserving energy
Substantial reductions in energy use are possible, quickly and cost effectively. For example, currently available diesel-powered vehicles and petrol-electric hybrids are up to 30% more fuel efficient than petrol equivalents. We expect their use will increase, especially if diesel’s local emissions – mainly particulates and nitrogen oxides (NOx) – can be further reduced. Shell’s efforts to develop cleaner burning fuels for diesel engines using gas to liquids technology can help (see right). So can Energise™, where we work with industrial companies to reduce their energy use (page 28).
What others say
Professor Zhou Dadi
Director, Energy Research Institute China
“Energy security – providing enough energy for rapid economic growth securely while protecting the environment – has become a key element of the energy strategy for China. Our dependence on imported energy, especially oil, is increasing and will continue to grow. China’s integration into the global economy and oil market means its rapidly growing energy demand is an important factor impacting global energy security and efforts to control greenhouse gases.
The current model in developed countries of high energy use is not a sustainable or desirable option for China. Bringing Chinese energy use per capita to the level of OECD countries would outstrip oil and gas market capacity. To tackle energy security for the world and China, address local pollution and help slow the growth of greenhouse gas emissions, improving energy efficiency must be a main priority.
We urgently need a new model of development with dramatically lower energy consumption and lower pollution. For example, to moderate growing energy use in the transport sector, we need strong promotion of convenient public transport, tighter fuel efficiency standards and advanced vehicles. Fuel switching, efficient appliances, better heating and cooling systems will be needed in the fast growing building sector.
China also needs to diversify its energy sources, including developing nuclear, hydro, natural gas, wind power and other renewables, as well as improving the efficiency and cleanliness of coal use (still more than half our energy in 2020). With more imported energy needed, international co-operation must be stepped up and energy markets further opened.”
Transport fuel from natural gas
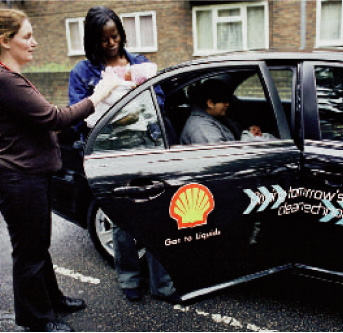
Midwives and their patients are transported in Toyota Avensis cars as part of our GTL trials in London
Converting natural gas into very low sulphur fuel helps cut local vehicle pollution and diversify the supply of transport fuels.
Since 2002, we have been blending Shell’s Natural Gas to Liquids (GTL) Fuel1with conventional diesel in Thailand (Pura Diesel). In 2004, blends were launched in Germany, the Netherlands, Austria (V-Power Diesel) and Greece (Diesel 2004).
Road tests using pure GTL took place in London and Shanghai during 2004 and continue in California and Tokyo. Results consistently show reduced emissions – for example up to 30% lower particulates in standard truck engines.
Customer demand for Shell GTL Fuel is growing. In Malaysia, we operate the world’s only commercial plant of its type producing clean-burning GTL Fuel for use in diesel engines. We are planning to build a second plant, ten times larger, in Qatar.2It will take time for GTL to make a significant contribution to transport fuel demand. By 2011, global production of GTL for diesel engines will be equivalent to one large refinery, producing enough fuel for three to four million passenger vehicles (nearly 1% of the global fleet). By 2015, production could be three to four times higher.
Greenhouse gas emissions from producing and using GTL Fuel are comparable to those from transport fuel from a conventional refinery. We are looking for ways to reduce the energy used to make GTL and store the carbon dioxide (CO2) emitted. We are also exploring the use of similar technology to convert coal (possibly mixed with biomass) to diesel, and to capture and store the CO2 underground.
Find out more
1www.shell.com/gtl
2www.shell.com/qatar
14The Shell Report
2. Boosting international natural gas and oil production
On a global scale, increasing world oil and natural gas production will depend mainly on efforts by OPEC, Russia and central Asia, where the largest remaining low cost fields lie. International energy companies like Shell can help by offering technology, skills and capital (see below). We are doing this in OPEC countries like Saudi Arabia (where we are exploring for natural gas), Nigeria and Qatar, and in Kazakhstan and Russia (see Sakhalin Island pages 18-19), and will be increasing our investment in exploration and production.
3. Maintaining a wide range of oil and natural gas sources
Large investments and new techniques will be needed to slow the decline in production from older oil and natural gas fields. We are doing this, for example, in the North Sea and the Gulf of Mexico. They will also be needed to develop more remote oil and gas fields, for example in deep water. ‘Unconventional’ sources will also play a role, such as the Athabasca Oil Sands region in Canada where we are expanding our activities (see right). Liquefied natural gas (LNG) production will likely double over the next decade helping to ensure a diverse choice of natural gas supplies. We are investing heavily to maintain our position as the largest private supplier of LNG (page 15).
Advanced drilling technology
Improved drilling technology will play an important role in extending the life of older oil and natural gas wells, producing from remote new fields, and reducing environmental impacts. Improvements in seismic mapping – mainly the development of four-dimensional (time lapse) techniques – give us a much more accurate picture of a reservoir. This means we need fewer wells because they can be more accurately positioned.
New techniques applied over the last decade to drill horizontally and at multiple levels also reduce the number of wells needed, increase the options for locating surface equipment, and lower costs. These advances reduce our footprint on the surface, lowering the impact on the environment. They enable us to recover more from existing fields and to develop smaller or thinner reservoirs. They also allow us to recover oil and natural gas from under environmentally sensitive locations without disturbing fauna and flora on the surface.
We see great promise in our ‘MonoDiameter’ drilling technique, which avoids the need for wells to narrow into a funnel as they get deeper. This lowers costs and lets us drill deeper. It also makes drill sites smaller and halves the amount of drill cutting produced as well as the quantity of steel and cement used. We drilled the first such well in 2002, and are now licensing the technology to others.1
Unconventional oil
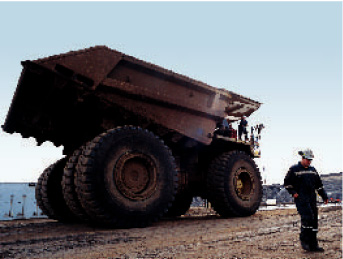
Athabasca Oil Sands Project truck which has the capacity to carry 400 tonnes in one load
‘Unconventional’ oil deposits, such as oil-laden sand and oil shale, can become a significant, secure energy source, provided their environmental impacts can be managed and governments create the right climate for investment.
Canada’s Athabasca oil sands region, where oil sand is either mined in open pits or extracted with steam before being upgraded to make low sulphur petrol, contains more oil than Saudi Arabia. Oil shale deposits are believed to be larger still.
Our first major oil sands mining joint venture, the 155,000 barrels per day Athabasca Oil Sands Project, reached full production in 2004. Production costs for oil sands mining, though still higher than for conventional oil, have been significantly reduced thanks to technology advances.
It takes more energy and more greenhouse gas (GHG) emissions to make petrol from oil sands than from conventional oil. As part of its broader commitment to sustainable development, the project will halve GHG emissions from current production by 2010 so that the combined carbon emissions from making and using oil sands petrol are lower than for the petrol from the imported oil it replaces. An independent external Climate Change Panel of environmental organisations and community representatives is advising and monitoring progress.
In 2004, we announced plans for expansion projects to nearly double oil sands production by 2010. We are also exploring technologies to lower the cost and reduce the environmental impact of extracting usable energy from shale.2
Find out more
1www.shell.com/oil
2www.shell.ca/oilsands
Energy security15
4. Reducing environmental impacts
Spreading the use of natural gas as an alternative to coal will help reduce environmental impacts. Natural gas-fired power plants typically emit no sulphur and less than half the carbon of modern coal plants. Around half our upstream investments until 2010 will be on projects contributing to our natural gas production, often including LNG (see below) or gas to liquids (GTL) plants. Yet more coal will also almost certainly be needed to meet demand, so it will also be critical to make coal use cleaner.
Our patented coal gasification technology can help. It turns coal into gas that can be burnt in a high efficiency gas turbine. The resulting carbon emissions are 20% lower than burning solid coal for power and local air emissions are more than 85% lower. Carbon capture will be critical to reducing the impact of increased fossil fuel use on CO2 levels in the atmosphere. We continue to conduct our own research and to work with seven industry partners and the US Department of Energy in the Carbon Capture Project, to reduce the costs of capturing CO2 from oil and gas combustion and safely store it underground.1The search for oil and natural gas in more remote regions will also increase pressure on ecologically sensitive areas. We are responding with better technology and by implementing our biodiversity standard (page 10).
5. Commercialising new energy sources
Intensified efforts are needed to drive down costs and increase production from renewable sources (like wind, solar and biofuels) and from hydrogen. Shell Renewables and Shell Hydrogen are building commercial businesses in this area.
Growing our Liquefied Natural Gas (LNG) business
When natural gas is cooled (to minus 162° Celsius), it becomes a liquid and shrinks, taking up 600 times less space. In this form, LNG is economical to be shipped long distances in special tankers and then warmed into a gas again where needed (known as regasification).
We have over 40 years experience producing and shipping LNG from Australia, Brunei, Malaysia, Nigeria and Oman, to Asia, Europe and North America, where natural gas demand is growing fast. Through our share in joint ventures we produce enough LNG to supply more than 10 million homes with power – more than any other private company. We aim to double production by 2009, with Sakhalin Energy in Russia the biggest contributor (pages 18-19).
To grow we must earn society’s continued trust in LNG as a responsible way to transport clean burning natural gas. Power made from natural gas transported as LNG typically emits about half as much carbon as coal, even with the extra energy needed for liquefying and shipping. LNG itself is not toxic or stored under pressure and, unlike oil, vaporises if spilled.
Onshore LNG facilities can cause concern to people living close to the plant, mostly about safety. There are also worries that offshore regasification plants might harm sea life and this needs to be considered in the design and location of such facilities. LNG ships and regasification facilities have a very strong safety record over more than 40 years. We will continue to respond to environmental and safety concerns and take great care in designing, locating and operating our LNG ships and plants.2
Beyond hydrocarbons – biofuels, wind, solar and hydrogen

Pat Foody, founder Iogen Energy, turning straw into ‘eco-ethanol’, Canada
Energy security concerns and higher prices could increase interest in locally-produced, low-carbon alternatives like wind and solar power, transport fuels made from plants (biofuels) and eventually hydrogen (which is low-carbon when made from renewable electricity and water).
Biofuels currently provide 1% of global transport fuels but could grow rapidly. Demand in the USA is already rising quickly and demand in Europe is set to grow with new government incentives.
We are the largest blender of transport biofuels. Iogen Energy (partly Shell owned) is demonstrating technology to reduce the costs of biofuel (currently twice that of conventional petrol), reduce the energy needed to convert plants to fuel, and use agriculture wastes to avoid competing for space with food crops. In 2004, Iogen produced the first commercially available biofuel from straw (‘eco-ethanol’) with carbon emissions at least 85% lower than for conventional petrol, and lower than for other commercial biofuels.
We have invested around $700 million since 2000 to build commercial businesses in wind and solar power, and hydrogen.3In four years we have become one of the world’s largest wind power developers and continue to work on large-scale projects like the 1,000 megawatt London Array, as part of a consortium which plans to build an offshore wind farm that would provide the equivalent of 25% of London’s electricity.
We are investing in thin film solar technology and reducing costs of today’s silicon-based panels through automation, higher panel conversion efficiencies, and use in large scale (5-20 megawatt) power plant projects. We are the largest retailer of rural solar home systems in the developing world.
We continue to invest in hydrogen technology, to build pilot hydrogen filling stations, most recently in Washington, DC, and to promote the creation of regional hydrogen networks through public-private partnerships.
Find out more
1www.co2captureproject.com
2www.shell.com/lng
3www.shell.com/newenergies
16The Shell Report
Location reports
How we are responding at locations identified as having environmental and social concerns that significantly affect our reputation and our business performance.
Nigeria
What is it?
The country
| • | | OPEC member producing approximately 3% of the world’s oil |
| |
| • | | 80% of government revenues and 95% of export earnings from oil and gas |
| |
| | | The Shell Petroleum Development Company of Nigeria Ltd (SPDC) |
| |
| • | | Operator of Nigeria’s largest oil and gas joint venture (Nigerian National Petroleum Company 55%, Shell 30%, Total 10% and Agip 5%) |
| |
| • | | Produced on average one million barrels per day of oil and 215,000 barrels of oil equivalent gas per day (43% and 61% of national total) |
| |
| • | | 5,000 staff, 95% Nigerian and 66% from the Niger Delta, and 7,000 contract staff |
| |
| • | | Paid approximately $3.3 billion in taxes and royalties in 2004 to the Nigerian government |
| |
| | | Other Shell interests include |
| |
| • | | Shell Nigeria Exploration & Production Company developing the offshore Bonga field (production starts 2005) |
| |
| • | | Non-operating partner (25.6%) in Nigeria LNG Company producing 8% of the world’s LNG in 2004 |


Basil Omiyi
First Nigerian Managing Director of The Shell Petroleum
Development Company of Nigeria Ltd (SPDC)
I am from the Niger Delta, Nigeria’s oil and gas producing region, and understand the frustrations of the people who live here. Poverty remains the overriding problem, made worse by tribal conflicts, corruption, crime and youth unemployment. I also understand that the success of my company, SPDC, is closely tied to peace and economic development in the Delta. Our communities have seen relatively little benefit from the oil and gas produced here for almost 50 years. The challenge is enormous: bringing law and order, jobs, basic services and education to more than 27 million people, in an area almost the size of England. Our government recognises it must take the lead and work together with Delta communities. We are deeply committed to help.
Environmental impacts
We must improve our environmental performance and make up for past mistakes, including cleaning up oil spills, preventing new ones and ending continuous flaring of gas.
In 2004, we cleaned up 199 sites, exceeding our target of 100. We are on track to restore all spill sites that have been identified for remediation by the end of 2006, provided communities allow us access. We have reduced the number of controllable spills (79 in 2004) by more than half and their volumes by over 95% since 2000 (see graph). Unfortunately, another 157 spills were caused by sabotage, mostly by communities seeking access payments and clean-up jobs. Poverty lies behind this practice. Ending it requires economic development and will take time. Meanwhile, we are talking to the communities about the dangers. We have increased pipeline security, buried or caged some of the most vulnerable sections and increased the hiring of surveillance teams from the community.
We continue working to come as close as we can to meeting the government’s and Shell’s target to end continuous flaring of associated gas by 2008. This requires gathering and bringing to market gas from more than 1,000 oil wells. By the end of 2004, the joint venture had invested $2 billion and was gathering 33% of its associated gas. It expects to spend another $1.85 billion to capture the rest from increasingly remote or smaller wells. The effort is behind schedule because of past under-funding by our government partner and delays by SPDC in implementing projects. That means we now expect to stop continuous flaring during 2009, as we complete construction of the final gas gathering facilities. We intend to shut in wells during 2008 where we cannot find permanent solutions for the associated gas (currently expected to be 17 low production fields). The SPDC ‘People and the Environment’ report, available on the web, describes the programme to end continuous flaring in more detail.
SPDC oil spills
Find out more
www.shell.com/nigeria
Location reports17
Peace and security
In 2004, the government increased security patrols in the Delta to deal with inter-tribal violence and combat large-scale oil theft by international armed gangs (estimated at 40-60 thousand barrels per day). We helped the security services by alerting them to pipeline tapping and provided logistical support when asked.
We increased work with local communities and government forces to stop villagers occupying our facilities and to resolve incidents peacefully. Government forces guard national strategic sites, including key SPDC facilities, to deter incidents. Elsewhere, if demonstrations were peaceful, we shut down and negotiated, requesting government protection only if employees were in danger or facilities vandalised (including at Rig 75, where 17 people were wounded). Community incidents increased by 10% to 176 compared with 2003.
We welcomed the government’s decision to develop a peace and security strategy for the Delta, which builds on and supersedes the multi-stakeholder initiative we launched in 2003.
Development holds the key
Government revenues from our operations are our biggest contribution to development. At an oil price of $30, for example, our operations generate more than $24 a barrel for the government in taxes, royalties and its share in joint venture production. SPDC earns $1.25. We also encourage the use of Nigerian contractors and suppliers, by requiring foreign bidders to work with qualified Nigerian contractors not just agents, by training contractor staff and by supporting proposed laws mandating the use of local firms. In 2004, approximately $727 million in contracts were awarded to Nigerian companies, 20% to companies from the Delta.
In 2004, the joint venture contributed $68.9 million to the government’s Niger Delta Development Commission (NDDC), set up to co-ordinate development in the region. We also began implementing our Sustainable Community Development strategy, rolling out our 13 ‘big rules’ to make our community projects more sustainable and ensure we do what we promise. We are improving project co-ordination and financial control, working to end the use of improper cash payments to communities, increasing community participation in designing and running projects, and partnering with international development experts. In 2004, we signed a partnership with the United Nations Development Programme to improve conflict management and peace-building initiatives, to support agriculture enterprises and to address HIV/AIDS issues. Our partnerships with USAID and Africare moved forward. Spending on community development projects dropped to $25 million, reflecting our increased contribution to the NDDC and our emphasis on reducing waste and doing fewer projects better.
Combating corruption
Corruption is a problem at many levels in Nigeria. Greater transparency helps. We continued to support the Extractive Industries Transparency Initiative (page 26) and welcomed the Nigerian government’s decision to publish all transfers to state and local government budgets in 2004. We have published our payments to the government since 2002. We also stepped up our anti-corruption campaign for staff, contractors and suppliers. Increased use of our whistle-blowing facility led to investigations that resulted in the firing of seven staff and the dismissal of 19 contractors. In 2004, we began publishing each proven case of corruption on our internal website.

What others say
Nemi Ogbanga
Director
Micro Projects Programme
External performance assessment
“Nine of us were invited by SPDC this year to assess their community projects completed in 2004. We visited SPDC in November to carry out initial preparations prior to the field visits and selected the projects to verify. Of the 141 completed projects we chose 73 projects, which we later visited in February 2005. We assessed these for functionality (delivered and operating as designed), success (rate of use by the community), level of ownership by the community beneficiaries and sustainability. By our assessment, SPDC achieved 74% functionality and success, 79% ownership by programme/project beneficiaries and 65% sustainability of projects. In our view, this is a commendable performance. However, we believe that SPDC can do more by addressing specific shortcomings that were identified in the quality and delivery of some projects. It can also improve sustainability by focusing on high impact economic empowerment programmes, rather than on infrastructure. We feel that the Sustainable Community Development approach can help in this regard when it becomes fully operational.”
18The Shell Report
Sakhalin
What is it?
| • | | Sakhalin II, an oil and gas production joint venture operated by Sakhalin Energy (Shell 55%, Mitsui 25%, Mitsubishi 20%) on Russia’s Sakhalin Island: |
| |
| – | | Phase 1 has produced oil since 1999 from the Molikpaq platform |
| |
| – | | Phase 2 is a multi-billion dollar investment including two further offshore platforms, 1,800km of pipelines and Russia’s first LNG plant (production is planned to start in 2007) |
| |
| • | | Shell’s biggest new upstream project, with peak gas production of 310,000 barrels of oil equivalent per day |
| |
| • | | Benefits to governments in Russia estimated at up to $45 billion cumulatively over the project life (assuming average $24 per barrel oil price) |
| |
| • | | Up to 12,000 jobs during construction and 2,400 permanent jobs |
| |
| • | | $2.1 billion paid to Russian contractors to date, expected to rise to well over $10 billion over the project’s life |
| |
| • | | Population of Sakhalin Island is 550,000 including 3,300 indigenous people |
| |
| | |  |

Ian Craig
Chief Executive Officer of Sakhalin
Energy Investment Company Ltd
Demand for clean-burning natural gas in Asia-Pacific and North America is expected to more than double by 2016. The Sakhalin II venture will help meet this demand, increase security of supply and bring significant value to Russia.
For Shell (our major shareholder), Sakhalin II is its largest new exploration and production interest and important to achieve its ‘more upstream’ strategy.
The project’s success depends on many things, including how well we work with others to generate benefits for the local community and respond to concerns about our environmental and social impacts. Oil and gas development is an opportunity to revitalise the economy and to help reduce unemployment and poverty on the island. But the project is located in a seismically active region with environmentally sensitive areas including the summer habitat of about 100 critically endangered western gray whales. The main pipeline route will cross more than 1,000 rivers and streams, sea fish spawning areas and reindeer grazing pastures. The influx of workers, especially during construction, puts a strain on local infrastructure and risks increasing crime and disease. The way of life of the island’s indigenous peoples must also be protected.
Western gray whales
We take concerns about the western gray whales very seriously and remain committed to reducing the project’s impact on them. During detailed pipeline route surveys begun in 2003, we discovered that the noise impact on the whales’ feeding area during construction could be greater than originally anticipated. In April 2004, we deferred laying the offshore pipeline to allow further studies to take place. As a result, we will miss two construction seasons.
Sakhalin Energy asked the World Conservation Union (IUCN) to convene an international panel of whale experts to assess our impact on the whales and how that impact could be mitigated. The independence of the panel was critical. IUCN determined the scope and membership of the panel, after consulting with Sakhalin Energy, potential lenders and other stakeholders.
The panel’s report, published in mid-February 2005, indicated that all oil and gas activity carries risks for the whale population. It highlighted the need to actively manage and reduce these risks, which include noise, oil spills, collisions with ships and physical disturbance. The report, details of the panel’s membership and the terms of reference are available on IUCN’s website.1
Sakhalin Energy has taken the scientists’ advice seriously. We have decided to move the pipelines linking the two offshore production platforms to the shore 20km south of the original route and away from the whales’ key feeding area. Several routes were considered and this one maximises the distance between our activities and the whales. We consulted with the indigenous reindeer herders to help select the best route onshore, respecting their need to limit the impact on their pastures. To reduce other environmental risks on wetlands, bird nesting sites and lagoons, we will be doing as much sensitive onshore work as we can during the winter season. Russian government agencies will be asked to approve the change.
Find out more
www.sakhalinenergy.com
1www.iucn.org
Location reports19
Sakhalin Energy also reconfirmed the location of the new production platform, which is 7km from the whales’ feeding area. The current location minimises sub-surface and well blow-out risks. We are confident our mitigation measures can offset the potential impact on the whale population.
Additional measures identified by the panel to reduce the risk to the whales have already been adopted. These include an enhanced oil spill prevention and leak detection programme, rapid response plans in the event of a spill (particularly in severe storms or icy conditions), shipping speed limits and closing certain areas to vessels. We are pleased that the panel will continue its role to help us ensure that these measures are effective.
Social challenges
Some of Sakhalin’s 3,300 indigenous people have a traditional way of life based on fishing, hunting and reindeer herding that could be damaged by the oil and gas developments on the island. We continue to engage with indigenous communities, particularly those directly affected by our operations. We participate in a forum to understand and address their concerns with representatives from local government, business and the indigenous people.
In addition, some residents of the town of Korsakov, 13km from Sakhalin Energy’s LNG plant, maintain that the negative impacts on the community outweigh the benefits of employment and infrastructure improvements. Updates on these challenges and the approach taken by the company can be found on our website.
Oil spill in Kholmsk harbour
In September 2004, a dredger on contract to Sakhalin Energy ran aground in a storm on the west side of the island, far from the whale feeding ground. Fuel oil was spilt and was cleaned up as soon as conditions allowed. The dredger itself could not be removed because of bad weather, but all remaining fuel was off-loaded. We continue to work with the vessel’s operator and salvage team to ensure its complete removal.
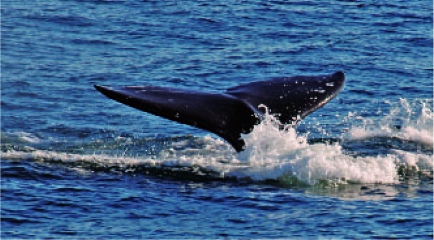
One of the critically endangered western gray whales at Sakhalin

What others say
Dr Randall Reeves
Chair of the Independent Scientific
Review Panel
External performance assessment
“An Independent Scientific Review Panel was convened by the World Conservation Union (IUCN) through a contractual agreement with Sakhalin Energy Investment Company (SEIC) to evaluate the knowledge on the critically endangered western gray whale population and SEIC’s programmes and policies for mitigating the potential impact on it. SEIC provided full financial support whilst accepting IUCN’s terms that selection of the Panel, conduct of the review and production of the report would be completely independent. The Panel consisted of 14 scientists from Russia, Europe and North America, acting in their individual capacities. They met four times, including a field visit to the project area on Sakhalin Island.
Whilst acknowledging the substantial resources invested by SEIC in gray whale research, the Panel concluded that in several important respects SEIC’s assessment of risks and proposed mitigation and monitoring measures fall short of a precautionary standard. The Panel advocated a more cautious approach by SEIC and other developers in the region to compensate for the known risks and uncertainties surrounding potential environmental effects of oil and gas development. They emphasised the importance of protecting the whales (from ship strikes and loud noise) and their vital feeding habitat (from oil contamination and smothering by suspended sediment). The changeover from tankers to pipelines for transporting oil from the Molikpaq Platform will eliminate the need for tankers to transit near the feeding grounds, thus reducing the risks of oil spills and ship-whale collisions. Another precautionary measure, recently announced by SEIC, is selection of the pipeline route farthest away from the whales’ feeding ground.”
20The Shell Report
Rebuilding trust
We have an interest in more than 70 major downstream facilities. We lost the trust of people living close to a few of them. We are working hard to improve our environmental performance and to find new ways of working with the community to rebuild relationships.
Norco
What is it?
| • | | Crude oil refinery and chemical plant since 1929 in an industrial area of Louisiana which includes another refinery and six other chemical plants |
| |
| • | | Chemical plant owned and operated by Shell |
| |
| • | | Refinery, formerly owned by Shell, since 1998 owned and operated by Motiva Enterprises, a 50:50 Shell-Saudi Refining Inc joint venture |
| |
| • | | Refinery produces 27 million litres of petrol per day, enough to fill 443,000 cars |
| |
| • | | Site employs over 1,500 people including 250 contractors |
| |
| • | | Site contributes $120 million in wages, $115 million in contract services, and more than $31 million in taxes each year |
| |
| | | |

Carol Triebel
Site Manager at Shell Chemical Norco
People living near our chemical plant and the adjacent Motiva refinery in Norco were dissatisfied with the way we responded to their concerns about safety and air pollution. At the refinery and chemical plant, we have worked hard with the Norco community to put things right and I am really pleased we are regaining our neighbours’ trust.
We have focused on two areas to improve our relationship with the community. First, we invested $133 million to upgrade the site. By end 2003 (latest reporting year), this helped cut our local air emissions by 40% compared with 1998. Second, we began to work more closely with local people. An air-monitoring group was set up in 2002, with two technical experts and 20 representatives from the community, state government and the site, to measure air quality around the facility. Samples are taken every six days, following US Environmental Protection Agency guidelines. Continuous sampling is used if emissions exceed set levels.
The group chose the locations to monitor and the substances to measure. It also selected independent consultants to analyse, assess and publish the results. Sulphur is measured separately by the state government.
In 2004, the consultants concluded that, for substances where comparable data is available, pollution levels in Norco are similar to those in major US cities. An independent study showed local cancer and mortality rates are lower than or similar to Louisiana averages.
There is no room for complacency. Additional upgrades of $411 million by 2007 should further improve our environmental performance. We have established a $5 million community-managed foundation for local economic projects.

What others say
Margie Eugene Richard
Founder of Concerned
Citizens of Norco
External performance assessment
“The door for communication which was once closed is now open. The right people have been at the table listening to the community’s concerns and needs. Trust is now being built with members of the Diamond area and the community as a whole. Commitments that they have made are being met. Some [commitments] have been immediate and others are long range.
The air monitoring programme at Norco was designed with local community members and technical experts. Ambient air monitoring is now in the community. The air monitoring data has also been made available to the public on an external website.
Shell Norco has made significant operational improvements to further reduce emissions. Community outreach and input has also improved significantly in community education and economic development. The plant has communicated these plans through various community activities with an open door to people from every area. The commitment to involve all residents has been kept. Communications must always be kept simple so that the people in the community can understand and challenge if necessary.
Opponents of industry must come together with the community to ensure changes are taking place. We will never get anywhere by attacking one another. Disagreement is okay because the results can always solve existing problems for industry and fenceline residents. The past provides knowledge and opportunity to improve the future for operating cleaner and smarter in order to have sustainable development which can lead to protection and preservation of the environment.
What happened in Norco between industry and fenceline people and the community as a whole could be a role model for all other facilities because together we can make a difference.”
Find out more
www.shellus.com/norco
www.motivaenterprises.com
Location reports21
Port Arthur
What is it?
| • | | Crude oil refinery since 1903 |
| |
| • | | A former Texaco facility, owned and operated by Motiva Enterprises, a 50:50 Shell-Saudi Refining Inc joint venture |
| |
| • | | Located alongside four other chemical plants and two other refineries on the Gulf of Mexico |
| |
| • | | Produces 19 million litres of petrol each day, enough to fill 311,000 cars |
| |
| • | | Employs 860 people including 600 contractors |
| |
| • | | Contributes $150 million in wages and contract services, and more than $30 million in taxes each year |

Tom Purves
Manager Motiva Port Arthur Refinery
Residents living near the Port Arthur Refinery say they are most concerned about education, unemployment and crime. They are also worried about air pollution and are not convinced the local petrochemicals industry is serious about its commitment to improve air quality. In 2004, we continued to respond to these concerns.
A $30 million upgrade to reduce flaring was completed in late 2003. As a result, in 2004 we flared 70% less often and nearly 90% fewer hours than in 2003, leading to significantly less pollution and nuisance from odours, noise and light. Air emissions from the refinery as reported to the state government have dropped 33% since 1999. We expect further improvements as we continue to improve plant efficiency.
The need now is to involve our neighbours more in what we do. Lawsuits filed against Motiva and other companies alleging environmental negligence have made this more difficult. However, with one lawsuit withdrawn and a second settled in early 2005, co-operation should now be easier. A community advisory panel of 18 residents meets quarterly to review the air emission data supplied by the government’s independent air monitoring programme and to assess our future improvement plans. Our five community liaison officers are active locally, seeking people’s views and providing a 24-hour response to complaints and questions.
We realise that charitable donations, while helpful, do not address the causes of social problems. Dealing with unemployment, crime and education needs the co-operation of the whole community – business and residents – and takes time. Our Citizens’ Action Committee of local and refinery volunteers and the Port Arthur Industrial Group, work with others to develop and implement plans to address these problems.

What others say
Gladdie Fowler
Chair of Motiva’s Citizens’
Action Committee
External performance assessment
“I am a product of Port Arthur who returned to the community to help. I am an elementary school principal who tutors and councils federal parolees and have a vested interest in the citizens of Port Arthur.
I became involved with Motiva when I decided to serve on Motiva’s Citizens’ Action Committee. Originally serving on the education and youth subcommittees, I became general chair and work extremely hard empowering the community to become actively involved in all of the committee’s projects. The committee represents a very diverse group of the community, including housewives, a clinical psychologist, teachers, principals, social workers and retirees. They represent a cross section of race and backgrounds.
After several meetings, the community was invited to a Motiva meeting in Port Arthur. From that meeting, five needs were identified and are being addressed. These five areas were health, environment, jobs, education and children/adolescent issues. Citizens were asked to sign up for the committee and Mr Michael Lightfoot, Sustainable Development Coordinator, was assigned to facilitate the workings of this group. The sleeves were then rolled up and the work began.
The Citizens’ Action Committee is effectively working in the community. Some of the activities already sponsored that address the needs of the community were a Health Fair, a Community Resource Day, and mentoring of a low-income family for a year to help them become more self-sufficient. We are currently working to establish a ‘Motiva Youth Training Academy’.
The associated challenges at the present are to increase community involvement by getting more citizens on the committee, raise awareness in the community about what is being done for the environment and to progress the academy.”
Find out more
www.portarthurrefinery.com
www.motivaenterprises.com
22The Shell Report
Pandacan
What is it?
| • | | Main fuels, lubricants and chemicals distribution centre for the Philippines since 1914 |
| |
| • | | 30 hectare site in what has become a densely populated part of Manila |
| |
| • | | Operated by Pandacan Depots Services, an equal share joint venture between Shell, Caltex and Petron |
| |
| • | | Supplies approximately 50% of the country’s fuel, 90% of its lubricants and 25% of its chemicals requirements |
| |
| • | | Employs 69 joint venture staff on-site |
| |
| | |  |

Sebastian Quiniones
Vice President Distribution for
Shell Philippines Petroleum Corporation
Following the terrorist attacks in the USA on September 11, 2001 the government of the Philippines raised security and safety concerns about having a large fuel depot here in central Manila. However, moving the Pandacan depot would have had a major impact on the supply and cost of fuel, as well as its safe and efficient delivery.
In 2002, we and the other oil companies using the site were legally allowed to continue operating and agreed with Manila’s mayor to reduce the depot’s size and create a 10-50 metres wide buffer zone between the depot and residential areas. The companies have since removed 26 of the 79 storage tanks, and a further two are currently being dismantled.
To ensure the buffer zone was safe for public use, we appointed an international environmental consultancy to test and clean up the land. At our request, the University of the Philippines also convened an independent health panel of local experts to challenge and review this programme. The mayor of Manila opened the 6,000m2area as a recreational park in June 2004.
We extended the programme to test soil and groundwater in neighbouring communities for contamination and check for any health risk. The conclusion of the environmental consultants, endorsed by the independent health panel, was that the very low levels of contamination found do not adversely affect the community’s health. The local community was involved throughout the process, providing valuable input.
The health panel has asked us to assess the impacts of air pollution with their help. A long-term air-monitoring programme is being agreed with them and is a priority for 2005.

What others say
Professor Elma Torres
Chair of the Pandacan Health Panel
External performance assessment
“The Pandacan Health Panel is an independent team of health experts selected and organised by the Institute of Health Policy and Development Studies of the National Institute of Health at the University of the Philippines in Manila. Our purpose is to review and comment on the environmental work and health risk assessment done by Shell Philippines’ third party consultants in the Environmental Site Assessment, including the remediation and development of the buffer zone.
Our team of five comprises specialists in environmental health assessments, health policy, toxicology and biostatistics. Technical representatives from the Department of Environment and Natural Resources and the Department of Health also joined us as observers on behalf of their respective government agencies.
Shell requested we use our expertise and local regulatory experience to ensure the right process and provide transparency in the conduct of this project. This project is the first of its kind in the Philippines and we also see our participation in this project as a source of learning for others. Information and best practices in environmental remediation processes will be used to influence policy-makers in establishing local standards.
We also used new information from the multinational consultants we met while conducting our review and validation. We dealt with this undertaking effectively and were able to balance the inputs and interests of each stakeholder for the common good of all.
Overall, the health panel commends Shell Philippines’ effective performance in upholding its commitment to sustainable development and public health protection, not only in the conduct of its business operations, but also in the manner by which it engages its various stakeholders throughout the scale-down project.”
Find out more
www.shell.com/pandacan
Location reports23
SAPREF
What is it?
| • | | Africa’s largest crude oil refinery and sea terminal managing 80% of South Africa’s crude oil imports |
| |
| • | | Owned and operated by SAPREF, a 50:50 joint venture between Shell and BP |
| |
| • | | Located in an industrial area of south Durban which includes the harbour, airport and one other refinery |
| |
| • | | Produces 7.4 million litres of petrol per day, 25% of South Africa’s needs |
| |
| • | | Undergoing a $100 million upgrade to produce cleaner fuels from 2006 |
| |
| • | | Employs 1,100 people, including 500 contract workers |
| |
| | |  |

Wayne Pearce
Managing Director of SAPREF
since September 2004
In 2004, SAPREF’s efforts to improve environmental performance and work more closely with the community continued. However, we still have much to do. We were guided by the 2003 community survey that showed our neighbours want us to communicate better, hire more local people and improve our environmental performance.
Local air quality, monitored by the government-led Multi Point Plan, improved in 2004. We met our self-imposed limit for sulphur dioxide emissions – a reduction of 60% since 1997 – and are investing to reduce volatile organic compound emissions by 20% by 2006.
Compared with 2003, we had 35% fewer spills and flared 9% less gas. But our progress was frustrated, in part by a significant spill at our offshore ship loading point and by a large flaring incident caused by an external power failure.
We encouraged our contractors to hire local residents, who now make up 60% of the 500 contractor staff working on upgrades to our site. In 2004, we spent $41 million with suppliers who meet the requirements of the South African black empowerment programme.
It has been difficult to find a group that represents the many different views of the community but in 2004, we re-established a community liaison forum and began work to agree our social and environmental priorities for 2005. This will include making progress on our commitment to invest $50-70 million by 2009 to comply with all the recommendations made by the independent review of the pipelines linking the refinery to the harbour following a major leak in 2001. We will report monthly on our performance.

What others say
Siva Chetty
Programme Manager of the
South Durban Multi Point Plan
External performance assessment
“The Multi Point Plan for the South Durban Basin was initiated by the democratic government of South Africa in November 2000. The objective of the plan was to set up the technical systems and institutional arrangements to oversee the reduction in air pollution in the local industrial area. The Multi Point Plan called for phasing out the use of dirty fuels, implementation of measurement systems, reduction in toxic pollutants and industry to co-fund the plan. SAPREF played an important role in this as one of several stakeholders.
SAPREF has contributed $460,000 towards the Multi Point Plan, approximately one-third of the total industry contribution. The project value for the Multi Point Plan is $5 million. The refinery invested in plant upgrades in 2002 which resulted in sulphur dioxide emissions reductions of 17 tons per day. Currently the eThekwini Health Department is engaged in a process with SAPREF to develop a new permit detailing further pollution reduction objectives. In preparation for the fuel reformulation strategy to phase out lead in fuel by 2006 in South Africa, SAPREF has invested over $100 million in upgrade projects.
The Multi Point Plan is a success story in South Africa for its ability to work with all stakeholders, government, community and industry, in solving a common problem. This initiative has overseen the overall reduction in sulphur dioxide emissions by 40% over the last few years. Decisive leadership and support from industry like SAPREF has laid the basis for broader scale industry co-operation with the plan and a commitment in action to put in pollution reduction strategies and plans. Through these efforts we are able to transform the South Durban Basin into a place to live and work.”
Find out more
www.sapref.com
24The Shell Report
Performance data
Here we report on our financial, social and environmental performance in 2004, including the 12 key performance indicators developed jointly with external stakeholders.
Financial
Key performance indicator
From 1995 to 2004 we outperformed national indices, although our performance relative to competitors weakened. In this period, dividends, an important component of shareholder return, grew faster than local inflation.
Net income
We achieved the highest net income in our history, $18.2 billion. This was 48% higher than in 2003, as a result of higher oil and natural gas prices, higher LNG volumes and prices, as well as higher refining margins and trading profits in Oil Products, and higher volumes and margins in Chemicals.
Oil and natural gas production
We produced approximately 3% less oil and natural gas than in 2003 – nearly 3.8 million barrels of oil equivalent (boe) a day. That is approximately 3% of the world’s oil and 3.5% of the world’s natural gas. We expect to produce between 3.5-3.8 million boe a day in 2005-2006 and between 3.8-4.0 million boe a day by 2009.
Replacing reserves
At the end of 2004, our proved developed and undeveloped reserves (excluding proved reserves of associated companies) were equivalent to 8.4 years of 2004 production. Our current level of reserves replacement is clearly a concern and reflects the exploration strategy and low levels of investment in the late 1990s. We have since refocused our exploration efforts and increased investment in finding and developing new oil and natural gas. Our goal is to have an average reserves replacement ratio of at least 100% over the period of 2004 to 2008.
Total capital invested
We invested $14.9 billion, up from $14.3 billion in 2003, of which more than $10 billion was in our upstream business.
Divestment programme
We sold assets for $7.6 billion, up from $4.5 billion in 2003, as we continued to reshape our portfolio to focus on faster growing and more profitable activities.
Find out more
www.shell.com/annualreport
Social – living by our business principles
Competition
We are committed to competing fairly and respecting all applicable competition laws. In 2004, Showa-Shell Sekiyu K.K. of Japan was fined ¥35 million ($0.3 million) for alleged anti-competitive tendering practices when selling jet fuel to the Japanese Air Force. The case is under appeal. In the Ivory Coast, we appealed two decisions where Shell had been found guilty of anti-competitive behaviour. One case alleged price fixing at the pump and the second abusing a dominant position in the retail fuel market by implementing a fuel transport policy that effectively blocked dealers from transporting fuel themselves. The appeals resulted in a reduction of the fines in both cases.
Contracts
We cancelled 64 contracts in 2004 due in part to concerns about the contractors’ ability or willingness to operate in line with our Business Principles and Group policies (most often our Health, Safety and Environment policy). This is up from 49 in 2003. Brazil and the USA had the most contracts cancelled.
Political payments
We continued our ban on making political payments. In 2004, an administrative error resulted in one political payment being made. This was in the USA, when an invoice to an industry association which contributed 10% to a political action committee was paid by mistake.
Child labour
Our companies have procedures to prevent the use of child labour in their operations in 83% of the countries where we operate, a rise from 78% in 2003. Screening of those with whom we do business has also increased. Shell companies in 61% of countries now check that contractors have procedures in place, up from 57% in 2003, and 53% check on suppliers, up from 50%.
Security
Our companies in 13 countries, including Nigeria (page 17) experienced significant security incidents in 2004, including armed robberies, kidnappings and vandalism. This was down from 16 in 2003. Six contractors at Shell operated facilities, five of them in Nigeria, lost their lives in 2004 because of security incidents. In 18% of the countries where we operate we needed to have armed security, down slightly from 22% in 2003.
We reorganised our security department to make it more effective in dealing with terrorism and organised crime.1
Key performance indicator
Integrity
Our policy on corruption is simple. We do not make or accept bribes or facilitation payments. We do not tolerate illegal acts, including acts of fraud.2
One way we track our success in living up to this policy is by asking staff confidentially in the Shell People Survey whether their part of Shell is dealing with the outside world with integrity. In 2004, 5% said it was not versus 79% who said it was, up from 78% in 2002, despite a change in the survey methodology that introduced a tougher rating scale and lowered the 2004 score by some 5%. In 2004, 82% of staff believed their part of the organisation does not tolerate bribery or other breaches of our Business Principles, up from 78% in 2002. However, 5% of staff believe their part of the organisation does tolerate these practices.
In 2004, we continued to improve detection of bribery, facilitation payments and other incidents of fraud. Our companies in 114 countries now offer staff hotlines, whistle-blowing schemes and other confidential ways to report possible incidents, up from 109 in 2003. Staff in 106 countries participated in awareness sessions about the use of intermediaries. In more than 100 countries, our companies have formal procedures to prevent facilitation payments by staff, contractors and suppliers, up from 90 in 2003.
Getting reliable data in this area remains difficult. In the past, we published the incidence of bribery based on our annual survey of the executives responsible for our country operations. In 2004, we provide the number of proven incidents of bribery and fraud gathered by our internal audit system and reported to the Group Audit Committee – 16 bribery incidents and 123 fraud cases were reported, resulting in the dismissal or resignation of 203 staff and contractors. We will continue to improve our detection and data quality.
What others say
“I felt joyful when I read Shell is very concerned with human rights and equal opportunities. Unfortunately my experience with Shell is not coincidental with those business principles.”
Tell Shell, El Salvador
What others say
“Shell’s behaviour goes against everything it says its doing – its recent report talks of ‘sustainable development’ and providing the world’s energy needs in ‘cleaner and more socially responsible ways’. This sounds like so much green wash when you hear the anger and frustration of local communities affected by pollution from the plants with the consequence adverse affect on people’s health.”
Tell Shell
Find out more
1www.shell.com/security
2www.shell.com/integrity
26The Shell Report
Social – our impacts on society
Social performance
Our social performance is about how well we provide benefits for the communities and societies where we operate and reduce disruptive social impacts. In 2004, our businesses continued implementing processes to manage social performance. These include social performance reviews to identify key stakeholders and assess responses to our main social impacts, and social performance plans to determine the steps needed to improve.
Our Oil Products business met its 2004 target to have social performance plans in place at the 28 major facilities it operates near communities. Gas & Power will do the same in 2005 at the facilities it operates. The joint ventures where it does not have operational control are encouraged to develop social performance plans. Exploration & Production will put social performance plans in place in 2005 at operations where social impacts could be high. Plans have been in place since 2003 at our nine major Chemicals facilities, four of which surveyed community opinions in 2004 to measure social performance.
Social investment
We spent $106 million on social investment programmes in 2004, up from $102 million in 2003. The largest programmes were in Nigeria (pages 16-17) and the USA.
Royalties and taxes
Taxes and royalties represent our biggest economic contribution to the societies where we operate. In 2004, we collected more than $72 billion in sales taxes and excise duties and paid over $15 billion in corporate taxes and $2 billion in royalties to the governments of the countries where we operated.
Local spend and supply chain
Supporting local suppliers and contractors is one of the most effective ways for us to support development and generate local benefits. Shell companies actively promoted the use of local suppliers and contractors in nearly 90% of the developing countries where we operate.
We spent an estimated $6.3 billion on goods and services from locally-owned companies in the developing world in 2004, up from $5.2 billion in 2003. This accounted for almost half our total spend in those countries.
Key performance indicator
In 2004, we maintained our lead in overall reputation with the general public over our main international competitors, according to the 2004 Reputation Tracker survey of 13 major Shell markets. The reserves restatements and related issues did not significantly affect attitudes amongst the general public in these markets, except the Netherlands, where our reputation rating declined. However, these issues have significantly affected our reputation with the financial community, media, non-governmental organisations and government, particularly in the Netherlands and the UK. Improving our reputation with these groups depends primarily on improving our underlying business performance and demonstrating our integrity and transparency in practice.
Revenue transparency
Oil revenues can transform countries by promoting economic growth and funding social services. However, managed badly, they can stimulate corruption and conflict. This is why we continue our strong support for initiatives that make public oil and natural gas revenues paid and received, such as the UK Government’s Extractive Industries Transparency Initiative.1We also publish the payments we make to the Nigerian government (pages 16-17) and to the Russian government for our project on Sakhalin Island.2
Health management standards
We met our target to fully implement our Minimum Health Management Standards. Our internal assurance to test the effectiveness of the standards is well advanced.3
HIV/AIDS
We implemented our guidelines on HIV/AIDS in five pilot countries – Gabon, the Ivory Coast, Kenya, Nigeria and South Africa. The guidelines call for Shell companies to provide counselling and to supply free anti-retroviral drugs for infected employees and their dependants. We will continue to roll out a pilot approach for further implementation of our guidelines in high impact locations, focusing on Africa, Asia and selected major construction projects.4
Find out more
www.shell.com/shellreport/data (for complete data tables)
1www.shell.com/paymentstogovernments
2www.sakhalinenergy.com
3www.shell.com/healthstandard
4www.shell.com/hivaids
Performance data27
Social – our people
Key performance indicator
Zero fatalities is always our goal. We are deeply saddened that two employees and 35 contractors lost their lives at work in 2004. Deaths from road accidents have dropped steadily, thanks mainly to our proactive driver safety programme. As a result the Fatal Accident Rate is our lowest ever reported. However, any fatalities at our operations are unacceptable. Most of these fatalities continued to occur in our Exploration & Production business. Contractor safety in Nigeria and Russia pose a particular challenge. Improving safety performance is a top priority for 2005 and a particularly pressing one as we increase investment and the scale of our construction projects upstream. We are continuing to roll out our ‘Hearts and Minds’ programme and in 2004 launched a multi-year effort to increase Health, Safety and Environment (HSE) competence.
The reliability of our Fatal Accident Rate data is subject to uncertainty because of weaknesses in gathering and checking the hours worked by contractors, though these are unlikely to affect the year-to-year trend.
Key performance indicator
Target missed despite major improvement in our US lubricants business, where TRCF has improved by nearly half since we acquired the business in 2002. The rise in injuries came mainly from big upstream projects under construction such as Bonga (Nigeria), Hazira (India) and Sakhalin (Russia). We have raised our 2005 target to reflect the higher risks of projects during construction. TRCF will be given specific focus in our 2005 scorecard, as one way to reflect the priority being put on improving our safety performance.
These data, which rely on people to report incidents, are subject to inherent limitations (see Basis of reporting page 31). The reliability of the TRCF data is also affected by uncertainty in the contractors’ hours data (see Fatal Accident Rate above), and by potentially incomplete reporting of safety incidents as a result of weaknesses in some controls, particularly in distribution activities in Oil Products and with upstream contractors on major construction projects. We will address these uncertainties in 2005.
Key performance indicator
Diversity and inclusiveness (D&I)
In 2004, we continued efforts to create a workplace that values differences. We used three indicators to measure progress.
Targets on gender and nationality
Women filled 9.4% of senior leadership positions, unchanged from 2003. Our target is 20%. The percentage of women in positions below senior leadership continued to increase. We had local staff available to fill the senior Shell representative (Country Chair) position in 79% of our operations in 2004, down from 84% in 2003, mainly because of staff reassignments and reorganisations. Our target was 100% coverage.
Diversity and inclusiveness indicator
Since 2002, we have tracked employees’ views on how inclusive their workplace is through the Shell People Survey. The 2004 results were slightly lower than in 2002.
Diversity and inclusiveness standard
By the end of 2004, nearly 90% of our operations had adopted our D&I standard1fully, unchanged from 2003. The rest had not because of conflict with local legislation or delays caused by reorganisation.
The way forward
In 2004, we concluded that ownership of the D&I programme needed to move more directly to our businesses. In 2005, all businesses must have fully resourced D&I plans and improvement targets. Their progress will be reviewed by our Executive Committee. Targets for 2005 were updated shifting the focus to continuous improvement, and replacing the Country Chair target with one that fits our global businesses, having local staff in the majority of senior leadership positions in a region or country.
Key performance indicator
Respect for staff
Score declined considerably. In the 2004 Shell People Survey, 67% of employees said they were ‘treated with respect’ by the company, down from 78% in 2002. 14% felt they were not. The biggest drop occurred in Exploration & Production. Although some 5% of the drop came from changes in the survey methodology, the decline is significant and a source of concern. We believe it largely reflects dissatisfaction with the reserves restatement and with the increase in work pressure on employees from business reorganisations. We are reviewing the results and discussing them with staff to decide how best to respond.
Employee rights
Employees in all countries where we operate have access to staff forums, grievance procedures or other support systems. Approximately 12% are members of unions, down slightly from 13% in 2003. We continued to invest in our people in 2004. In addition to the technical training and training sponsored by individual businesses, more than 1,300 employees attended Group leadership training programmes. Programmes were run for example in Dubai, Malaysia, the Netherlands, Nigeria, Norway and the UK, and at the IMD, INSEAD and Wharton business schools.2
Find out more
* www.shell.com/shellreport/data
(for complete data tables – 2002 acquisitions not assured in 2002)
1www.shell.com/diversity
2www.shell.com/employeerights
28The Shell Report
Environmental
Key performance indicator
Emission levels unchanged. Flaring levels in Exploration & Production were similar to 2003 and downstream emissions were unchanged. We believe improved energy efficiency in our refineries made up for the extra energy and greenhouse gas (GHG) emissions resulting from our response to regulations to produce lower sulphur fuels and lower our own local air emissions. We continued working to meet our 2010 target of having 5% lower GHG emissions than in 1990 which will depend on improvements in energy efficiency and, for a large part, on further flaring reductions (pages 8, 16 and 17).
Managing resources
Reducing the solid waste produced by our operations saves money and lowers impacts on the environment. Our increased focus on waste management led to a 13% drop in the volume of hazardous and non-hazardous waste we produced compared with 2003. In 2004, Oil Products included waste control in its environmental management standards and appointed a full-time environment and waste advisor to co-ordinate waste reduction efforts worldwide.
Our industry is not a major water consumer, but our operations can affect water quality through our effluents. In 2004, we used 1,620 million cubic metres of water, mostly for cooling. That was 4% less than in 2003. We continue to look for new ways to reduce, clean and re-use water, especially in water stressed areas.1
What others say
“I am demanding that Shell clean up their pollution and stop forthwith the continuous degradation of the environment of the Niger Delta. Please repair the damage that your oil exploitations have caused, and restore the balance to the areas that your destructive operations have affected, including the mangrove forests and local communities in the Niger Delta.”
Tell Shell, USA
Key performance indicator
Targets met. Oil Products improved its Refinery Energy Index (REI)2in part due to fewer and shorter shut downs and higher average availability at our refineries. Energy efficiency projects, as part of the Energise™ programme, also helped.
Oil Products reassessed its use of REI in 2004, including continued controls weaknesses on these data. To be consistent with industry practice and allow us to compare performance with other operators, refineries will switch to using the Solomon and Associates Energy Intensity Index (EII)2to measure and report on energy efficiency, starting in 2005.
Chemicals improved its Chemicals Energy Index (CEI)2 which measures energy efficiency by comparing energy used to produce a tonne of product to a year 2000 baseline (100) at selected sites. Improvement came mainly from process improvements, with particular gains at our Deer Park facility, as well as better utilisation of our plants and Energise™ energy efficiency projects. Changes in the mix of products we produced also improved our index score.
Exploration & Production used less energy per unit of production than in 2003, partly because compressors and other equipment which use a lot of energy were available less often, and partly because of changes to the portfolio of projects that enabled us to increase throughput without equivalent increases in energy use.
Energise™
Energise™ finds ways to improve energy efficiency at industrial facilities that require little or no investment. By the end of 2004, Energise™ programmes had been completed or were underway at 21 of our Oil Products and Chemicals plants. Improvements in energy efficiency are typically 3-7%. To date these programmes have generated $21 million in annual savings and avoided the emissions of an estimated 350,000 tonnes of CO2 per year.3
What others say
“Thank God for companies like Shell, that are not afraid to develop new economies like the hydrogen market. Nearly 20 years ago I predicted that this would become a viable solution, and I look forward to a day when we’re using hydrogen instead of overseas oil to run America. Thank you Shell for your work in this area.”
Tell Shell, USA
Find out more
* www.shell.com/shellreport/data
(for complete data tables – 2002 acquisitions not assured in 2002)
1www.shell.com/water
2www.shell.com/envandsociety/reportingandassurance
3www.shellglobalsolutions.com/energise
Performance data29
Key performance indicator
2004 target missed but volumes slightly lower than in 2003. Unexpectedly high downtime in compressors at gas gathering facilities at several upstream operations was the main reason the target was missed. We aim to meet our 2005 target mainly by having better controls and by increasing the availability of compressors at oil wells with high associated gas production. In 2004, we made progress but did not, as intended, complete our project to improve the quality of flaring data in Nigeria mainly due to delays in equipment procurement. We will finish the project by installing the last eleven gas meters in 2005.
We continue working to come as close as we can to meeting national regulations and our target to end continuous flaring by 2008, with a multi-billion dollar programme to build the facilities needed to gather and bring to market associated gas at all our operations. Project delays and past under-funding by partners mean we are behind schedule in Nigeria. We expect to be putting out the last continuous flares there during 2009 (pages 16-17).
Key performance indicator
Target missed in part because of damage to offshore pipelines in the US Gulf Coast as a result of hurricane Ivan (approximately 1,500 tonnes spilled). We are participating in an industry group to identify ways to reduce the damage to oil and gas facilities from hurricanes. The replacement of old flow lines in Oman and improved pipeline management in Nigeria (pages 16-17) helped reduce operational spill volumes in Exploration & Production.
Spills data are also subject to inherent limitations, mainly because of the need to estimate how much was spilled, evaporated and eventually recovered (see Basis of reporting, page 31).
Key performance indicator
External perception of environmental performance
Aim achieved of scoring highest in our industry for ‘environmental responsibility’ for the third year in a row in the 2004 Reputation Tracker survey of 13 Shell markets conducted on our behalf by Synovate, an independent market research company. Nearly a quarter of general public respondents and nearly a third of respondents from ‘special publics’ (for example financial community, media, non-governmental organisations and government) ranked us ‘the best’ or ‘one of the best’ companies in acting responsibly towards the environment.
Environmental liabilities, clean-up and decommissioning costs
We paid $244 million in environmental clean-up costs, up from $175 million in 2003 mainly due to a $62.5 million payment for contamination of groundwater by MTBE in Santa Monica in the USA. At the end of the year, we had provisions in place of $907 million for future environmental clean-up ($972 million in 2003), and $5.9 billion for facility decommissioning and site restoration, up from $4 billion in 2003, mainly because of increased estimates of decommissioning costs. See the Annual Report for further information.1
Fines, compensation payments and settlements
In addition, we paid $99 million in health, safety and environmental (HSE) fines, compensation and settlements. In 2003, we paid $142 million, restated to exclude payments also reported as environmental liabilities in that year. The vast majority of payments reported occurred in the USA. Outside the USA, we may not yet be capturing all payments and how the definitions of HSE-related payments are interpreted may differ. For this reason, in 2005, we will gather these data through our financial reporting system.1
Animal testing
We commission animal testing only when legally obliged or when there is no other way to ensure that our products are safe. An independent animal testing review panel meets twice a year to scrutinise our use of animals for safety testing. The panel has published its findings for 2004. The panel welcomed our efforts to reduce animal testing under REACH (Registration, Evaluation, Authorisation of Chemicals), new legislation being finalised in Europe.2
Find out more
* www.shell.com/shellreport/data
(for complete data tables – 2002 acquisitions not assured in 2002)
1www.shell.com/annualreport
2www.shell.com/animaltesting
30The Shell Report
Approach to reporting, assurance and performance assessment
We report openly on our governance, environmental and social performance because they affect our business performance today and our ability to win societal acceptance and achieve our strategy in the future. Reporting also helps build trust and motivates staff and business partners to improve their performance.
The Shell Report is sent to more than 750,000 people including our staff and shareholders, and financial regulators. Another 51,000 viewed it on the web in 2004, where we also provide supporting information.
Evolving reporting
We believe sustainability reporting should focus on the issues and impacts that most affect business performance. That is why ‘Meeting the Energy Challenge’ remains our theme and we explore different aspects of this challenge each year (Sustainable Transport in 2003 and Energy Security in 2004). It is why we focus our data reporting on the 12 Key Performance Indicators covering our main environmental and social impacts, using data from facilities where we have operational control. It is also why we strengthened the way we choose the issues and locations we report on. The selection process, described in full on our website,1relies on our internal reputation risk and financial risk tracking systems to identify the issues and locations with the highest impact on our reputation or financial performance. We may or may not have operational control over these locations.
Sustainability reporting must also respond to evolving requirements by financial regulators for non-financial reporting. We consider The Shell Report to be one of our material disclosures to investors. In 2004, we improved internal checks and controls on all our disclosures, including The Shell Report, under the supervision of the Group Disclosure Committee.
Sustainability reporting must also find different channels to meet different users’ needs. For this reason, we provide a short report with an overview of key issues and impacts for general readers, supported by more detailed information on the web for specialists. We meet with non-governmental organisations and analysts to address their specific information needs.
New in 2004
| | | – Improved process for selecting issues and locations to report. |
| |
| | | – Expanded role for performance assessments by independent experts and local communities. |
| |
| | | – Improved internal controls and closer integration of internal controls and external assurance. |
External assurance
We continue to have information in the report subjected to independent assurance by our auditors (KPMG Accountants N.V. and PricewaterhouseCoopers LLP). This helps us improve the quality of our data, manage our business better and increases trust. In this report, the auditors have carried out assurance work on selected financial, safety and environmental data as indicated by, and confirmed we have properly extracted selected data from our financial statements. They have also reviewed the other information in the report.
External performance assessments
Assurance is mainly about the quality of the information we report. Readers must translate this information into a judgment about our performance. To help them, we ask outside experts and people affected by our operations for their uncensored views on our progress at key locations. In 2004, we clarified the role of assessors and increased efforts to choose people who represent the whole community, a continuing challenge where communities are divided in their view.
Emerging guidelines
We again report in accordance with the Global Reporting Initiative (GRI)2and describe our contribution to the United Nations (UN) Global Compact on our website.3
Find out more
1www.shell.com/envandsociety/reportingandassurance
2www.shell.com/gri
3www.shell.com/gcprinciples
Assurance and basis of reporting31
Assurance and basis of reporting
Independent Assurance Report
To: Royal Dutch Petroleum Company and The“Shell” Transport and Trading Company, p.l.c
Responsibilities and scope
We have been engaged to express an independent opinion on information contained in the 2004 Shell Report (the “Report”). The preparation of the Report is the sole responsibility of the management of the Royal Dutch/Shell Group of Companies (the “Group”). There are no generally accepted international environmental, social and economic reporting standards. The reporting policy for the Report is explained in the Basis of reporting.
Our responsibility is to express an opinion on the information in the Report based on our assurance work. Our engagement was designed to provide reasonable assurance on whether:
| | – | The safety and environmental data and graphs, including the notes thereto, on pages 27-29, marked, fairly describe the performance of the reporting entities for each of these parameters in accordance with the Basis of Reporting. |
| |
| | – | The data for Total Shareholder Return (TSR) on page 24 are calculated correctly based on the assumptions for the calculation. |
| |
| | – | The selected financial data in the Report on pages 24, 26 and 29, namely net income, sales taxes and excise duties, corporate taxes, royalties, and decommissioning and site restoration provision, are properly extracted from the audited financial statements of the Group for the year ended 31 December 2004. |
In addition, we have been engaged to provide limited assurance as to whether the other information contained in the Report is consistent with the findings of our work.
We have not undertaken any work to confirm that all relevant issues are included or that the balance of the Report is appropriate. Furthermore we have not carried out any work on data reported in respect of future projections and targets or work on additional information from the Report published on the Group’s website. Accordingly, no opinion is given in respect of these matters.
Assurance work performed
We conducted our engagement in accordance with the International Standard on Assurance Engagements 3000. Our work comprised the following procedures:
| | – | For the safety and environmental data on pages 27-29, marked, we obtained an understanding of the systems both at the Business Unit and Group level, used to generate, aggregate and report the data. This included analytical reviews and tests of details. Tests of details were carried out using judgmental sampling. We also assessed data trends in discussions with management and tested the calculations made at Group level. |
| |
| | – | For TSR (page 24), we examined the basis of the calculations performed by management and checked their accuracy. |
| |
| | – | For the selected financial data on pages 24, 26 and 29 (listed above) we compared the data with the audited financial statements of the Group for the year ended 31 December 2004. |
| |
| | – | We reviewed the other information in the Report for consistency with our knowledge of the Group and discussed with management the processes to collate the Report, including the use of internal and external information sources and third party confirmations. |
We believe that our work provides a reasonable basis for our conclusions.
Considerations and limitations
Environmental and social data and assertions are subject to more inherent limitations than financial data, given both their nature and the methods used for determining, calculating or estimating such data. It is important to read the data and statements in the context of the basis of reporting provided by management on this page and the notes to the data.
Uncertainty relating to TRCF data
Without qualifying our opinion, we draw attention to the information on page 27, which explains the uncertainty related to the reported Group TRCF data as a consequence of difficulties in underlying data capture and reporting.
Conclusions
In our opinion:
| | – | The safety and environmental data and graphs, including the notes thereto, on pages 27-29, marked, fairly describe the performance of the reporting entities for each of these parameters on the bases stated; |
| |
| | – | The TSR for Royal Dutch Petroleum Company and The"Shell”Transport and Trading Company p.l.c. on page 24 are calculated correctly on the basis stated; |
| |
| | – | The selected financial data in the Report on pages 24, 26 and 29, namely net income, sales taxes and excise duties, corporate taxes, royalties, and decommissioning and site restoration provision are properly extracted from the audited financial statements of the Group for the year ended 31 December 2004; for a better understanding of the Group’s financial performance and position and the scope of our audits, the Report should be read in conjunction with the full Annual Report and Accounts of Royal Dutch Petroleum Company and The“Shell”Transport and Trading Company, p.l.c for the year ended 31 December 2004 and our reports thereon; |
| |
| | – | Nothing has come to our attention to indicate that the other information contained in the Report is inconsistent with the findings of our work. |
| | | |
| |  |
| The Hague | | London |
| | | |
| |  |
| May 4, 2005 | | |
Basis of reporting
The entities we include when reporting our performance vary between the different sections of The Shell Report.
Issues and locations (pages 8 - -11 and 16-23). Here we report on the issues and locations with the highest impact on our reputation or financial performance. These can include the activities of entities under our operational control (meaning we can require all our policies and standards to be applied). It can also include entities where we have a financial interest and have influence, but do not have operational control.
Health, Safety and Environmental data, as well as HSE fines, compensation payments and settlements (FCS) are reported according to the Group HSE Performance Monitoring and Reporting Guide (December 2003) (www.shell.com/envandsociety/ reportingandassurance). They are aggregated from those entities under operational control for their HSE policy and practices and certain companies to which we provide operational services. These data are reported on a 100% basis regardless of our equity share in the company. Chemical Energy Index (CEI) reporting is based on a selection of Chemical Units only.
Annualised Total Shareholder Return (TSR) is calculated as the annualised total of stock appreciation and yield from reinvested dividends before taxes for the parent companies (The“Shell” Transport and Trading Company p.l.c. and Royal Dutch Petroleum Company). The figures shown are based on quarterly reinvestment of gross dividends expressed in dollars.
Besides FCS payments and TSR, allother financial data are extracted from the Annual Report and Accounts of our parent companies (see www.shell.com/annual report).
Theremaining data, are either drawn from external sources or aggregated from all entities under operational control. We report these data on a 100% basis unless otherwise stated.
Data from companies that were disposed of or acquired during the year are generally included only for the period that the companies were under operational control. During 2002, acquisitions made a material difference to the HSE data we reported.
Limitations
Although we are confident in the overall reliability of the data reported we recognise that there is uncertainty in some of these. All HSE and social data carry inherent limitations, for example because of differing interpretations of reporting guidelines as well as variation in measurement, calculation or estimation. In addition, our injuries (TRCF) and spills data are subject to further limitations. For example, culture, individual behaviour and judgment can affect whether incidents are reported. Our injury and fatality rates (TRCF and FAR) and FCS data are subject to specific uncertainties due to difficulties in underlying data capture and controls weaknesses identified in the text (pages 27-29).
32The Shell Report
Data table
Financial
| | | | | | | | | | | | | | | | | |
| | | 1992-2001 | | | 1993-2002 | | | 1994-2003 | | | 1995-2004 | |
| |
Annualised total shareholder return | | | | | | | | | | | | | | | | |
| % Royal Dutch | | | 17.63 | | | | 11.73 | | | | 11.67 | | | | 11.35 | |
| % Shell Transport | | | 15.58 | | | | 13.05 | | | | 10.82 | | | | 13.07 | |
| |
Annualised total shareholder return is calculated as the annualised total of stock appreciation and yield from reinvested dividends before taxes. The figures shown are based on quarterly reinvestment of gross dividends expressed in dollars.
Environment
| | | | | | | | | | | | | | | | | | | | | |
| | | 2000 | | | 2001 | | | 2002 | | | 2003 | | | 2004 | |
| |
Greenhouse gas emissions | | | | | | | | | | | | | | | | | | | | |
Million tonnes CO2 equivalent | | | 101 | | | | 103 | | | | 106 | * | | | 112 | | | | 112 | |
| |
Methane (CH4 ) | | | | | | | | | | | | | | | | | | | | |
| Thousand tonnes | | | 398 | | | | 315 | | | | 241 | * | | | 234 | | | | 243 | |
| |
Carbon dioxide (CO2 ) | | | | | | | | | | | | | | | | | | | | |
| Million tonnes | | | 92 | | | | 95 | | | | 100 | * | | | 106 | | | | 106 | |
| |
Flaring Exploration & Production | | | | | | | | | | | | | | | | | | | | |
| Million tonnes | | | 9.3 | | | | 10.3 | | | | 7.6 | * | | | 9.3 | | | | 9.2 | |
| |
Sulphur dioxide (SO2 ) | | | | | | | | | | | | | | | | | | | | |
| Thousand tonnes | | | 277 | | | | 274 | | | | 270 | | | | 292 | | | | 304 | |
| |
Nitrogen oxides (NOx) | | | | | | | | | | | | | | | | | | | | |
| Thousand tonnes | | | 202 | | | | 213 | | | | 213 | | | | 219 | | | | 197 | |
| |
CFCs/halons/trichloroethane | | | | | | | | | | | | | | | | | | | | |
| Tonnes | | | 6 | | | | 5 | | | | 8 | | | | 3 | | | | 3 | |
| |
Volatile organic compounds | | | | | | | | | | | | | | | | | �� | | | |
(VOCs) | | | | | | | | | | | | | | | | | | | | |
| Thousand tonnes | | | 538 | | | | 372 | | | | 379 | | | | 294 | | | | 265 | |
| |
Spills | | | | | | | | | | | | | | | | | | | | |
| Thousand tonnes | | | 9.9 | | | | 17.8 | | | | 7.4 | * | | | 6.7 | | | | 6.6 | |
| |
Oil in effluents to surface environment | | | | | | | | | | | | | | | | | | | | |
| Thousand tonnes | | | 2.8 | | | | 2.9 | | | | 2.5 | | | | 2.4 | | | | 2.3 | |
| |
Fresh water usea | | | | | | | | | | | | | | | | | | | | |
| Million cubic metres | | | N/C | | | | 1,701 | | | | 1,710 | | | | 1,690 | | | | 1,620 | |
| |
Waste | | | | | | | | | | | | | | | | | | | | |
| Thousand tonnes | | | | | | | | | | | | | | | | | | | | |
| |
| Hazardous | | | 400 | | | | 445 | | | | 504 | | | | 554 | | | | 455 | |
| |
| Non-hazardous | | | 490 | | | | 452 | | | | 524 | | | | 510 | | | | 470 | |
| |
| Total | | | 890 | | | | 897 | | | | 1,028 | | | | 1,064 | | | | 925 | |
| |
Energy efficiencyb | | | | | | | | | | | | | | | | | | | | |
| Oil Products Refinery Energy Index | | | N/C | | | | N/C | | | | 135 | | | | 132 | | | | 131 | |
| |
Chemicals Energy Index c | | | N/C | | | | N/C | | | | 99.7 | | | | 98.3 | | | | 93.3 | |
| |
Exploration & Production energy efficiency | | | | | | | | | | | | * | | | | | | | | |
| Gigajoule per tonne production | | | 0.70 | | | | 0.70 | | | | 0.82 | * | | | 0.95 | | | | 0.92 | |
| |
N/C = not calculated
* 2002 acquisitions not assured in 2002.
a Includes cooling water.
b For explanation of Refinery Energy Index and Chemicals Energy Index, see find out more.1
c Only assured 2003 and 2004 data. Limited work on 2000 baseline.
KPMG Accountants N.V. and PricewaterhouseCoopers LLP have carried out assurance work for data marked with. See page 31 and description of data quality on pages 27-29.
Social
| | | | | | | | | | | | | | | | | | | | | |
| | | | % of countries (unless otherwise stated) | |
| | | 2000 | | | 2001 | | | 2002 | | | 2003 | | | 2004 | |
| |
Fatalitiesd | | | | | | | | | | | | | | | | | | | | |
| Employees | | | 5 | | | | 3 | | | | 8 | * | | | 5 | | | | 2 | |
| |
| Contractors | | | 55 | | | | 37 | | | | 45 | * | | | 42 | | | | 35 | |
| |
| Total number | | | 60 | | | | 40 | | | | 53 | * | | | 47 | | | | 37 | |
| |
Fatal accident rated | | | | | | | | | | | | | | | | | | | | |
| Number of fatalities per 100 million working hours (employees and contractors) | | | 8.2 | | | | 5.2 | | | | 6.3 | * | | | 5.6 | | | | 4.4 | |
| |
Injuries – total reportable case frequency (TRCF) | | | | | | | | | | | | | | | | | | | | |
| Per million working hours (employees and contractors) | | | 3.2 | | | | 2.9 | | | | 2.6 | * | | | 2.6 | | | | 2.6 | |
| |
Lost time injury frequency (LTIF) | | | | | | | | | | | | | | | | | | | | |
| Injury hours per million working hours (employees and contractors) | | | 1.3 | | | | 1.2 | | | | 1.1 | | | | 1.0 | | | | 1.0 | |
| |
Total reportable occupational illness frequency (TROIF) | | | | | | | | | | | | | | | | | | | | |
| Illnesses per million working hours (employees only) | | | 2.2 | | | | 2.3 | | | | 2.0 | | | | 2.0 | | | | 2.1 | |
| |
Security | | | | | | | | | | | | | | | | | | | | |
| Using armed security | | | 22 | | | | 18 | | | | 16 | | | | 22 | | | | 18 | |
| |
| Using armed company security | | | 2 | | | | 2 | | | | 1 | | | | 2 | | | | 2 | |
| |
| Using armed contractor security | | | 12 | | | | 12 | | | | 12 | | | | 22 | | | | 11 | |
| |
Gender diversity | | | | | | | | | | | | | | | | | | | | |
| % women | | | | | | | | | | | | | | | | | | | | |
| |
| In supervisory/professional positions | | | 17.1 | | | | 17.7 | | | | 18.9 | | | | 19.5 | | | | 20.7 | |
| |
| In management positions | | | 8.9 | | | | 9.2 | | | | 10.4 | | | | 11.1 | | | | 11.9 | |
| |
| In senior leadership positions | | | 7.8 | | | | 7.9 | | | | 8.3 | | | | 9.4 | | | | 9.4 | |
| |
Unions and staff forums | | | | | | | | | | | | | | | | | | | | |
| Estimated % employees members of unions | | | N/C | | | | 19 | | | | 19 | | | | 13 | | | | 12 | |
| |
| % staff with access to staff forum, grievance procedure or support systems | | | N/C | | | | 99.99 | | | | 99.99 | | | | 99.99 | | | | 100 | |
| |
Child laboure | | | | | | | | | | | | | | | | | | | | |
| Checks to ensure procedures in place to prevent use of child labour | | | | | | | | | | | | | | | | | | | | |
| |
| In own operations | | | 84 | | | | 89 | | | | 86 | | | | 78 | | | | 83 | |
| |
| Contractors | | | 51 | | | | 57 | | | | 56 | | | | 57 | | | | 61 | |
| |
| Suppliers | | | 31 | | | | 41 | | | | 42 | | | | 50 | | | | 53 | |
| |
Contracting and procurement | | | | | | | | | | | | | | | | | | | | |
Spend on goods and services from locally owned companies in low and medium countriesf$ billion | | | N/C | | | | N/C | | | | N/C | | | | 5.2 | | | | 6.3 | |
| |
Contracts cancelled due to incompatibility with
Business Principles | | | | | | | | | | | | | | | | | | | | |
| Number | | | 106 | | | | 100 | | | | 54 | | | | 49 | | | | 64 | |
| |
Joint ventures divested due to operations incompatible with
Business Principles | | | | | | | | | | | | | | | | | | | | |
| Number | | | 2 | | | | 0 | | | | 0 | | | | 1 | | | | 0 | |
| |
Business integrity | | | | | | | | | | | | | | | | | | | | |
Reported cases of briberyg | | | 5 | | | | 5 | | | | 4 | | | | 8 | | | | 16 | |
| |
Social investment (equity share) | | | | | | | | | | | | | | | | | | | | |
| $ million | | | 85 | | | | 85 | | | | 96 | | | | 102 | | | | 106 | |
| |
N/C = not calculated
d 2003 fatalities restated due to later investigations (two contractors).
e Prior to 2003 we asked if procedures existed, not if they were actively enforced.
f Country income level is as defined by the UNDP human development index.
g Proven cases of bribes paid or accepted by Shell employees, contractors or intermediaries.
Prior to 2003, may also include offers of bribes.
Find out more
www.shell.com/shellreport/data
1www.shell.com/envandsociety/reportingandassurance
Find out more33
Find out more
You can see this report online at www.shell.com/shellreport. The ‘About Shell’ website also provides further details on many of the issues discussed in the report and on other relevant topics. See www.shell.com/envandsociety for:
Our commitments, policies and standards
Shell General Business Principles
Commitment to sustainable development
HSE Commitment and Policy
Diversity and Inclusiveness Standard
Environmental Minimum Standards
Environmental, social and health impact assessment
Biodiversity Standard
Minimum Health Standards
Animal Testing Standard
Security Standard
Standard for Ship Quality Assurance
Management primers
Our position on key issues and topics
Animal testing
Biodiversity
Business integrity
Climate change
Energy security
Fuel and crude prices
Globalisation
HIV and AIDS
Human rights
Interacting with communities
New energies
Payments to governments
Politically sensitive regions
Product stewardship – dealing with legacies
Sustainable transport
Water use
Making it happen
Our approach
Creating business value
Embedding sustainable development
Environment
Society
Working with stakeholders
Case studies
Our performance
Financial
Social
Environmental
Reporting and assurance
Our approach to reporting
Our latest performance report
Local reports
External assurance and performance assessment
Reporting against the
Global Reporting Initiative
Reporting against the UN
Global Compact Principles
Other links
| | | |
Locations | | |
| Nigeria | | www.shell.com/nigeria |
| Norco | | www.shellus.com/norco |
| Pandacan | | www.shell.com/pandacan |
| Port Arthur | | www.portarthurrefinery.com |
| Sakhalin | | www.sakhalinenergy.com |
| SAPREF | | www.sapref.com |
| | | |
Energy security | | |
| Athabasca Oil Sands Project | | www.shell.ca/oilsands |
| Gas to Liquids | | www.shell.com/gtl |
| Liquefied Natural Gas | | www.shell.com/lng |
| New energies | | www.shell.com/newenergies |
| | | |
Other | | |
| Energise™ | | www.shellglobalsolutions.com/energise |
| Energy scenarios | | www.shell.com/scenarios |
| | | |
Downloads | | |
| Translated Shell Report | | www.shell.com/translatedshellreport |
| Annual Reports | | www.shell.com/annualreport |
| Local reports | | www.shell.com/localreports |
| Details on reporting | | www.shell.com/envandsociety/reportingandassurance |
| Data tables | | www.shell.com/shellreport/data |
The companies in which Royal Dutch Petroleum Company and The “Shell” Transport and Trading Company, p.l.c. directly or indirectly own investments are separate and distinct entities. But in this report the collective expressions “Shell”, “Group” and “Royal Dutch/Shell Group of Companies” are sometimes used for convenience in contexts where reference is made to the companies of the Royal Dutch/Shell Group in general. Likewise the words “we”, “us” and “our” are used in some places to refer to companies of the Royal Dutch/Shell Group in general, and in others to those who work in those companies. Those expressions are also used where no useful purpose is served by identifying a particular company or companies.
The paper used for this report contains 75% de-inked post-consumer waste. The remaining 25% is from elemental chlorine-free pulp sourced from sustainably managed forests. The manufacturers of the paper are accredited with the ISO 9002 Quality Assurance and ISO 14001 Environmental Management System.
We thank: Peter Knight of Context for writing, Corporate Edge for design and production using Ringmaster®, Butler & Tanner for printing and Peter Dazeley for cover photography. Butler & Tanner are accredited with the ISO 14001 Environmental Management Systems. Ringmaster® is the registered trademark of Automatrix plc.

Annual Report and Accounts 2004
The Annual Reports and Accounts of Royal Dutch Petroleum Company and The “Shell” Transport and Trading Company, p.l.c.
Available at www.shell.com/annualreport
The Shell Report 2004
Meeting the energy challenge – our progress in contributing to sustainable development.
Available at www.shell.com/shellreport
Summary Annual Report and Accounts 2004
Summary versions of the Annual Reports and Accounts of Royal Dutch Petroleum Company and The “Shell” Transport and Trading Company, p.l.c.
Available at www.shell.com/annualreport
Financial and Operational Information 2000–2004
Five years’ financial and operational information about the Group, including maps of exploration and production activities.
Available at www.shell.com/faoi
Statement of General
Business Principles
Fundamental principles that govern how
each Shell company conducts its affairs.
Available at www.shell.com/sgbp
Tell Shell
Tell us what you think about Shell, our performance, our reports or the issues
we face. Join the global debate – we value your views.
Visit www.shell.com/tellshell or
e-mail us at tellshell@shell.com
Contact any of the addresses below
for copies of publications:
Shell International B.V.
FSK Division, PO Box 162
2501 AN The Hague
The Netherlands
Tel: +31 (0)70 377 4540
Fax: +31 (0)70 377 3115
Shell International Limited
PXXC (Publications)
Shell Centre, London, SE1 7NA
United Kingdom
Tel: +44 (0)20 7934 5293
Fax: +44 (0)20 7934 5555
Shell Oil Company
1270 Avenue of the Americas
Suite 2320, New York
NY 10020, USA
Tel: +1 212 218 3113
Fax: +1 212 218 3114
More information about the
Royal Dutch/Shell Group
is available at www.shell.com